User login
Obesity Has Minimal Impact on Short-Term Functional Scores After Reverse Shoulder Arthroplasty for Rotator Cuff Tear Arthropathy
Body mass index (BMI) is thought to be a predictor of body composition, with higher values indicating more adipose tissue. BMI is a measure of mass with respect to height. The World Health Organization1 has established health categories based on BMI measurements. Values from 18.5 to 24.9 kg/m2 are deemed to represent normal weight; those from 25 to 30 kg/m2, overweight; and those higher than 30 kg/m2, obesity. BMI is not a perfect tool, but it is the most widely used tool in clinical and research practice because of its relative reliability and ease of use.2 Being overweight or obese (according to BMI) is increasingly common among adults worldwide, and particularly in the United States. An estimated 39% of adults worldwide are overweight, and 13% are obese.1 An estimated 69% of US adults are overweight, including 35.1% who are obese.2
Various pathologies have been treated with reverse shoulder arthroplasty (RSA), and results have been promising,3-9 but little is known about patient demographic and clinical factors that may adversely affect outcomes. Recent work suggests younger age7 and failed prior arthroplasty may adversely affect RSA outcomes.10 Higher BMI has also been implicated as a cause of increased perioperative and immediate postoperative complications of RSA with minimum 90-day follow-up, but no one has examined shoulder function scores at minimum 2-year follow-up.11,12
We conducted a study to examine shoulder function scores, mobility, patient satisfaction, and complications at minimum 2-year follow-up in normal-weight, overweight, and obese patients who underwent RSA. We hypothesized that, compared with normal-weight patients, obese patients would have worse shoulder function scores, worse mobility, and more complications.
Materials and Methods
Inclusion Criteria and Demographics
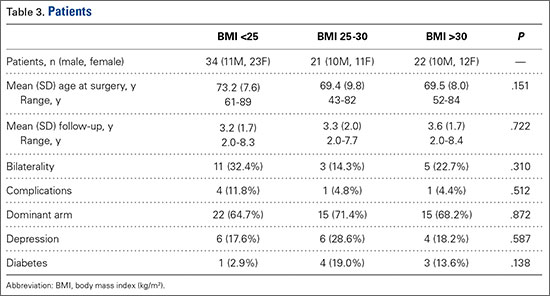
After obtaining Institutional Review Board approval for this study, we used a prospective shoulder arthroplasty registry to identify patients (N = 77) who had rotator cuff tear arthropathy (RCTA) treated with primary RSA and then had minimum 2-year follow-up. The study period was 2004-2011. All patients had RCTA diagnosed with physical examination findings and anteroposterior, scapular Y, and axillary radiographs. RCTA was graded 1 to 5 using the classification system of Hamada and colleagues.13 Rotator cuff status was determined with preoperative computed tomography arthrogram (CTA) or magnetic resonance imaging (MRI) and confirmed at time of surgery. BMI calculations were based on height and weight measured at initial office visit. Thirty-four patients had normal weight (BMI <25 kg/m2), 21 were overweight (BMI 25-30 kg/m2), and 22 were obese (BMI >30 kg/m2). Patient demographic and clinical characteristics reviewed also included age, sex, follow-up duration, arm dominance, complications, prevalence of depression, and prevalence of diabetes. All RSAs were performed by the same surgeon (Dr. Edwards) at a single high-volume shoulder arthroplasty center.
Shoulder function scores evaluated before surgery and at final follow-up included Constant score,14 American Shoulder and Elbow Surgeons (ASES) score,15 Western Ontario Osteoarthritis Shoulder (WOOS) index,16 Single Assessment Numeric Evaluation (SANE),17 and mobility. Satisfaction was assessed by having patients describe themselves as very dissatisfied, dissatisfied, satisfied, or very satisfied. All intraoperative and postoperative complications were recorded.
Surgical Technique and Postoperative Rehabilitation
The Aequalis RSA system (Tornier) was used for all patients during the study period. The RSA technique used has been well described.18,19 A standard postoperative rehabilitation protocol was followed.19,20
Clinical and Radiographic Assessment
Patients were prospectively enrolled in a shoulder arthroplasty outcomes registry and followed clinically. Mean follow-up was 3.16 years (range, 2-8 years). Before surgery, patients were examined by the surgeon. Examinations were repeated 1 week, 6 weeks, 3 months, 6 months, and 12 months after surgery and annually thereafter. Mobility (active range of motion) was determined with a handheld goniometer. Strength of abduction was measured with a handheld digital dynamometer (Chatillon digital force gauge, 200 lbf; Ametek). Anteroposterior in plane of scapula, scapular Y, and axillary radiographs were obtained at each clinic appointment.
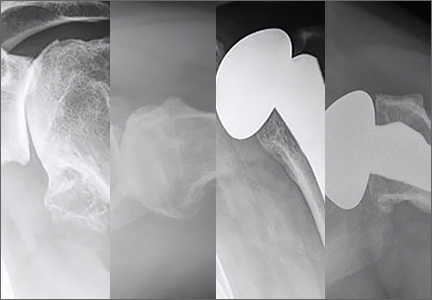
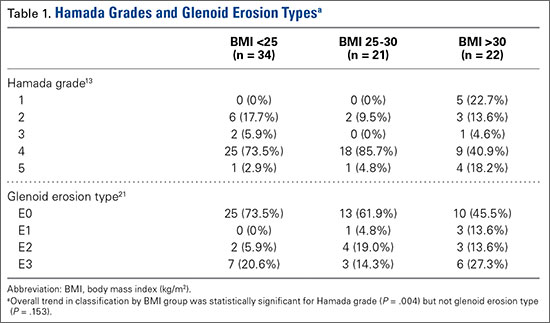
Before surgery, the surgeon reviewed all radiographs. Each RCTA was given a Hamada grade (1-5).13 Glenoid erosion in the coronal plane was classified (E0, E1, E2, E3) according to Sirveaux and colleagues.21 Hamada grades and glenoid erosion types are listed in Table 1. The overall trend in classification by BMI group was statistically significant for Hamada grade (P = .004) but not glenoid erosion type (P = .153).
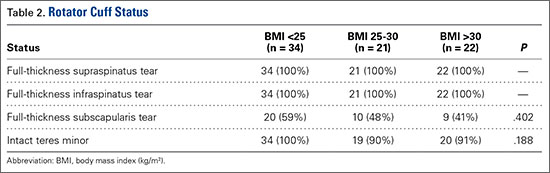
Before surgery, the surgeon also evaluated rotator cuff status using CTA or MRI. All patients had full-thickness tears of the supraspinatus and infraspinatus. The subscapularis was variably present, and subscapularis repair was performed when the subscapularis was intact. Rotator cuff status is listed in Table 2. There were no significant differences in the distribution of intact subscapularis (P = .402) or teres minor (P = .188) among the normal-weight, overweight, and obese groups. No patient had a latissimus dorsi transfer at time of RSA.
Statistical Analysis
Independent-samples t tests assuming unequal variances were used to compare the 3 BMI groups on age, follow-up duration, preoperative shoulder function scores, and mobility. Chi-square tests were used to identify any significant group differences in comorbidities (eg, complications, arm dominance, prevalence of depression, prevalence of diabetes) and patient satisfaction. Repeated-measures analysis of variance was used to evaluate main effects, changes from before surgery to final follow-up, and BMI group differences, as well as differences in changes from before surgery to final follow-up among the 3 BMI groups.
Results
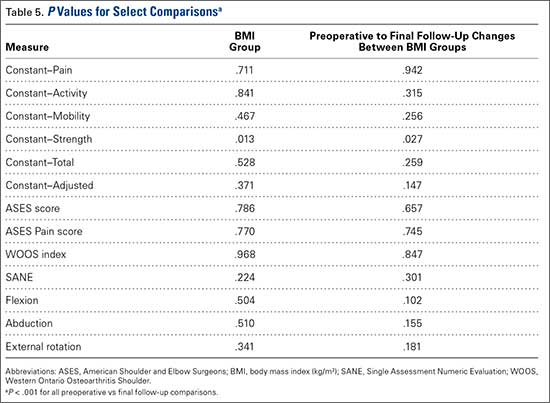
Among BMI groups (<25 kg/m2, 25-30 kg/m2, >30 kg/m2), there were no statistically significant preoperative differences in age, sex, follow-up duration, complications, arm dominance, prevalence of depression, or prevalence of diabetes (P >. 05) (Table 3). Table 4 lists the groups’ preoperative and final follow-up data (Constant score, ASES score, WOOS index, SANE, mobility). There were no statistically significant preoperative group differences in Constant score, ASES score, WOOS index, SANE, mobility, or patient satisfaction (P > .05) (Tables 5, 6).
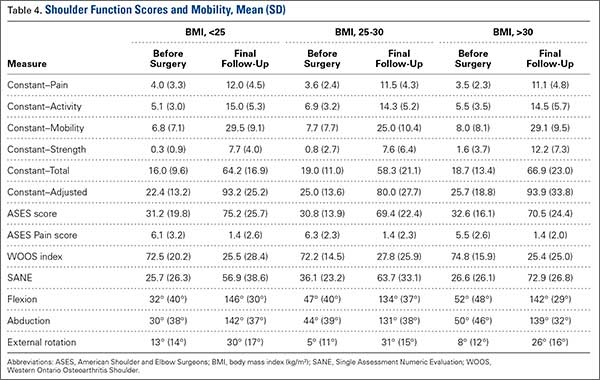
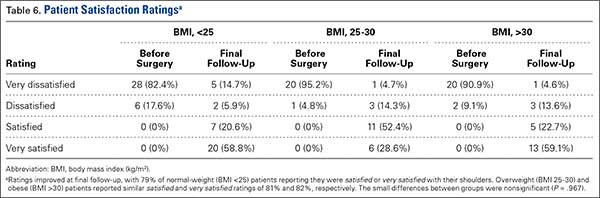
All groups’ shoulder function scores and mobility improved significantly from before surgery to final follow-up (P < .001) (Table 5). The groups’ magnitudes of change (improvement) from before surgery to final follow-up were almost identical, with no significant differences in shoulder function scores or mobility (Table 5). The only significant difference was in Constant–Strength, which was higher in the obese group (P = .017) (Table 5). Patient satisfaction ratings improved after surgery, with 79% of the normal-weight group reporting being satisfied or very satisfied with their shoulders (Table 6). The overweight and obese groups gave similar satisfied (81%) and very satisfied (82%) ratings. The small differences between group satisfaction scores were nonsignificant (P = .967).
Complications
The normal-weight group had 4 complications: periprosthetic infection (2 cases), intraoperative humeral fracture (1), and scapular spine stress fracture (1). The overweight group had 1 complication, an acromial stress fracture that was successfully treated with conservative measures. The obese group had 1 patient with 2 postoperative dislocations. The first dislocation was treated with closed reduction and bracing, and the second required revision surgery. There was no statistical difference in complications among the groups (P = .680).
Discussion
To our knowledge, this is the first study of the effects of varying BMI on functional outcomes of RSA with minimum 2-year follow-up. There appears to be minimal impact on shoulder function scores, complications, and patient satisfaction among normal-weight, overweight, and obese patients with RCTA treated by the same surgeon using similar techniques.
The relationship between obesity and increased perioperative risks or poorer surgical outcomes has been well established in orthopedic surgery. In a systematic review, Falagas and Kompoti22 found increased risk for perioperative and nosocomial infections in obese patients. Schoenfeld and colleagues23 and Jiang and colleagues24 reported increased risk for complications in spinal surgery. The total joint arthroplasty literature is rife with evidence suggesting higher BMI leads to increased risk for complications, including infection and deep venous thrombosis, as well as decreased functional outcome scores.25-29 Recent studies on shoulder surgery have shown worse outcomes in rotator cuff repair30 and a higher revision rate in hemiarthroplasy.31
Other RSA studies have examined short-term complications or perioperative risk factors associated with BMI. In a study using slightly different BMI groupings, Gupta and colleagues12 reported significantly higher complication rates for RSA patients with BMI higher than 35 kg/m2 compared to patients with BMI of 25 to 35 kg/m2 and compared to patients with BMI lower than 25 kg/m2. Their study highlighted medical and surgical complications and used a short follow-up period (minimum, 90 days). It did not assess shoulder function scores, and included multiple indications for RSA (eg, RCTA, proximal humerus fracture, inflammatory arthropathy). In another study, higher BMI was reported as a risk factor for early dislocation after RSA, but only 11 patients with a history of dislocation were assessed, and minimum follow-up was 6 months.32 We know of only one study that addressed RSA outcomes in obese patients and used minimum 2-year follow-up, but its primary endpoint was rate of complications, and it did not report shoulder function scores.11 Li and colleagues33 conducted a study similar to ours, but with primary total shoulder arthroplasty (TSA) patients, and reported similar results. Relative to normal BMI, higher BMI did not have a detrimental effect on short-term improvement in shoulder function after TSA.
Given the US obesity epidemic, our study results are encouraging. Depending on many factors, obesity remains a risk factor for poor outcomes in patients who undergo orthopedic surgery. As our results show, however, patients with higher BMI can obtain functional outcomes similar to those experienced by patients with normal-weight BMI after RSA for RCTA.
The primary limitation of this study was its retrospective design. Strengths of the study included its having a single surgeon and a single diagnosis: RCTA. In addition, each group was robust in size, a standard operative/postoperative protocol was used, and clinical results were measured with multiple validated shoulder function scores.
Conclusion
Improved shoulder function scores, mobility, and patient satisfaction can be expected after RSA for RCTA in patients with BMI higher than 30 kg/m2. These patients did not exhibit an increase in complications at short-term follow-up.
1. World Health Organization. Obesity and overweight [factsheet 311]. Updated January 2015. http://www.who.int/mediacentre/factsheets/fs311/en/. Accessed March 27, 2016.
2. National Center for Health Statistics, Centers for Disease Control and Prevention. Obesity and overweight. Updated February 25, 2016. http://www.cdc.gov/nchs/fastats/obesity-overweight.htm. Accessed March 27, 2016.
3. Boileau P, Gonzalez JF, Chuinard C, Bicknell R, Walch G. Reverse total shoulder arthroplasty after failed rotator cuff surgery. J Shoulder Elbow Surg. 2009;18(4):600-606.
4. Drake GN, O’Connor DP, Edwards TB. Indications for reverse total shoulder arthroplasty in rotator cuff disease. Clin Orthop Relat Res. 2010;468(6):1526-1533.
5. Gerber C, Pennington SD, Nyffeler RW. Reverse total shoulder arthroplasty. J Am Acad Orthop Surg. 2009;17(5):284-289.
6. Lenarz C, Shishani Y, McCrum C, Nowinski RJ, Edwards TB, Gobezie R. Is reverse shoulder arthroplasty appropriate for the treatment of fractures in the older patient? Early observations. Clin Orthop Relat Res. 2011;469(12):3324-3331.
7. Muh SJ, Streit JJ, Wanner JP, et al. Early follow-up of reverse total shoulder arthroplasty in patients sixty years of age or younger. J Bone Joint Surg Am. 2013;95(20):1877-1883.
8. Wall B, Nové-Josserand L, O’Connor DP, Edwards TB, Walch G. Reverse total shoulder arthroplasty: a review of results according to etiology. J Bone Joint Surg Am. 2007;89(7):1476-1485.
9. Young AA, Smith MM, Bacle G, Moraga C, Walch G. Early results of reverse shoulder arthroplasty in patients with rheumatoid arthritis. J Bone Joint Surg Am. 2011;93(20):1915-1923.
10. Boileau P, Melis B, Duperron D, Moineau G, Rumian AP, Han Y. Revision surgery of reverse shoulder arthroplasty. J Shoulder Elbow Surg. 2013;22(10):1359-1370.
11. Beck JD, Irgit KS, Andreychik CM, Maloney PJ, Tang X, Harter GD. Reverse total shoulder arthroplasty in obese patients. J Hand Surg Am. 2013;38(5):965-970.
12. Gupta AK, Chalmers PN, Rahman Z, et al. Reverse total shoulder arthroplasty in patients of varying body mass index. J Shoulder Elbow Surg. 2014;23(1):35-42.
13. Hamada K, Fukuda H, Mikasa M, Kobayashi Y. Roentgenographic findings in massive rotator cuff tears. A long-term observation. Clin Orthop Relat Res. 1990;(254):92-96.
14. Constant CR, Murley AH. A clinical method of functional assessment of the shoulder. Clin Orthop Relat Res. 1987;(214):160-164.
15. Michener LA, McClure PW, Sennett BJ. American Shoulder and Elbow Surgeons standardized shoulder assessment form, patient self-report section: reliability, validity, and responsiveness. J Shoulder Elbow Surg. 2002;11(6):587-594.
16. Lo IK, Griffin S, Kirkley A. The development of a disease-specific quality of life measurement tool for osteoarthritis of the shoulder: the Western Ontario Osteoarthritis of the Shoulder (WOOS) index. Osteoarthritis Cartilage. 2001;9(8):771-778.
17. Williams GN, Gangel TJ, Arciero RA, Uhorchak JM, Taylor DC. Comparison of the Single Assessment Numeric Evaluation method and two shoulder rating scales. Outcomes measures after shoulder surgery. Am J Sports Med. 1999;27(2):214-221.
18. Gartsman GM, Edwards TB. Shoulder Arthroplasty. Philadelpia, PA: Saunders Elsevier; 2008.
19. Liotard JP, Edwards TB, Padey A, Walch G, Boulahia A. Hydrotherapy rehabilitation after shoulder surgery. Tech Shoulder Elbow Surg. 2003;4:44-49.
20. Trappey GJ 4th, O’Connor DP, Edwards TB. What are the instability and infection rates after reverse shoulder arthroplasty? Clin Orthop Relat Res. 2011;469(9):2505-2511.
21. Sirveaux F, Favard L, Oudet D, Huquet D, Walch G, Molé D. Grammont inverted total shoulder arthroplasty in the treatment of glenohumeral osteoarthritis with massive rupture of the cuff. Results of a multicentre study of 80 shoulders. J Bone Joint Surg Br. 2004;86(3):388-395.
22. Falagas ME, Kompoti M. Obesity and infection. Lancet Infect Dis. 2006;6(7):438-446.
23. Schoenfeld AJ, Carey PA, Cleveland AW 3rd, Bader JO, Bono CM. Patient factors, comorbidities, and surgical characteristics that increase mortality and complication risk after spinal arthrodesis: a prognostic study based on 5,887 patients. Spine J. 2013;13(10):1171-1179.
24. Jiang J, Teng Y, Fan Z, Khan S, Xia Y. Does obesity affect the surgical outcome and complication rates of spinal surgery? A meta-analysis. Clin Orthop Relat Res. 2014;472(3):968-975.
25. Bozic KJ, Lau E, Kurtz S, et al. Patient-related risk factors for periprosthetic joint infection and postoperative mortality following total hip arthroplasty in Medicare patients. J Bone Joint Surg Am. 2012;94(9):794-800.
26. Franklin PD, Li W, Ayers DC. The Chitranjan Ranawat Award: functional outcome after total knee replacement varies with patient attributes. Clin Orthop Relat Res. 2008;466(11):2597-2604.
27. Huddleston JI, Wang Y, Uquillas C, Herndon JH, Maloney WJ. Age and obesity are risk factors for adverse events after total hip arthroplasty. Clin Orthop Relat Res. 2012;470(2):490-496.
28. Jämsen E, Nevalainen P, Eskelinen A, Huotari K, Kalliovalkama J, Moilanen T. Obesity, diabetes, and preoperative hyperglycemia as predictors of periprosthetic joint infection: a single-center analysis of 7181 primary hip and knee replacements for osteoarthritis. J Bone Joint Surg Am. 2012;94(14):e101.
29. Naziri Q, Issa K, Malkani AL, Bonutti PM, Harwin SF, Mont MA. Bariatric orthopaedics: total knee arthroplasty in super-obese patients (BMI > 50 kg/m2). Survivorship and complications. Clin Orthop Relat Res. 2013;471(11):3523-3530.
30. Warrender WJ, Brown OL, Abboud JA. Outcomes of arthroscopic rotator cuff repairs in obese patients. J Shoulder Elbow Surg. 2011;20(6):961-967.
31. Singh JA, Sperling JW, Cofield RH. Risk factors for revision surgery after humeral head replacement: 1,431 shoulders over 3 decades. J Shoulder Elbow Surg. 2012;21(8):1039-1044.
32. Chalmers PN, Rahman Z, Romeo AA, Nicholson GP. Early dislocation after reverse total shoulder arthroplasty. J Shoulder Elbow Surg. 2014;23(5):737-744.
33. Li X, Williams PN, Nguyen JT, Craig EV, Warren RF, Gulotta LV. Functional outcomes after total shoulder arthroplasty in obese patients. J Bone Joint Surg Am. 2013;95(21):e160.
Body mass index (BMI) is thought to be a predictor of body composition, with higher values indicating more adipose tissue. BMI is a measure of mass with respect to height. The World Health Organization1 has established health categories based on BMI measurements. Values from 18.5 to 24.9 kg/m2 are deemed to represent normal weight; those from 25 to 30 kg/m2, overweight; and those higher than 30 kg/m2, obesity. BMI is not a perfect tool, but it is the most widely used tool in clinical and research practice because of its relative reliability and ease of use.2 Being overweight or obese (according to BMI) is increasingly common among adults worldwide, and particularly in the United States. An estimated 39% of adults worldwide are overweight, and 13% are obese.1 An estimated 69% of US adults are overweight, including 35.1% who are obese.2
Various pathologies have been treated with reverse shoulder arthroplasty (RSA), and results have been promising,3-9 but little is known about patient demographic and clinical factors that may adversely affect outcomes. Recent work suggests younger age7 and failed prior arthroplasty may adversely affect RSA outcomes.10 Higher BMI has also been implicated as a cause of increased perioperative and immediate postoperative complications of RSA with minimum 90-day follow-up, but no one has examined shoulder function scores at minimum 2-year follow-up.11,12
We conducted a study to examine shoulder function scores, mobility, patient satisfaction, and complications at minimum 2-year follow-up in normal-weight, overweight, and obese patients who underwent RSA. We hypothesized that, compared with normal-weight patients, obese patients would have worse shoulder function scores, worse mobility, and more complications.
Materials and Methods
Inclusion Criteria and Demographics
After obtaining Institutional Review Board approval for this study, we used a prospective shoulder arthroplasty registry to identify patients (N = 77) who had rotator cuff tear arthropathy (RCTA) treated with primary RSA and then had minimum 2-year follow-up. The study period was 2004-2011. All patients had RCTA diagnosed with physical examination findings and anteroposterior, scapular Y, and axillary radiographs. RCTA was graded 1 to 5 using the classification system of Hamada and colleagues.13 Rotator cuff status was determined with preoperative computed tomography arthrogram (CTA) or magnetic resonance imaging (MRI) and confirmed at time of surgery. BMI calculations were based on height and weight measured at initial office visit. Thirty-four patients had normal weight (BMI <25 kg/m2), 21 were overweight (BMI 25-30 kg/m2), and 22 were obese (BMI >30 kg/m2). Patient demographic and clinical characteristics reviewed also included age, sex, follow-up duration, arm dominance, complications, prevalence of depression, and prevalence of diabetes. All RSAs were performed by the same surgeon (Dr. Edwards) at a single high-volume shoulder arthroplasty center.
Shoulder function scores evaluated before surgery and at final follow-up included Constant score,14 American Shoulder and Elbow Surgeons (ASES) score,15 Western Ontario Osteoarthritis Shoulder (WOOS) index,16 Single Assessment Numeric Evaluation (SANE),17 and mobility. Satisfaction was assessed by having patients describe themselves as very dissatisfied, dissatisfied, satisfied, or very satisfied. All intraoperative and postoperative complications were recorded.
Surgical Technique and Postoperative Rehabilitation
The Aequalis RSA system (Tornier) was used for all patients during the study period. The RSA technique used has been well described.18,19 A standard postoperative rehabilitation protocol was followed.19,20
Clinical and Radiographic Assessment
Patients were prospectively enrolled in a shoulder arthroplasty outcomes registry and followed clinically. Mean follow-up was 3.16 years (range, 2-8 years). Before surgery, patients were examined by the surgeon. Examinations were repeated 1 week, 6 weeks, 3 months, 6 months, and 12 months after surgery and annually thereafter. Mobility (active range of motion) was determined with a handheld goniometer. Strength of abduction was measured with a handheld digital dynamometer (Chatillon digital force gauge, 200 lbf; Ametek). Anteroposterior in plane of scapula, scapular Y, and axillary radiographs were obtained at each clinic appointment.
Before surgery, the surgeon reviewed all radiographs. Each RCTA was given a Hamada grade (1-5).13 Glenoid erosion in the coronal plane was classified (E0, E1, E2, E3) according to Sirveaux and colleagues.21 Hamada grades and glenoid erosion types are listed in Table 1. The overall trend in classification by BMI group was statistically significant for Hamada grade (P = .004) but not glenoid erosion type (P = .153).
Before surgery, the surgeon also evaluated rotator cuff status using CTA or MRI. All patients had full-thickness tears of the supraspinatus and infraspinatus. The subscapularis was variably present, and subscapularis repair was performed when the subscapularis was intact. Rotator cuff status is listed in Table 2. There were no significant differences in the distribution of intact subscapularis (P = .402) or teres minor (P = .188) among the normal-weight, overweight, and obese groups. No patient had a latissimus dorsi transfer at time of RSA.
Statistical Analysis
Independent-samples t tests assuming unequal variances were used to compare the 3 BMI groups on age, follow-up duration, preoperative shoulder function scores, and mobility. Chi-square tests were used to identify any significant group differences in comorbidities (eg, complications, arm dominance, prevalence of depression, prevalence of diabetes) and patient satisfaction. Repeated-measures analysis of variance was used to evaluate main effects, changes from before surgery to final follow-up, and BMI group differences, as well as differences in changes from before surgery to final follow-up among the 3 BMI groups.
Results
Among BMI groups (<25 kg/m2, 25-30 kg/m2, >30 kg/m2), there were no statistically significant preoperative differences in age, sex, follow-up duration, complications, arm dominance, prevalence of depression, or prevalence of diabetes (P >. 05) (Table 3). Table 4 lists the groups’ preoperative and final follow-up data (Constant score, ASES score, WOOS index, SANE, mobility). There were no statistically significant preoperative group differences in Constant score, ASES score, WOOS index, SANE, mobility, or patient satisfaction (P > .05) (Tables 5, 6).
All groups’ shoulder function scores and mobility improved significantly from before surgery to final follow-up (P < .001) (Table 5). The groups’ magnitudes of change (improvement) from before surgery to final follow-up were almost identical, with no significant differences in shoulder function scores or mobility (Table 5). The only significant difference was in Constant–Strength, which was higher in the obese group (P = .017) (Table 5). Patient satisfaction ratings improved after surgery, with 79% of the normal-weight group reporting being satisfied or very satisfied with their shoulders (Table 6). The overweight and obese groups gave similar satisfied (81%) and very satisfied (82%) ratings. The small differences between group satisfaction scores were nonsignificant (P = .967).
Complications
The normal-weight group had 4 complications: periprosthetic infection (2 cases), intraoperative humeral fracture (1), and scapular spine stress fracture (1). The overweight group had 1 complication, an acromial stress fracture that was successfully treated with conservative measures. The obese group had 1 patient with 2 postoperative dislocations. The first dislocation was treated with closed reduction and bracing, and the second required revision surgery. There was no statistical difference in complications among the groups (P = .680).
Discussion
To our knowledge, this is the first study of the effects of varying BMI on functional outcomes of RSA with minimum 2-year follow-up. There appears to be minimal impact on shoulder function scores, complications, and patient satisfaction among normal-weight, overweight, and obese patients with RCTA treated by the same surgeon using similar techniques.
The relationship between obesity and increased perioperative risks or poorer surgical outcomes has been well established in orthopedic surgery. In a systematic review, Falagas and Kompoti22 found increased risk for perioperative and nosocomial infections in obese patients. Schoenfeld and colleagues23 and Jiang and colleagues24 reported increased risk for complications in spinal surgery. The total joint arthroplasty literature is rife with evidence suggesting higher BMI leads to increased risk for complications, including infection and deep venous thrombosis, as well as decreased functional outcome scores.25-29 Recent studies on shoulder surgery have shown worse outcomes in rotator cuff repair30 and a higher revision rate in hemiarthroplasy.31
Other RSA studies have examined short-term complications or perioperative risk factors associated with BMI. In a study using slightly different BMI groupings, Gupta and colleagues12 reported significantly higher complication rates for RSA patients with BMI higher than 35 kg/m2 compared to patients with BMI of 25 to 35 kg/m2 and compared to patients with BMI lower than 25 kg/m2. Their study highlighted medical and surgical complications and used a short follow-up period (minimum, 90 days). It did not assess shoulder function scores, and included multiple indications for RSA (eg, RCTA, proximal humerus fracture, inflammatory arthropathy). In another study, higher BMI was reported as a risk factor for early dislocation after RSA, but only 11 patients with a history of dislocation were assessed, and minimum follow-up was 6 months.32 We know of only one study that addressed RSA outcomes in obese patients and used minimum 2-year follow-up, but its primary endpoint was rate of complications, and it did not report shoulder function scores.11 Li and colleagues33 conducted a study similar to ours, but with primary total shoulder arthroplasty (TSA) patients, and reported similar results. Relative to normal BMI, higher BMI did not have a detrimental effect on short-term improvement in shoulder function after TSA.
Given the US obesity epidemic, our study results are encouraging. Depending on many factors, obesity remains a risk factor for poor outcomes in patients who undergo orthopedic surgery. As our results show, however, patients with higher BMI can obtain functional outcomes similar to those experienced by patients with normal-weight BMI after RSA for RCTA.
The primary limitation of this study was its retrospective design. Strengths of the study included its having a single surgeon and a single diagnosis: RCTA. In addition, each group was robust in size, a standard operative/postoperative protocol was used, and clinical results were measured with multiple validated shoulder function scores.
Conclusion
Improved shoulder function scores, mobility, and patient satisfaction can be expected after RSA for RCTA in patients with BMI higher than 30 kg/m2. These patients did not exhibit an increase in complications at short-term follow-up.
1. World Health Organization. Obesity and overweight [factsheet 311]. Updated January 2015. http://www.who.int/mediacentre/factsheets/fs311/en/. Accessed March 27, 2016.
2. National Center for Health Statistics, Centers for Disease Control and Prevention. Obesity and overweight. Updated February 25, 2016. http://www.cdc.gov/nchs/fastats/obesity-overweight.htm. Accessed March 27, 2016.
3. Boileau P, Gonzalez JF, Chuinard C, Bicknell R, Walch G. Reverse total shoulder arthroplasty after failed rotator cuff surgery. J Shoulder Elbow Surg. 2009;18(4):600-606.
4. Drake GN, O’Connor DP, Edwards TB. Indications for reverse total shoulder arthroplasty in rotator cuff disease. Clin Orthop Relat Res. 2010;468(6):1526-1533.
5. Gerber C, Pennington SD, Nyffeler RW. Reverse total shoulder arthroplasty. J Am Acad Orthop Surg. 2009;17(5):284-289.
6. Lenarz C, Shishani Y, McCrum C, Nowinski RJ, Edwards TB, Gobezie R. Is reverse shoulder arthroplasty appropriate for the treatment of fractures in the older patient? Early observations. Clin Orthop Relat Res. 2011;469(12):3324-3331.
7. Muh SJ, Streit JJ, Wanner JP, et al. Early follow-up of reverse total shoulder arthroplasty in patients sixty years of age or younger. J Bone Joint Surg Am. 2013;95(20):1877-1883.
8. Wall B, Nové-Josserand L, O’Connor DP, Edwards TB, Walch G. Reverse total shoulder arthroplasty: a review of results according to etiology. J Bone Joint Surg Am. 2007;89(7):1476-1485.
9. Young AA, Smith MM, Bacle G, Moraga C, Walch G. Early results of reverse shoulder arthroplasty in patients with rheumatoid arthritis. J Bone Joint Surg Am. 2011;93(20):1915-1923.
10. Boileau P, Melis B, Duperron D, Moineau G, Rumian AP, Han Y. Revision surgery of reverse shoulder arthroplasty. J Shoulder Elbow Surg. 2013;22(10):1359-1370.
11. Beck JD, Irgit KS, Andreychik CM, Maloney PJ, Tang X, Harter GD. Reverse total shoulder arthroplasty in obese patients. J Hand Surg Am. 2013;38(5):965-970.
12. Gupta AK, Chalmers PN, Rahman Z, et al. Reverse total shoulder arthroplasty in patients of varying body mass index. J Shoulder Elbow Surg. 2014;23(1):35-42.
13. Hamada K, Fukuda H, Mikasa M, Kobayashi Y. Roentgenographic findings in massive rotator cuff tears. A long-term observation. Clin Orthop Relat Res. 1990;(254):92-96.
14. Constant CR, Murley AH. A clinical method of functional assessment of the shoulder. Clin Orthop Relat Res. 1987;(214):160-164.
15. Michener LA, McClure PW, Sennett BJ. American Shoulder and Elbow Surgeons standardized shoulder assessment form, patient self-report section: reliability, validity, and responsiveness. J Shoulder Elbow Surg. 2002;11(6):587-594.
16. Lo IK, Griffin S, Kirkley A. The development of a disease-specific quality of life measurement tool for osteoarthritis of the shoulder: the Western Ontario Osteoarthritis of the Shoulder (WOOS) index. Osteoarthritis Cartilage. 2001;9(8):771-778.
17. Williams GN, Gangel TJ, Arciero RA, Uhorchak JM, Taylor DC. Comparison of the Single Assessment Numeric Evaluation method and two shoulder rating scales. Outcomes measures after shoulder surgery. Am J Sports Med. 1999;27(2):214-221.
18. Gartsman GM, Edwards TB. Shoulder Arthroplasty. Philadelpia, PA: Saunders Elsevier; 2008.
19. Liotard JP, Edwards TB, Padey A, Walch G, Boulahia A. Hydrotherapy rehabilitation after shoulder surgery. Tech Shoulder Elbow Surg. 2003;4:44-49.
20. Trappey GJ 4th, O’Connor DP, Edwards TB. What are the instability and infection rates after reverse shoulder arthroplasty? Clin Orthop Relat Res. 2011;469(9):2505-2511.
21. Sirveaux F, Favard L, Oudet D, Huquet D, Walch G, Molé D. Grammont inverted total shoulder arthroplasty in the treatment of glenohumeral osteoarthritis with massive rupture of the cuff. Results of a multicentre study of 80 shoulders. J Bone Joint Surg Br. 2004;86(3):388-395.
22. Falagas ME, Kompoti M. Obesity and infection. Lancet Infect Dis. 2006;6(7):438-446.
23. Schoenfeld AJ, Carey PA, Cleveland AW 3rd, Bader JO, Bono CM. Patient factors, comorbidities, and surgical characteristics that increase mortality and complication risk after spinal arthrodesis: a prognostic study based on 5,887 patients. Spine J. 2013;13(10):1171-1179.
24. Jiang J, Teng Y, Fan Z, Khan S, Xia Y. Does obesity affect the surgical outcome and complication rates of spinal surgery? A meta-analysis. Clin Orthop Relat Res. 2014;472(3):968-975.
25. Bozic KJ, Lau E, Kurtz S, et al. Patient-related risk factors for periprosthetic joint infection and postoperative mortality following total hip arthroplasty in Medicare patients. J Bone Joint Surg Am. 2012;94(9):794-800.
26. Franklin PD, Li W, Ayers DC. The Chitranjan Ranawat Award: functional outcome after total knee replacement varies with patient attributes. Clin Orthop Relat Res. 2008;466(11):2597-2604.
27. Huddleston JI, Wang Y, Uquillas C, Herndon JH, Maloney WJ. Age and obesity are risk factors for adverse events after total hip arthroplasty. Clin Orthop Relat Res. 2012;470(2):490-496.
28. Jämsen E, Nevalainen P, Eskelinen A, Huotari K, Kalliovalkama J, Moilanen T. Obesity, diabetes, and preoperative hyperglycemia as predictors of periprosthetic joint infection: a single-center analysis of 7181 primary hip and knee replacements for osteoarthritis. J Bone Joint Surg Am. 2012;94(14):e101.
29. Naziri Q, Issa K, Malkani AL, Bonutti PM, Harwin SF, Mont MA. Bariatric orthopaedics: total knee arthroplasty in super-obese patients (BMI > 50 kg/m2). Survivorship and complications. Clin Orthop Relat Res. 2013;471(11):3523-3530.
30. Warrender WJ, Brown OL, Abboud JA. Outcomes of arthroscopic rotator cuff repairs in obese patients. J Shoulder Elbow Surg. 2011;20(6):961-967.
31. Singh JA, Sperling JW, Cofield RH. Risk factors for revision surgery after humeral head replacement: 1,431 shoulders over 3 decades. J Shoulder Elbow Surg. 2012;21(8):1039-1044.
32. Chalmers PN, Rahman Z, Romeo AA, Nicholson GP. Early dislocation after reverse total shoulder arthroplasty. J Shoulder Elbow Surg. 2014;23(5):737-744.
33. Li X, Williams PN, Nguyen JT, Craig EV, Warren RF, Gulotta LV. Functional outcomes after total shoulder arthroplasty in obese patients. J Bone Joint Surg Am. 2013;95(21):e160.
Use of an Anti-Gravity Treadmill for Early Postoperative Rehabilitation After Total Knee Replacement: A Pilot Study to Determine Safety and Feasibility
Patients undergoing total knee arthroplasty (TKA) may benefit from focused postoperative rehabilitation. Although there is limited research comparing different rehabilitation protocols after TKA,1 any type of rehabilitation often helps to optimize range of motion (ROM), strength, balance, and ambulation.2 Early mobilization and rehabilitation after TKA reduces pain, fear, anxiety, and risk of postoperative venous thromboembolic disease.3 Earlier discharge to home or community settings deceases time for inpatient rehabilitation, patient and family education, and gait training, which places a greater emphasis on outpatient rehabilitation.4
Although rapid rehabilitation protocols have gained wide acceptance, concern remains that a higher intensity intervention initiated immediately after hospital discharge could lead to an increased incidence of pain and swelling, and to poorer ROM and functional outcomes.5 Progressive weight-bearing activities, such as walking, are routinely recommended during rehabilitation to facilitate return to normal function. Not all patients are capable of full weight-bearing activity in the early postoperative period and assistive devices (ADs), such as walkers, crutches, and canes, are routinely employed. An opportunity to enhance early TKA rehabilitation exists with devices that allow functional gait training while modifying weight-bearing forces across the joint. Assistive devices, hydrotherapy (walking in water),6,7 and lower body positive-pressure chambers8 can reduce the forces at the knee during weight-bearing exercise.
Lower body positive-pressure devices have been extensively studied in physiological response of healthy humans;9-12 in disease states such as cerebral palsy13 and obesity;14 and in other postoperative orthopedic conditions, such as anterior cruciate ligament reconstruction, meniscectomy,8 microfracture,15 TKA,16 and Achilles tendon repair.17 These studies demonstrate that a lower body positive-pressure treadmill is associated with minimal cardiovascular effect while producing a significant decrease in ground reaction forces without altering gait kinematics.
We postulated that an anti-gravity treadmill may be safe and effective for gait training during rehabilitation following TKA. The primary objective was to determine the safety and feasibility of using the AlterG® Anti-Gravity Treadmill® device for postoperative gait training during rehabilitation following TKA. The secondary objective was to determine the effects of gait training (land-based vs anti-gravity) during postoperative rehabilitation on subjective patient outcomes assessed by Knee Injury and Osteoarthritis Outcome Score (KOOS), mobility assessed by the Timed Up and Go test (TUG), and pain assessed by a Numerical Rating Scale (NRS) to conduct a power analysis to determine sample sizes for efficacy studies based on these preliminary findings.
MethodsParticipants/Patient Enrollment and Study Overview
After signing an Institutional Review Board-approved consent, 30 patients were enrolled, and TKA surgeries were performed by 1 of 5 surgeons at 1 hospital. To be enrolled in the study, subjects must have (1) had a unilateral primary TKA, (2) been discharged from the hospital to home (not to a skilled nursing facility), (3) had only 3 to 4 home physical therapy (PT) sessions, (4) agreed to further outpatient PT at a single site, and (5) agreed to complete patient questionnaires. Exclusion criteria included (1) inability to meet inclusion criteria, (2) gross musculoskeletal deformity, (3) uncontrolled chronic or systemic disease, and (4) inability to follow instructions because of mental impairment, substance abuse, or addiction. Home PT was conducted for 3 to 4 sessions after surgery, and outpatient PT was continued at the study site per protocol for 4 weeks; subjects were asked to return for follow-up 3 months postoperatively. Patients were randomized on the first day of their outpatient PT to either a land-based (control) or an anti-gravity-based group using the AlterG Anti-Gravity Treadmill (AlterG group) gait training during outpatient PT sessions. Patients attended outpatient PT 2 days per week for 4 weeks for a total of 8 sessions. Therapy sessions lasted 45 to 60 minutes and included manual therapy, gait training, and therapeutic exercises/activities. The KOOS18,19 and TUG20 scores were evaluated at baseline (ie, first therapy session), end of physical therapy (EOPT) (ie, at final therapy session), and end of study (EOS) (ie, 3 months postoperatively). The NRS for pain was evaluated at baseline and at EOPT. Physical therapists were questioned for satisfaction with the anti-gravity rehabilitation protocol at EOPT.
Physical Therapy Protocols
All patients were treated consistently by 1 of 5 physical therapists at 1 outpatient setting; physical therapists averaged 11 years of experience in treating orthopedic conditions. Care was delivered in accordance with professional standards and the therapist’s assessment of medical necessity. Considerations included, but were not limited to, overall general health, any medical comorbidity, support system, and an ongoing assessment of ROM, strength, pain, and functional status. Each PT session started with a 5- to 10-minute warm-up on a standard cycle ergometer and was followed by manual therapy, gait training (land-based vs anti-gravity), therapeutic exercises/activities, and treatment modalities.
The time spent, activities selected, and modalities or physical agents chosen during the PT session were based on the patient’s needs and progress toward his/her functional goals. Manual therapy techniques consisted of soft-tissue mobilization, passive ROM, joint mobilization, passive stretching, scar mobilization, manual resistive exercises, and proprioceptive neuromuscular facilitation techniques. Therapeutic exercises/activities consisted of lower extremity resistance exercises (weight bearing and non-weight bearing), ROM exercises, stretching, balance, stair training, agility, activities of daily life (ADL) training, and a comprehensive home exercise program. Modalities or physical agents used during this study included moist hot packs, cold packs, ultrasound, electrical stimulation, and Kinesio Tape. Physical agents were incorporated into the individual’s plan of care based on medical necessity when deemed appropriate by the treating therapist. The exercise prescription was based on an individual’s status and tolerance and the number of sets and repetitions were based on fatigue.
Gait Training
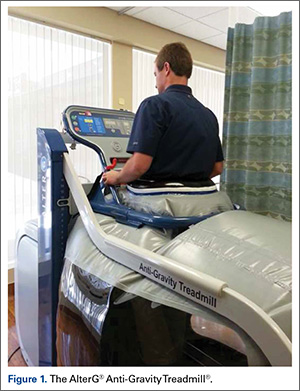
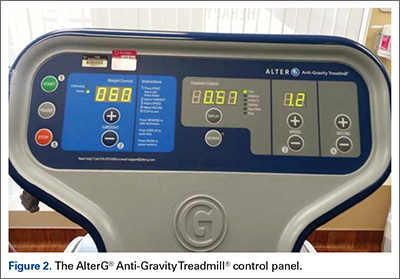
The patients were randomized (1:1) to either land-based or anti-gravity gait training. For the control group, land-based gait training was performed with or without an appropriate AD and appropriate assistance, tactile cueing, and verbal cueing from a physical therapist. Duration (minutes) and gait-training progression were dependent on the participant’s functional goals, pain level (assessed throughout treatment), and level of fatigue. For the AlterG group, gait training was performed in the AlterG Anti-Gravity Treadmill, M320 (Alter-G; Figure 1). On day 1, the AlterG pressure chamber was set to allow only 50% of the patient’s body weight to be transmitted to the treadmill floor, and speed was controlled by the patient according to his/her comfort level. The percentage of body weight was adjusted to allow for a safe and normalized gait pattern with a pain level no greater than 5 (0 to 10 scale) throughout the PT session. A report card was recorded at each PT session, including body-weight setting (%), speed (miles per hour), incline (%), and duration (minutes) (Figure 2). For subsequent visits, the body-weight setting was started from the end point of the previous session.
Data Collection and Analysis
SPSS version 12.0 (SPSS Inc.) was used for all analyses, and an alpha level of .05 determined statistical significance when comparing group differences. The safety and feasibility of the anti-gravity (AlterG) vs land-based (control) gait training was assessed by the presence (or absence) of adverse events (AEs) and complications, and the date the patient discontinued use of his/her AD. A chi-square test was used to assess differences between control and AlterG groups regarding patient discontinuance of an AD. Additionally, for patients randomized to AlterG, a report card summarized means and frequencies for body weight, speed, incline, and duration. At EOPT, the frequency of therapists who were satisfied with the AlterG Anti-Gravity Treadmill as part of the rehabilitation protocol was reported. The preliminary effects of gait training (land-based vs anti-gravity) during postoperative rehabilitation on functional outcomes (subjective patient outcomes assessed by KOOS, mobility assessed by the TUG test, and pain assessed by a NRS) were evaluated by independent sample t tests. Paired sample t tests were used to compare each of the functional outcomes at EOPT or EOS to the baseline value.
Results
Of the 30 patients enrolled, 29 (96.7%; 29/30) patients completed the study; 1 patient, who could not complete all PT sessions because of medical and transportation issues, was excluded. The remaining 29 patients comprised the study population (control = 15; AlterG = 14). All patients were compliant with PT protocols.
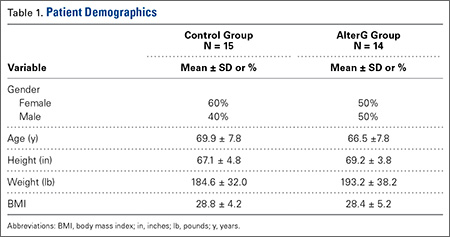
Patient demographics were similar between the control and AlterG groups (Table 1). The control group comprised 9 women (60%; 9/15) and 6 men (40%; 6/15), age 69.9 ± 7.8 years and a body mass index of 28.8 ± 4.2. Similarly, the AlterG group comprised 7 women (50%; 7/14) and 7 men (50%; 7/14), age 66.5 ± 7.8 years and a body mass index of 28.4 ± 5.2.
At the baseline PT visit, patients in the control and AlterG groups had similar KOOS, TUG, and NRS scores. At baseline, mean KOOS for symptoms, pain, sports/recreation, ADL, and quality of life were 52.7, 52.9, 22.7, 64, and 31.8, respectively, although 50% of patients did not complete the sports/recreation subset of the KOOS. In addition, the mean time to complete the TUG test was 14.5 seconds, which was within the normal limits for disabled patients. This was slightly longer than normal mobility (TUG <10 seconds),20 but patients had relatively low levels of pain (mean NRS = 2.5, on a scale of 0-11).
All patients completed the PT protocols without indication of injury or AEs related to their operative knee. Three patients (10.3%; 3/29) experienced a deep venous thromboembolism (DVT), 2 in the control group (13.3%; 2/15), and 1 in the AlterG group (7.1%; 1/14). Venous thromboembolism protocol of enoxaparin 30 mg twice daily while in the hospital and enoxaparin 40 mg once daily for 10 days after discharge was followed for all patients.
Overall, more than half of patients (55.2%; 16/29) discontinued their AD during the 4-week PT period, with the remaining discontinuing prior to EOPT (24.1%; 7/29) or after EOPT (20.7%; 6/29). No statistically significant differences were found between the control and AlterG groups regarding discontinuance of AD.
Among those randomized to the AlterG group, all patients performed within the protocol established for the device for body-weight setting, treadmill speed, and duration of walking. The average body-weight treadmill setting increased by ~30% over the treatment period, from 55% at baseline to 84% at EOPT. The average speed increased by ~70%, from 1.6 mph at baseline to 2.7 mph at EOPT. The mean duration of AlterG use increased by ~75%, from 7.2 minutes at baseline to 12.7 minutes at EOPT. All physical therapists (100%) reported satisfaction with the AlterG for use in early postoperative rehabilitation and reported that patients’ treatment progressed positively.
While functional outcomes (KOOS, TUG, or NRS) did not vary with the type of gait training (P > .2 for land-based vs anti-gravity), functional outcomes improved over time (all P < .01 from baseline to EOPT and all P < .01 from baseline to EOS).
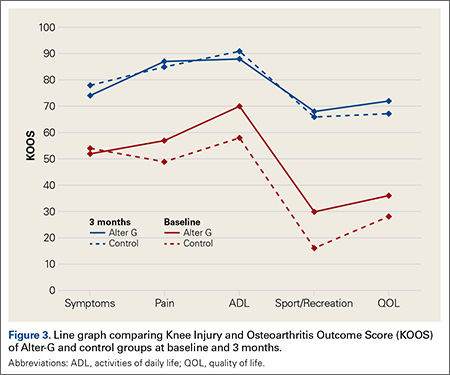
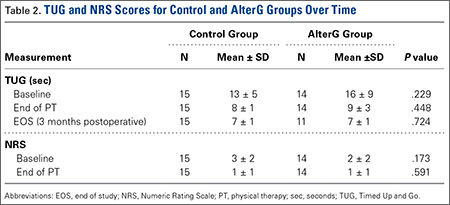
The KOOS scores improved from baseline to EOPT and from baseline to EOS (ie, 3-month follow-up visit) for both treatment groups (Figure 3). More patients completed the sports/recreation portion of the KOOS scores at EOPT and EOS compared to baseline. Forty-three percent and 25% of patients did not complete KOOS sports/recreation questions at EOPT and EOS, respectively, compared to 50% at baseline. This suggests that patients were improving to a level where sports/recreation scores were more applicable than directly after TKA surgery. The TUG scores had the greatest improvement from baseline to EOPT, with a decrease in time of 5 seconds and 7 seconds for the control and AlterG groups, respectively, and slight improvement from EOPT to EOS, with a decrease in time of 1 second and 2 seconds for the control and AlterG groups, respectively (Table 2). By the EOS, the values for the TUG tests for both treatment groups were within normal (<10 seconds) range.20 The NRS scores improved from baseline to EOPT with a score of 1 ± 1 in both control and AlterG groups.
Using these preliminary efficacy results, a post-hoc power analysis (α = .05 and 1β = 80%) was performed with the ADL domain of KOOS as the primary endpoint. Based on a standard deviation of 20 points and an effect size of 5 points, the sample size was estimated to be N = 250 per treatment group.
Discussion
We conducted a pilot study to assess, primarily, the feasibility and safety, and, secondarily, the efficacy, of a lower body positive-pressure treadmill for rehabilitation of patients after TKA. This small study showed that use of the AlterG Anti-Gravity Treadmill was not only safe and feasible during postoperative TKA rehabilitation, but also was well tolerated by patients and was rated highly satisfactory by physical therapists. Patients who used AlterG during gait training improved functionally (in terms of KOOS, TUG, and NRS) after 8 treatment sessions compared to baseline. However, there were no statistical differences between groups (control vs AlterG). Thus, these results suggest that an anti-gravity device for gait training may be a useful adjunct for postoperative TKA rehabilitation, but further studies are needed to determine the efficacy of anti-gravity compared to traditional land-based gait training.
The study of rehabilitation protocols during postoperative PT involved consideration of a number of issues. First, differences in functional outcomes compared to traditional rehabilitation could not be detected in this study because of the small number of patients, but the patients treated with anti-gravity gait training showed improvement in functional outcomes over time and did not report any added complications. Given that the primary outcome of this study was safety and feasibility, these added efficacy results are supplemental and useful in helping to plan studies. Second, the functional outcomes used to measure the efficacy of the anti-gravity treadmill may not be sensitive enough to detect differences between rehabilitation protocols. Use of a treadmill to measure speed improvement, endurance, and tolerance in both groups could be valuable in future studies. More studies may need to refine characteristics that are important to postoperative rehabilitation success, and quantitative and subjective measures that must be defined.
The results reported here using an anti-gravity treadmill for postoperative TKA rehabilitation support the safety and feasibility that has been reported in other orthopedic rehabilitation settings. Anti-gravity treadmills, which have been used to study patients after meniscectomy or anterior cruciate ligament reconstruction8 and Achilles repair,17 have demonstrated predictable decreases in ground reaction forces with increasing positive-pressure unweighting, reductions in pain with ambulation, and allowance of earlier institution of walking and jogging during rehabilitation.17
Patient safety is an important attribute for any postoperative rehabilitation protocol, especially in an elderly population undergoing major surgery. One of our important goals was to assess the safety of AlterG. We noted no AEs attributable to the device, which was supported by work indicating no adverse impact on systemic cardiovascular parameters in a similar lower body positive-pressure environment.9 Although 3 patients (10%) developed symptomatic DVT, there were no differences between the groups in the incidence of DVT. Use of an anti-gravity treadmill has also been examined for cardiovascular responses in TKA patients. In a study of 24 adults with TKA, researchers found that anti-gravity support allowed TKA patients to walk at faster speeds and tolerate greater inclines with lower heart rate, blood pressure, and oxygen consumption.21 With respect to efficacy of the rehabilitation intervention, we demonstrated significant improvements in all functional outcomes in both groups but no differences between the study groups. We concluded that AlterG was at least as effective as standard therapy in this small cohort. TKA is a very successful procedure, and the improvement in pain and function after surgery is fairly dramatic in most patients, regardless of specific rehabilitation protocols. Therefore, the substantial improvement in clinical outcomes may overshadow any enhanced benefits of the anti-gravity treadmill. Further investigations into the efficacy of AlterG are needed in a larger cohort to determine if this type of treatment is more beneficial than traditional land-based gait training.
Standard scoring systems such as KOOS, TUG, and NRS may not be sensitive enough to detect differences between treatment groups with small sample sizes. Given the results of the post hoc power analysis, a large number of patients (N = 250/group) would be necessary to detect any potential difference in clinical outcomes between the 2 groups. Larger studies are required to answer relevant questions, and additional outcome measures may be needed to detect differences between treatment groups. Relevant questions include whether earlier institution of the anti-gravity device during the immediate TKA postoperative period would be beneficial compared to standard postoperative PT, and whether PT enhanced with the anti-gravity device has incremental benefit in functional outcomes and in time to reach those goals. Finally, given the present attention to healthcare expenses, a cost-benefit analysis of anti-gravity device treatment vs traditional PT would be useful. Once the patient has become familiar with the function of an anti-gravity treadmill, gait therapy could proceed without the direct intervention of the therapist, potentially improving efficient delivery of rehabilitation services.
Studying the effect of different postoperative rehabilitation protocols after orthopedic surgeries can be challenging. In a large (N > 350) randomized controlled trial to study the effect of ergometer cycling after hip and knee replacement, patients who used the cycle ergometer had a higher Western Ontario and McMaster Universities Arthritis Index and greater satisfaction than those who did not after hip arthroplasty, but not after TKA.22 Improvements in muscular coordination and proprioception with the cycle ergometer may have been offset by increases in edema, joint effusion, and pain from the loading of the joint and the relatively fast rate of cycling compared to passive motion or ambulation. While many therapists and surgeons advocate cycling for rehabilitation after knee surgery, the need remains for a better definition of an optimal TKA rehabilitation program. A study of 82 patients comparing early progressive strength training to no early strength training showed no difference in the 6-minute walk test at 8 weeks.23 A systematic review of progressive resistance training (PRT) found that although postoperative PRT is safe and feasible, the methodological quality of existing studies is too low to allow conclusions regarding its efficacy.24 Gait training in an environment where weight-bearing loads can be closely controlled, monitored, and individualized may be an ideal methodology to enhance rehabilitation and return to function for knee replacement surgery.
This current study showed that the use of AlterG as an adjunct for postoperative rehabilitation is safe, accepted by patients and therapists, and leads to clinical functional outcomes that are at least as good as traditional postoperative TKA rehabilitation. We conclude that AlterG demonstrates utility and a potential for innovation in TKA rehabilitation.
1. NIH Consensus Statement on total knee arthroplasty. NIH Consensus State Sci Statements. 2003;20(1):1-34.
2. Jones CA, Voaklander DC, Suarez-Almazor ME. Determinants of function after total knee arthroplasty. Phys Ther. 2003;83(8):696-706.
3. Pearse EO, Caldwell BF, Lockwood RJ, Hollard J. Early mobilisation after conventional knee replacement may reduce the risk of post-operative venous thromboembolism. J Bone Joint Surg Br. 2007;89(3):316-322.
4. Westby MD, Kennedy D, Jones D, Jones A, Doyle-Waters MM, Backman C. Post-acute physiotherapy for primary total knee arthroplasty. Cochrane Database Syst Rev. 2008. doi.10.1002/14651858.CD007099
5. Bade MJ, Stevens-Lapsley JE. Early high-intensity rehabilitation following total knee arthroplasty improves outcomes. J Orthop Sports Phys Ther. 2011;41(12):932-941.
6. Ivanenko YP, Grasso R, Macellari V, Lacquaniti F. Control of foot trajectory in human locomotion: role of ground contact forces in simulated reduced gravity. J Neurophysiol. 2002;87(6):3070-3089.
7. Pöyhönen T, Keskinen KL, Kyröläinen H, Hautala A, Savolainen J, Mälkiä E. Neuromuscular function during therapeutic knee exercise under water and on dry land. Arch Phys Med Rehabil. 2001;82(10):1446-1452.
8. Eastlack RK, Hargens AR, Groppo ER, Steinbach GC, White KK, Pedowitz RA. Lower body positive-pressure exercise after knee surgery. Clin Orthop Rel Res. 2005;431:213-219.
9. Cutuk A, Groppo ER, Quigley EJ, White KW, Pedowitz RA, Hargens AR. Ambulation in simulated fractional gravity using lower body positive pressure: cardiovascular safety and gait analyses. J Appl Physiol. 2006;101(3):771-777.
10. Gojanovic B, Cutti P, Shultz R, Matheson GO. Maximal physiological parameters during partial body-weight support treadmill testing. Med Sci Sports Exerc. 2012;44(10):1935-1941.
11. Figueroa MA, Manning J, Escamilla P. Physiological responses to the AlterG Anti-Gravity Treadmill. Int J Applied Sci Tech. 2011;1:92-97.
12. Hoffman MD, Donaghe HE. Physiological responses to body weight-supported treadmill exercise in healthy adults. Arch Phys Med Rehabil. 2011;92(6):960-966.
13. Kurz MJ, Corr B, Stuberg W, Volkman KG, Smith N. Evaluation of lower body positive pressure supported treadmill training for children with cerebral palsy. Pediatr Phys Ther. 2011;23(3):232-239.
14. Christian M. Managing knee osteoarthritis: the effects of anti-gravity treadmill exercise on joint pain and physical function. Available at: http://mspace.lib.umanitoba.ca/handle/1993/8580. Accessed March 31, 2016.
15. Wilk KE, Macrina LC, Reinhold MM. Rehabilitation following microfracture of the knee. Cartilage. 2010;1(2):96-107.
16. Patil SS, Branovacki G, Martin MR, Pulido PA, Levy YD, Colwell CW Jr. 14-year median follow-up using the press-fit condylar sigma design for total knee arthroplasty. J Arthroplasty. 2013;28(8):1286-1290.
17. Saxena A, Granot A. Use of an anti-gravity treadmill in the rehabilitation of the operated achilles tendon: a pilot study. J Foot Ankle Surg. 2011;50(5):558-561.
18. Roos EM, Roos HP, Ekdahl C, Lohmander LS. Knee injury and Osteoarthritis Outcome Score (KOOS) - validation of a Swedish version. Scand J Med Sci Sports. 1998;8(6):439-448.
19. Roos EM, Toksvig-Larsen S. Knee injury and Osteoarthritis Outcome Score (KOOS) - validation and comparison to the WOMAC in total knee replacement. Health Qual Life Outcomes. 2003;1:17.
20. Timed Up and Go (TUG). Available at: http://www.rheumatology.org/I-Am-A/Rheumatologist/Research/Clinician-Researchers/Timed-Up-Go-TUG Accessed: March 15, 2016.
21. Webber SC, Horvey KJ, Yurach Pikaluk MT, Butcher SJ. Cardiovascular responses in older adults with total knee arthroplasty at rest and with exercise on a positive pressure treadmill. Eur J Appl Physiol. 2014;114(3):653-662.
22. Liebs TR, Herzberg W, Ruther W, Haasters J, Russlies M, Hassenpflug J. Ergometer cycling after hip and knee replacement surgery: a randomized control trial. J Bone Joint Surg Am. 2010;92(4):814-822.
23. Jakobsen TL, Kehlet H, Husted H, Petersen J, Bandholm T. Early progressive strength training to enhance recovery after fast-track total knee arthroplasty: a randomized controlled trial. Arthritis Care Res. 2014;66(12):1856-1866.
24. Skoffer B, Dalgas U, Mechlenburg I. Progressive resistance training before and after total hip and knee arthroplasty: a systematic review. Clin Rehabil. 2015;29(1):14-29.
Patients undergoing total knee arthroplasty (TKA) may benefit from focused postoperative rehabilitation. Although there is limited research comparing different rehabilitation protocols after TKA,1 any type of rehabilitation often helps to optimize range of motion (ROM), strength, balance, and ambulation.2 Early mobilization and rehabilitation after TKA reduces pain, fear, anxiety, and risk of postoperative venous thromboembolic disease.3 Earlier discharge to home or community settings deceases time for inpatient rehabilitation, patient and family education, and gait training, which places a greater emphasis on outpatient rehabilitation.4
Although rapid rehabilitation protocols have gained wide acceptance, concern remains that a higher intensity intervention initiated immediately after hospital discharge could lead to an increased incidence of pain and swelling, and to poorer ROM and functional outcomes.5 Progressive weight-bearing activities, such as walking, are routinely recommended during rehabilitation to facilitate return to normal function. Not all patients are capable of full weight-bearing activity in the early postoperative period and assistive devices (ADs), such as walkers, crutches, and canes, are routinely employed. An opportunity to enhance early TKA rehabilitation exists with devices that allow functional gait training while modifying weight-bearing forces across the joint. Assistive devices, hydrotherapy (walking in water),6,7 and lower body positive-pressure chambers8 can reduce the forces at the knee during weight-bearing exercise.
Lower body positive-pressure devices have been extensively studied in physiological response of healthy humans;9-12 in disease states such as cerebral palsy13 and obesity;14 and in other postoperative orthopedic conditions, such as anterior cruciate ligament reconstruction, meniscectomy,8 microfracture,15 TKA,16 and Achilles tendon repair.17 These studies demonstrate that a lower body positive-pressure treadmill is associated with minimal cardiovascular effect while producing a significant decrease in ground reaction forces without altering gait kinematics.
We postulated that an anti-gravity treadmill may be safe and effective for gait training during rehabilitation following TKA. The primary objective was to determine the safety and feasibility of using the AlterG® Anti-Gravity Treadmill® device for postoperative gait training during rehabilitation following TKA. The secondary objective was to determine the effects of gait training (land-based vs anti-gravity) during postoperative rehabilitation on subjective patient outcomes assessed by Knee Injury and Osteoarthritis Outcome Score (KOOS), mobility assessed by the Timed Up and Go test (TUG), and pain assessed by a Numerical Rating Scale (NRS) to conduct a power analysis to determine sample sizes for efficacy studies based on these preliminary findings.
MethodsParticipants/Patient Enrollment and Study Overview
After signing an Institutional Review Board-approved consent, 30 patients were enrolled, and TKA surgeries were performed by 1 of 5 surgeons at 1 hospital. To be enrolled in the study, subjects must have (1) had a unilateral primary TKA, (2) been discharged from the hospital to home (not to a skilled nursing facility), (3) had only 3 to 4 home physical therapy (PT) sessions, (4) agreed to further outpatient PT at a single site, and (5) agreed to complete patient questionnaires. Exclusion criteria included (1) inability to meet inclusion criteria, (2) gross musculoskeletal deformity, (3) uncontrolled chronic or systemic disease, and (4) inability to follow instructions because of mental impairment, substance abuse, or addiction. Home PT was conducted for 3 to 4 sessions after surgery, and outpatient PT was continued at the study site per protocol for 4 weeks; subjects were asked to return for follow-up 3 months postoperatively. Patients were randomized on the first day of their outpatient PT to either a land-based (control) or an anti-gravity-based group using the AlterG Anti-Gravity Treadmill (AlterG group) gait training during outpatient PT sessions. Patients attended outpatient PT 2 days per week for 4 weeks for a total of 8 sessions. Therapy sessions lasted 45 to 60 minutes and included manual therapy, gait training, and therapeutic exercises/activities. The KOOS18,19 and TUG20 scores were evaluated at baseline (ie, first therapy session), end of physical therapy (EOPT) (ie, at final therapy session), and end of study (EOS) (ie, 3 months postoperatively). The NRS for pain was evaluated at baseline and at EOPT. Physical therapists were questioned for satisfaction with the anti-gravity rehabilitation protocol at EOPT.
Physical Therapy Protocols
All patients were treated consistently by 1 of 5 physical therapists at 1 outpatient setting; physical therapists averaged 11 years of experience in treating orthopedic conditions. Care was delivered in accordance with professional standards and the therapist’s assessment of medical necessity. Considerations included, but were not limited to, overall general health, any medical comorbidity, support system, and an ongoing assessment of ROM, strength, pain, and functional status. Each PT session started with a 5- to 10-minute warm-up on a standard cycle ergometer and was followed by manual therapy, gait training (land-based vs anti-gravity), therapeutic exercises/activities, and treatment modalities.
The time spent, activities selected, and modalities or physical agents chosen during the PT session were based on the patient’s needs and progress toward his/her functional goals. Manual therapy techniques consisted of soft-tissue mobilization, passive ROM, joint mobilization, passive stretching, scar mobilization, manual resistive exercises, and proprioceptive neuromuscular facilitation techniques. Therapeutic exercises/activities consisted of lower extremity resistance exercises (weight bearing and non-weight bearing), ROM exercises, stretching, balance, stair training, agility, activities of daily life (ADL) training, and a comprehensive home exercise program. Modalities or physical agents used during this study included moist hot packs, cold packs, ultrasound, electrical stimulation, and Kinesio Tape. Physical agents were incorporated into the individual’s plan of care based on medical necessity when deemed appropriate by the treating therapist. The exercise prescription was based on an individual’s status and tolerance and the number of sets and repetitions were based on fatigue.
Gait Training
The patients were randomized (1:1) to either land-based or anti-gravity gait training. For the control group, land-based gait training was performed with or without an appropriate AD and appropriate assistance, tactile cueing, and verbal cueing from a physical therapist. Duration (minutes) and gait-training progression were dependent on the participant’s functional goals, pain level (assessed throughout treatment), and level of fatigue. For the AlterG group, gait training was performed in the AlterG Anti-Gravity Treadmill, M320 (Alter-G; Figure 1). On day 1, the AlterG pressure chamber was set to allow only 50% of the patient’s body weight to be transmitted to the treadmill floor, and speed was controlled by the patient according to his/her comfort level. The percentage of body weight was adjusted to allow for a safe and normalized gait pattern with a pain level no greater than 5 (0 to 10 scale) throughout the PT session. A report card was recorded at each PT session, including body-weight setting (%), speed (miles per hour), incline (%), and duration (minutes) (Figure 2). For subsequent visits, the body-weight setting was started from the end point of the previous session.
Data Collection and Analysis
SPSS version 12.0 (SPSS Inc.) was used for all analyses, and an alpha level of .05 determined statistical significance when comparing group differences. The safety and feasibility of the anti-gravity (AlterG) vs land-based (control) gait training was assessed by the presence (or absence) of adverse events (AEs) and complications, and the date the patient discontinued use of his/her AD. A chi-square test was used to assess differences between control and AlterG groups regarding patient discontinuance of an AD. Additionally, for patients randomized to AlterG, a report card summarized means and frequencies for body weight, speed, incline, and duration. At EOPT, the frequency of therapists who were satisfied with the AlterG Anti-Gravity Treadmill as part of the rehabilitation protocol was reported. The preliminary effects of gait training (land-based vs anti-gravity) during postoperative rehabilitation on functional outcomes (subjective patient outcomes assessed by KOOS, mobility assessed by the TUG test, and pain assessed by a NRS) were evaluated by independent sample t tests. Paired sample t tests were used to compare each of the functional outcomes at EOPT or EOS to the baseline value.
Results
Of the 30 patients enrolled, 29 (96.7%; 29/30) patients completed the study; 1 patient, who could not complete all PT sessions because of medical and transportation issues, was excluded. The remaining 29 patients comprised the study population (control = 15; AlterG = 14). All patients were compliant with PT protocols.
Patient demographics were similar between the control and AlterG groups (Table 1). The control group comprised 9 women (60%; 9/15) and 6 men (40%; 6/15), age 69.9 ± 7.8 years and a body mass index of 28.8 ± 4.2. Similarly, the AlterG group comprised 7 women (50%; 7/14) and 7 men (50%; 7/14), age 66.5 ± 7.8 years and a body mass index of 28.4 ± 5.2.
At the baseline PT visit, patients in the control and AlterG groups had similar KOOS, TUG, and NRS scores. At baseline, mean KOOS for symptoms, pain, sports/recreation, ADL, and quality of life were 52.7, 52.9, 22.7, 64, and 31.8, respectively, although 50% of patients did not complete the sports/recreation subset of the KOOS. In addition, the mean time to complete the TUG test was 14.5 seconds, which was within the normal limits for disabled patients. This was slightly longer than normal mobility (TUG <10 seconds),20 but patients had relatively low levels of pain (mean NRS = 2.5, on a scale of 0-11).
All patients completed the PT protocols without indication of injury or AEs related to their operative knee. Three patients (10.3%; 3/29) experienced a deep venous thromboembolism (DVT), 2 in the control group (13.3%; 2/15), and 1 in the AlterG group (7.1%; 1/14). Venous thromboembolism protocol of enoxaparin 30 mg twice daily while in the hospital and enoxaparin 40 mg once daily for 10 days after discharge was followed for all patients.
Overall, more than half of patients (55.2%; 16/29) discontinued their AD during the 4-week PT period, with the remaining discontinuing prior to EOPT (24.1%; 7/29) or after EOPT (20.7%; 6/29). No statistically significant differences were found between the control and AlterG groups regarding discontinuance of AD.
Among those randomized to the AlterG group, all patients performed within the protocol established for the device for body-weight setting, treadmill speed, and duration of walking. The average body-weight treadmill setting increased by ~30% over the treatment period, from 55% at baseline to 84% at EOPT. The average speed increased by ~70%, from 1.6 mph at baseline to 2.7 mph at EOPT. The mean duration of AlterG use increased by ~75%, from 7.2 minutes at baseline to 12.7 minutes at EOPT. All physical therapists (100%) reported satisfaction with the AlterG for use in early postoperative rehabilitation and reported that patients’ treatment progressed positively.
While functional outcomes (KOOS, TUG, or NRS) did not vary with the type of gait training (P > .2 for land-based vs anti-gravity), functional outcomes improved over time (all P < .01 from baseline to EOPT and all P < .01 from baseline to EOS).
The KOOS scores improved from baseline to EOPT and from baseline to EOS (ie, 3-month follow-up visit) for both treatment groups (Figure 3). More patients completed the sports/recreation portion of the KOOS scores at EOPT and EOS compared to baseline. Forty-three percent and 25% of patients did not complete KOOS sports/recreation questions at EOPT and EOS, respectively, compared to 50% at baseline. This suggests that patients were improving to a level where sports/recreation scores were more applicable than directly after TKA surgery. The TUG scores had the greatest improvement from baseline to EOPT, with a decrease in time of 5 seconds and 7 seconds for the control and AlterG groups, respectively, and slight improvement from EOPT to EOS, with a decrease in time of 1 second and 2 seconds for the control and AlterG groups, respectively (Table 2). By the EOS, the values for the TUG tests for both treatment groups were within normal (<10 seconds) range.20 The NRS scores improved from baseline to EOPT with a score of 1 ± 1 in both control and AlterG groups.
Using these preliminary efficacy results, a post-hoc power analysis (α = .05 and 1β = 80%) was performed with the ADL domain of KOOS as the primary endpoint. Based on a standard deviation of 20 points and an effect size of 5 points, the sample size was estimated to be N = 250 per treatment group.
Discussion
We conducted a pilot study to assess, primarily, the feasibility and safety, and, secondarily, the efficacy, of a lower body positive-pressure treadmill for rehabilitation of patients after TKA. This small study showed that use of the AlterG Anti-Gravity Treadmill was not only safe and feasible during postoperative TKA rehabilitation, but also was well tolerated by patients and was rated highly satisfactory by physical therapists. Patients who used AlterG during gait training improved functionally (in terms of KOOS, TUG, and NRS) after 8 treatment sessions compared to baseline. However, there were no statistical differences between groups (control vs AlterG). Thus, these results suggest that an anti-gravity device for gait training may be a useful adjunct for postoperative TKA rehabilitation, but further studies are needed to determine the efficacy of anti-gravity compared to traditional land-based gait training.
The study of rehabilitation protocols during postoperative PT involved consideration of a number of issues. First, differences in functional outcomes compared to traditional rehabilitation could not be detected in this study because of the small number of patients, but the patients treated with anti-gravity gait training showed improvement in functional outcomes over time and did not report any added complications. Given that the primary outcome of this study was safety and feasibility, these added efficacy results are supplemental and useful in helping to plan studies. Second, the functional outcomes used to measure the efficacy of the anti-gravity treadmill may not be sensitive enough to detect differences between rehabilitation protocols. Use of a treadmill to measure speed improvement, endurance, and tolerance in both groups could be valuable in future studies. More studies may need to refine characteristics that are important to postoperative rehabilitation success, and quantitative and subjective measures that must be defined.
The results reported here using an anti-gravity treadmill for postoperative TKA rehabilitation support the safety and feasibility that has been reported in other orthopedic rehabilitation settings. Anti-gravity treadmills, which have been used to study patients after meniscectomy or anterior cruciate ligament reconstruction8 and Achilles repair,17 have demonstrated predictable decreases in ground reaction forces with increasing positive-pressure unweighting, reductions in pain with ambulation, and allowance of earlier institution of walking and jogging during rehabilitation.17
Patient safety is an important attribute for any postoperative rehabilitation protocol, especially in an elderly population undergoing major surgery. One of our important goals was to assess the safety of AlterG. We noted no AEs attributable to the device, which was supported by work indicating no adverse impact on systemic cardiovascular parameters in a similar lower body positive-pressure environment.9 Although 3 patients (10%) developed symptomatic DVT, there were no differences between the groups in the incidence of DVT. Use of an anti-gravity treadmill has also been examined for cardiovascular responses in TKA patients. In a study of 24 adults with TKA, researchers found that anti-gravity support allowed TKA patients to walk at faster speeds and tolerate greater inclines with lower heart rate, blood pressure, and oxygen consumption.21 With respect to efficacy of the rehabilitation intervention, we demonstrated significant improvements in all functional outcomes in both groups but no differences between the study groups. We concluded that AlterG was at least as effective as standard therapy in this small cohort. TKA is a very successful procedure, and the improvement in pain and function after surgery is fairly dramatic in most patients, regardless of specific rehabilitation protocols. Therefore, the substantial improvement in clinical outcomes may overshadow any enhanced benefits of the anti-gravity treadmill. Further investigations into the efficacy of AlterG are needed in a larger cohort to determine if this type of treatment is more beneficial than traditional land-based gait training.
Standard scoring systems such as KOOS, TUG, and NRS may not be sensitive enough to detect differences between treatment groups with small sample sizes. Given the results of the post hoc power analysis, a large number of patients (N = 250/group) would be necessary to detect any potential difference in clinical outcomes between the 2 groups. Larger studies are required to answer relevant questions, and additional outcome measures may be needed to detect differences between treatment groups. Relevant questions include whether earlier institution of the anti-gravity device during the immediate TKA postoperative period would be beneficial compared to standard postoperative PT, and whether PT enhanced with the anti-gravity device has incremental benefit in functional outcomes and in time to reach those goals. Finally, given the present attention to healthcare expenses, a cost-benefit analysis of anti-gravity device treatment vs traditional PT would be useful. Once the patient has become familiar with the function of an anti-gravity treadmill, gait therapy could proceed without the direct intervention of the therapist, potentially improving efficient delivery of rehabilitation services.
Studying the effect of different postoperative rehabilitation protocols after orthopedic surgeries can be challenging. In a large (N > 350) randomized controlled trial to study the effect of ergometer cycling after hip and knee replacement, patients who used the cycle ergometer had a higher Western Ontario and McMaster Universities Arthritis Index and greater satisfaction than those who did not after hip arthroplasty, but not after TKA.22 Improvements in muscular coordination and proprioception with the cycle ergometer may have been offset by increases in edema, joint effusion, and pain from the loading of the joint and the relatively fast rate of cycling compared to passive motion or ambulation. While many therapists and surgeons advocate cycling for rehabilitation after knee surgery, the need remains for a better definition of an optimal TKA rehabilitation program. A study of 82 patients comparing early progressive strength training to no early strength training showed no difference in the 6-minute walk test at 8 weeks.23 A systematic review of progressive resistance training (PRT) found that although postoperative PRT is safe and feasible, the methodological quality of existing studies is too low to allow conclusions regarding its efficacy.24 Gait training in an environment where weight-bearing loads can be closely controlled, monitored, and individualized may be an ideal methodology to enhance rehabilitation and return to function for knee replacement surgery.
This current study showed that the use of AlterG as an adjunct for postoperative rehabilitation is safe, accepted by patients and therapists, and leads to clinical functional outcomes that are at least as good as traditional postoperative TKA rehabilitation. We conclude that AlterG demonstrates utility and a potential for innovation in TKA rehabilitation.
1. NIH Consensus Statement on total knee arthroplasty. NIH Consensus State Sci Statements. 2003;20(1):1-34.
2. Jones CA, Voaklander DC, Suarez-Almazor ME. Determinants of function after total knee arthroplasty. Phys Ther. 2003;83(8):696-706.
3. Pearse EO, Caldwell BF, Lockwood RJ, Hollard J. Early mobilisation after conventional knee replacement may reduce the risk of post-operative venous thromboembolism. J Bone Joint Surg Br. 2007;89(3):316-322.
4. Westby MD, Kennedy D, Jones D, Jones A, Doyle-Waters MM, Backman C. Post-acute physiotherapy for primary total knee arthroplasty. Cochrane Database Syst Rev. 2008. doi.10.1002/14651858.CD007099
5. Bade MJ, Stevens-Lapsley JE. Early high-intensity rehabilitation following total knee arthroplasty improves outcomes. J Orthop Sports Phys Ther. 2011;41(12):932-941.
6. Ivanenko YP, Grasso R, Macellari V, Lacquaniti F. Control of foot trajectory in human locomotion: role of ground contact forces in simulated reduced gravity. J Neurophysiol. 2002;87(6):3070-3089.
7. Pöyhönen T, Keskinen KL, Kyröläinen H, Hautala A, Savolainen J, Mälkiä E. Neuromuscular function during therapeutic knee exercise under water and on dry land. Arch Phys Med Rehabil. 2001;82(10):1446-1452.
8. Eastlack RK, Hargens AR, Groppo ER, Steinbach GC, White KK, Pedowitz RA. Lower body positive-pressure exercise after knee surgery. Clin Orthop Rel Res. 2005;431:213-219.
9. Cutuk A, Groppo ER, Quigley EJ, White KW, Pedowitz RA, Hargens AR. Ambulation in simulated fractional gravity using lower body positive pressure: cardiovascular safety and gait analyses. J Appl Physiol. 2006;101(3):771-777.
10. Gojanovic B, Cutti P, Shultz R, Matheson GO. Maximal physiological parameters during partial body-weight support treadmill testing. Med Sci Sports Exerc. 2012;44(10):1935-1941.
11. Figueroa MA, Manning J, Escamilla P. Physiological responses to the AlterG Anti-Gravity Treadmill. Int J Applied Sci Tech. 2011;1:92-97.
12. Hoffman MD, Donaghe HE. Physiological responses to body weight-supported treadmill exercise in healthy adults. Arch Phys Med Rehabil. 2011;92(6):960-966.
13. Kurz MJ, Corr B, Stuberg W, Volkman KG, Smith N. Evaluation of lower body positive pressure supported treadmill training for children with cerebral palsy. Pediatr Phys Ther. 2011;23(3):232-239.
14. Christian M. Managing knee osteoarthritis: the effects of anti-gravity treadmill exercise on joint pain and physical function. Available at: http://mspace.lib.umanitoba.ca/handle/1993/8580. Accessed March 31, 2016.
15. Wilk KE, Macrina LC, Reinhold MM. Rehabilitation following microfracture of the knee. Cartilage. 2010;1(2):96-107.
16. Patil SS, Branovacki G, Martin MR, Pulido PA, Levy YD, Colwell CW Jr. 14-year median follow-up using the press-fit condylar sigma design for total knee arthroplasty. J Arthroplasty. 2013;28(8):1286-1290.
17. Saxena A, Granot A. Use of an anti-gravity treadmill in the rehabilitation of the operated achilles tendon: a pilot study. J Foot Ankle Surg. 2011;50(5):558-561.
18. Roos EM, Roos HP, Ekdahl C, Lohmander LS. Knee injury and Osteoarthritis Outcome Score (KOOS) - validation of a Swedish version. Scand J Med Sci Sports. 1998;8(6):439-448.
19. Roos EM, Toksvig-Larsen S. Knee injury and Osteoarthritis Outcome Score (KOOS) - validation and comparison to the WOMAC in total knee replacement. Health Qual Life Outcomes. 2003;1:17.
20. Timed Up and Go (TUG). Available at: http://www.rheumatology.org/I-Am-A/Rheumatologist/Research/Clinician-Researchers/Timed-Up-Go-TUG Accessed: March 15, 2016.
21. Webber SC, Horvey KJ, Yurach Pikaluk MT, Butcher SJ. Cardiovascular responses in older adults with total knee arthroplasty at rest and with exercise on a positive pressure treadmill. Eur J Appl Physiol. 2014;114(3):653-662.
22. Liebs TR, Herzberg W, Ruther W, Haasters J, Russlies M, Hassenpflug J. Ergometer cycling after hip and knee replacement surgery: a randomized control trial. J Bone Joint Surg Am. 2010;92(4):814-822.
23. Jakobsen TL, Kehlet H, Husted H, Petersen J, Bandholm T. Early progressive strength training to enhance recovery after fast-track total knee arthroplasty: a randomized controlled trial. Arthritis Care Res. 2014;66(12):1856-1866.
24. Skoffer B, Dalgas U, Mechlenburg I. Progressive resistance training before and after total hip and knee arthroplasty: a systematic review. Clin Rehabil. 2015;29(1):14-29.
Perspective on Opioid Prescribing
Pain is a frequent symptom among patients seen in the hospital.[1, 2, 3] Hospitalized patients often suffer before they come to the hospital and are commonly prescribed opioids in the months preceding their hospital stay.[4] Adequate pain control is important because uncontrolled pain is associated with higher levels of depression and anxiety among hospitalized patients.[5] In 2011, the Institute of Medicine called on healthcare providers to improve pain assessment and management in healthcare delivery.[6] Since then, pain management has become a key quality indicator for hospitals, and providers are encouraged to frequently assess and treat pain.[7, 8, 9, 10] Although the use of opioids for pain management among hospitalized patients is routine, the amount of opioids prescribed per patient varies widely between institutions.[11] In‐hospital guidelines for the optimal management of acute exacerbations of chronic pain are lacking.
Pain management also carries risks. Recently, the Centers for Disease Control and Prevention urged clinicians to prevent opioid overdoses by following best prescribing practices including screening patients for substance use disorders, mental health issues, and avoiding combinations of opioids and sedatives.[12, 13] These guidelines may be at odds with the priorities of current hospital care, which focus on patient‐perceived pain control rather than potential long‐term consequences of opioid use.[7, 8, 14] In light of the competing demands to provide adequate pain relief to hospitalized patients while optimally prescribing opioids, we sought to understand physicians' attitudes, beliefs, and experiences that inform opioid prescribing practices during hospitalization and at discharge.
METHODS
Study Design, Setting, and Participants
Between January 2015 and August 2015, we recruited a convenience sample via e‐mail solicitation from approximately 135 hospitalists practicing in Colorado and South Carolina.[15] Fifty‐three physicians responded. We conducted 25 in‐depth, semistructured interviews with physicians who represented the average hospitalist practicing in the United States in terms of years in practice and gender.[16] We enrolled physicians working in 4 distinct types of hospital settings, including 2 university hospitals, a safety‐net hospital, a Veterans Affairs hospital, and a private hospital. We used purposive sampling to achieve an even distribution with respect to gender and years in practice.[17] Interviews were either face‐to‐face (n = 16) or over the telephone (n = 9) and were performed outside of the physician's clinical shift. Informed consent was obtained from study participants, and the interview duration was approximately 1 hour. The study was approved by the Colorado Multiple Institutional Review Board.
Interview Guide Development and Content
Members of our multidisciplinary team (S.L.C., I.A.B., S.K.) developed an interview guide designed to explore hospitalists' attitudes and practices about opioid prescribing during hospitalization and at discharge (see Supporting Information, Appendix 1, in the online version of this article). Initial interview questions were developed with input from health sciences researchers (S.E.L., A.D.D., R.D.) and qualitative researchers (I.A.B., S.K.). During data collection, we occasionally edited or added questions to our guide to more fully explore new issues or information emerging from our interviews. Through open‐ended interviews, we sought to capture a qualitative narrative in which hospitalists would describe their attitudes and practices that may influence opioid prescribing within 3 major domains pertinent to clinical practice: patient factors,[18, 19, 20, 21, 22, 23] physician factors,[24, 25, 26, 27] and institutional factors.[27, 28, 29, 30, 31, 32] These domains were based on prior literature. All participants received a $25 gift card.
Data Analysis
Interview transcripts and a demographic survey were our primary data sources. Transcript files were entered into qualitative data analysis software (ATLAS.ti; Scientific Software Development GmbH, Berlin, Germany). We used a mixed inductive and deductive,[33] participatory, team‐based approach to explore patterns and themes related to attitudes and practices around opioid prescribing.[34, 35] A deductive or top‐down approach was used to link text to predefined codes and categories based on literature, prior knowledge, and our interview guide. An inductive or bottom‐up approach was used to identify new codes and categories that emerged from the data, including unanticipated information relevant to our research questions.
Team members included 2 hospitalists (S.L.C., A.D.D.), 2 research assistants with experience in qualitative methods (S.E.L., R.D.), an addiction medicine physician and researcher (I.A.B.), and a medical anthropologist (S.K.). S.L.C. performed initial coding using an a priori template that reflected the primary areas of interest in the study. The codes were categorized as patient, physician, and institutional factors. Using this template as a guide, 3 other team members (S.E.L., A.D.D., R.D.) independently coded 3 transcripts by assigning predefined codes to text and assigning new codes to emergent findings. Using this subset of 4 transcripts, the team reached a consensus on initial codes to be applied to the remaining transcripts. In weekly meetings, team members discussed and modified the codebook based on inconsistencies noted among team members to refine the coding scheme and to ensure consensus. Through group consensus, codes were condensed into a list of categories, subcategories, and emergent themes (ie, themes that did not originate from summarized answers to specific interview questions). The team identified emergent themes represented across all major domains (Table 1). Three of the most prevalent themes representing physicians' personal opioid prescribing practices are reported here. The study team determined that thematic saturation was reached after 25 interviews, as additional interview data created little change to the codebook and no new patterns or themes emerged.
|
| Perceived success, satisfaction, comfort, and the use of opioids for pain management* |
| Professional experiences influenced opioid prescribing practices* |
| The use of opioids to improve efficiency* |
| Skepticism between other physician subspecialty types and opioid prescribing practices |
| Unintended consequences of patient‐perceived pain control metrics and opioid prescribing |
| Lack of trust with patients when reported pain level was not supported with objective data |
| Resident burnout contributed to a lack of empathy and undertreatment of pain |
| Limited perceived risk of personal opioid prescribing practices and patient overdose with short‐acting opioids |
| Unreal expectations by patients to have complete pain eradication contributes to overprescribing |
| Recognition that patient profiling impacts personal opioid‐prescribing practices |
RESULTS
Of the 25 hospitalist participants who were all trained in internal medicine, 16 (64%) were women. The majority were non‐Hispanic white (21 [84%]). Nine physicians (36%) completed residency within the past 5 years, 12 (48%) completed residency within the past 5 to 10 years, and 4 (16%) completed residency >10 years ago. Sixteen (64%) hospitalists practiced medicine in Colorado, where 8 (32%) worked in a safety‐net hospital, 5 (20%) worked in a university hospital, and 3 (12%) worked in a Veterans Affairs hospital. Nine hospitalists (36%) practiced in South Carolina, where 2 (8%) worked in a university hospital and 7 (28%) worked in a private hospital (Table 2).
| Female, no. (%) | 16 (64) |
| Race/ethnicity, no. (%) | |
| White, non‐Hispanic | 21 (84) |
| Asian, non‐Hispanic | 4 (16) |
| Years postresidency, no. (%) | |
| <5 | 9 (36) |
| 510 | 12 (48) |
| >10 | 4 (16) |
| State of practice, no. (%) | |
| Colorado | 16 (64) |
| South Carolina | 9 (36) |
| Private hospital, no. (%) | 7 (28) |
| Academic institution, no. (%) | |
| Safety‐net hospital | 8 (32) |
| Veteran Affairs hospital | 3 (12) |
| University hospital | 7 (28) |
Emergent themes described here include: (1) hospitalists' perceived success, satisfaction, and comfort when prescribing opioids for their patients' pain management; (2) the influence of physicians' professional sentinel experiences on opioid prescribing practices; and (3) opioid prescribing as a tool to improve efficiency in the hospital. Additional quotations to support emergent themes are listed in Table 3.
| Theme | Illustrative Quote |
|---|---|
| |
| Perceived success, satisfaction, comfort, and the use of opioids for pain management | Acute pain: I'm more comfortable treating acute pain. With chronic pain, it depends on the circumstance. There are certain people who have objective reasons to have chronic pain, for instance they have severe degenerate disc disease, for example. With chronic painlet me just say, getting their pain under control is quite challenging. Acute pain is much more straight forward to treat. |
| Chronic pain; If I am treating an exacerbation of someone's chronic pain, it makes me a little less comfortable as far as sending people out on large doses of opioids because of the whole addiction thought behind it. And you don't want to start or feed people's addiction. Or, you know, lead them to it, in the future, requiring increased doses of opioids. | |
| Chronic pain: I have a hard time feeling like I'm very successful with people who have chronic noncancer pain who come in for an exacerbation. Unless I can figure out clear reasons for that exacerbation, I feel I rarely succeed in having the patient, the providers, and the caregivers be happy. It is an unrewarding situation all around. | |
| Chronic pain: I'm less comfortable treating chronic pain because we don't know the patients as well, I think, in the hospital, and you just worry about people abusing the system to get their needs met while they are in the hospital. We don't have much objective data in terms of assessing pain, and you know, they are on chronic narcotics, you don't really know what to believe, I guess. | |
| Professional experiences that influenced opioid prescribing practices | In the hospital: I had 1 horrible experience. I had a young woman who came in with chronic abdominal pain. She told me how much opioids she took. It was before there was a statewide database and I couldn't verify her doses. I gave her what she told me she was taking. I hadn't put a pulse ox on her which I always do now because it makes me feel better. Later the nurse called and said she wasn't responsive. I put her on Pulse Ox and she was sating 30% and blue. A code was called and we brought her back. That was in my mind for ever, I almost killed a 23 year old. |
| In the hospital: I think past experiences inform what I do now. I mean it's not that I've murdered anybody, but there was a time when I took over a patient and didn't realize that, while she had terrible pain from her restless leg syndrome, she also had severe pulmonary hypertension. I gave her 5 mg of oxycodone. She ended up somnolent with hypercarbic respiratory failure. I think that is something that will always stick in my head. | |
| Discharge: When discussing what type of opioids prescribed at dischargeI worry about, not just deliberate diversion, but for the patient being robbed, for the type of opioid I might choose. So I might do oxycodone instead of Percocet. Percocet, itself, has a higher street value then oxycodone. That may be completely false, but I think of it as a name brand that people want. | |
| Discharge: I think many providers, including myself, try to minimize the use of opiates when we can. I think we are all concerned every time we write, you know, our DEA #. Even when we have other providers ask us, you know, to prescribe opioids for their patients because they are out of the hospital or something like that, it is always a touchy subject. Because I think we all feel like our license is always at risk every time we are writing opioids. | |
| Discharge: I give them what they need but I want them to be seen in follow‐up. I encourage that by giving them a shortened course. I'm more skeptical. I've seen people misuse, have bad side effects, and overdose on opioids. I worry about that, so I tend to prescribe shorter courses and less. | |
| The use of opioids to improve efficiency | There is always the group of patients [for whom] we've done everything we can. We set up follow‐up. If giving you a few days of Percocet is going to help you leave the hospital comfortably and stay out of the hospital for appropriate reasons, then we give them a few days. It's horrible but... |
| I'll give 4 or 6 weeks' worth of opioid medication to the chronic abdominal pain patients, the ones who have ERCPs scheduled for every 4 or 6 weeks. You sort of end up managing their chronic pain. It's the people that we know. If you don't give them a month's worth of pain meds, they are going to come back in to the hospital. Because they always come in when they run out. | |
| I think physicians overprescribe opioids because we don't want people to bounce back to the hospital. We don't want them to have acute pain at home and have to go back to the ER to be readmitted. You don't want someone to be in pain. I think that sometimes people go overboard. I also think that sometimes physicians gauge like, oh, this person isn't a huge risk, and maybe give them more opioids than necessary. | |
Perceived Success, Satisfaction, and Comfort When Prescribing Opioids for Pain Management
Providing adequate pain control to their patients was of utmost importance to hospitalists and influenced opioid prescribing. Hospitalists felt confident in their ability to control acute pain using opioids, but notably perceived limited success in achieving adequate patient‐perceived pain control when treating acute exacerbations of chronic pain with opioids. A physician described his confidence in treating severe, acute pain:
If someone is dying of cancer, or if they have an acutely broken femur, I don't really care if they are actively in the 12‐Step Program or Narcotics Anonymous to stay sober. That pain is real and there is no effective pain medicine on earth except for opioids.
[I am uncomfortable treating] people that you classify with chronic pain syndrome. There is that terminology you use for people who have subjective pain, out of proportion to objective findings. In my experience it is a black hole. You never get an adequate level of pain control and you keep adding the doses up and they get habituated. An end point is very difficult to achieve. Not like with acute pain.
All of these things you do for patient satisfaction set up people, who aren't ever going to be without pain, to fail. They have pain all the time, and now you are asking them about their pain. Well, of course their pain is not controlled, because their pain is never going to be less than 5 out of 10, period. And no opioid is going to get them there, unless they are unconscious.
Professional Experiences Influenced Opioid Prescribing Practices
Physicians reported little opioid‐specific training during residency, and so opioid prescribing practices were shaped by the physicians' clinical experiences. Hospitalists reflected on negative, sentinel events that shaped their opioid prescribing practices in the inpatient setting or led them to adopt risk‐modifying behaviors when prescribing opioids at hospital discharge. Negative experiences varied and included a fatal overdose and suspected diversion of opioids for sale. A physician reflected on an avoidable in‐hospital overdose which left her more guarded when prescribing opioids:
It is both your cumulative experience and, sometimes, when you've had a negative experience, it really biases how you think. I've had an experience where my patient actually overdosed. She crushed up the oxycodone we were giving her in the hospital and shot it up through her central line and died. We've all had experiences with opioids being abused. This just happened to be a very dramatic thing that happened right under my nose. It just makes me more guarded, in terms of my practice, and the lengths people will go through to do harm to themselves with opioids.
Hospitalists recognized that some of their patients had limited resources. They expressed suspicions that opioid prescriptions, in some cases, represented a form of currency for patients to supplement their income. A physician stated:
I think our population can divert quite a few meds. I think their financial situations can be really tenuous. Sometimes they sell pills to survive.
Physicians described past experiences with patients who were deceptive to get an opioid prescription, which left them much more reticent to prescribe the drugs. For example, a physician described how a patient altered her opioid prescription following hospital discharge:
I saw a patient who had her gallbladder removed. She asked for an opioid script until she could see her primary care physician, so I gave her a few days of opioids. I later found out she had forged my script and had changed it from 18 pills to 180 pills. She took it all over the state to try to fill. I got a call from the DEA [Drug Enforcement Administration] and had to write them a letter. I think she's in prison now.
These experiences inspired hospitalists to adopt strategies around opioid prescribing that would make it harder for a patient to misuse a prescription or to jeopardize their DEA license. A physician discussed her technique to prevent patients from selling their opioid prescriptions following discharge:
When I write the prescription, I put the name of the patient on the paper prescription with the patient's sticker on top. I don't want the patients to pull it off and sell the prescription, especially when it is my license.
Another physician described feeling reassured when she is able to verify a patient's opioid dose in a statewide prescription monitoring program:
Seeing they have filled opioids before supports your decision making. You just sort of cross your finger that this time my DEA number is not going to come up on the next drug bust!
The Use of Opioids to Improve Institutional Efficiency
Hospitalists felt institutional pressure to reduce hospital readmissions and to facilitate discharges. Pain was a common complaint among patients admitted to the hospital, and uncontrolled pain often prolonged a hospital stay. In these ways, physicians viewed opioid prescriptions as a tool to buffer against readmission or long hospital stays. A physician described his approach to more readily prescribed opioids when he felt it would prevent a patient from being rehospitalized:
If a patient tells you that they are in pain and they are receiving opioids in the hospital, and I have a strong sense that this is a person who comes back to the hospital easily and regularly if something is not right, I'm more likely to make sure that patient has adequate pain medicine for a reasonable duration of time to reduce the chance that they get readmitted just for pain alone.
Physicians used opioids as a tool to facilitate discharges and prevent readmissions; yet doing so sometimes left them feeling conflicted. On one hand, they felt pressured to maintain efficiency; on the other hand, they recognized it might not be in the patient's best interest to receive a higher than necessary quantity of opioids at discharge. A physician described his dilemma:
For the acute pain, I usually give them 15 to 20 [opioid pills]. For the chronics, maybe a little bit more like 30. A lot of them have told me they can just buy it off the street anyway. If we can help keep them out of the hospital, we are probably doing them a disservice [by prescribing more opioids], but we are also not clogging up our system.
Similarly, another hospitalist described opioid prescribing at discharge as a way to reduce hospital costs and prevent a readmission, despite feeling uncomfortable when a patient's diagnosis of pain was nebulous:
If the patient comes back and gets readmitted to the hospital when they don't have pain medicine, it's a $3,000.00, 2‐day stay in the hospital that was unnecessary. And when they have a prescription for a month of pain medicine, they stay out of the hospital. That is utterly pragmaticthere is no other way to do it and it's going to work. At other times, especially when a patient lacks a diagnosis which is known to cause pain, it can feel cheap and dirty.
DISCUSSION
To our knowledge, this is the first study to qualitatively explore the hospitalist perspective on opioid prescribing during hospitalization and at discharge. Hospitalists expressed discomfort and dissatisfaction when managing acute exacerbations of chronic pain with opioid medications. This stemmed from the discordance between the patients' expressed pain and the lack of objective clinical findings of pain, a perceived inability to adequately provide relief to patients with chronic pain, and a concern of contributing to future opioid dependence. Hospitalists identified negative professional experiences with opioid prescribing as a factor that influenced their opioid prescribing practices. Hospitalists also described using opioids as a tool to reduce readmissions and facilitate hospital discharges to contain healthcare costs. This sometimes left them feeling conflicted, especially when their patients lacked clear, pain‐related diagnoses.
Hospitalists were reluctant to increase patients' chronic opioid therapy doses, even when patients had acute exacerbations of chronic pain. Management of chronic pain presents a unique challenge to hospitalists. Existing clinical guidelines for chronic pain management are directed to the primary care physician.[36, 37] Acute exacerbations of chronic pain are commonly seen in hospitalized patients and should not be overlooked.[4] Management strategies that include in‐hospital, guideline‐based opioid dose adjustments are needed to address some of the concern hospitalists feel when managing chronic pain exacerbations. Involving the patient in the decision to temporarily increase their opioid dose may improve patient‐perceived pain control.[38] In addition, when possible, close communication between the hospitalist and the primary care physician may alleviate some of the uncertainty hospitalists feel when they prescribe an increased dose of chronic opioid therapy.[39, 40]
Opioid prescribing practices by hospitalists were influenced by past negative experiences. This principle, defined as negativity bias, refers to the notion that in most situations, negative events are more salient, potent, and dominant than positive events.[41, 42] Hospitalists recounted situations in which their patients overdosed on opioids in the hospital or forged an opioid prescription, which they perceived as jeopardizing their DEA licenses or reputations. They described concrete practice changes they made in an attempt to avoid these situations in the future. Whereas it is appropriate to critically assess practice behaviors that contribute to unanticipated patient outcomes, there may be unintended consequences when providers narrowly focus on the negative, including the undertreatment of pain. Focusing on successful outcomes associated with opioid prescribing, rather than negative outcomes, may lead to less restrictive and more thoughtful opioid prescribing practices. Furthermore, standardizing opioid prescribing to protect physicians from medicolegal consequences related to opioid diversion and fraud could lessen physicians' fears when prescribing opioids both during the hospitalization and at hospital discharge.
Hospitalists described prescribing opioids as a tool to improve efficiency in their practice, although at times it left them feeling conflicted. We interpreted this as a form of cognitive dissonance.[43] Hospitalists are acutely aware of the need to prevent costly hospital readmissions for their own success and longevity, which may lead them to become less judicious about how they prescribe opioids.[44, 45, 46] Our findings suggest a delicate balance between the potential benefits and drawbacks of using opioids to improve efficiency. Whereas it is important to provide pain relief to the patient, which can facilitate a discharge or delay time to next hospital admission, using opioids to smooth a difficult discharge may be detrimental to the patient. These findings highlight the competing pressures hospitalists face to deliver value‐based care[46, 47] while maintaining patient‐centered care.[48, 49]
This study has several limitations. First, qualitative data provide depth to the understanding of a behavior, but not breadth.[50, 51] Therefore, these results may not be generalizable to all hospitalists. We included a convenience sample of hospitalists who practiced in diverse settings including academic and private hospitals and the western and southern regions of the United States. The majority of the hospitalists interviewed had clinical experience less than 10 years. A national survey of hospitalists found the mean years of experience to be 6.9 years[16]; thus, the hospitalists we interviewed are likely representative of hospitalists nationally when considering clinical experience. Second, our interview guide was informed by prior literature and an a priori knowledge based on our experience as practicing hospitalist physicians. Interviews were conducted by 2 hospitalists who may have had similar experiences as those being described by the interviewees. Having shared experiences facilitated rapport and understating between the interviewers and participants; at the same time, however, shared experiences may have narrowed the focus of the interviews, eliminating themes that were already assumed. Lastly, hospitalists who chose to be interviewed may have participated because they felt strongly about the issues discussed and may not fully represent the population from which the sample was drawn.[15]
The development of evidence‐based strategies to promote optimal opioid prescribing for the management of acute exacerbations of chronic pain among hospitalized patients may benefit both hospital providers and patients who have a mutual goal for safe and effective pain relief. Methods to provide adequate pain relief to patients that allow hospitalists to maintain efficiency, while ensuring protection from medicolegal consequences related to opioid diversion or opioid overdose, are urgently needed.
Disclosures
This work was supported by the Denver Health Department of Medicine Small Grants Program, which was not involved in the design, conduct, or reporting of the study, or in the decision to submit the manuscript for publication. Dr. Binswanger was supported by the National Institute On Drug Abuse of the National Institutes of Health under award number R34DA035952. The content is solely the responsibility of the authors and does not necessarily represent the official views of the National Institutes of Health. The authors declare that they do not have any conflicts of interest.
- , , , , , . The prevalence of pain in hospitalized patients and resolution over six months. Pain. 1992;50(1):15–28.
- , . Undertreatment of medical inpatients with narcotic analgesics. Ann Intern Med. 1973;78(2):173–181.
- , . Pain and suffering in seriously ill hospitalized patients. J Am Geriatr Soc. 2000;48(5 suppl):S183–S186.
- , , , , , . Prevalence and characteristics of hospitalized adults on chronic opioid therapy. J Hosp Med. 2014;9(2):82–87.
- , , , . Characteristics of pain in hospitalized medical patients, surgical patients, and outpatients attending a pain management centre. Br J Anaesth. 2013;110(6):1017–1023.
- Institute of Medicine (US) Committee on Advancing Pain Research, Care, and Education. Relieving Pain in America: A Blueprint for Transforming Prevention, Care, Education, and Research. Washington, DC: National Academy of Sciences; 2011.
- , , , . Patient perception of pain care in hospitals in the United States. J Pain Res. 2009;2:157–164.
- , . Pain management: the fifth vital sign. Healthc Benchmarks. 2001;8(6):68–70, 62.
- , , , , . Assessing the relationship between the level of pain control and patient satisfaction. J Pain Res. 2013;6:683–689.
- , , . Impact of patient satisfaction ratings on physicians and clinical care. Patient Prefer Adherence. 2014;8:437–446.
- , , , , . Opioid utilization and opioid‐related adverse events in non‐surgical patients in U.S. hospitals. J Hosp Med. 2014;9(2):73–81.
- Centers for Disease Control and Prevention. CDC grand rounds: prescription drug overdoses—a U.S. epidemic. MMWR Morb Mortal Wkly Rep. 2012;61(1):10–13.
- Centers for Disease Control and Prevention. Vital signs: overdoses of prescription opioid pain relievers and other drugs among women—United States, 1999–2010. MMWR Morb Mortal Wkly Rep. 2013;62(26):537–542.
- , , , , . Patient perception of pain care in the United States: a 5‐year comparative analysis of hospital consumer assessment of health care providers and systems. Pain Physician. 2014;17(5):369–377.
- . Sampling Techniques. 3rd ed. New York, NY: Wiley; 1977.
- , , , , . Worklife and satisfaction of hospitalists: toward flourishing careers. J Gen Intern Med. 2012;27(1):28–36.
- . Qualitative Evaluation and Research Methods. Thousand Oaks, CA: Sage; 1990.
- , , , , . What percentage of chronic nonmalignant pain patients exposed to chronic opioid analgesic therapy develop abuse/addiction and/or aberrant drug‐related behaviors? A structured evidence‐based review. Pain Med. 2008;9(4):444–459.
- , , , , , . Controlled substance abuse and illicit drug use in chronic pain patients: an evaluation of multiple variables. Pain Physician. 2006;9(3):215–225.
- , , , et al. Predictors of opioid misuse in patients with chronic pain: a prospective cohort study. BMC Health Serv Res. 2006;6:46.
- , , , , . Do users of regularly prescribed opioids have higher rates of substance use problems than nonusers? Pain Med. 2007;8(8):647–656.
- , , , et al. Prescription long‐term opioid use in HIV‐infected patients. Clin J Pain. 2012;28(1):39–46.
- , , , et al. The unequal burden of pain: confronting racial and ethnic disparities in pain. Pain Med. 2003;4(3):277–294.
- , , , , . Analysis of the physician variable in pain management. Pain Med. 2001;2(4):317–327.
- , , , , . Exploring beliefs and practice of opioid prescribing for persistent non‐cancer pain by general practitioners. Eur J Pain. 2007;11(1):93–98.
- , , , , . Beliefs and attitudes about opioid prescribing and chronic pain management: survey of primary care providers. J Opioid Manag. 2014;10(6):375–382.
- , , , . Influences of attitudes on family physicians' willingness to prescribe long‐acting opioid analgesics for patients with chronic nonmalignant pain. Clin Ther. 2007;29(suppl):2589–2602.
- . Failure of enforcement controlled substance laws in health policy for prescribing opiate medications: a painful assessment of morbidity and mortality. Am J Ther. 2006;13(6):527–533.
- , . Achieving the right balance in oversight of physician opioid prescribing for pain: the role of state medical boards. J Law Med Ethics. 2003;31(1):21–40.
- , , , , . Regulating opioid prescribing through prescription monitoring programs: balancing drug diversion and treatment of pain. Pain Med. 2004;5(3):309–324.
- . The other side of trust in health care: prescribing drugs with the potential for abuse. Bioethics. 2007;21(1):51–60.
- US Drug Enforcement Administration, Department of Justice. Schedules of controlled substances: rescheduling of hydrocodone combination products from schedule III to schedule II. Fed Regist. 2014;79(163):49661–49682.
- , . Demonstrating rigor using thematic analysis: a hybrid approach of inductive and deductive coding and theme development. Int J Qual Methods. 2008;5(1):80–92.
- , . Analyzing Qualitative Data: Systematic Approaches. Thousand Oaks, CA: Sage; 2009.
- . Qualitative Research and Evaluation Methods, Third Edition. Thousand Oaks, CA: Sage; 2002.
- , , , et al. Pharmacological management of chronic neuropathic pain—consensus statement and guidelines from the Canadian Pain Society. Pain Res Manag. 2007;12(1):13–21.
- , , , et al. Clinical guidelines for the use of chronic opioid therapy in chronic noncancer pain. J Pain. 2009;10(2):113–130.
- , , , . Communication interventions make a difference in conversations between physicians and patients: a systematic review of the evidence. Med Care. 2007;45(4):340–349.
- , , , . Promoting effective transitions of care at hospital discharge: a review of key issues for hospitalists. J Hosp Med. 2007;2(5):314–323.
- , , , , . We need to talk: primary care provider communication at discharge in the era of a shared electronic medical record. J Hosp Med. 2015;10(5):307–310.
- , , , . Negative information weighs more heavily on the brain: the negativity bias in evaluative categorizations. J Pers Soc Psychol. 1998;75(4):887–900.
- , , , . Emotion, attention, and the ‘negativity bias’, studied through event‐related potentials. Int J Psychophysiol. 2001;41(1):75–85.
- , . Cognitive Dissonance: Progress on a Pivotal Theory in Social Psychology. Washington, DC: American Psychological Association; 1999.
- , , , , . Identifying hospital organizational strategies to reduce readmissions. Am J Med Qual. 2013;28(4):278–285.
- , , , , . Avoiding readmissions‐support systems required after discharge to continue rapid recovery? J Arthroplasty. 2015;30(4):527–530.
- , , , , . Effect of hospitalist workload on the quality and efficiency of care. JAMA Intern Med. 2014;174(5):786–793.
- , , . A framework for the frontline: how hospitalists can improve healthcare value. J Hosp Med. 2016;11(4):297–302.
- , , , . Hospitalist staffing and patient satisfaction in the national Medicare population. J Hosp Med. 2013;8(3):126–131.
- , . Improving patient satisfaction: timely feedback to specific physicians is essential for success. J Hosp Med. 2015;10(8):555–556.
- , . Users' guides to the medical literature: XXIII. Qualitative research in health care B. What are the results and how do they help me care for my patients? Evidence‐Based Medicine Working Group. JAMA. 2000;284(4):478–482.
- , . Users' guides to the medical literature: XXIII. Qualitative research in health care A. Are the results of the study valid? Evidence‐Based Medicine Working Group. JAMA. 2000;284(3):357–362.
Pain is a frequent symptom among patients seen in the hospital.[1, 2, 3] Hospitalized patients often suffer before they come to the hospital and are commonly prescribed opioids in the months preceding their hospital stay.[4] Adequate pain control is important because uncontrolled pain is associated with higher levels of depression and anxiety among hospitalized patients.[5] In 2011, the Institute of Medicine called on healthcare providers to improve pain assessment and management in healthcare delivery.[6] Since then, pain management has become a key quality indicator for hospitals, and providers are encouraged to frequently assess and treat pain.[7, 8, 9, 10] Although the use of opioids for pain management among hospitalized patients is routine, the amount of opioids prescribed per patient varies widely between institutions.[11] In‐hospital guidelines for the optimal management of acute exacerbations of chronic pain are lacking.
Pain management also carries risks. Recently, the Centers for Disease Control and Prevention urged clinicians to prevent opioid overdoses by following best prescribing practices including screening patients for substance use disorders, mental health issues, and avoiding combinations of opioids and sedatives.[12, 13] These guidelines may be at odds with the priorities of current hospital care, which focus on patient‐perceived pain control rather than potential long‐term consequences of opioid use.[7, 8, 14] In light of the competing demands to provide adequate pain relief to hospitalized patients while optimally prescribing opioids, we sought to understand physicians' attitudes, beliefs, and experiences that inform opioid prescribing practices during hospitalization and at discharge.
METHODS
Study Design, Setting, and Participants
Between January 2015 and August 2015, we recruited a convenience sample via e‐mail solicitation from approximately 135 hospitalists practicing in Colorado and South Carolina.[15] Fifty‐three physicians responded. We conducted 25 in‐depth, semistructured interviews with physicians who represented the average hospitalist practicing in the United States in terms of years in practice and gender.[16] We enrolled physicians working in 4 distinct types of hospital settings, including 2 university hospitals, a safety‐net hospital, a Veterans Affairs hospital, and a private hospital. We used purposive sampling to achieve an even distribution with respect to gender and years in practice.[17] Interviews were either face‐to‐face (n = 16) or over the telephone (n = 9) and were performed outside of the physician's clinical shift. Informed consent was obtained from study participants, and the interview duration was approximately 1 hour. The study was approved by the Colorado Multiple Institutional Review Board.
Interview Guide Development and Content
Members of our multidisciplinary team (S.L.C., I.A.B., S.K.) developed an interview guide designed to explore hospitalists' attitudes and practices about opioid prescribing during hospitalization and at discharge (see Supporting Information, Appendix 1, in the online version of this article). Initial interview questions were developed with input from health sciences researchers (S.E.L., A.D.D., R.D.) and qualitative researchers (I.A.B., S.K.). During data collection, we occasionally edited or added questions to our guide to more fully explore new issues or information emerging from our interviews. Through open‐ended interviews, we sought to capture a qualitative narrative in which hospitalists would describe their attitudes and practices that may influence opioid prescribing within 3 major domains pertinent to clinical practice: patient factors,[18, 19, 20, 21, 22, 23] physician factors,[24, 25, 26, 27] and institutional factors.[27, 28, 29, 30, 31, 32] These domains were based on prior literature. All participants received a $25 gift card.
Data Analysis
Interview transcripts and a demographic survey were our primary data sources. Transcript files were entered into qualitative data analysis software (ATLAS.ti; Scientific Software Development GmbH, Berlin, Germany). We used a mixed inductive and deductive,[33] participatory, team‐based approach to explore patterns and themes related to attitudes and practices around opioid prescribing.[34, 35] A deductive or top‐down approach was used to link text to predefined codes and categories based on literature, prior knowledge, and our interview guide. An inductive or bottom‐up approach was used to identify new codes and categories that emerged from the data, including unanticipated information relevant to our research questions.
Team members included 2 hospitalists (S.L.C., A.D.D.), 2 research assistants with experience in qualitative methods (S.E.L., R.D.), an addiction medicine physician and researcher (I.A.B.), and a medical anthropologist (S.K.). S.L.C. performed initial coding using an a priori template that reflected the primary areas of interest in the study. The codes were categorized as patient, physician, and institutional factors. Using this template as a guide, 3 other team members (S.E.L., A.D.D., R.D.) independently coded 3 transcripts by assigning predefined codes to text and assigning new codes to emergent findings. Using this subset of 4 transcripts, the team reached a consensus on initial codes to be applied to the remaining transcripts. In weekly meetings, team members discussed and modified the codebook based on inconsistencies noted among team members to refine the coding scheme and to ensure consensus. Through group consensus, codes were condensed into a list of categories, subcategories, and emergent themes (ie, themes that did not originate from summarized answers to specific interview questions). The team identified emergent themes represented across all major domains (Table 1). Three of the most prevalent themes representing physicians' personal opioid prescribing practices are reported here. The study team determined that thematic saturation was reached after 25 interviews, as additional interview data created little change to the codebook and no new patterns or themes emerged.
|
| Perceived success, satisfaction, comfort, and the use of opioids for pain management* |
| Professional experiences influenced opioid prescribing practices* |
| The use of opioids to improve efficiency* |
| Skepticism between other physician subspecialty types and opioid prescribing practices |
| Unintended consequences of patient‐perceived pain control metrics and opioid prescribing |
| Lack of trust with patients when reported pain level was not supported with objective data |
| Resident burnout contributed to a lack of empathy and undertreatment of pain |
| Limited perceived risk of personal opioid prescribing practices and patient overdose with short‐acting opioids |
| Unreal expectations by patients to have complete pain eradication contributes to overprescribing |
| Recognition that patient profiling impacts personal opioid‐prescribing practices |
RESULTS
Of the 25 hospitalist participants who were all trained in internal medicine, 16 (64%) were women. The majority were non‐Hispanic white (21 [84%]). Nine physicians (36%) completed residency within the past 5 years, 12 (48%) completed residency within the past 5 to 10 years, and 4 (16%) completed residency >10 years ago. Sixteen (64%) hospitalists practiced medicine in Colorado, where 8 (32%) worked in a safety‐net hospital, 5 (20%) worked in a university hospital, and 3 (12%) worked in a Veterans Affairs hospital. Nine hospitalists (36%) practiced in South Carolina, where 2 (8%) worked in a university hospital and 7 (28%) worked in a private hospital (Table 2).
| Female, no. (%) | 16 (64) |
| Race/ethnicity, no. (%) | |
| White, non‐Hispanic | 21 (84) |
| Asian, non‐Hispanic | 4 (16) |
| Years postresidency, no. (%) | |
| <5 | 9 (36) |
| 510 | 12 (48) |
| >10 | 4 (16) |
| State of practice, no. (%) | |
| Colorado | 16 (64) |
| South Carolina | 9 (36) |
| Private hospital, no. (%) | 7 (28) |
| Academic institution, no. (%) | |
| Safety‐net hospital | 8 (32) |
| Veteran Affairs hospital | 3 (12) |
| University hospital | 7 (28) |
Emergent themes described here include: (1) hospitalists' perceived success, satisfaction, and comfort when prescribing opioids for their patients' pain management; (2) the influence of physicians' professional sentinel experiences on opioid prescribing practices; and (3) opioid prescribing as a tool to improve efficiency in the hospital. Additional quotations to support emergent themes are listed in Table 3.
| Theme | Illustrative Quote |
|---|---|
| |
| Perceived success, satisfaction, comfort, and the use of opioids for pain management | Acute pain: I'm more comfortable treating acute pain. With chronic pain, it depends on the circumstance. There are certain people who have objective reasons to have chronic pain, for instance they have severe degenerate disc disease, for example. With chronic painlet me just say, getting their pain under control is quite challenging. Acute pain is much more straight forward to treat. |
| Chronic pain; If I am treating an exacerbation of someone's chronic pain, it makes me a little less comfortable as far as sending people out on large doses of opioids because of the whole addiction thought behind it. And you don't want to start or feed people's addiction. Or, you know, lead them to it, in the future, requiring increased doses of opioids. | |
| Chronic pain: I have a hard time feeling like I'm very successful with people who have chronic noncancer pain who come in for an exacerbation. Unless I can figure out clear reasons for that exacerbation, I feel I rarely succeed in having the patient, the providers, and the caregivers be happy. It is an unrewarding situation all around. | |
| Chronic pain: I'm less comfortable treating chronic pain because we don't know the patients as well, I think, in the hospital, and you just worry about people abusing the system to get their needs met while they are in the hospital. We don't have much objective data in terms of assessing pain, and you know, they are on chronic narcotics, you don't really know what to believe, I guess. | |
| Professional experiences that influenced opioid prescribing practices | In the hospital: I had 1 horrible experience. I had a young woman who came in with chronic abdominal pain. She told me how much opioids she took. It was before there was a statewide database and I couldn't verify her doses. I gave her what she told me she was taking. I hadn't put a pulse ox on her which I always do now because it makes me feel better. Later the nurse called and said she wasn't responsive. I put her on Pulse Ox and she was sating 30% and blue. A code was called and we brought her back. That was in my mind for ever, I almost killed a 23 year old. |
| In the hospital: I think past experiences inform what I do now. I mean it's not that I've murdered anybody, but there was a time when I took over a patient and didn't realize that, while she had terrible pain from her restless leg syndrome, she also had severe pulmonary hypertension. I gave her 5 mg of oxycodone. She ended up somnolent with hypercarbic respiratory failure. I think that is something that will always stick in my head. | |
| Discharge: When discussing what type of opioids prescribed at dischargeI worry about, not just deliberate diversion, but for the patient being robbed, for the type of opioid I might choose. So I might do oxycodone instead of Percocet. Percocet, itself, has a higher street value then oxycodone. That may be completely false, but I think of it as a name brand that people want. | |
| Discharge: I think many providers, including myself, try to minimize the use of opiates when we can. I think we are all concerned every time we write, you know, our DEA #. Even when we have other providers ask us, you know, to prescribe opioids for their patients because they are out of the hospital or something like that, it is always a touchy subject. Because I think we all feel like our license is always at risk every time we are writing opioids. | |
| Discharge: I give them what they need but I want them to be seen in follow‐up. I encourage that by giving them a shortened course. I'm more skeptical. I've seen people misuse, have bad side effects, and overdose on opioids. I worry about that, so I tend to prescribe shorter courses and less. | |
| The use of opioids to improve efficiency | There is always the group of patients [for whom] we've done everything we can. We set up follow‐up. If giving you a few days of Percocet is going to help you leave the hospital comfortably and stay out of the hospital for appropriate reasons, then we give them a few days. It's horrible but... |
| I'll give 4 or 6 weeks' worth of opioid medication to the chronic abdominal pain patients, the ones who have ERCPs scheduled for every 4 or 6 weeks. You sort of end up managing their chronic pain. It's the people that we know. If you don't give them a month's worth of pain meds, they are going to come back in to the hospital. Because they always come in when they run out. | |
| I think physicians overprescribe opioids because we don't want people to bounce back to the hospital. We don't want them to have acute pain at home and have to go back to the ER to be readmitted. You don't want someone to be in pain. I think that sometimes people go overboard. I also think that sometimes physicians gauge like, oh, this person isn't a huge risk, and maybe give them more opioids than necessary. | |
Perceived Success, Satisfaction, and Comfort When Prescribing Opioids for Pain Management
Providing adequate pain control to their patients was of utmost importance to hospitalists and influenced opioid prescribing. Hospitalists felt confident in their ability to control acute pain using opioids, but notably perceived limited success in achieving adequate patient‐perceived pain control when treating acute exacerbations of chronic pain with opioids. A physician described his confidence in treating severe, acute pain:
If someone is dying of cancer, or if they have an acutely broken femur, I don't really care if they are actively in the 12‐Step Program or Narcotics Anonymous to stay sober. That pain is real and there is no effective pain medicine on earth except for opioids.
[I am uncomfortable treating] people that you classify with chronic pain syndrome. There is that terminology you use for people who have subjective pain, out of proportion to objective findings. In my experience it is a black hole. You never get an adequate level of pain control and you keep adding the doses up and they get habituated. An end point is very difficult to achieve. Not like with acute pain.
All of these things you do for patient satisfaction set up people, who aren't ever going to be without pain, to fail. They have pain all the time, and now you are asking them about their pain. Well, of course their pain is not controlled, because their pain is never going to be less than 5 out of 10, period. And no opioid is going to get them there, unless they are unconscious.
Professional Experiences Influenced Opioid Prescribing Practices
Physicians reported little opioid‐specific training during residency, and so opioid prescribing practices were shaped by the physicians' clinical experiences. Hospitalists reflected on negative, sentinel events that shaped their opioid prescribing practices in the inpatient setting or led them to adopt risk‐modifying behaviors when prescribing opioids at hospital discharge. Negative experiences varied and included a fatal overdose and suspected diversion of opioids for sale. A physician reflected on an avoidable in‐hospital overdose which left her more guarded when prescribing opioids:
It is both your cumulative experience and, sometimes, when you've had a negative experience, it really biases how you think. I've had an experience where my patient actually overdosed. She crushed up the oxycodone we were giving her in the hospital and shot it up through her central line and died. We've all had experiences with opioids being abused. This just happened to be a very dramatic thing that happened right under my nose. It just makes me more guarded, in terms of my practice, and the lengths people will go through to do harm to themselves with opioids.
Hospitalists recognized that some of their patients had limited resources. They expressed suspicions that opioid prescriptions, in some cases, represented a form of currency for patients to supplement their income. A physician stated:
I think our population can divert quite a few meds. I think their financial situations can be really tenuous. Sometimes they sell pills to survive.
Physicians described past experiences with patients who were deceptive to get an opioid prescription, which left them much more reticent to prescribe the drugs. For example, a physician described how a patient altered her opioid prescription following hospital discharge:
I saw a patient who had her gallbladder removed. She asked for an opioid script until she could see her primary care physician, so I gave her a few days of opioids. I later found out she had forged my script and had changed it from 18 pills to 180 pills. She took it all over the state to try to fill. I got a call from the DEA [Drug Enforcement Administration] and had to write them a letter. I think she's in prison now.
These experiences inspired hospitalists to adopt strategies around opioid prescribing that would make it harder for a patient to misuse a prescription or to jeopardize their DEA license. A physician discussed her technique to prevent patients from selling their opioid prescriptions following discharge:
When I write the prescription, I put the name of the patient on the paper prescription with the patient's sticker on top. I don't want the patients to pull it off and sell the prescription, especially when it is my license.
Another physician described feeling reassured when she is able to verify a patient's opioid dose in a statewide prescription monitoring program:
Seeing they have filled opioids before supports your decision making. You just sort of cross your finger that this time my DEA number is not going to come up on the next drug bust!
The Use of Opioids to Improve Institutional Efficiency
Hospitalists felt institutional pressure to reduce hospital readmissions and to facilitate discharges. Pain was a common complaint among patients admitted to the hospital, and uncontrolled pain often prolonged a hospital stay. In these ways, physicians viewed opioid prescriptions as a tool to buffer against readmission or long hospital stays. A physician described his approach to more readily prescribed opioids when he felt it would prevent a patient from being rehospitalized:
If a patient tells you that they are in pain and they are receiving opioids in the hospital, and I have a strong sense that this is a person who comes back to the hospital easily and regularly if something is not right, I'm more likely to make sure that patient has adequate pain medicine for a reasonable duration of time to reduce the chance that they get readmitted just for pain alone.
Physicians used opioids as a tool to facilitate discharges and prevent readmissions; yet doing so sometimes left them feeling conflicted. On one hand, they felt pressured to maintain efficiency; on the other hand, they recognized it might not be in the patient's best interest to receive a higher than necessary quantity of opioids at discharge. A physician described his dilemma:
For the acute pain, I usually give them 15 to 20 [opioid pills]. For the chronics, maybe a little bit more like 30. A lot of them have told me they can just buy it off the street anyway. If we can help keep them out of the hospital, we are probably doing them a disservice [by prescribing more opioids], but we are also not clogging up our system.
Similarly, another hospitalist described opioid prescribing at discharge as a way to reduce hospital costs and prevent a readmission, despite feeling uncomfortable when a patient's diagnosis of pain was nebulous:
If the patient comes back and gets readmitted to the hospital when they don't have pain medicine, it's a $3,000.00, 2‐day stay in the hospital that was unnecessary. And when they have a prescription for a month of pain medicine, they stay out of the hospital. That is utterly pragmaticthere is no other way to do it and it's going to work. At other times, especially when a patient lacks a diagnosis which is known to cause pain, it can feel cheap and dirty.
DISCUSSION
To our knowledge, this is the first study to qualitatively explore the hospitalist perspective on opioid prescribing during hospitalization and at discharge. Hospitalists expressed discomfort and dissatisfaction when managing acute exacerbations of chronic pain with opioid medications. This stemmed from the discordance between the patients' expressed pain and the lack of objective clinical findings of pain, a perceived inability to adequately provide relief to patients with chronic pain, and a concern of contributing to future opioid dependence. Hospitalists identified negative professional experiences with opioid prescribing as a factor that influenced their opioid prescribing practices. Hospitalists also described using opioids as a tool to reduce readmissions and facilitate hospital discharges to contain healthcare costs. This sometimes left them feeling conflicted, especially when their patients lacked clear, pain‐related diagnoses.
Hospitalists were reluctant to increase patients' chronic opioid therapy doses, even when patients had acute exacerbations of chronic pain. Management of chronic pain presents a unique challenge to hospitalists. Existing clinical guidelines for chronic pain management are directed to the primary care physician.[36, 37] Acute exacerbations of chronic pain are commonly seen in hospitalized patients and should not be overlooked.[4] Management strategies that include in‐hospital, guideline‐based opioid dose adjustments are needed to address some of the concern hospitalists feel when managing chronic pain exacerbations. Involving the patient in the decision to temporarily increase their opioid dose may improve patient‐perceived pain control.[38] In addition, when possible, close communication between the hospitalist and the primary care physician may alleviate some of the uncertainty hospitalists feel when they prescribe an increased dose of chronic opioid therapy.[39, 40]
Opioid prescribing practices by hospitalists were influenced by past negative experiences. This principle, defined as negativity bias, refers to the notion that in most situations, negative events are more salient, potent, and dominant than positive events.[41, 42] Hospitalists recounted situations in which their patients overdosed on opioids in the hospital or forged an opioid prescription, which they perceived as jeopardizing their DEA licenses or reputations. They described concrete practice changes they made in an attempt to avoid these situations in the future. Whereas it is appropriate to critically assess practice behaviors that contribute to unanticipated patient outcomes, there may be unintended consequences when providers narrowly focus on the negative, including the undertreatment of pain. Focusing on successful outcomes associated with opioid prescribing, rather than negative outcomes, may lead to less restrictive and more thoughtful opioid prescribing practices. Furthermore, standardizing opioid prescribing to protect physicians from medicolegal consequences related to opioid diversion and fraud could lessen physicians' fears when prescribing opioids both during the hospitalization and at hospital discharge.
Hospitalists described prescribing opioids as a tool to improve efficiency in their practice, although at times it left them feeling conflicted. We interpreted this as a form of cognitive dissonance.[43] Hospitalists are acutely aware of the need to prevent costly hospital readmissions for their own success and longevity, which may lead them to become less judicious about how they prescribe opioids.[44, 45, 46] Our findings suggest a delicate balance between the potential benefits and drawbacks of using opioids to improve efficiency. Whereas it is important to provide pain relief to the patient, which can facilitate a discharge or delay time to next hospital admission, using opioids to smooth a difficult discharge may be detrimental to the patient. These findings highlight the competing pressures hospitalists face to deliver value‐based care[46, 47] while maintaining patient‐centered care.[48, 49]
This study has several limitations. First, qualitative data provide depth to the understanding of a behavior, but not breadth.[50, 51] Therefore, these results may not be generalizable to all hospitalists. We included a convenience sample of hospitalists who practiced in diverse settings including academic and private hospitals and the western and southern regions of the United States. The majority of the hospitalists interviewed had clinical experience less than 10 years. A national survey of hospitalists found the mean years of experience to be 6.9 years[16]; thus, the hospitalists we interviewed are likely representative of hospitalists nationally when considering clinical experience. Second, our interview guide was informed by prior literature and an a priori knowledge based on our experience as practicing hospitalist physicians. Interviews were conducted by 2 hospitalists who may have had similar experiences as those being described by the interviewees. Having shared experiences facilitated rapport and understating between the interviewers and participants; at the same time, however, shared experiences may have narrowed the focus of the interviews, eliminating themes that were already assumed. Lastly, hospitalists who chose to be interviewed may have participated because they felt strongly about the issues discussed and may not fully represent the population from which the sample was drawn.[15]
The development of evidence‐based strategies to promote optimal opioid prescribing for the management of acute exacerbations of chronic pain among hospitalized patients may benefit both hospital providers and patients who have a mutual goal for safe and effective pain relief. Methods to provide adequate pain relief to patients that allow hospitalists to maintain efficiency, while ensuring protection from medicolegal consequences related to opioid diversion or opioid overdose, are urgently needed.
Disclosures
This work was supported by the Denver Health Department of Medicine Small Grants Program, which was not involved in the design, conduct, or reporting of the study, or in the decision to submit the manuscript for publication. Dr. Binswanger was supported by the National Institute On Drug Abuse of the National Institutes of Health under award number R34DA035952. The content is solely the responsibility of the authors and does not necessarily represent the official views of the National Institutes of Health. The authors declare that they do not have any conflicts of interest.
- , , , , , . The prevalence of pain in hospitalized patients and resolution over six months. Pain. 1992;50(1):15–28.
- , . Undertreatment of medical inpatients with narcotic analgesics. Ann Intern Med. 1973;78(2):173–181.
- , . Pain and suffering in seriously ill hospitalized patients. J Am Geriatr Soc. 2000;48(5 suppl):S183–S186.
- , , , , , . Prevalence and characteristics of hospitalized adults on chronic opioid therapy. J Hosp Med. 2014;9(2):82–87.
- , , , . Characteristics of pain in hospitalized medical patients, surgical patients, and outpatients attending a pain management centre. Br J Anaesth. 2013;110(6):1017–1023.
- Institute of Medicine (US) Committee on Advancing Pain Research, Care, and Education. Relieving Pain in America: A Blueprint for Transforming Prevention, Care, Education, and Research. Washington, DC: National Academy of Sciences; 2011.
- , , , . Patient perception of pain care in hospitals in the United States. J Pain Res. 2009;2:157–164.
- , . Pain management: the fifth vital sign. Healthc Benchmarks. 2001;8(6):68–70, 62.
- , , , , . Assessing the relationship between the level of pain control and patient satisfaction. J Pain Res. 2013;6:683–689.
- , , . Impact of patient satisfaction ratings on physicians and clinical care. Patient Prefer Adherence. 2014;8:437–446.
- , , , , . Opioid utilization and opioid‐related adverse events in non‐surgical patients in U.S. hospitals. J Hosp Med. 2014;9(2):73–81.
- Centers for Disease Control and Prevention. CDC grand rounds: prescription drug overdoses—a U.S. epidemic. MMWR Morb Mortal Wkly Rep. 2012;61(1):10–13.
- Centers for Disease Control and Prevention. Vital signs: overdoses of prescription opioid pain relievers and other drugs among women—United States, 1999–2010. MMWR Morb Mortal Wkly Rep. 2013;62(26):537–542.
- , , , , . Patient perception of pain care in the United States: a 5‐year comparative analysis of hospital consumer assessment of health care providers and systems. Pain Physician. 2014;17(5):369–377.
- . Sampling Techniques. 3rd ed. New York, NY: Wiley; 1977.
- , , , , . Worklife and satisfaction of hospitalists: toward flourishing careers. J Gen Intern Med. 2012;27(1):28–36.
- . Qualitative Evaluation and Research Methods. Thousand Oaks, CA: Sage; 1990.
- , , , , . What percentage of chronic nonmalignant pain patients exposed to chronic opioid analgesic therapy develop abuse/addiction and/or aberrant drug‐related behaviors? A structured evidence‐based review. Pain Med. 2008;9(4):444–459.
- , , , , , . Controlled substance abuse and illicit drug use in chronic pain patients: an evaluation of multiple variables. Pain Physician. 2006;9(3):215–225.
- , , , et al. Predictors of opioid misuse in patients with chronic pain: a prospective cohort study. BMC Health Serv Res. 2006;6:46.
- , , , , . Do users of regularly prescribed opioids have higher rates of substance use problems than nonusers? Pain Med. 2007;8(8):647–656.
- , , , et al. Prescription long‐term opioid use in HIV‐infected patients. Clin J Pain. 2012;28(1):39–46.
- , , , et al. The unequal burden of pain: confronting racial and ethnic disparities in pain. Pain Med. 2003;4(3):277–294.
- , , , , . Analysis of the physician variable in pain management. Pain Med. 2001;2(4):317–327.
- , , , , . Exploring beliefs and practice of opioid prescribing for persistent non‐cancer pain by general practitioners. Eur J Pain. 2007;11(1):93–98.
- , , , , . Beliefs and attitudes about opioid prescribing and chronic pain management: survey of primary care providers. J Opioid Manag. 2014;10(6):375–382.
- , , , . Influences of attitudes on family physicians' willingness to prescribe long‐acting opioid analgesics for patients with chronic nonmalignant pain. Clin Ther. 2007;29(suppl):2589–2602.
- . Failure of enforcement controlled substance laws in health policy for prescribing opiate medications: a painful assessment of morbidity and mortality. Am J Ther. 2006;13(6):527–533.
- , . Achieving the right balance in oversight of physician opioid prescribing for pain: the role of state medical boards. J Law Med Ethics. 2003;31(1):21–40.
- , , , , . Regulating opioid prescribing through prescription monitoring programs: balancing drug diversion and treatment of pain. Pain Med. 2004;5(3):309–324.
- . The other side of trust in health care: prescribing drugs with the potential for abuse. Bioethics. 2007;21(1):51–60.
- US Drug Enforcement Administration, Department of Justice. Schedules of controlled substances: rescheduling of hydrocodone combination products from schedule III to schedule II. Fed Regist. 2014;79(163):49661–49682.
- , . Demonstrating rigor using thematic analysis: a hybrid approach of inductive and deductive coding and theme development. Int J Qual Methods. 2008;5(1):80–92.
- , . Analyzing Qualitative Data: Systematic Approaches. Thousand Oaks, CA: Sage; 2009.
- . Qualitative Research and Evaluation Methods, Third Edition. Thousand Oaks, CA: Sage; 2002.
- , , , et al. Pharmacological management of chronic neuropathic pain—consensus statement and guidelines from the Canadian Pain Society. Pain Res Manag. 2007;12(1):13–21.
- , , , et al. Clinical guidelines for the use of chronic opioid therapy in chronic noncancer pain. J Pain. 2009;10(2):113–130.
- , , , . Communication interventions make a difference in conversations between physicians and patients: a systematic review of the evidence. Med Care. 2007;45(4):340–349.
- , , , . Promoting effective transitions of care at hospital discharge: a review of key issues for hospitalists. J Hosp Med. 2007;2(5):314–323.
- , , , , . We need to talk: primary care provider communication at discharge in the era of a shared electronic medical record. J Hosp Med. 2015;10(5):307–310.
- , , , . Negative information weighs more heavily on the brain: the negativity bias in evaluative categorizations. J Pers Soc Psychol. 1998;75(4):887–900.
- , , , . Emotion, attention, and the ‘negativity bias’, studied through event‐related potentials. Int J Psychophysiol. 2001;41(1):75–85.
- , . Cognitive Dissonance: Progress on a Pivotal Theory in Social Psychology. Washington, DC: American Psychological Association; 1999.
- , , , , . Identifying hospital organizational strategies to reduce readmissions. Am J Med Qual. 2013;28(4):278–285.
- , , , , . Avoiding readmissions‐support systems required after discharge to continue rapid recovery? J Arthroplasty. 2015;30(4):527–530.
- , , , , . Effect of hospitalist workload on the quality and efficiency of care. JAMA Intern Med. 2014;174(5):786–793.
- , , . A framework for the frontline: how hospitalists can improve healthcare value. J Hosp Med. 2016;11(4):297–302.
- , , , . Hospitalist staffing and patient satisfaction in the national Medicare population. J Hosp Med. 2013;8(3):126–131.
- , . Improving patient satisfaction: timely feedback to specific physicians is essential for success. J Hosp Med. 2015;10(8):555–556.
- , . Users' guides to the medical literature: XXIII. Qualitative research in health care B. What are the results and how do they help me care for my patients? Evidence‐Based Medicine Working Group. JAMA. 2000;284(4):478–482.
- , . Users' guides to the medical literature: XXIII. Qualitative research in health care A. Are the results of the study valid? Evidence‐Based Medicine Working Group. JAMA. 2000;284(3):357–362.
Functional Status and Readmission
A continuing focus on readmission prevention as a means to improve quality and reduce waste and costs has led to abundant research on the identification of factors that put older patients at risk for readmission.[1, 2] Recently, research has focused on the development of prediction tools that are based on information from electronic health records (EHR) and that enable early, at‐admission, identification of patients at high risk for readmission.[3, 4, 5] Through such identification, patients are already targeted for inclusion in readmission‐prevention interventions early in their hospital stay.[6, 7] Yet, the ability to rely on these early‐identification tools is contingent on the stability of risk during the hospital stay. Of the in‐hospital factors that can affect readmission, change in functioning has been identified as a potentially major contributor, especially in older patients.[8]
Older adults' deterioration in functioning is a common, troubling phenomenon. Approximately 20% of patients older than 70 years and hospitalized for a medical illness deteriorate in functioning during the hospitalization.[9] Recent evidence points to the contribution of functioning to 30‐day readmission risk, with studies showing that pre‐ or posthospitalization functional impairment is associated with a 1.5 to 3 times greater likelihood of readmission.[10, 11, 12, 13] Whether in‐hospital changes in functioning add to patients' baseline risk, however, is unknown. The only readmission study that examined functional decline during hospitalization was a retrospective study performed in a population of older adults receiving rehabilitation services and therefore may not be generalizable to acutely hospitalized adults.[14] To fill the current knowledge gap, we examined whether in‐hospital functional decline significantly contributes to at‐admission readmission risk factors in its ability to accurately identify high readmission risk in older adults hospitalized in internal medicine units.
METHODS
Design and Participants
Previously collected data from a prospective cohort study, Hospitalization Process Effects on Functional Outcomes and Recovery (HoPE‐FOR), designed to assess the effect of hospitalization‐care processes on functional outcomes in older adults, were combined with EHR data. The population considered for recruitment to HoPE‐FOR comprised older patients (aged 70 years) admitted during the period 2009 to 2011 to 1 of the 8 internal medicine wards at 2 tertiary medical centers in Israel. Patients recruited for the study had an unplanned admission, and were not completely dependent in their basic functions. Cognitively impaired patients (scoring 5 or less on the Short Portable Mental Status Questionnaire [SPMSQ][15]) who had no available caregiver and patients admitted for stroke, coma, or respiratory failure requiring mechanical ventilation were not eligible for participation in the study. The recruitment process for the study is fully described elsewhere.[16, 17]
At‐admission functional, cognitive, mental, and nutritional status were assessed during the first 48 hours of hospitalization. Additional functional assessment was performed at discharge. Data on severity of acute disease, length of stay (LOS), and mortality were collected from the hospitals' EHR. Preadmission healthcare utilization and readmission information were retrieved from the EHR database of Clalit Health Services (Clalit), a large not‐for‐profit integrated healthcare provider and insurer in Israel; more than 80% of the HoPE‐FOR population were Clalit members.
Of the 969 community‐dwelling participants recruited to the HoPE‐FOR study, a subset of 758 (78%) members of Clalit was used for the current study, as data on readmissions to any general hospital were accurately and readily available from Clalit's EHR system.[18] Of those, we excluded 199 due to the following reasons: 13 (2%) died during the hospitalization, 46 (6%) transferred to another ward, 16 (2%) were discharged to a postacute care facility, and 124 (16%) dropped‐out from the HoPE‐FOR study during the hospitalization (due to unavailability because of intensive tests or procedures[16]) or had missing data on the main variables, leaving a final sample of 559 participants. The admission functional, cognitive, and clinical status; LOS; and readmission rates of the participants who dropped‐out were comparable to those of participants retained in the final sample except for albumin levels and age (see Supporting Information, Appendix A, in the online version of this article). The study was approved by the institutional reviews boards of each of the hospitals, Clalit, and the Israeli Ministry of Health.
Variables and Instruments
Outcome Measure
Readmission was defined as any unplanned hospitalization at any of 27 general hospitals in Israel, occurring within 30 days of discharge from the index hospitalization.
Predictors
We collected information on baseline and in‐hospital characteristics. Baseline characteristics included chronic clinical conditions known as risk factors for readmission; number of different drugs as classified by the fifth level of the Anatomical Therapeutic Chemical classification system; number of hospitalizations in the year preceding the index hospitalization; clinical, functional, cognitive, mental, and nutritional status at admission; and sociodemographic characteristics.
Chronic conditions included: congestive heart failure (HF), chronic renal failure (CRF), chronic obstructive pulmonary disease (COPD), diabetes mellitus, ischemic heart disease, arrhythmia, malignancy, and asthma, and were retrieved from the Clalit's EHR data warehouse.[19] Severity of acute disease was assessed with the Acute Physiology and Chronic Health Evaluation.[20] Functional status was measured as self‐reported independence in performing basic activities of daily living (ADL),[21] using the modified Barthel Index (mBI).[22] The mBI consists of 10 items including personal hygiene, bathing, eating, toileting, dressing, chair/bed transfers, ambulation, stair climbing, and bowel and bladder control. Each item is ranked on 5‐point scale, indicating the amount of assistance required in functional independence in each task. The scores are summarized into a total score ranging from 0 (totally dependent) to 100 (fully independent).
Cognitive status was assessed using the SPMSQ.[15] Mental status was assessed based on self‐report of depressive and anxiety symptoms using the 10‐item Tucker's short Zung Instrument (TSZI)[23] and the 10‐item Anxiety Symptoms Questionnaire Short Anxiety Screening Test (SAST),[24] respectively. Both the TSZI and the SAST were validated in Hebrew as screening tools in older adults.[24, 25]
Assessment of nutritional status included malnutrition risk (Malnutrition Universal Screening Tool [MUST]) and admission serum albumin level (g/dL). MUST provides classification into 3 malnutrition risk groups: low (being overweight or obese, with no loss of weight or loss of less than 5% of the weight and without expectation of fasting), medium (normal body mass index [BMI] or weight loss of 510%), and high (normal BMI and inadequate weight loss or malnutrition by BMI and/or 10% weight loss and/or expectations of fasting).[26] Classification of BMI in the current study was according to thresholds for older adults.[27]
In‐hospital risk factors include LOS, a well‐known risk factor of readmission[28] and ADL decline during the index hospitalization. ADL decline was defined as the change in mBI score, calculated by subtracting the discharge score from the at‐admission score and transforming negative scores (functional improvement) to 0.
Statistical Analysis
The relationship between each of the study variables and readmission was examined using 2 tests for categorical variables and t tests for continuous variables. We took a conservative approach, and used a 0.10 threshold level in univariate analysis to decide on variable inclusion in the multivariate models. To examine the at‐admission readmission risk, baseline multivariate logistic regression was modeled with all pre‐ or at‐admission variables that were associated with readmission risk in the univariate analysis. To capture the contribution of in‐hospital data on readmission risk, the at‐discharge multivariate logistic regression was constructed by adding in‐hospital risk factors to the baseline model. To capture the odds of clinically significant functional decline that is equivalent to functional loss in 1 ADL task,[29] we divided the original mBI decline score by 10. Adjusted odds ratios (OR) and 95% confidence intervals (CI) were estimated for each predictor. We used the bootstrapping technique[30] (100 bootstrap subsamples) to test the ADL parameter estimates of both models. The calibration of both models was determined by the Hosmer‐Lemeshow test. The discrimination of the baseline model was compared with that of the at‐discharge model using the C statistic.[31] We derived the prediction score for each patient by adding the coefficients of all applicable factors from the baseline and at‐discharge multivariate logistic regression models and categorized patients' risk of readmission into 5 groups: very low (019th centile), low (2039th centile), medium (4059th percentile), high (6079th percentile), very high (8099th percentile) and extremely high (9099th percentile). We also examined whether when comparing the at‐admission versus discharge model, new patients are identified as high risk (top 10% and 20% of risk score), as these are the patients who are targeted for intervention. Analysis was performed using IBM SPSS Statistical package version 21.0 (IBM, Armonk, NY) and Stata version 10 (StataCorp, College Station, TX).
RESULTS
Table 1 presents the baseline and in‐hospital characteristics of participants with and without readmissions. The sample includes 559 community‐dwelling older adults (49% men) aged 70 to 98 years (mean age 79 years). One‐third (36%) of the participants were fully independent in ADL at admission. Eighty‐five (15.2%) patients were readmitted within 30 days of discharge. Participants who were readmitted had lower at‐admission ADL levels; had 1 more hospitalization in the previous year; and were more likely to have HF, CRF, arrhythmia, and malignancy, and to be at risk of malnutrition, than those who were not readmitted. Participants who were readmitted were more likely to suffer from functional decline during the index hospitalization. No significant differences were found in living arrangements or in at‐admission mental and cognitive status.
| Characteristic | Entire Cohort, N = 559 | No Readmission, n = 474 | 30‐Day Readmission, n = 85 | P Value |
|---|---|---|---|---|
| ||||
| Baseline characteristics | ||||
| Sociodemographic characteristics | ||||
| Age, y, mean SD | 78.8 5.6 | 78.7 5.6 | 79.7 6.6 | 0.19 |
| Male, n (%) | 274 (49.0) | 222 (46.8) | 52 (61.2) | 0.015 |
| Living alone, n (%) | 167 (29.9) | 148 (31.2) | 19 (22.4) | 0.10 |
| Education, y, mean SD | 9.6 5.0 | 9.8 4.9 | 8.7 5.3 | 0.074 |
| Chronic condition, n (%) | ||||
| Congestive heart failure | 169 (30.2) | 130 (27.4) | 39 (45.9) | 0.001 |
| Chronic renal failure | 188 (33.6) | 138 (29.1) | 50 (58.8) | <0.001 |
| Chronic obstructive pulmonary disease | 93 (16.6) | 77 (16.2) | 16 (18.8) | 0.56 |
| Diabetes mellitus | 249 (44.5) | 212 (44.7) | 37 (43.5) | 0.84 |
| Ischemic heart disease | 353 (63.1) | 295 (62.2) | 58 (68.2) | 0.29 |
| Arrhythmia | 242 (43.3) | 192 (40.5) | 50 (58.8) | 0.002 |
| Malignancy | 176 (31.5) | 132 (27.8) | 44 (51.8) | <0.001 |
| Asthma | 72 (12.9) | 61 (12.9) | 11 (12.9) | 0.99 |
| No. of medications prescribed year before index hospitalization, mean SD | 12.1 5.7 | 11.9 5.5 | 13.7 6.3 | 0.007 |
| Prior hospitalizations | ||||
| No. of hospitalizations the year before index hospitalization, mean SD | 1.2 1.6 | 1.00 1.3 | 2.20 2.2 | <0.001 |
| At‐admission health status | ||||
| APACHE II (071), mean SD | 11.5 4.4 | 11.2 4.2 | 12.9 4.6 | 0.003 |
| ADL (mBI) (0100), mean SD | 76.9 28.9 | 78.4 28.4 | 68.7 30.4 | 0.004 |
| Cognitive impairment (SPMSQ 5), n (%) | 8.1 2.2 | 8.1 2.2 | 7.9 2.2 | 0.32 |
| Depression symptoms (TZI 70), n (%) | 106 (19.0) | 89 (18.8) | 17 (20.0) | 0.85 |
| Anxiety symptoms (SAST 24), n (%) | 138 (24.7) | 115 (24.3) | 23 (27.1) | 0.63 |
| Risk of malnutrition (MUST), n (%) | 0.002 | |||
| Low risk | 177 (31.7) | 163 (34.4) | 14 (16.5) | |
| Moderate risk | 169 (30.2) | 142 (30.0) | 27 (31.8) | |
| High risk | 213 (38.1) | 169 (35.7) | 44 (51.8) | |
| Serum albumin (g/dL) (1.54.9), mean SD | 3.4 0.5 | 3.3 0.5 | 3.0 0.5 | <0.001 |
| In‐hospital risk factors | ||||
| ADL decline (mBI) (0100), mean SD | 3.2 8.7 | 2.6 7.4 | 7.0 13.2 | 0.003 |
| Length of stay (130), mean SD | 5.7 3.7 | 5.6 3.4 | 6.7 5.1 | 0.055 |
Multivariate analysis (Table 2) shows that higher at‐admission mBI score was associated with lower odds of readmission (OR for 1‐unit increase: 0.99, 95% CI: 0.98‐0.99). Other predictors of higher readmission risk were: high or medium at‐admission risk of malnutrition, malignancy, CRF, each additional hospitalization during the previous year, and lower albumin levels. Severity of illness and demographic characteristics were not significantly associated with readmission.
| Characteristic | Baseline Model | Discharge Model | ||
|---|---|---|---|---|
| OR (95% CI) | P Value | OR (95% CI) | P Value | |
| ||||
| Male | 1.57 (0.892.77) | 0.12 | 1.75 (0.983.15) | 0.06 |
| Living alone | 1.04 (0.551.95) | 0.91 | 1.06 (0.562.01) | 0.86 |
| Education (years) | 0.98 (0.921.03) | 0.33 | 0.98 (0.931.03) | 0.38 |
| Chronic conditions | ||||
| Chronic renal failure | 2.54 (1.394.66) | 0.003 | 2.51 (1.364.64) | 0.003 |
| Malignancy | 2.45 (1.384.32) | 0.002 | 2.35 (1.324.18) | 0.004 |
| Congestive heart failure | 1.84 (1.983.46) | 0.06 | 1.83 (0.973.46) | 0.06 |
| Arrhythmia | 1.64 (0.922.93) | 0.10 | 1.66 (0.953.00) | 0.09 |
| No. of medications prescribed year before index admission | 0.98 (0.931.04) | 0.50 | 0.98 (0.931.04) | 0.51 |
| APACHE II | 0.98 (0.921.04) | 0.49 | 0.97 (0.911.04) | 0.36 |
| No. of hospitalizations year before index admission | 1.27 (1.091.48) | 0.002 | 1.26 (1.081.46) | 0.004 |
| Risk of malnutrition (MUST) | ||||
| Low | Ref | Ref | ||
| Moderate | 2.21 (1.054.66) | 0.042 | 2.10 (0.984.46) | 0.055 |
| High | 3.01 (1.486.12) | 0.002 | 2.88 (1.415.91) | 0.004 |
| Serum albumin (g/dL) | 0.41 (0.240.69) | 0.001 | 0.50 (0.300.83) | 0.03 |
| At‐admission ADL | 0.99 (0.980.99) | 0.037 | 0.99 (0.980.99) | 0.025 |
| In‐hospital ADL decline* | 1.32 (1.021.72) | 0.034 | ||
| Length of stay | 1.02 (0.951.09) | 0.66 | ||
| Model fit | C statistic = 0.81 | C statistic = 0.81 | ||
The at‐discharge model that combined the baseline model and in‐hospital risk factors showed that in‐hospital (from admission to discharge) ADL decline was significantly associated with readmission, as a 10‐point decrease in the mBI from admission to discharge was associated with 1.32 (95% CI: 1.02‐1.72) greater odds of readmission. LOS was not significantly associated with readmission, after controlling for baseline health status and in‐hospital ADL decline. All other predictors did not markedly change from the baseline to the at‐discharge model either in significance levels or in magnitude.
The discriminatory power of the baseline model was good (C statistic=0.81). Adding ADL decline and LOS did not change the discriminatory power of the model (C statistic=0.81). The P value of the Hosmer‐Lemeshow test equaled 0.67 for the baseline model and 0.48 for the at‐discharge model, indicating good calibration of both models. The P values for the regression coefficients of bootstrap inference assessing the relationship between the at‐admission and in‐hospital ADL decline odds of readmission remained stable (P < 0.05).
Classification of patients into risk categories by the baseline model and the discharge model (Table 3) shows that identifying patients in the top‐tier category (20th highest percentile) according to information available before or at admission does not detect 6/111 (5.4%) of patients who would have been categorized as highest‐risk if information on ADL decline had been incorporated in the predictive algorithm. Additional partitioning of the top fifth group into 2 tiers (8089th and 9099th percentiles) shows that selection of patients in the top 10% of the baseline risk score would not have detected 7/55 (12.7%) patients who would have been identified as high risk at discharge (data not shown).
| Discharge Model Risk Group | |||||||
|---|---|---|---|---|---|---|---|
| 0 | 1 | 2 | 3 | 4 | Total No. | ||
| |||||||
| Baseline model risk group | 0 | 99 (89.2) | 11 (9.8) | 0 | 1 (0.9) | 0 | 111 |
| 1 | 12 (10.8) | 88 (78.6) | 12 (10.7) | 0 | 0 | 112 | |
| 2 | 0 | 13 (11.6) | 90 (80.4) | 8 (7.1) | 1 (0.9) | 112 | |
| 3 | 0 | 0 | 10 (8.9) | 98 (86.7) | 5 (4.5) | 113 | |
| 4 | 0 | 0 | 0 | 6 (5.3) | 105 (94.6) | 111 | |
| Total no. | 111 | 112 | 112 | 113 | 111 | ||
DISCUSSION
To our knowledge, ours is the first empirical test of the simultaneous role of functioning along the hospitalization course in explaining readmission risk.[8] Our results show that at‐admission lower functional status and in‐hospital functional decline are significant predictors of early unplanned readmission in older adults, beyond other well‐known risk factors.
The major purpose of this study was to examine whether at‐admission data can be used to detect high‐risk patients for potential inclusion in readmission prevention interventions, or whether changes in ADL occurring during the index hospitalization could affect patients' risk, therefore necessitating an additional assessment at discharge. Our results show that some patients would not have been detected at admission, as their in‐hospital ADL decline affects their at‐discharge risk. Nonetheless, this is a small group (only 5% of patients if a targeting threshold of the highest 20% risk is used). Our findings also show that information on ADL decline during the index hospitalization does not contribute to the accuracy of readmission‐risk prediction in a model that utilizes data on prior hospitalizations, baseline nutritional and functional status, and chronic morbidity (CRF and malignancy). Our results are consistent with previous studies showing the association between baseline,[11, 13, 32] or at‐admission[13] functional status and readmission. However, these studies did not analyze the related contribution of in‐hospital functioning to readmission risk, which was recently suggested as a feature that may significantly affect readmission risk, especially in older patients.[8]
Our findings are also congruent with those of a study in which LOS was not significantly associated with readmission in an elderly population.[33] Our null finding can be explained by the broad set of pre‐ and at‐admission variables, such as nutritional and functional status as well as in‐hospital functional decline, included in our model, making LOS a less significant contributor than in more parsimonious models.[28]
Our results also show that malnutrition contributes to readmission risk beyond other well‐known risk factors. Previous studies showed that malnutrition in the elderly is associated with early readmission.[11, 34] These studies, however, did not examine other well‐known risk factors, such as previous hospitalizations, which were tested in our study, precluding identification of the contribution of malnutrition beyond other well‐known risks.
Our findings should be interpreted in light of several limitations. First, the functional, nutritional, and cognitive data were collected from participants' self‐reports, which are prone to recall bias. Nonetheless, self‐report is often used in large‐scale studies, which preclude actual performance measurement.[21] Second, our sample is of adults aged 70 years or older, and may not be representative of the 65 and older population, which is the target population for many readmission reduction interventions.[35] Yet, participants were from a relatively high‐functioning group of patients who were discharged to their homes, thus may resemble the over age 65 years group. Moreover, these inclusion criteria may have affected their readmission rates, which at 15% are lower than the average reported in other older adult populations.[36] Nonetheless, a more heterogenic sample (in terms of baseline functional status) is needed to address the association between in‐hospital functional change and readmissions as well as the discrimination of the model. Third, the attrition rate (16%) might impact the predictive ability of the models, as patients dropped‐out from the study might have had higher in‐hospital deterioration. However, no significant differences between study sample and dropped‐out patients in the wide range of baseline characteristics except for age and baseline albumin levels were found. Fourth, the unique characteristics of the Israeli healthcare system may affect study's generalizability. The high hospital‐bed occupancy rate, stretched to the limit at 99%, which is much higher than in other developed countries,[37] may affect readmission rates and risk. Nonetheless, our findings may be of relevance to other populations and healthcare systems, as variables included in our model have been previously shown to affect readmission risk in other settings,[4, 6] and the percent of in‐hospital ADL decline is similar to that reported by others.[9] Future studies should examine the significance of in‐hospital functioning in other older adult populations, such as greater mix of baseline functioning and myocardial infarction, HF, and COPD patients, that have been emphasized for readmission prevention by the Centers for Medicare and Medicaid Services.
CONCLUSIONS
This study shows that although both functional status and functional decline are significant predictors of readmission, in‐hospital functional decline did not contribute to the discriminative ability of the model, beyond the risk factors known at admission: malnutrition, prior hospitalizations, and being previously diagnosed with CRF or malignancy. These findings call attention to the ability to predict readmission early in the index hospitalization, to enable early intervention in targeted high‐risk patients. Nonetheless, further at‐discharge functional assessment can detect additional patients whose readmission risk changes during the index hospitalization and who should be considered for inclusion in readmission reduction interventions. As suggested in previous prediction models,[3, 38] most of the at‐admission variables examined in this study, including patient‐reported measures such as functioning, are readily available in the EHR or during the at‐admission intake.[39, 40] In settings where these assessments are not routinely performed, their implementation should be considered. These tools could be used to potentially identify patients at high risk of readmission, and accordingly, address physical function as part of routine medical care and during the acute hospitalization, and tailor adequate follow‐up care after discharge.[11]
Disclosures: This work was supported by the Israeli Science Foundation (grant number 565/08); Clalit Health Services(grant number 04‐121/2010); and the Israel National Institute for Health Policy Research (thesis scholarship number 35/2012). The funding agencies had no role in the design and conduct of this study, the analysis or interpretation of the data, or the preparation of the manuscript. The authors report no conflicts of interest.
- , , , , . Determinants of preventable readmissions in the United States: a systematic review. Implement Sci. 2010;5:1–27.
- , , , , , . Risk factors for hospital readmissions in elderly patients: a systematic review. QJM. 2011;104:639–651.
- , , , , , . Predicting 30‐day readmissions with preadmission electronic health record data. Med Care. 2015;53:283–289.
- , , , et al. Electronic medical record‐based multicondition models to predict the risk of 30 day readmission or death among adult medicine patients: validation and comparison to existing models. BMC Med Inform Decis Mak. 2015;15:39.
- , , , et al. An automated model to identify heart failure patients at risk for 30‐day readmission or death using electronic medical record data. Med Care. 2010;48:981–988.
- , , , , , . Development of a predictive model to identify inpatients at risk of re‐admission within 30 days of discharge (PARR‐30). BMJ Open. 2012;2:10.
- , , , et al. So many options, where do we start? An overview of the care transitions literature. J Hosp Med. 2016;11(3):221–230.
- , . Functional status—an important but overlooked variable in the readmissions equation. J Hosp Med. 2014;9:330–331.
- , , , et al. Loss of independence in activities of daily living in older adults hospitalized with medical illnesses: increased vulnerability with age. J Am Geriatr Soc. 2003;51:451–458.
- , , , et al. Hospital readmission among older medical patients in Hong Kong. J R Coll Physicians Lond. 1999;33:153–156.
- , , , . Functional impairment and hospital readmission in Medicare seniors. JAMA Intern Med. 2015;175:559–565.
- , , , , , . Association of impaired functional status at hospital discharge and subsequent rehospitalization. J Hosp Med. 2014;9:277–282.
- , , , et al. Incidence and main factors associated with early unplanned hospital readmission among French medical inpatients aged 75 and over admitted through emergency units. Age Ageing. 2008;37:416–422.
- , , , et al. Predictors of rehospitalization among elderly patients admitted to a rehabilitation hospital: the role of polypharmacy, functional status, and length of stay. J Am Med Dir Assoc. 2013;14:761–767.
- . A short portable mental status questionnaire for the assessment of organic brain deficit in elderly patients. J Am Geriatr Soc. 1975;23:433–441.
- , , , , , . Low mobility during hospitalization and functional decline in older adults. J Am Geriatr Soc. 2011;59:266–273.
- , , , , . Hospital associated functional decline: the role of hospitalization processes beyond individual risk factors. J Am Geriatr Soc. 2015;63:55–62.
- , , , . Health information exchange systems and length of stay in readmissions to a different hospital [published online December 29, 2015]. J Hosp Med. doi: 10.1002/jhm.2535.
- , . Prevalence of selected chronic diseases in Israel. Isr Med Assoc J. 2001;3:404–408.
- , , , . APACHE II: a severity of disease classification system. Crit Care Med. 1985;13:818–829.
- , , , , , . Functional status before hospitalization in acutely ill older adults: validity and clinical importance of retrospective reports. J Am Geriatr Soc. 2000;48:164–169.
- , , . Improving the sensitivity of the Barthel index for stroke rehabilitation. J Clin Epidemiol. 1989;42:703–709.
- , , , . Validation of a brief screening test for depression in the elderly. Age Ageing. 1987;16:139–144.
- , , , . Short Anxiety Screening Test—a brief instrument for detecting anxiety in the elderly. Int J Geriatr Psychiatry. 1999;14:1062–1071.
- , , , . Does the presence of anxiety affect the validity of a screening test for depression in the elderly? Int J Geriatr Psychiatry. 2002;17:309–314.
- . The ‘MUST’ report. Nutritional screening of adults: a multidisciplinary responsibility (executive summary). Available at: http://www.bapen.org.uk/pdfs/must/must_exec_sum.pdf. Accessed July 10, 2015.
- , , , , . Body mass index, weight change, and death in older adults: the systolic hypertension in the elderly program. Am J Epidemiol. 2002;156:132–138.
- , , , , et al. Derivation and validation of an index to predict early death or unplanned readmission after discharge from hospital to the community. CMAJ. 2010;182:551–557.
- , , , , . Variability in measuring (instrumental) activities of daily living functioning and functional decline in hospitalized older medical patients: a systematic review. J Clin Epidemiol. 2011;64:619–627.
- , , , , , . Internal validation of predictive models: efficiency of some procedures for logistic regression analysis. J Clin Epidemiol. 2001;54:774–781.
- , , , et al. Risk prediction models for hospital readmission: a systematic review. JAMA. 2011;306:1688–1698.
- , , , et al. Functional status and hospital readmissions using the medical expenditure panel survey. J Gen Intern Med. 2015;30:965–972.
- , , , . Predicting readmissions: poor performance of the LACE index in an older UK population. Age Ageing. 2012;41:784–789.
- , , , , . Risk factors for 30‐day hospital readmission in patients ≥65 years of age. Proc (Bayl Univ Med Cent). 2008;21:363–372.
- Center for Outcomes Research 360:1418–1428.
- , , , , . Managing the increasing shortage of acute care hospital beds in Israel. J Eval Clin Pract. 2015;21:79–84.
- , , , . Case finding for patients at risk of readmission to hospital: development of algorithm to identify high risk patients. BMJ. 2006;333:327.
- , , . Measuring nutritional risk in hospitals. Clin Epidemiol. 2010;2:209–216.
- , , , , . When do patient‐reported outcome measures inform readmission risk? J Hosp Med. 2015;10:294–300.
A continuing focus on readmission prevention as a means to improve quality and reduce waste and costs has led to abundant research on the identification of factors that put older patients at risk for readmission.[1, 2] Recently, research has focused on the development of prediction tools that are based on information from electronic health records (EHR) and that enable early, at‐admission, identification of patients at high risk for readmission.[3, 4, 5] Through such identification, patients are already targeted for inclusion in readmission‐prevention interventions early in their hospital stay.[6, 7] Yet, the ability to rely on these early‐identification tools is contingent on the stability of risk during the hospital stay. Of the in‐hospital factors that can affect readmission, change in functioning has been identified as a potentially major contributor, especially in older patients.[8]
Older adults' deterioration in functioning is a common, troubling phenomenon. Approximately 20% of patients older than 70 years and hospitalized for a medical illness deteriorate in functioning during the hospitalization.[9] Recent evidence points to the contribution of functioning to 30‐day readmission risk, with studies showing that pre‐ or posthospitalization functional impairment is associated with a 1.5 to 3 times greater likelihood of readmission.[10, 11, 12, 13] Whether in‐hospital changes in functioning add to patients' baseline risk, however, is unknown. The only readmission study that examined functional decline during hospitalization was a retrospective study performed in a population of older adults receiving rehabilitation services and therefore may not be generalizable to acutely hospitalized adults.[14] To fill the current knowledge gap, we examined whether in‐hospital functional decline significantly contributes to at‐admission readmission risk factors in its ability to accurately identify high readmission risk in older adults hospitalized in internal medicine units.
METHODS
Design and Participants
Previously collected data from a prospective cohort study, Hospitalization Process Effects on Functional Outcomes and Recovery (HoPE‐FOR), designed to assess the effect of hospitalization‐care processes on functional outcomes in older adults, were combined with EHR data. The population considered for recruitment to HoPE‐FOR comprised older patients (aged 70 years) admitted during the period 2009 to 2011 to 1 of the 8 internal medicine wards at 2 tertiary medical centers in Israel. Patients recruited for the study had an unplanned admission, and were not completely dependent in their basic functions. Cognitively impaired patients (scoring 5 or less on the Short Portable Mental Status Questionnaire [SPMSQ][15]) who had no available caregiver and patients admitted for stroke, coma, or respiratory failure requiring mechanical ventilation were not eligible for participation in the study. The recruitment process for the study is fully described elsewhere.[16, 17]
At‐admission functional, cognitive, mental, and nutritional status were assessed during the first 48 hours of hospitalization. Additional functional assessment was performed at discharge. Data on severity of acute disease, length of stay (LOS), and mortality were collected from the hospitals' EHR. Preadmission healthcare utilization and readmission information were retrieved from the EHR database of Clalit Health Services (Clalit), a large not‐for‐profit integrated healthcare provider and insurer in Israel; more than 80% of the HoPE‐FOR population were Clalit members.
Of the 969 community‐dwelling participants recruited to the HoPE‐FOR study, a subset of 758 (78%) members of Clalit was used for the current study, as data on readmissions to any general hospital were accurately and readily available from Clalit's EHR system.[18] Of those, we excluded 199 due to the following reasons: 13 (2%) died during the hospitalization, 46 (6%) transferred to another ward, 16 (2%) were discharged to a postacute care facility, and 124 (16%) dropped‐out from the HoPE‐FOR study during the hospitalization (due to unavailability because of intensive tests or procedures[16]) or had missing data on the main variables, leaving a final sample of 559 participants. The admission functional, cognitive, and clinical status; LOS; and readmission rates of the participants who dropped‐out were comparable to those of participants retained in the final sample except for albumin levels and age (see Supporting Information, Appendix A, in the online version of this article). The study was approved by the institutional reviews boards of each of the hospitals, Clalit, and the Israeli Ministry of Health.
Variables and Instruments
Outcome Measure
Readmission was defined as any unplanned hospitalization at any of 27 general hospitals in Israel, occurring within 30 days of discharge from the index hospitalization.
Predictors
We collected information on baseline and in‐hospital characteristics. Baseline characteristics included chronic clinical conditions known as risk factors for readmission; number of different drugs as classified by the fifth level of the Anatomical Therapeutic Chemical classification system; number of hospitalizations in the year preceding the index hospitalization; clinical, functional, cognitive, mental, and nutritional status at admission; and sociodemographic characteristics.
Chronic conditions included: congestive heart failure (HF), chronic renal failure (CRF), chronic obstructive pulmonary disease (COPD), diabetes mellitus, ischemic heart disease, arrhythmia, malignancy, and asthma, and were retrieved from the Clalit's EHR data warehouse.[19] Severity of acute disease was assessed with the Acute Physiology and Chronic Health Evaluation.[20] Functional status was measured as self‐reported independence in performing basic activities of daily living (ADL),[21] using the modified Barthel Index (mBI).[22] The mBI consists of 10 items including personal hygiene, bathing, eating, toileting, dressing, chair/bed transfers, ambulation, stair climbing, and bowel and bladder control. Each item is ranked on 5‐point scale, indicating the amount of assistance required in functional independence in each task. The scores are summarized into a total score ranging from 0 (totally dependent) to 100 (fully independent).
Cognitive status was assessed using the SPMSQ.[15] Mental status was assessed based on self‐report of depressive and anxiety symptoms using the 10‐item Tucker's short Zung Instrument (TSZI)[23] and the 10‐item Anxiety Symptoms Questionnaire Short Anxiety Screening Test (SAST),[24] respectively. Both the TSZI and the SAST were validated in Hebrew as screening tools in older adults.[24, 25]
Assessment of nutritional status included malnutrition risk (Malnutrition Universal Screening Tool [MUST]) and admission serum albumin level (g/dL). MUST provides classification into 3 malnutrition risk groups: low (being overweight or obese, with no loss of weight or loss of less than 5% of the weight and without expectation of fasting), medium (normal body mass index [BMI] or weight loss of 510%), and high (normal BMI and inadequate weight loss or malnutrition by BMI and/or 10% weight loss and/or expectations of fasting).[26] Classification of BMI in the current study was according to thresholds for older adults.[27]
In‐hospital risk factors include LOS, a well‐known risk factor of readmission[28] and ADL decline during the index hospitalization. ADL decline was defined as the change in mBI score, calculated by subtracting the discharge score from the at‐admission score and transforming negative scores (functional improvement) to 0.
Statistical Analysis
The relationship between each of the study variables and readmission was examined using 2 tests for categorical variables and t tests for continuous variables. We took a conservative approach, and used a 0.10 threshold level in univariate analysis to decide on variable inclusion in the multivariate models. To examine the at‐admission readmission risk, baseline multivariate logistic regression was modeled with all pre‐ or at‐admission variables that were associated with readmission risk in the univariate analysis. To capture the contribution of in‐hospital data on readmission risk, the at‐discharge multivariate logistic regression was constructed by adding in‐hospital risk factors to the baseline model. To capture the odds of clinically significant functional decline that is equivalent to functional loss in 1 ADL task,[29] we divided the original mBI decline score by 10. Adjusted odds ratios (OR) and 95% confidence intervals (CI) were estimated for each predictor. We used the bootstrapping technique[30] (100 bootstrap subsamples) to test the ADL parameter estimates of both models. The calibration of both models was determined by the Hosmer‐Lemeshow test. The discrimination of the baseline model was compared with that of the at‐discharge model using the C statistic.[31] We derived the prediction score for each patient by adding the coefficients of all applicable factors from the baseline and at‐discharge multivariate logistic regression models and categorized patients' risk of readmission into 5 groups: very low (019th centile), low (2039th centile), medium (4059th percentile), high (6079th percentile), very high (8099th percentile) and extremely high (9099th percentile). We also examined whether when comparing the at‐admission versus discharge model, new patients are identified as high risk (top 10% and 20% of risk score), as these are the patients who are targeted for intervention. Analysis was performed using IBM SPSS Statistical package version 21.0 (IBM, Armonk, NY) and Stata version 10 (StataCorp, College Station, TX).
RESULTS
Table 1 presents the baseline and in‐hospital characteristics of participants with and without readmissions. The sample includes 559 community‐dwelling older adults (49% men) aged 70 to 98 years (mean age 79 years). One‐third (36%) of the participants were fully independent in ADL at admission. Eighty‐five (15.2%) patients were readmitted within 30 days of discharge. Participants who were readmitted had lower at‐admission ADL levels; had 1 more hospitalization in the previous year; and were more likely to have HF, CRF, arrhythmia, and malignancy, and to be at risk of malnutrition, than those who were not readmitted. Participants who were readmitted were more likely to suffer from functional decline during the index hospitalization. No significant differences were found in living arrangements or in at‐admission mental and cognitive status.
| Characteristic | Entire Cohort, N = 559 | No Readmission, n = 474 | 30‐Day Readmission, n = 85 | P Value |
|---|---|---|---|---|
| ||||
| Baseline characteristics | ||||
| Sociodemographic characteristics | ||||
| Age, y, mean SD | 78.8 5.6 | 78.7 5.6 | 79.7 6.6 | 0.19 |
| Male, n (%) | 274 (49.0) | 222 (46.8) | 52 (61.2) | 0.015 |
| Living alone, n (%) | 167 (29.9) | 148 (31.2) | 19 (22.4) | 0.10 |
| Education, y, mean SD | 9.6 5.0 | 9.8 4.9 | 8.7 5.3 | 0.074 |
| Chronic condition, n (%) | ||||
| Congestive heart failure | 169 (30.2) | 130 (27.4) | 39 (45.9) | 0.001 |
| Chronic renal failure | 188 (33.6) | 138 (29.1) | 50 (58.8) | <0.001 |
| Chronic obstructive pulmonary disease | 93 (16.6) | 77 (16.2) | 16 (18.8) | 0.56 |
| Diabetes mellitus | 249 (44.5) | 212 (44.7) | 37 (43.5) | 0.84 |
| Ischemic heart disease | 353 (63.1) | 295 (62.2) | 58 (68.2) | 0.29 |
| Arrhythmia | 242 (43.3) | 192 (40.5) | 50 (58.8) | 0.002 |
| Malignancy | 176 (31.5) | 132 (27.8) | 44 (51.8) | <0.001 |
| Asthma | 72 (12.9) | 61 (12.9) | 11 (12.9) | 0.99 |
| No. of medications prescribed year before index hospitalization, mean SD | 12.1 5.7 | 11.9 5.5 | 13.7 6.3 | 0.007 |
| Prior hospitalizations | ||||
| No. of hospitalizations the year before index hospitalization, mean SD | 1.2 1.6 | 1.00 1.3 | 2.20 2.2 | <0.001 |
| At‐admission health status | ||||
| APACHE II (071), mean SD | 11.5 4.4 | 11.2 4.2 | 12.9 4.6 | 0.003 |
| ADL (mBI) (0100), mean SD | 76.9 28.9 | 78.4 28.4 | 68.7 30.4 | 0.004 |
| Cognitive impairment (SPMSQ 5), n (%) | 8.1 2.2 | 8.1 2.2 | 7.9 2.2 | 0.32 |
| Depression symptoms (TZI 70), n (%) | 106 (19.0) | 89 (18.8) | 17 (20.0) | 0.85 |
| Anxiety symptoms (SAST 24), n (%) | 138 (24.7) | 115 (24.3) | 23 (27.1) | 0.63 |
| Risk of malnutrition (MUST), n (%) | 0.002 | |||
| Low risk | 177 (31.7) | 163 (34.4) | 14 (16.5) | |
| Moderate risk | 169 (30.2) | 142 (30.0) | 27 (31.8) | |
| High risk | 213 (38.1) | 169 (35.7) | 44 (51.8) | |
| Serum albumin (g/dL) (1.54.9), mean SD | 3.4 0.5 | 3.3 0.5 | 3.0 0.5 | <0.001 |
| In‐hospital risk factors | ||||
| ADL decline (mBI) (0100), mean SD | 3.2 8.7 | 2.6 7.4 | 7.0 13.2 | 0.003 |
| Length of stay (130), mean SD | 5.7 3.7 | 5.6 3.4 | 6.7 5.1 | 0.055 |
Multivariate analysis (Table 2) shows that higher at‐admission mBI score was associated with lower odds of readmission (OR for 1‐unit increase: 0.99, 95% CI: 0.98‐0.99). Other predictors of higher readmission risk were: high or medium at‐admission risk of malnutrition, malignancy, CRF, each additional hospitalization during the previous year, and lower albumin levels. Severity of illness and demographic characteristics were not significantly associated with readmission.
| Characteristic | Baseline Model | Discharge Model | ||
|---|---|---|---|---|
| OR (95% CI) | P Value | OR (95% CI) | P Value | |
| ||||
| Male | 1.57 (0.892.77) | 0.12 | 1.75 (0.983.15) | 0.06 |
| Living alone | 1.04 (0.551.95) | 0.91 | 1.06 (0.562.01) | 0.86 |
| Education (years) | 0.98 (0.921.03) | 0.33 | 0.98 (0.931.03) | 0.38 |
| Chronic conditions | ||||
| Chronic renal failure | 2.54 (1.394.66) | 0.003 | 2.51 (1.364.64) | 0.003 |
| Malignancy | 2.45 (1.384.32) | 0.002 | 2.35 (1.324.18) | 0.004 |
| Congestive heart failure | 1.84 (1.983.46) | 0.06 | 1.83 (0.973.46) | 0.06 |
| Arrhythmia | 1.64 (0.922.93) | 0.10 | 1.66 (0.953.00) | 0.09 |
| No. of medications prescribed year before index admission | 0.98 (0.931.04) | 0.50 | 0.98 (0.931.04) | 0.51 |
| APACHE II | 0.98 (0.921.04) | 0.49 | 0.97 (0.911.04) | 0.36 |
| No. of hospitalizations year before index admission | 1.27 (1.091.48) | 0.002 | 1.26 (1.081.46) | 0.004 |
| Risk of malnutrition (MUST) | ||||
| Low | Ref | Ref | ||
| Moderate | 2.21 (1.054.66) | 0.042 | 2.10 (0.984.46) | 0.055 |
| High | 3.01 (1.486.12) | 0.002 | 2.88 (1.415.91) | 0.004 |
| Serum albumin (g/dL) | 0.41 (0.240.69) | 0.001 | 0.50 (0.300.83) | 0.03 |
| At‐admission ADL | 0.99 (0.980.99) | 0.037 | 0.99 (0.980.99) | 0.025 |
| In‐hospital ADL decline* | 1.32 (1.021.72) | 0.034 | ||
| Length of stay | 1.02 (0.951.09) | 0.66 | ||
| Model fit | C statistic = 0.81 | C statistic = 0.81 | ||
The at‐discharge model that combined the baseline model and in‐hospital risk factors showed that in‐hospital (from admission to discharge) ADL decline was significantly associated with readmission, as a 10‐point decrease in the mBI from admission to discharge was associated with 1.32 (95% CI: 1.02‐1.72) greater odds of readmission. LOS was not significantly associated with readmission, after controlling for baseline health status and in‐hospital ADL decline. All other predictors did not markedly change from the baseline to the at‐discharge model either in significance levels or in magnitude.
The discriminatory power of the baseline model was good (C statistic=0.81). Adding ADL decline and LOS did not change the discriminatory power of the model (C statistic=0.81). The P value of the Hosmer‐Lemeshow test equaled 0.67 for the baseline model and 0.48 for the at‐discharge model, indicating good calibration of both models. The P values for the regression coefficients of bootstrap inference assessing the relationship between the at‐admission and in‐hospital ADL decline odds of readmission remained stable (P < 0.05).
Classification of patients into risk categories by the baseline model and the discharge model (Table 3) shows that identifying patients in the top‐tier category (20th highest percentile) according to information available before or at admission does not detect 6/111 (5.4%) of patients who would have been categorized as highest‐risk if information on ADL decline had been incorporated in the predictive algorithm. Additional partitioning of the top fifth group into 2 tiers (8089th and 9099th percentiles) shows that selection of patients in the top 10% of the baseline risk score would not have detected 7/55 (12.7%) patients who would have been identified as high risk at discharge (data not shown).
| Discharge Model Risk Group | |||||||
|---|---|---|---|---|---|---|---|
| 0 | 1 | 2 | 3 | 4 | Total No. | ||
| |||||||
| Baseline model risk group | 0 | 99 (89.2) | 11 (9.8) | 0 | 1 (0.9) | 0 | 111 |
| 1 | 12 (10.8) | 88 (78.6) | 12 (10.7) | 0 | 0 | 112 | |
| 2 | 0 | 13 (11.6) | 90 (80.4) | 8 (7.1) | 1 (0.9) | 112 | |
| 3 | 0 | 0 | 10 (8.9) | 98 (86.7) | 5 (4.5) | 113 | |
| 4 | 0 | 0 | 0 | 6 (5.3) | 105 (94.6) | 111 | |
| Total no. | 111 | 112 | 112 | 113 | 111 | ||
DISCUSSION
To our knowledge, ours is the first empirical test of the simultaneous role of functioning along the hospitalization course in explaining readmission risk.[8] Our results show that at‐admission lower functional status and in‐hospital functional decline are significant predictors of early unplanned readmission in older adults, beyond other well‐known risk factors.
The major purpose of this study was to examine whether at‐admission data can be used to detect high‐risk patients for potential inclusion in readmission prevention interventions, or whether changes in ADL occurring during the index hospitalization could affect patients' risk, therefore necessitating an additional assessment at discharge. Our results show that some patients would not have been detected at admission, as their in‐hospital ADL decline affects their at‐discharge risk. Nonetheless, this is a small group (only 5% of patients if a targeting threshold of the highest 20% risk is used). Our findings also show that information on ADL decline during the index hospitalization does not contribute to the accuracy of readmission‐risk prediction in a model that utilizes data on prior hospitalizations, baseline nutritional and functional status, and chronic morbidity (CRF and malignancy). Our results are consistent with previous studies showing the association between baseline,[11, 13, 32] or at‐admission[13] functional status and readmission. However, these studies did not analyze the related contribution of in‐hospital functioning to readmission risk, which was recently suggested as a feature that may significantly affect readmission risk, especially in older patients.[8]
Our findings are also congruent with those of a study in which LOS was not significantly associated with readmission in an elderly population.[33] Our null finding can be explained by the broad set of pre‐ and at‐admission variables, such as nutritional and functional status as well as in‐hospital functional decline, included in our model, making LOS a less significant contributor than in more parsimonious models.[28]
Our results also show that malnutrition contributes to readmission risk beyond other well‐known risk factors. Previous studies showed that malnutrition in the elderly is associated with early readmission.[11, 34] These studies, however, did not examine other well‐known risk factors, such as previous hospitalizations, which were tested in our study, precluding identification of the contribution of malnutrition beyond other well‐known risks.
Our findings should be interpreted in light of several limitations. First, the functional, nutritional, and cognitive data were collected from participants' self‐reports, which are prone to recall bias. Nonetheless, self‐report is often used in large‐scale studies, which preclude actual performance measurement.[21] Second, our sample is of adults aged 70 years or older, and may not be representative of the 65 and older population, which is the target population for many readmission reduction interventions.[35] Yet, participants were from a relatively high‐functioning group of patients who were discharged to their homes, thus may resemble the over age 65 years group. Moreover, these inclusion criteria may have affected their readmission rates, which at 15% are lower than the average reported in other older adult populations.[36] Nonetheless, a more heterogenic sample (in terms of baseline functional status) is needed to address the association between in‐hospital functional change and readmissions as well as the discrimination of the model. Third, the attrition rate (16%) might impact the predictive ability of the models, as patients dropped‐out from the study might have had higher in‐hospital deterioration. However, no significant differences between study sample and dropped‐out patients in the wide range of baseline characteristics except for age and baseline albumin levels were found. Fourth, the unique characteristics of the Israeli healthcare system may affect study's generalizability. The high hospital‐bed occupancy rate, stretched to the limit at 99%, which is much higher than in other developed countries,[37] may affect readmission rates and risk. Nonetheless, our findings may be of relevance to other populations and healthcare systems, as variables included in our model have been previously shown to affect readmission risk in other settings,[4, 6] and the percent of in‐hospital ADL decline is similar to that reported by others.[9] Future studies should examine the significance of in‐hospital functioning in other older adult populations, such as greater mix of baseline functioning and myocardial infarction, HF, and COPD patients, that have been emphasized for readmission prevention by the Centers for Medicare and Medicaid Services.
CONCLUSIONS
This study shows that although both functional status and functional decline are significant predictors of readmission, in‐hospital functional decline did not contribute to the discriminative ability of the model, beyond the risk factors known at admission: malnutrition, prior hospitalizations, and being previously diagnosed with CRF or malignancy. These findings call attention to the ability to predict readmission early in the index hospitalization, to enable early intervention in targeted high‐risk patients. Nonetheless, further at‐discharge functional assessment can detect additional patients whose readmission risk changes during the index hospitalization and who should be considered for inclusion in readmission reduction interventions. As suggested in previous prediction models,[3, 38] most of the at‐admission variables examined in this study, including patient‐reported measures such as functioning, are readily available in the EHR or during the at‐admission intake.[39, 40] In settings where these assessments are not routinely performed, their implementation should be considered. These tools could be used to potentially identify patients at high risk of readmission, and accordingly, address physical function as part of routine medical care and during the acute hospitalization, and tailor adequate follow‐up care after discharge.[11]
Disclosures: This work was supported by the Israeli Science Foundation (grant number 565/08); Clalit Health Services(grant number 04‐121/2010); and the Israel National Institute for Health Policy Research (thesis scholarship number 35/2012). The funding agencies had no role in the design and conduct of this study, the analysis or interpretation of the data, or the preparation of the manuscript. The authors report no conflicts of interest.
- , , , , . Determinants of preventable readmissions in the United States: a systematic review. Implement Sci. 2010;5:1–27.
- , , , , , . Risk factors for hospital readmissions in elderly patients: a systematic review. QJM. 2011;104:639–651.
- , , , , , . Predicting 30‐day readmissions with preadmission electronic health record data. Med Care. 2015;53:283–289.
- , , , et al. Electronic medical record‐based multicondition models to predict the risk of 30 day readmission or death among adult medicine patients: validation and comparison to existing models. BMC Med Inform Decis Mak. 2015;15:39.
- , , , et al. An automated model to identify heart failure patients at risk for 30‐day readmission or death using electronic medical record data. Med Care. 2010;48:981–988.
- , , , , , . Development of a predictive model to identify inpatients at risk of re‐admission within 30 days of discharge (PARR‐30). BMJ Open. 2012;2:10.
- , , , et al. So many options, where do we start? An overview of the care transitions literature. J Hosp Med. 2016;11(3):221–230.
- , . Functional status—an important but overlooked variable in the readmissions equation. J Hosp Med. 2014;9:330–331.
- , , , et al. Loss of independence in activities of daily living in older adults hospitalized with medical illnesses: increased vulnerability with age. J Am Geriatr Soc. 2003;51:451–458.
- , , , et al. Hospital readmission among older medical patients in Hong Kong. J R Coll Physicians Lond. 1999;33:153–156.
- , , , . Functional impairment and hospital readmission in Medicare seniors. JAMA Intern Med. 2015;175:559–565.
- , , , , , . Association of impaired functional status at hospital discharge and subsequent rehospitalization. J Hosp Med. 2014;9:277–282.
- , , , et al. Incidence and main factors associated with early unplanned hospital readmission among French medical inpatients aged 75 and over admitted through emergency units. Age Ageing. 2008;37:416–422.
- , , , et al. Predictors of rehospitalization among elderly patients admitted to a rehabilitation hospital: the role of polypharmacy, functional status, and length of stay. J Am Med Dir Assoc. 2013;14:761–767.
- . A short portable mental status questionnaire for the assessment of organic brain deficit in elderly patients. J Am Geriatr Soc. 1975;23:433–441.
- , , , , , . Low mobility during hospitalization and functional decline in older adults. J Am Geriatr Soc. 2011;59:266–273.
- , , , , . Hospital associated functional decline: the role of hospitalization processes beyond individual risk factors. J Am Geriatr Soc. 2015;63:55–62.
- , , , . Health information exchange systems and length of stay in readmissions to a different hospital [published online December 29, 2015]. J Hosp Med. doi: 10.1002/jhm.2535.
- , . Prevalence of selected chronic diseases in Israel. Isr Med Assoc J. 2001;3:404–408.
- , , , . APACHE II: a severity of disease classification system. Crit Care Med. 1985;13:818–829.
- , , , , , . Functional status before hospitalization in acutely ill older adults: validity and clinical importance of retrospective reports. J Am Geriatr Soc. 2000;48:164–169.
- , , . Improving the sensitivity of the Barthel index for stroke rehabilitation. J Clin Epidemiol. 1989;42:703–709.
- , , , . Validation of a brief screening test for depression in the elderly. Age Ageing. 1987;16:139–144.
- , , , . Short Anxiety Screening Test—a brief instrument for detecting anxiety in the elderly. Int J Geriatr Psychiatry. 1999;14:1062–1071.
- , , , . Does the presence of anxiety affect the validity of a screening test for depression in the elderly? Int J Geriatr Psychiatry. 2002;17:309–314.
- . The ‘MUST’ report. Nutritional screening of adults: a multidisciplinary responsibility (executive summary). Available at: http://www.bapen.org.uk/pdfs/must/must_exec_sum.pdf. Accessed July 10, 2015.
- , , , , . Body mass index, weight change, and death in older adults: the systolic hypertension in the elderly program. Am J Epidemiol. 2002;156:132–138.
- , , , , et al. Derivation and validation of an index to predict early death or unplanned readmission after discharge from hospital to the community. CMAJ. 2010;182:551–557.
- , , , , . Variability in measuring (instrumental) activities of daily living functioning and functional decline in hospitalized older medical patients: a systematic review. J Clin Epidemiol. 2011;64:619–627.
- , , , , , . Internal validation of predictive models: efficiency of some procedures for logistic regression analysis. J Clin Epidemiol. 2001;54:774–781.
- , , , et al. Risk prediction models for hospital readmission: a systematic review. JAMA. 2011;306:1688–1698.
- , , , et al. Functional status and hospital readmissions using the medical expenditure panel survey. J Gen Intern Med. 2015;30:965–972.
- , , , . Predicting readmissions: poor performance of the LACE index in an older UK population. Age Ageing. 2012;41:784–789.
- , , , , . Risk factors for 30‐day hospital readmission in patients ≥65 years of age. Proc (Bayl Univ Med Cent). 2008;21:363–372.
- Center for Outcomes Research 360:1418–1428.
- , , , , . Managing the increasing shortage of acute care hospital beds in Israel. J Eval Clin Pract. 2015;21:79–84.
- , , , . Case finding for patients at risk of readmission to hospital: development of algorithm to identify high risk patients. BMJ. 2006;333:327.
- , , . Measuring nutritional risk in hospitals. Clin Epidemiol. 2010;2:209–216.
- , , , , . When do patient‐reported outcome measures inform readmission risk? J Hosp Med. 2015;10:294–300.
Hospital Antipsychotic Use
Antipsychotic medications are frequently used off label for management of behavioral symptoms associated with delirium and/or dementia. Despite regulations designed to curb inappropriate prescribing of these medications in nursing homes, substantial levels of use and variation in use have been observed in this setting.[1] Although antipsychotic medications are also frequently used in the hospital, the scope and variation in use have not been adequately investigated. Given the lack of oversight for medication prescribing in the hospital setting and the frequency of delirium, occurring in 15% to 26% of hospitalized older adults,[2, 3, 4] off‐label use of antipsychotic medications and variation in use could be substantial.
Because variation in practice is known to increase in the setting of controversy or lack of clarity regarding appropriate management,[5] large degrees of variation can draw attention to priority areas for clinical effectiveness studies, and the need for guidelines, clinical decision support, or regulatory oversight. In the absence of clear guidelines for the use of antipsychotic medication in nonpsychiatric hospitalized patients, we hypothesized that significant variation in use would persist after controlling for patient characteristics. Using a large, nationally representative cohort of admissions to 300 hospitals from July 2009 to June 2010, we sought to investigate prescribing patterns and hospital variation in use of antipsychotic medications in nonpsychiatric admissions to US hospitals.
METHODS
Setting and Data Collection
We conducted a retrospective cohort study using data from 300 US, nonfederal, acute care facilities contributing to the database maintained by Premier (Premier Healthcare Solutions, Inc., Charlotte, NC). This nationally representative database, created to measure healthcare utilization and quality of care, is drawn from voluntarily participating hospitals and contains data on approximately 1 in every 4 discharges nationwide.[6] Participating hospitals are similar in geographic distribution and urban/rural status to hospitals nationwide, although large, nonteaching hospitals are slightly over‐represented. The study was approved by the institutional review board at Beth Israel Deaconess Medical Center.
Inclusion and Exclusion Criteria
We studied a cohort of all adult (18 years) nonpsychiatric admissions to participating hospitals from July 1, 2009 through June 30, 2010. We excluded patients admitted to a psychiatry service or with any discharge diagnosis of a psychotic disorder (defined by the Elixhauser comorbidity Psychoses: 295.00‐298.9, 299.10‐299.11), because we were interested in use of antipsychotics for conditions other than primary psychiatric disorders. We also excluded patients with a charge for labor and delivery owing to the nonrepresentativeness of this patient population for the general hospitalized patient. We excluded admissions with unknown gender, and admissions with a length of stay greater than 365 days, as these admissions are not representative of the typical admission to an acute care hospital. We also excluded hospitals contributing less than 100 admissions owing to lack of precision in corresponding hospital prescribing rates.
Antipsychotic Medication Utilization
In‐hospital antipsychotic use was ascertained from pharmacy charges, reflecting each medication dispensed during the hospitalization. We categorized antipsychotic medications as typical (haloperidol, loxapine, thioridazine, molindone, thiothixine, pimozide, fluphenazine, trifluoperazine, chlorpromazine, and perphenazine) and atypical (aripiprazole, asenapine, clozapine, iloperidone, lurasidone, olanzapine, paliperidone, quetiapine, risperidone, and ziprasidone) based on classification by the Food and Drug Administration.[7, 8] We excluded prochlorperazine (Compazine) from our typical antipsychotic definition, as this medication is almost exclusively used as an antiemetic.
In the absence of guidelines for use of antipsychotic agents in hospitalized patients, we used the Centers for Medicare and Medicaid Services (CMS) guidelines for long‐term care facilities to define measures of potentially excessive dosing in the hospital setting.[9] These guidelines define the daily dosage levels of antipsychotics above which the medical necessity of the higher dose should be explained in the medical record. We defined any daily dosage above these specified levels as a potentially excessive daily dose.
Characteristics Associated With Use
We investigated the association between antipsychotic use and patient and hospital characteristics, selected based on clinical grounds. Patient characteristics included: (1) demographic variables such as age (<65, 6574, 75+ years), gender, self‐reported race, marital status, and primary insurance; (2) admission characteristic variables, including admitting department (surgical vs nonsurgical, defined by a surgical attending of record and presence of operating room charges), whether the patient spent any time in the intensive care unit (ICU), and whether they received mechanical ventilation; and (3) potential indications for use, including delirium (included delirium superimposed upon dementia), dementia (without delirium), and insomnia (see Supporting Information, Appendix, in the online version of this article for International Classification of Diseases, Ninth Revision, Clinical Modification [ICD‐9‐CM] codes). Hospital characteristics included number of beds, urban versus rural status, teaching status, and US Census region.
Statistical Analysis
We report the proportion of admissions with in‐hospital use of any antipsychotic, and the number of days of exposure, overall and stratified by typical and atypical.
We determined potentially excessive dosing by taking the sum of the doses for a specific antipsychotic charged on a given day and comparing it to the CMS guidelines for long‐term care settings described above. We report the percentage of exposed admissions with at least 1 day of potentially excessive dosing.
All multivariable models below were operationalized as generalized estimating equations with a Poisson error term, log link, robust variance estimator,[10] and an exchangeable correlation structure to account for repeated admissions of the same patient.
We investigated patient and hospital characteristics associated with use of any antipsychotic medication using a multivariable model that simultaneously included all patient and hospital characteristics in Table 1 as independent variables.
| % of Cohort | Any Exposure, % | Typical Exposure, % | Atypical Exposure, % | |
|---|---|---|---|---|
| ||||
| Patient characteristics | ||||
| Age group, y | ||||
| <65 | 52.1 | 4.6 | 2.0 | 3.1 |
| 6574 | 18.5 | 5.2 | 2.7 | 3.1 |
| 75+ | 29.4 | 8.8 | 4.6 | 5.4 |
| Gender | ||||
| Male | 43.8 | 6.6 | 3.6 | 3.8 |
| Female | 56.2 | 5.5 | 2.3 | 3.8 |
| Race | ||||
| White | 64.6 | 6.1 | 2.9 | 4.0 |
| Black | 13.5 | 5.5 | 2.8 | 3.3 |
| Hispanic | 5.0 | 4.9 | 2.2 | 3.2 |
| Other | 19.9 | 6.1 | 3.1 | 3.7 |
| Marital Status | ||||
| Married | 42.5 | 4.6 | 2.4 | 2.7 |
| Single | 46.7 | 7.2 | 3.2 | 4.7 |
| Unknown/other | 10.8 | 6.4 | 3.1 | 4.1 |
| Primary insurance | ||||
| Private (commercial) | 28.8 | 3.0 | 1.5 | 1.8 |
| Medicaid | 10.3 | 6.4 | 2.4 | 4.6 |
| Medicare managed | 10.6 | 7.1 | 4.1 | 4.0 |
| Medicare traditional | 40.9 | 8.0 | 3.7 | 5.3 |
| Self‐pay or other | 9.4 | 4.3 | 2.5 | 2.2 |
| Admitting department | ||||
| Surgical | 60.6 | 5.8 | 3.1 | 3.4 |
| Nonsurgical | 39.4 | 6.2 | 2.4 | 4.4 |
| Any ICU stay | 16.6 | 10.4 | 7.2 | 4.9 |
| Mechanical ventilation | 4.7 | 17.4 | 12.9 | 7.9 |
| Diagnoses | ||||
| Delirium | 3.2 | 28.6 | 19.4 | 15.7 |
| Dementia | 3.1 | 27.4 | 12.0 | 20.2 |
| Insomnia | 1.3 | 10.2 | 3.9 | 7.5 |
| Discharge disposition | ||||
| Home | 77.9 | 3.8 | 1.6 | 2.5 |
| SNF/Rehab | 15.5 | 13.7 | 6.8 | 9.0 |
| Hospice | 1.7 | 16.0 | 10.3 | 8.1 |
| Other | 4.9 | 11.6 | 7.6 | 5.7 |
| Hospital characteristics, % | ||||
| No. of beds | ||||
| 200 | 14.1 | 6.1 | 2.8 | 3.8 |
| 201300 | 18.6 | 6.1 | 2.9 | 3.9 |
| 301500 | 37.7 | 5.9 | 2.9 | 3.7 |
| 500+ | 29.7 | 5.9 | 2.8 | 3.8 |
| Population served | ||||
| Urban | 89.4 | 6.0 | 2.9 | 3.8 |
| Rural | 10.6 | 5.8 | 2.4 | 3.9 |
| Teaching status | ||||
| Teaching | 39.2 | 5.8 | 2.9 | 3.7 |
| Nonteaching | 60.8 | 6.0 | 2.8 | 3.9 |
| US Census region | ||||
| West | 16.9 | 5.9 | 3.2 | 3.5 |
| Northeast | 20.1 | 6.1 | 2.9 | 3.9 |
| Midwest | 21.9 | 5.7 | 2.5 | 3.8 |
| South | 41.0 | 6.1 | 2.9 | 3.9 |
To determine hospital variation in antipsychotic use, we first determined the proportion of admissions at each hospital with at least 1 charge for antipsychotic medication. We then divided hospitals into quintiles based on their facility‐level antipsychotic prescribing rates and assigned all admissions to their corresponding hospital quintile. We then used a multivariable model to measure the adjusted association between prescribing quintile and patient‐level receipt of antipsychotic medication, controlling for all patient characteristics listed in Table 1 (except discharge disposition), and comorbidities using the Healthcare Cost and Utilization Project Comorbidity Software version 3.7 (Agency for Healthcare Research and Quality, Rockville, MD).[11] We used the lowest prescribing quintile as the reference group. We also report in the Supporting Information, Appendix, in the online version of this article, the distribution of prescribing rates for the hospitals in our cohort before and after adjustment for patient characteristics. For both approaches, we conducted stratified analyses in admissions with delirium and dementia.
All analyses were carried out using SAS software (SAS Institute Inc., Cary, NC).
RESULTS
Admission Characteristics
There were 3,190,934 admissions aged 18 years and over to 300 hospitals from July 1, 2009 to June 30, 2010. After excluding admissions with unknown gender (n = 17), length of stay greater than 365 days (n = 25), charges for labor and delivery (n = 323,111) or a psychiatric attending of record or psychiatric comorbidity (n = 172,669), and admissions to hospitals with fewer than 100 admissions (n = 31), our cohort included 2,695,081 admissions. The median age was 63 years (25th, 75th percentile 48, 77 years), and 1,514,986 (56%) were women. Table 1 shows the overall admission characteristics of the cohort and the percent exposed to antipsychotics among each patient and hospital characteristic.
Antipsychotic Use
There were 160,773 (6%) admissions with antipsychotic exposure. Among exposed admissions, 102,148 (64%) received atypical and 76,979 (48%) received typical antipsychotics, with 18,354 (11%) exposed to both. The median (25th, 75th percentile) length of stay among exposed was 5 days (3, 9 days), and the median (25th, 75th percentile) number of days of exposure was 3 (1, 5 days) overall, 3 days (2, 6 days) for atypical and 2 days (1, 3 days) for typical exposure.
Among admissions aged 65 to 74 years, 25,855 (5%) were exposed. Among admissions aged 75 years or older, 69,792 (9%) were exposed. Among admissions with delirium, exposure occurred in 24,787 (29%), with 13,640 (55%) receiving atypical, 16,828 (68%) receiving typical, and 5681 (23%) exposed to both. Among admissions with dementia, exposure occurred in 23,179 (27%), with 17,068 (74%) receiving atypical, 10,108 (44%) receiving typical, and 3997 (17%) exposed to both.
Use of Specific Drugs and Potentially Excessive Dosing
Table 2 demonstrates the most commonly used antipsychotic medications and the rates of potentially excessive dosing. Quetiapine and olanzapine were the most commonly used atypical antipsychotics, and haloperidol represented the majority of typical antipsychotic use. Among admissions with antipsychotic exposure, 47% received at least 1 potentially excessive daily dose, 18% of those with atypical exposure and 79% of those with typical exposure. Among admissions aged 65 years and up (n = 1,291,375), the prevalence of potentially excessive dosing was almost identical; 46% received at least 1 daily dose in excess of the recommended daily dose, 11% of those with atypical exposure and 79% of those with typical exposure.
| Agent |
Overall Prevalence,N = 2,695,081 |
% of Exposed With Potentially Excessive Dosing* | ||
|---|---|---|---|---|
| Within 100% of Recommended DD* | 101% to 150% of Recommended DD* | >150% of Recommended DD* | ||
| ||||
| Any antipsychotic | 6.0 | 52.9 | 20.2 | 26.9 |
| Atypical | 3.8 | 82.0 | 5.4 | 12.6 |
| Quetiapine (200) | 1.8 | 81.7 | 5.7 | 12.6 |
| Olanzapine (10) | 0.6 | 73.7 | 7.3 | 19.0 |
| Risperidone (2) | 0.9 | 79.2 | 6.8 | 14.0 |
| Other | 0.7 | 98.3 | 0.1 | 1.6 |
| Typical | 2.9 | 21.1 | 37.0 | 41.9 |
| Haloperidol (4) | 2.5 | 13.2 | 41.3 | 45.5 |
| Chlorpromazine (75) | 0.3 | 76.0 | 9.8 | 14.2 |
| Other | 0.4 | 89.1 | 2.9 | 8.0 |
Characteristics Associated With Antipsychotic Use
Among the patient and hospital characteristics included in our analysis, the 5 characteristics most strongly associated with antipsychotic exposure after adjustment were (Table 3): delirium (relative risk [RR]: 2.93, 95% confidence interval [CI]: 2.88‐2.98); dementia (RR: 2.78, 95% CI: 2.72‐2.83); insurance status, with higher risk among patients with traditional Medicare (RR: 2.09, 95% CI: 2.04‐2.13), Medicare managed (RR: 1.98, 95% CI: 1.93‐2.03), Medicaid (RR: 1.84, 95% CI: 1.80‐1.88), and self‐pay/other (RR: 1.26, 95% CI: 1.23‐1.29) compared to private (commercial) insurance; use of mechanical ventilation (RR: 1.84, 95% CI: 1.81‐1.87); and any ICU stay (RR: 1.53, 95% CI: 1.51‐1.55).
| Unadjusted RR of Receiving Any Antipsychotic [95% CI] | Adjusted RR of Receiving Any Antipsychotic [95% CI]* | |
|---|---|---|
| ||
| Age group, y, % | ||
| <65 | Reference | Reference |
| 6574 | 1.12 [1.10,1.14] | 0.74 [0.72, 0.75] |
| 75+ | 1.90 [1.88,1.92] | 1.03 [1.01, 1.05] |
| Gender | ||
| Female | Reference | Reference |
| Male | 1.19 [1.18,1.20] | 1.27 [1.26, 1.28] |
| Race | ||
| White | Reference | Reference |
| Black | 0.91 [0.90,0.92] | 0.85 [0.83, 0.86] |
| Hispanic | 0.80 [0.78,0.82] | 0.79 [0.76, 0.81] |
| Other | 0.99 [0.98,1.00] | 0.96 [0.95, 0.98] |
| Marital status | ||
| Married | Reference | Reference |
| Single | 1.57 [1.55,1.59] | 1.43 [1.42, 1.45] |
| Unknown/other | 1.41 [1.39,1.43] | 1.27 [1.24, 1.29] |
| Primary insurance | ||
| Private (commercial) | Reference | Reference |
| Medicaid | 2.13 [2.09,2.17] | 1.84 [1.80, 1.88] |
| Medicare managed | 2.35 [2.31,2.39] | 1.98 [1.93, 2.03] |
| Medicare traditional | 2.65 [2.61,2.69] | 2.09 [2.04, 2.13] |
| Self‐pay or other | 1.41 [1.38,1.44] | 1.26 [1.23, 1.29] |
| Admitting department | ||
| Surgical | Reference | Reference |
| Nonsurgical | 1.06 [1.05,1.07] | 1.05 [1.03, 1.06] |
| Any ICU stay | 2.05 [2.03,2.07] | 1.53 [1.51, 1.55] |
| Mechanical ventilation | 3.22 [3.18,3.26] | 1.84 [1.81, 1.87] |
| Diagnoses | ||
| Delirium | 5.48 [5.42, 5.45] | 2.93 [2.88, 2.98] |
| Dementia | 5.21 [5.15,5.27] | 2.78 [2.72, 2.83] |
| Insomnia | 1.72 [1.67,1.78] | 1.51 [1.45, 1.57] |
| No. of beds | ||
| 200 | Reference | Reference |
| 201300 | 1.01 [0.99,1.03] | 0.96 [0.94, 0.98] |
| 301500 | 0.98 [0.97,1.00] | 0.93 [0.91, 0.95] |
| 500+ | 0.97 [0.96,0.98] | 0.91 [0.90, 0.93] |
| Population served | ||
| Urban | Reference | Reference |
| Rural | 0.96 [0.95,0.98] | 0.91 [0.89, 0.93] |
| Teaching status | ||
| Teaching | Reference | Reference |
| Nonteaching | 1.03 [1.02,1.04] | 0.98 [0.97, 1.00] |
| US Census region | ||
| West | Reference | Reference |
| Northeast | 1.03 [1.01,1.05] | 1.04 [1.02, 1.06] |
| Midwest | 0.95 [0.94,0.97] | 0.93 [0.91, 0.94] |
| South | 1.02 [1.01,1.03] | 1.07 [1.05, 1.09] |
Hospital Variation in Antipsychotic Use
Figure 1 demonstrates the antipsychotic prescribing rate at each hospital in our cohort, and the corresponding quintiles. Patients admitted to hospitals in the highest prescribing quintile were more than twice as likely to be exposed to antipsychotics compared to patients admitted to hospitals in the lowest prescribing quintile, even after adjustment for patient characteristics and comorbidities (Table 4). This relationship was similar across subgroups of admissions with delirium and dementia (see Supporting Information, Appendix, in the online version of this article for the distribution of hospital antipsychotic prescribing rates before and after adjustment for patient characteristics).
| Admissions, No. (% of Total) | Unadjusted RR of Exposure [95% CI] | Adjusted RR of exposure [95% CI]* | |
|---|---|---|---|
| |||
| Overall | |||
| Q1 | 431,017 (16%) | Reference | Reference |
| Q2 | 630,486 (23%) | 1.67 [1.63, 1.71] | 1.59 [1.55, 1.62] |
| Q3 | 548,337 (20%) | 1.93 [1.88, 1.97] | 1.84 [1.80, 1.88] |
| Q4 | 639,027 (24%) | 2.16 [2.12, 2.21] | 2.07 [2.03, 2.12] |
| Q5 | 446,214 (17%) | 2.83 [2.77, 2.89] | 2.56 [2.50, 2.61] |
| Delirium | |||
| Q1 | 12,878 (15%) | Reference | Reference |
| Q2 | 20,588 (24%) | 1.58 [1.51, 1.65] | 1.58 [1.51, 1.65] |
| Q3 | 17,402 (20%) | 1.71 [1.64, 1.80] | 1.73 [1.65, 1.82] |
| Q4 | 20,943 (24%) | 2.01 [1.92, 2.10] | 1.99 [1.91, 2.08] |
| Q5 | 14,883 (17%) | 2.15 [2.05, 2.25] | 2.16 [2.07, 2.26] |
| Dementia | |||
| Q1 | 28,290 (15%) | Reference | Reference |
| Q2 | 42,018 (22%) | 1.43 [1.36, 1.50] | 1.40 [1.34, 1.47] |
| Q3 | 38,593 (21%) | 1.61 [1.53, 1.69] | 1.59 [1.51, 1.66] |
| Q4 | 44,638 (24%) | 1.69 [1.62, 1.77] | 1.69 [1.61, 1.77] |
| Q5 | 34,442 (18%) | 1.92 [1.83, 2.01] | 1.90 [1.81, 1.99] |
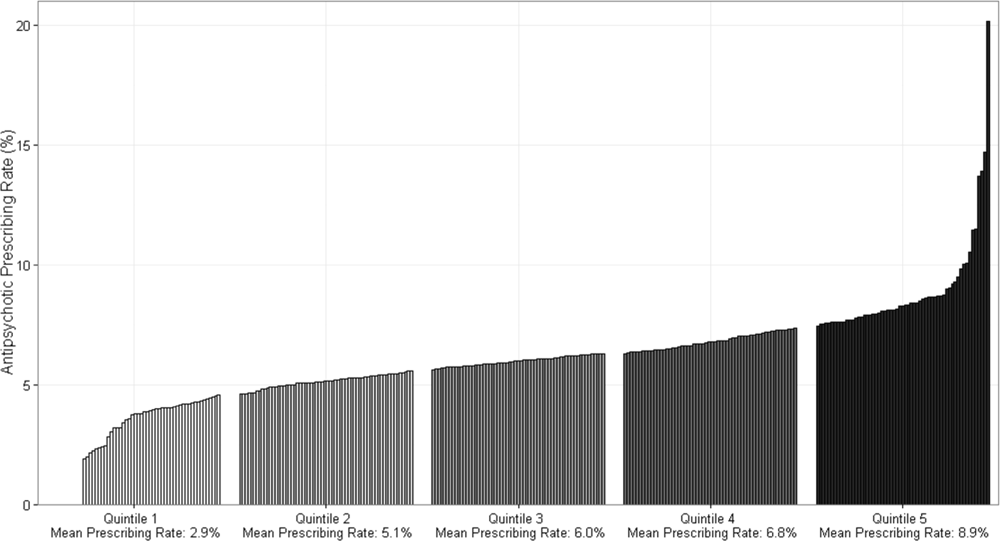
DISCUSSION
In this cohort of nonpsychiatric admissions to 300 US hospitals, antipsychotic medications were used in 6% of admissions, with atypical antipsychotics representing the majority of use. Potentially excessive daily doses based on CMS recommendations for long‐term care facilities occurred in almost half of admissions with any antipsychotic exposure, and in 87% of admissions with haloperidol exposure specifically. We found variation in hospital use of antipsychotics that was not fully accounted for by measured patient characteristics, and which persisted among subgroups of admissions with delirium and/or dementia. Although unmeasured patient characteristics or different billing practices between hospitals are potential explanations, our findings also raise the possibility of different hospital antipsychotic prescribing cultures. These findings provide new information regarding the scope of prescribing in US hospitals, and draw attention to the need for additional studies to better define what constitutes appropriate use of antipsychotics in the hospital setting.
A recent single‐center study at a large academic medical center found an overall antipsychotic exposure rate of 9% of nonpsychiatric admissions.[12] Our finding that 6% of admissions in this multicenter cohort were exposed to antipsychotics is slightly lower, but similar to the previous estimate. Assuming 37 million discharges from US hospitals each year,[13] our study suggests that more than 2 million hospitalized patients receive antipsychotics annually. With around 1.4 million residents in nursing homes on any given day,[14] and an exposure rate of 25% to 30% in that setting,[15, 16, 17] our study suggests that the number of patients exposed in the hospital setting is greater than the number exposed in the nursing home setting, the site of care for which prescribing regulations have been focused thus far.
Because our dataset does not contain preadmission medications, we were unable to specifically investigate new initiation. In the prior single‐center study, approximately 55% of overall use in the hospital setting was new initiation,[12] which would suggest that antipsychotics are newly initiated in around 1 million admissions each year in the hospital. Although we are unable to determine reason for use in our analysis, delirium was a strong predictor of antipsychotic use in our multivariable model, and prior studies have demonstrated delirium to be the most common reason for antipsychotic initiation in hospitalized patients,[12, 18] an indication for which efficacy/effectiveness data are lacking. A recent systematic review of antipsychotics for the treatment of delirium in older adults concluded that because of severe methodological limitations, the small number of existing studies on this topic do not support the use of antipsychotics in the treatment of delirium in older hospitalized adults.[19] Our results further highlight the need for randomized placebo‐controlled trials of antipsychotics in treatment of delirium.
We found variation in antipsychotic use between hospitals that was not fully explained by patient characteristics. Insufficient data to inform clinical decisions surrounding management of agitated delirium/dementia and lack of clear criteria by which to judge appropriateness of antipsychotic use may contribute to this variation. Some variation may relate to resource allocation at different hospitals, and the feasibility of implementing nonpharmacologic management options across settings. Our results collectively highlight the need for studies evaluating the efficacy/effectiveness of antipsychotics in the treatment of delirium and drivers of physician decision‐making in this realm, as well as the need for greater hospital investment in nonpharmacologic delirium‐prevention programs, which have been shown to be effective in prevention of delirium in hospitalized patients.[20]
We observed high levels of potentially excessive daily dosing using cutoffs applied in the long‐term care setting. The majority of the potentially excessive doses were in the setting of typical antipsychotic use, and haloperidol specifically, where doses exceeded 4 mg on at least 1 day in 87% of exposed admissions. Of note, the threshold for haloperidol dosage above which justification is required was decreased from 4 to 2 mg per day in the 2015 update to the CMS guidelines.[21] For the present analysis, we used the guidelines that were contemporaneous to our cohort; we are unable to determine current rates of potentially inappropriate dosages in the present analysis, but given the high prevalence in 2009 to 2010, and the lowering of the dosage threshold since then, it is unlikely that any decrease in use would be enough to substantially reduce the estimate. Whether these high dosages are actually inappropriate in the hospital setting is not established, and we were not able to review medical records to determine whether justification for use of such doses was documented.[22, 23] It is possible that hospitalized patients with altered pharmacodynamics and greater severity of illness could require larger doses of these medications; however, this is an area in need of further investigation, and current critical care guidelines note the lack of sufficient data upon which to justify use of haloperidol in the prevention or treatment of delirium in ICU patients.[24, 25]
The dosages in use are concerning given that the risk of extrapyramidal side effects increases with increasing dose, and prior studies have demonstrated an association between increased dose of antipsychotics and increased risk of other adverse events, including hip fracture and sudden cardiac death.[22, 23] Further, despite these known risks, studies have demonstrated failure to follow recommendations to mitigate risk,[26] such as electrocardiogram monitoring in individuals receiving intravenous haloperidol.[27] Our results suggest that physicians are similarly not following recommendations to use lower doses of haloperidol when treating older patients, given the almost identical incidence of potentially excessive dosing among admissions of patients aged 65 years and older in our cohort.[25] Clinical decision support prompts have been effective at increasing appropriate use of antipsychotic medications in several single‐center analyses,[28, 29, 30] and widespread implementation of such support with a focus on haloperidol dosing should be considered on the basis of our results.
The patient characteristics associated with antipsychotic use in this large, nationally representative analysis are consistent with those identified in prior single‐center analyses.[12, 18] Both prior analyses identified delirium as the most common reason for antipsychotic use, and dementia, intensive care unit stay, and mechanical ventilation were also previously identified as strong predictors of use that we believe hold face validity for the practicing hospitalist. On the other hand, some of the factors associated with antipsychotic use in our model cannot be readily explained, such as insurance status and race, and may be serving as proxies for other variables not included in our analysis. That nonwhite patients are less likely than white patients to receive antipsychotic medications in the hospital has been previously demonstrated,[12] and further investigation to understand this disparity is warranted.
Our study has several additional limitations. First, because our study is observational, the possibility of residual confounding exists, and we cannot rule out that there are other patient factors driving the hospital variation in antipsychotic use that we observed. Second, because guidelines do not exist for antipsychotic dosing in hospitalized patients, we could only comment on potentially excessive dosing, extrapolating from guidelines in the long‐term care setting. Whether such doses are actually excessive in hospitalized patients is not defined. Third, although Premier performs quality checks on charge and ICD‐9‐CM coding data submitted by participating hospitals, the validity of administrative data is uncertain. For example, the use of administrative data to identify delirium diagnoses is likely to have resulted in underestimation of delirium incidence among our different exposure groups. Delirium is likely to be coded more often in the setting of more severe or hyperactive cases, when antipsychotics are more likely to be utilized. This could result in an overestimation of the association between delirium and antipsychotic use. Additionally, differences in coding practices between hospitals for any of the variables in our models could explain some of the variation in antipsychotic prescribing that we observed. Finally, because we were unable to differentiate between new initiation and continuation of a preadmission antipsychotic, some of the variation that we observed is likely to reflect differences in outpatient antipsychotic prescribing practices.
In conclusion, in this large cohort of nonpsychiatric admissions to 300 US hospitals, we found that antipsychotic medication exposure was common, often at high daily doses. Delirium and dementia were the strongest predictors of use among the patient and hospital characteristics examined. The variation in antipsychotic prescribing that we observed was not fully accounted for by measured patient characteristics, and raises the possibility of differing hospital prescribing cultures. Our results draw attention to the need for additional research to better define what constitutes appropriate use of these potentially harmful medications in the hospital setting.
Disclosures: Dr. Herzig had full access to all of the data in the study and takes responsibility for the integrity of the data and the accuracy of the data analysis. Study concept and design: Drs. Herzig, Rothberg, Gurwitz, and Marcantonio. Acquisition of data: Dr. Herzig. Analysis of data: Mr. Guess. Interpretation of data: Drs. Herzig, Rothberg, Gurwitz, Marcantonio, and Mr. Guess. Drafting of the manuscript: Dr. Herzig. Critical revision of the manuscript for important intellectual content: Drs. Rothberg, Gurwitz, Marcantonio, and Mr. Guess. Dr. Herzig was funded by grant number K23AG042459 from the National Institute on Aging. Dr. Marcantonio was funded by grant number K24AG035075 from the National Institute on Aging. The funding organizations had no involvement in any aspect of the study, including design and conduct of the study; collection, management, analysis, and interpretation of the data; and preparation, review, or approval of the manuscript. The authors report no conflicts of interest.
- , , , et al. Variation in nursing home antipsychotic prescribing rates. Arch Intern Med. 2007;167(7):676–683.
- , . Precipitating factors for delirium in hospitalized elderly persons. Predictive model and interrelationship with baseline vulnerability. JAMA. 1996;275(11):852–857.
- , , , , . A predictive model for delirium in hospitalized elderly medical patients based on admission characteristics. Ann Intern Med. 1993;119(6):474–481.
- , , , , , . Delirium in hospitalized older persons: outcomes and predictors. J Am Geriatr Soc. 1994;42(8):809–815.
- , , , . Small‐area variations in the use of common surgical procedures: an international comparison of New England, England, and Norway. N Engl J Med. 1982;307(21):1310–1314.
- Premier Research Services. Available at: https://www.premierinc.com/transforming‐healthcare/healthcare‐performance‐improvement/premier‐research‐services. Accessed March 15, 2016.
- U.S. Food and Drug Administration. Atypical antipsychotic drugs information. Available at: http://www.fda.gov/drugs/drugsafety/postmarketdrugsafetyinformationforpatientsandproviders/ucm094303.htm. Accessed November 1, 2015.
- U.S. Food and Drug Administration. Information on conventional antipsychotics. Available at: http://www.fda.gov/drugs/drugsafety/postmarketdrugsafetyinformationforpatientsandproviders/ucm107211. htm. Accessed November 1, 2015.
- Centers for Medicare and Medicaid Services. State Operations Manual. Appendix PP: guidance to surveyors for long‐term care facilities. Available at: https://www.cms.gov/Medicare/Provider‐Enrollment‐and‐Certification/GuidanceforLawsAndRegulations/Downloads/som107 ap_pp_guidelines_ltcf.pdf. Revised October 14, 2005. Accessed March 15, 2016.
- . A modified Poisson regression approach to prospective studies with binary data. Am J Epidemiol. 2004;159(7):702–706.
- Healthcare Cost and Utilization Project. Comorbidity software, version 3.7. Agency for Healthcare Research and Quality, Rockville, MD. Available at: http://www.hcup‐us.ahrq.gov/toolssoftware/comorbidity/comorbidity.jsp. Accessed March 15, 2016.
- , , , et al. Antipsychotic use in hospitalized adults: rates, indications, and predictors. J Am Geriatr Soc. 2016;64(2):299–305.
- , . Overview of hospital stays in the United States, 2012. HCUP Statistical Brief #180. Agency for Healthcare Research and Quality, Rockville, MD. Available at: http://www.hcup‐us.ahrq.gov/reports/statbriefs/sb180‐Hospitalizations‐United‐States‐2012.pdf. Published October 2014. Accessed June 29, 2015.
- , , , . Long‐term care services in the United States: 2013 overview. Vital Health Stat 3. 2013;(37):1–107. Available at: http://www.cdc.gov/nchs/data/nsltcp/long_term_care_services_2013.pdf. Accessed March 16, 2016.
- , , , et al. The quality of antipsychotic drug prescribing in nursing homes. Arch Intern Med. 2005;165(11):1280–1285.
- , , , , , . Unexplained variation across US nursing homes in antipsychotic prescribing rates. Arch Intern Med. 2010;170(1):89–95.
- , , , , . Broadened use of atypical antipsychotics: safety, effectiveness, and policy challenges. Health Aff (Millwood). 2009;28(5):w770–w781.
- , , , , , . From hospital to community: use of antipsychotics in hospitalized elders. J Hosp Med. 2014;9(12):802–804.
- , , . Antipsychotics in the treatment of delirium in older hospitalized adults: a systematic review. J Am Geriatr Soc. 2011;59(suppl 2):S269–S276.
- , , , et al. Effectiveness of multicomponent nonpharmacological delirium interventions: a meta‐analysis. JAMA Intern Med. 2015;175(4):512–520.
- Centers for Medicare and Medicaid Services. State operations manual, appendix PP: guidance to surveyors for long‐term care facilities. Available at: https://www.cms.gov/Regulations‐and‐Guidance/Guidance/Manuals/downloads/som107ap_pp_guidelines_ltcf.pdf. Revised October 9, 2015. Accessed February 22, 2016.
- , , , , . Psychotropic drug use and the risk of hip fracture. N Engl J Med. 1987;316(7):363–369.
- , , , , . Atypical antipsychotic drugs and the risk of sudden cardiac death. N Engl J Med. 2009;360(3):225–235.
- , , , et al. Clinical practice guidelines for the management of pain, agitation, and delirium in adult patients in the intensive care unit. Crit Care Med. 2013;41(1):263–306.
- , , , , . Haloperidol overdosing in the treatment of agitated hospitalized older people with delirium: a retrospective chart review from a community teaching hospital. Drugs Aging. 2013;30(8):639–644.
- , , , . Unsafe use of intravenous haloperidol: evaluation of recommendation‐concordant care in hospitalized elderly adults. J Am Geriatr Soc. 2013;61(1):160–161.
- U.S. Food and Drug Administration. HALDOL brand of haloperidol injection. Available at: http://www.accessdata.fda.gov/drugsatfda_docs/label/2008/015923s082,018701s057lbl.pdf. Accessed February 23, 2016.
- , , , . Preventing potentially inappropriate medication use in hospitalized older patients with a computerized provider order entry warning system. Arch Intern Med. 2010;170(15):1331–1336.
- , , , et al. A standardized, bundled approach to providing geriatric‐focused acute care. J Am Geriatr Soc. 2014;62(5):936–942.
- , , , . Don't fuel the fire: decreasing intravenous haloperidol use in high risk patients via a customized electronic alert. J Am Med Inform Assoc. 2014;21(6):1109–1112.
Antipsychotic medications are frequently used off label for management of behavioral symptoms associated with delirium and/or dementia. Despite regulations designed to curb inappropriate prescribing of these medications in nursing homes, substantial levels of use and variation in use have been observed in this setting.[1] Although antipsychotic medications are also frequently used in the hospital, the scope and variation in use have not been adequately investigated. Given the lack of oversight for medication prescribing in the hospital setting and the frequency of delirium, occurring in 15% to 26% of hospitalized older adults,[2, 3, 4] off‐label use of antipsychotic medications and variation in use could be substantial.
Because variation in practice is known to increase in the setting of controversy or lack of clarity regarding appropriate management,[5] large degrees of variation can draw attention to priority areas for clinical effectiveness studies, and the need for guidelines, clinical decision support, or regulatory oversight. In the absence of clear guidelines for the use of antipsychotic medication in nonpsychiatric hospitalized patients, we hypothesized that significant variation in use would persist after controlling for patient characteristics. Using a large, nationally representative cohort of admissions to 300 hospitals from July 2009 to June 2010, we sought to investigate prescribing patterns and hospital variation in use of antipsychotic medications in nonpsychiatric admissions to US hospitals.
METHODS
Setting and Data Collection
We conducted a retrospective cohort study using data from 300 US, nonfederal, acute care facilities contributing to the database maintained by Premier (Premier Healthcare Solutions, Inc., Charlotte, NC). This nationally representative database, created to measure healthcare utilization and quality of care, is drawn from voluntarily participating hospitals and contains data on approximately 1 in every 4 discharges nationwide.[6] Participating hospitals are similar in geographic distribution and urban/rural status to hospitals nationwide, although large, nonteaching hospitals are slightly over‐represented. The study was approved by the institutional review board at Beth Israel Deaconess Medical Center.
Inclusion and Exclusion Criteria
We studied a cohort of all adult (18 years) nonpsychiatric admissions to participating hospitals from July 1, 2009 through June 30, 2010. We excluded patients admitted to a psychiatry service or with any discharge diagnosis of a psychotic disorder (defined by the Elixhauser comorbidity Psychoses: 295.00‐298.9, 299.10‐299.11), because we were interested in use of antipsychotics for conditions other than primary psychiatric disorders. We also excluded patients with a charge for labor and delivery owing to the nonrepresentativeness of this patient population for the general hospitalized patient. We excluded admissions with unknown gender, and admissions with a length of stay greater than 365 days, as these admissions are not representative of the typical admission to an acute care hospital. We also excluded hospitals contributing less than 100 admissions owing to lack of precision in corresponding hospital prescribing rates.
Antipsychotic Medication Utilization
In‐hospital antipsychotic use was ascertained from pharmacy charges, reflecting each medication dispensed during the hospitalization. We categorized antipsychotic medications as typical (haloperidol, loxapine, thioridazine, molindone, thiothixine, pimozide, fluphenazine, trifluoperazine, chlorpromazine, and perphenazine) and atypical (aripiprazole, asenapine, clozapine, iloperidone, lurasidone, olanzapine, paliperidone, quetiapine, risperidone, and ziprasidone) based on classification by the Food and Drug Administration.[7, 8] We excluded prochlorperazine (Compazine) from our typical antipsychotic definition, as this medication is almost exclusively used as an antiemetic.
In the absence of guidelines for use of antipsychotic agents in hospitalized patients, we used the Centers for Medicare and Medicaid Services (CMS) guidelines for long‐term care facilities to define measures of potentially excessive dosing in the hospital setting.[9] These guidelines define the daily dosage levels of antipsychotics above which the medical necessity of the higher dose should be explained in the medical record. We defined any daily dosage above these specified levels as a potentially excessive daily dose.
Characteristics Associated With Use
We investigated the association between antipsychotic use and patient and hospital characteristics, selected based on clinical grounds. Patient characteristics included: (1) demographic variables such as age (<65, 6574, 75+ years), gender, self‐reported race, marital status, and primary insurance; (2) admission characteristic variables, including admitting department (surgical vs nonsurgical, defined by a surgical attending of record and presence of operating room charges), whether the patient spent any time in the intensive care unit (ICU), and whether they received mechanical ventilation; and (3) potential indications for use, including delirium (included delirium superimposed upon dementia), dementia (without delirium), and insomnia (see Supporting Information, Appendix, in the online version of this article for International Classification of Diseases, Ninth Revision, Clinical Modification [ICD‐9‐CM] codes). Hospital characteristics included number of beds, urban versus rural status, teaching status, and US Census region.
Statistical Analysis
We report the proportion of admissions with in‐hospital use of any antipsychotic, and the number of days of exposure, overall and stratified by typical and atypical.
We determined potentially excessive dosing by taking the sum of the doses for a specific antipsychotic charged on a given day and comparing it to the CMS guidelines for long‐term care settings described above. We report the percentage of exposed admissions with at least 1 day of potentially excessive dosing.
All multivariable models below were operationalized as generalized estimating equations with a Poisson error term, log link, robust variance estimator,[10] and an exchangeable correlation structure to account for repeated admissions of the same patient.
We investigated patient and hospital characteristics associated with use of any antipsychotic medication using a multivariable model that simultaneously included all patient and hospital characteristics in Table 1 as independent variables.
| % of Cohort | Any Exposure, % | Typical Exposure, % | Atypical Exposure, % | |
|---|---|---|---|---|
| ||||
| Patient characteristics | ||||
| Age group, y | ||||
| <65 | 52.1 | 4.6 | 2.0 | 3.1 |
| 6574 | 18.5 | 5.2 | 2.7 | 3.1 |
| 75+ | 29.4 | 8.8 | 4.6 | 5.4 |
| Gender | ||||
| Male | 43.8 | 6.6 | 3.6 | 3.8 |
| Female | 56.2 | 5.5 | 2.3 | 3.8 |
| Race | ||||
| White | 64.6 | 6.1 | 2.9 | 4.0 |
| Black | 13.5 | 5.5 | 2.8 | 3.3 |
| Hispanic | 5.0 | 4.9 | 2.2 | 3.2 |
| Other | 19.9 | 6.1 | 3.1 | 3.7 |
| Marital Status | ||||
| Married | 42.5 | 4.6 | 2.4 | 2.7 |
| Single | 46.7 | 7.2 | 3.2 | 4.7 |
| Unknown/other | 10.8 | 6.4 | 3.1 | 4.1 |
| Primary insurance | ||||
| Private (commercial) | 28.8 | 3.0 | 1.5 | 1.8 |
| Medicaid | 10.3 | 6.4 | 2.4 | 4.6 |
| Medicare managed | 10.6 | 7.1 | 4.1 | 4.0 |
| Medicare traditional | 40.9 | 8.0 | 3.7 | 5.3 |
| Self‐pay or other | 9.4 | 4.3 | 2.5 | 2.2 |
| Admitting department | ||||
| Surgical | 60.6 | 5.8 | 3.1 | 3.4 |
| Nonsurgical | 39.4 | 6.2 | 2.4 | 4.4 |
| Any ICU stay | 16.6 | 10.4 | 7.2 | 4.9 |
| Mechanical ventilation | 4.7 | 17.4 | 12.9 | 7.9 |
| Diagnoses | ||||
| Delirium | 3.2 | 28.6 | 19.4 | 15.7 |
| Dementia | 3.1 | 27.4 | 12.0 | 20.2 |
| Insomnia | 1.3 | 10.2 | 3.9 | 7.5 |
| Discharge disposition | ||||
| Home | 77.9 | 3.8 | 1.6 | 2.5 |
| SNF/Rehab | 15.5 | 13.7 | 6.8 | 9.0 |
| Hospice | 1.7 | 16.0 | 10.3 | 8.1 |
| Other | 4.9 | 11.6 | 7.6 | 5.7 |
| Hospital characteristics, % | ||||
| No. of beds | ||||
| 200 | 14.1 | 6.1 | 2.8 | 3.8 |
| 201300 | 18.6 | 6.1 | 2.9 | 3.9 |
| 301500 | 37.7 | 5.9 | 2.9 | 3.7 |
| 500+ | 29.7 | 5.9 | 2.8 | 3.8 |
| Population served | ||||
| Urban | 89.4 | 6.0 | 2.9 | 3.8 |
| Rural | 10.6 | 5.8 | 2.4 | 3.9 |
| Teaching status | ||||
| Teaching | 39.2 | 5.8 | 2.9 | 3.7 |
| Nonteaching | 60.8 | 6.0 | 2.8 | 3.9 |
| US Census region | ||||
| West | 16.9 | 5.9 | 3.2 | 3.5 |
| Northeast | 20.1 | 6.1 | 2.9 | 3.9 |
| Midwest | 21.9 | 5.7 | 2.5 | 3.8 |
| South | 41.0 | 6.1 | 2.9 | 3.9 |
To determine hospital variation in antipsychotic use, we first determined the proportion of admissions at each hospital with at least 1 charge for antipsychotic medication. We then divided hospitals into quintiles based on their facility‐level antipsychotic prescribing rates and assigned all admissions to their corresponding hospital quintile. We then used a multivariable model to measure the adjusted association between prescribing quintile and patient‐level receipt of antipsychotic medication, controlling for all patient characteristics listed in Table 1 (except discharge disposition), and comorbidities using the Healthcare Cost and Utilization Project Comorbidity Software version 3.7 (Agency for Healthcare Research and Quality, Rockville, MD).[11] We used the lowest prescribing quintile as the reference group. We also report in the Supporting Information, Appendix, in the online version of this article, the distribution of prescribing rates for the hospitals in our cohort before and after adjustment for patient characteristics. For both approaches, we conducted stratified analyses in admissions with delirium and dementia.
All analyses were carried out using SAS software (SAS Institute Inc., Cary, NC).
RESULTS
Admission Characteristics
There were 3,190,934 admissions aged 18 years and over to 300 hospitals from July 1, 2009 to June 30, 2010. After excluding admissions with unknown gender (n = 17), length of stay greater than 365 days (n = 25), charges for labor and delivery (n = 323,111) or a psychiatric attending of record or psychiatric comorbidity (n = 172,669), and admissions to hospitals with fewer than 100 admissions (n = 31), our cohort included 2,695,081 admissions. The median age was 63 years (25th, 75th percentile 48, 77 years), and 1,514,986 (56%) were women. Table 1 shows the overall admission characteristics of the cohort and the percent exposed to antipsychotics among each patient and hospital characteristic.
Antipsychotic Use
There were 160,773 (6%) admissions with antipsychotic exposure. Among exposed admissions, 102,148 (64%) received atypical and 76,979 (48%) received typical antipsychotics, with 18,354 (11%) exposed to both. The median (25th, 75th percentile) length of stay among exposed was 5 days (3, 9 days), and the median (25th, 75th percentile) number of days of exposure was 3 (1, 5 days) overall, 3 days (2, 6 days) for atypical and 2 days (1, 3 days) for typical exposure.
Among admissions aged 65 to 74 years, 25,855 (5%) were exposed. Among admissions aged 75 years or older, 69,792 (9%) were exposed. Among admissions with delirium, exposure occurred in 24,787 (29%), with 13,640 (55%) receiving atypical, 16,828 (68%) receiving typical, and 5681 (23%) exposed to both. Among admissions with dementia, exposure occurred in 23,179 (27%), with 17,068 (74%) receiving atypical, 10,108 (44%) receiving typical, and 3997 (17%) exposed to both.
Use of Specific Drugs and Potentially Excessive Dosing
Table 2 demonstrates the most commonly used antipsychotic medications and the rates of potentially excessive dosing. Quetiapine and olanzapine were the most commonly used atypical antipsychotics, and haloperidol represented the majority of typical antipsychotic use. Among admissions with antipsychotic exposure, 47% received at least 1 potentially excessive daily dose, 18% of those with atypical exposure and 79% of those with typical exposure. Among admissions aged 65 years and up (n = 1,291,375), the prevalence of potentially excessive dosing was almost identical; 46% received at least 1 daily dose in excess of the recommended daily dose, 11% of those with atypical exposure and 79% of those with typical exposure.
| Agent |
Overall Prevalence,N = 2,695,081 |
% of Exposed With Potentially Excessive Dosing* | ||
|---|---|---|---|---|
| Within 100% of Recommended DD* | 101% to 150% of Recommended DD* | >150% of Recommended DD* | ||
| ||||
| Any antipsychotic | 6.0 | 52.9 | 20.2 | 26.9 |
| Atypical | 3.8 | 82.0 | 5.4 | 12.6 |
| Quetiapine (200) | 1.8 | 81.7 | 5.7 | 12.6 |
| Olanzapine (10) | 0.6 | 73.7 | 7.3 | 19.0 |
| Risperidone (2) | 0.9 | 79.2 | 6.8 | 14.0 |
| Other | 0.7 | 98.3 | 0.1 | 1.6 |
| Typical | 2.9 | 21.1 | 37.0 | 41.9 |
| Haloperidol (4) | 2.5 | 13.2 | 41.3 | 45.5 |
| Chlorpromazine (75) | 0.3 | 76.0 | 9.8 | 14.2 |
| Other | 0.4 | 89.1 | 2.9 | 8.0 |
Characteristics Associated With Antipsychotic Use
Among the patient and hospital characteristics included in our analysis, the 5 characteristics most strongly associated with antipsychotic exposure after adjustment were (Table 3): delirium (relative risk [RR]: 2.93, 95% confidence interval [CI]: 2.88‐2.98); dementia (RR: 2.78, 95% CI: 2.72‐2.83); insurance status, with higher risk among patients with traditional Medicare (RR: 2.09, 95% CI: 2.04‐2.13), Medicare managed (RR: 1.98, 95% CI: 1.93‐2.03), Medicaid (RR: 1.84, 95% CI: 1.80‐1.88), and self‐pay/other (RR: 1.26, 95% CI: 1.23‐1.29) compared to private (commercial) insurance; use of mechanical ventilation (RR: 1.84, 95% CI: 1.81‐1.87); and any ICU stay (RR: 1.53, 95% CI: 1.51‐1.55).
| Unadjusted RR of Receiving Any Antipsychotic [95% CI] | Adjusted RR of Receiving Any Antipsychotic [95% CI]* | |
|---|---|---|
| ||
| Age group, y, % | ||
| <65 | Reference | Reference |
| 6574 | 1.12 [1.10,1.14] | 0.74 [0.72, 0.75] |
| 75+ | 1.90 [1.88,1.92] | 1.03 [1.01, 1.05] |
| Gender | ||
| Female | Reference | Reference |
| Male | 1.19 [1.18,1.20] | 1.27 [1.26, 1.28] |
| Race | ||
| White | Reference | Reference |
| Black | 0.91 [0.90,0.92] | 0.85 [0.83, 0.86] |
| Hispanic | 0.80 [0.78,0.82] | 0.79 [0.76, 0.81] |
| Other | 0.99 [0.98,1.00] | 0.96 [0.95, 0.98] |
| Marital status | ||
| Married | Reference | Reference |
| Single | 1.57 [1.55,1.59] | 1.43 [1.42, 1.45] |
| Unknown/other | 1.41 [1.39,1.43] | 1.27 [1.24, 1.29] |
| Primary insurance | ||
| Private (commercial) | Reference | Reference |
| Medicaid | 2.13 [2.09,2.17] | 1.84 [1.80, 1.88] |
| Medicare managed | 2.35 [2.31,2.39] | 1.98 [1.93, 2.03] |
| Medicare traditional | 2.65 [2.61,2.69] | 2.09 [2.04, 2.13] |
| Self‐pay or other | 1.41 [1.38,1.44] | 1.26 [1.23, 1.29] |
| Admitting department | ||
| Surgical | Reference | Reference |
| Nonsurgical | 1.06 [1.05,1.07] | 1.05 [1.03, 1.06] |
| Any ICU stay | 2.05 [2.03,2.07] | 1.53 [1.51, 1.55] |
| Mechanical ventilation | 3.22 [3.18,3.26] | 1.84 [1.81, 1.87] |
| Diagnoses | ||
| Delirium | 5.48 [5.42, 5.45] | 2.93 [2.88, 2.98] |
| Dementia | 5.21 [5.15,5.27] | 2.78 [2.72, 2.83] |
| Insomnia | 1.72 [1.67,1.78] | 1.51 [1.45, 1.57] |
| No. of beds | ||
| 200 | Reference | Reference |
| 201300 | 1.01 [0.99,1.03] | 0.96 [0.94, 0.98] |
| 301500 | 0.98 [0.97,1.00] | 0.93 [0.91, 0.95] |
| 500+ | 0.97 [0.96,0.98] | 0.91 [0.90, 0.93] |
| Population served | ||
| Urban | Reference | Reference |
| Rural | 0.96 [0.95,0.98] | 0.91 [0.89, 0.93] |
| Teaching status | ||
| Teaching | Reference | Reference |
| Nonteaching | 1.03 [1.02,1.04] | 0.98 [0.97, 1.00] |
| US Census region | ||
| West | Reference | Reference |
| Northeast | 1.03 [1.01,1.05] | 1.04 [1.02, 1.06] |
| Midwest | 0.95 [0.94,0.97] | 0.93 [0.91, 0.94] |
| South | 1.02 [1.01,1.03] | 1.07 [1.05, 1.09] |
Hospital Variation in Antipsychotic Use
Figure 1 demonstrates the antipsychotic prescribing rate at each hospital in our cohort, and the corresponding quintiles. Patients admitted to hospitals in the highest prescribing quintile were more than twice as likely to be exposed to antipsychotics compared to patients admitted to hospitals in the lowest prescribing quintile, even after adjustment for patient characteristics and comorbidities (Table 4). This relationship was similar across subgroups of admissions with delirium and dementia (see Supporting Information, Appendix, in the online version of this article for the distribution of hospital antipsychotic prescribing rates before and after adjustment for patient characteristics).
| Admissions, No. (% of Total) | Unadjusted RR of Exposure [95% CI] | Adjusted RR of exposure [95% CI]* | |
|---|---|---|---|
| |||
| Overall | |||
| Q1 | 431,017 (16%) | Reference | Reference |
| Q2 | 630,486 (23%) | 1.67 [1.63, 1.71] | 1.59 [1.55, 1.62] |
| Q3 | 548,337 (20%) | 1.93 [1.88, 1.97] | 1.84 [1.80, 1.88] |
| Q4 | 639,027 (24%) | 2.16 [2.12, 2.21] | 2.07 [2.03, 2.12] |
| Q5 | 446,214 (17%) | 2.83 [2.77, 2.89] | 2.56 [2.50, 2.61] |
| Delirium | |||
| Q1 | 12,878 (15%) | Reference | Reference |
| Q2 | 20,588 (24%) | 1.58 [1.51, 1.65] | 1.58 [1.51, 1.65] |
| Q3 | 17,402 (20%) | 1.71 [1.64, 1.80] | 1.73 [1.65, 1.82] |
| Q4 | 20,943 (24%) | 2.01 [1.92, 2.10] | 1.99 [1.91, 2.08] |
| Q5 | 14,883 (17%) | 2.15 [2.05, 2.25] | 2.16 [2.07, 2.26] |
| Dementia | |||
| Q1 | 28,290 (15%) | Reference | Reference |
| Q2 | 42,018 (22%) | 1.43 [1.36, 1.50] | 1.40 [1.34, 1.47] |
| Q3 | 38,593 (21%) | 1.61 [1.53, 1.69] | 1.59 [1.51, 1.66] |
| Q4 | 44,638 (24%) | 1.69 [1.62, 1.77] | 1.69 [1.61, 1.77] |
| Q5 | 34,442 (18%) | 1.92 [1.83, 2.01] | 1.90 [1.81, 1.99] |
DISCUSSION
In this cohort of nonpsychiatric admissions to 300 US hospitals, antipsychotic medications were used in 6% of admissions, with atypical antipsychotics representing the majority of use. Potentially excessive daily doses based on CMS recommendations for long‐term care facilities occurred in almost half of admissions with any antipsychotic exposure, and in 87% of admissions with haloperidol exposure specifically. We found variation in hospital use of antipsychotics that was not fully accounted for by measured patient characteristics, and which persisted among subgroups of admissions with delirium and/or dementia. Although unmeasured patient characteristics or different billing practices between hospitals are potential explanations, our findings also raise the possibility of different hospital antipsychotic prescribing cultures. These findings provide new information regarding the scope of prescribing in US hospitals, and draw attention to the need for additional studies to better define what constitutes appropriate use of antipsychotics in the hospital setting.
A recent single‐center study at a large academic medical center found an overall antipsychotic exposure rate of 9% of nonpsychiatric admissions.[12] Our finding that 6% of admissions in this multicenter cohort were exposed to antipsychotics is slightly lower, but similar to the previous estimate. Assuming 37 million discharges from US hospitals each year,[13] our study suggests that more than 2 million hospitalized patients receive antipsychotics annually. With around 1.4 million residents in nursing homes on any given day,[14] and an exposure rate of 25% to 30% in that setting,[15, 16, 17] our study suggests that the number of patients exposed in the hospital setting is greater than the number exposed in the nursing home setting, the site of care for which prescribing regulations have been focused thus far.
Because our dataset does not contain preadmission medications, we were unable to specifically investigate new initiation. In the prior single‐center study, approximately 55% of overall use in the hospital setting was new initiation,[12] which would suggest that antipsychotics are newly initiated in around 1 million admissions each year in the hospital. Although we are unable to determine reason for use in our analysis, delirium was a strong predictor of antipsychotic use in our multivariable model, and prior studies have demonstrated delirium to be the most common reason for antipsychotic initiation in hospitalized patients,[12, 18] an indication for which efficacy/effectiveness data are lacking. A recent systematic review of antipsychotics for the treatment of delirium in older adults concluded that because of severe methodological limitations, the small number of existing studies on this topic do not support the use of antipsychotics in the treatment of delirium in older hospitalized adults.[19] Our results further highlight the need for randomized placebo‐controlled trials of antipsychotics in treatment of delirium.
We found variation in antipsychotic use between hospitals that was not fully explained by patient characteristics. Insufficient data to inform clinical decisions surrounding management of agitated delirium/dementia and lack of clear criteria by which to judge appropriateness of antipsychotic use may contribute to this variation. Some variation may relate to resource allocation at different hospitals, and the feasibility of implementing nonpharmacologic management options across settings. Our results collectively highlight the need for studies evaluating the efficacy/effectiveness of antipsychotics in the treatment of delirium and drivers of physician decision‐making in this realm, as well as the need for greater hospital investment in nonpharmacologic delirium‐prevention programs, which have been shown to be effective in prevention of delirium in hospitalized patients.[20]
We observed high levels of potentially excessive daily dosing using cutoffs applied in the long‐term care setting. The majority of the potentially excessive doses were in the setting of typical antipsychotic use, and haloperidol specifically, where doses exceeded 4 mg on at least 1 day in 87% of exposed admissions. Of note, the threshold for haloperidol dosage above which justification is required was decreased from 4 to 2 mg per day in the 2015 update to the CMS guidelines.[21] For the present analysis, we used the guidelines that were contemporaneous to our cohort; we are unable to determine current rates of potentially inappropriate dosages in the present analysis, but given the high prevalence in 2009 to 2010, and the lowering of the dosage threshold since then, it is unlikely that any decrease in use would be enough to substantially reduce the estimate. Whether these high dosages are actually inappropriate in the hospital setting is not established, and we were not able to review medical records to determine whether justification for use of such doses was documented.[22, 23] It is possible that hospitalized patients with altered pharmacodynamics and greater severity of illness could require larger doses of these medications; however, this is an area in need of further investigation, and current critical care guidelines note the lack of sufficient data upon which to justify use of haloperidol in the prevention or treatment of delirium in ICU patients.[24, 25]
The dosages in use are concerning given that the risk of extrapyramidal side effects increases with increasing dose, and prior studies have demonstrated an association between increased dose of antipsychotics and increased risk of other adverse events, including hip fracture and sudden cardiac death.[22, 23] Further, despite these known risks, studies have demonstrated failure to follow recommendations to mitigate risk,[26] such as electrocardiogram monitoring in individuals receiving intravenous haloperidol.[27] Our results suggest that physicians are similarly not following recommendations to use lower doses of haloperidol when treating older patients, given the almost identical incidence of potentially excessive dosing among admissions of patients aged 65 years and older in our cohort.[25] Clinical decision support prompts have been effective at increasing appropriate use of antipsychotic medications in several single‐center analyses,[28, 29, 30] and widespread implementation of such support with a focus on haloperidol dosing should be considered on the basis of our results.
The patient characteristics associated with antipsychotic use in this large, nationally representative analysis are consistent with those identified in prior single‐center analyses.[12, 18] Both prior analyses identified delirium as the most common reason for antipsychotic use, and dementia, intensive care unit stay, and mechanical ventilation were also previously identified as strong predictors of use that we believe hold face validity for the practicing hospitalist. On the other hand, some of the factors associated with antipsychotic use in our model cannot be readily explained, such as insurance status and race, and may be serving as proxies for other variables not included in our analysis. That nonwhite patients are less likely than white patients to receive antipsychotic medications in the hospital has been previously demonstrated,[12] and further investigation to understand this disparity is warranted.
Our study has several additional limitations. First, because our study is observational, the possibility of residual confounding exists, and we cannot rule out that there are other patient factors driving the hospital variation in antipsychotic use that we observed. Second, because guidelines do not exist for antipsychotic dosing in hospitalized patients, we could only comment on potentially excessive dosing, extrapolating from guidelines in the long‐term care setting. Whether such doses are actually excessive in hospitalized patients is not defined. Third, although Premier performs quality checks on charge and ICD‐9‐CM coding data submitted by participating hospitals, the validity of administrative data is uncertain. For example, the use of administrative data to identify delirium diagnoses is likely to have resulted in underestimation of delirium incidence among our different exposure groups. Delirium is likely to be coded more often in the setting of more severe or hyperactive cases, when antipsychotics are more likely to be utilized. This could result in an overestimation of the association between delirium and antipsychotic use. Additionally, differences in coding practices between hospitals for any of the variables in our models could explain some of the variation in antipsychotic prescribing that we observed. Finally, because we were unable to differentiate between new initiation and continuation of a preadmission antipsychotic, some of the variation that we observed is likely to reflect differences in outpatient antipsychotic prescribing practices.
In conclusion, in this large cohort of nonpsychiatric admissions to 300 US hospitals, we found that antipsychotic medication exposure was common, often at high daily doses. Delirium and dementia were the strongest predictors of use among the patient and hospital characteristics examined. The variation in antipsychotic prescribing that we observed was not fully accounted for by measured patient characteristics, and raises the possibility of differing hospital prescribing cultures. Our results draw attention to the need for additional research to better define what constitutes appropriate use of these potentially harmful medications in the hospital setting.
Disclosures: Dr. Herzig had full access to all of the data in the study and takes responsibility for the integrity of the data and the accuracy of the data analysis. Study concept and design: Drs. Herzig, Rothberg, Gurwitz, and Marcantonio. Acquisition of data: Dr. Herzig. Analysis of data: Mr. Guess. Interpretation of data: Drs. Herzig, Rothberg, Gurwitz, Marcantonio, and Mr. Guess. Drafting of the manuscript: Dr. Herzig. Critical revision of the manuscript for important intellectual content: Drs. Rothberg, Gurwitz, Marcantonio, and Mr. Guess. Dr. Herzig was funded by grant number K23AG042459 from the National Institute on Aging. Dr. Marcantonio was funded by grant number K24AG035075 from the National Institute on Aging. The funding organizations had no involvement in any aspect of the study, including design and conduct of the study; collection, management, analysis, and interpretation of the data; and preparation, review, or approval of the manuscript. The authors report no conflicts of interest.
- , , , et al. Variation in nursing home antipsychotic prescribing rates. Arch Intern Med. 2007;167(7):676–683.
- , . Precipitating factors for delirium in hospitalized elderly persons. Predictive model and interrelationship with baseline vulnerability. JAMA. 1996;275(11):852–857.
- , , , , . A predictive model for delirium in hospitalized elderly medical patients based on admission characteristics. Ann Intern Med. 1993;119(6):474–481.
- , , , , , . Delirium in hospitalized older persons: outcomes and predictors. J Am Geriatr Soc. 1994;42(8):809–815.
- , , , . Small‐area variations in the use of common surgical procedures: an international comparison of New England, England, and Norway. N Engl J Med. 1982;307(21):1310–1314.
- Premier Research Services. Available at: https://www.premierinc.com/transforming‐healthcare/healthcare‐performance‐improvement/premier‐research‐services. Accessed March 15, 2016.
- U.S. Food and Drug Administration. Atypical antipsychotic drugs information. Available at: http://www.fda.gov/drugs/drugsafety/postmarketdrugsafetyinformationforpatientsandproviders/ucm094303.htm. Accessed November 1, 2015.
- U.S. Food and Drug Administration. Information on conventional antipsychotics. Available at: http://www.fda.gov/drugs/drugsafety/postmarketdrugsafetyinformationforpatientsandproviders/ucm107211. htm. Accessed November 1, 2015.
- Centers for Medicare and Medicaid Services. State Operations Manual. Appendix PP: guidance to surveyors for long‐term care facilities. Available at: https://www.cms.gov/Medicare/Provider‐Enrollment‐and‐Certification/GuidanceforLawsAndRegulations/Downloads/som107 ap_pp_guidelines_ltcf.pdf. Revised October 14, 2005. Accessed March 15, 2016.
- . A modified Poisson regression approach to prospective studies with binary data. Am J Epidemiol. 2004;159(7):702–706.
- Healthcare Cost and Utilization Project. Comorbidity software, version 3.7. Agency for Healthcare Research and Quality, Rockville, MD. Available at: http://www.hcup‐us.ahrq.gov/toolssoftware/comorbidity/comorbidity.jsp. Accessed March 15, 2016.
- , , , et al. Antipsychotic use in hospitalized adults: rates, indications, and predictors. J Am Geriatr Soc. 2016;64(2):299–305.
- , . Overview of hospital stays in the United States, 2012. HCUP Statistical Brief #180. Agency for Healthcare Research and Quality, Rockville, MD. Available at: http://www.hcup‐us.ahrq.gov/reports/statbriefs/sb180‐Hospitalizations‐United‐States‐2012.pdf. Published October 2014. Accessed June 29, 2015.
- , , , . Long‐term care services in the United States: 2013 overview. Vital Health Stat 3. 2013;(37):1–107. Available at: http://www.cdc.gov/nchs/data/nsltcp/long_term_care_services_2013.pdf. Accessed March 16, 2016.
- , , , et al. The quality of antipsychotic drug prescribing in nursing homes. Arch Intern Med. 2005;165(11):1280–1285.
- , , , , , . Unexplained variation across US nursing homes in antipsychotic prescribing rates. Arch Intern Med. 2010;170(1):89–95.
- , , , , . Broadened use of atypical antipsychotics: safety, effectiveness, and policy challenges. Health Aff (Millwood). 2009;28(5):w770–w781.
- , , , , , . From hospital to community: use of antipsychotics in hospitalized elders. J Hosp Med. 2014;9(12):802–804.
- , , . Antipsychotics in the treatment of delirium in older hospitalized adults: a systematic review. J Am Geriatr Soc. 2011;59(suppl 2):S269–S276.
- , , , et al. Effectiveness of multicomponent nonpharmacological delirium interventions: a meta‐analysis. JAMA Intern Med. 2015;175(4):512–520.
- Centers for Medicare and Medicaid Services. State operations manual, appendix PP: guidance to surveyors for long‐term care facilities. Available at: https://www.cms.gov/Regulations‐and‐Guidance/Guidance/Manuals/downloads/som107ap_pp_guidelines_ltcf.pdf. Revised October 9, 2015. Accessed February 22, 2016.
- , , , , . Psychotropic drug use and the risk of hip fracture. N Engl J Med. 1987;316(7):363–369.
- , , , , . Atypical antipsychotic drugs and the risk of sudden cardiac death. N Engl J Med. 2009;360(3):225–235.
- , , , et al. Clinical practice guidelines for the management of pain, agitation, and delirium in adult patients in the intensive care unit. Crit Care Med. 2013;41(1):263–306.
- , , , , . Haloperidol overdosing in the treatment of agitated hospitalized older people with delirium: a retrospective chart review from a community teaching hospital. Drugs Aging. 2013;30(8):639–644.
- , , , . Unsafe use of intravenous haloperidol: evaluation of recommendation‐concordant care in hospitalized elderly adults. J Am Geriatr Soc. 2013;61(1):160–161.
- U.S. Food and Drug Administration. HALDOL brand of haloperidol injection. Available at: http://www.accessdata.fda.gov/drugsatfda_docs/label/2008/015923s082,018701s057lbl.pdf. Accessed February 23, 2016.
- , , , . Preventing potentially inappropriate medication use in hospitalized older patients with a computerized provider order entry warning system. Arch Intern Med. 2010;170(15):1331–1336.
- , , , et al. A standardized, bundled approach to providing geriatric‐focused acute care. J Am Geriatr Soc. 2014;62(5):936–942.
- , , , . Don't fuel the fire: decreasing intravenous haloperidol use in high risk patients via a customized electronic alert. J Am Med Inform Assoc. 2014;21(6):1109–1112.

Agreement on Dyspnea Severity
Breathlessness, or dyspnea, is defined as a subjective experience of breathing discomfort that is comprised of qualitatively distinct sensations that vary in intensity.[1] Dyspnea is a leading reason for patients presenting for emergency care,[2] and it is an important predictor for hospitalization and mortality in patients with cardiopulmonary disease.[3, 4, 5]
Several professional societies' guidelines recommend that patients should be asked to quantify the intensity of their breathlessness using a standardized scale, and that these ratings should be documented in medical records to guide dyspnea awareness and management.[1, 6, 7] During the evaluation and treatment of patients with acute cardiopulmonary conditions, the clinician estimates the severity of the illness and response to therapy based on multiple objective measures as well as the patient's perception of dyspnea. A patient‐centered care approach depends upon the physicians having a shared understanding of what the patient is experiencing. Without this appreciation, the healthcare provider cannot make appropriate treatment decisions to ensure alleviation of presenting symptoms. Understanding the severity of patients' dyspnea is critical to avoid under‐ or overtreatment of patients with acute cardiopulmonary conditions, but only a few studies have compared patient and provider perceptions of dyspnea intensity.[8, 9] Discordance between physician's impression of severity of dyspnea and patient's perception may result in suboptimal management and patient dissatisfaction with care. Furthermore, several studies have shown that, when physicians and patients agree with the assessment of well‐being, treatment adherence and outcomes improve.[10, 11]
Therefore, we evaluated the extent and directionality of agreement between patients' perception and healthcare providers' impression of dyspnea and explored which factors contribute to discordance. Additionally, we examined how healthcare providers document dyspnea severity.
METHODS
Study Setting and Population
The study was conducted between June 2012 and August 2012 at Baystate Medical Center (BMC), a 740‐bed tertiary care hospital in western Massachusetts. In 2012, the BMC hospitalist group had 48 attending physicians, of whom 47% were female, 48% had 0 to 3 years of attending experience, and 16% had 10 years of experience.
We enrolled consecutive admissions of English‐speaking adult patients, with a working diagnosis of heart failure (HF), chronic obstructive pulmonary disease (COPD), asthma, pneumonia, or a generic diagnosis of shortness of breath. Because we surveyed only hospitalists, we did not include patients admitted to an intensive care unit.
All participants gave informed consent to be part of the study. The research protocol was approved by the Baystate Health Institutional Review Board, Springfield, Massachusetts.
Dyspnea Assessment
Dyspnea intensity was assessed on an 11‐point (010) numerical rating scale (NRS).[12, 13] A trained research assistant interviewed patients on day 1 and 2 after admission, and on the day of discharge between 8 am and 12 pm on weekdays. The patient was asked: On a scale from 0 to 10, how bad is your shortness of breath at rest now, with 0 being no shortness of breath and 10 the worst shortness of breath you could ever imagine? The hospitalist or the senior resident and day‐shift nurse taking care of the patients were asked by the research assistant to rate the patient's dyspnea using the same scoring instrument shortly after they saw the patient. The physicians and nurses based their determination of dyspnea on their usual interview/examination of the patient. The patient, physician and the nurse were not aware of each other's rating. The research assistant scheduled the interviews to minimize the time intervals between the patient assessment and provider's rating. For this reason, the number of assessments per patient varied. Nurses were more readily available than physicians, which resulted in a larger number of patient‐nurse response pairs than patient‐physician pairs. All assessments were done in the morning, between 9 am and 12 pm, with a range of 3 hours between provider's assessment of the patient and the interview.
Dyspnea Agreement
Agreement was defined as a score within 1 between patient and healthcare provider; differences of 2 points were considered over‐ or underestimations. The decision to use this cutoff was based on prior studies, which found that a difference in the range of 1.6 to 2.2 cm was meaningful for the patient when assessment was done on the visual analog scale.[8, 14, 15] We also evaluated the direction of discordance. If the patient's rating of dyspnea severity was higher than the provider's rating, we defined this as underestimation by the provider; in the instance where a provider's score of dyspnea severity was higher than the patient's score, we defined this as overestimation. In a sensitivity analysis, agreement was defined as a score within 2 between patient and healthcare provider, and any difference 3 was considered disagreement.
Other Variables
We obtained information from the medical records about patient demographics, body mass index (BMI), smoking status, and vital signs. We calculated the oxygen saturation index as the ratio between the oxygen saturation and the fractional inspired oxygen (SpO2/FIO2). Comorbidities were assessed based on the International Classification od Diseases, Ninth Revision, Clinical Modification codes from the hospital financial decision support system. We calculated an overall combined comorbidity score based on the method described by Gagne, which is based on elements from the Charlson Comorbidity Index and from the Elixhauser comorbidities.[16]
Charts of the patients included in the study were retrospectively reviewed for physicians' and nurses' documentation of dyspnea at admission and at discharge. We recorded if dyspnea was mentioned and how it was assessed: whether it was described as present/absent; graded as mild, moderate, or severe; used a quantitative scale (010); used descriptors (eg, dyspnea when climbing stairs); and whether it was defined as improved or worsened without other qualifiers.
Statistical Analysis
Descriptive statistics of dyspnea scores, patient characteristics, comorbidities and vital signs were calculated and presented as medians with interquartile range (IQR) for continuous variables, and counts with percentages for categorical factors. Every patient‐provider concurrent scoring was included in the analysis as 1 dyad, which resulted in patients being included multiple times in the analysis. Patient‐physician and patient‐nurse dyads of dyspnea assessment were examined separately. Analyses included all dyads that were within same assessment period (same day and same time window).
The relationship between patient self‐perceived dyspnea severity and provider rating of was assessed in several ways. First, a weighted kappa coefficient was used as a measure of agreement between patient and nurse or physician scores. A weighted kappa analysis was chosen because it penalizes disagreements that are further apart from each other.
Second, we defined an indicator of discordance and constructed multivariable generalized estimating equation models that account for clustering of multiple dyads per patient, to assess the relationship of patient characteristics with discordance. Finally, we developed additional models to predict underestimation when compared to agreement or overestimation of dyspnea by the healthcare provider relative to the patient. Using the same definitions for agreement, we also compared the dyspnea assessment estimation between physicians and nurses.
We present the differences in dyspnea assessment between patient and healthcare provider and between nurses and physicians by Bland‐Altman plots.
All analyses were performed using SAS (version 9.3; SAS institute, Inc., Cary, NC), Stata (Stata statistical software release 13; StataCorp, College Station, TX), and RStudio version 0.99.892 (Bland‐Altman plots, R package version 0.3.1; The R Foundation for Statistical Computing, Vienna, Austria).[8, 9, 17]
RESULTS
Patient Characteristics
Among the 219 patients who met the screening criteria, 81 were not enrolled (Figure 1). Data from 138 patients, with both patient information and provider data on dyspnea assessment, were included. The median age of the patients was 72 years (IQR, 5880 years), 56.5% were women, 75.4% were white, and 28.3% were current smokers. Approximately 30% had a diagnosis of HF, 30% of COPD, and 13.0% of pneumonia. The median comorbidity score was 4 (IQR, 26), and 37.0% of the patients had a BMI 30. At admission, the median oxygen saturation index was 346 (IQR, 287.5460) indicating mild to moderate levels of hypoxia. (Table 1).
| Value | |
|---|---|
| |
| Age, median (IQR), y | 72 (5880) |
| Gender | |
| Female | 78 (56.5) |
| Male | 60 (43.5) |
| Race | |
| White | 104 (75.4) |
| Black | 16 (11.6) |
| Hispanic | 17 (12.3) |
| Other | 1 (0.7) |
| Body mass index, median (IQR) | 28 (23.334.6) |
| Obese (BMI 30) | 51 (37.0) |
| Smoker, current | 39 (28.3) |
| Admitting diagnosis | |
| Heart failure | 46 (33.3) |
| COPD/asthma | 41 (29.7) |
| Pneumonia | 18 (13.0) |
| Other | 33 (23.9) |
| Depression | 32 (23.2) |
| Comorbidity score, median (IQR) | 4 (26) |
| Respiratory rate at admission, median (IQR) | 20 (1924) |
| Oxygen saturation index at admission, median (IQR) | 346.4 (287.5460) |
| Patient NRS, median (IQR) | |
| At admission | 9 (710) |
| At discharge | 2 (14) |
| Discharged on home oxygen | 45 (32.6) |
| Respiratory rate at discharge, median (IQR) | 20 (1820) |
| Oxygen saturation index at discharge, median (IQR) | 475 (350485) |

Agreement Between Patients' Self‐Assessment and Providers' Assessment of Dyspnea Severity
Not all patients had complete data points, and more nurses were interviewed than physicians. Overall, 96 patient‐physician and 138 patient‐nurse pairs participated in the study. A total of 336 patient‐nurse rating dyad assessments of dyspnea and 124 patient‐physician rating dyads assessments were collected (Figure 1). The mean difference between patient and physicians and patient and nurses assessments of dyspnea was 1.23 (IQR, 3 to 0) and 0.21 (IQR, 2 to 2) respectively (a negative score means underestimation by the provider, a positive score means overestimation).
The unadjusted agreement on the severity of dyspnea was 36.3% for the patient‐physician dyads and 44.1% for the patient‐nurse dyads. Physicians underestimated their patients' dyspnea 37.9% of the time and overestimated it 25.8% of the time; nurses underestimated it 43.5% of the time and overestimated it in 12.4% of the study patients (Table 2). In 28.2% of the time, physicians were discordant more than 4 points of the patient assessment. Bland‐Altman plots show that there is greater variation in differences of dyspnea assessments with increase in shortness of breath scores (Figure 2). Nurses underestimated more when the dyspnea score was on the lower end. Physicians also tended to estimate either lower or higher when compared to patients when the dyspnea scores were <2 (Figure 2A,B).
| Underestimation | Concordance | Overestimation | |||||||
|---|---|---|---|---|---|---|---|---|---|
| 3 | 2 | %* | 0 | 1 | % | 2 | 3 | % | |
| |||||||||
| Patient‐nurse dyads | 110 | 48 | 43.5 | 82 | 78 | 44.1 | 17 | 28 | 12.4 |
| Patient‐physician dyads | 33 | 14 | 37.9 | 21 | 24 | 36.3 | 12 | 20 | 25.8 |
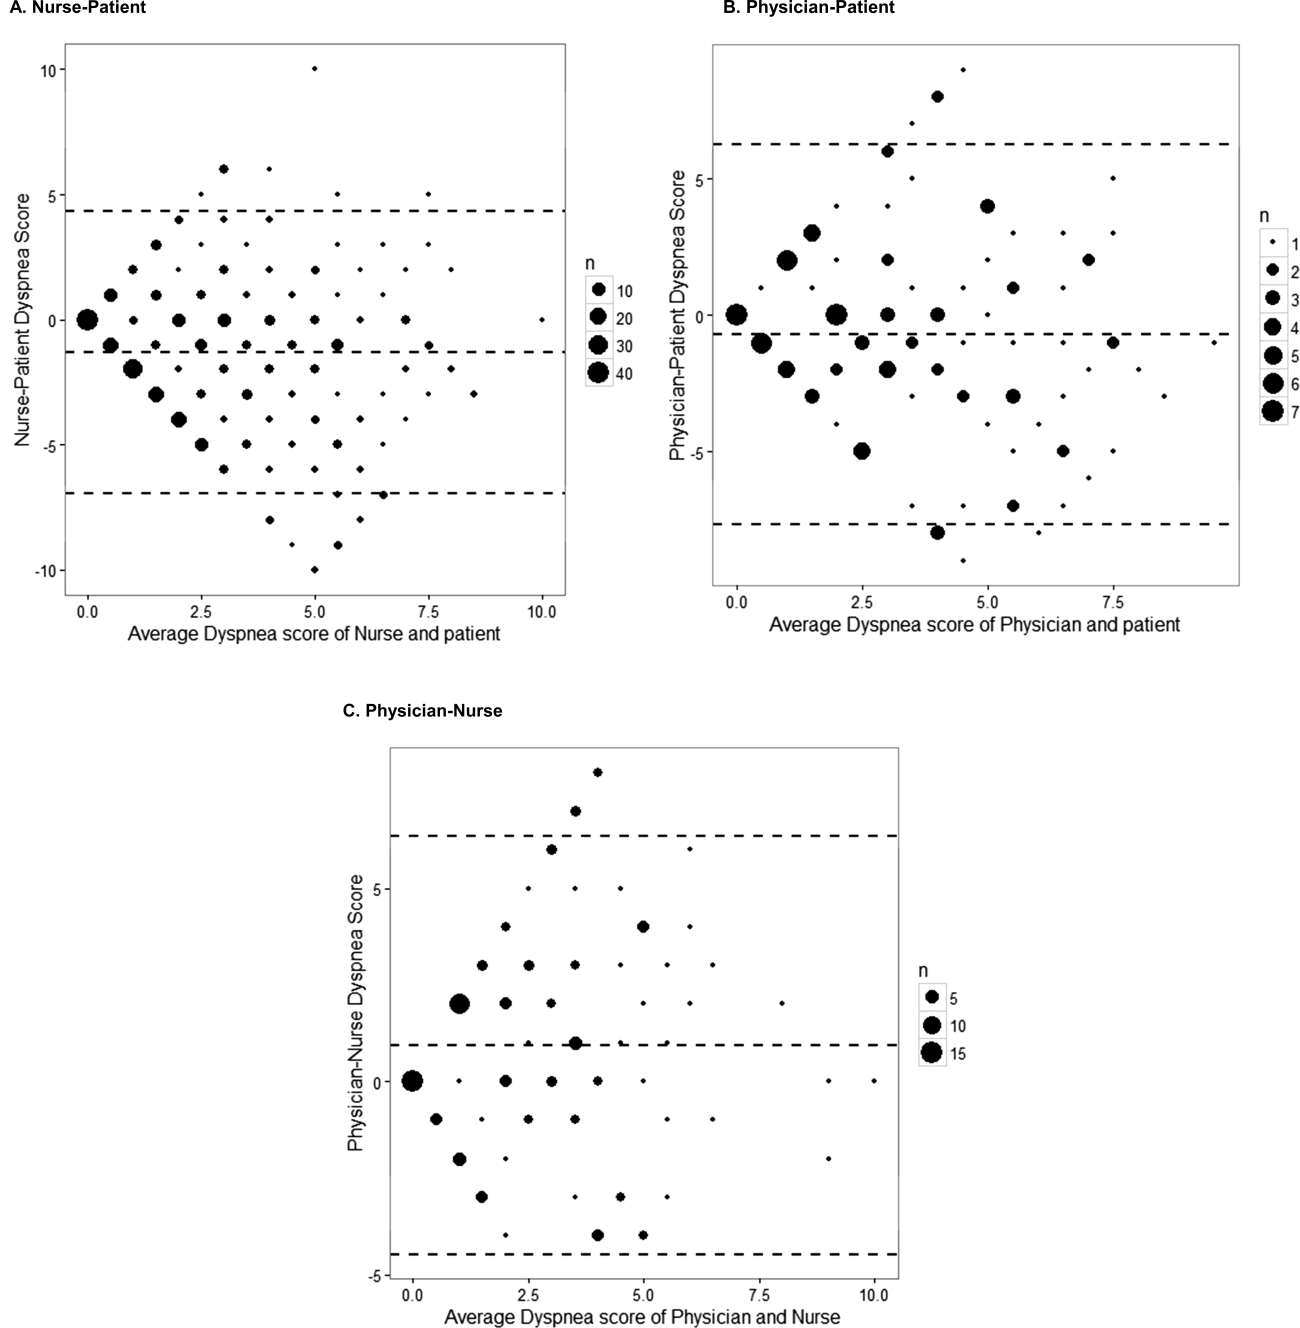
The weighted kappa coefficient for agreement was 0.11 (95% confidence interval [CI]: 0.01 to 0.21) for patient‐physician assessment, 0.18 (95% CI: 0.12 to 0.24) for patient‐nurse, and 0.09 (0.02 to 0.20) for physician‐nurse indicating poor agreement. In a sensitivity analysis in which we used a higher threshold for defining discordance (difference of more than 2 points), the kappa coefficient increased to 0.21 (95% CI: 0.06 to 0.36) for patient‐physician assessments, to 0.24 (95% CI: 0.15 to 0.33) for patient‐nurse, and to 0.24 (95% CI: 0.09 to 0.39) for nurse‐physician assessments.
Predictors of Discordance and Underestimation of Dyspnea Severity Assessment
Principal diagnosis was the only factor associated with the physicians' discordant assessment of patients' dyspnea. Patients with admission diagnoses other than HF, COPD, or pneumonia (eg, pulmonary embolism) were more likely to have an accurate assessment of their dyspnea by providers (Table 3). Similar results were obtained in the sensitivity analysis by using a higher cutoff for defining discordance and when assessing predictors for underestimation (results not shown).
| Modeling Probability of Discordance | ||
|---|---|---|
| Physician‐Patient Dyads, OR (95% CI), N = 124 | Nurse‐Patient Dyads, OR (95% CI), N = 363 | |
| ||
| Univariate Analysis | ||
| Body mass index | 1.00 (0.991.01) | 1.00 (0.991.00) |
| Comorbidity score | 1.01 (0.981.05) | 0.99 (0.961.01) |
| Respiratory rate at admission | 1.00 (0.991.02) | 0.99 (0.981.00) |
| Oxygen saturation at admission | 1.00 (1.001.00) | 1.00 (1.001.00) |
| Age (binary) | ||
| 65 years | Referent | Referent |
| >65 years | 1.21 (0.572.55) | 0.96 (0.571.64) |
| Gender | ||
| Female | Referent | Referent |
| Male | 1.10 (0.522.32) | 0.81 (0.481.37) |
| Race | ||
| White | Referent | Referent |
| Nonwhite | 1.02 (0.442.37) | 1.06 (0.581.95) |
| Obese (BMI >30) | 1.43 (0.663.11) | 0.76 (0.441.30) |
| Smoker | 1.36 (0.613.05) | 1.04 (0.591.85) |
| Admitting diagnosis | ||
| Heart failure | Referent | Referent |
| COPD/asthma | 0.68 (0.251.83) | 1.91 (0.983.73)* |
| Pneumonia | 0.38 (0.101.40) | 1.07 (0.462.45) |
| Other | 0.30 (0.110.82)* | 1.54 (0.763.11) |
| Depression | 1.21 (0.572.55) | 1.01 (0.541.86) |
| Multivariable analysis | ||
| Admitting diagnosis | ||
| Congestive heart failure | Referent | Referent |
| COPD | 0.68 (0.251.83) | 1.91 (0.983.73)* |
| Pneumonia | 0.38 (0.101.40) | 1.07 (0.462.45) |
| Other | 0.30 (0.110.82)* | 1.54 (0.763.11) |
In the multivariable analysis that assessed patient‐nurse dyads, the diagnosis of COPD was associated with a marginally significant likelihood of discordance (OR: 1.91; 95% CI: 0.98 to 3.73) (Table 3). Similarly, multivariable analysis identified principal diagnosis to be the only predictor of underestimation, and COPD diagnosis was associated with increased odds of dyspnea underestimation by nurses. When we used a higher cutoff to define discordance, the principal diagnosis of COPD (OR: 3.43, 95% CI: 1.76 to 6.69) was associated with an increased risk of discordance, and smoking (OR: 0.54, 95% CI: 0.29 to 0.99) was associated with a decreased risk of discordance. Overall, 45 patients (32.6%) were discharged on oxygen. The odds of discrepancy (under‐ or overestimation) in dyspnea scores between patient and nurse were 1.7 times higher compared to patients who were not discharged on oxygen, but this association did not reach statistical significance; the odds of discrepancy between patient and physician were 3.88 (95% CI: 1.07 to 14.13).
Documentation of Dyspnea
We found that dyspnea was mentioned in the admission notes in 96% of the charts reviewed; physicians used a qualitative rating (mild, moderate, or severe) to indicate the severity of dyspnea in only 16% of cases, and in 53% a descriptor was added (eg, dyspnea with climbing stairs, gradually increased in the prior week). Nurses were more likely than physicians to use qualitative ratings of dyspnea (26% of cases), and they used a more uniform description of the patient's dyspnea (eg, at rest, at rest and on exertion, or on exertion) than physicians. At discharge, 83% of physicians noted in their discharge summary that dyspnea improved compared with admission but did not refer to the patient's baseline level of dyspnea.
DISCUSSION
In this prospective study of 138 patients hospitalized with cardiopulmonary disease, we found that the agreement between patient's experience of dyspnea and providers' assessment was poor, and the discordance was higher for physicians than for nurses. In more than half of the cases, differences between patient and healthcare providers' assessment of dyspnea were present. One‐third of the time, both physicians and nurses underestimated patients' reported levels of dyspnea. Admitting diagnosis was the only patient factor predicting lack of agreement, and patients with COPD were more likely to have their dyspnea underestimated by nurses. Healthcare providers predominantly documented the presence or absence of dyspnea and rarely used a more nuanced scale.
Discrepancies between patient and provider assessments for pain, depression, and overall health have been reported.[8, 18, 19, 20, 21] One explanation is that patients and healthcare providers measure different factors despite using the same terminology. Furthermore, patient's assessment may be confounded by other symptoms such as anxiety, fatigue, or pain. Physicians and nurses may underevaluate and underestimate the level of breathlessness; however, from the physician perspective, dyspnea is only 1 data point, and providers rely on other measures, such as oxygen saturation, heart rate, respiratory rate, evidence of increasing breathing effort, and arterial blood gas to drive decision making. In a recent study that evaluated the attitudes and beliefs of hospitalists regarding the assessment and management of dyspnea, we found that most hospitalists indicated that awareness of dyspnea severity influences their decision for treatment, diagnostic testing, and timing of the discharge. Moreover, whereas less than half of the respondents reported experience with standardized assessment of dyspnea severity, most stated that such data would be very useful in their practice.[22]
What is the clinical significance of having discordance between patients self‐assessment and providers impression of the patient's severity of dyspnea? First, inaccurate assessment of dyspnea by providers can lead to inadequate treatment and workup. For example, a physician who underestimates the severity of dyspnea may fail to recognize when a complication of the underlying disease develops or may underutilize symptomatic methods for relief of dyspnea. In contrast, a physician who overestimates dyspnea may continue with aggressive treatment when this is not necessary. Second, lack of awareness of dyspnea severity experienced by the patient may result in premature discharge and patient's frustration with the provider, as was shown in several studies evaluating physician‐patient agreement for pain perception.[21, 23] We found that discrepancy between patients and healthcare providers was more pronounced for patients with COPD. In another study using the same patient cohort, we reported that compared to patients with congestive heart failure, those with COPD had more residual dyspnea at discharge; 1 in 4 patients was discharged with a dyspnea score of 5 of greater, and almost half reported symptoms above their baseline.[24] The results from the current study may explain in part why patients with COPD are discharged with higher levels of dyspnea and should alert healthcare providers on the importance of patient‐reported breathlessness. Third, the high level of discordance between healthcare providers and patients may explain the undertreatment of dyspnea in patients with advanced disease. This is supported by our findings that the discordance between patients and physicians was higher if the patient was discharged on oxygen.
One key role of the provider during a clinical encounter is to elicit the patient's symptoms and achieve a shared understanding of what the patient is experiencing. From the patient's perspective, their self‐assessment of dyspnea is more important that the physician's assessment. Fortunately, there is a growing recognition and emphasis on using outcomes that matter to patients, such as dyspnea, to inform judgment about patient care and for clinical research. Numerical measures for assessment of dyspnea exist, are easy to use, and are sensitive to change in patients' dyspnea.[6, 25, 26, 27] Still, it is not standard practice for healthcare providers to ask patients to provide a rating of their dyspnea. When we examined the documentation of dyspnea in the medical record, we found that the description was vague, and providers did not use a standardized validated assessment. Although the dyspnea score decreased during hospitalization, the respiratory rate did not significantly change, indicating that this objective measure may not be reliable in patient assessment. The providers' knowledge of the intensity of the symptom expressed by patients will enable them to track improvement in symptoms over time or in response to therapy. In addition, in this era of multiple handoffs within a hospitalization or from primary care to the hospital, a more uniform assessment could allow providers to follow the severity and time course of dyspnea. The low level of agreement we found between patients and the providers lends support to recommendations regarding a structured dyspnea assessment into routine hospital practice.
Study Strengths and Limitations
This study has several strengths. This is 1 of the very few studies to report on the level of agreement between patients' and providers' assessments of dyspnea. We used a validated, simple dyspnea scale that provides consistency in rating.[28, 29] We enrolled patients with a broad set of diagnoses and complaints, which increases the generalizability of our results, and we surveyed both physicians and nurses. Last, our findings were robust across different cutoff points utilized to characterize discordance and across 3 frequent diagnoses.
The study has several limitations. First, we included only English‐speaking patients, and the results cannot be generalized to patients from other cultures who do not speak English. Second, this is a single‐center study, and practices may be different in other centers; for example, some hospitals may have already implemented a dyspnea assessment tool. Third, we did not collect information on the physician and nurse characteristics such as years in practice. However, a recent study that describes the agreement of breathlessness assessment between nurses, physicians, and mechanically ventilated patients found that underestimation of breathlessness by providers was not associated with professional competencies, previous patient care, or years of working in an intensive care unit.[9] In addition, a systematic review found that length of professional experience is often unrelated to performance measures and outcomes.[30] Finally, although we asked for physicians and nurses assessment close to their visit to the patient, assessment was done from memory, not at the bedside observing the patient.
CONCLUSION
We found that the extent of agreement between a structured patient self‐assessment of dyspnea and healthcare providers' assessment was low. Future studies should prospectively test whether routine assessment of dyspnea results in better acute and long‐term patient outcomes.
Acknowledgements
The authors acknowledge Ms. Anu Joshi for her help with formatting the manuscript and assisting with table preparations. The authors also acknowledge Ms. Katherine Dempsey, Jahnavi Sagi, Sashi Ariyaratne, and Mr. Pradeep Kumbaham for their help with collecting the data.
Disclosures: M.S.S. is the guarantor for this article and had full access to all of the data in the study, and takes responsibility for the integrity and accuracy of the data analysis. M.S.S., P.K.L., E.N., and M.B.R. conceived of the study. M.S.S. and B.M. acquired the data. M.S.S., A.P., P.S.P., R.J.G., and P.K.L. analyzed and interpreted the data. M.S.S. drafted the manuscript. All authors critically reviewed the manuscript for intellectual content. M.S.S. is supported by grant 1K01HL114631‐01A1 from the National Heart, Lung, and Blood Institute of the National Institutes of Health and by the National Center for Research Resources and the National Center for Advancing Translational Sciences, National Institutes of Health, through grant UL1RR025752. The authors report no conflicts of interest.
- , , , et al. An official American Thoracic Society statement: update on the mechanisms, assessment, and management of dyspnea. Am J Respir Crit Care Med. 2012;185(4):435–452.
- , , . National Hospital Ambulatory Medical Care Survey: 2007 emergency department summary. Natl Health Stat Report. 2010;(26):1–31.
- , , , et al. The body‐mass index, airflow obstruction, dyspnea, and exercise capacity index in chronic obstructive pulmonary disease. N Engl J Med. 2004;350(10):1005–1012.
- , , , . Dyspnea is a better predictor of 5‐year survival than airway obstruction in patients with COPD. Chest. 2002;121(5):1434–1440.
- , , . A multidimensional grading system (BODE index) as predictor of hospitalization for COPD. Chest. 2005;128(6):3810–3816.
- , , , et al. American College of Chest Physicians consensus statement on the management of dyspnea in patients with advanced lung or heart disease. Chest. 2010;137(3):674–691.
- , , , et al. Managing dyspnea in patients with advanced chronic obstructive pulmonary disease: a Canadian Thoracic Society clinical practice guideline. Can Respir J. 2011;18(2):69–78.
- , , . Physician vs patient assessment of dyspnea during acute decompensated heart failure. Congest Heart Fail. 2010;16(2):60–64.
- , , , , , . Underestimation of Patient Breathlessness by Nurses and Physicians during a Spontaneous Breathing Trial. Am J Respir Crit Care Med. 2015;192(12):1440–1448.
- , , , , , . The influence of patient‐practitioner agreement on outcome of care. Am J Public Health. 1981;71(2):127–131.
- , , , , , . Listening to parents: The role of symptom perception in pediatric palliative home care. Palliat Support Care. 2016;14(1):13–19.
- , . Validity of the numeric rating scale as a measure of dyspnea. Am J Crit Care. 1998;7(3):200–204.
- , , , , , . Dyspnea scales in the assessment of illiterate patients with chronic obstructive pulmonary disease. Am J Med Sci. 2000;320(4):240–243.
- , , , , . Measuring the dyspnea of decompensated heart failure with a visual analog scale: how much improvement is meaningful? Congest Heart Fail. 2004;10(4):188–191.
- , , , , , . Clinically meaningful changes in quantitative measures of asthma severity. Acad Emerg Med. 2000;7(4):327–334.
- , , , , . A combined comorbidity score predicted mortality in elderly patients better than existing scores. J Clin Epidemiol. 2011;64(7):749–759.
- . BlandAltmanLeh: plots (slightly extended) Bland‐Altman plots. Available at: https://cran.r‐project.org/web/packages/BlandAltmanLeh/index.html. Published December 23, 2015. Accessed March 10, 2016.
- , , , , . Correlation of patient and caregiver ratings of cancer pain. J Pain Symptom Manage. 1991;6(2):53–57.
- , , , et al. Depression symptomatology and diagnosis: discordance between patients and physicians in primary care settings. BMC Fam Pract. 2008;9:1.
- , , , , , . Patient‐physician discordance in assessments of global disease severity in rheumatoid arthritis. Arthritis Care Res (Hoboken) 2010;62(6):857–864.
- , , , et al. The influence of discordance in pain assessment on the functional status of patients with chronic nonmalignant pain. Am J Med Sci. 2006;332(1):18–23.
- , , , et al. Hospitalist attitudes toward the assessment and management of dyspnea in patients with acute cardiopulmonary diseases. J Hosp Med. 2015;10(11):724–730.
- , , , , . Brief report: patient‐physician agreement as a predictor of outcomes in patients with back pain. J Gen Intern Med. 2005;20(10):935–937.
- , , , , , . The trajectory of dyspnea in hospitalized patients [published online November 24, 2015]. J Pain Symptom Manage. doi: 10.1016/j.jpainsymman.2015.11.005.
- , , , , . Measurement of breathlessness in advanced disease: a systematic review. Respir Med. 2007;101(3):399–410.
- . Review of dyspnoea quantification in the emergency department: is a rating scale for breathlessness suitable for use as an admission prediction tool? Emerg Med Australas. 2007;19(5):394–404.
- , , , . Validation of a verbal dyspnoea rating scale in the emergency department. Emerg Med Australas. 2008;20(6):475–481.
- , , . Measurement of dyspnea: word labeled visual analog scale vs. verbal ordinal scale. Respir Physiol Neurobiol. 2003;134(2):77–83.
- , , , , , . Verbal numerical scales are as reliable and sensitive as visual analog scales for rating dyspnea in young and older subjects. Respir Physiol Neurobiol. 2007;157(2–3):360–365.
- , , . Systematic review: the relationship between clinical experience and quality of health care. Ann Intern Med. 2005;142(4):260–273.
Breathlessness, or dyspnea, is defined as a subjective experience of breathing discomfort that is comprised of qualitatively distinct sensations that vary in intensity.[1] Dyspnea is a leading reason for patients presenting for emergency care,[2] and it is an important predictor for hospitalization and mortality in patients with cardiopulmonary disease.[3, 4, 5]
Several professional societies' guidelines recommend that patients should be asked to quantify the intensity of their breathlessness using a standardized scale, and that these ratings should be documented in medical records to guide dyspnea awareness and management.[1, 6, 7] During the evaluation and treatment of patients with acute cardiopulmonary conditions, the clinician estimates the severity of the illness and response to therapy based on multiple objective measures as well as the patient's perception of dyspnea. A patient‐centered care approach depends upon the physicians having a shared understanding of what the patient is experiencing. Without this appreciation, the healthcare provider cannot make appropriate treatment decisions to ensure alleviation of presenting symptoms. Understanding the severity of patients' dyspnea is critical to avoid under‐ or overtreatment of patients with acute cardiopulmonary conditions, but only a few studies have compared patient and provider perceptions of dyspnea intensity.[8, 9] Discordance between physician's impression of severity of dyspnea and patient's perception may result in suboptimal management and patient dissatisfaction with care. Furthermore, several studies have shown that, when physicians and patients agree with the assessment of well‐being, treatment adherence and outcomes improve.[10, 11]
Therefore, we evaluated the extent and directionality of agreement between patients' perception and healthcare providers' impression of dyspnea and explored which factors contribute to discordance. Additionally, we examined how healthcare providers document dyspnea severity.
METHODS
Study Setting and Population
The study was conducted between June 2012 and August 2012 at Baystate Medical Center (BMC), a 740‐bed tertiary care hospital in western Massachusetts. In 2012, the BMC hospitalist group had 48 attending physicians, of whom 47% were female, 48% had 0 to 3 years of attending experience, and 16% had 10 years of experience.
We enrolled consecutive admissions of English‐speaking adult patients, with a working diagnosis of heart failure (HF), chronic obstructive pulmonary disease (COPD), asthma, pneumonia, or a generic diagnosis of shortness of breath. Because we surveyed only hospitalists, we did not include patients admitted to an intensive care unit.
All participants gave informed consent to be part of the study. The research protocol was approved by the Baystate Health Institutional Review Board, Springfield, Massachusetts.
Dyspnea Assessment
Dyspnea intensity was assessed on an 11‐point (010) numerical rating scale (NRS).[12, 13] A trained research assistant interviewed patients on day 1 and 2 after admission, and on the day of discharge between 8 am and 12 pm on weekdays. The patient was asked: On a scale from 0 to 10, how bad is your shortness of breath at rest now, with 0 being no shortness of breath and 10 the worst shortness of breath you could ever imagine? The hospitalist or the senior resident and day‐shift nurse taking care of the patients were asked by the research assistant to rate the patient's dyspnea using the same scoring instrument shortly after they saw the patient. The physicians and nurses based their determination of dyspnea on their usual interview/examination of the patient. The patient, physician and the nurse were not aware of each other's rating. The research assistant scheduled the interviews to minimize the time intervals between the patient assessment and provider's rating. For this reason, the number of assessments per patient varied. Nurses were more readily available than physicians, which resulted in a larger number of patient‐nurse response pairs than patient‐physician pairs. All assessments were done in the morning, between 9 am and 12 pm, with a range of 3 hours between provider's assessment of the patient and the interview.
Dyspnea Agreement
Agreement was defined as a score within 1 between patient and healthcare provider; differences of 2 points were considered over‐ or underestimations. The decision to use this cutoff was based on prior studies, which found that a difference in the range of 1.6 to 2.2 cm was meaningful for the patient when assessment was done on the visual analog scale.[8, 14, 15] We also evaluated the direction of discordance. If the patient's rating of dyspnea severity was higher than the provider's rating, we defined this as underestimation by the provider; in the instance where a provider's score of dyspnea severity was higher than the patient's score, we defined this as overestimation. In a sensitivity analysis, agreement was defined as a score within 2 between patient and healthcare provider, and any difference 3 was considered disagreement.
Other Variables
We obtained information from the medical records about patient demographics, body mass index (BMI), smoking status, and vital signs. We calculated the oxygen saturation index as the ratio between the oxygen saturation and the fractional inspired oxygen (SpO2/FIO2). Comorbidities were assessed based on the International Classification od Diseases, Ninth Revision, Clinical Modification codes from the hospital financial decision support system. We calculated an overall combined comorbidity score based on the method described by Gagne, which is based on elements from the Charlson Comorbidity Index and from the Elixhauser comorbidities.[16]
Charts of the patients included in the study were retrospectively reviewed for physicians' and nurses' documentation of dyspnea at admission and at discharge. We recorded if dyspnea was mentioned and how it was assessed: whether it was described as present/absent; graded as mild, moderate, or severe; used a quantitative scale (010); used descriptors (eg, dyspnea when climbing stairs); and whether it was defined as improved or worsened without other qualifiers.
Statistical Analysis
Descriptive statistics of dyspnea scores, patient characteristics, comorbidities and vital signs were calculated and presented as medians with interquartile range (IQR) for continuous variables, and counts with percentages for categorical factors. Every patient‐provider concurrent scoring was included in the analysis as 1 dyad, which resulted in patients being included multiple times in the analysis. Patient‐physician and patient‐nurse dyads of dyspnea assessment were examined separately. Analyses included all dyads that were within same assessment period (same day and same time window).
The relationship between patient self‐perceived dyspnea severity and provider rating of was assessed in several ways. First, a weighted kappa coefficient was used as a measure of agreement between patient and nurse or physician scores. A weighted kappa analysis was chosen because it penalizes disagreements that are further apart from each other.
Second, we defined an indicator of discordance and constructed multivariable generalized estimating equation models that account for clustering of multiple dyads per patient, to assess the relationship of patient characteristics with discordance. Finally, we developed additional models to predict underestimation when compared to agreement or overestimation of dyspnea by the healthcare provider relative to the patient. Using the same definitions for agreement, we also compared the dyspnea assessment estimation between physicians and nurses.
We present the differences in dyspnea assessment between patient and healthcare provider and between nurses and physicians by Bland‐Altman plots.
All analyses were performed using SAS (version 9.3; SAS institute, Inc., Cary, NC), Stata (Stata statistical software release 13; StataCorp, College Station, TX), and RStudio version 0.99.892 (Bland‐Altman plots, R package version 0.3.1; The R Foundation for Statistical Computing, Vienna, Austria).[8, 9, 17]
RESULTS
Patient Characteristics
Among the 219 patients who met the screening criteria, 81 were not enrolled (Figure 1). Data from 138 patients, with both patient information and provider data on dyspnea assessment, were included. The median age of the patients was 72 years (IQR, 5880 years), 56.5% were women, 75.4% were white, and 28.3% were current smokers. Approximately 30% had a diagnosis of HF, 30% of COPD, and 13.0% of pneumonia. The median comorbidity score was 4 (IQR, 26), and 37.0% of the patients had a BMI 30. At admission, the median oxygen saturation index was 346 (IQR, 287.5460) indicating mild to moderate levels of hypoxia. (Table 1).
| Value | |
|---|---|
| |
| Age, median (IQR), y | 72 (5880) |
| Gender | |
| Female | 78 (56.5) |
| Male | 60 (43.5) |
| Race | |
| White | 104 (75.4) |
| Black | 16 (11.6) |
| Hispanic | 17 (12.3) |
| Other | 1 (0.7) |
| Body mass index, median (IQR) | 28 (23.334.6) |
| Obese (BMI 30) | 51 (37.0) |
| Smoker, current | 39 (28.3) |
| Admitting diagnosis | |
| Heart failure | 46 (33.3) |
| COPD/asthma | 41 (29.7) |
| Pneumonia | 18 (13.0) |
| Other | 33 (23.9) |
| Depression | 32 (23.2) |
| Comorbidity score, median (IQR) | 4 (26) |
| Respiratory rate at admission, median (IQR) | 20 (1924) |
| Oxygen saturation index at admission, median (IQR) | 346.4 (287.5460) |
| Patient NRS, median (IQR) | |
| At admission | 9 (710) |
| At discharge | 2 (14) |
| Discharged on home oxygen | 45 (32.6) |
| Respiratory rate at discharge, median (IQR) | 20 (1820) |
| Oxygen saturation index at discharge, median (IQR) | 475 (350485) |
Agreement Between Patients' Self‐Assessment and Providers' Assessment of Dyspnea Severity
Not all patients had complete data points, and more nurses were interviewed than physicians. Overall, 96 patient‐physician and 138 patient‐nurse pairs participated in the study. A total of 336 patient‐nurse rating dyad assessments of dyspnea and 124 patient‐physician rating dyads assessments were collected (Figure 1). The mean difference between patient and physicians and patient and nurses assessments of dyspnea was 1.23 (IQR, 3 to 0) and 0.21 (IQR, 2 to 2) respectively (a negative score means underestimation by the provider, a positive score means overestimation).
The unadjusted agreement on the severity of dyspnea was 36.3% for the patient‐physician dyads and 44.1% for the patient‐nurse dyads. Physicians underestimated their patients' dyspnea 37.9% of the time and overestimated it 25.8% of the time; nurses underestimated it 43.5% of the time and overestimated it in 12.4% of the study patients (Table 2). In 28.2% of the time, physicians were discordant more than 4 points of the patient assessment. Bland‐Altman plots show that there is greater variation in differences of dyspnea assessments with increase in shortness of breath scores (Figure 2). Nurses underestimated more when the dyspnea score was on the lower end. Physicians also tended to estimate either lower or higher when compared to patients when the dyspnea scores were <2 (Figure 2A,B).
| Underestimation | Concordance | Overestimation | |||||||
|---|---|---|---|---|---|---|---|---|---|
| 3 | 2 | %* | 0 | 1 | % | 2 | 3 | % | |
| |||||||||
| Patient‐nurse dyads | 110 | 48 | 43.5 | 82 | 78 | 44.1 | 17 | 28 | 12.4 |
| Patient‐physician dyads | 33 | 14 | 37.9 | 21 | 24 | 36.3 | 12 | 20 | 25.8 |
The weighted kappa coefficient for agreement was 0.11 (95% confidence interval [CI]: 0.01 to 0.21) for patient‐physician assessment, 0.18 (95% CI: 0.12 to 0.24) for patient‐nurse, and 0.09 (0.02 to 0.20) for physician‐nurse indicating poor agreement. In a sensitivity analysis in which we used a higher threshold for defining discordance (difference of more than 2 points), the kappa coefficient increased to 0.21 (95% CI: 0.06 to 0.36) for patient‐physician assessments, to 0.24 (95% CI: 0.15 to 0.33) for patient‐nurse, and to 0.24 (95% CI: 0.09 to 0.39) for nurse‐physician assessments.
Predictors of Discordance and Underestimation of Dyspnea Severity Assessment
Principal diagnosis was the only factor associated with the physicians' discordant assessment of patients' dyspnea. Patients with admission diagnoses other than HF, COPD, or pneumonia (eg, pulmonary embolism) were more likely to have an accurate assessment of their dyspnea by providers (Table 3). Similar results were obtained in the sensitivity analysis by using a higher cutoff for defining discordance and when assessing predictors for underestimation (results not shown).
| Modeling Probability of Discordance | ||
|---|---|---|
| Physician‐Patient Dyads, OR (95% CI), N = 124 | Nurse‐Patient Dyads, OR (95% CI), N = 363 | |
| ||
| Univariate Analysis | ||
| Body mass index | 1.00 (0.991.01) | 1.00 (0.991.00) |
| Comorbidity score | 1.01 (0.981.05) | 0.99 (0.961.01) |
| Respiratory rate at admission | 1.00 (0.991.02) | 0.99 (0.981.00) |
| Oxygen saturation at admission | 1.00 (1.001.00) | 1.00 (1.001.00) |
| Age (binary) | ||
| 65 years | Referent | Referent |
| >65 years | 1.21 (0.572.55) | 0.96 (0.571.64) |
| Gender | ||
| Female | Referent | Referent |
| Male | 1.10 (0.522.32) | 0.81 (0.481.37) |
| Race | ||
| White | Referent | Referent |
| Nonwhite | 1.02 (0.442.37) | 1.06 (0.581.95) |
| Obese (BMI >30) | 1.43 (0.663.11) | 0.76 (0.441.30) |
| Smoker | 1.36 (0.613.05) | 1.04 (0.591.85) |
| Admitting diagnosis | ||
| Heart failure | Referent | Referent |
| COPD/asthma | 0.68 (0.251.83) | 1.91 (0.983.73)* |
| Pneumonia | 0.38 (0.101.40) | 1.07 (0.462.45) |
| Other | 0.30 (0.110.82)* | 1.54 (0.763.11) |
| Depression | 1.21 (0.572.55) | 1.01 (0.541.86) |
| Multivariable analysis | ||
| Admitting diagnosis | ||
| Congestive heart failure | Referent | Referent |
| COPD | 0.68 (0.251.83) | 1.91 (0.983.73)* |
| Pneumonia | 0.38 (0.101.40) | 1.07 (0.462.45) |
| Other | 0.30 (0.110.82)* | 1.54 (0.763.11) |
In the multivariable analysis that assessed patient‐nurse dyads, the diagnosis of COPD was associated with a marginally significant likelihood of discordance (OR: 1.91; 95% CI: 0.98 to 3.73) (Table 3). Similarly, multivariable analysis identified principal diagnosis to be the only predictor of underestimation, and COPD diagnosis was associated with increased odds of dyspnea underestimation by nurses. When we used a higher cutoff to define discordance, the principal diagnosis of COPD (OR: 3.43, 95% CI: 1.76 to 6.69) was associated with an increased risk of discordance, and smoking (OR: 0.54, 95% CI: 0.29 to 0.99) was associated with a decreased risk of discordance. Overall, 45 patients (32.6%) were discharged on oxygen. The odds of discrepancy (under‐ or overestimation) in dyspnea scores between patient and nurse were 1.7 times higher compared to patients who were not discharged on oxygen, but this association did not reach statistical significance; the odds of discrepancy between patient and physician were 3.88 (95% CI: 1.07 to 14.13).
Documentation of Dyspnea
We found that dyspnea was mentioned in the admission notes in 96% of the charts reviewed; physicians used a qualitative rating (mild, moderate, or severe) to indicate the severity of dyspnea in only 16% of cases, and in 53% a descriptor was added (eg, dyspnea with climbing stairs, gradually increased in the prior week). Nurses were more likely than physicians to use qualitative ratings of dyspnea (26% of cases), and they used a more uniform description of the patient's dyspnea (eg, at rest, at rest and on exertion, or on exertion) than physicians. At discharge, 83% of physicians noted in their discharge summary that dyspnea improved compared with admission but did not refer to the patient's baseline level of dyspnea.
DISCUSSION
In this prospective study of 138 patients hospitalized with cardiopulmonary disease, we found that the agreement between patient's experience of dyspnea and providers' assessment was poor, and the discordance was higher for physicians than for nurses. In more than half of the cases, differences between patient and healthcare providers' assessment of dyspnea were present. One‐third of the time, both physicians and nurses underestimated patients' reported levels of dyspnea. Admitting diagnosis was the only patient factor predicting lack of agreement, and patients with COPD were more likely to have their dyspnea underestimated by nurses. Healthcare providers predominantly documented the presence or absence of dyspnea and rarely used a more nuanced scale.
Discrepancies between patient and provider assessments for pain, depression, and overall health have been reported.[8, 18, 19, 20, 21] One explanation is that patients and healthcare providers measure different factors despite using the same terminology. Furthermore, patient's assessment may be confounded by other symptoms such as anxiety, fatigue, or pain. Physicians and nurses may underevaluate and underestimate the level of breathlessness; however, from the physician perspective, dyspnea is only 1 data point, and providers rely on other measures, such as oxygen saturation, heart rate, respiratory rate, evidence of increasing breathing effort, and arterial blood gas to drive decision making. In a recent study that evaluated the attitudes and beliefs of hospitalists regarding the assessment and management of dyspnea, we found that most hospitalists indicated that awareness of dyspnea severity influences their decision for treatment, diagnostic testing, and timing of the discharge. Moreover, whereas less than half of the respondents reported experience with standardized assessment of dyspnea severity, most stated that such data would be very useful in their practice.[22]
What is the clinical significance of having discordance between patients self‐assessment and providers impression of the patient's severity of dyspnea? First, inaccurate assessment of dyspnea by providers can lead to inadequate treatment and workup. For example, a physician who underestimates the severity of dyspnea may fail to recognize when a complication of the underlying disease develops or may underutilize symptomatic methods for relief of dyspnea. In contrast, a physician who overestimates dyspnea may continue with aggressive treatment when this is not necessary. Second, lack of awareness of dyspnea severity experienced by the patient may result in premature discharge and patient's frustration with the provider, as was shown in several studies evaluating physician‐patient agreement for pain perception.[21, 23] We found that discrepancy between patients and healthcare providers was more pronounced for patients with COPD. In another study using the same patient cohort, we reported that compared to patients with congestive heart failure, those with COPD had more residual dyspnea at discharge; 1 in 4 patients was discharged with a dyspnea score of 5 of greater, and almost half reported symptoms above their baseline.[24] The results from the current study may explain in part why patients with COPD are discharged with higher levels of dyspnea and should alert healthcare providers on the importance of patient‐reported breathlessness. Third, the high level of discordance between healthcare providers and patients may explain the undertreatment of dyspnea in patients with advanced disease. This is supported by our findings that the discordance between patients and physicians was higher if the patient was discharged on oxygen.
One key role of the provider during a clinical encounter is to elicit the patient's symptoms and achieve a shared understanding of what the patient is experiencing. From the patient's perspective, their self‐assessment of dyspnea is more important that the physician's assessment. Fortunately, there is a growing recognition and emphasis on using outcomes that matter to patients, such as dyspnea, to inform judgment about patient care and for clinical research. Numerical measures for assessment of dyspnea exist, are easy to use, and are sensitive to change in patients' dyspnea.[6, 25, 26, 27] Still, it is not standard practice for healthcare providers to ask patients to provide a rating of their dyspnea. When we examined the documentation of dyspnea in the medical record, we found that the description was vague, and providers did not use a standardized validated assessment. Although the dyspnea score decreased during hospitalization, the respiratory rate did not significantly change, indicating that this objective measure may not be reliable in patient assessment. The providers' knowledge of the intensity of the symptom expressed by patients will enable them to track improvement in symptoms over time or in response to therapy. In addition, in this era of multiple handoffs within a hospitalization or from primary care to the hospital, a more uniform assessment could allow providers to follow the severity and time course of dyspnea. The low level of agreement we found between patients and the providers lends support to recommendations regarding a structured dyspnea assessment into routine hospital practice.
Study Strengths and Limitations
This study has several strengths. This is 1 of the very few studies to report on the level of agreement between patients' and providers' assessments of dyspnea. We used a validated, simple dyspnea scale that provides consistency in rating.[28, 29] We enrolled patients with a broad set of diagnoses and complaints, which increases the generalizability of our results, and we surveyed both physicians and nurses. Last, our findings were robust across different cutoff points utilized to characterize discordance and across 3 frequent diagnoses.
The study has several limitations. First, we included only English‐speaking patients, and the results cannot be generalized to patients from other cultures who do not speak English. Second, this is a single‐center study, and practices may be different in other centers; for example, some hospitals may have already implemented a dyspnea assessment tool. Third, we did not collect information on the physician and nurse characteristics such as years in practice. However, a recent study that describes the agreement of breathlessness assessment between nurses, physicians, and mechanically ventilated patients found that underestimation of breathlessness by providers was not associated with professional competencies, previous patient care, or years of working in an intensive care unit.[9] In addition, a systematic review found that length of professional experience is often unrelated to performance measures and outcomes.[30] Finally, although we asked for physicians and nurses assessment close to their visit to the patient, assessment was done from memory, not at the bedside observing the patient.
CONCLUSION
We found that the extent of agreement between a structured patient self‐assessment of dyspnea and healthcare providers' assessment was low. Future studies should prospectively test whether routine assessment of dyspnea results in better acute and long‐term patient outcomes.
Acknowledgements
The authors acknowledge Ms. Anu Joshi for her help with formatting the manuscript and assisting with table preparations. The authors also acknowledge Ms. Katherine Dempsey, Jahnavi Sagi, Sashi Ariyaratne, and Mr. Pradeep Kumbaham for their help with collecting the data.
Disclosures: M.S.S. is the guarantor for this article and had full access to all of the data in the study, and takes responsibility for the integrity and accuracy of the data analysis. M.S.S., P.K.L., E.N., and M.B.R. conceived of the study. M.S.S. and B.M. acquired the data. M.S.S., A.P., P.S.P., R.J.G., and P.K.L. analyzed and interpreted the data. M.S.S. drafted the manuscript. All authors critically reviewed the manuscript for intellectual content. M.S.S. is supported by grant 1K01HL114631‐01A1 from the National Heart, Lung, and Blood Institute of the National Institutes of Health and by the National Center for Research Resources and the National Center for Advancing Translational Sciences, National Institutes of Health, through grant UL1RR025752. The authors report no conflicts of interest.
- , , , et al. An official American Thoracic Society statement: update on the mechanisms, assessment, and management of dyspnea. Am J Respir Crit Care Med. 2012;185(4):435–452.
- , , . National Hospital Ambulatory Medical Care Survey: 2007 emergency department summary. Natl Health Stat Report. 2010;(26):1–31.
- , , , et al. The body‐mass index, airflow obstruction, dyspnea, and exercise capacity index in chronic obstructive pulmonary disease. N Engl J Med. 2004;350(10):1005–1012.
- , , , . Dyspnea is a better predictor of 5‐year survival than airway obstruction in patients with COPD. Chest. 2002;121(5):1434–1440.
- , , . A multidimensional grading system (BODE index) as predictor of hospitalization for COPD. Chest. 2005;128(6):3810–3816.
- , , , et al. American College of Chest Physicians consensus statement on the management of dyspnea in patients with advanced lung or heart disease. Chest. 2010;137(3):674–691.
- , , , et al. Managing dyspnea in patients with advanced chronic obstructive pulmonary disease: a Canadian Thoracic Society clinical practice guideline. Can Respir J. 2011;18(2):69–78.
- , , . Physician vs patient assessment of dyspnea during acute decompensated heart failure. Congest Heart Fail. 2010;16(2):60–64.
- , , , , , . Underestimation of Patient Breathlessness by Nurses and Physicians during a Spontaneous Breathing Trial. Am J Respir Crit Care Med. 2015;192(12):1440–1448.
- , , , , , . The influence of patient‐practitioner agreement on outcome of care. Am J Public Health. 1981;71(2):127–131.
- , , , , , . Listening to parents: The role of symptom perception in pediatric palliative home care. Palliat Support Care. 2016;14(1):13–19.
- , . Validity of the numeric rating scale as a measure of dyspnea. Am J Crit Care. 1998;7(3):200–204.
- , , , , , . Dyspnea scales in the assessment of illiterate patients with chronic obstructive pulmonary disease. Am J Med Sci. 2000;320(4):240–243.
- , , , , . Measuring the dyspnea of decompensated heart failure with a visual analog scale: how much improvement is meaningful? Congest Heart Fail. 2004;10(4):188–191.
- , , , , , . Clinically meaningful changes in quantitative measures of asthma severity. Acad Emerg Med. 2000;7(4):327–334.
- , , , , . A combined comorbidity score predicted mortality in elderly patients better than existing scores. J Clin Epidemiol. 2011;64(7):749–759.
- . BlandAltmanLeh: plots (slightly extended) Bland‐Altman plots. Available at: https://cran.r‐project.org/web/packages/BlandAltmanLeh/index.html. Published December 23, 2015. Accessed March 10, 2016.
- , , , , . Correlation of patient and caregiver ratings of cancer pain. J Pain Symptom Manage. 1991;6(2):53–57.
- , , , et al. Depression symptomatology and diagnosis: discordance between patients and physicians in primary care settings. BMC Fam Pract. 2008;9:1.
- , , , , , . Patient‐physician discordance in assessments of global disease severity in rheumatoid arthritis. Arthritis Care Res (Hoboken) 2010;62(6):857–864.
- , , , et al. The influence of discordance in pain assessment on the functional status of patients with chronic nonmalignant pain. Am J Med Sci. 2006;332(1):18–23.
- , , , et al. Hospitalist attitudes toward the assessment and management of dyspnea in patients with acute cardiopulmonary diseases. J Hosp Med. 2015;10(11):724–730.
- , , , , . Brief report: patient‐physician agreement as a predictor of outcomes in patients with back pain. J Gen Intern Med. 2005;20(10):935–937.
- , , , , , . The trajectory of dyspnea in hospitalized patients [published online November 24, 2015]. J Pain Symptom Manage. doi: 10.1016/j.jpainsymman.2015.11.005.
- , , , , . Measurement of breathlessness in advanced disease: a systematic review. Respir Med. 2007;101(3):399–410.
- . Review of dyspnoea quantification in the emergency department: is a rating scale for breathlessness suitable for use as an admission prediction tool? Emerg Med Australas. 2007;19(5):394–404.
- , , , . Validation of a verbal dyspnoea rating scale in the emergency department. Emerg Med Australas. 2008;20(6):475–481.
- , , . Measurement of dyspnea: word labeled visual analog scale vs. verbal ordinal scale. Respir Physiol Neurobiol. 2003;134(2):77–83.
- , , , , , . Verbal numerical scales are as reliable and sensitive as visual analog scales for rating dyspnea in young and older subjects. Respir Physiol Neurobiol. 2007;157(2–3):360–365.
- , , . Systematic review: the relationship between clinical experience and quality of health care. Ann Intern Med. 2005;142(4):260–273.
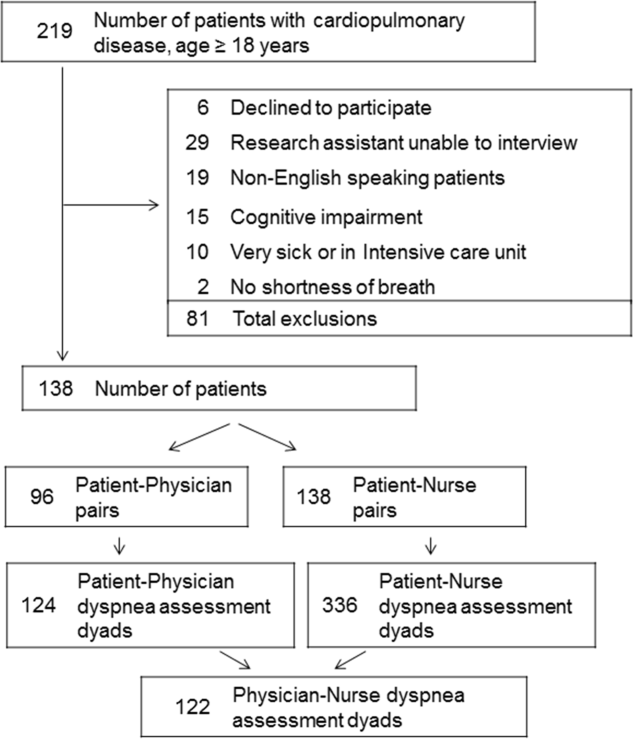
The Impact of Fellowship Training on Scholarly Productivity in Academic Dermatology
The percentage of dermatology residents pursuing fellowship training is steadily increasing. A report from the American Board of Dermatology described an increase in the percentage of residents entering fellowships approved by the American Board of Dermatology and Accreditation Council for Graduate Medical Education from 10% in 2006 to 24% in 2010.1 The American Medical Association Residency & Fellowship Database FREIDA Online showed that 30% of dermatology residents or fellows pursued further fellowship training in 2013.2 The number of dermatology fellowship positions offered also is steadily increasing. Data from SF Match showed that the number of participating applicants in Mohs micrographic surgery (MMS) fellowships increased from 64 in 2002 to 86 in 2014, and the number of programs increased from 48 to 56, respectively.3 Similarly, in pediatric dermatology the SF Match reported an increase from 14 to 22 in participating applicants and an increase in available programs from 14 to 20 in 2009 and 2012, respectively.4 Reports on dermatopathology programs also have suggested either a stable or increased percentage of residents pursuing fellowships in this specialty.5,6
There are several reported factors that influence the pursuit of dermatology fellowships. Fellows often hope to gain further exposure to a dermatology subspecialty,7 which is especially applicable to procedural dermatology, as the prevailing opinion among dermatologists is that residency training should emphasize medical dermatology much more than surgery.8,9 Increased financial compensation, responsibility to provide for a family, and increased levels of educational debt do not notably influence the desire to pursue a fellowship, though these factors often play a role in the decision to pursue a career in academia.6,10-12 Additionally, it has been reported that fellowship-trained dermatologists are more likely to teach students, residents, and fellows and are up to 8 times more likely to participate in research than non–fellowship-trained dermatologists.6,8,11 Research activity also correlates with the decision to pursue an academic career. As such, fellowship training may present physicians with opportunities to improve clinical care, garner more research opportunities, and advance in academic rank.13
Scholarly productivity, measured by contribution to research, is a heavily weighted factor when hiring and promoting within academic medicine.14-17 Despite the importance of scholarly productivity, it is difficult to accurately quantify the measure. Commonly used metrics include number of publications, number of citations, amount of National Institutes of Health funding, number of research presentations, and number of lectures.18,19 However, taken individually, none of these measures entirely represents an individual’s research contribution. For example, a physician may have a large number of relatively low-quality publications. Additionally, if considering the number of citations, one of an author’s publications may have many citations, while the remaining publications do not.
The h-index, introduced in 2005 by Hirsch,20,21 is a measure of academic productivity that takes into account both the quantity and impact of research measured by recording the number of published articles and the number of citations in peer-reviewed journals. A high h-index indicates a high number of significant publications. For example, if a physician has 10 published articles cited 10 times each, his/her h-index is 10. Another physician with an h-index of 10 may have published 50 articles, which indicates that the remaining 40 articles were cited fewer than 10 times. Prior studies on the use of the h-index in fields as diverse as otolaryngology, radiology, anesthesiology, neurosurgery, ophthalmology, and urology indicate a strong association between the h-index and academic rank.22-28 Other studies indicate that fellowship-trained individuals tend to have a higher h-index than their non–fellowship-trained counterparts.29,30 One study demonstrated that fellowship-trained dermatologic surgeons had significantly increased academic productivity (P=.001), as measured by the number of publications in PubMed, compared to non–fellowship-trained dermatologic surgeons.11
The goal of this study was to determine whether dermatology fellowship training impacts scholarly productivity and academic promotion. Additionally, the scholarly productivity of procedural dermatology/MMS, dermatopathology, and pediatric dermatology fellows is compared to determine if type of subspecialty affects research productivity.
Methods
A list of academic dermatology departments was accessed using FREIDA Online. Individual departmental websites were visited to compile a list of academic faculty members. Additional recorded data included academic rank, gender, and fellowship training. Academic rank was classified as assistant professor, associate professor, professor, and chair. Physicians listed as chairs were not listed as professors to avoid duplication of these individuals. Voluntary, nonclinical, and nonacademic faculty members were excluded from the analysis. Departments that did not list the academic rank of faculty members also were excluded. Faculty members were organized by fellowship type: procedural dermatology/MMS, dermatopathology, pediatric dermatology, other fellowship, and no fellowship. Individuals with multiple fellowships were counted in multiple categories.
Faculty members were subsequently searched on the Scopus database to determine the h-index and publication range in years. Correct author identity was ensured by confirming correct departmental affiliations and publications related to dermatology. (Results collected from the Scopus database have been shown to correlate well with those ofISI Web of Knowledge.23)
Kruskal-Wallis tests were used to compare continuous variables, and the Pearson χ2 test was used to compare categorical variables. Statistical significance was set at P<.05. All statistical analyses were performed using SAS software. This study qualified as nonhuman subject research per the institutional review board of Rutgers New Jersey Medical School (Newark, New Jersey).
Results
The analysis included 1043 faculty members from 103 academic departments. There were 144 dermatologists (13.8%) with procedural dermatology/MMS fellowships, 162 (15.5%) with dermatopathology fellowships, 71 (6.8%) with pediatric dermatology fellowships, 124 (11.9%) with other fellowships, and 542 (52.0%) with no fellowships (Figure 1). Fellowships classified as other included immunodermatology, dermatology-rheumatology, clinical education, dermatoepidemiology, cutaneous oncology, dermatopharmacology, and photobiology. Fellowship-trained dermatologists had a higher mean h-index than dermatologists without fellowships (13.2 vs 11.7; P<.001)(Figure 2).
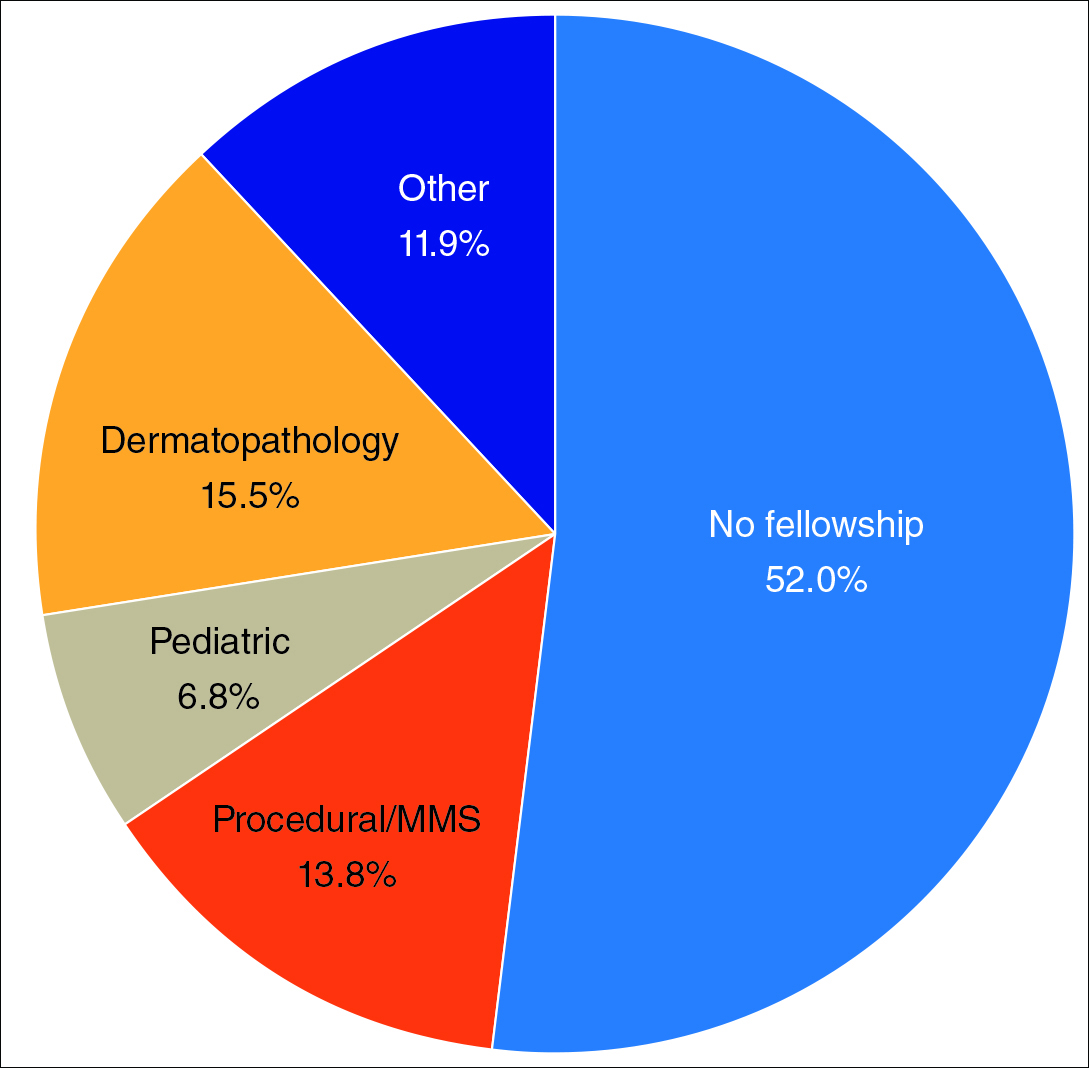
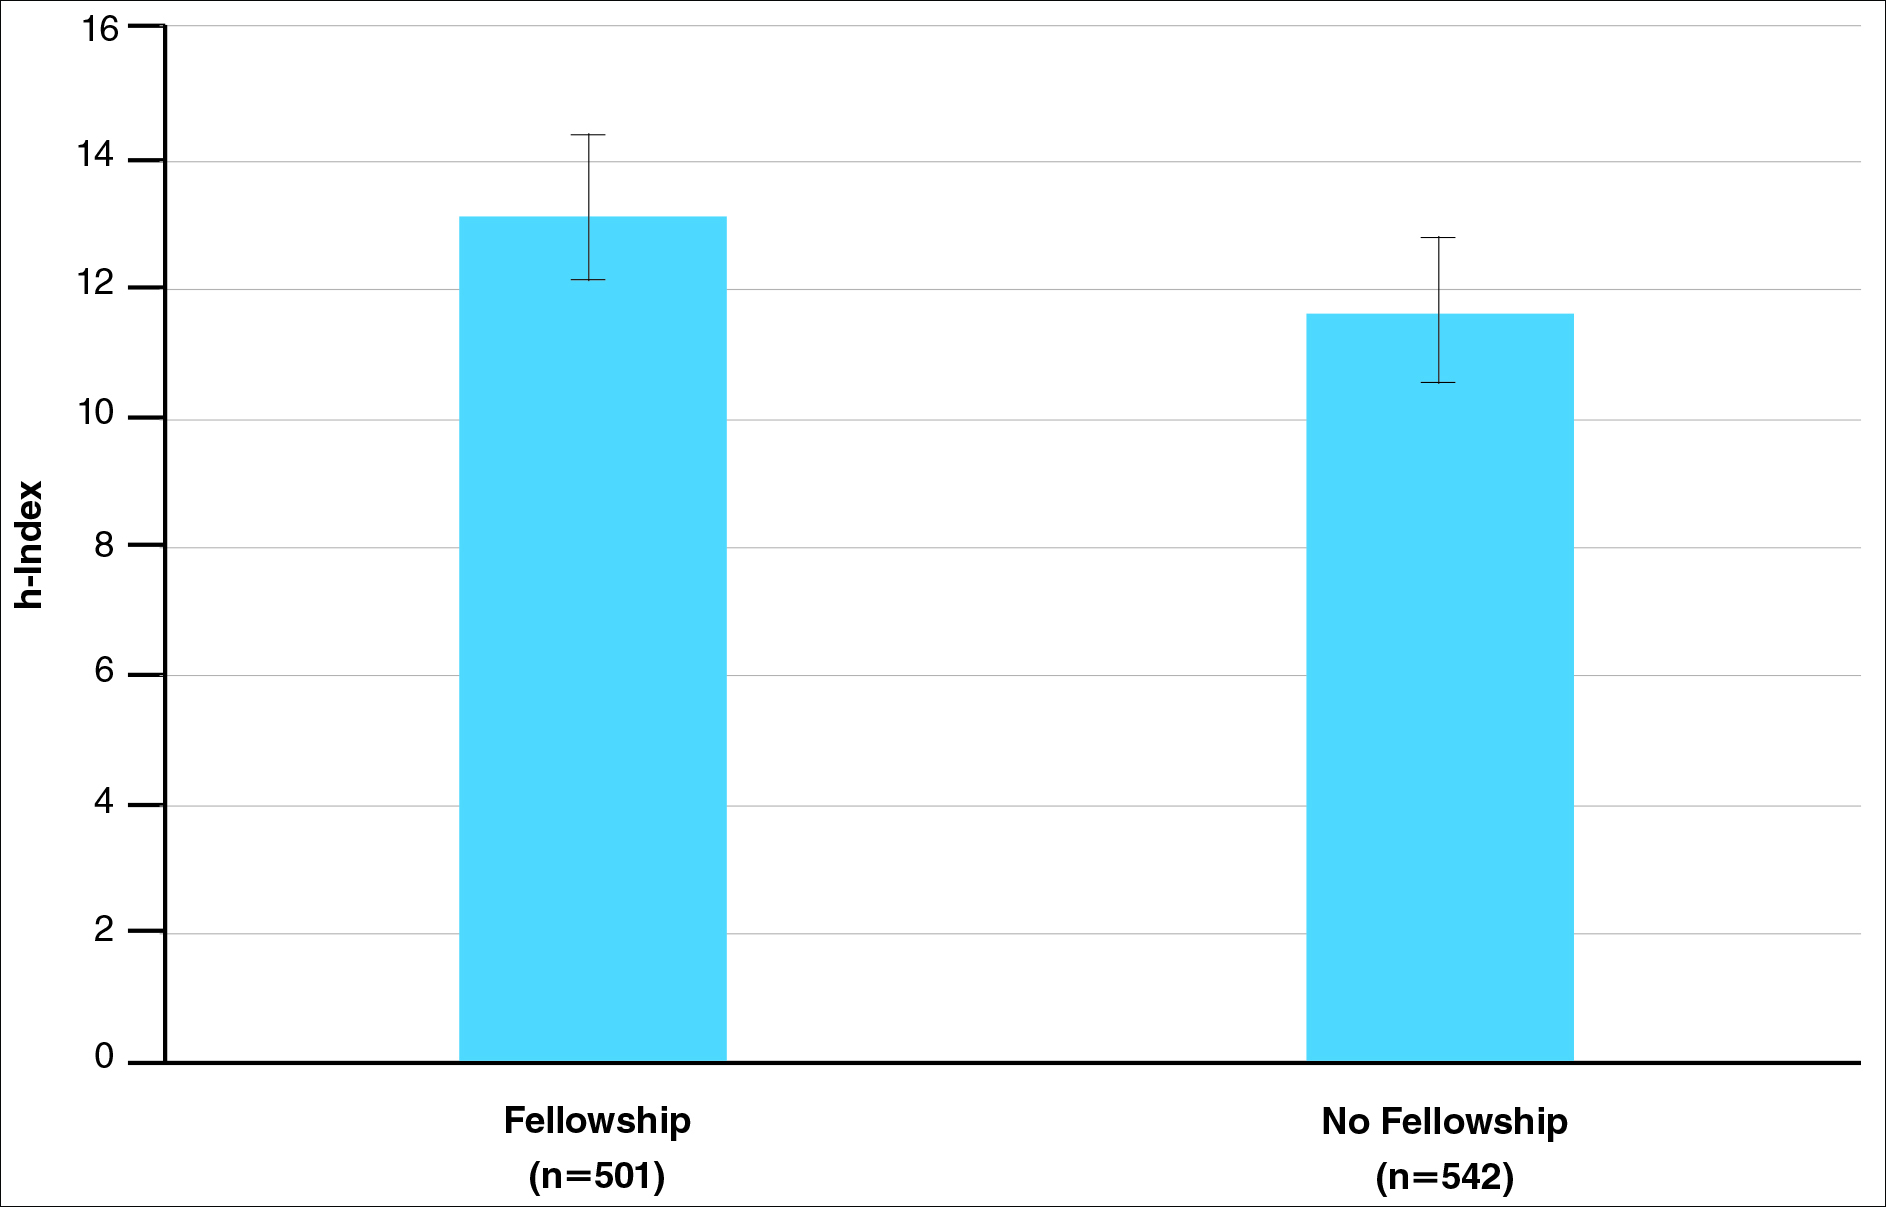
There were significant statistical differences among the fellowships examined (Kruskal-Wallis analysis of variance, P<.05). Academic dermatologists who completed dermatopathology or other fellowships had higher scholarly productivity than those who completed pediatric dermatology and procedural dermatology/MMS fellowships (P<.05)(Figure 3). Those who did not complete a fellowship had a higher mean h-index than those who completed pediatric dermatology and procedural dermatology/MMS fellowships; however, the difference was not statistically significant.
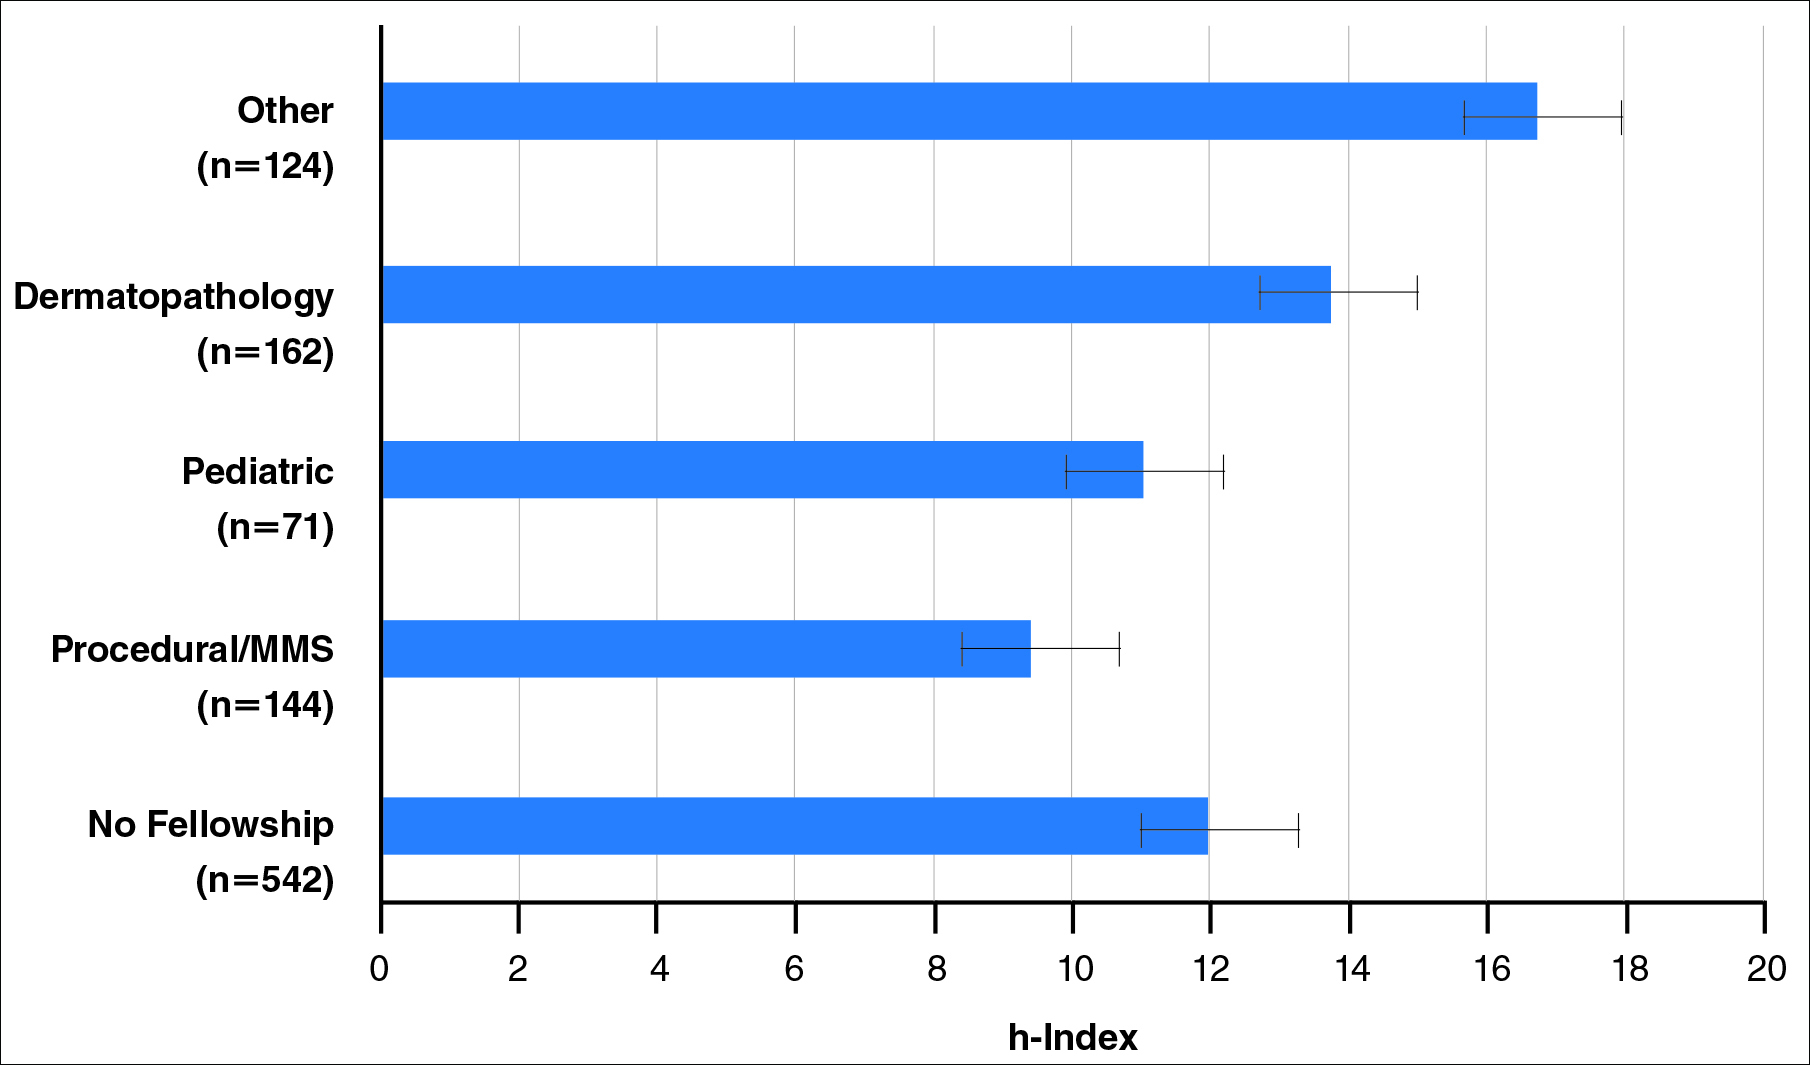
Regarding academic rank, there was a significant increase in scholarly productivity (as measured by the h-index) from assistant professor to professor (P<.05). There was no statistical difference in scholarly productivity between professors and chairs. When controlling for academic rank, there were no statistically significant differences in h-index between fellowship-trained versus non–fellowship-trained dermatologists, except at the level of associate professor. However, fellowship-trained dermatologists consistently had a higher mean h-index compared to non–fellowship-trained dermatologists in each rank (Figure 4). Fellowship-trained dermatologists made up 48.2% (222/461) of assistant professors, 45.2% (103/228) of associate professors, 47.3% (125/264) of professors, and 56.7% (51/90) of chairs.
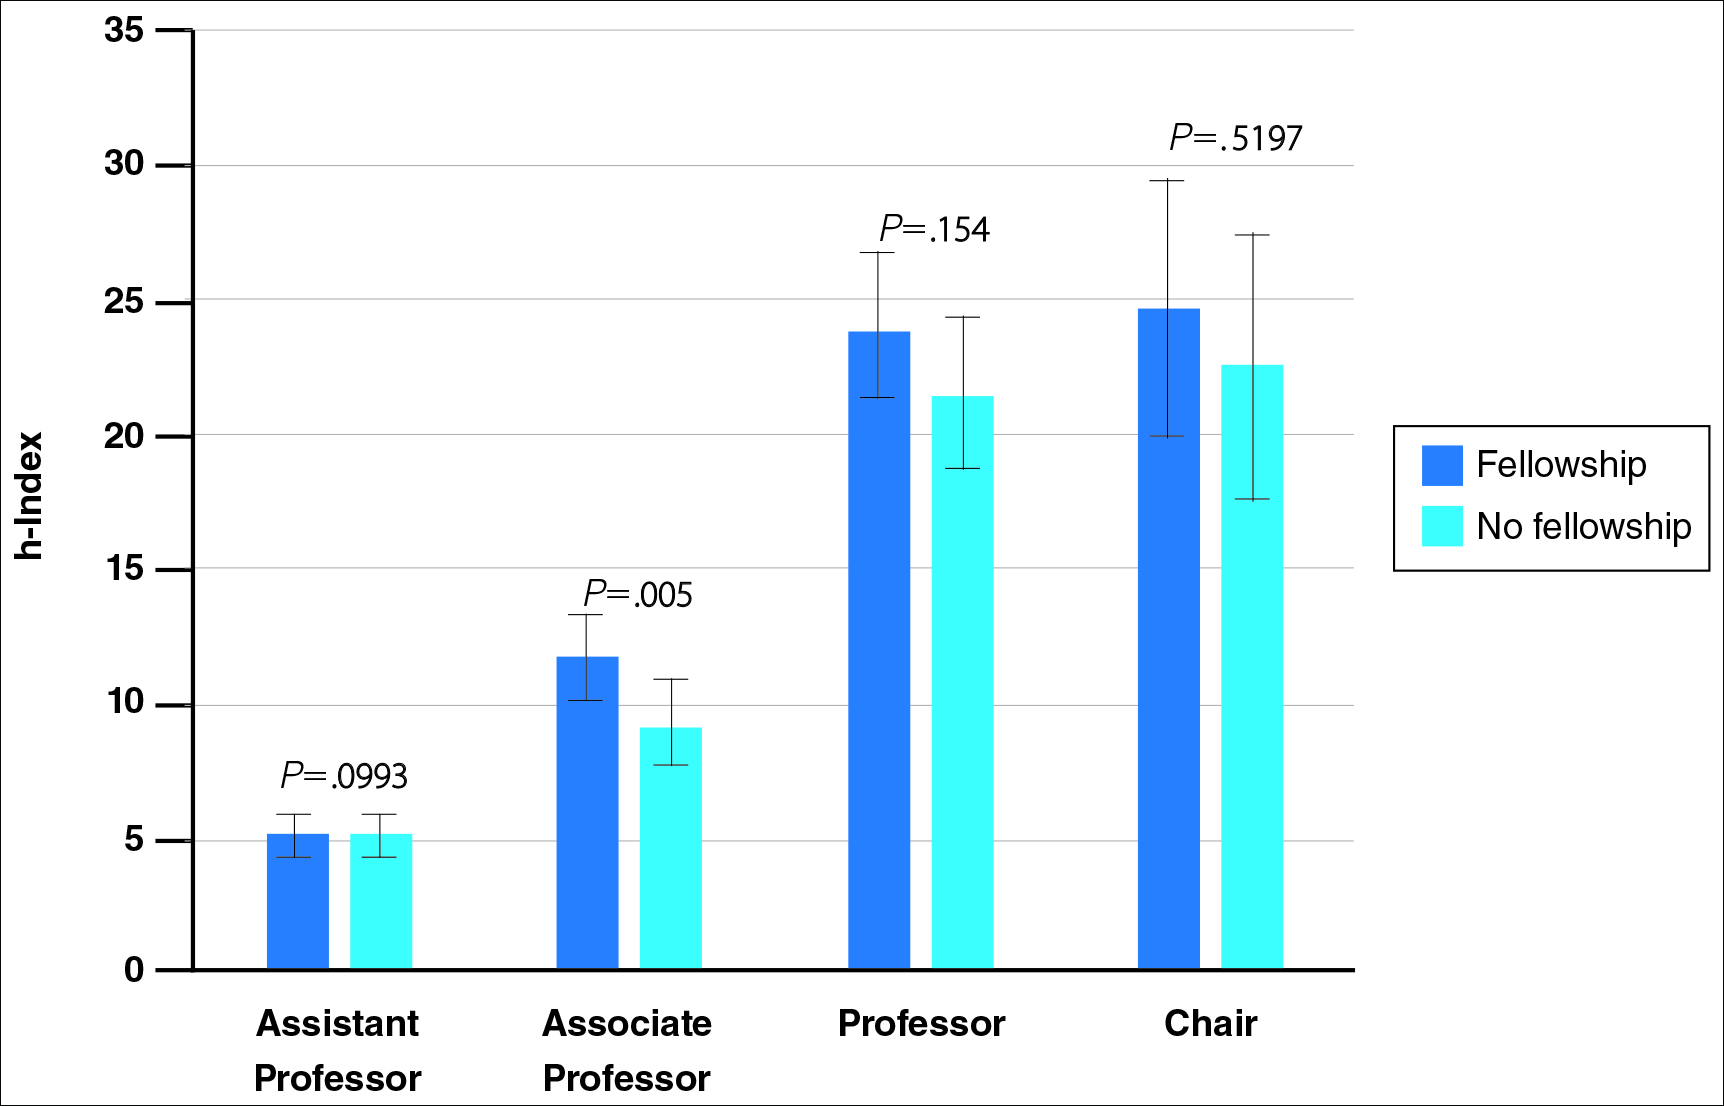
When controlling for the number of active publication years, no statistically significant differences were found between scholarly productivity in fellowship-trained versus non–fellowship-trained dermatologists. However, fellowship-trained academic dermatologists consistently had a higher mean h-index than non–fellowship-trained dermatologists within each 10-year range, except for the 31- to 40-year range (Figure 5).
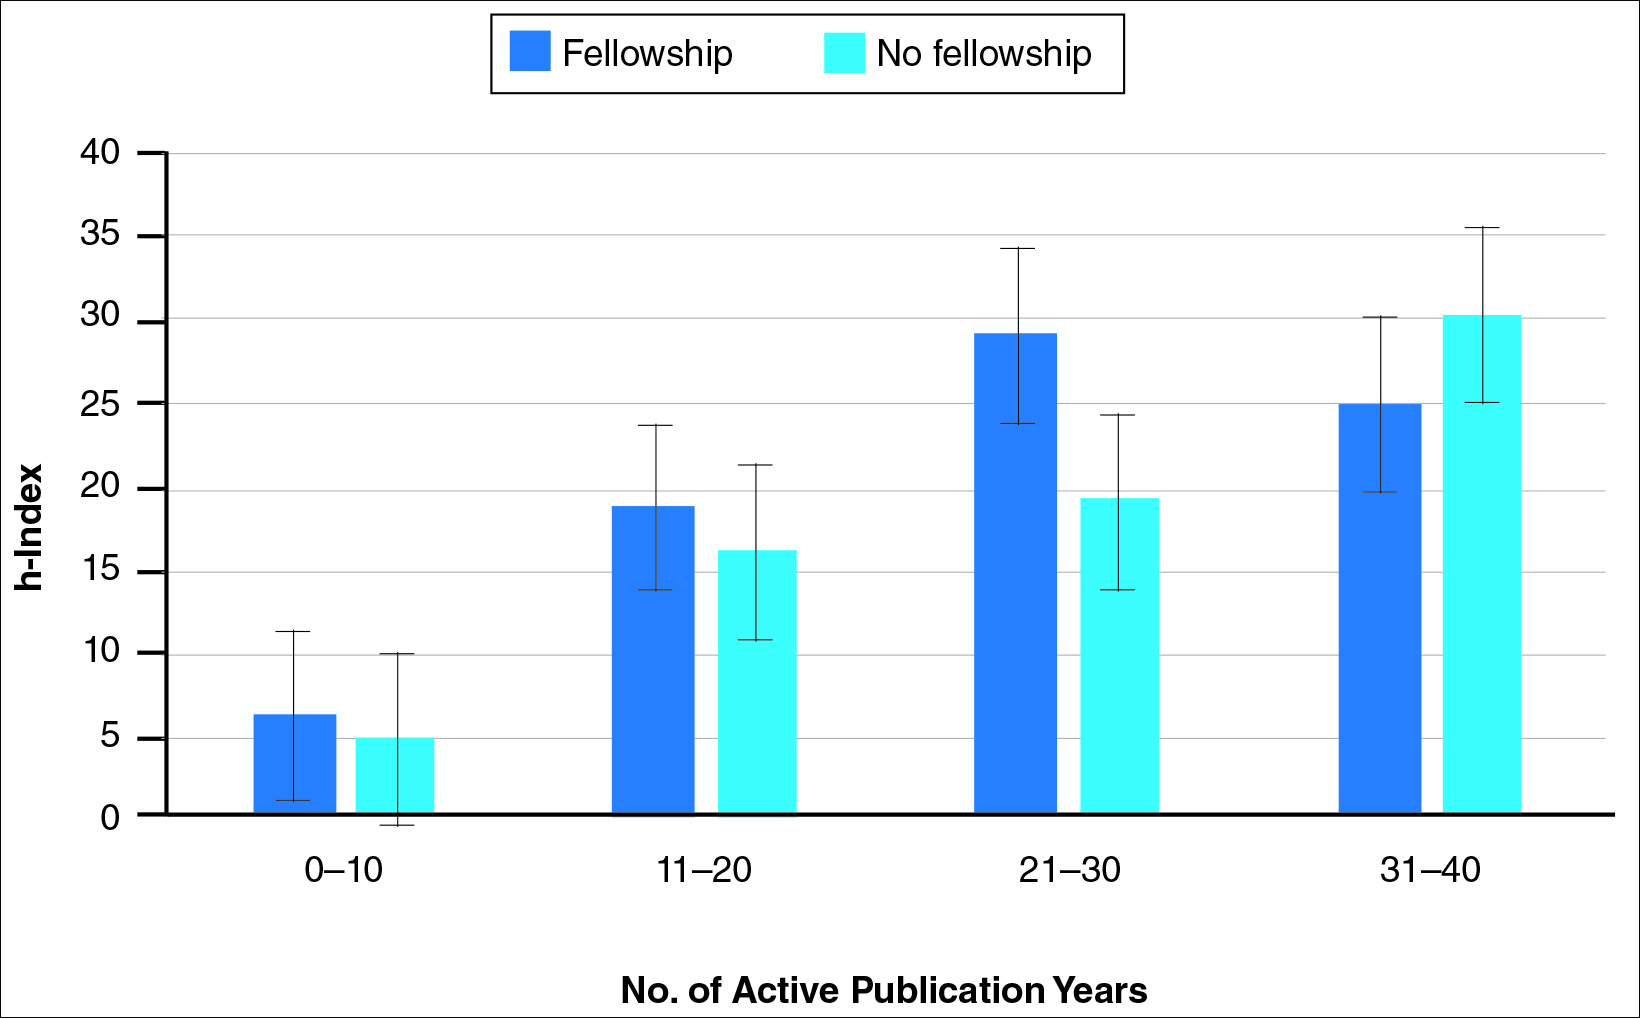
Comment
The proportion of dermatology residents who pursue fellowship training has been steadily increasing, according to data from the American Medical Association and American Board of Dermatology.1,2 Fellowship training allows graduating residents to have greater exposure to a dermatology subspecialty and often provides a narrower focus for future clinical activities. In our study, we found that fellowship-trained dermatologists had significantly higher research productivity, as measured by the h-index, than academic dermatologists without fellowship, which is likely because fellowship training offers an opportunity to hone teaching skills and pursue more research activity.13 For instance, several fellowship programs allow focused research time during training.11 Additionally, residents pursuing fellowships may be more likely to engage in research activities.
Greater scholarly productivity is especially important for academic physicians, as it plays an important role in hiring and promoting.14,15,19,31 Additionally, increased research productivity has been found to be associated with improved teaching and clinical activity.19 Research productivity of faculty members also influences the reputation and prestige of the department and the institution’s subsequent ability to attract higher-quality residents and faculty members.28
There were significant differences in mean h-index between dermatology subspecialties. Academic dermatologists who completed procedural dermatology/MMS fellowships had the lowest mean h-index, while those who completed dermatopathology or other fellowships had the highest mean h-index. These findings suggest that an emphasis on research productivity may be greater in dermatopathology. Additionally, dermatologists who completed other fellowships, such as immunodermatology or dermatopharmacology, may have received such fellowships prior to dermatology training. It would be interesting to determine the amount of time allocated for research within each subspecialty fellowship training.
A greater amount of clinical responsibility also may influence the difference in measures of scholarly productivity within each subspecialty. For instance, there is a known shortage of pediatric dermatologists,32 which may translate as a decreased amount of time that can be dedicated to research activity because of higher clinical volume per physician. Dermatologists with no fellowship had a higher mean h-index than those with pediatric and procedural dermatology/MMS fellowships, which may reflect the smaller number of subspecialists compared to non–fellowship-trained dermatologists (13.8% procedural dermatology/MMS; 6.8% pediatric dermatology; 52.0% no fellowship). As such, the research of subspecialists is targeted to a narrower audience and will garner fewer citations than non–fellowship-trained dermatologists. However, the lower number of subspecialists is not the only factor impacting scholarly productivity, as dermato-pathologists had higher scholarly impact than non–fellowship-trained individuals despite comprising only 15.5% of the cohort.
In corroboration with prior studies of academic medicine, the h-index increased with increasing rank from assistant professor to professor and chair.29,30,33 This increase confirms that research productivity is associated with academic rank. When stratifying the 2 cohorts of fellowship-trained and non–fellowship-trained academic dermatologists by academic rank, there was no significant difference in the h-index for both groups at each rank, except for associate professor. In addition, there was a relatively equal distribution within each rank of fellowship-trained and non–fellowship-trained individuals. This lack of statistical difference also was demonstrated when stratifying for years of active publication experience. Academic dermatologists have been shown to be more interested in pursuing research activity, and research is pivotal to pursuing a dermatology residency.11 Future studies may extend the comparison of scholarly productivity to nonacademic dermatologists.
It is important to acknowledge certain limitations in the data collection process and use of the h-index. Many of the dermatology department websites do not provide information about whether individual faculty members are pursuing a tenure track or nontenure track. This distinction may have bearing on the h-index, as research is more heavily emphasized in the tenure track. Moreover, the h-index does not take into account the type of research (ie, clinical vs basic science research). Therefore, while basic science research often is more time intensive than clinical research, a publication is weighed solely by its number of citations. As such, the h-index may not capture the true amount of time dedicated to research activities. In addition, the h-index cannot account for self-citation, which may increase this measure.34 However, to greatly influence the h-index, many self-citations of each work would be necessary, making it less concerning. Another limitation of this study is that it does not take into account time dedicated to the education of residents and medical students, an act that is necessary for preservation of the field. Although education portfolios that detail an individual’s contribution to teaching are starting to become more popular, there currently is no measure for educational activities.18,35 Finally, dermatology department websites are not frequently updated; as such, data gathered from websites regarding academic rank may not always be recent.
Conclusion
Scholarly productivity, as measured by the h-index, is a major contributory factor to hiring, promoting, and developing reputations in academic medicine. Our findings demonstrate that there is greater scholarly productivity among fellowship-trained dermatologists compared to non–fellowship-trained dermatologists. However, when controlling for academic rank and publication range, this difference is minimized. As such, fellowships may provide more opportunity for structured research experiences but may not be necessary for successful academic careers. In addition, individuals who wish to dedicate a substantial portion of time to research may find that fellowships in dermatopathology, immunodermatology, dermatology-rheumatology, clinical education, dermatoepidemiology, cutaneous oncology, dermatopharmacology, and photobiology are more conducive to performing research. We also recommend that other activities, including clinical and teaching activities, serve as supplemental measures to scholarly productivity when evaluating a physician’s contribution.
- Trends in postgraduate fellowships. American Board of Dermatology website. https://www.abderm.org/media/42577/prog-dir-ite_newsletter_july_2011.pdf. Accessed February 3, 2016.
- American Medical Association. FREIDA Online. https://freida.ama-assn.org/Freida/user/specStatistics Search.do?method=viewGraduates&pageNumber=3&spcCd=080. Accessed February 3, 2016.
- Micrographic surgery and dermatologic oncology fellowship. SF Match website. https://www.sfmatch.org/SpecialtyInsideAll.aspx?id=10&typ=1&name=Micrographic%20Surgery%20and%20Dermatologic%20Oncology#. Accessed February 3, 2016.
- Pediatric dermatology fellowship. SF Match website. https://www.sfmatch.org/SpecialtyInsideAll.aspx?id=16&typ=1&name=Pediatric%20Dermatology#. Accessed February 3, 2016.
- Javorsky E, Kostecki J, Kimball AB. The relative popularity of nonprocedural dermatology fellowships. J Am Acad Dermatol. 2012;66:693-694.
- Suwattee P, Cham PM, Abdollahi M, et al. Dermatopathology workforce in the United States: a survey. J Am Acad Dermatol. 2011;65:1180-1185.
- Park KK. Fellowships after dermatology residency: the traditional and beyond. Cutis. 2015;95:E31-E34.
- Tierney EP, Hanke CW, Kimball AB. Recent changes in the workforce and practice of dermatologic surgery. Dermatol Surg. 2009;35:413-419.
- Wu JJ, Markus RF, Orengo IF. The increased competitiveness of Mohs micrographic surgery training. Dermatol Online J. 2002;8:24.
- Salter SA, Kimball AB. Rising educational debt levels in recent dermatology trainees and effects on career choices. J Am Acad Dermatol. 2006;54:329-331.
- Tierney EP, Hanke CW, Kimball AB. Academic productivity and affiliation of dermatologic surgeons. Dermatol Surg. 2009;35:1886-1892.
- Nguyen JC, Jacobson CC, Rehmus W, et al. Workforce characteristics of Mohs surgery fellows. Dermatol Surg. 2004;30(2, pt 1):136-138.
- Goldenberg G, Patel MJ, Sangueza OP, et al. US dermatopathology fellows career survey: 2004-2005. J Cutan Pathol. 2007;34:487-489.
- Atasoylu AA, Wright SM, Beasley BW, et al. Promotion criteria for clinician-educators. J Gen Intern Med. 2003;18:711-716.
- Beasley BW, Wright SM, Cofrancesco J Jr, et al. Promotion criteria for clinician-educators in the United States and Canada. a survey of promotion committee chairpersons. JAMA. 1997;278:723-728.
- Dixon AK. Publishing and academic promotion. Singapore Med J. 2009;50:847-850.
- Todisco A, Souza RF, Gores GJ. Trains, tracks, and promotion in an academic medical center. Gastroenterology. 2011;141:1545-1548.
- Baldwin C, Chandran L, Gusic M. Guidelines for evaluating the educational performance of medical school faculty: priming a national conversation. Teach Learn Med. 2011;23:285-297.
- Akl EA, Meerpohl JJ, Raad D, et al. Effects of assessing the productivity of faculty in academic medical centres: a systematic review. CMAJ. 2012;184:E602-E612.
- Hirsch JE. An index to quantify an individual’s scientific research output. Proc Natl Acad Sci U S A. 2005;102:16569-16572.
- Hirsch JE. Does the h-index have predictive power? Proc Natl Acad Sci U S A. 2007;104:19193-19198.
- Benway BM, Kalidas P, Cabello JM, et al. Does citation analysis reveal association between h-index and academic rank in urology? Urology. 2009;74:30-33.
- Lee J, Kraus KL, Couldwell WT. Use of the h-index in neurosurgery. clinical article. J Neurosurg. 2009;111:387-392.
- Kasabwala K, Morton CM, Svider PF, et al. Factors influencing scholarly impact: does urology fellowship training affect research output? J Surg Educ. 2014;71:345-352.
- Pagel PS, Hudetz JA. H-index is a sensitive indicator of academic activity in highly productive anaesthesiologists: results of a bibliometric analysis. Acta Anaesthesiol Scand. 2011;55:1085-1089.
- Rad AE, Brinjikji W, Cloft HJ, et al. The h-index in academic radiology. Acad Radiol. 2010;17:817-821.
- Svider PF, Choudhry ZA, Choudhry OJ, et al. The use of the h-index in academic otolaryngology. Laryngoscope. 2013;123:103-106.
- Svider PF, Lopez SA, Husain Q, et al. The association between scholarly impact and National Institutes of Health funding in ophthalmology. Ophthalmology. 2014;121:423-428.
- Eloy JA, Svider PF, Mauro KM, et al. Impact of fellowship training on research productivity in academic otolaryngology. Laryngoscope. 2012;122:2690-2694.
- Huang G, Fang CH, Lopez SA, et al. Impact of fellowship training on research productivity in academic ophthalmology. J Surg Educ. 2015;72:410-417.
- Ball P. Achievement index climbs the ranks. Nature. 2007;448:737.
- Dinulos JG. Pediatric dermatology: past, present and future. Curr Opin Pediatr. 2007;19:417-419.
- Agarwal N, Clark S, Svider PF, et al. Impact of fellowship training on research productivity in academic neurological surgery. World Neurosurg. 2013;80:738-744.
- Engqvist L, Frommen JG. The h-index and self-citations. Trends Ecol Evol. 2008;23:250-252.
- Lamki N, Marchand M. The medical educator teaching portfolio: its compilation and potential utility. Sultan Qaboos Univ Med J. 2006;6:7-12.
The percentage of dermatology residents pursuing fellowship training is steadily increasing. A report from the American Board of Dermatology described an increase in the percentage of residents entering fellowships approved by the American Board of Dermatology and Accreditation Council for Graduate Medical Education from 10% in 2006 to 24% in 2010.1 The American Medical Association Residency & Fellowship Database FREIDA Online showed that 30% of dermatology residents or fellows pursued further fellowship training in 2013.2 The number of dermatology fellowship positions offered also is steadily increasing. Data from SF Match showed that the number of participating applicants in Mohs micrographic surgery (MMS) fellowships increased from 64 in 2002 to 86 in 2014, and the number of programs increased from 48 to 56, respectively.3 Similarly, in pediatric dermatology the SF Match reported an increase from 14 to 22 in participating applicants and an increase in available programs from 14 to 20 in 2009 and 2012, respectively.4 Reports on dermatopathology programs also have suggested either a stable or increased percentage of residents pursuing fellowships in this specialty.5,6
There are several reported factors that influence the pursuit of dermatology fellowships. Fellows often hope to gain further exposure to a dermatology subspecialty,7 which is especially applicable to procedural dermatology, as the prevailing opinion among dermatologists is that residency training should emphasize medical dermatology much more than surgery.8,9 Increased financial compensation, responsibility to provide for a family, and increased levels of educational debt do not notably influence the desire to pursue a fellowship, though these factors often play a role in the decision to pursue a career in academia.6,10-12 Additionally, it has been reported that fellowship-trained dermatologists are more likely to teach students, residents, and fellows and are up to 8 times more likely to participate in research than non–fellowship-trained dermatologists.6,8,11 Research activity also correlates with the decision to pursue an academic career. As such, fellowship training may present physicians with opportunities to improve clinical care, garner more research opportunities, and advance in academic rank.13
Scholarly productivity, measured by contribution to research, is a heavily weighted factor when hiring and promoting within academic medicine.14-17 Despite the importance of scholarly productivity, it is difficult to accurately quantify the measure. Commonly used metrics include number of publications, number of citations, amount of National Institutes of Health funding, number of research presentations, and number of lectures.18,19 However, taken individually, none of these measures entirely represents an individual’s research contribution. For example, a physician may have a large number of relatively low-quality publications. Additionally, if considering the number of citations, one of an author’s publications may have many citations, while the remaining publications do not.
The h-index, introduced in 2005 by Hirsch,20,21 is a measure of academic productivity that takes into account both the quantity and impact of research measured by recording the number of published articles and the number of citations in peer-reviewed journals. A high h-index indicates a high number of significant publications. For example, if a physician has 10 published articles cited 10 times each, his/her h-index is 10. Another physician with an h-index of 10 may have published 50 articles, which indicates that the remaining 40 articles were cited fewer than 10 times. Prior studies on the use of the h-index in fields as diverse as otolaryngology, radiology, anesthesiology, neurosurgery, ophthalmology, and urology indicate a strong association between the h-index and academic rank.22-28 Other studies indicate that fellowship-trained individuals tend to have a higher h-index than their non–fellowship-trained counterparts.29,30 One study demonstrated that fellowship-trained dermatologic surgeons had significantly increased academic productivity (P=.001), as measured by the number of publications in PubMed, compared to non–fellowship-trained dermatologic surgeons.11
The goal of this study was to determine whether dermatology fellowship training impacts scholarly productivity and academic promotion. Additionally, the scholarly productivity of procedural dermatology/MMS, dermatopathology, and pediatric dermatology fellows is compared to determine if type of subspecialty affects research productivity.
Methods
A list of academic dermatology departments was accessed using FREIDA Online. Individual departmental websites were visited to compile a list of academic faculty members. Additional recorded data included academic rank, gender, and fellowship training. Academic rank was classified as assistant professor, associate professor, professor, and chair. Physicians listed as chairs were not listed as professors to avoid duplication of these individuals. Voluntary, nonclinical, and nonacademic faculty members were excluded from the analysis. Departments that did not list the academic rank of faculty members also were excluded. Faculty members were organized by fellowship type: procedural dermatology/MMS, dermatopathology, pediatric dermatology, other fellowship, and no fellowship. Individuals with multiple fellowships were counted in multiple categories.
Faculty members were subsequently searched on the Scopus database to determine the h-index and publication range in years. Correct author identity was ensured by confirming correct departmental affiliations and publications related to dermatology. (Results collected from the Scopus database have been shown to correlate well with those ofISI Web of Knowledge.23)
Kruskal-Wallis tests were used to compare continuous variables, and the Pearson χ2 test was used to compare categorical variables. Statistical significance was set at P<.05. All statistical analyses were performed using SAS software. This study qualified as nonhuman subject research per the institutional review board of Rutgers New Jersey Medical School (Newark, New Jersey).
Results
The analysis included 1043 faculty members from 103 academic departments. There were 144 dermatologists (13.8%) with procedural dermatology/MMS fellowships, 162 (15.5%) with dermatopathology fellowships, 71 (6.8%) with pediatric dermatology fellowships, 124 (11.9%) with other fellowships, and 542 (52.0%) with no fellowships (Figure 1). Fellowships classified as other included immunodermatology, dermatology-rheumatology, clinical education, dermatoepidemiology, cutaneous oncology, dermatopharmacology, and photobiology. Fellowship-trained dermatologists had a higher mean h-index than dermatologists without fellowships (13.2 vs 11.7; P<.001)(Figure 2).
There were significant statistical differences among the fellowships examined (Kruskal-Wallis analysis of variance, P<.05). Academic dermatologists who completed dermatopathology or other fellowships had higher scholarly productivity than those who completed pediatric dermatology and procedural dermatology/MMS fellowships (P<.05)(Figure 3). Those who did not complete a fellowship had a higher mean h-index than those who completed pediatric dermatology and procedural dermatology/MMS fellowships; however, the difference was not statistically significant.
Regarding academic rank, there was a significant increase in scholarly productivity (as measured by the h-index) from assistant professor to professor (P<.05). There was no statistical difference in scholarly productivity between professors and chairs. When controlling for academic rank, there were no statistically significant differences in h-index between fellowship-trained versus non–fellowship-trained dermatologists, except at the level of associate professor. However, fellowship-trained dermatologists consistently had a higher mean h-index compared to non–fellowship-trained dermatologists in each rank (Figure 4). Fellowship-trained dermatologists made up 48.2% (222/461) of assistant professors, 45.2% (103/228) of associate professors, 47.3% (125/264) of professors, and 56.7% (51/90) of chairs.
When controlling for the number of active publication years, no statistically significant differences were found between scholarly productivity in fellowship-trained versus non–fellowship-trained dermatologists. However, fellowship-trained academic dermatologists consistently had a higher mean h-index than non–fellowship-trained dermatologists within each 10-year range, except for the 31- to 40-year range (Figure 5).
Comment
The proportion of dermatology residents who pursue fellowship training has been steadily increasing, according to data from the American Medical Association and American Board of Dermatology.1,2 Fellowship training allows graduating residents to have greater exposure to a dermatology subspecialty and often provides a narrower focus for future clinical activities. In our study, we found that fellowship-trained dermatologists had significantly higher research productivity, as measured by the h-index, than academic dermatologists without fellowship, which is likely because fellowship training offers an opportunity to hone teaching skills and pursue more research activity.13 For instance, several fellowship programs allow focused research time during training.11 Additionally, residents pursuing fellowships may be more likely to engage in research activities.
Greater scholarly productivity is especially important for academic physicians, as it plays an important role in hiring and promoting.14,15,19,31 Additionally, increased research productivity has been found to be associated with improved teaching and clinical activity.19 Research productivity of faculty members also influences the reputation and prestige of the department and the institution’s subsequent ability to attract higher-quality residents and faculty members.28
There were significant differences in mean h-index between dermatology subspecialties. Academic dermatologists who completed procedural dermatology/MMS fellowships had the lowest mean h-index, while those who completed dermatopathology or other fellowships had the highest mean h-index. These findings suggest that an emphasis on research productivity may be greater in dermatopathology. Additionally, dermatologists who completed other fellowships, such as immunodermatology or dermatopharmacology, may have received such fellowships prior to dermatology training. It would be interesting to determine the amount of time allocated for research within each subspecialty fellowship training.
A greater amount of clinical responsibility also may influence the difference in measures of scholarly productivity within each subspecialty. For instance, there is a known shortage of pediatric dermatologists,32 which may translate as a decreased amount of time that can be dedicated to research activity because of higher clinical volume per physician. Dermatologists with no fellowship had a higher mean h-index than those with pediatric and procedural dermatology/MMS fellowships, which may reflect the smaller number of subspecialists compared to non–fellowship-trained dermatologists (13.8% procedural dermatology/MMS; 6.8% pediatric dermatology; 52.0% no fellowship). As such, the research of subspecialists is targeted to a narrower audience and will garner fewer citations than non–fellowship-trained dermatologists. However, the lower number of subspecialists is not the only factor impacting scholarly productivity, as dermato-pathologists had higher scholarly impact than non–fellowship-trained individuals despite comprising only 15.5% of the cohort.
In corroboration with prior studies of academic medicine, the h-index increased with increasing rank from assistant professor to professor and chair.29,30,33 This increase confirms that research productivity is associated with academic rank. When stratifying the 2 cohorts of fellowship-trained and non–fellowship-trained academic dermatologists by academic rank, there was no significant difference in the h-index for both groups at each rank, except for associate professor. In addition, there was a relatively equal distribution within each rank of fellowship-trained and non–fellowship-trained individuals. This lack of statistical difference also was demonstrated when stratifying for years of active publication experience. Academic dermatologists have been shown to be more interested in pursuing research activity, and research is pivotal to pursuing a dermatology residency.11 Future studies may extend the comparison of scholarly productivity to nonacademic dermatologists.
It is important to acknowledge certain limitations in the data collection process and use of the h-index. Many of the dermatology department websites do not provide information about whether individual faculty members are pursuing a tenure track or nontenure track. This distinction may have bearing on the h-index, as research is more heavily emphasized in the tenure track. Moreover, the h-index does not take into account the type of research (ie, clinical vs basic science research). Therefore, while basic science research often is more time intensive than clinical research, a publication is weighed solely by its number of citations. As such, the h-index may not capture the true amount of time dedicated to research activities. In addition, the h-index cannot account for self-citation, which may increase this measure.34 However, to greatly influence the h-index, many self-citations of each work would be necessary, making it less concerning. Another limitation of this study is that it does not take into account time dedicated to the education of residents and medical students, an act that is necessary for preservation of the field. Although education portfolios that detail an individual’s contribution to teaching are starting to become more popular, there currently is no measure for educational activities.18,35 Finally, dermatology department websites are not frequently updated; as such, data gathered from websites regarding academic rank may not always be recent.
Conclusion
Scholarly productivity, as measured by the h-index, is a major contributory factor to hiring, promoting, and developing reputations in academic medicine. Our findings demonstrate that there is greater scholarly productivity among fellowship-trained dermatologists compared to non–fellowship-trained dermatologists. However, when controlling for academic rank and publication range, this difference is minimized. As such, fellowships may provide more opportunity for structured research experiences but may not be necessary for successful academic careers. In addition, individuals who wish to dedicate a substantial portion of time to research may find that fellowships in dermatopathology, immunodermatology, dermatology-rheumatology, clinical education, dermatoepidemiology, cutaneous oncology, dermatopharmacology, and photobiology are more conducive to performing research. We also recommend that other activities, including clinical and teaching activities, serve as supplemental measures to scholarly productivity when evaluating a physician’s contribution.
- Trends in postgraduate fellowships. American Board of Dermatology website. https://www.abderm.org/media/42577/prog-dir-ite_newsletter_july_2011.pdf. Accessed February 3, 2016.
- American Medical Association. FREIDA Online. https://freida.ama-assn.org/Freida/user/specStatistics Search.do?method=viewGraduates&pageNumber=3&spcCd=080. Accessed February 3, 2016.
- Micrographic surgery and dermatologic oncology fellowship. SF Match website. https://www.sfmatch.org/SpecialtyInsideAll.aspx?id=10&typ=1&name=Micrographic%20Surgery%20and%20Dermatologic%20Oncology#. Accessed February 3, 2016.
- Pediatric dermatology fellowship. SF Match website. https://www.sfmatch.org/SpecialtyInsideAll.aspx?id=16&typ=1&name=Pediatric%20Dermatology#. Accessed February 3, 2016.
- Javorsky E, Kostecki J, Kimball AB. The relative popularity of nonprocedural dermatology fellowships. J Am Acad Dermatol. 2012;66:693-694.
- Suwattee P, Cham PM, Abdollahi M, et al. Dermatopathology workforce in the United States: a survey. J Am Acad Dermatol. 2011;65:1180-1185.
- Park KK. Fellowships after dermatology residency: the traditional and beyond. Cutis. 2015;95:E31-E34.
- Tierney EP, Hanke CW, Kimball AB. Recent changes in the workforce and practice of dermatologic surgery. Dermatol Surg. 2009;35:413-419.
- Wu JJ, Markus RF, Orengo IF. The increased competitiveness of Mohs micrographic surgery training. Dermatol Online J. 2002;8:24.
- Salter SA, Kimball AB. Rising educational debt levels in recent dermatology trainees and effects on career choices. J Am Acad Dermatol. 2006;54:329-331.
- Tierney EP, Hanke CW, Kimball AB. Academic productivity and affiliation of dermatologic surgeons. Dermatol Surg. 2009;35:1886-1892.
- Nguyen JC, Jacobson CC, Rehmus W, et al. Workforce characteristics of Mohs surgery fellows. Dermatol Surg. 2004;30(2, pt 1):136-138.
- Goldenberg G, Patel MJ, Sangueza OP, et al. US dermatopathology fellows career survey: 2004-2005. J Cutan Pathol. 2007;34:487-489.
- Atasoylu AA, Wright SM, Beasley BW, et al. Promotion criteria for clinician-educators. J Gen Intern Med. 2003;18:711-716.
- Beasley BW, Wright SM, Cofrancesco J Jr, et al. Promotion criteria for clinician-educators in the United States and Canada. a survey of promotion committee chairpersons. JAMA. 1997;278:723-728.
- Dixon AK. Publishing and academic promotion. Singapore Med J. 2009;50:847-850.
- Todisco A, Souza RF, Gores GJ. Trains, tracks, and promotion in an academic medical center. Gastroenterology. 2011;141:1545-1548.
- Baldwin C, Chandran L, Gusic M. Guidelines for evaluating the educational performance of medical school faculty: priming a national conversation. Teach Learn Med. 2011;23:285-297.
- Akl EA, Meerpohl JJ, Raad D, et al. Effects of assessing the productivity of faculty in academic medical centres: a systematic review. CMAJ. 2012;184:E602-E612.
- Hirsch JE. An index to quantify an individual’s scientific research output. Proc Natl Acad Sci U S A. 2005;102:16569-16572.
- Hirsch JE. Does the h-index have predictive power? Proc Natl Acad Sci U S A. 2007;104:19193-19198.
- Benway BM, Kalidas P, Cabello JM, et al. Does citation analysis reveal association between h-index and academic rank in urology? Urology. 2009;74:30-33.
- Lee J, Kraus KL, Couldwell WT. Use of the h-index in neurosurgery. clinical article. J Neurosurg. 2009;111:387-392.
- Kasabwala K, Morton CM, Svider PF, et al. Factors influencing scholarly impact: does urology fellowship training affect research output? J Surg Educ. 2014;71:345-352.
- Pagel PS, Hudetz JA. H-index is a sensitive indicator of academic activity in highly productive anaesthesiologists: results of a bibliometric analysis. Acta Anaesthesiol Scand. 2011;55:1085-1089.
- Rad AE, Brinjikji W, Cloft HJ, et al. The h-index in academic radiology. Acad Radiol. 2010;17:817-821.
- Svider PF, Choudhry ZA, Choudhry OJ, et al. The use of the h-index in academic otolaryngology. Laryngoscope. 2013;123:103-106.
- Svider PF, Lopez SA, Husain Q, et al. The association between scholarly impact and National Institutes of Health funding in ophthalmology. Ophthalmology. 2014;121:423-428.
- Eloy JA, Svider PF, Mauro KM, et al. Impact of fellowship training on research productivity in academic otolaryngology. Laryngoscope. 2012;122:2690-2694.
- Huang G, Fang CH, Lopez SA, et al. Impact of fellowship training on research productivity in academic ophthalmology. J Surg Educ. 2015;72:410-417.
- Ball P. Achievement index climbs the ranks. Nature. 2007;448:737.
- Dinulos JG. Pediatric dermatology: past, present and future. Curr Opin Pediatr. 2007;19:417-419.
- Agarwal N, Clark S, Svider PF, et al. Impact of fellowship training on research productivity in academic neurological surgery. World Neurosurg. 2013;80:738-744.
- Engqvist L, Frommen JG. The h-index and self-citations. Trends Ecol Evol. 2008;23:250-252.
- Lamki N, Marchand M. The medical educator teaching portfolio: its compilation and potential utility. Sultan Qaboos Univ Med J. 2006;6:7-12.
Practice Points
- As residents decide whether to pursue fellowship training, it is important to consider the importance of fellowship completion for academic promotion and productivity.
- Although there is greater scholarly productivity among fellowship-trained dermatologists compared to non–fellowship-trained dermatologists, this difference is minimized when controlling for academic rank and publication range.
- Fellowships may provide more opportunity for structured research experiences but may not be necessary for successful careers in academic dermatology.
OPAT at a Medical Respite Facility
Prolonged hospitalizations for complex patients with severe infections and difficult social situations are becoming very common in many institutions. Outpatient parenteral antimicrobial therapy (OPAT) is widely used[1] and has been found to be a safe, efficient, and cost‐effective way to administer intravenous (IV) antimicrobial therapy to patients, with the potential to decrease hospital length of stay (LOS) and to improve patient satisfaction.[2] Infectious disease (ID) consultation should be involved to determine appropriate candidates for OPAT as well as a suitable drug regimen and duration of therapy,[3] or if oral alternatives can be utilized.[4] OPAT patients require close laboratory monitoring and provider follow‐up for the duration of their care. The combination of ID consultation, patient selection, laboratory monitoring, and follow‐up care have been described as part of a proposed OPAT bundle in recent medical literature.[5] Appropriate patient selection is a key component as to whether or not a patient will be successful with OPAT once discharged from the hospital. Current Infectious Diseases Society of America (IDSA) guidelines recommend that patients be evaluated for stable housing and ability to perform OPAT‐specific duties prior to discharge.[3]
To our knowledge there are no published data regarding the use of OPAT at a medical respite facility for homeless patients with co‐morbid substance abuse and mental illness issues. This may be due to perceived concerns of difficulty in administering OPAT to these disadvantaged patients for multiple reasons such as unstable or no housing, inability to stay engaged in medical care, and underlying mental illness and substance abuse problems. In particular, the concern for substance abuse, specifically injection drug use (IDU), is a significant problem. The current IDSA guidelines for OPAT recommend patients who are likely to abuse a vascular access system are poor candidates for OPAT.[3]
A major barrier to successful utilization of OPAT programs is the need for stable housing so that antibiotics can be administered in a safe setting. Recommending long‐term parenteral therapy as an inpatient for all patients who are homeless or have a history of IDU can lead to prolonged hospitalizations, increased healthcare costs, and contribute to conflicts between patients and staff. Chemical dependence treatment is not available in most inpatient settings, leaving patients with addiction issues without options. Most patients would prefer, when given the choice, to be treated with OPAT outside of the inpatient setting.[6]
This study aimed to evaluate our experience with administering OPAT to homeless patients at a medical respite facility and to determine if patients could complete a successful treatment course of antibiotics for a variety of illnesses.
METHODS
Harborview Medical Center (HMC) is a 413‐bed county hospital, and serves as a major teaching hospital for the University of Washington. It is a level 1 trauma/burn center for Washington, Wyoming, Alaska, Montana, and Idaho. The hospital has 61 psychiatric beds, 29 rehabilitation beds, and 89 intensive care unit beds, with over 60,000 emergency department visits per year. Harborview also serves as a public safety‐net hospital for King County, providing $219 million in charity care in 2013.
Housed in a building adjacent to HMC is a 34‐bed medical respite program,[7] which was established in 2011 through collaboration with King County and 6 other hospitals to serve the homeless population needing medical care, similar to programs in Boston[8] and San Francisco.[9] It is staffed by a multidisciplinary team from HMC including a physician, nurse practitioners, registered nurses, medical assistants, mental health specialists, case managers, and security guards, and accepts patients from all hospitals and clinics within King County. To qualify for medical respite, patient must be homeless and require ongoing nursing needs (ie, wound care, parenteral therapy). Referred patients are screened by a nurse prior to admission. The projected daily cost at medical respite is $350 per patient.
Medical respite is a harm‐reduction model, which includes information on needle exchange programs, narcan kits and education on safer injection practices. Resources are available for patients wishing to start a rehabilitation program, including opiate replacement therapy. Patients may leave the premises during the day, but a curfew is enforced at 9 pm nightly. Patients sign a contract on admission to refrain from using their IV line for IDU and peripherally‐inserted central catheter (PICC) port is secured and monitored for manipulation. Patients who exhibit threatening behavior or who use alcohol/drugs on site are discharged from the program. Patients in need of OPAT must keep nurse visits once or twice daily depending on medication and wound care. Medications needing more frequent dosing were placed on a battery‐operated pump and changed once every 24 hours by nursing.
After obtaining approval from the University of Washington Institutional Review Board, we performed a retrospective chart review of homeless patients over 18 years old discharged from HMC who received OPAT at medical respite from January 1, 2012 to January 1, 2014. There were no exclusions for race, gender, or insurance status. Patients included in the study were respite candidates, and required prolonged parenteral antibiotic therapy. Data collection was performed using a REDCap data collection tool and REDCap grant support.[10] Demographics, diagnosis, and comorbidities, including mental illness, current IDU at time of admission, and remote IDU (last use >3 months ago) were obtained from the electronic medical record. Surgical, microbiologic, and antimicrobial therapy, including route (IV or oral), duration of therapy, and adverse events were abstracted. Primary outcome was defined as successful completion of OPAT at medical respite without nonadherence to therapy or readmission (for presumed OPAT failure). A secondary outcome was antimicrobial course completion for a specific diagnosis defined by achieving goal duration of parenteral and/or oral antibiotic therapy as deemed appropriate by an ID provider. Nonadherence is defined as missing greater than 2 doses of scheduled antibiotic, absence from respite for greater than 24 hours, evidence of line tampering, or expulsion from respite for violation of care agreement. Recurrence of infection was defined as subsequent infection at the same site, following completion of a prior antimicrobial course, at the most recent follow‐up visit.
Continuous variables are expressed as the mean standard deviation, and categorical variables are expressed as the proportion of the entire population. Categorical variables are compared using the 2 test. A 2‐sided P value of <0.05 was considered statistically significant.
RESULTS
Fifty‐one homeless patients were identified with 53 episodes of OPAT between January 1, 2012 and January 1, 2014. For ease of reporting, the number of episodes of OPAT (n = 53) was used as the denominator instead of number of patients (n = 51) for descriptive statistics. The average age was 45 10.4 years (range, 2262 years), 38 (72%) patients were male, and 39 (74%) were Caucasian. Comorbidities included 28 (53%) patients with current IDU and 9 (17%) with a remote history of IDU, 32 (60%) with hepatitis C infection, and 14 (26%) with mental illness (Table 1).
| Comorbidities | No. per Patient Episode, n = 53 (%) |
|---|---|
| |
| Hepatitis C infection | 32 (60%) |
| Current IDU | 28 (53%) |
| Psychiatric/mental illness | 14 (26%) |
| Remote IDU | 9 (17%) |
| Hypertension | 7 (13%) |
| Diabetes type 1 or type 2 | 5 (9%) |
| Rheumatologic diagnosis | 3 (6%) |
| Obesity | 2 (4%) |
| Cardiovascular disease | 2 (4%) |
| Peripheral vascular disease | 2 (4%) |
| Congestive heart failure | 2 (4%) |
| Chronic kidney disease (any stage) | 1 (2%) |
| HIV | 1 (2%) |
Forty‐six (87%) patients were evaluated by an ID physician during their admission. Diagnosis (some patients had multiple) requiring OPAT included: bacteremia in 28, osteomyelitis in 22, skin and soft tissue infection in 19, endocarditis in 15, and epidural abscess in 7 patients. Twenty‐nine patients underwent surgical intervention. The pathogens recovered were primarily gram‐positive organisms. Multidrug resistant organisms were isolated in 11 patients. The IV medications used included vancomycin, nafcillin, cefazolin, ertapenem, and daptomycin.
Forty‐six (87%) patients completed a defined course of antibiotic therapy (deemed appropriate therapy by an ID physician) for their specific infection. Thirty‐four (64%) patients were successfully treated with OPAT at medical respite. There were 19 (36%) failures, which included nonadherent patients, some of whom required urgent readmission (Table 2). There were a total of 16 readmissions, and 10 of those were considered OPAT failures, whereas the other 6 were not (patients admitted for other reasons including, surgery, and IV malfunction). Of the total readmissions, 12 of those were current or remote IDU patients. There is a trend toward a higher prevalence of current/remote IDU among those with clinical failure (15/19, 79%) compared to those with clinical success (22/34, 65%) (P = 0.2788). Overall, 27 (51%) patients were switched to oral therapy after completing an initial IV course. Oral agents used were: trimethoprim‐sulfamethoxazole, rifampin, doxycycline, fluconazole, linezolid, fluoroquinolones, and amoxicillin/clavulanic acid. The average length of OPAT was 22 days. The average daily cost of an acute‐care bed day in 2015 was $1500 at our institution. The cost savings to our institution (using $1500/day inpatient cost compared to $350 per day at medical respite) was $25,000 per episode of OPAT.
| No. of Episodes of Care, n = 53 (%) | |
|---|---|
| |
| Successfully treated at medical respite | 34 (64%) |
| Nonadherent to therapy | 19 (36%) |
| Left respite with IV line in place | 6 [2 admitted, 3 orals, 1 lost] |
| Missed IV doses and switched to orals | 5 |
| Missed IV doses and admitted | 8 admitted |
| Any hospital readmission | 16 (30%) |
| Readmissions, assumed failures | 10 (19%) |
| PICC‐lineassociated infection/bacteremia | 2 |
| SIRS with suspected line infection | 2 |
| Ongoing IDU /discharge from respite | 2 |
| Nonadherent with OPAT/altercations | 3 |
| Acute kidney injury | 1 |
| Readmissions, not counted as failures | 6 (11%) |
| PICC malfunction (leaking) | 2 [1 had further OPAT] |
| Surgery | 4 [3 had further OPAT] |
During the course of OPAT, 7 (13%) patients experienced an adverse event. Of those, we had 1 patient with drug rash, 1 with nausea, and 1 with diarrhea (not infectious). One patient developed leukopenia (white blood cells <4.0), and 2 patients developed neutropenia (absolute neutrophils <750). One patient developed significant elevation of creatinine(>1.9 upper limit of normal) and required inpatient admission. An additional 5 patients had a small elevation of creatinine that did not meet the criteria listed above and were not counted as adverse events by definition. At the study conclusion, 36 (68%) patients had no recurrence of infection at the most recent follow‐up visit at HMC; length of follow‐up ranged from 2 months to 2.5 years. One patient later died of nonOPAT‐related complications. In total, 11 (21%) patients were lost to follow‐up, 1 with a peripherally inserted central catheter line in place.
DISCUSSION
We demonstrated that 87% of homeless patients were able to complete a defined course of antibiotic therapy, and 64% were successfully treated with OPAT at medical respite. To our knowledge this is the first study evaluating this specific population in which OPAT was received at medical respite. Our rate of adverse events (some that required change in drug therapy) was similar to other OPAT studies in the published literature, ranging from 3% to 10% in 1 study,[3] and up to 11% in another.[11] Our total readmission rate of 30% was similar to what current literature suggests, ranging from 9%[11] up to 26%[12] for OPAT patients. Notably, 11% of the readmissions were not related to OPAT failure. This supports the recommendation for close scrutiny of social behaviors in the OPAT patient‐selection process; however, in certain circumstances, IDU alone may not be a reason to fully exclude someone from OPAT candidacy. Careful review of substance abuse history and evaluation of psychosocial factors, such as housing status, mental health history, and outpatient support system are needed. Furthermore, an evaluation of the patient's willingness to comply with care agreements while an inpatient and at respite, and ensuring appropriate resources for chemical dependency treatment are needed. Early consideration of oral antimicrobial options if the patient is readmitted for complications/nonadherence should be encouraged.
Our findings are consistent with results reported by Ho and colleagues, which demonstrated a success rate of 97% of IDU OPAT patients.[13] They carefully chose 29 study patients from 906 in their OPAT program over several years, giving them daily infusions under close supervision. Patients signed an agreement to refrain from accessing their IV lines for drug use. Special security seals were used on all connections and tubing to prevent line tampering. Medical respite in King County uses a similar technique, using a Tegaderm dressing to cover all valves and tubing junction sites to prevent tampering. The IV lines are inspected daily, and ID providers were contacted to discuss any patients suspicious of tampering with their lines to discuss next appropriate steps, either readmission or transition to oral antibiotics. Half of our patients were switched to oral therapy during their course, consistent with current literature.[12, 14]
Traditionally, homeless patients requiring ongoing parenteral therapy have remained inpatients for the duration of their course. Feigal and colleagues evaluated the connection between homelessness and inpatient discharge delays for placement over a 6‐month period in 2009 at an urban hospital.[15] They found homeless patients awaiting placement had an increased median LOS of 26 days, compared to housed individuals with 14 days. Homeless patients without a psychiatric disorder had a delay in discharge 60% longer compared to those with housing, with data adjusted for multiple variables. The cause for delay in discharge in homeless patients was found in those awaiting group home or nursing facility placement, in 50% of cases, whereas delay for chemical dependency program was in 17% of cases, and other local treatment center in 12% of cases.
Medical respite programs are gaining in popularity in the United States since they began in the mid‐1980s.[16] A review by Doran and colleagues found medical respite can result in cost avoidance for hospitals by limiting inpatient days and readmissions.[17] Medical respite can also help engage patients in follow‐up care and assist with housing placement. Many programs promote safe IDU practices and offer referrals for rehabilitation programs, both of which are programs that are not available in most hospitals. Medical respite may continue to be a site of OPAT expansion, as there is continued pressure to discharge nonacute patients from the hospital. Moving forward, it may be beneficial for hospitals, public health departments, and communities to support these programs, which can assist with close monitoring of homeless patients receiving OPAT.
There were several limitations in our study. This was a retrospective observational study with a small patient population comprised of a high prevalence of current and remote IDU. The single center study makes it difficult to generalize to other settings. In addition, there were no comparative data with historical controls, making it difficult to perform comparative analysis.
OPAT is effective for many patients, and it is optimal to utilize ID consultation to determine appropriate candidacy,[3, 4, 5] particularly among IDU. OPAT can be successful in a closely monitored medical respite setting for homeless patients with the help of a multidisciplinary team. Medical respite OPAT can decrease inpatient stays in patients who would otherwise require long hospitalizations, resulting in overall cost savings, and may lead to improved patient satisfaction. Future research linking other outcomes of medical respite OPAT, including substance‐dependence treatment and transition to housing, is warranted.
Acknowledgements
The authors thank the staff at the Harborview Medical Center Infectious Disease Clinic and at Edward Thomas House Medical Respite for their help in this study.
Disclosures: Presented at the oral abstract session Clinical Practice IssuesOPAT in Diverse Populations, IDWeek, October 812, 2014, Philadelphia, Pennsylvania. The authors report no conflicts of interest.
- , , , et al. Experience of infectious diseases consultants with outpatient parenteral antimicrobial therapy: results of an emerging infections network survey. Clin Infect Dis. 2006;43:1290–1295.
- , , , et al. Randomized controlled trial of intravenous antibiotic therapy for cellulitis at home compared with hospital. BMJ. 2005;330:129.
- , , , et al. Practice guidelines for outpatient parenteral antimicrobial therapy. IDSA guidelines. Clin Infect Dis. 2004;38:1651–1672.
- , , . Mandatory infectious diseases approval of outpatient parenteral antimicrobial therapy (OPAT): clinical and economic outcomes of averted cases. J Antimicrob Chemother. 2014;10:1093–1099.
- , , , . Are we ready for an outpatient parenteral antimicrobial therapy bundle? A critical appraisal of the evidence. Clin Infect Dis. 2013;57:419–424.
- , , , et al. Willingness to pay to access patient preferences for therapy in a Canadian setting. BMC Health Serv Res. 2005;5:43.
- UW Medicine. Respite program at Jefferson Terrace (Edward Thomas House). University of Washington website. Available at: http://www.uwmedicine.org/locations/respite‐program‐jefferson‐terrace. Accessed October 1, 2015.
- Boston Healthcare for the Homeless Program. Medical respite care at the Barbara McInnis House. Available at: http://www.bhchp.org/medical‐respite‐care. Accessed October 1, 2015.
- San Francisco Department of Public Health. Medical Respite and Sobering Center. Available at: https://www.sfdph.org/dph/comupg/oprograms/HUH/medrespite.asp. Accessed October 1, 2015.
- , , , , , . Research electronic data capture (REDCap)—a metadata‐driven methodology and workflow process for providing translational research informatics support. J Biomed Inform. 2009;42:377–381.
- , , . Outpatient parenteral antimicrobial therapy (OPAT) in a teaching hospital‐based practice: a retrospective cohort study describing experience and evolution over 10 years. Int J Antimicro Agents. 2012;39:407–413.
- , , , et al. Prediction model for 30‐day hospital readmissions among patients discharged receiving outpatient parenteral antibiotic therapy. Clin Infect Dis. 2014;58:812–819.
- , , , . Safe and successful treatment of intravenous drug users with a peripherally inserted central catheter in an outpatient parenteral antibiotic treatment service. J Antimicrob Chemother. 2010;65:2641–2644.
- , . Outpatient parenteral antimicrobial therapy and antimicrobial stewardship: challenges and checklists. J Antimicrob Chemother. 2015;70:965–970.
- , , , , , . Homelessness and discharge delays from an urban safety net hospital. Public Health. 2014;128:1033–1035.
- , , . Medical respite care for homeless people: a growing national phenomenon. J Health Care Poor Underserved. 2009;20:36–41.
- , , , . Medical respite programs for homeless patients: a systematic review. J Health Care Poor Underserved. 2013;24:499–524.
Prolonged hospitalizations for complex patients with severe infections and difficult social situations are becoming very common in many institutions. Outpatient parenteral antimicrobial therapy (OPAT) is widely used[1] and has been found to be a safe, efficient, and cost‐effective way to administer intravenous (IV) antimicrobial therapy to patients, with the potential to decrease hospital length of stay (LOS) and to improve patient satisfaction.[2] Infectious disease (ID) consultation should be involved to determine appropriate candidates for OPAT as well as a suitable drug regimen and duration of therapy,[3] or if oral alternatives can be utilized.[4] OPAT patients require close laboratory monitoring and provider follow‐up for the duration of their care. The combination of ID consultation, patient selection, laboratory monitoring, and follow‐up care have been described as part of a proposed OPAT bundle in recent medical literature.[5] Appropriate patient selection is a key component as to whether or not a patient will be successful with OPAT once discharged from the hospital. Current Infectious Diseases Society of America (IDSA) guidelines recommend that patients be evaluated for stable housing and ability to perform OPAT‐specific duties prior to discharge.[3]
To our knowledge there are no published data regarding the use of OPAT at a medical respite facility for homeless patients with co‐morbid substance abuse and mental illness issues. This may be due to perceived concerns of difficulty in administering OPAT to these disadvantaged patients for multiple reasons such as unstable or no housing, inability to stay engaged in medical care, and underlying mental illness and substance abuse problems. In particular, the concern for substance abuse, specifically injection drug use (IDU), is a significant problem. The current IDSA guidelines for OPAT recommend patients who are likely to abuse a vascular access system are poor candidates for OPAT.[3]
A major barrier to successful utilization of OPAT programs is the need for stable housing so that antibiotics can be administered in a safe setting. Recommending long‐term parenteral therapy as an inpatient for all patients who are homeless or have a history of IDU can lead to prolonged hospitalizations, increased healthcare costs, and contribute to conflicts between patients and staff. Chemical dependence treatment is not available in most inpatient settings, leaving patients with addiction issues without options. Most patients would prefer, when given the choice, to be treated with OPAT outside of the inpatient setting.[6]
This study aimed to evaluate our experience with administering OPAT to homeless patients at a medical respite facility and to determine if patients could complete a successful treatment course of antibiotics for a variety of illnesses.
METHODS
Harborview Medical Center (HMC) is a 413‐bed county hospital, and serves as a major teaching hospital for the University of Washington. It is a level 1 trauma/burn center for Washington, Wyoming, Alaska, Montana, and Idaho. The hospital has 61 psychiatric beds, 29 rehabilitation beds, and 89 intensive care unit beds, with over 60,000 emergency department visits per year. Harborview also serves as a public safety‐net hospital for King County, providing $219 million in charity care in 2013.
Housed in a building adjacent to HMC is a 34‐bed medical respite program,[7] which was established in 2011 through collaboration with King County and 6 other hospitals to serve the homeless population needing medical care, similar to programs in Boston[8] and San Francisco.[9] It is staffed by a multidisciplinary team from HMC including a physician, nurse practitioners, registered nurses, medical assistants, mental health specialists, case managers, and security guards, and accepts patients from all hospitals and clinics within King County. To qualify for medical respite, patient must be homeless and require ongoing nursing needs (ie, wound care, parenteral therapy). Referred patients are screened by a nurse prior to admission. The projected daily cost at medical respite is $350 per patient.
Medical respite is a harm‐reduction model, which includes information on needle exchange programs, narcan kits and education on safer injection practices. Resources are available for patients wishing to start a rehabilitation program, including opiate replacement therapy. Patients may leave the premises during the day, but a curfew is enforced at 9 pm nightly. Patients sign a contract on admission to refrain from using their IV line for IDU and peripherally‐inserted central catheter (PICC) port is secured and monitored for manipulation. Patients who exhibit threatening behavior or who use alcohol/drugs on site are discharged from the program. Patients in need of OPAT must keep nurse visits once or twice daily depending on medication and wound care. Medications needing more frequent dosing were placed on a battery‐operated pump and changed once every 24 hours by nursing.
After obtaining approval from the University of Washington Institutional Review Board, we performed a retrospective chart review of homeless patients over 18 years old discharged from HMC who received OPAT at medical respite from January 1, 2012 to January 1, 2014. There were no exclusions for race, gender, or insurance status. Patients included in the study were respite candidates, and required prolonged parenteral antibiotic therapy. Data collection was performed using a REDCap data collection tool and REDCap grant support.[10] Demographics, diagnosis, and comorbidities, including mental illness, current IDU at time of admission, and remote IDU (last use >3 months ago) were obtained from the electronic medical record. Surgical, microbiologic, and antimicrobial therapy, including route (IV or oral), duration of therapy, and adverse events were abstracted. Primary outcome was defined as successful completion of OPAT at medical respite without nonadherence to therapy or readmission (for presumed OPAT failure). A secondary outcome was antimicrobial course completion for a specific diagnosis defined by achieving goal duration of parenteral and/or oral antibiotic therapy as deemed appropriate by an ID provider. Nonadherence is defined as missing greater than 2 doses of scheduled antibiotic, absence from respite for greater than 24 hours, evidence of line tampering, or expulsion from respite for violation of care agreement. Recurrence of infection was defined as subsequent infection at the same site, following completion of a prior antimicrobial course, at the most recent follow‐up visit.
Continuous variables are expressed as the mean standard deviation, and categorical variables are expressed as the proportion of the entire population. Categorical variables are compared using the 2 test. A 2‐sided P value of <0.05 was considered statistically significant.
RESULTS
Fifty‐one homeless patients were identified with 53 episodes of OPAT between January 1, 2012 and January 1, 2014. For ease of reporting, the number of episodes of OPAT (n = 53) was used as the denominator instead of number of patients (n = 51) for descriptive statistics. The average age was 45 10.4 years (range, 2262 years), 38 (72%) patients were male, and 39 (74%) were Caucasian. Comorbidities included 28 (53%) patients with current IDU and 9 (17%) with a remote history of IDU, 32 (60%) with hepatitis C infection, and 14 (26%) with mental illness (Table 1).
| Comorbidities | No. per Patient Episode, n = 53 (%) |
|---|---|
| |
| Hepatitis C infection | 32 (60%) |
| Current IDU | 28 (53%) |
| Psychiatric/mental illness | 14 (26%) |
| Remote IDU | 9 (17%) |
| Hypertension | 7 (13%) |
| Diabetes type 1 or type 2 | 5 (9%) |
| Rheumatologic diagnosis | 3 (6%) |
| Obesity | 2 (4%) |
| Cardiovascular disease | 2 (4%) |
| Peripheral vascular disease | 2 (4%) |
| Congestive heart failure | 2 (4%) |
| Chronic kidney disease (any stage) | 1 (2%) |
| HIV | 1 (2%) |
Forty‐six (87%) patients were evaluated by an ID physician during their admission. Diagnosis (some patients had multiple) requiring OPAT included: bacteremia in 28, osteomyelitis in 22, skin and soft tissue infection in 19, endocarditis in 15, and epidural abscess in 7 patients. Twenty‐nine patients underwent surgical intervention. The pathogens recovered were primarily gram‐positive organisms. Multidrug resistant organisms were isolated in 11 patients. The IV medications used included vancomycin, nafcillin, cefazolin, ertapenem, and daptomycin.
Forty‐six (87%) patients completed a defined course of antibiotic therapy (deemed appropriate therapy by an ID physician) for their specific infection. Thirty‐four (64%) patients were successfully treated with OPAT at medical respite. There were 19 (36%) failures, which included nonadherent patients, some of whom required urgent readmission (Table 2). There were a total of 16 readmissions, and 10 of those were considered OPAT failures, whereas the other 6 were not (patients admitted for other reasons including, surgery, and IV malfunction). Of the total readmissions, 12 of those were current or remote IDU patients. There is a trend toward a higher prevalence of current/remote IDU among those with clinical failure (15/19, 79%) compared to those with clinical success (22/34, 65%) (P = 0.2788). Overall, 27 (51%) patients were switched to oral therapy after completing an initial IV course. Oral agents used were: trimethoprim‐sulfamethoxazole, rifampin, doxycycline, fluconazole, linezolid, fluoroquinolones, and amoxicillin/clavulanic acid. The average length of OPAT was 22 days. The average daily cost of an acute‐care bed day in 2015 was $1500 at our institution. The cost savings to our institution (using $1500/day inpatient cost compared to $350 per day at medical respite) was $25,000 per episode of OPAT.
| No. of Episodes of Care, n = 53 (%) | |
|---|---|
| |
| Successfully treated at medical respite | 34 (64%) |
| Nonadherent to therapy | 19 (36%) |
| Left respite with IV line in place | 6 [2 admitted, 3 orals, 1 lost] |
| Missed IV doses and switched to orals | 5 |
| Missed IV doses and admitted | 8 admitted |
| Any hospital readmission | 16 (30%) |
| Readmissions, assumed failures | 10 (19%) |
| PICC‐lineassociated infection/bacteremia | 2 |
| SIRS with suspected line infection | 2 |
| Ongoing IDU /discharge from respite | 2 |
| Nonadherent with OPAT/altercations | 3 |
| Acute kidney injury | 1 |
| Readmissions, not counted as failures | 6 (11%) |
| PICC malfunction (leaking) | 2 [1 had further OPAT] |
| Surgery | 4 [3 had further OPAT] |
During the course of OPAT, 7 (13%) patients experienced an adverse event. Of those, we had 1 patient with drug rash, 1 with nausea, and 1 with diarrhea (not infectious). One patient developed leukopenia (white blood cells <4.0), and 2 patients developed neutropenia (absolute neutrophils <750). One patient developed significant elevation of creatinine(>1.9 upper limit of normal) and required inpatient admission. An additional 5 patients had a small elevation of creatinine that did not meet the criteria listed above and were not counted as adverse events by definition. At the study conclusion, 36 (68%) patients had no recurrence of infection at the most recent follow‐up visit at HMC; length of follow‐up ranged from 2 months to 2.5 years. One patient later died of nonOPAT‐related complications. In total, 11 (21%) patients were lost to follow‐up, 1 with a peripherally inserted central catheter line in place.
DISCUSSION
We demonstrated that 87% of homeless patients were able to complete a defined course of antibiotic therapy, and 64% were successfully treated with OPAT at medical respite. To our knowledge this is the first study evaluating this specific population in which OPAT was received at medical respite. Our rate of adverse events (some that required change in drug therapy) was similar to other OPAT studies in the published literature, ranging from 3% to 10% in 1 study,[3] and up to 11% in another.[11] Our total readmission rate of 30% was similar to what current literature suggests, ranging from 9%[11] up to 26%[12] for OPAT patients. Notably, 11% of the readmissions were not related to OPAT failure. This supports the recommendation for close scrutiny of social behaviors in the OPAT patient‐selection process; however, in certain circumstances, IDU alone may not be a reason to fully exclude someone from OPAT candidacy. Careful review of substance abuse history and evaluation of psychosocial factors, such as housing status, mental health history, and outpatient support system are needed. Furthermore, an evaluation of the patient's willingness to comply with care agreements while an inpatient and at respite, and ensuring appropriate resources for chemical dependency treatment are needed. Early consideration of oral antimicrobial options if the patient is readmitted for complications/nonadherence should be encouraged.
Our findings are consistent with results reported by Ho and colleagues, which demonstrated a success rate of 97% of IDU OPAT patients.[13] They carefully chose 29 study patients from 906 in their OPAT program over several years, giving them daily infusions under close supervision. Patients signed an agreement to refrain from accessing their IV lines for drug use. Special security seals were used on all connections and tubing to prevent line tampering. Medical respite in King County uses a similar technique, using a Tegaderm dressing to cover all valves and tubing junction sites to prevent tampering. The IV lines are inspected daily, and ID providers were contacted to discuss any patients suspicious of tampering with their lines to discuss next appropriate steps, either readmission or transition to oral antibiotics. Half of our patients were switched to oral therapy during their course, consistent with current literature.[12, 14]
Traditionally, homeless patients requiring ongoing parenteral therapy have remained inpatients for the duration of their course. Feigal and colleagues evaluated the connection between homelessness and inpatient discharge delays for placement over a 6‐month period in 2009 at an urban hospital.[15] They found homeless patients awaiting placement had an increased median LOS of 26 days, compared to housed individuals with 14 days. Homeless patients without a psychiatric disorder had a delay in discharge 60% longer compared to those with housing, with data adjusted for multiple variables. The cause for delay in discharge in homeless patients was found in those awaiting group home or nursing facility placement, in 50% of cases, whereas delay for chemical dependency program was in 17% of cases, and other local treatment center in 12% of cases.
Medical respite programs are gaining in popularity in the United States since they began in the mid‐1980s.[16] A review by Doran and colleagues found medical respite can result in cost avoidance for hospitals by limiting inpatient days and readmissions.[17] Medical respite can also help engage patients in follow‐up care and assist with housing placement. Many programs promote safe IDU practices and offer referrals for rehabilitation programs, both of which are programs that are not available in most hospitals. Medical respite may continue to be a site of OPAT expansion, as there is continued pressure to discharge nonacute patients from the hospital. Moving forward, it may be beneficial for hospitals, public health departments, and communities to support these programs, which can assist with close monitoring of homeless patients receiving OPAT.
There were several limitations in our study. This was a retrospective observational study with a small patient population comprised of a high prevalence of current and remote IDU. The single center study makes it difficult to generalize to other settings. In addition, there were no comparative data with historical controls, making it difficult to perform comparative analysis.
OPAT is effective for many patients, and it is optimal to utilize ID consultation to determine appropriate candidacy,[3, 4, 5] particularly among IDU. OPAT can be successful in a closely monitored medical respite setting for homeless patients with the help of a multidisciplinary team. Medical respite OPAT can decrease inpatient stays in patients who would otherwise require long hospitalizations, resulting in overall cost savings, and may lead to improved patient satisfaction. Future research linking other outcomes of medical respite OPAT, including substance‐dependence treatment and transition to housing, is warranted.
Acknowledgements
The authors thank the staff at the Harborview Medical Center Infectious Disease Clinic and at Edward Thomas House Medical Respite for their help in this study.
Disclosures: Presented at the oral abstract session Clinical Practice IssuesOPAT in Diverse Populations, IDWeek, October 812, 2014, Philadelphia, Pennsylvania. The authors report no conflicts of interest.
- , , , et al. Experience of infectious diseases consultants with outpatient parenteral antimicrobial therapy: results of an emerging infections network survey. Clin Infect Dis. 2006;43:1290–1295.
- , , , et al. Randomized controlled trial of intravenous antibiotic therapy for cellulitis at home compared with hospital. BMJ. 2005;330:129.
- , , , et al. Practice guidelines for outpatient parenteral antimicrobial therapy. IDSA guidelines. Clin Infect Dis. 2004;38:1651–1672.
- , , . Mandatory infectious diseases approval of outpatient parenteral antimicrobial therapy (OPAT): clinical and economic outcomes of averted cases. J Antimicrob Chemother. 2014;10:1093–1099.
- , , , . Are we ready for an outpatient parenteral antimicrobial therapy bundle? A critical appraisal of the evidence. Clin Infect Dis. 2013;57:419–424.
- , , , et al. Willingness to pay to access patient preferences for therapy in a Canadian setting. BMC Health Serv Res. 2005;5:43.
- UW Medicine. Respite program at Jefferson Terrace (Edward Thomas House). University of Washington website. Available at: http://www.uwmedicine.org/locations/respite‐program‐jefferson‐terrace. Accessed October 1, 2015.
- Boston Healthcare for the Homeless Program. Medical respite care at the Barbara McInnis House. Available at: http://www.bhchp.org/medical‐respite‐care. Accessed October 1, 2015.
- San Francisco Department of Public Health. Medical Respite and Sobering Center. Available at: https://www.sfdph.org/dph/comupg/oprograms/HUH/medrespite.asp. Accessed October 1, 2015.
- , , , , , . Research electronic data capture (REDCap)—a metadata‐driven methodology and workflow process for providing translational research informatics support. J Biomed Inform. 2009;42:377–381.
- , , . Outpatient parenteral antimicrobial therapy (OPAT) in a teaching hospital‐based practice: a retrospective cohort study describing experience and evolution over 10 years. Int J Antimicro Agents. 2012;39:407–413.
- , , , et al. Prediction model for 30‐day hospital readmissions among patients discharged receiving outpatient parenteral antibiotic therapy. Clin Infect Dis. 2014;58:812–819.
- , , , . Safe and successful treatment of intravenous drug users with a peripherally inserted central catheter in an outpatient parenteral antibiotic treatment service. J Antimicrob Chemother. 2010;65:2641–2644.
- , . Outpatient parenteral antimicrobial therapy and antimicrobial stewardship: challenges and checklists. J Antimicrob Chemother. 2015;70:965–970.
- , , , , , . Homelessness and discharge delays from an urban safety net hospital. Public Health. 2014;128:1033–1035.
- , , . Medical respite care for homeless people: a growing national phenomenon. J Health Care Poor Underserved. 2009;20:36–41.
- , , , . Medical respite programs for homeless patients: a systematic review. J Health Care Poor Underserved. 2013;24:499–524.
A Guide to Ultrasound of the Shoulder, Part 2: The Diagnostic Evaluation
The musculoskeletal (MSK) ultrasound evaluation of the shoulder provides a cost- and time-efficient imaging modality with similar diagnostic power as magnetic resonance imaging (MRI).1,2 Its portable point-of-care applications can be used in the office, in the operating room, and in sideline athletic event coverage, as we discussed in Part 1 of this series.3
MSK ultrasound may seem difficult and daunting, and many articles have quoted steep learning curves.4,5 However, in our experience in teaching many ultrasound courses, this modality can be learned quite quickly with the proper instruction. Physicians are already familiar with anatomy and usually have had some exposure to MRI.4 Taking courses in MSK ultrasound or simply learning the basic concepts of ultrasound and then learning the machine controls is usually a good start.5-8 Practice scanning normal individuals, comparing the images from an MRI to learn how to reproduce the same planes and images. This will allow the user to become familiar with normal anatomy and how to see the images on the ultrasound screen.5-8 Vollman and colleagues9 showed that in trainees, combining MRI images with sonograms enhances the ability to correctly identify MSK ultrasound anatomy from 40.9% to 72.5%, when compared with learning from ultrasound images alone.
There are currently no certifications necessary to perform ultrasound scans or bill for them; however, some insurance carriers may require demonstrating relevant, documented training for reimbursement.3 Various organizations are trying to develop certifications and regulations for ultrasound to standardize the use of this modality. In the United States, the American Institute of Ultrasound in Medicine (AIUM) and the American Registry for Diagnostic Medical Sonography (ARDMS) provide guidelines and particular MSK ultrasound certifications.10,11
Basic Ultrasound Principles
The ultrasound machine creates electrical impulses that are turned into sound waves by piezoelectric crystals at the probe’s footprint. These sound waves bounce off tissues and return to the probe, where they are converted electronically to an image on the monitor. Depending on the echogenicity of the scanned tissue, the ultrasound beam will either reflect or be absorbed at different rates. This variance is transmitted on the monitor as a grayscale image. When ultrasound waves are highly reflective, like in bone or fat, they are characterized as hyperechoic. The opposite occurs when ultrasound waves are absorbed like in the fluid of a cystic cavity or joint effusion, and the image appears black. This is described as anechoic.12 Intermediate tissues such as tendons that are less reflective are seen as hypoechoic and appear gray. When a tissue has a similar echogenicity to its surrounding tissues, it is called isoechoic.12
The transducer is the scanning component of the ultrasound machine. Transducers come in 2 shapes: linear and curvilinear. The linear probe creates a straight image that is equal to the size of the transducer footprint. The curvilinear probe creates a wider, wedge-shaped panoramic image.
Linear probes are of higher frequency and generate higher resolution images of shallower structures, while curvilinear probes have greater depth penetration but generate lower resolution images. A high frequency of 10 to 15 MHz is preferred for anatomy between 2 cm to 4 cm depth.13 Midrange frequency of 5 to 10 MHz is preferred at 5 cm to 6 cm depth, and low-frequency 2 to 5 MHz probes are preferred for anatomical structures >6 cm depth.13
Anisotropy is the property of being directionally dependent, as opposed to isotropy, which implies identical properties in all directions. This anisotropic effect is dependent on the angle of the insonating beam. The maximum return echo occurs when the ultrasound beam is perpendicular to the tendon. Decreasing the insonating angle on a normal tendon will cause it to change from brightly hyperechoic (the actual echo from tightly bound tendon fibers) to darkly hypoechoic. If the angle is then increased, the tendon will again appear hyperechoic. If the artifact causes a normal tendon to appear hypoechoic, it may falsely lead to a diagnosis of tendinosis or tear.
Posterior acoustic shadowing is present when a hyperechoic structure reflects the ultrasound beam so much that it creates a dark shadow underneath it.12,14 This phenomenon is possible since the ultrasound beam cannot penetrate the hyperechoic structure and reflects off its inferior tissues. Reverberation is when the beam is repeated back and forth between 2 parallel highly reflective surfaces. The initial reflection will be displayed correctly, while the subsequent ultrasound waves will be delayed and appear at a farther distance from the transducer.12,14
The point where the beam is at its narrowest point generates the section of the image that is best visualized.15 This is called the focal zone, and it can be adjusted to highlight the desired area of evaluation. Gain controls adjust the amount of black, gray, and white on the monitor and can be adjusted to focus the desired image.13 Depth settings are fundamental in finding the desired targets. It is recommended to start with a higher depth setting to get an overview and progressively decrease the depth to key in on the desired anatomy.13 Color Doppler can be used to view movement within structures and to identify vessels, synovitis, and neovascularization in tendinopathy.13
Ultrasound of the Shoulder
Patients should be seated, if possible, on a rotating seat. The examiner’s shoulder should be higher than the patient’s shoulder.16 The user holds the ultrasound probe between the thumb and index fingers while resting the hypothenar eminence on the patient to serve as a fulcrum and steadying force. The examination should take 5 to 15 minutes, depending on the examiner’s expertise and the amount of anatomy being scanned.
Examining the body requires knowledge of anatomy. The examination and accuracy are determined by the technician using the probe. The probe can be angled any direction and be placed obliquely on the subject. The advantage here is that anatomy in the human body is not always planar. Muscles and tissues can run obliquely or even perpendicular to each other. When evaluating anatomy, the examiner should keep in mind what structure he or she is looking for; where it should be found; what landmarks can be used to easily locate it; what orientation it has; and what the normal anatomy should look like.
Muscle appears as a lattice with larger areas of hypoechoic muscle tissue and hyperechoic fascial perimysium layers traversing through it.17 The actual muscle tissue appears hypoechoic from the fluid or blood found within. Scarring, fibrosis, calcification, or chronic injury will change the tissue to appear denser or hyperechoic.17 Acute injury will appear hypoechoic from the inflammatory response and influx of blood. Tendon appears dense and hyperechoic with striations within the tissue, sometimes referred to as a horse’s tail.17 When torn, there will be a disassociation of the tissue with a hypoechoic region between the 2 ends. The attachment to the bone and muscle tissue should appear uniform. Hyperechoic areas within the tendon may be from calcification. Ligament appears similar to tendon but is more isoechoic and connects bone to bone. Evaluation of the entire length and the attachments to the bone are critical to evaluate for disease.
Bone appears bright hyperechoic, smooth, and flat, while hyaline cartilage is hypoechoic, smooth, and runs superiorly in a parallel pattern to its respective inferior cortical bone.17
Fibrocartilage is hyperechoic and typically triangularly shaped, such as in the glenohumeral labrum. Nerves appear fascicular and hypoechoic surrounded by hyperechoic epineurium.14
The epidermis and dermis are the most superficial structure on top of the screen, and are also hyperechoic.17
The Diagnostic Shoulder Examination
The proximal long head of the biceps tendon (LHBT) is the easiest structure in the shoulder to identify because of the anatomic structure, the bicipital groove. By keeping the arm relaxed, perpendicular to the ground, and in neutral rotation, the probe can be placed perpendicular to the arm over the proximal shoulder (Figure 1A).16-20 By finding the groove, the biceps tendon will usually be found resting within the groove (Figure 1B). This is the short axis view and is equivalent to an MRI in the axial plane.
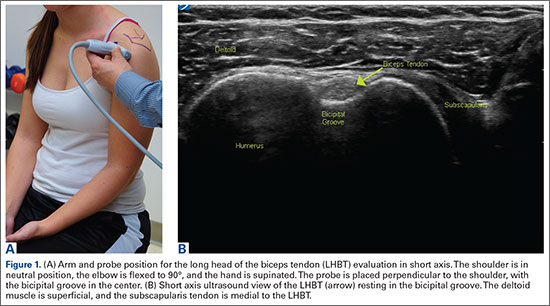
The long axis view of the proximal biceps tendon is found by keeping the tendon in the center of the screen/probe. The probe is then rotated 90° on its center axis, keeping the tendon centered on the probe. The user should be sure to visualize the entire tendon on the screen. If only part of the tendon is seen along only part of the screen, then the probe is oblique to the tendon. In this case, the probe area showing the tendon must be stabilized as the center or set point. The other part of the probe will then pivot until all of the tendon is seen on the screen. The MRI equivalent to the long axis of the proximal biceps tendon is the sagittal view.
Ultrasound is a dynamic evaluation. Moving the probe or moving the patient will change what and how something is imaged. The proximal biceps tendon is a good example of this concept. The bicipital groove is very deep proximally and flattens out as it travels distally to the mid-humerus. The examiner should continually adjust his or her hand/probe/patient position as well as depth/gain and other console functions to adapt to the dynamics of the scan. While keeping the bicep tendon in a short axis view, the tendon can be dynamically evaluated for subluxation by internally and externally rotating the arm.
To find the subscapularis, the arm remains in a neutral position with the hand supinated and the probe is held parallel with the ground. After finding the bicipital groove, the subscapularis tendon insertion is just medial to the groove (Figure 1B). By externally rotating the arm, the subscapularis tendon/muscle will come into a long axis view.16-20 The MRI equivalent to the long axis view of the subscapularis is the axial view. Dynamic testing can be done by internally and externally rotating the arm to evaluate for impingement of the subscapularis tendon as it slides underneath the coracoid process. To view the subscapularis tendon in short axis, the tendon is kept in the center of the screen/probe, and the probe is then rotated 90° on its center axis, keeping the tendon centered on the probe. The MRI equivalent is the sagittal view.
Some have recommended using the modified Crass or Middleton position to evaluate the supraspinatus, where the hand is in the “back pocket”.19 However, many patients with shoulder pain have trouble with this position. By resting the ipsilateral hand on the ipsilateral hip and then dropping the elbow, the supraspinatus insertion can still be brought out from under the acromion. This does bring the insertion anterior out of the scapular plane, so an adjustment is required in probe positioning to properly see the supraspinatus short and long axis. To find the long axis, the probe is placed parallel to a plane that spans the contralateral shoulder and ipsilateral hip (Figure 2A). The fibers of the supraspinatus should be inserting directly lateral to the humeral head without any intervening space (Figure 2B). If any space exists, a partial articular supraspinatus tendon avulsion (PASTA) lesion is present, and its thickness can be directly measured. Moving more posterior will show the flattening of the tuberosity and the fibers of the infraspinatus moving away from the humeral head—the bare spot. The MRI equivalent is the coronal view.
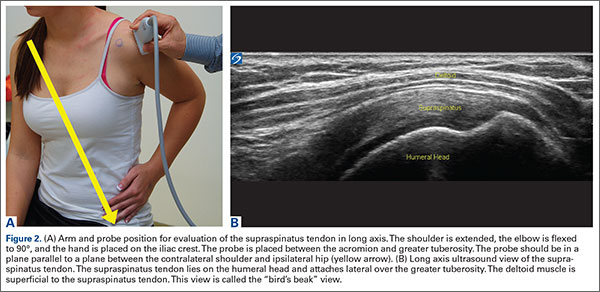
To view the supraspinatus tendon in short axis, maintain the arm in the same position, keeping the tendon in the center of the screen/probe. The probe is then rotated 90° on its center axis, keeping the tendon centered on the probe. The probe should now be in a parallel plane between the ipsilateral shoulder and the contralateral hip. The biceps tendon in cross-section will be found anteriorly, and the articular cartilage will appear as a black layer over the bone. Dynamic testing includes placing the probe in a coronal plane between the acromion and greater tuberosity. When the patient abducts the arm while in internal rotation, the supraspinatus tendon will slide underneath the coracoacromial arch showing potential external impingement.15 The MRI equivalent is the sagittal plane.
The glenohumeral joint is best viewed posteriorly, limiting how much of the intra-articular portion of the joint can be imaged. The arm remains in a neutral position; palpate for the posterior acromion and place the probe just inferior to it, wedging up against it (Figure 3A). The glenohumeral joint will be seen by keeping the probe parallel to the ground (Figure 3B). The MRI equivalent is the axial plane. If a joint effusion exists, it can be seen in the posterior recess.15 A hyperechoic triangular region in between the humeral head and the glenoid will represent the glenoid labrum (Figure 3B). By internally and externally rotating the arm, the joint and labrum complex can be dynamically examined. From the labrum, scanning superior and medial can sometimes show the spinoglenoid notch where a paralabral cyst might be seen.15
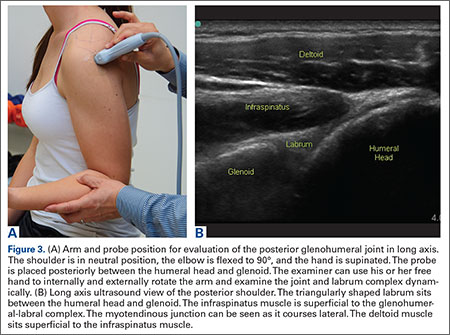
Using the glenohumeral joint as a reference, the infraspinatus muscle is easily visualized. Maintaining the arm in neutral position with the probe over the glenohumeral joint, the infraspinatus will become apparent as it lays in long axis view superficially between the posterior deltoid and glenohumeral joint (Figure 3B).16-20 The teres minor lies just inferiorly. The MRI equivalent is the axial plane. To view the infraspinatus and teres minor in short axis, the probe is then rotated 90° on its center axis. The infraspinatus (superiorly) and teres minor (inferiorly) muscles will be visible in short axis within the infraspinatus fossa.15 The MRI equivalent is the sagittal view.
The acromioclavicular joint is superficial and easy to image. The arm remains in a neutral position, and we can palpate the joint for easy localization. The probe is placed anteriorly in a coronal plane over the acromion and clavicle. By scanning anteriorly and posteriorly, a joint effusion referred to as a Geyser sign might be seen. The MRI equivalent is the coronal view.
Available Certifications
The AIUM certification is a voluntary peer reviewed process that acknowledges that a practice is meeting national standards and aids in improving their respective MSK ultrasound protocols. They also provide guidelines on demonstrating training and competence on performing and/or interpreting diagnostic MSK examinations (Table).10 The ARDMS certification provides an actual individual certification referred to as “Registered” in MSK ultrasound.11 The physician must perform 150 diagnostic MSK ultrasound evaluations within 36 months of applying and pass a 200-question examination that is offered twice per year.11 None of these certifications are mandated by the American Medical Association (AMA) or American Osteopathic Association (AOA).
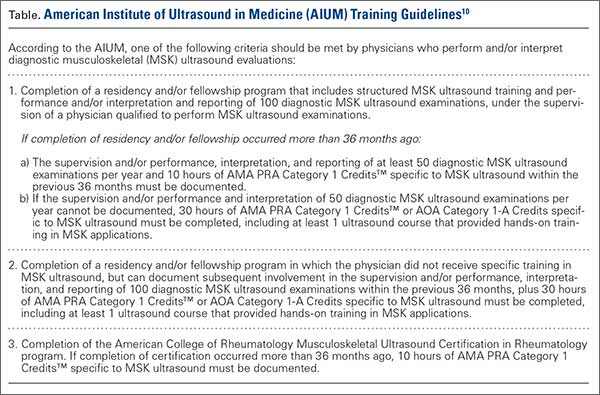
Maintenance and Continuing Medical Education (CME)
The AIUM recommends that a minimum of 50 diagnostic MSK ultrasound evaluations be performed per year for skill maintenance.10 Furthermore, 10 hours of AMA PRA Category 1 Credits™ or American Osteopathic Association Category 1-A Credits specific to MSK ultrasound must be completed by physicians performing and/or interpreting these examinations every 3 years.10 ARDMS recommends a minimum of 30 MSK ultrasound-specific CMEs in preparation for their “Registered” MSK evaluation.1
Conclusion
MSK ultrasound is a dynamic, real-time imaging modality that can improve cost efficiency and patient care. Its portability allows for its use anywhere. Learning the skill may seem daunting, but with the proper courses and education, the technology can be easily learned. By correlating a known modality like MRI, the user will easily begin to read ultrasound images. No current certification is needed to use or bill for ultrasound, but various institutions are developing criteria and testing. Two organizations, AIUM and ARDMS, provide guidelines and certifications to demonstrate competency, which may become necessary in the very near future.
1. Sivan M, Brown J, Brennan S, Bhakta B. A one-stop approach to the management of soft tissue and degenerative musculoskeletal conditions using clinic-based ultrasonography. Musculoskeletal Care. 2011;9(2):63-68.
2. Roy J-S, Braën C, Leblond J, et al. Diagnostic accuracy of ultrasonography, MRI and MR arthrography in the characterization of rotator cuff disorders: a meta-analysis [published online ahead of print February 11, 2015]. Br J Sports Med. doi:10.1136/bjsports-2014-094148.
3. Hirahara AM, Panero AJ. A guide to ultrasound of the shoulder, part 1: coding and reimbursement. Am J Orthop. 2016;45(3):176-182.
4. Hama M, Takase K, Ihata A, et al. Challenges to expanding the clinical application of musculoskeletal ultrasonography (MSUS) among rheumatologists: from a second survey in Japan. Mod Rheumatol. 2012;2:202-208.
5. Smith MJ, Rogers A, Amso N, Kennedy J, Hall A, Mullaney P. A training, assessment and feedback package for the trainee shoulder sonographer. Ultrasound. 2015;23(1):29-41.
6. Delzell PB, Boyle A, Schneider E. Dedicated training program for shoulder sonography: the results of a quality program reverberate with everyone. J Ultrasound Med. 2015;34(6):1037-1042.
7. Finnoff JT, Berkoff D, Brennan F, et al. American Medical Society for Sports Medicine (AMSSM) recommended sports ultrasound curriculum for sports medicine fellowships. PM R. 2015;7(2)e1-e11.
8. Adelman S, Fishman P. Use of portable ultrasound machine for outpatient orthopedic diagnosis: an implementation study. Perm J. 2013;17(3):18-22.
9. Vollman A, Hulen R, Dulchavsky S, et al. Educational benefits of fusing magnetic resonance imaging with sonograms. J Clin Ultrasound. 2014;42(5) 257-263.
10. Training guidelines for physicians and chiropractors who evaluate and interpret diagnostic musculoskeletal ultrasound examinations. Laurel, MD: American Institute of Ultrasound in Medicine; 2014. http://www.aium.org/resources/viewStatement.aspx?id=51. Accessed February 26, 2016.
11. Registered in musculoskeletal (RMSK) sonography. American Registry for Diagnostic Medical Sonography Web site. http://www.ardms.org/get-certified/RMSK/Pages/RMSK.aspx. Accessed February 26, 2016.
12. Silkowski C. Ultrasound nomenclature, image orientation, and basic instrumentation. In: Abraham D, Silkowski C, Odwin C, eds. Emergency Medicine Sonography Pocket Guide to Sonographic Anatomy and Pathology. Sudbury, MA: Jones and Bartlett; 2010:1-24.
13. Ihnatsenka B, Boezaart AP. Ultrasound: basic understanding and learning the language. Int J Shoulder Surg. 2010;4(3):55-62.
14. Taljanovic MS, Melville DM, Scalcione LR, Gimber LH, Lorenz EJ, Witte RS. Artifacts in musculoskeletal ultrasonography. Semin Musculoskelet Radiol. 2014;18(1):3-11.
15. Ng A, Swanevelder J. Resolution in ultrasound imaging. Continuing Educ Anaesth Crit Care Pain. 2011;11(5):186-192. http://ceaccp.oxfordjournals.org/content/11/5/186.full. Accessed March 3, 2016.
16. Nazarian L, Bohm-Velez M, Kan JH, et al. AIUM practice parameters for the performance of a musculoskeletal ultrasound examination. Laurel, MD: American Institute of Ultrasound in Medicine; 2012. http://www.aium.org/resources/guidelines/musculoskeletal.pdf. Accessed February 26, 2016.
17. Jacobson J. Fundamentals of Musculoskeletal Ultrasound. 2nd edition. Philadelphia, PA: Elsevier Saunders; 2013.
18. The Ultrasound Subcommittee of the European Society of Musculoskeletal Radiology. Musculoskeletal ultrasound: technique guidelines. Insights Imaging. 2010;1:99-141.
19. Corazza A, Orlandi D, Fabbro E, et al. Dynamic high-resolution ultrasound of the shoulder: how we do it. Eur J Radiol. 2015;84(2):266-277.
20. Allen GM. Shoulder ultrasound imaging-integrating anatomy, biomechanics and disease processes. Eur J Radiol. 2008;68(1):137-146
The musculoskeletal (MSK) ultrasound evaluation of the shoulder provides a cost- and time-efficient imaging modality with similar diagnostic power as magnetic resonance imaging (MRI).1,2 Its portable point-of-care applications can be used in the office, in the operating room, and in sideline athletic event coverage, as we discussed in Part 1 of this series.3
MSK ultrasound may seem difficult and daunting, and many articles have quoted steep learning curves.4,5 However, in our experience in teaching many ultrasound courses, this modality can be learned quite quickly with the proper instruction. Physicians are already familiar with anatomy and usually have had some exposure to MRI.4 Taking courses in MSK ultrasound or simply learning the basic concepts of ultrasound and then learning the machine controls is usually a good start.5-8 Practice scanning normal individuals, comparing the images from an MRI to learn how to reproduce the same planes and images. This will allow the user to become familiar with normal anatomy and how to see the images on the ultrasound screen.5-8 Vollman and colleagues9 showed that in trainees, combining MRI images with sonograms enhances the ability to correctly identify MSK ultrasound anatomy from 40.9% to 72.5%, when compared with learning from ultrasound images alone.
There are currently no certifications necessary to perform ultrasound scans or bill for them; however, some insurance carriers may require demonstrating relevant, documented training for reimbursement.3 Various organizations are trying to develop certifications and regulations for ultrasound to standardize the use of this modality. In the United States, the American Institute of Ultrasound in Medicine (AIUM) and the American Registry for Diagnostic Medical Sonography (ARDMS) provide guidelines and particular MSK ultrasound certifications.10,11
Basic Ultrasound Principles
The ultrasound machine creates electrical impulses that are turned into sound waves by piezoelectric crystals at the probe’s footprint. These sound waves bounce off tissues and return to the probe, where they are converted electronically to an image on the monitor. Depending on the echogenicity of the scanned tissue, the ultrasound beam will either reflect or be absorbed at different rates. This variance is transmitted on the monitor as a grayscale image. When ultrasound waves are highly reflective, like in bone or fat, they are characterized as hyperechoic. The opposite occurs when ultrasound waves are absorbed like in the fluid of a cystic cavity or joint effusion, and the image appears black. This is described as anechoic.12 Intermediate tissues such as tendons that are less reflective are seen as hypoechoic and appear gray. When a tissue has a similar echogenicity to its surrounding tissues, it is called isoechoic.12
The transducer is the scanning component of the ultrasound machine. Transducers come in 2 shapes: linear and curvilinear. The linear probe creates a straight image that is equal to the size of the transducer footprint. The curvilinear probe creates a wider, wedge-shaped panoramic image.
Linear probes are of higher frequency and generate higher resolution images of shallower structures, while curvilinear probes have greater depth penetration but generate lower resolution images. A high frequency of 10 to 15 MHz is preferred for anatomy between 2 cm to 4 cm depth.13 Midrange frequency of 5 to 10 MHz is preferred at 5 cm to 6 cm depth, and low-frequency 2 to 5 MHz probes are preferred for anatomical structures >6 cm depth.13
Anisotropy is the property of being directionally dependent, as opposed to isotropy, which implies identical properties in all directions. This anisotropic effect is dependent on the angle of the insonating beam. The maximum return echo occurs when the ultrasound beam is perpendicular to the tendon. Decreasing the insonating angle on a normal tendon will cause it to change from brightly hyperechoic (the actual echo from tightly bound tendon fibers) to darkly hypoechoic. If the angle is then increased, the tendon will again appear hyperechoic. If the artifact causes a normal tendon to appear hypoechoic, it may falsely lead to a diagnosis of tendinosis or tear.
Posterior acoustic shadowing is present when a hyperechoic structure reflects the ultrasound beam so much that it creates a dark shadow underneath it.12,14 This phenomenon is possible since the ultrasound beam cannot penetrate the hyperechoic structure and reflects off its inferior tissues. Reverberation is when the beam is repeated back and forth between 2 parallel highly reflective surfaces. The initial reflection will be displayed correctly, while the subsequent ultrasound waves will be delayed and appear at a farther distance from the transducer.12,14
The point where the beam is at its narrowest point generates the section of the image that is best visualized.15 This is called the focal zone, and it can be adjusted to highlight the desired area of evaluation. Gain controls adjust the amount of black, gray, and white on the monitor and can be adjusted to focus the desired image.13 Depth settings are fundamental in finding the desired targets. It is recommended to start with a higher depth setting to get an overview and progressively decrease the depth to key in on the desired anatomy.13 Color Doppler can be used to view movement within structures and to identify vessels, synovitis, and neovascularization in tendinopathy.13
Ultrasound of the Shoulder
Patients should be seated, if possible, on a rotating seat. The examiner’s shoulder should be higher than the patient’s shoulder.16 The user holds the ultrasound probe between the thumb and index fingers while resting the hypothenar eminence on the patient to serve as a fulcrum and steadying force. The examination should take 5 to 15 minutes, depending on the examiner’s expertise and the amount of anatomy being scanned.
Examining the body requires knowledge of anatomy. The examination and accuracy are determined by the technician using the probe. The probe can be angled any direction and be placed obliquely on the subject. The advantage here is that anatomy in the human body is not always planar. Muscles and tissues can run obliquely or even perpendicular to each other. When evaluating anatomy, the examiner should keep in mind what structure he or she is looking for; where it should be found; what landmarks can be used to easily locate it; what orientation it has; and what the normal anatomy should look like.
Muscle appears as a lattice with larger areas of hypoechoic muscle tissue and hyperechoic fascial perimysium layers traversing through it.17 The actual muscle tissue appears hypoechoic from the fluid or blood found within. Scarring, fibrosis, calcification, or chronic injury will change the tissue to appear denser or hyperechoic.17 Acute injury will appear hypoechoic from the inflammatory response and influx of blood. Tendon appears dense and hyperechoic with striations within the tissue, sometimes referred to as a horse’s tail.17 When torn, there will be a disassociation of the tissue with a hypoechoic region between the 2 ends. The attachment to the bone and muscle tissue should appear uniform. Hyperechoic areas within the tendon may be from calcification. Ligament appears similar to tendon but is more isoechoic and connects bone to bone. Evaluation of the entire length and the attachments to the bone are critical to evaluate for disease.
Bone appears bright hyperechoic, smooth, and flat, while hyaline cartilage is hypoechoic, smooth, and runs superiorly in a parallel pattern to its respective inferior cortical bone.17
Fibrocartilage is hyperechoic and typically triangularly shaped, such as in the glenohumeral labrum. Nerves appear fascicular and hypoechoic surrounded by hyperechoic epineurium.14
The epidermis and dermis are the most superficial structure on top of the screen, and are also hyperechoic.17
The Diagnostic Shoulder Examination
The proximal long head of the biceps tendon (LHBT) is the easiest structure in the shoulder to identify because of the anatomic structure, the bicipital groove. By keeping the arm relaxed, perpendicular to the ground, and in neutral rotation, the probe can be placed perpendicular to the arm over the proximal shoulder (Figure 1A).16-20 By finding the groove, the biceps tendon will usually be found resting within the groove (Figure 1B). This is the short axis view and is equivalent to an MRI in the axial plane.
The long axis view of the proximal biceps tendon is found by keeping the tendon in the center of the screen/probe. The probe is then rotated 90° on its center axis, keeping the tendon centered on the probe. The user should be sure to visualize the entire tendon on the screen. If only part of the tendon is seen along only part of the screen, then the probe is oblique to the tendon. In this case, the probe area showing the tendon must be stabilized as the center or set point. The other part of the probe will then pivot until all of the tendon is seen on the screen. The MRI equivalent to the long axis of the proximal biceps tendon is the sagittal view.
Ultrasound is a dynamic evaluation. Moving the probe or moving the patient will change what and how something is imaged. The proximal biceps tendon is a good example of this concept. The bicipital groove is very deep proximally and flattens out as it travels distally to the mid-humerus. The examiner should continually adjust his or her hand/probe/patient position as well as depth/gain and other console functions to adapt to the dynamics of the scan. While keeping the bicep tendon in a short axis view, the tendon can be dynamically evaluated for subluxation by internally and externally rotating the arm.
To find the subscapularis, the arm remains in a neutral position with the hand supinated and the probe is held parallel with the ground. After finding the bicipital groove, the subscapularis tendon insertion is just medial to the groove (Figure 1B). By externally rotating the arm, the subscapularis tendon/muscle will come into a long axis view.16-20 The MRI equivalent to the long axis view of the subscapularis is the axial view. Dynamic testing can be done by internally and externally rotating the arm to evaluate for impingement of the subscapularis tendon as it slides underneath the coracoid process. To view the subscapularis tendon in short axis, the tendon is kept in the center of the screen/probe, and the probe is then rotated 90° on its center axis, keeping the tendon centered on the probe. The MRI equivalent is the sagittal view.
Some have recommended using the modified Crass or Middleton position to evaluate the supraspinatus, where the hand is in the “back pocket”.19 However, many patients with shoulder pain have trouble with this position. By resting the ipsilateral hand on the ipsilateral hip and then dropping the elbow, the supraspinatus insertion can still be brought out from under the acromion. This does bring the insertion anterior out of the scapular plane, so an adjustment is required in probe positioning to properly see the supraspinatus short and long axis. To find the long axis, the probe is placed parallel to a plane that spans the contralateral shoulder and ipsilateral hip (Figure 2A). The fibers of the supraspinatus should be inserting directly lateral to the humeral head without any intervening space (Figure 2B). If any space exists, a partial articular supraspinatus tendon avulsion (PASTA) lesion is present, and its thickness can be directly measured. Moving more posterior will show the flattening of the tuberosity and the fibers of the infraspinatus moving away from the humeral head—the bare spot. The MRI equivalent is the coronal view.
To view the supraspinatus tendon in short axis, maintain the arm in the same position, keeping the tendon in the center of the screen/probe. The probe is then rotated 90° on its center axis, keeping the tendon centered on the probe. The probe should now be in a parallel plane between the ipsilateral shoulder and the contralateral hip. The biceps tendon in cross-section will be found anteriorly, and the articular cartilage will appear as a black layer over the bone. Dynamic testing includes placing the probe in a coronal plane between the acromion and greater tuberosity. When the patient abducts the arm while in internal rotation, the supraspinatus tendon will slide underneath the coracoacromial arch showing potential external impingement.15 The MRI equivalent is the sagittal plane.
The glenohumeral joint is best viewed posteriorly, limiting how much of the intra-articular portion of the joint can be imaged. The arm remains in a neutral position; palpate for the posterior acromion and place the probe just inferior to it, wedging up against it (Figure 3A). The glenohumeral joint will be seen by keeping the probe parallel to the ground (Figure 3B). The MRI equivalent is the axial plane. If a joint effusion exists, it can be seen in the posterior recess.15 A hyperechoic triangular region in between the humeral head and the glenoid will represent the glenoid labrum (Figure 3B). By internally and externally rotating the arm, the joint and labrum complex can be dynamically examined. From the labrum, scanning superior and medial can sometimes show the spinoglenoid notch where a paralabral cyst might be seen.15
Using the glenohumeral joint as a reference, the infraspinatus muscle is easily visualized. Maintaining the arm in neutral position with the probe over the glenohumeral joint, the infraspinatus will become apparent as it lays in long axis view superficially between the posterior deltoid and glenohumeral joint (Figure 3B).16-20 The teres minor lies just inferiorly. The MRI equivalent is the axial plane. To view the infraspinatus and teres minor in short axis, the probe is then rotated 90° on its center axis. The infraspinatus (superiorly) and teres minor (inferiorly) muscles will be visible in short axis within the infraspinatus fossa.15 The MRI equivalent is the sagittal view.
The acromioclavicular joint is superficial and easy to image. The arm remains in a neutral position, and we can palpate the joint for easy localization. The probe is placed anteriorly in a coronal plane over the acromion and clavicle. By scanning anteriorly and posteriorly, a joint effusion referred to as a Geyser sign might be seen. The MRI equivalent is the coronal view.
Available Certifications
The AIUM certification is a voluntary peer reviewed process that acknowledges that a practice is meeting national standards and aids in improving their respective MSK ultrasound protocols. They also provide guidelines on demonstrating training and competence on performing and/or interpreting diagnostic MSK examinations (Table).10 The ARDMS certification provides an actual individual certification referred to as “Registered” in MSK ultrasound.11 The physician must perform 150 diagnostic MSK ultrasound evaluations within 36 months of applying and pass a 200-question examination that is offered twice per year.11 None of these certifications are mandated by the American Medical Association (AMA) or American Osteopathic Association (AOA).
Maintenance and Continuing Medical Education (CME)
The AIUM recommends that a minimum of 50 diagnostic MSK ultrasound evaluations be performed per year for skill maintenance.10 Furthermore, 10 hours of AMA PRA Category 1 Credits™ or American Osteopathic Association Category 1-A Credits specific to MSK ultrasound must be completed by physicians performing and/or interpreting these examinations every 3 years.10 ARDMS recommends a minimum of 30 MSK ultrasound-specific CMEs in preparation for their “Registered” MSK evaluation.1
Conclusion
MSK ultrasound is a dynamic, real-time imaging modality that can improve cost efficiency and patient care. Its portability allows for its use anywhere. Learning the skill may seem daunting, but with the proper courses and education, the technology can be easily learned. By correlating a known modality like MRI, the user will easily begin to read ultrasound images. No current certification is needed to use or bill for ultrasound, but various institutions are developing criteria and testing. Two organizations, AIUM and ARDMS, provide guidelines and certifications to demonstrate competency, which may become necessary in the very near future.
1. Sivan M, Brown J, Brennan S, Bhakta B. A one-stop approach to the management of soft tissue and degenerative musculoskeletal conditions using clinic-based ultrasonography. Musculoskeletal Care. 2011;9(2):63-68.
2. Roy J-S, Braën C, Leblond J, et al. Diagnostic accuracy of ultrasonography, MRI and MR arthrography in the characterization of rotator cuff disorders: a meta-analysis [published online ahead of print February 11, 2015]. Br J Sports Med. doi:10.1136/bjsports-2014-094148.
3. Hirahara AM, Panero AJ. A guide to ultrasound of the shoulder, part 1: coding and reimbursement. Am J Orthop. 2016;45(3):176-182.
4. Hama M, Takase K, Ihata A, et al. Challenges to expanding the clinical application of musculoskeletal ultrasonography (MSUS) among rheumatologists: from a second survey in Japan. Mod Rheumatol. 2012;2:202-208.
5. Smith MJ, Rogers A, Amso N, Kennedy J, Hall A, Mullaney P. A training, assessment and feedback package for the trainee shoulder sonographer. Ultrasound. 2015;23(1):29-41.
6. Delzell PB, Boyle A, Schneider E. Dedicated training program for shoulder sonography: the results of a quality program reverberate with everyone. J Ultrasound Med. 2015;34(6):1037-1042.
7. Finnoff JT, Berkoff D, Brennan F, et al. American Medical Society for Sports Medicine (AMSSM) recommended sports ultrasound curriculum for sports medicine fellowships. PM R. 2015;7(2)e1-e11.
8. Adelman S, Fishman P. Use of portable ultrasound machine for outpatient orthopedic diagnosis: an implementation study. Perm J. 2013;17(3):18-22.
9. Vollman A, Hulen R, Dulchavsky S, et al. Educational benefits of fusing magnetic resonance imaging with sonograms. J Clin Ultrasound. 2014;42(5) 257-263.
10. Training guidelines for physicians and chiropractors who evaluate and interpret diagnostic musculoskeletal ultrasound examinations. Laurel, MD: American Institute of Ultrasound in Medicine; 2014. http://www.aium.org/resources/viewStatement.aspx?id=51. Accessed February 26, 2016.
11. Registered in musculoskeletal (RMSK) sonography. American Registry for Diagnostic Medical Sonography Web site. http://www.ardms.org/get-certified/RMSK/Pages/RMSK.aspx. Accessed February 26, 2016.
12. Silkowski C. Ultrasound nomenclature, image orientation, and basic instrumentation. In: Abraham D, Silkowski C, Odwin C, eds. Emergency Medicine Sonography Pocket Guide to Sonographic Anatomy and Pathology. Sudbury, MA: Jones and Bartlett; 2010:1-24.
13. Ihnatsenka B, Boezaart AP. Ultrasound: basic understanding and learning the language. Int J Shoulder Surg. 2010;4(3):55-62.
14. Taljanovic MS, Melville DM, Scalcione LR, Gimber LH, Lorenz EJ, Witte RS. Artifacts in musculoskeletal ultrasonography. Semin Musculoskelet Radiol. 2014;18(1):3-11.
15. Ng A, Swanevelder J. Resolution in ultrasound imaging. Continuing Educ Anaesth Crit Care Pain. 2011;11(5):186-192. http://ceaccp.oxfordjournals.org/content/11/5/186.full. Accessed March 3, 2016.
16. Nazarian L, Bohm-Velez M, Kan JH, et al. AIUM practice parameters for the performance of a musculoskeletal ultrasound examination. Laurel, MD: American Institute of Ultrasound in Medicine; 2012. http://www.aium.org/resources/guidelines/musculoskeletal.pdf. Accessed February 26, 2016.
17. Jacobson J. Fundamentals of Musculoskeletal Ultrasound. 2nd edition. Philadelphia, PA: Elsevier Saunders; 2013.
18. The Ultrasound Subcommittee of the European Society of Musculoskeletal Radiology. Musculoskeletal ultrasound: technique guidelines. Insights Imaging. 2010;1:99-141.
19. Corazza A, Orlandi D, Fabbro E, et al. Dynamic high-resolution ultrasound of the shoulder: how we do it. Eur J Radiol. 2015;84(2):266-277.
20. Allen GM. Shoulder ultrasound imaging-integrating anatomy, biomechanics and disease processes. Eur J Radiol. 2008;68(1):137-146
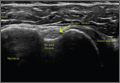
Management of the Biconcave (B2) Glenoid in Shoulder Arthroplasty: Technical Considerations
Total shoulder arthroplasty (TSA) has demonstrated excellent long-term clinical outcomes for the treatment of advanced glenohumeral osteoarthritis (OA).1-5 Glenohumeral OA is characterized by a broad spectrum of glenoid pathology. Both the morphology of the glenoid and humeral head subluxation are important preoperative factors to evaluate, as these have been shown to adversely impact shoulder arthroplasty outcomes.6,7
Walch and colleagues8 have previously classified glenoid morphology in cases of advanced glenohumeral arthritis based on the preoperative computed tomography (CT) scans of individuals undergoing shoulder arthroplasty (Figures 1A-1E). The biconcave (B2) glenoid is characterized by asymmetric posterior bone loss and a posterior translated humeral head that is seated in a biconcave glenoid. The degree and extent of bone loss in the B2 glenoid can be highly variable, ranging from the classic interpretation, in which 50% of the native glenoid fossa is preserved, to the more extreme case with little remaining native anterior glenoid. Scalise and colleagues9 have reported that determining the premorbid native glenoid version with a 3-dimensional (3D) glenoid vault model can aid in differentiating a pathologic B2 glenoid from a nonpathologic type C glenoid.
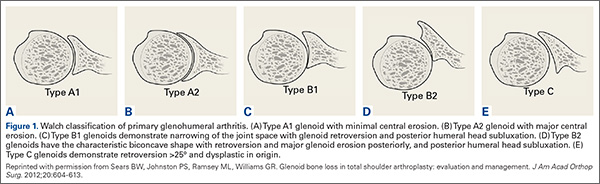
The B2 glenoid in particular has been associated with poor shoulder arthroplasty outcomes and component survivorship.6,10-12 There are many factors that are thought to contribute to this problem, such as glenoid component malposition, or undercorrection of the pathologic retroversion.6,13,14 Walch and colleagues10 reported that if the neoglenoid retroversion was greater than 27°, there was a 44% incidence of loosening and/or instability and 60% of the dislocations were observed when the humeral head subluxation was greater than 80%. Cases with severe posterior glenoid bone deficiency present a unique challenge to the surgeon, and the ability to accurately and securely place an implant in the correct anatomic position can be compromised. Standard TSA has proven excellent outcomes in the setting of typical glenohumeral OA, but in the B2 glenoid with significant posterior bone erosion, additional attention must be given to ensure adequate correction of the bony deformity, soft tissue balancing, and implant stability.
Several strategies that have been proposed to address extreme bone loss in the B2 glenoid will be discussed in this review. These include hemiarthroplasty, TSA with asymmetric reaming of the high side, TSA with bone grafting of the posterior glenoid bone loss, TSA with an augmented glenoid component, and reverse shoulder arthroplasty (RSA). Importantly, while these techniques have been proposed for managing the B2 glenoid, currently there is no gold standard consensus for the treatment of this condition. The purpose of this review is to highlight important characteristics of the B2 glenoid morphology on clinical outcomes and discuss the current surgical management options for this condition.
Preoperative Planning
Being able to accurately determine the amount of retroversion is critical for preoperative planning. Friedman and colleagues15 initially described a method to measure glenoid retroversion; however, this is less accurate in B2 glenoids (Figures 2A, 2B). More recently, Rouleau and colleagues16 have validated and published methods to measure glenoid retroversion and subluxation in the B2 glenoid using 3 reference lines: the paleoglenoid (native glenoid surface), intermediate glenoid (line from anterior and posterior edge), and neoglenoid (eroded posterior surface) (Figure 2).
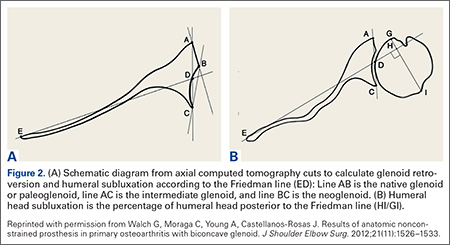
Preoperative evaluation starts with plain radiographs; however, additional imaging is needed, as the axillary view has shown to overestimate retroversion in 86% of patients (Figures 3A-3E).17 For a detailed evaluation of the glenoid retroversion and bone deficiency, CT scans with 3D reconstructions are useful.18,19 The surgical plan should be guided by the location and extent of glenoid bone loss. One tool that has been developed to help in predicting premorbid glenoid version, inclination, and position of the joint line is the 3D virtual glenoid vault model.9,20,21 This helps determine accurate premorbid glenoid anatomy and has been shown to assist in the selection of the optimal implant in an attempt to restore native glenoid anatomy, and avoid peg perforation.21 Patient-specific instrumentation (PSI) for shoulder arthroplasty is being used more frequently and has shown promise for more accurate glenoid component placement, particularly in the complex glenoid with severe bone deficiency. PSI involves creating a custom-fitted guide that is referenced to surface anatomy derived from the preoperative CT scan, which can then direct the surgeon toward optimal implant position with regard to glenoid component location, version and inclination (Figures 4A, 4B). Early reports show that PSI has resulted in a significant reduction in the frequency of malpositioned glenoid implants, with the greatest benefit observed in patients with retroversion in excess of 16°.22
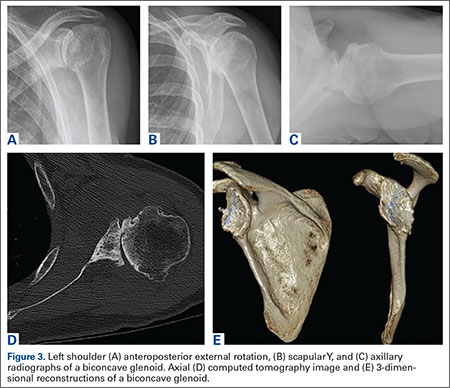
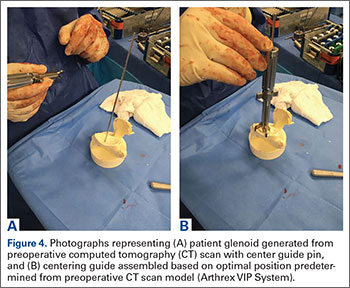
Surgical Management
Hemiarthroplasty
Shoulder hemiarthroplasty has been traditionally described as an option for younger, more active patients in whom longevity of the glenoid component is a concern, or in patients with inadequate glenoid bone stock to tolerate a glenoid component. While there are no reports of hemiarthroplasty specifically for patients with B2 glenoids, one study has examined the effect of glenoid morphology on the outcomes of hemiarthroplasty for shoulder osteoarthritis. Levine and colleagues7 reported inferior clinical outcomes after shoulder hemiarthroplasty in patients with eccentric posterior glenoid wear. Several authors have advocated a “ream-and-run” technique to create a concentric glenoid and re-center the humeral head while still maintaining the native glenoid.23,24 However, in a recent series of 162 ream-and-run procedures, Gilmer and colleagues25 reported that only 23% of patients with B2 glenoid geometry achieved a minimal clinically important change in patient-reported outcome scores and 14% required revision. Furthermore, Lynch and colleagues26 found that progressive medial erosion and recurrent posterior glenoid erosion occur in a significant percentage of patients at early follow-up. Given these recent findings, the use of hemiarthroplasty alone or a ream-and-run procedure for patients with B2 glenoid morphology should be approached with caution.
Total Shoulder Arthroplasty
As with any TSA, the primary goals in treating patients with B2 glenoid defects are to provide the patient with a pain-free, stable, and functional shoulder (Figures 5A-5D). There are, however, a few challenges that are unique to TSA in the setting of B2 glenoid defects. Because the humeral head is often subluxated posteriorly into the defect, the anterior capsule and rotator cuff can tighten while the posterior aspect of the joint becomes lax. These soft tissues must be balanced during TSA in order to stabilize the shoulder and restore the appropriate length-tension relationship of the rotator cuff. The other primary concern is restoration of appropriate glenoid version and lateralization. To accomplish this, the most common techniques utilized are asymmetric reaming, bone graft augmentation, and glenoid component augmentation.27,28
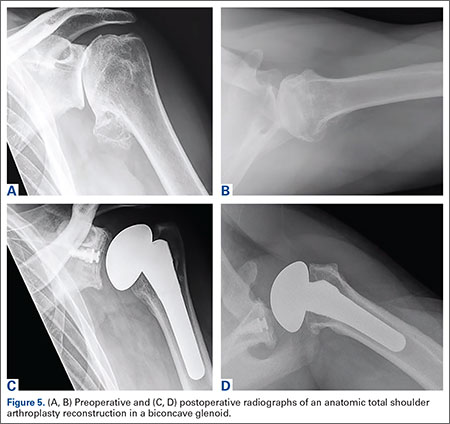
Asymmetric Reaming. One of the more readily utilized techniques for addressing the B2 glenoid during TSA is eccentric or asymmetric reaming. During this process, the anterior glenoid is preferentially reamed while little to no bone is removed posteriorly. This technique is generally felt to be sufficient to treat posterior defects up to 5 mm to 8 mm or retroversion up to 15°.28 These upper limits have been confirmed in a number of cadaveric and simulated models.29-31
The success of this technique hinges on excellent glenoid exposure. With appropriate retractors in place, the anterior capsulolabral complex, including the biceps insertion, is resected to improve visualization. The inferior capsule must be resected carefully to ensure exposure and better motion postoperatively. On the other hand, it is imperative to protect the posterior capsulolabral attachments because of the increased risk of posterior instability in patients with B2 glenoids.
Detailed imaging such as CT scans with 3D reconstructions have improved our understanding of the degree of the deformities in all directions, which can better guide the reaming. PSI and planning software developed to improve the surgeon’s ability to place the glenoid component centrally in the best possible position after version correction can be even more helpful. We find that using a burr to provisionally lower the high side (anterior) provides a more en face view, which subsequently makes the eccentric reaming easier. As a guide, we will not ream more than 1 cm of anterior bone or attempt to correct more than ~20° of retroversion. The goal should be to create a glenoid surface that is more neutral and congruent to the posterior surface of the glenoid component while not overmedializing the component.
Although eccentric reaming may be one of the more straightforward methods for addressing posterior glenoid erosion, it is not without a number of potential downsides. When attempting to correct defects >10 mm or retroversion beyond 15°, excessive medialization of the implant can occur. Although increasing the thickness of the glenoid component can compensate for small amounts of medialization, excessive medialization can lead to a number of issues.27,28,32 As reaming progresses medially, the risk of keel penetration increases as the glenoid vault narrows.30,32 Further medialization decreases posterior cortical support for the implant, which increases the risk of component loosening and subsidence.33-35 The more medial the implant is placed, the smaller the surface of available bone for implant fixation. This often requires utilization of a smaller sized glenoid component that may result in component mismatch with the humeral implant. Finally, excessive medialization has the potential to under tension the rotator cuff, leading to decreased shoulder stability, strength, and function.
Bone Graft Augmentation. When posterior erosion becomes too excessive to address with eccentric reaming alone, defect augmentation is another option to consider (Figures 6A-6E). While technically more demanding, bone graft also provides the advantage of better re-creating the natural joint line and center of rotation of the glenohumeral joint.
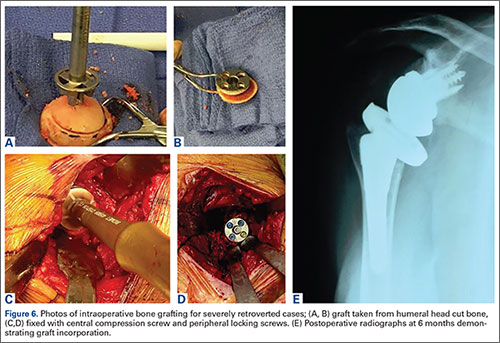
For most defects, the resected humeral head provides the ideal source of graft. After initial reaming of the anterior glenoid, the defect must be sized and measured. We then recommend using a guided, cannulated system to place a central pin, lying perpendicular to the glenoid axis in neutral position. The anterior glenoid is then reamed enough to create a flat surface on which to attach the bone graft. The posterior surface is then gently burred to create a bleeding surface to enhance graft incorporation. The graft is then contoured to the defect and placed flush with the anterior glenoid. Cannulated screws are placed over guidewires to fix the graft. Using an arthroscopic cannula inserted posteriorly allows for easier placement of the guidewires and easier implantation of the screws. Although a reamer or burr can be used to contour the graft once it is fixed in place, this should be minimized to prevent loss of fixation. When the graft is fixed, we then cement the glenoid component into place.
Although good clinical results have been obtained with this technique, there is concern of incomplete graft healing and component loosening in the long term. Even in clinically asymptomatic and well functioning patients, some degree of radiographic lucency may be present in over 50% of cases.31,36,37 Glenoid Component Augmentation. To address the issues related to lucency and nonunion of bone graft augmentation, several augmented glenoid components have been developed. Augmented glenoid components have the benefit of filling posterior defects and stabilizing the shoulder without requiring excessive medialization (as often occurs with eccentric reaming) or union of a bone-to-bone interface (as is required in bone graft augmentation).38 Although many of the metal back designs experienced undesirably high failure rates and have since been recalled,39 more modern all-polyethylene components hold promise. The 2 most commonly utilized designs are the posterior step augment (DePuy) and the posterior wedge (Exactech). Although biomechanical analyses of both designs have demonstrated increased stability during loading in cadaveric and simulation models, the step augment (DePuy) has demonstrated increased stability and resistance to loosening.40,41 Although midterm results are not yet available for this newest generation of augmented components, short-term results with 2 to 3 years of follow-up have demonstrated excellent clinical outcomes.28
Reverse Total Shoulder Arthroplasty
While most commonly indicated for patients with rotator cuff tear arthropathy, RSA has recently been advocated for older patients with osteoarthritis and B2 glenoids in the setting of an intact rotator cuff. The semi-constrained design of the RSA is a potential solution to the static posterior humeral head subluxation seen in patients with B2 glenoid geometry (Figure 6E).
Technically, RSA is often an easier solution than a TSA with bone grafting because there is usually enough glenoid bone stock for fixation. That said, we always get a CT scan with 3D reconstructions to better appreciate the anatomy. Note that in B2 glenoids, the bone loss is typically posterior and inferior. RSA in the setting of a B2 glenoid is one of the ideal indications to use PSI to ensure ideal placement of the central pin, which is the key to glenoid baseplate positioning. Even when using a RSA, eccentric reaming and/or bone grafting allow for more ideal component placement. Using the same eccentric reaming techniques described above, one should try to ream to place the baseplate at 10° of retroversion. In cases where retroversion cannot be corrected to 10°, graft can be taken from the humeral head, iliac crest, or allograft. A benefit to using bone graft with RSA as opposed to TSA is that the graft can be fashioned to the baseplate, impacted/compressed into the B2 glenoid, and then secured with a central compression screw and peripheral locking screws.
Mizuno and colleagues41 reported a retrospective series of 27 RSAs performed for primary glenohumeral osteoarthritis and biconcave glenoid. At a mean follow-up of nearly 5 years, the authors noted significant improvement in Constant scores and shoulder motion with minimal complications. There was no recurrence of posterior instability observed by the time of final follow-up.41
RSA is a promising treatment for primary glenohumeral arthritis with posterior glenoid bone loss and static posterior subluxation in elderly or less active patients, but the longevity of these implants has yet to be established for younger, more active patients and requires further study.
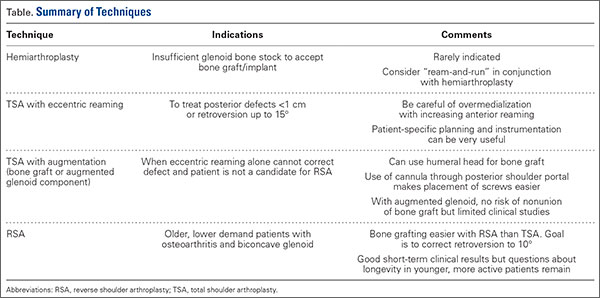
Conclusion
Reconstruction of the B2 glenoid presents a challenging clinical problem that has been associated with poor clinical outcomes and implant survivorship. The high failure rate from glenoid component loosening and subsequent premature implant failure can be substantially decreased with accurate glenoid component positioning and appropriate correction of the pathologic glenoid retroversion. Careful preoperative planning is essential for accurate preparation and execution of the optimal surgical plan. There are many surgical strategies to address the B2 glenoid, but no consensus on the optimal method exists, as the technique should be uniquely customized to the individual’s pathology and surgeon preference (Table). Cases with mild deformity may be corrected with eccentric reaming and TSA, while the more severe deformities may require posterior glenoid bone grafting and/or augmented implants to restore native version. Finally, the RSA is a reliable option to restore stability and address bone deficiency for the severe B2 glenoid in an older, lower demand patient.
1. Barrett WP, Franklin JL, Jackins SE, Wyss CR, Matsen FA 3rd. Total shoulder arthroplasty. J Bone Joint Surg Am. 1987;69(6):865-872.
2. Bryant D, Litchfield R, Sandow M, Gartsman GM, Guyatt G, Kirkley A. A comparison of pain, strength, range of motion, and functional outcomes after hemiarthroplasty and total shoulder arthroplasty in patients with osteoarthritis of the shoulder. A systematic review and meta-analysis. J Bone Joint Surg Am. 2005;87(9):1947-1956.
3. Matsen FA 3rd. Early effectiveness of shoulder arthroplasty for patients who have primary glenohumeral degenerative joint disease. J Bone Joint Surg Am. 1996;78(2):260-264.
4. Fenlin JM Jr, Frieman BG. Indications, technique, and results of total shoulder arthroplasty in osteoarthritis. Orthop Clin North Am. 1998;29(3):423-434.
5. Singh JA, Sperling JW, Cofield RH. Revision surgery following total shoulder arthroplasty: Analysis of 2588 shoulders over three decades (1976 to 2008). J Bone Joint Surg Br. 2011;93(11):1513-1517.
6. Iannotti JP, Norris TR. Influence of preoperative factors on outcome of shoulder arthroplasty for glenohumeral osteoarthritis. J Bone Joint Surg Am. 2003;85-A(2):251-258.
7. Levine WN, Djurasovic M, Glasson JM, Pollock RG, Flatow EL, Bigliani LU. Hemiarthroplasty for glenohumeral osteoarthritis: Results correlated to degree of glenoid wear. J Shoulder Elbow Surg. 1997;6(5):449-454.
8. Walch G, Badet R, Boulahia A, Khoury A. Morphologic study of the glenoid in primary glenohumeral osteoarthritis. J Arthroplasty. 1999;14(6):756-760.
9. Scalise JJ, Codsi MJ, Bryan J, Iannotti JP. The three-dimensional glenoid vault model can estimate normal glenoid version in osteoarthritis. J Shoulder Elbow Surg. 2008;17(3):487-491.
10. Walch G, Moraga C, Young A, Castellanos-Rosas J. Results of anatomic nonconstrained prosthesis in primary osteoarthritis with biconcave glenoid. J Shoulder Elbow Surg. 2012;21(11):1526-1533.
11. Kany J, Katz D. How to deal with glenoid type B2 or C? How to prevent mistakes in implantation of glenoid component? Eur J Orthop Surg Traumatol. 2013;23(4):379-385.
12. Denard PJ, Walch G. Current concepts in the surgical management of primary glenohumeral arthritis with a biconcave glenoid. J Shoulder Elbow Surg. 2013;22(11):1589-1598.
13. Iannotti JP, Greeson C, Downing D, Sabesan V, Bryan JA. Effect of glenoid deformity on glenoid component placement in primary shoulder arthroplasty. J Shoulder Elbow Surg. 2012;21(1):48-55.
14. Ho JC, Sabesan VJ, Iannotti JP. Glenoid component retroversion is associated with osteolysis. J Bone Joint Surg Am. 2013;95(12):e82.
15. Friedman RJ, Hawthorne KB, Genez BM. The use of computerized tomography in the measurement of glenoid version. J Bone Joint Surg Am. 1992;74(7):1032-1037.
16. Rouleau DM, Kidder JF, Pons-Villanueva J, Dynamidis S, Defranco M, Walch G. Glenoid version: How to measure it? Validity of different methods in two-dimensional computed tomography scans. J Shoulder Elbow Surg. 2010;19(8):1230-1237.
17. Nyffeler RW, Jost B, Pfirrmann CW, Gerber C. Measurement of glenoid version: Conventional radiographs versus computed tomography scans. J Shoulder Elbow Surg. 2003;12(5):493-496.
18. Budge MD, Lewis GS, Schaefer E, Coquia S, Flemming DJ, Armstrong AD. Comparison of standard two-dimensional and three-dimensional corrected glenoid version measurements. J Shoulder Elbow Surg. 2011;20(4):577-583.
19. Bokor DJ, O’Sullivan MD, Hazan GJ. Variability of measurement of glenoid version on computed tomography scan. J Shoulder Elbow Surg. 1999;8(6):595-598.
20. Ganapathi A, McCarron JA, Chen X, Iannotti JP. Predicting normal glenoid version from the pathologic scapula: A comparison of 4 methods in 2- and 3-dimensional models. J Shoulder Elbow Surg. 2011;20(2):234-244.
21. Ricchetti ET, Hendel MD, Collins DN, Iannotti JP. Is premorbid glenoid anatomy altered in patients with glenohumeral osteoarthritis? Clin Orthop Relat Res. 2013;471(9):2932-2939.
22. Hendel MD, Bryan JA, Barsoum WK, et al. Comparison of patient-specific instruments with standard surgical instruments in determining glenoid component position: A randomized prospective clinical trial. J Bone Joint Surg Am. 2012;94(23):2167-2175.
23. Matsen FA 3rd, Warme WJ, Jackins SE. Can the ream and run procedure improve glenohumeral relationships and function for shoulders with the arthritic triad? Clin Orthop Relat Res. 2015;473(6):2088-2096.
24. Saltzman MD, Chamberlain AM, Mercer DM, Warme WJ, Bertelsen AL, Matsen FA 3rd. Shoulder hemiarthroplasty with concentric glenoid reaming in patients 55 years old or less. J Shoulder Elbow Surg. 2011;20(4):609-615.
25. Gilmer BB, Comstock BA, Jette JL, Warme WJ, Jackins SE, Matsen FA. The prognosis for improvement in comfort and function after the ream-and-run arthroplasty for glenohumeral arthritis: An analysis of 176 consecutive cases. J Bone Joint Surg Am. 2012;94(14):e102.
26. Lynch JR, Franta AK, Montgomery WH Jr, Lenters TR, Mounce D, Matsen FA 3rd. Self-assessed outcome at two to four years after shoulder hemiarthroplasty with concentric glenoid reaming. J Bone Joint Surg Am. 2007;89(6):1284-1292.
27. Donohue KW, Ricchetti ET, Iannotti JP. Surgical management of the biconcave (B2) glenoid. Curr Rev Musculoskelet Med. 2016;9(1):30-39.
28. Clavert P, Millett PJ, Warner JJ. Glenoid resurfacing: What are the limits to asymmetric reaming for posterior erosion? J Shoulder Elbow Surg. 2007;16(6):843-848.
29. Gillespie R, Lyons R, Lazarus M. Eccentric reaming in total shoulder arthroplasty: A cadaveric study. Orthopedics. 2009;32(1):21.
30. Neer CS 2nd, Morrison DS. Glenoid bone-grafting in total shoulder arthroplasty. J Bone Joint Surg Am. 1988;70(8):1154-1162.
31. Nowak DD, Bahu MJ, Gardner TR, et al. Simulation of surgical glenoid resurfacing using three-dimensional computed tomography of the arthritic glenohumeral joint: The amount of glenoid retroversion that can be corrected. J Shoulder Elbow Surg. 2009;18(5):680-688.
32. Strauss EJ, Roche C, Flurin PH, Wright T, Zuckerman JD. The glenoid in shoulder arthroplasty. J Shoulder Elbow Surg. 2009;18(5):819-833.
33. Walch G, Young AA, Boileau P, Loew M, Gazielly D, Mole D. Patterns of loosening of polyethylene keeled glenoid components after shoulder arthroplasty for primary osteoarthritis: Results of a multicenter study with more than five years of follow-up. J Bone Joint Surg Am. 2012;94(2):145-150.
34. Walch G, Young AA, Melis B, Gazielly D, Loew M, Boileau P. Results of a convex-back cemented keeled glenoid component in primary osteoarthritis: Multicenter study with a follow-up greater than 5 years. J Shoulder Elbow Surg. 2011;20(3):385-394.
35. Klika BJ, Wooten CW, Sperling JW, et al. Structural bone grafting for glenoid deficiency in primary total shoulder arthroplasty. J Shoulder Elbow Surg. 2014;23(7):1066-1072.
36. Sabesan V, Callanan M, Sharma V, Iannotti JP. Correction of acquired glenoid bone loss in osteoarthritis with a standard versus an augmented glenoid component. J Shoulder Elbow Surg. 2014;23(7):964-973.
37. Steinmann SP, Cofield RH. Bone grafting for glenoid deficiency in total shoulder replacement. J Shoulder Elbow Surg. 2000;9(5):361-367.
38. Cil A, Sperling JW, Cofield RH. Nonstandard glenoid components for bone deficiencies in shoulder arthroplasty. J Shoulder Elbow Surg. 2014;23(7):e149-e157.
39. Iannotti JP, Lappin KE, Klotz CL, Reber EW, Swope SW. Liftoff resistance of augmented glenoid components during cyclic fatigue loading in the posterior-superior direction. J Shoulder Elbow Surg. 2013;22(11):1530-1536.
40. Knowles NK, Ferreira LM, Athwal GS. Augmented glenoid component designs for type B2 erosions: A computational comparison by volume of bone removal and quality of remaining bone. J Shoulder Elbow Surg. 2015;24(8):1218-1226.
41. Mizuno N, Denard PJ, Raiss P, Walch G. Reverse total shoulder arthroplasty for primary glenohumeral osteoarthritis in patients with a biconcave glenoid. J Bone Joint Surg Am. 2013;95(14):1297-1304.
Total shoulder arthroplasty (TSA) has demonstrated excellent long-term clinical outcomes for the treatment of advanced glenohumeral osteoarthritis (OA).1-5 Glenohumeral OA is characterized by a broad spectrum of glenoid pathology. Both the morphology of the glenoid and humeral head subluxation are important preoperative factors to evaluate, as these have been shown to adversely impact shoulder arthroplasty outcomes.6,7
Walch and colleagues8 have previously classified glenoid morphology in cases of advanced glenohumeral arthritis based on the preoperative computed tomography (CT) scans of individuals undergoing shoulder arthroplasty (Figures 1A-1E). The biconcave (B2) glenoid is characterized by asymmetric posterior bone loss and a posterior translated humeral head that is seated in a biconcave glenoid. The degree and extent of bone loss in the B2 glenoid can be highly variable, ranging from the classic interpretation, in which 50% of the native glenoid fossa is preserved, to the more extreme case with little remaining native anterior glenoid. Scalise and colleagues9 have reported that determining the premorbid native glenoid version with a 3-dimensional (3D) glenoid vault model can aid in differentiating a pathologic B2 glenoid from a nonpathologic type C glenoid.
The B2 glenoid in particular has been associated with poor shoulder arthroplasty outcomes and component survivorship.6,10-12 There are many factors that are thought to contribute to this problem, such as glenoid component malposition, or undercorrection of the pathologic retroversion.6,13,14 Walch and colleagues10 reported that if the neoglenoid retroversion was greater than 27°, there was a 44% incidence of loosening and/or instability and 60% of the dislocations were observed when the humeral head subluxation was greater than 80%. Cases with severe posterior glenoid bone deficiency present a unique challenge to the surgeon, and the ability to accurately and securely place an implant in the correct anatomic position can be compromised. Standard TSA has proven excellent outcomes in the setting of typical glenohumeral OA, but in the B2 glenoid with significant posterior bone erosion, additional attention must be given to ensure adequate correction of the bony deformity, soft tissue balancing, and implant stability.
Several strategies that have been proposed to address extreme bone loss in the B2 glenoid will be discussed in this review. These include hemiarthroplasty, TSA with asymmetric reaming of the high side, TSA with bone grafting of the posterior glenoid bone loss, TSA with an augmented glenoid component, and reverse shoulder arthroplasty (RSA). Importantly, while these techniques have been proposed for managing the B2 glenoid, currently there is no gold standard consensus for the treatment of this condition. The purpose of this review is to highlight important characteristics of the B2 glenoid morphology on clinical outcomes and discuss the current surgical management options for this condition.
Preoperative Planning
Being able to accurately determine the amount of retroversion is critical for preoperative planning. Friedman and colleagues15 initially described a method to measure glenoid retroversion; however, this is less accurate in B2 glenoids (Figures 2A, 2B). More recently, Rouleau and colleagues16 have validated and published methods to measure glenoid retroversion and subluxation in the B2 glenoid using 3 reference lines: the paleoglenoid (native glenoid surface), intermediate glenoid (line from anterior and posterior edge), and neoglenoid (eroded posterior surface) (Figure 2).
Preoperative evaluation starts with plain radiographs; however, additional imaging is needed, as the axillary view has shown to overestimate retroversion in 86% of patients (Figures 3A-3E).17 For a detailed evaluation of the glenoid retroversion and bone deficiency, CT scans with 3D reconstructions are useful.18,19 The surgical plan should be guided by the location and extent of glenoid bone loss. One tool that has been developed to help in predicting premorbid glenoid version, inclination, and position of the joint line is the 3D virtual glenoid vault model.9,20,21 This helps determine accurate premorbid glenoid anatomy and has been shown to assist in the selection of the optimal implant in an attempt to restore native glenoid anatomy, and avoid peg perforation.21 Patient-specific instrumentation (PSI) for shoulder arthroplasty is being used more frequently and has shown promise for more accurate glenoid component placement, particularly in the complex glenoid with severe bone deficiency. PSI involves creating a custom-fitted guide that is referenced to surface anatomy derived from the preoperative CT scan, which can then direct the surgeon toward optimal implant position with regard to glenoid component location, version and inclination (Figures 4A, 4B). Early reports show that PSI has resulted in a significant reduction in the frequency of malpositioned glenoid implants, with the greatest benefit observed in patients with retroversion in excess of 16°.22
Surgical Management
Hemiarthroplasty
Shoulder hemiarthroplasty has been traditionally described as an option for younger, more active patients in whom longevity of the glenoid component is a concern, or in patients with inadequate glenoid bone stock to tolerate a glenoid component. While there are no reports of hemiarthroplasty specifically for patients with B2 glenoids, one study has examined the effect of glenoid morphology on the outcomes of hemiarthroplasty for shoulder osteoarthritis. Levine and colleagues7 reported inferior clinical outcomes after shoulder hemiarthroplasty in patients with eccentric posterior glenoid wear. Several authors have advocated a “ream-and-run” technique to create a concentric glenoid and re-center the humeral head while still maintaining the native glenoid.23,24 However, in a recent series of 162 ream-and-run procedures, Gilmer and colleagues25 reported that only 23% of patients with B2 glenoid geometry achieved a minimal clinically important change in patient-reported outcome scores and 14% required revision. Furthermore, Lynch and colleagues26 found that progressive medial erosion and recurrent posterior glenoid erosion occur in a significant percentage of patients at early follow-up. Given these recent findings, the use of hemiarthroplasty alone or a ream-and-run procedure for patients with B2 glenoid morphology should be approached with caution.
Total Shoulder Arthroplasty
As with any TSA, the primary goals in treating patients with B2 glenoid defects are to provide the patient with a pain-free, stable, and functional shoulder (Figures 5A-5D). There are, however, a few challenges that are unique to TSA in the setting of B2 glenoid defects. Because the humeral head is often subluxated posteriorly into the defect, the anterior capsule and rotator cuff can tighten while the posterior aspect of the joint becomes lax. These soft tissues must be balanced during TSA in order to stabilize the shoulder and restore the appropriate length-tension relationship of the rotator cuff. The other primary concern is restoration of appropriate glenoid version and lateralization. To accomplish this, the most common techniques utilized are asymmetric reaming, bone graft augmentation, and glenoid component augmentation.27,28
Asymmetric Reaming. One of the more readily utilized techniques for addressing the B2 glenoid during TSA is eccentric or asymmetric reaming. During this process, the anterior glenoid is preferentially reamed while little to no bone is removed posteriorly. This technique is generally felt to be sufficient to treat posterior defects up to 5 mm to 8 mm or retroversion up to 15°.28 These upper limits have been confirmed in a number of cadaveric and simulated models.29-31
The success of this technique hinges on excellent glenoid exposure. With appropriate retractors in place, the anterior capsulolabral complex, including the biceps insertion, is resected to improve visualization. The inferior capsule must be resected carefully to ensure exposure and better motion postoperatively. On the other hand, it is imperative to protect the posterior capsulolabral attachments because of the increased risk of posterior instability in patients with B2 glenoids.
Detailed imaging such as CT scans with 3D reconstructions have improved our understanding of the degree of the deformities in all directions, which can better guide the reaming. PSI and planning software developed to improve the surgeon’s ability to place the glenoid component centrally in the best possible position after version correction can be even more helpful. We find that using a burr to provisionally lower the high side (anterior) provides a more en face view, which subsequently makes the eccentric reaming easier. As a guide, we will not ream more than 1 cm of anterior bone or attempt to correct more than ~20° of retroversion. The goal should be to create a glenoid surface that is more neutral and congruent to the posterior surface of the glenoid component while not overmedializing the component.
Although eccentric reaming may be one of the more straightforward methods for addressing posterior glenoid erosion, it is not without a number of potential downsides. When attempting to correct defects >10 mm or retroversion beyond 15°, excessive medialization of the implant can occur. Although increasing the thickness of the glenoid component can compensate for small amounts of medialization, excessive medialization can lead to a number of issues.27,28,32 As reaming progresses medially, the risk of keel penetration increases as the glenoid vault narrows.30,32 Further medialization decreases posterior cortical support for the implant, which increases the risk of component loosening and subsidence.33-35 The more medial the implant is placed, the smaller the surface of available bone for implant fixation. This often requires utilization of a smaller sized glenoid component that may result in component mismatch with the humeral implant. Finally, excessive medialization has the potential to under tension the rotator cuff, leading to decreased shoulder stability, strength, and function.
Bone Graft Augmentation. When posterior erosion becomes too excessive to address with eccentric reaming alone, defect augmentation is another option to consider (Figures 6A-6E). While technically more demanding, bone graft also provides the advantage of better re-creating the natural joint line and center of rotation of the glenohumeral joint.
For most defects, the resected humeral head provides the ideal source of graft. After initial reaming of the anterior glenoid, the defect must be sized and measured. We then recommend using a guided, cannulated system to place a central pin, lying perpendicular to the glenoid axis in neutral position. The anterior glenoid is then reamed enough to create a flat surface on which to attach the bone graft. The posterior surface is then gently burred to create a bleeding surface to enhance graft incorporation. The graft is then contoured to the defect and placed flush with the anterior glenoid. Cannulated screws are placed over guidewires to fix the graft. Using an arthroscopic cannula inserted posteriorly allows for easier placement of the guidewires and easier implantation of the screws. Although a reamer or burr can be used to contour the graft once it is fixed in place, this should be minimized to prevent loss of fixation. When the graft is fixed, we then cement the glenoid component into place.
Although good clinical results have been obtained with this technique, there is concern of incomplete graft healing and component loosening in the long term. Even in clinically asymptomatic and well functioning patients, some degree of radiographic lucency may be present in over 50% of cases.31,36,37 Glenoid Component Augmentation. To address the issues related to lucency and nonunion of bone graft augmentation, several augmented glenoid components have been developed. Augmented glenoid components have the benefit of filling posterior defects and stabilizing the shoulder without requiring excessive medialization (as often occurs with eccentric reaming) or union of a bone-to-bone interface (as is required in bone graft augmentation).38 Although many of the metal back designs experienced undesirably high failure rates and have since been recalled,39 more modern all-polyethylene components hold promise. The 2 most commonly utilized designs are the posterior step augment (DePuy) and the posterior wedge (Exactech). Although biomechanical analyses of both designs have demonstrated increased stability during loading in cadaveric and simulation models, the step augment (DePuy) has demonstrated increased stability and resistance to loosening.40,41 Although midterm results are not yet available for this newest generation of augmented components, short-term results with 2 to 3 years of follow-up have demonstrated excellent clinical outcomes.28
Reverse Total Shoulder Arthroplasty
While most commonly indicated for patients with rotator cuff tear arthropathy, RSA has recently been advocated for older patients with osteoarthritis and B2 glenoids in the setting of an intact rotator cuff. The semi-constrained design of the RSA is a potential solution to the static posterior humeral head subluxation seen in patients with B2 glenoid geometry (Figure 6E).
Technically, RSA is often an easier solution than a TSA with bone grafting because there is usually enough glenoid bone stock for fixation. That said, we always get a CT scan with 3D reconstructions to better appreciate the anatomy. Note that in B2 glenoids, the bone loss is typically posterior and inferior. RSA in the setting of a B2 glenoid is one of the ideal indications to use PSI to ensure ideal placement of the central pin, which is the key to glenoid baseplate positioning. Even when using a RSA, eccentric reaming and/or bone grafting allow for more ideal component placement. Using the same eccentric reaming techniques described above, one should try to ream to place the baseplate at 10° of retroversion. In cases where retroversion cannot be corrected to 10°, graft can be taken from the humeral head, iliac crest, or allograft. A benefit to using bone graft with RSA as opposed to TSA is that the graft can be fashioned to the baseplate, impacted/compressed into the B2 glenoid, and then secured with a central compression screw and peripheral locking screws.
Mizuno and colleagues41 reported a retrospective series of 27 RSAs performed for primary glenohumeral osteoarthritis and biconcave glenoid. At a mean follow-up of nearly 5 years, the authors noted significant improvement in Constant scores and shoulder motion with minimal complications. There was no recurrence of posterior instability observed by the time of final follow-up.41
RSA is a promising treatment for primary glenohumeral arthritis with posterior glenoid bone loss and static posterior subluxation in elderly or less active patients, but the longevity of these implants has yet to be established for younger, more active patients and requires further study.
Conclusion
Reconstruction of the B2 glenoid presents a challenging clinical problem that has been associated with poor clinical outcomes and implant survivorship. The high failure rate from glenoid component loosening and subsequent premature implant failure can be substantially decreased with accurate glenoid component positioning and appropriate correction of the pathologic glenoid retroversion. Careful preoperative planning is essential for accurate preparation and execution of the optimal surgical plan. There are many surgical strategies to address the B2 glenoid, but no consensus on the optimal method exists, as the technique should be uniquely customized to the individual’s pathology and surgeon preference (Table). Cases with mild deformity may be corrected with eccentric reaming and TSA, while the more severe deformities may require posterior glenoid bone grafting and/or augmented implants to restore native version. Finally, the RSA is a reliable option to restore stability and address bone deficiency for the severe B2 glenoid in an older, lower demand patient.
1. Barrett WP, Franklin JL, Jackins SE, Wyss CR, Matsen FA 3rd. Total shoulder arthroplasty. J Bone Joint Surg Am. 1987;69(6):865-872.
2. Bryant D, Litchfield R, Sandow M, Gartsman GM, Guyatt G, Kirkley A. A comparison of pain, strength, range of motion, and functional outcomes after hemiarthroplasty and total shoulder arthroplasty in patients with osteoarthritis of the shoulder. A systematic review and meta-analysis. J Bone Joint Surg Am. 2005;87(9):1947-1956.
3. Matsen FA 3rd. Early effectiveness of shoulder arthroplasty for patients who have primary glenohumeral degenerative joint disease. J Bone Joint Surg Am. 1996;78(2):260-264.
4. Fenlin JM Jr, Frieman BG. Indications, technique, and results of total shoulder arthroplasty in osteoarthritis. Orthop Clin North Am. 1998;29(3):423-434.
5. Singh JA, Sperling JW, Cofield RH. Revision surgery following total shoulder arthroplasty: Analysis of 2588 shoulders over three decades (1976 to 2008). J Bone Joint Surg Br. 2011;93(11):1513-1517.
6. Iannotti JP, Norris TR. Influence of preoperative factors on outcome of shoulder arthroplasty for glenohumeral osteoarthritis. J Bone Joint Surg Am. 2003;85-A(2):251-258.
7. Levine WN, Djurasovic M, Glasson JM, Pollock RG, Flatow EL, Bigliani LU. Hemiarthroplasty for glenohumeral osteoarthritis: Results correlated to degree of glenoid wear. J Shoulder Elbow Surg. 1997;6(5):449-454.
8. Walch G, Badet R, Boulahia A, Khoury A. Morphologic study of the glenoid in primary glenohumeral osteoarthritis. J Arthroplasty. 1999;14(6):756-760.
9. Scalise JJ, Codsi MJ, Bryan J, Iannotti JP. The three-dimensional glenoid vault model can estimate normal glenoid version in osteoarthritis. J Shoulder Elbow Surg. 2008;17(3):487-491.
10. Walch G, Moraga C, Young A, Castellanos-Rosas J. Results of anatomic nonconstrained prosthesis in primary osteoarthritis with biconcave glenoid. J Shoulder Elbow Surg. 2012;21(11):1526-1533.
11. Kany J, Katz D. How to deal with glenoid type B2 or C? How to prevent mistakes in implantation of glenoid component? Eur J Orthop Surg Traumatol. 2013;23(4):379-385.
12. Denard PJ, Walch G. Current concepts in the surgical management of primary glenohumeral arthritis with a biconcave glenoid. J Shoulder Elbow Surg. 2013;22(11):1589-1598.
13. Iannotti JP, Greeson C, Downing D, Sabesan V, Bryan JA. Effect of glenoid deformity on glenoid component placement in primary shoulder arthroplasty. J Shoulder Elbow Surg. 2012;21(1):48-55.
14. Ho JC, Sabesan VJ, Iannotti JP. Glenoid component retroversion is associated with osteolysis. J Bone Joint Surg Am. 2013;95(12):e82.
15. Friedman RJ, Hawthorne KB, Genez BM. The use of computerized tomography in the measurement of glenoid version. J Bone Joint Surg Am. 1992;74(7):1032-1037.
16. Rouleau DM, Kidder JF, Pons-Villanueva J, Dynamidis S, Defranco M, Walch G. Glenoid version: How to measure it? Validity of different methods in two-dimensional computed tomography scans. J Shoulder Elbow Surg. 2010;19(8):1230-1237.
17. Nyffeler RW, Jost B, Pfirrmann CW, Gerber C. Measurement of glenoid version: Conventional radiographs versus computed tomography scans. J Shoulder Elbow Surg. 2003;12(5):493-496.
18. Budge MD, Lewis GS, Schaefer E, Coquia S, Flemming DJ, Armstrong AD. Comparison of standard two-dimensional and three-dimensional corrected glenoid version measurements. J Shoulder Elbow Surg. 2011;20(4):577-583.
19. Bokor DJ, O’Sullivan MD, Hazan GJ. Variability of measurement of glenoid version on computed tomography scan. J Shoulder Elbow Surg. 1999;8(6):595-598.
20. Ganapathi A, McCarron JA, Chen X, Iannotti JP. Predicting normal glenoid version from the pathologic scapula: A comparison of 4 methods in 2- and 3-dimensional models. J Shoulder Elbow Surg. 2011;20(2):234-244.
21. Ricchetti ET, Hendel MD, Collins DN, Iannotti JP. Is premorbid glenoid anatomy altered in patients with glenohumeral osteoarthritis? Clin Orthop Relat Res. 2013;471(9):2932-2939.
22. Hendel MD, Bryan JA, Barsoum WK, et al. Comparison of patient-specific instruments with standard surgical instruments in determining glenoid component position: A randomized prospective clinical trial. J Bone Joint Surg Am. 2012;94(23):2167-2175.
23. Matsen FA 3rd, Warme WJ, Jackins SE. Can the ream and run procedure improve glenohumeral relationships and function for shoulders with the arthritic triad? Clin Orthop Relat Res. 2015;473(6):2088-2096.
24. Saltzman MD, Chamberlain AM, Mercer DM, Warme WJ, Bertelsen AL, Matsen FA 3rd. Shoulder hemiarthroplasty with concentric glenoid reaming in patients 55 years old or less. J Shoulder Elbow Surg. 2011;20(4):609-615.
25. Gilmer BB, Comstock BA, Jette JL, Warme WJ, Jackins SE, Matsen FA. The prognosis for improvement in comfort and function after the ream-and-run arthroplasty for glenohumeral arthritis: An analysis of 176 consecutive cases. J Bone Joint Surg Am. 2012;94(14):e102.
26. Lynch JR, Franta AK, Montgomery WH Jr, Lenters TR, Mounce D, Matsen FA 3rd. Self-assessed outcome at two to four years after shoulder hemiarthroplasty with concentric glenoid reaming. J Bone Joint Surg Am. 2007;89(6):1284-1292.
27. Donohue KW, Ricchetti ET, Iannotti JP. Surgical management of the biconcave (B2) glenoid. Curr Rev Musculoskelet Med. 2016;9(1):30-39.
28. Clavert P, Millett PJ, Warner JJ. Glenoid resurfacing: What are the limits to asymmetric reaming for posterior erosion? J Shoulder Elbow Surg. 2007;16(6):843-848.
29. Gillespie R, Lyons R, Lazarus M. Eccentric reaming in total shoulder arthroplasty: A cadaveric study. Orthopedics. 2009;32(1):21.
30. Neer CS 2nd, Morrison DS. Glenoid bone-grafting in total shoulder arthroplasty. J Bone Joint Surg Am. 1988;70(8):1154-1162.
31. Nowak DD, Bahu MJ, Gardner TR, et al. Simulation of surgical glenoid resurfacing using three-dimensional computed tomography of the arthritic glenohumeral joint: The amount of glenoid retroversion that can be corrected. J Shoulder Elbow Surg. 2009;18(5):680-688.
32. Strauss EJ, Roche C, Flurin PH, Wright T, Zuckerman JD. The glenoid in shoulder arthroplasty. J Shoulder Elbow Surg. 2009;18(5):819-833.
33. Walch G, Young AA, Boileau P, Loew M, Gazielly D, Mole D. Patterns of loosening of polyethylene keeled glenoid components after shoulder arthroplasty for primary osteoarthritis: Results of a multicenter study with more than five years of follow-up. J Bone Joint Surg Am. 2012;94(2):145-150.
34. Walch G, Young AA, Melis B, Gazielly D, Loew M, Boileau P. Results of a convex-back cemented keeled glenoid component in primary osteoarthritis: Multicenter study with a follow-up greater than 5 years. J Shoulder Elbow Surg. 2011;20(3):385-394.
35. Klika BJ, Wooten CW, Sperling JW, et al. Structural bone grafting for glenoid deficiency in primary total shoulder arthroplasty. J Shoulder Elbow Surg. 2014;23(7):1066-1072.
36. Sabesan V, Callanan M, Sharma V, Iannotti JP. Correction of acquired glenoid bone loss in osteoarthritis with a standard versus an augmented glenoid component. J Shoulder Elbow Surg. 2014;23(7):964-973.
37. Steinmann SP, Cofield RH. Bone grafting for glenoid deficiency in total shoulder replacement. J Shoulder Elbow Surg. 2000;9(5):361-367.
38. Cil A, Sperling JW, Cofield RH. Nonstandard glenoid components for bone deficiencies in shoulder arthroplasty. J Shoulder Elbow Surg. 2014;23(7):e149-e157.
39. Iannotti JP, Lappin KE, Klotz CL, Reber EW, Swope SW. Liftoff resistance of augmented glenoid components during cyclic fatigue loading in the posterior-superior direction. J Shoulder Elbow Surg. 2013;22(11):1530-1536.
40. Knowles NK, Ferreira LM, Athwal GS. Augmented glenoid component designs for type B2 erosions: A computational comparison by volume of bone removal and quality of remaining bone. J Shoulder Elbow Surg. 2015;24(8):1218-1226.
41. Mizuno N, Denard PJ, Raiss P, Walch G. Reverse total shoulder arthroplasty for primary glenohumeral osteoarthritis in patients with a biconcave glenoid. J Bone Joint Surg Am. 2013;95(14):1297-1304.