User login
Interhospital Transfer Handoff Practices
Transitions of care are major sources of preventable medical errors. Incomplete or inaccurate communication during handoffs is the root cause of many adverse events.[1] In a prospective study, adverse events were found to occur during interhospital transfer up to 30% of the time.[2] Furthermore, patients subject to interhospital transfer have longer length of stay and higher inpatient mortality, even after adjusting for mortality risk predictors.[3] Standardizing intrahospital handoff structures and communication practices has been shown to reduce medical errors.[4, 5, 6] Interhospital transfer is an understudied area among the transitions of care literature. Little is known about institutional variations in the process of information transfer and its association with patient outcomes. Although it is challenging to ascertain the total burden of transferred patients, it has been estimated that 1.6 million inpatients originated at another facility.[7] Additionally, approximately 5.9% of admissions to a representative sample of US intensive care units (ICU) originated from other hospitals.[8] Patients are transferred between hospitals for multiple reasons beyond medical necessity, for example, to adjust for patient preferences, bed availability, and hospital staffing patterns. This creates a setting in which complex and often critically ill patients are subject to variable and sometimes ambiguous handoff processes.[9]
This survey of 32 tertiary care centers in the United States was undertaken to identify common practices in communication and documentation during interhospital patient transfers. Additional goals were to understand the structure of the handoff process, the role of the transfer center, and how electronic medical records (EMR) and interhospital communication play a role in this care transition. Subsequently, common challenges in coordinating interhospital transfers were identified to provide a conceptual framework for process improvement.
METHODS
Survey Process
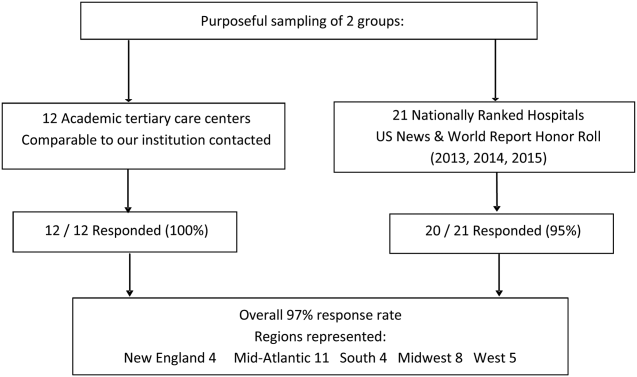
The survey was initiated in September 2013 and concluded in September 2015, and was designed to quantify patient volume and identify common as well as unique practices to improve communication across the transfer process. The respondents were transfer center directors or managers, typically with a nursing background. Mass e‐mail generated a very poor response rate and did not allow for discussion and clarification of responses. The strategy was then modified to contact individual institutions directly. The survey was performed via phone whenever possible. Figure 1 represents purposeful sampling conducted on 2 different groups of hospitals. These hospitals represent a convenience sample of institutions from a nationally ranked list of hospitals as well as others comparable to our own institutions. Hospitals were selected based on status as academic tertiary care centers with roughly similar bed sizes (600). Several were selected based on similar EMR capabilities. Geographic diversity was also taken into account. Thirty‐two academic tertiary care centers were ultimately included in the survey. Data were entered into a survey form and deidentified. The RutgersRobert Wood Johnson Medical School Institutional Review Board approved this study.

Survey Content
Qualitative and quantitative data were collected by the study team. Data included number and origin of transfers (including those from inpatient facilities and emergency departments), staff characteristics, transfer process, documentation received prior to transfer, EMR access and type, outcomes, and clinical status tracking (see Supporting Figure 1 in the online version of this article for the complete survey tool).
Measurement and Data Analysis
Descriptive statistics are presented in unweighted fashion as a number and percentage for dichotomous variables, or a numeric range for ordinal variables. When a range was given by survey participants, the lower end of the range was used to calculate the population median. Several institutions surveyed were unable to provide specific numeric values, but instead cited how many requests for transfer they received either daily or monthly; these were omitted from the demographics analysis.
Respondents also provided a description of their overall triage and acceptance process for qualitative analysis. Unique strategies were identified by the study personnel at the time of each interview and amassed at the end of the interview period. These strategies were then discussed by the study team, and separated into categories that addressed the main challenges associated with interhospital transfers. Five general tenants of the transfer process were identified: acceptance and transport, need for clinical updates, provider handoffs and coordination of care, information availability, and feedback.
RESULTS
Based on a survey question asking respondents to estimate the total number of interhospital transfers received per month, the annual burden of patients transferred into these 32 hospitals represented approximately 247,000 patients yearly. The median number of patients transferred per month, based on a point estimate if given or the lower end of the range if a range was provided, was 700 (range, 2502500). On average, 28% (range, 10%50%) were transferred directly to an ICU, representing approximately 69,000 critically ill patients. A majority of hospitals polled (65%) received patients from more than 100 referring institutions, and a minority (23%) identified EMR interoperability for more than a quarter of the sending facilities. The overall acceptance rate ranged from 50% to 95%.
Table 1 represents common transition elements of participating institutions. Thirty‐eight percent of hospitals utilize a critical caretrained registered nurse as the initial triage point of contact. The process and quality controls for coordinating transfers from outside hospitals were highly variable. Although clinical updates from acceptance to arrival were required in a majority of hospitals (81%), the acceptable time interval was inconsistent, varying from 2 to 4 hours (13%) to 24 hours (38%). A mandatory 3‐way recorded discussion (between transfer center staff, and referring and accepting physician) was nearly uniform. Objective clinical information to assist the handoff (ie, current labs, radiology images, history and physical, progress notes, or discharge summary) was available in only 29% of hospitals. Only 23% of hospitals also recorded a 3‐way nursing handoff (bedside‐to‐bedside nursing report). A minority of hospitals utilized their principal EMR to document the transfer process and share incoming clinical information among providers (32%).
| Survey Question | Survey Response | N (%) |
|---|---|---|
| ||
| What is the training background of the staff member who takes the initial call and triages patients in your transfer center? | Critical care experienced RN | 12/32 (38%) |
| Other clinical background (EMT, RN) | 13/32 (41%) | |
| Nonclinical personnel | 7/32 (22%) | |
| Prior to the patient's arrival, do you require any documentation to be transmitted from the transferring institution? | Objective clinical data required | 9/32 (28%) |
| Objective clinical data not required | 23/32 (72%) | |
| Is a 3‐way recorded conversation facilitated by the transfer center required? | Initial physician‐to‐physician acceptance discussion | 27/32 (84%) |
| RN‐to‐RN report | 6/26 (23%) | |
| Are clinical status updates required? | Updates required every 24 hours | 12/32 (38%) |
| Updates required every 812 hours | 7/32 (22%) | |
| Updates required every 24 hours | 4/32 (13%) | |
| Updates required but timing not specified | 3/32 (9%) | |
| Clinical status updates not required | 6/32 (19%) | |
| Is any clinical information obtained by the transfer center available to the patient's providers in real time on your EMR system? | Yes | 10/31 (32%) |
| No | 21/31 (68%) | |
| Do you track the outcomes of patients you accept from outside hospitals? | Yes | 14/24 (58%) |
| No | 10/24 (42%) | |
Descriptions of the transfer process were conceptually evaluated by the study team, then divided into 5 common themes: acceptance and transport, clinical updates, coordination of care, information availability, and quality improvement (Table 2). Institutions devised novel approaches including providing high bed priority to expedite transit, a dedicated quarterback physician to coordinate safe transfer and uninterrupted communication, electronic transfer notes to share communication with all providers, and a standardized system of feedback to referring hospitals. Several institutions relied on an expect note, which could be a free‐text document or a form document in the EMR. This preserves verbal handoff information that may otherwise be lost if the accepting physician at the time of transfer is not the physician receiving the handoff.
| Challenges | Innovative Practices |
|---|---|
| |
| Expedited acceptance and transport | Automatic acceptance for certain diagnoses (ie, neurosurgical indication for transfer) |
| Transferred patients prioritized for hospital beds over all patients except codes | |
| Hospital controls transportation units, allowing for immediate dispatch and patient retrieval | |
| Outsourcing of transfer center and interfacility transfer to third party | |
| Timeliness of clinical updates | Transfer center communicates with bedside RN for clinical updates at the time of transfer |
| Clinical status updates every 24 hours for critical patients | |
| Daily reevaluation of clinical status | |
| Accepting physician alerted of changes in clinical status | |
| Handoff and coordination of care | Physician accept tool in EMR |
| Quarterback physician who triages and accepts all patients during a given time period | |
| Critical patients are accepted into a critical care resuscitation unit, an all‐purpose intensive care unit staffed by an intensivist who shares decision making with the referring provider and is involved in all communications regarding the transferred patient | |
| Availability of protected clinical information | Scribed physician handoff imported into EMR |
| Expect note in EMR: summary of clinical information documented by accepting physician | |
| PACS radiology cloud networks for hospital systems or statewide | |
| EMR interoperability: Care Everywhere module in Epic EMR | |
| Health and information management department responsible for obtaining and scanning outside records into EMR | |
| Feedback and quality improvement | Automatic review if patient upgraded to ICU within 4 hours of arrival |
| Departmental chair review of physician verbal handoff if poor outcome or difficulty with transfer | |
| Outcomes and quality of handoff reported back to referring hospital | |
| Discharge summary sent to referring hospital | |
| Referring hospital able to view patient's chart for 1 year | |
Quality improvement occurred via both internal and external feedback at several institutions. There were two notable mechanisms of internal feedback. Review of recorded physician verbal handoff by department chair occurred if an adverse event involved a transferred patient. An automatic internal review was triggered if a patient was upgraded to a higher level of care within 4 hours of arrival. These advanced mechanisms require vigilance and dedication on the part of the transfer center and physicians involved in the transfer process. External feedback was provided to referring hospitals through both active and passive mechanisms. One advanced health system allowed referring providers to access the patient's inpatient medical record for 1 year and sent a discharge summary to all referring hospitals. Another hospital maintained a sophisticated scorecard, with key measures shared with internal stakeholders and referring hospitals. Some of the metrics tracked included: denials due to insufficient bed capacity, change in bed status within 12 hours of transfer, and duration of stay in the postanesthesia care unit or emergency department awaiting an inpatient bed. This organization also performed site visits to referring hospitals, addressing handoff quality improvement.
DISCUSSION
Standardizing intrahospital handoffs has been shown to decrease preventable medical errors and reduce possible near‐miss events.[6, 10] Interhospital care transitions are inherently more complex due to increased acuity and decreased continuity; yet, there is no universal standardization of these handovers. We found that practices vary widely among tertiary care centers, and the level of transfer center involvement in the verbal and written handoff is inconsistent.
Evidence‐based frameworks to improve healthcare delivery, such as TeamSTEPPS (Team Strategies and Tools to Enhance Performance and Patient Safety), first require an organizational assessment to identify barriers to effective communication.[11] Interhospital transfers offer multiple unique barriers to continuity: physical distance, uncertainty in timing, incongruent treatment goals, disparate information sources, and distractions. This study provides the first step in conceptualizing the unique aspects of interhospital transfers, as well as highlights strategies to improve care coordination (Table 2).
A tailored intervention needs not only to overcome the typical barriers to handoffs such as time constraints, information sharing, and ambiguity in provider roles, but also to overcome multiple systems barriers. Bed management systems add another time‐related variable due to fixed and frequently overburdened bed capacity. Prioritization of transfers depends upon an accurate clinical depiction of patient acuity as well as organizational strategies. For example, neurologic diagnoses are commonly a top priority and are triaged as such, sometimes instead of higher‐acuity patients with other principal diagnoses. The complexity of this process may lead to delays in high‐acuity transfers, and is contingent upon accurate and updated clinical information. Coordinating handovers amidst complex provider schedules is another systems barrier. The commonly adopted 7 on, 7 off model for hospitalists, and shift work for intensivists, may increase the possibility that a transfer occurs across multiple provider changes. Patient follow‐up and closed‐loop feedback are important components of intrahospital handovers, but are much more challenging to implement for interhospital handovers with incongruent information systems and providers.
Programs to improve intrahospital handovers (eg, IPASS) emphasize creating an accurate clinical depiction of a patient using both verbal and written handoffs.[12] This is arguably more difficult over the phone without a concurrent written handoff. Recording of 3‐way physician and nurse handoffs is common, but reviews of recorded conversations are often unavailable or cumbersome in real time. EMR documentation of verbal information exchanged during the handoff is a possible solution. However, there may be legal implications for a transcribed verbal handoff. Furthermore, transfer centers often work with a software program separate from the principal EMR, and documentation in real time is challenging. EMR integration could help reinforce a patient‐centered shared mental model by allowing visualization of lab trends, radiology, vitals, and other documentation during and after the verbal handoff.
Physician‐driven checklist accept tools are another solution. Usually the responsibility of the accepting attending or fellow, this type of document is most useful as a modifiable document in the EMR. Accept tools, such as the one created by Malpass et al., have demonstrated successful shared decision making, and have resulted in fewer emergent procedures and fewer antibiotic changes on arrival.[13] One of the challenges with this approach is the frequency of utilization. In the aforementioned study, the adoption rate of the accept tool was about 70% in a closed university medical ICU, where these types of interventions may be viewed favorably by providers instead of burdensome.[13]
The most consistent finding of this survey was the lack of common processes to improve outcomes. Simple interventions, such as regular clinical updates, documentation of the handoff process, and obtaining objective information early in the process, were inconsistently adopted. Outcomes tracking and feedback are necessary components of team‐based quality improvement. Approximately half of the hospitals surveyed specifically tracked outcomes of transferred patients, and a minority had systems in place to provide feedback to referring centers.
Improving care delivery requires buy‐in from all participants, necessitating engagement of referring hospitals. Interventions such as frequent status updates and providing early documentation have the potential to increase the burden on referring providers when feedback or incentives are not commonplace. Moreover, the referring provider has the option of transferring a patient to a hospital with reduced handoff requirements, creating a disincentive for quality improvement. Quality metrics that incorporate outcomes of transferred patients may be necessary to better align the goals of sending and receiving physicians.
This study was intended to be a qualitative investigation and has some limitations. Any verbal qualitative study has the possibility of misinterpretation of information given by transfer center personnel. A single investigator performed most of the discussions and was able to clarify when needed, providing a degree of consistency, but may also be a source of bias. Categorical answers and a team‐based approach to conceptualizing responses likely minimized this potential bias.
We selected hospitals from the U.S. News and World Report Honor Roll plus additional hospitals chosen based on similarity to our home institutions. This may be a skewed sample and may not represent other major US hospitals and networks. However, we chose to interview large academic tertiary care centers, many accepting more than 1000 patients monthly, as these are likely to be the most proficient at performing transfers, and responses may be generalizable.
CONCLUSIONS
Standardization of information exchange during interhospital transfers does not currently exist. Practices vary widely amongst academic tertiary care centers. There is a paucity of data to support the association of specific processes with patient outcomes. Ultimately, a multicenter study examining the impact of improved information transfer on patient outcomes is warranted, utilizing tracking resources already in place. Optimizing and aligning practices between sending and receiving hospitals may improve interhospital handover efficiency and patient safety.
Disclosures
Dr. Usher is supported by a National Institutes of Health Clinical and Translational Science Award at the University of Minnesota: UL1TR000114. Dr. Steinberg has received support from Arena Pharmaceuticals and Major League Baseball. Drs. Herrigel, Parikh, Fanning, and Carroll have no disclosures. A prior version of this article was presented as an abstract at the Society of General Internal Medicine Mid‐Atlantic Regional Meeting in April 2014 in New York, New York.
- , , , . Doctors' handovers in hospitals: a literature review. BMJ Qual Saf. 2011;20(2):128–133.
- , , , et al. Quality of inter‐hospital transport of critically ill patients: a prospective audit. Crit Care. 2005;9(4):R446–R451.
- , , , , . Interhospital transfer patients discharged by academic hospitalists and general internists: characteristics and outcomes [published online November 20, 2015]. J Hosp Med. doi: 10.1002/jhm.2515.
- , , , et al. Evaluation of postoperative handover using a tool to assess information transfer and teamwork. Ann Surg. 2011;253(4):831–837.
- , , , et al. Rates of medical errors and preventable adverse events among hospitalized children following implementation of a resident handoff bundle. JAMA. 2013;310(21):2262–2270.
- , , , et al. Changes in medical errors after implementation of a handoff program. N Engl J Med. 2014;371(19):1803–1812.
- HCUP National Inpatient Sample (NIS). Healthcare Cost and Utilization Project (HCUP). 2012. Agency for Healthcare Research and Quality, Rockville, MD. Available at: www.hcup‐us.ahrq.gov/nisoverview.jsp. Accessed 26 May 2015.
- , , , , , . Outcomes among patients discharged from busy intensive care units. Ann Intern Med. 2013;159(7):447–455.
- , , . Reasons underlying inter‐hospital transfers to an academic medical intensive care unit. J Crit Care. 2013;28(2):202–208.
- , , , . Avoiding handover fumbles: a controlled trial of a structured handover tool versus traditional handover methods. BMJ Qual Saf. 2012;21(11):925–932.
- , , , et al. Validation of a teamwork perceptions measure to increase patient safety. BMJ Qual Saf. 2014;23(9):718–726.
- , , , et al. Development, implementation, and dissemination of the I‐PASS handoff curriculum: a multisite educational intervention to improve patient handoffs. Acad Med. 2014;89(6):876–884.
- , , , . The interhospital medical intensive care unit transfer instrument facilitates early implementation of critical therapies and is associated with fewer emergent procedures upon arrival. J Intensive Care Med. 2015;30(6):351–357.
Transitions of care are major sources of preventable medical errors. Incomplete or inaccurate communication during handoffs is the root cause of many adverse events.[1] In a prospective study, adverse events were found to occur during interhospital transfer up to 30% of the time.[2] Furthermore, patients subject to interhospital transfer have longer length of stay and higher inpatient mortality, even after adjusting for mortality risk predictors.[3] Standardizing intrahospital handoff structures and communication practices has been shown to reduce medical errors.[4, 5, 6] Interhospital transfer is an understudied area among the transitions of care literature. Little is known about institutional variations in the process of information transfer and its association with patient outcomes. Although it is challenging to ascertain the total burden of transferred patients, it has been estimated that 1.6 million inpatients originated at another facility.[7] Additionally, approximately 5.9% of admissions to a representative sample of US intensive care units (ICU) originated from other hospitals.[8] Patients are transferred between hospitals for multiple reasons beyond medical necessity, for example, to adjust for patient preferences, bed availability, and hospital staffing patterns. This creates a setting in which complex and often critically ill patients are subject to variable and sometimes ambiguous handoff processes.[9]
This survey of 32 tertiary care centers in the United States was undertaken to identify common practices in communication and documentation during interhospital patient transfers. Additional goals were to understand the structure of the handoff process, the role of the transfer center, and how electronic medical records (EMR) and interhospital communication play a role in this care transition. Subsequently, common challenges in coordinating interhospital transfers were identified to provide a conceptual framework for process improvement.
METHODS
Survey Process
The survey was initiated in September 2013 and concluded in September 2015, and was designed to quantify patient volume and identify common as well as unique practices to improve communication across the transfer process. The respondents were transfer center directors or managers, typically with a nursing background. Mass e‐mail generated a very poor response rate and did not allow for discussion and clarification of responses. The strategy was then modified to contact individual institutions directly. The survey was performed via phone whenever possible. Figure 1 represents purposeful sampling conducted on 2 different groups of hospitals. These hospitals represent a convenience sample of institutions from a nationally ranked list of hospitals as well as others comparable to our own institutions. Hospitals were selected based on status as academic tertiary care centers with roughly similar bed sizes (600). Several were selected based on similar EMR capabilities. Geographic diversity was also taken into account. Thirty‐two academic tertiary care centers were ultimately included in the survey. Data were entered into a survey form and deidentified. The RutgersRobert Wood Johnson Medical School Institutional Review Board approved this study.
Survey Content
Qualitative and quantitative data were collected by the study team. Data included number and origin of transfers (including those from inpatient facilities and emergency departments), staff characteristics, transfer process, documentation received prior to transfer, EMR access and type, outcomes, and clinical status tracking (see Supporting Figure 1 in the online version of this article for the complete survey tool).
Measurement and Data Analysis
Descriptive statistics are presented in unweighted fashion as a number and percentage for dichotomous variables, or a numeric range for ordinal variables. When a range was given by survey participants, the lower end of the range was used to calculate the population median. Several institutions surveyed were unable to provide specific numeric values, but instead cited how many requests for transfer they received either daily or monthly; these were omitted from the demographics analysis.
Respondents also provided a description of their overall triage and acceptance process for qualitative analysis. Unique strategies were identified by the study personnel at the time of each interview and amassed at the end of the interview period. These strategies were then discussed by the study team, and separated into categories that addressed the main challenges associated with interhospital transfers. Five general tenants of the transfer process were identified: acceptance and transport, need for clinical updates, provider handoffs and coordination of care, information availability, and feedback.
RESULTS
Based on a survey question asking respondents to estimate the total number of interhospital transfers received per month, the annual burden of patients transferred into these 32 hospitals represented approximately 247,000 patients yearly. The median number of patients transferred per month, based on a point estimate if given or the lower end of the range if a range was provided, was 700 (range, 2502500). On average, 28% (range, 10%50%) were transferred directly to an ICU, representing approximately 69,000 critically ill patients. A majority of hospitals polled (65%) received patients from more than 100 referring institutions, and a minority (23%) identified EMR interoperability for more than a quarter of the sending facilities. The overall acceptance rate ranged from 50% to 95%.
Table 1 represents common transition elements of participating institutions. Thirty‐eight percent of hospitals utilize a critical caretrained registered nurse as the initial triage point of contact. The process and quality controls for coordinating transfers from outside hospitals were highly variable. Although clinical updates from acceptance to arrival were required in a majority of hospitals (81%), the acceptable time interval was inconsistent, varying from 2 to 4 hours (13%) to 24 hours (38%). A mandatory 3‐way recorded discussion (between transfer center staff, and referring and accepting physician) was nearly uniform. Objective clinical information to assist the handoff (ie, current labs, radiology images, history and physical, progress notes, or discharge summary) was available in only 29% of hospitals. Only 23% of hospitals also recorded a 3‐way nursing handoff (bedside‐to‐bedside nursing report). A minority of hospitals utilized their principal EMR to document the transfer process and share incoming clinical information among providers (32%).
| Survey Question | Survey Response | N (%) |
|---|---|---|
| ||
| What is the training background of the staff member who takes the initial call and triages patients in your transfer center? | Critical care experienced RN | 12/32 (38%) |
| Other clinical background (EMT, RN) | 13/32 (41%) | |
| Nonclinical personnel | 7/32 (22%) | |
| Prior to the patient's arrival, do you require any documentation to be transmitted from the transferring institution? | Objective clinical data required | 9/32 (28%) |
| Objective clinical data not required | 23/32 (72%) | |
| Is a 3‐way recorded conversation facilitated by the transfer center required? | Initial physician‐to‐physician acceptance discussion | 27/32 (84%) |
| RN‐to‐RN report | 6/26 (23%) | |
| Are clinical status updates required? | Updates required every 24 hours | 12/32 (38%) |
| Updates required every 812 hours | 7/32 (22%) | |
| Updates required every 24 hours | 4/32 (13%) | |
| Updates required but timing not specified | 3/32 (9%) | |
| Clinical status updates not required | 6/32 (19%) | |
| Is any clinical information obtained by the transfer center available to the patient's providers in real time on your EMR system? | Yes | 10/31 (32%) |
| No | 21/31 (68%) | |
| Do you track the outcomes of patients you accept from outside hospitals? | Yes | 14/24 (58%) |
| No | 10/24 (42%) | |
Descriptions of the transfer process were conceptually evaluated by the study team, then divided into 5 common themes: acceptance and transport, clinical updates, coordination of care, information availability, and quality improvement (Table 2). Institutions devised novel approaches including providing high bed priority to expedite transit, a dedicated quarterback physician to coordinate safe transfer and uninterrupted communication, electronic transfer notes to share communication with all providers, and a standardized system of feedback to referring hospitals. Several institutions relied on an expect note, which could be a free‐text document or a form document in the EMR. This preserves verbal handoff information that may otherwise be lost if the accepting physician at the time of transfer is not the physician receiving the handoff.
| Challenges | Innovative Practices |
|---|---|
| |
| Expedited acceptance and transport | Automatic acceptance for certain diagnoses (ie, neurosurgical indication for transfer) |
| Transferred patients prioritized for hospital beds over all patients except codes | |
| Hospital controls transportation units, allowing for immediate dispatch and patient retrieval | |
| Outsourcing of transfer center and interfacility transfer to third party | |
| Timeliness of clinical updates | Transfer center communicates with bedside RN for clinical updates at the time of transfer |
| Clinical status updates every 24 hours for critical patients | |
| Daily reevaluation of clinical status | |
| Accepting physician alerted of changes in clinical status | |
| Handoff and coordination of care | Physician accept tool in EMR |
| Quarterback physician who triages and accepts all patients during a given time period | |
| Critical patients are accepted into a critical care resuscitation unit, an all‐purpose intensive care unit staffed by an intensivist who shares decision making with the referring provider and is involved in all communications regarding the transferred patient | |
| Availability of protected clinical information | Scribed physician handoff imported into EMR |
| Expect note in EMR: summary of clinical information documented by accepting physician | |
| PACS radiology cloud networks for hospital systems or statewide | |
| EMR interoperability: Care Everywhere module in Epic EMR | |
| Health and information management department responsible for obtaining and scanning outside records into EMR | |
| Feedback and quality improvement | Automatic review if patient upgraded to ICU within 4 hours of arrival |
| Departmental chair review of physician verbal handoff if poor outcome or difficulty with transfer | |
| Outcomes and quality of handoff reported back to referring hospital | |
| Discharge summary sent to referring hospital | |
| Referring hospital able to view patient's chart for 1 year | |
Quality improvement occurred via both internal and external feedback at several institutions. There were two notable mechanisms of internal feedback. Review of recorded physician verbal handoff by department chair occurred if an adverse event involved a transferred patient. An automatic internal review was triggered if a patient was upgraded to a higher level of care within 4 hours of arrival. These advanced mechanisms require vigilance and dedication on the part of the transfer center and physicians involved in the transfer process. External feedback was provided to referring hospitals through both active and passive mechanisms. One advanced health system allowed referring providers to access the patient's inpatient medical record for 1 year and sent a discharge summary to all referring hospitals. Another hospital maintained a sophisticated scorecard, with key measures shared with internal stakeholders and referring hospitals. Some of the metrics tracked included: denials due to insufficient bed capacity, change in bed status within 12 hours of transfer, and duration of stay in the postanesthesia care unit or emergency department awaiting an inpatient bed. This organization also performed site visits to referring hospitals, addressing handoff quality improvement.
DISCUSSION
Standardizing intrahospital handoffs has been shown to decrease preventable medical errors and reduce possible near‐miss events.[6, 10] Interhospital care transitions are inherently more complex due to increased acuity and decreased continuity; yet, there is no universal standardization of these handovers. We found that practices vary widely among tertiary care centers, and the level of transfer center involvement in the verbal and written handoff is inconsistent.
Evidence‐based frameworks to improve healthcare delivery, such as TeamSTEPPS (Team Strategies and Tools to Enhance Performance and Patient Safety), first require an organizational assessment to identify barriers to effective communication.[11] Interhospital transfers offer multiple unique barriers to continuity: physical distance, uncertainty in timing, incongruent treatment goals, disparate information sources, and distractions. This study provides the first step in conceptualizing the unique aspects of interhospital transfers, as well as highlights strategies to improve care coordination (Table 2).
A tailored intervention needs not only to overcome the typical barriers to handoffs such as time constraints, information sharing, and ambiguity in provider roles, but also to overcome multiple systems barriers. Bed management systems add another time‐related variable due to fixed and frequently overburdened bed capacity. Prioritization of transfers depends upon an accurate clinical depiction of patient acuity as well as organizational strategies. For example, neurologic diagnoses are commonly a top priority and are triaged as such, sometimes instead of higher‐acuity patients with other principal diagnoses. The complexity of this process may lead to delays in high‐acuity transfers, and is contingent upon accurate and updated clinical information. Coordinating handovers amidst complex provider schedules is another systems barrier. The commonly adopted 7 on, 7 off model for hospitalists, and shift work for intensivists, may increase the possibility that a transfer occurs across multiple provider changes. Patient follow‐up and closed‐loop feedback are important components of intrahospital handovers, but are much more challenging to implement for interhospital handovers with incongruent information systems and providers.
Programs to improve intrahospital handovers (eg, IPASS) emphasize creating an accurate clinical depiction of a patient using both verbal and written handoffs.[12] This is arguably more difficult over the phone without a concurrent written handoff. Recording of 3‐way physician and nurse handoffs is common, but reviews of recorded conversations are often unavailable or cumbersome in real time. EMR documentation of verbal information exchanged during the handoff is a possible solution. However, there may be legal implications for a transcribed verbal handoff. Furthermore, transfer centers often work with a software program separate from the principal EMR, and documentation in real time is challenging. EMR integration could help reinforce a patient‐centered shared mental model by allowing visualization of lab trends, radiology, vitals, and other documentation during and after the verbal handoff.
Physician‐driven checklist accept tools are another solution. Usually the responsibility of the accepting attending or fellow, this type of document is most useful as a modifiable document in the EMR. Accept tools, such as the one created by Malpass et al., have demonstrated successful shared decision making, and have resulted in fewer emergent procedures and fewer antibiotic changes on arrival.[13] One of the challenges with this approach is the frequency of utilization. In the aforementioned study, the adoption rate of the accept tool was about 70% in a closed university medical ICU, where these types of interventions may be viewed favorably by providers instead of burdensome.[13]
The most consistent finding of this survey was the lack of common processes to improve outcomes. Simple interventions, such as regular clinical updates, documentation of the handoff process, and obtaining objective information early in the process, were inconsistently adopted. Outcomes tracking and feedback are necessary components of team‐based quality improvement. Approximately half of the hospitals surveyed specifically tracked outcomes of transferred patients, and a minority had systems in place to provide feedback to referring centers.
Improving care delivery requires buy‐in from all participants, necessitating engagement of referring hospitals. Interventions such as frequent status updates and providing early documentation have the potential to increase the burden on referring providers when feedback or incentives are not commonplace. Moreover, the referring provider has the option of transferring a patient to a hospital with reduced handoff requirements, creating a disincentive for quality improvement. Quality metrics that incorporate outcomes of transferred patients may be necessary to better align the goals of sending and receiving physicians.
This study was intended to be a qualitative investigation and has some limitations. Any verbal qualitative study has the possibility of misinterpretation of information given by transfer center personnel. A single investigator performed most of the discussions and was able to clarify when needed, providing a degree of consistency, but may also be a source of bias. Categorical answers and a team‐based approach to conceptualizing responses likely minimized this potential bias.
We selected hospitals from the U.S. News and World Report Honor Roll plus additional hospitals chosen based on similarity to our home institutions. This may be a skewed sample and may not represent other major US hospitals and networks. However, we chose to interview large academic tertiary care centers, many accepting more than 1000 patients monthly, as these are likely to be the most proficient at performing transfers, and responses may be generalizable.
CONCLUSIONS
Standardization of information exchange during interhospital transfers does not currently exist. Practices vary widely amongst academic tertiary care centers. There is a paucity of data to support the association of specific processes with patient outcomes. Ultimately, a multicenter study examining the impact of improved information transfer on patient outcomes is warranted, utilizing tracking resources already in place. Optimizing and aligning practices between sending and receiving hospitals may improve interhospital handover efficiency and patient safety.
Disclosures
Dr. Usher is supported by a National Institutes of Health Clinical and Translational Science Award at the University of Minnesota: UL1TR000114. Dr. Steinberg has received support from Arena Pharmaceuticals and Major League Baseball. Drs. Herrigel, Parikh, Fanning, and Carroll have no disclosures. A prior version of this article was presented as an abstract at the Society of General Internal Medicine Mid‐Atlantic Regional Meeting in April 2014 in New York, New York.
- , , , . Doctors' handovers in hospitals: a literature review. BMJ Qual Saf. 2011;20(2):128–133.
- , , , et al. Quality of inter‐hospital transport of critically ill patients: a prospective audit. Crit Care. 2005;9(4):R446–R451.
- , , , , . Interhospital transfer patients discharged by academic hospitalists and general internists: characteristics and outcomes [published online November 20, 2015]. J Hosp Med. doi: 10.1002/jhm.2515.
- , , , et al. Evaluation of postoperative handover using a tool to assess information transfer and teamwork. Ann Surg. 2011;253(4):831–837.
- , , , et al. Rates of medical errors and preventable adverse events among hospitalized children following implementation of a resident handoff bundle. JAMA. 2013;310(21):2262–2270.
- , , , et al. Changes in medical errors after implementation of a handoff program. N Engl J Med. 2014;371(19):1803–1812.
- HCUP National Inpatient Sample (NIS). Healthcare Cost and Utilization Project (HCUP). 2012. Agency for Healthcare Research and Quality, Rockville, MD. Available at: www.hcup‐us.ahrq.gov/nisoverview.jsp. Accessed 26 May 2015.
- , , , , , . Outcomes among patients discharged from busy intensive care units. Ann Intern Med. 2013;159(7):447–455.
- , , . Reasons underlying inter‐hospital transfers to an academic medical intensive care unit. J Crit Care. 2013;28(2):202–208.
- , , , . Avoiding handover fumbles: a controlled trial of a structured handover tool versus traditional handover methods. BMJ Qual Saf. 2012;21(11):925–932.
- , , , et al. Validation of a teamwork perceptions measure to increase patient safety. BMJ Qual Saf. 2014;23(9):718–726.
- , , , et al. Development, implementation, and dissemination of the I‐PASS handoff curriculum: a multisite educational intervention to improve patient handoffs. Acad Med. 2014;89(6):876–884.
- , , , . The interhospital medical intensive care unit transfer instrument facilitates early implementation of critical therapies and is associated with fewer emergent procedures upon arrival. J Intensive Care Med. 2015;30(6):351–357.
© 2016 Society of Hospital Medicine
Evaluation of Internet Information About Rotator Cuff Repair
Patients are learning about health and disease more independently than before, but such self-education may pose a unique challenge for practicing physicians. Although educated patients can assist in the critical appraisal of treatment options,1 misinformed patients may have preconceived treatment biases and unrealistic expectations. More than 66 million Americans use the Internet daily, and recent surveys have shown 86% have used the Internet for health-related information.2,3 With Internet use increasing, the number of patients turning to the web for medical information is increasing as well.4 For many patients, this information can be useful in making decisions about their health and health care.5
Although accessing medical information from the Internet has grown exponentially, analysis of information quality has grown considerably slower.6 With no regulatory body monitoring content, there is easy circumvention of the peer review process, an essential feature of academic publishing.7 With no external regulation, the information retrieved may be incorrect, outdated, or misleading. Many orthopedic studies have analyzed Internet content about numerous diagnoses.3-6,8-18 Most of these studies have found this information highly variable and of poor quality.
We conducted a study to evaluate and analyze rotator cuff repair information available to the general public through the Internet; to assess changes in the quality of information over time; to determine if sites sponsored by academic institutions offered higher-quality information; and to assess whether the readability of the material varied according to DISCERN scores.
Rotator cuff repairs are among the most common surgeries performed by orthopedic surgeons. To our knowledge, this is the first study to assess the quality of web information about rotator cuff repairs. We hypothesized that the quality of information would positively correlate with the reading level of the material presented, that academic institutions would present the highest-quality information, and that the type of information presented would change over time.
Materials and Methods
We used the search phrase rotator cuff repair on the 3 most popular search engines: Google, Yahoo!, and Bing. Google is the dominant engine, taking 83.06% of total market share, followed by Yahoo! (6.86%) and Bing (4.27%).5 The first 50 websites identified by each search engine were selected for evaluation, excluding duplicates or overlapping websites. Similarly, advertisements and strictly video results lacking text were excluded. After each engine was queried, a master list of 150 websites was created for individual evaluation and assessment. To assess changes in results over time, we performed 2 searches, on November 16, 2011, and May 18, 2014.
The content of each website was analyzed for authorship, ability to contact the author, discussion of disorder, surgical treatment, complications, surgical eligibility, rehabilitation, other treatment options, and use of peer-reviewed sources. Authorship was placed in 1 of 6 categories:
1. Academic—university-affiliated physician or research group.
2. Private—physician or group without stated affiliation to an academic organization.
3. Industry—manufacturing or marketing company advertising a product or service for profit.
4. News source—bulletin or article without affiliation to a hospital or an academic institution.
5. Public education—individual or organization with noncommercial website providing third-party information (eg, Wikipedia, About.com).
6. Blog—website publishing an individual’s personal experiences in diary or journal form.
Websites were also assessed for accuracy and validity based on presence or absence of Health On the Net code (HONcode) certification and DISCERN score. Designed by the Health On the Net Foundation in 1996, HONcode provides a framework for disseminating high-quality medical information over the web.19 Website owners can request that their sites be evaluated for HONcode certification; a site that qualifies can display the HONcode seal.20 The DISCERN project, initially funded by the National Health Service in the United Kingdom, judges the quality of written information available on health-related websites.21 It determines the quality of a publication on the basis of 16 questions: The first 8 address the publication’s reliability, the next 7 involve specific details of treatment choices, and the last is an overall rating of the website.
Website readability was assessed with the Flesch-Kincaid test. This test, designed under contract with the US Navy in 1975, has been used in other orthopedic studies.19 Regression analysis was performed to check for correlation between website readability and DISCERN score. Analysis of variance was used to analyze differences between scores.
Results
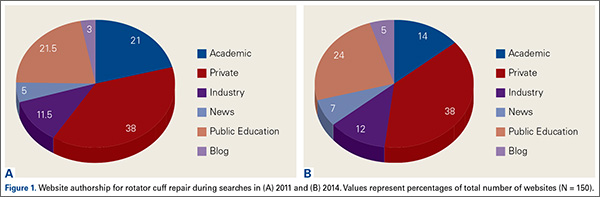
We performed a comprehensive analysis of the top 50 websites from each of the 3 search engines (N = 150 websites) (Figures 1–5, Table). Regarding authorship, our 2 searches demonstrated similar values (Figure 1). In 2011, 21% of websites were associated with an academic institution, 38% were authored by private physicians or hospital or physician groups not associated with an academic institution, 11.5% were industry-sponsored, 5% were news bulletins or media reports, 21.5% were public education websites, and 3% were personal blogs. Our 2014 search found a similar distribution of contributors. Between 2011 and 2014, the largest change was in academic authors, which decreased by 7%, from 21% to 14%. Percentage of websites authored by private physicians remained constant from the first to the second search: 38%.
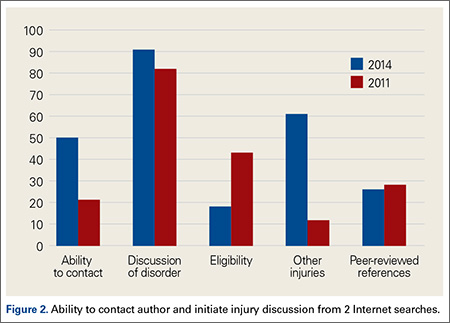
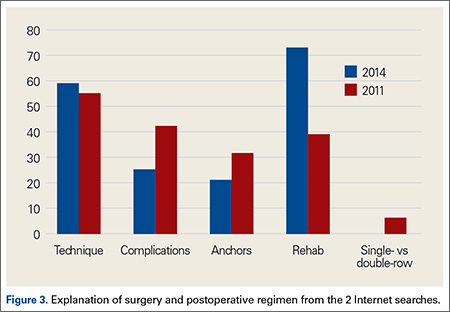
When the 2011 and 2014 website content was compared, several changes were noted. Percentage of websites providing an author contact method increased from 21% to 50% (Figure 2), percentage detailing rotator cuff repairs increased from 82% to 91%, and percentage introducing treatment options in addition to surgical management increased from 11.5% to 61%. Percentage discussing surgical eligibility, however, decreased from 43% to 18%. Percentage citing peer-reviewed sources remained relatively constant (28%, 26%), as did percentage discussing surgical technique for rotator cuff repair (55%, 59%) (Figure 3). A major decrease was found in percentage of websites discussing surgical complications, 42% in 2011 down to 25% in 2014, whereas a major increase was found in percentage discussing rehabilitation, from 39% in 2011 up to 73% in 2014. In 2014, no websites discussed double- versus single-row surgery—compared with 6% in 2011. False claims remained low between 2011 and 2014. In both searches, no website guaranteed a return to sport, and few made claims of painless or bloodless surgery.
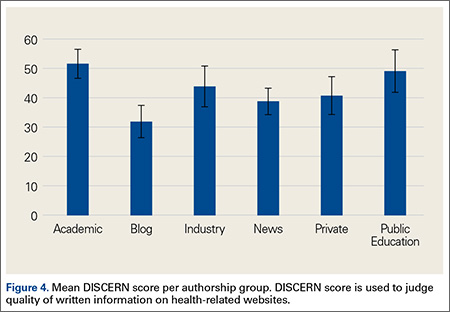
DISCERN scores for websites found during the 2014 search were averaged for each of the 6 authorship groups (Figure 4). The highest DISCERN scores were given to academic institution websites (51.6) and public education websites (49). For the academic websites, this difference was significant relative to news, blog, and private physician websites (Ps = .012, .001, .001) The lowest DISCERN scores were given to news organization websites and personal blogs. DISCERN scores were 43.8 for industry sources and 40.7 for private physician groups; the difference was not significant (P = .229). Overall mean DISCERN score for all websites was 44. Eleven percent of websites were HONcode-certified.
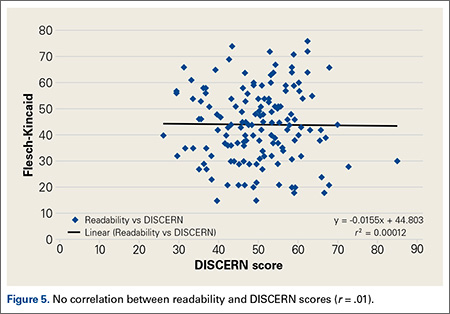
No correlation was found between website readability and DISCERN score; correlation coefficient r was .01 (Figure 5). For the websites in 2014, mean Flesch-Kincaid readability score was 50.17, and mean grade level was 10.98; coefficient of determination r2 was 0.00012.
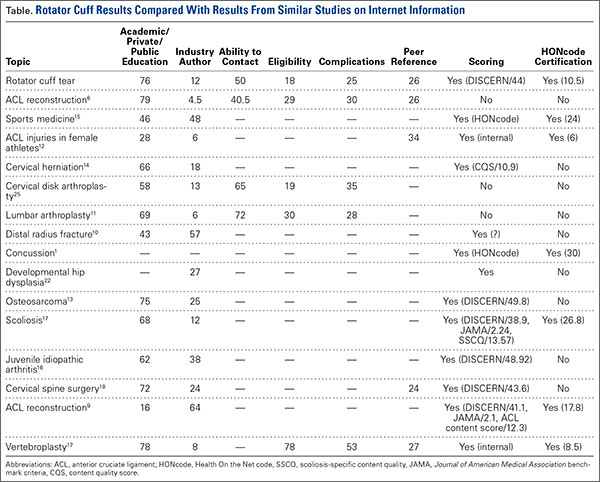
The Table compares our data with data from other orthopedic studies that have analyzed the quality of Internet information about various orthopedic injuries, diseases, and procedures.3-6,8,9,11-18 With its mean DISCERN score of 44, the present rotator cuff tear study was ranked third of 6 studies that have used this scoring system to analyze website content. Of these 6 studies, those reviewing osteosarcoma and juvenile idiopathic arthritis were ranked highest (mean scores, 49.8 and 48.9, respectively), and the study reviewing scoliosis surgery was ranked lowest (38.9). Bruce-Brand and colleagues9 recently found a mean DISCERN score of 41 for anterior cruciate ligament (ACL) reconstruction. When considering HONcode-certified websites, our Internet search for rotator cuff tears found the third lowest percentage, 10.5%, compared with the other studies (Table); the highest percentage, 30%, was found for websites discussing concussions in athletes. When considering authorship, our rotator cuff study found the third highest percentage, 76%, authored by academic centers, physicians, and public education websites; the highest percentage was found in websites discussing ACL reconstruction. Websites discussing ACL reconstruction also had the highest percentage of websites authored by industry.9
Discussion
To our knowledge, this is the first study specifically analyzing the quality of Internet information about rotator cuff repairs. A similar study, conducted by Starman and colleagues15 in 2010, addressed the quality of web information about 10 common sports medicine diagnoses, one of which was rotator cuff tears. In that study, only 16 of the websites included discussed rotator cuff tears. In addition, the authors used a customized, HONcode-based grading system to analyze each website, making their data difficult to compare across studies.
Ideally, a high-quality medical website should be written by a credible source and should cover a disorder, treatment options, eligibility, rehabilitation, and complications. As there is no standard grading system for analyzing web content about rotator cuff repairs, we analyzed the websites for specific information we thought should be included in a high-quality website (Figures 2, 3). When considering authorship, we found academic centers, private physicians, and educational sources comprised 76% of the sources; industry sources made up only 12%. Similar findings were noted by investigators analyzing Internet information about other orthopedic topics, including ACL reconstruction, lumbar arthroplasty, osteosarcoma, and cervical spine surgery.5,11,22 Studies analyzing websites for information on ACL tears and distal radius fractures found have a higher percentage of industry-sponsored websites.9,10
DISCERN showed that the highest-quality information came from websites with academic affiliations, consistent with previous studies,3,9,17 and its mean score (51.6) was significantly higher than the scores for private physician websites, news sites, and blogs (Ps = .001, .016, .001); the least reliable information was from personal blogs and news outlets. Of note, mean DISCERN score was higher for the industry websites we found than for private physician websites (43.8 vs 40.7), though the difference was not significant (P = .229). Previous investigators considered number of industry-sponsored websites as a marker of poor quality of information relating to a given topic; however, given the DISCERN scores in our study, this might not necessarily be true.6 Based on the present study’s data, websites affiliated with academic institutions would be recommended for patients searching for high-quality information about rotator cuff tears.
Given DISCERN scores across studies, information about rotator cuff tears ranked below information about osteosarcoma and juvenile idiopathic arthritis but above information about scoliosis, cervical spine surgery, and ACL reconstruction (Table). DISCERN scores must be compared across studies, as there are no definitions for good and poor DISCERN scores.
Of the 4 studies that analyzed percentage of websites citing peer-reviewed sources, only our study and the study of cervical spine surgery18 analyzed that percentage as well as DISCERN score. Percentage citing peer-reviewed sources was 26% for rotator cuff tears and 24% for cervical spine surgery; the respective DISCERN scores were 44 and 43.6. As only these 2 studies could be compared, no real correlation between percentage of websites citing peer-reviewed sources and the quality of the content on a given topic can be assessed. More research into this relationship is needed. One already delineated association is the correlation between HONcode-certified sites and high DISCERN scores.21 For high-quality medical information, physicians can direct their patients both to academic institution websites and to HONcode-certified websites.
When we compared the present study with previous investigations, we found a large difference between search results for a given topic. In 2013, Duncan and colleagues6 and Bruce-Brand and colleagues9 used similar study designs (eg, search terms, search engines) for their investigations of quality of web information. Their results, however, were widely different. For example, percentages of industry authorship were 4.5% (Duncan and colleagues6) and 64% (Bruce-Brand and colleagues9). This inconsistency between studies conducted during similar periods might be related to what appears at the top of the results queue for a search. Duncan and colleagues6 analyzed 200 websites, Bruce-Brand and colleagues9 only 45. Industries may have made financial arrangements and used search engine optimization techniques to have their websites listed first in search results.
In our study, we also analyzed how web information has changed over time. On the Internet, information changes daily, and we hypothesized that the content found during our 2 searches (2011, 2014) would yield different results. Surprisingly, the data were similar, particularly concerning authorship (Figures 1, 2). In both searches, the largest authorship source was private physician or physician groups (38% in 2011 and 2014). Other authorship sources showed little change in percentage between searches. As for content, we found both increases and decreases in specific web information. Ability to contact authors increased from 21% (2011) to 50% (2014). We think it is important that websites offer a communication channel to people who read the medical information the sites provide. Percentage of websites discussing nonoperative treatment options increased from 11.5% to 61%. Therefore, patients in 2014 were being introduced to more options (in addition to surgery) for managing shoulder pain—an improvement in quality of information between the searches. Percentage of websites discussing surgical eligibility, however, decreased from 43% to 18%—a negative development in information quality. Another decrease, from 42% to 25%, was found for websites discussing surgical complications. Given the data as a whole, and our finding both negative and positive changes, it appears the quality of web content has not improved significantly. Interestingly, no websites discussed double- versus single-row surgery in 2014, but 6% did so in 2011.
Lost in the discussion of quality and reliability of information is whether patients comprehend what they are reading.23 Yi and colleagues19 recentlyassessed the readability level of arthroscopy information in articles published online by the American Academy of Orthopaedic Surgeons (AAOS) and the Arthroscopy Association of North America (AANA). The investigators used the Flesch-Kincaid readability test to determine readability level in terms of grade level. They found that the majority of the patient education articles on the AAOS and AANA sites had a readability level far above the national average; only 4 articles were written at or below the eighth-grade level, the current average reading level in the United States.24 Information that is not comprehensible is of no use to patients, and information that physicians and researchers consider high-quality might not be what patients consider high-quality. As we pursue higher-quality web content, we need to consider that its audience includes nonmedical readers, our patients. In the present study, we found that the readability of a website had no correlation with the site’s DISCERN score (Figure 5). Therefore, for information about rotator cuff repairs, higher-quality websites are no harder than lower-quality sites for patients to comprehend. The Flesch-Kincaid readability test is flawed in that it considers only total number of syllables per word and words per sentence, not nontextual elements of patient education materials, such as illustrations on a website. The 10.98 mean grade level found in our study is higher than the levels found for most studies reviewed by Yi and colleagues.19
This study had several limitations. During an Internet search, the number of websites a user visits drops precipitously after the first page of results. Studies have shown the top 20 sites in a given search receive 97% of the views, and the top 3 receive 58.4%. Whether patients visit websites far down in the list of 150 we found in our given search is unknown. Last, the Flesch-Kincaid readability test is flawed in several ways but nevertheless is used extensively in research. Grading is based on number of words and syllables used in a given sentence; it does not take into account the complexity or common usage of a given word or definition. Therefore, websites may receive low Flesch-Kincaid scores—indicating ease of reading—despite their use of complex medical terminology and jargon that complicate patients’ comprehension of the material.
Conclusion
Numerous authors have evaluated orthopedic patients’ accessing of medical information from the Internet. Although the Internet makes access easier, unreliable content can lead patients to develop certain notions about the direction of their care and certain expectations regarding their clinical outcomes. With there being no regulatory body monitoring content, the peer review process, an essential feature of academic publishing, can be easily circumvented.25
In this study, the highest-quality websites had academic affiliations. Quality of information about rotator cuff repairs was similar to what was found for other orthopedic topics in comparable studies. Surprisingly, there was little change in authorship and content of web information between our 2 search periods (2011, 2014). Although there has been a rapid increase in the number of medical websites, quality of content seems not to have changed significantly. Patients look to physicians for guidance but increasingly are accessing the Internet for additional information. It is essential that physicians understand the quality of information available on the Internet when counseling patients regarding surgery.
1. Brunnekreef JJ, Schreurs BW. Total hip arthroplasty: what information do we offer patients on websites of hospitals? BMC Health Serv Res. 2011;11:83.
2. Koh HS, In Y, Kong CG, Won HY, Kim KH, Lee JH. Factors affecting patients’ graft choice in anterior cruciate ligament reconstruction. Clin Orthop Surg. 2010;2(2):69-75.
3. Nason GJ, Baker JF, Byrne DP, Noel J, Moore D, Kiely PJ. Scoliosis-specific information on the Internet: has the “information highway” led to better information provision? Spine. 2012;37(21):E1364-E1369.
4. Groves ND, Humphreys HW, Williams AJ, Jones A. Effect of informational Internet web pages on patients’ decision making: randomised controlled trial regarding choice of spinal or general anaesthesia for orthopaedic surgery. Anaesthesia. 2010;65(3):277-282.
5. Purcell K, Brenner J, Rainie L. Search Engine Use 2012. Washington, DC: Pew Internet & American Life Project; 2012.
6. Duncan IC, Kane PW, Lawson KA, Cohen SB, Ciccotti MG, Dodson CC. Evaluation of information available on the Internet regarding anterior cruciate ligament reconstruction. Arthroscopy. 2013;29(6):1101-1107.
7. Lichtenfeld LJ. Can the beast be tamed? The woeful tale of accurate health information on the Internet. Ann Surg Oncol. 2012;19(3):701-702.
8. Ahmed OH, Sullivan SJ, Schneiders AG, McCrory PR. Concussion information online: evaluation of information quality, content and readability of concussion-related websites. Br J Sports Med. 2012;46(9):675-683.
9. Bruce-Brand RA, Baker JF, Byrne DP, Hogan NA, McCarthy T. Assessment of the quality and content of information on anterior cruciate ligament reconstruction on the Internet. Arthroscopy. 2013;29(6):1095-1100.
10. Dy JC, Taylor SA, Patel RM, Kitay A, Roberts TR, Daluiski A. The effect of search term on the quality and accuracy of online information regarding distal radius fractures. J Hand Surg Am. 2012;37(9):1881-1887.
11. Garcia RM, Messerschmitt PJ, Ahn NU. An evaluation of information on the Internet of a new device: the lumbar artificial disc replacement. J Spinal Disord Tech. 2009;22(1):52-57.
12. Gosselin MM, Mulcahey MK, Feller E, Hulstyn MJ. Examining Internet resources on gender differences in ACL injuries: what patients are reading. Knee. 2013;20(3):196-202.
13. Lam CG, Roter DL, Cohen KJ. Survey of quality, readability, and social reach of websites on osteosarcoma in adolescents. Patient Educ Couns. 2013;90(1):82-87.
14. Morr S, Shanti N, Carrer A, Kubeck J, Gerling MC. Quality of information concerning cervical disc herniation on the Internet. Spine J. 2010;10(4):350-354.
15. Starman JS, Gettys FK, Capo JA, Fleischli JE, Norton HJ, Karunakar MA. Quality and content of Internet-based information for ten common orthopaedic sports medicine diagnoses. J Bone Joint Surg Am. 2010;92(7):1612-1618.
16. Stinson JN, Tucker L, Huber A, et al. Surfing for juvenile idiopathic arthritis: perspectives on quality and content of information on the Internet. J Rheumatol. 2009;36(8):1755-1762.
17. Sullivan TB, Anderson JS, Ahn UM, Ahn NU. Can Internet information on vertebroplasty be a reliable means of patient self-education? Clin Orthop Relat Res. 2014;472(5):1597-1604.
18. Weil AG, Bojanowski MW, Jamart J, Gustin T, Lévêque M. Evaluation of the quality of information on the Internet available to patients undergoing cervical spine surgery. World Neurosurg. 2014;82(1-2):e31-e39.
19. Yi PH, Ganta A, Hussein KI, Frank RM, Jawa A. Readability of arthroscopy-related patient education materials from the American Academy of Orthopaedic Surgeons and Arthroscopy Association of North America web sites. Arthroscopy. 2013;29(6):1108-1112.
20. Boyer C, Selby M, Scherrer JR, Appel RD. The Health On the Net code of conduct for medical and health websites. Comput Biol Med. 1998;28(5):603-610.
21. Silberg WM, Lundberg GD, Musacchio RA. Assessing, controlling, and assuring the quality of medical information on the Internet: Caveant lector et viewor—Let the reader and viewer beware. JAMA. 1997;277(15):1244-1245.
22. Fabricant PD, Dy CJ, Patel RM, Blanco JS, Doyle SM. Internet search term affects the quality and accuracy of online information about developmental hip dysplasia. J Pediatr Orthop. 2013;33(4):361-365.
23. Aslam N, Bowyer D, Wainwright A, Theologis T, Benson M. Evaluation of Internet use by paediatric orthopaedic outpatients and the quality of information available. J Pediatr Orthop B. 2005;14(2):129-133.
24. Wetzler MJ. “I found it on the Internet”: how reliable and readable is patient information? Arthroscopy. 2013;29(6):967-968.
25. Qureshi SA, Koehler SM, Lin JD, Bird J, Garcia RM, Hecht AC. An evaluation of information on the Internet about a new device: the cervical artificial disc replacement. Spine. 2012;37(10):881-883.
Patients are learning about health and disease more independently than before, but such self-education may pose a unique challenge for practicing physicians. Although educated patients can assist in the critical appraisal of treatment options,1 misinformed patients may have preconceived treatment biases and unrealistic expectations. More than 66 million Americans use the Internet daily, and recent surveys have shown 86% have used the Internet for health-related information.2,3 With Internet use increasing, the number of patients turning to the web for medical information is increasing as well.4 For many patients, this information can be useful in making decisions about their health and health care.5
Although accessing medical information from the Internet has grown exponentially, analysis of information quality has grown considerably slower.6 With no regulatory body monitoring content, there is easy circumvention of the peer review process, an essential feature of academic publishing.7 With no external regulation, the information retrieved may be incorrect, outdated, or misleading. Many orthopedic studies have analyzed Internet content about numerous diagnoses.3-6,8-18 Most of these studies have found this information highly variable and of poor quality.
We conducted a study to evaluate and analyze rotator cuff repair information available to the general public through the Internet; to assess changes in the quality of information over time; to determine if sites sponsored by academic institutions offered higher-quality information; and to assess whether the readability of the material varied according to DISCERN scores.
Rotator cuff repairs are among the most common surgeries performed by orthopedic surgeons. To our knowledge, this is the first study to assess the quality of web information about rotator cuff repairs. We hypothesized that the quality of information would positively correlate with the reading level of the material presented, that academic institutions would present the highest-quality information, and that the type of information presented would change over time.
Materials and Methods
We used the search phrase rotator cuff repair on the 3 most popular search engines: Google, Yahoo!, and Bing. Google is the dominant engine, taking 83.06% of total market share, followed by Yahoo! (6.86%) and Bing (4.27%).5 The first 50 websites identified by each search engine were selected for evaluation, excluding duplicates or overlapping websites. Similarly, advertisements and strictly video results lacking text were excluded. After each engine was queried, a master list of 150 websites was created for individual evaluation and assessment. To assess changes in results over time, we performed 2 searches, on November 16, 2011, and May 18, 2014.
The content of each website was analyzed for authorship, ability to contact the author, discussion of disorder, surgical treatment, complications, surgical eligibility, rehabilitation, other treatment options, and use of peer-reviewed sources. Authorship was placed in 1 of 6 categories:
1. Academic—university-affiliated physician or research group.
2. Private—physician or group without stated affiliation to an academic organization.
3. Industry—manufacturing or marketing company advertising a product or service for profit.
4. News source—bulletin or article without affiliation to a hospital or an academic institution.
5. Public education—individual or organization with noncommercial website providing third-party information (eg, Wikipedia, About.com).
6. Blog—website publishing an individual’s personal experiences in diary or journal form.
Websites were also assessed for accuracy and validity based on presence or absence of Health On the Net code (HONcode) certification and DISCERN score. Designed by the Health On the Net Foundation in 1996, HONcode provides a framework for disseminating high-quality medical information over the web.19 Website owners can request that their sites be evaluated for HONcode certification; a site that qualifies can display the HONcode seal.20 The DISCERN project, initially funded by the National Health Service in the United Kingdom, judges the quality of written information available on health-related websites.21 It determines the quality of a publication on the basis of 16 questions: The first 8 address the publication’s reliability, the next 7 involve specific details of treatment choices, and the last is an overall rating of the website.
Website readability was assessed with the Flesch-Kincaid test. This test, designed under contract with the US Navy in 1975, has been used in other orthopedic studies.19 Regression analysis was performed to check for correlation between website readability and DISCERN score. Analysis of variance was used to analyze differences between scores.
Results
We performed a comprehensive analysis of the top 50 websites from each of the 3 search engines (N = 150 websites) (Figures 1–5, Table). Regarding authorship, our 2 searches demonstrated similar values (Figure 1). In 2011, 21% of websites were associated with an academic institution, 38% were authored by private physicians or hospital or physician groups not associated with an academic institution, 11.5% were industry-sponsored, 5% were news bulletins or media reports, 21.5% were public education websites, and 3% were personal blogs. Our 2014 search found a similar distribution of contributors. Between 2011 and 2014, the largest change was in academic authors, which decreased by 7%, from 21% to 14%. Percentage of websites authored by private physicians remained constant from the first to the second search: 38%.
When the 2011 and 2014 website content was compared, several changes were noted. Percentage of websites providing an author contact method increased from 21% to 50% (Figure 2), percentage detailing rotator cuff repairs increased from 82% to 91%, and percentage introducing treatment options in addition to surgical management increased from 11.5% to 61%. Percentage discussing surgical eligibility, however, decreased from 43% to 18%. Percentage citing peer-reviewed sources remained relatively constant (28%, 26%), as did percentage discussing surgical technique for rotator cuff repair (55%, 59%) (Figure 3). A major decrease was found in percentage of websites discussing surgical complications, 42% in 2011 down to 25% in 2014, whereas a major increase was found in percentage discussing rehabilitation, from 39% in 2011 up to 73% in 2014. In 2014, no websites discussed double- versus single-row surgery—compared with 6% in 2011. False claims remained low between 2011 and 2014. In both searches, no website guaranteed a return to sport, and few made claims of painless or bloodless surgery.
DISCERN scores for websites found during the 2014 search were averaged for each of the 6 authorship groups (Figure 4). The highest DISCERN scores were given to academic institution websites (51.6) and public education websites (49). For the academic websites, this difference was significant relative to news, blog, and private physician websites (Ps = .012, .001, .001) The lowest DISCERN scores were given to news organization websites and personal blogs. DISCERN scores were 43.8 for industry sources and 40.7 for private physician groups; the difference was not significant (P = .229). Overall mean DISCERN score for all websites was 44. Eleven percent of websites were HONcode-certified.
No correlation was found between website readability and DISCERN score; correlation coefficient r was .01 (Figure 5). For the websites in 2014, mean Flesch-Kincaid readability score was 50.17, and mean grade level was 10.98; coefficient of determination r2 was 0.00012.
The Table compares our data with data from other orthopedic studies that have analyzed the quality of Internet information about various orthopedic injuries, diseases, and procedures.3-6,8,9,11-18 With its mean DISCERN score of 44, the present rotator cuff tear study was ranked third of 6 studies that have used this scoring system to analyze website content. Of these 6 studies, those reviewing osteosarcoma and juvenile idiopathic arthritis were ranked highest (mean scores, 49.8 and 48.9, respectively), and the study reviewing scoliosis surgery was ranked lowest (38.9). Bruce-Brand and colleagues9 recently found a mean DISCERN score of 41 for anterior cruciate ligament (ACL) reconstruction. When considering HONcode-certified websites, our Internet search for rotator cuff tears found the third lowest percentage, 10.5%, compared with the other studies (Table); the highest percentage, 30%, was found for websites discussing concussions in athletes. When considering authorship, our rotator cuff study found the third highest percentage, 76%, authored by academic centers, physicians, and public education websites; the highest percentage was found in websites discussing ACL reconstruction. Websites discussing ACL reconstruction also had the highest percentage of websites authored by industry.9
Discussion
To our knowledge, this is the first study specifically analyzing the quality of Internet information about rotator cuff repairs. A similar study, conducted by Starman and colleagues15 in 2010, addressed the quality of web information about 10 common sports medicine diagnoses, one of which was rotator cuff tears. In that study, only 16 of the websites included discussed rotator cuff tears. In addition, the authors used a customized, HONcode-based grading system to analyze each website, making their data difficult to compare across studies.
Ideally, a high-quality medical website should be written by a credible source and should cover a disorder, treatment options, eligibility, rehabilitation, and complications. As there is no standard grading system for analyzing web content about rotator cuff repairs, we analyzed the websites for specific information we thought should be included in a high-quality website (Figures 2, 3). When considering authorship, we found academic centers, private physicians, and educational sources comprised 76% of the sources; industry sources made up only 12%. Similar findings were noted by investigators analyzing Internet information about other orthopedic topics, including ACL reconstruction, lumbar arthroplasty, osteosarcoma, and cervical spine surgery.5,11,22 Studies analyzing websites for information on ACL tears and distal radius fractures found have a higher percentage of industry-sponsored websites.9,10
DISCERN showed that the highest-quality information came from websites with academic affiliations, consistent with previous studies,3,9,17 and its mean score (51.6) was significantly higher than the scores for private physician websites, news sites, and blogs (Ps = .001, .016, .001); the least reliable information was from personal blogs and news outlets. Of note, mean DISCERN score was higher for the industry websites we found than for private physician websites (43.8 vs 40.7), though the difference was not significant (P = .229). Previous investigators considered number of industry-sponsored websites as a marker of poor quality of information relating to a given topic; however, given the DISCERN scores in our study, this might not necessarily be true.6 Based on the present study’s data, websites affiliated with academic institutions would be recommended for patients searching for high-quality information about rotator cuff tears.
Given DISCERN scores across studies, information about rotator cuff tears ranked below information about osteosarcoma and juvenile idiopathic arthritis but above information about scoliosis, cervical spine surgery, and ACL reconstruction (Table). DISCERN scores must be compared across studies, as there are no definitions for good and poor DISCERN scores.
Of the 4 studies that analyzed percentage of websites citing peer-reviewed sources, only our study and the study of cervical spine surgery18 analyzed that percentage as well as DISCERN score. Percentage citing peer-reviewed sources was 26% for rotator cuff tears and 24% for cervical spine surgery; the respective DISCERN scores were 44 and 43.6. As only these 2 studies could be compared, no real correlation between percentage of websites citing peer-reviewed sources and the quality of the content on a given topic can be assessed. More research into this relationship is needed. One already delineated association is the correlation between HONcode-certified sites and high DISCERN scores.21 For high-quality medical information, physicians can direct their patients both to academic institution websites and to HONcode-certified websites.
When we compared the present study with previous investigations, we found a large difference between search results for a given topic. In 2013, Duncan and colleagues6 and Bruce-Brand and colleagues9 used similar study designs (eg, search terms, search engines) for their investigations of quality of web information. Their results, however, were widely different. For example, percentages of industry authorship were 4.5% (Duncan and colleagues6) and 64% (Bruce-Brand and colleagues9). This inconsistency between studies conducted during similar periods might be related to what appears at the top of the results queue for a search. Duncan and colleagues6 analyzed 200 websites, Bruce-Brand and colleagues9 only 45. Industries may have made financial arrangements and used search engine optimization techniques to have their websites listed first in search results.
In our study, we also analyzed how web information has changed over time. On the Internet, information changes daily, and we hypothesized that the content found during our 2 searches (2011, 2014) would yield different results. Surprisingly, the data were similar, particularly concerning authorship (Figures 1, 2). In both searches, the largest authorship source was private physician or physician groups (38% in 2011 and 2014). Other authorship sources showed little change in percentage between searches. As for content, we found both increases and decreases in specific web information. Ability to contact authors increased from 21% (2011) to 50% (2014). We think it is important that websites offer a communication channel to people who read the medical information the sites provide. Percentage of websites discussing nonoperative treatment options increased from 11.5% to 61%. Therefore, patients in 2014 were being introduced to more options (in addition to surgery) for managing shoulder pain—an improvement in quality of information between the searches. Percentage of websites discussing surgical eligibility, however, decreased from 43% to 18%—a negative development in information quality. Another decrease, from 42% to 25%, was found for websites discussing surgical complications. Given the data as a whole, and our finding both negative and positive changes, it appears the quality of web content has not improved significantly. Interestingly, no websites discussed double- versus single-row surgery in 2014, but 6% did so in 2011.
Lost in the discussion of quality and reliability of information is whether patients comprehend what they are reading.23 Yi and colleagues19 recentlyassessed the readability level of arthroscopy information in articles published online by the American Academy of Orthopaedic Surgeons (AAOS) and the Arthroscopy Association of North America (AANA). The investigators used the Flesch-Kincaid readability test to determine readability level in terms of grade level. They found that the majority of the patient education articles on the AAOS and AANA sites had a readability level far above the national average; only 4 articles were written at or below the eighth-grade level, the current average reading level in the United States.24 Information that is not comprehensible is of no use to patients, and information that physicians and researchers consider high-quality might not be what patients consider high-quality. As we pursue higher-quality web content, we need to consider that its audience includes nonmedical readers, our patients. In the present study, we found that the readability of a website had no correlation with the site’s DISCERN score (Figure 5). Therefore, for information about rotator cuff repairs, higher-quality websites are no harder than lower-quality sites for patients to comprehend. The Flesch-Kincaid readability test is flawed in that it considers only total number of syllables per word and words per sentence, not nontextual elements of patient education materials, such as illustrations on a website. The 10.98 mean grade level found in our study is higher than the levels found for most studies reviewed by Yi and colleagues.19
This study had several limitations. During an Internet search, the number of websites a user visits drops precipitously after the first page of results. Studies have shown the top 20 sites in a given search receive 97% of the views, and the top 3 receive 58.4%. Whether patients visit websites far down in the list of 150 we found in our given search is unknown. Last, the Flesch-Kincaid readability test is flawed in several ways but nevertheless is used extensively in research. Grading is based on number of words and syllables used in a given sentence; it does not take into account the complexity or common usage of a given word or definition. Therefore, websites may receive low Flesch-Kincaid scores—indicating ease of reading—despite their use of complex medical terminology and jargon that complicate patients’ comprehension of the material.
Conclusion
Numerous authors have evaluated orthopedic patients’ accessing of medical information from the Internet. Although the Internet makes access easier, unreliable content can lead patients to develop certain notions about the direction of their care and certain expectations regarding their clinical outcomes. With there being no regulatory body monitoring content, the peer review process, an essential feature of academic publishing, can be easily circumvented.25
In this study, the highest-quality websites had academic affiliations. Quality of information about rotator cuff repairs was similar to what was found for other orthopedic topics in comparable studies. Surprisingly, there was little change in authorship and content of web information between our 2 search periods (2011, 2014). Although there has been a rapid increase in the number of medical websites, quality of content seems not to have changed significantly. Patients look to physicians for guidance but increasingly are accessing the Internet for additional information. It is essential that physicians understand the quality of information available on the Internet when counseling patients regarding surgery.
1. Brunnekreef JJ, Schreurs BW. Total hip arthroplasty: what information do we offer patients on websites of hospitals? BMC Health Serv Res. 2011;11:83.
2. Koh HS, In Y, Kong CG, Won HY, Kim KH, Lee JH. Factors affecting patients’ graft choice in anterior cruciate ligament reconstruction. Clin Orthop Surg. 2010;2(2):69-75.
3. Nason GJ, Baker JF, Byrne DP, Noel J, Moore D, Kiely PJ. Scoliosis-specific information on the Internet: has the “information highway” led to better information provision? Spine. 2012;37(21):E1364-E1369.
4. Groves ND, Humphreys HW, Williams AJ, Jones A. Effect of informational Internet web pages on patients’ decision making: randomised controlled trial regarding choice of spinal or general anaesthesia for orthopaedic surgery. Anaesthesia. 2010;65(3):277-282.
5. Purcell K, Brenner J, Rainie L. Search Engine Use 2012. Washington, DC: Pew Internet & American Life Project; 2012.
6. Duncan IC, Kane PW, Lawson KA, Cohen SB, Ciccotti MG, Dodson CC. Evaluation of information available on the Internet regarding anterior cruciate ligament reconstruction. Arthroscopy. 2013;29(6):1101-1107.
7. Lichtenfeld LJ. Can the beast be tamed? The woeful tale of accurate health information on the Internet. Ann Surg Oncol. 2012;19(3):701-702.
8. Ahmed OH, Sullivan SJ, Schneiders AG, McCrory PR. Concussion information online: evaluation of information quality, content and readability of concussion-related websites. Br J Sports Med. 2012;46(9):675-683.
9. Bruce-Brand RA, Baker JF, Byrne DP, Hogan NA, McCarthy T. Assessment of the quality and content of information on anterior cruciate ligament reconstruction on the Internet. Arthroscopy. 2013;29(6):1095-1100.
10. Dy JC, Taylor SA, Patel RM, Kitay A, Roberts TR, Daluiski A. The effect of search term on the quality and accuracy of online information regarding distal radius fractures. J Hand Surg Am. 2012;37(9):1881-1887.
11. Garcia RM, Messerschmitt PJ, Ahn NU. An evaluation of information on the Internet of a new device: the lumbar artificial disc replacement. J Spinal Disord Tech. 2009;22(1):52-57.
12. Gosselin MM, Mulcahey MK, Feller E, Hulstyn MJ. Examining Internet resources on gender differences in ACL injuries: what patients are reading. Knee. 2013;20(3):196-202.
13. Lam CG, Roter DL, Cohen KJ. Survey of quality, readability, and social reach of websites on osteosarcoma in adolescents. Patient Educ Couns. 2013;90(1):82-87.
14. Morr S, Shanti N, Carrer A, Kubeck J, Gerling MC. Quality of information concerning cervical disc herniation on the Internet. Spine J. 2010;10(4):350-354.
15. Starman JS, Gettys FK, Capo JA, Fleischli JE, Norton HJ, Karunakar MA. Quality and content of Internet-based information for ten common orthopaedic sports medicine diagnoses. J Bone Joint Surg Am. 2010;92(7):1612-1618.
16. Stinson JN, Tucker L, Huber A, et al. Surfing for juvenile idiopathic arthritis: perspectives on quality and content of information on the Internet. J Rheumatol. 2009;36(8):1755-1762.
17. Sullivan TB, Anderson JS, Ahn UM, Ahn NU. Can Internet information on vertebroplasty be a reliable means of patient self-education? Clin Orthop Relat Res. 2014;472(5):1597-1604.
18. Weil AG, Bojanowski MW, Jamart J, Gustin T, Lévêque M. Evaluation of the quality of information on the Internet available to patients undergoing cervical spine surgery. World Neurosurg. 2014;82(1-2):e31-e39.
19. Yi PH, Ganta A, Hussein KI, Frank RM, Jawa A. Readability of arthroscopy-related patient education materials from the American Academy of Orthopaedic Surgeons and Arthroscopy Association of North America web sites. Arthroscopy. 2013;29(6):1108-1112.
20. Boyer C, Selby M, Scherrer JR, Appel RD. The Health On the Net code of conduct for medical and health websites. Comput Biol Med. 1998;28(5):603-610.
21. Silberg WM, Lundberg GD, Musacchio RA. Assessing, controlling, and assuring the quality of medical information on the Internet: Caveant lector et viewor—Let the reader and viewer beware. JAMA. 1997;277(15):1244-1245.
22. Fabricant PD, Dy CJ, Patel RM, Blanco JS, Doyle SM. Internet search term affects the quality and accuracy of online information about developmental hip dysplasia. J Pediatr Orthop. 2013;33(4):361-365.
23. Aslam N, Bowyer D, Wainwright A, Theologis T, Benson M. Evaluation of Internet use by paediatric orthopaedic outpatients and the quality of information available. J Pediatr Orthop B. 2005;14(2):129-133.
24. Wetzler MJ. “I found it on the Internet”: how reliable and readable is patient information? Arthroscopy. 2013;29(6):967-968.
25. Qureshi SA, Koehler SM, Lin JD, Bird J, Garcia RM, Hecht AC. An evaluation of information on the Internet about a new device: the cervical artificial disc replacement. Spine. 2012;37(10):881-883.
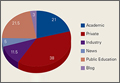
How to Make Your Patient With Sleep Apnea a Super User of Positive Airway Pressure Therapy
Adherence to positive airway pressure (PAP) therapy is a difficult patient management issue. Clinicians at the John D. Dingell VA Medical Center in Detroit (VAMC Detroit) developed the O’Brien criteria and extensive patient education materials to increase patient adherence. The importance of PAP therapy and the reasons veterans should sleep with a PAP machine for 7 to 9 hours each night are stressed (many sleep only 4 to 5 hours). Several recent studies have confirmed widely varying PAP therapy adherence rates (30%-84%).1-13 A majority of patients indicated that mask discomfort is the primary reason for nonadherence.1
Adherence is affected by many factors, including heated humidity, patient education, mask type, and type of PAP machine (eg, continuous PAP [CPAP] vs bilevel PAP [BPAP]; auto-PAP vs CPAP). Other factors, such as race and economic status, also affect adherence.14 The Wisconsin Sleep Cohort Study found that patients with moderate-to-severe untreated obstructive sleep apnea (OSA) were 4 to 5 times more likely to die of a cardiovascular event and 3 times more likely to die of any cause.15 The morbidity and mortality associated with severe untreated OSA led the clinicians to intensify treatment efforts.16In this article, the authors summarize the initiative at the VAMC Detroit to enhance PAP therapy adherence in patients with sleep apnea. The goal was to motivate patients to maximize PAP machine use. This article is a guide that federal health care providers and their civilian counterparts in the private sector can use to maximize PAP machine use. Working toward that goal, a set of PAP “super user” criteria was developed and used to create a 5-point method for encouraging patients to maximize adherence to PAP therapy.
Background
Positive airway pressure is the room air pressure, measured in centimeters of H2O, which splints open the airway to prevent snoring, apneas, and hypopneas. An apnea is a 90%-plus airway obstruction that lasts longer than 10 seconds and is seen with sleep study polysomnography. A hypopnea is a 30%-plus airway obstruction that lasts longer than 10 seconds and is accompanied by a 3% drop in pulse oximetry (SpO2).
A CPAP device delivers pressure continuously through a medical air compressor or flow generator called a PAP machine. The BPAP machine has separate inspiratory pressure and expiratory pressure. Auto-PAP machines give minimum pressure and maximum pressure usually between the range of 4 cm H2O to 20 cm H2O. This machine finds the user’s median pressure (90th percentile) and maximum pressure and averages pressure over a specified period of use. The auto-PAP can then be set to CPAP mode and the pressure fixed or set to the 90th percentile.
O’Brien Criteria
The O’Brien criteria for PAP super-user status (Table 1) were developed for maximizing PAP machine use and presented at the 2013 John D. Dingell Sleep and Wake Disorders Center Symposium. There is no other published reference or criteria proposed for maximizing PAP machine adherence. A recent study on sleep time criteria suggested that a higher percentage of patients achieved normal functioning with longer duration nightly CPAP therapy, which is in line with the authors’ recommended PAP machine use duration.17
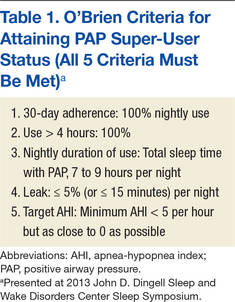
Positive airway pressure therapy is eligible for insurance reimbursement by Medicare and third-party payers for adult patients who have OSA and achieve 4 hours of nightly use for 70% of nights over 30 days. Coverage for CPAP therapy is initially limited to 12 weeks during which beneficiaries with an OSA diagnosis can be identified and any therapy benefits documented. Subsequent CPAP therapy is covered only for those OSA patients who benefit during the 12-week period.18At VAMC Detroit, the data covering the previous 30 days of use is downloaded. Medicare allows for the best 30-day period out of the 12-week window. The hospital, along with Harper Hospital and the Detroit Medical Centers in conjunction with the Wayne State University sleep program, is an Academic Center of Distinction, which follows the sleep guidelines and practice parameters for Medicare, third-party insurance companies, and the American Academy of Sleep Medicine.
The sleep clinic clinicians follow the clinical guidelines for evaluation, management, and long-term care of adults with OSA.19,20 Follow-up visits are scheduled and made on a consultation basis up to 90 days for the required download or as necessary for PAP therapy. In this initiative, practitioners offer veteran-specific patient care with PAP therapy that exceeds Medicare guidelines. The success of this process yielded a growing cohort of PAP super users at VAMC Detroit. These patients exceed the Medicare criterion of 4 hours of nightly use for 70% of nights over 30 days. Thus, 4 hours of nightly use for 100% of nights over the same period was proposed as another criterion.
The super-user criteria, which provide motivation to reach the top, stimulate many patients to achieve the Medicare criteria. All 5 criteria must be satisfied to attain super-user status, and becoming a super user is not easy. In fact, the expectation is that, if an adherence data study is conducted, it will show that only a small percentage of all users meet the criteria. Maximum adherence is expected to be the tail (3%-4%) of a bell-shaped curve.
PAP Super-User Status
At the initial evaluation, practitioners create a self-fulfilling prophecy that, as first described by Merton, sets expectations.21 A self-fulfilling prophecy is a prediction that directly or indirectly causes the prediction to become true as a result of the positive feedback between belief and behavior.21 The personnel at VAMC Detroit sleep clinic set a tone that enables patients to meet and exceed the Medicare sleep guidelines and their expectations. Patients are encouraged to make it their personal mission to achieve the goal of becoming a PAP super user. The patients receive the O’Brien criteria for PAP super-user status—guidelines thought to contribute to higher quality of life.
The Medicare criterion emphasized is the minimum required for full adherence. The goal is to reduce sleepiness and increase well-being. The literature shows that increasing duration of sleep results in lower daytime sleepiness.22 Inadequate sleep has many detrimental effects. According to a recent study, insufficient sleep contributes to weight gain.22 Desired patient outcomes are increased sleep time without arousals, increased slow-wave sleep (SWS), consolidation of memories and rapid eye movement (REM), and improvement in emotional and procedural skill memories.23 Patients are informed that using a PAP machine for 7 to 9 hours can reduce excessive daytime sleepiness and allow for more SWS and REM sleep, which help improve memory, judgment, and concentration. Many other studies have shown how 7 to 9 hours of sleep benefit adults. Thus, 7 to 9 hours became the criterion for maximizing PAP sleep time.
Initial Evaluation and Sleep Study
A primary care provider can enroll a patient into the clinic for a sleep study by requesting an evaluation. The consultation is then triaged using the STOP-BANG (Snoring, Tiredness, Observed apnea, high blood Pressure–Body mass index > 35, Age > 50, Neck circumference > 40 cm, Gender male) questionnaire. The STOP-BANG has a high sensitivity for predicting moderate-to-severe (87.0%) and severe (70.4%) sleep-disordered breathing.24 More than 3 affirmative answers indicate a high risk for sleep-disordered breathing and is cause for ordering a sleep study.
CPAP Group Class
Patients with a diagnosis of sleep apnea subsequently receive their CPAP machines when they attend a 2-hour group class taught by a respiratory therapist. Group education sessions increase the chance of issuing more machines and providing better education.25 One study found that “attendance in a group clinic designed to encourage compliance with CPAP therapy provided a simple and effective means of improving treatment of OSA.”25
In class, the respiratory therapist briefly assesses each patient’s CPAP prescription, describes the patient’s type of sleep apnea and final diagnosis, and reviews the CPAP machine’s features. Veterans are then instructed to take their CPAP machines home to use all night, every night for 4 weeks. All night is defined as a period of 7.5 to 8 hours, as population-based study results have shown that sleep of this duration is associated with lowest cardiovascular morbidity and mortality. After the initial 4-plus weeks of machine use, patients with all their CPAP equipment are seen in the sleep clinic.
First Sleep Clinic Follow-Up Visit
At first follow-up, patients are asked for a subjective evaluation of their sleep. Most state they are “better” with PAP therapy. Each patient’s mask is checked and refitted with the patient’s prescribed pressure.
Patients are informed of their PAP settings and requirements from the sleep study and told their particular “magic pressure.” Patients understand that a person’s magic pressure, determined in the laboratory, is the pressure of room air blown into the nose, mouth, or both that eliminates not only snoring, but also partial and complete airway obstructions (hypopneas, apneas). Patients are asked to remember their particular magic pressure and their AHI and told their OSA status (mild, moderate, or severe) as assessed by the laboratory study.26 Extensive education on sleep apnea and treatment are also addressed. Education and training are among the most important tenets of PAP therapy, and these are incorporated into all encounters.25,26
PAP Data Report and Leak
The CPAP data are downloaded and printed. If adherence is suboptimal, clinician and patient discuss increasing adherence and possibly becoming a super user. The patient receives a copy of the report, which can be compared with the patient’s adherence statistics and with the adherence statistics of similar patients who are super users. A few blacked-out names are posted on the board in front of the provider’s computer station. Patients can thus easily see that attaining super-user status is very difficult but possible. Some patients maximize their therapy and are designated PAP super users. These patients are proud to receive this designation, and they strive to keep it.
Data downloads are crucial for adherence. In a recent study, the American Thoracic Society stated, “Providers need to be able to interpret adherence systems.”27
The clinic provides a summary report on each patient’s adherence. A provider interpretation is added, and the report is copied into the Computer Patient Record System.
After the report is downloaded, the provider checks for correct pressure and then for a large leak. A large leak is an unintentional leak (the total amount that leaks but not including leak from the mask) > 5% of the night. A leak of > 15 minutes was added to the super-user criteria, because some software provides the average time of a large leak per day in minutes.28 Many veterans sleep only 4 to 5 hours nightly (300 minutes × 5% = 15 minutes). Therefore, the leak should not be more than 5% or 15 minutes for a veteran sleeping 5 hours.
The machine indicates a percentage of leak on the patient self-check LED screen for adherence. There is no standardized leak criterion used by all flow-generator manufacturers. Every mask has venting designed to leak intentionally so that the patient does not rebreathe air CO2. The main concern is unintentional leaks above the intentional leak or venting threshold.
The ResMed CPAP (ResMed Corp, San Diego, CA) maximum intentional leak is 24 L/min.29 Above that level is large leak. The exact leak amount varies by interface (mask) based on pressure and mask type.2,12
The larger the interface surface area, the larger the leak. Unintentional leak is higher with the full-face mask than with the nasal mask, most likely because there is more opportunity for leakage with the larger surface area of the full-face mask. Nasal pillows seem to leak less because of their smaller surface area, but more studies on mask interfaces are needed to validate this finding.
Chin Strap
Adding a chin strap improved patient adherence, nightly duration of use, residual AHI, and leak in patients with sleep apnea.30 Other investigators reported reduced OSA, confirmed by polysomnography and nasopharyngolaryngoscopy, with use of only a chin strap.31 When a nasal mask with chin strap is used, the strap should be made to fit properly over the chin, not on the throat. Properly used chin straps significantly reduce leakage and residual AHI.30
A chin strap most likely reduces large leak and dry mouth.30 Dry mouth can result from mouth leak, which is commonly caused by nasal congestion or high pressure and mouth breathing. The nasal turbinates help humidify, warm, and cool the air. Heated humidification of PAP can help prevent dry mouth.
Asking the Right Questions
The clinician should ask several key questions at the first follow-up: How is it going with your PAP machine? Do you feel PAP therapy is helping you sleep? Do you feel better with PAP therapy? To a patient who states he or she is not doing well with therapy, the clinician should ask, What type of problems are you having? In many cases, poor adherence is attributable to a large leak from a poorly fitting mask. A large leak can also increase residual AHI and cause frequent arousals.30
Some machines cannot maintain the pressure of a large leak and will shut off and trigger an alarm that wakes the patient to readjust the mask. This situation causes some patients to discontinue CPAP/BPAP use. The mask leak must be adjusted. Another common complaint is morning dry mouth. This extreme dryness—a significant clue pointing to mouth leak caused in part by the mouth dropping open during sleep with PAP—should be addressed by fitting the patient with a chin strap.30 Dry mouth also can be caused by low humidity; increasing the humidity setting usually resolves the problem. However, as one study found, use of controlled heated humidification did not improve adherence or quality of life.32 In the same study, the nasopharyngeal dryness that resulted from CPAP therapy without humidification was reduced immediately and during the first weeks of treatment.All current PAP machines feature heated humidification.
Mouth breathing can also result from nasal congestion, allergic or vasomotor rhinitis, nasal turbinate hypertrophy, obstruction from a deviated septum, polyps, or air hunger/insufficient PAP pressure. Chronic rhinosinusitis is a problem that affects up to 12.5% of the U.S. population.33
Adherence is also increased with the elimination of leak and associated arousals. Patients are shown how to use their PAP machine’s heated humidity settings to obtain desired comfort levels. The clinician explains that the nasal turbinates heat and cool the air and that they can become swollen and irritated with PAP therapy. A heated hose may be prescribed to provide optimal humidification without condensation or water dripping into the hose (rainout).
A full-face mask is used only when the patient cannot breathe out the nose adequately or when PAP becomes too high. A 2013 study found no significant differences among ResMed, Respironics, and Fisher & Paykel CPAP interfaces (Fisher & Paykel Healthcare, Irvine, CA).34 The clinician determines which mask is comfortable for a patient and tries to stay with that mask for that patient.
Adherence Report
A therapy data summary is downloaded and reviewed with the patient.28 A pattern of use report that shows daily use with times over the month is also reviewed.28 The software’s sleep therapy long-term trend report lists important statistics. The adherence data summary and the CPAP summary are also reviewed (Table 2).28 This page is printed and given to patients to reieiw their progress. For some it represents a reward for using the CPAP/BPAP machine as well as a congratulatory note.
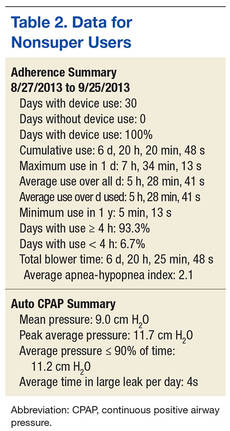
In the Example 1 summary download (Table 2), a patient used a PAP machine 4 hours or more on 93.3% of the 30 days the machine was used.28 Residual AHI was low, 2.1, and there was no appreciable leak. The PAP of 11.2 cm H2O was in the 90th percentile. The patient was fixed to 12 cm H2O with expiratory pressure relief (EPR) of 1. The EPR is a comfort feature that reduces pressure from 1 cm H2O to 3 cm H2O to make it easier for the patient to exhale. (A flow generator that produces EPR of > 3 cm H2O is a BPAP machine.)
This patient was not a super user. Overall use was low—5 hours, 28 minutes—which could indicate behaviorally insufficient sleep syndrome. Sleep time is controversial, but the National Sleep Foundation recommends 7 to 9 hours of sleep per night.
A different patient used a PAP machine 4 hours or more on 100% (28/28) of the days when the machine was used (Table 3).29 Residual AHI was low (0.6), median use was 8 hours, 47 minutes, and there was no appreciable leak. The patient was using autoset mode with a minimum pressure of 13 cm H2O and maximum pressure of 18 cm H2O. The 95th percentile pressure was 13.6 cm H2O. The patient’s pressure was changed to 14 cm H2O with EPR of 3. This patient was a super user.
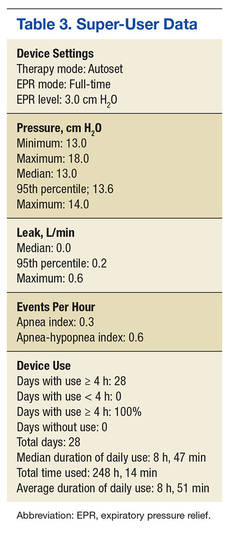
Sleep Hygiene Discussion
Providers must discuss sleep hygiene (good sleep habits) with veterans. If needed, AASM pamphlets on sleep hygiene and other educational materials can be provided. The bedroom should be cool, comfortable, quiet, and dark and should not include a television or computer. Exposure to room light before bedtime suppresses melatonin onset and shortens melatonin duration and tells the brain it is time to wake up.34
Patients are asked about the number of arousals they have per night. At first follow-up, providers must determine what is causing a patient to arouse while on CPAP/BPAP therapy. Some causes are air leak resulting in unresolved OSA, nocturia (may be triggered by unresolved OSA), dry mouth (indicating need for chin strap), nightmares (suggestive of unresolved OSA in REM sleep), posttraumatic stress disorder (PTSD), environmental noise, and claustrophobia. The provider should have thought-out answers to these problems in advance.
Epworth Sleepiness Scale
The Epworth Sleepiness Scale (ESS) is administered as part of the baseline comprehensive examination and at every sleep clinic follow-up after issuing a CPAP/BPAP machine.35 The first evaluation after the machine is issued should show a reduction in ESS. No reduction in ESS indicates that a problem needs to be addressed. The most common reason for insufficient reduction in ESS is suboptimal PAP therapy adherence, usually because of a large leak. Some cases of poor adherence may be attributable to restless legs syndrome, periodic limb movement disorder, chronic musculoskeletal pain, and sleep fragmentation caused by alcohol, smoking, caffeine, or cocaine. Excessive daytime sleepiness may persist from use of pain medications or other sedating medications. One study found a correlation between sleep duration with CPAP therapy and reduction in ESS.36 In addition to administering the ESS, patients are asked how they doing with PAP therapy, and the answer is documented. Treatment changes are made if needed to reduce excessive daytime sleepiness.
Ear-Nose-Throat Examination
A quick look into the nose with a nasal speculum is a crucial component of a thorough examination. The clinician looks for a deviated septum, swollen turbinates, obstruction, polyps, bleeding, infection, septal perforation, and discharge. In addition, the patient is checked for airflow amount, nasal congestion, and obstruction; if necessary a nasal steroid spray or a nasal saline spray is prescribed. In some cases, saline spray can be added to the steroid spray to help reduce or eliminate nasal congestion.37
Treatment of congestion requires education, as many patients improperly use these sprays. The steroid spray is not an instant vasoconstrictor; a week of regular use is needed to reduce inflammation and congestion. Saline spray and saline irrigation can be used as a treatment adjunct for symptoms of chronic rhinosinusitis.37If the steroid and saline sprays fail after a 2-month trial, consider an ear-nose-throat (ENT) consultation. A recent study found that adherence rates increased after septoplasty in patients with nasal obstruction.38 The throat is examined for macroglossia or scalloping of the tongue.39 Macroglossic Mallampati IV tongues are platterlike. They are big, long, and wide and often have impressions or scalloping along the outside from a molding of the teeth. The patient is shown a Mallampati diagram and given a Mallampati score.
Creating a Sense of Mission
The sleep physician assistant (PA)at the Detroit VAMC is a retired U.S. Army colonel who ensures that the language the physician uses aligns with the language veterans use. Behavioral techniques are used to create a common culture that helps overcome obstacles—allowing patients to understand the benefits of and need for full CPAP/BPAP therapy adherence. One technique reinforces their sense of mission accomplishment, their military pride, and their interservice rivalry to increase adherence. The mission with each patient is to “work until success is achieved...but the patient can’t quit.” The mantra given to a patient with a difficult case is, “We will not let you fail with CPAP/BPAP therapy,” which echoes a familiar military motto, “We will not leave you behind.” Also, the goal of the physician is: Never give up on the patient.
Behavioral and Psychological Principles
The behavioral and psychological principles for success with PAP super users should be studied to validate better outcomes with longer duration PAP machine use. Patients who are motivated to succeed and to participate in their care can make great strides in changing their behavior to get more and better sleep. Obese patients can get referrals to the MOVE! weight loss program. Some veterans simply follow instructions, pay attention to detail, and do what they are told regarding sleep, PAP education, and good sleep hygiene. Many veterans have poor sleep hygiene and insomnia because they watch television or play games on electronic devices right before bedtime. Many patients develop behaviorally insufficient sleep syndrome. Their behavior prevents them from going to bed at a time that will allow sufficient sleep. Some veterans smoke or drink caffeinated beverages or al cohol immediately before sleep time and then wonder why they have insomnia.
Veterans with insomnia may be referred to the insomnia clinic psychologist for cognitive behavioral therapy for insomnia.40 Referral to this psychologist can be very helpful in the treatment of insomnia after the patient’s OSA has been treated. Veterans are encouraged to follow good sleep hygiene principles and permanently discontinue detrimental sleep behaviors.
For veterans with PTSD, imagery rehearsal before sleep has been effective in resolving disturbing nightmares and excluding their violent details.41 Clinicians recommend that these veterans rehearse a pleasant dream before sleep time. Cartwright and Lamberg performed extensive research on dreams and nightmares, and their book may provide insight into reducing nightmares for veterans with severe PTSD.42 Persistent nightmares associated with PTSD also can be reduced with use of prazosin. 43
Sleep Clinic Economics
The economic impact of OSA is substantial because of increased risk of cardiovascular disease and risk of motor vehicle accidents and decreased quality of life and productivity. Results of cost-effectiveness analyses support the value of diagnosing and treating OSA. Studies have provided estimates from a payer perspective, ranging from $2,000 to $11,000 per quality-adjusted life year over 5 years for treating moderate-to-severe OSA. The Sleep Heart Health Study showed that OSA was associated with an 18% increase in predicted health care utilization based on medication use.44,45 Moreover, CPAP therapy was found to be clinically more effective than no treatment: Therapy increased life expectancy in males and females, and effective treatment of OSA was associated with lower health care and disability costs and fewer missed workdays.
The authors’ initiatives to improve PAP therapy adherence required adding a PA and a registered respiratory therapist (RT) to the staff of 2 full-time equivalent (FTE) board-certified sleep physicians. The sleep physicians trained the PA to initiate and complete all the recommendations described, and the PA attended an AASM-sponsored review course for additional training. The PA is responsible for performing comprehensive face-to-face clinical evaluations in 4 half-day clinic sessions each week, as well as providing follow-up care in 4 additional half-day clinic sessions each week.
During these sessions, the PA provides education about sleep apnea and treatment. Thirty-minute follow-up clinic appointments are reserved for downloading CPAP data, providing interpretation, and educating patients to maximize PAP therapy and become super users. The remaining clinic sessions are run by 3 sleep fellows under the supervision of the sleep physicians. During all visits, providers encourage patients to maintain good sleep hygiene. Nonadherent patients are scheduled to be seen in a separate clinic session during which the RT troubleshoots and corrects PAP machine and mask-related problems.
Setting up the CPAP group classes and follow-up clinics required adding an FTE RT at a cost of $44,000 to $48,000 per year. By recruiting an FTE PA starting at GS-12 and $75,542 instead of another board-certified sleep physician, VAMC Detroit was able to provide increased access to patient care (8 clinics) at sizable financial savings (estimate, $75,000/y). A 0.5 FTE clinical psychologist provided cognitive behavioral therapy for insomnia and PAP therapy nonadherence and helped achieve the initiative’s goals.
The sleep center projects that the overall cost-effectiveness of these initiatives in terms of admission rates, life expectancy, and productivity would not be dissimilar to that reported in the peer-reviewed literature, as noted earlier. The center’s upcoming research projects will provide more data specific to its population. Educating patients requires that only motivated providers give patients instructions during a 30-minute follow-up clinic visit—there is no additional expense. This model of intensive care can be adopted at other VAMCs.
Conclusion
Maximizing PAP machine use is a unique approach that stimulates veterans to attain the highest level of adherence. This approach is based on clinical observation and patient encounters, and treatment recommendations over 8 years.
Showing enthusiasm with patients is crucial. Enthusiasm is contagious. Clinicians who are also PAP machine users should let patients know of their PAP super-user status and add that many others have attained this status, too. The benefits of optimal treatment are reviewed with patients: increased energy, lower risk of cardiovascular disease, lower blood pressure, better insulin sensitivity, and overall reduced mortality. Some patients have difficulty using the nasal mask and chin strap and understanding and adhering to PAP therapy. These impediments can be overcome with further education and follow-up. Sleep clinic clinicians take the time to show patients how to use the machine’s self-adherence check and leak functions. Patients can then monitor their progress daily.
To motivate patients, clinicians should set expectations early, invest time in providing education at follow-up; be diligent with respect to mask fitting and download evaluation. Sleep clinic providers should also speak the veterans’ language, create a self-fulfilling prophesy for success, and schedule a follow-up sleep clinic appointment if a patient is not fulfilling the Medicare adherence criterion of 4 hours’ nightly use for 70% of nights over 30 days.
PAP therapy coaching and persistent education with provider contact and enthusiasm can improve adherence. Encouragement and praise can help patients exceed Medicare’s minimum PAP therapy criterion and improve their overall PAP experience. The sleep team should tell patients they are proud of their accomplishments with such a difficult treatment. Being genuine and caring and showing concern about their evaluation, treatment, and follow-up is important. This helps reduce their OSA-related morbidity, lessen their depression, and improves their daily well-being and quality of life.
“The variation in responses to CPAP and acceptance of CPAP suggest that focused interventions, rather than one-size-fits-all interventions, may have a greater effect on the overall outcome of CPAP adherence,” wrote Weaver and Sawyer.46
Finally, one cannot equate spending on veteran care with spending in other areas of the national budget. The real cost of not giving veterans appropriate care will be a loss of trust, given that the overarching mission is “to care for him who shall have borne the battle and for his widow and his orphan.”
1. Boyaci H, Gacar K, Baris SA, Basyigit I, Yildiz F. Positive airway pressure device compliance of patients with obstructive sleep apnea syndrome. Adv Clin Exp Med. 2013;22(6):809-815.
2. Bachour A, Vitikainen P, Virkkula P, Maasilta P. CPAP interface: satisfaction and side effects. Sleep Breath. 2013;17(2):667-672.
3. Wimms AJ, Richards GN, Genjafield AV. Assessment of the impact on compliance of a new CPAP system in obstructive sleep apnea. Sleep Breath. 2013;17(1):69-76.
4. Smith I, Nadig V, Lasserson TJ. Educational, supportive and behavioral interventions to improve usage of continuous positive airway pressure machines for adults with obstructive sleep apnea. Cochrane Database Syst Rev. 2009;(2):CD007736.
5. Beecroft J, Zanon S, Lukic D, Hanly P. Oral continuous positive airway pressure for sleep apnea: effectiveness, patient preference, and adherence. Chest. 2003;124(6):2200-2208.
6. Chai CL, Pathinathan A, Smith B. Continuous positive airway pressure delivery interfaces for obstructive sleep apnoea. Cochrane Database Syst Rev. 2006;(4):CD005308.
7. Nilius G, Happel A, Domanski U, Ruhle KH. Pressure-relief continuous positive airway pressure vs constant continuous positive airway pressure: a comparison of efficacy and compliance. Chest. 2006;130(4):1018-1024.
8. Ballard RD, Gay PC, Strollo PJ. Interventions to improve compliance in sleep apnea patients previously non-compliant with continuous positive airway pressure. J Clin Sleep Med. 2007;3(7):706-712.
9. Sin DD, Mayers I, Man GC, Pawluk L. Long-term compliance rates to continuous positive airway pressure in obstructive sleep apnea: a population-based study. Chest. 2002;121(2):430-435.
10. Mortimore IL, Whittle AT, Douglas NJ. Comparison of nose and face mask CPAP therapy for sleep apnoea. Thorax. 1998;53(4):290-292.
11. Haniffa M, Lasserson TJ, Smith I. Interventions to improve compliance with continuous positive airway pressure for obstructive sleep apnoea. Cochrane Database Syst Rev. 2004;(4):CD003531.
12. Kushida CA, Berry RB, Blau, A, et al. Positive airway pressure initiation: a randomized controlled trial to assess the impact of therapy mode and titration process on efficacy, adherence, and outcomes. Sleep. 2011;34(8):1083-1092.
13. Gentina T, Fortin F, Douay B, et al. Auto bi-level with pressure relief during exhalation as a rescue therapy for optimally treated obstructive sleep apnoea patients with poor compliance to continuous positive airways pressure therapy--a pilot study. Sleep Breath. 2011;15(1):21-27.
14. Billings, ME, Auckley D, Benca R, et al. Race and residential socioeconomics as predictors of CPAP adherence. Sleep. 2011;34(12):1653-1658.
15. Young T, Finn L, Peppard PE, et al. Sleep disordered breathing and mortality: eighteen-year follow-up of the Wisconsin Sleep Cohort. Sleep. 2008;31(8):1071-1078.
16. Centers for Disease Control and Prevention. Effect of short sleep duration on daily activities--United States, 2005-2008. MMWR Morb Mortal Wkly Rep. 2011;60(8):239-242.
17. Antic NA, Catcheside P, Buchan C, et al. The effect of CPAP in normalizing daytime sleepiness, quality of life, and neurocognitive function in patients with moderate to severe OSA. Sleep. 2011;34(1):111-119.
18. Phurrough S, Jacques L, Spencer F, Stiller J, Brechner R. Coverage decision memorandum for continuous positive airway pressure (CPAP) therapy for obstructive sleep apnea (OSA) (CAG-00093R2). Centers for Medicare & Medicaid Services Website. https://www.cms.gov/medicare-coverage-database/details/nca-decision-memo.aspx?NCAId=204&fromdb=true. Accessed February 5, 2016.
19. Epstein LJ, Kristo D, Strollo PJ Jr, et al; Adult Obstructive Sleep Apnea Task Force of the American Academy of Sleep Medicine. J Clin Sleep Med. 2009;5(3):263-276.
20. Berry RB, Chediak A, Brown LK, et al; NPPV Titration Task Force of the American Academy of Sleep Medicine. Best clinical practices for the sleep center adjustment of noninvasive positive pressure ventilation (NPPV) in stable chronic alveolar hypoventilation syndromes. J Clin Sleep Med. 2010;6(5):491-509.
21. Merton RK. Social Theory and Social Structure. New York, NY: Free Press; 1968.
22. Chaput JP, McNeil J, Després JP, Bouchard C, Tremblay A. Seven to eight hours of sleep a night is associated with a lower prevalence of the metabolic syndrome and reduced overall cardiometabolic risk in adults. PLoS One. 2013;8(9):e72832.
23. Born J, Wagner U. Sleep, hormones, and memory. Obstet Gynecol Clin North Am. 2009;36(4):809-829, x.
24. Silva GE, Vana KD, Goodwin JL, Sherrill DL, Quan SF. Identification of patients with sleep disordered breathing: comparing the four-variable screening tool, STOP, STOP-Bang, and Epworth Sleepiness Scales. J Clin Sleep Med. 2011;7(5):467-472.
25. Soares Pires F, Drummond M, Marinho A, et al. Effectiveness of a group education session on adherence with APAP in obstructive sleep apnea--a randomized controlled study. Sleep Breath. 2013;17(3):993-1001.
26. Berry RB, Budhiraja R, Gottlieb DJ, et al; American Academy of Sleep Medicine. Rules for scoring respiratory events in sleep: update of the 2007 AASM Manual for the Scoring of Sleep and Associated Events. Deliberations of the Sleep Apnea Definitions Task Force of the American Academy of Sleep Medicine. J Clin Sleep Med. 2012;8(5):597-619.
27. Schwab RJ, Badr SM, Epstein LJ, et al; ATS Subcommittee on CPAP Adherence Tracking Systems. An official American Thoracic Society statement: continuous positive airway pressure adherence tracking systems. The optimal monitoring strategies and outcome measures in adults. Am J Respir Crit Care Med. 2013;188(5):613-620.
28. Respironics Encore Pro and Encore Pro 2 [computer program]. Philips, Inc; May 12, 2013.
29. ResMed. Version 04.01.013. San Diego, CA.
30. Knowles SR, O'Brien DT, Zhang S, Devara A, Rowley JA. Effect of addition of chin strap on PAP compliance, nightly duration of use, and other factors. J Clin Sleep Med. 2014;10(4):377-383.
31. Vorona RD, Ware JC, Sinacori JT, Ford ML 3rd, Cross JP. Treatment of severe obstructive sleep apnea syndrome with a chinstrap. J Clin Sleep Med. 2007;3(7):729-730.
32. Ruhle KH, Franke KJ, Domanski U, Nilius G. Quality of life, compliance, sleep and nasopharyngeal side effects during CPAP therapy with and without controlled heated humidification. Sleep Breath. 2011;15(3):479-485.
33. Hamilos DL. Chronic rhinosinusitis: epidemiology and medical management. J Allergy Clin Immunol. 2011;128(4):693-707.
34. Gooley JJ, Chamberlain K, Smith KA, et al. Exposure to room light before bedtime suppresses melatonin onset and shortens melatonin duration in humans. J Clin Endocrinol Metab. 2011;96(3):E463-E472.
35. Johns MW. A new method for measuring daytime sleepiness: the Epworth Sleepiness Scale. Sleep. 1991;14(6):540-545.
36. Bednarek M, Zgierska A, Pływaczewski R, Zielinski J. The effect of CPAP treatment on excessive daytime somnolence in patients with obstructive sleep apnea [in Polish]. Pneumonol Alergol Pol. 1999;67(5-6):237-244.
37. Harvey R, Hannan SA, Badia L, Scadding G. Nasal saline irrigations for the symptoms of chronic rhinosinusitis. Cochrane Database Syst Rev. 2007;(3):CD006394.
38. Poirier J, George C, Rotenberg B. The effect of nasal surgery on nasal continuous positive airway pressure compliance. Laryngoscope. 2014;124(1):317-319.
39. Law JA. From the journal archives: Mallampati in two millennia: its impact then and implications now. Can J Anaesth. 2014;61(5):480-484.
40. Hood HK, Rogojanski J, Moss TG. Cognitive-behavioral therapy for chronic insomnia. Curr Treat Options Neurol. 2014;16(12):321.
41. Harb GC, Thompson R, Ross RJ, Cook JM. Combat-related PTSD nightmares and imagery rehearsal: nightmare characteristics and relation to treatment outcome. J Trauma Stress. 2012;25(5):511-518.
42. Cartwright R, Lamberg L. Crisis Dreaming: Using Your Dreams to Solve Your Problems.. New York, NY: HarperCollins;1992.
43.Writer BW, Meyer EG, Schillerstrom JE. Prazosin for military combat-related PTSD nightmares: a critical review. J Neuropsychiatry Clin Neurosci. 2014;26(1):24-33.
44. Park JG, Ramar K, Olson EJ. Updates on definition, consequences, and management of obstructive sleep apnea. Mayo Clin Proc. 2011;86(6):549-554.
45. Kapur V, Blough DK, Sandblom RE, et al. The medical cost of undiagnosed sleep apnea. Sleep. 1999;22(6):749-755.
46. Weaver TE, Sawyer AM. Adherence to continuous positive airway pressure treatment for obstructive sleep apnoea: implications for future interventions. Indian J Med Res. 2010;131:245-258.
Adherence to positive airway pressure (PAP) therapy is a difficult patient management issue. Clinicians at the John D. Dingell VA Medical Center in Detroit (VAMC Detroit) developed the O’Brien criteria and extensive patient education materials to increase patient adherence. The importance of PAP therapy and the reasons veterans should sleep with a PAP machine for 7 to 9 hours each night are stressed (many sleep only 4 to 5 hours). Several recent studies have confirmed widely varying PAP therapy adherence rates (30%-84%).1-13 A majority of patients indicated that mask discomfort is the primary reason for nonadherence.1
Adherence is affected by many factors, including heated humidity, patient education, mask type, and type of PAP machine (eg, continuous PAP [CPAP] vs bilevel PAP [BPAP]; auto-PAP vs CPAP). Other factors, such as race and economic status, also affect adherence.14 The Wisconsin Sleep Cohort Study found that patients with moderate-to-severe untreated obstructive sleep apnea (OSA) were 4 to 5 times more likely to die of a cardiovascular event and 3 times more likely to die of any cause.15 The morbidity and mortality associated with severe untreated OSA led the clinicians to intensify treatment efforts.16In this article, the authors summarize the initiative at the VAMC Detroit to enhance PAP therapy adherence in patients with sleep apnea. The goal was to motivate patients to maximize PAP machine use. This article is a guide that federal health care providers and their civilian counterparts in the private sector can use to maximize PAP machine use. Working toward that goal, a set of PAP “super user” criteria was developed and used to create a 5-point method for encouraging patients to maximize adherence to PAP therapy.
Background
Positive airway pressure is the room air pressure, measured in centimeters of H2O, which splints open the airway to prevent snoring, apneas, and hypopneas. An apnea is a 90%-plus airway obstruction that lasts longer than 10 seconds and is seen with sleep study polysomnography. A hypopnea is a 30%-plus airway obstruction that lasts longer than 10 seconds and is accompanied by a 3% drop in pulse oximetry (SpO2).
A CPAP device delivers pressure continuously through a medical air compressor or flow generator called a PAP machine. The BPAP machine has separate inspiratory pressure and expiratory pressure. Auto-PAP machines give minimum pressure and maximum pressure usually between the range of 4 cm H2O to 20 cm H2O. This machine finds the user’s median pressure (90th percentile) and maximum pressure and averages pressure over a specified period of use. The auto-PAP can then be set to CPAP mode and the pressure fixed or set to the 90th percentile.
O’Brien Criteria
The O’Brien criteria for PAP super-user status (Table 1) were developed for maximizing PAP machine use and presented at the 2013 John D. Dingell Sleep and Wake Disorders Center Symposium. There is no other published reference or criteria proposed for maximizing PAP machine adherence. A recent study on sleep time criteria suggested that a higher percentage of patients achieved normal functioning with longer duration nightly CPAP therapy, which is in line with the authors’ recommended PAP machine use duration.17
Positive airway pressure therapy is eligible for insurance reimbursement by Medicare and third-party payers for adult patients who have OSA and achieve 4 hours of nightly use for 70% of nights over 30 days. Coverage for CPAP therapy is initially limited to 12 weeks during which beneficiaries with an OSA diagnosis can be identified and any therapy benefits documented. Subsequent CPAP therapy is covered only for those OSA patients who benefit during the 12-week period.18At VAMC Detroit, the data covering the previous 30 days of use is downloaded. Medicare allows for the best 30-day period out of the 12-week window. The hospital, along with Harper Hospital and the Detroit Medical Centers in conjunction with the Wayne State University sleep program, is an Academic Center of Distinction, which follows the sleep guidelines and practice parameters for Medicare, third-party insurance companies, and the American Academy of Sleep Medicine.
The sleep clinic clinicians follow the clinical guidelines for evaluation, management, and long-term care of adults with OSA.19,20 Follow-up visits are scheduled and made on a consultation basis up to 90 days for the required download or as necessary for PAP therapy. In this initiative, practitioners offer veteran-specific patient care with PAP therapy that exceeds Medicare guidelines. The success of this process yielded a growing cohort of PAP super users at VAMC Detroit. These patients exceed the Medicare criterion of 4 hours of nightly use for 70% of nights over 30 days. Thus, 4 hours of nightly use for 100% of nights over the same period was proposed as another criterion.
The super-user criteria, which provide motivation to reach the top, stimulate many patients to achieve the Medicare criteria. All 5 criteria must be satisfied to attain super-user status, and becoming a super user is not easy. In fact, the expectation is that, if an adherence data study is conducted, it will show that only a small percentage of all users meet the criteria. Maximum adherence is expected to be the tail (3%-4%) of a bell-shaped curve.
PAP Super-User Status
At the initial evaluation, practitioners create a self-fulfilling prophecy that, as first described by Merton, sets expectations.21 A self-fulfilling prophecy is a prediction that directly or indirectly causes the prediction to become true as a result of the positive feedback between belief and behavior.21 The personnel at VAMC Detroit sleep clinic set a tone that enables patients to meet and exceed the Medicare sleep guidelines and their expectations. Patients are encouraged to make it their personal mission to achieve the goal of becoming a PAP super user. The patients receive the O’Brien criteria for PAP super-user status—guidelines thought to contribute to higher quality of life.
The Medicare criterion emphasized is the minimum required for full adherence. The goal is to reduce sleepiness and increase well-being. The literature shows that increasing duration of sleep results in lower daytime sleepiness.22 Inadequate sleep has many detrimental effects. According to a recent study, insufficient sleep contributes to weight gain.22 Desired patient outcomes are increased sleep time without arousals, increased slow-wave sleep (SWS), consolidation of memories and rapid eye movement (REM), and improvement in emotional and procedural skill memories.23 Patients are informed that using a PAP machine for 7 to 9 hours can reduce excessive daytime sleepiness and allow for more SWS and REM sleep, which help improve memory, judgment, and concentration. Many other studies have shown how 7 to 9 hours of sleep benefit adults. Thus, 7 to 9 hours became the criterion for maximizing PAP sleep time.
Initial Evaluation and Sleep Study
A primary care provider can enroll a patient into the clinic for a sleep study by requesting an evaluation. The consultation is then triaged using the STOP-BANG (Snoring, Tiredness, Observed apnea, high blood Pressure–Body mass index > 35, Age > 50, Neck circumference > 40 cm, Gender male) questionnaire. The STOP-BANG has a high sensitivity for predicting moderate-to-severe (87.0%) and severe (70.4%) sleep-disordered breathing.24 More than 3 affirmative answers indicate a high risk for sleep-disordered breathing and is cause for ordering a sleep study.
CPAP Group Class
Patients with a diagnosis of sleep apnea subsequently receive their CPAP machines when they attend a 2-hour group class taught by a respiratory therapist. Group education sessions increase the chance of issuing more machines and providing better education.25 One study found that “attendance in a group clinic designed to encourage compliance with CPAP therapy provided a simple and effective means of improving treatment of OSA.”25
In class, the respiratory therapist briefly assesses each patient’s CPAP prescription, describes the patient’s type of sleep apnea and final diagnosis, and reviews the CPAP machine’s features. Veterans are then instructed to take their CPAP machines home to use all night, every night for 4 weeks. All night is defined as a period of 7.5 to 8 hours, as population-based study results have shown that sleep of this duration is associated with lowest cardiovascular morbidity and mortality. After the initial 4-plus weeks of machine use, patients with all their CPAP equipment are seen in the sleep clinic.
First Sleep Clinic Follow-Up Visit
At first follow-up, patients are asked for a subjective evaluation of their sleep. Most state they are “better” with PAP therapy. Each patient’s mask is checked and refitted with the patient’s prescribed pressure.
Patients are informed of their PAP settings and requirements from the sleep study and told their particular “magic pressure.” Patients understand that a person’s magic pressure, determined in the laboratory, is the pressure of room air blown into the nose, mouth, or both that eliminates not only snoring, but also partial and complete airway obstructions (hypopneas, apneas). Patients are asked to remember their particular magic pressure and their AHI and told their OSA status (mild, moderate, or severe) as assessed by the laboratory study.26 Extensive education on sleep apnea and treatment are also addressed. Education and training are among the most important tenets of PAP therapy, and these are incorporated into all encounters.25,26
PAP Data Report and Leak
The CPAP data are downloaded and printed. If adherence is suboptimal, clinician and patient discuss increasing adherence and possibly becoming a super user. The patient receives a copy of the report, which can be compared with the patient’s adherence statistics and with the adherence statistics of similar patients who are super users. A few blacked-out names are posted on the board in front of the provider’s computer station. Patients can thus easily see that attaining super-user status is very difficult but possible. Some patients maximize their therapy and are designated PAP super users. These patients are proud to receive this designation, and they strive to keep it.
Data downloads are crucial for adherence. In a recent study, the American Thoracic Society stated, “Providers need to be able to interpret adherence systems.”27
The clinic provides a summary report on each patient’s adherence. A provider interpretation is added, and the report is copied into the Computer Patient Record System.
After the report is downloaded, the provider checks for correct pressure and then for a large leak. A large leak is an unintentional leak (the total amount that leaks but not including leak from the mask) > 5% of the night. A leak of > 15 minutes was added to the super-user criteria, because some software provides the average time of a large leak per day in minutes.28 Many veterans sleep only 4 to 5 hours nightly (300 minutes × 5% = 15 minutes). Therefore, the leak should not be more than 5% or 15 minutes for a veteran sleeping 5 hours.
The machine indicates a percentage of leak on the patient self-check LED screen for adherence. There is no standardized leak criterion used by all flow-generator manufacturers. Every mask has venting designed to leak intentionally so that the patient does not rebreathe air CO2. The main concern is unintentional leaks above the intentional leak or venting threshold.
The ResMed CPAP (ResMed Corp, San Diego, CA) maximum intentional leak is 24 L/min.29 Above that level is large leak. The exact leak amount varies by interface (mask) based on pressure and mask type.2,12
The larger the interface surface area, the larger the leak. Unintentional leak is higher with the full-face mask than with the nasal mask, most likely because there is more opportunity for leakage with the larger surface area of the full-face mask. Nasal pillows seem to leak less because of their smaller surface area, but more studies on mask interfaces are needed to validate this finding.
Chin Strap
Adding a chin strap improved patient adherence, nightly duration of use, residual AHI, and leak in patients with sleep apnea.30 Other investigators reported reduced OSA, confirmed by polysomnography and nasopharyngolaryngoscopy, with use of only a chin strap.31 When a nasal mask with chin strap is used, the strap should be made to fit properly over the chin, not on the throat. Properly used chin straps significantly reduce leakage and residual AHI.30
A chin strap most likely reduces large leak and dry mouth.30 Dry mouth can result from mouth leak, which is commonly caused by nasal congestion or high pressure and mouth breathing. The nasal turbinates help humidify, warm, and cool the air. Heated humidification of PAP can help prevent dry mouth.
Asking the Right Questions
The clinician should ask several key questions at the first follow-up: How is it going with your PAP machine? Do you feel PAP therapy is helping you sleep? Do you feel better with PAP therapy? To a patient who states he or she is not doing well with therapy, the clinician should ask, What type of problems are you having? In many cases, poor adherence is attributable to a large leak from a poorly fitting mask. A large leak can also increase residual AHI and cause frequent arousals.30
Some machines cannot maintain the pressure of a large leak and will shut off and trigger an alarm that wakes the patient to readjust the mask. This situation causes some patients to discontinue CPAP/BPAP use. The mask leak must be adjusted. Another common complaint is morning dry mouth. This extreme dryness—a significant clue pointing to mouth leak caused in part by the mouth dropping open during sleep with PAP—should be addressed by fitting the patient with a chin strap.30 Dry mouth also can be caused by low humidity; increasing the humidity setting usually resolves the problem. However, as one study found, use of controlled heated humidification did not improve adherence or quality of life.32 In the same study, the nasopharyngeal dryness that resulted from CPAP therapy without humidification was reduced immediately and during the first weeks of treatment.All current PAP machines feature heated humidification.
Mouth breathing can also result from nasal congestion, allergic or vasomotor rhinitis, nasal turbinate hypertrophy, obstruction from a deviated septum, polyps, or air hunger/insufficient PAP pressure. Chronic rhinosinusitis is a problem that affects up to 12.5% of the U.S. population.33
Adherence is also increased with the elimination of leak and associated arousals. Patients are shown how to use their PAP machine’s heated humidity settings to obtain desired comfort levels. The clinician explains that the nasal turbinates heat and cool the air and that they can become swollen and irritated with PAP therapy. A heated hose may be prescribed to provide optimal humidification without condensation or water dripping into the hose (rainout).
A full-face mask is used only when the patient cannot breathe out the nose adequately or when PAP becomes too high. A 2013 study found no significant differences among ResMed, Respironics, and Fisher & Paykel CPAP interfaces (Fisher & Paykel Healthcare, Irvine, CA).34 The clinician determines which mask is comfortable for a patient and tries to stay with that mask for that patient.
Adherence Report
A therapy data summary is downloaded and reviewed with the patient.28 A pattern of use report that shows daily use with times over the month is also reviewed.28 The software’s sleep therapy long-term trend report lists important statistics. The adherence data summary and the CPAP summary are also reviewed (Table 2).28 This page is printed and given to patients to reieiw their progress. For some it represents a reward for using the CPAP/BPAP machine as well as a congratulatory note.
In the Example 1 summary download (Table 2), a patient used a PAP machine 4 hours or more on 93.3% of the 30 days the machine was used.28 Residual AHI was low, 2.1, and there was no appreciable leak. The PAP of 11.2 cm H2O was in the 90th percentile. The patient was fixed to 12 cm H2O with expiratory pressure relief (EPR) of 1. The EPR is a comfort feature that reduces pressure from 1 cm H2O to 3 cm H2O to make it easier for the patient to exhale. (A flow generator that produces EPR of > 3 cm H2O is a BPAP machine.)
This patient was not a super user. Overall use was low—5 hours, 28 minutes—which could indicate behaviorally insufficient sleep syndrome. Sleep time is controversial, but the National Sleep Foundation recommends 7 to 9 hours of sleep per night.
A different patient used a PAP machine 4 hours or more on 100% (28/28) of the days when the machine was used (Table 3).29 Residual AHI was low (0.6), median use was 8 hours, 47 minutes, and there was no appreciable leak. The patient was using autoset mode with a minimum pressure of 13 cm H2O and maximum pressure of 18 cm H2O. The 95th percentile pressure was 13.6 cm H2O. The patient’s pressure was changed to 14 cm H2O with EPR of 3. This patient was a super user.
Sleep Hygiene Discussion
Providers must discuss sleep hygiene (good sleep habits) with veterans. If needed, AASM pamphlets on sleep hygiene and other educational materials can be provided. The bedroom should be cool, comfortable, quiet, and dark and should not include a television or computer. Exposure to room light before bedtime suppresses melatonin onset and shortens melatonin duration and tells the brain it is time to wake up.34
Patients are asked about the number of arousals they have per night. At first follow-up, providers must determine what is causing a patient to arouse while on CPAP/BPAP therapy. Some causes are air leak resulting in unresolved OSA, nocturia (may be triggered by unresolved OSA), dry mouth (indicating need for chin strap), nightmares (suggestive of unresolved OSA in REM sleep), posttraumatic stress disorder (PTSD), environmental noise, and claustrophobia. The provider should have thought-out answers to these problems in advance.
Epworth Sleepiness Scale
The Epworth Sleepiness Scale (ESS) is administered as part of the baseline comprehensive examination and at every sleep clinic follow-up after issuing a CPAP/BPAP machine.35 The first evaluation after the machine is issued should show a reduction in ESS. No reduction in ESS indicates that a problem needs to be addressed. The most common reason for insufficient reduction in ESS is suboptimal PAP therapy adherence, usually because of a large leak. Some cases of poor adherence may be attributable to restless legs syndrome, periodic limb movement disorder, chronic musculoskeletal pain, and sleep fragmentation caused by alcohol, smoking, caffeine, or cocaine. Excessive daytime sleepiness may persist from use of pain medications or other sedating medications. One study found a correlation between sleep duration with CPAP therapy and reduction in ESS.36 In addition to administering the ESS, patients are asked how they doing with PAP therapy, and the answer is documented. Treatment changes are made if needed to reduce excessive daytime sleepiness.
Ear-Nose-Throat Examination
A quick look into the nose with a nasal speculum is a crucial component of a thorough examination. The clinician looks for a deviated septum, swollen turbinates, obstruction, polyps, bleeding, infection, septal perforation, and discharge. In addition, the patient is checked for airflow amount, nasal congestion, and obstruction; if necessary a nasal steroid spray or a nasal saline spray is prescribed. In some cases, saline spray can be added to the steroid spray to help reduce or eliminate nasal congestion.37
Treatment of congestion requires education, as many patients improperly use these sprays. The steroid spray is not an instant vasoconstrictor; a week of regular use is needed to reduce inflammation and congestion. Saline spray and saline irrigation can be used as a treatment adjunct for symptoms of chronic rhinosinusitis.37If the steroid and saline sprays fail after a 2-month trial, consider an ear-nose-throat (ENT) consultation. A recent study found that adherence rates increased after septoplasty in patients with nasal obstruction.38 The throat is examined for macroglossia or scalloping of the tongue.39 Macroglossic Mallampati IV tongues are platterlike. They are big, long, and wide and often have impressions or scalloping along the outside from a molding of the teeth. The patient is shown a Mallampati diagram and given a Mallampati score.
Creating a Sense of Mission
The sleep physician assistant (PA)at the Detroit VAMC is a retired U.S. Army colonel who ensures that the language the physician uses aligns with the language veterans use. Behavioral techniques are used to create a common culture that helps overcome obstacles—allowing patients to understand the benefits of and need for full CPAP/BPAP therapy adherence. One technique reinforces their sense of mission accomplishment, their military pride, and their interservice rivalry to increase adherence. The mission with each patient is to “work until success is achieved...but the patient can’t quit.” The mantra given to a patient with a difficult case is, “We will not let you fail with CPAP/BPAP therapy,” which echoes a familiar military motto, “We will not leave you behind.” Also, the goal of the physician is: Never give up on the patient.
Behavioral and Psychological Principles
The behavioral and psychological principles for success with PAP super users should be studied to validate better outcomes with longer duration PAP machine use. Patients who are motivated to succeed and to participate in their care can make great strides in changing their behavior to get more and better sleep. Obese patients can get referrals to the MOVE! weight loss program. Some veterans simply follow instructions, pay attention to detail, and do what they are told regarding sleep, PAP education, and good sleep hygiene. Many veterans have poor sleep hygiene and insomnia because they watch television or play games on electronic devices right before bedtime. Many patients develop behaviorally insufficient sleep syndrome. Their behavior prevents them from going to bed at a time that will allow sufficient sleep. Some veterans smoke or drink caffeinated beverages or al cohol immediately before sleep time and then wonder why they have insomnia.
Veterans with insomnia may be referred to the insomnia clinic psychologist for cognitive behavioral therapy for insomnia.40 Referral to this psychologist can be very helpful in the treatment of insomnia after the patient’s OSA has been treated. Veterans are encouraged to follow good sleep hygiene principles and permanently discontinue detrimental sleep behaviors.
For veterans with PTSD, imagery rehearsal before sleep has been effective in resolving disturbing nightmares and excluding their violent details.41 Clinicians recommend that these veterans rehearse a pleasant dream before sleep time. Cartwright and Lamberg performed extensive research on dreams and nightmares, and their book may provide insight into reducing nightmares for veterans with severe PTSD.42 Persistent nightmares associated with PTSD also can be reduced with use of prazosin. 43
Sleep Clinic Economics
The economic impact of OSA is substantial because of increased risk of cardiovascular disease and risk of motor vehicle accidents and decreased quality of life and productivity. Results of cost-effectiveness analyses support the value of diagnosing and treating OSA. Studies have provided estimates from a payer perspective, ranging from $2,000 to $11,000 per quality-adjusted life year over 5 years for treating moderate-to-severe OSA. The Sleep Heart Health Study showed that OSA was associated with an 18% increase in predicted health care utilization based on medication use.44,45 Moreover, CPAP therapy was found to be clinically more effective than no treatment: Therapy increased life expectancy in males and females, and effective treatment of OSA was associated with lower health care and disability costs and fewer missed workdays.
The authors’ initiatives to improve PAP therapy adherence required adding a PA and a registered respiratory therapist (RT) to the staff of 2 full-time equivalent (FTE) board-certified sleep physicians. The sleep physicians trained the PA to initiate and complete all the recommendations described, and the PA attended an AASM-sponsored review course for additional training. The PA is responsible for performing comprehensive face-to-face clinical evaluations in 4 half-day clinic sessions each week, as well as providing follow-up care in 4 additional half-day clinic sessions each week.
During these sessions, the PA provides education about sleep apnea and treatment. Thirty-minute follow-up clinic appointments are reserved for downloading CPAP data, providing interpretation, and educating patients to maximize PAP therapy and become super users. The remaining clinic sessions are run by 3 sleep fellows under the supervision of the sleep physicians. During all visits, providers encourage patients to maintain good sleep hygiene. Nonadherent patients are scheduled to be seen in a separate clinic session during which the RT troubleshoots and corrects PAP machine and mask-related problems.
Setting up the CPAP group classes and follow-up clinics required adding an FTE RT at a cost of $44,000 to $48,000 per year. By recruiting an FTE PA starting at GS-12 and $75,542 instead of another board-certified sleep physician, VAMC Detroit was able to provide increased access to patient care (8 clinics) at sizable financial savings (estimate, $75,000/y). A 0.5 FTE clinical psychologist provided cognitive behavioral therapy for insomnia and PAP therapy nonadherence and helped achieve the initiative’s goals.
The sleep center projects that the overall cost-effectiveness of these initiatives in terms of admission rates, life expectancy, and productivity would not be dissimilar to that reported in the peer-reviewed literature, as noted earlier. The center’s upcoming research projects will provide more data specific to its population. Educating patients requires that only motivated providers give patients instructions during a 30-minute follow-up clinic visit—there is no additional expense. This model of intensive care can be adopted at other VAMCs.
Conclusion
Maximizing PAP machine use is a unique approach that stimulates veterans to attain the highest level of adherence. This approach is based on clinical observation and patient encounters, and treatment recommendations over 8 years.
Showing enthusiasm with patients is crucial. Enthusiasm is contagious. Clinicians who are also PAP machine users should let patients know of their PAP super-user status and add that many others have attained this status, too. The benefits of optimal treatment are reviewed with patients: increased energy, lower risk of cardiovascular disease, lower blood pressure, better insulin sensitivity, and overall reduced mortality. Some patients have difficulty using the nasal mask and chin strap and understanding and adhering to PAP therapy. These impediments can be overcome with further education and follow-up. Sleep clinic clinicians take the time to show patients how to use the machine’s self-adherence check and leak functions. Patients can then monitor their progress daily.
To motivate patients, clinicians should set expectations early, invest time in providing education at follow-up; be diligent with respect to mask fitting and download evaluation. Sleep clinic providers should also speak the veterans’ language, create a self-fulfilling prophesy for success, and schedule a follow-up sleep clinic appointment if a patient is not fulfilling the Medicare adherence criterion of 4 hours’ nightly use for 70% of nights over 30 days.
PAP therapy coaching and persistent education with provider contact and enthusiasm can improve adherence. Encouragement and praise can help patients exceed Medicare’s minimum PAP therapy criterion and improve their overall PAP experience. The sleep team should tell patients they are proud of their accomplishments with such a difficult treatment. Being genuine and caring and showing concern about their evaluation, treatment, and follow-up is important. This helps reduce their OSA-related morbidity, lessen their depression, and improves their daily well-being and quality of life.
“The variation in responses to CPAP and acceptance of CPAP suggest that focused interventions, rather than one-size-fits-all interventions, may have a greater effect on the overall outcome of CPAP adherence,” wrote Weaver and Sawyer.46
Finally, one cannot equate spending on veteran care with spending in other areas of the national budget. The real cost of not giving veterans appropriate care will be a loss of trust, given that the overarching mission is “to care for him who shall have borne the battle and for his widow and his orphan.”
1. Boyaci H, Gacar K, Baris SA, Basyigit I, Yildiz F. Positive airway pressure device compliance of patients with obstructive sleep apnea syndrome. Adv Clin Exp Med. 2013;22(6):809-815.
2. Bachour A, Vitikainen P, Virkkula P, Maasilta P. CPAP interface: satisfaction and side effects. Sleep Breath. 2013;17(2):667-672.
3. Wimms AJ, Richards GN, Genjafield AV. Assessment of the impact on compliance of a new CPAP system in obstructive sleep apnea. Sleep Breath. 2013;17(1):69-76.
4. Smith I, Nadig V, Lasserson TJ. Educational, supportive and behavioral interventions to improve usage of continuous positive airway pressure machines for adults with obstructive sleep apnea. Cochrane Database Syst Rev. 2009;(2):CD007736.
5. Beecroft J, Zanon S, Lukic D, Hanly P. Oral continuous positive airway pressure for sleep apnea: effectiveness, patient preference, and adherence. Chest. 2003;124(6):2200-2208.
6. Chai CL, Pathinathan A, Smith B. Continuous positive airway pressure delivery interfaces for obstructive sleep apnoea. Cochrane Database Syst Rev. 2006;(4):CD005308.
7. Nilius G, Happel A, Domanski U, Ruhle KH. Pressure-relief continuous positive airway pressure vs constant continuous positive airway pressure: a comparison of efficacy and compliance. Chest. 2006;130(4):1018-1024.
8. Ballard RD, Gay PC, Strollo PJ. Interventions to improve compliance in sleep apnea patients previously non-compliant with continuous positive airway pressure. J Clin Sleep Med. 2007;3(7):706-712.
9. Sin DD, Mayers I, Man GC, Pawluk L. Long-term compliance rates to continuous positive airway pressure in obstructive sleep apnea: a population-based study. Chest. 2002;121(2):430-435.
10. Mortimore IL, Whittle AT, Douglas NJ. Comparison of nose and face mask CPAP therapy for sleep apnoea. Thorax. 1998;53(4):290-292.
11. Haniffa M, Lasserson TJ, Smith I. Interventions to improve compliance with continuous positive airway pressure for obstructive sleep apnoea. Cochrane Database Syst Rev. 2004;(4):CD003531.
12. Kushida CA, Berry RB, Blau, A, et al. Positive airway pressure initiation: a randomized controlled trial to assess the impact of therapy mode and titration process on efficacy, adherence, and outcomes. Sleep. 2011;34(8):1083-1092.
13. Gentina T, Fortin F, Douay B, et al. Auto bi-level with pressure relief during exhalation as a rescue therapy for optimally treated obstructive sleep apnoea patients with poor compliance to continuous positive airways pressure therapy--a pilot study. Sleep Breath. 2011;15(1):21-27.
14. Billings, ME, Auckley D, Benca R, et al. Race and residential socioeconomics as predictors of CPAP adherence. Sleep. 2011;34(12):1653-1658.
15. Young T, Finn L, Peppard PE, et al. Sleep disordered breathing and mortality: eighteen-year follow-up of the Wisconsin Sleep Cohort. Sleep. 2008;31(8):1071-1078.
16. Centers for Disease Control and Prevention. Effect of short sleep duration on daily activities--United States, 2005-2008. MMWR Morb Mortal Wkly Rep. 2011;60(8):239-242.
17. Antic NA, Catcheside P, Buchan C, et al. The effect of CPAP in normalizing daytime sleepiness, quality of life, and neurocognitive function in patients with moderate to severe OSA. Sleep. 2011;34(1):111-119.
18. Phurrough S, Jacques L, Spencer F, Stiller J, Brechner R. Coverage decision memorandum for continuous positive airway pressure (CPAP) therapy for obstructive sleep apnea (OSA) (CAG-00093R2). Centers for Medicare & Medicaid Services Website. https://www.cms.gov/medicare-coverage-database/details/nca-decision-memo.aspx?NCAId=204&fromdb=true. Accessed February 5, 2016.
19. Epstein LJ, Kristo D, Strollo PJ Jr, et al; Adult Obstructive Sleep Apnea Task Force of the American Academy of Sleep Medicine. J Clin Sleep Med. 2009;5(3):263-276.
20. Berry RB, Chediak A, Brown LK, et al; NPPV Titration Task Force of the American Academy of Sleep Medicine. Best clinical practices for the sleep center adjustment of noninvasive positive pressure ventilation (NPPV) in stable chronic alveolar hypoventilation syndromes. J Clin Sleep Med. 2010;6(5):491-509.
21. Merton RK. Social Theory and Social Structure. New York, NY: Free Press; 1968.
22. Chaput JP, McNeil J, Després JP, Bouchard C, Tremblay A. Seven to eight hours of sleep a night is associated with a lower prevalence of the metabolic syndrome and reduced overall cardiometabolic risk in adults. PLoS One. 2013;8(9):e72832.
23. Born J, Wagner U. Sleep, hormones, and memory. Obstet Gynecol Clin North Am. 2009;36(4):809-829, x.
24. Silva GE, Vana KD, Goodwin JL, Sherrill DL, Quan SF. Identification of patients with sleep disordered breathing: comparing the four-variable screening tool, STOP, STOP-Bang, and Epworth Sleepiness Scales. J Clin Sleep Med. 2011;7(5):467-472.
25. Soares Pires F, Drummond M, Marinho A, et al. Effectiveness of a group education session on adherence with APAP in obstructive sleep apnea--a randomized controlled study. Sleep Breath. 2013;17(3):993-1001.
26. Berry RB, Budhiraja R, Gottlieb DJ, et al; American Academy of Sleep Medicine. Rules for scoring respiratory events in sleep: update of the 2007 AASM Manual for the Scoring of Sleep and Associated Events. Deliberations of the Sleep Apnea Definitions Task Force of the American Academy of Sleep Medicine. J Clin Sleep Med. 2012;8(5):597-619.
27. Schwab RJ, Badr SM, Epstein LJ, et al; ATS Subcommittee on CPAP Adherence Tracking Systems. An official American Thoracic Society statement: continuous positive airway pressure adherence tracking systems. The optimal monitoring strategies and outcome measures in adults. Am J Respir Crit Care Med. 2013;188(5):613-620.
28. Respironics Encore Pro and Encore Pro 2 [computer program]. Philips, Inc; May 12, 2013.
29. ResMed. Version 04.01.013. San Diego, CA.
30. Knowles SR, O'Brien DT, Zhang S, Devara A, Rowley JA. Effect of addition of chin strap on PAP compliance, nightly duration of use, and other factors. J Clin Sleep Med. 2014;10(4):377-383.
31. Vorona RD, Ware JC, Sinacori JT, Ford ML 3rd, Cross JP. Treatment of severe obstructive sleep apnea syndrome with a chinstrap. J Clin Sleep Med. 2007;3(7):729-730.
32. Ruhle KH, Franke KJ, Domanski U, Nilius G. Quality of life, compliance, sleep and nasopharyngeal side effects during CPAP therapy with and without controlled heated humidification. Sleep Breath. 2011;15(3):479-485.
33. Hamilos DL. Chronic rhinosinusitis: epidemiology and medical management. J Allergy Clin Immunol. 2011;128(4):693-707.
34. Gooley JJ, Chamberlain K, Smith KA, et al. Exposure to room light before bedtime suppresses melatonin onset and shortens melatonin duration in humans. J Clin Endocrinol Metab. 2011;96(3):E463-E472.
35. Johns MW. A new method for measuring daytime sleepiness: the Epworth Sleepiness Scale. Sleep. 1991;14(6):540-545.
36. Bednarek M, Zgierska A, Pływaczewski R, Zielinski J. The effect of CPAP treatment on excessive daytime somnolence in patients with obstructive sleep apnea [in Polish]. Pneumonol Alergol Pol. 1999;67(5-6):237-244.
37. Harvey R, Hannan SA, Badia L, Scadding G. Nasal saline irrigations for the symptoms of chronic rhinosinusitis. Cochrane Database Syst Rev. 2007;(3):CD006394.
38. Poirier J, George C, Rotenberg B. The effect of nasal surgery on nasal continuous positive airway pressure compliance. Laryngoscope. 2014;124(1):317-319.
39. Law JA. From the journal archives: Mallampati in two millennia: its impact then and implications now. Can J Anaesth. 2014;61(5):480-484.
40. Hood HK, Rogojanski J, Moss TG. Cognitive-behavioral therapy for chronic insomnia. Curr Treat Options Neurol. 2014;16(12):321.
41. Harb GC, Thompson R, Ross RJ, Cook JM. Combat-related PTSD nightmares and imagery rehearsal: nightmare characteristics and relation to treatment outcome. J Trauma Stress. 2012;25(5):511-518.
42. Cartwright R, Lamberg L. Crisis Dreaming: Using Your Dreams to Solve Your Problems.. New York, NY: HarperCollins;1992.
43.Writer BW, Meyer EG, Schillerstrom JE. Prazosin for military combat-related PTSD nightmares: a critical review. J Neuropsychiatry Clin Neurosci. 2014;26(1):24-33.
44. Park JG, Ramar K, Olson EJ. Updates on definition, consequences, and management of obstructive sleep apnea. Mayo Clin Proc. 2011;86(6):549-554.
45. Kapur V, Blough DK, Sandblom RE, et al. The medical cost of undiagnosed sleep apnea. Sleep. 1999;22(6):749-755.
46. Weaver TE, Sawyer AM. Adherence to continuous positive airway pressure treatment for obstructive sleep apnoea: implications for future interventions. Indian J Med Res. 2010;131:245-258.
Complete Atrioventricular Nodal Block Due to Malignancy-Related Hypercalcemia
Complete atrioventricular (AV) block can occur due to structural or functional causes. Common structural etiologies include sclerodegenerative disease of the conduction system, ischemic heart disease in the acute or chronic setting, infiltrative myocardial disease, congenital heart disease, and cardiac surgery. Reversible etiologies of complete AV block include drug overdose and electrolyte abnormalities. In the following case study, the authors present a rare case of complete AV block caused by severe hypercalcemia related to malignancy that completely normalized after treatment of the hypercalcemia.
Case Report
A 63-year-old African-American man with metastatic carcinoma of the lungs (Figure 1) with unknown primary cancer was found to have a serum calcium level of 17.5 mg/dL (reference range:8.4-10.2 mg/dL) on routine preoperative laboratory testing prior to placement of a surgical port for chemotherapy. The patient also was noted to have a slow heart rate, and his electrocardiogram revealed a third-degree AV block with an escape rhythm at 29 bpm with a prolonged corrected QT (QTc) of 556 ms (Figure 2).
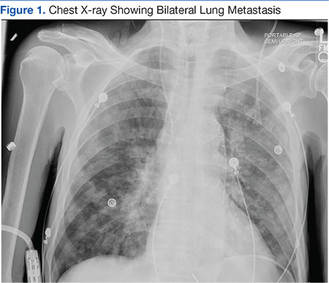
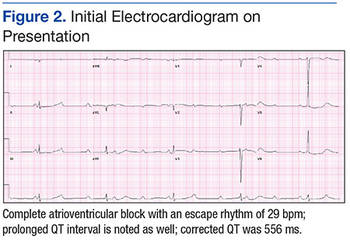
Although the patient reported nonspecific symptoms of fatigue, anorexia, dysphagia, and weight loss for 3 months, there were no new symptoms of dizziness, chest discomfort, or syncope. His past medical history included hypertension, hyperlipidemia, chronic kidney disease, obstructive sleep apnea, and the recently discovered bilateral lung metastasis. The patient reported no prior history of cardiac arrhythmias, coronary artery disease, or structural heart defects. His outpatient medications included aspirin, amlodipine, bupropion, hydralazine, and simvastatin.
At the physical examination the patient was cachectic but in no apparent distress. His heart rate escape rhythm was 29 bpm, with no murmurs and mildly reduced breath sounds. The patient’s blood pressure was 110/70. After correction for albumin, the serum calcium level was 17.8 mg/dL; ionized calcium level was 8.6 mg/dL; parathyroid hormone was 7.6 pg/mL (normal range, 12-88 pg/mL); parathyroid hormone-related protein was 6.4 pmol/L (normal range, < 2.0 pmol/L); potassium was 3.4 mmol/L (normal range, 3.5 – 5.1 mmol/L); and magnesium was 2.01 mg/dL. The patient’s thyroid stimulating hormone level was normal, and serial cardiac enzymes stayed within the reference range.
The patient was admitted to a cardiac care unit. A temporary transvenous pacemaker was placed, and the hypercalcemia was treated with aggressive fluid hydration, calcitonin, and zoledronic acid. Serum calcium gradually decreased to 14.6 mg/dL the following day and 9.6 mg/dL the subsequent day. The normalization of calcium resulted in resolution of complete heart block (Figure 3). The patient did not experience recurrence of AV nodal dysfunction and eventually died 3 months later due to his advanced metastatic disease.
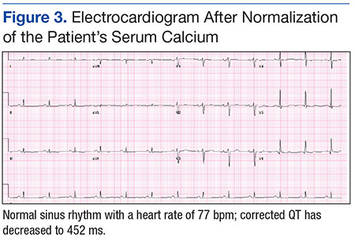
Discussion
The reported cardiovascular effects of hypercalcemia include hypertension, arrhythmias, increased myocardial contractility at serum calcium level below 15 mg/dL, and myocardial depression above that level. Electrocardiographic manifestations of hypercalcemia include a shortened ST segment leading to a short corrected QT interval (QTc), slight increase in T wave duration, and rarely, Osborn waves or J waves.1-3 However, its influence on the AV node is less clear.
One small study assessed the prevalence of cardiac arrhythmias and conduction disturbances in 20 patients with hyperparathyroidism and moderate hypercalcemia and found no increase in the frequency of arrhythmias or high grade AV block.4
There are reports of conduction abnormality secondary to experimentally induced hypercalcemia in the literature. Hoff and colleagues described findings of AV block generated by the injection of IV calcium in dogs.5 In 2 human subjects, sinus bradycardia was precipitated after they received IV infusion of calcium gluconate.6 Shah and colleagues described 2 patients with sinus node dysfunction attributed to hypercalcemia secondary to hyperparathyroidism.7
Case reports of AV nodal dysfunction provoked by hypercalcemia have primarily occurred in the setting of primary hyperparathyroidism.8,9 Milk-alkali syndrome and vitamin D related hypercalcemia also have been reported to cause complete heart block.10,11 Reports of malignancy-related hypercalcemia causing conduction abnormalities are rare. The authors also found one case report of marked sinus bradycardia due to hypercalcemia related to breast cancer.12The case study presented in this report is rare because the patient developed complete AV block due to malignancy-related hypercalcemia that resolved completely with resolution of hypercalcemia. The prolongation of the QTc interval was another unique electrocardiographic change observed in this case. Calcium levels are inversely proportional to the QTc interval, and hypercalcemia is typically associated with a shortened QTc interval. However, this patient had a prolonged QTc without any other clear-cut cause. His hypokalemia was of a mild degree and not severe enough to produce such a long QTc interval. A possible explanation of QTc prolongation may be an increase in the T wave width associated with a serum calcium level above 16 mg/dL.
The pathophysiology of hypercalcemia-induced AV nodal conduction system disease is unknown. Calcium deposition in AV nodes of elderly patients has been associated with paroxysmal 2:1 AV block.8 It could be postulated that elevated serum calcium levels predispose to calcium deposition in cardiac conduction tissue, leading to progressive dysfunction. Although this theory may be applicable in a chronic setting, the mechanism in an acute setting likely relates to elevated serum levels of calcium that causes an alteration in electrochemical gradients. These elevated serum levels also increase intracellular calcium. This rise may result in increased calmodulin activation on the intracellular portion of the myocyte cell membrane and consequent enhanced sodium channel activation, which may then inhibit AV nodal conduction.13
Conclusion
Physicians should be aware that severe hypercalcemia can cause significant conduction system alterations, including complete AV block. A short QTc interval is typical, but a prolonged QTc interval also may be seen. While temporary support with a transvenous pacemaker may be needed, the conduction system abnormality is expected to resolve by treatment of the underlying hypercalcemia.
1. Nierenberg DW, Ransil BJ. Q-aTc interval as a clinical indicator of hypercalcemia. Am J Cardiol. 1979;44(2):243-248.
2. Bronsky D, Dubin A, Waldstein SS, Kushner DS. Calcium and the electrocardiogram II. The electrocardiographic manifestations of hyperparathyroidism and of marked hypercalcemia from various other etiologies. Am J Cardiol. 1961;7(6):833-839.
3. Otero J, Lenihan DJ. The "normothermic" Osborn wave induced by severe hypercalcemia. Tex Heart Inst J. 2000;27(3):316-317.
4. Rosenqvist M, Nordenström J, Andersson M, Edhag OK. Cardiac conduction inpatients with hypercalcaemia due to primary hyperparathyroidism. Clin Endocrinol (Oxf). 1992;37(1):29-33.
5. Hoff H, Smith P, Winkler A. Electrocardiographic changes and concentration of calcium in serum following injection of calcium chloride. Am J Physiol. 1939;125:162-171.
6. Howard JE, Hopkins TR, Connor TB. The use of intravenous calcium as a measure of activity of the parathyroid glands. Trans Assoc Am Physicians. 1952;65:351-358.
7. Shah AP, Lopez A, Wachsner RY, Meymandi SK, El-Bialy AK, Ichiuji AM. Sinus node dysfunction secondary to hyperparathyroidism. J Cardiovasc Pharmacol Ther. 2004;9(2):145-147.
8. Vosnakidis A, Polymeropoulos K, Zaragoulidis P, Zarifis I. Atrioventricular nodal dysfunction secondary to hyperparathyroidism. J Thoracic Dis. 2013;5(3):E90-E92.
9. Crum WB, Till HJ. Hyperparathyroidism with Wenckebach's phenomenon. Am J Cardiol. 1960;6:838-840.
10. Ginsberg H, Schwarz KV. Letter: hypercalcemia and complete heart block. Ann Intern Med. 1973;79(6):903.
11. Garg G, Khadgwat R, Khandelwal D, Gupta N. Vitamin D toxicity presenting as hypercalcemia and complete heart block: an interesting case report. Indian J Endocrinol Metab. 2012;16 (suppl 2):S423-S425.
12. Badertscher E, Warnica JW, Ernst DS. Acute hypercalcemia and severe bradycardia in a patient with breast cancer. CMAJ. 1993;148(9):1506-1508.
13. Potet F, Chagot B, Anghelescu M, et al. Functional interactions between distinct sodium channel cytoplasmic domains through the action of calmodulin. J Biol Chem. 2009;284(13):8846-8854.
Complete atrioventricular (AV) block can occur due to structural or functional causes. Common structural etiologies include sclerodegenerative disease of the conduction system, ischemic heart disease in the acute or chronic setting, infiltrative myocardial disease, congenital heart disease, and cardiac surgery. Reversible etiologies of complete AV block include drug overdose and electrolyte abnormalities. In the following case study, the authors present a rare case of complete AV block caused by severe hypercalcemia related to malignancy that completely normalized after treatment of the hypercalcemia.
Case Report
A 63-year-old African-American man with metastatic carcinoma of the lungs (Figure 1) with unknown primary cancer was found to have a serum calcium level of 17.5 mg/dL (reference range:8.4-10.2 mg/dL) on routine preoperative laboratory testing prior to placement of a surgical port for chemotherapy. The patient also was noted to have a slow heart rate, and his electrocardiogram revealed a third-degree AV block with an escape rhythm at 29 bpm with a prolonged corrected QT (QTc) of 556 ms (Figure 2).
Although the patient reported nonspecific symptoms of fatigue, anorexia, dysphagia, and weight loss for 3 months, there were no new symptoms of dizziness, chest discomfort, or syncope. His past medical history included hypertension, hyperlipidemia, chronic kidney disease, obstructive sleep apnea, and the recently discovered bilateral lung metastasis. The patient reported no prior history of cardiac arrhythmias, coronary artery disease, or structural heart defects. His outpatient medications included aspirin, amlodipine, bupropion, hydralazine, and simvastatin.
At the physical examination the patient was cachectic but in no apparent distress. His heart rate escape rhythm was 29 bpm, with no murmurs and mildly reduced breath sounds. The patient’s blood pressure was 110/70. After correction for albumin, the serum calcium level was 17.8 mg/dL; ionized calcium level was 8.6 mg/dL; parathyroid hormone was 7.6 pg/mL (normal range, 12-88 pg/mL); parathyroid hormone-related protein was 6.4 pmol/L (normal range, < 2.0 pmol/L); potassium was 3.4 mmol/L (normal range, 3.5 – 5.1 mmol/L); and magnesium was 2.01 mg/dL. The patient’s thyroid stimulating hormone level was normal, and serial cardiac enzymes stayed within the reference range.
The patient was admitted to a cardiac care unit. A temporary transvenous pacemaker was placed, and the hypercalcemia was treated with aggressive fluid hydration, calcitonin, and zoledronic acid. Serum calcium gradually decreased to 14.6 mg/dL the following day and 9.6 mg/dL the subsequent day. The normalization of calcium resulted in resolution of complete heart block (Figure 3). The patient did not experience recurrence of AV nodal dysfunction and eventually died 3 months later due to his advanced metastatic disease.
Discussion
The reported cardiovascular effects of hypercalcemia include hypertension, arrhythmias, increased myocardial contractility at serum calcium level below 15 mg/dL, and myocardial depression above that level. Electrocardiographic manifestations of hypercalcemia include a shortened ST segment leading to a short corrected QT interval (QTc), slight increase in T wave duration, and rarely, Osborn waves or J waves.1-3 However, its influence on the AV node is less clear.
One small study assessed the prevalence of cardiac arrhythmias and conduction disturbances in 20 patients with hyperparathyroidism and moderate hypercalcemia and found no increase in the frequency of arrhythmias or high grade AV block.4
There are reports of conduction abnormality secondary to experimentally induced hypercalcemia in the literature. Hoff and colleagues described findings of AV block generated by the injection of IV calcium in dogs.5 In 2 human subjects, sinus bradycardia was precipitated after they received IV infusion of calcium gluconate.6 Shah and colleagues described 2 patients with sinus node dysfunction attributed to hypercalcemia secondary to hyperparathyroidism.7
Case reports of AV nodal dysfunction provoked by hypercalcemia have primarily occurred in the setting of primary hyperparathyroidism.8,9 Milk-alkali syndrome and vitamin D related hypercalcemia also have been reported to cause complete heart block.10,11 Reports of malignancy-related hypercalcemia causing conduction abnormalities are rare. The authors also found one case report of marked sinus bradycardia due to hypercalcemia related to breast cancer.12The case study presented in this report is rare because the patient developed complete AV block due to malignancy-related hypercalcemia that resolved completely with resolution of hypercalcemia. The prolongation of the QTc interval was another unique electrocardiographic change observed in this case. Calcium levels are inversely proportional to the QTc interval, and hypercalcemia is typically associated with a shortened QTc interval. However, this patient had a prolonged QTc without any other clear-cut cause. His hypokalemia was of a mild degree and not severe enough to produce such a long QTc interval. A possible explanation of QTc prolongation may be an increase in the T wave width associated with a serum calcium level above 16 mg/dL.
The pathophysiology of hypercalcemia-induced AV nodal conduction system disease is unknown. Calcium deposition in AV nodes of elderly patients has been associated with paroxysmal 2:1 AV block.8 It could be postulated that elevated serum calcium levels predispose to calcium deposition in cardiac conduction tissue, leading to progressive dysfunction. Although this theory may be applicable in a chronic setting, the mechanism in an acute setting likely relates to elevated serum levels of calcium that causes an alteration in electrochemical gradients. These elevated serum levels also increase intracellular calcium. This rise may result in increased calmodulin activation on the intracellular portion of the myocyte cell membrane and consequent enhanced sodium channel activation, which may then inhibit AV nodal conduction.13
Conclusion
Physicians should be aware that severe hypercalcemia can cause significant conduction system alterations, including complete AV block. A short QTc interval is typical, but a prolonged QTc interval also may be seen. While temporary support with a transvenous pacemaker may be needed, the conduction system abnormality is expected to resolve by treatment of the underlying hypercalcemia.
1. Nierenberg DW, Ransil BJ. Q-aTc interval as a clinical indicator of hypercalcemia. Am J Cardiol. 1979;44(2):243-248.
2. Bronsky D, Dubin A, Waldstein SS, Kushner DS. Calcium and the electrocardiogram II. The electrocardiographic manifestations of hyperparathyroidism and of marked hypercalcemia from various other etiologies. Am J Cardiol. 1961;7(6):833-839.
3. Otero J, Lenihan DJ. The "normothermic" Osborn wave induced by severe hypercalcemia. Tex Heart Inst J. 2000;27(3):316-317.
4. Rosenqvist M, Nordenström J, Andersson M, Edhag OK. Cardiac conduction inpatients with hypercalcaemia due to primary hyperparathyroidism. Clin Endocrinol (Oxf). 1992;37(1):29-33.
5. Hoff H, Smith P, Winkler A. Electrocardiographic changes and concentration of calcium in serum following injection of calcium chloride. Am J Physiol. 1939;125:162-171.
6. Howard JE, Hopkins TR, Connor TB. The use of intravenous calcium as a measure of activity of the parathyroid glands. Trans Assoc Am Physicians. 1952;65:351-358.
7. Shah AP, Lopez A, Wachsner RY, Meymandi SK, El-Bialy AK, Ichiuji AM. Sinus node dysfunction secondary to hyperparathyroidism. J Cardiovasc Pharmacol Ther. 2004;9(2):145-147.
8. Vosnakidis A, Polymeropoulos K, Zaragoulidis P, Zarifis I. Atrioventricular nodal dysfunction secondary to hyperparathyroidism. J Thoracic Dis. 2013;5(3):E90-E92.
9. Crum WB, Till HJ. Hyperparathyroidism with Wenckebach's phenomenon. Am J Cardiol. 1960;6:838-840.
10. Ginsberg H, Schwarz KV. Letter: hypercalcemia and complete heart block. Ann Intern Med. 1973;79(6):903.
11. Garg G, Khadgwat R, Khandelwal D, Gupta N. Vitamin D toxicity presenting as hypercalcemia and complete heart block: an interesting case report. Indian J Endocrinol Metab. 2012;16 (suppl 2):S423-S425.
12. Badertscher E, Warnica JW, Ernst DS. Acute hypercalcemia and severe bradycardia in a patient with breast cancer. CMAJ. 1993;148(9):1506-1508.
13. Potet F, Chagot B, Anghelescu M, et al. Functional interactions between distinct sodium channel cytoplasmic domains through the action of calmodulin. J Biol Chem. 2009;284(13):8846-8854.
Peer Technical Consultant: Veteran-Centric Technical Support Model for VA Home-Based Telehealth Programs
With an increasing demand for mental health services for veterans in rural clinics, telehealth can deliver services to veterans at home or in other nonclinic settings. Telehealth can reduce demands on VA clinic space and staff required for traditional videoconferencing.
Clinic-based telemental health started at the VA in 2003 and has provided access to more than 1 million appointments.1 Despite the great strides in accessibility, logistic barriers limit expansion of clinic-based telehealth appointments. A VA staff member at the patient site must be available to “greet and seat” the veteran; scheduling requires 2 separate appointments (on patient and provider sites); and limited telehealth equipment and clinic space need to be reserved ahead of time.
The first known use of telehealth technologies to deliver mental health services within the VA network information technology system to at-home veterans occurred in 2009 at the VA Portland Health Care System (VAPORHCS) in Oregon. Between 2010 and 2013, the VAPORHCS Home-Based Telemental Health (HBTMH) pilot served about 82 veterans through about 740 appointments. The HBTMH pilot transitioned from a single facility to a regional implementation model under an Office of Innovation Grant Innovation #669: Home-Based Telemental Health (Innovation), which served about 84 veterans from 2013 to 2014.
In 2014, about 4,200 veterans accessed some health care via the national Clinical Video Telehealth–Into the Home (CVT-IH) program, with all 21 VISNs participating (John Peters, e-mail communication, February 2014). In all 3 implementation models (HBTMH pilot, Innovation, and CVT-IH), the veteran can receive health services via videoconferencing in real time, on personal or loaned computers, at home or in another nonclinic setting.
As the VA’s use of telehealth services grows in non-VA settings, technical support remains a significant challenge.2 Increased use of CVT-IH through veterans’ personal computers and devices has generated a corresponding need for technical support. The National Telehealth Technical Help Desk (NTTHD), which supports the national CVT-IH program, does not provide technical support directly to veterans. Instead, recommendations are given to the providers who are expected to transmit and implement the technical solutions with the veterans. Similarly, HBTMH pilot providers were initially responsible for all technical issues for home-based telehealth work, including helping patients with software installation and subsequent troubleshooting.
Providers participating in the HBTMH pilot project encountered veterans with all levels of comfort and skill with the required technology. Some veterans have never used a personal computer, e-mail, and/or webcam. Addressing technical issues often required up to 15 to 20 minutes during an HBTMH pilot session; some cases took hours spread over several days. In VISN 20, providers in Oregon and Washington have reported discontinuation of treatment of veterans enrolled in CVT-IH for technical reasons, including poor connections, lack of timely technical support, and incompatibility of veteran-owned computers with VA-approved third-party software (Anders Goranson, Sara Smucker Barnwell, Kathleen Woodside, e-mail communication, December 2013).
A peer technical consultant (PTC) who directly serves patients and providers may be better positioned to meet the technical needs of everyone involved in a home-based telehealth program. The PTC role was developed for the HBTMH Pilot and expanded during the Innovation program. The authors describe the role of the PTC, outline key responsibilities, and highlight how the PTC can provide effective technical support and improve provider and patient access and engagement with nonclinic-based telehealth services.
Methods
Lessons from the initial phases of the HBTMH pilot strongly suggested that technical barriers had to be reduced. In 2010, a former patient in the HBTMH pilot who had a background in information technology and computer systems and interest in helping other veterans contacted Dr. Peter Shore. They developed the novel role of a PTC, focused on delivering technical support with compassion (Table 1). A functional statement and position description were submitted to volunteer services at the VAPORHCS (Appendix). With the regionwide expansion of the HBTMH pilot into the Innovation program, the PTC was hired as a full-time contract employee to increase the availability of technical support.

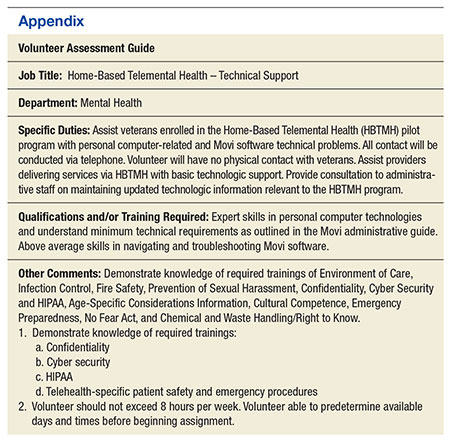
The PTC assumed responsibility for installations and troubleshooting for both providers and veterans enrolled in the HBTMH pilot. The PTC, who was based at the VAPORHCS, received referrals, contacted veterans by telephone, addressed technical problems, and reported the result to the provider. No face-to-face contact occurred between the PTC and the veterans. The PTC received regular supervision from the project director. Starting in mid-2012, local providers who were using the national CVT-IH program also requested PTC services. The PTC was able to add technical support for veterans beyond the NTTHD model, allowing for immediate in-session attention in some cases.
For the Innovation program, which loaned devices (netbooks or iPads) and connectivity (mobile broadband Internet access) to veterans who needed them, the role of PTC expanded to become a technology concierge, helping to set up and manage all mobile telecommunication devices. The PTC phoned veterans when they received their device and provided a virtual tour, helped familiarize them with the technology by using test calls, and guided them in the use of relevant mobile applications installed on the device. During treatment, the PTC called enrolled veterans to follow up and to answer additional questions. The PTC also provided assistance to veterans interested in enrolling in the patient online portal My HealtheVet to access health information, communicate with providers, and request medication refills.
The VAPORHCS received institutional review board approval to present HBTMH pilot research data and program evaluation data for Innovation (as a quality improvement project). An initial evaluation of the position was completed through review of PTC workload and productivity, informal feedback from telehealth providers, and veteran and provider surveys during and after treatment.
Results
From March 2010 through April 2012, the PTC logged more than 2,500 hours of volunteer service on behalf of the HBTMH pilot (before the Innovation expansion). The dropout rate due to nonclinical reasons for veterans enrolled in the HBTMH pilot was 11%.3 During the HBTMH pilot, 78% of veterans reported that they had enough technical support (ie, from the volunteer PTC), whereas among veterans receiving clinic-based videoconferencing sessions, 61% reported having adequate technical support (ie, from telehealth clinical technicians employed by the VA).3
During 2013 to 2014, veterans and providers were surveyed during and after Innovation program treatment. Eighty percent of participants stated that the PTC was prompt in resolving any issues (20% reported “neutral”). One hundred percent of providers indicated that the PTC was able to resolve the technical issues and that they were “very likely” to continue participating in HBTMH if the PTC was involved. Eighty-nine percent of veterans reported they felt there was enough technical support, and 11% responded “neutral” to this question. Table 2 describes typical PTC services provided during the Innovation program.
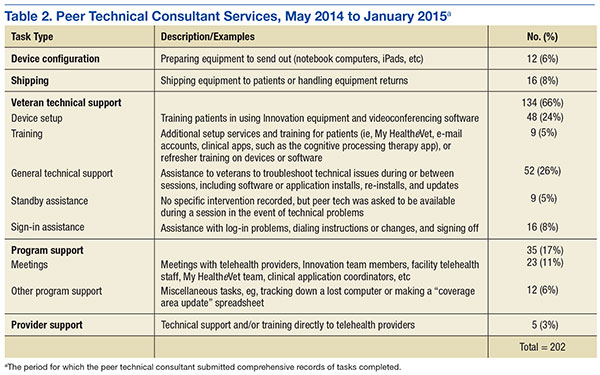
Informal summary observations from the PTC confirmed that the most frequent interventions were device and software orientation, assessment of audio and/or video disruptions during sessions, and software log-in configuration and support. Common technical issues included audio and video bandwidth limitations and the need to clean up veterans’ personal computers to restore functionality or improve performance (eg, problems due to malware and viruses; e-mail communication, various dates, William Cannon).
Troubleshooting was performed immediately during a session about half the time (vs between sessions) and initiated by veterans about half the time (vs by providers on their behalf) according to informal observations. The average length of a technical support appointment was about 30 minutes for veterans who were comfortable with technology; in contrast, appointments with veterans who were unfamiliar with technology averaged about 90 minutes.
The task logs recorded instances where flexibility and availability were needed for optimal task completion. Although many tasks seemed to be routine, others showed considerable use of the PTC’s time or direct participation during a session.
One PTC noted, “Client called around 9:30 and had me put [provider’s name] info into Jabber. Also Jabber had an issue of being stuck but forced a call and issue cleared up. 15 min. Stayed online with client to ensure appointment connection went well. 5 min.”
Malware, although not the most common issue, seemed to be time consuming. A task that required 4 hours for resolution of multiple issues was described as “requested outside assist due to drivers. Troubleshooting discovered 240 plus malware and numerous Trojan [horses].”
Another time-consuming issue involved software or updates to existing software interfering with the videoconferencing program, with the following example logged for 90 minutes: “Jabber will not store contacts. Updated IOS. Deleted games. Deleted and reinstalled Jabber. Re-updated Jabber. Problem finally resolved” (December 19, 2014). Other patients simply needed more time to familiarize themselves with the technology, as in this example: “2.5 hours of training and using the iPad” (November 25, 2014).
Informal feedback from providers as well as formal feedback from a program audit indicated appreciation for the PTC’s ability to facilitate engagement and surmount technical hurdles. One provider reflected on a particular instance in which the PTC worked with both the veteran and the provider over the phone and webchat to teach them to use the equipment. “[Veteran] and the peer technician developed a friendly rapport and [veteran] expressed gratitude for the team’s efforts to deliver treatment that he would not have had otherwise.” Another provider commented, “The [National] Help Desk is almost too general. You have to explain who you are each time, and never get to explain who [the] veteran is. … They are aware of national problems. Otherwise, they can’t help out much.”
In 2012, the Office of Telehealth Services completed its Conditions of Participation review of all VISN 20 Telehealth programs and in their final report commended the practices of the HBTMH program, highlighting the associated peer-to-peer volunteer program.4
Discussion
The number of technical issues addressed by the PTC demonstrates the versatility and potential impact of this role. In each case, the PTC accommodates the specific needs of the veteran and any factors that might impact their technology use (eg, low cognitive functioning, hyperarousal, slowed processing speed, low frustration tolerance, or paranoia). This model could be expanded within or outside the VA, although due to the limited scope of the evaluation and the unique qualifications of the individual who filled the PTC role, generalizability remains to be established.
By providing direct support, the PTC attempts to meet veterans where they are and helps them become comfortable with the technology so they are not preoccupied with technical problems while receiving health care. In doing so, engagement in telehealth care is enhanced for patients and providers, and dropouts due to technologic problems may be prevented. Initial program evaluation of this role also suggests considerable provider and veteran satisfaction.
The PTC’s interactions help minimize potential frustrations related to technology use for the delivery of mental health care. Frequently, veterans using in-home telehealth have little experience with technology. Moreover, technology use has been found to be lower for rural dwelling adults.5 Other populations (eg, geriatric) may have greater technology challenges and need additional support.6 When patients start CVT services, there is a potential for dropout if there are initial connection problems, particularly among patients who may have low stress tolerance. The PTC can develop an ongoing relationship with veterans who have a history of technologic difficulties and help monitor them.
Technology barriers and limited support are also a documented barrier to provider engagement.7 Given the inherent limitations and reported provider discouragement with the NTTHD model, more directed technical support may enhance provider engagement and efficiency. With the immediate and one-on-one support given by the PTC, this concern has been assertively addressed. In VISN 20 some mental health care providers elected not to use the CVT-IH program technical support system of the and chose instead to work with the Innovation PTC.
Programmatically, the PTC role is consistent with the VA Office of Mental Health Services and the VA Central Office initiative to increase involvement of peer support programs. From a recovery model perspective, the role of the PTC goes beyond technical support in connecting veterans to other veterans who are encouraged to take control of their health care by making self-directed choices. They can experience empowerment through interactions with another veteran who may share some of their experiences. Further investigation into the effects of using a peer technical support system on veterans, providers, and PTCs compared with the existing national VA technical support help desk system might be useful, particularly with regard to rates of initiation of care or dropouts.
Integration of this role should be done in a purposeful and direct manner, defining peer roles and establishing clear policies and practices. Logistically, the transition of the PTC from a volunteer to a contract employee afforded increased credentialing to allow for improved integration with the other HBTMH team members. The PTC was able to effectively coordinate with clinical, support and administrative staff to share information, resolve issues collaboratively, and bridge gaps in technology knowledge.
Conclusion
Between the HBTMH pilot and the Innovation program, the authors have demonstrated the growing need for personalized and attentive technical support for patients enrolled in home-based telehealth services. Under a current call center help desk model, satisfaction and services may be inadequate for some veterans’ needs. The authors contend that the PTC is an effective way to deliver the necessary specialized technical assistance to veterans and providers and encourage further implementation and evaluation of this approach.
There is preliminary evidence suggesting that this support can have a beneficial impact on provider and veteran engagement in telehealth services. The PTC offers much needed support to providers who frequently do not have the time or knowledge to address all the technical issues that arise during telehealth care. Veterans helping veterans is a powerful alternative deserving of national resources and policy change. Although this case developed in a very VA-specific context, peer technical support may be applicable to other organizations as well.
Acknowledgements
Being the first to do anything in the VA takes courage, tenacity, and luck. The following individuals greatly assisted with the HBTMH pilot and the subsequent Innovation: William “Bear” Cannon, David Greaves, Tracy Dekelboum, William Minium, Sean O’Connor, Joe Ronzio, Kit Teague, and Mark Ward. For assistance with data entry and analysis, the authors thank Athalia White. For help with administrative approvals, the authors thank Bradford Felker and Carol Simons.
This article is dedicated to William “Bear” Cannon, who reinvented himself while serving as the PTC and saved his life along the way. His unwavering commitment to serve his fellow veterans is unheralded. May he be the shining light to those who follow him.
1. Darkins A. The growth of telehealth services in the Veterans Health Administration between 1994 and 2014: a study in the diffusion of innovation. Telemed J E Health. 2014;20(9):761-768.
2. Ronzio JL, Tuerk PW, Shore P. Technology and clinical videoconferencing infrastructures: a guide to selecting appropriate system. In: Tuerk PW, Shore P, eds. Clinical Video Teleconferencing: Program Development and Practice. New York, NY: Springer;2015:3-22.
3. Shore P, Goranson A, Ward MF, Lu MW. Meeting veterans where they're @: a VA home-based telemental health (HBTMH) pilot program. Int J Psychiatry Med. 2014;48(1):5-17.
4. U.S. Department of Veterans Affairs, Veterans Health Administration. Telehealth Conditions of Participation: Final Core and Modality-Specific Standards. Washington, DC: Veterans Health Administration; 2014.
5. Calvert JF Jr, Kaye J, Leahy M, Hexem K, Carlson N. Technology use by rural and urban oldest old. Technol Health Care. 2009;17(1):1-11.
6. Kang HG, Mahoney DF, Hoenig H, et al; Center for Integration of Medicine and Innovative Technology Working Group on Advanced Approaches to Physiologic Monitoring for the Aged. In situ monitoring of health in older adults: technologies and issues. J Am Geriatr Soc. 2010;58(8):1579-1586.
7. Brooks E, Turvey C, Augusterfer EF. Provider barriers to telemental health: obstacles overcome, obstacles remain. Telemed J E Health. 2013;19(6):433-437.
With an increasing demand for mental health services for veterans in rural clinics, telehealth can deliver services to veterans at home or in other nonclinic settings. Telehealth can reduce demands on VA clinic space and staff required for traditional videoconferencing.
Clinic-based telemental health started at the VA in 2003 and has provided access to more than 1 million appointments.1 Despite the great strides in accessibility, logistic barriers limit expansion of clinic-based telehealth appointments. A VA staff member at the patient site must be available to “greet and seat” the veteran; scheduling requires 2 separate appointments (on patient and provider sites); and limited telehealth equipment and clinic space need to be reserved ahead of time.
The first known use of telehealth technologies to deliver mental health services within the VA network information technology system to at-home veterans occurred in 2009 at the VA Portland Health Care System (VAPORHCS) in Oregon. Between 2010 and 2013, the VAPORHCS Home-Based Telemental Health (HBTMH) pilot served about 82 veterans through about 740 appointments. The HBTMH pilot transitioned from a single facility to a regional implementation model under an Office of Innovation Grant Innovation #669: Home-Based Telemental Health (Innovation), which served about 84 veterans from 2013 to 2014.
In 2014, about 4,200 veterans accessed some health care via the national Clinical Video Telehealth–Into the Home (CVT-IH) program, with all 21 VISNs participating (John Peters, e-mail communication, February 2014). In all 3 implementation models (HBTMH pilot, Innovation, and CVT-IH), the veteran can receive health services via videoconferencing in real time, on personal or loaned computers, at home or in another nonclinic setting.
As the VA’s use of telehealth services grows in non-VA settings, technical support remains a significant challenge.2 Increased use of CVT-IH through veterans’ personal computers and devices has generated a corresponding need for technical support. The National Telehealth Technical Help Desk (NTTHD), which supports the national CVT-IH program, does not provide technical support directly to veterans. Instead, recommendations are given to the providers who are expected to transmit and implement the technical solutions with the veterans. Similarly, HBTMH pilot providers were initially responsible for all technical issues for home-based telehealth work, including helping patients with software installation and subsequent troubleshooting.
Providers participating in the HBTMH pilot project encountered veterans with all levels of comfort and skill with the required technology. Some veterans have never used a personal computer, e-mail, and/or webcam. Addressing technical issues often required up to 15 to 20 minutes during an HBTMH pilot session; some cases took hours spread over several days. In VISN 20, providers in Oregon and Washington have reported discontinuation of treatment of veterans enrolled in CVT-IH for technical reasons, including poor connections, lack of timely technical support, and incompatibility of veteran-owned computers with VA-approved third-party software (Anders Goranson, Sara Smucker Barnwell, Kathleen Woodside, e-mail communication, December 2013).
A peer technical consultant (PTC) who directly serves patients and providers may be better positioned to meet the technical needs of everyone involved in a home-based telehealth program. The PTC role was developed for the HBTMH Pilot and expanded during the Innovation program. The authors describe the role of the PTC, outline key responsibilities, and highlight how the PTC can provide effective technical support and improve provider and patient access and engagement with nonclinic-based telehealth services.
Methods
Lessons from the initial phases of the HBTMH pilot strongly suggested that technical barriers had to be reduced. In 2010, a former patient in the HBTMH pilot who had a background in information technology and computer systems and interest in helping other veterans contacted Dr. Peter Shore. They developed the novel role of a PTC, focused on delivering technical support with compassion (Table 1). A functional statement and position description were submitted to volunteer services at the VAPORHCS (Appendix). With the regionwide expansion of the HBTMH pilot into the Innovation program, the PTC was hired as a full-time contract employee to increase the availability of technical support.
The PTC assumed responsibility for installations and troubleshooting for both providers and veterans enrolled in the HBTMH pilot. The PTC, who was based at the VAPORHCS, received referrals, contacted veterans by telephone, addressed technical problems, and reported the result to the provider. No face-to-face contact occurred between the PTC and the veterans. The PTC received regular supervision from the project director. Starting in mid-2012, local providers who were using the national CVT-IH program also requested PTC services. The PTC was able to add technical support for veterans beyond the NTTHD model, allowing for immediate in-session attention in some cases.
For the Innovation program, which loaned devices (netbooks or iPads) and connectivity (mobile broadband Internet access) to veterans who needed them, the role of PTC expanded to become a technology concierge, helping to set up and manage all mobile telecommunication devices. The PTC phoned veterans when they received their device and provided a virtual tour, helped familiarize them with the technology by using test calls, and guided them in the use of relevant mobile applications installed on the device. During treatment, the PTC called enrolled veterans to follow up and to answer additional questions. The PTC also provided assistance to veterans interested in enrolling in the patient online portal My HealtheVet to access health information, communicate with providers, and request medication refills.
The VAPORHCS received institutional review board approval to present HBTMH pilot research data and program evaluation data for Innovation (as a quality improvement project). An initial evaluation of the position was completed through review of PTC workload and productivity, informal feedback from telehealth providers, and veteran and provider surveys during and after treatment.
Results
From March 2010 through April 2012, the PTC logged more than 2,500 hours of volunteer service on behalf of the HBTMH pilot (before the Innovation expansion). The dropout rate due to nonclinical reasons for veterans enrolled in the HBTMH pilot was 11%.3 During the HBTMH pilot, 78% of veterans reported that they had enough technical support (ie, from the volunteer PTC), whereas among veterans receiving clinic-based videoconferencing sessions, 61% reported having adequate technical support (ie, from telehealth clinical technicians employed by the VA).3
During 2013 to 2014, veterans and providers were surveyed during and after Innovation program treatment. Eighty percent of participants stated that the PTC was prompt in resolving any issues (20% reported “neutral”). One hundred percent of providers indicated that the PTC was able to resolve the technical issues and that they were “very likely” to continue participating in HBTMH if the PTC was involved. Eighty-nine percent of veterans reported they felt there was enough technical support, and 11% responded “neutral” to this question. Table 2 describes typical PTC services provided during the Innovation program.
Informal summary observations from the PTC confirmed that the most frequent interventions were device and software orientation, assessment of audio and/or video disruptions during sessions, and software log-in configuration and support. Common technical issues included audio and video bandwidth limitations and the need to clean up veterans’ personal computers to restore functionality or improve performance (eg, problems due to malware and viruses; e-mail communication, various dates, William Cannon).
Troubleshooting was performed immediately during a session about half the time (vs between sessions) and initiated by veterans about half the time (vs by providers on their behalf) according to informal observations. The average length of a technical support appointment was about 30 minutes for veterans who were comfortable with technology; in contrast, appointments with veterans who were unfamiliar with technology averaged about 90 minutes.
The task logs recorded instances where flexibility and availability were needed for optimal task completion. Although many tasks seemed to be routine, others showed considerable use of the PTC’s time or direct participation during a session.
One PTC noted, “Client called around 9:30 and had me put [provider’s name] info into Jabber. Also Jabber had an issue of being stuck but forced a call and issue cleared up. 15 min. Stayed online with client to ensure appointment connection went well. 5 min.”
Malware, although not the most common issue, seemed to be time consuming. A task that required 4 hours for resolution of multiple issues was described as “requested outside assist due to drivers. Troubleshooting discovered 240 plus malware and numerous Trojan [horses].”
Another time-consuming issue involved software or updates to existing software interfering with the videoconferencing program, with the following example logged for 90 minutes: “Jabber will not store contacts. Updated IOS. Deleted games. Deleted and reinstalled Jabber. Re-updated Jabber. Problem finally resolved” (December 19, 2014). Other patients simply needed more time to familiarize themselves with the technology, as in this example: “2.5 hours of training and using the iPad” (November 25, 2014).
Informal feedback from providers as well as formal feedback from a program audit indicated appreciation for the PTC’s ability to facilitate engagement and surmount technical hurdles. One provider reflected on a particular instance in which the PTC worked with both the veteran and the provider over the phone and webchat to teach them to use the equipment. “[Veteran] and the peer technician developed a friendly rapport and [veteran] expressed gratitude for the team’s efforts to deliver treatment that he would not have had otherwise.” Another provider commented, “The [National] Help Desk is almost too general. You have to explain who you are each time, and never get to explain who [the] veteran is. … They are aware of national problems. Otherwise, they can’t help out much.”
In 2012, the Office of Telehealth Services completed its Conditions of Participation review of all VISN 20 Telehealth programs and in their final report commended the practices of the HBTMH program, highlighting the associated peer-to-peer volunteer program.4
Discussion
The number of technical issues addressed by the PTC demonstrates the versatility and potential impact of this role. In each case, the PTC accommodates the specific needs of the veteran and any factors that might impact their technology use (eg, low cognitive functioning, hyperarousal, slowed processing speed, low frustration tolerance, or paranoia). This model could be expanded within or outside the VA, although due to the limited scope of the evaluation and the unique qualifications of the individual who filled the PTC role, generalizability remains to be established.
By providing direct support, the PTC attempts to meet veterans where they are and helps them become comfortable with the technology so they are not preoccupied with technical problems while receiving health care. In doing so, engagement in telehealth care is enhanced for patients and providers, and dropouts due to technologic problems may be prevented. Initial program evaluation of this role also suggests considerable provider and veteran satisfaction.
The PTC’s interactions help minimize potential frustrations related to technology use for the delivery of mental health care. Frequently, veterans using in-home telehealth have little experience with technology. Moreover, technology use has been found to be lower for rural dwelling adults.5 Other populations (eg, geriatric) may have greater technology challenges and need additional support.6 When patients start CVT services, there is a potential for dropout if there are initial connection problems, particularly among patients who may have low stress tolerance. The PTC can develop an ongoing relationship with veterans who have a history of technologic difficulties and help monitor them.
Technology barriers and limited support are also a documented barrier to provider engagement.7 Given the inherent limitations and reported provider discouragement with the NTTHD model, more directed technical support may enhance provider engagement and efficiency. With the immediate and one-on-one support given by the PTC, this concern has been assertively addressed. In VISN 20 some mental health care providers elected not to use the CVT-IH program technical support system of the and chose instead to work with the Innovation PTC.
Programmatically, the PTC role is consistent with the VA Office of Mental Health Services and the VA Central Office initiative to increase involvement of peer support programs. From a recovery model perspective, the role of the PTC goes beyond technical support in connecting veterans to other veterans who are encouraged to take control of their health care by making self-directed choices. They can experience empowerment through interactions with another veteran who may share some of their experiences. Further investigation into the effects of using a peer technical support system on veterans, providers, and PTCs compared with the existing national VA technical support help desk system might be useful, particularly with regard to rates of initiation of care or dropouts.
Integration of this role should be done in a purposeful and direct manner, defining peer roles and establishing clear policies and practices. Logistically, the transition of the PTC from a volunteer to a contract employee afforded increased credentialing to allow for improved integration with the other HBTMH team members. The PTC was able to effectively coordinate with clinical, support and administrative staff to share information, resolve issues collaboratively, and bridge gaps in technology knowledge.
Conclusion
Between the HBTMH pilot and the Innovation program, the authors have demonstrated the growing need for personalized and attentive technical support for patients enrolled in home-based telehealth services. Under a current call center help desk model, satisfaction and services may be inadequate for some veterans’ needs. The authors contend that the PTC is an effective way to deliver the necessary specialized technical assistance to veterans and providers and encourage further implementation and evaluation of this approach.
There is preliminary evidence suggesting that this support can have a beneficial impact on provider and veteran engagement in telehealth services. The PTC offers much needed support to providers who frequently do not have the time or knowledge to address all the technical issues that arise during telehealth care. Veterans helping veterans is a powerful alternative deserving of national resources and policy change. Although this case developed in a very VA-specific context, peer technical support may be applicable to other organizations as well.
Acknowledgements
Being the first to do anything in the VA takes courage, tenacity, and luck. The following individuals greatly assisted with the HBTMH pilot and the subsequent Innovation: William “Bear” Cannon, David Greaves, Tracy Dekelboum, William Minium, Sean O’Connor, Joe Ronzio, Kit Teague, and Mark Ward. For assistance with data entry and analysis, the authors thank Athalia White. For help with administrative approvals, the authors thank Bradford Felker and Carol Simons.
This article is dedicated to William “Bear” Cannon, who reinvented himself while serving as the PTC and saved his life along the way. His unwavering commitment to serve his fellow veterans is unheralded. May he be the shining light to those who follow him.
1. Darkins A. The growth of telehealth services in the Veterans Health Administration between 1994 and 2014: a study in the diffusion of innovation. Telemed J E Health. 2014;20(9):761-768.
2. Ronzio JL, Tuerk PW, Shore P. Technology and clinical videoconferencing infrastructures: a guide to selecting appropriate system. In: Tuerk PW, Shore P, eds. Clinical Video Teleconferencing: Program Development and Practice. New York, NY: Springer;2015:3-22.
3. Shore P, Goranson A, Ward MF, Lu MW. Meeting veterans where they're @: a VA home-based telemental health (HBTMH) pilot program. Int J Psychiatry Med. 2014;48(1):5-17.
4. U.S. Department of Veterans Affairs, Veterans Health Administration. Telehealth Conditions of Participation: Final Core and Modality-Specific Standards. Washington, DC: Veterans Health Administration; 2014.
5. Calvert JF Jr, Kaye J, Leahy M, Hexem K, Carlson N. Technology use by rural and urban oldest old. Technol Health Care. 2009;17(1):1-11.
6. Kang HG, Mahoney DF, Hoenig H, et al; Center for Integration of Medicine and Innovative Technology Working Group on Advanced Approaches to Physiologic Monitoring for the Aged. In situ monitoring of health in older adults: technologies and issues. J Am Geriatr Soc. 2010;58(8):1579-1586.
7. Brooks E, Turvey C, Augusterfer EF. Provider barriers to telemental health: obstacles overcome, obstacles remain. Telemed J E Health. 2013;19(6):433-437.
Predictors of VA and Non-VA Health Care Service Use by Homeless Veterans Residing in a Low-Demand Emergency Shelter
In 2009, the VA announced a goal of ending veteran homelessness by 2015.1 The primary focus of this new policy has been housing veterans experiencing chronic homelessness, many of whom languish outside the VA housing system. Since that time, progress has been made with point-in-time enumerations indicating that veteran homelessness has decreased nationally. Despite this progress, however, more than 55,000 veterans are still estimated to experience homelessness each night.2
Historically, the VA has offered an array of services specifically meant to alleviate veteran homelessness (grant, per diem, and other transitional housing programs; vocational rehabilitation, etc).3 The majority of these programs require some period of veteran abstinence as a condition for providing housing services. The recent move toward permanent “housing first” programs with few conditions for enrollment and participation provides new opportunities for housing veterans experiencing chronic homelessness, who are the specific target of the goal of ending veteran homelessness.4
Because veterans experiencing chronic homelessness have additional, substantial need for medical, psychiatric, and substance-abuse services, the VA also offers these services to this population.5-7 Veterans experiencing homelessness also may access parallel non-VA services.8 Information about veterans outside of traditional VA housing services, specifically those housed in low-demand shelters, is needed to develop services for this population and will be critical to success in ending veteran homelessness.
The Behavioral Model of Health Services Use9-11 and its later refinement, the Behavioral Model for Vulnerable Persons,12 have been used to conceptualize health care service use (Figure). In these models, health service use is predicted by 3 types of factors: predisposing factors (eg, age, race, gender, residential history), enabling factors (eg, availability, accessibility, affordability, acceptability), and service need factors (eg, substance-use disorders, mental health problems, physical health problems).
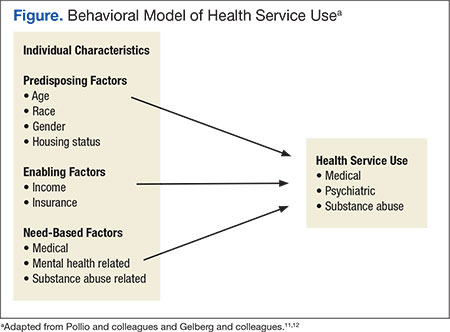
Studies applying these models of health care service use to both general homeless populations and, specifically to populations of veterans experiencing homelessness have found that service use is most influenced by need-based factors (eg, drug abuse, poor health, mental health problems).6,12-20 These same studies indicate that predisposing factors (eg, age, race, and gender) and enabling factors (eg, insurance, use of other services, and usual place of care) are also associated with service use, though less consistently.
Studies focused on veterans experiencing homelessness, however, included only treatment-seeking populations, which are not necessarily representative of the broader population of veterans experiencing homelessness. Additionally, none of these prior studies focused on the unique subset of veterans residing in low-demand shelters (characterized by unlimited duration of stay, no government ID or fee required for entry, and no requirement for service participation). This is a population that seems to be less engaged in services but nevertheless is challenged.21 This study, therefore, is focused on nontreatment seeking veterans residing in a low-demand shelter. The study applied the Behavioral Model of Health Services Use and the Behavioral Model for Vulnerable Persons to examine use of VA and non-VA services.
Study Parameters
This study was conducted in Fort Worth, Texas, the 17th largest city in the U.S. with more than 810,000 residents.22 In 2013, a biennial point-in-time count identified about 2,300 individuals who were homeless in Fort Worth. Most were found in emergency shelters (n = 1,126, 50%) or transitional housing (n = 965, 40%). Slightly more than 10% (n = 281) were found to be unsheltered: sleeping on the streets or in encampments, automobiles, or abandoned buildings.23 Although national estimates identify 12% of all adults who are homeless as veterans,2 only 8% (n = 189) of people experiencing homelessness in Fort Worth reported military service.23
Access to the full array of VA emergency department (ED), inpatient, and outpatient medical, psychiatric, and substance-abuse services are available to veterans experiencing homelessness at the Dallas VA Medical Center (DVAMC), located 35 miles away. Only VA outpatient medical, psychiatric, and substance-related services are available in Fort Worth through the VA Outpatient Clinic and Health Care for the Homeless Veterans (HCHV) program. If veterans experiencing homelessness seek care outside of the VA system, a comprehensive network of emergency, inpatient and outpatient medical, psychiatric, and substance-related services is available in Fort Worth.
Sample
The study sample included 110 adult male veterans randomly recruited as they awaited admission to a private, low-demand emergency shelter. The study excluded veterans with a dishonorable discharge to ensure participants were eligible for VA services. Institutional review board approvals were obtained prior to the study from the University of Texas at Arlington and DVAMC. All participants provided informed consent and were given a $5 gift for their involvement.
Instruments
Through structured interviews, experienced research staff collected demographics, history of homelessness, military service, and substance abuse in the previous 30 days. Data on alcohol and drug problems in the past 12 months were obtained using the Short Michigan Alcohol Screening Test (SMAST) and the Drug Abuse Screening Test. The Veterans RAND 12-Item Health Survey (VR-12) was used to measure physical and mental health functioning in the previous 4 weeks. Finally, participants reported their use of VA or non-VA medical (ED, inpatient, and outpatient), psychiatric (ED, inpatient, and outpatient), and substance abuse-related (inpatient and outpatient) services in the 12 months prior to the interview. These measures have been shown to be valid and reliable with acceptable psychometrics.24-26
Data Analysis
Statistical analysis was completed using IBM SPSS Statistics version 19. Descriptive data were summarized using counts, percentages, means, and standard deviations. A dichotomous variable for alcohol abuse was defined as SMAST score ≥ 3. A variable representing participant’s VR-12 mental component summary scores was used as an indicator of mental health functioning.
McNemar’s test was used to compare the use of VA and non-VA medical, psychiatric, and substance-related services using dichotomous variables for each overall sector as well as respective sector subcomponent services (emergency, inpatient, and outpatient for medical and psychiatric sectors and inpatient and outpatient for the substance-related sector). Statistical significance level was set at α = .05.
Logistic regression was used to predict psychiatric and substance abuse-related service use with separate dependent variables for VA, non-VA, and both VA and non-VA services. Need-based factors included in all models as independent variables were mental health functioning, alcohol abuse, and a dichotomous variable representing cocaine use in the previous 30 days. Independent variables for the other service sectors were included as enabling factors (eg, medical and substance-related problems predicting psychiatric service use), aligning all service use variables in the model to the same provider system (eg, VA service sector independent variables with VA service sector dependent variables).
Results
The sample mean age was 49.2 years (SD = 9.2), and fewer than half (n = 45, 41%) were white. Three-fourths (n = 82, 75%) had ever been married, and few participants (n = 5, 5%) were currently married. Total mean lifetime experience of homelessness was 3.9 years (SD = 4.3). One-third of the samples participants (n = 36, 33%) reported that their current episode of homelessness had lasted 1 year or longer. Most had an adult felony conviction (n = 78, 71%) and a history of incarceration as an adult (n = 104, 95%). All military branches were represented, with 49% serving in the Army, 23% in the Marine Corps, 17% in the Navy, 10% in the Air Force, and 1% in the Coast Guard.
Most of the sample’s veterans served during the Vietnam era (n = 43, 43%) or the post-Vietnam era (n = 49, 45%), but 12 (11%) served during the Persian Gulf era (including Operation Iraqi Freedom and Operation Enduring Freedom). Few received a nonservice connected VA pension (n = 21, 19%) or service-connected disability benefits (n = 20, 18%). The mean income earned in the previous 30 days was $466 (SD = $431). None of these predisposing factors were associated with any service variables.
The sample’s mean VR-12 physical functioning score was 43.8 (SD = 9.1), which was significantly higher (t = 6.2, df = 109, P < .001) than the 38.4 (SD = 12.2) population norm used with the instrument. The sample’s mean mental health functioning score of 39.4 (SD = 14.3) was significantly lower (t = -8.6, df = 109, P < .001) than the population norm (51.1, SD = 11.4).27 Substance-related problems were prevalent, with an identified alcohol problem in 62% (n = 68) and a drug problem in 79% (n = 87) of participants. More than half reported illicit drug use in the past 30 days (n = 61, 56%), especially cocaine (n = 42, 38%) and marijuana (n = 37, 33%).
The majority of veterans (n = 96, 87%) reported using some type of service in the past 12 months (Table 1). Most survey respondents used medical services. About half used psychiatric services, and almost one-third used substance-related services. More veterans used non-VA ED services than used VA ED services. More veterans used VA outpatient medical services than used non-VA outpatient medical services. Examining service sectors indicated that more veterans used VA psychiatric services than used non-VA psychiatric services, especially VA outpatient psychiatric services. More veterans used non-VA substance abuse-related services, especially outpatient services, rather than similar services offered by the VA. 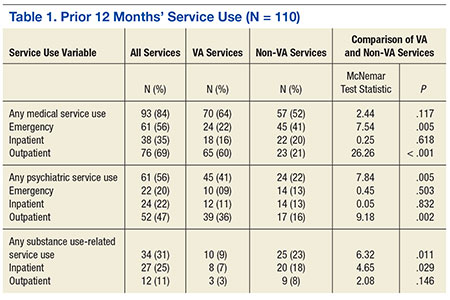
Separate logistic regression models predicted use of psychiatric and substance-abuse services with 3 models (VA, non-VA, or any service use) for each dependent variable from independent variables that reflected need and enabling factors (Tables 2 and 3). Demographic predisposing factors, which were not associated with service use, were not included as covariates in these models. For the model predicting the use of non-VA substance-abuse services, collinearity between the alcohol-abuse and cocaine-abuse variables required separate models for each of the 2 variables.
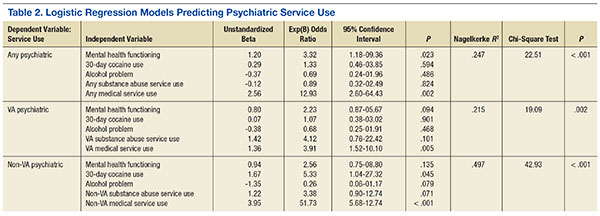
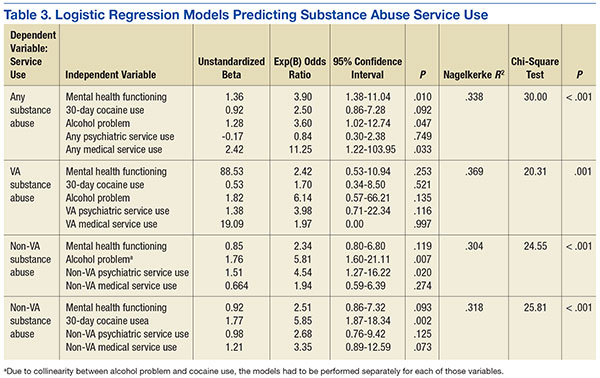
Medical sector service use predicted psychiatric sector service use in all models. In fact, VA medical service use was the only predictor of use of VA psychiatric services. Lower mental health functioning predicted the use of any (VA or non-VA) psychiatric service use. In addition to the use of medical services, 30-day cocaine use predicted non-VA psychiatric service use.
Any substance-related sector service use was predicted by lower mental health functioning, self-reported alcohol problem, and any medical services utilization. No independent variables included in the model predicted any VA substance-related service use. Non-VA substance abuse service use was predicted by non-VA psychiatric service use and alcohol abuse. In the separate analysis that replaced alcohol problems with 30-day cocaine use variable, only 30-day cocaine use predicted non-VA substance-related service utilization.
Discussion
This study examined the use of medical, psychiatric, and substance-abuse services by randomly sampled veterans from a low-demand emergency shelter. Random selection of the sample and its high (98%) participation rate virtually eliminated potential for bias within this sample. Another strength of this study is its focus on low-demand shelter users—a population that has not been well studied. This low-demand shelter-dwelling population of veterans experiencing homelessness is of interest because more substance-abuse problems and histories of incarceration seem to make them especially disadvantaged and challenged.
The limitation of the sample to users of a low-demand shelter at only 1 location may reduce generalizability to other veteran homeless populations and settings. The study also may not generalize to populations of female veterans experiencing homelessness. Another limitation of the study is that it did not use diagnostic assessments for psychiatric and substance use disorders and objective collateral information such as agency record data. Finally, although the limited size of the sample may have been insufficient to adequately test certain hypotheses, it was a relatively large sample of this population and was large enough to yield significant findings.
This study found that need-based factors predicted the use of some service sectors intended for those needs. For example, mental health functioning appropriately predicted any psychiatric service use, and presence of an alcohol problem appropriately predicted any substance abuse service use. Specifically for non-VA services, both cocaine use and presence of an alcohol problem in separate models predicted substance-abuse service use. However for VA substance-abuse services, neither cocaine use nor presence of an alcohol problem predicted service use. Despite the high need, very few veterans used substance-abuse services, and they rarely used VA substance-abuse services.
For 2 service sectors, need-based factors predicted the use of services intended for other needs. Cocaine use predicted non-VA psychiatric service use, and low mental health functioning predicted substance-abuse service use. One potential explanation for this finding could be that providers or patients incorrectly classified cocaine-related substance use problems as psychiatric. The VR-12 mental health functioning measure also may have incorrectly classified cocaine-related problems as psychiatric.
Three enabling factors predicted service use by sector and type. The first 2 are preference for VA-provided services and the geographic availability of services, which competed for veterans’ selection of service providers. When both VA and non-VA services were present in Fort Worth, a preference for VA-provided services was observed, with the exception of outpatient substance abuse services which were highly underutilized in general. No preference was observed for any non-VA services when both were present. When VA services were not present in Fort Worth, veterans used geographically available non-VA providers for some services, but for other services they used Dallas-based VA and Fort Worth-based non-VA providers equally (Table 3 and Table 4).
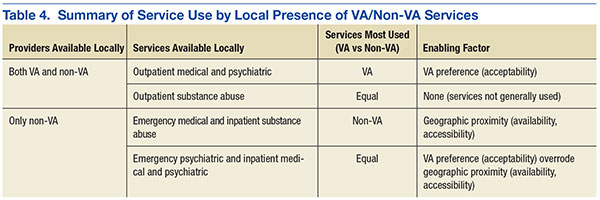
The third enabling factor influencing service use was through other service use as an enabling pathway. Those veterans who opted out of locally available services in favor of VA services in Dallas may have been prompted to do so by provider referrals, which were further facilitated by VA and public transportation between Fort Worth and Dallas. The most consistent enabling pathway was medical service use, which predicted all types of psychiatric service use (VA and non-VA combined, VA only, and non-VA only), and any substance-related service use. Psychiatric service use predicted substance abuse service use but only in non-VA settings; no pathways led from VA medical or psychiatric services to VA substance abuse services.
Conclusions
These findings suggest, in large part, the validity of the Andersen and Gelberg models of health care service use. Consistent with prior studies, need-based factors predicted the use of any psychiatric and substance-related sector services as well as the use of non-VA subcomponent services for both sectors. Also consistent with prior studies, enabling factors (medical sector service use) predicted service use, with the exception of VA or non-VA substance-abuse services. Unlike prior studies, however, predisposing factors (eg, age, race, marital status, and income) were not associated with service use.
This study could not determine why veterans underutilized substance-abuse services, even those available locally to them in Fort Worth. One possible barrier to care is that the services are designed or delivered in a manner that does not engage these veterans (eg, expectations regarding abstinence or service involvement). Another barrier could be that referral pathways between VA outpatient medical and psychiatric service providers and VA substance-related services are not sufficiently facilitative. Future investigations could build upon the findings of this study by collecting data that could help assess these potential barriers.
The data from this study suggest 3 opportunities to improve the utilization of services most needed by this population. The first opportunity would be to accurately differentiate between substance abuse and psychiatric problems in clinical assessment and identify the most appropriate type of care. Another opportunity, linked closely to the first, would be to facilitate more effective and efficient referral pathways among VA service sectors, especially from medical and psychiatric services to substance-abuse services. Another strategy to improve referral pathways would be for VA service networks to systematically examine local service systems for factors or processes that may disrupt integrated care and implement program improvements.28 For homeless veterans navigating an inherently complex VA health care system, peer-to-peer and patient navigator programs have helped improve service efficiency and service outcomes.29 The third opportunity to improve utilization of services would be to ensure geographic availability and accessibility by strategic placement of these services.
The results from this study, while informative, point directly to needed areas for further inquiry to inform public health response. Although the low-demand shelter users are a particularly challenging subgroup of veterans experiencing chronic homelessness, other equally challenging populations warrant additional study. For example, veterans outside of both VA and community services (eg, unsheltered populations) are likely to require different approaches to engage in appropriate services. Additionally, changes to the homeless policy implemented in the period after this sample was recruited suggest the need to revisit the service-using behaviors of this population. Finally, interventions developed as part of the national response need to be assessed for their ability to engage these difficult-to-reach veterans.
Acknowledgements
This study was funded by a U.S. Department of Veterans Affairs Office of Academic Affiliations Pre-Doctoral Social Work Research Fellowship award.
1. U.S. Department of Veterans Affairs. Homeless veterans: VA is working to end homelessness among veterans. U.S. Department of Veterans Affairs Website. www.va.gov/homeless/about_the_initiative.asp#one. Updated January 26, 2016. Accessed February 16, 2016.
2. Henry M, Cortes A, Morris S, Abt Associates; U. S. Department of Housing and Urban Development Office of Community Planning and Development. The 2013 Annual Homeless Assessment Report (AHAR) to Congress: Part 1 Point-in-Time Estimates of Homelessness. HUD Exchange Website. https://www.hudexchange.info/resources/documents/ahar-2013-part1.pdf. Published October 2014. Accessed February 16, 2016.
3. U.S. Department of Veterans Affairs. Homeless Veterans: Housing Assistance. U.S. Department of Veterans Affairs Web site. http://www.va.gov/homeless/housing.asp. Updated November 5, 2015. Accessed February 16, 2016.
4. Austin EL, Pollio DE, Holmes S, et al. VA's expansion of supportive housing: successes and challenges on the path to Housing First. Psychiatr Serv. 2014;65(5):641-647.
5. Tsai J, Kasprow WJ, Rosenheck RA. Alcohol and drug use disorders among homeless veterans: prevalence and association with supported housing outcomes. Addict Behav. 2014;39(2):455-460.
6. Wenzel SL, Bakhtiar L, Caskey NH, et al. Homeless veterans utilization of medical, psychiatric, and substance abuse services. Med Care. 1995;33(11):1132-1144.
7. McQuire J, Gelberg L, Blue-Howells J, Rosenheck RA. Access to primary care for homeless veterans with serious mental health illness or substance abuse: a follow-up evaluation of co-located primary care and homeless social services. Adm Policy Ment Health. 2009;36(4):255-264.
8. Tsai J, Mares AS, Rosenheck RA. Do homeless veterans have the same needs and outcomes as non-veterans? Mil Med. 2012;177(1):27-31.
9. Andersen RM. A behavioral model of families use of health services: Research Series No. 25. Chicago, IL: University of Chicago Center for Health Administrative Studies; 1968.
10. Andersen RM. Revisiting the behavioral model and access to medical care: does it matter? J Health Soc Behav. 1995;36(1):1-10.
11. Pollio DE, North CS, Eyrich KM, Foster DA, Spitznagel E. Modeling service access in a homeless population. J Psychoactive Drugs. 2003;35(4):487-495.
12. Gelberg L, Andersen RM, Leake BD. The Behavioral Model for Vulnerable Populations: application to medical care use and outcomes for homeless people. Health Serv Res. 2000;34(6):1273-1302.
13. Padgett D, Struening EL, Andrews H. Factors affecting the use of medical, mental health, alcohol, and drug treatment services by homeless adults. Med Care. 1990;28(9):805-821.
14. Stein JA, Andersen RM, Koegel P, Gelberg L. Predicting health services utilization among homeless adults: a prospective analysis. J Health Care Poor Underserved. 2000;11(2):212-230.
15. Gamache G, Rosenheck RA, Tessler R. Factors predicting choice of provider among homeless veterans with mental illness. Psychiatr Serv. 2000;51(8):1024-1028.
16. Wenzel SL, Audrey Burnam, M, Koegel P, et al. Access to inpatient or residential substance abuse treatment among homeless adults with alcohol or other drug use disorders. Med Care. 2001;39(11):1158-1169.
17. Pollio DE, North CS, Eyrich KM, Foster DA, Spitznagel E. Modeling service access in a homeless population. J Psychoactive Drugs. 2003;35(4):487-495.
18. Solorio MR, Milburn NG, Andersen RM, Trifskin S, Rodríguez MA. Emotional distress and mental health service use among urban homeless adolescents. J Behav Health Serv Res. 2006;33(4):381-393.
19. Stein JA, Andersen RM, Robertson M, Gelberg L. Impact of hepatitis B and C infection on health services utilization in homeless adults: a test of the Gelberg-Anderson Behavioral Model for Vulnerable Populations. Health Psychol. 2012;31(1):20-30.
20. Linton KF, Shafer MS. Factors associated with the health service use of unsheltered, chronically homeless adults. Soc Work Public Health. 2013;29(1):73-80.
21. Petrovich JC, Pollio DE, North CS. Characteristics and service use of homeless veterans and nonveterans residing in a low-demand emergency shelter. Psych Serv. 2014;65(6):751-757.
22. U.S. Census Bureau. State & County Quick Facts: Fort Worth (city), Texas. U.S. Census Bureau Website. http://quickfacts.census.gov/qfd/states/48/4827000.html. Revised December 2, 2015. Accessed February 17, 2016.
23. Tarrant County Homeless Coalition. 2014 point in time count results. Tarrant County Homeless Coalition Website. http://www.ahomewithhope.org/staff/local-data-research/2014-homeless-count/. Accessed February 16, 2016.
24. North CS, Eyrich KM, Pollio DE, Foster DA, Cottler LB, Spitznagel EL. The Homeless Supplement to the Diagnostic Interview Schedule: test-retest analyses. Int J Method Psychiatr Res. 2004;13(3):184-191.
25. Iqbal SU, Rogers W, Selim A, et al. The Veterans RAND 12 Item Health Survey (VR-12): What it is and how it is Used. Washington, DC: Veterans Health Administration; 2009.
26. Fischer J, Corcoran K, eds. Measures for Clinical Practice and Research: A Sourcebook. 4th ed. New York, NY: Oxford University Press; 2013.
27. Selim AJ, Rogers W, Fleishman JA, Qian SX, Finke BG, Rothendler JA, Kazis LE. Updated U.S. population standard for the Veterans RAND 12-Item Health Survey (VR-12). Qual Life Res. 2009;18(1):43-52.
28. Blue-Howells J, McQuire J, Nakashima J. Co-location of health care services for homeless veterans: a case study of innovation in program implementation. Soc Work Health Care. 2008;47(3):219-231.
29. Piette JD, Holtz B, Beard AJ, et al; Ann Arbor PACT Steering Committee. Improving chronic illness care for veterans within the framework of the Patient-Centered Medical Home: experiences from the Ann Arbor Patient-Aligned Care Team Laboratory. Transl Behav Med. 2011;1(4):615-623.
In 2009, the VA announced a goal of ending veteran homelessness by 2015.1 The primary focus of this new policy has been housing veterans experiencing chronic homelessness, many of whom languish outside the VA housing system. Since that time, progress has been made with point-in-time enumerations indicating that veteran homelessness has decreased nationally. Despite this progress, however, more than 55,000 veterans are still estimated to experience homelessness each night.2
Historically, the VA has offered an array of services specifically meant to alleviate veteran homelessness (grant, per diem, and other transitional housing programs; vocational rehabilitation, etc).3 The majority of these programs require some period of veteran abstinence as a condition for providing housing services. The recent move toward permanent “housing first” programs with few conditions for enrollment and participation provides new opportunities for housing veterans experiencing chronic homelessness, who are the specific target of the goal of ending veteran homelessness.4
Because veterans experiencing chronic homelessness have additional, substantial need for medical, psychiatric, and substance-abuse services, the VA also offers these services to this population.5-7 Veterans experiencing homelessness also may access parallel non-VA services.8 Information about veterans outside of traditional VA housing services, specifically those housed in low-demand shelters, is needed to develop services for this population and will be critical to success in ending veteran homelessness.
The Behavioral Model of Health Services Use9-11 and its later refinement, the Behavioral Model for Vulnerable Persons,12 have been used to conceptualize health care service use (Figure). In these models, health service use is predicted by 3 types of factors: predisposing factors (eg, age, race, gender, residential history), enabling factors (eg, availability, accessibility, affordability, acceptability), and service need factors (eg, substance-use disorders, mental health problems, physical health problems).
Studies applying these models of health care service use to both general homeless populations and, specifically to populations of veterans experiencing homelessness have found that service use is most influenced by need-based factors (eg, drug abuse, poor health, mental health problems).6,12-20 These same studies indicate that predisposing factors (eg, age, race, and gender) and enabling factors (eg, insurance, use of other services, and usual place of care) are also associated with service use, though less consistently.
Studies focused on veterans experiencing homelessness, however, included only treatment-seeking populations, which are not necessarily representative of the broader population of veterans experiencing homelessness. Additionally, none of these prior studies focused on the unique subset of veterans residing in low-demand shelters (characterized by unlimited duration of stay, no government ID or fee required for entry, and no requirement for service participation). This is a population that seems to be less engaged in services but nevertheless is challenged.21 This study, therefore, is focused on nontreatment seeking veterans residing in a low-demand shelter. The study applied the Behavioral Model of Health Services Use and the Behavioral Model for Vulnerable Persons to examine use of VA and non-VA services.
Study Parameters
This study was conducted in Fort Worth, Texas, the 17th largest city in the U.S. with more than 810,000 residents.22 In 2013, a biennial point-in-time count identified about 2,300 individuals who were homeless in Fort Worth. Most were found in emergency shelters (n = 1,126, 50%) or transitional housing (n = 965, 40%). Slightly more than 10% (n = 281) were found to be unsheltered: sleeping on the streets or in encampments, automobiles, or abandoned buildings.23 Although national estimates identify 12% of all adults who are homeless as veterans,2 only 8% (n = 189) of people experiencing homelessness in Fort Worth reported military service.23
Access to the full array of VA emergency department (ED), inpatient, and outpatient medical, psychiatric, and substance-abuse services are available to veterans experiencing homelessness at the Dallas VA Medical Center (DVAMC), located 35 miles away. Only VA outpatient medical, psychiatric, and substance-related services are available in Fort Worth through the VA Outpatient Clinic and Health Care for the Homeless Veterans (HCHV) program. If veterans experiencing homelessness seek care outside of the VA system, a comprehensive network of emergency, inpatient and outpatient medical, psychiatric, and substance-related services is available in Fort Worth.
Sample
The study sample included 110 adult male veterans randomly recruited as they awaited admission to a private, low-demand emergency shelter. The study excluded veterans with a dishonorable discharge to ensure participants were eligible for VA services. Institutional review board approvals were obtained prior to the study from the University of Texas at Arlington and DVAMC. All participants provided informed consent and were given a $5 gift for their involvement.
Instruments
Through structured interviews, experienced research staff collected demographics, history of homelessness, military service, and substance abuse in the previous 30 days. Data on alcohol and drug problems in the past 12 months were obtained using the Short Michigan Alcohol Screening Test (SMAST) and the Drug Abuse Screening Test. The Veterans RAND 12-Item Health Survey (VR-12) was used to measure physical and mental health functioning in the previous 4 weeks. Finally, participants reported their use of VA or non-VA medical (ED, inpatient, and outpatient), psychiatric (ED, inpatient, and outpatient), and substance abuse-related (inpatient and outpatient) services in the 12 months prior to the interview. These measures have been shown to be valid and reliable with acceptable psychometrics.24-26
Data Analysis
Statistical analysis was completed using IBM SPSS Statistics version 19. Descriptive data were summarized using counts, percentages, means, and standard deviations. A dichotomous variable for alcohol abuse was defined as SMAST score ≥ 3. A variable representing participant’s VR-12 mental component summary scores was used as an indicator of mental health functioning.
McNemar’s test was used to compare the use of VA and non-VA medical, psychiatric, and substance-related services using dichotomous variables for each overall sector as well as respective sector subcomponent services (emergency, inpatient, and outpatient for medical and psychiatric sectors and inpatient and outpatient for the substance-related sector). Statistical significance level was set at α = .05.
Logistic regression was used to predict psychiatric and substance abuse-related service use with separate dependent variables for VA, non-VA, and both VA and non-VA services. Need-based factors included in all models as independent variables were mental health functioning, alcohol abuse, and a dichotomous variable representing cocaine use in the previous 30 days. Independent variables for the other service sectors were included as enabling factors (eg, medical and substance-related problems predicting psychiatric service use), aligning all service use variables in the model to the same provider system (eg, VA service sector independent variables with VA service sector dependent variables).
Results
The sample mean age was 49.2 years (SD = 9.2), and fewer than half (n = 45, 41%) were white. Three-fourths (n = 82, 75%) had ever been married, and few participants (n = 5, 5%) were currently married. Total mean lifetime experience of homelessness was 3.9 years (SD = 4.3). One-third of the samples participants (n = 36, 33%) reported that their current episode of homelessness had lasted 1 year or longer. Most had an adult felony conviction (n = 78, 71%) and a history of incarceration as an adult (n = 104, 95%). All military branches were represented, with 49% serving in the Army, 23% in the Marine Corps, 17% in the Navy, 10% in the Air Force, and 1% in the Coast Guard.
Most of the sample’s veterans served during the Vietnam era (n = 43, 43%) or the post-Vietnam era (n = 49, 45%), but 12 (11%) served during the Persian Gulf era (including Operation Iraqi Freedom and Operation Enduring Freedom). Few received a nonservice connected VA pension (n = 21, 19%) or service-connected disability benefits (n = 20, 18%). The mean income earned in the previous 30 days was $466 (SD = $431). None of these predisposing factors were associated with any service variables.
The sample’s mean VR-12 physical functioning score was 43.8 (SD = 9.1), which was significantly higher (t = 6.2, df = 109, P < .001) than the 38.4 (SD = 12.2) population norm used with the instrument. The sample’s mean mental health functioning score of 39.4 (SD = 14.3) was significantly lower (t = -8.6, df = 109, P < .001) than the population norm (51.1, SD = 11.4).27 Substance-related problems were prevalent, with an identified alcohol problem in 62% (n = 68) and a drug problem in 79% (n = 87) of participants. More than half reported illicit drug use in the past 30 days (n = 61, 56%), especially cocaine (n = 42, 38%) and marijuana (n = 37, 33%).
The majority of veterans (n = 96, 87%) reported using some type of service in the past 12 months (Table 1). Most survey respondents used medical services. About half used psychiatric services, and almost one-third used substance-related services. More veterans used non-VA ED services than used VA ED services. More veterans used VA outpatient medical services than used non-VA outpatient medical services. Examining service sectors indicated that more veterans used VA psychiatric services than used non-VA psychiatric services, especially VA outpatient psychiatric services. More veterans used non-VA substance abuse-related services, especially outpatient services, rather than similar services offered by the VA.
Separate logistic regression models predicted use of psychiatric and substance-abuse services with 3 models (VA, non-VA, or any service use) for each dependent variable from independent variables that reflected need and enabling factors (Tables 2 and 3). Demographic predisposing factors, which were not associated with service use, were not included as covariates in these models. For the model predicting the use of non-VA substance-abuse services, collinearity between the alcohol-abuse and cocaine-abuse variables required separate models for each of the 2 variables.
Medical sector service use predicted psychiatric sector service use in all models. In fact, VA medical service use was the only predictor of use of VA psychiatric services. Lower mental health functioning predicted the use of any (VA or non-VA) psychiatric service use. In addition to the use of medical services, 30-day cocaine use predicted non-VA psychiatric service use.
Any substance-related sector service use was predicted by lower mental health functioning, self-reported alcohol problem, and any medical services utilization. No independent variables included in the model predicted any VA substance-related service use. Non-VA substance abuse service use was predicted by non-VA psychiatric service use and alcohol abuse. In the separate analysis that replaced alcohol problems with 30-day cocaine use variable, only 30-day cocaine use predicted non-VA substance-related service utilization.
Discussion
This study examined the use of medical, psychiatric, and substance-abuse services by randomly sampled veterans from a low-demand emergency shelter. Random selection of the sample and its high (98%) participation rate virtually eliminated potential for bias within this sample. Another strength of this study is its focus on low-demand shelter users—a population that has not been well studied. This low-demand shelter-dwelling population of veterans experiencing homelessness is of interest because more substance-abuse problems and histories of incarceration seem to make them especially disadvantaged and challenged.
The limitation of the sample to users of a low-demand shelter at only 1 location may reduce generalizability to other veteran homeless populations and settings. The study also may not generalize to populations of female veterans experiencing homelessness. Another limitation of the study is that it did not use diagnostic assessments for psychiatric and substance use disorders and objective collateral information such as agency record data. Finally, although the limited size of the sample may have been insufficient to adequately test certain hypotheses, it was a relatively large sample of this population and was large enough to yield significant findings.
This study found that need-based factors predicted the use of some service sectors intended for those needs. For example, mental health functioning appropriately predicted any psychiatric service use, and presence of an alcohol problem appropriately predicted any substance abuse service use. Specifically for non-VA services, both cocaine use and presence of an alcohol problem in separate models predicted substance-abuse service use. However for VA substance-abuse services, neither cocaine use nor presence of an alcohol problem predicted service use. Despite the high need, very few veterans used substance-abuse services, and they rarely used VA substance-abuse services.
For 2 service sectors, need-based factors predicted the use of services intended for other needs. Cocaine use predicted non-VA psychiatric service use, and low mental health functioning predicted substance-abuse service use. One potential explanation for this finding could be that providers or patients incorrectly classified cocaine-related substance use problems as psychiatric. The VR-12 mental health functioning measure also may have incorrectly classified cocaine-related problems as psychiatric.
Three enabling factors predicted service use by sector and type. The first 2 are preference for VA-provided services and the geographic availability of services, which competed for veterans’ selection of service providers. When both VA and non-VA services were present in Fort Worth, a preference for VA-provided services was observed, with the exception of outpatient substance abuse services which were highly underutilized in general. No preference was observed for any non-VA services when both were present. When VA services were not present in Fort Worth, veterans used geographically available non-VA providers for some services, but for other services they used Dallas-based VA and Fort Worth-based non-VA providers equally (Table 3 and Table 4).
The third enabling factor influencing service use was through other service use as an enabling pathway. Those veterans who opted out of locally available services in favor of VA services in Dallas may have been prompted to do so by provider referrals, which were further facilitated by VA and public transportation between Fort Worth and Dallas. The most consistent enabling pathway was medical service use, which predicted all types of psychiatric service use (VA and non-VA combined, VA only, and non-VA only), and any substance-related service use. Psychiatric service use predicted substance abuse service use but only in non-VA settings; no pathways led from VA medical or psychiatric services to VA substance abuse services.
Conclusions
These findings suggest, in large part, the validity of the Andersen and Gelberg models of health care service use. Consistent with prior studies, need-based factors predicted the use of any psychiatric and substance-related sector services as well as the use of non-VA subcomponent services for both sectors. Also consistent with prior studies, enabling factors (medical sector service use) predicted service use, with the exception of VA or non-VA substance-abuse services. Unlike prior studies, however, predisposing factors (eg, age, race, marital status, and income) were not associated with service use.
This study could not determine why veterans underutilized substance-abuse services, even those available locally to them in Fort Worth. One possible barrier to care is that the services are designed or delivered in a manner that does not engage these veterans (eg, expectations regarding abstinence or service involvement). Another barrier could be that referral pathways between VA outpatient medical and psychiatric service providers and VA substance-related services are not sufficiently facilitative. Future investigations could build upon the findings of this study by collecting data that could help assess these potential barriers.
The data from this study suggest 3 opportunities to improve the utilization of services most needed by this population. The first opportunity would be to accurately differentiate between substance abuse and psychiatric problems in clinical assessment and identify the most appropriate type of care. Another opportunity, linked closely to the first, would be to facilitate more effective and efficient referral pathways among VA service sectors, especially from medical and psychiatric services to substance-abuse services. Another strategy to improve referral pathways would be for VA service networks to systematically examine local service systems for factors or processes that may disrupt integrated care and implement program improvements.28 For homeless veterans navigating an inherently complex VA health care system, peer-to-peer and patient navigator programs have helped improve service efficiency and service outcomes.29 The third opportunity to improve utilization of services would be to ensure geographic availability and accessibility by strategic placement of these services.
The results from this study, while informative, point directly to needed areas for further inquiry to inform public health response. Although the low-demand shelter users are a particularly challenging subgroup of veterans experiencing chronic homelessness, other equally challenging populations warrant additional study. For example, veterans outside of both VA and community services (eg, unsheltered populations) are likely to require different approaches to engage in appropriate services. Additionally, changes to the homeless policy implemented in the period after this sample was recruited suggest the need to revisit the service-using behaviors of this population. Finally, interventions developed as part of the national response need to be assessed for their ability to engage these difficult-to-reach veterans.
Acknowledgements
This study was funded by a U.S. Department of Veterans Affairs Office of Academic Affiliations Pre-Doctoral Social Work Research Fellowship award.
1. U.S. Department of Veterans Affairs. Homeless veterans: VA is working to end homelessness among veterans. U.S. Department of Veterans Affairs Website. www.va.gov/homeless/about_the_initiative.asp#one. Updated January 26, 2016. Accessed February 16, 2016.
2. Henry M, Cortes A, Morris S, Abt Associates; U. S. Department of Housing and Urban Development Office of Community Planning and Development. The 2013 Annual Homeless Assessment Report (AHAR) to Congress: Part 1 Point-in-Time Estimates of Homelessness. HUD Exchange Website. https://www.hudexchange.info/resources/documents/ahar-2013-part1.pdf. Published October 2014. Accessed February 16, 2016.
3. U.S. Department of Veterans Affairs. Homeless Veterans: Housing Assistance. U.S. Department of Veterans Affairs Web site. http://www.va.gov/homeless/housing.asp. Updated November 5, 2015. Accessed February 16, 2016.
4. Austin EL, Pollio DE, Holmes S, et al. VA's expansion of supportive housing: successes and challenges on the path to Housing First. Psychiatr Serv. 2014;65(5):641-647.
5. Tsai J, Kasprow WJ, Rosenheck RA. Alcohol and drug use disorders among homeless veterans: prevalence and association with supported housing outcomes. Addict Behav. 2014;39(2):455-460.
6. Wenzel SL, Bakhtiar L, Caskey NH, et al. Homeless veterans utilization of medical, psychiatric, and substance abuse services. Med Care. 1995;33(11):1132-1144.
7. McQuire J, Gelberg L, Blue-Howells J, Rosenheck RA. Access to primary care for homeless veterans with serious mental health illness or substance abuse: a follow-up evaluation of co-located primary care and homeless social services. Adm Policy Ment Health. 2009;36(4):255-264.
8. Tsai J, Mares AS, Rosenheck RA. Do homeless veterans have the same needs and outcomes as non-veterans? Mil Med. 2012;177(1):27-31.
9. Andersen RM. A behavioral model of families use of health services: Research Series No. 25. Chicago, IL: University of Chicago Center for Health Administrative Studies; 1968.
10. Andersen RM. Revisiting the behavioral model and access to medical care: does it matter? J Health Soc Behav. 1995;36(1):1-10.
11. Pollio DE, North CS, Eyrich KM, Foster DA, Spitznagel E. Modeling service access in a homeless population. J Psychoactive Drugs. 2003;35(4):487-495.
12. Gelberg L, Andersen RM, Leake BD. The Behavioral Model for Vulnerable Populations: application to medical care use and outcomes for homeless people. Health Serv Res. 2000;34(6):1273-1302.
13. Padgett D, Struening EL, Andrews H. Factors affecting the use of medical, mental health, alcohol, and drug treatment services by homeless adults. Med Care. 1990;28(9):805-821.
14. Stein JA, Andersen RM, Koegel P, Gelberg L. Predicting health services utilization among homeless adults: a prospective analysis. J Health Care Poor Underserved. 2000;11(2):212-230.
15. Gamache G, Rosenheck RA, Tessler R. Factors predicting choice of provider among homeless veterans with mental illness. Psychiatr Serv. 2000;51(8):1024-1028.
16. Wenzel SL, Audrey Burnam, M, Koegel P, et al. Access to inpatient or residential substance abuse treatment among homeless adults with alcohol or other drug use disorders. Med Care. 2001;39(11):1158-1169.
17. Pollio DE, North CS, Eyrich KM, Foster DA, Spitznagel E. Modeling service access in a homeless population. J Psychoactive Drugs. 2003;35(4):487-495.
18. Solorio MR, Milburn NG, Andersen RM, Trifskin S, Rodríguez MA. Emotional distress and mental health service use among urban homeless adolescents. J Behav Health Serv Res. 2006;33(4):381-393.
19. Stein JA, Andersen RM, Robertson M, Gelberg L. Impact of hepatitis B and C infection on health services utilization in homeless adults: a test of the Gelberg-Anderson Behavioral Model for Vulnerable Populations. Health Psychol. 2012;31(1):20-30.
20. Linton KF, Shafer MS. Factors associated with the health service use of unsheltered, chronically homeless adults. Soc Work Public Health. 2013;29(1):73-80.
21. Petrovich JC, Pollio DE, North CS. Characteristics and service use of homeless veterans and nonveterans residing in a low-demand emergency shelter. Psych Serv. 2014;65(6):751-757.
22. U.S. Census Bureau. State & County Quick Facts: Fort Worth (city), Texas. U.S. Census Bureau Website. http://quickfacts.census.gov/qfd/states/48/4827000.html. Revised December 2, 2015. Accessed February 17, 2016.
23. Tarrant County Homeless Coalition. 2014 point in time count results. Tarrant County Homeless Coalition Website. http://www.ahomewithhope.org/staff/local-data-research/2014-homeless-count/. Accessed February 16, 2016.
24. North CS, Eyrich KM, Pollio DE, Foster DA, Cottler LB, Spitznagel EL. The Homeless Supplement to the Diagnostic Interview Schedule: test-retest analyses. Int J Method Psychiatr Res. 2004;13(3):184-191.
25. Iqbal SU, Rogers W, Selim A, et al. The Veterans RAND 12 Item Health Survey (VR-12): What it is and how it is Used. Washington, DC: Veterans Health Administration; 2009.
26. Fischer J, Corcoran K, eds. Measures for Clinical Practice and Research: A Sourcebook. 4th ed. New York, NY: Oxford University Press; 2013.
27. Selim AJ, Rogers W, Fleishman JA, Qian SX, Finke BG, Rothendler JA, Kazis LE. Updated U.S. population standard for the Veterans RAND 12-Item Health Survey (VR-12). Qual Life Res. 2009;18(1):43-52.
28. Blue-Howells J, McQuire J, Nakashima J. Co-location of health care services for homeless veterans: a case study of innovation in program implementation. Soc Work Health Care. 2008;47(3):219-231.
29. Piette JD, Holtz B, Beard AJ, et al; Ann Arbor PACT Steering Committee. Improving chronic illness care for veterans within the framework of the Patient-Centered Medical Home: experiences from the Ann Arbor Patient-Aligned Care Team Laboratory. Transl Behav Med. 2011;1(4):615-623.
Partial Flexor Tendon Laceration Assessment: Interobserver and Intraobserver Reliability
How to manage complete flexor tendon lacerations in the hand is well documented and a subject of relative agreement among authors. However, treatment of partial flexor tendon lacerations is controversial and lacking clear consensus in the literature. Managing these injuries can be challenging, as clinicians must weigh the diminished tensile strength in the injured tendon and the potential for later complications (eg, entrapment, triggering, rupture) against the negative effects of tenorrhaphy.1 Several studies have found impaired tendon gliding on the basis of bulk and inflammatory reaction secondary to suture material within the flexor sheath as well as decreased tendon strength after tenorrhaphy.2-6 This finding led the investigators to recommend nonsurgical management for partial lacerations up to as much as 95% of the cross-sectional area (CSA) of the tendon. According to a survey by McCarthy and colleagues,7 45% of 591 members of the American Society for Surgery of the Hand (ASSH) indicated they would perform tenorrhaphy for a laceration that involved more than 50% of the tendon.
However, accurate assessment of partial-thickness flexor tendon lacerations is difficult owing to the subjectivity of evaluation. In the survey just mentioned,7 the majority of surgeons used the naked eye to make assessments, and only 14% used other means, such as a ruler, a pair of calipers, or loupe magnification. In addition, flexor tendon injuries are often evaluated under less than ideal circumstances—a dirty or bloody field, poor lighting, an uncomfortable patient.
We conducted a study to determine the interobserver and intraobserver reliability of surgeons assessing the percentage of CSA injured in partially lacerated digital flexor tendons. We hypothesized that participants’ accuracy and agreement would be poor.
Materials and Methods
Eight 1-cm transverse, volar skin incisions were made over the midportions of the middle and proximal phalanges of the index, middle, ring, and small fingers of a fresh-frozen human cadaver hand (Figure 1). The tendon sheaths were incised, and the flexor digitorum profundus tendons to each digit were delivered through the wound. With use of a method described previously by Manning and colleagues,8 the tendon was then placed over a flat metal post to be used as a cutting board, and the proposed laceration site was marked with ink. Under loupe magnification, a No. 15 blade was used to create a partial transverse, volar-to-dorsal laceration in each tendon.8 The goal was to create lacerations of about 30%, 50%, and 70% of the total CSA of the tendon. The tendons were then returned to the wound, and visibility of the marked laceration within the wound was ensured. A similar exercise was performed at the level of the proximal palmar crease. Four flexor digitorum superficialis tendons were exposed through 1-cm transverse incisions, and partial lacerations were made in the volar substance of the tendons. The tendons were then returned to the wound, resulting in 12 partially lacerated tendons (8 flexor digitorum profundus, 4 flexor digitorum superficialis).
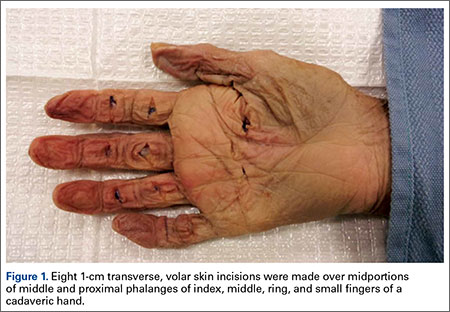
Six orthopedic surgery residents (2 postgraduate year 1 [PGY-1], 2 PGY-3, 2 PGY-5) and 4 fellowship-trained hand surgeons participated in our study. Each was asked to evaluate the tendons and determine the percentage of total CSA lacerated. Loupe magnification and measuring tools were not permitted, but participants were allowed to handle the tendons. In addition, they were asked if they would perform tenorrhaphy on the injured tendons, given only the amount of injury. The participants repeated this exercise 4 weeks later.
After all measurements were made, a longitudinal incision was made down each of the digits, and the flexor tendons were exposed within the flexor sheath. The transverse incisions in the palm were connected to expose the flexor digitorum superficialis tendons. Under an operating microscope, a pair of digital microcalipers (Kobalt 0.5-ft Metric and SAE Caliper; Figure 2) accurate to 0.01 mm was used to measure the external width (a) and height (b + bˈ) of the tendons just proximal to the lacerations. Measurements were made with the caliper blades just touching the edges of the lacerated tendon, thus minimizing deformation of the tendon. Other measurements made at the laceration site were width of the remaining tendon (c) and height of the remaining tendon (bˈ). CSA of the tendon was calculated assuming a regular ellipsoid shape and using the equation:
Area = 1/2π(b+b')
The area of the tendon injured was determined by calculating the area under a parabola and using the equation:
Area = 2/3c[(b+b')-b']
Last, the percentage of total CSA lacerated was calculated using the equation:
Area (total area)
Statistical analysis was performed to determine accuracy and interobserver and intraobserver reliability. Paired t tests were used in the assessment of accuracy to determine if there were differences between estimated and calibrated measurements.

Results
The 10 participants’ estimates differed significantly (P < .0006) from the calibrated measurements, as did residents’ estimates (P < .0025) and fellowship-trained hand surgeons’ estimates (P < .0002). Estimates were scored 1 to 5 on the basis of proximity to calibrated measurements (Table 1). Thus, more accurate estimates received lower scores. Individual estimates were then scored and stratified into groups for comparison. Third-year residents were the most accurate residents, and there was no difference in accuracy between residents and fellowship-trained hand surgeons. These results are listed in Table 2. Once overall and grouped accuracy was analyzed, κ statistics were calculated to compare interobserver and intraobserver reliability. Overall interobserver agreement was poor for both initial readings (κ = 0.16) and secondary readings (κ = 0.16), indicating poor strength of agreement between individuals both initially and secondarily. Table 3 presents the κ interpretations. There was moderate overall intraobserver agreement (45.83%), indicating participants’ secondary estimates agreed with their primary estimates 46% of the time. Fellowship-trained hand surgeons and first-year residents had the highest intraobserver agreement (50.0%). These results are listed in Table 4.


Discussion
Accurate assessment of partial flexor tendon lacerations is difficult and subjective. There is no standardized method for determining the extent of injury, regardless of whether the evaluation is performed in an emergency department or in the operating room. As McCarthy and colleagues7 noted in their survey of ASSH members, naked eye assessment was by far the most popular means of estimating percentage injured in partial lacerations, and only 10% of the survey respondents used intraoperative measuring devices. Our study showed that participants agreed with one another less than 50% of the time when evaluating injuries without the aid of measuring devices. In addition, interobserver agreement in this study was about 50%, highlighting the difficulty in making an accurate and reproducible assessment.
In a study of canine flexor tendons, McCarthy and colleagues9 found calipers are inaccurate as well and do not provide a reliable means of assessing partial flexor tendon lacerations. They compared caliper measurements with laser micrometer measurements, and the differences averaged 29.3%. They suggested that methods for calculating loss of CSA and for creating precise lacerations must be developed in order to evaluate treatments. One such method is the “tenotome,” devised by Hitchcock and colleagues10: A device with standard scalpel blades is used to make uniform lacerations in tendons by leaving a constant area of the tendon intact, regardless of the size or shape of the original tendon. Measurements made with calipers or rulers assume the tendon has a regular ellipsoid shape, but in reality the shape is a double-ellipse, particularly within the flexor sheath.
Dobyns and colleagues11 observed that changes in CSA size can be related to changes in the size of the bundle pattern of the tendon. They found that, on average, the radial bundle comprised about 60% of the total CSA of the tendon. This finding was clarified by Grewal and colleagues.12 Using histologic sections of tendons plus photomicrographs, they determined that, in zone II of the index and small fingers, the ulnar bundle had an area consistently larger than 50% and the radial bundle less than 50% of the total tendon area. In the ring and middle fingers, the areas of both bundles were almost 50% of the total tendon area. The authors suggested that, using this bundle pattern theory of injury, surgeons could more accurately evaluate the extent of injury with the naked eye.
One of the questions that prompted our study is how reliable is the information a surgeon receives regarding a partial flexor tendon injury evaluated by someone else in another setting. What is done with this information is another question. The scenario can be considered in 2 settings: emergency department and operating room.
Given the poor accuracy and interobserver agreement found in our study, along with the inaccuracy of caliper and ruler measurements, it seems decisions to perform tenorrhaphy based on reported percentages lacerated are unreliable. Our results showed that the ability to accurately assess partial tendon injuries does not improve with surgeon experience, as fellowship-trained hand surgeons were not statistically more accurate or consistent than residents. To this effect, one institution treats all its partial flexor tendon lacerations with wound inspection and irrigation in the emergency department, under digital block and after neurovascular injury has been excluded.8 If the patient is able to actively flex and extend the digit without triggering, then the wound is closed without closing the tendon sheath, a dorsal blocking splint is applied, and motion is begun early, 48 hours later, regardless of laceration severity.
Once the decision has been made to go to the operating room and the injury is being evaluated, what should be done with the information from the measurement, whether made with loupe magnification, calipers, rulers, or the naked eye? Surgeons must weigh the risks for triggering, entrapment, and rupture of untreated partial tendon lacerations1 with the added bulk and potential for adhesions, along with the tensile strength reduction that accompanies tendon repair. Both Reynolds and colleagues13 and Ollinger and colleagues14 found tensile strength significantly diminished in sutured tendons. Ollinger and colleagues14 showed a decrease in tendon gliding after surgical exposure and tenorrhaphy for partial tendon lacerations. Reynolds and colleagues13 concluded that surgical repair leads to poorer results than nonsurgical treatment.
Clinical studies have demonstrated excellent results with nonintervention, and in vivo and in vitro studies have indicated that early motion can be initiated in partial lacerations of up to 95% of total CSA. Wray and Weeks6 treated 26 patients with partial lacerations varying from 25% to 95% of total CSA and noted 1 incidence of trigger finger (which resolved) and no late ruptures. They advocated treatment with early motion and excision or repair of beveled partial lacerations with simple sutures. Stahl and colleagues2 reported comparable outcomes in children with partial lacerations up to 75% of total CSA treated with and without surgery and noted no complications in either group. In a biomechanical study, Hariharan and colleagues4 found lacerations up to 75% can withstand forces associated with active unresisted mobilization.
Conversely, how many patients or surgeons want to return to the operating room to fix a late rupture when it could have been repaired in the primary setting? Schlenker and colleagues,1 reporting on a late flexor pollicus tendon rupture that required tendon grafting, recommended exploration and primary repair of all partial flexor tendon lacerations. Often, it is difficult to determine whether surgical repair is necessary to ensure the best outcome for the patient.
Our study results showed that, in the evaluation of flexor tendon lacerations, both accuracy and interobserver agreement were poor among residents and fellowship-trained hand surgeons, and intraobserver agreement was moderate. Third-year residents were the most accurate residents, and there was no difference in accuracy between residents and fellowship-trained hand surgeons. Our results highlight the difficulty in making accurate assessments of flexor tendon lacerations owing to the subjectivity of evaluation, which appear not to improve with surgeon experience.
1. Schlenker JD, Lister GD, Kleinert HE. Three complications of untreated partial laceration of flexor tendon—entrapment, rupture, and triggering. J Hand Surg Am. 1981;6(4):392-398.
2. Stahl S, Kaufman T, Bialik V. Partial lacerations of flexor tendons in children. Primary repair versus conservative treatment. J Hand Surg Br. 1997;22(3):377-380.
3. Al-Qattan MM. Conservative management of zone II partial flexor tendon lacerations greater than half the width of the tendon. J Hand Surg Am. 2000;25(6):1118-1121.
4. Hariharan JS, Diao E, Soejima O, Lotz JC. Partial lacerations of human digital flexor tendons: a biomechanical analysis. J Hand Surg Am. 1997;22(6):1011-1015.
5. Bishop AT, Cooney WP 3rd, Wood MB. Treatment of partial flexor tendon lacerations: the effect of tenorrhaphy and early protected mobilization. J Trauma. 1986;26(4):301-312.
6. Wray RC Jr, Weeks PM. Treatment of partial tendon lacerations. Hand. 1980;12(2):163-166.
7. McCarthy DM, Boardman ND 3rd, Tramaglini DM, Sotereanos DG, Herndon JH. Clinical management of partially lacerated digital flexor tendons: a survey of hand surgeons. J Hand Surg Am. 1995;20(2):273-275.
8. Manning DW, Spiguel AR, Mass DP. Biomechanical analysis of partial flexor tendon lacerations in zone II of human cadavers. J Hand Surg Am. 2010;35(1):11-18.
9. McCarthy DM, Tramaglini DM, Chan SS, Schmidt CC, Sotereanos DG, Herndon JH. Effect of partial laceration on the structural properties of the canine FDP tendon: an in vitro study. J Hand Surg Am. 1995;20(5):795-800.
10. Hitchcock TF, Candel AG, Light TR, Blevens AD. New technique for producing uniform partial lacerations of tendons. J Orthop Res. 1989;7(3):451-455.
11. Dobyns RC, Cooney WC, Wood MB. Effect of partial lacerations on canine flexor tendons. Minn Med. 1982;65(1):27-32.
12. Grewal R, Sotereanos DG, Rao U, Herndon JH, Woo SL. Bundle pattern of the flexor digitorum profundus tendon in zone II of the hand: a quantitative assessment of the size of a laceration. J Hand Surg Am. 1996;21(6):978-983.
13. Reynolds B, Wray RC Jr, Weeks PM. Should an incompletely severed tendon be sutured? Plast Reconstr Surg. 1976;57(1):36-38.
14. Ollinger H, Wray RC Jr, Weeks PM. Effects of suture on tensile strength gain of partially and completely severed tendons. Surg Forum. 1975;26:63-64.
How to manage complete flexor tendon lacerations in the hand is well documented and a subject of relative agreement among authors. However, treatment of partial flexor tendon lacerations is controversial and lacking clear consensus in the literature. Managing these injuries can be challenging, as clinicians must weigh the diminished tensile strength in the injured tendon and the potential for later complications (eg, entrapment, triggering, rupture) against the negative effects of tenorrhaphy.1 Several studies have found impaired tendon gliding on the basis of bulk and inflammatory reaction secondary to suture material within the flexor sheath as well as decreased tendon strength after tenorrhaphy.2-6 This finding led the investigators to recommend nonsurgical management for partial lacerations up to as much as 95% of the cross-sectional area (CSA) of the tendon. According to a survey by McCarthy and colleagues,7 45% of 591 members of the American Society for Surgery of the Hand (ASSH) indicated they would perform tenorrhaphy for a laceration that involved more than 50% of the tendon.
However, accurate assessment of partial-thickness flexor tendon lacerations is difficult owing to the subjectivity of evaluation. In the survey just mentioned,7 the majority of surgeons used the naked eye to make assessments, and only 14% used other means, such as a ruler, a pair of calipers, or loupe magnification. In addition, flexor tendon injuries are often evaluated under less than ideal circumstances—a dirty or bloody field, poor lighting, an uncomfortable patient.
We conducted a study to determine the interobserver and intraobserver reliability of surgeons assessing the percentage of CSA injured in partially lacerated digital flexor tendons. We hypothesized that participants’ accuracy and agreement would be poor.
Materials and Methods
Eight 1-cm transverse, volar skin incisions were made over the midportions of the middle and proximal phalanges of the index, middle, ring, and small fingers of a fresh-frozen human cadaver hand (Figure 1). The tendon sheaths were incised, and the flexor digitorum profundus tendons to each digit were delivered through the wound. With use of a method described previously by Manning and colleagues,8 the tendon was then placed over a flat metal post to be used as a cutting board, and the proposed laceration site was marked with ink. Under loupe magnification, a No. 15 blade was used to create a partial transverse, volar-to-dorsal laceration in each tendon.8 The goal was to create lacerations of about 30%, 50%, and 70% of the total CSA of the tendon. The tendons were then returned to the wound, and visibility of the marked laceration within the wound was ensured. A similar exercise was performed at the level of the proximal palmar crease. Four flexor digitorum superficialis tendons were exposed through 1-cm transverse incisions, and partial lacerations were made in the volar substance of the tendons. The tendons were then returned to the wound, resulting in 12 partially lacerated tendons (8 flexor digitorum profundus, 4 flexor digitorum superficialis).
Six orthopedic surgery residents (2 postgraduate year 1 [PGY-1], 2 PGY-3, 2 PGY-5) and 4 fellowship-trained hand surgeons participated in our study. Each was asked to evaluate the tendons and determine the percentage of total CSA lacerated. Loupe magnification and measuring tools were not permitted, but participants were allowed to handle the tendons. In addition, they were asked if they would perform tenorrhaphy on the injured tendons, given only the amount of injury. The participants repeated this exercise 4 weeks later.
After all measurements were made, a longitudinal incision was made down each of the digits, and the flexor tendons were exposed within the flexor sheath. The transverse incisions in the palm were connected to expose the flexor digitorum superficialis tendons. Under an operating microscope, a pair of digital microcalipers (Kobalt 0.5-ft Metric and SAE Caliper; Figure 2) accurate to 0.01 mm was used to measure the external width (a) and height (b + bˈ) of the tendons just proximal to the lacerations. Measurements were made with the caliper blades just touching the edges of the lacerated tendon, thus minimizing deformation of the tendon. Other measurements made at the laceration site were width of the remaining tendon (c) and height of the remaining tendon (bˈ). CSA of the tendon was calculated assuming a regular ellipsoid shape and using the equation:
Area = 1/2π(b+b')
The area of the tendon injured was determined by calculating the area under a parabola and using the equation:
Area = 2/3c[(b+b')-b']
Last, the percentage of total CSA lacerated was calculated using the equation:
Area (total area)
Statistical analysis was performed to determine accuracy and interobserver and intraobserver reliability. Paired t tests were used in the assessment of accuracy to determine if there were differences between estimated and calibrated measurements.
Results
The 10 participants’ estimates differed significantly (P < .0006) from the calibrated measurements, as did residents’ estimates (P < .0025) and fellowship-trained hand surgeons’ estimates (P < .0002). Estimates were scored 1 to 5 on the basis of proximity to calibrated measurements (Table 1). Thus, more accurate estimates received lower scores. Individual estimates were then scored and stratified into groups for comparison. Third-year residents were the most accurate residents, and there was no difference in accuracy between residents and fellowship-trained hand surgeons. These results are listed in Table 2. Once overall and grouped accuracy was analyzed, κ statistics were calculated to compare interobserver and intraobserver reliability. Overall interobserver agreement was poor for both initial readings (κ = 0.16) and secondary readings (κ = 0.16), indicating poor strength of agreement between individuals both initially and secondarily. Table 3 presents the κ interpretations. There was moderate overall intraobserver agreement (45.83%), indicating participants’ secondary estimates agreed with their primary estimates 46% of the time. Fellowship-trained hand surgeons and first-year residents had the highest intraobserver agreement (50.0%). These results are listed in Table 4.
Discussion
Accurate assessment of partial flexor tendon lacerations is difficult and subjective. There is no standardized method for determining the extent of injury, regardless of whether the evaluation is performed in an emergency department or in the operating room. As McCarthy and colleagues7 noted in their survey of ASSH members, naked eye assessment was by far the most popular means of estimating percentage injured in partial lacerations, and only 10% of the survey respondents used intraoperative measuring devices. Our study showed that participants agreed with one another less than 50% of the time when evaluating injuries without the aid of measuring devices. In addition, interobserver agreement in this study was about 50%, highlighting the difficulty in making an accurate and reproducible assessment.
In a study of canine flexor tendons, McCarthy and colleagues9 found calipers are inaccurate as well and do not provide a reliable means of assessing partial flexor tendon lacerations. They compared caliper measurements with laser micrometer measurements, and the differences averaged 29.3%. They suggested that methods for calculating loss of CSA and for creating precise lacerations must be developed in order to evaluate treatments. One such method is the “tenotome,” devised by Hitchcock and colleagues10: A device with standard scalpel blades is used to make uniform lacerations in tendons by leaving a constant area of the tendon intact, regardless of the size or shape of the original tendon. Measurements made with calipers or rulers assume the tendon has a regular ellipsoid shape, but in reality the shape is a double-ellipse, particularly within the flexor sheath.
Dobyns and colleagues11 observed that changes in CSA size can be related to changes in the size of the bundle pattern of the tendon. They found that, on average, the radial bundle comprised about 60% of the total CSA of the tendon. This finding was clarified by Grewal and colleagues.12 Using histologic sections of tendons plus photomicrographs, they determined that, in zone II of the index and small fingers, the ulnar bundle had an area consistently larger than 50% and the radial bundle less than 50% of the total tendon area. In the ring and middle fingers, the areas of both bundles were almost 50% of the total tendon area. The authors suggested that, using this bundle pattern theory of injury, surgeons could more accurately evaluate the extent of injury with the naked eye.
One of the questions that prompted our study is how reliable is the information a surgeon receives regarding a partial flexor tendon injury evaluated by someone else in another setting. What is done with this information is another question. The scenario can be considered in 2 settings: emergency department and operating room.
Given the poor accuracy and interobserver agreement found in our study, along with the inaccuracy of caliper and ruler measurements, it seems decisions to perform tenorrhaphy based on reported percentages lacerated are unreliable. Our results showed that the ability to accurately assess partial tendon injuries does not improve with surgeon experience, as fellowship-trained hand surgeons were not statistically more accurate or consistent than residents. To this effect, one institution treats all its partial flexor tendon lacerations with wound inspection and irrigation in the emergency department, under digital block and after neurovascular injury has been excluded.8 If the patient is able to actively flex and extend the digit without triggering, then the wound is closed without closing the tendon sheath, a dorsal blocking splint is applied, and motion is begun early, 48 hours later, regardless of laceration severity.
Once the decision has been made to go to the operating room and the injury is being evaluated, what should be done with the information from the measurement, whether made with loupe magnification, calipers, rulers, or the naked eye? Surgeons must weigh the risks for triggering, entrapment, and rupture of untreated partial tendon lacerations1 with the added bulk and potential for adhesions, along with the tensile strength reduction that accompanies tendon repair. Both Reynolds and colleagues13 and Ollinger and colleagues14 found tensile strength significantly diminished in sutured tendons. Ollinger and colleagues14 showed a decrease in tendon gliding after surgical exposure and tenorrhaphy for partial tendon lacerations. Reynolds and colleagues13 concluded that surgical repair leads to poorer results than nonsurgical treatment.
Clinical studies have demonstrated excellent results with nonintervention, and in vivo and in vitro studies have indicated that early motion can be initiated in partial lacerations of up to 95% of total CSA. Wray and Weeks6 treated 26 patients with partial lacerations varying from 25% to 95% of total CSA and noted 1 incidence of trigger finger (which resolved) and no late ruptures. They advocated treatment with early motion and excision or repair of beveled partial lacerations with simple sutures. Stahl and colleagues2 reported comparable outcomes in children with partial lacerations up to 75% of total CSA treated with and without surgery and noted no complications in either group. In a biomechanical study, Hariharan and colleagues4 found lacerations up to 75% can withstand forces associated with active unresisted mobilization.
Conversely, how many patients or surgeons want to return to the operating room to fix a late rupture when it could have been repaired in the primary setting? Schlenker and colleagues,1 reporting on a late flexor pollicus tendon rupture that required tendon grafting, recommended exploration and primary repair of all partial flexor tendon lacerations. Often, it is difficult to determine whether surgical repair is necessary to ensure the best outcome for the patient.
Our study results showed that, in the evaluation of flexor tendon lacerations, both accuracy and interobserver agreement were poor among residents and fellowship-trained hand surgeons, and intraobserver agreement was moderate. Third-year residents were the most accurate residents, and there was no difference in accuracy between residents and fellowship-trained hand surgeons. Our results highlight the difficulty in making accurate assessments of flexor tendon lacerations owing to the subjectivity of evaluation, which appear not to improve with surgeon experience.
1. Schlenker JD, Lister GD, Kleinert HE. Three complications of untreated partial laceration of flexor tendon—entrapment, rupture, and triggering. J Hand Surg Am. 1981;6(4):392-398.
2. Stahl S, Kaufman T, Bialik V. Partial lacerations of flexor tendons in children. Primary repair versus conservative treatment. J Hand Surg Br. 1997;22(3):377-380.
3. Al-Qattan MM. Conservative management of zone II partial flexor tendon lacerations greater than half the width of the tendon. J Hand Surg Am. 2000;25(6):1118-1121.
4. Hariharan JS, Diao E, Soejima O, Lotz JC. Partial lacerations of human digital flexor tendons: a biomechanical analysis. J Hand Surg Am. 1997;22(6):1011-1015.
5. Bishop AT, Cooney WP 3rd, Wood MB. Treatment of partial flexor tendon lacerations: the effect of tenorrhaphy and early protected mobilization. J Trauma. 1986;26(4):301-312.
6. Wray RC Jr, Weeks PM. Treatment of partial tendon lacerations. Hand. 1980;12(2):163-166.
7. McCarthy DM, Boardman ND 3rd, Tramaglini DM, Sotereanos DG, Herndon JH. Clinical management of partially lacerated digital flexor tendons: a survey of hand surgeons. J Hand Surg Am. 1995;20(2):273-275.
8. Manning DW, Spiguel AR, Mass DP. Biomechanical analysis of partial flexor tendon lacerations in zone II of human cadavers. J Hand Surg Am. 2010;35(1):11-18.
9. McCarthy DM, Tramaglini DM, Chan SS, Schmidt CC, Sotereanos DG, Herndon JH. Effect of partial laceration on the structural properties of the canine FDP tendon: an in vitro study. J Hand Surg Am. 1995;20(5):795-800.
10. Hitchcock TF, Candel AG, Light TR, Blevens AD. New technique for producing uniform partial lacerations of tendons. J Orthop Res. 1989;7(3):451-455.
11. Dobyns RC, Cooney WC, Wood MB. Effect of partial lacerations on canine flexor tendons. Minn Med. 1982;65(1):27-32.
12. Grewal R, Sotereanos DG, Rao U, Herndon JH, Woo SL. Bundle pattern of the flexor digitorum profundus tendon in zone II of the hand: a quantitative assessment of the size of a laceration. J Hand Surg Am. 1996;21(6):978-983.
13. Reynolds B, Wray RC Jr, Weeks PM. Should an incompletely severed tendon be sutured? Plast Reconstr Surg. 1976;57(1):36-38.
14. Ollinger H, Wray RC Jr, Weeks PM. Effects of suture on tensile strength gain of partially and completely severed tendons. Surg Forum. 1975;26:63-64.

Technical Errors May Affect Accuracy of Torque Limiter in Locking Plate Osteosynthesis
Proper surgical technique must be used to ensure that surgical fracture management is long-lasting. Plate implantation and screw implantation are among the most common orthopedic procedures performed. Plate and screw osteosynthesis can be done with nonlocking or locking plate and screw constructs or with hybrid fixation that incorporates both methods.
Nonlocking plate and screw osteosynthesis uses friction-fit for fixation. In osteoporotic bone, less torque is generated because of poor bone quality, and thus less friction force between plate and bone.1,2 Locked plating has dramatically changed fracture management, especially in frail and comminuted osteoporotic bone, with significant advantages over conventional plating.3-7
Development of locked plating systems, including the Less Invasive Stabilization System (LISS; DePuy Synthes) with its soft-tissue and fracture-fragment preservation, has changed treatment of distal femur and proximal tibia fractures. Cole and colleagues8 reported stable fixation and union in 97% of their patients. The LISS system proved to be stable, but there were cases of implant removal difficulty with this titanium construct. In 1 of the 10 cases in which the LISS plate was removed, 4 of the 11 locking screws were welded to the plate.8
Cold welding, in which similar metals are chemically bonded together under extreme pressure, is a complication associated with use of titanium-only plates and screws.9 This process, which is more likely to happen if cross-threading occurs within the screw–plate interface, can make screw removal extremely difficult. Screw removal difficulty strips screw heads, and often the surgeon must use either metal cutting instruments or trephines to remove screw remnants, which often results in retained implant or debris and damage or necrosis to surrounding bone.9,10
Locking screws are often inserted under power with a torque-limiting device attached to the drill mechanism to reduce the risk of lock screw overtightening and to try to prevent difficult implant removal. Although standard practice is to insert the screw and stop just before screw head engagement, with final tightening with a torque limiter and hand power, final tightening is often inadvertently done under power.3 Most technique guides instruct surgeons how to insert screws under power while using a torque limiter, but the exact technique is not emphasized.
We conducted a study to determine if rotational speed of screw insertion affects maximum torque on screw with use of a torque limiter. We describe proper use of a torque limiter as well as possible pitfalls. We hypothesized that improper use would result in substantially higher than expected insertion torque.
Materials and Methods
Torque-Limiting Attachments, Torque Wrench, and Drill
The Small Fragment Locking Compression Plate System (Synthes) includes a 1.5-Nm torque-limiting attachment and quick-coupling wooden handles and Star Drive attachments. All devices in this study were in active use at 6 urban institutions (3 level I trauma centers, 2 level II trauma centers, 1 level III hospital). Permission to obtain and test each device was granted by each institution.
A 0.25-inch dial torque wrench (751LDIN; CDI Torque Products) was purchased through an established distributor. The manufacturer includes a traceable certificate of accuracy to verify correct calibration. The torque wrench has a torque range of 0 to 9 Nm with visual increment demarcations of 0.2 Nm and a memory needle to retain maximum torque measurement. The same torque wrench was used in each experiment in order to maintain consistent measurements between devices. It was reset to zero after each use.
This study used a 0.5-inch, 19.2-V lithium drill (Craftsman C3) with 2 speed options: 0 to 440 rpm high torque and 0 to 1600 rpm high speed. This device provides variable torque output with a maximum output of 38.4 Nm. For this study, all measurements were done with the device on its high torque setting.
Maximum Torque Determination for Different Scenarios
Each torque limiter was evaluated for variations in maximum torque under 4 different scenarios. In each scenario, the torque limiter was coupled to the Star Drive attachment and then to that scenario’s rotating force. The completed system was then inserted into the torque wrench, which was secured to a flat working surface and rotated in accordance with each scenario; maximum torque was measured and recorded (Figures 1, 2). A torque-limiting event was defined as a single audible click on the torque limiter.
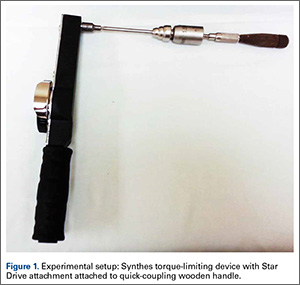
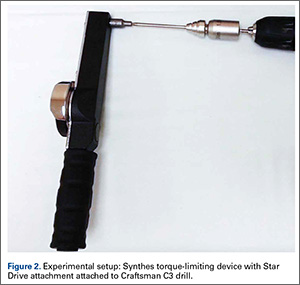
In scenario 1, each torque-limiting attachment system was attached to a quick-coupling wooden handle. The completed system was then rotated at controlled low velocity under hand power until 1 torque-limiting event occurred. This scenario was also used as an internal control to verify that the torque limiters were calibrated correctly.
In Scenario 2, the device was again attached to a quick-coupling wooden handle. The completed system was rotated at high velocity under hand power until multiple torque-limiting events occurred in a row. High velocity was defined as the operator freely rotating the wooden handle in a single action with full power resulting in multiple torque-limiting events.
In Scenario 3, the device was attached to a power drill braced to the flat working surface and rotated at low velocity under power until 1 torque-limiting event occurred.
In Scenario 4, the device was again attached to a power drill braced to the flat working surface. The completed system was rotated at high velocity under power until multiple torque-limiting events occurred.
After each trial, we recorded maximum torque achieved before each device’s torque-limiting event. Either an orthopedic surgery resident or a qualified medical student tested each torque-limiting device in each standardized testing scenario.
Statistical Analysis
Experiments for each torque limiter were repeated for 3 trials of each of the 4 different scenarios. For comparative statistics between experiments, maximum torque measurements were expressed as means and SDs; 95% confidence interval (95% CI) was calculated and reported to determine extent of variation within a single group. One-way analysis of variance (ANOVA) and Tukey post hoc tests were performed between groups for comparison of the normally distributed data. Significance was set at P ≤ .05.
Results
During simulation, we successfully measured maximum torque achieved with each torque limiter under the 4 different scenarios. All testing was done by 2 operators. ANOVA demonstrated significant (P ≤ .001) differences in torque among the scenarios.
In scenario 1, mean (SD) maximum torque under hand power at low velocity was 1.49 (0.15) Nm (95% CI, 1.43-1.55), near the advertised maximum torque of 1.5 Nm, with relatively minimal variation between devices. This scenario confirmed proper calibration of properly used torque limiters. Mean maximum torque ranged from 1.25 to 1.93 Nm.
In scenario 2, mean (SD) maximum torque under hand power at high velocity was 3.73 (0.79) Nm (95% CI, 3.33-4.13), a 2.5-fold increase compared with scenario 1 (P < .0001) (Figure 3). There also was an increase in variation of maximum torque between trials of individual devices and between different devices. Mean maximum torque ranged from 2.27 to 5.53 Nm.
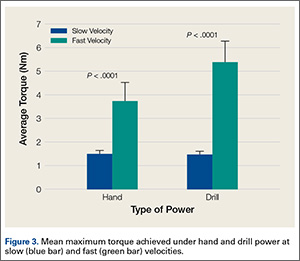
In scenario 3, mean (SD) maximum torque under drill power at controlled low velocity was 1.47 (0.14) Nm (95% CI, 1.37-1.56), again near the advertised maximum torque of 1.5 Nm, with relatively minimal variation. Mean maximum torque ranged from 1.10 to 1.73 Nm.
In scenario 4, mean (SD) maximum torque under drill power at full power/high velocity was 5.37 (0.90) Nm (95% CI, 4.92-5.83), a 3.65-fold increase compared with scenario 3 (P < .0001) (Figure 3). Mean maximum torque measured in 3 tests ranged from 3.40 to 6.92 Nm.
There was no significant difference in mean maximum torque between the scenarios of hand power at low velocity and drill power at low velocities (P = .999) (Figure 4). Highest maximum torque from any device was 9.0 Nm (drill at full power). Results are summarized in the Table. There was no statistical significance in the test between the 2 test operators.
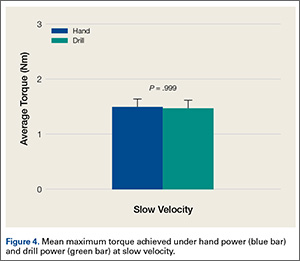
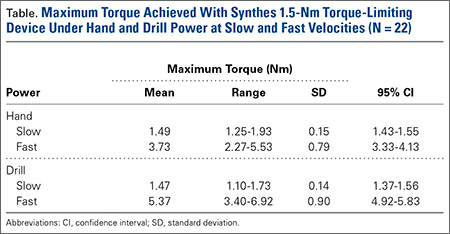
Discussion
Maximum torque was measured using a torque-limiting attachment under 4 different simulated scenarios. Our goals were to determine if varying practice and rotational velocity would affect maximum insertional torque and to measure consistency among torque limiters. We designed the scenarios to mimic practice patterns, including hand insertion and power insertion of locking screws. Results demonstrated that misuse of a torque-limiting device may inadvertently produce insertional torque substantially higher than recommended. Highest maximum torque was 9.0 Nm, which is 6.0-fold higher than expected for a locking screw using a 1.5-Nm torque limiter.
Our study results showed that insertion under controlled hand power (and low-velocity drill power) until 1 torque-limiting event occurred produced the most consistent and predictable results. Insertion under drill power or high-velocity hand power produced multiple sequential torque-limiting events, yielding inaccurate insertion torque. Low-velocity insertion under hand power, or carefully controlled drill power, consistently produced torque similar to advertised values.
Manufacturers’ technique guides are available for proximal humerus locking compression plate (LCP) systems, small-fragment LCP systems, the Proximal Humeral Interlocking System (PHILOS; DePuy Synthes), and the LISS. These technique guides clearly state that insertion can be performed under power. Only the PHILOS and LISS guides state that insertion should be performed under power until a single click is heard or that final tightening should be completed under hand power. The proximal humerus LCP guide states that surgeons should insert the locking screw under power until the torque-limiting device clicks. The small-fragment LCP guide states that insertion under power should always be completed with the torque-limiting attachment; there is no mention of reducing power or a single click (this may give the surgeon a false sense of security).
Screw overtightening and head/thread stripping can make screw removal challenging.10 Removal rates for LISS plates range from 8% to 26%, and removal is often reported as taking longer than the index procedure, with complication rates as high as 47%.11-13 Bae and colleagues3 reported significant difficulty in removing 24 of 279 self-tapping locking screws (3.5 mm).
It is important to note that these complications, most notably cold welding, are mostly associated with titanium locking plate and screw constructs. Although stainless steel constructs have gained favor, titanium constructs are still widely used around the world.14,15
In 10% of cases in a laboratory setting, insertion of a 3.5-mm locking screw at 4 to 6 Nm damaged the screw.9 Removal of 3.5-mm locking screws had a stripping rate of 8.6%, and use of the torque limiter did not make removal easy all the time.3 Torque limiters are set specific to each screw diameter to reduce the risk of damage/stripping or even overtightening. Even when a surgeon intends to stop a drill before locking, final tightening often inadvertently occurs under power.3
Cold welding is often described as a cause of difficult implant removal.3,12 According to a newer definition, this process is independent of temperature and can occur when 2 metallic surfaces are in direct contact.16 High contact pressures between 2 similar metals can lead to this solid state welding.17 Theoretically, improper use of torque limiters can increase the risk of welding; however, it appears to be associated only with titanium locking plate and screw constructs.
Locked plating osteosynthesis is a valuable tool for fracture management, but improper use can have significant consequences, including morbid implant removal procedures, which are more difficult and time-consuming than the index surgery. We determined that proper use of torque limiters involves insertion under hand or power control at slow velocity until 1 torque-limiting event occurs. Many orthopedic surgeons may assume that torque limiters are accurate no matter how screws are inserted into locking plates. In addition, they may be unaware guidelines exist, as these are often deeply embedded within text. Therefore, we must emphasize that torque limiters can be inaccurate when used improperly.
One limitation of this study is that it tested only the Synthes 1.5-Nm torque-limiting attachment, though we can speculate that torque limiters designed for larger screws and limiters manufactured by different companies will behave similarly. Another limitation is that we did not obtain the hospitals’ service records for the tested equipment and assumed the equipment was properly checked for accuracy by the providing company. However, we hypothesized that, if maintenance were an issue, then our results would not be similar across all sites tested.
These tests involved a torque limiter linked to a torque-measuring device and may not perfectly represent actual torque measured at the locked screw–thread interface. However, we think our construct accurately determines the torque produced at the level of the driver tip. Also, we can speculate that the torque produced with improper use will lead to the complications mentioned and demonstrated in previous studies. Welding of the screw–plate interface may simply be a result of improper trajectory and cross-threading. However, if we assume that torque limiters prevent excessive torque no matter how they are used, high insertion speeds may compound the effect of welding. Additional biomechanical studies with full locked plate osteosynthesis constructs on bone specimens are planned to further characterize the potential complications of this issue.
1. Sommer C, Babst R, Müller M, Hanson B. Locking compression plate loosening and plate breakage: a report of four cases. J Orthop Trauma. 2004;18(8):571-577.
2. Schütz M, Südkamp NP. Revolution in plate osteosynthesis: new internal fixator systems. J Orthop Sci. 2003;8(2):252-258.
3. Bae JH, Oh JK, Oh CW, Hur CR. Technical difficulties of removal of locking screw after locking compression plating. Arch Orthop Trauma Surg. 2009;129(1):91-95.
4. Frigg R. Locking compression plate (LCP). An osteosynthesis plate based on the dynamic compression plate and the point contact fixator (PC-Fix). Injury. 2001;32(suppl 2):63-66.
5. Frigg R. Development of the locking compression plate. Injury. 2003;34(suppl 2):B6-B10.
6. Korner J, Lill H, Müller LP, Rommens PM, Schneider E, Linke B. The LCP-concept in the operative treatment of distal humerus fractures—biological, biomechanical and surgical aspects. Injury. 2003;34(suppl 2):B20-B30.
7. Egol KA, Kubiak EN, Fulkerson E, Kummer FJ, Koval KJ. Biomechanics of locked plates and screws. J Orthop Trauma. 2004;18(8):488-493.
8. Cole PA, Zlowodzki M, Kregor PJ. Treatment of proximal tibia fractures using the Less Invasive Stabilization System: surgical experience and early clinical results in 77 fractures. J Orthop Trauma. 2004;18(8):528-535.
9. Ehlinger M, Adam P, Simon P, Bonnomet F. Technical difficulties in hardware removal in titanium compression plates with locking screws. Orthop Traumatol Surg Res. 2009;95(5):373-376.
10. Gopinathan NR, Dhillon MS, Kumar R. Surgical technique: simple technique for removing a locking recon plate with damaged screw heads. Clin Orthop Relat Res. 2013;471(5):1572-1575.
11. Pattison G, Reynolds J, Hardy J. Salvaging a stripped drive connection when removing screws. Injury. 1999;30(1):74-75.
12. Raja S, Imbuldeniya AM, Garg S, Groom G. Difficulties encountered removing locked plates. Ann R Coll Surg Engl. 2012;94(7):502-505.
13. Kumar G, Dunlop C. Case report: a technique to remove a jammed locking screw from a locking plate. Clin Orthop Relat Res. 2011;469(2):613-616.
14. Disegi JA. Titanium alloys for fracture fixation implants. Injury. 2000;31(suppl 4):14-17.
15. El-Zayat BF, Ruchholtz S, Efe T, Paletta J, Kreslo D, Zettl R. Results of titanium locking plate and stainless steel cerclage wire combination in femoral fractures. Indian J Orthop. 2013;47(5):454-458.
16. Van Nortwick SS, Yao J, Ladd AL. Titanium integration with bone, welding, and screw head destruction complicating hardware removal of the distal radius: report of 2 cases. J Hand Surg. 2012;37(7):1388-1392.
17. Ferguson GS, Chaudhury MK, Sigal GB, Whitesides GM. Contact adhesion of thin gold films on elastomeric supports: cold welding under ambient conditions. Science. 1991;253(5021):776-778.
Proper surgical technique must be used to ensure that surgical fracture management is long-lasting. Plate implantation and screw implantation are among the most common orthopedic procedures performed. Plate and screw osteosynthesis can be done with nonlocking or locking plate and screw constructs or with hybrid fixation that incorporates both methods.
Nonlocking plate and screw osteosynthesis uses friction-fit for fixation. In osteoporotic bone, less torque is generated because of poor bone quality, and thus less friction force between plate and bone.1,2 Locked plating has dramatically changed fracture management, especially in frail and comminuted osteoporotic bone, with significant advantages over conventional plating.3-7
Development of locked plating systems, including the Less Invasive Stabilization System (LISS; DePuy Synthes) with its soft-tissue and fracture-fragment preservation, has changed treatment of distal femur and proximal tibia fractures. Cole and colleagues8 reported stable fixation and union in 97% of their patients. The LISS system proved to be stable, but there were cases of implant removal difficulty with this titanium construct. In 1 of the 10 cases in which the LISS plate was removed, 4 of the 11 locking screws were welded to the plate.8
Cold welding, in which similar metals are chemically bonded together under extreme pressure, is a complication associated with use of titanium-only plates and screws.9 This process, which is more likely to happen if cross-threading occurs within the screw–plate interface, can make screw removal extremely difficult. Screw removal difficulty strips screw heads, and often the surgeon must use either metal cutting instruments or trephines to remove screw remnants, which often results in retained implant or debris and damage or necrosis to surrounding bone.9,10
Locking screws are often inserted under power with a torque-limiting device attached to the drill mechanism to reduce the risk of lock screw overtightening and to try to prevent difficult implant removal. Although standard practice is to insert the screw and stop just before screw head engagement, with final tightening with a torque limiter and hand power, final tightening is often inadvertently done under power.3 Most technique guides instruct surgeons how to insert screws under power while using a torque limiter, but the exact technique is not emphasized.
We conducted a study to determine if rotational speed of screw insertion affects maximum torque on screw with use of a torque limiter. We describe proper use of a torque limiter as well as possible pitfalls. We hypothesized that improper use would result in substantially higher than expected insertion torque.
Materials and Methods
Torque-Limiting Attachments, Torque Wrench, and Drill
The Small Fragment Locking Compression Plate System (Synthes) includes a 1.5-Nm torque-limiting attachment and quick-coupling wooden handles and Star Drive attachments. All devices in this study were in active use at 6 urban institutions (3 level I trauma centers, 2 level II trauma centers, 1 level III hospital). Permission to obtain and test each device was granted by each institution.
A 0.25-inch dial torque wrench (751LDIN; CDI Torque Products) was purchased through an established distributor. The manufacturer includes a traceable certificate of accuracy to verify correct calibration. The torque wrench has a torque range of 0 to 9 Nm with visual increment demarcations of 0.2 Nm and a memory needle to retain maximum torque measurement. The same torque wrench was used in each experiment in order to maintain consistent measurements between devices. It was reset to zero after each use.
This study used a 0.5-inch, 19.2-V lithium drill (Craftsman C3) with 2 speed options: 0 to 440 rpm high torque and 0 to 1600 rpm high speed. This device provides variable torque output with a maximum output of 38.4 Nm. For this study, all measurements were done with the device on its high torque setting.
Maximum Torque Determination for Different Scenarios
Each torque limiter was evaluated for variations in maximum torque under 4 different scenarios. In each scenario, the torque limiter was coupled to the Star Drive attachment and then to that scenario’s rotating force. The completed system was then inserted into the torque wrench, which was secured to a flat working surface and rotated in accordance with each scenario; maximum torque was measured and recorded (Figures 1, 2). A torque-limiting event was defined as a single audible click on the torque limiter.
In scenario 1, each torque-limiting attachment system was attached to a quick-coupling wooden handle. The completed system was then rotated at controlled low velocity under hand power until 1 torque-limiting event occurred. This scenario was also used as an internal control to verify that the torque limiters were calibrated correctly.
In Scenario 2, the device was again attached to a quick-coupling wooden handle. The completed system was rotated at high velocity under hand power until multiple torque-limiting events occurred in a row. High velocity was defined as the operator freely rotating the wooden handle in a single action with full power resulting in multiple torque-limiting events.
In Scenario 3, the device was attached to a power drill braced to the flat working surface and rotated at low velocity under power until 1 torque-limiting event occurred.
In Scenario 4, the device was again attached to a power drill braced to the flat working surface. The completed system was rotated at high velocity under power until multiple torque-limiting events occurred.
After each trial, we recorded maximum torque achieved before each device’s torque-limiting event. Either an orthopedic surgery resident or a qualified medical student tested each torque-limiting device in each standardized testing scenario.
Statistical Analysis
Experiments for each torque limiter were repeated for 3 trials of each of the 4 different scenarios. For comparative statistics between experiments, maximum torque measurements were expressed as means and SDs; 95% confidence interval (95% CI) was calculated and reported to determine extent of variation within a single group. One-way analysis of variance (ANOVA) and Tukey post hoc tests were performed between groups for comparison of the normally distributed data. Significance was set at P ≤ .05.
Results
During simulation, we successfully measured maximum torque achieved with each torque limiter under the 4 different scenarios. All testing was done by 2 operators. ANOVA demonstrated significant (P ≤ .001) differences in torque among the scenarios.
In scenario 1, mean (SD) maximum torque under hand power at low velocity was 1.49 (0.15) Nm (95% CI, 1.43-1.55), near the advertised maximum torque of 1.5 Nm, with relatively minimal variation between devices. This scenario confirmed proper calibration of properly used torque limiters. Mean maximum torque ranged from 1.25 to 1.93 Nm.
In scenario 2, mean (SD) maximum torque under hand power at high velocity was 3.73 (0.79) Nm (95% CI, 3.33-4.13), a 2.5-fold increase compared with scenario 1 (P < .0001) (Figure 3). There also was an increase in variation of maximum torque between trials of individual devices and between different devices. Mean maximum torque ranged from 2.27 to 5.53 Nm.
In scenario 3, mean (SD) maximum torque under drill power at controlled low velocity was 1.47 (0.14) Nm (95% CI, 1.37-1.56), again near the advertised maximum torque of 1.5 Nm, with relatively minimal variation. Mean maximum torque ranged from 1.10 to 1.73 Nm.
In scenario 4, mean (SD) maximum torque under drill power at full power/high velocity was 5.37 (0.90) Nm (95% CI, 4.92-5.83), a 3.65-fold increase compared with scenario 3 (P < .0001) (Figure 3). Mean maximum torque measured in 3 tests ranged from 3.40 to 6.92 Nm.
There was no significant difference in mean maximum torque between the scenarios of hand power at low velocity and drill power at low velocities (P = .999) (Figure 4). Highest maximum torque from any device was 9.0 Nm (drill at full power). Results are summarized in the Table. There was no statistical significance in the test between the 2 test operators.
Discussion
Maximum torque was measured using a torque-limiting attachment under 4 different simulated scenarios. Our goals were to determine if varying practice and rotational velocity would affect maximum insertional torque and to measure consistency among torque limiters. We designed the scenarios to mimic practice patterns, including hand insertion and power insertion of locking screws. Results demonstrated that misuse of a torque-limiting device may inadvertently produce insertional torque substantially higher than recommended. Highest maximum torque was 9.0 Nm, which is 6.0-fold higher than expected for a locking screw using a 1.5-Nm torque limiter.
Our study results showed that insertion under controlled hand power (and low-velocity drill power) until 1 torque-limiting event occurred produced the most consistent and predictable results. Insertion under drill power or high-velocity hand power produced multiple sequential torque-limiting events, yielding inaccurate insertion torque. Low-velocity insertion under hand power, or carefully controlled drill power, consistently produced torque similar to advertised values.
Manufacturers’ technique guides are available for proximal humerus locking compression plate (LCP) systems, small-fragment LCP systems, the Proximal Humeral Interlocking System (PHILOS; DePuy Synthes), and the LISS. These technique guides clearly state that insertion can be performed under power. Only the PHILOS and LISS guides state that insertion should be performed under power until a single click is heard or that final tightening should be completed under hand power. The proximal humerus LCP guide states that surgeons should insert the locking screw under power until the torque-limiting device clicks. The small-fragment LCP guide states that insertion under power should always be completed with the torque-limiting attachment; there is no mention of reducing power or a single click (this may give the surgeon a false sense of security).
Screw overtightening and head/thread stripping can make screw removal challenging.10 Removal rates for LISS plates range from 8% to 26%, and removal is often reported as taking longer than the index procedure, with complication rates as high as 47%.11-13 Bae and colleagues3 reported significant difficulty in removing 24 of 279 self-tapping locking screws (3.5 mm).
It is important to note that these complications, most notably cold welding, are mostly associated with titanium locking plate and screw constructs. Although stainless steel constructs have gained favor, titanium constructs are still widely used around the world.14,15
In 10% of cases in a laboratory setting, insertion of a 3.5-mm locking screw at 4 to 6 Nm damaged the screw.9 Removal of 3.5-mm locking screws had a stripping rate of 8.6%, and use of the torque limiter did not make removal easy all the time.3 Torque limiters are set specific to each screw diameter to reduce the risk of damage/stripping or even overtightening. Even when a surgeon intends to stop a drill before locking, final tightening often inadvertently occurs under power.3
Cold welding is often described as a cause of difficult implant removal.3,12 According to a newer definition, this process is independent of temperature and can occur when 2 metallic surfaces are in direct contact.16 High contact pressures between 2 similar metals can lead to this solid state welding.17 Theoretically, improper use of torque limiters can increase the risk of welding; however, it appears to be associated only with titanium locking plate and screw constructs.
Locked plating osteosynthesis is a valuable tool for fracture management, but improper use can have significant consequences, including morbid implant removal procedures, which are more difficult and time-consuming than the index surgery. We determined that proper use of torque limiters involves insertion under hand or power control at slow velocity until 1 torque-limiting event occurs. Many orthopedic surgeons may assume that torque limiters are accurate no matter how screws are inserted into locking plates. In addition, they may be unaware guidelines exist, as these are often deeply embedded within text. Therefore, we must emphasize that torque limiters can be inaccurate when used improperly.
One limitation of this study is that it tested only the Synthes 1.5-Nm torque-limiting attachment, though we can speculate that torque limiters designed for larger screws and limiters manufactured by different companies will behave similarly. Another limitation is that we did not obtain the hospitals’ service records for the tested equipment and assumed the equipment was properly checked for accuracy by the providing company. However, we hypothesized that, if maintenance were an issue, then our results would not be similar across all sites tested.
These tests involved a torque limiter linked to a torque-measuring device and may not perfectly represent actual torque measured at the locked screw–thread interface. However, we think our construct accurately determines the torque produced at the level of the driver tip. Also, we can speculate that the torque produced with improper use will lead to the complications mentioned and demonstrated in previous studies. Welding of the screw–plate interface may simply be a result of improper trajectory and cross-threading. However, if we assume that torque limiters prevent excessive torque no matter how they are used, high insertion speeds may compound the effect of welding. Additional biomechanical studies with full locked plate osteosynthesis constructs on bone specimens are planned to further characterize the potential complications of this issue.
1. Sommer C, Babst R, Müller M, Hanson B. Locking compression plate loosening and plate breakage: a report of four cases. J Orthop Trauma. 2004;18(8):571-577.
2. Schütz M, Südkamp NP. Revolution in plate osteosynthesis: new internal fixator systems. J Orthop Sci. 2003;8(2):252-258.
3. Bae JH, Oh JK, Oh CW, Hur CR. Technical difficulties of removal of locking screw after locking compression plating. Arch Orthop Trauma Surg. 2009;129(1):91-95.
4. Frigg R. Locking compression plate (LCP). An osteosynthesis plate based on the dynamic compression plate and the point contact fixator (PC-Fix). Injury. 2001;32(suppl 2):63-66.
5. Frigg R. Development of the locking compression plate. Injury. 2003;34(suppl 2):B6-B10.
6. Korner J, Lill H, Müller LP, Rommens PM, Schneider E, Linke B. The LCP-concept in the operative treatment of distal humerus fractures—biological, biomechanical and surgical aspects. Injury. 2003;34(suppl 2):B20-B30.
7. Egol KA, Kubiak EN, Fulkerson E, Kummer FJ, Koval KJ. Biomechanics of locked plates and screws. J Orthop Trauma. 2004;18(8):488-493.
8. Cole PA, Zlowodzki M, Kregor PJ. Treatment of proximal tibia fractures using the Less Invasive Stabilization System: surgical experience and early clinical results in 77 fractures. J Orthop Trauma. 2004;18(8):528-535.
9. Ehlinger M, Adam P, Simon P, Bonnomet F. Technical difficulties in hardware removal in titanium compression plates with locking screws. Orthop Traumatol Surg Res. 2009;95(5):373-376.
10. Gopinathan NR, Dhillon MS, Kumar R. Surgical technique: simple technique for removing a locking recon plate with damaged screw heads. Clin Orthop Relat Res. 2013;471(5):1572-1575.
11. Pattison G, Reynolds J, Hardy J. Salvaging a stripped drive connection when removing screws. Injury. 1999;30(1):74-75.
12. Raja S, Imbuldeniya AM, Garg S, Groom G. Difficulties encountered removing locked plates. Ann R Coll Surg Engl. 2012;94(7):502-505.
13. Kumar G, Dunlop C. Case report: a technique to remove a jammed locking screw from a locking plate. Clin Orthop Relat Res. 2011;469(2):613-616.
14. Disegi JA. Titanium alloys for fracture fixation implants. Injury. 2000;31(suppl 4):14-17.
15. El-Zayat BF, Ruchholtz S, Efe T, Paletta J, Kreslo D, Zettl R. Results of titanium locking plate and stainless steel cerclage wire combination in femoral fractures. Indian J Orthop. 2013;47(5):454-458.
16. Van Nortwick SS, Yao J, Ladd AL. Titanium integration with bone, welding, and screw head destruction complicating hardware removal of the distal radius: report of 2 cases. J Hand Surg. 2012;37(7):1388-1392.
17. Ferguson GS, Chaudhury MK, Sigal GB, Whitesides GM. Contact adhesion of thin gold films on elastomeric supports: cold welding under ambient conditions. Science. 1991;253(5021):776-778.

Treating Tibia Fractures With Far Cortical Locking Implants
Fracture healing can be categorized as primary or secondary. Primary healing requires precise reapproximation of bone fragments and compression of cortices. Osteons are formed across the fracture line, allowing blood supply and endothelial cells to gain access, leading to osteoblast infiltration and subsequent bone formation.1 This type of bone healing can be accomplished only with absolute stability—specifically, only with less than 2% strain at the fracture site, necessitating operative intervention with compression plating (Figure 1).2 This type of construct generates friction between the bone fragments against a metal plate, created by tightening screws that purchase both far and near cortices of bone.3 Although this type of fixation works well with many fractures, there are several instances in which compression plating is not ideal.4 Osteoporotic bone, for example, limits the amount of compression that can be developed, as screws strip the bone more readily, leading to weakened constructs prone to failure. Metaphyseal fractures in which there is minimal cortex for screw thread purchase are a similar challenge.5 Highly comminuted fractures do not allow for sufficient fragment compression and stability. In addition, compression plating requires periosteal stripping at the fracture, and often substantial soft-tissue disruption, which is especially a problem in areas of tenuous blood supply (eg, the tibia).

Locked plating therefore has become a valuable technique in managing osteoporotic fractures.2 Locking plates may be used to achieve secondary bone healing through a small amount of interfragmentary motion, 0.2 to 10 mm, as seen with bridge plating for example, whereby the locking plates act as internal fixators. Much as with external fixators, as the distance from the fixator bar (or plate) to bone decreases, construct stiffness increases. Thus, locking plates function as extremely stiff fixators when the plate is very near bone. It has therefore been speculated that such stiffness is insufficient to provide optimal secondary healing conditions.6,7 Titanium (vs stainless steel) plates have been used, and screws have been omitted just adjacent to either side of the fracture site, in attempts to increase plate flexibility and thus interfragmentary motion.8,9 In addition, biomechanical and animal model studies have demonstrated that, with use of locking plates, motion at the fracture site is asymmetric and leads to unequal callus formation at the near and far cortices, thus weakening the fracture site.10,11
The locking plate design was recently modified to address these concerns. Far cortical locking (FCL) uses locking screws threaded only distally (Figure 2), which allows for purchase into the far cortex but not the near cortex, which increases pin length from plate to bone. The near cortex is no longer anchored to the plate and thus increases construct flexibility. Pilot holes in the near cortex allow for movement of the nonthreaded screw shaft in a controlled, biphasic manner.12 This design decreases stiffness while sacrificing very little construct strength.10 In addition, motion at the far and near cortices is nearly parallel. It has been shown in an ovine tibial osteotomy model that, compared with the traditional locking plate design, FCL generates symmetric callus formation and improved fracture healing.11 Although these results are promising, there are only limited clinical data on use of the FCL technique in fracture repair. Our null hypothesis was that, despite the theoretical advantages of FCL constructs over conventional locking plates, there would be no clinically observed differences between the constructs.
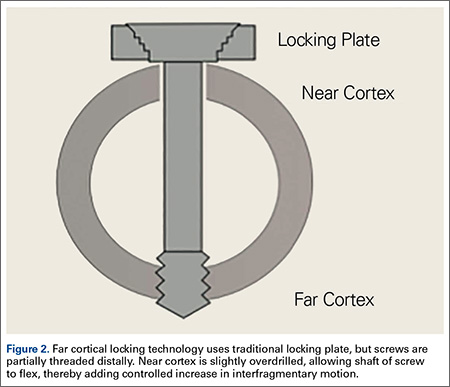
Patients and Methods
After obtaining Institutional Review Board approval from the 2 level I trauma centers and 1 level II trauma center involved in this study, we retrospectively reviewed the cases of all adults who presented with a tibia fracture and were treated with FCL technology (MotionLoc, Zimmer) by a fellowship-trained trauma surgeon at these hospitals (Figures 3A–3C). Any primary tibia fracture treated with FCL was considered. Only patients with follow-up of at least 20 weeks were included in the analysis. Exclusion criteria were tibial malunions or nonunions treated with FCL and fractures treated with a combination of intramedullary fixation and plating.
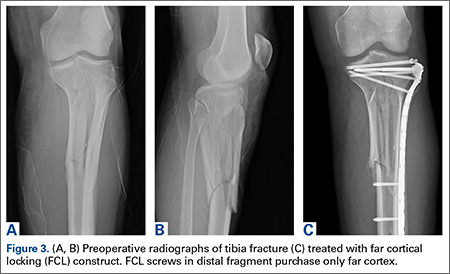
We reviewed the patient charts for demographic data, mechanism of injury, fracture type, and comorbidities. Risk factors for poor healing—such as diabetes and tobacco use, either current or prior—were recorded. We also reviewed the radiographs of the initial injuries for analysis of the tibia fracture types (Table 1) as well as the follow-up radiographs for evaluation of fracture healing. Using the Orthopaedic Trauma Association classification system, we identified a variety of fracture patterns. Fracture healing rates were recorded and used to calculate the overall healing rates for each group. Union was defined as either radiographic evidence of a completely healed fracture (≥3 cortices) or radiographic evidence of osseous bridging at the fracture site in addition to full weight-bearing without pain. Infection was defined as positive intraoperative cultures or grossly infected wounds with purulence and erythema.
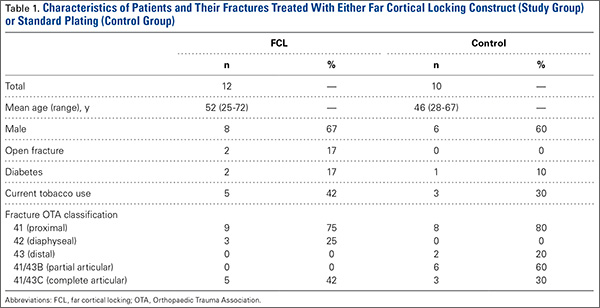
For statistical analysis, we used Welch 2-sample t test to compare categorical data, including rates of fracture union, infection, and revision surgery. We chose this test because it was unclear whether variance in the groups would be similar. FCL and control data were compared for significant differences by calculating P values. Similarly, for continuous data, Fisher exact test was used to calculate P values for mean time to union and mean time to full weight-bearing in order to compare FCL and control outcomes.
Results
Twelve patients treated at 2 level I and 1 level II trauma centers between November 2010 and May 2012 met the inclusion and exclusion criteria for this study. Another 10 patients were treated with standard plating techniques (control group). Mean age was 52 years (range, 25-72 years) for the FCL group and 46 years (range, 28-67 years) for the control group. The FCL group included 2 open fractures (control, 0) and 2 patients with diabetes (control, 1) (Table 1).
Eleven of the 12 FCL patients and all 10 control patients achieved fracture union by most recent follow-up (Table 2). The difference was not statistically significant (P = .363). The FCL-treated fracture that did not heal received an interfragmentary screw in addition to the standard FCL technology construct. The interfragmentary screw inhibited motion at the fracture site and could potentially have led to nonunion. For this patient, revision surgery to an intramedullary nail was required. Removal of the interfragmentary screw was uneventful. Each of the 2 open fractures in the FCL group required bone grafting because of large segmental bone loss. One of these fractures, a type 3B, became infected after bone grafting, and complete healing required plate removal. The patient was eventually treated with a brace. An infection that occurred after union in a closed tibia fracture in the FCL group required hardware removal. No patient in either group experienced loss or failure of fixation.
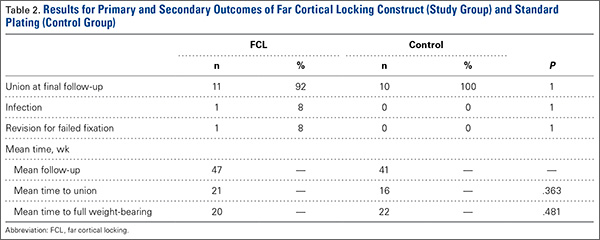
Discussion
Far cortical locking is a relatively new technology designed to increase fracture fixation flexibility by functionally lengthening the distance between the locking plate and the screw cortical purchase, which occurs at the far cortex rather than the near cortex. This construct thereby functions as an internal fixator and is functionally similar to an external fixator. Rather than there being bars external to the skin, a plate is placed internally, adjacent to but without compressing fracture fragments or the plate to the bone. This theoretically leads to a desirable amount of interfragmentary motion, promoting callus formation and secondary healing. However, too much motion at the fracture site disrupts healing by shearing proliferating cells attempting to bridge the fracture gap. Therefore, there is a narrow target zone of desirable motion between fracture fragments required to promote secondary bone healing—defined as 2% to 10% gap strain.2 FCL constructs are thought to fall in this range of gap strain and thus better promote secondary healing over standard locked plates. Although biomechanical studies have been used as proof of concept, there are no published clinical data on the effectiveness of FCL implants. The present article describes early data on clinical outcomes of this new type of implant.
The main limitation of this study is its small cohort size, which is largely a result of the short time these implants have been available and our attempt to compare only similar fractures in this analysis. In addition, follow-up was on average less than 1 year. We consider such follow-up acceptable, though, as all fractures essentially reached final healing status within that period. Another limitation is that we combined compression plating and locked plating in the control group. Considering the mechanism of the theoretical advantage of FCL implants, with larger cohorts it would be useful to perform a subanalysis in which compression and standard locking plates are separately compared with FCL implants.
This study found no statistically significant difference between FCL and standard plating, suggesting FCL likely is not inferior to standard plating. Although the FCL group included a nonunion, it is important to note that, in this case, there was a technical discrepancy in the ideal technique whereby another interfragmentary screw was placed, eliminating the interfragmentary motion that establishes the premise of FCL technology. This case thereby demonstrated that a breach in the FCL technique, as with standard locking techniques, may lead to fracture-healing complications. In the FCL group, 2 open fractures with significant segmental bone loss requiring bone graft subsequently healed. In addition, compared with the control group, the FCL group included more patients with diabetes and more tobacco users (both diabetes and tobacco use are associated with poor bone and wound healing). The FCL group was also, on average, 6 years older than the control group. None of these group differences, however, reached statistical significance. Indeed, part of the impetus to use FCL implants in this population was that these patients likely were at higher risk for poor healing and nonunion. This factor therefore represents a selection bias—the FCL group was more predisposed to nonunion—and a study limitation.
Together, our data show neither superiority nor inferiority of the FCL technique. This study is an important step in furthering investigations into FCL constructs. The finding of similar efficacy with FCL and conventional plating may assuage safety concerns and pave the way for more definitive studies of FCL technology and fuller evaluations of its effectiveness. These studies will be essential in determining whether the theoretical advantage of FCL translates into better clinical outcomes. Larger, prospective randomized studies with longer follow-ups will be needed to better compare FCL technology with current implants and techniques. At this early stage, however, FCL technology appears to be a viable option for complex fractures of the tibia.
1. Bernstein J, ed. Musculoskeletal Medicine. Rosemont, IL: American Academy of Orthopaedic Surgeons; 2003.
2. Egol KA, Kubiak EN, Fulkerson E, Kummer FJ, Koval KJ. Biomechanics of locked plates and screws. J Orthop Trauma. 2004;18(8):488-493.
3. Bagby GW. Compression bone-plating: historical considerations. J Bone Joint Surg Am. 1977;59(5):625-631.
4. Kubiak EN, Fulkerson E, Strauss E, Egol KA. The evolution of locked plates. J Bone Joint Surg Am. 2006;88(suppl 4):189-200.
5. Fitzpatrick DC, Doornink J, Madey SM, Bottlang M. Relative stability of conventional and locked plating fixation in a model of the osteoporotic femoral diaphysis. Clin Biomech. 2009;24(2):203-209.
6. Henderson CE, Bottlang M, Marsh JL, Fitzpatrick DC, Madey SM. Does locked plating of periprosthetic supracondylar femur fractures promote bone healing by callus formation? Two cases with opposite outcomes. Iowa Orthop J. 2008;28:73-76.
7. Lujan TJ, Henderson CE, Madey SM, Fitzpatrick DC, Marsh JL, Bottlang M. Locked plating of distal femur fractures leads to inconsistent and asymmetric callus formation. J Orthop Trauma. 2010;24(3):156-162.
8. Stoffel K, Dieter U, Stachowiak G, Gächter A, Kuster MS. Biomechanical testing of the LCP—how can stability in locked internal fixators be controlled? Injury. 2003;34(suppl 2):B11-B19.
9. Schmal H, Strohm PC, Jaeger M, Südkamp NP. Flexible fixation and fracture healing: do locked plating ‘internal fixators’ resemble external fixators? J Orthop Trauma. 2011;25(suppl 1):S15-S20.
10. Bottlang M, Doornink J, Fitzpatrick DC, Madey SM. Far cortical locking can reduce stiffness of locked plating constructs while retaining construct strength. J Bone Joint Surg Am. 2009;91(8):1985-1994.
11. Bottlang M, Lesser M, Koerber J, et al. Far cortical locking can improve healing of fractures stabilized with locking plates. J Bone Joint Surg Am. 2010;92(7):1652-1660.
12. Bottlang M, Feist F. Biomechanics of far cortical locking. J Orthop Trauma. 2011;25(suppl 1):S21-S28.
Fracture healing can be categorized as primary or secondary. Primary healing requires precise reapproximation of bone fragments and compression of cortices. Osteons are formed across the fracture line, allowing blood supply and endothelial cells to gain access, leading to osteoblast infiltration and subsequent bone formation.1 This type of bone healing can be accomplished only with absolute stability—specifically, only with less than 2% strain at the fracture site, necessitating operative intervention with compression plating (Figure 1).2 This type of construct generates friction between the bone fragments against a metal plate, created by tightening screws that purchase both far and near cortices of bone.3 Although this type of fixation works well with many fractures, there are several instances in which compression plating is not ideal.4 Osteoporotic bone, for example, limits the amount of compression that can be developed, as screws strip the bone more readily, leading to weakened constructs prone to failure. Metaphyseal fractures in which there is minimal cortex for screw thread purchase are a similar challenge.5 Highly comminuted fractures do not allow for sufficient fragment compression and stability. In addition, compression plating requires periosteal stripping at the fracture, and often substantial soft-tissue disruption, which is especially a problem in areas of tenuous blood supply (eg, the tibia).
Locked plating therefore has become a valuable technique in managing osteoporotic fractures.2 Locking plates may be used to achieve secondary bone healing through a small amount of interfragmentary motion, 0.2 to 10 mm, as seen with bridge plating for example, whereby the locking plates act as internal fixators. Much as with external fixators, as the distance from the fixator bar (or plate) to bone decreases, construct stiffness increases. Thus, locking plates function as extremely stiff fixators when the plate is very near bone. It has therefore been speculated that such stiffness is insufficient to provide optimal secondary healing conditions.6,7 Titanium (vs stainless steel) plates have been used, and screws have been omitted just adjacent to either side of the fracture site, in attempts to increase plate flexibility and thus interfragmentary motion.8,9 In addition, biomechanical and animal model studies have demonstrated that, with use of locking plates, motion at the fracture site is asymmetric and leads to unequal callus formation at the near and far cortices, thus weakening the fracture site.10,11
The locking plate design was recently modified to address these concerns. Far cortical locking (FCL) uses locking screws threaded only distally (Figure 2), which allows for purchase into the far cortex but not the near cortex, which increases pin length from plate to bone. The near cortex is no longer anchored to the plate and thus increases construct flexibility. Pilot holes in the near cortex allow for movement of the nonthreaded screw shaft in a controlled, biphasic manner.12 This design decreases stiffness while sacrificing very little construct strength.10 In addition, motion at the far and near cortices is nearly parallel. It has been shown in an ovine tibial osteotomy model that, compared with the traditional locking plate design, FCL generates symmetric callus formation and improved fracture healing.11 Although these results are promising, there are only limited clinical data on use of the FCL technique in fracture repair. Our null hypothesis was that, despite the theoretical advantages of FCL constructs over conventional locking plates, there would be no clinically observed differences between the constructs.
Patients and Methods
After obtaining Institutional Review Board approval from the 2 level I trauma centers and 1 level II trauma center involved in this study, we retrospectively reviewed the cases of all adults who presented with a tibia fracture and were treated with FCL technology (MotionLoc, Zimmer) by a fellowship-trained trauma surgeon at these hospitals (Figures 3A–3C). Any primary tibia fracture treated with FCL was considered. Only patients with follow-up of at least 20 weeks were included in the analysis. Exclusion criteria were tibial malunions or nonunions treated with FCL and fractures treated with a combination of intramedullary fixation and plating.
We reviewed the patient charts for demographic data, mechanism of injury, fracture type, and comorbidities. Risk factors for poor healing—such as diabetes and tobacco use, either current or prior—were recorded. We also reviewed the radiographs of the initial injuries for analysis of the tibia fracture types (Table 1) as well as the follow-up radiographs for evaluation of fracture healing. Using the Orthopaedic Trauma Association classification system, we identified a variety of fracture patterns. Fracture healing rates were recorded and used to calculate the overall healing rates for each group. Union was defined as either radiographic evidence of a completely healed fracture (≥3 cortices) or radiographic evidence of osseous bridging at the fracture site in addition to full weight-bearing without pain. Infection was defined as positive intraoperative cultures or grossly infected wounds with purulence and erythema.
For statistical analysis, we used Welch 2-sample t test to compare categorical data, including rates of fracture union, infection, and revision surgery. We chose this test because it was unclear whether variance in the groups would be similar. FCL and control data were compared for significant differences by calculating P values. Similarly, for continuous data, Fisher exact test was used to calculate P values for mean time to union and mean time to full weight-bearing in order to compare FCL and control outcomes.
Results
Twelve patients treated at 2 level I and 1 level II trauma centers between November 2010 and May 2012 met the inclusion and exclusion criteria for this study. Another 10 patients were treated with standard plating techniques (control group). Mean age was 52 years (range, 25-72 years) for the FCL group and 46 years (range, 28-67 years) for the control group. The FCL group included 2 open fractures (control, 0) and 2 patients with diabetes (control, 1) (Table 1).
Eleven of the 12 FCL patients and all 10 control patients achieved fracture union by most recent follow-up (Table 2). The difference was not statistically significant (P = .363). The FCL-treated fracture that did not heal received an interfragmentary screw in addition to the standard FCL technology construct. The interfragmentary screw inhibited motion at the fracture site and could potentially have led to nonunion. For this patient, revision surgery to an intramedullary nail was required. Removal of the interfragmentary screw was uneventful. Each of the 2 open fractures in the FCL group required bone grafting because of large segmental bone loss. One of these fractures, a type 3B, became infected after bone grafting, and complete healing required plate removal. The patient was eventually treated with a brace. An infection that occurred after union in a closed tibia fracture in the FCL group required hardware removal. No patient in either group experienced loss or failure of fixation.
Discussion
Far cortical locking is a relatively new technology designed to increase fracture fixation flexibility by functionally lengthening the distance between the locking plate and the screw cortical purchase, which occurs at the far cortex rather than the near cortex. This construct thereby functions as an internal fixator and is functionally similar to an external fixator. Rather than there being bars external to the skin, a plate is placed internally, adjacent to but without compressing fracture fragments or the plate to the bone. This theoretically leads to a desirable amount of interfragmentary motion, promoting callus formation and secondary healing. However, too much motion at the fracture site disrupts healing by shearing proliferating cells attempting to bridge the fracture gap. Therefore, there is a narrow target zone of desirable motion between fracture fragments required to promote secondary bone healing—defined as 2% to 10% gap strain.2 FCL constructs are thought to fall in this range of gap strain and thus better promote secondary healing over standard locked plates. Although biomechanical studies have been used as proof of concept, there are no published clinical data on the effectiveness of FCL implants. The present article describes early data on clinical outcomes of this new type of implant.
The main limitation of this study is its small cohort size, which is largely a result of the short time these implants have been available and our attempt to compare only similar fractures in this analysis. In addition, follow-up was on average less than 1 year. We consider such follow-up acceptable, though, as all fractures essentially reached final healing status within that period. Another limitation is that we combined compression plating and locked plating in the control group. Considering the mechanism of the theoretical advantage of FCL implants, with larger cohorts it would be useful to perform a subanalysis in which compression and standard locking plates are separately compared with FCL implants.
This study found no statistically significant difference between FCL and standard plating, suggesting FCL likely is not inferior to standard plating. Although the FCL group included a nonunion, it is important to note that, in this case, there was a technical discrepancy in the ideal technique whereby another interfragmentary screw was placed, eliminating the interfragmentary motion that establishes the premise of FCL technology. This case thereby demonstrated that a breach in the FCL technique, as with standard locking techniques, may lead to fracture-healing complications. In the FCL group, 2 open fractures with significant segmental bone loss requiring bone graft subsequently healed. In addition, compared with the control group, the FCL group included more patients with diabetes and more tobacco users (both diabetes and tobacco use are associated with poor bone and wound healing). The FCL group was also, on average, 6 years older than the control group. None of these group differences, however, reached statistical significance. Indeed, part of the impetus to use FCL implants in this population was that these patients likely were at higher risk for poor healing and nonunion. This factor therefore represents a selection bias—the FCL group was more predisposed to nonunion—and a study limitation.
Together, our data show neither superiority nor inferiority of the FCL technique. This study is an important step in furthering investigations into FCL constructs. The finding of similar efficacy with FCL and conventional plating may assuage safety concerns and pave the way for more definitive studies of FCL technology and fuller evaluations of its effectiveness. These studies will be essential in determining whether the theoretical advantage of FCL translates into better clinical outcomes. Larger, prospective randomized studies with longer follow-ups will be needed to better compare FCL technology with current implants and techniques. At this early stage, however, FCL technology appears to be a viable option for complex fractures of the tibia.
1. Bernstein J, ed. Musculoskeletal Medicine. Rosemont, IL: American Academy of Orthopaedic Surgeons; 2003.
2. Egol KA, Kubiak EN, Fulkerson E, Kummer FJ, Koval KJ. Biomechanics of locked plates and screws. J Orthop Trauma. 2004;18(8):488-493.
3. Bagby GW. Compression bone-plating: historical considerations. J Bone Joint Surg Am. 1977;59(5):625-631.
4. Kubiak EN, Fulkerson E, Strauss E, Egol KA. The evolution of locked plates. J Bone Joint Surg Am. 2006;88(suppl 4):189-200.
5. Fitzpatrick DC, Doornink J, Madey SM, Bottlang M. Relative stability of conventional and locked plating fixation in a model of the osteoporotic femoral diaphysis. Clin Biomech. 2009;24(2):203-209.
6. Henderson CE, Bottlang M, Marsh JL, Fitzpatrick DC, Madey SM. Does locked plating of periprosthetic supracondylar femur fractures promote bone healing by callus formation? Two cases with opposite outcomes. Iowa Orthop J. 2008;28:73-76.
7. Lujan TJ, Henderson CE, Madey SM, Fitzpatrick DC, Marsh JL, Bottlang M. Locked plating of distal femur fractures leads to inconsistent and asymmetric callus formation. J Orthop Trauma. 2010;24(3):156-162.
8. Stoffel K, Dieter U, Stachowiak G, Gächter A, Kuster MS. Biomechanical testing of the LCP—how can stability in locked internal fixators be controlled? Injury. 2003;34(suppl 2):B11-B19.
9. Schmal H, Strohm PC, Jaeger M, Südkamp NP. Flexible fixation and fracture healing: do locked plating ‘internal fixators’ resemble external fixators? J Orthop Trauma. 2011;25(suppl 1):S15-S20.
10. Bottlang M, Doornink J, Fitzpatrick DC, Madey SM. Far cortical locking can reduce stiffness of locked plating constructs while retaining construct strength. J Bone Joint Surg Am. 2009;91(8):1985-1994.
11. Bottlang M, Lesser M, Koerber J, et al. Far cortical locking can improve healing of fractures stabilized with locking plates. J Bone Joint Surg Am. 2010;92(7):1652-1660.
12. Bottlang M, Feist F. Biomechanics of far cortical locking. J Orthop Trauma. 2011;25(suppl 1):S21-S28.
Patients' Sleep Quality and Duration
Approximately 70 million adults within the United States have sleep disorders,[1] and up to 30% of adults report sleeping less than 6 hours per night.[2] Poor sleep has been associated with undesirable health outcomes.[1] Suboptimal sleep duration and sleep quality has been associated with a higher prevalence of chronic health conditions including hypertension, type 2 diabetes, coronary artery disease, stroke, and obesity, as well as increased overall mortality.[3, 4, 5, 6, 7]
Sleep plays an important role in restoration of wellness. Poor sleep is associated with physiological disturbances that may result in poor healing.[8, 9, 10] In the literature, prevalence of insomnia among elderly hospitalized patients was 36.7%,[11] whereas in younger hospitalized patients it was 50%.[12] Hospitalized patients frequently cite their acute illness, hospital‐related environmental factors, and disruptions that are part of routine care as causes for poor sleep during hospitalization.[13, 14, 15] Although the pervasiveness of poor sleep among hospitalized patients is high, interventions that prioritize sleep optimization as routine care, are uncommon. Few studies have reviewed the effect of sleep‐promoting measures on both sleep quality and sleep duration among patients hospitalized on general medicine units.
In this study, we aimed to assess the feasibility of incorporating sleep‐promoting interventions on a general medicine unit. We sought to identify differences in sleep measures between intervention and control groups. The primary outcome that we hoped to influence and lengthen in the intervention group was sleep duration. This outcome was measured both by sleep diary and with actigraphy. Secondary outcomes that we hypothesized should improve in the intervention group included feeling more refreshed in the mornings, sleep efficiency, and fewer sleep disruptions. As a feasibility pilot, we also wanted to explore the ease or difficulty with which sleep‐promoting interventions could be incorporated to the team's workflow.
METHODS
Study Design
A quasi‐experimental prospective pilot study was conducted at a single academic center, the Johns Hopkins Bayview Medical Center. Participants included adult patients admitted to the general medicine ward from July 2013 through January 2014. Patients with dementia; inability to complete survey questionnaires due to delirium, disability, or a language barrier; active withdrawal from alcohol or controlled substances; or acute psychiatric illness were excluded in this study.
The medicine ward at our medical center is comprised of 2 structurally identical units that admit patients with similar diagnoses, disease severity, and case‐mix disease groups. Nursing and support staff are unit specific. Pertaining to the sleep environment, the units both have semiprivate and private rooms. Visitors are encouraged to leave by 10 pm. Patients admitted from the emergency room to the medicine ward are assigned haphazardly to either unit based on bed availability. For the purpose of this study, we selected 1 unit to be a control unit and identified the other as the sleep‐promoting intervention unit.
Study Procedure
Upon arrival to the medicine unit, the research team approached all patients who met study eligibility criteria for study participation. Patients were provided full disclosure of the study using institutional research guidelines, and those interested in participating were consented. Participants were not explicitly told about their group assignment. This study was approved by the Johns Hopkins Institutional Review Board for human subject research.
In this study, the control group participants received standard of care as it pertains to sleep promotion. No additional sleep‐promoting measures were implemented to routine medical care, medication administration, nursing care, and overnight monitoring. Patients who used sleep medications at home, prior to admission, had those medicines continued only if they requested them and they were not contraindicated given their acute illness. Participants on the intervention unit were exposed to a nurse‐delivered sleep‐promoting protocol aimed at transforming the culture of care such that helping patients to sleep soundly was made a top priority. Environmental changes included unit‐wide efforts to minimize light and noise disturbances by dimming hallway lights, turning off room lights, and encouraging care teams to be as quiet as possible. Other strategies focused largely on minimizing care‐related disruptions. These included, when appropriate, administering nighttime medications in the early evening, minimizing fluids overnight, and closing patient room doors where appropriate. Further, patients were offered the following sleep‐promoting items to choose from: ear plugs, eye masks, warm blankets, and relaxation music. The final component of our intervention was 30‐minute sleep hygiene education taught by a physician. It highlighted basic sleep physiology and healthy sleep behavior adapted from Buysse.[16] Patients learned the role of behaviors such as reducing time lying awake in bed, setting standard wake‐up time and sleep time, and going to bed only when sleepy. This behavioral education was supplemented by a handout with sleep‐promoting suggestions.
The care team on the intervention unit received comprehensive study‐focused training in which night nursing teams were familiarized with the sleep‐promoting protocol through in‐service sessions facilitated by 1 of the authors (E.W.G.). To further promote study implementation, sleep‐promoting procedures were supported and encouraged by supervising nurses who made daily reminders to the intervention unit night care team of the goals of the sleep‐promoting study during evening huddles performed at the beginning of each shift. To assess the adherence of the sleep protocol, the nursing staff completed a daily checklist of elements within the protocol that were employed .
Data Collection and Measures
Baseline Measures
At the time of enrollment, study patients' demographic information, including use of chronic sleep medication prior to admission, was collected. Participants were assessed for baseline sleep disturbance prior to admission using standardized, validated sleep assessment tools: Pittsburgh Sleep Quality Index (PSQI), the Insomnia Severity Index (ISI), and the Epworth Sleepiness Scale (ESS). PSQI, a 19‐item tool, assessed self‐rated sleep quality measured over the prior month; a score of 5 or greater indicated poor sleep.[17] ISI, a 7‐item tool, identified the presence, rated the severity, and described the impact of insomnia; a score of 10 or greater indicated insomnia.[18] ESS, an 8‐item self‐rated tool, evaluated the impact of perceived sleepiness on daily functioning in 8 different environments; a score of 9 or greater was linked to burden of sleepiness. Participants were also screened for both obstructive sleep apnea (using the Berlin Sleep Apnea Index) and clinical depression (using Center for Epidemiologic Studies‐Depression 10‐point scale), as these conditions affect sleep patterns. These data are shown in Table 1.
| Intervention, n = 48 | Control, n = 64 | P Value | |
|---|---|---|---|
| |||
| Age, y, mean (SD) | 58.2 (16) | 56.9 (17) | 0.69 |
| Female, n (%) | 26 (54.2) | 36 (56.3) | 0.83 |
| Race, n (%) | |||
| Caucasian | 33 (68.8) | 46 (71.9) | 0.92 |
| African American | 13 (27.1) | 16 (25.0) | |
| Other | 2 (4.2) | 2 (3.1) | |
| BMI, mean (SD) | 32.1 (9.2) | 31.8 (9.3) | 0.85 |
| Admitting service, n (%) | |||
| Teaching | 21 (43.8) | 18 (28.1) | 0.09 |
| Nonteaching | 27 (56.3) | 46 (71.9) | |
| Sleep medication prior to admission, n (%) | 7 (14.9) | 21 (32.8) | 0.03 |
| Length of stay, d, mean (SD) | 4.9 (3) | 5.8 (3.9) | 0.19 |
| Number of sleep diaries per participant, mean (SD) | 2.2 (0.8) | 2.6 (0.9) | 0.02 |
| Proportion of hospital days with sleep diaries per participant, (SD) | 0.6 (0.2) | 0.5 (0.2) | 0.71 |
| Number of nights with actigraphy per participant, mean (SD) | 1.2 (0.7) | 1.4 (0.8) | 0.16 |
| Proportion of hospital nights with actigraphy per participant (SD) | 0.3 (0.2) | 0.3 (0.1) | 0.91 |
| Baseline sleep measures | |||
| PSQI, mean (SD) | 9.9 (4.6) | 9.1 (4.5) | 0.39 |
| ESS, mean (SD) | 7.4 (4.2) | 7.7 (4.8) | 0.79 |
| ISI, mean (SD) | 11.9 (7.6) | 10.8 (7.4) | 0.44 |
| CESD‐10, mean (SD) | 12.2 (7.2) | 12.8 (7.6) | 0.69 |
| Berlin Sleep Apnea, mean (SD) | 0.63 (0.5) | 0.61 (0.5) | 0.87 |
Sleep Diary Measures
A sleep diary completed each morning assessed the outcome measures, perceived sleep quality, how refreshing sleep was, and sleep durations. The diary employed a 5‐point Likert rating scale ranging from poor (1) to excellent (5). Perceived sleep duration was calculated from patients' reported time in bed, time to fall asleep, wake time, and number and duration of awakenings after sleep onset on their sleep diary. These data were used to compute total sleep time (TST) and sleep efficiency (SE). The sleep diary also included other pertinent sleep‐related measures including use of sleep medication the night prior and specific sleep disruptions from the prior night. To measure the impact of disruptions due to disturbances the prior night, we created a summed scale score of 4 items that negatively interfered with sleep (light, temperature, noise, and interruptions; 5 point scales from 1 = not at all to 5 = significant). Analysis of principal axis factors with varimax rotation yielded 1 disruption factor accounting for 55% of the variance, and Cronbach's was 0.73.
Actigraphy Measures
Actigraphy outcomes of sleep were recorded using the actigraphy wrist watch (ActiSleep Plus (GT3X+); ActiGraph, Pensacola, FL). Participants wore the monitor from the day of enrollment throughout the hospital stay or until transfer out of the unit. Objective data were analyzed and scored using ActiLife 6 data analysis software (version 6.10.1; Actigraph). Time in bed, given the unique inpatient setting, was calculated using sleep diary responses as the interval between sleep time and reported wake up time. These were entered into the Actilife 6 software for the sleep scoring analysis using a validated algorithm, Cole‐Kripke, to calculate actigraphy TST and SE.
Statistical Analysis
Descriptive and inferential statistics were computed using Statistical Package for the Social Sciences version 22 (IBM, Armonk, NY). We computed means, proportions, and measures of dispersion for all study variables. To test differences in sleep diary and actigraphy outcomes between the intervention and control arms, we used linear mixed models with full maximum likelihood estimation to model each of the 7 continuous sleep outcomes. These statistical methods are appropriate to account for the nonindependence of continuous repeated observations within hospital patients.[19] For all outcomes, the unit of analysis was nightly observations nested within patient‐ level characteristics. The use of full maximum likelihood estimation is a robust and preferred method for handling values missing at random in longitudinal datasets.[20]
To model repeated observations, mixed models included a term representing time in days. For each outcome, we specified unconditional growth models to examine the variability between and within patients by computing intraclass correlations and inspecting variance components. We used model fit indices (‐2LL deviance, Akaike's information criterion, and Schwartz's Bayesian criterion) as appropriate to determine best fitting model specifications in terms of random effects and covariance structure.[21, 22]
We tested the main effect of the intervention on sleep outcomes and the interactive effect of group (intervention vs control) by hospital day, to test whether there were group differences in slopes representing average change in sleep outcomes over hospital days. All models adjusted for age, body mass index, depression, and baseline sleep quality (PSQI) as time‐invariant covariates, and whether participants had taken a sleep medication the day before, as a time‐varying covariate. Adjustment for prehospitalization sleep quality was a matter of particular importance. We used the PSQI to control for sleep quality because it is both a well‐validated, multidimensional measure, and it includes prehospital use of sleep medications. In a series of sensitivity analyses, we also explored whether the dichotomous self‐reported measure of whether or not participants regularly took sleep medications prior to hospitalization, rather than the PSQI, would change our substantive findings. All covariates were centered at the grand‐mean following guidelines for appropriate interpretation of regression coefficients.[23]
RESULTS
Of the 112 study patients, 48 were in the intervention unit and 64 in the control unit. Eighty‐five percent of study participants endorsed poor sleep prior to hospital admission on the PSQI sleep quality measure, which was similar in both groups (Table 1).
Participants completed 1 to 8 sleep diary entries (mean = 2.5, standard deviation = 1.1). Because only 6 participants completed 5 or more diaries, we constrained the number of diaries included in the inferential analysis to 4 to avoid influential outliers identified by scatterplots. Fifty‐seven percent of participants had 1 night of valid actigraphy data (n = 64); 29%, 2 nights (n = 32), 8% had 3 or 4 nights, and 9 participants did not have any usable actigraphy data. The extent to which the intervention was accepted by patients in the intervention group was highly variable. Unit‐wide patient adherence with the 10 pm lights off, telephone off, and TV off policy was 87%, 67%, and 64% of intervention patients, respectively. Uptake of sleep menu items was also highly variable, and not a single element was used by more than half of patients (acceptance rates ranged from 11% to 44%). Eye masks (44%) and ear plugs (32%) were the most commonly utilized items.
A greater proportion of patients in the control arm (33%) had been taking sleep medications prior to hospitalization compared to the intervention arm (15%; 2 = 4.6, P < 0.05). However, hypnotic medication use in the hospital was similar across the both groups (intervention unit patients: 25% and controls: 21%, P = 0.49).
Intraclass correlations for the 7 sleep outcomes ranged from 0.59 to 0.76 on sleep diary outcomes, and from 0.61 to 0.85 on actigraphy. Dependency of sleep measures within patients accounted for 59% to 85% of variance in sleep outcomes. The best‐fit mixed models included random intercepts only. The results of mixed models testing the main effect of intervention versus comparison arm on sleep outcome measures, adjusted for covariates, are presented in Table 2. Total sleep time was the only outcome that was significantly different between groups; the average total sleep time, calculated from sleep diary data, was longer in the intervention group by 49 minutes.
| Intervention, n = 48 | Control, n = 64 | P Value | |
|---|---|---|---|
| |||
| Sleep diary outcomes | |||
| Sleep quality, mean (SE) | 3.14 (0.16) | 3.08 (0.13) | 0.79 |
| Refreshed sleep, mean (SE) | 2.94 (0.17) | 2.74 (0.14) | 0.38 |
| Negative impact of sleep disruptions, mean (SE) | 4.39 (0.58) | 4.81 (0.48) | 0.58 |
| Total sleep time, min, mean (SE) | 422 (16.2) | 373 (13.2) | 0.02 |
| Sleep efficiency, %, mean (SE) | 83.5 (2.3) | 82.1 (1.9) | 0.65 |
| Actigraphy outcomes | |||
| Total sleep time, min, mean (SE) | 377 (16.8) | 356 (13.2) | 0.32 |
| Sleep efficiency, %, mean (SE) | 72.7 (2.2) | 74.8 (1.8) | 0.45 |
Table 3 lists slopes representing average change in sleep measures over hospital days in both groups. The P values represent z tests of interaction terms in mixed models, after adjustment for covariates, testing whether slopes significantly differed between groups. Of the 7 outcomes, 3 sleep diary measures had significant interaction terms. For ratings of sleep quality, refreshing sleep, and sleep disruptions, slopes in the control group were flat, whereas slopes in the intervention group demonstrated improvements in ratings of sleep quality and refreshed sleep, and a decrease in the impact of sleep disruptions over the course of subsequent nights in the hospital. Figure 1 illustrates a plot of the adjusted average slopes for the refreshed sleep score across hospital days in intervention and control groups.
| Intervention, Slope (SE), n = 48 | Control, Slope (SE), n = 64 | P Value | |
|---|---|---|---|
| |||
| Refreshed sleep rating | 0.55 (0.18) | 0.03 (0.13) | 0.006 |
| Sleep quality rating | 0.52 (0.16) | 0.02 (0.11) | 0.012 |
| Negative impact of sleep interruptions | 1.65 (0.48) | 0.05 (0.32) | 0.006 |
| Total sleep time, diary | 11.2 (18.1) | 6.3 (13.0) | 0.44 |
| Total sleep time, actigraphy | 7.3 (25.5) | 1.0 (15.3) | 0.83 |
| Sleep efficiency, diary | 1.1 (2.3) | 1.5 (1.6) | 0.89 |
| Sleep efficiency, actigraphy | 0.9 (4.0) | 0.7 (2.4) | 0.74 |
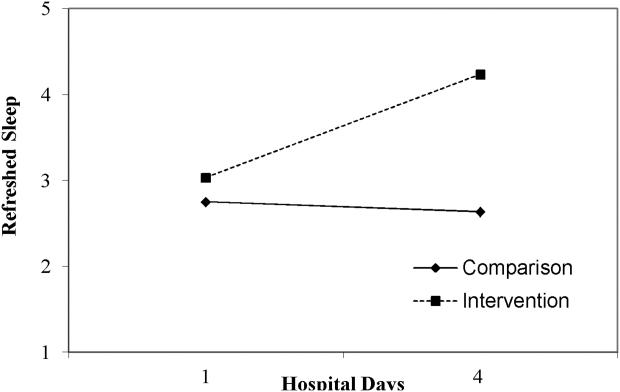
DISCUSSION
Poor sleep is common among hospitalized adults, both at home prior to the admission and especially when in the hospital. This pilot study demonstrated the feasibility of rolling out a sleep‐promoting intervention on a hospital's general medicine unit. Although participants on the intervention unit reported improved sleep quality and feeling more refreshed, this was not supported by actigraphy data (such as sleep time or sleep efficiency). Although care team engagement and implementation of unit‐wide interventions were high, patient use of individual components was imperfect. Of particular interest, however, the intervention group actually began to have improved sleep quality and fewer disruptions with subsequent nights sleeping in the hospital.
Our findings of the high prevalence of poor sleep among hospitalized patients is congruent with prior studies and supports the great need to screen for and address poor sleep within the hospital setting.[24, 25, 26] Attempts to promote sleep among hospitalized patients may be effective. Prior literature on sleep‐promoting intervention studies demonstrated relaxation techniques improved sleep quality by almost 38%,[27] and ear plugs and eye masks showed some benefit in promoting sleep within the hospital.[28] Our study's multicomponent intervention that attempted to minimize disruptions led to improvement in sleep quality, more restorative sleep, and decreased report of sleep disruptions, especially among patients who had a longer length of stay. As suggested by Thomas et al.[29] and seen in our data, this temporal relationship with improvement across subsequent nights suggests there may be an adaptation to the new environment and that it may take time for the sleep intervention to work.
Hospitalized patients often fail to reclaim the much‐needed restorative sleep at the time when they are most vulnerable. Patients cite routine care as the primary cause of sleep disruption, and often recognize the way that the hospital environment interferes with their ability to sleep.[30, 31, 32] The sleep‐promoting interventions used in our study would be characterized by most as low effort[33] and a potential for high yield, even though our patients only appreciated modest improvements in sleep outcomes.
Several limitations of this study should be considered. First, although we had hoped to collect substantial amounts of objective data, the average time of actigraphy observation was less than 48 hours. This may have constrained the group by time interaction analysis with actigraphy data, as studies have shown increased accuracy in actigraphy measures with longer wear.[34] By contrast, the sleep diary survey collected throughout hospitalization yielded significant improvements in consecutive daily measurements. Second, the proximity of the study units raised concern for study contamination, which could have reduced the differences in the outcome measures that may have been observed. Although the physicians work on both units, the nursing and support care teams are distinct and unit dependent. Finally, this was not a randomized trial. Patient assignment to the treatment arms was haphazard and occurred within the hospital's admitting strategy. Allocation of patients to either the intervention or the control group was based on bed availability at the time of admission. Although both groups were similar in most characteristics, more of the control participants reported taking more sleep medications prior to admission as compared to the intervention participants. Fortunately, hypnotic use was not different between groups during the admission, the time when sleep data were being captured.
Overall, this pilot study suggests that patients admitted to general medical ward fail to realize sufficient restorative sleep when they are in the hospital. Sleep disruption is rather frequent. This study demonstrates the opportunity for and feasibility of sleep‐promoting interventions where facilitating sleep is considered to be a top priority and vital component of the healthcare delivery. When trying to improve patients' sleep in the hospital, it may take several consecutive nights to realize a return on investment.
Acknowledgements
The authors acknowledge the Department of Nursing, Johns Hopkins Bayview Medical Center, and care teams of the Zieve Medicine Units, and the Center for Child and Community Health Research Biostatistics, Epidemiology and Data Management (BEAD) Core group.
Disclosures: Dr. Wright is a Miller‐Coulson Family Scholar and is supported through the Johns Hopkins Center for Innovative Medicine. Dr. Howell is the chief of the Division of Hospital Medicine at Johns Hopkins Bayview Medical Center and associate professor at Johns Hopkins School of Medicine. He served as the president of the Society of Hospital Medicine (SHM) in 2013 and currently serves as a board member. He is also a senior physician advisor for SHM. He is a coinvestigator grant recipient on an Agency for Healthcare Research and Quality grant on medication reconciliation funded through Baylor University. He was previously a coinvestigator grant recipient of Center for Medicare and Medicaid Innovations grant that ended in June 2015.
- Institute of Medicine (US) Committee on Sleep Medicine and Research. Sleep disorders and sleep deprivation: an unmet public health problem. Washington, DC: National Academies Press; 2006. Available at: http://www.ncbi.nlm.nih.gov/books/NBK19960. Accessed September 16, 2014.
- , . Health behaviors of adults: United States, 2005–2007. Vital Health Stat 10. 2010;245:1–132.
- , , . High incidence of diabetes in men with sleep complaints or short sleep duration: a 12‐year follow‐up study of a middle‐aged population. Diabetes Care. 2005;28:2762–2767.
- , , , et al. Linking sleep duration and obesity among black and white US adults. Clin Pract (Lond). 2013;10(5):661–667.
- , , , et al. Gender‐specific associations of short sleep duration with prevalent and incident hypertension: the Whitehall II Study. Hypertension. 2007;50:693–700.
- , , , , , . The joint effect of sleep duration and disturbed sleep on cause‐specific mortality: results from the Whitehall II cohort study. PLoS One. 2014;9(4):e91965.
- , , , , , . Poor self‐reported sleep quality predicts mortality within one year of inpatient post‐acute rehabilitation among older adults. Sleep. 2011;34(12):1715–1721.
- , , , , . The effects of sleep deprivation on symptoms of psychopathology in healthy adults. Sleep Med. 2007;8(3):215–221.
- , , , , . Sleep deprivation and activation of morning levels of cellular and genomic markers of inflammation. Arch Intern Med. 2006;166:1756–1762.
- , , , . The metabolic consequences of sleep deprivation. Sleep Med Rev. 2007;11(3):163–178.
- , , , et al. Insomnia among hospitalized elderly patients: prevalence, clinical characteristics and risk factors. Arch Gerontol Geriatr. 2011;52:133–137.
- , , , et al. Is insomnia a marker for psychiatric disorders in general hospitals? Sleep Med. 2005;6:549–553.
- , , , , , . Perceived control and sleep in hospitalized older adults: a sound hypothesis? J Hosp Med. 2013;8:184–190.
- , , , et al. Sleep disruption due to hospital noises: a prospective evaluation. Ann Intern Med. 2012;157:170–179.
- . Sleep in acute care settings: an integrative review. J Nurs Scholarsh. 2000;32(1):31–38.
- . Physical health as it relates to insomnia. Talk presented at: Center for Behavior and Health, Lecture Series in Johns Hopkins Bayview Medical Center; July 17, 2012; Baltimore, MD.
- , , , , . The Pittsburgh Sleep Quality Index: a new instrument for psychiatric practice and research. Psychiatry Res. 1989;28:193–213.
- , . Measures of sleep: The Insomnia Severity Index, Medical Outcomes Study (MOS) Sleep Scale, Pittsburgh Sleep Diary (PSD), and Pittsburgh Sleep Quality Index (PSQI). Arthritis Rheumatol. 2003;49:S184–S196.
- , . Applied Mixed Models in Medicine. 3rd ed. Somerset, NJ: Wiley; 2014:539.
- , , , Applying mixed regression models to the analysis of repeated‐measures data in psychosomatic medicine. Psychosom Med. 2006;68(6):870–878.
- , . Using the SPSS mixed procedure to fit cross‐sectional and longitudinal multilevel models. Educ Psychol Meas. 2005;65(5):717–741.
- , . Introduction to estimation issues in multilevel modeling. New Dir Inst Res. 2012;2012(154):23–39.
- , . Centering predictor variables in cross‐sectional multilevel models: a new look at an old issue. Psychol Methods. 2007;12(2):121–138.
- , . Sleep quality in adult hospitalized patients with infection: an observational study. Am J Med Sci. 2015;349(1):56–60.
- , , , et al. Risk of sleep apnea in hospitalized older patients. J Clin Sleep Med. 2014;10:1061–1066.
- , , . Hospital ward policy and patients' sleep patterns: a multiple baseline study. Rehabil Psychol. 1989;34(1):43–50.
- , , . Non‐pharmacologic interventions to improve the sleep of hospitalized patients: a systematic review. J Gen Intern Med. 2014;29:788–795.
- , , , , , Earplugs and eye masks vs routine care prevent sleep impairment in post‐anaesthesia care unit: a randomized study. Br J Anaesth. 2014;112(1):89–95.
- , , , et al. Sleep rounds: a multidisciplinary approach to optimize sleep quality and satisfaction in hospitalized patients. J Hosp Med. 2012;7:508–512.
- , , , , . Factors affecting sleep quality of patients in intensive care unit. J Clin Sleep Med. 2012;8(3):301–307.
- . Insomnia among hospitalized older persons. Clin Geriatr Med. 2008;24(1):51–67.
- , , , . A nonpharmacological sleep protocol for hospitalized older patients. J Am Geriatr Soc. 1998;46(6):700–705.
- The Action Priority Matrix: making the most of your opportunities. TimeAnalyzer website. Available at: http://www.timeanalyzer.com/lib/priority.htm. Published 2006. Accessed July 10, 2015.
- , , , et al. Measuring sleep: accuracy, sensitivity, and specificity of wrist actigraphy compared to polysomnography. Sleep. 2013;36(11):1747–1755.
Approximately 70 million adults within the United States have sleep disorders,[1] and up to 30% of adults report sleeping less than 6 hours per night.[2] Poor sleep has been associated with undesirable health outcomes.[1] Suboptimal sleep duration and sleep quality has been associated with a higher prevalence of chronic health conditions including hypertension, type 2 diabetes, coronary artery disease, stroke, and obesity, as well as increased overall mortality.[3, 4, 5, 6, 7]
Sleep plays an important role in restoration of wellness. Poor sleep is associated with physiological disturbances that may result in poor healing.[8, 9, 10] In the literature, prevalence of insomnia among elderly hospitalized patients was 36.7%,[11] whereas in younger hospitalized patients it was 50%.[12] Hospitalized patients frequently cite their acute illness, hospital‐related environmental factors, and disruptions that are part of routine care as causes for poor sleep during hospitalization.[13, 14, 15] Although the pervasiveness of poor sleep among hospitalized patients is high, interventions that prioritize sleep optimization as routine care, are uncommon. Few studies have reviewed the effect of sleep‐promoting measures on both sleep quality and sleep duration among patients hospitalized on general medicine units.
In this study, we aimed to assess the feasibility of incorporating sleep‐promoting interventions on a general medicine unit. We sought to identify differences in sleep measures between intervention and control groups. The primary outcome that we hoped to influence and lengthen in the intervention group was sleep duration. This outcome was measured both by sleep diary and with actigraphy. Secondary outcomes that we hypothesized should improve in the intervention group included feeling more refreshed in the mornings, sleep efficiency, and fewer sleep disruptions. As a feasibility pilot, we also wanted to explore the ease or difficulty with which sleep‐promoting interventions could be incorporated to the team's workflow.
METHODS
Study Design
A quasi‐experimental prospective pilot study was conducted at a single academic center, the Johns Hopkins Bayview Medical Center. Participants included adult patients admitted to the general medicine ward from July 2013 through January 2014. Patients with dementia; inability to complete survey questionnaires due to delirium, disability, or a language barrier; active withdrawal from alcohol or controlled substances; or acute psychiatric illness were excluded in this study.
The medicine ward at our medical center is comprised of 2 structurally identical units that admit patients with similar diagnoses, disease severity, and case‐mix disease groups. Nursing and support staff are unit specific. Pertaining to the sleep environment, the units both have semiprivate and private rooms. Visitors are encouraged to leave by 10 pm. Patients admitted from the emergency room to the medicine ward are assigned haphazardly to either unit based on bed availability. For the purpose of this study, we selected 1 unit to be a control unit and identified the other as the sleep‐promoting intervention unit.
Study Procedure
Upon arrival to the medicine unit, the research team approached all patients who met study eligibility criteria for study participation. Patients were provided full disclosure of the study using institutional research guidelines, and those interested in participating were consented. Participants were not explicitly told about their group assignment. This study was approved by the Johns Hopkins Institutional Review Board for human subject research.
In this study, the control group participants received standard of care as it pertains to sleep promotion. No additional sleep‐promoting measures were implemented to routine medical care, medication administration, nursing care, and overnight monitoring. Patients who used sleep medications at home, prior to admission, had those medicines continued only if they requested them and they were not contraindicated given their acute illness. Participants on the intervention unit were exposed to a nurse‐delivered sleep‐promoting protocol aimed at transforming the culture of care such that helping patients to sleep soundly was made a top priority. Environmental changes included unit‐wide efforts to minimize light and noise disturbances by dimming hallway lights, turning off room lights, and encouraging care teams to be as quiet as possible. Other strategies focused largely on minimizing care‐related disruptions. These included, when appropriate, administering nighttime medications in the early evening, minimizing fluids overnight, and closing patient room doors where appropriate. Further, patients were offered the following sleep‐promoting items to choose from: ear plugs, eye masks, warm blankets, and relaxation music. The final component of our intervention was 30‐minute sleep hygiene education taught by a physician. It highlighted basic sleep physiology and healthy sleep behavior adapted from Buysse.[16] Patients learned the role of behaviors such as reducing time lying awake in bed, setting standard wake‐up time and sleep time, and going to bed only when sleepy. This behavioral education was supplemented by a handout with sleep‐promoting suggestions.
The care team on the intervention unit received comprehensive study‐focused training in which night nursing teams were familiarized with the sleep‐promoting protocol through in‐service sessions facilitated by 1 of the authors (E.W.G.). To further promote study implementation, sleep‐promoting procedures were supported and encouraged by supervising nurses who made daily reminders to the intervention unit night care team of the goals of the sleep‐promoting study during evening huddles performed at the beginning of each shift. To assess the adherence of the sleep protocol, the nursing staff completed a daily checklist of elements within the protocol that were employed .
Data Collection and Measures
Baseline Measures
At the time of enrollment, study patients' demographic information, including use of chronic sleep medication prior to admission, was collected. Participants were assessed for baseline sleep disturbance prior to admission using standardized, validated sleep assessment tools: Pittsburgh Sleep Quality Index (PSQI), the Insomnia Severity Index (ISI), and the Epworth Sleepiness Scale (ESS). PSQI, a 19‐item tool, assessed self‐rated sleep quality measured over the prior month; a score of 5 or greater indicated poor sleep.[17] ISI, a 7‐item tool, identified the presence, rated the severity, and described the impact of insomnia; a score of 10 or greater indicated insomnia.[18] ESS, an 8‐item self‐rated tool, evaluated the impact of perceived sleepiness on daily functioning in 8 different environments; a score of 9 or greater was linked to burden of sleepiness. Participants were also screened for both obstructive sleep apnea (using the Berlin Sleep Apnea Index) and clinical depression (using Center for Epidemiologic Studies‐Depression 10‐point scale), as these conditions affect sleep patterns. These data are shown in Table 1.
| Intervention, n = 48 | Control, n = 64 | P Value | |
|---|---|---|---|
| |||
| Age, y, mean (SD) | 58.2 (16) | 56.9 (17) | 0.69 |
| Female, n (%) | 26 (54.2) | 36 (56.3) | 0.83 |
| Race, n (%) | |||
| Caucasian | 33 (68.8) | 46 (71.9) | 0.92 |
| African American | 13 (27.1) | 16 (25.0) | |
| Other | 2 (4.2) | 2 (3.1) | |
| BMI, mean (SD) | 32.1 (9.2) | 31.8 (9.3) | 0.85 |
| Admitting service, n (%) | |||
| Teaching | 21 (43.8) | 18 (28.1) | 0.09 |
| Nonteaching | 27 (56.3) | 46 (71.9) | |
| Sleep medication prior to admission, n (%) | 7 (14.9) | 21 (32.8) | 0.03 |
| Length of stay, d, mean (SD) | 4.9 (3) | 5.8 (3.9) | 0.19 |
| Number of sleep diaries per participant, mean (SD) | 2.2 (0.8) | 2.6 (0.9) | 0.02 |
| Proportion of hospital days with sleep diaries per participant, (SD) | 0.6 (0.2) | 0.5 (0.2) | 0.71 |
| Number of nights with actigraphy per participant, mean (SD) | 1.2 (0.7) | 1.4 (0.8) | 0.16 |
| Proportion of hospital nights with actigraphy per participant (SD) | 0.3 (0.2) | 0.3 (0.1) | 0.91 |
| Baseline sleep measures | |||
| PSQI, mean (SD) | 9.9 (4.6) | 9.1 (4.5) | 0.39 |
| ESS, mean (SD) | 7.4 (4.2) | 7.7 (4.8) | 0.79 |
| ISI, mean (SD) | 11.9 (7.6) | 10.8 (7.4) | 0.44 |
| CESD‐10, mean (SD) | 12.2 (7.2) | 12.8 (7.6) | 0.69 |
| Berlin Sleep Apnea, mean (SD) | 0.63 (0.5) | 0.61 (0.5) | 0.87 |
Sleep Diary Measures
A sleep diary completed each morning assessed the outcome measures, perceived sleep quality, how refreshing sleep was, and sleep durations. The diary employed a 5‐point Likert rating scale ranging from poor (1) to excellent (5). Perceived sleep duration was calculated from patients' reported time in bed, time to fall asleep, wake time, and number and duration of awakenings after sleep onset on their sleep diary. These data were used to compute total sleep time (TST) and sleep efficiency (SE). The sleep diary also included other pertinent sleep‐related measures including use of sleep medication the night prior and specific sleep disruptions from the prior night. To measure the impact of disruptions due to disturbances the prior night, we created a summed scale score of 4 items that negatively interfered with sleep (light, temperature, noise, and interruptions; 5 point scales from 1 = not at all to 5 = significant). Analysis of principal axis factors with varimax rotation yielded 1 disruption factor accounting for 55% of the variance, and Cronbach's was 0.73.
Actigraphy Measures
Actigraphy outcomes of sleep were recorded using the actigraphy wrist watch (ActiSleep Plus (GT3X+); ActiGraph, Pensacola, FL). Participants wore the monitor from the day of enrollment throughout the hospital stay or until transfer out of the unit. Objective data were analyzed and scored using ActiLife 6 data analysis software (version 6.10.1; Actigraph). Time in bed, given the unique inpatient setting, was calculated using sleep diary responses as the interval between sleep time and reported wake up time. These were entered into the Actilife 6 software for the sleep scoring analysis using a validated algorithm, Cole‐Kripke, to calculate actigraphy TST and SE.
Statistical Analysis
Descriptive and inferential statistics were computed using Statistical Package for the Social Sciences version 22 (IBM, Armonk, NY). We computed means, proportions, and measures of dispersion for all study variables. To test differences in sleep diary and actigraphy outcomes between the intervention and control arms, we used linear mixed models with full maximum likelihood estimation to model each of the 7 continuous sleep outcomes. These statistical methods are appropriate to account for the nonindependence of continuous repeated observations within hospital patients.[19] For all outcomes, the unit of analysis was nightly observations nested within patient‐ level characteristics. The use of full maximum likelihood estimation is a robust and preferred method for handling values missing at random in longitudinal datasets.[20]
To model repeated observations, mixed models included a term representing time in days. For each outcome, we specified unconditional growth models to examine the variability between and within patients by computing intraclass correlations and inspecting variance components. We used model fit indices (‐2LL deviance, Akaike's information criterion, and Schwartz's Bayesian criterion) as appropriate to determine best fitting model specifications in terms of random effects and covariance structure.[21, 22]
We tested the main effect of the intervention on sleep outcomes and the interactive effect of group (intervention vs control) by hospital day, to test whether there were group differences in slopes representing average change in sleep outcomes over hospital days. All models adjusted for age, body mass index, depression, and baseline sleep quality (PSQI) as time‐invariant covariates, and whether participants had taken a sleep medication the day before, as a time‐varying covariate. Adjustment for prehospitalization sleep quality was a matter of particular importance. We used the PSQI to control for sleep quality because it is both a well‐validated, multidimensional measure, and it includes prehospital use of sleep medications. In a series of sensitivity analyses, we also explored whether the dichotomous self‐reported measure of whether or not participants regularly took sleep medications prior to hospitalization, rather than the PSQI, would change our substantive findings. All covariates were centered at the grand‐mean following guidelines for appropriate interpretation of regression coefficients.[23]
RESULTS
Of the 112 study patients, 48 were in the intervention unit and 64 in the control unit. Eighty‐five percent of study participants endorsed poor sleep prior to hospital admission on the PSQI sleep quality measure, which was similar in both groups (Table 1).
Participants completed 1 to 8 sleep diary entries (mean = 2.5, standard deviation = 1.1). Because only 6 participants completed 5 or more diaries, we constrained the number of diaries included in the inferential analysis to 4 to avoid influential outliers identified by scatterplots. Fifty‐seven percent of participants had 1 night of valid actigraphy data (n = 64); 29%, 2 nights (n = 32), 8% had 3 or 4 nights, and 9 participants did not have any usable actigraphy data. The extent to which the intervention was accepted by patients in the intervention group was highly variable. Unit‐wide patient adherence with the 10 pm lights off, telephone off, and TV off policy was 87%, 67%, and 64% of intervention patients, respectively. Uptake of sleep menu items was also highly variable, and not a single element was used by more than half of patients (acceptance rates ranged from 11% to 44%). Eye masks (44%) and ear plugs (32%) were the most commonly utilized items.
A greater proportion of patients in the control arm (33%) had been taking sleep medications prior to hospitalization compared to the intervention arm (15%; 2 = 4.6, P < 0.05). However, hypnotic medication use in the hospital was similar across the both groups (intervention unit patients: 25% and controls: 21%, P = 0.49).
Intraclass correlations for the 7 sleep outcomes ranged from 0.59 to 0.76 on sleep diary outcomes, and from 0.61 to 0.85 on actigraphy. Dependency of sleep measures within patients accounted for 59% to 85% of variance in sleep outcomes. The best‐fit mixed models included random intercepts only. The results of mixed models testing the main effect of intervention versus comparison arm on sleep outcome measures, adjusted for covariates, are presented in Table 2. Total sleep time was the only outcome that was significantly different between groups; the average total sleep time, calculated from sleep diary data, was longer in the intervention group by 49 minutes.
| Intervention, n = 48 | Control, n = 64 | P Value | |
|---|---|---|---|
| |||
| Sleep diary outcomes | |||
| Sleep quality, mean (SE) | 3.14 (0.16) | 3.08 (0.13) | 0.79 |
| Refreshed sleep, mean (SE) | 2.94 (0.17) | 2.74 (0.14) | 0.38 |
| Negative impact of sleep disruptions, mean (SE) | 4.39 (0.58) | 4.81 (0.48) | 0.58 |
| Total sleep time, min, mean (SE) | 422 (16.2) | 373 (13.2) | 0.02 |
| Sleep efficiency, %, mean (SE) | 83.5 (2.3) | 82.1 (1.9) | 0.65 |
| Actigraphy outcomes | |||
| Total sleep time, min, mean (SE) | 377 (16.8) | 356 (13.2) | 0.32 |
| Sleep efficiency, %, mean (SE) | 72.7 (2.2) | 74.8 (1.8) | 0.45 |
Table 3 lists slopes representing average change in sleep measures over hospital days in both groups. The P values represent z tests of interaction terms in mixed models, after adjustment for covariates, testing whether slopes significantly differed between groups. Of the 7 outcomes, 3 sleep diary measures had significant interaction terms. For ratings of sleep quality, refreshing sleep, and sleep disruptions, slopes in the control group were flat, whereas slopes in the intervention group demonstrated improvements in ratings of sleep quality and refreshed sleep, and a decrease in the impact of sleep disruptions over the course of subsequent nights in the hospital. Figure 1 illustrates a plot of the adjusted average slopes for the refreshed sleep score across hospital days in intervention and control groups.
| Intervention, Slope (SE), n = 48 | Control, Slope (SE), n = 64 | P Value | |
|---|---|---|---|
| |||
| Refreshed sleep rating | 0.55 (0.18) | 0.03 (0.13) | 0.006 |
| Sleep quality rating | 0.52 (0.16) | 0.02 (0.11) | 0.012 |
| Negative impact of sleep interruptions | 1.65 (0.48) | 0.05 (0.32) | 0.006 |
| Total sleep time, diary | 11.2 (18.1) | 6.3 (13.0) | 0.44 |
| Total sleep time, actigraphy | 7.3 (25.5) | 1.0 (15.3) | 0.83 |
| Sleep efficiency, diary | 1.1 (2.3) | 1.5 (1.6) | 0.89 |
| Sleep efficiency, actigraphy | 0.9 (4.0) | 0.7 (2.4) | 0.74 |
DISCUSSION
Poor sleep is common among hospitalized adults, both at home prior to the admission and especially when in the hospital. This pilot study demonstrated the feasibility of rolling out a sleep‐promoting intervention on a hospital's general medicine unit. Although participants on the intervention unit reported improved sleep quality and feeling more refreshed, this was not supported by actigraphy data (such as sleep time or sleep efficiency). Although care team engagement and implementation of unit‐wide interventions were high, patient use of individual components was imperfect. Of particular interest, however, the intervention group actually began to have improved sleep quality and fewer disruptions with subsequent nights sleeping in the hospital.
Our findings of the high prevalence of poor sleep among hospitalized patients is congruent with prior studies and supports the great need to screen for and address poor sleep within the hospital setting.[24, 25, 26] Attempts to promote sleep among hospitalized patients may be effective. Prior literature on sleep‐promoting intervention studies demonstrated relaxation techniques improved sleep quality by almost 38%,[27] and ear plugs and eye masks showed some benefit in promoting sleep within the hospital.[28] Our study's multicomponent intervention that attempted to minimize disruptions led to improvement in sleep quality, more restorative sleep, and decreased report of sleep disruptions, especially among patients who had a longer length of stay. As suggested by Thomas et al.[29] and seen in our data, this temporal relationship with improvement across subsequent nights suggests there may be an adaptation to the new environment and that it may take time for the sleep intervention to work.
Hospitalized patients often fail to reclaim the much‐needed restorative sleep at the time when they are most vulnerable. Patients cite routine care as the primary cause of sleep disruption, and often recognize the way that the hospital environment interferes with their ability to sleep.[30, 31, 32] The sleep‐promoting interventions used in our study would be characterized by most as low effort[33] and a potential for high yield, even though our patients only appreciated modest improvements in sleep outcomes.
Several limitations of this study should be considered. First, although we had hoped to collect substantial amounts of objective data, the average time of actigraphy observation was less than 48 hours. This may have constrained the group by time interaction analysis with actigraphy data, as studies have shown increased accuracy in actigraphy measures with longer wear.[34] By contrast, the sleep diary survey collected throughout hospitalization yielded significant improvements in consecutive daily measurements. Second, the proximity of the study units raised concern for study contamination, which could have reduced the differences in the outcome measures that may have been observed. Although the physicians work on both units, the nursing and support care teams are distinct and unit dependent. Finally, this was not a randomized trial. Patient assignment to the treatment arms was haphazard and occurred within the hospital's admitting strategy. Allocation of patients to either the intervention or the control group was based on bed availability at the time of admission. Although both groups were similar in most characteristics, more of the control participants reported taking more sleep medications prior to admission as compared to the intervention participants. Fortunately, hypnotic use was not different between groups during the admission, the time when sleep data were being captured.
Overall, this pilot study suggests that patients admitted to general medical ward fail to realize sufficient restorative sleep when they are in the hospital. Sleep disruption is rather frequent. This study demonstrates the opportunity for and feasibility of sleep‐promoting interventions where facilitating sleep is considered to be a top priority and vital component of the healthcare delivery. When trying to improve patients' sleep in the hospital, it may take several consecutive nights to realize a return on investment.
Acknowledgements
The authors acknowledge the Department of Nursing, Johns Hopkins Bayview Medical Center, and care teams of the Zieve Medicine Units, and the Center for Child and Community Health Research Biostatistics, Epidemiology and Data Management (BEAD) Core group.
Disclosures: Dr. Wright is a Miller‐Coulson Family Scholar and is supported through the Johns Hopkins Center for Innovative Medicine. Dr. Howell is the chief of the Division of Hospital Medicine at Johns Hopkins Bayview Medical Center and associate professor at Johns Hopkins School of Medicine. He served as the president of the Society of Hospital Medicine (SHM) in 2013 and currently serves as a board member. He is also a senior physician advisor for SHM. He is a coinvestigator grant recipient on an Agency for Healthcare Research and Quality grant on medication reconciliation funded through Baylor University. He was previously a coinvestigator grant recipient of Center for Medicare and Medicaid Innovations grant that ended in June 2015.
- Institute of Medicine (US) Committee on Sleep Medicine and Research. Sleep disorders and sleep deprivation: an unmet public health problem. Washington, DC: National Academies Press; 2006. Available at: http://www.ncbi.nlm.nih.gov/books/NBK19960. Accessed September 16, 2014.
- , . Health behaviors of adults: United States, 2005–2007. Vital Health Stat 10. 2010;245:1–132.
- , , . High incidence of diabetes in men with sleep complaints or short sleep duration: a 12‐year follow‐up study of a middle‐aged population. Diabetes Care. 2005;28:2762–2767.
- , , , et al. Linking sleep duration and obesity among black and white US adults. Clin Pract (Lond). 2013;10(5):661–667.
- , , , et al. Gender‐specific associations of short sleep duration with prevalent and incident hypertension: the Whitehall II Study. Hypertension. 2007;50:693–700.
- , , , , , . The joint effect of sleep duration and disturbed sleep on cause‐specific mortality: results from the Whitehall II cohort study. PLoS One. 2014;9(4):e91965.
- , , , , , . Poor self‐reported sleep quality predicts mortality within one year of inpatient post‐acute rehabilitation among older adults. Sleep. 2011;34(12):1715–1721.
- , , , , . The effects of sleep deprivation on symptoms of psychopathology in healthy adults. Sleep Med. 2007;8(3):215–221.
- , , , , . Sleep deprivation and activation of morning levels of cellular and genomic markers of inflammation. Arch Intern Med. 2006;166:1756–1762.
- , , , . The metabolic consequences of sleep deprivation. Sleep Med Rev. 2007;11(3):163–178.
- , , , et al. Insomnia among hospitalized elderly patients: prevalence, clinical characteristics and risk factors. Arch Gerontol Geriatr. 2011;52:133–137.
- , , , et al. Is insomnia a marker for psychiatric disorders in general hospitals? Sleep Med. 2005;6:549–553.
- , , , , , . Perceived control and sleep in hospitalized older adults: a sound hypothesis? J Hosp Med. 2013;8:184–190.
- , , , et al. Sleep disruption due to hospital noises: a prospective evaluation. Ann Intern Med. 2012;157:170–179.
- . Sleep in acute care settings: an integrative review. J Nurs Scholarsh. 2000;32(1):31–38.
- . Physical health as it relates to insomnia. Talk presented at: Center for Behavior and Health, Lecture Series in Johns Hopkins Bayview Medical Center; July 17, 2012; Baltimore, MD.
- , , , , . The Pittsburgh Sleep Quality Index: a new instrument for psychiatric practice and research. Psychiatry Res. 1989;28:193–213.
- , . Measures of sleep: The Insomnia Severity Index, Medical Outcomes Study (MOS) Sleep Scale, Pittsburgh Sleep Diary (PSD), and Pittsburgh Sleep Quality Index (PSQI). Arthritis Rheumatol. 2003;49:S184–S196.
- , . Applied Mixed Models in Medicine. 3rd ed. Somerset, NJ: Wiley; 2014:539.
- , , , Applying mixed regression models to the analysis of repeated‐measures data in psychosomatic medicine. Psychosom Med. 2006;68(6):870–878.
- , . Using the SPSS mixed procedure to fit cross‐sectional and longitudinal multilevel models. Educ Psychol Meas. 2005;65(5):717–741.
- , . Introduction to estimation issues in multilevel modeling. New Dir Inst Res. 2012;2012(154):23–39.
- , . Centering predictor variables in cross‐sectional multilevel models: a new look at an old issue. Psychol Methods. 2007;12(2):121–138.
- , . Sleep quality in adult hospitalized patients with infection: an observational study. Am J Med Sci. 2015;349(1):56–60.
- , , , et al. Risk of sleep apnea in hospitalized older patients. J Clin Sleep Med. 2014;10:1061–1066.
- , , . Hospital ward policy and patients' sleep patterns: a multiple baseline study. Rehabil Psychol. 1989;34(1):43–50.
- , , . Non‐pharmacologic interventions to improve the sleep of hospitalized patients: a systematic review. J Gen Intern Med. 2014;29:788–795.
- , , , , , Earplugs and eye masks vs routine care prevent sleep impairment in post‐anaesthesia care unit: a randomized study. Br J Anaesth. 2014;112(1):89–95.
- , , , et al. Sleep rounds: a multidisciplinary approach to optimize sleep quality and satisfaction in hospitalized patients. J Hosp Med. 2012;7:508–512.
- , , , , . Factors affecting sleep quality of patients in intensive care unit. J Clin Sleep Med. 2012;8(3):301–307.
- . Insomnia among hospitalized older persons. Clin Geriatr Med. 2008;24(1):51–67.
- , , , . A nonpharmacological sleep protocol for hospitalized older patients. J Am Geriatr Soc. 1998;46(6):700–705.
- The Action Priority Matrix: making the most of your opportunities. TimeAnalyzer website. Available at: http://www.timeanalyzer.com/lib/priority.htm. Published 2006. Accessed July 10, 2015.
- , , , et al. Measuring sleep: accuracy, sensitivity, and specificity of wrist actigraphy compared to polysomnography. Sleep. 2013;36(11):1747–1755.
