User login
Prevalence of Glaucoma in Patients With Vitiligo
Vitiligo is an acquired idiopathic disease of unknown etiology. Characterized by depigmented maculae and melanocytic destruction, it usually presents in childhood or young adulthood. The incidence of vitiligo ranges from 0.5% to 2% globally and there is no racial or gender predilection.1
Patients with vitiligo may exhibit pigmentary abnormalities of the iris and retina.2 Noninflammatory depigmented lesions of the ocular fundus observed in vitiligo indicate a local loss of melanocytes.1 The fact that melanocytes are present not only in the skin and roots of the hair but also in the uvea and stria vascularis of the inner ear may explain the ophthalmologic disorders that accompany vitiligo.3 The term glaucoma refers to a large number of diseases that share a common feature: a distinctive and progressive optic neuropathy that may derive from various risks and is associated with a gradual loss of the visual field. If the disorder is not diagnosed and treated properly it could cause blindness.
Glaucoma is classified on the basis of the underlying abnormality that causes intraocular pressure (IOP) to rise. Glaucoma is first divided into open-angle and angle-closure glaucoma; glaucoma associated with developmental anomalies is then subdivided according to specific alterations.4
A PubMed search of articles indexed for MEDLINE using the terms vitiligo and glaucoma revealed only 1 study examining the incidence of glaucoma in patients with vitiligo.5 In the study reported here, we determined the presence of and possible risk factors for glaucoma in patients with vitiligo who had presented to the dermatology polyclinic.
Methods
We registered 49 patients diagnosed with vitiligo by clinical and Wood light examination and 20 age- and sex-matched healthy controls. Patients who were using topical corticosteroid treatments for vitiligo lesions located on the face were excluded from the study due to the glaucoma-inducing effects of corticosteroids. Similarly, patients who received drugs with sympathetic and parasympathetic action that can cause glaucoma were excluded.
The patients received a comprehensive ophthalmologic examination that included visual acuity testing, refraction, IOP measurement, gonioscopy, and fundus examination. All patients and controls underwent visual field tests and optic nerve head analyses using a confocal scanning laser ophthalmoscope. Glaucoma was diagnosed based on fundus examination, IOP measurement, field of vision evaluation, and optic nerve head analysis.
Informed consent was obtained from all participants. The research protocol was approved by the university hospital ethics committee.
Results
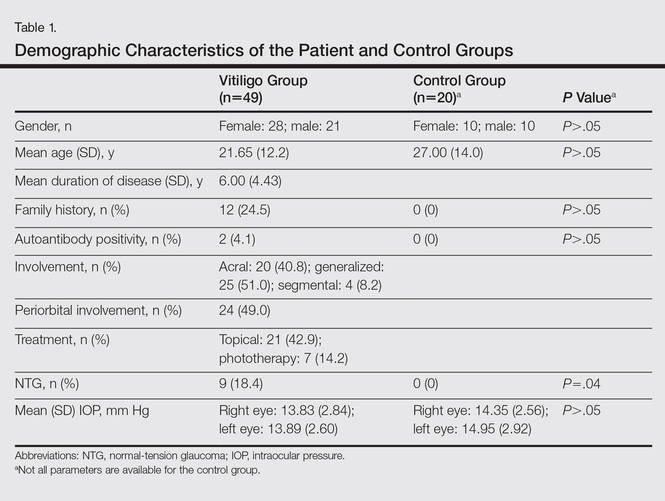
The study registered a total of 49 patients with vitiligo (28 female; 21 male) and 20 healthy controls (10 female; 10 male) with a variety of demographic and clinical characteristics (Table 1).
Mean (SD) IOP values were 13.83 (2.84) mm Hg for the right eye and 13.89 (2.60) mm Hg for the left eye in the vitiligo group. Values were 14.35 (2.56) mm Hg and 14.95 (2.92) mm Hg, respectively, in the control group. The IOP differences between the 2 groups were not statistically significant (P>.05).
Nine patients (18.4%) in the vitiligo group were found to have signs of normal-tension glaucoma (NTG). Optic nerve damage and vision loss occurs in the presence of normal IOP in NTG. There were no signs of NTG in the control group. Normal-tension glaucoma was diagnosed in the vitiligo group based on glaucomatous optic disc appearance, visual field defects, and structural analysis of the entire optic nerve head in confocal scanning laser ophthalmoscope. The NTG difference between the vitiligo and control groups was statistically significant (P=.04).
In the vitiligo group, of the 9 patients who had NTG, 6 had periorbital vitiligo lesions; the remaining 3 had none. Although patients who had periorbital lesions had a higher rate of glaucoma relative to the patients without periorbital lesions, the difference was not statistically significant (P>.05).
No statistically significant differences (P>.05) were found between patients with vitiligo with and without glaucoma in terms of age, sex, disease duration, family history of vitiligo, presence or absence of periorbital involvement, manner of involvement, percentage of the involved body areas, and IOP (Table 1).
Comment
Glaucoma is characterized by increased IOP, visual field loss, and changes in the optic nerve head. Although elevated IOP is common in ocular hypertension as well as in glaucoma, there is no glaucomatous visual field loss in ocular hypertension. In NTG, on the other hand, glaucomatous visual field loss and optic nerve head changes occur without an increase in IOP.6 Normal-tension glaucoma is a particular type of open-angle glaucoma. It is believed that NTG and high-tension glaucoma induce optic nerve head damage through different means.7 Alternative theories have been put forth to account for the glaucomatous damage to the optic nerve head that occurs in NTG, despite normal or close to normal IOP. These theories include vascular disorders (eg, ischemia, which interrupts the orthograde or retrograde axonal transport), excessive accumulation of free radicals, triggering of apoptosis, and low resistance of lamina cribrosa.8
Although there are various studies exploring ocular symptoms in patients with vitiligo,9-15 only 1 study has examined the incidence of glaucoma in this group of patients.5 Biswas et al11 examined ocular signs in 100 patients with vitiligo and found that 23% of patients had hypopigmented foci in the iris, 18% had pigmentation in the anterior chamber, 11% had chorioretinal degeneration, 9% had hypopigmentation of the retinal pigment epithelium, 5% had uveitis, and 34% were evaluated as normal. In this study, the authors concluded that there was a strong relationship between vitiligo and eye diseases.11 When Gopal et al9 compared the eye examinations of 150 vitiligo patients and 100 healthy controls, they found uveitis, iris, and retinal pigmentary abnormalities in 16% of the vitiligo patients (P<.001).
Rogosić et al5 examined the incidence of glaucoma in 42 patients with vitiligo and found primary open-angle glaucoma in 24 (57%) patients. The patients had a mean age of 56 years, mean disease duration of 13 years, and mean IOP of 18 mm Hg for the right eye and 17.5 mm Hg for the left eye. The incidence of glaucoma was significantly higher in patients with vitiligo (P<.001) and increased with disease duration.5
Similar studies, however, have failed to show a relationship between vitiligo and glaucoma. In a study that evaluated the retinal pigment epithelium and the optic nerve in patients with vitiligo, Perossini et al10 found that the fundus examination of the patients was perfectly normal.
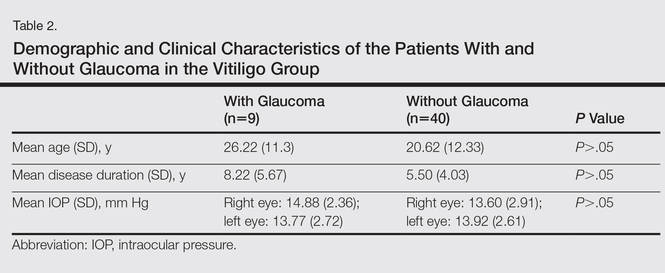
In our study, we detected NTG in 18.4% of patients with vitiligo. We did not find a significant statistical difference between patients with and without glaucoma (Table 2). Rogosić et al5 found a significant relationship between age and glaucoma incidence, but we did not find such a relationship, which we believe is because the mean age of our patients was lower than the prior study.
In vitiligo, melanocytes are destroyed through an unknown mechanism. Although the cellular and molecular mechanisms causing melanocytic destruction have not yet been determined, various hypotheses have been put forward to explain the etiopathogenesis of vitiligo. Among these, the most commonly held hypotheses are the neural, self-destruction, and autoimmune hypotheses.16
Based on the observation that stress and serious trauma could precipitate or trigger the onset of vitiligo,16 the neural hypothesis holds that neurochemical mediators released from the edges of the nerve endings exert toxic effects on melanocytes. The fact that both melanocytes and choroidal pigment cells originate from the mesenchyme and dermatomal spreading of segmental vitiligo are arguments propounded in favor of this hypothesis.17
The self-destruction hypothesis suggests that the intrinsic protective mechanisms that normally enable melanocytes to eliminate toxic intermediate products or metabolites on the melanogenesis path have been impaired in patients with vitiligo.18,19 There is evidence of increased oxidative stress over the whole epidermis of patients with vitiligo.20 Thus, free radicals affect melanin and cause membrane damage via lipid peroxidation reactions.21
The autoimmune hypothesis proposes a clinical relationship between vitiligo and several diseases believed to be autoimmune. Because the macrophage infiltration observed in vitiligo lesions is more pronounced on the perilesional skin, this hypothesis holds that macrophages may play a role in melanocyte removal.21 The Koebner phenomenon observed in vitiligo lends support to the critical role of trauma in the etiopathogenesis of the disease.
Although we could not explain the co-presence of vitiligo and glaucoma, we believe that it may result from the fact that both diseases are observed in tissues that have the same embryologic origin and etiology, perhaps vascular or neural disorders, excessive accumulation of free radicals, or the triggering of apoptosis. Dermatologists should be alert to the presence of glaucoma in patients with vitiligo because glaucoma is an eye disease that progresses slowly and may lead to vision loss.
1. Ortonne JP. Vitiligo and other disorders of hypopigmentation. In: Bolognia JB, Jorizzo JL, Rapini RP, eds. Dermatology. 1st ed. New York, NY: Mosby; 2003:947-973.
2. Ortonne JP, Bahadoran P, Fitzpatrick TB, et al. Hypomelanoses and hypermelanoses. In: Freedberg IM, Eisen AZ, Wolff K, eds. Fitzpatrick’s Dermatology in General Medicine. 6th ed. New York, NY: McGraw-Hill; 2003:836-881.
3. van den Wijngaard R, Wijngaard R, Wankowiczs-Kalinsa A, et al. Autoimmune melanocyte destruction in vitiligo. Lab Invest. 2001;81:1061-1067.
4. Shields MB, Ritch R, Krupin T. Classification of the glaucomas. In: Ritch R, Shields MB, Krupin T, eds. The Glaucomas. St Louis, MO: C.V. Mosby Co; 1996:717-725.
5. Rogosić V, Bojić L, Puizina-Ivić N, et al. Vitiligo and glaucoma–an association or a coincidence? a pilot study. Acta Dermatovenerol Croat. 2010;18:21-26.
6. Anderson DR. Normal-tension glaucoma (low-tension glaucoma). Indian J Ophthalmol. 2011;59(suppl 59):S97-S101.
7. Iwata K. Primary open angle glaucoma and low tension glaucoma–pathogenesis and mechanism of optic nerve damage [in Japanese]. Nippon Ganka Gakkai Zasshi. 1992;96:1501-1531.
8. Hitchings RA, Anderton SA. A comparative study of visual field defects seen in patients with low-tension glaucoma and chronic simple glaucoma. Br J Ophthalmol. 1983;67:818-821.
9. Gopal KV, Rama Rao GR, Kumar YH, et al. Vitiligo: a part of a systemic autoimmune process. Indian J Dermatol Venereol Leprol. 2007;73:162-165.
10. Perossini M, Turio E, Perossini T, et al. Vitiligo: ocular and electrophysiological findings. G Ital Dermatol Venereol. 2010;145:141-149.
11. Biswas G, Barbhuiya JN, Biswas MC, et al. Clinical pattern of ocular manifestations in vitiligo. J Indian Med Assoc. 2003;101:478-480.
12. Park S, Albert DM, Bolognia JL. Ocular manifestations of pigmentary disorders. Dermatol Clin. 1992;10:609-622.
13. Albert DM, Nordlund JJ, Lerner AB. Ocular abnormalities occurring with vitiligo. Ophthalmology. 1979;86:1145-1160.
14. Wagoner MD, Albert DM, Lerner AB, et al. New observations on vitiligo and ocular disease. Am J Ophthalmol. 1983;96:16-26.
15. Cowan CL Jr, Halder RM, Grimes PE, et al. Ocular disturbances in vitiligo. J Am Acad Dermatol. 1986;15:17-24.
16. Orecchia GE. Neural pathogenesis. In: Hann SK, Nordlund JJ. Vitiligo. Oxford, England: Blackwell Science Ltd; 2000:142-150.
17. Braun-Falco O, Plewig G, Wolf HH, et al. Disorders of melanin pigmentation. In: Bartels V, ed. Dermatology. Berlin, Germany: Springer; 2000:1013-1042.
18. Tüzün Y, Kotoğyan A, Aydemir EH, et al. Pigmentasyon bozuklukları. In: Baransü O. Dermatoloji. 2nd ed. Istanbul: Nobel Tıp Kitabevi; 1994:557-559.
19. Odom RB, James WD, Berger TG. Disturbances of pigmentation. In: Odom RB, James WD, Berger TG. Andrews’ Diseases of the Skin. 9th ed. Philadelphia, PA: W.B. Saunders Company; 2000:1065-1068.
20. Schallreuter KU. Biochemical theory of vitiligo: a role of pteridines in pigmentation. In: Hann SK, Nordlund JJ. Vitiligo. London, England: Blackwell Science Ltd; 2000:151-159.
21. van den Wijngaard R, Wankowicz-Kalinska A, Le Poole C, et al. Local immune response in skin of generalized vitiligo patients. destruction of melanocytes is associated with the predominent presence of CLA+T cells at the perilesional site. Lab Invest. 2000;80:1299-1309.
Vitiligo is an acquired idiopathic disease of unknown etiology. Characterized by depigmented maculae and melanocytic destruction, it usually presents in childhood or young adulthood. The incidence of vitiligo ranges from 0.5% to 2% globally and there is no racial or gender predilection.1
Patients with vitiligo may exhibit pigmentary abnormalities of the iris and retina.2 Noninflammatory depigmented lesions of the ocular fundus observed in vitiligo indicate a local loss of melanocytes.1 The fact that melanocytes are present not only in the skin and roots of the hair but also in the uvea and stria vascularis of the inner ear may explain the ophthalmologic disorders that accompany vitiligo.3 The term glaucoma refers to a large number of diseases that share a common feature: a distinctive and progressive optic neuropathy that may derive from various risks and is associated with a gradual loss of the visual field. If the disorder is not diagnosed and treated properly it could cause blindness.
Glaucoma is classified on the basis of the underlying abnormality that causes intraocular pressure (IOP) to rise. Glaucoma is first divided into open-angle and angle-closure glaucoma; glaucoma associated with developmental anomalies is then subdivided according to specific alterations.4
A PubMed search of articles indexed for MEDLINE using the terms vitiligo and glaucoma revealed only 1 study examining the incidence of glaucoma in patients with vitiligo.5 In the study reported here, we determined the presence of and possible risk factors for glaucoma in patients with vitiligo who had presented to the dermatology polyclinic.
Methods
We registered 49 patients diagnosed with vitiligo by clinical and Wood light examination and 20 age- and sex-matched healthy controls. Patients who were using topical corticosteroid treatments for vitiligo lesions located on the face were excluded from the study due to the glaucoma-inducing effects of corticosteroids. Similarly, patients who received drugs with sympathetic and parasympathetic action that can cause glaucoma were excluded.
The patients received a comprehensive ophthalmologic examination that included visual acuity testing, refraction, IOP measurement, gonioscopy, and fundus examination. All patients and controls underwent visual field tests and optic nerve head analyses using a confocal scanning laser ophthalmoscope. Glaucoma was diagnosed based on fundus examination, IOP measurement, field of vision evaluation, and optic nerve head analysis.
Informed consent was obtained from all participants. The research protocol was approved by the university hospital ethics committee.
Results
The study registered a total of 49 patients with vitiligo (28 female; 21 male) and 20 healthy controls (10 female; 10 male) with a variety of demographic and clinical characteristics (Table 1).
Mean (SD) IOP values were 13.83 (2.84) mm Hg for the right eye and 13.89 (2.60) mm Hg for the left eye in the vitiligo group. Values were 14.35 (2.56) mm Hg and 14.95 (2.92) mm Hg, respectively, in the control group. The IOP differences between the 2 groups were not statistically significant (P>.05).
Nine patients (18.4%) in the vitiligo group were found to have signs of normal-tension glaucoma (NTG). Optic nerve damage and vision loss occurs in the presence of normal IOP in NTG. There were no signs of NTG in the control group. Normal-tension glaucoma was diagnosed in the vitiligo group based on glaucomatous optic disc appearance, visual field defects, and structural analysis of the entire optic nerve head in confocal scanning laser ophthalmoscope. The NTG difference between the vitiligo and control groups was statistically significant (P=.04).
In the vitiligo group, of the 9 patients who had NTG, 6 had periorbital vitiligo lesions; the remaining 3 had none. Although patients who had periorbital lesions had a higher rate of glaucoma relative to the patients without periorbital lesions, the difference was not statistically significant (P>.05).
No statistically significant differences (P>.05) were found between patients with vitiligo with and without glaucoma in terms of age, sex, disease duration, family history of vitiligo, presence or absence of periorbital involvement, manner of involvement, percentage of the involved body areas, and IOP (Table 1).
Comment
Glaucoma is characterized by increased IOP, visual field loss, and changes in the optic nerve head. Although elevated IOP is common in ocular hypertension as well as in glaucoma, there is no glaucomatous visual field loss in ocular hypertension. In NTG, on the other hand, glaucomatous visual field loss and optic nerve head changes occur without an increase in IOP.6 Normal-tension glaucoma is a particular type of open-angle glaucoma. It is believed that NTG and high-tension glaucoma induce optic nerve head damage through different means.7 Alternative theories have been put forth to account for the glaucomatous damage to the optic nerve head that occurs in NTG, despite normal or close to normal IOP. These theories include vascular disorders (eg, ischemia, which interrupts the orthograde or retrograde axonal transport), excessive accumulation of free radicals, triggering of apoptosis, and low resistance of lamina cribrosa.8
Although there are various studies exploring ocular symptoms in patients with vitiligo,9-15 only 1 study has examined the incidence of glaucoma in this group of patients.5 Biswas et al11 examined ocular signs in 100 patients with vitiligo and found that 23% of patients had hypopigmented foci in the iris, 18% had pigmentation in the anterior chamber, 11% had chorioretinal degeneration, 9% had hypopigmentation of the retinal pigment epithelium, 5% had uveitis, and 34% were evaluated as normal. In this study, the authors concluded that there was a strong relationship between vitiligo and eye diseases.11 When Gopal et al9 compared the eye examinations of 150 vitiligo patients and 100 healthy controls, they found uveitis, iris, and retinal pigmentary abnormalities in 16% of the vitiligo patients (P<.001).
Rogosić et al5 examined the incidence of glaucoma in 42 patients with vitiligo and found primary open-angle glaucoma in 24 (57%) patients. The patients had a mean age of 56 years, mean disease duration of 13 years, and mean IOP of 18 mm Hg for the right eye and 17.5 mm Hg for the left eye. The incidence of glaucoma was significantly higher in patients with vitiligo (P<.001) and increased with disease duration.5
Similar studies, however, have failed to show a relationship between vitiligo and glaucoma. In a study that evaluated the retinal pigment epithelium and the optic nerve in patients with vitiligo, Perossini et al10 found that the fundus examination of the patients was perfectly normal.
In our study, we detected NTG in 18.4% of patients with vitiligo. We did not find a significant statistical difference between patients with and without glaucoma (Table 2). Rogosić et al5 found a significant relationship between age and glaucoma incidence, but we did not find such a relationship, which we believe is because the mean age of our patients was lower than the prior study.
In vitiligo, melanocytes are destroyed through an unknown mechanism. Although the cellular and molecular mechanisms causing melanocytic destruction have not yet been determined, various hypotheses have been put forward to explain the etiopathogenesis of vitiligo. Among these, the most commonly held hypotheses are the neural, self-destruction, and autoimmune hypotheses.16
Based on the observation that stress and serious trauma could precipitate or trigger the onset of vitiligo,16 the neural hypothesis holds that neurochemical mediators released from the edges of the nerve endings exert toxic effects on melanocytes. The fact that both melanocytes and choroidal pigment cells originate from the mesenchyme and dermatomal spreading of segmental vitiligo are arguments propounded in favor of this hypothesis.17
The self-destruction hypothesis suggests that the intrinsic protective mechanisms that normally enable melanocytes to eliminate toxic intermediate products or metabolites on the melanogenesis path have been impaired in patients with vitiligo.18,19 There is evidence of increased oxidative stress over the whole epidermis of patients with vitiligo.20 Thus, free radicals affect melanin and cause membrane damage via lipid peroxidation reactions.21
The autoimmune hypothesis proposes a clinical relationship between vitiligo and several diseases believed to be autoimmune. Because the macrophage infiltration observed in vitiligo lesions is more pronounced on the perilesional skin, this hypothesis holds that macrophages may play a role in melanocyte removal.21 The Koebner phenomenon observed in vitiligo lends support to the critical role of trauma in the etiopathogenesis of the disease.
Although we could not explain the co-presence of vitiligo and glaucoma, we believe that it may result from the fact that both diseases are observed in tissues that have the same embryologic origin and etiology, perhaps vascular or neural disorders, excessive accumulation of free radicals, or the triggering of apoptosis. Dermatologists should be alert to the presence of glaucoma in patients with vitiligo because glaucoma is an eye disease that progresses slowly and may lead to vision loss.
1. Ortonne JP. Vitiligo and other disorders of hypopigmentation. In: Bolognia JB, Jorizzo JL, Rapini RP, eds. Dermatology. 1st ed. New York, NY: Mosby; 2003:947-973.
2. Ortonne JP, Bahadoran P, Fitzpatrick TB, et al. Hypomelanoses and hypermelanoses. In: Freedberg IM, Eisen AZ, Wolff K, eds. Fitzpatrick’s Dermatology in General Medicine. 6th ed. New York, NY: McGraw-Hill; 2003:836-881.
3. van den Wijngaard R, Wijngaard R, Wankowiczs-Kalinsa A, et al. Autoimmune melanocyte destruction in vitiligo. Lab Invest. 2001;81:1061-1067.
4. Shields MB, Ritch R, Krupin T. Classification of the glaucomas. In: Ritch R, Shields MB, Krupin T, eds. The Glaucomas. St Louis, MO: C.V. Mosby Co; 1996:717-725.
5. Rogosić V, Bojić L, Puizina-Ivić N, et al. Vitiligo and glaucoma–an association or a coincidence? a pilot study. Acta Dermatovenerol Croat. 2010;18:21-26.
6. Anderson DR. Normal-tension glaucoma (low-tension glaucoma). Indian J Ophthalmol. 2011;59(suppl 59):S97-S101.
7. Iwata K. Primary open angle glaucoma and low tension glaucoma–pathogenesis and mechanism of optic nerve damage [in Japanese]. Nippon Ganka Gakkai Zasshi. 1992;96:1501-1531.
8. Hitchings RA, Anderton SA. A comparative study of visual field defects seen in patients with low-tension glaucoma and chronic simple glaucoma. Br J Ophthalmol. 1983;67:818-821.
9. Gopal KV, Rama Rao GR, Kumar YH, et al. Vitiligo: a part of a systemic autoimmune process. Indian J Dermatol Venereol Leprol. 2007;73:162-165.
10. Perossini M, Turio E, Perossini T, et al. Vitiligo: ocular and electrophysiological findings. G Ital Dermatol Venereol. 2010;145:141-149.
11. Biswas G, Barbhuiya JN, Biswas MC, et al. Clinical pattern of ocular manifestations in vitiligo. J Indian Med Assoc. 2003;101:478-480.
12. Park S, Albert DM, Bolognia JL. Ocular manifestations of pigmentary disorders. Dermatol Clin. 1992;10:609-622.
13. Albert DM, Nordlund JJ, Lerner AB. Ocular abnormalities occurring with vitiligo. Ophthalmology. 1979;86:1145-1160.
14. Wagoner MD, Albert DM, Lerner AB, et al. New observations on vitiligo and ocular disease. Am J Ophthalmol. 1983;96:16-26.
15. Cowan CL Jr, Halder RM, Grimes PE, et al. Ocular disturbances in vitiligo. J Am Acad Dermatol. 1986;15:17-24.
16. Orecchia GE. Neural pathogenesis. In: Hann SK, Nordlund JJ. Vitiligo. Oxford, England: Blackwell Science Ltd; 2000:142-150.
17. Braun-Falco O, Plewig G, Wolf HH, et al. Disorders of melanin pigmentation. In: Bartels V, ed. Dermatology. Berlin, Germany: Springer; 2000:1013-1042.
18. Tüzün Y, Kotoğyan A, Aydemir EH, et al. Pigmentasyon bozuklukları. In: Baransü O. Dermatoloji. 2nd ed. Istanbul: Nobel Tıp Kitabevi; 1994:557-559.
19. Odom RB, James WD, Berger TG. Disturbances of pigmentation. In: Odom RB, James WD, Berger TG. Andrews’ Diseases of the Skin. 9th ed. Philadelphia, PA: W.B. Saunders Company; 2000:1065-1068.
20. Schallreuter KU. Biochemical theory of vitiligo: a role of pteridines in pigmentation. In: Hann SK, Nordlund JJ. Vitiligo. London, England: Blackwell Science Ltd; 2000:151-159.
21. van den Wijngaard R, Wankowicz-Kalinska A, Le Poole C, et al. Local immune response in skin of generalized vitiligo patients. destruction of melanocytes is associated with the predominent presence of CLA+T cells at the perilesional site. Lab Invest. 2000;80:1299-1309.
Practice Points
- Patients with vitiligo may exhibit pigmentary abnormalities of the iris and retina.
- Normal-tension glaucoma may develop in patients with vitiligo.
- Glaucoma progresses slowly and may lead to vision loss; as a result, dermatologists should be alert to the presence of glaucoma in vitiligo patients.

Changing Treatment Landscape of Hepatitis C Virus Infection Among Penitentiary Inmates
The incidence of hepatitis C virus (HCV) infection increased markedly in the 1970s and 1980s. These increases were mainly attributable to blood transfusions and injection drug use.1,2 The blood supply was not screened for HCV before 1992 (now, HCV infection by blood transfusion is rare).2,3 Surveillance of the period 1992-2003 showed a substantial decrease in the incidence of acute hepatitis C cases, and the rate remained steady through 2010.2,3 Over the past 5 years, HCV has returned to national attention with a rising infection rate (2.5-fold increase during 2010-2013) and a rapid succession of FDA approvals of direct-acting antiviral agents (DAAs).4 Currently, the most prevalent mode of infection is injection drug use, accounting for > 50% of all cases of HCV infection and 84% of acute HCV infections.5
Baby boomers (people born between 1945 and 1965) account for three-fourths of the population currently living with chronic HCV infection resulting from past infection.6 Historically, rates of acute and chronic infection have been far higher for blacks than for whites and Hispanics.2,4,7,8 In 2004, that trend started to reverse, with the incidence in whites surpassing that in blacks.4 Recent reports have identified a new cohort of HCV-infected injection drug users (IDUs) who are young (aged ≤ 24 years) and white nonurban dwellers.5
HCV Infection Among High Risk Individuals
In the U.S., unlike in other parts of the world, HCV infection is more prevalent than hepatitis B virus (HBV) infection.4,9,10 According to the National Health and Nutrition Examination Survey (NHANES), about 2.7 million Americans have chronic HCV infection. However, NHANES surveys do not sample certain populations, including the incarcerated and the homeless, in whom infection rates are thought to be higher.11 The incarcerated, the largest institutionalized group, have the highest incidence: One in 3 is infected with HCV.12 This rate is attributable to high rates of injection drug use and other high-risk behaviors. Drug-related offenses account for 50% of federal prison incarceration.13 For IDUs, the HCV infection rate is as high as 70% to 90%. Despite widespread implementation of needle-exchange programs after the discovery of HIV in the 1980s, recent surveys have indicated that about one-third of 18- to 30-year-old active IDUs are infected with HCV.14
Penitentiary Inmates Infected With HCV
A 2015 search of the Federal Bureau of Prisons (BOP) electronic medical records at the U.S. Penitentiary Canaan (USP Canaan) found that out of a population of about 1,600 inmates, 182 (11%) had tested positive for HCV antibodies (anti-HCV). This percentage likely is an underestimation, because HCV testing is not mandatory, and many (45%-85%) of the infected are unaware of their HCV infection status.2 Most of the infected remain chronically infected and are not being treated.
Prevalence of HCV infection commonly refers to chronic HCV infection. The diagnosis of chronic HCV infection is established by presence of HCV RNA on polymerase chain reaction assays. Of the 182 inmates who tested positive for anti-HCV, 45 had their cases resolved (undetectable HCV RNA), 34 spontaneously, and the other 11 after treatment, primarily with peginterferon and ribavirin (pegINF/RBV) dual therapies. The remaining 137 who tested positive remained chronically infected. This chronically infected group represented 9% of the population of 1,600 inmates. Although the infection rate is significantly higher than that in the general population (1% incidence), the inmates’ true rate of infection in all probability is much higher.11
Earlier NHANES data showed HCV more prevalent in minorities, particularly blacks, compared with whites.2,7,8 At USP Canaan, however, the incidence of chronic HCV infection was 21% in whites (mean age, 42 years), 4% in blacks (mean age, 51 years), and 7% in Hispanics (mean age, 39 years). The lower rates in blacks and Hispanics could have resulted from a lack of awareness about getting tested or from having fewer opportunities to obtain medical care in the community before incarceration (the infection can remain asymptomatic for several decades).
HCV genotype 1 is the most common HCV genotype in the U.S.5,15 At USP Canaan, genotype 1 accounted for 56% of the cases of chronic HCV infection in whites, 90% in blacks, and 79% in Hispanics. The majority genotype was subtype 1a.
Of the 137 inmates with HCV co-infections, 8 (6%) had HIV/HCV co-infection, and 4 (3%) had HBV/HCV co-infection. Also, 7 (5%) were diabetic. According to the American Association for the Study of Liver Diseases and the Infectious Diseases Society of America (AASLD/IDSA) guidelines, patients with comorbidities are a high priority for treatment, as there is a high risk for complications, with liver fibrosis progressing more rapidly.16
Changing Landscape of HCV Treatment
Treatments for chronic HCV infection have never been more promising. There is the prospect of a cure with the new DAAs. These new medications are active against HCV and interfere with viral enzymes and other proteins essential for viral replication. Until recently, the mainstay of treatment for chronic HCV infection was pegINF/RBV. However, INF-based dual therapies were associated with high rates of adverse effects (AEs) and treatment discontinuation. In 2011, release of the protease inhibitors (PIs) boceprevir and telaprevir improved sustained virologic response (SVR) rates for treatment-naïve patients with genotype 1 from about 50% (pegINF/RBV dual therapies) to 70% to 75% (PI in combination with pegINF/RBV triple therapies). However, first-generation DAAs were INF-based, and their dosing was cumbersome.15,17-19
Starting with the 2013 approval of simeprevir (second-wave PI) and sofosbuvir (polymerase inhibitor), most patients’ SVR rates improved to 75% to 90%.20,21 Sustained virologic response rates were boosted to > 95% after the 2014 approval of Harvoni, coformulated ledispasvir (replication complex inhibitor) and sofosbuvir, and Viekira Pak, a combination of ombitasvir (replication complex inhibitor), paritaprevir (PI), and ritonavir (inhibitor of CYP3A4 enzyme) co-packaged with dasabuvir (polymerase inhibitor).22-24 In 2015, daclatasvir (replication complex inhibitor) was approved, followed in 2016 by Zepatier, coformulated elbasvir (replication complex inhibitor) and grazoprevir (PI). Harvoni has simplified the treatment regimen to 1 pill a day and shortened the duration of treatment to as few as 8 weeks for some
patients.25
The option of an all-oral, INF-free treatment regimen and the prospect of freedom from the HCV could not come at a more opportune time, given the aging of baby boomers with chronic HCV infection and the high rates of HCV and HIV infections contracted in the 1970s and 1980s. An estimated one-third of those infected is expected to develop cirrhosis within 20 years.26
Cost of HCV Treatment
The U.S. has the highest health care costs in the world—consuming 17% of the nation’s gross domestic product.27,28 Health care costs also have been steadily increasing in U.S. prisons because of the expanding and aging incarcerated population. The Eighth Amendment provides inmates with the constitutional right to health care. The BOP’s overall expense of pharmaceuticals for HCV treatment has soared in recent years. It was kept below $2 million in fiscal years 2010 and 2011 but more than doubled the next 2 years, to more than $4 million in 2012 and 2013, and increased in 2014 to about $6 million. Hepititis C treatment accounted for 3% of the BOP pharmaceutical budget in 2011 and 7% in 2014.29 Increased HCV pharmaceutical expenses were attributable to the introduction of DAAs. Even so, the majority of inmates with chronic HCV infection remained untreated.
Compared with DAA PIs, sofosbuvir is a game changer. Its all-oral, INF-free regimen makes treatment of chronic HCV infection more effective and safer. However, its cost is prohibitive, even in rich countries: A 12-week course costs $84,000, and Harvoni (ledispasvir/ sofosbuvir) costs $94,000.30,31 A generic version of sofosbuvir is not expected until 2025.32 Many studies have been conducted on the cost-effectiveness of these newer DAAs, but the picture is unclear, as the results were sensitive to drug price, drug efficacy (SVR rates vary with genotype and patient profile), quality of life after successful treatment, and the willingness-to-pay threshold.30 Ironically, treatment cost could be the primary barrier to HCV eradication.
At USP Canaan, 137 inmates with chronic HCV infection potentially could have benefited from treatment. A majority (91 inmates) were infected with HCV genotype 1; of the other 46 inmates, 12 had genotype 2, 18 had genotype 3, 2 had genotype 4, and 14 lacked genotyping.
The all-oral, INF-free regimen obviates the need for weekly injection, and treatment duration is shorter. The AASLD/IDSA treatment guidelines recommend all-oral, INF-free treatment regimens for all patients with genotype 1. Typically, treatment lasts 12 or 24 weeks, depending on presence or absence of liver cirrhosis, among other considerations.16
Because of the high cost of treating all inmates with chronic HCV infection, the large number of inmates who are asymptomatic, and the potential decrease in medication costs after the introduction of generic versions, inmates are being prioritized for treatment based primarily on staging (presence or absence of liver disease). The rationale for using staging for prioritization is that patients with chronic HCV infection and no or minimal fibrosis at presentation seem to progress slowly, and treatment possibly can be delayed or withheld; whereas patients with significant fibrosis (septal or bridging fibrosis) progress almost invariably to cirrhosis over a 10- to 20-year period, so antiviral treatment becomes urgent.33
APRI: Biomarker for Liver Fibrosis
A liver biopsy is the gold standard for the diagnosis of liver fibrosis. Although generally safe, it is costly. It is also subject to sampling error and examiner discrepancy, which lead to incorrect staging of fibrosis in 20% of patients.5,33 Alternatively, various biologic markers can be used to diagnose liver disease. The aspartate aminotransferase (AST) platelet ratio index (APRI) is a simple and useful index based on readily available laboratory results: AST level and platelet count. APRI correlated significantly with fibrosis stage in patients with chronic HCV infection.33
At USP Canaan, 16 (12%) of the 137 inmates with chronic HCV infection had an APRI higher than 1, and 5 of the 16 had an APRI higher than 2.
Conclusion
In coming years, treatment of chronic HCV infection will consume a more significant portion of the health care budget. As treatment becomes more efficacious and safer, the paradigm may shift from a stage-based strategy to a treat-all strategy. Possibly, more inmates will ask for treatment as the treatment burden lessens due to fewer treatment-associated AEs. However, despite the efficacy of HCV treatment, there is no reduction in the overall lifetime medical costs, because the offset in downstream direct medical costs (from successful treatment) is less than the cost of a cure.30
In the BOP, many challenges remain: HCV infection rates are expected to be high, treatment costs astronomical, resources limited, and treated patients may become reinfected if high-risk behavior continues. Patient education is, therefore, an important component of effective prevention and treatment strategies. The U.S. Preventive Services Task Force recommends HCV screening for all high-risk persons and a onetime screening for all baby boomers.34 Federal prisons offer HCV testing to all inmates with risk factors, when clinically indicated, or on
request.
All inmates with chronic HCV infection were being monitored for treatment prioritization, as some were at higher risk for complications or disease progression and required more urgent treatment.35 Ideally, all inmates should be treated, as incarcerated persons are at elevated risk for HCV transmission, and successful treatment would benefit public health by reducing infection rates in the community.16 However, resource constraints are a reality in health care, particularly among underserved populations, and this situation provides the rationale for screening, monitoring, and treatment prioritization. This step-by-step approach, which rests on sound clinical judgment, helps control the budget.
Click here for the digital edition.
1. Centers for Disease Control and Prevention. Recommendations for prevention and control of hepatitis C virus (HCV) infection and HCV-related chronic disease. MMWR Recomm Rep. 1998;47(RR-19):1-39.
2. Ditah I, Ditah F, Devaki P, et al. The changing epidemiology of hepatitis C virus infection in the United States: National Health and Nutrition Examination Survey 2001 through 2010. J Hepatol. 2014;60(4):691-698.
3. Daniels D, Grytdal S, Wasley A; Centers for Disease Control and Prevention (CDC). Surveillance for acute viral hepatitis - United States, 2007. MMWR Surveill Summ. 2009;58(3):1-27.
4. Centers for Disease Control and Prevention, Division of Viral Hepatitis and National Center for HIV/AIDS, Viral Hepatitis, STD, and TB Prevention. Viral Hepatitis Surveillance—United States, 2013. Centers for Disease Control and Prevention Website. http://www.cdc.gov/hepatitis/statistics/2013surveillance/pdfs/2013hepsurveillancerpt.pdf. Updated April 24, 2015. Accessed May 20, 2015.
5. Hepatitis C Online. Hepatitis C Online Website. http://www.hepatitisc.uw.edu. Accessed March 3, 2016.
6. Smith BD, Morgan RL, Beckett GA, et al; Centers for Disease Control and Prevention. Recommendations for the identification of chronic hepatitis C virus infection among persons born during 1945-1965. MMWR Recomm Rep. 2012;61(RR-4):1-32.
7. Alter KJ, Kruszon-Moran D, Nainan OV, et al. The prevalence of hepatitis C virus infection in the United States, 1988 through 1994. N Engl J Med. 1999;341(8):556-562.
8. Liu G, Holmberg SD, Kamili S, Xu F. Racial disparities in the proportion of current, unresolved hepatitis C virus infections in the United States, 2003-2010. Dig Dis Sci. 2014;59(8):1950-1957.
9. World Health Organization. Hepatitis B [fact sheet 204]. World Health Organization Website. http://www.who.int/mediacentre/factsheets/fs204/en. Updated July 2015. Accessed March 3, 2016.
10. World Health Organization. Hepatitis C [fact sheet 164]. World Health Organization Website. http://www.who.int/mediacentre/factsheets/fs164/en. Updated July 2015. Accessed March 3, 2016.
11. Denniston MM, Jiles RB, Drobeniuc J, et al. Chronic hepatitis C virus infection in the United States, National Health and Nutrition Examination Survey 2003 to 2010. Ann Intern Med. 2014;160(5):293-300.
12. Centers for Disease Control and Prevention. Hepatitis C and Incarceration. Publication No. 21-1306. Centers for Disease Control and Prevention Website. http://www.cdc.gov/hepatitis/HCV/PDFs/HepCIncarcerationFactSheet.pdf. October 2013. Accessed March 3, 2016.
13. Federal Bureau of Prisons. Inmate statistics: offenses. Federal Bureau of Prisons Website. http://www.bop.gov/about/statistics/statistics_inmate_offenses.jsp. Updated January 30, 2016. Accessed March 3, 2016.
14. Centers for Disease Control and Prevention. Hepatitis C FAQs for health professionals. Centers for Disease Control and Prevention Website. http://www.cdc.gov/hepatitis/HCV/HCVfaq.htm. Updated January 8, 2016. Accessed March 4, 2016.
15. Saab S, Gordon SC, Park H, Sulkowski M, Ahmed A, Younossi Z. Cost-effectiveness analysis of sofosbuvir plus peginterferon/ribavirin in the treatment of chronic hepatitis C virus genotype 1 infection. Aliment Pharmacol Ther. 2014;40(6):657-675.
16. American Association for the Study of Liver Diseases, Infectious Diseases Society of America. Recommendations for Testing, Managing, and Treating Hepatitis C. American Association for the Study of Liver Diseases and the Infectious Diseases Society of America Website. http://hcvguidelines.org. Updated February 2016. Accessed March 4, 2016.
17. Jacobson IM, McHutchison JG, Dusheiko G, et al; ADVANCE Study Team. Telaprevir for previously untreated chronic hepatitis C virus infection. N Engl J Med. 2011;364(25):2405-2416.
18. Kwo PY. Boceprevir: a novel nonstructural 3 (NS3) protease inhibitor for the treatment of chronic hepatitis C infection. Therap Adv Gastroenterol. 2012;5(3):179-188.
19. Stahmeyer JT, Rossol S, Krauth C. Outcomes, costs and cost-effectiveness of treating
hepatitis C with direct acting antivirals. J Comp Eff Res. 2015;4(3):267-277.
20. Lawitz E, Mangia A, Wyles D, et al. Sofosbuvir for previously untreated chronic hepatitis C infection. N Engl J Med. 2013;368(20):1878-1887.
21. Fried MW, Buti M, Dore GJ, et al. Once-daily simeprevir (TMC435) with pegylated interferon and ribavirin in treatment-naïve genotype 1 hepatitis C: the randomized PILLAR study. Hepatology. 2013;58(6):1918-1929.
22. Ferenci P, Bernstein D, Lalezari J, et al; PEARL-III Study; PEARL-IV Study. ABT-450/r-ombitasvir and dasabuvir with or without ribavirin for HCV. N Engl J Med. 2014;370(21):1983-1992.
23. Feld JJ, Kowdley KV, Coakley E, et al. Treatment of HCV with ABT-450/r-ombitasvir and dasabuvir with ribavirin. N Engl J Med. 2014;370(17):1594-1603.
24. Afdhal N, Zeuzem S, Kwo P, et al; ION-1 Investigators. Ledipasvir and sofosbuvir for untreated HCV genotype 1 infection. N Engl J Med. 2014;370(20):1889-1898.
25. Kowdley KV, Gordon SC, Reddy KR, et al; ION-3 Investigators. Ledipasvir and
sofosbuvir for 8 or 12 weeks for chronic HCV without cirrhosis. N Engl J Med. 2014;370(20):1879-1888.
26. Younossi ZM, Singer ME, Mir HM, Henry L, Hunt S. Impact of interferon free regimens on clinical and cost outcomes for chronic hepatitis C genotype 1 patients. J Hepatol. 2014;60(3):530-537.
27. The Economist Don’t kill Obamacare. The Economist Website. http://www.economist.com/news/leaders/21645730-supreme-court-considers-whether-gut-obamacare-evidence-mounting-law. Published May 7, 2015. Accessed March 4, 2016.
28. The World Bank. Health expenditure, total (% of GDP). The World Bank Website. http://data.worldbank.org/indicator/SH.XPD.TOTL.ZS. Published 2015. Accessed March 4, 2016.
29. Federal Bureau of Prisons, Health Services Division. 2015 BOP National P&T Minutes. Federal Bureau of Prisons intranet website. http://sallyport.bop.gov/co/hsd/pharmacy/docs/BOP_National_P&T_Minutes/2015%20BOP%20National%20P&T%20Minutes_Final.pdf. Published August 13, 2014. Accessed November 9, 2015.
30. Chhatwal J, Kanwal F, Roberts MS, Dunn MA. Cost-effectiveness and budget impact of hepatitis C virus treatment with sofosbuvir and ledipasvir in the United States. Ann Intern Med. 2015;162(6):397-406.
31. Sachs J. The drug that is bankrupting America. Huffington Post Website. http://www.huffingtonpost.com/jeffrey-sachs/the-drug-that-is-bankrupt_b_6692340
.html. Published February 16, 2015. Updated April 18, 2015. Accessed March 4, 2016.
32. Hill A, Khoo S, Fortunak J, Simmons B, Ford N. Minimum costs for producing hepatitis C direct-acting antivirals for use in large-scale treatment access programs in developing countries. Clin Infect Dis. 2014;58(7):928-936.
33. Wai CT, Greenson JK, Fontana RJ, et al. A simple noninvasive index can predict both significant fibrosis and cirrhosis in patients with chronic hepatitis C. Hepatology. 2003;38(2):518-526.
34. U.S. Preventive Services Task Force. Hepatitis C: screening. U.S. Preventive Services Task Force Website. http://www.uspreventiveservicestaskforce.org/Page/Document/UpdateSummaryFinal/hepatitis-c-screening?ds=1&s=hepatitis c. Updated July 2015. Accessed March 4, 2016.
35. Federal Bureau of Prisons. Evaluation and Management of Chronic Hepatitis C Virus (HCV) Infection [clinical practice guidelines]. Federal Bureau of Prisons Website. http://www.bop.gov/resources/pdfs/hepatitis_c.pdf. Published July 2015. Accessed March 4, 2016.
The incidence of hepatitis C virus (HCV) infection increased markedly in the 1970s and 1980s. These increases were mainly attributable to blood transfusions and injection drug use.1,2 The blood supply was not screened for HCV before 1992 (now, HCV infection by blood transfusion is rare).2,3 Surveillance of the period 1992-2003 showed a substantial decrease in the incidence of acute hepatitis C cases, and the rate remained steady through 2010.2,3 Over the past 5 years, HCV has returned to national attention with a rising infection rate (2.5-fold increase during 2010-2013) and a rapid succession of FDA approvals of direct-acting antiviral agents (DAAs).4 Currently, the most prevalent mode of infection is injection drug use, accounting for > 50% of all cases of HCV infection and 84% of acute HCV infections.5
Baby boomers (people born between 1945 and 1965) account for three-fourths of the population currently living with chronic HCV infection resulting from past infection.6 Historically, rates of acute and chronic infection have been far higher for blacks than for whites and Hispanics.2,4,7,8 In 2004, that trend started to reverse, with the incidence in whites surpassing that in blacks.4 Recent reports have identified a new cohort of HCV-infected injection drug users (IDUs) who are young (aged ≤ 24 years) and white nonurban dwellers.5
HCV Infection Among High Risk Individuals
In the U.S., unlike in other parts of the world, HCV infection is more prevalent than hepatitis B virus (HBV) infection.4,9,10 According to the National Health and Nutrition Examination Survey (NHANES), about 2.7 million Americans have chronic HCV infection. However, NHANES surveys do not sample certain populations, including the incarcerated and the homeless, in whom infection rates are thought to be higher.11 The incarcerated, the largest institutionalized group, have the highest incidence: One in 3 is infected with HCV.12 This rate is attributable to high rates of injection drug use and other high-risk behaviors. Drug-related offenses account for 50% of federal prison incarceration.13 For IDUs, the HCV infection rate is as high as 70% to 90%. Despite widespread implementation of needle-exchange programs after the discovery of HIV in the 1980s, recent surveys have indicated that about one-third of 18- to 30-year-old active IDUs are infected with HCV.14
Penitentiary Inmates Infected With HCV
A 2015 search of the Federal Bureau of Prisons (BOP) electronic medical records at the U.S. Penitentiary Canaan (USP Canaan) found that out of a population of about 1,600 inmates, 182 (11%) had tested positive for HCV antibodies (anti-HCV). This percentage likely is an underestimation, because HCV testing is not mandatory, and many (45%-85%) of the infected are unaware of their HCV infection status.2 Most of the infected remain chronically infected and are not being treated.
Prevalence of HCV infection commonly refers to chronic HCV infection. The diagnosis of chronic HCV infection is established by presence of HCV RNA on polymerase chain reaction assays. Of the 182 inmates who tested positive for anti-HCV, 45 had their cases resolved (undetectable HCV RNA), 34 spontaneously, and the other 11 after treatment, primarily with peginterferon and ribavirin (pegINF/RBV) dual therapies. The remaining 137 who tested positive remained chronically infected. This chronically infected group represented 9% of the population of 1,600 inmates. Although the infection rate is significantly higher than that in the general population (1% incidence), the inmates’ true rate of infection in all probability is much higher.11
Earlier NHANES data showed HCV more prevalent in minorities, particularly blacks, compared with whites.2,7,8 At USP Canaan, however, the incidence of chronic HCV infection was 21% in whites (mean age, 42 years), 4% in blacks (mean age, 51 years), and 7% in Hispanics (mean age, 39 years). The lower rates in blacks and Hispanics could have resulted from a lack of awareness about getting tested or from having fewer opportunities to obtain medical care in the community before incarceration (the infection can remain asymptomatic for several decades).
HCV genotype 1 is the most common HCV genotype in the U.S.5,15 At USP Canaan, genotype 1 accounted for 56% of the cases of chronic HCV infection in whites, 90% in blacks, and 79% in Hispanics. The majority genotype was subtype 1a.
Of the 137 inmates with HCV co-infections, 8 (6%) had HIV/HCV co-infection, and 4 (3%) had HBV/HCV co-infection. Also, 7 (5%) were diabetic. According to the American Association for the Study of Liver Diseases and the Infectious Diseases Society of America (AASLD/IDSA) guidelines, patients with comorbidities are a high priority for treatment, as there is a high risk for complications, with liver fibrosis progressing more rapidly.16
Changing Landscape of HCV Treatment
Treatments for chronic HCV infection have never been more promising. There is the prospect of a cure with the new DAAs. These new medications are active against HCV and interfere with viral enzymes and other proteins essential for viral replication. Until recently, the mainstay of treatment for chronic HCV infection was pegINF/RBV. However, INF-based dual therapies were associated with high rates of adverse effects (AEs) and treatment discontinuation. In 2011, release of the protease inhibitors (PIs) boceprevir and telaprevir improved sustained virologic response (SVR) rates for treatment-naïve patients with genotype 1 from about 50% (pegINF/RBV dual therapies) to 70% to 75% (PI in combination with pegINF/RBV triple therapies). However, first-generation DAAs were INF-based, and their dosing was cumbersome.15,17-19
Starting with the 2013 approval of simeprevir (second-wave PI) and sofosbuvir (polymerase inhibitor), most patients’ SVR rates improved to 75% to 90%.20,21 Sustained virologic response rates were boosted to > 95% after the 2014 approval of Harvoni, coformulated ledispasvir (replication complex inhibitor) and sofosbuvir, and Viekira Pak, a combination of ombitasvir (replication complex inhibitor), paritaprevir (PI), and ritonavir (inhibitor of CYP3A4 enzyme) co-packaged with dasabuvir (polymerase inhibitor).22-24 In 2015, daclatasvir (replication complex inhibitor) was approved, followed in 2016 by Zepatier, coformulated elbasvir (replication complex inhibitor) and grazoprevir (PI). Harvoni has simplified the treatment regimen to 1 pill a day and shortened the duration of treatment to as few as 8 weeks for some
patients.25
The option of an all-oral, INF-free treatment regimen and the prospect of freedom from the HCV could not come at a more opportune time, given the aging of baby boomers with chronic HCV infection and the high rates of HCV and HIV infections contracted in the 1970s and 1980s. An estimated one-third of those infected is expected to develop cirrhosis within 20 years.26
Cost of HCV Treatment
The U.S. has the highest health care costs in the world—consuming 17% of the nation’s gross domestic product.27,28 Health care costs also have been steadily increasing in U.S. prisons because of the expanding and aging incarcerated population. The Eighth Amendment provides inmates with the constitutional right to health care. The BOP’s overall expense of pharmaceuticals for HCV treatment has soared in recent years. It was kept below $2 million in fiscal years 2010 and 2011 but more than doubled the next 2 years, to more than $4 million in 2012 and 2013, and increased in 2014 to about $6 million. Hepititis C treatment accounted for 3% of the BOP pharmaceutical budget in 2011 and 7% in 2014.29 Increased HCV pharmaceutical expenses were attributable to the introduction of DAAs. Even so, the majority of inmates with chronic HCV infection remained untreated.
Compared with DAA PIs, sofosbuvir is a game changer. Its all-oral, INF-free regimen makes treatment of chronic HCV infection more effective and safer. However, its cost is prohibitive, even in rich countries: A 12-week course costs $84,000, and Harvoni (ledispasvir/ sofosbuvir) costs $94,000.30,31 A generic version of sofosbuvir is not expected until 2025.32 Many studies have been conducted on the cost-effectiveness of these newer DAAs, but the picture is unclear, as the results were sensitive to drug price, drug efficacy (SVR rates vary with genotype and patient profile), quality of life after successful treatment, and the willingness-to-pay threshold.30 Ironically, treatment cost could be the primary barrier to HCV eradication.
At USP Canaan, 137 inmates with chronic HCV infection potentially could have benefited from treatment. A majority (91 inmates) were infected with HCV genotype 1; of the other 46 inmates, 12 had genotype 2, 18 had genotype 3, 2 had genotype 4, and 14 lacked genotyping.
The all-oral, INF-free regimen obviates the need for weekly injection, and treatment duration is shorter. The AASLD/IDSA treatment guidelines recommend all-oral, INF-free treatment regimens for all patients with genotype 1. Typically, treatment lasts 12 or 24 weeks, depending on presence or absence of liver cirrhosis, among other considerations.16
Because of the high cost of treating all inmates with chronic HCV infection, the large number of inmates who are asymptomatic, and the potential decrease in medication costs after the introduction of generic versions, inmates are being prioritized for treatment based primarily on staging (presence or absence of liver disease). The rationale for using staging for prioritization is that patients with chronic HCV infection and no or minimal fibrosis at presentation seem to progress slowly, and treatment possibly can be delayed or withheld; whereas patients with significant fibrosis (septal or bridging fibrosis) progress almost invariably to cirrhosis over a 10- to 20-year period, so antiviral treatment becomes urgent.33
APRI: Biomarker for Liver Fibrosis
A liver biopsy is the gold standard for the diagnosis of liver fibrosis. Although generally safe, it is costly. It is also subject to sampling error and examiner discrepancy, which lead to incorrect staging of fibrosis in 20% of patients.5,33 Alternatively, various biologic markers can be used to diagnose liver disease. The aspartate aminotransferase (AST) platelet ratio index (APRI) is a simple and useful index based on readily available laboratory results: AST level and platelet count. APRI correlated significantly with fibrosis stage in patients with chronic HCV infection.33
At USP Canaan, 16 (12%) of the 137 inmates with chronic HCV infection had an APRI higher than 1, and 5 of the 16 had an APRI higher than 2.
Conclusion
In coming years, treatment of chronic HCV infection will consume a more significant portion of the health care budget. As treatment becomes more efficacious and safer, the paradigm may shift from a stage-based strategy to a treat-all strategy. Possibly, more inmates will ask for treatment as the treatment burden lessens due to fewer treatment-associated AEs. However, despite the efficacy of HCV treatment, there is no reduction in the overall lifetime medical costs, because the offset in downstream direct medical costs (from successful treatment) is less than the cost of a cure.30
In the BOP, many challenges remain: HCV infection rates are expected to be high, treatment costs astronomical, resources limited, and treated patients may become reinfected if high-risk behavior continues. Patient education is, therefore, an important component of effective prevention and treatment strategies. The U.S. Preventive Services Task Force recommends HCV screening for all high-risk persons and a onetime screening for all baby boomers.34 Federal prisons offer HCV testing to all inmates with risk factors, when clinically indicated, or on
request.
All inmates with chronic HCV infection were being monitored for treatment prioritization, as some were at higher risk for complications or disease progression and required more urgent treatment.35 Ideally, all inmates should be treated, as incarcerated persons are at elevated risk for HCV transmission, and successful treatment would benefit public health by reducing infection rates in the community.16 However, resource constraints are a reality in health care, particularly among underserved populations, and this situation provides the rationale for screening, monitoring, and treatment prioritization. This step-by-step approach, which rests on sound clinical judgment, helps control the budget.
Click here for the digital edition.
1. Centers for Disease Control and Prevention. Recommendations for prevention and control of hepatitis C virus (HCV) infection and HCV-related chronic disease. MMWR Recomm Rep. 1998;47(RR-19):1-39.
2. Ditah I, Ditah F, Devaki P, et al. The changing epidemiology of hepatitis C virus infection in the United States: National Health and Nutrition Examination Survey 2001 through 2010. J Hepatol. 2014;60(4):691-698.
3. Daniels D, Grytdal S, Wasley A; Centers for Disease Control and Prevention (CDC). Surveillance for acute viral hepatitis - United States, 2007. MMWR Surveill Summ. 2009;58(3):1-27.
4. Centers for Disease Control and Prevention, Division of Viral Hepatitis and National Center for HIV/AIDS, Viral Hepatitis, STD, and TB Prevention. Viral Hepatitis Surveillance—United States, 2013. Centers for Disease Control and Prevention Website. http://www.cdc.gov/hepatitis/statistics/2013surveillance/pdfs/2013hepsurveillancerpt.pdf. Updated April 24, 2015. Accessed May 20, 2015.
5. Hepatitis C Online. Hepatitis C Online Website. http://www.hepatitisc.uw.edu. Accessed March 3, 2016.
6. Smith BD, Morgan RL, Beckett GA, et al; Centers for Disease Control and Prevention. Recommendations for the identification of chronic hepatitis C virus infection among persons born during 1945-1965. MMWR Recomm Rep. 2012;61(RR-4):1-32.
7. Alter KJ, Kruszon-Moran D, Nainan OV, et al. The prevalence of hepatitis C virus infection in the United States, 1988 through 1994. N Engl J Med. 1999;341(8):556-562.
8. Liu G, Holmberg SD, Kamili S, Xu F. Racial disparities in the proportion of current, unresolved hepatitis C virus infections in the United States, 2003-2010. Dig Dis Sci. 2014;59(8):1950-1957.
9. World Health Organization. Hepatitis B [fact sheet 204]. World Health Organization Website. http://www.who.int/mediacentre/factsheets/fs204/en. Updated July 2015. Accessed March 3, 2016.
10. World Health Organization. Hepatitis C [fact sheet 164]. World Health Organization Website. http://www.who.int/mediacentre/factsheets/fs164/en. Updated July 2015. Accessed March 3, 2016.
11. Denniston MM, Jiles RB, Drobeniuc J, et al. Chronic hepatitis C virus infection in the United States, National Health and Nutrition Examination Survey 2003 to 2010. Ann Intern Med. 2014;160(5):293-300.
12. Centers for Disease Control and Prevention. Hepatitis C and Incarceration. Publication No. 21-1306. Centers for Disease Control and Prevention Website. http://www.cdc.gov/hepatitis/HCV/PDFs/HepCIncarcerationFactSheet.pdf. October 2013. Accessed March 3, 2016.
13. Federal Bureau of Prisons. Inmate statistics: offenses. Federal Bureau of Prisons Website. http://www.bop.gov/about/statistics/statistics_inmate_offenses.jsp. Updated January 30, 2016. Accessed March 3, 2016.
14. Centers for Disease Control and Prevention. Hepatitis C FAQs for health professionals. Centers for Disease Control and Prevention Website. http://www.cdc.gov/hepatitis/HCV/HCVfaq.htm. Updated January 8, 2016. Accessed March 4, 2016.
15. Saab S, Gordon SC, Park H, Sulkowski M, Ahmed A, Younossi Z. Cost-effectiveness analysis of sofosbuvir plus peginterferon/ribavirin in the treatment of chronic hepatitis C virus genotype 1 infection. Aliment Pharmacol Ther. 2014;40(6):657-675.
16. American Association for the Study of Liver Diseases, Infectious Diseases Society of America. Recommendations for Testing, Managing, and Treating Hepatitis C. American Association for the Study of Liver Diseases and the Infectious Diseases Society of America Website. http://hcvguidelines.org. Updated February 2016. Accessed March 4, 2016.
17. Jacobson IM, McHutchison JG, Dusheiko G, et al; ADVANCE Study Team. Telaprevir for previously untreated chronic hepatitis C virus infection. N Engl J Med. 2011;364(25):2405-2416.
18. Kwo PY. Boceprevir: a novel nonstructural 3 (NS3) protease inhibitor for the treatment of chronic hepatitis C infection. Therap Adv Gastroenterol. 2012;5(3):179-188.
19. Stahmeyer JT, Rossol S, Krauth C. Outcomes, costs and cost-effectiveness of treating
hepatitis C with direct acting antivirals. J Comp Eff Res. 2015;4(3):267-277.
20. Lawitz E, Mangia A, Wyles D, et al. Sofosbuvir for previously untreated chronic hepatitis C infection. N Engl J Med. 2013;368(20):1878-1887.
21. Fried MW, Buti M, Dore GJ, et al. Once-daily simeprevir (TMC435) with pegylated interferon and ribavirin in treatment-naïve genotype 1 hepatitis C: the randomized PILLAR study. Hepatology. 2013;58(6):1918-1929.
22. Ferenci P, Bernstein D, Lalezari J, et al; PEARL-III Study; PEARL-IV Study. ABT-450/r-ombitasvir and dasabuvir with or without ribavirin for HCV. N Engl J Med. 2014;370(21):1983-1992.
23. Feld JJ, Kowdley KV, Coakley E, et al. Treatment of HCV with ABT-450/r-ombitasvir and dasabuvir with ribavirin. N Engl J Med. 2014;370(17):1594-1603.
24. Afdhal N, Zeuzem S, Kwo P, et al; ION-1 Investigators. Ledipasvir and sofosbuvir for untreated HCV genotype 1 infection. N Engl J Med. 2014;370(20):1889-1898.
25. Kowdley KV, Gordon SC, Reddy KR, et al; ION-3 Investigators. Ledipasvir and
sofosbuvir for 8 or 12 weeks for chronic HCV without cirrhosis. N Engl J Med. 2014;370(20):1879-1888.
26. Younossi ZM, Singer ME, Mir HM, Henry L, Hunt S. Impact of interferon free regimens on clinical and cost outcomes for chronic hepatitis C genotype 1 patients. J Hepatol. 2014;60(3):530-537.
27. The Economist Don’t kill Obamacare. The Economist Website. http://www.economist.com/news/leaders/21645730-supreme-court-considers-whether-gut-obamacare-evidence-mounting-law. Published May 7, 2015. Accessed March 4, 2016.
28. The World Bank. Health expenditure, total (% of GDP). The World Bank Website. http://data.worldbank.org/indicator/SH.XPD.TOTL.ZS. Published 2015. Accessed March 4, 2016.
29. Federal Bureau of Prisons, Health Services Division. 2015 BOP National P&T Minutes. Federal Bureau of Prisons intranet website. http://sallyport.bop.gov/co/hsd/pharmacy/docs/BOP_National_P&T_Minutes/2015%20BOP%20National%20P&T%20Minutes_Final.pdf. Published August 13, 2014. Accessed November 9, 2015.
30. Chhatwal J, Kanwal F, Roberts MS, Dunn MA. Cost-effectiveness and budget impact of hepatitis C virus treatment with sofosbuvir and ledipasvir in the United States. Ann Intern Med. 2015;162(6):397-406.
31. Sachs J. The drug that is bankrupting America. Huffington Post Website. http://www.huffingtonpost.com/jeffrey-sachs/the-drug-that-is-bankrupt_b_6692340
.html. Published February 16, 2015. Updated April 18, 2015. Accessed March 4, 2016.
32. Hill A, Khoo S, Fortunak J, Simmons B, Ford N. Minimum costs for producing hepatitis C direct-acting antivirals for use in large-scale treatment access programs in developing countries. Clin Infect Dis. 2014;58(7):928-936.
33. Wai CT, Greenson JK, Fontana RJ, et al. A simple noninvasive index can predict both significant fibrosis and cirrhosis in patients with chronic hepatitis C. Hepatology. 2003;38(2):518-526.
34. U.S. Preventive Services Task Force. Hepatitis C: screening. U.S. Preventive Services Task Force Website. http://www.uspreventiveservicestaskforce.org/Page/Document/UpdateSummaryFinal/hepatitis-c-screening?ds=1&s=hepatitis c. Updated July 2015. Accessed March 4, 2016.
35. Federal Bureau of Prisons. Evaluation and Management of Chronic Hepatitis C Virus (HCV) Infection [clinical practice guidelines]. Federal Bureau of Prisons Website. http://www.bop.gov/resources/pdfs/hepatitis_c.pdf. Published July 2015. Accessed March 4, 2016.
PICC Use in Adults With Pneumonia
Pneumonia is the most common cause of unplanned hospitalization in the United States.[1] Despite its clinical toll, the management of this disease has evolved markedly. Expanding vaccination programs, efforts to improve timeliness of antibiotic therapy, and improved processes of care are but a few developments that have improved outcomes for patients afflicted with this illness.[2, 3]
Use of peripherally inserted central catheters (PICCs) is an example of a modern development in the management of patients with pneumonia.[4, 5, 6, 7] PICCs provide many of the benefits associated with central venous catheters (CVCs) including reliable venous access for delivery of antibiotics, phlebotomy, and invasive hemodynamic monitoring. However, as they are placed in veins of the upper extremity, PICCs bypass insertion risks (eg, injury to the carotid vessels or pneumothorax) associated with placement of traditional CVCs.[8] Because they offer durable venous access, PICCs also facilitate care transitions while continuing intravenous antimicrobial therapy in patients with pneumonia.
However, accumulating evidence also suggests that PICCs are associated with important complications, including central lineassociated bloodstream infectionand venous thromboembolism.[9, 10] Furthermore, knowledge gaps in clinicians regarding indications for appropriate use and management of complications associated with PICCs have been recognized.[10, 11] These elements are problematic because reports of unjustified and inappropriate PICC use are growing in the literature.[12, 13] Such concerns have prompted a number of policy calls to improve PICC use, including Choosing Wisely recommendations by various professional societies.[14, 15]
As little is known about the prevalence or patterns of PICC use in adults hospitalized with pneumonia, we conducted a retrospective cohort study using data from a large network of US hospitals.
METHODS
Setting and Participants
We included patients from hospitals that participated in Premier's inpatient dataset, a large, fee‐supported, multipayer administrative database that has been used extensively in health services research to measure quality of care and comparative effectiveness of interventions.[16] Participating hospitals represent all regions of the United States and include teaching and nonteaching facilities in rural and urban locations. In addition to variables found in the uniform billing form, the Premier inpatient database also includes a date‐stamped list of charges for procedures conducted during hospitalization such as PICC placement. As PICC‐specific data are not available in most nationally representative datasets, Premier offers unique insights into utilization, timing, and factors associated with use of PICCs in hospitalized settings.
We included adult patients aged 18 years who were (1) admitted with a principal diagnosis of pneumonia present on admission, or secondary diagnosis of pneumonia if paired with a principal diagnosis of sepsis, respiratory failure, or influenza; (2) received at least 1 day of antibiotics between July 1, 2007 and November 30, 2011, and (3) underwent chest x‐ray or computed tomography (CT) at the time of admission. International Classification of Disease, 9th Revision, Clinical Modification (ICD‐9‐CM) codes were used for patient selection. Patients who were not admitted (eg, observation cases), had cystic fibrosis, or marked as pneumonia not present on admission were excluded. For patients who had more than 1 hospitalization during the study period, a single admission was randomly selected for inclusion.
Patient, Physician, and Hospital Data
For all patients, age, gender, marital status, insurance, race, and ethnicity were captured. Using software provided by the Healthcare Costs and Utilization Project, we categorized information on 29 comorbid conditions and computed a combined comorbidity score as described by Gagne et al.[17] Patients were considered to have healthcare‐associated pneumonia (HCAP) if they were: (1) admitted from a skilled nursing or a long‐term care facility, (2) hospitalized in the previous 90 days, (3) on dialysis, or (4) receiving immunosuppressing medications (eg, chemotherapy or steroids equivalent to at least 20 mg of prednisone per day) at the time of admission. Information on specialty of the admitting physician and hospital characteristics (eg, size, location, teaching status) were sourced through Premier data.
Receipt of PICCs and Related Therapies
Among eligible adult patients hospitalized with pneumonia, we identified patients who received a PICC at any time during hospitalization via PICC‐specific billing codes. Non‐PICC devices (eg, midlines, Hickman catheters) were not included. For all insertions, we assessed day of PICC placement relative to admission date. Data on type of PICC (eg, power‐injection capable, antibiotic coating) or PICC characteristics (size, number of lumens) were not available. We used billing codes to assess use of invasive or noninvasive ventilation, vasopressors, and administration of pneumonia‐specific antibiotics (eg, ‐lactams, macrolides, fluoroquinolones). Early exposure was defined when a billing code appeared within 2 days of hospital admission.
Outcomes of Interest
The primary outcome of interest was receipt of a PICC. Additionally, we assessed factors associated with PICC placement and variation in risk‐standardized rates of PICC use between hospitals.
Statistical Analyses
Patient and hospital characteristics were summarized using frequencies for categorical variables and medians with interquartile ranges for continuous variables. We examined association of individual patient and hospital characteristics with use of PICCs using generalized estimating equations models with a logit link for categorical variables and identity link for continuous variables, accounting for patient clustering within hospitals.
| Characteristic | Total, No. (%) | No PICC, No. (%) | PICC, No. (%) | P Value* |
|---|---|---|---|---|
| ||||
| 545,250 (100) | 503,401 (92.3) | 41,849 (7.7) | ||
| Demographics | ||||
| Age, median (Q1Q3), y | 71 (5782) | 72 (5782) | 69 (5780) | <0.001 |
| Gender | <0.001 | |||
| Male | 256,448 (47.0) | 237,232 (47.1) | 19,216 (45.9) | |
| Female | 288,802 (53.0) | 266,169 (52.9) | 22,633 (54.1) | |
| Race/ethnicity | <0.001 | |||
| White | 377,255 (69.2) | 346,689 (68.9) | 30,566 (73.0) | |
| Black | 63,345 (11.6) | 58,407 (11.6) | 4,938 (11.8) | |
| Hispanic | 22,855 (4.2) | 21,716 (4.3) | 1,139 (2.7) | |
| Other | 81,795 (15.0) | 76,589 (15.2) | 5,206 (12.4) | |
| Admitting specialty | <0.001 | |||
| Internal medicine | 236,859 (43.4) | 218,689 (43.4) | 18,170 (43.4) | |
| Hospital medicine | 116,499 (21.4) | 107,671 (21.4) | 8,828 (21.1) | |
| Family practice | 80,388 (14.7) | 75,482 (15.0) | 4,906 (11.7) | |
| Critical care and pulmonary | 35,670 (6.5) | 30,529 (6.1) | 41,849 (12.3) | |
| Geriatrics | 4,812 (0.9) | 4,098 (0.8) | 714 (1.7) | |
| Other | 71,022 (13.0) | 66,932 (13.3) | 4,090 (9.8) | |
| Insurance | <0.001 | |||
| Medicare | 370,303 (67.9) | 341,379 (67.8) | 28,924 (69.1) | |
| Medicaid | 45,505 (8.3) | 41,100 (8.2) | 4,405 (10.5) | |
| Managed care | 69,984 (12.8) | 65,280 (13.0) | 4,704 (11.2) | |
| Commercialindemnity | 20,672 (3.8) | 19,251 (3.8) | 1,421 (3.4) | |
| Other | 38,786 (7.1) | 36,391 (7.2) | 2,395 (5.7) | |
| Comorbidities | ||||
| Gagne combined comorbidity score, median (Q1Q3) | 2 (15) | 2 (14) | 4 (26) | <0.001 |
| Hypertension | 332,347 (60.9) | 306,964 (61.0) | 25,383 (60.7) | 0.13 |
| Chronic pulmonary disease | 255,403 (46.8) | 234,619 (46.6) | 20,784 (49.7) | <0.001 |
| Diabetes | 171,247 (31.4) | 155,540 (30.9) | 15,707 (37.5) | <0.001 |
| Congestive heart failure | 146,492 (26.9) | 131,041 (26.0) | 15,451 (36.9) | <0.001 |
| Atrial fibrillation | 108,405 (19.9) | 97,124 (19.3) | 11,281 (27.0) | <0.001 |
| Renal failure | 104,404 (19.1) | 94,277 (18.7) | 10,127 (24.2) | <0.001 |
| Nicotine replacement therapy/tobacco use | 89,938 (16.5) | 83,247 (16.5) | 6,691 (16.0) | <0.001 |
| Obesity | 60,242 (11.0) | 53,268 (10.6) | 6,974 (16.7) | <0.001 |
| Coagulopathy | 41,717 (7.6) | 35,371 (7.0) | 6,346 (15.2) | <0.001 |
| Prior stroke (1 year) | 26,787 (4.9) | 24,046 (4.78) | 2,741 (6.55) | <0.001 |
| Metastatic cancer | 21,868 (4.0) | 20,244 (4.0) | 1,624 (3.9) | 0.16 |
| Solid tumor w/out metastasis | 21,083 (3.9) | 19,380 (3.8) | 1,703 (4.1) | 0.12 |
| Prior VTE (1 year) | 19,090 (3.5) | 16,906 (3.4) | 2,184 (5.2) | <0.001 |
| Chronic liver disease | 16,273 (3.0) | 14,207 (2.8) | 2,066 (4.9) | <0.001 |
| Prior bacteremia (1 year) | 4,106 (0.7) | 3,584 (0.7) | 522 (1.2) | <0.001 |
| Nephrotic syndrome | 671 (0.1) | 607 (0.1) | 64 (0.2) | 0.03 |
| Morbidity markers | ||||
| Type of pneumonia | <0.001 | |||
| CAP | 376,370 (69.1) | 352,900 (70.1) | 23,830 (56.9) | |
| HCAP | 168,520 (30.9) | 150,501 (29.9) | 18,019 (43.1) | |
| Sepsis present on admission | 114,578 (21.0) | 96,467 (19.2) | 18,111 (43.3) | <0.001 |
| Non‐invasive ventilation | 47,913(8.8) | 40,599 (8.1) | 7,314 (17.5) | <0.001 |
| Invasive mechanical ventilation | 56,179 (10.3) | 44,228 (8.8) | 11,951 (28.6) | <0.001 |
| ICU status | 97,703 (17.9) | 80,380 (16.0) | 17,323 (41.4) | <0.001 |
| Vasopressor use | 48,353 (8.9) | 38,030 (7.6) | 10,323 (24.7) | <0.001 |
| Antibiotic/medication use | ||||
| Anti‐MRSA agent (vancomycin) | 146,068 (26.8) | 123,327 (24.5) | 22,741 (54.3) | <0.001 |
| Third‐generation cephalosporin | 250,782 (46.0) | 235,556 (46.8) | 15,226 (36.4) | <0.001 |
| Anti‐Pseudomonal cephalosporin | 41,798 (7.7) | 36,982 (7.3) | 4,816 (11.5) | <0.001 |
| Anti‐Pseudomonal ‐lactam | 122,215 (22.4) | 105,741 (21.0) | 16,474 (39.4) | <0.001 |
| Fluroquinolone | 288,051 (52.8) | 267,131 (53.1) | 20,920 (50.0) | <0.001 |
| Macrolide | 223,737 (41.0) | 210,954 (41.9) | 12,783 (30.5) | <0.001 |
| Aminoglycoside | 15,415 (2.8) | 12,661 (2.5) | 2,754 (6.6) | <0.001 |
| Oral steroids | 44,486 (8.2) | 41,586 (8.3) | 2,900 (6.9) | <0.001 |
| Intravenous steroids | 146,308 (26.8) | 133,920 (26.6) | 12,388 (29.6) | <0.001 |
| VTE prophylaxis with LMWH | 190,735 (35.0) | 174,612 (34.7) | 16,123 (38.5) | 0.01 |
| Discharge disposition | ||||
| Home | 282,146 (51.7) | 272,604(54.1) | 9,542 (22.8) | <0.001 |
| Home with home health | 71,977 (13.2) | 65,289 (13.0) | 6,688 (16.0) | <0.001 |
| Skilled nursing facility | 111,541 (20.5) | 97,113 (19.3) | 14,428 (34.5) | <0.001 |
| Hospice | 20,428 (3.7) | 17,902 (3.6) | 2,526 (6.0) | <0.001 |
| Expired | 47,733 (8.7) | 40,768 (8.1) | 6,965 (16.6) | <0.001 |
| Other | 11,425 (2.1) | 9,725 (1.9) | 1,700 (4.1) | <0.001 |
We then developed a multivariable hierarchical generalized linear model (HGLM) for PICC placement with a random effect for hospital. In this model, we included patient demographics, comorbidities, sepsis on admission, type of pneumonia (eg, HCAP vs community‐associated pneumonia [CAP]), admitting physician specialty, and indicators for early receipt of specific treatments such as guideline‐recommended antibiotics, vasopressors, ventilation (invasive or noninvasive), and pneumatic compression devices for prophylaxis of deep vein thrombosis.
To understand and estimate between‐hospital variation in PICC use, we calculated risk‐standardized rates of PICC use (RSPICC) across hospitals using HGLM methods. These methods are also employed by the Centers for Medicare and Medicaid Services to calculate risk‐standardized measures for public reporting.[18] Because hospital rates of PICC use were highly skewed (21.2% [n = 105] of hospitals had no patients with PICCs), we restricted this model to the 343 hospitals that had at least 5 patients with a PICC to obtain stable estimates. For each hospital, we estimated a predicted rate of PICC use (pPICC) as the sum of predicted probabilities of PICC receipt from patient factors and the random intercept for hospital in which they were admitted. We then calculated an expected rate of PICC use (ePICC) per hospital as the sum of expected probabilities of PICC receipt from patient factors only. RSPICC for each hospital was then computed as the product of the overall unadjusted mean PICC rate (PICC) from all patients and the ratio of the predicted to expected PICC rate (uPICC*[pPICC/ePICC]).[19] Kruskal‐Wallis tests were used to evaluate the association between hospital characteristics with RSPICC rates. To evaluate the impact of the hospital in variation in PICC use, we assessed the change in likelihood ratio of a hierarchical model with hospital random effects compared to a logistic regression model with patient factors only. In addition, we estimated the intraclass correlation (ICC) to assess the proportion of variation in PICC use associated with the hospital, and the median odds ratio (MOR) from the hierarchical model. The MOR is the median of a set of odds ratios comparing 2 patients with the same set of characteristics treated at 2 randomly selected hospitals.[20, 21, 22] All analyses were performed using the Statistical Analysis System version 9.3 (SAS Institute, Inc., Cary, NC) and Stata 13 (StataCorp Inc., College Station, TX).
Ethical and Regulatory Oversight
Permission to conduct this study was obtained from the institutional review board at Baystate Medical Center, Springfield, Massachusetts. The study did not qualify as human subjects research and made use of fully deidentified data.
RESULTS
Between July 2007 and November 2011, 634,285 admissions representing 545,250 unique patients from 495 hospitals met eligibility criteria and were included in the study (Figure 1). Included patients had a median age of 71 years (interquartile range [IQR]: 5782), and 53.0% were female. Most patients were Caucasian (69.2%), unmarried (51.6%), and insured by Medicare (67.9%). Patients were admitted to the hospital by internal medicine providers (43.4%), hospitalists (21.4%), and family practice providers (14.7%); notably, critical care and pulmonary medicine providers admitted 6.5% of patients. The median Gagne comorbidity score was 2 (IQR: 15). Hypertension, chronic obstructive pulmonary disease, diabetes, and congestive heart failure were among the most common comorbidities observed (Table 1).

Among eligible patients, 41,849 (7.7%) received a PICC during hospitalization. Approximately a quarter of all patients who received PICCs did so by hospital day 2; 90% underwent insertion by hospital day 11 (mean = 5.4 days, median = 4 days). Patients who received PICCs were younger (median IQR: 69 years, 5780 years) but otherwise demographically similar to those that did not receive PICCs (median IQR: 72 years, 5782 years). Compared to other specialties, patients admitted by critical care/pulmonary providers were twice as likely to receive PICCs (12.3% vs 6.1%, P < .001). Patients who received PICCs had higher comorbidity scores than those who did not (median Gagne comorbidity score 4 vs 2, P < 0.001) and were more likely to be diagnosed with HCAP (43.1% vs 29.9%, P < 0.001) than CAP (56.9% vs 70.1%, P < 0.001).
PICC recipients were also more likely to receive intensive care unit (ICU) level of care (41.4% vs 16%, P < 0.001) and both noninvasive (17.5% vs 8.1%, P < 0.001) and invasive ventilation (28.6% vs 8.8%, P < 0.001) upon admission. Vasopressor use was also significantly more frequent in patients who received PICCs (24.7% vs 7.6%, P < 0.001) compared to those who did not receive these devices. Patients with PICCs were more often discharged to skilled nursing facilities (34.5% vs 19.3%) than those without PICCs.
Characteristics Associated With PICC Use Following Multivariable Modeling
Using HGLM with a random hospital effect, multiple patient characteristics were associated with PICC use (Table 2). Patients 65 years of age were less likely to receive a PICC compared to younger patients (odds ratio [OR]: 0.81, 95% confidence interval [CI]: 0.79‐0.84). Weight loss (OR: 2.03, 95% CI: 1.97‐2.10), sepsis on admission (OR: 1.80, 95% CI: 1.75‐1.85), and ICU status on hospital day 1 or 2 (OR: 1.70, 95% CI: 1.64‐1.75) represented 3 factors most strongly associated with PICC use.
| Patient Characteristic | Odds Ratio | 95% Confidence Intervals |
|---|---|---|
| ||
| Age group (>66 vs 65 years) | 0.82 | 0.790.84 |
| Race/ethnicity | ||
| Other | 1.02 | 0.971.06 |
| Black | 0.99 | 0.951.03 |
| Hispanic | 0.82 | 0.760.88 |
| White | Referent | |
| Marital status | ||
| Other/missing | 1.07 | 1.011.14 |
| Single | 1.02 | 1.001.05 |
| Married | Referent | |
| Insurance payor | ||
| Other | 0.85 | 0.800.89 |
| Medicaid | 1.13 | 1.081.18 |
| Managed care | 0.95 | 0.910.99 |
| Commercialindemnity | 0.93 | 0.871.00 |
| Medicare | Referent | |
| Admitting physician specialty | ||
| Pulmonary/critical care medicine | 1.18 | 1.131.24 |
| Family practice | 1.01 | 0.971.05 |
| Geriatric medicine (FP and IM) | 1.85 | 1.662.05 |
| Hospitalist | 0.94 | 0.910.98 |
| Other specialties | 1.02 | 0.971.06 |
| Internal medicine | Referent | |
| Comorbidities | ||
| Congestive heart failure | 1.27 | 1.241.31 |
| Valvular disease | 1.11 | 1.071.15 |
| Pulmonary circulation disorders | 1.37 | 1.321.42 |
| Peripheral vascular disease | 1.09 | 1.051.13 |
| Hypertension | 0.94 | 0.920.97 |
| Paralysis | 1.59 | 1.511.67 |
| Other neurological disorders | 1.20 | 1.161.23 |
| Chronic lung disease | 1.10 | 1.071.12 |
| Diabetes | 1.13 | 1.101.16 |
| Hypothyroidism | 1.03 | 1.001.06 |
| Liver disease | 1.16 | 1.101.23 |
| Ulcer | 1.86 | 1.153.02 |
| Lymphoma | 0.88 | 0.810.96 |
| Metastatic cancer | 0.75 | 0.710.80 |
| Solid tumor without metastasis | 0.93 | 0.880.98 |
| Arthritis | 1.22 | 1.161.28 |
| Obesity | 1.47 | 1.421.52 |
| Weight loss | 2.03 | 1.972.10 |
| Blood loss | 1.69 | 1.551.85 |
| Deficiency anemias | 1.40 | 1.371.44 |
| Alcohol abuse | 1.19 | 1.131.26 |
| Drug abuse | 1.31 | 1.231.39 |
| Psychoses | 1.16 | 1.111.21 |
| Depression | 1.10 | 1.061.13 |
| Renal failure | 0.96 | 0.930.98 |
| Type of pneumonia | ||
| HCAP | 1.03 | 1.011.06 |
| CAP | Referent | |
| Sepsis (POA) | 1.80 | 1.751.85 |
| Antibiotic exposure | ||
| Anti‐MRSA agent | 1.72 | 1.671.76 |
| Anti‐Pseudomonal carbapenem | 1.37 | 1.311.44 |
| Non‐Pseudomonal carbapenem | 1.48 | 1.331.66 |
| Third‐generation cephalosporin | 1.04 | 1.011.07 |
| Anti‐Pseudomonal cephalosporin | 1.25 | 1.201.30 |
| Anti‐Pseudomonal ‐lactam | 1.27 | 1.231.31 |
| Aztreonam | 1.31 | 1.231.40 |
| Non‐Pseudomonal ‐lactam | 1.36 | 1.231.50 |
| ‐lactam | 1.55 | 1.261.90 |
| Respiratory quinolone | 0.90 | 0.870.92 |
| Macrolide | 0.85 | 0.820.88 |
| Doxycycline | 0.94 | 0.871.01 |
| Aminoglycoside | 1.21 | 1.141.27 |
| Vasopressors | 1.06 | 1.031.10 |
| Noninvasive ventilation | 1.29 | 1.251.34 |
| Invasive ventilation | 1.66 | 1.611.72 |
| Intensive care unit on admission | 1.70 | 1.641.75 |
| Atrial fibrillation | 1.26 | 1.221.29 |
| Upper extremity chronic DVT | 1.61 | 1.132.28 |
| Nicotine replacement therapy/tobacco abuse | 0.91 | 0.880.94 |
| Aspirin | 0.94 | 0.920.97 |
| Warfarin | 0.90 | 0.860.94 |
| LMWH, prophylactic dose | 1.10 | 1.081.13 |
| LMWH, treatment dose | 1.22 | 1.161.29 |
| Intravenous steroids | 1.05 | 1.021.08 |
| Bacteremia (prior year) | 1.14 | 1.021.27 |
| VTE (prior year) | 1.11 | 1.061.18 |
| Pneumatic compression device | 1.25 | 1.081.45 |
| Invasive ventilation (prior year) | 1.17 | 1.111.24 |
| Irritable bowel disease | 1.19 | 1.051.36 |
Therapy with potent parenteral antimicrobials including antimethicillin‐resistant Staphylococcus aureus agents (OR: 1.72, 95% CI: 1.67‐1.76), antipseudomonal ‐lactamases (OR: 1.27, 95% CI: 1.23‐1.31), and carbapenems (OR: 1.37, 95% CI: 1.31‐1.44) were significantly associated with PICC use. Conversely, use of macrolides (OR: 0.85, 95% CI: 0.82‐0.88) or respiratory fluoroquinolones (OR: 0.90, 95% CI: 0.87‐0.92) were associated with lower likelihood of PICC use. After adjusting for antimicrobial therapy, HCAP was only slightly more likely to result in PICC use than CAP (OR: 1.03, 95% CI: 1.01‐1.06). Compared to internal medicine providers, admission by geriatricians and critical care/pulmonary specialists was associated with greater likelihood of PICC use (OR: 1.85, 95% CI: 1.66‐2.05 and OR: 1.18, 95% CI: =1.13‐1.24, respectively). Admission by hospitalists was associated with a modestly lower likelihood of PICC placement (OR: 0.94, 95% CI: 0.91‐0.98).
Hospital Level Variation in PICC Use
To ensure stable estimates of hospital PICC use, we excluded 152 facilities (31%): 10% had no patients with PICCs and 21% had <5 patients who received a PICC. Therefore, RSPICC was estimated for 343 of 495 facilities (69%) (Figure 2). In these facilities, RSPICC varied from 0.3% to 41.7%. Hospital RSPICC was significantly associated with hospital location (median 11.9% vs 7.8% for urban vs rural hospitals respectively, P = 0.05). RSPICCs were also greater among hospitals in Southern (11.3%), Western (12.7%), and Midwest (12.0%) regions of the nation compared to those in the Northeast (8.4%) (P = 0.02) (Table 3).
| Hospital Characteristic (No.) | Median (IQR), % | P Value |
|---|---|---|
| ||
| Bed size | 0.12 | |
| 200 beds (106) | 9.1 (4.816.3) | |
| 201 beds (237) | 11.6 (5.817.6) | |
| Rural/urban | 0.05 | |
| Urban (275) | 11.9 (5.517.4) | |
| Rural (68) | 7.8 (5.014.0) | |
| Region | 0.02 | |
| Northeast (50) | 8.4 (3.913.0) | |
| Midwest (69) | 12.0 (5.817.4) | |
| West (57) | 12.7 (7.617.0) | |
| South (167) | 11.3 (4.817.8) | |
| Teaching status | 0.77 | |
| Nonteaching (246) | 10.9 (5.017.4) | |
| Teaching (97) | 12.0 (5.816.9) | |
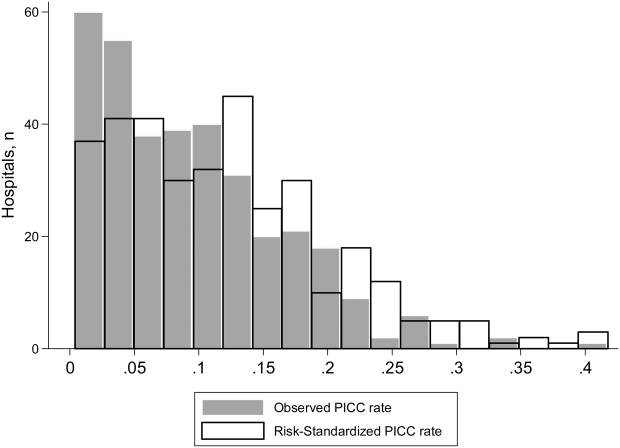
A likelihood ratio test comparing the hierarchical model to a logistic model with patient factors only was highly significant (P < 0.001), indicating that the hospital where the patient was treated had a major impact on receipt of PICC after accounting for patient factors. The MOR was 2.71, which is a larger effect than we found for any of the individual patient characteristics. The proportion of variance explained by hospitals was 25% (95% CI: 22%‐28%), as measured by the ICC.
DISCUSSION
In this study of 545,250 adults hospitalized with pneumonia, we found that approximately 8% of patients received a PICC. Patients who received PICCs had more comorbidities, were more frequently diagnosed with HCAP, and were more often admitted to the ICU, where they experienced greater rates of mechanical ventilation, noninvasive ventilation, and vasopressor use compared to those who did not receive a PICC. Additionally, risk‐adjusted rates of PICC use varied as much as 10‐fold across institutions. In fact, almost 70% of the total variation in rates of PICC use remained unexplained by hospital or patient characteristics. Although use of PICCs is often clinically nuanced in ways that are difficult to capture in large datasets (eg, difficult venous access or inability to tolerate oral medications), the substantial variation of PICC use observed suggests that physician and institutional practice styles are the major determinants of PICC placement during a hospitalization for pneumonia. Because PICCs are associated with serious complications, and evidence regarding discretionary use is accumulating, a research agenda examining reasons for such use and related outcomes appears necessary.
The placement of PICCs has grown substantially in hospitalized patients all over the world.[23, 24] Although originally developed for total parenteral nutrition in surgical patients,[25] contemporary reports of PICC use in critical illness,[26] diseases such as cystic fibrosis,[27] and even pregnancy[28] are now common. Although PICCs are clinically invaluable in many of these conditions, growing use of these devices has led to the realization that benefits may be offset by complications.[9, 10, 29, 30] Additionally, recent data suggest that not all PICCs may be used for appropriate reasons. For instance, in a decade‐long study at a tertiary care center, changes in patterns of PICC use including shortened dwell times, multiple insertions in a single patient, and unclear indications for use were reported.[11] In another study at an academic medical center, a substantial proportion of PICCs were found to be idle or unjustified.[12] It comes as little surprise, then, that a recent multicenter study found that 1 out of every 5 clinicians did not even know that their patient had a PICC.[29] Although calls to improve PICC use in the hospital setting have emerged, strategies to do so are limited by data that emanate from single‐center reports or retrospective designs. No other studies reporting use of PICCs across US hospitals for any clinical condition currently exist.[31]
We found that patients with weight loss, those with greater combined comorbidity scores, and those who were critically ill or diagnosed with sepsis were more likely to receive PICCs than others. These observations suggest that PICC use may reflect underlying severity of illness, as advanced care such as ventilator support was often associated with PICC use. Additionally, discharge to a skilled nursing facility was frequently associated with PICC placement, a finding consistent with a recent study evaluating the use of PICCs in these settings.[32] However, a substantial proportion of PICC use remained unexplained by available patient or hospital factors. Although our study was not specifically designed to examine this question, a possible reason may relate to unmeasured institutional factors that influence the propensity to use a PICC, recently termed as PICC culture.[33] For example, it is plausible that hospitals with nursing‐led PICC teams or interventional radiology (such as teaching hospitals) are more likely to use PICCs than those without such operators. This hypothesis may explain why urban, larger, and teaching hospitals exhibited higher rates of PICC use. Conversely, providers may have an affinity toward PICC use that is predicated not just by operator availability, but also local hospital norms. Understanding why some facilities use PICCs at higher rates than others and implications of such variation with respect to patient safety, cost, and outcomes is important. Study designs that use mixed‐methods approaches or seek to qualitatively understand reasons behind PICC use are likely to be valuable in this enquiry.
Our study has limitations. First, we used an administrative dataset and ICD‐9‐CM codes rather than clinical data from medical records to identify cases of pneumonia or comorbidities. Our estimates of PICC use across hospitals thus may not fully account for differences in severity of illness, and it is possible that patients needed a PICC for reasons that we could not observe. However, the substantial variation observed in rates of PICC use across hospitals is unlikely to be explained by differences in patient severity of illness, documentation, or coding practices. Second, as PICC removal codes were not available, we are unable to comment on how often hospitalized pneumonia patients were discharged with PICCs or received antimicrobial therapy beyond their inpatient stay. Third, although we observed that a number of patient and hospital factors were associated with PICC receipt, our study was not designed to determine the reasons underlying these patterns.
These limitations aside, our study has important strengths. To our knowledge, this is the first study to report utilization and outcomes associated with PICC use among those hospitalized with pneumonia across the United States. The inclusion of a large number of patients receiving care in diverse facilities lends a high degree of external validity to our findings. Second, we used advanced modeling to identify factors associated with PICC use in hospitalized patients with pneumonia, producing innovative and novel findings. Third, our study is the first to show the existence of substantial variation in rates of PICC use across US hospitals within the single disease state of pneumonia. Understanding the drivers of this variability is important as it may inform future studies, policies, and practices to improve PICC use in hospitalized patients.
In conclusion, we found that PICC use in patients hospitalized with pneumonia is common and highly variable. Future studies examining the contextual factors behind PICC use and their association with outcomes are needed to facilitate efforts to standardize PICC use across hospitals.
Disclosures
Dr. Chopra is supported by a career development award (1‐K08‐HS022835‐01) from the Agency of Healthcare Research and Quality. The authors report no conflicts of interest.
- , . Reasons for being admitted to the hospital through the emergency department, 2003. Healthcare Cost and Utilization Project Statistical Brief 2. Rockville, MD: Agency for Healthcare Research and Quality. Available at: www.hcup‐us.ahrq.gov/reports/statbriefs/sb2.pdf. Published February 2006. Accessed June 27, 2014.
- , , , et al. National patterns of risk‐standardized mortality and readmission after hospitalization for acute myocardial infarction, heart failure, and pneumonia: update on publicly reported outcomes measures based on the 2013 release. J Gen Intern Med. 2014;29(10):1333–1340.
- , , , et al. Quality of care for elderly patients hospitalized for pneumonia in the United States, 2006 to 2010. JAMA Intern Med. 2014;174(11):1806–1814.
- , . PICC lines: the latest home care challenge. RN. 1990;53(1):44–51.
- , , , . Peripherally inserted central catheters in an acute‐care hospital. Arch Intern Med. 1994;154(16):1833–1837.
- , . The peripherally inserted central catheter: a retrospective look at three years of insertions. J Intraven Nurs. 1993;16(2):92–103.
- , , , . Peripherally inserted central catheters in general medicine. Mayo Clin Proc. 1997;72(3):225–233.
- , , . Two‐year trends of peripherally inserted central catheter‐line complications at a tertiary‐care hospital: role of nursing expertise. Infect Control Hosp Epidemiol. 2001;22(6):377–379.
- , , , , , . PICC‐associated bloodstream infections: prevalence, patterns, and predictors. Am J Med. 2014;127(4):319–328.
- , , , , . The risk of bloodstream infection associated with peripherally inserted central catheters compared with central venous catheters in adults: a systematic review and meta‐analysis. Infect Control Hosp Epidemiol. 2013;34(9):908–918.
- , , , , , . Peripherally inserted central catheters: use at a tertiary care pediatric center. J Vasc Interv Radiol. 2013;24(9):1323–1331.
- , , , et al. Temporary central venous catheter utilization patterns in a large tertiary care center: tracking the “idle central venous catheter”. Infect Control Hosp Epidemiol. 2012;33(1):50–57.
- , , , , . Inappropriate intravascular device use: a prospective study. Journal Hosp Infect. 2011;78(2):128–132.
- , , , et al. Enhancing patient‐centered care: SGIM and choosing wisely. J Gen Intern Med. 2014;29(3):432–433.
- , , , et al. Critical and honest conversations: the evidence behind the “Choosing Wisely” campaign recommendations by the American Society of Nephrology. Clin J Am Soc Nephrol. 2012;7(10):1664–1672.
- , , , et al. Using highly detailed administrative data to predict pneumonia mortality. PLoS One. 2014;9(1):e87382.
- , , , , . A combined comorbidity score predicted mortality in elderly patients better than existing scores. J Clin Epidemiol. 2011;64(7):749–759.
- , , , , . Hospitals with the highest intensive care utilization provide lower quality pneumonia care to the elderly. Crit Care Med. 2015;43(6):1178–1186.
- , . Statistical and clinical aspects of hospital outcomes profiling. Stat Sci. 2007;22(2):206–226.
- , . Appropriate assessment of neighborhood effects on individual health: integrating random and fixed effects in multilevel logistic regression. Am J Epidemiol. 2005;161(1):81–88.
- , , , . Interpreting parameters in the logistic regression model with random effects. Biometrics. 2000;56(3):909–914.
- , , , . Hospital‐level associations with 30‐day patient mortality after cardiac surgery: a tutorial on the application and interpretation of marginal and multilevel logistic regression. BMC Med Res Methodol. 2012;12:28.
- , , , . Experiences of the first PICC team in the Czech Republic. Br J Nurs. 2015;24(suppl 2):S4–S10.
- , , , et al. Greece reports prototype intervention with first peripherally inserted central catheter: case report and literature review. J Vasc Nurs. 2012;30(3):88–93.
- Total intravenous nutrition with peripherally inserted silicone elastomer central venous catheters. Arch Surg. 1975;110(5):644–646.
- , . Focus on peripherally inserted central catheters in critically ill patients. World J Crit Care Med. 2014;3(4):80–94.
- , , , et al. Quality improvement initiative to reduce deep vein thrombosis associated with peripherally inserted central catheters in adults with cystic fibrosis. Ann Am Thorac Soc. 2014;11(9):1404–1410.
- , , , . Peripherally Inserted central catheter (PICC) complications during pregnancy. JPEN J Parenter Enteral Nutr. 2013;38(5):595–601.
- , , , et al. Do clinicians know which of their patients have central venous catheters?: a multicenter observational study. Ann Intern Med. 2014;161(8):562–567.
- , , , et al. Risk of venous thromboembolism associated with peripherally inserted central catheters: a systematic review and meta‐analysis. Lancet. 2013;382(9889):311–325.
- , , . The problem with peripherally inserted central catheters. JAMA. 2012;308(15):1527–1528.
- , , , et al. Peripherally inserted central catheter use in skilled nursing facilities: a pilot study. J Am Geriatr Soc. 2015;63(9):1894–1899.
- , , , , . Inpatient venous access practices: PICC culture and the kidney patient. J Vasc Access. 2015;16(3):206–210.
Pneumonia is the most common cause of unplanned hospitalization in the United States.[1] Despite its clinical toll, the management of this disease has evolved markedly. Expanding vaccination programs, efforts to improve timeliness of antibiotic therapy, and improved processes of care are but a few developments that have improved outcomes for patients afflicted with this illness.[2, 3]
Use of peripherally inserted central catheters (PICCs) is an example of a modern development in the management of patients with pneumonia.[4, 5, 6, 7] PICCs provide many of the benefits associated with central venous catheters (CVCs) including reliable venous access for delivery of antibiotics, phlebotomy, and invasive hemodynamic monitoring. However, as they are placed in veins of the upper extremity, PICCs bypass insertion risks (eg, injury to the carotid vessels or pneumothorax) associated with placement of traditional CVCs.[8] Because they offer durable venous access, PICCs also facilitate care transitions while continuing intravenous antimicrobial therapy in patients with pneumonia.
However, accumulating evidence also suggests that PICCs are associated with important complications, including central lineassociated bloodstream infectionand venous thromboembolism.[9, 10] Furthermore, knowledge gaps in clinicians regarding indications for appropriate use and management of complications associated with PICCs have been recognized.[10, 11] These elements are problematic because reports of unjustified and inappropriate PICC use are growing in the literature.[12, 13] Such concerns have prompted a number of policy calls to improve PICC use, including Choosing Wisely recommendations by various professional societies.[14, 15]
As little is known about the prevalence or patterns of PICC use in adults hospitalized with pneumonia, we conducted a retrospective cohort study using data from a large network of US hospitals.
METHODS
Setting and Participants
We included patients from hospitals that participated in Premier's inpatient dataset, a large, fee‐supported, multipayer administrative database that has been used extensively in health services research to measure quality of care and comparative effectiveness of interventions.[16] Participating hospitals represent all regions of the United States and include teaching and nonteaching facilities in rural and urban locations. In addition to variables found in the uniform billing form, the Premier inpatient database also includes a date‐stamped list of charges for procedures conducted during hospitalization such as PICC placement. As PICC‐specific data are not available in most nationally representative datasets, Premier offers unique insights into utilization, timing, and factors associated with use of PICCs in hospitalized settings.
We included adult patients aged 18 years who were (1) admitted with a principal diagnosis of pneumonia present on admission, or secondary diagnosis of pneumonia if paired with a principal diagnosis of sepsis, respiratory failure, or influenza; (2) received at least 1 day of antibiotics between July 1, 2007 and November 30, 2011, and (3) underwent chest x‐ray or computed tomography (CT) at the time of admission. International Classification of Disease, 9th Revision, Clinical Modification (ICD‐9‐CM) codes were used for patient selection. Patients who were not admitted (eg, observation cases), had cystic fibrosis, or marked as pneumonia not present on admission were excluded. For patients who had more than 1 hospitalization during the study period, a single admission was randomly selected for inclusion.
Patient, Physician, and Hospital Data
For all patients, age, gender, marital status, insurance, race, and ethnicity were captured. Using software provided by the Healthcare Costs and Utilization Project, we categorized information on 29 comorbid conditions and computed a combined comorbidity score as described by Gagne et al.[17] Patients were considered to have healthcare‐associated pneumonia (HCAP) if they were: (1) admitted from a skilled nursing or a long‐term care facility, (2) hospitalized in the previous 90 days, (3) on dialysis, or (4) receiving immunosuppressing medications (eg, chemotherapy or steroids equivalent to at least 20 mg of prednisone per day) at the time of admission. Information on specialty of the admitting physician and hospital characteristics (eg, size, location, teaching status) were sourced through Premier data.
Receipt of PICCs and Related Therapies
Among eligible adult patients hospitalized with pneumonia, we identified patients who received a PICC at any time during hospitalization via PICC‐specific billing codes. Non‐PICC devices (eg, midlines, Hickman catheters) were not included. For all insertions, we assessed day of PICC placement relative to admission date. Data on type of PICC (eg, power‐injection capable, antibiotic coating) or PICC characteristics (size, number of lumens) were not available. We used billing codes to assess use of invasive or noninvasive ventilation, vasopressors, and administration of pneumonia‐specific antibiotics (eg, ‐lactams, macrolides, fluoroquinolones). Early exposure was defined when a billing code appeared within 2 days of hospital admission.
Outcomes of Interest
The primary outcome of interest was receipt of a PICC. Additionally, we assessed factors associated with PICC placement and variation in risk‐standardized rates of PICC use between hospitals.
Statistical Analyses
Patient and hospital characteristics were summarized using frequencies for categorical variables and medians with interquartile ranges for continuous variables. We examined association of individual patient and hospital characteristics with use of PICCs using generalized estimating equations models with a logit link for categorical variables and identity link for continuous variables, accounting for patient clustering within hospitals.
| Characteristic | Total, No. (%) | No PICC, No. (%) | PICC, No. (%) | P Value* |
|---|---|---|---|---|
| ||||
| 545,250 (100) | 503,401 (92.3) | 41,849 (7.7) | ||
| Demographics | ||||
| Age, median (Q1Q3), y | 71 (5782) | 72 (5782) | 69 (5780) | <0.001 |
| Gender | <0.001 | |||
| Male | 256,448 (47.0) | 237,232 (47.1) | 19,216 (45.9) | |
| Female | 288,802 (53.0) | 266,169 (52.9) | 22,633 (54.1) | |
| Race/ethnicity | <0.001 | |||
| White | 377,255 (69.2) | 346,689 (68.9) | 30,566 (73.0) | |
| Black | 63,345 (11.6) | 58,407 (11.6) | 4,938 (11.8) | |
| Hispanic | 22,855 (4.2) | 21,716 (4.3) | 1,139 (2.7) | |
| Other | 81,795 (15.0) | 76,589 (15.2) | 5,206 (12.4) | |
| Admitting specialty | <0.001 | |||
| Internal medicine | 236,859 (43.4) | 218,689 (43.4) | 18,170 (43.4) | |
| Hospital medicine | 116,499 (21.4) | 107,671 (21.4) | 8,828 (21.1) | |
| Family practice | 80,388 (14.7) | 75,482 (15.0) | 4,906 (11.7) | |
| Critical care and pulmonary | 35,670 (6.5) | 30,529 (6.1) | 41,849 (12.3) | |
| Geriatrics | 4,812 (0.9) | 4,098 (0.8) | 714 (1.7) | |
| Other | 71,022 (13.0) | 66,932 (13.3) | 4,090 (9.8) | |
| Insurance | <0.001 | |||
| Medicare | 370,303 (67.9) | 341,379 (67.8) | 28,924 (69.1) | |
| Medicaid | 45,505 (8.3) | 41,100 (8.2) | 4,405 (10.5) | |
| Managed care | 69,984 (12.8) | 65,280 (13.0) | 4,704 (11.2) | |
| Commercialindemnity | 20,672 (3.8) | 19,251 (3.8) | 1,421 (3.4) | |
| Other | 38,786 (7.1) | 36,391 (7.2) | 2,395 (5.7) | |
| Comorbidities | ||||
| Gagne combined comorbidity score, median (Q1Q3) | 2 (15) | 2 (14) | 4 (26) | <0.001 |
| Hypertension | 332,347 (60.9) | 306,964 (61.0) | 25,383 (60.7) | 0.13 |
| Chronic pulmonary disease | 255,403 (46.8) | 234,619 (46.6) | 20,784 (49.7) | <0.001 |
| Diabetes | 171,247 (31.4) | 155,540 (30.9) | 15,707 (37.5) | <0.001 |
| Congestive heart failure | 146,492 (26.9) | 131,041 (26.0) | 15,451 (36.9) | <0.001 |
| Atrial fibrillation | 108,405 (19.9) | 97,124 (19.3) | 11,281 (27.0) | <0.001 |
| Renal failure | 104,404 (19.1) | 94,277 (18.7) | 10,127 (24.2) | <0.001 |
| Nicotine replacement therapy/tobacco use | 89,938 (16.5) | 83,247 (16.5) | 6,691 (16.0) | <0.001 |
| Obesity | 60,242 (11.0) | 53,268 (10.6) | 6,974 (16.7) | <0.001 |
| Coagulopathy | 41,717 (7.6) | 35,371 (7.0) | 6,346 (15.2) | <0.001 |
| Prior stroke (1 year) | 26,787 (4.9) | 24,046 (4.78) | 2,741 (6.55) | <0.001 |
| Metastatic cancer | 21,868 (4.0) | 20,244 (4.0) | 1,624 (3.9) | 0.16 |
| Solid tumor w/out metastasis | 21,083 (3.9) | 19,380 (3.8) | 1,703 (4.1) | 0.12 |
| Prior VTE (1 year) | 19,090 (3.5) | 16,906 (3.4) | 2,184 (5.2) | <0.001 |
| Chronic liver disease | 16,273 (3.0) | 14,207 (2.8) | 2,066 (4.9) | <0.001 |
| Prior bacteremia (1 year) | 4,106 (0.7) | 3,584 (0.7) | 522 (1.2) | <0.001 |
| Nephrotic syndrome | 671 (0.1) | 607 (0.1) | 64 (0.2) | 0.03 |
| Morbidity markers | ||||
| Type of pneumonia | <0.001 | |||
| CAP | 376,370 (69.1) | 352,900 (70.1) | 23,830 (56.9) | |
| HCAP | 168,520 (30.9) | 150,501 (29.9) | 18,019 (43.1) | |
| Sepsis present on admission | 114,578 (21.0) | 96,467 (19.2) | 18,111 (43.3) | <0.001 |
| Non‐invasive ventilation | 47,913(8.8) | 40,599 (8.1) | 7,314 (17.5) | <0.001 |
| Invasive mechanical ventilation | 56,179 (10.3) | 44,228 (8.8) | 11,951 (28.6) | <0.001 |
| ICU status | 97,703 (17.9) | 80,380 (16.0) | 17,323 (41.4) | <0.001 |
| Vasopressor use | 48,353 (8.9) | 38,030 (7.6) | 10,323 (24.7) | <0.001 |
| Antibiotic/medication use | ||||
| Anti‐MRSA agent (vancomycin) | 146,068 (26.8) | 123,327 (24.5) | 22,741 (54.3) | <0.001 |
| Third‐generation cephalosporin | 250,782 (46.0) | 235,556 (46.8) | 15,226 (36.4) | <0.001 |
| Anti‐Pseudomonal cephalosporin | 41,798 (7.7) | 36,982 (7.3) | 4,816 (11.5) | <0.001 |
| Anti‐Pseudomonal ‐lactam | 122,215 (22.4) | 105,741 (21.0) | 16,474 (39.4) | <0.001 |
| Fluroquinolone | 288,051 (52.8) | 267,131 (53.1) | 20,920 (50.0) | <0.001 |
| Macrolide | 223,737 (41.0) | 210,954 (41.9) | 12,783 (30.5) | <0.001 |
| Aminoglycoside | 15,415 (2.8) | 12,661 (2.5) | 2,754 (6.6) | <0.001 |
| Oral steroids | 44,486 (8.2) | 41,586 (8.3) | 2,900 (6.9) | <0.001 |
| Intravenous steroids | 146,308 (26.8) | 133,920 (26.6) | 12,388 (29.6) | <0.001 |
| VTE prophylaxis with LMWH | 190,735 (35.0) | 174,612 (34.7) | 16,123 (38.5) | 0.01 |
| Discharge disposition | ||||
| Home | 282,146 (51.7) | 272,604(54.1) | 9,542 (22.8) | <0.001 |
| Home with home health | 71,977 (13.2) | 65,289 (13.0) | 6,688 (16.0) | <0.001 |
| Skilled nursing facility | 111,541 (20.5) | 97,113 (19.3) | 14,428 (34.5) | <0.001 |
| Hospice | 20,428 (3.7) | 17,902 (3.6) | 2,526 (6.0) | <0.001 |
| Expired | 47,733 (8.7) | 40,768 (8.1) | 6,965 (16.6) | <0.001 |
| Other | 11,425 (2.1) | 9,725 (1.9) | 1,700 (4.1) | <0.001 |
We then developed a multivariable hierarchical generalized linear model (HGLM) for PICC placement with a random effect for hospital. In this model, we included patient demographics, comorbidities, sepsis on admission, type of pneumonia (eg, HCAP vs community‐associated pneumonia [CAP]), admitting physician specialty, and indicators for early receipt of specific treatments such as guideline‐recommended antibiotics, vasopressors, ventilation (invasive or noninvasive), and pneumatic compression devices for prophylaxis of deep vein thrombosis.
To understand and estimate between‐hospital variation in PICC use, we calculated risk‐standardized rates of PICC use (RSPICC) across hospitals using HGLM methods. These methods are also employed by the Centers for Medicare and Medicaid Services to calculate risk‐standardized measures for public reporting.[18] Because hospital rates of PICC use were highly skewed (21.2% [n = 105] of hospitals had no patients with PICCs), we restricted this model to the 343 hospitals that had at least 5 patients with a PICC to obtain stable estimates. For each hospital, we estimated a predicted rate of PICC use (pPICC) as the sum of predicted probabilities of PICC receipt from patient factors and the random intercept for hospital in which they were admitted. We then calculated an expected rate of PICC use (ePICC) per hospital as the sum of expected probabilities of PICC receipt from patient factors only. RSPICC for each hospital was then computed as the product of the overall unadjusted mean PICC rate (PICC) from all patients and the ratio of the predicted to expected PICC rate (uPICC*[pPICC/ePICC]).[19] Kruskal‐Wallis tests were used to evaluate the association between hospital characteristics with RSPICC rates. To evaluate the impact of the hospital in variation in PICC use, we assessed the change in likelihood ratio of a hierarchical model with hospital random effects compared to a logistic regression model with patient factors only. In addition, we estimated the intraclass correlation (ICC) to assess the proportion of variation in PICC use associated with the hospital, and the median odds ratio (MOR) from the hierarchical model. The MOR is the median of a set of odds ratios comparing 2 patients with the same set of characteristics treated at 2 randomly selected hospitals.[20, 21, 22] All analyses were performed using the Statistical Analysis System version 9.3 (SAS Institute, Inc., Cary, NC) and Stata 13 (StataCorp Inc., College Station, TX).
Ethical and Regulatory Oversight
Permission to conduct this study was obtained from the institutional review board at Baystate Medical Center, Springfield, Massachusetts. The study did not qualify as human subjects research and made use of fully deidentified data.
RESULTS
Between July 2007 and November 2011, 634,285 admissions representing 545,250 unique patients from 495 hospitals met eligibility criteria and were included in the study (Figure 1). Included patients had a median age of 71 years (interquartile range [IQR]: 5782), and 53.0% were female. Most patients were Caucasian (69.2%), unmarried (51.6%), and insured by Medicare (67.9%). Patients were admitted to the hospital by internal medicine providers (43.4%), hospitalists (21.4%), and family practice providers (14.7%); notably, critical care and pulmonary medicine providers admitted 6.5% of patients. The median Gagne comorbidity score was 2 (IQR: 15). Hypertension, chronic obstructive pulmonary disease, diabetes, and congestive heart failure were among the most common comorbidities observed (Table 1).
Among eligible patients, 41,849 (7.7%) received a PICC during hospitalization. Approximately a quarter of all patients who received PICCs did so by hospital day 2; 90% underwent insertion by hospital day 11 (mean = 5.4 days, median = 4 days). Patients who received PICCs were younger (median IQR: 69 years, 5780 years) but otherwise demographically similar to those that did not receive PICCs (median IQR: 72 years, 5782 years). Compared to other specialties, patients admitted by critical care/pulmonary providers were twice as likely to receive PICCs (12.3% vs 6.1%, P < .001). Patients who received PICCs had higher comorbidity scores than those who did not (median Gagne comorbidity score 4 vs 2, P < 0.001) and were more likely to be diagnosed with HCAP (43.1% vs 29.9%, P < 0.001) than CAP (56.9% vs 70.1%, P < 0.001).
PICC recipients were also more likely to receive intensive care unit (ICU) level of care (41.4% vs 16%, P < 0.001) and both noninvasive (17.5% vs 8.1%, P < 0.001) and invasive ventilation (28.6% vs 8.8%, P < 0.001) upon admission. Vasopressor use was also significantly more frequent in patients who received PICCs (24.7% vs 7.6%, P < 0.001) compared to those who did not receive these devices. Patients with PICCs were more often discharged to skilled nursing facilities (34.5% vs 19.3%) than those without PICCs.
Characteristics Associated With PICC Use Following Multivariable Modeling
Using HGLM with a random hospital effect, multiple patient characteristics were associated with PICC use (Table 2). Patients 65 years of age were less likely to receive a PICC compared to younger patients (odds ratio [OR]: 0.81, 95% confidence interval [CI]: 0.79‐0.84). Weight loss (OR: 2.03, 95% CI: 1.97‐2.10), sepsis on admission (OR: 1.80, 95% CI: 1.75‐1.85), and ICU status on hospital day 1 or 2 (OR: 1.70, 95% CI: 1.64‐1.75) represented 3 factors most strongly associated with PICC use.
| Patient Characteristic | Odds Ratio | 95% Confidence Intervals |
|---|---|---|
| ||
| Age group (>66 vs 65 years) | 0.82 | 0.790.84 |
| Race/ethnicity | ||
| Other | 1.02 | 0.971.06 |
| Black | 0.99 | 0.951.03 |
| Hispanic | 0.82 | 0.760.88 |
| White | Referent | |
| Marital status | ||
| Other/missing | 1.07 | 1.011.14 |
| Single | 1.02 | 1.001.05 |
| Married | Referent | |
| Insurance payor | ||
| Other | 0.85 | 0.800.89 |
| Medicaid | 1.13 | 1.081.18 |
| Managed care | 0.95 | 0.910.99 |
| Commercialindemnity | 0.93 | 0.871.00 |
| Medicare | Referent | |
| Admitting physician specialty | ||
| Pulmonary/critical care medicine | 1.18 | 1.131.24 |
| Family practice | 1.01 | 0.971.05 |
| Geriatric medicine (FP and IM) | 1.85 | 1.662.05 |
| Hospitalist | 0.94 | 0.910.98 |
| Other specialties | 1.02 | 0.971.06 |
| Internal medicine | Referent | |
| Comorbidities | ||
| Congestive heart failure | 1.27 | 1.241.31 |
| Valvular disease | 1.11 | 1.071.15 |
| Pulmonary circulation disorders | 1.37 | 1.321.42 |
| Peripheral vascular disease | 1.09 | 1.051.13 |
| Hypertension | 0.94 | 0.920.97 |
| Paralysis | 1.59 | 1.511.67 |
| Other neurological disorders | 1.20 | 1.161.23 |
| Chronic lung disease | 1.10 | 1.071.12 |
| Diabetes | 1.13 | 1.101.16 |
| Hypothyroidism | 1.03 | 1.001.06 |
| Liver disease | 1.16 | 1.101.23 |
| Ulcer | 1.86 | 1.153.02 |
| Lymphoma | 0.88 | 0.810.96 |
| Metastatic cancer | 0.75 | 0.710.80 |
| Solid tumor without metastasis | 0.93 | 0.880.98 |
| Arthritis | 1.22 | 1.161.28 |
| Obesity | 1.47 | 1.421.52 |
| Weight loss | 2.03 | 1.972.10 |
| Blood loss | 1.69 | 1.551.85 |
| Deficiency anemias | 1.40 | 1.371.44 |
| Alcohol abuse | 1.19 | 1.131.26 |
| Drug abuse | 1.31 | 1.231.39 |
| Psychoses | 1.16 | 1.111.21 |
| Depression | 1.10 | 1.061.13 |
| Renal failure | 0.96 | 0.930.98 |
| Type of pneumonia | ||
| HCAP | 1.03 | 1.011.06 |
| CAP | Referent | |
| Sepsis (POA) | 1.80 | 1.751.85 |
| Antibiotic exposure | ||
| Anti‐MRSA agent | 1.72 | 1.671.76 |
| Anti‐Pseudomonal carbapenem | 1.37 | 1.311.44 |
| Non‐Pseudomonal carbapenem | 1.48 | 1.331.66 |
| Third‐generation cephalosporin | 1.04 | 1.011.07 |
| Anti‐Pseudomonal cephalosporin | 1.25 | 1.201.30 |
| Anti‐Pseudomonal ‐lactam | 1.27 | 1.231.31 |
| Aztreonam | 1.31 | 1.231.40 |
| Non‐Pseudomonal ‐lactam | 1.36 | 1.231.50 |
| ‐lactam | 1.55 | 1.261.90 |
| Respiratory quinolone | 0.90 | 0.870.92 |
| Macrolide | 0.85 | 0.820.88 |
| Doxycycline | 0.94 | 0.871.01 |
| Aminoglycoside | 1.21 | 1.141.27 |
| Vasopressors | 1.06 | 1.031.10 |
| Noninvasive ventilation | 1.29 | 1.251.34 |
| Invasive ventilation | 1.66 | 1.611.72 |
| Intensive care unit on admission | 1.70 | 1.641.75 |
| Atrial fibrillation | 1.26 | 1.221.29 |
| Upper extremity chronic DVT | 1.61 | 1.132.28 |
| Nicotine replacement therapy/tobacco abuse | 0.91 | 0.880.94 |
| Aspirin | 0.94 | 0.920.97 |
| Warfarin | 0.90 | 0.860.94 |
| LMWH, prophylactic dose | 1.10 | 1.081.13 |
| LMWH, treatment dose | 1.22 | 1.161.29 |
| Intravenous steroids | 1.05 | 1.021.08 |
| Bacteremia (prior year) | 1.14 | 1.021.27 |
| VTE (prior year) | 1.11 | 1.061.18 |
| Pneumatic compression device | 1.25 | 1.081.45 |
| Invasive ventilation (prior year) | 1.17 | 1.111.24 |
| Irritable bowel disease | 1.19 | 1.051.36 |
Therapy with potent parenteral antimicrobials including antimethicillin‐resistant Staphylococcus aureus agents (OR: 1.72, 95% CI: 1.67‐1.76), antipseudomonal ‐lactamases (OR: 1.27, 95% CI: 1.23‐1.31), and carbapenems (OR: 1.37, 95% CI: 1.31‐1.44) were significantly associated with PICC use. Conversely, use of macrolides (OR: 0.85, 95% CI: 0.82‐0.88) or respiratory fluoroquinolones (OR: 0.90, 95% CI: 0.87‐0.92) were associated with lower likelihood of PICC use. After adjusting for antimicrobial therapy, HCAP was only slightly more likely to result in PICC use than CAP (OR: 1.03, 95% CI: 1.01‐1.06). Compared to internal medicine providers, admission by geriatricians and critical care/pulmonary specialists was associated with greater likelihood of PICC use (OR: 1.85, 95% CI: 1.66‐2.05 and OR: 1.18, 95% CI: =1.13‐1.24, respectively). Admission by hospitalists was associated with a modestly lower likelihood of PICC placement (OR: 0.94, 95% CI: 0.91‐0.98).
Hospital Level Variation in PICC Use
To ensure stable estimates of hospital PICC use, we excluded 152 facilities (31%): 10% had no patients with PICCs and 21% had <5 patients who received a PICC. Therefore, RSPICC was estimated for 343 of 495 facilities (69%) (Figure 2). In these facilities, RSPICC varied from 0.3% to 41.7%. Hospital RSPICC was significantly associated with hospital location (median 11.9% vs 7.8% for urban vs rural hospitals respectively, P = 0.05). RSPICCs were also greater among hospitals in Southern (11.3%), Western (12.7%), and Midwest (12.0%) regions of the nation compared to those in the Northeast (8.4%) (P = 0.02) (Table 3).
| Hospital Characteristic (No.) | Median (IQR), % | P Value |
|---|---|---|
| ||
| Bed size | 0.12 | |
| 200 beds (106) | 9.1 (4.816.3) | |
| 201 beds (237) | 11.6 (5.817.6) | |
| Rural/urban | 0.05 | |
| Urban (275) | 11.9 (5.517.4) | |
| Rural (68) | 7.8 (5.014.0) | |
| Region | 0.02 | |
| Northeast (50) | 8.4 (3.913.0) | |
| Midwest (69) | 12.0 (5.817.4) | |
| West (57) | 12.7 (7.617.0) | |
| South (167) | 11.3 (4.817.8) | |
| Teaching status | 0.77 | |
| Nonteaching (246) | 10.9 (5.017.4) | |
| Teaching (97) | 12.0 (5.816.9) | |
A likelihood ratio test comparing the hierarchical model to a logistic model with patient factors only was highly significant (P < 0.001), indicating that the hospital where the patient was treated had a major impact on receipt of PICC after accounting for patient factors. The MOR was 2.71, which is a larger effect than we found for any of the individual patient characteristics. The proportion of variance explained by hospitals was 25% (95% CI: 22%‐28%), as measured by the ICC.
DISCUSSION
In this study of 545,250 adults hospitalized with pneumonia, we found that approximately 8% of patients received a PICC. Patients who received PICCs had more comorbidities, were more frequently diagnosed with HCAP, and were more often admitted to the ICU, where they experienced greater rates of mechanical ventilation, noninvasive ventilation, and vasopressor use compared to those who did not receive a PICC. Additionally, risk‐adjusted rates of PICC use varied as much as 10‐fold across institutions. In fact, almost 70% of the total variation in rates of PICC use remained unexplained by hospital or patient characteristics. Although use of PICCs is often clinically nuanced in ways that are difficult to capture in large datasets (eg, difficult venous access or inability to tolerate oral medications), the substantial variation of PICC use observed suggests that physician and institutional practice styles are the major determinants of PICC placement during a hospitalization for pneumonia. Because PICCs are associated with serious complications, and evidence regarding discretionary use is accumulating, a research agenda examining reasons for such use and related outcomes appears necessary.
The placement of PICCs has grown substantially in hospitalized patients all over the world.[23, 24] Although originally developed for total parenteral nutrition in surgical patients,[25] contemporary reports of PICC use in critical illness,[26] diseases such as cystic fibrosis,[27] and even pregnancy[28] are now common. Although PICCs are clinically invaluable in many of these conditions, growing use of these devices has led to the realization that benefits may be offset by complications.[9, 10, 29, 30] Additionally, recent data suggest that not all PICCs may be used for appropriate reasons. For instance, in a decade‐long study at a tertiary care center, changes in patterns of PICC use including shortened dwell times, multiple insertions in a single patient, and unclear indications for use were reported.[11] In another study at an academic medical center, a substantial proportion of PICCs were found to be idle or unjustified.[12] It comes as little surprise, then, that a recent multicenter study found that 1 out of every 5 clinicians did not even know that their patient had a PICC.[29] Although calls to improve PICC use in the hospital setting have emerged, strategies to do so are limited by data that emanate from single‐center reports or retrospective designs. No other studies reporting use of PICCs across US hospitals for any clinical condition currently exist.[31]
We found that patients with weight loss, those with greater combined comorbidity scores, and those who were critically ill or diagnosed with sepsis were more likely to receive PICCs than others. These observations suggest that PICC use may reflect underlying severity of illness, as advanced care such as ventilator support was often associated with PICC use. Additionally, discharge to a skilled nursing facility was frequently associated with PICC placement, a finding consistent with a recent study evaluating the use of PICCs in these settings.[32] However, a substantial proportion of PICC use remained unexplained by available patient or hospital factors. Although our study was not specifically designed to examine this question, a possible reason may relate to unmeasured institutional factors that influence the propensity to use a PICC, recently termed as PICC culture.[33] For example, it is plausible that hospitals with nursing‐led PICC teams or interventional radiology (such as teaching hospitals) are more likely to use PICCs than those without such operators. This hypothesis may explain why urban, larger, and teaching hospitals exhibited higher rates of PICC use. Conversely, providers may have an affinity toward PICC use that is predicated not just by operator availability, but also local hospital norms. Understanding why some facilities use PICCs at higher rates than others and implications of such variation with respect to patient safety, cost, and outcomes is important. Study designs that use mixed‐methods approaches or seek to qualitatively understand reasons behind PICC use are likely to be valuable in this enquiry.
Our study has limitations. First, we used an administrative dataset and ICD‐9‐CM codes rather than clinical data from medical records to identify cases of pneumonia or comorbidities. Our estimates of PICC use across hospitals thus may not fully account for differences in severity of illness, and it is possible that patients needed a PICC for reasons that we could not observe. However, the substantial variation observed in rates of PICC use across hospitals is unlikely to be explained by differences in patient severity of illness, documentation, or coding practices. Second, as PICC removal codes were not available, we are unable to comment on how often hospitalized pneumonia patients were discharged with PICCs or received antimicrobial therapy beyond their inpatient stay. Third, although we observed that a number of patient and hospital factors were associated with PICC receipt, our study was not designed to determine the reasons underlying these patterns.
These limitations aside, our study has important strengths. To our knowledge, this is the first study to report utilization and outcomes associated with PICC use among those hospitalized with pneumonia across the United States. The inclusion of a large number of patients receiving care in diverse facilities lends a high degree of external validity to our findings. Second, we used advanced modeling to identify factors associated with PICC use in hospitalized patients with pneumonia, producing innovative and novel findings. Third, our study is the first to show the existence of substantial variation in rates of PICC use across US hospitals within the single disease state of pneumonia. Understanding the drivers of this variability is important as it may inform future studies, policies, and practices to improve PICC use in hospitalized patients.
In conclusion, we found that PICC use in patients hospitalized with pneumonia is common and highly variable. Future studies examining the contextual factors behind PICC use and their association with outcomes are needed to facilitate efforts to standardize PICC use across hospitals.
Disclosures
Dr. Chopra is supported by a career development award (1‐K08‐HS022835‐01) from the Agency of Healthcare Research and Quality. The authors report no conflicts of interest.
- , . Reasons for being admitted to the hospital through the emergency department, 2003. Healthcare Cost and Utilization Project Statistical Brief 2. Rockville, MD: Agency for Healthcare Research and Quality. Available at: www.hcup‐us.ahrq.gov/reports/statbriefs/sb2.pdf. Published February 2006. Accessed June 27, 2014.
- , , , et al. National patterns of risk‐standardized mortality and readmission after hospitalization for acute myocardial infarction, heart failure, and pneumonia: update on publicly reported outcomes measures based on the 2013 release. J Gen Intern Med. 2014;29(10):1333–1340.
- , , , et al. Quality of care for elderly patients hospitalized for pneumonia in the United States, 2006 to 2010. JAMA Intern Med. 2014;174(11):1806–1814.
- , . PICC lines: the latest home care challenge. RN. 1990;53(1):44–51.
- , , , . Peripherally inserted central catheters in an acute‐care hospital. Arch Intern Med. 1994;154(16):1833–1837.
- , . The peripherally inserted central catheter: a retrospective look at three years of insertions. J Intraven Nurs. 1993;16(2):92–103.
- , , , . Peripherally inserted central catheters in general medicine. Mayo Clin Proc. 1997;72(3):225–233.
- , , . Two‐year trends of peripherally inserted central catheter‐line complications at a tertiary‐care hospital: role of nursing expertise. Infect Control Hosp Epidemiol. 2001;22(6):377–379.
- , , , , , . PICC‐associated bloodstream infections: prevalence, patterns, and predictors. Am J Med. 2014;127(4):319–328.
- , , , , . The risk of bloodstream infection associated with peripherally inserted central catheters compared with central venous catheters in adults: a systematic review and meta‐analysis. Infect Control Hosp Epidemiol. 2013;34(9):908–918.
- , , , , , . Peripherally inserted central catheters: use at a tertiary care pediatric center. J Vasc Interv Radiol. 2013;24(9):1323–1331.
- , , , et al. Temporary central venous catheter utilization patterns in a large tertiary care center: tracking the “idle central venous catheter”. Infect Control Hosp Epidemiol. 2012;33(1):50–57.
- , , , , . Inappropriate intravascular device use: a prospective study. Journal Hosp Infect. 2011;78(2):128–132.
- , , , et al. Enhancing patient‐centered care: SGIM and choosing wisely. J Gen Intern Med. 2014;29(3):432–433.
- , , , et al. Critical and honest conversations: the evidence behind the “Choosing Wisely” campaign recommendations by the American Society of Nephrology. Clin J Am Soc Nephrol. 2012;7(10):1664–1672.
- , , , et al. Using highly detailed administrative data to predict pneumonia mortality. PLoS One. 2014;9(1):e87382.
- , , , , . A combined comorbidity score predicted mortality in elderly patients better than existing scores. J Clin Epidemiol. 2011;64(7):749–759.
- , , , , . Hospitals with the highest intensive care utilization provide lower quality pneumonia care to the elderly. Crit Care Med. 2015;43(6):1178–1186.
- , . Statistical and clinical aspects of hospital outcomes profiling. Stat Sci. 2007;22(2):206–226.
- , . Appropriate assessment of neighborhood effects on individual health: integrating random and fixed effects in multilevel logistic regression. Am J Epidemiol. 2005;161(1):81–88.
- , , , . Interpreting parameters in the logistic regression model with random effects. Biometrics. 2000;56(3):909–914.
- , , , . Hospital‐level associations with 30‐day patient mortality after cardiac surgery: a tutorial on the application and interpretation of marginal and multilevel logistic regression. BMC Med Res Methodol. 2012;12:28.
- , , , . Experiences of the first PICC team in the Czech Republic. Br J Nurs. 2015;24(suppl 2):S4–S10.
- , , , et al. Greece reports prototype intervention with first peripherally inserted central catheter: case report and literature review. J Vasc Nurs. 2012;30(3):88–93.
- Total intravenous nutrition with peripherally inserted silicone elastomer central venous catheters. Arch Surg. 1975;110(5):644–646.
- , . Focus on peripherally inserted central catheters in critically ill patients. World J Crit Care Med. 2014;3(4):80–94.
- , , , et al. Quality improvement initiative to reduce deep vein thrombosis associated with peripherally inserted central catheters in adults with cystic fibrosis. Ann Am Thorac Soc. 2014;11(9):1404–1410.
- , , , . Peripherally Inserted central catheter (PICC) complications during pregnancy. JPEN J Parenter Enteral Nutr. 2013;38(5):595–601.
- , , , et al. Do clinicians know which of their patients have central venous catheters?: a multicenter observational study. Ann Intern Med. 2014;161(8):562–567.
- , , , et al. Risk of venous thromboembolism associated with peripherally inserted central catheters: a systematic review and meta‐analysis. Lancet. 2013;382(9889):311–325.
- , , . The problem with peripherally inserted central catheters. JAMA. 2012;308(15):1527–1528.
- , , , et al. Peripherally inserted central catheter use in skilled nursing facilities: a pilot study. J Am Geriatr Soc. 2015;63(9):1894–1899.
- , , , , . Inpatient venous access practices: PICC culture and the kidney patient. J Vasc Access. 2015;16(3):206–210.
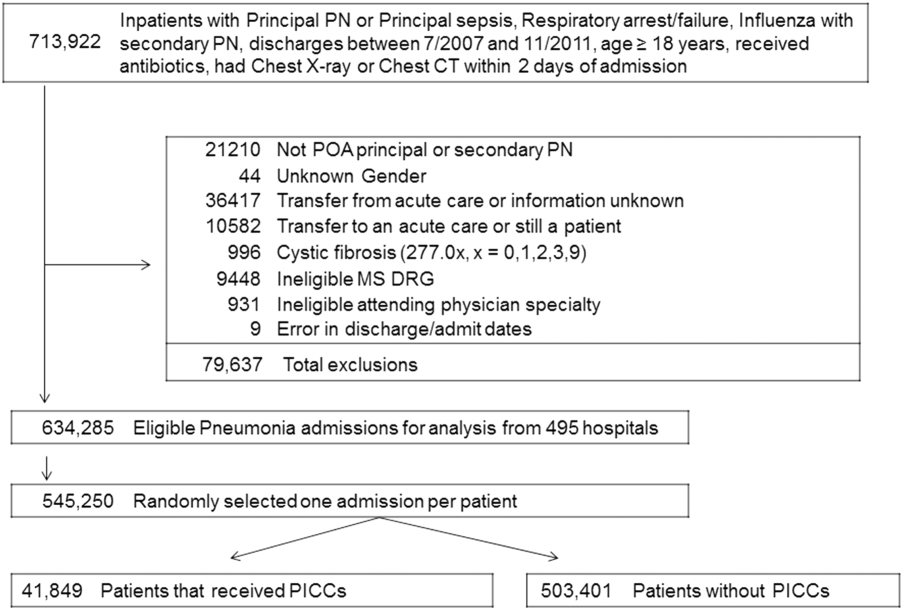
Hospital Admission Service Structure
Hospital admission represents a time period during which patients are at risk for poor clinical outcomes. Although some risk is directly generated by illness pathophysiology, some additive risk is generated by the emergency department (ED)inpatient service handover inherent in the admission process.[1] Increased risk of suboptimal outcomes can result from ED overcrowding, which has been associated with increased mortality, difficulty in patient disposition, and delays in provision of care.[2] Inpatient bed occupancy, as well as availability and organization of accepting inpatient service healthcare staff, can affect ED overcrowding as well.[3, 4]
The overwhelming majority of hospitalist groups accept a significant portion of their admissions via the ED.[5] Hospitalist services must balance their daily group workload between ongoing care and discharge of inpatients and the activity of admitting new patients to their service. Two major models of admission processing exist for hospitalist groups to accomplish these competing tasks. One model, called the general model, employs the use of individual hospitalists to simultaneously perform admission activity as well as ongoing ward‐based care for inpatients during their workday. In the general model, a hospitalist who admits patients on their first hospital day will generally continue to see them on their second hospital day. The other model, called the admitter‐rounder model, divides the hospitalist daily group workflow between hospitalists who are assigned to perform only admission activity (admitters), and hospitalists who are assigned to perform only ongoing care for patients who are already admitted (rounders). In the admitter‐rounder model, the admitter on a patient's first hospital day will generally not serve as the patient's rounder on subsequent hospital days.
Limited evidence exists to guide hospitalist groups on which model their service design should adopt. Conflicting evidence exists as to whether the fragmentation of care generated by an admitter‐rounder admission model is beneficial or harmful.[6, 7, 8, 9] Increased availability of attending inpatient physicians during the EDinpatient admission process has been associated with improved hospital mortality and decreased readmissions in hospital settings outside the United States, where attending availability may otherwise be limited.[10, 11, 12] Separation of admission and rounding activity within a hospitalist workforce may allow each group of hospitalists to provide more timely and effective care related to their respective tasks. Our division implemented a change from a general model to an admitter‐rounder model of care on January 2, 2012. We hypothesized that changing from a general admission model to an admitter‐rounder model of care would be associated with a decreased rate of transfer to the intensive care unit (ICU) 24 hours after floor arrival and shortened ED length of stay (LOS), due to improved availability of hospitalists during the admission process. Due to the introduction of discontinuity, we hypothesized that adoption of the admitter‐rounder model would be associated with a prolongation of hospital LOS and no overall effect on 30 day postdischarge readmission rate. We sought to examine the relationship between our division's service design change and our hypothesized variables of interest.
METHODS
Setting and Study Design
We retrospectively evaluated electronic medical records of patients admitted between July 1, 2010 and June 30, 2013 from the ED to medical floor beds at Northwestern Memorial Hospital, an academic tertiary care teaching hospital located in Chicago, Illinois, under care of either a hospital medicine independent service or a medical teaching service. Admissions for care in observation units, service intake via interhospital or intrahospital transfers of care, or direct admissions from outpatient clinics that bypassed the ED were excluded, as was any patient with incomplete data, leaving 19,270 hospitalizations available for analysis. Each hospital medicine service was comprised of a single hospitalist with only clinical care responsibilities for the workday and no ICU or outpatient clinic responsibilities, with routine handover of the service to a hospitalist colleague every 7 days. Each medical teaching service was comprised of a supervising attending (often a hospitalist), a resident, 1 to 2 interns, and 1 to 3 medical students; the residents and interns maintained outpatient clinic responsibilities of 1 to 2 half days per service week. Inpatients on all teams were localized to hospital beds assigned to their care team. Regardless of hospitalist service design, 3 or more hospitalists were available each day to perform daytime admissions. Throughout the study period, both the hospital medicine and medicine teaching services utilized a group of physicians separate from the day teams to perform admissions and cross‐coverage at night, and the teaching services maintained a generalist model of daytime admission practice. All teams accepted new admissions every day. All ED admissions involved a phone‐based signout of transfer of care to the person admitting for the accepting ward team, followed by transfer of the patient to the floor, independent of whether the accepting team met the patient in the ED prior to transfer. None of the accepting inpatient services in the study had a formal right to refuse acceptance of patients referred for admission by the ED. The time period evaluated was constrained to avoid the effect of other service changes that took place before or after the study period. The Northwestern University Institutional Review Board approved the study (STU00087387).
Data Acquisition and Measures
Data were obtained from the Northwestern Memorial Hospital Enterprise Data Warehouse, an integrated repository of all clinical and research data for patients receiving care in the system. For analysis, the patients were separated into 4 groups: a prechange general admission hospitalist group (group 1), a postchange admitter‐rounder hospitalist group (group 2), and 2 teaching service control groups separated according to the prechange or postchange time period (groups 3 and 4, respectively). The primary outcome variable for the study was transfer of the patient to the ICU within 24 hours of inpatient floor arrival, which has been previously reported as an adverse outcome related to the admission process due to its association with increased inpatient mortality.[13] Secondary outcome variables included ED LOS, total hospital LOS, and readmission to Northwestern Memorial Hospital within 30 days of hospital discharge. Data on unexpected transfer to the operating room, discharge against medical advice (all within 24 hours of arrival to the ward), as well as mortality during the hospital stay were collected but not further analyzed due to the extremely low incidence of each. Covariables measured included each admitted patient's age, sex, race, Elixhauser composite score (a patient comorbidity score associated with inpatient mortality, described by van Walraven et al.[14]), case mix, insurance payer status, patient census on the accepting service for day 2 of the admitted patient's hospitalization, and hospital occupancy on the day of admission.[7, 14, 15, 16] Hospital occupancy was calculated as the sum of the number of beds occupied at midnight plus the number of patients discharged during the previous 24 hours, divided by the number of hospital beds, as defined by Forster et al.[16]
Statistical Analysis
Prestudy sample size calculation using an value of 0.05 and value of 0.2 to detect a 1.5% absolute difference in ICU transfer rate between postchange study groups, with a patient distribution ratio of 3.3:1 or higher between the admitter‐rounder and teaching postchange groups, and an assumed higher transfer rate in the teaching postchange group, revealed a requirement of at least 1068 hospitalizations in the teaching postchange group for our evaluation. Descriptive statistics were calculated for each patient group. Firth's logistic regressions were used to model the odds of patient being transfer to ICU within 24 hours after arrival and the odds of hospital readmission within 30 days after discharge, adjusting for confounders.[17] Quantile regressions were used to model the change in the median of ED LOS and the median of hospital LOS due to the right‐skewed distributions of LOS. Based on the clinical relevance to the outcomes, models were adjusted for patients' measured covariates. All covariates that were significant at = 0.05 level were considered significant. All statistical analyses were performed in SAS version 9.4 (SAS Institute Inc., Cary, NC).
RESULTS
Patient Characteristics
The characteristics of the 4 patient populations are listed in Table 1. Compared to the general admission hospitalist group, the admitter‐rounder hospitalist group was more likely to be older (admitter‐rounder 61.9 19.0 vs 61.2 18.4, P = 0.03), a Medicare beneficiary (56.0% vs 52.9%, P < 0.001), have a higher Elixhauser composite score (6.6 7.3 vs 5.3 6.7, P < 0.001), and less likely to be white (46.5% vs 48.4%, P = 0.03). The teaching service patient characteristics changed over time only with regard to Elixhauser composite score (teaching postchange 6.4 7.3 vs 5.6 7.0, P < 0.001); except for case mix, all other covariates did not change significantly between prechange and postchange teaching services. There was no significant difference in Elixhauser composite score between hospitalist and teaching services during the study period. Hospitalist groups were more likely than teaching service groups to have older patients, both before (hospitalist 61.2 18.4 vs teaching 60.1 19.1, P = 0.009) and after (hospitalist 61.9 18.0 vs teaching 60.0 18.6, P < 0.001) the hospitalist admission system change. Compared to teaching groups, hospitalist groups were less likely to have female patients before the system change (hospitalist 52.3% vs 54.6%, P = 0.03), and more likely to have Medicare beneficiaries after the system change (hospitalist 56.0% vs 51.1%, P < 0.001). Significant differences in case mix existed in all comparisons among all 4 study groups.
| Group 1 Hospitalist General, N = 8,465 | Group 2 Hospitalist Admitter‐Rounder, N = 6,291 | Group 3 Teaching Prechange, N = 2,636 | Group 4 Teaching Postchange, N = 1,878 | Group 2 vs Group 1, P Value | Group 4 vs Group 3, P Value | Group 1 vs Group 3, P Value | Group 2 vs Group 4, P Value | |
|---|---|---|---|---|---|---|---|---|
| ||||||||
| Age, y, mean (SD) | 61.2 (18.4) | 61.9 (19.0) | 60.1 (19.1) | 60.0 (18.6) | 0.03 | 0.88 | 0.009 | <0.001 |
| Female sex, n (%) | 4,423 (52.3) | 3,298 (52.4) | 1,440 (54.6) | 1,031 (54.9) | 0.83 | 0.86 | 0.03 | 0.06 |
| White race, n (%) | 4,096 (48.4) | 2,927 (46.5) | 1,261 (47.8) | 880 (46.9) | 0.03 | 0.52 | 0.62 | 0.80 |
| Payer status | < 0.001 | 0.001 | 0.07 | <0.001 | ||||
| Medicaid, n (%) | 1,121 (13.2) | 811 (12.9) | 393 (14.9) | 222 (11.8) | ||||
| Medicare, n (%) | 4,475 (52.9) | 3,521 (56.0) | 1,394 (52.9) | 961 (51.2) | ||||
| Private, n (%) | 2,218 (26.2) | 1,442 (22.9) | 674 (25.6) | 525 (28.0) | ||||
| Self‐pay, n (%) | 299 (3.5) | 273 (4.3) | 72 (2.7) | 88 (4.7) | ||||
| Other, n (%) | 352 (4.2) | 244 (3.9) | 103 (3.9) | 82 (4.4) | ||||
| Elixhauser composite score, mean (SD) | 5.3 (6.7) | 6.6 (7.3) | 5.6 (7.0) | 6.4 (7.3) | <0.001 | 0.007 | 0.05 | 0.30 |
| Inpatient mortality, n (%) | 74 (0.9) | 70 (1.1) | 31 (1.2) | 18 (1.0) | 0.14 | 0.51 | 0.15 | 0.62 |
| No. of patients seen by accepting service, mean (SD) | 10.2 (3.8) | 12.0 (3.1) | 6.3 (3.2) | 7.0 (3.3) | <0.001 | <0.001 | <0.001 | <0.001 |
| Hospital % occupancy at admission, mean (SD) | 1.23 (0.18) | 1.20 (0.17) | 1.23 (0.18) | 1.20 (0.17) | <0.001 | <0.001 | 0.61 | 0.43 |
| Case mix, n (%) | <0.001 | <0.001 | <0.001 | <0.001 | ||||
| Diseases of the circulatory system | 2,695 (31.8) | 1,173 (18.9) | 396 (15.0) | 292 (15.6) | ||||
| Other | 1,139 (13.5) | 1,151 (18.3) | 423 (16.1) | 292 (15.6) | ||||
| Diseases of the respiratory system | 883 (10.4) | 612 (9.7) | 314 (11.9) | 541 (28.9) | ||||
| Diseases of the digestive system | 923 (10.9) | 889 (14.1) | 420 (15.9) | 196 (10.4) | ||||
| Diseases of the genitourinary system | 492 (5.8) | 525 (8.4) | 230 (8.7) | 122 (6.5) | ||||
| Injury and poisoning | 517 (6.1) | 451 (7.2) | 182 (6.9) | 80 (4.3) | ||||
| Endocrine, nutritional, and metabolic diseases and immunity disorders | 473 (5.6) | 357 (5.7) | 194 (7.4) | 76 (4.1) | ||||
| Symptoms, signs, and ill‐defined conditions and factors influencing health status | 470 (5.6) | 267 (4.2) | 141 (5.4) | 63 (3.4) | ||||
| Diseases of the musculoskeletal system and connective tissue | 371 (4.4) | 281 (4.5) | 136 (5.1) | 58 (3.1) | ||||
| Infectious and parasitic diseases | 234 (2.8) | 288 (4.6) | 108 (4.1) | 98 (5.2) | ||||
| Diseases of the blood and blood‐forming organs | 268 (3.2) | 297 (4.7) | 92 (3.5) | 60 (3.2) | ||||
Impact of the Admission System on Outcomes
Measured unadjusted primary and secondary outcomes for the 4 study groups, as well as inpatient mortality, are listed in Table 2. Comparative odds ratios (ORs) for the outcomes of transfer to ICU 24 hours of floor arrival and readmission to hospital 30 days after discharge, median (50% quantile) regression results for the outcomes of ED and hospital LOS, each adjusted by all study covariates, as well as associated difference‐in‐difference parameter estimates with associated standard error (SE) ranges and P values, are listed in Table 3. Difference‐in‐difference analysis of outcomes associated with adoption of the hospitalist admitter‐rounder system compared to the time‐matched teaching service revealed no statistically significant difference in associated ICU transfer outcome between hospitalist or teaching services (admitter‐rounder OR difference of +0.22, SE 0.22, P = 0.32). A significant decrease in associated odds for hospital readmission 30 days postdischarge was noted when adoption of the hospitalist admitter‐rounder system was compared to the time‐matched teaching service (admitter‐rounder OR difference of 0.21, SE 0.08, P = 0.01). Adoption of the hospitalist admitter‐rounder system, compared to the time‐matched teaching service, was associated with a significant increase in ED LOS (admitter‐rounder difference of +0.49 hours, SE 0.09, P < 0.001). Difference‐in‐difference analysis revealed no significant difference in associated hospital LOS between the hospitalist and time‐matched teaching services over the study period (admitter‐rounder difference of 0.39 hours, SE 2.44, P = 0.87).
|
Group 1, Hospitalist General, N = 8,465 |
Group 2, Hospitalist Admitter‐Rounder, N = 6,291 |
Group 3, Teaching Prechange, N = 2,636 |
Group 4. Teaching Postchange, N = 1,878 |
|
|---|---|---|---|---|
| ||||
| Transfer to ICU 24 hours after ward arrival, n (%) | 235 (2.8) | 139 (2.2) | 75 (2.9) | 59 (3.1) |
| Hospital readmission 30 days after discharge, n (%) | 1,924 (22.7) | 1,546 (24.6) | 608 (23.1) | 504 (26.8) |
| Emergency department length of stay, h | ||||
| Mean (SD) | 6.9 (3.36) | 7.39 (3.9) | 7.05 (2.98) | 6.89 (3.03) |
| Median [range] | 6.22 [0.2262.47] | 6.68 [0.62149.52] | 6.53 [1.9833.63] | 6.3 [2.0224.17] |
| Hospital length of stay, h | ||||
| Mean (SD) | 102.46 (120.14) | 125.94 (153.41) | 114.07 (165.62) | 122.89 (125.55) |
| Median [range] | 67.37 [0.521,964.07] | 88.18 [0.285,801.28] | 71.5 [4.575,131.37] | 88.08 [4.731,262.58] |
| Hospitalist Admitter‐Rounder vs Hospitalist General | Teaching Postchange vs Teaching Prechange | Difference‐in‐Difference Value Parameter Estimate [Standard Error], P Value | |
|---|---|---|---|
| |||
| Transfer to ICU 24 hours after floor arrival, OR (95% confidence interval) | 1.292 (1.0261.629) | 1.029 (0.7211.468) | OR: +0.22 [ 0.22], 0.32 |
| Hospital readmission 30 days after discharge, OR (95% confidence interval) | 1.048 (0.9661.136) | 1.298 (1.1271.495) | OR: 0.21 [ 0.08], 0.01 |
| Emergency department length of stay, median hours | +0.40 | 0.09 | +0.49 [ 0.09], <0.001 |
| Hospital length of stay, median hours | +12.96 | +13.36 | 0.39 [ 2.44], 0.87 |
DISCUSSION
Our observations were revealing for a statistically nonsignificant trend toward increased ICU transfers 24 hours after floor arrival after adoption of the admitter‐rounder model by the hospital medicine service. Despite prior publication of early transfer to the ICU being associated with adverse outcomes, including increased inpatient mortality, we observed no difference in mortality in our study groups.[13] We suspect that earlier transfer to the ICU in our study cohort may instead represent a protective action taken more frequently by admitting hospitalists in the admitter‐rounder model in response to provider discontinuity risks embedded in the admission process. Requests for transfer to the ICU at our institution require approval by the ICU team, and requests from attending hospitalists may be responded to differently from requests enacted by teaching team members, which as a factor also may account for some of the adjusted differences in transfer incidence. Taken together, increased availability of hospitalists during the admission process may result in earlier implementation of an overall lower threshold for implementation of ICU transfer. Our conclusion is limited by our study cohort's overall inpatient mortality rate, which is sufficiently low to preclude further assessment of the relationship of adverse outcomes with ICU transfer rate in our study groups. Therefore, clinical significance of our primary outcome findings, as well as the workload factors that impact ICU transfers initiated by hospitalist and teaching services, require further examination.
Despite a hypothesized increase in hospital LOS caused by additional discontinuity of hospitalist care in the admitter‐rounder model, adoption of the admitter‐rounder model was not associated with an increased hospital LOS. We suspect this finding may represent the presence of action(s) proximal to the admission process, on the part of either admission and/or rounding hospitalists, which decrease hospital LOS to a degree offsetting the expected LOS increase generated by provider discontinuity. Examples of such actions include more efficient testing or consultation, or improved detection of diagnostic errors.
Adoption of the admitter‐rounder model by the hospital medicine service was also associated with decreased hospital readmission rates compared to the time‐matched teaching service. We suspect that assignment of daily discharge and admission service activity to separate hospitalists in the admitter‐rounder model may allow more opportunity for rounder hospitalists to engage in activity protective against readmissions, such as greater direct engagement with postdischarge resources, or improved hospitalist availability for multidisciplinary inpatient efforts focused on discharge planning.
Adoption of the admitter‐rounder model was found to be associated with a median 29‐minute increase in ED LOS compared to the time‐matched teaching service. As a floor team member's physical presence in the ED was not required for ED‐floor transfer during the study period, increased physical availability of admitting hospitalists in the admitter‐rounder model may allow for increased opportunity for a hospitalist to disrupt ED‐specific workflows related to patient transfer (eg, disruption of transportation service activity by an earlier bedside visit from the admitting hospitalist). Hospitalists in the general model were allowed to leave after performing their daily duties, whereas admitting hospitalists in the admitter‐rounder model were assigned to stay for a timed shift, regardless of the completion of admissions; the difference in duty assignment may be associated with different hospitalist behaviors during the admission process. Improved ease for ED staff to contact hospitalist staff in the admitter‐rounder model may have led ED staff to prioritize other tasks more demanding of their continuous engagement at the expense of initiating admissions, thereby paradoxically delaying admissions to hospital medicine.
Other studies exist that attempt to describe changes in admission service structure, particularly with regard to housestaff admission activity in relation to changes in resident work hours. Many of these studies vary with regard to implementation of separate physician teams for day and night coverage, or are focused on a specific medical condition, thereby limiting their applicability to a hospital medicine service free of work‐hour restrictions and engaged in care of a wide variety of medical conditions.[18, 19, 20] In contrast, our study is an attempt to examine, in isolation, outcomes associated with adoption of an admitter‐rounder model of care as a specific discontinuity risk during the admission process, within the context of a stable system of night coverage in place for all medical teams engaged in admission activity of undifferentiated medical patients.
Limitations of our study include the inability to ascertain causality of observed outcomes, due to our observational study design. Our study was of a single hospital, which may limit applicability of our results to other hospital environments. However, the admission models examined in our study are common among hospital medicine groups. Clinically relevant outcome metrics, such as mortality and unexpected transfer to the operating room, were measured but of too low incidence to allow for further meaningful analysis. The clinical consequences and workflow practices that correlate with our study's findings likely require case review and time‐motion analyses, respectively, to further delineate the relevance of our findings; these analyses were outside of the scope of our study, and further investigation is required. In summary, our observations suggest that adoption by hospitalist services of an admitter‐rounder model of care for admissions is associated with a decreased rate of hospital readmission 30 days after discharge, with no effect on median hospital LOS, a statistically nonsignificant trend toward more ICU transfers in the first 24 hours of a patient's hospital stay, and a slight increase in median ED LOS.
Acknowledgements
This study was conducted with logistical support, software, and computer hardware provided by the Division of Hospital Medicine, Department of Medicine, Northwestern University Feinberg School of Medicine, and by the Biostatistics Collaboration Center, Northwestern University Feinberg School of Medicine.
Disclosure: Nothing to report.
- , , , et al. Residents' and attending physicians' handoffs: a systematic review of the literature. Acad Med. 2009;84(12):1775–1787.
- , , , et al. The effect of emergency department crowding on clinically oriented outcomes. Acad Emerg Med. 2009;16:1–10.
- , , , et al. Time series analysis of variables associated with daily mean emergency department length of stay. Ann Emerg Med. 2007;49:265–271.
- , , , et al. Active bed management by hospitalists and emergency department throughput. Ann Intern Med. 2008;149:804–810.
- Society of Hospital Medicine. 2014 state of hospital medicine report. 2014:22.
- , , , , . The impact of fragmentation of hospitalist care on length of stay. J Hosp Med. 2010;5:335–338.
- , , , et al. The effect of hospitalist discontinuity on adverse events. J Hosp Med. 2015;10:147–151.
- , , , . Liability impact of the hospitalist model of care. J Hosp Med. 2014;9:750–755.
- . Does continuity of care matter? No: discontinuity can improve patient care. West J Med. 2001;175(1):5.
- , , , , . Consultant input in acute medical admissions and patient outcomes in hospitals in England: a multivariate analysis. PLoS One. 2013;8(4):e61476.
- , , . Effectiveness of acute medical units in hospitals: a systematic review. Int J Qual Health Care. 2009;21(6):397–407.
- , , . Acute medicine in the United Kingdom: first‐hand perspectives on a parallel evolution of inpatient medical care. J Hosp Med. 2012:7(3);254–257.
- , , , et al. Adverse outcomes associated with delayed intensive care unit transfers in an integrated healthcare system. J Hosp Med. 2012;7(3):224–230.
- , , , , . A modification of the Elixhauser comorbidity measures into a point system for hospital death using administrative data. Med Care. 2009;47(6):626–633.
- , , , , . Effect of hospitalist workload on the quality and efficiency of care. JAMA Intern Med. 2014;174(5):786–793.
- , , , , . The effect of hospital occupancy on emergency department length of stay and patient disposition. Acad Emerg Med. 2003;10(2):127–133.
- . Bias reduction of maximum likelihood estimates. Biometrika. 1993;80(1):27–38.
- , , , et al. Effect of the 2011 vs 2003 duty hour regulation‐compliant models on sleep duration, trainee education, and continuity of patient care among internal medicine house staff. JAMA Intern Med. 2013;173(8):649–655.
- , , , . Post‐call transfer of resident responsibility: Its effect on patient care. J Gen Intern Med. 1990;5:501–505.
- , , , et al. Effect of short call admission on length of stay and quality of care for acute decompensated heart failure. Circulation. 2008;117:2637–2644.
Hospital admission represents a time period during which patients are at risk for poor clinical outcomes. Although some risk is directly generated by illness pathophysiology, some additive risk is generated by the emergency department (ED)inpatient service handover inherent in the admission process.[1] Increased risk of suboptimal outcomes can result from ED overcrowding, which has been associated with increased mortality, difficulty in patient disposition, and delays in provision of care.[2] Inpatient bed occupancy, as well as availability and organization of accepting inpatient service healthcare staff, can affect ED overcrowding as well.[3, 4]
The overwhelming majority of hospitalist groups accept a significant portion of their admissions via the ED.[5] Hospitalist services must balance their daily group workload between ongoing care and discharge of inpatients and the activity of admitting new patients to their service. Two major models of admission processing exist for hospitalist groups to accomplish these competing tasks. One model, called the general model, employs the use of individual hospitalists to simultaneously perform admission activity as well as ongoing ward‐based care for inpatients during their workday. In the general model, a hospitalist who admits patients on their first hospital day will generally continue to see them on their second hospital day. The other model, called the admitter‐rounder model, divides the hospitalist daily group workflow between hospitalists who are assigned to perform only admission activity (admitters), and hospitalists who are assigned to perform only ongoing care for patients who are already admitted (rounders). In the admitter‐rounder model, the admitter on a patient's first hospital day will generally not serve as the patient's rounder on subsequent hospital days.
Limited evidence exists to guide hospitalist groups on which model their service design should adopt. Conflicting evidence exists as to whether the fragmentation of care generated by an admitter‐rounder admission model is beneficial or harmful.[6, 7, 8, 9] Increased availability of attending inpatient physicians during the EDinpatient admission process has been associated with improved hospital mortality and decreased readmissions in hospital settings outside the United States, where attending availability may otherwise be limited.[10, 11, 12] Separation of admission and rounding activity within a hospitalist workforce may allow each group of hospitalists to provide more timely and effective care related to their respective tasks. Our division implemented a change from a general model to an admitter‐rounder model of care on January 2, 2012. We hypothesized that changing from a general admission model to an admitter‐rounder model of care would be associated with a decreased rate of transfer to the intensive care unit (ICU) 24 hours after floor arrival and shortened ED length of stay (LOS), due to improved availability of hospitalists during the admission process. Due to the introduction of discontinuity, we hypothesized that adoption of the admitter‐rounder model would be associated with a prolongation of hospital LOS and no overall effect on 30 day postdischarge readmission rate. We sought to examine the relationship between our division's service design change and our hypothesized variables of interest.
METHODS
Setting and Study Design
We retrospectively evaluated electronic medical records of patients admitted between July 1, 2010 and June 30, 2013 from the ED to medical floor beds at Northwestern Memorial Hospital, an academic tertiary care teaching hospital located in Chicago, Illinois, under care of either a hospital medicine independent service or a medical teaching service. Admissions for care in observation units, service intake via interhospital or intrahospital transfers of care, or direct admissions from outpatient clinics that bypassed the ED were excluded, as was any patient with incomplete data, leaving 19,270 hospitalizations available for analysis. Each hospital medicine service was comprised of a single hospitalist with only clinical care responsibilities for the workday and no ICU or outpatient clinic responsibilities, with routine handover of the service to a hospitalist colleague every 7 days. Each medical teaching service was comprised of a supervising attending (often a hospitalist), a resident, 1 to 2 interns, and 1 to 3 medical students; the residents and interns maintained outpatient clinic responsibilities of 1 to 2 half days per service week. Inpatients on all teams were localized to hospital beds assigned to their care team. Regardless of hospitalist service design, 3 or more hospitalists were available each day to perform daytime admissions. Throughout the study period, both the hospital medicine and medicine teaching services utilized a group of physicians separate from the day teams to perform admissions and cross‐coverage at night, and the teaching services maintained a generalist model of daytime admission practice. All teams accepted new admissions every day. All ED admissions involved a phone‐based signout of transfer of care to the person admitting for the accepting ward team, followed by transfer of the patient to the floor, independent of whether the accepting team met the patient in the ED prior to transfer. None of the accepting inpatient services in the study had a formal right to refuse acceptance of patients referred for admission by the ED. The time period evaluated was constrained to avoid the effect of other service changes that took place before or after the study period. The Northwestern University Institutional Review Board approved the study (STU00087387).
Data Acquisition and Measures
Data were obtained from the Northwestern Memorial Hospital Enterprise Data Warehouse, an integrated repository of all clinical and research data for patients receiving care in the system. For analysis, the patients were separated into 4 groups: a prechange general admission hospitalist group (group 1), a postchange admitter‐rounder hospitalist group (group 2), and 2 teaching service control groups separated according to the prechange or postchange time period (groups 3 and 4, respectively). The primary outcome variable for the study was transfer of the patient to the ICU within 24 hours of inpatient floor arrival, which has been previously reported as an adverse outcome related to the admission process due to its association with increased inpatient mortality.[13] Secondary outcome variables included ED LOS, total hospital LOS, and readmission to Northwestern Memorial Hospital within 30 days of hospital discharge. Data on unexpected transfer to the operating room, discharge against medical advice (all within 24 hours of arrival to the ward), as well as mortality during the hospital stay were collected but not further analyzed due to the extremely low incidence of each. Covariables measured included each admitted patient's age, sex, race, Elixhauser composite score (a patient comorbidity score associated with inpatient mortality, described by van Walraven et al.[14]), case mix, insurance payer status, patient census on the accepting service for day 2 of the admitted patient's hospitalization, and hospital occupancy on the day of admission.[7, 14, 15, 16] Hospital occupancy was calculated as the sum of the number of beds occupied at midnight plus the number of patients discharged during the previous 24 hours, divided by the number of hospital beds, as defined by Forster et al.[16]
Statistical Analysis
Prestudy sample size calculation using an value of 0.05 and value of 0.2 to detect a 1.5% absolute difference in ICU transfer rate between postchange study groups, with a patient distribution ratio of 3.3:1 or higher between the admitter‐rounder and teaching postchange groups, and an assumed higher transfer rate in the teaching postchange group, revealed a requirement of at least 1068 hospitalizations in the teaching postchange group for our evaluation. Descriptive statistics were calculated for each patient group. Firth's logistic regressions were used to model the odds of patient being transfer to ICU within 24 hours after arrival and the odds of hospital readmission within 30 days after discharge, adjusting for confounders.[17] Quantile regressions were used to model the change in the median of ED LOS and the median of hospital LOS due to the right‐skewed distributions of LOS. Based on the clinical relevance to the outcomes, models were adjusted for patients' measured covariates. All covariates that were significant at = 0.05 level were considered significant. All statistical analyses were performed in SAS version 9.4 (SAS Institute Inc., Cary, NC).
RESULTS
Patient Characteristics
The characteristics of the 4 patient populations are listed in Table 1. Compared to the general admission hospitalist group, the admitter‐rounder hospitalist group was more likely to be older (admitter‐rounder 61.9 19.0 vs 61.2 18.4, P = 0.03), a Medicare beneficiary (56.0% vs 52.9%, P < 0.001), have a higher Elixhauser composite score (6.6 7.3 vs 5.3 6.7, P < 0.001), and less likely to be white (46.5% vs 48.4%, P = 0.03). The teaching service patient characteristics changed over time only with regard to Elixhauser composite score (teaching postchange 6.4 7.3 vs 5.6 7.0, P < 0.001); except for case mix, all other covariates did not change significantly between prechange and postchange teaching services. There was no significant difference in Elixhauser composite score between hospitalist and teaching services during the study period. Hospitalist groups were more likely than teaching service groups to have older patients, both before (hospitalist 61.2 18.4 vs teaching 60.1 19.1, P = 0.009) and after (hospitalist 61.9 18.0 vs teaching 60.0 18.6, P < 0.001) the hospitalist admission system change. Compared to teaching groups, hospitalist groups were less likely to have female patients before the system change (hospitalist 52.3% vs 54.6%, P = 0.03), and more likely to have Medicare beneficiaries after the system change (hospitalist 56.0% vs 51.1%, P < 0.001). Significant differences in case mix existed in all comparisons among all 4 study groups.
| Group 1 Hospitalist General, N = 8,465 | Group 2 Hospitalist Admitter‐Rounder, N = 6,291 | Group 3 Teaching Prechange, N = 2,636 | Group 4 Teaching Postchange, N = 1,878 | Group 2 vs Group 1, P Value | Group 4 vs Group 3, P Value | Group 1 vs Group 3, P Value | Group 2 vs Group 4, P Value | |
|---|---|---|---|---|---|---|---|---|
| ||||||||
| Age, y, mean (SD) | 61.2 (18.4) | 61.9 (19.0) | 60.1 (19.1) | 60.0 (18.6) | 0.03 | 0.88 | 0.009 | <0.001 |
| Female sex, n (%) | 4,423 (52.3) | 3,298 (52.4) | 1,440 (54.6) | 1,031 (54.9) | 0.83 | 0.86 | 0.03 | 0.06 |
| White race, n (%) | 4,096 (48.4) | 2,927 (46.5) | 1,261 (47.8) | 880 (46.9) | 0.03 | 0.52 | 0.62 | 0.80 |
| Payer status | < 0.001 | 0.001 | 0.07 | <0.001 | ||||
| Medicaid, n (%) | 1,121 (13.2) | 811 (12.9) | 393 (14.9) | 222 (11.8) | ||||
| Medicare, n (%) | 4,475 (52.9) | 3,521 (56.0) | 1,394 (52.9) | 961 (51.2) | ||||
| Private, n (%) | 2,218 (26.2) | 1,442 (22.9) | 674 (25.6) | 525 (28.0) | ||||
| Self‐pay, n (%) | 299 (3.5) | 273 (4.3) | 72 (2.7) | 88 (4.7) | ||||
| Other, n (%) | 352 (4.2) | 244 (3.9) | 103 (3.9) | 82 (4.4) | ||||
| Elixhauser composite score, mean (SD) | 5.3 (6.7) | 6.6 (7.3) | 5.6 (7.0) | 6.4 (7.3) | <0.001 | 0.007 | 0.05 | 0.30 |
| Inpatient mortality, n (%) | 74 (0.9) | 70 (1.1) | 31 (1.2) | 18 (1.0) | 0.14 | 0.51 | 0.15 | 0.62 |
| No. of patients seen by accepting service, mean (SD) | 10.2 (3.8) | 12.0 (3.1) | 6.3 (3.2) | 7.0 (3.3) | <0.001 | <0.001 | <0.001 | <0.001 |
| Hospital % occupancy at admission, mean (SD) | 1.23 (0.18) | 1.20 (0.17) | 1.23 (0.18) | 1.20 (0.17) | <0.001 | <0.001 | 0.61 | 0.43 |
| Case mix, n (%) | <0.001 | <0.001 | <0.001 | <0.001 | ||||
| Diseases of the circulatory system | 2,695 (31.8) | 1,173 (18.9) | 396 (15.0) | 292 (15.6) | ||||
| Other | 1,139 (13.5) | 1,151 (18.3) | 423 (16.1) | 292 (15.6) | ||||
| Diseases of the respiratory system | 883 (10.4) | 612 (9.7) | 314 (11.9) | 541 (28.9) | ||||
| Diseases of the digestive system | 923 (10.9) | 889 (14.1) | 420 (15.9) | 196 (10.4) | ||||
| Diseases of the genitourinary system | 492 (5.8) | 525 (8.4) | 230 (8.7) | 122 (6.5) | ||||
| Injury and poisoning | 517 (6.1) | 451 (7.2) | 182 (6.9) | 80 (4.3) | ||||
| Endocrine, nutritional, and metabolic diseases and immunity disorders | 473 (5.6) | 357 (5.7) | 194 (7.4) | 76 (4.1) | ||||
| Symptoms, signs, and ill‐defined conditions and factors influencing health status | 470 (5.6) | 267 (4.2) | 141 (5.4) | 63 (3.4) | ||||
| Diseases of the musculoskeletal system and connective tissue | 371 (4.4) | 281 (4.5) | 136 (5.1) | 58 (3.1) | ||||
| Infectious and parasitic diseases | 234 (2.8) | 288 (4.6) | 108 (4.1) | 98 (5.2) | ||||
| Diseases of the blood and blood‐forming organs | 268 (3.2) | 297 (4.7) | 92 (3.5) | 60 (3.2) | ||||
Impact of the Admission System on Outcomes
Measured unadjusted primary and secondary outcomes for the 4 study groups, as well as inpatient mortality, are listed in Table 2. Comparative odds ratios (ORs) for the outcomes of transfer to ICU 24 hours of floor arrival and readmission to hospital 30 days after discharge, median (50% quantile) regression results for the outcomes of ED and hospital LOS, each adjusted by all study covariates, as well as associated difference‐in‐difference parameter estimates with associated standard error (SE) ranges and P values, are listed in Table 3. Difference‐in‐difference analysis of outcomes associated with adoption of the hospitalist admitter‐rounder system compared to the time‐matched teaching service revealed no statistically significant difference in associated ICU transfer outcome between hospitalist or teaching services (admitter‐rounder OR difference of +0.22, SE 0.22, P = 0.32). A significant decrease in associated odds for hospital readmission 30 days postdischarge was noted when adoption of the hospitalist admitter‐rounder system was compared to the time‐matched teaching service (admitter‐rounder OR difference of 0.21, SE 0.08, P = 0.01). Adoption of the hospitalist admitter‐rounder system, compared to the time‐matched teaching service, was associated with a significant increase in ED LOS (admitter‐rounder difference of +0.49 hours, SE 0.09, P < 0.001). Difference‐in‐difference analysis revealed no significant difference in associated hospital LOS between the hospitalist and time‐matched teaching services over the study period (admitter‐rounder difference of 0.39 hours, SE 2.44, P = 0.87).
|
Group 1, Hospitalist General, N = 8,465 |
Group 2, Hospitalist Admitter‐Rounder, N = 6,291 |
Group 3, Teaching Prechange, N = 2,636 |
Group 4. Teaching Postchange, N = 1,878 |
|
|---|---|---|---|---|
| ||||
| Transfer to ICU 24 hours after ward arrival, n (%) | 235 (2.8) | 139 (2.2) | 75 (2.9) | 59 (3.1) |
| Hospital readmission 30 days after discharge, n (%) | 1,924 (22.7) | 1,546 (24.6) | 608 (23.1) | 504 (26.8) |
| Emergency department length of stay, h | ||||
| Mean (SD) | 6.9 (3.36) | 7.39 (3.9) | 7.05 (2.98) | 6.89 (3.03) |
| Median [range] | 6.22 [0.2262.47] | 6.68 [0.62149.52] | 6.53 [1.9833.63] | 6.3 [2.0224.17] |
| Hospital length of stay, h | ||||
| Mean (SD) | 102.46 (120.14) | 125.94 (153.41) | 114.07 (165.62) | 122.89 (125.55) |
| Median [range] | 67.37 [0.521,964.07] | 88.18 [0.285,801.28] | 71.5 [4.575,131.37] | 88.08 [4.731,262.58] |
| Hospitalist Admitter‐Rounder vs Hospitalist General | Teaching Postchange vs Teaching Prechange | Difference‐in‐Difference Value Parameter Estimate [Standard Error], P Value | |
|---|---|---|---|
| |||
| Transfer to ICU 24 hours after floor arrival, OR (95% confidence interval) | 1.292 (1.0261.629) | 1.029 (0.7211.468) | OR: +0.22 [ 0.22], 0.32 |
| Hospital readmission 30 days after discharge, OR (95% confidence interval) | 1.048 (0.9661.136) | 1.298 (1.1271.495) | OR: 0.21 [ 0.08], 0.01 |
| Emergency department length of stay, median hours | +0.40 | 0.09 | +0.49 [ 0.09], <0.001 |
| Hospital length of stay, median hours | +12.96 | +13.36 | 0.39 [ 2.44], 0.87 |
DISCUSSION
Our observations were revealing for a statistically nonsignificant trend toward increased ICU transfers 24 hours after floor arrival after adoption of the admitter‐rounder model by the hospital medicine service. Despite prior publication of early transfer to the ICU being associated with adverse outcomes, including increased inpatient mortality, we observed no difference in mortality in our study groups.[13] We suspect that earlier transfer to the ICU in our study cohort may instead represent a protective action taken more frequently by admitting hospitalists in the admitter‐rounder model in response to provider discontinuity risks embedded in the admission process. Requests for transfer to the ICU at our institution require approval by the ICU team, and requests from attending hospitalists may be responded to differently from requests enacted by teaching team members, which as a factor also may account for some of the adjusted differences in transfer incidence. Taken together, increased availability of hospitalists during the admission process may result in earlier implementation of an overall lower threshold for implementation of ICU transfer. Our conclusion is limited by our study cohort's overall inpatient mortality rate, which is sufficiently low to preclude further assessment of the relationship of adverse outcomes with ICU transfer rate in our study groups. Therefore, clinical significance of our primary outcome findings, as well as the workload factors that impact ICU transfers initiated by hospitalist and teaching services, require further examination.
Despite a hypothesized increase in hospital LOS caused by additional discontinuity of hospitalist care in the admitter‐rounder model, adoption of the admitter‐rounder model was not associated with an increased hospital LOS. We suspect this finding may represent the presence of action(s) proximal to the admission process, on the part of either admission and/or rounding hospitalists, which decrease hospital LOS to a degree offsetting the expected LOS increase generated by provider discontinuity. Examples of such actions include more efficient testing or consultation, or improved detection of diagnostic errors.
Adoption of the admitter‐rounder model by the hospital medicine service was also associated with decreased hospital readmission rates compared to the time‐matched teaching service. We suspect that assignment of daily discharge and admission service activity to separate hospitalists in the admitter‐rounder model may allow more opportunity for rounder hospitalists to engage in activity protective against readmissions, such as greater direct engagement with postdischarge resources, or improved hospitalist availability for multidisciplinary inpatient efforts focused on discharge planning.
Adoption of the admitter‐rounder model was found to be associated with a median 29‐minute increase in ED LOS compared to the time‐matched teaching service. As a floor team member's physical presence in the ED was not required for ED‐floor transfer during the study period, increased physical availability of admitting hospitalists in the admitter‐rounder model may allow for increased opportunity for a hospitalist to disrupt ED‐specific workflows related to patient transfer (eg, disruption of transportation service activity by an earlier bedside visit from the admitting hospitalist). Hospitalists in the general model were allowed to leave after performing their daily duties, whereas admitting hospitalists in the admitter‐rounder model were assigned to stay for a timed shift, regardless of the completion of admissions; the difference in duty assignment may be associated with different hospitalist behaviors during the admission process. Improved ease for ED staff to contact hospitalist staff in the admitter‐rounder model may have led ED staff to prioritize other tasks more demanding of their continuous engagement at the expense of initiating admissions, thereby paradoxically delaying admissions to hospital medicine.
Other studies exist that attempt to describe changes in admission service structure, particularly with regard to housestaff admission activity in relation to changes in resident work hours. Many of these studies vary with regard to implementation of separate physician teams for day and night coverage, or are focused on a specific medical condition, thereby limiting their applicability to a hospital medicine service free of work‐hour restrictions and engaged in care of a wide variety of medical conditions.[18, 19, 20] In contrast, our study is an attempt to examine, in isolation, outcomes associated with adoption of an admitter‐rounder model of care as a specific discontinuity risk during the admission process, within the context of a stable system of night coverage in place for all medical teams engaged in admission activity of undifferentiated medical patients.
Limitations of our study include the inability to ascertain causality of observed outcomes, due to our observational study design. Our study was of a single hospital, which may limit applicability of our results to other hospital environments. However, the admission models examined in our study are common among hospital medicine groups. Clinically relevant outcome metrics, such as mortality and unexpected transfer to the operating room, were measured but of too low incidence to allow for further meaningful analysis. The clinical consequences and workflow practices that correlate with our study's findings likely require case review and time‐motion analyses, respectively, to further delineate the relevance of our findings; these analyses were outside of the scope of our study, and further investigation is required. In summary, our observations suggest that adoption by hospitalist services of an admitter‐rounder model of care for admissions is associated with a decreased rate of hospital readmission 30 days after discharge, with no effect on median hospital LOS, a statistically nonsignificant trend toward more ICU transfers in the first 24 hours of a patient's hospital stay, and a slight increase in median ED LOS.
Acknowledgements
This study was conducted with logistical support, software, and computer hardware provided by the Division of Hospital Medicine, Department of Medicine, Northwestern University Feinberg School of Medicine, and by the Biostatistics Collaboration Center, Northwestern University Feinberg School of Medicine.
Disclosure: Nothing to report.
- , , , et al. Residents' and attending physicians' handoffs: a systematic review of the literature. Acad Med. 2009;84(12):1775–1787.
- , , , et al. The effect of emergency department crowding on clinically oriented outcomes. Acad Emerg Med. 2009;16:1–10.
- , , , et al. Time series analysis of variables associated with daily mean emergency department length of stay. Ann Emerg Med. 2007;49:265–271.
- , , , et al. Active bed management by hospitalists and emergency department throughput. Ann Intern Med. 2008;149:804–810.
- Society of Hospital Medicine. 2014 state of hospital medicine report. 2014:22.
- , , , , . The impact of fragmentation of hospitalist care on length of stay. J Hosp Med. 2010;5:335–338.
- , , , et al. The effect of hospitalist discontinuity on adverse events. J Hosp Med. 2015;10:147–151.
- , , , . Liability impact of the hospitalist model of care. J Hosp Med. 2014;9:750–755.
- . Does continuity of care matter? No: discontinuity can improve patient care. West J Med. 2001;175(1):5.
- , , , , . Consultant input in acute medical admissions and patient outcomes in hospitals in England: a multivariate analysis. PLoS One. 2013;8(4):e61476.
- , , . Effectiveness of acute medical units in hospitals: a systematic review. Int J Qual Health Care. 2009;21(6):397–407.
- , , . Acute medicine in the United Kingdom: first‐hand perspectives on a parallel evolution of inpatient medical care. J Hosp Med. 2012:7(3);254–257.
- , , , et al. Adverse outcomes associated with delayed intensive care unit transfers in an integrated healthcare system. J Hosp Med. 2012;7(3):224–230.
- , , , , . A modification of the Elixhauser comorbidity measures into a point system for hospital death using administrative data. Med Care. 2009;47(6):626–633.
- , , , , . Effect of hospitalist workload on the quality and efficiency of care. JAMA Intern Med. 2014;174(5):786–793.
- , , , , . The effect of hospital occupancy on emergency department length of stay and patient disposition. Acad Emerg Med. 2003;10(2):127–133.
- . Bias reduction of maximum likelihood estimates. Biometrika. 1993;80(1):27–38.
- , , , et al. Effect of the 2011 vs 2003 duty hour regulation‐compliant models on sleep duration, trainee education, and continuity of patient care among internal medicine house staff. JAMA Intern Med. 2013;173(8):649–655.
- , , , . Post‐call transfer of resident responsibility: Its effect on patient care. J Gen Intern Med. 1990;5:501–505.
- , , , et al. Effect of short call admission on length of stay and quality of care for acute decompensated heart failure. Circulation. 2008;117:2637–2644.
Landscape of Business Models in Teledermatology
Teledermatology remains relatively limited in practice despite strong evidence supporting its use.1 A major impediment to its adoption is nonreimbursement.2,3 We sought to characterize business models that currently are in use for teledermatology through interviews with private and academic dermatologists.
Methods
The institutional review board at the University of Pennsylvania (Philadelphia, Pennsylvania) exempted this study from review. We contacted the email lists of the American Academy of Dermatology’s Telemedicine Task Force, the American Telemedicine Association’s Teledermatology Special Interest Group, and the Association of Professors of Dermatology to identify dermatologists who have been reimbursed for teledermatology services. Inclusion criteria were dermatologists who were currently receiving payment for teledermatology services and members of teledermatology-related professional groups. Interviews were conducted by telephone and/or email using an interview guide, which included questions on teledermatology platforms and workflow models, reimbursement structures and amounts, and referrers. Individuals, institutions, and teledermatology platforms were anonymized to encourage candid disclosure of business practices.
Results
Nineteen dermatologists participated in the study. Most participants described business models fitting into 4 categories: (1) standard fee-for-service reimbursement from insurance (n=4), (2) capitated service contracts (n=6), (3) per-case service contracts (n=3), and (4) direct to consumer (n=5)(Table). There were other business models reported at Veterans Affairs hospitals and accountable care organizations (n=4).
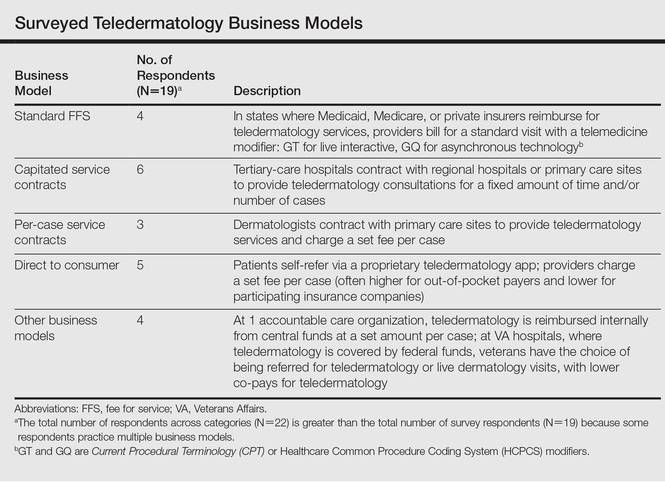
Standard fee-for-service (FFS) teledermatology business models were frequently represented among respondents at academic institutions. With this model, providers used live interactive or store-and-forward teledermatology platforms to conduct virtual clinic visits and bill patients’ insurance companies directly. At some institutions, providers conducted live interactive teledermatology visits and also used store-and-forward teledermatology for initial screening before the patient encounter. Physician extenders at some referring sites (eg, physician assistants, nurse practitioners) were trained to photograph lesions, set up live interactive teledermatology equipment, and perform certain procedures such as skin biopsies. Referrers—often Federally Qualified Health centers, rural health clinics, or state facilities—contracted with the teledermatology site and sometimes paid a fee to join the referral network.
In another business model, teledermatology centers did not bill patients directly and instead received payment only from the centers’ participating referrers through service contracts. The subscribing institutions then could bill patients’ insurance companies appropriately. Service contracts among respondents were structured either to be capitated or reimbursed on a per-case basis. Capitated service contracts typically required subscribing institutions to pay weekly stipends of several hundred dollars or a percentage of an individual dermatologist’s salary (eg, 0.1 full-time equivalents) for consultations. Sometimes the number of consultations per time period was capped. In contrast, per-case service contracts involved per-case payments from referrers to dermatologists for teledermatology consultations. In one hybrid model, the subscribing institution paid an annual fee for a certain number of consultations per month with any additional consultations exceeding that number covered at a set fee per case.
Direct-to-consumer models, which were more common among private dermatologist respondents, used proprietary asynchronous teledermatology platforms to connect with patients. Patients generally paid out of pocket to participate, with fees ranging from $30 to $100 per case or less if the patient had participating insurance. One respondent contracted with a large private insurer to reimburse this service at a reduced fee.
Comment
Our study was limited by a small sample size; however, our goal was to detect and report different types of teledermatology business models that currently are in practice. The small number of respondents likely does not indicate poor participation; rather, it is probably reflective of our strict inclusion criteria. We sought to interview only dermatologists who were currently receiving payment for teledermatology services and members of teledermatology-related professional groups. Our strategy in this study was to cast a wide net to capture some of the few dermatologists who currently fit this requirement.
We anticipate that the standard FFS business model for teledermatology will expand slightly as more legislation incentivizing telemedicine is enacted. Currently, Medicaid reimburses for live interactive teledermatology in 47 states and for asynchronous consultations in 9 states, whereas Medicare nationally reimburses only for live interactive services in low-access areas.4 Additionally, 29 states and the District of Columbia have private insurance parity laws mandating that private plans cover and reimburse for telemedicine comparable to in-person care. Seven of those states just passed their legislation in 2015, with 8 more states currently considering proposed parity laws.5
On the other hand, the FFS model in general may actually limit the rate of adoption of teledermatology. Several of our study’s respondents pointed to dermatologists’ opportunity costs under the FFS reimbursement environment as a barrier to widespread adoption of teledermatology; providers may prefer in-person visits to teledermatology because they can perform procedures, which are more highly reimbursed. For that reason, a major driver of teledermatology adoption in the future may be the emergence of new, quality-based practice models, such as accountable care organizations.6
Because most states require that providers hold a medical license in the jurisdiction where their patient is physically located, physicians providing teledermatology services across state lines could face additional licensure requirements. However, these requirements would not be a barrier for physicians providing teledermatology services within the context of an in-state referral network. Licensure requirements generally do not restrict physician-to-physician consultations.7
Conclusion
As reimbursement models across medicine evolve and telemedicine continues to enhance delivery of care, we anticipate that quality-based reimbursement ultimately will drive successful utilization of teledermatology services. Telemedicine has been noted to be a cost-effective tool for coordinating care, maintaining quality, and improving patient satisfaction.8 Although none of the teledermatology business models surveyed currently incorporate incentives for faster case turnaround or higher patient satisfaction, we expect models to adjust as quality measures become more prevalent in the reimbursement landscape. Effective business models must be implemented to make teledermatology a feasible option for dermatologists to deliver care and patients to access care.
1. Armstrong AW, Wu J, Kovarik CL, et al. State of teledermatology programs in the United States. J Am Acad Dermatol. 2012;67:939-944.
2. Armstrong AW, Kwong MW, Ledo L, et al. Practice models and challenges in teledermatology: a study of collective experiences from teledermatologists. PLOS One. 2011;6:e28687.
3. Thomas L, Capistrant G. State telemedicine gaps analysis: coverage & reimbursement. American Telemedicine Association website. http://www.americantelemed.org/docs/default-source/policy/50-state-telemedicine-gaps-analysis---coverage-and-reimbursement.pdf. Published May 2015. Accessed February 19, 2016.
4. State telehealth laws and reimbursement policies: a comprehensive scan of the 50 states and District of Columbia. Center for Connected Health Policy website. http://cchpca.org/sites/default/files/resources/State%20Laws%20and%20Reimbursement%20Policies%20Report%20Feb%20%202015.pdf. Published June 2015. Accessed February 19, 2016.
5. 2015 State telemedicine legislation tracking. American Telemedicine Association website. http://www.america telemed.org/docs/default-source/policy/state-legislation-matrix_2016147931CF25A6.pdf?sfvrsn=2. Updated January 11, 2016. Accessed March 23, 2016.
6. Telehealth and ACO’s–a match made in heaven. Hands on Telehealth website. http://www.handsontelehealth.com/past-issues/159-infographic-telehealth-and-acosa-match-made-in-heaven. Accessed February 19, 2016.
7. Thomas L, Capistrant G. State telemedicine gaps analysis: physician practice standards & licensure. American Telemedicine Association website. http://www.american telemed.org/docs/default-source/policy/50-state-telemedicine-gaps-analysis--physician-practice-standards-licensure.pdf. Published May 2015. Accessed February 19, 2016.
8. Telemedicine’s impact on healthcare cost and quality. American Telemedicine Association website. http://www.americantelemed.org/docs/default-source/policy/examples-of-research-outcomes---telemedicine’s-impact-on-healthcare-cost-and-quality.pdf. Published April 2015. Accessed February 19, 2016.
Teledermatology remains relatively limited in practice despite strong evidence supporting its use.1 A major impediment to its adoption is nonreimbursement.2,3 We sought to characterize business models that currently are in use for teledermatology through interviews with private and academic dermatologists.
Methods
The institutional review board at the University of Pennsylvania (Philadelphia, Pennsylvania) exempted this study from review. We contacted the email lists of the American Academy of Dermatology’s Telemedicine Task Force, the American Telemedicine Association’s Teledermatology Special Interest Group, and the Association of Professors of Dermatology to identify dermatologists who have been reimbursed for teledermatology services. Inclusion criteria were dermatologists who were currently receiving payment for teledermatology services and members of teledermatology-related professional groups. Interviews were conducted by telephone and/or email using an interview guide, which included questions on teledermatology platforms and workflow models, reimbursement structures and amounts, and referrers. Individuals, institutions, and teledermatology platforms were anonymized to encourage candid disclosure of business practices.
Results
Nineteen dermatologists participated in the study. Most participants described business models fitting into 4 categories: (1) standard fee-for-service reimbursement from insurance (n=4), (2) capitated service contracts (n=6), (3) per-case service contracts (n=3), and (4) direct to consumer (n=5)(Table). There were other business models reported at Veterans Affairs hospitals and accountable care organizations (n=4).
Standard fee-for-service (FFS) teledermatology business models were frequently represented among respondents at academic institutions. With this model, providers used live interactive or store-and-forward teledermatology platforms to conduct virtual clinic visits and bill patients’ insurance companies directly. At some institutions, providers conducted live interactive teledermatology visits and also used store-and-forward teledermatology for initial screening before the patient encounter. Physician extenders at some referring sites (eg, physician assistants, nurse practitioners) were trained to photograph lesions, set up live interactive teledermatology equipment, and perform certain procedures such as skin biopsies. Referrers—often Federally Qualified Health centers, rural health clinics, or state facilities—contracted with the teledermatology site and sometimes paid a fee to join the referral network.
In another business model, teledermatology centers did not bill patients directly and instead received payment only from the centers’ participating referrers through service contracts. The subscribing institutions then could bill patients’ insurance companies appropriately. Service contracts among respondents were structured either to be capitated or reimbursed on a per-case basis. Capitated service contracts typically required subscribing institutions to pay weekly stipends of several hundred dollars or a percentage of an individual dermatologist’s salary (eg, 0.1 full-time equivalents) for consultations. Sometimes the number of consultations per time period was capped. In contrast, per-case service contracts involved per-case payments from referrers to dermatologists for teledermatology consultations. In one hybrid model, the subscribing institution paid an annual fee for a certain number of consultations per month with any additional consultations exceeding that number covered at a set fee per case.
Direct-to-consumer models, which were more common among private dermatologist respondents, used proprietary asynchronous teledermatology platforms to connect with patients. Patients generally paid out of pocket to participate, with fees ranging from $30 to $100 per case or less if the patient had participating insurance. One respondent contracted with a large private insurer to reimburse this service at a reduced fee.
Comment
Our study was limited by a small sample size; however, our goal was to detect and report different types of teledermatology business models that currently are in practice. The small number of respondents likely does not indicate poor participation; rather, it is probably reflective of our strict inclusion criteria. We sought to interview only dermatologists who were currently receiving payment for teledermatology services and members of teledermatology-related professional groups. Our strategy in this study was to cast a wide net to capture some of the few dermatologists who currently fit this requirement.
We anticipate that the standard FFS business model for teledermatology will expand slightly as more legislation incentivizing telemedicine is enacted. Currently, Medicaid reimburses for live interactive teledermatology in 47 states and for asynchronous consultations in 9 states, whereas Medicare nationally reimburses only for live interactive services in low-access areas.4 Additionally, 29 states and the District of Columbia have private insurance parity laws mandating that private plans cover and reimburse for telemedicine comparable to in-person care. Seven of those states just passed their legislation in 2015, with 8 more states currently considering proposed parity laws.5
On the other hand, the FFS model in general may actually limit the rate of adoption of teledermatology. Several of our study’s respondents pointed to dermatologists’ opportunity costs under the FFS reimbursement environment as a barrier to widespread adoption of teledermatology; providers may prefer in-person visits to teledermatology because they can perform procedures, which are more highly reimbursed. For that reason, a major driver of teledermatology adoption in the future may be the emergence of new, quality-based practice models, such as accountable care organizations.6
Because most states require that providers hold a medical license in the jurisdiction where their patient is physically located, physicians providing teledermatology services across state lines could face additional licensure requirements. However, these requirements would not be a barrier for physicians providing teledermatology services within the context of an in-state referral network. Licensure requirements generally do not restrict physician-to-physician consultations.7
Conclusion
As reimbursement models across medicine evolve and telemedicine continues to enhance delivery of care, we anticipate that quality-based reimbursement ultimately will drive successful utilization of teledermatology services. Telemedicine has been noted to be a cost-effective tool for coordinating care, maintaining quality, and improving patient satisfaction.8 Although none of the teledermatology business models surveyed currently incorporate incentives for faster case turnaround or higher patient satisfaction, we expect models to adjust as quality measures become more prevalent in the reimbursement landscape. Effective business models must be implemented to make teledermatology a feasible option for dermatologists to deliver care and patients to access care.
1. Armstrong AW, Wu J, Kovarik CL, et al. State of teledermatology programs in the United States. J Am Acad Dermatol. 2012;67:939-944.
2. Armstrong AW, Kwong MW, Ledo L, et al. Practice models and challenges in teledermatology: a study of collective experiences from teledermatologists. PLOS One. 2011;6:e28687.
3. Thomas L, Capistrant G. State telemedicine gaps analysis: coverage & reimbursement. American Telemedicine Association website. http://www.americantelemed.org/docs/default-source/policy/50-state-telemedicine-gaps-analysis---coverage-and-reimbursement.pdf. Published May 2015. Accessed February 19, 2016.
4. State telehealth laws and reimbursement policies: a comprehensive scan of the 50 states and District of Columbia. Center for Connected Health Policy website. http://cchpca.org/sites/default/files/resources/State%20Laws%20and%20Reimbursement%20Policies%20Report%20Feb%20%202015.pdf. Published June 2015. Accessed February 19, 2016.
5. 2015 State telemedicine legislation tracking. American Telemedicine Association website. http://www.america telemed.org/docs/default-source/policy/state-legislation-matrix_2016147931CF25A6.pdf?sfvrsn=2. Updated January 11, 2016. Accessed March 23, 2016.
6. Telehealth and ACO’s–a match made in heaven. Hands on Telehealth website. http://www.handsontelehealth.com/past-issues/159-infographic-telehealth-and-acosa-match-made-in-heaven. Accessed February 19, 2016.
7. Thomas L, Capistrant G. State telemedicine gaps analysis: physician practice standards & licensure. American Telemedicine Association website. http://www.american telemed.org/docs/default-source/policy/50-state-telemedicine-gaps-analysis--physician-practice-standards-licensure.pdf. Published May 2015. Accessed February 19, 2016.
8. Telemedicine’s impact on healthcare cost and quality. American Telemedicine Association website. http://www.americantelemed.org/docs/default-source/policy/examples-of-research-outcomes---telemedicine’s-impact-on-healthcare-cost-and-quality.pdf. Published April 2015. Accessed February 19, 2016.
Practice Points
- Teledermatology services may improve access to dermatology care but are limited by lack of reimbursement.
- Different business models have been successfully implemented for use of teledermatology in different care settings.
- As more legislation incentivizing telemedicine is enacted, the standard fee-for-service business model for teledermatology likely will expand.

Patient‐Reported Barriers to Discharge
Thirty‐six million adults were discharged from US hospitals in 2012, with approximately 45% from medicine service lines.[1, 2] Discharge planning, a key aspect of care for hospitalized patients,[3] should involve the development of a plan to enable the patient to be discharged at the appropriate time and with provision of sufficient postdischarge support and services.[4]
Central to the discharge planning process is an assessment of a patient's readiness for discharge. Readiness is often a provider‐driven process, based on specific clinical and health system benchmarks.[5] However, providers' perception of readiness for discharge does not always correlate with patients' self‐assessments or objective measures of understanding.[6] For example, nurses overestimate patients' readiness for discharge compared to patients' own self‐report.[7] As a result, the need to include the patient perspective is increasingly recognized as an important contributing factor in the discharge planning process.[8, 9]
Current approaches to assessing discharge readiness are typically single assessments. However, these assessments do not take into account the complexity of discharge planning or patients' understanding, or their ability to carry out postacute care tasks.[8] In addition, few models have included assessments of physical stability and functional ability along with measures such as ability to manage self‐care activities at home, coping and social support, or access to health system and community resources.[10, 11]
To address these gaps in the existing literature, we carried out a prospective observational study of daily, patient‐reported, assessments of discharge readiness to better understand patients' perspectives on issues that could impede the transition to home. Using these data, we then sought to determine the prevalence of patient‐reported discharge barriers and the frequency with which they were resolved prior to the day of discharge. We also explored whether problems identified at discharge were associated with 30‐day readmission.
METHODS
Study Design, Setting, and Participants
We carried out a prospective observational study at the University of California San Francisco (UCSF) Medical Center, a 600‐bed tertiary care academic hospital in San Francisco, California. The UCSF Committee on Human Research approved this study. We recruited patients between November 2013 and April 2014. Patients were eligible to participate if they were admitted to the General Medicine Service; over 18 years old; English speaking; cognitively able to provide informed consent; and not under contact, droplet, airborne, or radiation isolation. Patients were eligible to participate regardless of where they were admitted from or expected to be discharged (eg, home, skilled nursing facility). Patients were excluded if they were acutely unwell or symptomatic resulting in them being unable to complete the surveys. Caregivers were not able to participate in the study on behalf of patients. We screened daily admission charts for eligibility and approached consecutive patients to consent them into the study on their first or second day of hospitalization. An enrollment tracker was used to documented reasons for patients' exclusion or refusal.
Survey Development
We adapted an existing and validated Readiness for Hospital Discharge Survey (RHDS) previously used in obstetric, surgical, and medicine patients for our study.[10, 11, 12] This initial list was culled from 23 to 12 items, based on input from patients and physicians. This feedback step also prompted a change in the response scale from a 0 to 10 scale to a simpler yes, no, or I would like to talk with someone about this scale intended to encourage discussion between patients and providers. After this revision step, we further pretested the survey among physicians and a small set of general medical patients to assess comprehension. Thus, our final question set included 12 items in 4 domains; personal status (ie, pain, mobility), knowledge (ie, medications, problems to watch for, recovery plan), coping ability (ie, emotional support, who to call with problems), and expected support (ie, related to activities and instrumental activities of daily living).
Data Collection
We collected data from interviews of patients as well as chart abstraction. Trained research assistants approached patients to complete our revised RHDS at admission, which was either on their first or second day of hospitalization. We collected data via an intake admission survey, which asked patients about their readiness for discharge, followed by a daily readiness for discharge survey until the day of discharge. A research assistant read the survey items to patients and recorded responses on a paper version of the survey. We abstracted demographic, clinical, and 30‐day readmission information from each participant's electronic medical record.
Analytic Approach
A barrier to discharge readiness was confirmed when a patient responded no' to an item (except for presence of catheter and pain or discomfort where yes was used) and/or they stated they wanted to talk to someone about the issue. We then used descriptive statistics to summarize patients' responses by survey administration number. Multilevel mixed effect regression was used to investigate any patterns in barriers to discharge over the course of hospitalization. We described the frequency of identified barriers to discharge on the intake admission and final (48 hours of discharge) surveys. McNemar's tests compared the proportion of patients reporting each barrier, and paired t tests the mean number of barriers at these 2 survey time points. We also assessed whether persistent barriers to discharge readiness on the final survey were associated with readmission to our hospital within 30‐days using t tests, 2, or Fisher exact test. Analysis was conducted in SPSS 22.0 (IBM Corp., Armonk, NY) and Stata (StataCorp, College Station, TX).
RESULTS
Patients
There were 2045 patients admitted to the general medicine service during the study period. Medical record screening resulted in 1350 exclusions. Of the remaining 695 patients, 113 refused and 419 were further found to be unable to participate. After all exclusions were applied and following direct screening, 163 patients agreed to participate in our study (Table 1). Mean length of stay among our cohort was 5.42 days (standard deviation [SD], 11.49) and the majority of patients were admitted from and discharged to home (Table 1).
| |
| Mean age, y (SD) | 56.4 (17) |
| Female gender, no. (%) | 86 (53) |
| Race, no. (%) | |
| Asian | 13 (8) |
| African American | 27 (16) |
| White | 96 (59) |
| Other | 24 (25) |
| Declined to say | 3 (1) |
| Married, no. (%) | 78 (48) |
| Insurance, no. (%) | |
| Medicare | 59 (36) |
| Medicaid | 22 (14) |
| Private | 73 (45) |
| Self‐pay | 2 (1) |
| Other | 7 (4) |
| Patient admitted from, no. (%) | |
| Home | 118 (72) |
| Outpatient clinic | 17 (10) |
| Procedural area | 6 (4) |
| Another facility | 12 (7) |
| Other | 9 (6) |
| Patient discharged to, no. (%) | |
| Home without services | 107 (66) |
| Home with services | 40 (25) |
| Home hospice | 2 (1) |
| Skilled nursing facility | 8 (5) |
| Patient deceased | 3 (2) |
| Other | 3 (2) |
Barriers to Discharge Readiness
Patients completed on average 1.82 surveys (SD 1.10; range, 18), and in total 296 surveys were administered. Only 5% of patients were captured on their admission day, whereas 77% of patients were surveyed on their second hospital day (Table 2). Between the first and second survey administration, 51% of patients were lost to follow‐up, and then by the third survey administration a further 37% were lost to follow‐up (Table 3). Patients were unable to be reinterviewed most often because they had been (1) discharged, (2) were unavailable or having a procedure at time of recruitment, or (3) became too sick and symptomatic.
| Hospital Day | ||||||||||
|---|---|---|---|---|---|---|---|---|---|---|
| 1 | 2 | 3 | 4 | 5 | 6 | 7 | 8 | 9 | 10 | |
| No. of eligible patients hospitalized | 163 | 161 | 138 | 102 | 70 | 50 | 35 | 24 | 19 | 17 |
| No. of patients surveyed | 8 | 124 | 70 | 30 | 22 | 13 | 7 | 6 | 2 | 0 |
| % of eligible patients surveyed | 4.9 | 77.0 | 50.7 | 29.4 | 31.4 | 26.0 | 20.0 | 25.0 | 10.5 | 0 |
| Survey No. | ||||||
|---|---|---|---|---|---|---|
| 1 | 2 | 3 | 4 | 5 | 6+ | |
| ||||||
| No. of patients surveyed | 163 | 83 | 31 | 11 | 3 | 5 |
| Total barriers (all patients) | 533 | 235 | 84 | 22 | 7 | 8 |
| No. of barriers per patient, mean (SD) | 3.27(2.35) | 2.83 (2.11) | 2.71 (2.49) | 2.00 (1.73) | 2.33 (2.51) | 1.60 (2.30) |
| Median no. of barriers per patient | 3.0 | 3.0 | 2.0 | 1.0 | 2.0 | 0 |
| Median hospital day of survey administration | 2.0 | 3.0 | 5.0 | 6.0 | 8.0 | 13.0 |
| Initial admission survey, no. (%) | 163 (100.0) | 0 | 0 | 0 | 0 | 0 |
| Follow‐up survey, no. (%) | 0 | 38 (45.8) | 16 (51.6) | 4 (36.4) | 0 | 1 (20.0) |
| Survey 48 hours before discharge, no. (%) | 59 (36.2) | 45 (54.2) | 15 (48.4) | 7 (63.6) | 3 (100.0) | 4 (80.0) |
In total, over 889 individual barriers to discharge readiness were reported across all surveys. The total and mean numbers of barriers were highest on the admission intake survey, and numbers continued to decrease until the fourth survey. On average, the total number of barriers to discharge patients reported decreased by 0.15 (95% confidence interval: 0.01‐0.30) per day (P = 0.047).
Change in Barriers to Discharge
Sixty‐eight patients (42%) completed an admission intake survey as well as final survey 48 hours before discharge (Table 4). We observed a significant reduction in mean number of barriers reported between admission and discharge surveys (3.19 vs 2.53, P = 0.01). Sixty‐one patients (90%) left the hospital with 1 or more persistent barrier to a safe discharge. However, the 3 most common barriers to discharge readiness on the admission and final survey remained the same: unresolved pain, lack of understanding of plan for recovery, and daily living activities (eg, cooking, cleaning, and shopping). The number of patients with unresolved pain appeared to increase slightly, though this rise was not statistically significant. In contrast, there were significant reductions in patients reporting they were unaware of problems to watch out for postdischarge (28% vs 16%; P = 0.04) or did not understand their recovery plan (52% vs 40%; P = 0.03).
| Barrier to Discharge | Survey | |
|---|---|---|
| Admission, No. (%) | Final Survey, No. (%) | |
| ||
| Catheter is present? | 6 (7.2) | 6 (7.2) |
| Not out of bed, sitting in a chair, or walking? | 17 (20.5) | 13 (15.7) |
| Pain or discomfort? | 50 (60.2) | 52 (62.7) |
| Unable to get to the bathroom for toilet or to shower? | 15 (18.1) | 12 (14.5) |
| Unable to self‐care without help from others? | 27 (32.5) | 23 (27.7) |
| Unable to get your own medications? | 11 (13.3) | 14 (16.9) |
| Know what problems to watch for?* | 23 (27.7) | 13 (15.7) |
| Know where to call if you had problems? | 10 (12.0) | 8 (9.6) |
| Inability for personal care such as bathing, toileting, and eating? | 8 (9.6) | 11 (13.3) |
| Lack of support for emotional needs? | 16 (19.3) | 9 (10.8) |
| Unable to cook, clean, or do shopping? | 33 (39.8) | 25 (30.1) |
| Do not understand the overall plan for your recovery?* | 43 (51.8) | 33 (39.8) |
DISCUSSION
Assessing discharge readiness highlights an opportunity to engage patients directly in their discharge planning process. However, our prospective study of 163 hospitalized adults revealed that unresolved discharge barriers were common; 90% of patients were discharged with at least 1 issue that might inhibit an effective transition home. The majority of these patients were also discharged home without any support services. In addition, many of the major barriers patients reportedpain, lack of understanding around plans, and ability to provide self‐carewere consistent from admission to discharge, suggesting a missed opportunity to address problems present early in a patient's stay.
Some of the issues our patients described, such as pain; lack of understanding of a recovery plan; and functional, social, and environmental vulnerabilities that impede recovery, have been described in studies using data collected in the postacute time period.[13, 14, 15] Focus on postacute barriers is likely to be of limited clinical utility to assist in any real‐time discharge planning, particularly planning that assesses individual patients' needs and tailors programs and education appropriately. Having said this, consistency between our results and data collected from postdischarge patients again supports broad areas of improvement for health systems.
Persistent gaps in care at discharge may be a result of limited standardization of discharge processes and a lack of engagement in obtaining patient‐reported concerns. Lack of a framework for preparing individual patients for discharge has been recognized as a significant obstacle to effective discharge planning. For example, Hesselink et al.'s qualitative study with almost 200 patients and providers across multiple institutions described how lack of a standard approach to providing discharge planning resulted in gaps in information provision.[16] Similarly, Horwitz et al. described wide variation in discharge practices at a US academic medical center, suggesting lack of a standard approach to identifying patient needs.[14]
Although many transitions of care programs have supported implementation of specific care interventions at a hospital or health system level, there have been surprisingly few studies describing efforts to standardize the assessment of discharge barriers and prospectively engage individual patients.[17] One emblematic study used stakeholder interviews and process mapping to develop a readiness report within their electronic medical record (EMR).[17] Aggregate data from the EMR including orders and discharge plans were coded, extracted, and summarized into a report. The overall goal of the report was to identify progress toward completion of discharge tasks; however, a limitation was that it did not explicitly include patient self‐assessments. Another study by Grimmer et al. describes the development of a patient‐centered discharge checklist that incorporated patients and care concerns.[18] The themes incorporated into this checklist cover many transitional issues; however, outside of the checklist's development, few publications or Web resources describe it in actual use.
Our approach may represent an advance in approaches to engaging patients in discharge planning and preparing patients for leaving the hospital. Although our data do not support efficacy of our daily surveys in terms of improving discharge planning, this initial evaluation provides the framework upon which providers can develop discharge plans that are both standardized in terms of using a structured multidomain communication tool to elicit barriers, as well as patient‐centered and patient‐directed, by using the information collected in the survey tool to initiate tailored discharge planning earlier in the hospital stay. However, our program points out an important limitation of an entirely patient‐initiated program, which is difficulty obtaining truly daily assessments. During this study, we had a single research assistant visit patients as frequently as possible during hospitalization, but even daily visits did not yield complete information on all patients. Although this limitation may in part be due to the fact that our study was a focused pilot of an approach we hope to expand, it also represents the complexity of patient experience in the hospital, where patients are often out of their room for tests, are unable to complete a survey because of problematic symptoms, or simply are unwilling or unable to participate in regular surveys.
Our study has a number of limitations. First, the number of patients in our study overall, and the number who completed at least 2 surveys, was relatively small, limiting the generalizability of the study and our ability to determine the true prevalence of unresolved barriers at discharge. In addition, our selection criteria and response rates have limited our sample in that our final group may not be representative of all patients admitted to our medicine service. The broad exclusion of patients who had physical or psychosocial barriers, and those who were acutely unwell and symptomatic, has the potential to introduce selection bias given the excluded populations are those most at risk of readmission. We also acknowledge that some of the issues that patients' are reporting may be chronic ones. However, given the fact that patients feel these issues, even if chronic, are unaddressed or that they want to talk with their doctor about them, is still a very large potential gap in care and patient engagement.
However, despite these limitations, which seem most likely to produce a cohort that is more likely to be able to participate in our survey, and in turn more likely to participate in their care more broadly, we still observed disappointing resolution of discharge barriers. In addition, our adapted survey instrument, though based on well‐supported conceptual frameworks,[19] has not been extensively tested outside of our hospital setting. Finally, as a single‐center study, our results cannot be generalized to other settings.
Assessing discharge readiness highlights an opportunity to obtain patient self‐reported barriers to discharge. This can facilitate discharge planning that targets individual patient needs. This information also emphasizes potentially fruitful opportunities for improved communication and education activities, potentially if these data are fed back to providers in real time, potentially as part of team‐based dashboards or the context of interdisciplinary team models.
Acknowledgements
The authors thank all of the patients who participated in this project, and Yimdriuska Magan Gigi for her assistance with chart abstractions. The authors also acknowledge and thank John Boscardin for his statistical and analytic support.
Disclosures: James D. Harrison, and Drs. Ryan S. Greysen and Andrew D. Auerbach contributed to the concept, design, analysis, interpretation of data, drafting of the manuscript, critical revisions to the manuscript, and final approval of manuscript. Ronald Jacolbia and Alice Nguyen contributed to the acquisition of data, drafting and final approval of manuscript and project, and administrative and technical support. Dr. Auerbach was supported by National Heart, Lung, and Blood Institute grant K24 K24HL098372. Dr. Greysen is supported by the National Institutes of Health (NIH), National Institute of Aging (NIA) through the Claude D. Pepper Older Americans Independence Center (P30AG021342 NIH/NIA and K23AG045338‐01). The authors have no financial or other conflicts of interest to declare.
- , , . Trends and projections in inpatient hospital costs and utilization 2003–2013. HCUP statistical brief #175. July 2014. Rockville, MD: Agency for Healthcare Research and Quality; 2014.
- , . Overview of hospital stays in the United States 2012. HCUP statistical brief #180. October 2014. Rockville, MD: Agency for Healthcare Research and Quality; 2014.
- Joint Commision. The Joint Commission Comprehensive Accreditation Manual for Hospitals. Oak Brook, IL: The Joint Commission; 2015.
- , , . Hospital discharge and readmission. In: Post TW, ed. UpToDate website: Available at: http://www.uptodate.com/contents/hospital‐discharge‐and‐readmission. Accessed August 14, 2015.
- , . A patient centered model of care for hospital discharge. Clin Nurse Res. 2004;13:117–136.
- , , , , , . Which reasons do doctors, nurses and patients have for hospital discharge? A mixed methods study. PLoS One. 2014;9:e91333.
- , , . Nurse and patient perceptions of discharge readiness in relation to postdischarge utilization. Med Care. 2010;48:482–486.
- , . Older people's perception of their readiness for discharge and postdischarge use of community support and services. Int J Older People Nurs. 2013;8:104–115.
- , , , . The care transitions intervention: Results of a randomized controlled trial. Arch Intern Med. 2006;166:1822–1828.
- , . Psychometric properties of the Readiness for Hospital Discharge Scale. J Nurs Meas. 2006;14:163–180.
- , , , et al. Perceived readiness for hospital discharge in adult medical‐surgical patients. Clin Nurse Spec. 2007;21:31–42.
- , , , . Validation of patient and nurse short forms of the Readiness for Hospital Discharge Scale and their relationship to return to the hospital. Health Serv Res. 2014;49:304–317.
- , , , et al. “Missing Pieces”—functional, social and environmental barriers to recovery for vulnerable older adults transitioning from hospital to home. J Am Geriatr Soc. 2014;62:1556–1561.
- , , , et al. Quality of discharge practices and patient understanding at an academic medical center. JAMA Intern Med. 2013;173:1715–1722.
- , , . Brief scale measuring patient prepardeness for hospital discharge to home: Psychometric properties. J Hosp Med. 2008;3:446–454.
- , , , et al. Improving patient discharge and reducing hospital readmission by using intervention mapping. BMC Health Serv Res. 2014;14:389.
- , , , , , . Development of a discharge readiness report within the electronic health record: a discharge planning tool. J Hosp Med. 2014;9:533–539.
- , , , . Incorporating Patient and Carer Concerns in Discharge Plans: The Development of a Practical Patient‐Centred Checklist. The Internet Journal of Allied Health Sciences and Practice. 2006;4: Article 5.
- , , , . Identifying keys to success in reducing readmissions using the ideal transitions in care framework. BMC Health Serv Res. 2014;14:423.
Thirty‐six million adults were discharged from US hospitals in 2012, with approximately 45% from medicine service lines.[1, 2] Discharge planning, a key aspect of care for hospitalized patients,[3] should involve the development of a plan to enable the patient to be discharged at the appropriate time and with provision of sufficient postdischarge support and services.[4]
Central to the discharge planning process is an assessment of a patient's readiness for discharge. Readiness is often a provider‐driven process, based on specific clinical and health system benchmarks.[5] However, providers' perception of readiness for discharge does not always correlate with patients' self‐assessments or objective measures of understanding.[6] For example, nurses overestimate patients' readiness for discharge compared to patients' own self‐report.[7] As a result, the need to include the patient perspective is increasingly recognized as an important contributing factor in the discharge planning process.[8, 9]
Current approaches to assessing discharge readiness are typically single assessments. However, these assessments do not take into account the complexity of discharge planning or patients' understanding, or their ability to carry out postacute care tasks.[8] In addition, few models have included assessments of physical stability and functional ability along with measures such as ability to manage self‐care activities at home, coping and social support, or access to health system and community resources.[10, 11]
To address these gaps in the existing literature, we carried out a prospective observational study of daily, patient‐reported, assessments of discharge readiness to better understand patients' perspectives on issues that could impede the transition to home. Using these data, we then sought to determine the prevalence of patient‐reported discharge barriers and the frequency with which they were resolved prior to the day of discharge. We also explored whether problems identified at discharge were associated with 30‐day readmission.
METHODS
Study Design, Setting, and Participants
We carried out a prospective observational study at the University of California San Francisco (UCSF) Medical Center, a 600‐bed tertiary care academic hospital in San Francisco, California. The UCSF Committee on Human Research approved this study. We recruited patients between November 2013 and April 2014. Patients were eligible to participate if they were admitted to the General Medicine Service; over 18 years old; English speaking; cognitively able to provide informed consent; and not under contact, droplet, airborne, or radiation isolation. Patients were eligible to participate regardless of where they were admitted from or expected to be discharged (eg, home, skilled nursing facility). Patients were excluded if they were acutely unwell or symptomatic resulting in them being unable to complete the surveys. Caregivers were not able to participate in the study on behalf of patients. We screened daily admission charts for eligibility and approached consecutive patients to consent them into the study on their first or second day of hospitalization. An enrollment tracker was used to documented reasons for patients' exclusion or refusal.
Survey Development
We adapted an existing and validated Readiness for Hospital Discharge Survey (RHDS) previously used in obstetric, surgical, and medicine patients for our study.[10, 11, 12] This initial list was culled from 23 to 12 items, based on input from patients and physicians. This feedback step also prompted a change in the response scale from a 0 to 10 scale to a simpler yes, no, or I would like to talk with someone about this scale intended to encourage discussion between patients and providers. After this revision step, we further pretested the survey among physicians and a small set of general medical patients to assess comprehension. Thus, our final question set included 12 items in 4 domains; personal status (ie, pain, mobility), knowledge (ie, medications, problems to watch for, recovery plan), coping ability (ie, emotional support, who to call with problems), and expected support (ie, related to activities and instrumental activities of daily living).
Data Collection
We collected data from interviews of patients as well as chart abstraction. Trained research assistants approached patients to complete our revised RHDS at admission, which was either on their first or second day of hospitalization. We collected data via an intake admission survey, which asked patients about their readiness for discharge, followed by a daily readiness for discharge survey until the day of discharge. A research assistant read the survey items to patients and recorded responses on a paper version of the survey. We abstracted demographic, clinical, and 30‐day readmission information from each participant's electronic medical record.
Analytic Approach
A barrier to discharge readiness was confirmed when a patient responded no' to an item (except for presence of catheter and pain or discomfort where yes was used) and/or they stated they wanted to talk to someone about the issue. We then used descriptive statistics to summarize patients' responses by survey administration number. Multilevel mixed effect regression was used to investigate any patterns in barriers to discharge over the course of hospitalization. We described the frequency of identified barriers to discharge on the intake admission and final (48 hours of discharge) surveys. McNemar's tests compared the proportion of patients reporting each barrier, and paired t tests the mean number of barriers at these 2 survey time points. We also assessed whether persistent barriers to discharge readiness on the final survey were associated with readmission to our hospital within 30‐days using t tests, 2, or Fisher exact test. Analysis was conducted in SPSS 22.0 (IBM Corp., Armonk, NY) and Stata (StataCorp, College Station, TX).
RESULTS
Patients
There were 2045 patients admitted to the general medicine service during the study period. Medical record screening resulted in 1350 exclusions. Of the remaining 695 patients, 113 refused and 419 were further found to be unable to participate. After all exclusions were applied and following direct screening, 163 patients agreed to participate in our study (Table 1). Mean length of stay among our cohort was 5.42 days (standard deviation [SD], 11.49) and the majority of patients were admitted from and discharged to home (Table 1).
| |
| Mean age, y (SD) | 56.4 (17) |
| Female gender, no. (%) | 86 (53) |
| Race, no. (%) | |
| Asian | 13 (8) |
| African American | 27 (16) |
| White | 96 (59) |
| Other | 24 (25) |
| Declined to say | 3 (1) |
| Married, no. (%) | 78 (48) |
| Insurance, no. (%) | |
| Medicare | 59 (36) |
| Medicaid | 22 (14) |
| Private | 73 (45) |
| Self‐pay | 2 (1) |
| Other | 7 (4) |
| Patient admitted from, no. (%) | |
| Home | 118 (72) |
| Outpatient clinic | 17 (10) |
| Procedural area | 6 (4) |
| Another facility | 12 (7) |
| Other | 9 (6) |
| Patient discharged to, no. (%) | |
| Home without services | 107 (66) |
| Home with services | 40 (25) |
| Home hospice | 2 (1) |
| Skilled nursing facility | 8 (5) |
| Patient deceased | 3 (2) |
| Other | 3 (2) |
Barriers to Discharge Readiness
Patients completed on average 1.82 surveys (SD 1.10; range, 18), and in total 296 surveys were administered. Only 5% of patients were captured on their admission day, whereas 77% of patients were surveyed on their second hospital day (Table 2). Between the first and second survey administration, 51% of patients were lost to follow‐up, and then by the third survey administration a further 37% were lost to follow‐up (Table 3). Patients were unable to be reinterviewed most often because they had been (1) discharged, (2) were unavailable or having a procedure at time of recruitment, or (3) became too sick and symptomatic.
| Hospital Day | ||||||||||
|---|---|---|---|---|---|---|---|---|---|---|
| 1 | 2 | 3 | 4 | 5 | 6 | 7 | 8 | 9 | 10 | |
| No. of eligible patients hospitalized | 163 | 161 | 138 | 102 | 70 | 50 | 35 | 24 | 19 | 17 |
| No. of patients surveyed | 8 | 124 | 70 | 30 | 22 | 13 | 7 | 6 | 2 | 0 |
| % of eligible patients surveyed | 4.9 | 77.0 | 50.7 | 29.4 | 31.4 | 26.0 | 20.0 | 25.0 | 10.5 | 0 |
| Survey No. | ||||||
|---|---|---|---|---|---|---|
| 1 | 2 | 3 | 4 | 5 | 6+ | |
| ||||||
| No. of patients surveyed | 163 | 83 | 31 | 11 | 3 | 5 |
| Total barriers (all patients) | 533 | 235 | 84 | 22 | 7 | 8 |
| No. of barriers per patient, mean (SD) | 3.27(2.35) | 2.83 (2.11) | 2.71 (2.49) | 2.00 (1.73) | 2.33 (2.51) | 1.60 (2.30) |
| Median no. of barriers per patient | 3.0 | 3.0 | 2.0 | 1.0 | 2.0 | 0 |
| Median hospital day of survey administration | 2.0 | 3.0 | 5.0 | 6.0 | 8.0 | 13.0 |
| Initial admission survey, no. (%) | 163 (100.0) | 0 | 0 | 0 | 0 | 0 |
| Follow‐up survey, no. (%) | 0 | 38 (45.8) | 16 (51.6) | 4 (36.4) | 0 | 1 (20.0) |
| Survey 48 hours before discharge, no. (%) | 59 (36.2) | 45 (54.2) | 15 (48.4) | 7 (63.6) | 3 (100.0) | 4 (80.0) |
In total, over 889 individual barriers to discharge readiness were reported across all surveys. The total and mean numbers of barriers were highest on the admission intake survey, and numbers continued to decrease until the fourth survey. On average, the total number of barriers to discharge patients reported decreased by 0.15 (95% confidence interval: 0.01‐0.30) per day (P = 0.047).
Change in Barriers to Discharge
Sixty‐eight patients (42%) completed an admission intake survey as well as final survey 48 hours before discharge (Table 4). We observed a significant reduction in mean number of barriers reported between admission and discharge surveys (3.19 vs 2.53, P = 0.01). Sixty‐one patients (90%) left the hospital with 1 or more persistent barrier to a safe discharge. However, the 3 most common barriers to discharge readiness on the admission and final survey remained the same: unresolved pain, lack of understanding of plan for recovery, and daily living activities (eg, cooking, cleaning, and shopping). The number of patients with unresolved pain appeared to increase slightly, though this rise was not statistically significant. In contrast, there were significant reductions in patients reporting they were unaware of problems to watch out for postdischarge (28% vs 16%; P = 0.04) or did not understand their recovery plan (52% vs 40%; P = 0.03).
| Barrier to Discharge | Survey | |
|---|---|---|
| Admission, No. (%) | Final Survey, No. (%) | |
| ||
| Catheter is present? | 6 (7.2) | 6 (7.2) |
| Not out of bed, sitting in a chair, or walking? | 17 (20.5) | 13 (15.7) |
| Pain or discomfort? | 50 (60.2) | 52 (62.7) |
| Unable to get to the bathroom for toilet or to shower? | 15 (18.1) | 12 (14.5) |
| Unable to self‐care without help from others? | 27 (32.5) | 23 (27.7) |
| Unable to get your own medications? | 11 (13.3) | 14 (16.9) |
| Know what problems to watch for?* | 23 (27.7) | 13 (15.7) |
| Know where to call if you had problems? | 10 (12.0) | 8 (9.6) |
| Inability for personal care such as bathing, toileting, and eating? | 8 (9.6) | 11 (13.3) |
| Lack of support for emotional needs? | 16 (19.3) | 9 (10.8) |
| Unable to cook, clean, or do shopping? | 33 (39.8) | 25 (30.1) |
| Do not understand the overall plan for your recovery?* | 43 (51.8) | 33 (39.8) |
DISCUSSION
Assessing discharge readiness highlights an opportunity to engage patients directly in their discharge planning process. However, our prospective study of 163 hospitalized adults revealed that unresolved discharge barriers were common; 90% of patients were discharged with at least 1 issue that might inhibit an effective transition home. The majority of these patients were also discharged home without any support services. In addition, many of the major barriers patients reportedpain, lack of understanding around plans, and ability to provide self‐carewere consistent from admission to discharge, suggesting a missed opportunity to address problems present early in a patient's stay.
Some of the issues our patients described, such as pain; lack of understanding of a recovery plan; and functional, social, and environmental vulnerabilities that impede recovery, have been described in studies using data collected in the postacute time period.[13, 14, 15] Focus on postacute barriers is likely to be of limited clinical utility to assist in any real‐time discharge planning, particularly planning that assesses individual patients' needs and tailors programs and education appropriately. Having said this, consistency between our results and data collected from postdischarge patients again supports broad areas of improvement for health systems.
Persistent gaps in care at discharge may be a result of limited standardization of discharge processes and a lack of engagement in obtaining patient‐reported concerns. Lack of a framework for preparing individual patients for discharge has been recognized as a significant obstacle to effective discharge planning. For example, Hesselink et al.'s qualitative study with almost 200 patients and providers across multiple institutions described how lack of a standard approach to providing discharge planning resulted in gaps in information provision.[16] Similarly, Horwitz et al. described wide variation in discharge practices at a US academic medical center, suggesting lack of a standard approach to identifying patient needs.[14]
Although many transitions of care programs have supported implementation of specific care interventions at a hospital or health system level, there have been surprisingly few studies describing efforts to standardize the assessment of discharge barriers and prospectively engage individual patients.[17] One emblematic study used stakeholder interviews and process mapping to develop a readiness report within their electronic medical record (EMR).[17] Aggregate data from the EMR including orders and discharge plans were coded, extracted, and summarized into a report. The overall goal of the report was to identify progress toward completion of discharge tasks; however, a limitation was that it did not explicitly include patient self‐assessments. Another study by Grimmer et al. describes the development of a patient‐centered discharge checklist that incorporated patients and care concerns.[18] The themes incorporated into this checklist cover many transitional issues; however, outside of the checklist's development, few publications or Web resources describe it in actual use.
Our approach may represent an advance in approaches to engaging patients in discharge planning and preparing patients for leaving the hospital. Although our data do not support efficacy of our daily surveys in terms of improving discharge planning, this initial evaluation provides the framework upon which providers can develop discharge plans that are both standardized in terms of using a structured multidomain communication tool to elicit barriers, as well as patient‐centered and patient‐directed, by using the information collected in the survey tool to initiate tailored discharge planning earlier in the hospital stay. However, our program points out an important limitation of an entirely patient‐initiated program, which is difficulty obtaining truly daily assessments. During this study, we had a single research assistant visit patients as frequently as possible during hospitalization, but even daily visits did not yield complete information on all patients. Although this limitation may in part be due to the fact that our study was a focused pilot of an approach we hope to expand, it also represents the complexity of patient experience in the hospital, where patients are often out of their room for tests, are unable to complete a survey because of problematic symptoms, or simply are unwilling or unable to participate in regular surveys.
Our study has a number of limitations. First, the number of patients in our study overall, and the number who completed at least 2 surveys, was relatively small, limiting the generalizability of the study and our ability to determine the true prevalence of unresolved barriers at discharge. In addition, our selection criteria and response rates have limited our sample in that our final group may not be representative of all patients admitted to our medicine service. The broad exclusion of patients who had physical or psychosocial barriers, and those who were acutely unwell and symptomatic, has the potential to introduce selection bias given the excluded populations are those most at risk of readmission. We also acknowledge that some of the issues that patients' are reporting may be chronic ones. However, given the fact that patients feel these issues, even if chronic, are unaddressed or that they want to talk with their doctor about them, is still a very large potential gap in care and patient engagement.
However, despite these limitations, which seem most likely to produce a cohort that is more likely to be able to participate in our survey, and in turn more likely to participate in their care more broadly, we still observed disappointing resolution of discharge barriers. In addition, our adapted survey instrument, though based on well‐supported conceptual frameworks,[19] has not been extensively tested outside of our hospital setting. Finally, as a single‐center study, our results cannot be generalized to other settings.
Assessing discharge readiness highlights an opportunity to obtain patient self‐reported barriers to discharge. This can facilitate discharge planning that targets individual patient needs. This information also emphasizes potentially fruitful opportunities for improved communication and education activities, potentially if these data are fed back to providers in real time, potentially as part of team‐based dashboards or the context of interdisciplinary team models.
Acknowledgements
The authors thank all of the patients who participated in this project, and Yimdriuska Magan Gigi for her assistance with chart abstractions. The authors also acknowledge and thank John Boscardin for his statistical and analytic support.
Disclosures: James D. Harrison, and Drs. Ryan S. Greysen and Andrew D. Auerbach contributed to the concept, design, analysis, interpretation of data, drafting of the manuscript, critical revisions to the manuscript, and final approval of manuscript. Ronald Jacolbia and Alice Nguyen contributed to the acquisition of data, drafting and final approval of manuscript and project, and administrative and technical support. Dr. Auerbach was supported by National Heart, Lung, and Blood Institute grant K24 K24HL098372. Dr. Greysen is supported by the National Institutes of Health (NIH), National Institute of Aging (NIA) through the Claude D. Pepper Older Americans Independence Center (P30AG021342 NIH/NIA and K23AG045338‐01). The authors have no financial or other conflicts of interest to declare.
- , , . Trends and projections in inpatient hospital costs and utilization 2003–2013. HCUP statistical brief #175. July 2014. Rockville, MD: Agency for Healthcare Research and Quality; 2014.
- , . Overview of hospital stays in the United States 2012. HCUP statistical brief #180. October 2014. Rockville, MD: Agency for Healthcare Research and Quality; 2014.
- Joint Commision. The Joint Commission Comprehensive Accreditation Manual for Hospitals. Oak Brook, IL: The Joint Commission; 2015.
- , , . Hospital discharge and readmission. In: Post TW, ed. UpToDate website: Available at: http://www.uptodate.com/contents/hospital‐discharge‐and‐readmission. Accessed August 14, 2015.
- , . A patient centered model of care for hospital discharge. Clin Nurse Res. 2004;13:117–136.
- , , , , , . Which reasons do doctors, nurses and patients have for hospital discharge? A mixed methods study. PLoS One. 2014;9:e91333.
- , , . Nurse and patient perceptions of discharge readiness in relation to postdischarge utilization. Med Care. 2010;48:482–486.
- , . Older people's perception of their readiness for discharge and postdischarge use of community support and services. Int J Older People Nurs. 2013;8:104–115.
- , , , . The care transitions intervention: Results of a randomized controlled trial. Arch Intern Med. 2006;166:1822–1828.
- , . Psychometric properties of the Readiness for Hospital Discharge Scale. J Nurs Meas. 2006;14:163–180.
- , , , et al. Perceived readiness for hospital discharge in adult medical‐surgical patients. Clin Nurse Spec. 2007;21:31–42.
- , , , . Validation of patient and nurse short forms of the Readiness for Hospital Discharge Scale and their relationship to return to the hospital. Health Serv Res. 2014;49:304–317.
- , , , et al. “Missing Pieces”—functional, social and environmental barriers to recovery for vulnerable older adults transitioning from hospital to home. J Am Geriatr Soc. 2014;62:1556–1561.
- , , , et al. Quality of discharge practices and patient understanding at an academic medical center. JAMA Intern Med. 2013;173:1715–1722.
- , , . Brief scale measuring patient prepardeness for hospital discharge to home: Psychometric properties. J Hosp Med. 2008;3:446–454.
- , , , et al. Improving patient discharge and reducing hospital readmission by using intervention mapping. BMC Health Serv Res. 2014;14:389.
- , , , , , . Development of a discharge readiness report within the electronic health record: a discharge planning tool. J Hosp Med. 2014;9:533–539.
- , , , . Incorporating Patient and Carer Concerns in Discharge Plans: The Development of a Practical Patient‐Centred Checklist. The Internet Journal of Allied Health Sciences and Practice. 2006;4: Article 5.
- , , , . Identifying keys to success in reducing readmissions using the ideal transitions in care framework. BMC Health Serv Res. 2014;14:423.
Calcium-Containing Crystal-Associated Arthropathies in the Elderly
Calcium pyrophosphate (CPP) crystals may deposit in both articular tissues (predominantly hyaline cartilage and fibrocartilage) and periarticular soft tissues.1,2 Calcium pyrophosphate deposition disease (CPPD) may be asymptomatic or be associated with a spectrum of clinical syndromes, including both acute and chronic inflammatory arthritis.2
The European League Against Rheumatism (EULAR) recently suggested changes in CPPD terminology.2 According to the new EULAR classification, pseudogout, or CPPD, has been reclassified based on new key terms that include several of the previously described disease phenotypes: asymptomatic CPPD; acute CPP crystal arthritis (previously known as pseudogout); osteoarthritis (OA) with CPPD (previously, pseudo-OA); and the chronic CCP crystal inflammatory arthritis (previously, pseudorheumatoid arthritis). In similar fashion, chondrocalcinosis (CC) refers to calcification of the fibrocartilage and/or hyaline cartilage identified by imaging or histologic analysis. Although CC is most commonly seen in CPPD, it is not exclusive to this disease, as it can be seen in other crystal diseases (oxalosis, basic calcium phosphate [BCP]) and can appear as casual finding or coexist with OA.2
Clinical Manifestations
In clinical practice, CPPD may present with several phenotypic forms. In asymptomatic CPPD, CC is a common radiographic finding without clinical symptoms. Acute CPP arthritis always should be suspected in any patient aged > 65 years presenting with acute monoarticular or oligoarticular, migratory or additive, symmetrical, or polyarticular arthritis.3 Acute CCP arthritis is characterized by self-limited acute or subacute attacks of arthritis involving 1 or several extremity joints (knees, wrists, ankles; rarely affects large toe). Typically, the acute attacks last 7 to 10 days. Several unusual sites (eg, the hip joints, trochanteric bursa, and deep spinal joints) also may be affected. However, differences in pattern of joint involvement are insufficient to permit definitive diagnosis without demonstration of the specific crystal type in the inflammatory joint fluid.
Pseudogout attacks closely resemble gouty arthritis; CPPD presents as intermittent flares and often is asymptomatic between flares. Trauma, surgery, or severe medical illness frequently provokes attacks of monosodium urate (MSU) as well as acute CPP arthritis. Systemic findings, such as fever; leukocytosis with a left shift in the differential count; inflammatory markers, such as elevated sedimentation rate (ESR); or C-reactive protein, also can occur, resembling pyogenic arthritis, osteomyelitis, and/or systemic sepsis in the elderly patient.
Diagnosis must be confirmed with aspiration, Gram stain and cultures of the synovial fluid, and evaluation for the presence of CPP crystals under polarized light microscopy.2 The diagnosis can be difficult to confirm secondary to the weakly birefringent nature of CPP crystals.4 Coexistence of MSU and CPP crystals in a single inflammatory effusion is neither uncommon nor unexplained given increased frequencies of both hyperuricemia/gout and CC among elderly patients.5
Chronic CPP crystal inflammatory arthritis may present as a chronic, symmetrical, bilateral, and deforming polyarthritis. It frequently affects the wrists and metacarpophalangeal joints and tendon sheaths. Chronic CPP may resemble rheumatoid arthritis (RA) and produce wrist tenosynovitis, which may manifest as carpal tunnel syndrome and/or cubital tunnel syndrome. Calcium pyrophosphate deposition disease should be on the differential diagnosis in the elderly patient presenting with a clinical picture that resembles “seronegative” RA, with morning stiffness, synovial thickening, localized edema, and restricted motion due to active inflammation or flexion contracture of the hands/wrist. It may present with prominent systemic features, such as leukocytosis, fevers, mental confusion, and inflammatory oligoarthritis or polyarthritis. The diagnosis of CPPD still may be possible even though the rheumatoid factor (RF) is positive, given the increasing likelihood of elevated RF in the older population. In this setting, aspiration of joint fluid and radiography will assist in clarification of the diagnosis. Furthermore, CPPD typically does not cause the type of erosive disease that is often seen in RA.
Calcium pyrophosphate deposition disease also can mimic polymyalgia rheumatica (PMR). A direct comparison of a cohort of patients with pseudo-PMR (PMR/CPPD) with actual PMR patients found that increased age at diagnosis, presence of knee osteoarthritis, tendinous calcifications, and ankle arthritis carried the highest predictive value in patients with CPPD presenting with PMR-like symptoms.6 However, the PMR/CPPD variant can be difficult to distinguish, because both conditions can have elevated systemic inflammatory markers, and both are steroid responsive.
Calcium pyrophosphate deposition disease involving a single joint can rarely lead to extensive destruction—as with neuropathic joints in the absence of any neurologic deficits—and is extremely debilitating. This presentation is not well understood and does not have good treatment alternatives. Calcium pyrophosphate crystals often are associated with manifestations of OA.1,2 Indeed, up to 20% of OA joints have been found to be positive for CPP crystals in various studies. Given the extensive evidence supporting treatment of OA, usually they are treated in a similar fashion with good results. Occasionally, these will have unusual manifestations for typical OA, such as involvement of wrists and metacarpophalangeal joints; however, the presentation is often indolent like OA.
Calcium pyrophosphate crystal deposition involving the spine has been associated with a number of clinical manifestations. Spine stiffness, sometimes associated with bony ankylosis, can resemble ankylosing spondylitis or diffuse idiopathic skeletal hyperostosis. Such symptoms are seen more commonly in familial CPPD rather than in the elderly. However, crystal deposition in the ligamentum flavum at the cervical spine levels has been associated with a condition called crowned dens syndrome.7 Although mostly asymptomatic, it may be present with acute neck pain, fever, and an increased ESR, sometimes mimicking PMR or giant cell arteritis or neurologic symptoms. Similarly, CPP crystal deposition in the posterior longitudinal ligament at the lower levels of the spine may lead to spinal cord compression syndromes or symptoms of either acute nerve compression or chronic spinal stenosis.8,9 Calcium pyrophosphate crystal deposition also can occur in other soft tissues, such as bursae, ligaments, and tendons and may be sufficient to cause local nerve compression, such as carpal or cubital tunnel syndrome.
Epidemiology
Radiographic surveys of the knees, hands, wrists, and pelvis and epidemiologic studies have demonstrated an age-related increase in the prevalence of CPPD: 15% prevalence in patients aged 65 to 74 years, 36% prevalence in patients aged 75 to 84 years, and 50% prevalence in patients aged > 84 years.10 In a recent radiographic study, 40% of patients with CPPD did not present with CC of the knee, and the study’s authors recommended additional radiographs of pelvis, wrists, or hands for accurate diagnosis of radiographic CC.11
Diagnosis
Accurate diagnosis should be achieved on the basis of the clinical picture and demonstration of CPP crystals in synovial fluid or tissue by compensated polarized light microscopy (Figures 1A and 1B).2 The sensitivity and specificity for CPP crystal detection has been shown to be 95.9% and 86.5%, respectively.12 However, the CPP crystal is more readily identified by a rheumatologist rather than in a standard hospital laboratory, which misses 30% of CPP crystals.13
Findings of CC on radiograph strengthens a CPPD diagnosis, but its absence does not rule it out (Figure 2A).2 More recently, the use of new imaging modalities, such as musculoskeletal ultrasound, provides the capacity to visualize crystal deposits within the joint structures, the hyaline cartilage, and/or fibrocartilage (Figure 2B and 2C).14 The presence of hyperechoic bands within the intermediate layer hyaline cartilage and hyperechoic spots in fibrocartilage are consistent with CPP crystal deposits.2,14 The use of computed tomography is the gold standard imaging modality for the identification of CPPD of the spine.15 There is not enough evidence to support the use of magnetic resonance imaging in CPPD, but it may play a role in rare complications.2
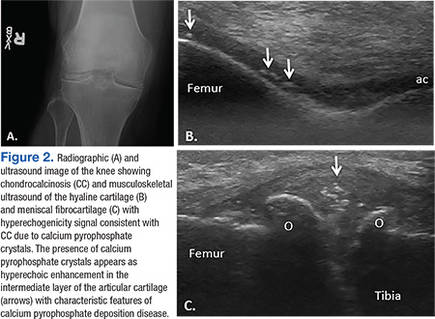
Treatment
The EULAR recently defined new guidelines for the management of CPPD.16 Asymptomatic CPPD needs no treatment.In other CPPD phenotypes, the goals are to attempt prompt resolution of the acute synovitis, reduction in chronic damage, and management of associated conditions.In acute attacks, treatment modalities used in gout are often required; however, data for CPPD treatment are limited (Table). Treatment relies on the use of colchicine and nonsteroidal anti-inflammatory drugs (NSAIDs), but toxicity and comorbidities in the elderly limit the usage of these drugs.
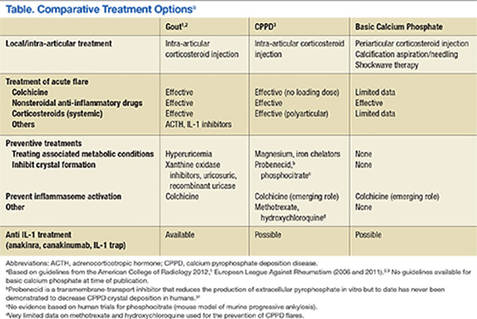
Given increased renal impairment, the loading dose of colchicine is not recommended.16 Colchicine has recently been shown to completely block crystal-induced maturation of IL-1β in vitro, indicating that the drug acts upstream of inflammasome activation.17 This is in addition to the well-known role of colchicine in inhibition of micro-tubule formation, which likely leads to prevention of cell migration, phagocytosis, and activation of inflammasome.18-20
Intra-articular injection of corticosteroid is an efficient and well-tolerated treatment alternative for monoarticular CPP flares. Oral or parenteral corticosteroids are frequently used for polyarticular flares in particular for those patients in which NSAIDs and colchicine are contraindicated.16 Parenteral adrenocorticotropic hormone has been used in patients with congestive heart failure, renal insufficiency, gastrointestinal bleeding, or resistance to NSAIDs.21 For prophylaxis of acute CPP crystal arthritis, a low dose of oral NSAIDs, oral colchicine, or prednisone may be used with good results.16 In chronic CPP arthritis, continuous use of colchicine, NSAIDs, or low-dose prednisone is often appropriate. If these interventions are ineffective or contraindicated, using hydroxychloroquine (HCQ) and methotrexate (MTX) have been successfully used to control chronic CPP crystal inflammation.22,23 Recent trials have raised questions about MTX, and further trials on HCQ usage are underway.24 Biologic agents targeting IL-1 are not currently approved for the treatment of CPPD, but there are suggestions that it may be effective in refractory cases and induce rapid stable remissions after 3 days of therapy.25
In contrast to gout, there is no specific target therapy for lowering CPP crystal load in the elderly. Crucial in the management of CPPD in the elderly is the search for associated diseases, such as hyperparathyroidism, hemochromatosis, hypomagnesemia, and hypophosphatemia, as well as avoidance of tacrolimus, which facilitates or causes CC.16 Correction of the underlying metabolic disorder, especially when undertaken early, may reduce the severity of CPPD. However, there is little evidence to suggest that treatment of associated disease results in resolution of CPPD—most famously, although therapeutic phlebotomy does not help in hemochromatosis for prevention of crystal disease, chelating agents do seem to be moderately effective.26 Only oral administration of magnesium has shown a reduction in meniscal CC in a patient with CPPD arthropathy.27 In addition, this was in the setting of familial hypomagnesemia associated CPPD. However, unlike uricosuric agents for gout, no pharmacologic treatments can prevent CPPD crystal formation and deposition in tissues.
Therapeutic Agents
Magnesium
Magnesium is a cofactor for the activity of pyrophosphatases that converts inorganic pyrophosphates (PPis) into orthophosphates. In addition, magnesium can increase the solubility of CPP crystals. Early detection and management of hypomagnesemia are recommended, because it occurs in patients who have well-defined conditions and situations: Gitelman syndrome, thiazide and loop diuretics use, tacrolimus use, familial forms of renal magnesium wasting or use of proton pump inhibitors, short bowel syndrome, and intestinal failure in patients receiving home parenteral nutrition. Long-term administration of magnesium in some patients with chronic hypomagnesemia decreased meniscal calcification.27-29
Dietary Calcium
Epidemiologic studies showed a lower incidence of CC in Chinese subjects. The authors of the study speculate that this lower prevalence of CPPD could result from high levels of calcium found in the drinking water in Beijing, which may affect parathyroid hormone secretion.30 Further studies are needed to confirm this hypothesis, as it could be a cheaper approach to pseudogout prevention.
Probenecid
Probenecid is an in vitro inhibitor of the transmembrane PPi transporter thought to possibly prevent extracellular PPi elaboration. However, this observation has not been confirmed by either case reports or clinical trials.31
Phosphocitrate
Phosphocitrate acts directly on preventing crystal deposition in tissues in CPPD as well as BCP based on in vitro evidence and mouse models.32,33
Hyaluronan
An amelioration of pain and increased range of motion were observed in radiographic CC with OA.34 However, it is associated with increased acute CPP arthritis.35
Radiosynovectomy
In a double-blind study of 15 patients with symmetrical CPPD arthropathy, the knee that underwent intra-articular injection of yttrium-90 (5 mCi) plus steroid had less pain, stiffness, joint line tenderness, and effusion compared with the contralateral control knee injected with saline and steroids.36
Precipitators of Acute Pseudogout
Diuretics are known to exacerbate gout, but they also can exacerbate pseudogout. A recent case-control study nested within a United Kingdom general practice database found that loop diuretics rather than hydrochlorothiazide was associated with increased risk of CPPD mediated primarily by magnesium reabsorption in the loop of Henle.28 Chronic kidney disease associated with secondary and tertiary hyperparathyroidism increases calcium or PPi concentration, which leads to CPP-crystal deposition.
In addition, multiple case reports have described acute pseudogout caused by bisphosphonate administration for osteoporosis or Paget disease—more likely in the elderly population. Intravenous pamidronate, oral etidronate, and alendronate therapy have all been described in the elderly.37 The overall mechanism behind this link is not completely understood, but bisphosphonates are structurally similar to PPi. Pseudogout attacks also have been described in neutropenic patients undergoing treatment with granulocyte-colony stimulating factor.38 In addition to pharmaceutical exacerbation of pseudogout, surgical procedures and trauma can precipitate attacks. Joint lavage has been described to increase the incidence of pseudogout.39 It was hypothesized that joint lavage with fluid induced “crystal shedding” from CPPD crystals imbedded in the joint tissue. Patients who underwent meniscectomy of the knee 20 years ago had a 20% incidence of CC in the knee that was operated compared with 4% CC in the contralateral nonoperated knee.40 Overall, the surgery most linked with a pseudogout attack, however, is parathyroidectomy.41
Basic Calcium Phosphate Crystals
Basic calcium phosphate crystals are common but rarely diagnosed due to the cumbersome and expensive methods required to identify these crystals.42 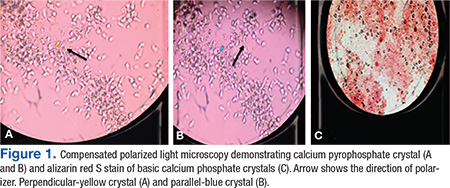
Basic calcium phosphate and CPPD crystals may coexist in synovial fluid. Similar to CPPD, BCP crystal disease is often concurrent with OA and can cause calcification of articular cartilage. Basic calcium phosphate is more common than CPP crystals with occurrence of 30% to 50% in OA synovial fluid.42 Additionally, BCP crystal disease has been linked to increased severity of OA. Basic calcium phosphate crystals in knee joints were found to have radiographically more severe arthritis with larger effusions.44,45 Similarly, BCP crystals in OA synovial fluid correlated with higher Kellgreen-Lawrence grade scores by radiography.42,46
It is currently believed that BCP crystals are continuously formed in the extracellular matrix, and their deposition is actively prevented by PPi present in the matrix.47 Elevated PPi levels, on the other hand, favor the formation of CPP crystals.48 The clinical upshot seems to be that although CPP crystals are almost universally intra-articular and released by chondrocytes, BCD crystals and deposits are more frequently present in soft tissues.
Acute Calcific Tendinitis
Typically, this type of tendinitis involves the shoulder joint and is extra-articular. Common treatments help, including NSAIDs, intra-articular steroids, ice, and rest. In addition, high-energy extracorporeal shock wave therapy has been shown to be effective when used with conscious sedation.49,50 Needling or barbotage in association with lavage and steroid injections also is effective and has occasionally been shown to reduce the size of the calcium deposit as well, often in combination with IV drugs like ethylenediaminetetraacetic acid.51-53
Acute calcific periarthritis of the hand presents similar to gout or pseudogout, affecting the wrist, usually in postmenopausal women.54 Basic calcium phosphate crystals are aspirated from the joint, and periarticular crystals may be subtle. Local steroid injections are beneficial.Milwaukee shoulder syndrome is an arthropathy associated with BCP crystals in the joint fluid and results in extensive destruction of shoulder articular cartilage and surrounding tissues. It is commonly bilateral and occurs in elderly women more often than it does in men.55 Aspiration of the shoulder joint typically reveals a serosanginous fluid. Fluid samples can be assessed for hydroxyapatite crystals by staining with alizarin red dye, which produces a characteristic “halo” or orange-red stain by light microscopy.43 Surgical treatment of Milwaukee shoulder syndrome is difficult due to increased age of the population affected and the severity of the shoulder destruction. Usually a conservative approach of analgesics, recurrent shoulder aspirations, and steroid injections is the best treatment option.
Conclusions
Calcium-containing crystal-associated arthropathies are a complex array of entities that target the veteran elderly population with increasing frequency. Challenges still remain in the diagnosis, crystal identification, and treatment due to coexisting comorbid conditions and polypharmacy commonly seen in veterans. Overall morbidity associated with calcium-containing crystal-associated arthropathies and the coexisting osteoarthritis is great, and focused identification of the disease process with tailored treatment can achieve the goal of decreasing symptoms and improving quality of life.
Acknowledgements
This work was supported by grant P20GM104937 (A.M.R.).
1. Guerne PA, Terkeltaub R. Clinical Features, Diagnosis, and Treatment of CPPD Crystal Arthropathy. In: Terkeltaub R, ed. Gout and Other Crystal Arthropathies. Philadelphia, PA: Saunders/Elsevier; 2012:249-265.
2. Zhang W, Doherty M, Bardin T, et al. European League Against Rheumatism recommendations for calcium pyrophosphate deposition. Part I: terminology and diagnosis. Ann Rheum Dis. 2011;70(4):563-570.
3. McCarty DJ. Calcium pyrophosphate dihydrate crystal deposition disease—1975. Arthritis Rheum. 1976;19(S3):275-285.
4. Ivorra J, Rosas J, Pascual E. Most calcium pyrophosphate crystals appear as non-birefringent. Ann Rheum Dis. 1999;58(9):582-584.
5. Lawrence RC, Felson DT, Helmick CG, et al; National Arthritis Data Workgroup. Estimates of the prevalence of arthritis and other rheumatic conditions in the United States. Part II. Arthritis Rheum. 2008;58(1):26-35.
6. Pego-Reigosa JM, Rodriguez-Rodriguez M, Hurtado-Hernandez Z, et al. Calcium pyrophosphate deposition disease mimicking polymyalgia rheumatica: a prospective followup study of predictive factors for this condition in patients presenting with polymyalgia symptoms. Arthritis Rheum. 2005;53(6):931-938.
7. Bouvet JP, le Parc JM, Michalski B, Benlahrache C, Auquier L. Acute neck pain due to calcifications surrounding the odontoid process: the crowned dens syndrome. Arthritis Rheum. 1985;28(12):1417-1420.
8. Muthukumar N, Karuppaswamy U. Tumoral calcium pyrophosphate dihydrate deposition disease of the ligamentum flavum. Neurosurgery. 2003;53(1):103-109.
9. Armas JB, Couto AR, Bettencourt BF. Spondyloarthritis, diffuse idiopathic skeletal hyperostosis (DISH) and chondrocalcinosis. Adv in Exp Med Biol. 2009;649:37-56.
10. Abhishek A, Doherty M. Epidemiology of calcium pyrophosphate crystal arthritis and basic calcium phosphate crystal arthropathy. Rheum Dis Clin North Am. 2014;40(2):177-191.
11. Abhishek A, Doherty S, Maciewicz R, Muir K, Zhang W, Doherty M. Chondrocalcinosis is common in the absence of knee involvement. Arthritis Res Ther. 2012;14(5):R205.
12. Lumbreras B, Pascual E, Frasquet J, González-Salinas J, Rodríguez E, Hernández-Aguado I. Analysis for crystals in synovial fluid: training of the analysts results in high consistency. Ann Rheum Dis. 2005;64(4):612-615.
13. Szscygiel J, Reginato AM SS. Quality improvements in the identification of crystals from synovial fluid: hospital laboratory versus rheumatology department evaluation. Poster presented at: 2014 ACR/ARHP Annual Meeting; November 15, 2014; Boston, MA.
14. Grassi W, Meenagh G, Pascual E, Filippucci E. “Crystal clear”-sonographic assessment of gout and calcium pyrophosphate deposition disease. Semin Arthritis Rheum. 2006;36(3):197-202.
15. Scutellari PN, Galeotti R, Leprotti S, Ridolfi M, Franciosi R, Antinolfi G. The crowned dens syndrome. Evaluation with CT imaging. Radiol Med. 2007;112(2):195-207.
16. Zhang W, Doherty M, Pascual E, et al. EULAR recommendations for calcium pyrophosphate deposition. Part II: management. Ann Rheum Dis. 2011;70(4):571-575.
17. Martinon F, Pétrilli V, Mayor A, Tardivel A, Tschopp J. Gout-associated uric acid crystals activate the NALP3 inflammasome. Nature. 2006;440(7081):237-241.
18. Nuki G. Colchicine: its mechanism of action and efficacy in crystal-induced inflammation. Curr Rheumatol Rep. 2008;10(3):218-227.
19. Borisy GG, Taylor EW. The mechanism of action of colchicine. Colchicine binding to sea urchin eggs and the mitotic apparatus. J Cell Biol. 1967;34(2):535-548.
20. Borisy GG, Taylor EW. The mechanism of action of colchicine. Binding of colchincine-3H to cellular protein. J Cell Biol. 1967;34(2):525-533.
21. Daoussis D, Antonopoulos I, Andonopoulos AP. ACTH as a treatment for acute crystal-induced arthritis: update on clinical evidence and mechanisms of action. Semin Arthritis Rheum. 2014;43(5):648-653.
22. Rothschild B, Yakubov LE. Prospective 6-month, double-blind trial of hydroxychloroquine treatment of CPDD. Compr Ther. 1997;23(5):327-331.
23. Chollet-Janin A, Finckh A, Dudler J, Guerne PA. Methotrexate as an alternative therapy for chronic calcium pyrophosphate deposition disease: an exploratory analysis. Arthritis Rheum. 2007;56(2):688-692.
24. Finckh A, Mc Carthy GM, Madigan A, et al. Methotrexate in chronic-recurrent calcium pyrophosphate deposition disease: no significant effect in a randomized crossover trial. Arthritis Res Ther. 2014;16(5):458.
25. Moltó A, Ea HK, Richette P, Bardin T, Lioté F. Efficacy of anakinra for refractory acute calcium pyrophosphate crystal arthritis. Joint Bone Spine. 2012;79(6):621-623.
26. Harty LC, Lai D, Connor S, et al. Prevalence and progress of joint symptoms in hereditary hemochromatosis and symptomatic response to venesection. J Clin Rheumatol. 2011;17(4):220-222.
27. Doherty M, Dieppe PA. Double blind, placebo controlled trial of magnesium carbonate in chronic pyrophosphate arthropathy. Ann Rheum Dis. 1983;42(suppl 1):106-107.
28. Rho YH, Zhu Y, Zhang Y, Reginato AM, Choi HK. Risk factors for pseudogout in the general population. Rheumatology (Oxford). 2012;51(11):2070-2074.
29. Park CH, Kim EH, Roh YH, Kim HY, Lee SK. The association between the use of proton pump inhibitors and the risk of hypomagnesemia: a systematic review and meta-analysis. PLoS One. 2014;9(11):e112558.
30. Zhang Y, Terkeltaub R, Nevitt M, et al. Lower prevalence of chondrocalcinosis in Chinese subjects in Beijing than in white subjects in the United States: the Beijing Osteoarthritis Study. Arthritis Rheum. 2006;54(11):3508-3512.
31. Rosenthal AK, Ryan LM. Probenecid inhibits transforming growth factor-beta 1 induced pyrophosphate elaboration by chondrocytes. J Rheumatol. 1994;21(5):896-900.
32. Cheung HS, Sallis JD, Demadis KD, Wierzbicki A. Phosphocitrate blocks calcification-induced articular joint degeneration in a guinea pig model. Arthritis Rheum. 2006;54(8):2452-2461.
33. Sun Y, Mauerhan DR, Honeycutt PR, et al. Calcium deposition in osteoarthritic meniscus and meniscal cell culture. Arthritis Res Ther. 2010;12(2):R56.
34. Daumen-Legre V, Pham T, Acquaviva PC, Lafforgue P. Evaluation of safety and efficacy of viscosupplementation in knee osteoarthritis with chondrocalcinosis. In: Arthritis and Rheumatism.Vol. 42. Lippincott Williams and Wilkins; 1999:S158-S158.
35. Disla E, Infante R, Fahmy A, Karten I, Cuppari GG. Recurrent acute calcium pyrophosphate dihydrate arthritis following intraarticular hyaluronate injection. Arthritis Rheum. 1999;42(6):1302-1303.
36. Doherty M, Dieppe PA. Effect of intra-articularYttrium-90 on chronic pyrophosphate arthropathy of the knee. Lancet. 1981;2(8258):1243-1246.
37. Wendling D, Tisserand G, Griffond V, Saccomani C, Toussirot E. Acute pseudogout after pamidronate infusion. Clin Rheumatol. 2008;27(9):1205-1206.
38. Ames PRJ, Rainey MG. Consecutive pseudogout attacks after repetitive granulocyte colony-stimulating factor administration for neutropenia. Mod Rheumatol. 2007;17(5):445-446.
39. Pasquetti P, Selvi E, Righeschi K, et al. Joint lavage and pseudogout. Ann Rheum Dis. 2004;63(11):1529-1530.
40. Doherty M, Watt I, Dieppe P. Localised chondrocalcinosis in post-meniscectomy knees. Lancet. 1982;1(8283):1207-1210.
41. Rubin MR, Silverberg SJ. Rheumatic manifestations of primary hyperparathyroidism and parathyroid hormone therapy. Curr Rheumatol Rep. 2002;4(2):179-185.
42. Ea HK, Lioté F. Diagnosis and clinical manifestations of calcium pyrophosphate and basic calcium phosphate crystal deposition diseases. Rheum Dis Clin North Am. 2014;40(2):207-229.
43. Paul H, Reginato AJ, Ralph Schumacher HR. Alizarin red s staining as a screening test to detect calcium compounds in synovial fluid. Arthritis Rheum. 1983;26(2):191-200.
44. Molloy ES, McCarthy GM. Basic calcium phosphate crystals: pathways to joint degeneration. Curr Opin Rheumatol. 2006;18(2):187-192.
45. Carroll GJ, Stuart RA, Armstrong JA, Breidahl PD, Laing BA. Hydroxyapatite crystals are a frequent finding in osteoarthritic synovial fluid, but are not related to increased concentrations of keratan sulfate or interleukin 1 beta. J Rheumatol. 1991;18(6):861-866.
46. Derfus BA, Kurian JB, Butler JJ, et al. The high prevalence of pathologic calcium crystals in pre-operative knees. J Rheumatol. 2002;29(3):570-574.
47. Ho AM, Johnson MD, Kingsley DM. Role of the mouse ank gene in control of tissue calcification and arthritis. Science. 2000;289(5477):265-270.
48. Macmullan P, McCarthy G. Treatment and management of pseudogout: insights for the clinician. Ther Adv Musculoskelet Dis. 2012;4(2):121-131.
49. Gerdesmeyer L, Wagenpfeil S, Haake M, et al. Extracorporeal shock wave therapy for the treatment of chronic calcifying tendonitis of the rotator cuff: a randomized controlled trial. JAMA. 2003;290(19):2573-2580.
50. Lee SY, Cheng B, Grimmer-Somers K. The midterm effectiveness of extracorporeal shockwave therapy in the management of chronic calcific shoulder tendinitis. J Shoulder Elbow Surg. 2011;20(5):845-854.
51. Pfister J, Gerber H. Chronic calcifying tendinitis of the shoulder-therapy by percutaneous needle aspiration and lavage: a prospective open study of 62 shoulders. Clin Rheumatol. 1997;16(3):269-274.
52. del Cura JL, Torre I, Zabala R, Legórburu A. Sonographically guided percutaneous needle lavage in calcific tendinitis of the shoulder: short- and long-term results. AJR Am J Roentgenol. 2007;189(3):W128-W134.
53. Yoo JC, Koh KH, Park WH, Park JC, Kim SM, Yoon YC. The outcome of ultrasound-guided needle decompression and steroid injection in calcific tendinitis. J Shoulder Elbow Surg. 2010;19(4):596-600.
54. Wiper JD, Garrido A. Images in clinical medicine. Acute calcific tendinitis. N Engl J Med. 2008;359(23):2477.
55. Halverson PB, Carrera GF, McCarty DJ. Milwaukee shoulder syndrome. Arch Intern Med. 1990;150(3):677-682.
Calcium pyrophosphate (CPP) crystals may deposit in both articular tissues (predominantly hyaline cartilage and fibrocartilage) and periarticular soft tissues.1,2 Calcium pyrophosphate deposition disease (CPPD) may be asymptomatic or be associated with a spectrum of clinical syndromes, including both acute and chronic inflammatory arthritis.2
The European League Against Rheumatism (EULAR) recently suggested changes in CPPD terminology.2 According to the new EULAR classification, pseudogout, or CPPD, has been reclassified based on new key terms that include several of the previously described disease phenotypes: asymptomatic CPPD; acute CPP crystal arthritis (previously known as pseudogout); osteoarthritis (OA) with CPPD (previously, pseudo-OA); and the chronic CCP crystal inflammatory arthritis (previously, pseudorheumatoid arthritis). In similar fashion, chondrocalcinosis (CC) refers to calcification of the fibrocartilage and/or hyaline cartilage identified by imaging or histologic analysis. Although CC is most commonly seen in CPPD, it is not exclusive to this disease, as it can be seen in other crystal diseases (oxalosis, basic calcium phosphate [BCP]) and can appear as casual finding or coexist with OA.2
Clinical Manifestations
In clinical practice, CPPD may present with several phenotypic forms. In asymptomatic CPPD, CC is a common radiographic finding without clinical symptoms. Acute CPP arthritis always should be suspected in any patient aged > 65 years presenting with acute monoarticular or oligoarticular, migratory or additive, symmetrical, or polyarticular arthritis.3 Acute CCP arthritis is characterized by self-limited acute or subacute attacks of arthritis involving 1 or several extremity joints (knees, wrists, ankles; rarely affects large toe). Typically, the acute attacks last 7 to 10 days. Several unusual sites (eg, the hip joints, trochanteric bursa, and deep spinal joints) also may be affected. However, differences in pattern of joint involvement are insufficient to permit definitive diagnosis without demonstration of the specific crystal type in the inflammatory joint fluid.
Pseudogout attacks closely resemble gouty arthritis; CPPD presents as intermittent flares and often is asymptomatic between flares. Trauma, surgery, or severe medical illness frequently provokes attacks of monosodium urate (MSU) as well as acute CPP arthritis. Systemic findings, such as fever; leukocytosis with a left shift in the differential count; inflammatory markers, such as elevated sedimentation rate (ESR); or C-reactive protein, also can occur, resembling pyogenic arthritis, osteomyelitis, and/or systemic sepsis in the elderly patient.
Diagnosis must be confirmed with aspiration, Gram stain and cultures of the synovial fluid, and evaluation for the presence of CPP crystals under polarized light microscopy.2 The diagnosis can be difficult to confirm secondary to the weakly birefringent nature of CPP crystals.4 Coexistence of MSU and CPP crystals in a single inflammatory effusion is neither uncommon nor unexplained given increased frequencies of both hyperuricemia/gout and CC among elderly patients.5
Chronic CPP crystal inflammatory arthritis may present as a chronic, symmetrical, bilateral, and deforming polyarthritis. It frequently affects the wrists and metacarpophalangeal joints and tendon sheaths. Chronic CPP may resemble rheumatoid arthritis (RA) and produce wrist tenosynovitis, which may manifest as carpal tunnel syndrome and/or cubital tunnel syndrome. Calcium pyrophosphate deposition disease should be on the differential diagnosis in the elderly patient presenting with a clinical picture that resembles “seronegative” RA, with morning stiffness, synovial thickening, localized edema, and restricted motion due to active inflammation or flexion contracture of the hands/wrist. It may present with prominent systemic features, such as leukocytosis, fevers, mental confusion, and inflammatory oligoarthritis or polyarthritis. The diagnosis of CPPD still may be possible even though the rheumatoid factor (RF) is positive, given the increasing likelihood of elevated RF in the older population. In this setting, aspiration of joint fluid and radiography will assist in clarification of the diagnosis. Furthermore, CPPD typically does not cause the type of erosive disease that is often seen in RA.
Calcium pyrophosphate deposition disease also can mimic polymyalgia rheumatica (PMR). A direct comparison of a cohort of patients with pseudo-PMR (PMR/CPPD) with actual PMR patients found that increased age at diagnosis, presence of knee osteoarthritis, tendinous calcifications, and ankle arthritis carried the highest predictive value in patients with CPPD presenting with PMR-like symptoms.6 However, the PMR/CPPD variant can be difficult to distinguish, because both conditions can have elevated systemic inflammatory markers, and both are steroid responsive.
Calcium pyrophosphate deposition disease involving a single joint can rarely lead to extensive destruction—as with neuropathic joints in the absence of any neurologic deficits—and is extremely debilitating. This presentation is not well understood and does not have good treatment alternatives. Calcium pyrophosphate crystals often are associated with manifestations of OA.1,2 Indeed, up to 20% of OA joints have been found to be positive for CPP crystals in various studies. Given the extensive evidence supporting treatment of OA, usually they are treated in a similar fashion with good results. Occasionally, these will have unusual manifestations for typical OA, such as involvement of wrists and metacarpophalangeal joints; however, the presentation is often indolent like OA.
Calcium pyrophosphate crystal deposition involving the spine has been associated with a number of clinical manifestations. Spine stiffness, sometimes associated with bony ankylosis, can resemble ankylosing spondylitis or diffuse idiopathic skeletal hyperostosis. Such symptoms are seen more commonly in familial CPPD rather than in the elderly. However, crystal deposition in the ligamentum flavum at the cervical spine levels has been associated with a condition called crowned dens syndrome.7 Although mostly asymptomatic, it may be present with acute neck pain, fever, and an increased ESR, sometimes mimicking PMR or giant cell arteritis or neurologic symptoms. Similarly, CPP crystal deposition in the posterior longitudinal ligament at the lower levels of the spine may lead to spinal cord compression syndromes or symptoms of either acute nerve compression or chronic spinal stenosis.8,9 Calcium pyrophosphate crystal deposition also can occur in other soft tissues, such as bursae, ligaments, and tendons and may be sufficient to cause local nerve compression, such as carpal or cubital tunnel syndrome.
Epidemiology
Radiographic surveys of the knees, hands, wrists, and pelvis and epidemiologic studies have demonstrated an age-related increase in the prevalence of CPPD: 15% prevalence in patients aged 65 to 74 years, 36% prevalence in patients aged 75 to 84 years, and 50% prevalence in patients aged > 84 years.10 In a recent radiographic study, 40% of patients with CPPD did not present with CC of the knee, and the study’s authors recommended additional radiographs of pelvis, wrists, or hands for accurate diagnosis of radiographic CC.11
Diagnosis
Accurate diagnosis should be achieved on the basis of the clinical picture and demonstration of CPP crystals in synovial fluid or tissue by compensated polarized light microscopy (Figures 1A and 1B).2 The sensitivity and specificity for CPP crystal detection has been shown to be 95.9% and 86.5%, respectively.12 However, the CPP crystal is more readily identified by a rheumatologist rather than in a standard hospital laboratory, which misses 30% of CPP crystals.13
Findings of CC on radiograph strengthens a CPPD diagnosis, but its absence does not rule it out (Figure 2A).2 More recently, the use of new imaging modalities, such as musculoskeletal ultrasound, provides the capacity to visualize crystal deposits within the joint structures, the hyaline cartilage, and/or fibrocartilage (Figure 2B and 2C).14 The presence of hyperechoic bands within the intermediate layer hyaline cartilage and hyperechoic spots in fibrocartilage are consistent with CPP crystal deposits.2,14 The use of computed tomography is the gold standard imaging modality for the identification of CPPD of the spine.15 There is not enough evidence to support the use of magnetic resonance imaging in CPPD, but it may play a role in rare complications.2
Treatment
The EULAR recently defined new guidelines for the management of CPPD.16 Asymptomatic CPPD needs no treatment.In other CPPD phenotypes, the goals are to attempt prompt resolution of the acute synovitis, reduction in chronic damage, and management of associated conditions.In acute attacks, treatment modalities used in gout are often required; however, data for CPPD treatment are limited (Table). Treatment relies on the use of colchicine and nonsteroidal anti-inflammatory drugs (NSAIDs), but toxicity and comorbidities in the elderly limit the usage of these drugs.
Given increased renal impairment, the loading dose of colchicine is not recommended.16 Colchicine has recently been shown to completely block crystal-induced maturation of IL-1β in vitro, indicating that the drug acts upstream of inflammasome activation.17 This is in addition to the well-known role of colchicine in inhibition of micro-tubule formation, which likely leads to prevention of cell migration, phagocytosis, and activation of inflammasome.18-20
Intra-articular injection of corticosteroid is an efficient and well-tolerated treatment alternative for monoarticular CPP flares. Oral or parenteral corticosteroids are frequently used for polyarticular flares in particular for those patients in which NSAIDs and colchicine are contraindicated.16 Parenteral adrenocorticotropic hormone has been used in patients with congestive heart failure, renal insufficiency, gastrointestinal bleeding, or resistance to NSAIDs.21 For prophylaxis of acute CPP crystal arthritis, a low dose of oral NSAIDs, oral colchicine, or prednisone may be used with good results.16 In chronic CPP arthritis, continuous use of colchicine, NSAIDs, or low-dose prednisone is often appropriate. If these interventions are ineffective or contraindicated, using hydroxychloroquine (HCQ) and methotrexate (MTX) have been successfully used to control chronic CPP crystal inflammation.22,23 Recent trials have raised questions about MTX, and further trials on HCQ usage are underway.24 Biologic agents targeting IL-1 are not currently approved for the treatment of CPPD, but there are suggestions that it may be effective in refractory cases and induce rapid stable remissions after 3 days of therapy.25
In contrast to gout, there is no specific target therapy for lowering CPP crystal load in the elderly. Crucial in the management of CPPD in the elderly is the search for associated diseases, such as hyperparathyroidism, hemochromatosis, hypomagnesemia, and hypophosphatemia, as well as avoidance of tacrolimus, which facilitates or causes CC.16 Correction of the underlying metabolic disorder, especially when undertaken early, may reduce the severity of CPPD. However, there is little evidence to suggest that treatment of associated disease results in resolution of CPPD—most famously, although therapeutic phlebotomy does not help in hemochromatosis for prevention of crystal disease, chelating agents do seem to be moderately effective.26 Only oral administration of magnesium has shown a reduction in meniscal CC in a patient with CPPD arthropathy.27 In addition, this was in the setting of familial hypomagnesemia associated CPPD. However, unlike uricosuric agents for gout, no pharmacologic treatments can prevent CPPD crystal formation and deposition in tissues.
Therapeutic Agents
Magnesium
Magnesium is a cofactor for the activity of pyrophosphatases that converts inorganic pyrophosphates (PPis) into orthophosphates. In addition, magnesium can increase the solubility of CPP crystals. Early detection and management of hypomagnesemia are recommended, because it occurs in patients who have well-defined conditions and situations: Gitelman syndrome, thiazide and loop diuretics use, tacrolimus use, familial forms of renal magnesium wasting or use of proton pump inhibitors, short bowel syndrome, and intestinal failure in patients receiving home parenteral nutrition. Long-term administration of magnesium in some patients with chronic hypomagnesemia decreased meniscal calcification.27-29
Dietary Calcium
Epidemiologic studies showed a lower incidence of CC in Chinese subjects. The authors of the study speculate that this lower prevalence of CPPD could result from high levels of calcium found in the drinking water in Beijing, which may affect parathyroid hormone secretion.30 Further studies are needed to confirm this hypothesis, as it could be a cheaper approach to pseudogout prevention.
Probenecid
Probenecid is an in vitro inhibitor of the transmembrane PPi transporter thought to possibly prevent extracellular PPi elaboration. However, this observation has not been confirmed by either case reports or clinical trials.31
Phosphocitrate
Phosphocitrate acts directly on preventing crystal deposition in tissues in CPPD as well as BCP based on in vitro evidence and mouse models.32,33
Hyaluronan
An amelioration of pain and increased range of motion were observed in radiographic CC with OA.34 However, it is associated with increased acute CPP arthritis.35
Radiosynovectomy
In a double-blind study of 15 patients with symmetrical CPPD arthropathy, the knee that underwent intra-articular injection of yttrium-90 (5 mCi) plus steroid had less pain, stiffness, joint line tenderness, and effusion compared with the contralateral control knee injected with saline and steroids.36
Precipitators of Acute Pseudogout
Diuretics are known to exacerbate gout, but they also can exacerbate pseudogout. A recent case-control study nested within a United Kingdom general practice database found that loop diuretics rather than hydrochlorothiazide was associated with increased risk of CPPD mediated primarily by magnesium reabsorption in the loop of Henle.28 Chronic kidney disease associated with secondary and tertiary hyperparathyroidism increases calcium or PPi concentration, which leads to CPP-crystal deposition.
In addition, multiple case reports have described acute pseudogout caused by bisphosphonate administration for osteoporosis or Paget disease—more likely in the elderly population. Intravenous pamidronate, oral etidronate, and alendronate therapy have all been described in the elderly.37 The overall mechanism behind this link is not completely understood, but bisphosphonates are structurally similar to PPi. Pseudogout attacks also have been described in neutropenic patients undergoing treatment with granulocyte-colony stimulating factor.38 In addition to pharmaceutical exacerbation of pseudogout, surgical procedures and trauma can precipitate attacks. Joint lavage has been described to increase the incidence of pseudogout.39 It was hypothesized that joint lavage with fluid induced “crystal shedding” from CPPD crystals imbedded in the joint tissue. Patients who underwent meniscectomy of the knee 20 years ago had a 20% incidence of CC in the knee that was operated compared with 4% CC in the contralateral nonoperated knee.40 Overall, the surgery most linked with a pseudogout attack, however, is parathyroidectomy.41
Basic Calcium Phosphate Crystals
Basic calcium phosphate crystals are common but rarely diagnosed due to the cumbersome and expensive methods required to identify these crystals.42
Basic calcium phosphate and CPPD crystals may coexist in synovial fluid. Similar to CPPD, BCP crystal disease is often concurrent with OA and can cause calcification of articular cartilage. Basic calcium phosphate is more common than CPP crystals with occurrence of 30% to 50% in OA synovial fluid.42 Additionally, BCP crystal disease has been linked to increased severity of OA. Basic calcium phosphate crystals in knee joints were found to have radiographically more severe arthritis with larger effusions.44,45 Similarly, BCP crystals in OA synovial fluid correlated with higher Kellgreen-Lawrence grade scores by radiography.42,46
It is currently believed that BCP crystals are continuously formed in the extracellular matrix, and their deposition is actively prevented by PPi present in the matrix.47 Elevated PPi levels, on the other hand, favor the formation of CPP crystals.48 The clinical upshot seems to be that although CPP crystals are almost universally intra-articular and released by chondrocytes, BCD crystals and deposits are more frequently present in soft tissues.
Acute Calcific Tendinitis
Typically, this type of tendinitis involves the shoulder joint and is extra-articular. Common treatments help, including NSAIDs, intra-articular steroids, ice, and rest. In addition, high-energy extracorporeal shock wave therapy has been shown to be effective when used with conscious sedation.49,50 Needling or barbotage in association with lavage and steroid injections also is effective and has occasionally been shown to reduce the size of the calcium deposit as well, often in combination with IV drugs like ethylenediaminetetraacetic acid.51-53
Acute calcific periarthritis of the hand presents similar to gout or pseudogout, affecting the wrist, usually in postmenopausal women.54 Basic calcium phosphate crystals are aspirated from the joint, and periarticular crystals may be subtle. Local steroid injections are beneficial.Milwaukee shoulder syndrome is an arthropathy associated with BCP crystals in the joint fluid and results in extensive destruction of shoulder articular cartilage and surrounding tissues. It is commonly bilateral and occurs in elderly women more often than it does in men.55 Aspiration of the shoulder joint typically reveals a serosanginous fluid. Fluid samples can be assessed for hydroxyapatite crystals by staining with alizarin red dye, which produces a characteristic “halo” or orange-red stain by light microscopy.43 Surgical treatment of Milwaukee shoulder syndrome is difficult due to increased age of the population affected and the severity of the shoulder destruction. Usually a conservative approach of analgesics, recurrent shoulder aspirations, and steroid injections is the best treatment option.
Conclusions
Calcium-containing crystal-associated arthropathies are a complex array of entities that target the veteran elderly population with increasing frequency. Challenges still remain in the diagnosis, crystal identification, and treatment due to coexisting comorbid conditions and polypharmacy commonly seen in veterans. Overall morbidity associated with calcium-containing crystal-associated arthropathies and the coexisting osteoarthritis is great, and focused identification of the disease process with tailored treatment can achieve the goal of decreasing symptoms and improving quality of life.
Acknowledgements
This work was supported by grant P20GM104937 (A.M.R.).
1. Guerne PA, Terkeltaub R. Clinical Features, Diagnosis, and Treatment of CPPD Crystal Arthropathy. In: Terkeltaub R, ed. Gout and Other Crystal Arthropathies. Philadelphia, PA: Saunders/Elsevier; 2012:249-265.
2. Zhang W, Doherty M, Bardin T, et al. European League Against Rheumatism recommendations for calcium pyrophosphate deposition. Part I: terminology and diagnosis. Ann Rheum Dis. 2011;70(4):563-570.
3. McCarty DJ. Calcium pyrophosphate dihydrate crystal deposition disease—1975. Arthritis Rheum. 1976;19(S3):275-285.
4. Ivorra J, Rosas J, Pascual E. Most calcium pyrophosphate crystals appear as non-birefringent. Ann Rheum Dis. 1999;58(9):582-584.
5. Lawrence RC, Felson DT, Helmick CG, et al; National Arthritis Data Workgroup. Estimates of the prevalence of arthritis and other rheumatic conditions in the United States. Part II. Arthritis Rheum. 2008;58(1):26-35.
6. Pego-Reigosa JM, Rodriguez-Rodriguez M, Hurtado-Hernandez Z, et al. Calcium pyrophosphate deposition disease mimicking polymyalgia rheumatica: a prospective followup study of predictive factors for this condition in patients presenting with polymyalgia symptoms. Arthritis Rheum. 2005;53(6):931-938.
7. Bouvet JP, le Parc JM, Michalski B, Benlahrache C, Auquier L. Acute neck pain due to calcifications surrounding the odontoid process: the crowned dens syndrome. Arthritis Rheum. 1985;28(12):1417-1420.
8. Muthukumar N, Karuppaswamy U. Tumoral calcium pyrophosphate dihydrate deposition disease of the ligamentum flavum. Neurosurgery. 2003;53(1):103-109.
9. Armas JB, Couto AR, Bettencourt BF. Spondyloarthritis, diffuse idiopathic skeletal hyperostosis (DISH) and chondrocalcinosis. Adv in Exp Med Biol. 2009;649:37-56.
10. Abhishek A, Doherty M. Epidemiology of calcium pyrophosphate crystal arthritis and basic calcium phosphate crystal arthropathy. Rheum Dis Clin North Am. 2014;40(2):177-191.
11. Abhishek A, Doherty S, Maciewicz R, Muir K, Zhang W, Doherty M. Chondrocalcinosis is common in the absence of knee involvement. Arthritis Res Ther. 2012;14(5):R205.
12. Lumbreras B, Pascual E, Frasquet J, González-Salinas J, Rodríguez E, Hernández-Aguado I. Analysis for crystals in synovial fluid: training of the analysts results in high consistency. Ann Rheum Dis. 2005;64(4):612-615.
13. Szscygiel J, Reginato AM SS. Quality improvements in the identification of crystals from synovial fluid: hospital laboratory versus rheumatology department evaluation. Poster presented at: 2014 ACR/ARHP Annual Meeting; November 15, 2014; Boston, MA.
14. Grassi W, Meenagh G, Pascual E, Filippucci E. “Crystal clear”-sonographic assessment of gout and calcium pyrophosphate deposition disease. Semin Arthritis Rheum. 2006;36(3):197-202.
15. Scutellari PN, Galeotti R, Leprotti S, Ridolfi M, Franciosi R, Antinolfi G. The crowned dens syndrome. Evaluation with CT imaging. Radiol Med. 2007;112(2):195-207.
16. Zhang W, Doherty M, Pascual E, et al. EULAR recommendations for calcium pyrophosphate deposition. Part II: management. Ann Rheum Dis. 2011;70(4):571-575.
17. Martinon F, Pétrilli V, Mayor A, Tardivel A, Tschopp J. Gout-associated uric acid crystals activate the NALP3 inflammasome. Nature. 2006;440(7081):237-241.
18. Nuki G. Colchicine: its mechanism of action and efficacy in crystal-induced inflammation. Curr Rheumatol Rep. 2008;10(3):218-227.
19. Borisy GG, Taylor EW. The mechanism of action of colchicine. Colchicine binding to sea urchin eggs and the mitotic apparatus. J Cell Biol. 1967;34(2):535-548.
20. Borisy GG, Taylor EW. The mechanism of action of colchicine. Binding of colchincine-3H to cellular protein. J Cell Biol. 1967;34(2):525-533.
21. Daoussis D, Antonopoulos I, Andonopoulos AP. ACTH as a treatment for acute crystal-induced arthritis: update on clinical evidence and mechanisms of action. Semin Arthritis Rheum. 2014;43(5):648-653.
22. Rothschild B, Yakubov LE. Prospective 6-month, double-blind trial of hydroxychloroquine treatment of CPDD. Compr Ther. 1997;23(5):327-331.
23. Chollet-Janin A, Finckh A, Dudler J, Guerne PA. Methotrexate as an alternative therapy for chronic calcium pyrophosphate deposition disease: an exploratory analysis. Arthritis Rheum. 2007;56(2):688-692.
24. Finckh A, Mc Carthy GM, Madigan A, et al. Methotrexate in chronic-recurrent calcium pyrophosphate deposition disease: no significant effect in a randomized crossover trial. Arthritis Res Ther. 2014;16(5):458.
25. Moltó A, Ea HK, Richette P, Bardin T, Lioté F. Efficacy of anakinra for refractory acute calcium pyrophosphate crystal arthritis. Joint Bone Spine. 2012;79(6):621-623.
26. Harty LC, Lai D, Connor S, et al. Prevalence and progress of joint symptoms in hereditary hemochromatosis and symptomatic response to venesection. J Clin Rheumatol. 2011;17(4):220-222.
27. Doherty M, Dieppe PA. Double blind, placebo controlled trial of magnesium carbonate in chronic pyrophosphate arthropathy. Ann Rheum Dis. 1983;42(suppl 1):106-107.
28. Rho YH, Zhu Y, Zhang Y, Reginato AM, Choi HK. Risk factors for pseudogout in the general population. Rheumatology (Oxford). 2012;51(11):2070-2074.
29. Park CH, Kim EH, Roh YH, Kim HY, Lee SK. The association between the use of proton pump inhibitors and the risk of hypomagnesemia: a systematic review and meta-analysis. PLoS One. 2014;9(11):e112558.
30. Zhang Y, Terkeltaub R, Nevitt M, et al. Lower prevalence of chondrocalcinosis in Chinese subjects in Beijing than in white subjects in the United States: the Beijing Osteoarthritis Study. Arthritis Rheum. 2006;54(11):3508-3512.
31. Rosenthal AK, Ryan LM. Probenecid inhibits transforming growth factor-beta 1 induced pyrophosphate elaboration by chondrocytes. J Rheumatol. 1994;21(5):896-900.
32. Cheung HS, Sallis JD, Demadis KD, Wierzbicki A. Phosphocitrate blocks calcification-induced articular joint degeneration in a guinea pig model. Arthritis Rheum. 2006;54(8):2452-2461.
33. Sun Y, Mauerhan DR, Honeycutt PR, et al. Calcium deposition in osteoarthritic meniscus and meniscal cell culture. Arthritis Res Ther. 2010;12(2):R56.
34. Daumen-Legre V, Pham T, Acquaviva PC, Lafforgue P. Evaluation of safety and efficacy of viscosupplementation in knee osteoarthritis with chondrocalcinosis. In: Arthritis and Rheumatism.Vol. 42. Lippincott Williams and Wilkins; 1999:S158-S158.
35. Disla E, Infante R, Fahmy A, Karten I, Cuppari GG. Recurrent acute calcium pyrophosphate dihydrate arthritis following intraarticular hyaluronate injection. Arthritis Rheum. 1999;42(6):1302-1303.
36. Doherty M, Dieppe PA. Effect of intra-articularYttrium-90 on chronic pyrophosphate arthropathy of the knee. Lancet. 1981;2(8258):1243-1246.
37. Wendling D, Tisserand G, Griffond V, Saccomani C, Toussirot E. Acute pseudogout after pamidronate infusion. Clin Rheumatol. 2008;27(9):1205-1206.
38. Ames PRJ, Rainey MG. Consecutive pseudogout attacks after repetitive granulocyte colony-stimulating factor administration for neutropenia. Mod Rheumatol. 2007;17(5):445-446.
39. Pasquetti P, Selvi E, Righeschi K, et al. Joint lavage and pseudogout. Ann Rheum Dis. 2004;63(11):1529-1530.
40. Doherty M, Watt I, Dieppe P. Localised chondrocalcinosis in post-meniscectomy knees. Lancet. 1982;1(8283):1207-1210.
41. Rubin MR, Silverberg SJ. Rheumatic manifestations of primary hyperparathyroidism and parathyroid hormone therapy. Curr Rheumatol Rep. 2002;4(2):179-185.
42. Ea HK, Lioté F. Diagnosis and clinical manifestations of calcium pyrophosphate and basic calcium phosphate crystal deposition diseases. Rheum Dis Clin North Am. 2014;40(2):207-229.
43. Paul H, Reginato AJ, Ralph Schumacher HR. Alizarin red s staining as a screening test to detect calcium compounds in synovial fluid. Arthritis Rheum. 1983;26(2):191-200.
44. Molloy ES, McCarthy GM. Basic calcium phosphate crystals: pathways to joint degeneration. Curr Opin Rheumatol. 2006;18(2):187-192.
45. Carroll GJ, Stuart RA, Armstrong JA, Breidahl PD, Laing BA. Hydroxyapatite crystals are a frequent finding in osteoarthritic synovial fluid, but are not related to increased concentrations of keratan sulfate or interleukin 1 beta. J Rheumatol. 1991;18(6):861-866.
46. Derfus BA, Kurian JB, Butler JJ, et al. The high prevalence of pathologic calcium crystals in pre-operative knees. J Rheumatol. 2002;29(3):570-574.
47. Ho AM, Johnson MD, Kingsley DM. Role of the mouse ank gene in control of tissue calcification and arthritis. Science. 2000;289(5477):265-270.
48. Macmullan P, McCarthy G. Treatment and management of pseudogout: insights for the clinician. Ther Adv Musculoskelet Dis. 2012;4(2):121-131.
49. Gerdesmeyer L, Wagenpfeil S, Haake M, et al. Extracorporeal shock wave therapy for the treatment of chronic calcifying tendonitis of the rotator cuff: a randomized controlled trial. JAMA. 2003;290(19):2573-2580.
50. Lee SY, Cheng B, Grimmer-Somers K. The midterm effectiveness of extracorporeal shockwave therapy in the management of chronic calcific shoulder tendinitis. J Shoulder Elbow Surg. 2011;20(5):845-854.
51. Pfister J, Gerber H. Chronic calcifying tendinitis of the shoulder-therapy by percutaneous needle aspiration and lavage: a prospective open study of 62 shoulders. Clin Rheumatol. 1997;16(3):269-274.
52. del Cura JL, Torre I, Zabala R, Legórburu A. Sonographically guided percutaneous needle lavage in calcific tendinitis of the shoulder: short- and long-term results. AJR Am J Roentgenol. 2007;189(3):W128-W134.
53. Yoo JC, Koh KH, Park WH, Park JC, Kim SM, Yoon YC. The outcome of ultrasound-guided needle decompression and steroid injection in calcific tendinitis. J Shoulder Elbow Surg. 2010;19(4):596-600.
54. Wiper JD, Garrido A. Images in clinical medicine. Acute calcific tendinitis. N Engl J Med. 2008;359(23):2477.
55. Halverson PB, Carrera GF, McCarty DJ. Milwaukee shoulder syndrome. Arch Intern Med. 1990;150(3):677-682.

Long‐term Antipsychotics in Elders
Delirium, a clinical syndrome characterized by inattention and acute cognitive dysfunction, is very common in older hospitalized patients, with a reported incidence of 18% to 35% at time of admission and overall occurrence rates of 29% to 64%.[1] Previous studies have reported that a diagnosis of delirium is not benign and is associated with other adverse outcomes including prolonged hospitalization, institutionalization, increased cost, and mortality. These outcomes occurred independent of age, prior cognitive functioning, and comorbidities.[2] Guidelines recommend that management of inpatient delirium should be focused on addressing the underlying etiology and managed with nonpharmacological interventions whenever possible.[3, 4, 5] However, implementing these recommendations can prove to be very challenging in hospital settings. Providers frequently have to resort to medical therapies, including antipsychotics (APs). Although these medications are commonly used to treat delirium in elderly patients, there is limited evidence to support their efficacy, and there are currently no proven pharmacological alternatives to these medications.[6] Furthermore, previous studies have demonstrated an increased risk of stroke, infection, cognitive impairment, and mortality in elders with dementia who receive long‐term AP therapy.[7, 8, 9] Yet as many as 48% of hospitalized elders who were newly started on APs had these drugs continued at time of discharge.[10]
There have been few studies describing the long‐term outcomes of elderly patient who are started on APs in the hospital. Most information on outcomes comes from patients with dementia. Therefore, we studied the 1‐year outcomes of a cohort of patients with and without dementia who were started on APs in the hospital and then discharged on these medications. In this cohort, we aimed to describe the number of readmissions, reasons for readmissions, duration of AP therapy, use of other sedating medications such as anxiolytics, hypnotics, and antihistamines as well as the incidence of readmission and death 1 year after the index hospital discharge.
METHODS
We previously described a retrospective cohort of 300 elders (65 years old) admitted to a tertiary care hospital between October 1, 2012 and September 31, 2013 who were newly prescribed APs while hospitalized.[10] Of patients alive at the time of discharge (260), 56% (146 patients) were discharged on APs. Two investigators extracted these 148 patient charts independently to identify and quantify the number of readmissions to the index hospital. We then limited the sample to only the first readmission per patient following the index admission and extracted this readmission for each patient. We first determined if APs were present on the admission medication reconciliation. If APs were not present on admission, we examined whether they were resumed during the hospitalization using the electronic medication administration summary. If they were present on admission, we looked to see if they were discontinued during the readmission and if additional new APs were started during the hospitalizations. We documented the circumstances around APs use and identified patients who died during their hospitalizations. We identified delirium using the same terms that were described in our prior study on the same cohort of patients.[10] We determined if patients were delirious using a predetermined algorithm (Figure 1). Briefly, we first determined delirium was documented. We then examined whether there was a Confusion Assessment Method (CAM) instrument included in the record. If a CAM instrument was not documented, we then looked for documentation using specific terms (eg, disorientation, confusions). We identified patients with dementia by determining whether dementia was documented along with other admission medical comorbidities. If it was not, we determined whether dementia was newly diagnosed during the hospital stay using progress notes or consultation notes. We did not objectively define criteria for diagnosis of dementia. We used the National Death Index (NDI) to determine mortality for all patients 1 year after discharge from the index hospitalization. The NDI is a national database of death records maintained by the National Center for Health Statistics. It has shown consistently high sensitivity and specificity for detection of death.[11]

We used descriptive statistics (means, standard deviations, range, and percents as appropriate to the scale of measurement) to describe the patient sample. We then used multiple logistic regression to identify significant predictors of death within 1 year of discharge.[12] Univariate analysis was used to select candidates for the logistic model (t tests for continuous factors and 2 for discrete factors). All factors with a significance level <0.2 on univariate analysis were included in the logistic regression, in addition to age and sex (regardless of significance). A maximum likelihood procedure was used to calculate the regression coefficients for the logistic model. The likelihood ratio criterion was used to determine the significance of individual factors in the regression model.[13] Factors with a significance level of 0.15 or less were retained in the final model, in addition to age and sex.
RESULTS
The 260 patients discharged alive from their index admissions had a 1‐year mortality rate of 29% (75/260). Of the 146/260 patients discharged on APs, 60 (41%) patients experienced at least 1 readmission (mean = 2 readmissions per patient; range, 18, with 111 total readmissions for 60 patients) within 1 year from discharge (Figure 2). Most common diagnoses at the time of readmissions were related neurological and psychiatric disorders (14%), cardiovascular and circulation disorders (13%), renal injury and electrolyte disorders (11%), and infections (6%). Among patients with at least 1 readmission, the mean age was 81.3 (range, 65.599.7), 60% were male, and 45% were admitted from a skilled nursing facility or rehabilitation facility (Table 1). Median time to readmission was 43.5 days (range, 1343 days), and 79% were readmitted to a medical service. The remaining 20% were admitted to a surgical service. Inpatient mortality during first readmissions was 8% (5/60). At the time of first readmission, 39/60 (65%) of patients were still on the same APs on which they had been discharged, and the APs were continued during the hospitalization in 79% of the patients (61% quetiapine, 19% olanzapine, and 13% risperidone). About half of patients whose APs were discontinued prior to readmission received a new AP during their hospital stays (9/20; 45%). One patient had been started on quetiapine in the outpatient setting. No patients were found to have new benzodiazepines, nonbenzodiazepine hypnotic, or antihistamines on their admission medication list.
| Variables | Value* |
|---|---|
| |
| Age, mean (range), yr | 81.3 (65.599.7) |
| Gender, no. (%) | |
| Male | 36 (60) |
| Female | 24 (40) |
| Admitted from, no. (%) | |
| Home | 33 (55) |
| Rehabilitation facilities | 5 (8) |
| SNF | 22 (37) |
| Services, no. (%) | |
| Medicine | 48 (80) |
| Surgery | 12 (20) |
| Types of APs continued on readmission (from index admission), no. (%) | |
| Quetiapine | 19 (61) |
| Olanzapine | 6 (19) |
| Risperidone | 4 (13) |
| Haloperidol | 2 (7) |
| Types of APs started during readmission, no. (%) | |
| Quetiapine | 7 (39) |
| Risperidone | 2 (11) |
| Haloperidol | 16 (89) |
| Indications for AP use, no. (%) | |
| Delirium | 14 (77) |
| Undocumented | 3 (17) |
| Other | 1 (6) |
| ECG, no. (%) | |
| Prior to APs administration | 17 (94) |
| After APs administration | 4 (22) |
| QTc prolongation >500 ms, no. (%) | |
| Prior to APs administration | 3 (18) |
| After APs administration∥ | 2 (50) |
| Discharge destination, no. (%) | |
| Home | 23 (38) |
| Rehabilitation facilities | 4 (7) |
| SNF | 28 (47) |
| Death | 5 (8) |
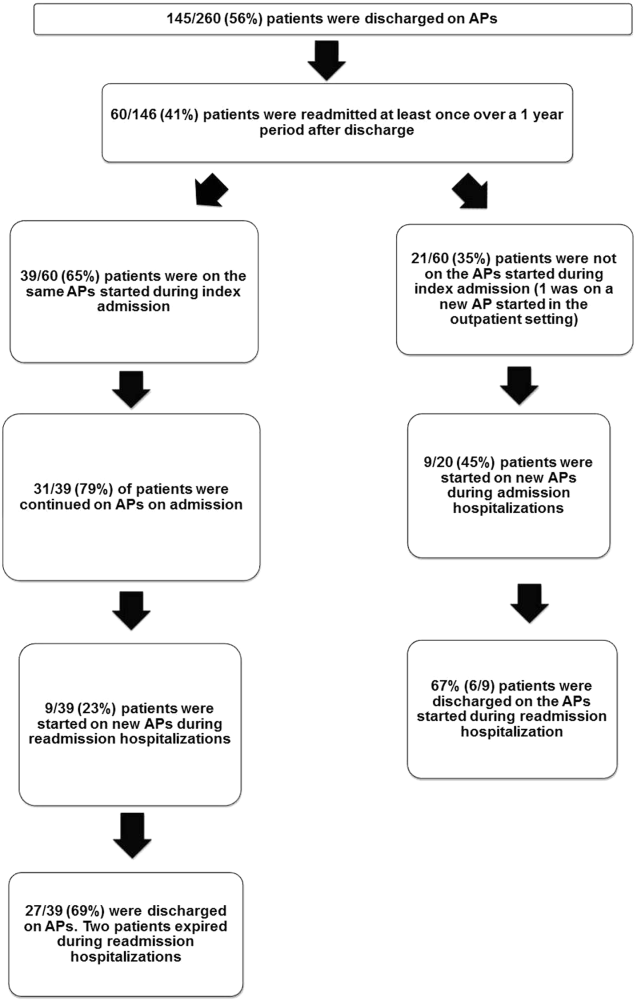
Eighteen patients received 1 or more new APs during the readmission hospitalizations. These included haloperidol (89%) and quetiapine (39%). Delirium was the main reported indication for starting APs (78%), but in 17% of cases no indication was documented. An electrocardiogram (ECG) was performed in 94% prior to APs administration and for 22% after APs administration. Corrected QT interval (QTc) of >500 ms was present in 18% of patients in pretreatment ECG and 50% of patients in post‐AP ECG. Of patients who survived readmission, 58% (32/55) were discharged to postacute facilities. Of the 39 patients who were on the same APs from index admission, 27 (69%) patients were eventually discharged on the same APs or new APs started during the readmission.
In the multivariable model (Table 2), predictors of death at 1 year included discharge to postacute facilities after index admission (odds ratio [OR]: 2.28; 95% confidence interval [CI]: 1.10‐4.73, P = 0.03) and QTc prolongation >500 ms during index admission (OR: 3.41; 95% CI: 1.34‐8.67, P = 0.01). Age and gender were not associated with 1‐year mortality.
| Odds Ratio | 95% Confidence Interval | P Value | |
|---|---|---|---|
| |||
| Age | 1.03 | 0.991.06 | 0.13 |
| Male sex | 0.87 | 0.501.52 | 0.63 |
| Risperdal | 3.53 | 0.6419.40 | 0.15 |
| QTc prolongation after AP administration* | 3.41 | 1.348.67 | 0.01 |
| Presence of geriatric psychiatry consult | 0.30 | 0.091.04 | 0.06 |
| Discharged to postacute facilities vs home | 2.28 | 1.104.73 | 0.03 |
DISCUSSION
In a cohort of elderly patients who were discharged on APs, nearly one‐third (29%) died within 1 year of the hospitalization in which APs were initiated. Nearly half of the survivors from the index admission (41%) experienced at least 1 admission within 1 year from discharge. Of readmitted patients, two‐thirds were taking the same APs that had been started during the index hospitalization. Half of the patients not on APs on readmission were started on an AP during the hospitalization, most often because they became delirious on return to the acute care setting. Compared to patients discharged home after an index admission, patients who were discharged to postacute facilities were almost 4 times as likely to die during the year subsequent to the admission. These data suggest that once patients are started on APs, most are continued on them until the next admission or are restarted during that readmission. Moreover, hospitalized elders who require an AP are at high risk for mortality in the coming year.
Prior studies have reported that patients with delirium have elevated 1‐year mortality rates.[14, 15, 16, 17, 18, 19] A secondary analysis of the Delirium Prevention Trial, which included 437 hospitalized older patients, revealed a 1‐year mortality rate of 20% in those who were never delirious during hospitalization, compared to 26% to 38% in patients with delirium.[19] Additionally, 1‐year mortality in hospitalized older patients with delirium (36%) was shown to be higher than patients with dementia (29%) or depression (26%).[17] Unlike these studies, not all of the patients in our study had documented delirium, but all received an AP. Still, it is notable that the 1‐year mortality rate for delirium in general is similar to what we found in this study.
The literature has also reported that long‐term AP use is associated with excess mortality in elder patients, especially those with dementia.[20, 21, 22] In a retrospective cohort study, older patients with dementia who were taking antipsychotics had significantly higher 1‐year mortality rates (23%29%) than patients not taking antipsychotic medications (15%). In a large Canadian propensity score‐matched cohort study that included over 13,000 demented older adults, the mortality was higher in the community‐dwelling elders who received atypical APs compared to no APs, with a difference of 1.1% in 180‐day mortality rate after initiation of APs.[21] The absolute mortality rate was 2.6% higher in patients who received typical compared to atypical APs. Unlike these studies, not every patient in our cohort had a diagnosis of dementia, but again, mortality rates in these studies appear similar to our cohort.
In contrast, other observational studies have not found an increased risk associated with receipt of APs. For example, a prospective study that enrolled approximately 950 patients with probable dementia showed that AP use was not associated with time to death after adjustment for comorbidities, demographic and cognitive variables.[23] These conflicting results highlight the difficulties of attributing outcomes in high‐risk populations. Although the excess mortality observed in patients taking APs may be related to the risks of APs, it is quite possible that patients who require APs (most often for delirium or agitated dementia) are at higher risk of death. This confounding by indication may be nearly impossible to adjust for retrospectively, even using techniques such as propensity matching.
Our report adds to the literature; we know of no studies to date describing a cohort of patients, most with delirium, who were started on APs in the hospital. We also attempted to identify the reasons that patients were started on APs, which have been infrequently reported. As noted above, our 1‐year mortality rate of 29% among older patients prescribed APs in the hospital was quite similar to mortality rates both for patients with delirium who were not necessarily treated with APs and patients with dementia who were treated with APs. This finding further supports the argument that risk factors for mortality, including dementia, delirium, and AP use are very difficult to tease apart. It is possible that the reasons that APs are prescribed (agitated delirium or dementia) have as much to do with the excess mortality reported in observational studies of APs as the use of APs themselves.
The high rate of continued AP use we observed (two‐thirds of readmitted patients) may reflect limited pharmacological alternatives to these medications with little evidence to support treating the symptoms of delirium with other drug classes, along with suboptimal environmental and behavioral modifications in postacute facilities and hospitals. This is unfortunate given that delirium is often preventable. Systematic implementation of well‐documented strategies to decrease delirium in hospitals and postacute facilities would likely reduce the prescription of APs and has the potential to slow the decline in this vulnerable population. A meta‐analysis incorporating both randomized and nonrandomized trials of medical and surgical patients showed that multicomponent nonpharmacologic interventions decreased delirium by 50%.[24] Thus, simple interventions such as reorientation, early mobilization, optimizing vision and hearing, sleepwake cycle preservation, and hydration might avoid roughly 1 million cases of delirium in hospitalized older adults annually.[24] The Hospital Elder Life Program and Acute Care for Elders units are examples of programs that have been shown to decrease the incidence of delirium.[25, 26]
Despite vigorous efforts to prevent delirium, a subgroup of patients still will become delirious. These patients are at high risk for death. Our mortality prediction model revealed that patients who were discharged to postacute facilities were 4 times more likely to die during the subsequent year compared to patients who were discharged home. Patients discharged to postacute facilities are likely to have a higher burden of disease, greater functional and cognitive impairment, and more frailty than those who are able to return to the community. Very ill and/or frail patients receiving APs in the hospital and requiring APs on discharge to postacute care facilities have limited survival and may benefit from expedited palliative care interventions to clarify prognosis and goals, and relieve suffering. At a minimum, our study identifies a need for further study to identify this very high‐risk group of elders. It is notable that 50% of patients were found to have a post‐treatment ECG with a QTc of >500 ms, a finding that has not been previously described. This would put these patients at higher risk of mortality, and as such we suggest that current guidelines should continue to emphasize the importance of post‐treatment ECGs and set clear criteria for discontinuation in elderly patients.
Our study is limited by its retrospective, single‐center design and small sample size, therefore limiting the interpretation and generalizability of the results to other hospitals. Quetiapine was the most common AP medication used in our hospital; therefore, our findings cannot be generalized to hospitals that utilize other AP agents. Future studies should examine antipsychotic use across hospitals to determine variation in prescribing patterns and outcomes. Nevertheless, the care of these patients were transitioned to a large number of geriatricians and primary care and nursing home physicians after discharge, and the reflected practice patterns extended beyond our hospital. Additionally, we were unable to determine when and why APs were discontinued or started in the outpatient setting. We were only able to detect readmissions to the 3 hospitals within our health system and therefore may have missed some readmissions to other institutions, although the majority of patients in our region tend to return to the same hospital. For patients who were not readmitted, we were also unable to identify whether they remained on the APs initiated during their index hospitalizations. Any retrospective study is limited by the difficulty of distinguishing delirium from the behavioral and psychiatric symptoms of dementia, but we identified delirium using standard terms described in previous literature.[10] We were unable to determine the types of delirium (hyperactive vs hypoactive) given that the documentations on behavioral symptoms were largely missing from the charts. The number of patients with preexisting diagnosis of dementia was likely underestimated, as we were only able to verify the diagnosis from the medical history. Additionally, the retrospective design based on chart review limited the factors that we could detect and grade accurately for inclusion in our mortality prediction model. Of note, our model did not contain objective measures of cognition, agitation, function, and markers for frailty such as walking speed, weak grip strength, weight loss, and low physical activity.
CONCLUSION
Initiating an AP (eg, haloperidol, quetiapine, olanzapine, and risperidone) in the hospital is likely to result in long‐term use of these medications despite the fact that AP use has been associated with multiple risks including falls, fractures, stroke, cardiovascular disease, and increased mortality in those with underlying dementia.[27] When possible, behavioral interventions to prevent delirium and slow the trajectory of decline should be implemented to reduce AP use. If patients with delirium are started on antipsychotics, it is important to monitor for prolonged QTc given the associated risk of mortality. In a subgroup of patients at high risk for death in the upcoming year, occurrence of delirium or use of APs during a hospitalization should both be considered triggers for early advance care planning and possibly palliative care and end‐of‐life discussions, with an emphasis on quality of life.
Disclosures: The research was supported by the Department of Medicine, Baystate Medical Center/Tufts University School of Medicine. Dr. Lagu is supported by the National Heart, Lung, and Blood Institute of the National Institutes of Health under award number K01HL114745. Drs. Lagu and Loh had full access to all of the data in the study. They take responsibility for the integrity of the data and the accuracy of the analysis. Drs. Loh, Brennan, Lindenauer, and Lagu conceived of the study. Drs. Loh, Ramdass, and Ms. Garb acquired the data. Ms Garb analyzed and interpreted the data. Drs. Loh, Ramdass, and Thim drafted the manuscript. Drs. Brennan, Lindenauer, and Lagu and Ms. Garb critically reviewed the manuscript for important intellectual content. Dr. Lagu has received consulting fees from the Institute for Healthcare Improvement, under contract to the Centers for Medicare and Medicaid Services, for her work on a project to help health systems achieve disability competence. Dr. Brennan is supported by a Geriatric Work Force Enhancement Grant from the US Department of Health and Human Services award number 1 U1QHP287020100. The authors report no conflicts of interest.
- , , . Delirium in elderly people. Lancet. 2014;383:911–922.
- , , , et al. Adverse outcomes after hospitalization and delirium in persons with Alzheimer disease. Ann Intern Med. 2012;156:848–856, W296.
- American Geriatrics Society Expert Panel on Postoperative Delirium in Older Adults. American Geriatrics Society abstracted clinical practice guideline for postoperative delirium in older adults. J Am Geriatr Soc. 2015;63:142–150.
- Practice guideline for the treatment of patients with delirium. American Psychiatric Association. Am J Psychiatry. 1999;156:1–20.
- , ; Guideline Development Group. The prevention, diagnosis and management of delirium in older people: concise guidelines. Clin Med (Lond). 2006;6:303–308.
- , , . Antipsychotics in the treatment of delirium: a systematic review. J Clin Psychiatry. 2007;68:11–21.
- , , , et al. Antipsychotics, other psychotropics, and the risk of death in patients with dementia: number needed to harm. JAMA Psychiatry. 2015;72:438–445.
- , . Safety and efficacy of antipsychotic drugs for the behavioral and psychological symptoms of dementia. Indian J Psychiatry. 2009;51(suppl 1):S87–S92.
- , , , . Use and safety of antipsychotics in behavioral disorders in elderly people with dementia. J Clin Psychopharmacol. 2014;34:109–123.
- , , , , , . From hospital to community: use of antipsychotics in hospitalized elders. J Hosp Med. 2014;9:802–804.
- , , . Comparison of National Death Index and World Wide Web Death Searches. Am J Epidemiol. 2000;152:107–111.
- . Analysis of Binary Data. London, United Kingdom: Methuen; 1970:76–99.
- . Statistical Methods for Survival Data Analysis. New York, NY: John Wiley 1992:233–236.
- , , , . The risk of adverse outcomes in hospitalized older patients in relation to a frailty index based on a comprehensive geriatric assessment. Age Ageing. 2014;43:127–132.
- , , , et al. Risk factors for delirium and inpatient mortality with delirium. J Postgrad Med. 2013;59:263–270.
- , , , , , . Comprehensive geriatric assessment predicts mortality and adverse outcomes in hospitalized older adults. BMC Geriatr. 2014;14:129.
- , , , , , . One‐year mortality of elderly inpatients with delirium, dementia, or depression seen by a consultation‐liaison service. Psychosomatics. 2012;53:433–438.
- , , , . Excess mortality in general hospital patients with delirium: a 5‐year follow‐up of 519 patients seen in psychiatric consultation. J Psychosom Res. 1994;38:339–346.
- , , , et al. Older adults discharged from the hospital with delirium: 1‐year outcomes. J Am Geriatr Soc. 2006;54:1245–1250.
- , , , et al. The dementia antipsychotic withdrawal trial (DART‐AD): long‐term follow‐up of a randomised placebo‐controlled trial. Lancet Neurol. 2009;8:151–157.
- , , , et al. Antipsychotic drug use and mortality in older adults with dementia. Ann Intern Med. 2007;146:775–786.
- , , , et al. Risk of death in elderly users of conventional vs. atypical antipsychotic medications. N Engl J Med. 2005;353:2335–2341.
- , , , et al. The long‐term effects of conventional and atypical antipsychotics in patients with probable Alzheimer's disease. Am J Psychiatry. 2013;170:1051–1058.
- , , , et al. Effectiveness of multicomponent nonpharmacological delirium interventions: a meta‐analysis. JAMA Intern Med. 2015;175:512–520.
- , , , , . Sustainability and scalability of the hospital elder life program at a community hospital. J Am Geriatr Soc. 2011;59:359–365.
- , , , et al. Effectiveness of acute geriatric unit care using acute care for elders components: a systematic review and meta‐analysis. J Am Geriatr Soc. 2012;60:2237–2245.
- , . Adverse effects of antipsychotic medications. Am Fam Physician. 2010;81:617–622.
Delirium, a clinical syndrome characterized by inattention and acute cognitive dysfunction, is very common in older hospitalized patients, with a reported incidence of 18% to 35% at time of admission and overall occurrence rates of 29% to 64%.[1] Previous studies have reported that a diagnosis of delirium is not benign and is associated with other adverse outcomes including prolonged hospitalization, institutionalization, increased cost, and mortality. These outcomes occurred independent of age, prior cognitive functioning, and comorbidities.[2] Guidelines recommend that management of inpatient delirium should be focused on addressing the underlying etiology and managed with nonpharmacological interventions whenever possible.[3, 4, 5] However, implementing these recommendations can prove to be very challenging in hospital settings. Providers frequently have to resort to medical therapies, including antipsychotics (APs). Although these medications are commonly used to treat delirium in elderly patients, there is limited evidence to support their efficacy, and there are currently no proven pharmacological alternatives to these medications.[6] Furthermore, previous studies have demonstrated an increased risk of stroke, infection, cognitive impairment, and mortality in elders with dementia who receive long‐term AP therapy.[7, 8, 9] Yet as many as 48% of hospitalized elders who were newly started on APs had these drugs continued at time of discharge.[10]
There have been few studies describing the long‐term outcomes of elderly patient who are started on APs in the hospital. Most information on outcomes comes from patients with dementia. Therefore, we studied the 1‐year outcomes of a cohort of patients with and without dementia who were started on APs in the hospital and then discharged on these medications. In this cohort, we aimed to describe the number of readmissions, reasons for readmissions, duration of AP therapy, use of other sedating medications such as anxiolytics, hypnotics, and antihistamines as well as the incidence of readmission and death 1 year after the index hospital discharge.
METHODS
We previously described a retrospective cohort of 300 elders (65 years old) admitted to a tertiary care hospital between October 1, 2012 and September 31, 2013 who were newly prescribed APs while hospitalized.[10] Of patients alive at the time of discharge (260), 56% (146 patients) were discharged on APs. Two investigators extracted these 148 patient charts independently to identify and quantify the number of readmissions to the index hospital. We then limited the sample to only the first readmission per patient following the index admission and extracted this readmission for each patient. We first determined if APs were present on the admission medication reconciliation. If APs were not present on admission, we examined whether they were resumed during the hospitalization using the electronic medication administration summary. If they were present on admission, we looked to see if they were discontinued during the readmission and if additional new APs were started during the hospitalizations. We documented the circumstances around APs use and identified patients who died during their hospitalizations. We identified delirium using the same terms that were described in our prior study on the same cohort of patients.[10] We determined if patients were delirious using a predetermined algorithm (Figure 1). Briefly, we first determined delirium was documented. We then examined whether there was a Confusion Assessment Method (CAM) instrument included in the record. If a CAM instrument was not documented, we then looked for documentation using specific terms (eg, disorientation, confusions). We identified patients with dementia by determining whether dementia was documented along with other admission medical comorbidities. If it was not, we determined whether dementia was newly diagnosed during the hospital stay using progress notes or consultation notes. We did not objectively define criteria for diagnosis of dementia. We used the National Death Index (NDI) to determine mortality for all patients 1 year after discharge from the index hospitalization. The NDI is a national database of death records maintained by the National Center for Health Statistics. It has shown consistently high sensitivity and specificity for detection of death.[11]
We used descriptive statistics (means, standard deviations, range, and percents as appropriate to the scale of measurement) to describe the patient sample. We then used multiple logistic regression to identify significant predictors of death within 1 year of discharge.[12] Univariate analysis was used to select candidates for the logistic model (t tests for continuous factors and 2 for discrete factors). All factors with a significance level <0.2 on univariate analysis were included in the logistic regression, in addition to age and sex (regardless of significance). A maximum likelihood procedure was used to calculate the regression coefficients for the logistic model. The likelihood ratio criterion was used to determine the significance of individual factors in the regression model.[13] Factors with a significance level of 0.15 or less were retained in the final model, in addition to age and sex.
RESULTS
The 260 patients discharged alive from their index admissions had a 1‐year mortality rate of 29% (75/260). Of the 146/260 patients discharged on APs, 60 (41%) patients experienced at least 1 readmission (mean = 2 readmissions per patient; range, 18, with 111 total readmissions for 60 patients) within 1 year from discharge (Figure 2). Most common diagnoses at the time of readmissions were related neurological and psychiatric disorders (14%), cardiovascular and circulation disorders (13%), renal injury and electrolyte disorders (11%), and infections (6%). Among patients with at least 1 readmission, the mean age was 81.3 (range, 65.599.7), 60% were male, and 45% were admitted from a skilled nursing facility or rehabilitation facility (Table 1). Median time to readmission was 43.5 days (range, 1343 days), and 79% were readmitted to a medical service. The remaining 20% were admitted to a surgical service. Inpatient mortality during first readmissions was 8% (5/60). At the time of first readmission, 39/60 (65%) of patients were still on the same APs on which they had been discharged, and the APs were continued during the hospitalization in 79% of the patients (61% quetiapine, 19% olanzapine, and 13% risperidone). About half of patients whose APs were discontinued prior to readmission received a new AP during their hospital stays (9/20; 45%). One patient had been started on quetiapine in the outpatient setting. No patients were found to have new benzodiazepines, nonbenzodiazepine hypnotic, or antihistamines on their admission medication list.
| Variables | Value* |
|---|---|
| |
| Age, mean (range), yr | 81.3 (65.599.7) |
| Gender, no. (%) | |
| Male | 36 (60) |
| Female | 24 (40) |
| Admitted from, no. (%) | |
| Home | 33 (55) |
| Rehabilitation facilities | 5 (8) |
| SNF | 22 (37) |
| Services, no. (%) | |
| Medicine | 48 (80) |
| Surgery | 12 (20) |
| Types of APs continued on readmission (from index admission), no. (%) | |
| Quetiapine | 19 (61) |
| Olanzapine | 6 (19) |
| Risperidone | 4 (13) |
| Haloperidol | 2 (7) |
| Types of APs started during readmission, no. (%) | |
| Quetiapine | 7 (39) |
| Risperidone | 2 (11) |
| Haloperidol | 16 (89) |
| Indications for AP use, no. (%) | |
| Delirium | 14 (77) |
| Undocumented | 3 (17) |
| Other | 1 (6) |
| ECG, no. (%) | |
| Prior to APs administration | 17 (94) |
| After APs administration | 4 (22) |
| QTc prolongation >500 ms, no. (%) | |
| Prior to APs administration | 3 (18) |
| After APs administration∥ | 2 (50) |
| Discharge destination, no. (%) | |
| Home | 23 (38) |
| Rehabilitation facilities | 4 (7) |
| SNF | 28 (47) |
| Death | 5 (8) |
Eighteen patients received 1 or more new APs during the readmission hospitalizations. These included haloperidol (89%) and quetiapine (39%). Delirium was the main reported indication for starting APs (78%), but in 17% of cases no indication was documented. An electrocardiogram (ECG) was performed in 94% prior to APs administration and for 22% after APs administration. Corrected QT interval (QTc) of >500 ms was present in 18% of patients in pretreatment ECG and 50% of patients in post‐AP ECG. Of patients who survived readmission, 58% (32/55) were discharged to postacute facilities. Of the 39 patients who were on the same APs from index admission, 27 (69%) patients were eventually discharged on the same APs or new APs started during the readmission.
In the multivariable model (Table 2), predictors of death at 1 year included discharge to postacute facilities after index admission (odds ratio [OR]: 2.28; 95% confidence interval [CI]: 1.10‐4.73, P = 0.03) and QTc prolongation >500 ms during index admission (OR: 3.41; 95% CI: 1.34‐8.67, P = 0.01). Age and gender were not associated with 1‐year mortality.
| Odds Ratio | 95% Confidence Interval | P Value | |
|---|---|---|---|
| |||
| Age | 1.03 | 0.991.06 | 0.13 |
| Male sex | 0.87 | 0.501.52 | 0.63 |
| Risperdal | 3.53 | 0.6419.40 | 0.15 |
| QTc prolongation after AP administration* | 3.41 | 1.348.67 | 0.01 |
| Presence of geriatric psychiatry consult | 0.30 | 0.091.04 | 0.06 |
| Discharged to postacute facilities vs home | 2.28 | 1.104.73 | 0.03 |
DISCUSSION
In a cohort of elderly patients who were discharged on APs, nearly one‐third (29%) died within 1 year of the hospitalization in which APs were initiated. Nearly half of the survivors from the index admission (41%) experienced at least 1 admission within 1 year from discharge. Of readmitted patients, two‐thirds were taking the same APs that had been started during the index hospitalization. Half of the patients not on APs on readmission were started on an AP during the hospitalization, most often because they became delirious on return to the acute care setting. Compared to patients discharged home after an index admission, patients who were discharged to postacute facilities were almost 4 times as likely to die during the year subsequent to the admission. These data suggest that once patients are started on APs, most are continued on them until the next admission or are restarted during that readmission. Moreover, hospitalized elders who require an AP are at high risk for mortality in the coming year.
Prior studies have reported that patients with delirium have elevated 1‐year mortality rates.[14, 15, 16, 17, 18, 19] A secondary analysis of the Delirium Prevention Trial, which included 437 hospitalized older patients, revealed a 1‐year mortality rate of 20% in those who were never delirious during hospitalization, compared to 26% to 38% in patients with delirium.[19] Additionally, 1‐year mortality in hospitalized older patients with delirium (36%) was shown to be higher than patients with dementia (29%) or depression (26%).[17] Unlike these studies, not all of the patients in our study had documented delirium, but all received an AP. Still, it is notable that the 1‐year mortality rate for delirium in general is similar to what we found in this study.
The literature has also reported that long‐term AP use is associated with excess mortality in elder patients, especially those with dementia.[20, 21, 22] In a retrospective cohort study, older patients with dementia who were taking antipsychotics had significantly higher 1‐year mortality rates (23%29%) than patients not taking antipsychotic medications (15%). In a large Canadian propensity score‐matched cohort study that included over 13,000 demented older adults, the mortality was higher in the community‐dwelling elders who received atypical APs compared to no APs, with a difference of 1.1% in 180‐day mortality rate after initiation of APs.[21] The absolute mortality rate was 2.6% higher in patients who received typical compared to atypical APs. Unlike these studies, not every patient in our cohort had a diagnosis of dementia, but again, mortality rates in these studies appear similar to our cohort.
In contrast, other observational studies have not found an increased risk associated with receipt of APs. For example, a prospective study that enrolled approximately 950 patients with probable dementia showed that AP use was not associated with time to death after adjustment for comorbidities, demographic and cognitive variables.[23] These conflicting results highlight the difficulties of attributing outcomes in high‐risk populations. Although the excess mortality observed in patients taking APs may be related to the risks of APs, it is quite possible that patients who require APs (most often for delirium or agitated dementia) are at higher risk of death. This confounding by indication may be nearly impossible to adjust for retrospectively, even using techniques such as propensity matching.
Our report adds to the literature; we know of no studies to date describing a cohort of patients, most with delirium, who were started on APs in the hospital. We also attempted to identify the reasons that patients were started on APs, which have been infrequently reported. As noted above, our 1‐year mortality rate of 29% among older patients prescribed APs in the hospital was quite similar to mortality rates both for patients with delirium who were not necessarily treated with APs and patients with dementia who were treated with APs. This finding further supports the argument that risk factors for mortality, including dementia, delirium, and AP use are very difficult to tease apart. It is possible that the reasons that APs are prescribed (agitated delirium or dementia) have as much to do with the excess mortality reported in observational studies of APs as the use of APs themselves.
The high rate of continued AP use we observed (two‐thirds of readmitted patients) may reflect limited pharmacological alternatives to these medications with little evidence to support treating the symptoms of delirium with other drug classes, along with suboptimal environmental and behavioral modifications in postacute facilities and hospitals. This is unfortunate given that delirium is often preventable. Systematic implementation of well‐documented strategies to decrease delirium in hospitals and postacute facilities would likely reduce the prescription of APs and has the potential to slow the decline in this vulnerable population. A meta‐analysis incorporating both randomized and nonrandomized trials of medical and surgical patients showed that multicomponent nonpharmacologic interventions decreased delirium by 50%.[24] Thus, simple interventions such as reorientation, early mobilization, optimizing vision and hearing, sleepwake cycle preservation, and hydration might avoid roughly 1 million cases of delirium in hospitalized older adults annually.[24] The Hospital Elder Life Program and Acute Care for Elders units are examples of programs that have been shown to decrease the incidence of delirium.[25, 26]
Despite vigorous efforts to prevent delirium, a subgroup of patients still will become delirious. These patients are at high risk for death. Our mortality prediction model revealed that patients who were discharged to postacute facilities were 4 times more likely to die during the subsequent year compared to patients who were discharged home. Patients discharged to postacute facilities are likely to have a higher burden of disease, greater functional and cognitive impairment, and more frailty than those who are able to return to the community. Very ill and/or frail patients receiving APs in the hospital and requiring APs on discharge to postacute care facilities have limited survival and may benefit from expedited palliative care interventions to clarify prognosis and goals, and relieve suffering. At a minimum, our study identifies a need for further study to identify this very high‐risk group of elders. It is notable that 50% of patients were found to have a post‐treatment ECG with a QTc of >500 ms, a finding that has not been previously described. This would put these patients at higher risk of mortality, and as such we suggest that current guidelines should continue to emphasize the importance of post‐treatment ECGs and set clear criteria for discontinuation in elderly patients.
Our study is limited by its retrospective, single‐center design and small sample size, therefore limiting the interpretation and generalizability of the results to other hospitals. Quetiapine was the most common AP medication used in our hospital; therefore, our findings cannot be generalized to hospitals that utilize other AP agents. Future studies should examine antipsychotic use across hospitals to determine variation in prescribing patterns and outcomes. Nevertheless, the care of these patients were transitioned to a large number of geriatricians and primary care and nursing home physicians after discharge, and the reflected practice patterns extended beyond our hospital. Additionally, we were unable to determine when and why APs were discontinued or started in the outpatient setting. We were only able to detect readmissions to the 3 hospitals within our health system and therefore may have missed some readmissions to other institutions, although the majority of patients in our region tend to return to the same hospital. For patients who were not readmitted, we were also unable to identify whether they remained on the APs initiated during their index hospitalizations. Any retrospective study is limited by the difficulty of distinguishing delirium from the behavioral and psychiatric symptoms of dementia, but we identified delirium using standard terms described in previous literature.[10] We were unable to determine the types of delirium (hyperactive vs hypoactive) given that the documentations on behavioral symptoms were largely missing from the charts. The number of patients with preexisting diagnosis of dementia was likely underestimated, as we were only able to verify the diagnosis from the medical history. Additionally, the retrospective design based on chart review limited the factors that we could detect and grade accurately for inclusion in our mortality prediction model. Of note, our model did not contain objective measures of cognition, agitation, function, and markers for frailty such as walking speed, weak grip strength, weight loss, and low physical activity.
CONCLUSION
Initiating an AP (eg, haloperidol, quetiapine, olanzapine, and risperidone) in the hospital is likely to result in long‐term use of these medications despite the fact that AP use has been associated with multiple risks including falls, fractures, stroke, cardiovascular disease, and increased mortality in those with underlying dementia.[27] When possible, behavioral interventions to prevent delirium and slow the trajectory of decline should be implemented to reduce AP use. If patients with delirium are started on antipsychotics, it is important to monitor for prolonged QTc given the associated risk of mortality. In a subgroup of patients at high risk for death in the upcoming year, occurrence of delirium or use of APs during a hospitalization should both be considered triggers for early advance care planning and possibly palliative care and end‐of‐life discussions, with an emphasis on quality of life.
Disclosures: The research was supported by the Department of Medicine, Baystate Medical Center/Tufts University School of Medicine. Dr. Lagu is supported by the National Heart, Lung, and Blood Institute of the National Institutes of Health under award number K01HL114745. Drs. Lagu and Loh had full access to all of the data in the study. They take responsibility for the integrity of the data and the accuracy of the analysis. Drs. Loh, Brennan, Lindenauer, and Lagu conceived of the study. Drs. Loh, Ramdass, and Ms. Garb acquired the data. Ms Garb analyzed and interpreted the data. Drs. Loh, Ramdass, and Thim drafted the manuscript. Drs. Brennan, Lindenauer, and Lagu and Ms. Garb critically reviewed the manuscript for important intellectual content. Dr. Lagu has received consulting fees from the Institute for Healthcare Improvement, under contract to the Centers for Medicare and Medicaid Services, for her work on a project to help health systems achieve disability competence. Dr. Brennan is supported by a Geriatric Work Force Enhancement Grant from the US Department of Health and Human Services award number 1 U1QHP287020100. The authors report no conflicts of interest.
- , , . Delirium in elderly people. Lancet. 2014;383:911–922.
- , , , et al. Adverse outcomes after hospitalization and delirium in persons with Alzheimer disease. Ann Intern Med. 2012;156:848–856, W296.
- American Geriatrics Society Expert Panel on Postoperative Delirium in Older Adults. American Geriatrics Society abstracted clinical practice guideline for postoperative delirium in older adults. J Am Geriatr Soc. 2015;63:142–150.
- Practice guideline for the treatment of patients with delirium. American Psychiatric Association. Am J Psychiatry. 1999;156:1–20.
- , ; Guideline Development Group. The prevention, diagnosis and management of delirium in older people: concise guidelines. Clin Med (Lond). 2006;6:303–308.
- , , . Antipsychotics in the treatment of delirium: a systematic review. J Clin Psychiatry. 2007;68:11–21.
- , , , et al. Antipsychotics, other psychotropics, and the risk of death in patients with dementia: number needed to harm. JAMA Psychiatry. 2015;72:438–445.
- , . Safety and efficacy of antipsychotic drugs for the behavioral and psychological symptoms of dementia. Indian J Psychiatry. 2009;51(suppl 1):S87–S92.
- , , , . Use and safety of antipsychotics in behavioral disorders in elderly people with dementia. J Clin Psychopharmacol. 2014;34:109–123.
- , , , , , . From hospital to community: use of antipsychotics in hospitalized elders. J Hosp Med. 2014;9:802–804.
- , , . Comparison of National Death Index and World Wide Web Death Searches. Am J Epidemiol. 2000;152:107–111.
- . Analysis of Binary Data. London, United Kingdom: Methuen; 1970:76–99.
- . Statistical Methods for Survival Data Analysis. New York, NY: John Wiley 1992:233–236.
- , , , . The risk of adverse outcomes in hospitalized older patients in relation to a frailty index based on a comprehensive geriatric assessment. Age Ageing. 2014;43:127–132.
- , , , et al. Risk factors for delirium and inpatient mortality with delirium. J Postgrad Med. 2013;59:263–270.
- , , , , , . Comprehensive geriatric assessment predicts mortality and adverse outcomes in hospitalized older adults. BMC Geriatr. 2014;14:129.
- , , , , , . One‐year mortality of elderly inpatients with delirium, dementia, or depression seen by a consultation‐liaison service. Psychosomatics. 2012;53:433–438.
- , , , . Excess mortality in general hospital patients with delirium: a 5‐year follow‐up of 519 patients seen in psychiatric consultation. J Psychosom Res. 1994;38:339–346.
- , , , et al. Older adults discharged from the hospital with delirium: 1‐year outcomes. J Am Geriatr Soc. 2006;54:1245–1250.
- , , , et al. The dementia antipsychotic withdrawal trial (DART‐AD): long‐term follow‐up of a randomised placebo‐controlled trial. Lancet Neurol. 2009;8:151–157.
- , , , et al. Antipsychotic drug use and mortality in older adults with dementia. Ann Intern Med. 2007;146:775–786.
- , , , et al. Risk of death in elderly users of conventional vs. atypical antipsychotic medications. N Engl J Med. 2005;353:2335–2341.
- , , , et al. The long‐term effects of conventional and atypical antipsychotics in patients with probable Alzheimer's disease. Am J Psychiatry. 2013;170:1051–1058.
- , , , et al. Effectiveness of multicomponent nonpharmacological delirium interventions: a meta‐analysis. JAMA Intern Med. 2015;175:512–520.
- , , , , . Sustainability and scalability of the hospital elder life program at a community hospital. J Am Geriatr Soc. 2011;59:359–365.
- , , , et al. Effectiveness of acute geriatric unit care using acute care for elders components: a systematic review and meta‐analysis. J Am Geriatr Soc. 2012;60:2237–2245.
- , . Adverse effects of antipsychotic medications. Am Fam Physician. 2010;81:617–622.
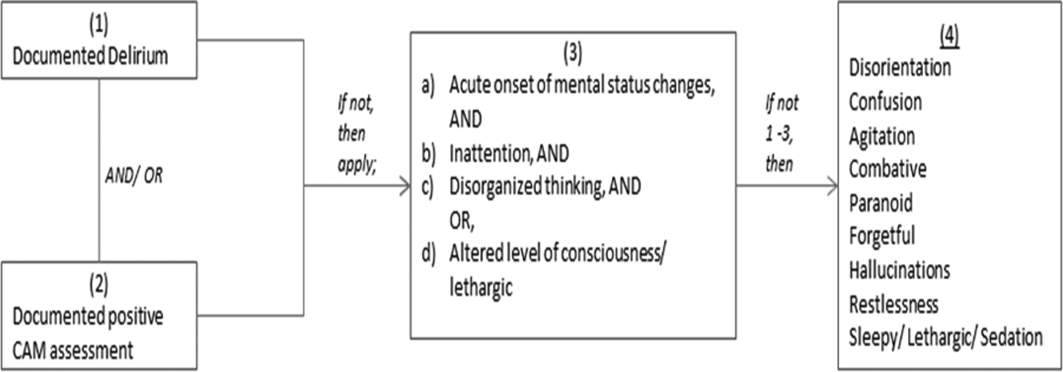
The Current State of PHM Fellowships
Pediatric hospital medicine (PHM) fellowship programs came into existence approximately 20 years ago in Canada,[1] and since that time the number of programs in North America has grown dramatically. The first 3 PHM fellowship programs in the United States were initiated in 2003, and by 2008 there were 7 active programs. Just 5 years later in 2013, there were 20 fellowship programs in existence. Now, in 2015, there are over 30 programs, with several more in development. The goal of postresidency training in PHM is to improve the care of hospitalized children by training future hospitalists to provide high‐quality, evidence‐based clinical care and to generate new knowledge and scholarship in areas such as clinical research, patient safety and quality improvement, medical education, practice management, and patient outcomes.[2] Many pediatric hospitalists want to be able to perform research or quality improvement, but feel that they lack the time, skills, resources, and mentorship to do so.[3] To date, fellowship‐trained hospitalists have a demonstrated track record of contributing to the body of literature that is shaping the care of hospitalized children.[4, 5]
At present, PHM is not a recognized subspecialty of the American Board of Pediatrics (ABP) and therefore does not fall under the purview of the Accreditation Council of Graduate Medical Education (ACGME), leading to concern from some about the variability in depth and breadth of training across programs.[1] The development and publication of the PHM Core Competencies in 2010 helped define the scope of practice of pediatric hospitalists and provide guidelines for training programs, specifically with respect to clinical and nonclinical areas for assessment of competency.[6] Furthermore, studies of early career hospitalists have identified areas for future fellowship curriculum development, such as core procedural skills, quality improvement, and practice management.[7]
In an effort to address training variability across programs, PHM fellowship directors (FDs) have come together as an organized group, first meeting in 2008, with the primary goal of defining training standards and sharing curricular resources. Annual meetings of the FDs, sponsored by the American Academy of Pediatrics Section on Hospital Medicine (AAP‐SOHM), began in 2012. A key objective of this annual meeting has been to develop a standardized fellowship curriculum for use across programs as well as to determine gaps in training that need to be addressed. During this process, we have received input from key stakeholders including community hospitalists, internal medicine‐pediatrics hospitalists, and the PHM Certification Steering Committee, which organized the application for subspecialty certification to the ABP. To inform this process of curriculum standardization, we fielded a survey of PHM fellowship directors. The purpose of this article is to summarize the current curricula, operations, and logistics of PHM fellowship programs.
METHODS
This was a cross‐sectional study of 31 PHM fellowship programs across the United States and Canada in April 2014. Inclusion criteria included all pediatric fellowships that were self‐identified to the AAP‐SOHM as providing a hospital medicine fellowship option. This included both PHM fellowships as well as academic general pediatric fellowships with a hospitalist track. A web‐based survey (SurveyMonkey, Inc.) was distributed by e‐mail to the FDs at the 31 training programs (see Supporting Information in the online version of this article). To enhance content validity of survey responses, survey questions were designed using an iterative consensus process among the authors, who included junior and senior FDs and represented the 2014 annual FD meeting planning committee. Items were created to gather feedback on the following key areas of PHM fellowships: program demographics, types of required and elective clinical rotations, graduate coursework offerings, amount of time spent in clinical activities, fellow billing practices, and description of fellows' research activities. The survey consisted of 30 multiple‐choice and short‐answer questions. Follow‐up e‐mail reminders were sent to all FDs 2 weeks and 4 weeks after the initial request was sent. Survey completion was voluntary, and no incentives were offered. The study was determined to be exempt by the Stanford University Institutional Review Board. Data were summarized using frequency distributions. No subgroup comparisons were made.
RESULTS
Program directors from 27/31 (87%) PHM fellowship programs responded to the survey; 25 were active programs, and 2 were under development. Responding programs represented all 4 major regions of the country and Canada, with varying program initiation dates, ranging from 1997 to 2013.
Program Demographics
The duration of most programs (17/27) was 2 years (63%), with 6 (22%) 1‐year programs and 4 (15%) 3‐year programs making up the remainder. Four programs described variable lengths, which could be tailored based on the fellow's individual interest. Two of the programs are 2 years in length, but offer a 1‐year option for fellows who wish to focus on enhancing clinical skills without an academic focus. The other 2 programs are 2 years in length, but will offer an extension to a third year for those pursuing a graduate degree.
Fellow Clinical Activities
The average amount of total clinical time (weeks on service) across responding programs was 50% (range, 20%65%). When looking specifically at time on the inpatient general pediatric service, number of weeks varied by year of training and by institution, with 12 to 41 weeks in the first year of fellowship, 6 to 41 weeks in the second year of fellowship, and 6 to 28 weeks in the third year of fellowship (Figure 1). Though the range is large, on average, fellows spend 17 weeks on inpatient general pediatrics service during each year of training. Of note, the median number of weeks on inpatient general pediatrics service by year of training was 15 weeks, 16 weeks, and 16.5 weeks, respectively. In addition to inpatient general pediatrics service time, most programs require other clinical rotations, with sedation, complex care, and inpatient pediatrics at community sites being the most frequent (Figure 2). Of the 6 responding 1‐year programs, 5 (83%) allow fellows to bill/generate clinical revenue at some point during their training. Of the 15 responding 2‐year programs, 11 (73%) allow fellows to bill/generate clinical revenue at some point during their training. Of the 4 responding 3‐year programs, 2 (50%) allow their fellows to bill/generate clinical revenue at some point during their training.
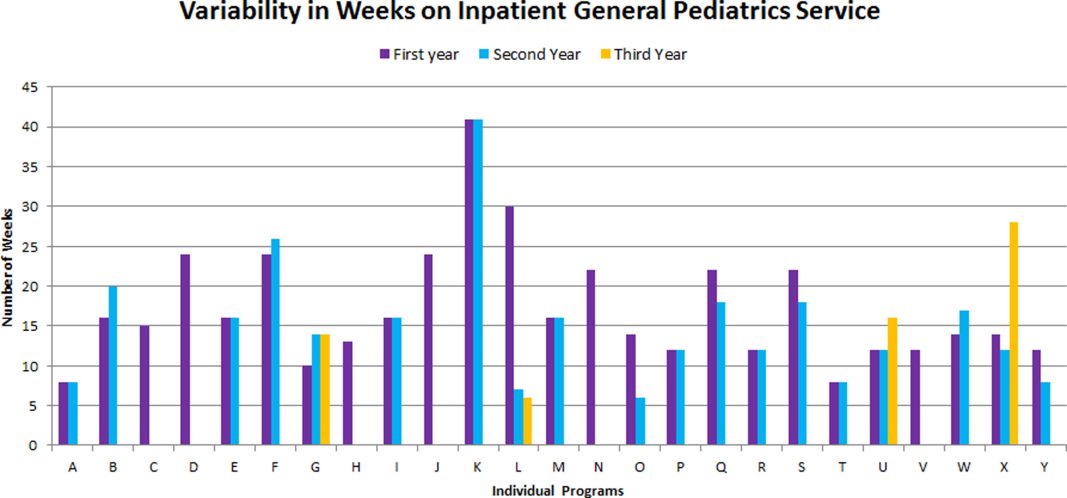
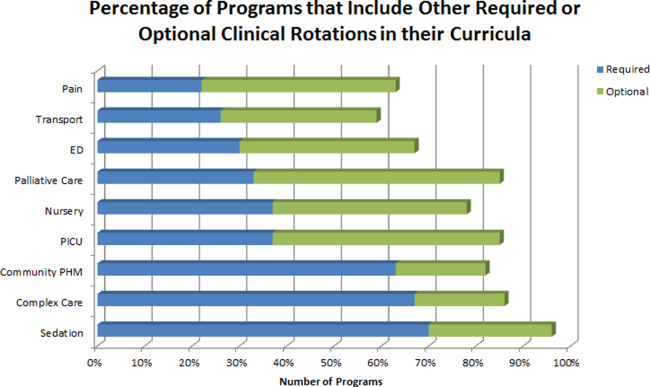
Fellow Scholarly Activities
With respect to time dedicated to research, the majority of programs offer coursework such as courses for credit, noncredit courses, or certificate courses. In addition, 11 programs offer fellows a masters' degree in areas including public health, clinical science, epidemiology, education, academic sciences, healthcare quality, clinical and translational research, or health services administration. The majority of these degrees are paid for by departmental funds, with tuition reimbursement, university support, training grants, and personal funds making up the remainder. Twenty‐one (81%) programs provide a scholarship oversight committee for their fellows. Current fellows' (n = 63) primary areas of research are varied and include clinical research (36%), quality‐improvement research (22%), medical education research (20%), health services research (16%), and other areas (6%).
DISCUSSION
This is the most comprehensive description of pediatric hospital medicine fellowship curricula to date. Understanding the scope of these programs is an important first step in developing a standardized curriculum that can be used by all. The results of this survey indicate that although there is variability among PHM fellowship curricular content, several common themes exist.
The number of clinical weeks on the inpatient general pediatrics service varied from program to program, though the majority of programs require fellows to spend 15 to 16 weeks each year of training. The variability may be due in part to the way in which respondents defined the term week on clinical service. For example, if the fellow is primarily on a shift schedule, then he/she may only work 2 to 3 shifts in 1 week, which may have been viewed similarly to daily presence on a more traditional inpatient teaching service with 5 to 7 consecutive days of service. The current study did not explore the details of inpatient general pediatric clinical activities or exposure to opportunities to hone procedural skills, areas that are worth investigating as we move forward to better understand the needs of trainees.
Most residency training programs in general pediatrics require a significant amount of inpatient clinical time, specifically a minimum of 10 units or months, though only half of this time is required to be in inpatient general pediatrics.[8] Although nonfellowship trained early career hospitalists may feel adequately prepared to manage the clinical care of some hospitalized children, perceived competency is significantly lower than their fellowship‐trained colleagues with regard to care of the child with medical complexity and technology‐dependence, and with regard to provision of sedation for procedures.[7] The majority of FDs surveyed in our study indicated that additional clinical experience with sedation, complex care, and inpatient pediatrics at community sites were required of their fellows. Of note, many of these rotations are not commonly required in pediatric residency training programs; however, the PHM core competencies suggest that hospitalists should demonstrate proficiency in these areas to provide optimal care for hospitalized children. Our results suggest that current PHM fellowship curricula help address these clinical gaps. The requirement of these particular specialized experiences may reflect the clinical scope of practice that is expected from potential employers or may be related to staffing needs. It is well documented that the inpatient demographic of large pediatric tertiary care referral centers has changed over the past decade, with an increasing prevalence of children with medical complexity.[9, 10] In both tertiary referral centers and community hospitals, the expansion of the role of the hospitalist in providing specialized clinical services, such as sedation or surgical comanagement, has been significantly driven by financial factors, though a more recent focus on improvement of efficiency and quality of care within the hospital system has relied heavily on hospitalist input.[11, 12, 13] Important next steps in curriculum standardization include ensuring that training programs allow for adequate clinical exposure and proper assessment of competency in these areas, and determining the full complement of clinical training experiences that will produce hospitalists with a well‐defined scope of practice that adequately addresses the needs of hospitalized children.
Most fellowship‐trained hospitalists work primarily in university‐affiliated institutions with expectations for scholarly productivity.[5, 7] Fellowship‐trained hospitalists have made large contributions to the growing body of PHM literature, specifically in the realms of medical education, healthcare quality, clinical pediatrics, and healthcare outcomes.[4] Many PHM fellowship‐trained hospitalists have educational or administrative leadership roles.[2] Our results indicate that current PHM fellows continue to be active in a variety of research activities. In addition, FDs reported that the vast majority of programs included scholarship oversight committees, which ensure a mentored and structured research experience. Finally, most programs require or offer additional coursework, and many programs with university affiliations allow for attainment of graduate degrees. Inclusion of robust research training and infrastructure in all programs is a paramount goal of PHM fellowship training. This will allow graduates to be successful researchers, generating new knowledge and supporting the provision of high‐quality, evidence‐based, and value‐driven care for hospitalized children.
A unique feature of several PHM fellowship programs is that fellows are allowed to bill for clinical encounters. Many programs rely on clinical revenue to support fellow salaries.[14] For some programs, a portion of this clinical revenue comes from fellows billing for clinical encounters.[15] Programs that allow fellows to bill/generate clinical revenue have fellows working in attending roles without direct supervision, whereas nonbilling fellows have direct supervision by an attending.[15] In the current ABP training model, subspecialty fellows cannot independently bill for clinical encounters within their own subspecialty, though they can moonlight as long as they meet the duty hour requirements set forth by the ACGME.[16] FDs will need to consider the impact of this requirement on fellow autonomy and on financial revenue for funding fellow salaries if the field achieves ABP subspecialty status.
Regardless of whether or not PHM becomes a designated subspecialty of the ABP, FDs will continue to work together to develop a standard core curriculum that incorporates elements of clinical and nonclinical training to ensure that graduates not only provide high‐quality care for hospitalized children, but also generate new knowledge that advances the field in care delivery and quality of care in any setting. The results of this study will not only help to inform curriculum standardization, but also assessment and evaluation methods. Currently, PHM FDs meet annually and are nearing consensus on a standard 2‐year curriculum based on the PHM Core Competencies that incorporates core clinical, systems, and scholarly domains. We continue to solicit the input of stakeholders, including new FDs, community hospitalist leaders, internal medicine‐pediatrics hospitalist leaders, the Joint Council of Pediatric Hospital Medicine, and leaders of national organizations, such as the American Academy of Pediatrics, Academic Pediatrics Association, and Society of Hospital Medicine. Additional work around standardizing the fellowship application and recruitment process has resulted in our recent acceptance into the Fall Subspecialty Match through the National Residency Match Program, as well as development and implementation of a common fellowship application form. The FD group has recently formalized, voting into place an executive steering committee, which is responsible for the development and execution of long‐term goals that include finalizing a standardized curriculum, refining program and fellow assessment methods through critical evaluation of fellow metrics and outcomes, and standardization of evaluation methods.
Adopting a standard 2‐year curriculum may affect some programs, specifically those that are currently 1 year in duration. These programs would need to extend the length of their fellowship to allow for the breadth of experiences expected with a standardized 2‐year curriculum. This could result in significant financial challenges, effectively increasing the cost to administer the program. In addition, at present, programs have the flexibility to highlight individual areas of strength to attract candidates, allowing fellows to gain an in‐depth experience in domains such as clinical research, quality improvement, medical education, or health services research. With a standardized curriculum, some programs may have to assemble specific clinical and nonclinical experiences to meet the agreed‐upon expectations for PHM fellowship training. If these resources are not available, programs may need to seek relationships with other institutions to complete their offerings, a possibility that is being actively explored by this group. FDs continue to work with each other to share resources, identify training opportunities, and partner with each other to ensure that the requirements of a standard curriculum can be met.
This study has several limitations. First, it was a voluntary survey of program directors, and though we captured over 80% of programs at the time of the survey, there are currently more programs that have come into existence and more still that are in the development stage, leading to potential sampling error. Second, variable effort or accuracy by participants may have led to some degree of response error, such as content error or nonreporting error. Third, the survey questions focused on high‐level information, making it difficult to make nuanced comparisons between curricular elements or determine best curricular practice. In addition, this survey did not explore medical education and quality improvement activities of fellows, 2 major areas in which hospitalists play a major role in the inpatient setting.[1, 17, 18, 19, 20]
CONCLUSION
PHM fellowship programs have grown and continue to grow at a rapid rate. Variability in training is evident, both in clinical experiences and research experiences, though several common elements were identified in this study. The majority of programs are 2 years, and clinical experience comprises approximately 50% of training time, often including key rotations such as sedation, complex care, and rotations at community hospitals. Future directions include standardizing clinical training and expectations for scholarship, formulating appropriate methods for assessment of competency that can be used across programs, and seeking sustainable sources of funding.
Disclosure
Nothing to report.
- , . Characteristics of pediatric hospital medicine fellowships and training programs. J Hosp Med. 2009;4(3):157–163.
- , . Pediatric hospitalists in medical education: current roles and future directions. Curr Probl Pediatr Adolesc Health Care. 2012;42(5):120–126.
- , , . Research needs of pediatric hospitalists. Hosp Pediatr. 2011;1(1):38–44.
- , , , . Pediatric hospital medicine fellowships: outcomes and future directions. Paper presented at: Pediatric Hospital Medicine 2014; July 26, 2014; Orlando, FL.
- , , . Pediatric hospitalist research productivity: predictors of success at presenting abstracts and publishing peer‐reviewed manuscripts among pediatric hospitalists. Hosp Pediatr. 2012;2(3):149–160.
- , , . Pediatric hospital medicine core competencies: development and methodology. J Hosp Med. 2010;5:339–343.
- , , , . Perceived core competency achievements of fellowship and non‐fellowship early career pediatric hospitalists. J Hosp Med. 2015;10(6):373–389.
- Accreditation Council of Graduate Medical Education. ACGME program requirements for graduate medical education in pediatrics. Available at: https://www.acgme.org/acgmeweb/Portals/0/PFAssets/2013‐PR‐FAQ‐PIF/320_pediatrics_07012013.pdf. Published September 30, 2012. Accessed July 7, 2015.
- , , , , , . Increasing prevalence of medically complex children in US hospitals. Pediatrics. 2010;126(4):638–646.
- , , , et al. Children with complex chronic conditions in inpatient hospital settings in the United States. Pediatrics. 2010;126(4):647–655.
- , . The expanding role of hospitalists in the United States. Swiss Med Wkly. 2006;136:591–596.
- , , , , , . Pediatric hospitalist comanagement of spinal fusion surgery patients. J Hosp Med. 2007;2(1):23–30.
- , , , , . Development of a pediatric hospitalist sedation service: training and implementation. J Hosp Med. 2012;7(4):335–339.
- , . Sources of funding and support for pediatric hospital medicine fellowship programs. Poster presented at: Pediatric Hospital Medicine 2014; July 27, 2014; Orlando, FL.
- Council of Pediatric Hospital Medicine Fellowship Directors. Pediatric Hospital Medicine Fellowship Directors Annual Meeting: funding and return on investment. July 24, 2014.
- Accreditation Council of Graduate Medical Education. Frequently asked questions: ACGME common duty hour requirements. Available at: https://www.acgme.org/acgmeweb/Portals/0/PDFs/dh‐faqs2011.pdf. Updated June 18, 2014. Accessed July 7, 2015.
- , . Pediatric hospitalists: training, current practice and career goals. J Hosp Med. 2009;4(3):179–186.
- , . The hospitalist movement and its implications for the care of hospitalized children. Pediatrics. 1999;103:473–477.
- . Pediatric hospitalists and medical education. Pediatr Ann. 2014;43(7):e151–e156
- , , , et al. Quality improvement research in pediatric hospital medicine and the role of the Pediatric Research in Inpatient Settings (PRIS) network. Acad Pediatr. 2013;13(6):S54–S60.
Pediatric hospital medicine (PHM) fellowship programs came into existence approximately 20 years ago in Canada,[1] and since that time the number of programs in North America has grown dramatically. The first 3 PHM fellowship programs in the United States were initiated in 2003, and by 2008 there were 7 active programs. Just 5 years later in 2013, there were 20 fellowship programs in existence. Now, in 2015, there are over 30 programs, with several more in development. The goal of postresidency training in PHM is to improve the care of hospitalized children by training future hospitalists to provide high‐quality, evidence‐based clinical care and to generate new knowledge and scholarship in areas such as clinical research, patient safety and quality improvement, medical education, practice management, and patient outcomes.[2] Many pediatric hospitalists want to be able to perform research or quality improvement, but feel that they lack the time, skills, resources, and mentorship to do so.[3] To date, fellowship‐trained hospitalists have a demonstrated track record of contributing to the body of literature that is shaping the care of hospitalized children.[4, 5]
At present, PHM is not a recognized subspecialty of the American Board of Pediatrics (ABP) and therefore does not fall under the purview of the Accreditation Council of Graduate Medical Education (ACGME), leading to concern from some about the variability in depth and breadth of training across programs.[1] The development and publication of the PHM Core Competencies in 2010 helped define the scope of practice of pediatric hospitalists and provide guidelines for training programs, specifically with respect to clinical and nonclinical areas for assessment of competency.[6] Furthermore, studies of early career hospitalists have identified areas for future fellowship curriculum development, such as core procedural skills, quality improvement, and practice management.[7]
In an effort to address training variability across programs, PHM fellowship directors (FDs) have come together as an organized group, first meeting in 2008, with the primary goal of defining training standards and sharing curricular resources. Annual meetings of the FDs, sponsored by the American Academy of Pediatrics Section on Hospital Medicine (AAP‐SOHM), began in 2012. A key objective of this annual meeting has been to develop a standardized fellowship curriculum for use across programs as well as to determine gaps in training that need to be addressed. During this process, we have received input from key stakeholders including community hospitalists, internal medicine‐pediatrics hospitalists, and the PHM Certification Steering Committee, which organized the application for subspecialty certification to the ABP. To inform this process of curriculum standardization, we fielded a survey of PHM fellowship directors. The purpose of this article is to summarize the current curricula, operations, and logistics of PHM fellowship programs.
METHODS
This was a cross‐sectional study of 31 PHM fellowship programs across the United States and Canada in April 2014. Inclusion criteria included all pediatric fellowships that were self‐identified to the AAP‐SOHM as providing a hospital medicine fellowship option. This included both PHM fellowships as well as academic general pediatric fellowships with a hospitalist track. A web‐based survey (SurveyMonkey, Inc.) was distributed by e‐mail to the FDs at the 31 training programs (see Supporting Information in the online version of this article). To enhance content validity of survey responses, survey questions were designed using an iterative consensus process among the authors, who included junior and senior FDs and represented the 2014 annual FD meeting planning committee. Items were created to gather feedback on the following key areas of PHM fellowships: program demographics, types of required and elective clinical rotations, graduate coursework offerings, amount of time spent in clinical activities, fellow billing practices, and description of fellows' research activities. The survey consisted of 30 multiple‐choice and short‐answer questions. Follow‐up e‐mail reminders were sent to all FDs 2 weeks and 4 weeks after the initial request was sent. Survey completion was voluntary, and no incentives were offered. The study was determined to be exempt by the Stanford University Institutional Review Board. Data were summarized using frequency distributions. No subgroup comparisons were made.
RESULTS
Program directors from 27/31 (87%) PHM fellowship programs responded to the survey; 25 were active programs, and 2 were under development. Responding programs represented all 4 major regions of the country and Canada, with varying program initiation dates, ranging from 1997 to 2013.
Program Demographics
The duration of most programs (17/27) was 2 years (63%), with 6 (22%) 1‐year programs and 4 (15%) 3‐year programs making up the remainder. Four programs described variable lengths, which could be tailored based on the fellow's individual interest. Two of the programs are 2 years in length, but offer a 1‐year option for fellows who wish to focus on enhancing clinical skills without an academic focus. The other 2 programs are 2 years in length, but will offer an extension to a third year for those pursuing a graduate degree.
Fellow Clinical Activities
The average amount of total clinical time (weeks on service) across responding programs was 50% (range, 20%65%). When looking specifically at time on the inpatient general pediatric service, number of weeks varied by year of training and by institution, with 12 to 41 weeks in the first year of fellowship, 6 to 41 weeks in the second year of fellowship, and 6 to 28 weeks in the third year of fellowship (Figure 1). Though the range is large, on average, fellows spend 17 weeks on inpatient general pediatrics service during each year of training. Of note, the median number of weeks on inpatient general pediatrics service by year of training was 15 weeks, 16 weeks, and 16.5 weeks, respectively. In addition to inpatient general pediatrics service time, most programs require other clinical rotations, with sedation, complex care, and inpatient pediatrics at community sites being the most frequent (Figure 2). Of the 6 responding 1‐year programs, 5 (83%) allow fellows to bill/generate clinical revenue at some point during their training. Of the 15 responding 2‐year programs, 11 (73%) allow fellows to bill/generate clinical revenue at some point during their training. Of the 4 responding 3‐year programs, 2 (50%) allow their fellows to bill/generate clinical revenue at some point during their training.
Fellow Scholarly Activities
With respect to time dedicated to research, the majority of programs offer coursework such as courses for credit, noncredit courses, or certificate courses. In addition, 11 programs offer fellows a masters' degree in areas including public health, clinical science, epidemiology, education, academic sciences, healthcare quality, clinical and translational research, or health services administration. The majority of these degrees are paid for by departmental funds, with tuition reimbursement, university support, training grants, and personal funds making up the remainder. Twenty‐one (81%) programs provide a scholarship oversight committee for their fellows. Current fellows' (n = 63) primary areas of research are varied and include clinical research (36%), quality‐improvement research (22%), medical education research (20%), health services research (16%), and other areas (6%).
DISCUSSION
This is the most comprehensive description of pediatric hospital medicine fellowship curricula to date. Understanding the scope of these programs is an important first step in developing a standardized curriculum that can be used by all. The results of this survey indicate that although there is variability among PHM fellowship curricular content, several common themes exist.
The number of clinical weeks on the inpatient general pediatrics service varied from program to program, though the majority of programs require fellows to spend 15 to 16 weeks each year of training. The variability may be due in part to the way in which respondents defined the term week on clinical service. For example, if the fellow is primarily on a shift schedule, then he/she may only work 2 to 3 shifts in 1 week, which may have been viewed similarly to daily presence on a more traditional inpatient teaching service with 5 to 7 consecutive days of service. The current study did not explore the details of inpatient general pediatric clinical activities or exposure to opportunities to hone procedural skills, areas that are worth investigating as we move forward to better understand the needs of trainees.
Most residency training programs in general pediatrics require a significant amount of inpatient clinical time, specifically a minimum of 10 units or months, though only half of this time is required to be in inpatient general pediatrics.[8] Although nonfellowship trained early career hospitalists may feel adequately prepared to manage the clinical care of some hospitalized children, perceived competency is significantly lower than their fellowship‐trained colleagues with regard to care of the child with medical complexity and technology‐dependence, and with regard to provision of sedation for procedures.[7] The majority of FDs surveyed in our study indicated that additional clinical experience with sedation, complex care, and inpatient pediatrics at community sites were required of their fellows. Of note, many of these rotations are not commonly required in pediatric residency training programs; however, the PHM core competencies suggest that hospitalists should demonstrate proficiency in these areas to provide optimal care for hospitalized children. Our results suggest that current PHM fellowship curricula help address these clinical gaps. The requirement of these particular specialized experiences may reflect the clinical scope of practice that is expected from potential employers or may be related to staffing needs. It is well documented that the inpatient demographic of large pediatric tertiary care referral centers has changed over the past decade, with an increasing prevalence of children with medical complexity.[9, 10] In both tertiary referral centers and community hospitals, the expansion of the role of the hospitalist in providing specialized clinical services, such as sedation or surgical comanagement, has been significantly driven by financial factors, though a more recent focus on improvement of efficiency and quality of care within the hospital system has relied heavily on hospitalist input.[11, 12, 13] Important next steps in curriculum standardization include ensuring that training programs allow for adequate clinical exposure and proper assessment of competency in these areas, and determining the full complement of clinical training experiences that will produce hospitalists with a well‐defined scope of practice that adequately addresses the needs of hospitalized children.
Most fellowship‐trained hospitalists work primarily in university‐affiliated institutions with expectations for scholarly productivity.[5, 7] Fellowship‐trained hospitalists have made large contributions to the growing body of PHM literature, specifically in the realms of medical education, healthcare quality, clinical pediatrics, and healthcare outcomes.[4] Many PHM fellowship‐trained hospitalists have educational or administrative leadership roles.[2] Our results indicate that current PHM fellows continue to be active in a variety of research activities. In addition, FDs reported that the vast majority of programs included scholarship oversight committees, which ensure a mentored and structured research experience. Finally, most programs require or offer additional coursework, and many programs with university affiliations allow for attainment of graduate degrees. Inclusion of robust research training and infrastructure in all programs is a paramount goal of PHM fellowship training. This will allow graduates to be successful researchers, generating new knowledge and supporting the provision of high‐quality, evidence‐based, and value‐driven care for hospitalized children.
A unique feature of several PHM fellowship programs is that fellows are allowed to bill for clinical encounters. Many programs rely on clinical revenue to support fellow salaries.[14] For some programs, a portion of this clinical revenue comes from fellows billing for clinical encounters.[15] Programs that allow fellows to bill/generate clinical revenue have fellows working in attending roles without direct supervision, whereas nonbilling fellows have direct supervision by an attending.[15] In the current ABP training model, subspecialty fellows cannot independently bill for clinical encounters within their own subspecialty, though they can moonlight as long as they meet the duty hour requirements set forth by the ACGME.[16] FDs will need to consider the impact of this requirement on fellow autonomy and on financial revenue for funding fellow salaries if the field achieves ABP subspecialty status.
Regardless of whether or not PHM becomes a designated subspecialty of the ABP, FDs will continue to work together to develop a standard core curriculum that incorporates elements of clinical and nonclinical training to ensure that graduates not only provide high‐quality care for hospitalized children, but also generate new knowledge that advances the field in care delivery and quality of care in any setting. The results of this study will not only help to inform curriculum standardization, but also assessment and evaluation methods. Currently, PHM FDs meet annually and are nearing consensus on a standard 2‐year curriculum based on the PHM Core Competencies that incorporates core clinical, systems, and scholarly domains. We continue to solicit the input of stakeholders, including new FDs, community hospitalist leaders, internal medicine‐pediatrics hospitalist leaders, the Joint Council of Pediatric Hospital Medicine, and leaders of national organizations, such as the American Academy of Pediatrics, Academic Pediatrics Association, and Society of Hospital Medicine. Additional work around standardizing the fellowship application and recruitment process has resulted in our recent acceptance into the Fall Subspecialty Match through the National Residency Match Program, as well as development and implementation of a common fellowship application form. The FD group has recently formalized, voting into place an executive steering committee, which is responsible for the development and execution of long‐term goals that include finalizing a standardized curriculum, refining program and fellow assessment methods through critical evaluation of fellow metrics and outcomes, and standardization of evaluation methods.
Adopting a standard 2‐year curriculum may affect some programs, specifically those that are currently 1 year in duration. These programs would need to extend the length of their fellowship to allow for the breadth of experiences expected with a standardized 2‐year curriculum. This could result in significant financial challenges, effectively increasing the cost to administer the program. In addition, at present, programs have the flexibility to highlight individual areas of strength to attract candidates, allowing fellows to gain an in‐depth experience in domains such as clinical research, quality improvement, medical education, or health services research. With a standardized curriculum, some programs may have to assemble specific clinical and nonclinical experiences to meet the agreed‐upon expectations for PHM fellowship training. If these resources are not available, programs may need to seek relationships with other institutions to complete their offerings, a possibility that is being actively explored by this group. FDs continue to work with each other to share resources, identify training opportunities, and partner with each other to ensure that the requirements of a standard curriculum can be met.
This study has several limitations. First, it was a voluntary survey of program directors, and though we captured over 80% of programs at the time of the survey, there are currently more programs that have come into existence and more still that are in the development stage, leading to potential sampling error. Second, variable effort or accuracy by participants may have led to some degree of response error, such as content error or nonreporting error. Third, the survey questions focused on high‐level information, making it difficult to make nuanced comparisons between curricular elements or determine best curricular practice. In addition, this survey did not explore medical education and quality improvement activities of fellows, 2 major areas in which hospitalists play a major role in the inpatient setting.[1, 17, 18, 19, 20]
CONCLUSION
PHM fellowship programs have grown and continue to grow at a rapid rate. Variability in training is evident, both in clinical experiences and research experiences, though several common elements were identified in this study. The majority of programs are 2 years, and clinical experience comprises approximately 50% of training time, often including key rotations such as sedation, complex care, and rotations at community hospitals. Future directions include standardizing clinical training and expectations for scholarship, formulating appropriate methods for assessment of competency that can be used across programs, and seeking sustainable sources of funding.
Disclosure
Nothing to report.
- , . Characteristics of pediatric hospital medicine fellowships and training programs. J Hosp Med. 2009;4(3):157–163.
- , . Pediatric hospitalists in medical education: current roles and future directions. Curr Probl Pediatr Adolesc Health Care. 2012;42(5):120–126.
- , , . Research needs of pediatric hospitalists. Hosp Pediatr. 2011;1(1):38–44.
- , , , . Pediatric hospital medicine fellowships: outcomes and future directions. Paper presented at: Pediatric Hospital Medicine 2014; July 26, 2014; Orlando, FL.
- , , . Pediatric hospitalist research productivity: predictors of success at presenting abstracts and publishing peer‐reviewed manuscripts among pediatric hospitalists. Hosp Pediatr. 2012;2(3):149–160.
- , , . Pediatric hospital medicine core competencies: development and methodology. J Hosp Med. 2010;5:339–343.
- , , , . Perceived core competency achievements of fellowship and non‐fellowship early career pediatric hospitalists. J Hosp Med. 2015;10(6):373–389.
- Accreditation Council of Graduate Medical Education. ACGME program requirements for graduate medical education in pediatrics. Available at: https://www.acgme.org/acgmeweb/Portals/0/PFAssets/2013‐PR‐FAQ‐PIF/320_pediatrics_07012013.pdf. Published September 30, 2012. Accessed July 7, 2015.
- , , , , , . Increasing prevalence of medically complex children in US hospitals. Pediatrics. 2010;126(4):638–646.
- , , , et al. Children with complex chronic conditions in inpatient hospital settings in the United States. Pediatrics. 2010;126(4):647–655.
- , . The expanding role of hospitalists in the United States. Swiss Med Wkly. 2006;136:591–596.
- , , , , , . Pediatric hospitalist comanagement of spinal fusion surgery patients. J Hosp Med. 2007;2(1):23–30.
- , , , , . Development of a pediatric hospitalist sedation service: training and implementation. J Hosp Med. 2012;7(4):335–339.
- , . Sources of funding and support for pediatric hospital medicine fellowship programs. Poster presented at: Pediatric Hospital Medicine 2014; July 27, 2014; Orlando, FL.
- Council of Pediatric Hospital Medicine Fellowship Directors. Pediatric Hospital Medicine Fellowship Directors Annual Meeting: funding and return on investment. July 24, 2014.
- Accreditation Council of Graduate Medical Education. Frequently asked questions: ACGME common duty hour requirements. Available at: https://www.acgme.org/acgmeweb/Portals/0/PDFs/dh‐faqs2011.pdf. Updated June 18, 2014. Accessed July 7, 2015.
- , . Pediatric hospitalists: training, current practice and career goals. J Hosp Med. 2009;4(3):179–186.
- , . The hospitalist movement and its implications for the care of hospitalized children. Pediatrics. 1999;103:473–477.
- . Pediatric hospitalists and medical education. Pediatr Ann. 2014;43(7):e151–e156
- , , , et al. Quality improvement research in pediatric hospital medicine and the role of the Pediatric Research in Inpatient Settings (PRIS) network. Acad Pediatr. 2013;13(6):S54–S60.
© 2016 Society of Hospital Medicine

AMI and Heavy Drinking
Moderate alcohol consumption has been associated with lower risk of coronary heart disease death.[1, 2, 3] This benefit has been shown across all age groups, both sexes, in low‐risk patients (without prior cardiovascular disease [CVD], diabetics and even in patients with established CVD.[3, 4, 5, 6, 7, 8, 9, 10, 11, 12] The relationship between the dose of alcohol and total mortality has been depicted in many observational studies as a J‐shaped curve, attributed to a combined effect of both benefits and harms.[3, 4, 13] Unlike moderate drinking, heavy drinking and particularly binge drinking may have net negative cardiovascular effects. For example, higher levels of intake of alcohol were associated with increased mortality in men with previous myocardial infarction,[14] whereas some reports suggest a continued beneficial association with acute myocardial infarction (AMI).[15, 16, 17] In other studies, the association between AMI and binge or chronic heavy drinking is inconsistent or lacks enough power to report the risk/benefit estimates.[3] Data are sparse on the effects of alcoholism on outcomes in patients hospitalized due to an AMI. Therefore, we sought to investigate the prevalence and association of alcohol‐related diagnoses with in‐hospital mortality in patients presenting with AMI in the United States.
METHODS
This study was a cross‐sectional analysis of the 2011 Nationwide Inpatient Sample (NIS). The NIS is a publicly available deidentified database of hospital discharges in the United States.[18] It contains data from approximately 8 million hospital stays that were selected using a complex probability sampling design and weighting scheme intended to represent all discharges from nonfederal hospitals in the United States. Each record includes 1 primary diagnosis and up to 24 secondary diagnoses.
Analysis was conducted for all patients aged 21 years and greater with a primary discharge diagnosis of AMI based on International Classification of Diseases, 9th Revision (ICD‐9) codes. ST‐elevation myocardial infarction (STEMI) and nonST‐elevation myocardial infarction (NSTEMI) were recorded when the principal diagnosis included the appropriate ICD‐9 codes (see Supporting Table 1 in the online version of this article). Alcohol‐related diagnosis was categorized as the presence of alcohol use disorders or other chronic conditions caused by heavy drinking such as alcoholic cardiomyopathy and alcoholic liver disease among others. Variables reflecting acute effects and chronic effects of alcohol use were created for analytic purposes. Acute effects that increase the risk for acute withdrawal syndrome and hemodynamic instability (and may thereby effect mortality) were characterized by alcohol withdrawal, acute alcoholic hepatitis, alcoholic gastritis, or acute alcohol intoxication. Chronic effects of alcohol were characterized by alcohol dependence, alcoholic polyneuropathy, alcoholic cardiomyopathy, or alcoholic liver damage other than acute hepatitis. A number of comorbidities were generated from ICD‐9 codes including smoking, chronic liver disease, peripheral vascular disease, hypertension, diabetes, renal failure, drug abuse, arrhythmia, and gastrointestinal bleeding using Clinical Classification Software codes provided by the Healthcare Cost and Utilization Project, Agency for Healthcare Research and Quality[19] (see Supporting Table 1 in the online version of this article).
The risk for alcohol‐related diagnoses in AMI patients adjusting for age and sex was estimated using all adult discharge records. All other analyses included only AMI discharges. The principal outcome measure was in‐hospital mortality. Secondary outcomes included having a cardiac procedure (diagnostic catheterization, percutaneous coronary angioplasty, or coronary bypass grafting), and length of stay.
All statistical analyses were performed using Statistical Analysis Software version 9.4 (SAS Inc., Cary, NC). Logistic regression methods appropriate for the NIS sample design were utilized to predict AMI mortality risk associated with alcohol‐related diagnoses (overall and separately for acute and chronic alcohol‐related diagnoses). Mortality risk was evaluated in all AMI discharges and again for STEMI and NSTEMI discharges. To control for factors frequently associated with alcoholism, adjustment was made for age, sex, liver disease, hypertension, diabetes, renal failure, peripheral vascular disease, arrhythmias, drug abuse, gastrointestinal bleed, and smoking. For secondary outcomes, odds ratios were calculated for having a cardiac procedure performed during the hospital admission and length of stay above the median.
RESULTS
Table 1 lists characteristics of AMI patients stratified by in‐hospital mortality. In 2011, AMI accounted for 610,963 (1.9%) of overall adult hospital admissions, with an in‐hospital mortality of 5.3%. Thirty‐two percent were STEMI admissions and 68% were NSTEMI admissions with in‐hospital mortality of 8.5% and 3.8%, respectively. Patients with alcohol‐related diagnoses comprised 18,684 (3.1%) of all AMI admissions. This prevalence was significantly lower relative to non‐AMI admissions (4.9%), even after age and sex adjustment (adjusted odds ratio [OR]: 0.7, 95% confidence interval [CI]: 0.6‐0.7, P < 0.001).
| Variables | AMI, In‐hospital Death | AMI, Alive at Discharge | P Value |
|---|---|---|---|
| |||
| No. | 32,399 (5.3) | 578,564 (94.7) | <0.0001 |
| Age, y (SD) | 76 (7577) | 67 (6668) | |
| Sex | |||
| Males | 17,483 (54) | 352,943 (61) | <0.0001 |
| Females | 14,916 (46) | 225,621 (39) | <0.0001 |
| Race | |||
| White | 22,517 (70) | 387,816 (67) | <0.0001 |
| Black | 2,580 (7.9) | 56,735 (9.8) | <0.0001 |
| Hispanic | 2,002 (6.1) | 41,399 (7.2) | <0.0001 |
| Asian | 685 (2) | 11,160 (1.9) | <0.0001 |
| Native American | 146 (0.3) | 2,240 (0.4) | <0.0001 |
| Others | 991 (3) | 17,711 (3.2) | <0.0001 |
| Unspecified | 3,478 (10.7) | 61,503 (10.5) | <0.0001 |
| STEMI | 16,437 (50.7) | 177,240 (30.6) | <0.0001 |
| NSTEMI | 15,962 (49.3) | 401,324 (69.4) | <0.0001 |
| Alcohol diagnoses | |||
| Acute drinking | 110 (0.3) | 2,615 (0.5) | 0.1389 |
| Chronic drinking | 816 (2.5) | 15,143 (2.6) | 0.2473 |
| Comorbidities | |||
| Diabetes mellitus | 11,497 (35.5) | 211,321 (36.5) | 0.5963 |
| Hypertension | 20,068 (61.9) | 411,853 (71.2) | <0.0001 |
| Peripheral vascular disease | 4,962 (15.3) | 70,024 (12.1) | <0.0001 |
| Renal failure | 9,929 (30.6) | 113,714 (19.7) | <0.0001 |
| Drug abuse | 330 (1.0) | 13,263 (2.3) | <0.0001 |
| Arrhythmias | 14,977 (46.2) | 167,286 (28.9) | <0.0001 |
| Liver disease | 442 (1.4) | 6,493 (1.1) | 0.0753 |
| Smoking history | 6,736 (20.8) | 210,205 (36.3) | <0.0001 |
| Gastrointestinal bleed | 1,982 (6.1) | 12,086 (2.1) | <0.0001 |
Table 2 lists the characteristics of AMI patients stratified by alcohol status. Patients with alcohol‐related disorders presenting with AMI were younger, overwhelmingly male, and had a higher prevalence of the following comorbid conditions: drug abuse, liver disease, gastrointestinal bleeding, and smoking history. They had a lower prevalence of diabetes, hypertension, and renal failure.
| Variables | Alcohol‐Related Diagnoses | No Alcohol‐Related Diagnoses | P Value |
|---|---|---|---|
| |||
| No. | 18,684 (3.1) | 592,279 (96.9) | <0.0001 |
| Age, y, mean | 59 (5860) | 68 (6769) | <0.0001 |
| Sex | |||
| Males | 16,315 (87.3) | 354,051 (59.8) | <0.0001 |
| Females | 2,369 (12.7) | 238,228 (40.2) | <0.0001 |
| Race | |||
| White | 11,917 (63.8) | 398,766 (67.2) | <0.0001 |
| Black | 2,613 (13.9) | 56,723 (9.6) | <0.0001 |
| Hispanic | 1,400 (7.5) | 42,052 (7.1) | <0.0001 |
| Asian | 125 (0.7) | 11,724 (1.9) | <0.0001 |
| Native American | 165 (0.9) | 2,221 (0.4) | <0.0001 |
| Others | 570 (2.9) | 18,139 (3.2) | <0.0001 |
| Unspecified | 1,894 (10.1) | 62,654 (10.6) | <0.0001 |
| STEMI | 6,541 (35.1) | 187,136 (31.2) | <0.0001 |
| NSTEMI | 12,143 (64.9) | 405,143 (68.8) | <0.0001 |
| Died | 881 (4.7) | 31,518 (5.3) | 0.1312 |
| Comorbidities | |||
| Diabetes mellitus | 4,663 (24.9) | 218,446 (36.8) | <0.0001 |
| Hypertension | 12,501 (66.8) | 420,001 (70.8) | <0.0001 |
| Peripheral vascular disease | 2,269 (12.1) | 72,773 (12.3) | 0.7987 |
| Renal failure | 1,937 (10.4) | 121,925 (20.6) | <0.0001 |
| Drug abuse | 2,894 (15.5) | 10,708 (1.8) | <0.0001 |
| Arrhythmias | 5,476 (29.3) | 177,088 (29.9) | 0.4076 |
| Liver disease | 887 (4.7) | 6,053 (1.0) | <0.0001 |
| Smoking history | 12,771 (68.3) | 204,390 (34.5) | <0.0001 |
| Gastrointestinal bleed | 730 (3.9) | 13,347 (2.3) | <0.0001 |
Among AMI patients, unadjusted in‐hospital mortality was observed to be similar in the alcohol use disorder group (4.7% vs 5.3%, P = 0.131), STEMI hospitalizations (7.9% vs 8.5%, P = 0.475), and lower in NSTEMI hospitalizations (3% vs 3.9%, P = 0.035). However, as shown in Table 2, there were a number of factors that may have influenced death in AMI patients that differed between those with and without alcohol diagnoses. Table 3 shows the adjusted risk for death and each secondary outcome. After adjusting for factors associated with alcoholism, including age, sex, liver disease, hypertension, diabetes, renal failure, drug abuse, gastrointestinal bleed, and smoking, alcohol‐related diagnoses were associated with increased mortality in AMI hospitalizations (adjusted OR: 1.5, 95% CI: 1.2‐1.7, P < 0.001). Contrary to our expectations, however, acute alcohol‐related diagnoses were not independently associated with mortality. The association with alcohol‐related diagnoses was significant in both STEMI (adjusted OR: 1.7, 95% CI: 1.4‐2.2, P < 0.001) and NSTEMI patients (adjusted OR: 1.3, 95% CI: 1.0‐1.7, P = 0.025).
| Adjusted Odds Ratio* | 95% Confidence Intervals | P Value | |
|---|---|---|---|
| |||
| Primary outcome: death | |||
| AMI | |||
| Alcohol diagnoses | 1.5 | 1.21.7 | <0.001 |
| Acute alcohol diagnoses | 1.0 | 0.71.5 | 0.886 |
| Chronic alcohol diagnoses | 1.5 | 1.21.8 | 0.001 |
| STEMI | |||
| Alcohol diagnoses | 1.7 | 1.42.2 | <0.001 |
| Acute alcohol diagnoses | 1.1 | 0.61.9 | 0.835 |
| Chronic alcohol diagnoses | 1.6 | 1.22.1 | 0.001 |
| NSTEMI | |||
| Alcohol diagnoses | 1.3 | 1.01.7 | 0.025 |
| Acute alcohol diagnoses | 1.2 | 0.72.1 | 0.581 |
| Chronic alcohol diagnoses | 1.4 | 1.11.9 | 0.022 |
| Secondary outcomes | |||
| AMI | |||
| Length of stay | 1.5 | 1.31.6 | <0.001 |
| All cardiac procedures | 0.6 | 0.60.7 | <0.001 |
| CABG | 1.2 | 1.01.3 | 0.008 |
| Angioplasty | 0.6 | 0.60.7 | <0.001 |
| Diagnostic angiogram | 0.7 | 0.60.8 | <0.001 |
| STEMI | |||
| Length of stay | 1.2 | 1.11.4 | <0.001 |
| All cardiac procedures | 0.6 | 0.50.7 | <0.001 |
| CABG | 1.2 | 0.91.5 | 0.125 |
| Angioplasty | 0.6 | 0.50.7 | <0.001 |
| Diagnostic angiogram | 0.7 | 0.60.9 | <0.001 |
| NSTEMI | |||
| Length of stay | 1.6 | 1.51.8 | <0.001 |
| All cardiac procedures | 0.7 | 0.60.8 | <0.001 |
| CABG | 1.1 | 0.91.5 | 0.125 |
| Angioplasty | 0.6 | 0.60.7 | <0.001 |
| Diagnostic angiogram | 0.7 | 0.60.8 | <0.001 |
Regarding secondary outcomes, alcohol‐related diagnoses were associated with an increased length of stay, fewer diagnostic catheterizations and angioplasties, but higher coronary artery bypass grafting (CABG) procedures (Table 3).
DISCUSSION
In this analysis of AMI discharges, a modestly increased risk of in‐hospital mortality was found for patients with alcohol‐related diagnoses, although AMI patients were less likely to have a diagnosis related to alcohol. This increased risk of in‐hospital mortality was present in both STEMI and NSTEMI patients with alcohol‐related diagnoses, and was present in patients with chronic alcohol‐related diagnoses but not with withdrawal or intoxication. In addition to mortality differences, AMI patients with alcohol‐related diagnoses had a higher length of stay, but were less likely to have a cardiac procedure.
The association of alcohol‐related diagnoses with cardiovascular outcomes is not as well defined as the beneficial association between coronary heart disease and moderate alcohol use. Heavy drinking has been associated with greater risk of sudden cardiac death in subjects with preexisting coronary heart disease.[20, 21] Data from the Nurses Health Study demonstrated a U‐shaped curve between alcohol use and sudden cardiac death, but with limited power for assessing heavy drinking patterns.[22] In the Physicians Health Study, there was no significant increase in the risk of sudden cardiac death in men with higher intake of alcohol (2 drinks/day), but again with limited power for evaluating truly heavy drinking.[23] More recently, as shown by Mukamal et al., there was a trend toward higher overall cardiovascular deaths (OR: 1.07, 95% CI: 0.94‐1.22) but lower coronary heart disease mortality (OR: 0.80, 95% CI: 0.61‐1.05) in heavy drinkers, but results were not statistically significant even after adjusting for age, sex, and race.[3] One study demonstrated that heavy episodic drinking within the preceding 24 hours was associated with an increased risk of myocardial infarction (OR: 1.4, 95% confidence interval: 1.1‐1.9), particularly in the elderly (>65 years old) (OR: 5.3, 95% CI: 1.6‐18),[24] but the study did not consider mortality. The more recent study done by Mostofsky et al. has shown higher incidence of AMI onset within 1 hour after alcohol consumption among people who are not daily drinkers,[25] but the study did not consider mortality outcomes.
As an extension of knowledge regarding the association of alcohol‐related diagnoses with cardiovascular outcomes, we believe that our analysis of the NIS is the first to show a statistically significant positive age‐adjusted association of in‐hospital mortality with alcohol‐related diagnoses in AMI patients. Episodic or binge drinking has been noted to have proarrhythmogenic effects leading to sudden cardiac death.[26] This would often occur prior to hospitalization, but once hospitalized the presence of rhythm abnormalities was not associated with alcohol diagnoses. Alcohol effects might also be expected to lead to increased AMI mortality due to autonomic instability, gastrointestinal bleeding, or liver disease, but intoxication, withdrawal, gastrointestinal bleeding, liver disease, or comorbid tobacco or drug abuse did not account for excess alcohol‐associated AMI mortality in this study. Additional research will be required to determine the reasons underlying the increased age‐adjusted mortality.
The important strength of the present study includes the use of a large national database that allowed us to link alcohol‐related diagnoses to AMI death in the hospital, and to explore potential confounders of this association (eg, gastrointestinal bleeding, withdrawal, liver disease). However, a number of limitations merit consideration. The NIS sampling frame is limited to hospital discharges. As such, we have no data on prehospital AMI death and alcohol use pattern immediately preceding hospitalization. Similarly, we were unable to consider mortality immediately beyond the hospital discharge. Other important predictors that are not recorded in the NIS are details regarding a patient's physical activity and medications such as statins and ‐blockers that could affect survivorship in AMI patients. Another potential limitation of our analysis is the lack of differentiating between type 2 myocardial infarction, occurring from sepsis or acute kidney injury, from a true NSTEMI. However, we included only primary discharge diagnoses of AMI, and results for STEMI and NSTEMI discharges were similar. Regarding the cross‐sectional study design, we are unable to establish a cause and effect relationship between in‐hospital AMI mortality and alcohol‐related diagnoses. The NIS data were abstracted from administrative databases that may lack important details on alcohol‐related problems. In particular, it seems likely that heavy drinkers with less obvious alcohol‐related problems would be underidentified in clinical settings, and this may have biased our results toward an overestimation of the alcohol‐associated risk. Due to these limitations, AMI mortality will need to be evaluated in other samples to definitively evaluate associations with diagnoses related to heavy drinking and determine the reasons underlying the association. The increased death and CABG despite decreased angiography and angioplasty suggests that these patients presentations may be with more severe coronary heart disease, which is a question requiring further study. Finally, an alcohol user who presents with an AMI is less likely to have cardiac risk factors like diabetes, renal failure, and possibly hypertension. Rather, alcohol diagnoses in AMI patients associate with tobacco and drug abuse, liver disease, and higher age‐adjusted risk for death. It is important for a practicing hospitalist to have a high index of suspicion for these atypical AMI patients.
CONCLUSION
Although alcohol‐related diagnoses are less commonly documented in AMI patients relative to other admission diagnoses, results of this study suggest that they independently predict in‐hospital mortality. More research is needed to definitively measure the risk of such death attributable to alcohol and determine the mechanisms underlying the association.
Disclosure
Nothing to report.
- , , , , . Alcohol and coronary heart disease: a meta‐analysis. Addiction. 2000;95(10):1505–1523.
- , , , et al. Forecasting the future of cardiovascular disease in the United States: a policy statement from the American Heart Association. Circulation. 2011;123(8):933–944.
- , , , . Alcohol consumption and cardiovascular mortality among U.S. adults, 1987 to 2002. J Am Coll Cardiol. 2010;55(13):1328–1335.
- , , , , , . Alcohol dosing and total mortality in men and women: an updated meta‐analysis of 34 prospective studies. Arch Intern Med. 2006;166(22):2437–2445.
- , , , et al. Alcohol intake and risk of coronary heart disease in younger, middle‐aged, and older adults. Circulation. 2010;121(14):1589–1597.
- , , , . Binge drinking and mortality after acute myocardial infarction. Circulation. 2005;112(25):3839–3845.
- , , , et al. Comparison of outcomes among moderate alcohol drinkers before acute myocardial infarction to effect of continued versus discontinuing alcohol intake after the infarct. Am J Cardiol. 2010;105(12):1651–1654.
- , , , , . Alcohol consumption and mortality in patients with cardiovascular disease: a meta‐analysis. J Am Coll Cardiol. 2010;55(13):1339–1347.
- , , , , . Prior alcohol consumption and mortality following acute myocardial infarction. JAMA. 2001;285(15):1965–1970.
- , , , , . Lifestyle, social factors, and survival after age 75: population based study. BMJ. 2012;345:e5568.
- , , , et al. Effect of moderate red wine intake on cardiac prognosis after recent acute myocardial infarction of subjects with Type 2 diabetes mellitus. Diabet Med. 2006;23(9):974–981.
- , , , , . Meta‐analysis of the relationship between alcohol consumption and coronary heart disease and mortality in type 2 diabetic patients. Diabetologia. 2006;49(4):648–652.
- , , , , . Alcohol and cardiovascular health: the dose makes the poison…or the remedy. Mayo Clin Proc. 2014;89(3):382–393.
- , . Alcohol intake and mortality in middle aged men with diagnosed coronary heart disease. Heart. 2000;83(4):394–399.
- , , , et al. Alcohol intake and the risk of coronary heart disease in the Spanish EPIC cohort study. Heart. 2010;96(2):124–130.
- , , . Does recent alcohol consumption reduce the risk of acute myocardial infarction and coronary death in regular drinkers? Am J Epidemiol. 1992;136(7):819–824.
- , . How much alcohol and how often? Population based case‐control study of alcohol consumption and risk of a major coronary event. BMJ. 1997;314(7088):1159–1164.
- HCUP Nationwide Inpatient Sample. Healthcare Cost and Utilization Project. Rockville, MD; Agency for Healthcare Research and Quality, 2011. Available at: http://www.hcup‐us.ahrq.gov/nisoverview.jsp.
- HCUP Clinical Classifications Software for Services and Procedures. Healthcare Cost and Utilization Project. Rockville, MD: Agency for Healthcare Research and Quality; 2008. Available at: http://www.hcup‐us.ahrq.gov/toolssoftware/ccs_svcsproc/ccssvcproc.jsp. Accessed May 10th, 2014.
- , . Drinking habits and cardiovascular disease: the Framingham Study. Am Heart J. 1983;105(4):667–673.
- , . Alcohol and sudden cardiac death. Br Heart J. 1992;68(5):443–448.
- , , , et al. Light‐to‐moderate alcohol consumption and risk of sudden cardiac death in women. Heart Rhythm. 2010;7(10):1374–1380.
- , , , , , . Moderate alcohol consumption and the risk of sudden cardiac death among US male physicians. Circulation. 1999;100(9):944–950.
- , , , et al. Patterns of alcohol consumption and myocardial infarction risk: observations from 52 countries in the INTERHEART case‐control study. Circulation. 2014;130(5):390–398.
- , , , et al. Risk of myocardial infarction immediately after alcohol consumption. Epidemiology. 2015;26(2):143–150.
- , , , , , . Drinking habits and coronary heart disease: the Yugoslavia cardiovascular disease study. Am J Epidemiol. 1982;116(5):748–758.
Moderate alcohol consumption has been associated with lower risk of coronary heart disease death.[1, 2, 3] This benefit has been shown across all age groups, both sexes, in low‐risk patients (without prior cardiovascular disease [CVD], diabetics and even in patients with established CVD.[3, 4, 5, 6, 7, 8, 9, 10, 11, 12] The relationship between the dose of alcohol and total mortality has been depicted in many observational studies as a J‐shaped curve, attributed to a combined effect of both benefits and harms.[3, 4, 13] Unlike moderate drinking, heavy drinking and particularly binge drinking may have net negative cardiovascular effects. For example, higher levels of intake of alcohol were associated with increased mortality in men with previous myocardial infarction,[14] whereas some reports suggest a continued beneficial association with acute myocardial infarction (AMI).[15, 16, 17] In other studies, the association between AMI and binge or chronic heavy drinking is inconsistent or lacks enough power to report the risk/benefit estimates.[3] Data are sparse on the effects of alcoholism on outcomes in patients hospitalized due to an AMI. Therefore, we sought to investigate the prevalence and association of alcohol‐related diagnoses with in‐hospital mortality in patients presenting with AMI in the United States.
METHODS
This study was a cross‐sectional analysis of the 2011 Nationwide Inpatient Sample (NIS). The NIS is a publicly available deidentified database of hospital discharges in the United States.[18] It contains data from approximately 8 million hospital stays that were selected using a complex probability sampling design and weighting scheme intended to represent all discharges from nonfederal hospitals in the United States. Each record includes 1 primary diagnosis and up to 24 secondary diagnoses.
Analysis was conducted for all patients aged 21 years and greater with a primary discharge diagnosis of AMI based on International Classification of Diseases, 9th Revision (ICD‐9) codes. ST‐elevation myocardial infarction (STEMI) and nonST‐elevation myocardial infarction (NSTEMI) were recorded when the principal diagnosis included the appropriate ICD‐9 codes (see Supporting Table 1 in the online version of this article). Alcohol‐related diagnosis was categorized as the presence of alcohol use disorders or other chronic conditions caused by heavy drinking such as alcoholic cardiomyopathy and alcoholic liver disease among others. Variables reflecting acute effects and chronic effects of alcohol use were created for analytic purposes. Acute effects that increase the risk for acute withdrawal syndrome and hemodynamic instability (and may thereby effect mortality) were characterized by alcohol withdrawal, acute alcoholic hepatitis, alcoholic gastritis, or acute alcohol intoxication. Chronic effects of alcohol were characterized by alcohol dependence, alcoholic polyneuropathy, alcoholic cardiomyopathy, or alcoholic liver damage other than acute hepatitis. A number of comorbidities were generated from ICD‐9 codes including smoking, chronic liver disease, peripheral vascular disease, hypertension, diabetes, renal failure, drug abuse, arrhythmia, and gastrointestinal bleeding using Clinical Classification Software codes provided by the Healthcare Cost and Utilization Project, Agency for Healthcare Research and Quality[19] (see Supporting Table 1 in the online version of this article).
The risk for alcohol‐related diagnoses in AMI patients adjusting for age and sex was estimated using all adult discharge records. All other analyses included only AMI discharges. The principal outcome measure was in‐hospital mortality. Secondary outcomes included having a cardiac procedure (diagnostic catheterization, percutaneous coronary angioplasty, or coronary bypass grafting), and length of stay.
All statistical analyses were performed using Statistical Analysis Software version 9.4 (SAS Inc., Cary, NC). Logistic regression methods appropriate for the NIS sample design were utilized to predict AMI mortality risk associated with alcohol‐related diagnoses (overall and separately for acute and chronic alcohol‐related diagnoses). Mortality risk was evaluated in all AMI discharges and again for STEMI and NSTEMI discharges. To control for factors frequently associated with alcoholism, adjustment was made for age, sex, liver disease, hypertension, diabetes, renal failure, peripheral vascular disease, arrhythmias, drug abuse, gastrointestinal bleed, and smoking. For secondary outcomes, odds ratios were calculated for having a cardiac procedure performed during the hospital admission and length of stay above the median.
RESULTS
Table 1 lists characteristics of AMI patients stratified by in‐hospital mortality. In 2011, AMI accounted for 610,963 (1.9%) of overall adult hospital admissions, with an in‐hospital mortality of 5.3%. Thirty‐two percent were STEMI admissions and 68% were NSTEMI admissions with in‐hospital mortality of 8.5% and 3.8%, respectively. Patients with alcohol‐related diagnoses comprised 18,684 (3.1%) of all AMI admissions. This prevalence was significantly lower relative to non‐AMI admissions (4.9%), even after age and sex adjustment (adjusted odds ratio [OR]: 0.7, 95% confidence interval [CI]: 0.6‐0.7, P < 0.001).
| Variables | AMI, In‐hospital Death | AMI, Alive at Discharge | P Value |
|---|---|---|---|
| |||
| No. | 32,399 (5.3) | 578,564 (94.7) | <0.0001 |
| Age, y (SD) | 76 (7577) | 67 (6668) | |
| Sex | |||
| Males | 17,483 (54) | 352,943 (61) | <0.0001 |
| Females | 14,916 (46) | 225,621 (39) | <0.0001 |
| Race | |||
| White | 22,517 (70) | 387,816 (67) | <0.0001 |
| Black | 2,580 (7.9) | 56,735 (9.8) | <0.0001 |
| Hispanic | 2,002 (6.1) | 41,399 (7.2) | <0.0001 |
| Asian | 685 (2) | 11,160 (1.9) | <0.0001 |
| Native American | 146 (0.3) | 2,240 (0.4) | <0.0001 |
| Others | 991 (3) | 17,711 (3.2) | <0.0001 |
| Unspecified | 3,478 (10.7) | 61,503 (10.5) | <0.0001 |
| STEMI | 16,437 (50.7) | 177,240 (30.6) | <0.0001 |
| NSTEMI | 15,962 (49.3) | 401,324 (69.4) | <0.0001 |
| Alcohol diagnoses | |||
| Acute drinking | 110 (0.3) | 2,615 (0.5) | 0.1389 |
| Chronic drinking | 816 (2.5) | 15,143 (2.6) | 0.2473 |
| Comorbidities | |||
| Diabetes mellitus | 11,497 (35.5) | 211,321 (36.5) | 0.5963 |
| Hypertension | 20,068 (61.9) | 411,853 (71.2) | <0.0001 |
| Peripheral vascular disease | 4,962 (15.3) | 70,024 (12.1) | <0.0001 |
| Renal failure | 9,929 (30.6) | 113,714 (19.7) | <0.0001 |
| Drug abuse | 330 (1.0) | 13,263 (2.3) | <0.0001 |
| Arrhythmias | 14,977 (46.2) | 167,286 (28.9) | <0.0001 |
| Liver disease | 442 (1.4) | 6,493 (1.1) | 0.0753 |
| Smoking history | 6,736 (20.8) | 210,205 (36.3) | <0.0001 |
| Gastrointestinal bleed | 1,982 (6.1) | 12,086 (2.1) | <0.0001 |
Table 2 lists the characteristics of AMI patients stratified by alcohol status. Patients with alcohol‐related disorders presenting with AMI were younger, overwhelmingly male, and had a higher prevalence of the following comorbid conditions: drug abuse, liver disease, gastrointestinal bleeding, and smoking history. They had a lower prevalence of diabetes, hypertension, and renal failure.
| Variables | Alcohol‐Related Diagnoses | No Alcohol‐Related Diagnoses | P Value |
|---|---|---|---|
| |||
| No. | 18,684 (3.1) | 592,279 (96.9) | <0.0001 |
| Age, y, mean | 59 (5860) | 68 (6769) | <0.0001 |
| Sex | |||
| Males | 16,315 (87.3) | 354,051 (59.8) | <0.0001 |
| Females | 2,369 (12.7) | 238,228 (40.2) | <0.0001 |
| Race | |||
| White | 11,917 (63.8) | 398,766 (67.2) | <0.0001 |
| Black | 2,613 (13.9) | 56,723 (9.6) | <0.0001 |
| Hispanic | 1,400 (7.5) | 42,052 (7.1) | <0.0001 |
| Asian | 125 (0.7) | 11,724 (1.9) | <0.0001 |
| Native American | 165 (0.9) | 2,221 (0.4) | <0.0001 |
| Others | 570 (2.9) | 18,139 (3.2) | <0.0001 |
| Unspecified | 1,894 (10.1) | 62,654 (10.6) | <0.0001 |
| STEMI | 6,541 (35.1) | 187,136 (31.2) | <0.0001 |
| NSTEMI | 12,143 (64.9) | 405,143 (68.8) | <0.0001 |
| Died | 881 (4.7) | 31,518 (5.3) | 0.1312 |
| Comorbidities | |||
| Diabetes mellitus | 4,663 (24.9) | 218,446 (36.8) | <0.0001 |
| Hypertension | 12,501 (66.8) | 420,001 (70.8) | <0.0001 |
| Peripheral vascular disease | 2,269 (12.1) | 72,773 (12.3) | 0.7987 |
| Renal failure | 1,937 (10.4) | 121,925 (20.6) | <0.0001 |
| Drug abuse | 2,894 (15.5) | 10,708 (1.8) | <0.0001 |
| Arrhythmias | 5,476 (29.3) | 177,088 (29.9) | 0.4076 |
| Liver disease | 887 (4.7) | 6,053 (1.0) | <0.0001 |
| Smoking history | 12,771 (68.3) | 204,390 (34.5) | <0.0001 |
| Gastrointestinal bleed | 730 (3.9) | 13,347 (2.3) | <0.0001 |
Among AMI patients, unadjusted in‐hospital mortality was observed to be similar in the alcohol use disorder group (4.7% vs 5.3%, P = 0.131), STEMI hospitalizations (7.9% vs 8.5%, P = 0.475), and lower in NSTEMI hospitalizations (3% vs 3.9%, P = 0.035). However, as shown in Table 2, there were a number of factors that may have influenced death in AMI patients that differed between those with and without alcohol diagnoses. Table 3 shows the adjusted risk for death and each secondary outcome. After adjusting for factors associated with alcoholism, including age, sex, liver disease, hypertension, diabetes, renal failure, drug abuse, gastrointestinal bleed, and smoking, alcohol‐related diagnoses were associated with increased mortality in AMI hospitalizations (adjusted OR: 1.5, 95% CI: 1.2‐1.7, P < 0.001). Contrary to our expectations, however, acute alcohol‐related diagnoses were not independently associated with mortality. The association with alcohol‐related diagnoses was significant in both STEMI (adjusted OR: 1.7, 95% CI: 1.4‐2.2, P < 0.001) and NSTEMI patients (adjusted OR: 1.3, 95% CI: 1.0‐1.7, P = 0.025).
| Adjusted Odds Ratio* | 95% Confidence Intervals | P Value | |
|---|---|---|---|
| |||
| Primary outcome: death | |||
| AMI | |||
| Alcohol diagnoses | 1.5 | 1.21.7 | <0.001 |
| Acute alcohol diagnoses | 1.0 | 0.71.5 | 0.886 |
| Chronic alcohol diagnoses | 1.5 | 1.21.8 | 0.001 |
| STEMI | |||
| Alcohol diagnoses | 1.7 | 1.42.2 | <0.001 |
| Acute alcohol diagnoses | 1.1 | 0.61.9 | 0.835 |
| Chronic alcohol diagnoses | 1.6 | 1.22.1 | 0.001 |
| NSTEMI | |||
| Alcohol diagnoses | 1.3 | 1.01.7 | 0.025 |
| Acute alcohol diagnoses | 1.2 | 0.72.1 | 0.581 |
| Chronic alcohol diagnoses | 1.4 | 1.11.9 | 0.022 |
| Secondary outcomes | |||
| AMI | |||
| Length of stay | 1.5 | 1.31.6 | <0.001 |
| All cardiac procedures | 0.6 | 0.60.7 | <0.001 |
| CABG | 1.2 | 1.01.3 | 0.008 |
| Angioplasty | 0.6 | 0.60.7 | <0.001 |
| Diagnostic angiogram | 0.7 | 0.60.8 | <0.001 |
| STEMI | |||
| Length of stay | 1.2 | 1.11.4 | <0.001 |
| All cardiac procedures | 0.6 | 0.50.7 | <0.001 |
| CABG | 1.2 | 0.91.5 | 0.125 |
| Angioplasty | 0.6 | 0.50.7 | <0.001 |
| Diagnostic angiogram | 0.7 | 0.60.9 | <0.001 |
| NSTEMI | |||
| Length of stay | 1.6 | 1.51.8 | <0.001 |
| All cardiac procedures | 0.7 | 0.60.8 | <0.001 |
| CABG | 1.1 | 0.91.5 | 0.125 |
| Angioplasty | 0.6 | 0.60.7 | <0.001 |
| Diagnostic angiogram | 0.7 | 0.60.8 | <0.001 |
Regarding secondary outcomes, alcohol‐related diagnoses were associated with an increased length of stay, fewer diagnostic catheterizations and angioplasties, but higher coronary artery bypass grafting (CABG) procedures (Table 3).
DISCUSSION
In this analysis of AMI discharges, a modestly increased risk of in‐hospital mortality was found for patients with alcohol‐related diagnoses, although AMI patients were less likely to have a diagnosis related to alcohol. This increased risk of in‐hospital mortality was present in both STEMI and NSTEMI patients with alcohol‐related diagnoses, and was present in patients with chronic alcohol‐related diagnoses but not with withdrawal or intoxication. In addition to mortality differences, AMI patients with alcohol‐related diagnoses had a higher length of stay, but were less likely to have a cardiac procedure.
The association of alcohol‐related diagnoses with cardiovascular outcomes is not as well defined as the beneficial association between coronary heart disease and moderate alcohol use. Heavy drinking has been associated with greater risk of sudden cardiac death in subjects with preexisting coronary heart disease.[20, 21] Data from the Nurses Health Study demonstrated a U‐shaped curve between alcohol use and sudden cardiac death, but with limited power for assessing heavy drinking patterns.[22] In the Physicians Health Study, there was no significant increase in the risk of sudden cardiac death in men with higher intake of alcohol (2 drinks/day), but again with limited power for evaluating truly heavy drinking.[23] More recently, as shown by Mukamal et al., there was a trend toward higher overall cardiovascular deaths (OR: 1.07, 95% CI: 0.94‐1.22) but lower coronary heart disease mortality (OR: 0.80, 95% CI: 0.61‐1.05) in heavy drinkers, but results were not statistically significant even after adjusting for age, sex, and race.[3] One study demonstrated that heavy episodic drinking within the preceding 24 hours was associated with an increased risk of myocardial infarction (OR: 1.4, 95% confidence interval: 1.1‐1.9), particularly in the elderly (>65 years old) (OR: 5.3, 95% CI: 1.6‐18),[24] but the study did not consider mortality. The more recent study done by Mostofsky et al. has shown higher incidence of AMI onset within 1 hour after alcohol consumption among people who are not daily drinkers,[25] but the study did not consider mortality outcomes.
As an extension of knowledge regarding the association of alcohol‐related diagnoses with cardiovascular outcomes, we believe that our analysis of the NIS is the first to show a statistically significant positive age‐adjusted association of in‐hospital mortality with alcohol‐related diagnoses in AMI patients. Episodic or binge drinking has been noted to have proarrhythmogenic effects leading to sudden cardiac death.[26] This would often occur prior to hospitalization, but once hospitalized the presence of rhythm abnormalities was not associated with alcohol diagnoses. Alcohol effects might also be expected to lead to increased AMI mortality due to autonomic instability, gastrointestinal bleeding, or liver disease, but intoxication, withdrawal, gastrointestinal bleeding, liver disease, or comorbid tobacco or drug abuse did not account for excess alcohol‐associated AMI mortality in this study. Additional research will be required to determine the reasons underlying the increased age‐adjusted mortality.
The important strength of the present study includes the use of a large national database that allowed us to link alcohol‐related diagnoses to AMI death in the hospital, and to explore potential confounders of this association (eg, gastrointestinal bleeding, withdrawal, liver disease). However, a number of limitations merit consideration. The NIS sampling frame is limited to hospital discharges. As such, we have no data on prehospital AMI death and alcohol use pattern immediately preceding hospitalization. Similarly, we were unable to consider mortality immediately beyond the hospital discharge. Other important predictors that are not recorded in the NIS are details regarding a patient's physical activity and medications such as statins and ‐blockers that could affect survivorship in AMI patients. Another potential limitation of our analysis is the lack of differentiating between type 2 myocardial infarction, occurring from sepsis or acute kidney injury, from a true NSTEMI. However, we included only primary discharge diagnoses of AMI, and results for STEMI and NSTEMI discharges were similar. Regarding the cross‐sectional study design, we are unable to establish a cause and effect relationship between in‐hospital AMI mortality and alcohol‐related diagnoses. The NIS data were abstracted from administrative databases that may lack important details on alcohol‐related problems. In particular, it seems likely that heavy drinkers with less obvious alcohol‐related problems would be underidentified in clinical settings, and this may have biased our results toward an overestimation of the alcohol‐associated risk. Due to these limitations, AMI mortality will need to be evaluated in other samples to definitively evaluate associations with diagnoses related to heavy drinking and determine the reasons underlying the association. The increased death and CABG despite decreased angiography and angioplasty suggests that these patients presentations may be with more severe coronary heart disease, which is a question requiring further study. Finally, an alcohol user who presents with an AMI is less likely to have cardiac risk factors like diabetes, renal failure, and possibly hypertension. Rather, alcohol diagnoses in AMI patients associate with tobacco and drug abuse, liver disease, and higher age‐adjusted risk for death. It is important for a practicing hospitalist to have a high index of suspicion for these atypical AMI patients.
CONCLUSION
Although alcohol‐related diagnoses are less commonly documented in AMI patients relative to other admission diagnoses, results of this study suggest that they independently predict in‐hospital mortality. More research is needed to definitively measure the risk of such death attributable to alcohol and determine the mechanisms underlying the association.
Disclosure
Nothing to report.
- , , , , . Alcohol and coronary heart disease: a meta‐analysis. Addiction. 2000;95(10):1505–1523.
- , , , et al. Forecasting the future of cardiovascular disease in the United States: a policy statement from the American Heart Association. Circulation. 2011;123(8):933–944.
- , , , . Alcohol consumption and cardiovascular mortality among U.S. adults, 1987 to 2002. J Am Coll Cardiol. 2010;55(13):1328–1335.
- , , , , , . Alcohol dosing and total mortality in men and women: an updated meta‐analysis of 34 prospective studies. Arch Intern Med. 2006;166(22):2437–2445.
- , , , et al. Alcohol intake and risk of coronary heart disease in younger, middle‐aged, and older adults. Circulation. 2010;121(14):1589–1597.
- , , , . Binge drinking and mortality after acute myocardial infarction. Circulation. 2005;112(25):3839–3845.
- , , , et al. Comparison of outcomes among moderate alcohol drinkers before acute myocardial infarction to effect of continued versus discontinuing alcohol intake after the infarct. Am J Cardiol. 2010;105(12):1651–1654.
- , , , , . Alcohol consumption and mortality in patients with cardiovascular disease: a meta‐analysis. J Am Coll Cardiol. 2010;55(13):1339–1347.
- , , , , . Prior alcohol consumption and mortality following acute myocardial infarction. JAMA. 2001;285(15):1965–1970.
- , , , , . Lifestyle, social factors, and survival after age 75: population based study. BMJ. 2012;345:e5568.
- , , , et al. Effect of moderate red wine intake on cardiac prognosis after recent acute myocardial infarction of subjects with Type 2 diabetes mellitus. Diabet Med. 2006;23(9):974–981.
- , , , , . Meta‐analysis of the relationship between alcohol consumption and coronary heart disease and mortality in type 2 diabetic patients. Diabetologia. 2006;49(4):648–652.
- , , , , . Alcohol and cardiovascular health: the dose makes the poison…or the remedy. Mayo Clin Proc. 2014;89(3):382–393.
- , . Alcohol intake and mortality in middle aged men with diagnosed coronary heart disease. Heart. 2000;83(4):394–399.
- , , , et al. Alcohol intake and the risk of coronary heart disease in the Spanish EPIC cohort study. Heart. 2010;96(2):124–130.
- , , . Does recent alcohol consumption reduce the risk of acute myocardial infarction and coronary death in regular drinkers? Am J Epidemiol. 1992;136(7):819–824.
- , . How much alcohol and how often? Population based case‐control study of alcohol consumption and risk of a major coronary event. BMJ. 1997;314(7088):1159–1164.
- HCUP Nationwide Inpatient Sample. Healthcare Cost and Utilization Project. Rockville, MD; Agency for Healthcare Research and Quality, 2011. Available at: http://www.hcup‐us.ahrq.gov/nisoverview.jsp.
- HCUP Clinical Classifications Software for Services and Procedures. Healthcare Cost and Utilization Project. Rockville, MD: Agency for Healthcare Research and Quality; 2008. Available at: http://www.hcup‐us.ahrq.gov/toolssoftware/ccs_svcsproc/ccssvcproc.jsp. Accessed May 10th, 2014.
- , . Drinking habits and cardiovascular disease: the Framingham Study. Am Heart J. 1983;105(4):667–673.
- , . Alcohol and sudden cardiac death. Br Heart J. 1992;68(5):443–448.
- , , , et al. Light‐to‐moderate alcohol consumption and risk of sudden cardiac death in women. Heart Rhythm. 2010;7(10):1374–1380.
- , , , , , . Moderate alcohol consumption and the risk of sudden cardiac death among US male physicians. Circulation. 1999;100(9):944–950.
- , , , et al. Patterns of alcohol consumption and myocardial infarction risk: observations from 52 countries in the INTERHEART case‐control study. Circulation. 2014;130(5):390–398.
- , , , et al. Risk of myocardial infarction immediately after alcohol consumption. Epidemiology. 2015;26(2):143–150.
- , , , , , . Drinking habits and coronary heart disease: the Yugoslavia cardiovascular disease study. Am J Epidemiol. 1982;116(5):748–758.