User login
Implications of Vancomycin Troughs Drawn Earlier Than Current Guidelines
Vancomycin was isolated in the 1950s, but due to impurities causing adverse events and semisynthetic penicillin production, its use was greatly reduced.1,2 However, this medication gained in popularity 30 years later as a first-line treatment for methicillin-resistant Staphylococcus aureus infections.
In 2009 the Infectious Diseases Society of America (IDSA), American Society of Health System Pharmacists, and Society of Infectious Diseases Pharmacists developed a consensus review of the therapeutic monitoring and dosing of vancomycin in adult patients.3 Trough serum concentration levels are recommended as the most accurate and convenient method to monitor vancomycin. Per IDSA guidelines, an optimal trough is intended to be high enough to clear infections (> 10 mg/L) and prevent the development of vancomycin intermediate and resistant bacteria. Troughs should be obtained just before the next dose in steady-state conditions (starting just before the fourth dose) in patients with normal renal function.
Since the development of these guidelines, vancomycin trough levels are often drawn early.4-7 This may lead to an overestimation of the true trough concentration. A study by Morrison and colleagues in Boston, Massachusetts, found that 41.3% of vancomycin troughs were drawn early, and this resulted in statistically significant increases in the vancomycin concentrations, the rate of vancomycin regimen adjustments (decrease, discontinuation, or holding of dose), and the repeat vancomycin level orders compared with correctly timed troughs.5 It was noted by the study authors that lowering the daily dose of vancomycin based on early trough levels could lead to an underdosing of vancomycin and an increase in intermediate or resistant bacteria.
Related: IDWEEK: Antibiotic ‘time-out’ cut vancomycin use
The prevalence and implications of early trough samples have been measured at only 1 facility, and it is unknown whether these data can be reproduced elsewhere.5 Thus, this study sought to determine the prevalence and corresponding clinical actions of early trough levels at the Captain James A. Lovell Federal Health Care Center (JALFHCC). This is a unique facility that in 2010 combined a VA hospital with a DoD hospital. This facility cares for 67,000 military and retiree beneficiaries each year from southwestern Wisconsin and northwestern Illinois.The primary objective of this study was to measure the rate of early troughs drawn and their resultant effect on vancomycin regimens compared with correctly timed troughs. Secondarily, this study sought to compare the rate of repeated vancomycin trough levels in early vs correctly timed measurements.
Methods
This retrospective cohort analysis compared the outcomes of early and correctly timed vancomycin troughs. This study was approved by the Edward Hines, Jr. VA Hospital and JALFHCC Institutional Review Board. Veteran patients aged ≥ 18 years, hospitalized at JALFHCC, and receiving IV vancomycin at dosing intervals of 8, 12, 24, and 48 hours with measured trough levels between July 1, 2009, and July 1, 2013, were included in this study. Patients were excluded from analysis if vancomycin was given at any schedule other than the previously stated frequencies, they received hemodialysis during the treatment period, or their insurance coverage was through TRICARE (these patients had either active-duty or retired active-duty status).
Potentially eligible patients were identified via a Computerized Patient Records System (CPRS) search for laboratory vancomycin level measurements. The search supplied the researcher with the patient name, vancomycin level date and time, type of vancomycin level (trough or random), and vancomycin concentration. With this information, further data were gathered through CPRS: demographics, type of clinical infection, desired trough level (inferred if not listed in CPRS note), and vancomycin administration time (through the bar code medication administration system [BCMA] in CPRS). This analysis was of troughs, and multiple troughs may have originated from the same patient.
An early trough was defined as a trough taken more than 2 hours earlier than the next theoretical administration time or anytime before the third dose. After a trough was determined to be early or on time, the clinical actions taken during the dosing interval following sample collection were documented. A dose was considered to be held if stated in the BCMA or in a CPRS provider note. A dose was considered to be decreased with a change in frequency or strength that resulted in an overall daily dose decrease. A recollected vancomycin trough was counted within 24 hours of the trough or per a note in CPRS. Finally, observations that noted trends in vancomycin trough management were recorded.
The chi-square test with a significance criterion of 0.05 was used to compare early and on time troughs. Based on the results from the Boston, Massachusetts, study and 1 other study, about 780 vancomycin troughs would be required to meet significance in the primary outcome.5,6
Results
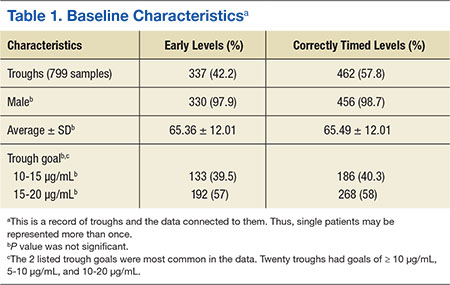
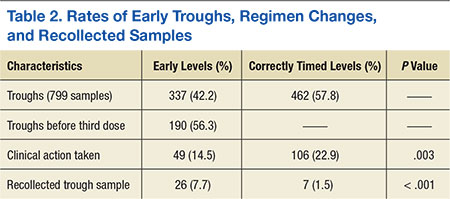
A total of 474 patient charts were reviewed, and 278 met inclusion criteria (196 were excluded). Of the included patients, 799 trough levels were analyzed. Of these, 377 (42.2%) were drawn early. There was no significant difference in the baseline characteristics of the early group vs the correctly timed group (Table 1). Of the early troughs, 190 (56.3%) were drawn prior to the third dose of vancomycin. It was observed that a large portion of these troughs occurred after a vancomycin dose adjustment.
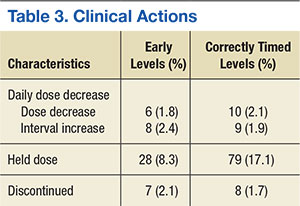
Clinical actions taken after sampling occurred at a rate of 14.5% in the early group and 22.9% in the correctly timed group (P = .003; Table 2). Early troughs led to a 7.7% rate of trough recollection, which was significantly greater than the 1.5% rate in the correctly timed group (P < .001). An analysis of each factor resulting in a clinical action illustrated that the rates of daily dose decrease and discontinued dose were similar between the groups (Table 3). However, the rate of held doses was 8.3% in the early group and 17.1% in the correctly timed group.
This research process yielded some observations. Occasionally a trough was drawn after vancomycin therapy was discontinued and when there was no concern for nephrotoxicity. After the guidelines were published, providers continued to document in CPRS notes to check troughs before the third dose. This incidence decreased over time. Troughs were taken often in patients who were receiving a short course of therapy or who were hemodynamically stable. Finally, documentation of vancomycin regimen changes occasionally did not match the record in the BCMA (in these situations, the BCMA record was used for this study).
Related: Assessment of High Staphylococcus aureus MIC and Poor Patient Outcomes
Discussion
A large portion of trough levels at the JALFHCC were drawn early and did not adhere to the 2009 consensus guidelines. The rates of early troughs in this study and in the Boston, Massachusetts, study are similar.5 However, the 2 studies differed in 1 significant aspect: Clinical actions were taken less often in the early group at JALFHCC, whereas they were taken more often in the early group in the Boston, Massachusetts, study. This dissimilarity could be attributed to a difference in software between the hospitals. In the previous study, trough levels and the time that they were drawn were not displayed together. Thus, clinicians may have been less likely to gauge whether a trough was early. Since this information is available at the JALFHCC, clinicians may have been aware that the trough was early and avoided adjusting treatment (such as holding a dose, as illustrated in the data) based on a falsely elevated trough. This point is further supported by significantly greater amounts of recollected troughs in the early group, suggesting an understanding that the trough was early.
The low trough recollection rate of 7.7% of all early samples could be due to several factors that would prevent a trough redraw. First, medication discontinuation resulting from course completion or sensitivity results would not require further trough monitoring. Second, practitioners may assess the early sample as insignificantly different from a correctly timed one and elect not to redraw the trough. Sometimes a trough was drawn at the correct time, but the time was recorded incorrectly. In this situation, a new trough level would not be necessary. Finally, a lack of sufficient staffing during nights and weekends may result in a delay in interpreting results leading to a missed opportunity for recollection. Additionally, some troughs may not have been redrawn based on a practitioner’s opinion that a trough was not significantly early and did not represent skewed results. Sometimes an incorrect recording of trough draw time reflected that it was taken after vancomycin dosing when it was not.
Specific observations regarding the timing of the trough indicate other possible concerns and areas for improvement. First, providers must cancel future trough orders concurrently with canceling treatment. Second, at the time of publication of the consensus, some providers were slow adopters of the new guidelines. Finally, the IDSA guidelines state that frequent monitoring for short course, lower intensity therapy, or in patients who are hemodynamically stable is not recommended.3 However, troughs were sometimes measured 2 to 3 times weekly in these patients.
Related: Results mixed in hospital efforts to tackle antimicrobial resistance
The data and observations lead to the conclusion that although providers may be able to discern between early and correctly timed troughs, they were not consistently adherent to the 2009 IDSA guidelines. It has been shown that pharmacy involvement of Medicare patients with infections in the intensive care unit has led to better clinical and monetary outcomes.8 Therefore, continued efforts by clinical pharmacists to monitor trough timing can be used to improve adherence and decrease costs (each trough is estimated to cost $16.97).
A study conducted in Australia demonstrated that pharmacist-led education of vancomycin dosing and monitoring (including when to measure a trough level) among prescribers and nurses led to improved adherence to the current guidelines and a greater number of patients treated within desired therapeutic ranges.9 In addition, a small study at the Atlanta VAMC in Georgia demonstrated that education of nurses, lab personnel, residents, ward clerks, and pharmacists led to a greater number of appropriately timed vancomycin and aminoglycoside levels.10 Thus, an interdisciplinary review of the current IDSA guidelines and review on the publication of the anticipated updated vancomycin guidelines should be provided to hospital personnel to aid in adoption of current dosing and monitoring recommendations.11
Limitations
This study is limited by the 4-year span of time that it encompassed, which may give a skewed depiction of current practices. Another limitation is that patients with fluctuating renal function were included in the analysis. Instead of selecting a random level order, a trough level order was sometimes selected for these patients. This could lead to a lower actual rate of early troughs. A third limitation is that this was a small and unblinded study. Also, the actual trough levels and the resulting changes that were made to specific regimens were not recorded. Thus, these data do not indicate whether the changes that were made reflected guideline recommendations. Finally, some clinical actions were taken after the dosing interval following the trough. This was often a result of off-hours lab results or waiting on attending physician or infectious disease guidance. These data were not included in the analysis.
Conclusion
Vancomycin troughs were often drawn too early and resulted in an increased rate of trough recollection. In an attempt to improve adherence to the current and the upcoming revised version of the IDSA consensus statement, it is recommended to educate and reeducate providers through interdisciplinary-led review sessions.
Author disclosures
The authors report no actual or potential conflicts of interest with regard to this article.
Disclaimer
The opinions expressed herein are those of the authors and do not necessarily reflect those of Federal Practitioner, Frontline Medical Communications Inc., the U.S. Government, or any of its agencies. This article may discuss unlabeled or investigational use of certain drugs. Please review the complete prescribing information for specific drugs or drug combinations—including indications, contraindications, warnings, and adverse effects—before administering pharmacologic therapy to patients.
1. Moellering RC Jr. Vancomycin: a 50-year reassessment. Clin Infect Dis. 2006;42(suppl 1):S3-S4.
2. Levine DP. Vancomycin: a history. Clin Infect Dis. 2006;42(suppl 1):S5-S12.
3. Rybak MJ, Lomaestro BM, Rotschafer JC, et al. Therapeutic monitoring of vancomycin in adults summary of consensus recommendations from the American Society of Health-System Pharmacists, the Infectious Diseases Society of America, and the Society of Infectious Diseases Pharmacists. Pharmacotherapy. 2009;29(11):1275-1279.
4. Davis SL, Scheetz MH, Bosso JA, Goff DA, Rybak MJ. Adherence to the 2009 consensus guidelines for vancomycin dosing and monitoring practices: a cross-sectional survey of U.S. hospitals. Pharmacotherapy. 2013;33(12):1256-1263.
5. Morrison AP, Melanson SEF, Carty MG, Bates DW, Szumita PM, Tanasijevic MJ. What proportion of vancomycin trough levels are drawn too early? Frequency and impact on clinical actions. Am J Clin Pathol. 2012;137(3):472-478.
6. Traugott KA, Maxwell PR, Green K, Frei C, Lewis JS 2nd. Effects of therapeutic drug monitoring criteria in a computerized prescriber-order-entry system on the appropriateness of vancomycin level orders. Am J Health Syst Pharm. 2011;68(4):347-352.
7. Melanson SE, Mijailovic AS, Wright AP, Szumita PM, Bates DW, Tanasijevic MJ. An intervention to improve the timing of vancomycin levels. Am J Clin Pathol. 2013;140(6):801-806.
8. MacLaren R, Bond CA, Martin SJ, Fike D. Clinical and economic outcomes of involving pharmacists in the direct care of critically ill patients with infections. Crit Care Med. 2008;36(12):3184-3189.
9. Phillips CJ, Doan H, Quinn S, Kirkpatrick CM, Gordon DL, Doogue MP. An educational intervention to improve vancomycin prescribing and monitoring. Int J Antimicrob Agents. 2013;41(4):393-394.
10. Carroll DJ, Austin GE, Stajich GV, Miyrhaya RK, Murphy JE, Ward ES. Effect of education on the appropriateness of serum drug concentration determination. Ther Drug Monit. 1992;14(1):81-84.
11. Infectious Diseases Society of America (IDSA). IDSA practice guidelines: antimicrobial agent use. IDSA Website. 2015. http://www.idsociety.org/Antimicrobial_Agents. Accessed November 16, 2015.
Vancomycin was isolated in the 1950s, but due to impurities causing adverse events and semisynthetic penicillin production, its use was greatly reduced.1,2 However, this medication gained in popularity 30 years later as a first-line treatment for methicillin-resistant Staphylococcus aureus infections.
In 2009 the Infectious Diseases Society of America (IDSA), American Society of Health System Pharmacists, and Society of Infectious Diseases Pharmacists developed a consensus review of the therapeutic monitoring and dosing of vancomycin in adult patients.3 Trough serum concentration levels are recommended as the most accurate and convenient method to monitor vancomycin. Per IDSA guidelines, an optimal trough is intended to be high enough to clear infections (> 10 mg/L) and prevent the development of vancomycin intermediate and resistant bacteria. Troughs should be obtained just before the next dose in steady-state conditions (starting just before the fourth dose) in patients with normal renal function.
Since the development of these guidelines, vancomycin trough levels are often drawn early.4-7 This may lead to an overestimation of the true trough concentration. A study by Morrison and colleagues in Boston, Massachusetts, found that 41.3% of vancomycin troughs were drawn early, and this resulted in statistically significant increases in the vancomycin concentrations, the rate of vancomycin regimen adjustments (decrease, discontinuation, or holding of dose), and the repeat vancomycin level orders compared with correctly timed troughs.5 It was noted by the study authors that lowering the daily dose of vancomycin based on early trough levels could lead to an underdosing of vancomycin and an increase in intermediate or resistant bacteria.
Related: IDWEEK: Antibiotic ‘time-out’ cut vancomycin use
The prevalence and implications of early trough samples have been measured at only 1 facility, and it is unknown whether these data can be reproduced elsewhere.5 Thus, this study sought to determine the prevalence and corresponding clinical actions of early trough levels at the Captain James A. Lovell Federal Health Care Center (JALFHCC). This is a unique facility that in 2010 combined a VA hospital with a DoD hospital. This facility cares for 67,000 military and retiree beneficiaries each year from southwestern Wisconsin and northwestern Illinois.The primary objective of this study was to measure the rate of early troughs drawn and their resultant effect on vancomycin regimens compared with correctly timed troughs. Secondarily, this study sought to compare the rate of repeated vancomycin trough levels in early vs correctly timed measurements.
Methods
This retrospective cohort analysis compared the outcomes of early and correctly timed vancomycin troughs. This study was approved by the Edward Hines, Jr. VA Hospital and JALFHCC Institutional Review Board. Veteran patients aged ≥ 18 years, hospitalized at JALFHCC, and receiving IV vancomycin at dosing intervals of 8, 12, 24, and 48 hours with measured trough levels between July 1, 2009, and July 1, 2013, were included in this study. Patients were excluded from analysis if vancomycin was given at any schedule other than the previously stated frequencies, they received hemodialysis during the treatment period, or their insurance coverage was through TRICARE (these patients had either active-duty or retired active-duty status).
Potentially eligible patients were identified via a Computerized Patient Records System (CPRS) search for laboratory vancomycin level measurements. The search supplied the researcher with the patient name, vancomycin level date and time, type of vancomycin level (trough or random), and vancomycin concentration. With this information, further data were gathered through CPRS: demographics, type of clinical infection, desired trough level (inferred if not listed in CPRS note), and vancomycin administration time (through the bar code medication administration system [BCMA] in CPRS). This analysis was of troughs, and multiple troughs may have originated from the same patient.
An early trough was defined as a trough taken more than 2 hours earlier than the next theoretical administration time or anytime before the third dose. After a trough was determined to be early or on time, the clinical actions taken during the dosing interval following sample collection were documented. A dose was considered to be held if stated in the BCMA or in a CPRS provider note. A dose was considered to be decreased with a change in frequency or strength that resulted in an overall daily dose decrease. A recollected vancomycin trough was counted within 24 hours of the trough or per a note in CPRS. Finally, observations that noted trends in vancomycin trough management were recorded.
The chi-square test with a significance criterion of 0.05 was used to compare early and on time troughs. Based on the results from the Boston, Massachusetts, study and 1 other study, about 780 vancomycin troughs would be required to meet significance in the primary outcome.5,6
Results
A total of 474 patient charts were reviewed, and 278 met inclusion criteria (196 were excluded). Of the included patients, 799 trough levels were analyzed. Of these, 377 (42.2%) were drawn early. There was no significant difference in the baseline characteristics of the early group vs the correctly timed group (Table 1). Of the early troughs, 190 (56.3%) were drawn prior to the third dose of vancomycin. It was observed that a large portion of these troughs occurred after a vancomycin dose adjustment.
Clinical actions taken after sampling occurred at a rate of 14.5% in the early group and 22.9% in the correctly timed group (P = .003; Table 2). Early troughs led to a 7.7% rate of trough recollection, which was significantly greater than the 1.5% rate in the correctly timed group (P < .001). An analysis of each factor resulting in a clinical action illustrated that the rates of daily dose decrease and discontinued dose were similar between the groups (Table 3). However, the rate of held doses was 8.3% in the early group and 17.1% in the correctly timed group.
This research process yielded some observations. Occasionally a trough was drawn after vancomycin therapy was discontinued and when there was no concern for nephrotoxicity. After the guidelines were published, providers continued to document in CPRS notes to check troughs before the third dose. This incidence decreased over time. Troughs were taken often in patients who were receiving a short course of therapy or who were hemodynamically stable. Finally, documentation of vancomycin regimen changes occasionally did not match the record in the BCMA (in these situations, the BCMA record was used for this study).
Related: Assessment of High Staphylococcus aureus MIC and Poor Patient Outcomes
Discussion
A large portion of trough levels at the JALFHCC were drawn early and did not adhere to the 2009 consensus guidelines. The rates of early troughs in this study and in the Boston, Massachusetts, study are similar.5 However, the 2 studies differed in 1 significant aspect: Clinical actions were taken less often in the early group at JALFHCC, whereas they were taken more often in the early group in the Boston, Massachusetts, study. This dissimilarity could be attributed to a difference in software between the hospitals. In the previous study, trough levels and the time that they were drawn were not displayed together. Thus, clinicians may have been less likely to gauge whether a trough was early. Since this information is available at the JALFHCC, clinicians may have been aware that the trough was early and avoided adjusting treatment (such as holding a dose, as illustrated in the data) based on a falsely elevated trough. This point is further supported by significantly greater amounts of recollected troughs in the early group, suggesting an understanding that the trough was early.
The low trough recollection rate of 7.7% of all early samples could be due to several factors that would prevent a trough redraw. First, medication discontinuation resulting from course completion or sensitivity results would not require further trough monitoring. Second, practitioners may assess the early sample as insignificantly different from a correctly timed one and elect not to redraw the trough. Sometimes a trough was drawn at the correct time, but the time was recorded incorrectly. In this situation, a new trough level would not be necessary. Finally, a lack of sufficient staffing during nights and weekends may result in a delay in interpreting results leading to a missed opportunity for recollection. Additionally, some troughs may not have been redrawn based on a practitioner’s opinion that a trough was not significantly early and did not represent skewed results. Sometimes an incorrect recording of trough draw time reflected that it was taken after vancomycin dosing when it was not.
Specific observations regarding the timing of the trough indicate other possible concerns and areas for improvement. First, providers must cancel future trough orders concurrently with canceling treatment. Second, at the time of publication of the consensus, some providers were slow adopters of the new guidelines. Finally, the IDSA guidelines state that frequent monitoring for short course, lower intensity therapy, or in patients who are hemodynamically stable is not recommended.3 However, troughs were sometimes measured 2 to 3 times weekly in these patients.
Related: Results mixed in hospital efforts to tackle antimicrobial resistance
The data and observations lead to the conclusion that although providers may be able to discern between early and correctly timed troughs, they were not consistently adherent to the 2009 IDSA guidelines. It has been shown that pharmacy involvement of Medicare patients with infections in the intensive care unit has led to better clinical and monetary outcomes.8 Therefore, continued efforts by clinical pharmacists to monitor trough timing can be used to improve adherence and decrease costs (each trough is estimated to cost $16.97).
A study conducted in Australia demonstrated that pharmacist-led education of vancomycin dosing and monitoring (including when to measure a trough level) among prescribers and nurses led to improved adherence to the current guidelines and a greater number of patients treated within desired therapeutic ranges.9 In addition, a small study at the Atlanta VAMC in Georgia demonstrated that education of nurses, lab personnel, residents, ward clerks, and pharmacists led to a greater number of appropriately timed vancomycin and aminoglycoside levels.10 Thus, an interdisciplinary review of the current IDSA guidelines and review on the publication of the anticipated updated vancomycin guidelines should be provided to hospital personnel to aid in adoption of current dosing and monitoring recommendations.11
Limitations
This study is limited by the 4-year span of time that it encompassed, which may give a skewed depiction of current practices. Another limitation is that patients with fluctuating renal function were included in the analysis. Instead of selecting a random level order, a trough level order was sometimes selected for these patients. This could lead to a lower actual rate of early troughs. A third limitation is that this was a small and unblinded study. Also, the actual trough levels and the resulting changes that were made to specific regimens were not recorded. Thus, these data do not indicate whether the changes that were made reflected guideline recommendations. Finally, some clinical actions were taken after the dosing interval following the trough. This was often a result of off-hours lab results or waiting on attending physician or infectious disease guidance. These data were not included in the analysis.
Conclusion
Vancomycin troughs were often drawn too early and resulted in an increased rate of trough recollection. In an attempt to improve adherence to the current and the upcoming revised version of the IDSA consensus statement, it is recommended to educate and reeducate providers through interdisciplinary-led review sessions.
Author disclosures
The authors report no actual or potential conflicts of interest with regard to this article.
Disclaimer
The opinions expressed herein are those of the authors and do not necessarily reflect those of Federal Practitioner, Frontline Medical Communications Inc., the U.S. Government, or any of its agencies. This article may discuss unlabeled or investigational use of certain drugs. Please review the complete prescribing information for specific drugs or drug combinations—including indications, contraindications, warnings, and adverse effects—before administering pharmacologic therapy to patients.
1. Moellering RC Jr. Vancomycin: a 50-year reassessment. Clin Infect Dis. 2006;42(suppl 1):S3-S4.
2. Levine DP. Vancomycin: a history. Clin Infect Dis. 2006;42(suppl 1):S5-S12.
3. Rybak MJ, Lomaestro BM, Rotschafer JC, et al. Therapeutic monitoring of vancomycin in adults summary of consensus recommendations from the American Society of Health-System Pharmacists, the Infectious Diseases Society of America, and the Society of Infectious Diseases Pharmacists. Pharmacotherapy. 2009;29(11):1275-1279.
4. Davis SL, Scheetz MH, Bosso JA, Goff DA, Rybak MJ. Adherence to the 2009 consensus guidelines for vancomycin dosing and monitoring practices: a cross-sectional survey of U.S. hospitals. Pharmacotherapy. 2013;33(12):1256-1263.
5. Morrison AP, Melanson SEF, Carty MG, Bates DW, Szumita PM, Tanasijevic MJ. What proportion of vancomycin trough levels are drawn too early? Frequency and impact on clinical actions. Am J Clin Pathol. 2012;137(3):472-478.
6. Traugott KA, Maxwell PR, Green K, Frei C, Lewis JS 2nd. Effects of therapeutic drug monitoring criteria in a computerized prescriber-order-entry system on the appropriateness of vancomycin level orders. Am J Health Syst Pharm. 2011;68(4):347-352.
7. Melanson SE, Mijailovic AS, Wright AP, Szumita PM, Bates DW, Tanasijevic MJ. An intervention to improve the timing of vancomycin levels. Am J Clin Pathol. 2013;140(6):801-806.
8. MacLaren R, Bond CA, Martin SJ, Fike D. Clinical and economic outcomes of involving pharmacists in the direct care of critically ill patients with infections. Crit Care Med. 2008;36(12):3184-3189.
9. Phillips CJ, Doan H, Quinn S, Kirkpatrick CM, Gordon DL, Doogue MP. An educational intervention to improve vancomycin prescribing and monitoring. Int J Antimicrob Agents. 2013;41(4):393-394.
10. Carroll DJ, Austin GE, Stajich GV, Miyrhaya RK, Murphy JE, Ward ES. Effect of education on the appropriateness of serum drug concentration determination. Ther Drug Monit. 1992;14(1):81-84.
11. Infectious Diseases Society of America (IDSA). IDSA practice guidelines: antimicrobial agent use. IDSA Website. 2015. http://www.idsociety.org/Antimicrobial_Agents. Accessed November 16, 2015.
Shared Medical Appointments and Their Effects on Achieving Diabetes Mellitus Goals in a Veteran Population
In 2012, 9.3% of the U.S. population had diabetes mellitus (DM).1 According to the American Diabetes Association, in 2012, the total cost of diagnosed DM in the U.S. was $245 billion.2 Diabetes mellitus is a leading cause of blindness, end-stage renal disease, and amputation in the U.S.3 Up to 80% of patients with DM will develop or die of macrovascular disease, such as heart attack or stroke.3
Diabetes mellitus is a chronic disease of epidemic proportion with management complexity that threatens to overwhelm providers in the acute care and primary care settings. Limited specialist availability and increased wait times continue to afflict the VA health care system, prompting efforts to increase health care provider (HCP) access and improve clinic efficiency.4 One of the methods proposed to increase HCP access and maximize clinic efficiency is the shared medical appointment (SMA).5,6
The SMA was designed to improve access and quality of care through enhanced education and support. With the number of people living with chronic diseases on the rise, the current patient-provider model is unrealistic in today’s health care environment. Shared medical appointments offer a unique format for providing evidence-based chronic disease management in which patients and a multidisciplinary team of providers collaborate toward education, discussion, and medication management in a supportive environment.7 Research has suggested that SMAs are a successful way to manage type 2 DM (T2DM).8,9 However, there is uncertainty regarding the optimal model design. The goals of this study were to evaluate whether the diabetes SMA at the Adam Benjamin, Jr. (ABJ) community-based outpatient clinic (CBOC) was an effective practice model for achieving improvements in glycemic control and to use subgroup analyses to elucidate unique characteristics about SMAs that may have been correlated with clinical success. This study may provide valuable information for other facilities considering SMAs.
Overview
The Jesse Brown VAMC (JBVAMC) and the ABJ CBOC implemented a T2DM-focused SMA in 2011. The ABJ CBOC multidisciplinary SMA team consisted of a medical administration service clerk, a registered dietician, a certified DM educator, a registered nurse, a nurse practitioner (NP), and a clinical pharmacy specialist (CPS). This team collaborated to deliver high-quality care to patients with poorly controlled T2DM to improve their glycemic control as well as clinical knowledge of their disease. A private conference room at the ABJ CBOC served as the location for the SMAs. This room was divided into 2 adjacent areas: One area with tables was organized in a semicircle to promote group discussion as well as minimize isolated conversations; the other area had computer terminals to facilitate individualized medication management. Other equipment included a scale for obtaining patient weights and various audio-visual devices.
The ABJ CBOC offered monthly SMAs. The team made several attempts to maximize SMA show rates, as previous studies indicated that low SMA show rates were a barrier to success.3,4,7-9 One review reported no-show rates as high as 70% in certain group visit models.4 About 2 weeks prior to a session, prospective SMA patients received automated and customized preappointment letters. Automated and customized phone call reminders were made to prospective SMA patients a few days before each session. As many as 18 patients participated in a single ABJ SMA.
The ABJ SMAs lasted from 60 to 90 minutes, depending on the level of patient participation and the size of the group. The first half of the SMA was dedicated to a group discussion, which involved the SMA team, the patient, and the patient’s family (if desired). The topic of conversation was typically guided by patient curiosity and knowledge deficits in a spontaneous and free-flowing manner; for this reason, these sessions were considered to be open.
The team also engaged in more structured focused sessions, which limited the spontaneous flow of conservation and narrowed the scope to provide targeted education about various aspects of T2DM care. During focused sessions, services such as dental, optometry, podiatry, MOVE! (a VA self-management weight reduction program), and nutrition also participated. Focused sessions addressed topics such as hypoglycemia management, eating around the holidays, sick-day management of T2DM, grocery shopping, exercise, oral health, eye care, and foot care. The specialty services were encouraged to be creative and interactive during the SMA. Many of these services used supportive literature, demonstrations, diagrams, and props to enrich the educational experience. Group discussion typically lasted 30 to 40 minutes; after which patients met individually with either a CPS or NP for medication management.
Medication management focused on optimizing T2DM therapy (both oral and injectable) to improve glycemic control. Interventions outside of T2DM therapy (eg, cholesterol, hypertension, and other risk reduction modalities) were not made, due to time constraints. Once a patient demonstrated improved working knowledge of T2DM and a clinically significant reduction in their glycosylated hemoglobin A1c (A1c) they were discharged from SMAs at the discretion of the SMA team. There was no set minimum or maximum duration for the SMAs.
Methods
This study was a retrospective chart review conducted at the JBVAMC and was approved by the institutional review board and the research and development committee. Patient confidentiality was maintained by identifying patients by means other than name or unique identifiers. Protected health information was accessible only by the aforementioned investigators. There was no direct patient contact during this study.
Patient lists were generated from the computerized patient record system (CPRS). Patients were tracked up to 6 months after SMA discharge or until the last SMA in which they participated. The control group was matched according to location, age, glycemic control, and time. The control group never attended an ABJ SMA but may have received regular care through their primary care provider, CPS, or endocrinologist. Prospective control group patients were randomized and reviewed sequentially to obtain the matched cohort.
The study took place at ABJ, an outpatient clinic serving veterans in northwest Indiana and surrounding areas. Inclusion criteria for the SMA group were patients with T2DM, aged ≥ 45 years, with an A1c ≥ 8.5% seen at ABJ for T2DM from May 1, 2011, to June 30, 2013. The control group included patients with T2DM, aged ≥ 45 years, with an A1c > 9% who never attended SMAs but may have received regular care at ABJ during the study period. The SMA group’s inclusion criteria threshold for A1c was lower in order to maximize sample size. The control group’s inclusion criteria threshold for A1c was higher due to use of a default reminder report called “A1c > 9%” to generate patient lists. Patients were excluded from the study if they did not meet inclusion criteria.
Baseline datum was the most recent parameter available in CPRS prior to enrollment. The endpoint datum was the parameter nearest the time of SMA discharge or the first available parameter within 6 months from the date of discharge. In the control group, the baseline datum was the initial parameter during the study period and the endpoint datum was the closest measure to 4 months after baseline. Four months was chosen to allow for at least 1 A1c measurement during the study period. In addition, it was estimated (prior to collecting any data) that 4 months was the average time a patient participated in SMAs. Serial A1c measurements were defined as values obtained at SMA discharge and 3- and 6-months postdischarge. These parameters were used to evaluate the sustainability of improvements in glycemic control. All values falling outside of these defined parameters were excluded.
Related: Experiences of Veterans With Diabetes From Shared Medical Appointments
The data analysis compared A1c change from baseline to endpoint for the SMA and control groups. Data collection included baseline characteristics, SMA show rate, number of SMA patients seen by a CPS or NP, number and type of SMA interventions made by a CPS or NP, and the number and type of non-SMA interventions made during the study period. Intervention types were medications: added, discontinued, or titrated; and other, defined as referrals made to specialty services (such as dental, optometry, and podiatry).
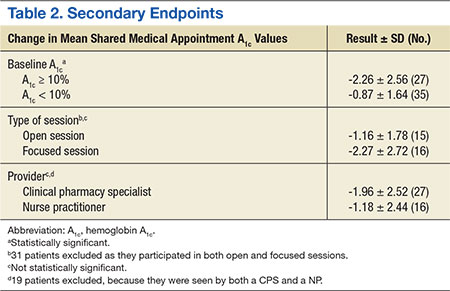
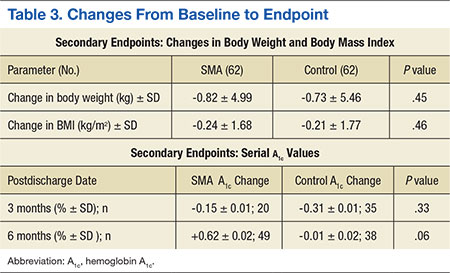
Secondary endpoints included the number of SMAs and glycemic improvement, SMA format style (open- vs focused session) and glycemic improvement, SMA provider (CPS vs NP) and glycemic improvement, the change in A1c stratified by baseline A1c (A1c ≥ 10% vs < 10%), the change in actual body weight (ABW) and body mass index (BMI), and maintenance of A1c (3- and 6-months postdischarge).
The primary endpoint was evaluated using a 2-sample Student t test. Secondary endpoints were evaluated using the independent t test. Statistical significance was defined as P < .05.
Results
A total of 129 unique patients were scheduled for SMAs, 62 of which met inclusion criteria and were included in the SMA group. During enrollment, 67 patients were excluded: 55 never participated in SMAs, 6 had baseline A1c values < 8.5%, 4 had insufficient data, and 2 were aged < 45 years. A total of 29 SMAs were conducted during the study period, and patients attended an average of 3.15 ± 2.14 (SD) SMAs. The average attendance at each SMA was 7.1 ± 2.62 (SD) patients. For the control group, 754 unique patients were identified and randomized. A total of 90 charts were sequentially reviewed in order to obtain the 62 patients for the control group.
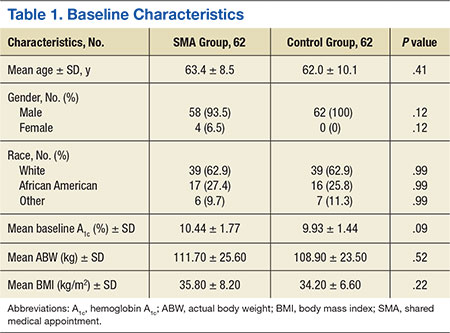
Baseline characteristics were balanced between groups. However, there were more women in the SMA group vs the control group (Table 1). Within the control group, there were a total of 107 appointments that addressed T2DM, which averaged 1.72 ± 1.51 (SD) appointments per patient. The total number of interventions made in the SMA group was 192: 64.6% (124) by a CPS and 35.4% (68) by a NP. For the CPS, the most frequent intervention was medication titration (69.5%), followed by other (23.5%), medication addition (4%), and medication discontinuation (3%). Of note, 53.2% (33) of the SMA patients were seen an average of 1.2 times by non-SMA providers. The SMA patients had a total of 45 non-SMA interventions (0.73 per patient) during the study period.
For the primary endpoint, the SMA group had a 1.48% ± 0.02 (SD) reduction in A1c compared with a 0.6% ± 0.02 (SD) decrease in the control group (P = .01). When evaluating mean changes in A1c by the number of SMAs attended, it was noted that participation in ≥ 6 SMAs led to the greatest reduction in A1c of 2.08%. In the SMA group, it was noted that patients with higher A1c values at baseline demonstrated greater improvements in glycemic control compared with patients with lower baseline A1c values. The mean change in A1c, stratified by baseline A1c, was -2.26% for those with baseline A1c values ≥ 10% and -0.87% for those with baseline A1c values < 10%.
In evaluating the format style, open- vs focused-session, it was observed that participation in focused sessions led to greater improvements in glycemic control. Furthermore, when stratified by provider, greater improvements in glycemic control were demonstrated when medication management was completed by a CPS vs a NP (Table 2). The average number of interventions per SMA patient was 3.1 ± 2.22 (SD). For the control group, the total number of interventions made was 86, with an average of 1.37 ± 1.51 (SD) per patient. The overall show rate was 49% ± 16 (SD), 52% ± 16 (SD) for open visits, and 46% ± 15 (SD) for focused visits. The mean change in ABW and BMI from baseline to endpoint was no different between the SMA and control groups (Table 3). The SMA group participants demonstrated a decrease in A1c at 3 months postdischarge, and a moderate increase in A1c was noted at 6 months postdischarge.
Discussion
Shared medical appointments provide an effective alternative to standards of care in order to obtain improvements in glycemic control. Consistent with previous studies, this study reported significant improvements in glycemic control in the SMA group vs the control group. This study also elucidated unique characteristics about SMAs that may have been correlated with clinical success.
Although the greatest improvements in glycemic control were noted for those who participated in ≥ 6 SMAs, it was observed that participation in only 1 SMA also led to improvements. For a site with limited staff and a high volume of patients waiting to participate in SMAs, it may be mutually beneficial to offer only 1 SMA per patient. In addition, patients with ≥ 10% A1c at baseline demonstrated greater improvements in glycemic control compared to those with < 10% A1c at baseline. The reasons the higher baseline A1c subgroup responded to interventions more robustly are unclear and likely multifactorial. Nonetheless, factors such as psychosocial influences (eg, peer pressure to get healthy) may have increased motivation to prevent complications and improved medication adherence in the setting of closer follow-up. Additionally, hyperresponsiveness to drug therapy may have played a role. Regardless, for new SMA programs interested in making an immediate impact, it may be advantageous to initially select patients with very poorly controlled DM.
A unique aspect of the ABJ SMA was the variety of focused sessions offered. Previous studies did not demonstrate such a variety of focused sessions, nor did they evaluate the impact of a focused visit on the patient’s T2DM control. Participation in focused ABJ SMA sessions may have led to improved T2DM control, which may be attributed to the value patients assigned to specialty care and an increased motivation to get healthy.
Related: SGLT2 Inhibitors for Type 2 Diabetes Mellitus Treatment
Another factor that may have led to improved T2DM control was CPS involvement with medication management. The presence of a NP was highly valued, both from a group discussion and medication management standpoint; still, it is a good idea to involve a CPS who has a strong command of DM pharmacotherapy. One shortcoming of this SMA program was the inability for patients to maintain glycemic improvements 6 months after discharge. This pitfall was likely the result of suboptimal coordination of care after SMA discharge and may be avoided by asking the medical administration service clerk to promptly schedule discharged SMA patients for a general medicine clinic T2DM follow-up.The SMA patients had more T2DM interventions within the same time frame compared with the control patients. Although not causative, the increased number of interventions in addition to the bolstered support of the SMA may have correlated with glycemic improvements.
An important finding of this study was the SMA show rate and how it compared with attendance rates found in other group models. The favorable ABJ SMA show rate could have been due to the rigorous attention paid to reminder letters and phone calls. The literature has not established a standard approach to increasing SMA show rates; however, the current data suggest that increased reminders may have increased attendance.
Limitations
This study had several limitations. The external validity was weakened by the modest sample size and the homogenous baseline characteristics of those enrolled. Another limitation was inconsistent documentation of laboratory parameters. The inability to obtain A1c values exactly at enrollment and discharge could have potentially skewed the results. In addition, incomplete documentation of interventions for dual-care patients (ie, those who obtained care outside of the VA) was an unavoidable challenge. Last, this study did not perform an assessment of SMA patient satisfaction, cost-benefit, or safety.
Conclusion
The ABJ SMA was an effective addition to standards of care in order to achieve improvements in glycemic control in a veteran population with poorly controlled T2DM. Furthermore,the data suggest that a successful program should be multidisciplinary, select poorly controlled patients, offer focused sessions, have a CPS participate in medication management, and encourage patients to complete ≥ 6 sessions. Future studies should be conducted to include more diverse patients to see whether the efficacy of this SMA format is maintained.
A safety analysis should also be conducted to ensure that the SMA format is not only effective, but also a safe means to manage medical conditions. In addition, the scope of the ABJ SMAs should be expanded to allow for evaluation of other diseases. An evaluation of patient satisfaction and cost-benefit could provide additional support for the implementation of SMAs, as improvements in quality of life and cost savings are endpoints to be desired.
Author disclosures
The authors report no actual or potential conflicts of interest with regard to this article.
Disclaimer
The opinions expressed herein are those of the authors and do not necessarily reflect those of Federal Practitioner, Frontline Medical Communications Inc., the U.S. Government, or any of its agencies. This article may discuss unlabeled or investigational use of certain drugs. Please review complete prescribing information for specific drugs or drug combinations—including indications, contraindications, warnings, and adverse effects—before administering pharmacologic therapy to patients.
1. Centers for Disease Control and Prevention. National Diabetes Statistics Report: Estimate of Diabetes and Its Burden in the United States, 2014. Atlanta, GA: U.S. Department of Health and Human Services; 2014.
2. American Diabetes Association. Economic costs of diabetes in the U.S. in 2012. Diabetes Care. 2013;36(4):1033-1046.
3. Kirsh SR, Watts S, Pascuzzi K, et al. Shared medical appointments based on the chronic care model: a quality improvement project to address the challenges of patients with diabetes with high cardiovascular risk. Qual Saf Health Care. 2007;16(5):349-353.
4. Jaber R, Braksmajer A, Trilling JS. Group visits: a qualitative review of current research. J Am Board Fam Med. 2006;19(3):276-290.
5. Klein S. The Veterans Health Administration: implementing patient-centered medical homes in the nation's largest integrated delivery system. Commonwealth Fund Website. http://www.common wealthfund.org/publications/case-studies/2011 /sep/va-medical-homes. Published September 2011. Accessed November 11, 2015.
6. U.S. Department of Veterans Affairs. VA Shared Medical Appointments for Patients With Diabetes: Maximizing Patient & Provider Expertise to Strengthen Patient Management. Washington, DC: U.S. Department of Veterans Affairs; 2008.
7. Bronson DL, Maxwell RA. Shared medical appointments: increasing patient access without increasing physician hours. Cleve Clin J Med. 2004;71(5):369-370, 372, 374 passim.
8. Cohen LB, Taveira T, Khatana SA, Dooley AG, Pirraglia PA, Wu WC. Pharmacist-led shared medical appointments for multiple cardiovascular risk reduction in patients with type 2 diabetes. Diabetes Educ. 2011;37(6):801-812.
9. Naik AD, Palmer N, Petersen NJ, et al. Comparative effectiveness of goal setting in diabetes mellitus group clinics: randomized clinical trial. Arch Intern Med. 2011;171(5):453-459.
In 2012, 9.3% of the U.S. population had diabetes mellitus (DM).1 According to the American Diabetes Association, in 2012, the total cost of diagnosed DM in the U.S. was $245 billion.2 Diabetes mellitus is a leading cause of blindness, end-stage renal disease, and amputation in the U.S.3 Up to 80% of patients with DM will develop or die of macrovascular disease, such as heart attack or stroke.3
Diabetes mellitus is a chronic disease of epidemic proportion with management complexity that threatens to overwhelm providers in the acute care and primary care settings. Limited specialist availability and increased wait times continue to afflict the VA health care system, prompting efforts to increase health care provider (HCP) access and improve clinic efficiency.4 One of the methods proposed to increase HCP access and maximize clinic efficiency is the shared medical appointment (SMA).5,6
The SMA was designed to improve access and quality of care through enhanced education and support. With the number of people living with chronic diseases on the rise, the current patient-provider model is unrealistic in today’s health care environment. Shared medical appointments offer a unique format for providing evidence-based chronic disease management in which patients and a multidisciplinary team of providers collaborate toward education, discussion, and medication management in a supportive environment.7 Research has suggested that SMAs are a successful way to manage type 2 DM (T2DM).8,9 However, there is uncertainty regarding the optimal model design. The goals of this study were to evaluate whether the diabetes SMA at the Adam Benjamin, Jr. (ABJ) community-based outpatient clinic (CBOC) was an effective practice model for achieving improvements in glycemic control and to use subgroup analyses to elucidate unique characteristics about SMAs that may have been correlated with clinical success. This study may provide valuable information for other facilities considering SMAs.
Overview
The Jesse Brown VAMC (JBVAMC) and the ABJ CBOC implemented a T2DM-focused SMA in 2011. The ABJ CBOC multidisciplinary SMA team consisted of a medical administration service clerk, a registered dietician, a certified DM educator, a registered nurse, a nurse practitioner (NP), and a clinical pharmacy specialist (CPS). This team collaborated to deliver high-quality care to patients with poorly controlled T2DM to improve their glycemic control as well as clinical knowledge of their disease. A private conference room at the ABJ CBOC served as the location for the SMAs. This room was divided into 2 adjacent areas: One area with tables was organized in a semicircle to promote group discussion as well as minimize isolated conversations; the other area had computer terminals to facilitate individualized medication management. Other equipment included a scale for obtaining patient weights and various audio-visual devices.
The ABJ CBOC offered monthly SMAs. The team made several attempts to maximize SMA show rates, as previous studies indicated that low SMA show rates were a barrier to success.3,4,7-9 One review reported no-show rates as high as 70% in certain group visit models.4 About 2 weeks prior to a session, prospective SMA patients received automated and customized preappointment letters. Automated and customized phone call reminders were made to prospective SMA patients a few days before each session. As many as 18 patients participated in a single ABJ SMA.
The ABJ SMAs lasted from 60 to 90 minutes, depending on the level of patient participation and the size of the group. The first half of the SMA was dedicated to a group discussion, which involved the SMA team, the patient, and the patient’s family (if desired). The topic of conversation was typically guided by patient curiosity and knowledge deficits in a spontaneous and free-flowing manner; for this reason, these sessions were considered to be open.
The team also engaged in more structured focused sessions, which limited the spontaneous flow of conservation and narrowed the scope to provide targeted education about various aspects of T2DM care. During focused sessions, services such as dental, optometry, podiatry, MOVE! (a VA self-management weight reduction program), and nutrition also participated. Focused sessions addressed topics such as hypoglycemia management, eating around the holidays, sick-day management of T2DM, grocery shopping, exercise, oral health, eye care, and foot care. The specialty services were encouraged to be creative and interactive during the SMA. Many of these services used supportive literature, demonstrations, diagrams, and props to enrich the educational experience. Group discussion typically lasted 30 to 40 minutes; after which patients met individually with either a CPS or NP for medication management.
Medication management focused on optimizing T2DM therapy (both oral and injectable) to improve glycemic control. Interventions outside of T2DM therapy (eg, cholesterol, hypertension, and other risk reduction modalities) were not made, due to time constraints. Once a patient demonstrated improved working knowledge of T2DM and a clinically significant reduction in their glycosylated hemoglobin A1c (A1c) they were discharged from SMAs at the discretion of the SMA team. There was no set minimum or maximum duration for the SMAs.
Methods
This study was a retrospective chart review conducted at the JBVAMC and was approved by the institutional review board and the research and development committee. Patient confidentiality was maintained by identifying patients by means other than name or unique identifiers. Protected health information was accessible only by the aforementioned investigators. There was no direct patient contact during this study.
Patient lists were generated from the computerized patient record system (CPRS). Patients were tracked up to 6 months after SMA discharge or until the last SMA in which they participated. The control group was matched according to location, age, glycemic control, and time. The control group never attended an ABJ SMA but may have received regular care through their primary care provider, CPS, or endocrinologist. Prospective control group patients were randomized and reviewed sequentially to obtain the matched cohort.
The study took place at ABJ, an outpatient clinic serving veterans in northwest Indiana and surrounding areas. Inclusion criteria for the SMA group were patients with T2DM, aged ≥ 45 years, with an A1c ≥ 8.5% seen at ABJ for T2DM from May 1, 2011, to June 30, 2013. The control group included patients with T2DM, aged ≥ 45 years, with an A1c > 9% who never attended SMAs but may have received regular care at ABJ during the study period. The SMA group’s inclusion criteria threshold for A1c was lower in order to maximize sample size. The control group’s inclusion criteria threshold for A1c was higher due to use of a default reminder report called “A1c > 9%” to generate patient lists. Patients were excluded from the study if they did not meet inclusion criteria.
Baseline datum was the most recent parameter available in CPRS prior to enrollment. The endpoint datum was the parameter nearest the time of SMA discharge or the first available parameter within 6 months from the date of discharge. In the control group, the baseline datum was the initial parameter during the study period and the endpoint datum was the closest measure to 4 months after baseline. Four months was chosen to allow for at least 1 A1c measurement during the study period. In addition, it was estimated (prior to collecting any data) that 4 months was the average time a patient participated in SMAs. Serial A1c measurements were defined as values obtained at SMA discharge and 3- and 6-months postdischarge. These parameters were used to evaluate the sustainability of improvements in glycemic control. All values falling outside of these defined parameters were excluded.
Related: Experiences of Veterans With Diabetes From Shared Medical Appointments
The data analysis compared A1c change from baseline to endpoint for the SMA and control groups. Data collection included baseline characteristics, SMA show rate, number of SMA patients seen by a CPS or NP, number and type of SMA interventions made by a CPS or NP, and the number and type of non-SMA interventions made during the study period. Intervention types were medications: added, discontinued, or titrated; and other, defined as referrals made to specialty services (such as dental, optometry, and podiatry).
Secondary endpoints included the number of SMAs and glycemic improvement, SMA format style (open- vs focused session) and glycemic improvement, SMA provider (CPS vs NP) and glycemic improvement, the change in A1c stratified by baseline A1c (A1c ≥ 10% vs < 10%), the change in actual body weight (ABW) and body mass index (BMI), and maintenance of A1c (3- and 6-months postdischarge).
The primary endpoint was evaluated using a 2-sample Student t test. Secondary endpoints were evaluated using the independent t test. Statistical significance was defined as P < .05.
Results
A total of 129 unique patients were scheduled for SMAs, 62 of which met inclusion criteria and were included in the SMA group. During enrollment, 67 patients were excluded: 55 never participated in SMAs, 6 had baseline A1c values < 8.5%, 4 had insufficient data, and 2 were aged < 45 years. A total of 29 SMAs were conducted during the study period, and patients attended an average of 3.15 ± 2.14 (SD) SMAs. The average attendance at each SMA was 7.1 ± 2.62 (SD) patients. For the control group, 754 unique patients were identified and randomized. A total of 90 charts were sequentially reviewed in order to obtain the 62 patients for the control group.
Baseline characteristics were balanced between groups. However, there were more women in the SMA group vs the control group (Table 1). Within the control group, there were a total of 107 appointments that addressed T2DM, which averaged 1.72 ± 1.51 (SD) appointments per patient. The total number of interventions made in the SMA group was 192: 64.6% (124) by a CPS and 35.4% (68) by a NP. For the CPS, the most frequent intervention was medication titration (69.5%), followed by other (23.5%), medication addition (4%), and medication discontinuation (3%). Of note, 53.2% (33) of the SMA patients were seen an average of 1.2 times by non-SMA providers. The SMA patients had a total of 45 non-SMA interventions (0.73 per patient) during the study period.
For the primary endpoint, the SMA group had a 1.48% ± 0.02 (SD) reduction in A1c compared with a 0.6% ± 0.02 (SD) decrease in the control group (P = .01). When evaluating mean changes in A1c by the number of SMAs attended, it was noted that participation in ≥ 6 SMAs led to the greatest reduction in A1c of 2.08%. In the SMA group, it was noted that patients with higher A1c values at baseline demonstrated greater improvements in glycemic control compared with patients with lower baseline A1c values. The mean change in A1c, stratified by baseline A1c, was -2.26% for those with baseline A1c values ≥ 10% and -0.87% for those with baseline A1c values < 10%.
In evaluating the format style, open- vs focused-session, it was observed that participation in focused sessions led to greater improvements in glycemic control. Furthermore, when stratified by provider, greater improvements in glycemic control were demonstrated when medication management was completed by a CPS vs a NP (Table 2). The average number of interventions per SMA patient was 3.1 ± 2.22 (SD). For the control group, the total number of interventions made was 86, with an average of 1.37 ± 1.51 (SD) per patient. The overall show rate was 49% ± 16 (SD), 52% ± 16 (SD) for open visits, and 46% ± 15 (SD) for focused visits. The mean change in ABW and BMI from baseline to endpoint was no different between the SMA and control groups (Table 3). The SMA group participants demonstrated a decrease in A1c at 3 months postdischarge, and a moderate increase in A1c was noted at 6 months postdischarge.
Discussion
Shared medical appointments provide an effective alternative to standards of care in order to obtain improvements in glycemic control. Consistent with previous studies, this study reported significant improvements in glycemic control in the SMA group vs the control group. This study also elucidated unique characteristics about SMAs that may have been correlated with clinical success.
Although the greatest improvements in glycemic control were noted for those who participated in ≥ 6 SMAs, it was observed that participation in only 1 SMA also led to improvements. For a site with limited staff and a high volume of patients waiting to participate in SMAs, it may be mutually beneficial to offer only 1 SMA per patient. In addition, patients with ≥ 10% A1c at baseline demonstrated greater improvements in glycemic control compared to those with < 10% A1c at baseline. The reasons the higher baseline A1c subgroup responded to interventions more robustly are unclear and likely multifactorial. Nonetheless, factors such as psychosocial influences (eg, peer pressure to get healthy) may have increased motivation to prevent complications and improved medication adherence in the setting of closer follow-up. Additionally, hyperresponsiveness to drug therapy may have played a role. Regardless, for new SMA programs interested in making an immediate impact, it may be advantageous to initially select patients with very poorly controlled DM.
A unique aspect of the ABJ SMA was the variety of focused sessions offered. Previous studies did not demonstrate such a variety of focused sessions, nor did they evaluate the impact of a focused visit on the patient’s T2DM control. Participation in focused ABJ SMA sessions may have led to improved T2DM control, which may be attributed to the value patients assigned to specialty care and an increased motivation to get healthy.
Related: SGLT2 Inhibitors for Type 2 Diabetes Mellitus Treatment
Another factor that may have led to improved T2DM control was CPS involvement with medication management. The presence of a NP was highly valued, both from a group discussion and medication management standpoint; still, it is a good idea to involve a CPS who has a strong command of DM pharmacotherapy. One shortcoming of this SMA program was the inability for patients to maintain glycemic improvements 6 months after discharge. This pitfall was likely the result of suboptimal coordination of care after SMA discharge and may be avoided by asking the medical administration service clerk to promptly schedule discharged SMA patients for a general medicine clinic T2DM follow-up.The SMA patients had more T2DM interventions within the same time frame compared with the control patients. Although not causative, the increased number of interventions in addition to the bolstered support of the SMA may have correlated with glycemic improvements.
An important finding of this study was the SMA show rate and how it compared with attendance rates found in other group models. The favorable ABJ SMA show rate could have been due to the rigorous attention paid to reminder letters and phone calls. The literature has not established a standard approach to increasing SMA show rates; however, the current data suggest that increased reminders may have increased attendance.
Limitations
This study had several limitations. The external validity was weakened by the modest sample size and the homogenous baseline characteristics of those enrolled. Another limitation was inconsistent documentation of laboratory parameters. The inability to obtain A1c values exactly at enrollment and discharge could have potentially skewed the results. In addition, incomplete documentation of interventions for dual-care patients (ie, those who obtained care outside of the VA) was an unavoidable challenge. Last, this study did not perform an assessment of SMA patient satisfaction, cost-benefit, or safety.
Conclusion
The ABJ SMA was an effective addition to standards of care in order to achieve improvements in glycemic control in a veteran population with poorly controlled T2DM. Furthermore,the data suggest that a successful program should be multidisciplinary, select poorly controlled patients, offer focused sessions, have a CPS participate in medication management, and encourage patients to complete ≥ 6 sessions. Future studies should be conducted to include more diverse patients to see whether the efficacy of this SMA format is maintained.
A safety analysis should also be conducted to ensure that the SMA format is not only effective, but also a safe means to manage medical conditions. In addition, the scope of the ABJ SMAs should be expanded to allow for evaluation of other diseases. An evaluation of patient satisfaction and cost-benefit could provide additional support for the implementation of SMAs, as improvements in quality of life and cost savings are endpoints to be desired.
Author disclosures
The authors report no actual or potential conflicts of interest with regard to this article.
Disclaimer
The opinions expressed herein are those of the authors and do not necessarily reflect those of Federal Practitioner, Frontline Medical Communications Inc., the U.S. Government, or any of its agencies. This article may discuss unlabeled or investigational use of certain drugs. Please review complete prescribing information for specific drugs or drug combinations—including indications, contraindications, warnings, and adverse effects—before administering pharmacologic therapy to patients.
1. Centers for Disease Control and Prevention. National Diabetes Statistics Report: Estimate of Diabetes and Its Burden in the United States, 2014. Atlanta, GA: U.S. Department of Health and Human Services; 2014.
2. American Diabetes Association. Economic costs of diabetes in the U.S. in 2012. Diabetes Care. 2013;36(4):1033-1046.
3. Kirsh SR, Watts S, Pascuzzi K, et al. Shared medical appointments based on the chronic care model: a quality improvement project to address the challenges of patients with diabetes with high cardiovascular risk. Qual Saf Health Care. 2007;16(5):349-353.
4. Jaber R, Braksmajer A, Trilling JS. Group visits: a qualitative review of current research. J Am Board Fam Med. 2006;19(3):276-290.
5. Klein S. The Veterans Health Administration: implementing patient-centered medical homes in the nation's largest integrated delivery system. Commonwealth Fund Website. http://www.common wealthfund.org/publications/case-studies/2011 /sep/va-medical-homes. Published September 2011. Accessed November 11, 2015.
6. U.S. Department of Veterans Affairs. VA Shared Medical Appointments for Patients With Diabetes: Maximizing Patient & Provider Expertise to Strengthen Patient Management. Washington, DC: U.S. Department of Veterans Affairs; 2008.
7. Bronson DL, Maxwell RA. Shared medical appointments: increasing patient access without increasing physician hours. Cleve Clin J Med. 2004;71(5):369-370, 372, 374 passim.
8. Cohen LB, Taveira T, Khatana SA, Dooley AG, Pirraglia PA, Wu WC. Pharmacist-led shared medical appointments for multiple cardiovascular risk reduction in patients with type 2 diabetes. Diabetes Educ. 2011;37(6):801-812.
9. Naik AD, Palmer N, Petersen NJ, et al. Comparative effectiveness of goal setting in diabetes mellitus group clinics: randomized clinical trial. Arch Intern Med. 2011;171(5):453-459.
Complete Closing Wedge Osteotomy for Correction of Blount Disease (Tibia Vara): A Technique
Blount disease (tibia vara) is an angular tibia deformity that includes varus, increased posterior slope, and internal rotation. This deformity was first described in 1922 by Erlacher1 in Germany. In 1937, Walter Blount2 reported on it in the United States. It is the most common cause of pathologic genu varum in adolescence and childhood.
An oblique incomplete closing wedge osteotomy of the proximal tibial metaphysis was described by Wagner3 for the treatment of unicompartmental osteoarthrosis of the knee in adults. Laurencin and colleagues4 applied this technique to the treatment of pediatric tibia vara with favorable results. They spared the medial cortex of the tibia in their incomplete closing wedge osteotomy technique. In each of the 9 cases we treated and describe here, we accidentally completed the tibial osteotomy when attempting the Laurencin technique. Given that the osteotomy was completed, we modified the Laurencin technique by using a 6-hole, 4.5-mm compression plate rather than a 5-hole semitubular plate, and added a large oblique screw from the medial side to compress the osteotomy site and to protect the plate from fracture. In addition, in 2 patients who weighed more than 250 pounds, we used an external fixator for additional stability. In this article, we report the outcomes of correcting adolescent tibia vara with a complete closing wedge tibial osteotomy and an oblique fibular osteotomy.
Materials and Methods
This study was approved by the Institutional Review Board at Pennsylvania State University. Between 2009 and 2012, we performed 9 complete oblique proximal tibial lateral closing wedge osteotomies on 8 patients (2 girls, 6 boys). In each case, the primary diagnosis was Blount disease. One patient also had renal dysplasia and was receiving dialysis. Mean age at time of operation was 15 years (range, 13-17 years). Mean preoperative weight was 215 pounds (range, 119-317 lb). Mean weight gain at follow-up was 4.39 pounds (range, –10 to 19 lb). Mean body mass index (BMI) was 38 (range, 25-48) (Table). All patients had varus angulation of the proximal tibia before surgery. Mean preoperative varus on standing films was 22° (range, 10°-36°). Because of the patients’ size, we used standing long-leg radiographs, on individual cassettes, for each leg.
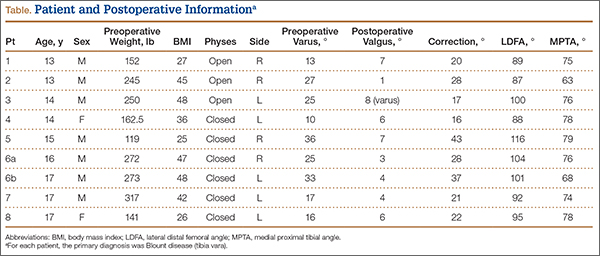
Surgical Technique
Before surgery, we use paper cutouts to template the osteotomy wedge. We also use perioperative antibiotics and a standard time-out. For visualization of the entire leg for accurate correction, we prepare and drape the entire leg. A sterile tourniquet is used. At the midshaft of the fibula, a 4-cm incision is made, and dissection is carefully carried down to the fibula. Subperiosteal dissection is performed about the fibula, allowing adequate clearance for an oblique osteotomy. The osteotomy removes about 1 cm of fibula, which is to be used as bone graft for the tibial osteotomy. In addition, a lateral compartment fasciotomy is performed to prevent swelling-related complications. The wound is irrigated and injected with bupivacaine and closed in routine fashion.
We then make an inverted hockey-stick incision over the proximal tibia, centered down to the tibial tubercle. After dissecting down to the anterior compartment, we perform a fasciotomy of about 8 cm to accommodate swelling. Subperiosteal dissection is then performed around the proximal tibia. The medial soft tissues are left attached to increase blood supply and healing. During subperiosteal dissection, soft elevators are used to gently retract the lateral soft tissues along with the inferior and posterior structures. We use fluoroscopic imaging to guide the osteotomy as well as screw and plate placement. We use a 6-hole, 4.5-mm compression plate and screws for fixation. The 2 proximal screws of the plate are predrilled in place to allow for application of the plate after completion of the osteotomy. The plate is then rotated out of position on 1 screw, and the osteotomy is identified under fluoroscopy with the appropriate position distal to the second hole of the 6-hole plate.
An oscillating saw and osteotomes are used to perform the oblique osteotomy. The pre-estimated bone wedge is removed. Wedge size is adjusted, if needed. The bone wedge is morselized for bone graft. The osteotomy is then closed, correcting both varus and internal tibial torsion. Our goal is 5° valgus. After correction is obtained, the plate is placed, and the proximal screw is snugly seated. Three cortical screws are placed distally to hold the plate in place under compression mode, and a cancellous screw is placed superiorly at the proximal portion of the plate for additional fixation. The screw placed proximal to the osteotomy site is a fully threaded cortical screw with excellent compression. Correction and proper placement of hardware are verified with fluoroscopy.
The wound is irrigated and injected with bupivacaine. Bone graft is then placed at the osteotomy site. Additional bone graft is placed posteriorly between the osteotomy site and the muscle mass to stimulate additional healing. Another screw is placed obliquely from the medial side across the osteotomy site to provide additional fixation (Figure 1).
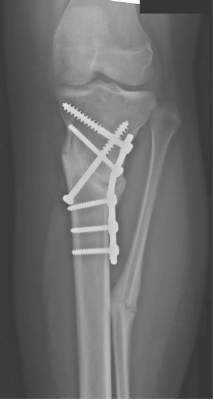
A deep drain is placed and connected to bulb suction for 24 hours after surgery. The wound is then closed in routine fashion. In 2 patients who weighed more than 250 pounds, we used an external fixator for additional stability (Figure 2).
Postoperative Care
The incisions are dressed with antibiotic ointment and 4×4-in bandages and then wrapped with sterile cotton under-cast padding. The leg is placed into a well-padded cylinder cast with the knee flexed 10°. The leg is aligned to about 5° valgus. The cast is then split on the side and spread to allow for swelling and to prevent compartment syndrome.5 We also use a drain hooked to bulb suction, which is removed 24 hours after surgery. Toe-touch weight-bearing with crutches is allowed immediately after surgery. The cast is removed at 6 weeks, and a hinged range-of-motion knee brace is worn for another 6 weeks. All patients are allowed to resume normal activity after 4 months. In our 2 external-fixator cases, a cast was not used, and toe-touch weight-bearing and knee motion were allowed immediately. The external fixators were removed at about 10 weeks.
Results
Mean postoperative mechanical femoral-tibial angle was 3°, and mean correction was 26° (range, 16°-43°) (Table). Lateral distal femoral angle did not show significant femoral deformity in our sample. Mean medial proximal tibial angle was 74° (range, 63°-79°). In each case, the varus deformity was primarily in the tibia. Mean tourniquet time was 88 minutes (range, 50-119 min). Our complication rate was 11% (1 knee). In our first case, in which we did not use an extra medial screw, the 4.5-mm plate fractured at the osteotomy site 2.5 months after surgery. The 250-pound patient subsequently lost 17° of correction, and valgus alignment was not achieved. Preoperative varus was 25°, and postoperative alignment was 8° varus. This plate fracture led us to use an extra medial screw for additional stability in all subsequent cases and to consider using an external fixator for patients weighing more than 250 pounds. After the first case, there were no other plate fractures. A potential problem with closing wedge osteotomy is shortening, but varus correction restores some length. Mean postoperative leg-length difference was 10 mm (range, 0-16 mm). No patient complained of leg-length difference during the postoperative follow-up.
Eight and a half months after surgery, 1 patient had hardware removed, at the family’s request. No patient experienced perioperative infection or neurovascular damage. Our overall patient population was obese—mean BMI was 38 (range, 25-48), and mean postoperative weight was 219 pounds. Three of our 8 patients were overweight (BMI, 25-30), and 5 were obese (BMI, >30). For prevention of plate failure, we recommend using an extra oblique screw in all patients and considering an external fixator for patients who weigh more than 250 pounds.
Discussion
Correction of adolescent tibia vara can be challenging because of patient obesity. The technique described here—a modification of the technique of Laurencin and colleagues4—is practical and reproducible in this population. The goals in performing osteotomy are to correct the deformity, restore joint alignment, preserve leg length, and prevent recurrent deformity and other complications, such as neurovascular injury, nonunion, and infection.3,6-8 Our technique minimizes the risk for these complications. For example, the fasciotomy provides excellent decompression of the anterior and lateral compartments, minimizing neurovascular ischemia and the risk for compartment syndrome. During cast placement, splitting and spreading reduce the risk for compartment syndrome as well.5
Wagner3,9 demonstrated the utility of a closing wedge proximal tibial osteotomy in adults. Laurencin and colleagues4 showed this technique is effective in correcting tibia vara in a pediatric population. However, they did not specify patient weight and used a small semitubular plate for fixation, and some of their patients had infantile Blount disease. We modified the technique in 3 ways. First, we performed a complete osteotomy. Second, because our patients were adolescents and very large, we used a 6-hole, 4.5-mm compression plate and screws. Third, we used an external fixator for increased stability in patients who weighed more than 250 pounds.
The reported technique, using an oblique metaphyseal closing wedge osteotomy with internal fixation in obese patients, is practical, safe, and reliable. This technique is a useful alternative to an external fixator. We used it on 9 knees with tibia vara, and it was completely successful in 8 cases and partially successful in 1 (hardware breakage occurred). An external fixator was used to prevent hardware breakage in 2 patients who weighed more than 250 pounds. This technique is a valuable treatment option for surgical correction, especially in obese patients.
1. Erlacher P. Deformierende Prozesse der Epiphysengegend bei Kindem. Archiv Orthop Unfall-Chir. 1922;20:81-96.
2. Blount WP. Tibia vara. J Bone Joint Surg. 1937;29:1-28.
3. Wagner H. Principles of corrective osteotomies in osteoarthrosis of the knee. In: Weal UH, ed. Joint Preserving Procedures of the Lower Extremity. New York, NY: Springer; 1980:77-102.
4. Laurencin CT, Ferriter PJ, Millis MB. Oblique proximal tibial osteotomy for the correction of tibia vara in the young. Clin Orthop Relat Res. 1996;(327):218-224.
5. Garfin SR, Mubarak SJ, Evans KL, Hargens AR, Akeson WH. Quantification of intracompartmental pressure and volume under plaster casts. J Bone Joint Surg Am. 1981;63(3):449-453.
6. Mycoskie PJ. Complications of osteotomies about the knee in children. Orthopedics. 1981;4(9):1005-1015.
7. Matsen FA, Staheli LT. Neurovascular complications following tibial osteotomy in children. A case report. Clin Orthop Relat Res. 1975;(110):210-214.
8. Steel HH, Sandrew RE, Sullivan PD. Complications of tibial osteotomy in children for genu varum or valgum. Evidence that neurological changes are due to ischemia. J Bone Joint Surg Am. 1971;53(8):1629-1635.
9. Wagner H. The displacement osteotomy as a correction principle. In: Heirholzer G, Muller KH, eds. Corrective Osteotomies of the Lower Extremity After Trauma. Berlin, Germany: Springer; 1985:141-150.
Blount disease (tibia vara) is an angular tibia deformity that includes varus, increased posterior slope, and internal rotation. This deformity was first described in 1922 by Erlacher1 in Germany. In 1937, Walter Blount2 reported on it in the United States. It is the most common cause of pathologic genu varum in adolescence and childhood.
An oblique incomplete closing wedge osteotomy of the proximal tibial metaphysis was described by Wagner3 for the treatment of unicompartmental osteoarthrosis of the knee in adults. Laurencin and colleagues4 applied this technique to the treatment of pediatric tibia vara with favorable results. They spared the medial cortex of the tibia in their incomplete closing wedge osteotomy technique. In each of the 9 cases we treated and describe here, we accidentally completed the tibial osteotomy when attempting the Laurencin technique. Given that the osteotomy was completed, we modified the Laurencin technique by using a 6-hole, 4.5-mm compression plate rather than a 5-hole semitubular plate, and added a large oblique screw from the medial side to compress the osteotomy site and to protect the plate from fracture. In addition, in 2 patients who weighed more than 250 pounds, we used an external fixator for additional stability. In this article, we report the outcomes of correcting adolescent tibia vara with a complete closing wedge tibial osteotomy and an oblique fibular osteotomy.
Materials and Methods
This study was approved by the Institutional Review Board at Pennsylvania State University. Between 2009 and 2012, we performed 9 complete oblique proximal tibial lateral closing wedge osteotomies on 8 patients (2 girls, 6 boys). In each case, the primary diagnosis was Blount disease. One patient also had renal dysplasia and was receiving dialysis. Mean age at time of operation was 15 years (range, 13-17 years). Mean preoperative weight was 215 pounds (range, 119-317 lb). Mean weight gain at follow-up was 4.39 pounds (range, –10 to 19 lb). Mean body mass index (BMI) was 38 (range, 25-48) (Table). All patients had varus angulation of the proximal tibia before surgery. Mean preoperative varus on standing films was 22° (range, 10°-36°). Because of the patients’ size, we used standing long-leg radiographs, on individual cassettes, for each leg.
Surgical Technique
Before surgery, we use paper cutouts to template the osteotomy wedge. We also use perioperative antibiotics and a standard time-out. For visualization of the entire leg for accurate correction, we prepare and drape the entire leg. A sterile tourniquet is used. At the midshaft of the fibula, a 4-cm incision is made, and dissection is carefully carried down to the fibula. Subperiosteal dissection is performed about the fibula, allowing adequate clearance for an oblique osteotomy. The osteotomy removes about 1 cm of fibula, which is to be used as bone graft for the tibial osteotomy. In addition, a lateral compartment fasciotomy is performed to prevent swelling-related complications. The wound is irrigated and injected with bupivacaine and closed in routine fashion.
We then make an inverted hockey-stick incision over the proximal tibia, centered down to the tibial tubercle. After dissecting down to the anterior compartment, we perform a fasciotomy of about 8 cm to accommodate swelling. Subperiosteal dissection is then performed around the proximal tibia. The medial soft tissues are left attached to increase blood supply and healing. During subperiosteal dissection, soft elevators are used to gently retract the lateral soft tissues along with the inferior and posterior structures. We use fluoroscopic imaging to guide the osteotomy as well as screw and plate placement. We use a 6-hole, 4.5-mm compression plate and screws for fixation. The 2 proximal screws of the plate are predrilled in place to allow for application of the plate after completion of the osteotomy. The plate is then rotated out of position on 1 screw, and the osteotomy is identified under fluoroscopy with the appropriate position distal to the second hole of the 6-hole plate.
An oscillating saw and osteotomes are used to perform the oblique osteotomy. The pre-estimated bone wedge is removed. Wedge size is adjusted, if needed. The bone wedge is morselized for bone graft. The osteotomy is then closed, correcting both varus and internal tibial torsion. Our goal is 5° valgus. After correction is obtained, the plate is placed, and the proximal screw is snugly seated. Three cortical screws are placed distally to hold the plate in place under compression mode, and a cancellous screw is placed superiorly at the proximal portion of the plate for additional fixation. The screw placed proximal to the osteotomy site is a fully threaded cortical screw with excellent compression. Correction and proper placement of hardware are verified with fluoroscopy.
The wound is irrigated and injected with bupivacaine. Bone graft is then placed at the osteotomy site. Additional bone graft is placed posteriorly between the osteotomy site and the muscle mass to stimulate additional healing. Another screw is placed obliquely from the medial side across the osteotomy site to provide additional fixation (Figure 1).
A deep drain is placed and connected to bulb suction for 24 hours after surgery. The wound is then closed in routine fashion. In 2 patients who weighed more than 250 pounds, we used an external fixator for additional stability (Figure 2).
Postoperative Care
The incisions are dressed with antibiotic ointment and 4×4-in bandages and then wrapped with sterile cotton under-cast padding. The leg is placed into a well-padded cylinder cast with the knee flexed 10°. The leg is aligned to about 5° valgus. The cast is then split on the side and spread to allow for swelling and to prevent compartment syndrome.5 We also use a drain hooked to bulb suction, which is removed 24 hours after surgery. Toe-touch weight-bearing with crutches is allowed immediately after surgery. The cast is removed at 6 weeks, and a hinged range-of-motion knee brace is worn for another 6 weeks. All patients are allowed to resume normal activity after 4 months. In our 2 external-fixator cases, a cast was not used, and toe-touch weight-bearing and knee motion were allowed immediately. The external fixators were removed at about 10 weeks.
Results
Mean postoperative mechanical femoral-tibial angle was 3°, and mean correction was 26° (range, 16°-43°) (Table). Lateral distal femoral angle did not show significant femoral deformity in our sample. Mean medial proximal tibial angle was 74° (range, 63°-79°). In each case, the varus deformity was primarily in the tibia. Mean tourniquet time was 88 minutes (range, 50-119 min). Our complication rate was 11% (1 knee). In our first case, in which we did not use an extra medial screw, the 4.5-mm plate fractured at the osteotomy site 2.5 months after surgery. The 250-pound patient subsequently lost 17° of correction, and valgus alignment was not achieved. Preoperative varus was 25°, and postoperative alignment was 8° varus. This plate fracture led us to use an extra medial screw for additional stability in all subsequent cases and to consider using an external fixator for patients weighing more than 250 pounds. After the first case, there were no other plate fractures. A potential problem with closing wedge osteotomy is shortening, but varus correction restores some length. Mean postoperative leg-length difference was 10 mm (range, 0-16 mm). No patient complained of leg-length difference during the postoperative follow-up.
Eight and a half months after surgery, 1 patient had hardware removed, at the family’s request. No patient experienced perioperative infection or neurovascular damage. Our overall patient population was obese—mean BMI was 38 (range, 25-48), and mean postoperative weight was 219 pounds. Three of our 8 patients were overweight (BMI, 25-30), and 5 were obese (BMI, >30). For prevention of plate failure, we recommend using an extra oblique screw in all patients and considering an external fixator for patients who weigh more than 250 pounds.
Discussion
Correction of adolescent tibia vara can be challenging because of patient obesity. The technique described here—a modification of the technique of Laurencin and colleagues4—is practical and reproducible in this population. The goals in performing osteotomy are to correct the deformity, restore joint alignment, preserve leg length, and prevent recurrent deformity and other complications, such as neurovascular injury, nonunion, and infection.3,6-8 Our technique minimizes the risk for these complications. For example, the fasciotomy provides excellent decompression of the anterior and lateral compartments, minimizing neurovascular ischemia and the risk for compartment syndrome. During cast placement, splitting and spreading reduce the risk for compartment syndrome as well.5
Wagner3,9 demonstrated the utility of a closing wedge proximal tibial osteotomy in adults. Laurencin and colleagues4 showed this technique is effective in correcting tibia vara in a pediatric population. However, they did not specify patient weight and used a small semitubular plate for fixation, and some of their patients had infantile Blount disease. We modified the technique in 3 ways. First, we performed a complete osteotomy. Second, because our patients were adolescents and very large, we used a 6-hole, 4.5-mm compression plate and screws. Third, we used an external fixator for increased stability in patients who weighed more than 250 pounds.
The reported technique, using an oblique metaphyseal closing wedge osteotomy with internal fixation in obese patients, is practical, safe, and reliable. This technique is a useful alternative to an external fixator. We used it on 9 knees with tibia vara, and it was completely successful in 8 cases and partially successful in 1 (hardware breakage occurred). An external fixator was used to prevent hardware breakage in 2 patients who weighed more than 250 pounds. This technique is a valuable treatment option for surgical correction, especially in obese patients.
1. Erlacher P. Deformierende Prozesse der Epiphysengegend bei Kindem. Archiv Orthop Unfall-Chir. 1922;20:81-96.
2. Blount WP. Tibia vara. J Bone Joint Surg. 1937;29:1-28.
3. Wagner H. Principles of corrective osteotomies in osteoarthrosis of the knee. In: Weal UH, ed. Joint Preserving Procedures of the Lower Extremity. New York, NY: Springer; 1980:77-102.
4. Laurencin CT, Ferriter PJ, Millis MB. Oblique proximal tibial osteotomy for the correction of tibia vara in the young. Clin Orthop Relat Res. 1996;(327):218-224.
5. Garfin SR, Mubarak SJ, Evans KL, Hargens AR, Akeson WH. Quantification of intracompartmental pressure and volume under plaster casts. J Bone Joint Surg Am. 1981;63(3):449-453.
6. Mycoskie PJ. Complications of osteotomies about the knee in children. Orthopedics. 1981;4(9):1005-1015.
7. Matsen FA, Staheli LT. Neurovascular complications following tibial osteotomy in children. A case report. Clin Orthop Relat Res. 1975;(110):210-214.
8. Steel HH, Sandrew RE, Sullivan PD. Complications of tibial osteotomy in children for genu varum or valgum. Evidence that neurological changes are due to ischemia. J Bone Joint Surg Am. 1971;53(8):1629-1635.
9. Wagner H. The displacement osteotomy as a correction principle. In: Heirholzer G, Muller KH, eds. Corrective Osteotomies of the Lower Extremity After Trauma. Berlin, Germany: Springer; 1985:141-150.
A Review of Patient Adherence to Topical Therapies for Treatment of Atopic Dermatitis
Atopic dermatitis (AD) is a chronic inflammatory skin disease that typically begins in early childhood (Figure). It is one of the most commonly diagnosed dermatologic conditions, affecting up to 25% of children and 2% to 3% of adults in the United States.1,2 The mainstays of treatment for AD are topical emollients and topical medications, of which corticosteroids are most commonly prescribed.3 Although treatments for AD generally are straightforward and efficacious when used correctly, poor adherence to treatment often prevents patients from achieving disease control.4 Patient adherence to therapy is a familiar challenge in dermatology, especially for diseases like AD that require long-term treatment with topical medications.4,5 In some instances, poor adherence may be misconstrued as poor response to treatment, which may lead to escalation to more powerful and potentially dangerous systemic medications.6 Ensuring good adherence to treatment leads to better outcomes and disease control, averts unnecessary treatment, prevents disease complications, improves quality of life, and decreases treatment cost.4,5 This article provides a review of the literature on patient adherence to topical therapies for AD as well as a discussion of methods to improve patient adherence to treatment in the clinical setting.

Methods
A PubMed search of articles indexed for MEDLINE from January 2005 to May 2015 was conducted to identify studies that focused on treatment adherence in AD using the search terms atopic dermatitis and medication adherence and atopic dermatitis and patient compliance After excluding duplicate results and those that were not in the English language, a final list of clinical trials that investigated patient adherence/compliance to topical medications for the treatment of AD was extracted for evaluation.
Results
Our review of the literature yielded 7 quantitative studies that evaluated adherence to topical medications in AD using electronic monitoring and/or self-reporting (Table).7-13 Participant demographics, disease severity, drug and vehicle used, duration of treatment, and number of follow-up visits varied. All studies used medication event monitoring system caps on medication jars to objectively track patient adherence by recording the date and time when the cap was removed. To assess disease response, the studies used such measures as the Investigator Global Assessment scale, Eczema Area and Severity Index score, or other visual analog scales.
In all of the studies, treatment proved effective and disease severity declined from baseline regardless of the rate of adherence, with benefit continuing after treatment had ended.7-13 Some results suggested that better adherence increased treatment efficacy and reduced disease severity.8,9 However, one 10-day trial found no difference in severity and efficacy among participants who applied the medication at least once daily, missed applications some days, or applied the medication more than twice daily.13
Study participants typically overestimated their adherence to treatment compared to actual adherence rates, with most reporting near 100% adherence.7-9,11,12 Average measured adherence rates ranged from 32% to 93% (Table). Adherence rates typically were highest at the beginning of the study and decreased as the study continued.7-13 The study with the best average adherence rate of 93% had the shortest treatment period of 3 days,11 and the study with the lowest average adherence rate of 32% had the longest treatment period of 8 weeks.7 The study with the lowest adherence rate was the only study wherein participants were blinded to their enrollment in the study, which would most closely mimic adherence rates in clinical practice.7 The participants in the other studies were not aware that their adherence was being monitored, but their behavior may have been influenced since they were aware of their enrollment in the study.
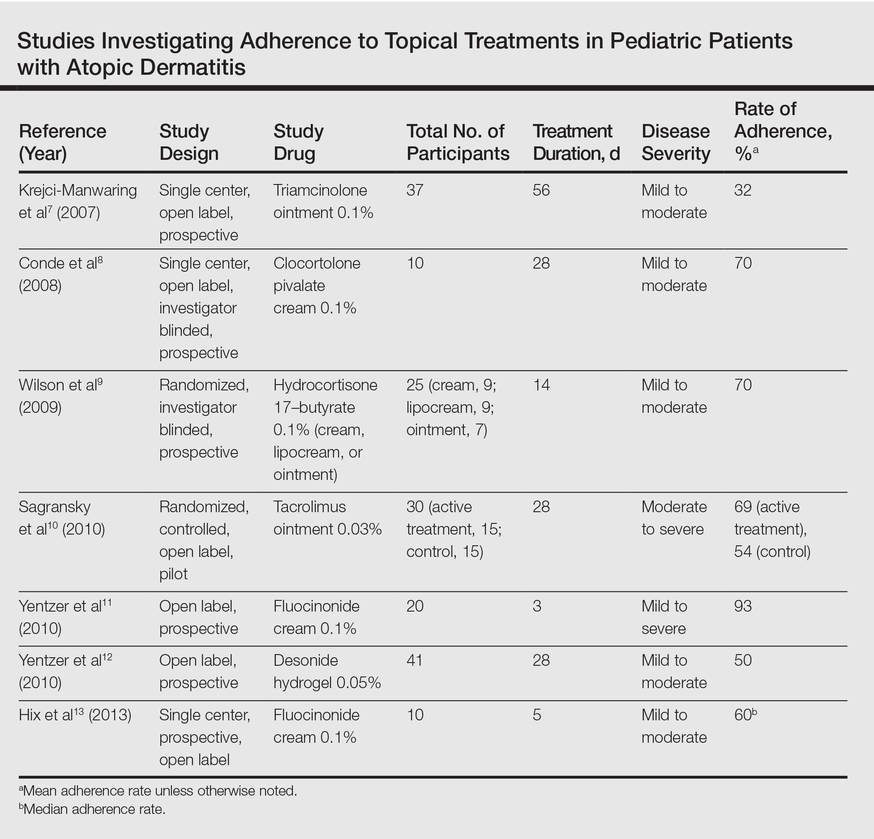
Many variables affect treatment adherence in patients with AD. Average adherence rates were significantly higher (P=.03) in participants with greater disease severity.7 There is conflicting evidence regarding the role of medication vehicle in treatment adherence. While Wilson et al9 did not find any difference in adherence based on medication vehicle, Yentzer et al12 found vehicle characteristics and medication side effects were among patients’ top-ranked concerns about using topical medications. Sagransky et al10 compared treatment adherence between 2 groups of AD patients: one control group received a standard-of-care 4-week follow-up, and an active group received an additional 1-week follow-up. The mean adherence rate of the treatment group was 69% compared with 54% in the control group.10
Comment
Poor adherence to treatment is a pervasive problem in patients with AD. Our review of the literature confirmed that patients generally are not accurate historians of their medication usage, often reporting near-perfect treatment adherence even when actual adherence is poor. Rates of adherence from clinical trials are likely higher than those seen in clinical practice due in part to study incentives and differences between how patients in a study are treated compared to those in a physician’s clinic; for example, research study participants often have additional follow-up visits compared to those being treated in the clinical population and by virtue of being enrolled in a study are aware that their behavior is being monitored, which can increase treatment adherence.7
The dogma suggesting that tachyphylaxis can occur with long-term use of topical corticosteroids is not supported by clinical trials.14 Furthermore, in our review of the literature patient adherence was highest in the shortest study11 and lowest in the longest study.7 Given that AD patients cannot benefit from a treatment if they do not use it, the supposed decrease in efficacy of topical corticosteroids over time may be because patients fail to use them consistently.
Our review of the literature was limited by the small body of research that exists on treatment adherence in AD patients, especially relating to topical medications, and did not reveal any studies evaluating systemic medications in AD. Of the studies we examined, sample sizes were small and treatment and follow-up periods were short. Our review only covered adherence to prescribed topical medications in AD, chiefly corticosteroids; thus, we did not evaluate adherence to other therapies (eg, emollients) in this patient population.
The existing research also is limited by the relative paucity of data showing a correlation between improved adherence to topical treatment and improved disease outcomes, which may be due to the methodological limitations of the study designs that have been used; for instance, studies may use objective monitors to describe daily adherence to treatment, but disease severity typically is measured over longer periods of time, usually every few weeks or months. Short-term data may not be an accurate demonstration of how participants’ actual treatment adherence impacts disease outcome, as the data does not account for more complex adherence factors; for example, participants who achieve good disease control using topical corticosteroids for an 8-week study period may actually demonstrate poor treatment adherence overall, as topical corticosteroids have good short-term efficacy and the patient may have stopped using the product after the first few weeks of the treatment period. In contrast, poorly adherent patients may never use the medication well enough to achieve improvement and may continue low-level use throughout the study period. Therefore, studies that measure disease severity at more regular intervals are required to show the true effect of treatment adherence on disease outcomes.
Since AD mainly affects children, family issues can pose special challenges to attaining good treatment adherence.15,16 The physician–patient (or parent) relationship and the family’s perception of the patient’s disease severity are strong predictors of adherence to topical treatment.16 Potential barriers to adherence in the pediatric population are caregivers with negative beliefs about treatment, the time-consuming nature of applying topical therapies, or a child who is uncooperative.15,17 In the treatment of infants, critical factors are caregiver availability and beliefs and fears about medications and their side effects, while in the teenage population, the desire to “fit in” and oppositional behavior can lead to poor adherence to treatment.17 Regardless of age, other barriers to treatment adherence are forgetfulness, belief that the drug is not working, and the messiness of treatment.17
Educational tools (eg, action plans, instructions about how to apply topical medications correctly) may be underutilized in patients with AD. If consistently implemented, these tools could have a positive impact on adherence to medication in patients with AD. For example, written action plans pioneered in the asthma community have shown to improve quality of life and reduce disease severity and may offer the same benefits for AD patients due to the similarities of the diseases.18 Since AD patients and their caregivers often are not well versed in how to apply topical medications correctly, efforts to educate patients could potentially increase adherence to treatment. In one study, AD patients began to use medications more effectively after applying a fluorescent cream to reveal affected areas they had missed, and clinicians were able to provide additional instruction based on the findings.19
Adherence to topical treatments among AD patients is a multifactorial issue. Regimens often are complex and inconvenient due to the need for multiple medications, the topical nature of the products, and the need for frequent application. To optimize prescription treatments, patients also must be diligent with preventive measures such as application of topical emollients and use of bathing techniques (eg, bleach baths). A way to overcome treatment complexity and increase adherence may be to provide a written action plan and involve the patient and caregiver in the plan’s development. If a drug formulation is not aesthetically acceptable to the patient (eg, the greasiness of an ointment), allowing the patient to choose the medication vehicle may increase satisfaction and use.12 Fear of steroid side effects also is common among patients and caregivers and could be overcome with education about the product.20
Conclusion
Treatment adherence can have a dramatic effect on diseases outcomes and can be particularly challenging in AD due to the use of topical medications with complex treatment regimens. Additionally, a large majority of patients with AD are children, from infants to teenagers, adding another layer of treatment challenges. Further research is needed to more definitively develop effective methods for enhancing treatment adherence in this patient population. Although enormous amounts of money are being spent to develop improved treatments for AD, we may be able to achieve far more benefit at a much lower cost by figuring out how to get patients to adhere to the treatments that are already available.
- Eichenfield LF, Tom WL, Chamlin SL, et al. Guidelines of care for the management of atopic dermatitis: section 1. diagnosis and assessment of atopic dermatitis. J Am Acad Dermatol. 2014;70:338-351.
- Landis ET, Davis SA, Taheri A, et al. Top dermatologic diagnoses by age. Dermatol Online J. 2014;20:22368.
- Eichenfield LF, Tom WL, Berger TG, et al. Guidelines of care for the management of atopic dermatitis: section 2. management and treatment of atopic dermatitis with topical therapies. J Am Acad Dermatol. 2014;71:116-132.
- Lee IA, Maibach HI. Pharmionics in dermatology: a review of topical medication adherence. Am J Clin Dermatol. 2006;7:231-236.
- Tan X, Feldman SR, Chang J, et al. Topical drug delivery systems in dermatology: a review of patient adherence issues. Expert Opin Drug Deliv. 2012;9:1263-1271.
- Sidbury R, Davis DM, Cohen DE, et al. Guidelines of care for the management of atopic dermatitis: section 3. Management and treatment with phototherapy and systemic agents. J Am Acad Dermatol. 2014;71:327-349.
- Krejci-Manwaring J, Tusa MG, Carroll C, et al. Stealth monitoring of adherence to topical medication: adherence is very poor in children with atopic dermatitis. J Am Acad Dermatol. 2007;56:211-216.
- Conde JF, Kaur M, Fleischer AB Jr, et al. Adherence to clocortolone pivalate cream 0.1% in a pediatric population with atopic dermatitis. Cutis. 2008;81:435-441.
- Wilson R, Camacho F, Clark AR, et al. Adherence to topical hydrocortisone 17-butyrate 0.1% in different vehicles in adults with atopic dermatitis. J Am Acad Dermatol. 2009;60:166-168.
- Sagransky MJ, Yentzer BA, Williams LL, et al. A randomized controlled pilot study of the effects of an extra office visit on adherence and outcomes in atopic dermatitis. Arch Dermatol. 2010;146:1428-1430.
- Yentzer BA, Ade RA, Fountain JM, et al. Improvement in treatment adherence with a 3-day course of fluocinonide cream 0.1% for atopic dermatitis. Cutis. 2010;86:208-213.
- Yentzer BA, Camacho FT, Young T, et al. Good adherence and early efficacy using desonide hydrogel for atopic dermatitis: results from a program addressing patient compliance. J Drugs Dermatol. 2010;9:324-329.
- Hix E, Gustafson CJ, O’Neill JL, et al. Adherence to a five day treatment course of topical fluocinonide 0.1% cream in atopic dermatitis. Dermatol Online J. 2013;19:20029.
- Taheri A, Cantrell J, Feldman SR. Tachyphylaxis to topical glucocorticoids; what is the evidence? Dermatol Online J. 2013;19:18954.
- Santer M, Burgess H, Yardley L, et al. Managing childhood eczema: qualitative study exploring carers’ experiences of barriers and facilitators to treatment adherence. J Adv Nurs. 2013;69:2493-2501.
- Ohya Y, Williams H, Steptoe A, et al. Psychosocial factors and adherence to treatment advice in childhood atopic dermatitis. J Invest Dermatol. 2001;117:852-857.
- Ou HT, Feldman SR, Balkrishnan R. Understanding and improving treatment adherence in pediatric patients. Semin Cutan Med Surg. 2010;29:137-140.
- Chisolm SS, Taylor SL, Balkrishnan R, et al. Written action plans: potential for improving outcomes in children with atopic dermatitis. J Am Acad Dermatol. 2008;59:677-683.
- Ulff E, Maroti M, Serup J. Fluorescent cream used as an educational intervention to improve the effectiveness of self-application by patients with atopic dermatitis. J Dermatolog Treat. 2013;24:268-271.
- Aubert-Wastiaux H, Moret L, Le Rhun A, et al. Topical corticosteroid phobia in atopic dermatitis: a study of its nature, origins and frequency. Br J Dermatol. 2011;165:808-814.
Atopic dermatitis (AD) is a chronic inflammatory skin disease that typically begins in early childhood (Figure). It is one of the most commonly diagnosed dermatologic conditions, affecting up to 25% of children and 2% to 3% of adults in the United States.1,2 The mainstays of treatment for AD are topical emollients and topical medications, of which corticosteroids are most commonly prescribed.3 Although treatments for AD generally are straightforward and efficacious when used correctly, poor adherence to treatment often prevents patients from achieving disease control.4 Patient adherence to therapy is a familiar challenge in dermatology, especially for diseases like AD that require long-term treatment with topical medications.4,5 In some instances, poor adherence may be misconstrued as poor response to treatment, which may lead to escalation to more powerful and potentially dangerous systemic medications.6 Ensuring good adherence to treatment leads to better outcomes and disease control, averts unnecessary treatment, prevents disease complications, improves quality of life, and decreases treatment cost.4,5 This article provides a review of the literature on patient adherence to topical therapies for AD as well as a discussion of methods to improve patient adherence to treatment in the clinical setting.
Methods
A PubMed search of articles indexed for MEDLINE from January 2005 to May 2015 was conducted to identify studies that focused on treatment adherence in AD using the search terms atopic dermatitis and medication adherence and atopic dermatitis and patient compliance After excluding duplicate results and those that were not in the English language, a final list of clinical trials that investigated patient adherence/compliance to topical medications for the treatment of AD was extracted for evaluation.
Results
Our review of the literature yielded 7 quantitative studies that evaluated adherence to topical medications in AD using electronic monitoring and/or self-reporting (Table).7-13 Participant demographics, disease severity, drug and vehicle used, duration of treatment, and number of follow-up visits varied. All studies used medication event monitoring system caps on medication jars to objectively track patient adherence by recording the date and time when the cap was removed. To assess disease response, the studies used such measures as the Investigator Global Assessment scale, Eczema Area and Severity Index score, or other visual analog scales.
In all of the studies, treatment proved effective and disease severity declined from baseline regardless of the rate of adherence, with benefit continuing after treatment had ended.7-13 Some results suggested that better adherence increased treatment efficacy and reduced disease severity.8,9 However, one 10-day trial found no difference in severity and efficacy among participants who applied the medication at least once daily, missed applications some days, or applied the medication more than twice daily.13
Study participants typically overestimated their adherence to treatment compared to actual adherence rates, with most reporting near 100% adherence.7-9,11,12 Average measured adherence rates ranged from 32% to 93% (Table). Adherence rates typically were highest at the beginning of the study and decreased as the study continued.7-13 The study with the best average adherence rate of 93% had the shortest treatment period of 3 days,11 and the study with the lowest average adherence rate of 32% had the longest treatment period of 8 weeks.7 The study with the lowest adherence rate was the only study wherein participants were blinded to their enrollment in the study, which would most closely mimic adherence rates in clinical practice.7 The participants in the other studies were not aware that their adherence was being monitored, but their behavior may have been influenced since they were aware of their enrollment in the study.
Many variables affect treatment adherence in patients with AD. Average adherence rates were significantly higher (P=.03) in participants with greater disease severity.7 There is conflicting evidence regarding the role of medication vehicle in treatment adherence. While Wilson et al9 did not find any difference in adherence based on medication vehicle, Yentzer et al12 found vehicle characteristics and medication side effects were among patients’ top-ranked concerns about using topical medications. Sagransky et al10 compared treatment adherence between 2 groups of AD patients: one control group received a standard-of-care 4-week follow-up, and an active group received an additional 1-week follow-up. The mean adherence rate of the treatment group was 69% compared with 54% in the control group.10
Comment
Poor adherence to treatment is a pervasive problem in patients with AD. Our review of the literature confirmed that patients generally are not accurate historians of their medication usage, often reporting near-perfect treatment adherence even when actual adherence is poor. Rates of adherence from clinical trials are likely higher than those seen in clinical practice due in part to study incentives and differences between how patients in a study are treated compared to those in a physician’s clinic; for example, research study participants often have additional follow-up visits compared to those being treated in the clinical population and by virtue of being enrolled in a study are aware that their behavior is being monitored, which can increase treatment adherence.7
The dogma suggesting that tachyphylaxis can occur with long-term use of topical corticosteroids is not supported by clinical trials.14 Furthermore, in our review of the literature patient adherence was highest in the shortest study11 and lowest in the longest study.7 Given that AD patients cannot benefit from a treatment if they do not use it, the supposed decrease in efficacy of topical corticosteroids over time may be because patients fail to use them consistently.
Our review of the literature was limited by the small body of research that exists on treatment adherence in AD patients, especially relating to topical medications, and did not reveal any studies evaluating systemic medications in AD. Of the studies we examined, sample sizes were small and treatment and follow-up periods were short. Our review only covered adherence to prescribed topical medications in AD, chiefly corticosteroids; thus, we did not evaluate adherence to other therapies (eg, emollients) in this patient population.
The existing research also is limited by the relative paucity of data showing a correlation between improved adherence to topical treatment and improved disease outcomes, which may be due to the methodological limitations of the study designs that have been used; for instance, studies may use objective monitors to describe daily adherence to treatment, but disease severity typically is measured over longer periods of time, usually every few weeks or months. Short-term data may not be an accurate demonstration of how participants’ actual treatment adherence impacts disease outcome, as the data does not account for more complex adherence factors; for example, participants who achieve good disease control using topical corticosteroids for an 8-week study period may actually demonstrate poor treatment adherence overall, as topical corticosteroids have good short-term efficacy and the patient may have stopped using the product after the first few weeks of the treatment period. In contrast, poorly adherent patients may never use the medication well enough to achieve improvement and may continue low-level use throughout the study period. Therefore, studies that measure disease severity at more regular intervals are required to show the true effect of treatment adherence on disease outcomes.
Since AD mainly affects children, family issues can pose special challenges to attaining good treatment adherence.15,16 The physician–patient (or parent) relationship and the family’s perception of the patient’s disease severity are strong predictors of adherence to topical treatment.16 Potential barriers to adherence in the pediatric population are caregivers with negative beliefs about treatment, the time-consuming nature of applying topical therapies, or a child who is uncooperative.15,17 In the treatment of infants, critical factors are caregiver availability and beliefs and fears about medications and their side effects, while in the teenage population, the desire to “fit in” and oppositional behavior can lead to poor adherence to treatment.17 Regardless of age, other barriers to treatment adherence are forgetfulness, belief that the drug is not working, and the messiness of treatment.17
Educational tools (eg, action plans, instructions about how to apply topical medications correctly) may be underutilized in patients with AD. If consistently implemented, these tools could have a positive impact on adherence to medication in patients with AD. For example, written action plans pioneered in the asthma community have shown to improve quality of life and reduce disease severity and may offer the same benefits for AD patients due to the similarities of the diseases.18 Since AD patients and their caregivers often are not well versed in how to apply topical medications correctly, efforts to educate patients could potentially increase adherence to treatment. In one study, AD patients began to use medications more effectively after applying a fluorescent cream to reveal affected areas they had missed, and clinicians were able to provide additional instruction based on the findings.19
Adherence to topical treatments among AD patients is a multifactorial issue. Regimens often are complex and inconvenient due to the need for multiple medications, the topical nature of the products, and the need for frequent application. To optimize prescription treatments, patients also must be diligent with preventive measures such as application of topical emollients and use of bathing techniques (eg, bleach baths). A way to overcome treatment complexity and increase adherence may be to provide a written action plan and involve the patient and caregiver in the plan’s development. If a drug formulation is not aesthetically acceptable to the patient (eg, the greasiness of an ointment), allowing the patient to choose the medication vehicle may increase satisfaction and use.12 Fear of steroid side effects also is common among patients and caregivers and could be overcome with education about the product.20
Conclusion
Treatment adherence can have a dramatic effect on diseases outcomes and can be particularly challenging in AD due to the use of topical medications with complex treatment regimens. Additionally, a large majority of patients with AD are children, from infants to teenagers, adding another layer of treatment challenges. Further research is needed to more definitively develop effective methods for enhancing treatment adherence in this patient population. Although enormous amounts of money are being spent to develop improved treatments for AD, we may be able to achieve far more benefit at a much lower cost by figuring out how to get patients to adhere to the treatments that are already available.
- Eichenfield LF, Tom WL, Chamlin SL, et al. Guidelines of care for the management of atopic dermatitis: section 1. diagnosis and assessment of atopic dermatitis. J Am Acad Dermatol. 2014;70:338-351.
- Landis ET, Davis SA, Taheri A, et al. Top dermatologic diagnoses by age. Dermatol Online J. 2014;20:22368.
- Eichenfield LF, Tom WL, Berger TG, et al. Guidelines of care for the management of atopic dermatitis: section 2. management and treatment of atopic dermatitis with topical therapies. J Am Acad Dermatol. 2014;71:116-132.
- Lee IA, Maibach HI. Pharmionics in dermatology: a review of topical medication adherence. Am J Clin Dermatol. 2006;7:231-236.
- Tan X, Feldman SR, Chang J, et al. Topical drug delivery systems in dermatology: a review of patient adherence issues. Expert Opin Drug Deliv. 2012;9:1263-1271.
- Sidbury R, Davis DM, Cohen DE, et al. Guidelines of care for the management of atopic dermatitis: section 3. Management and treatment with phototherapy and systemic agents. J Am Acad Dermatol. 2014;71:327-349.
- Krejci-Manwaring J, Tusa MG, Carroll C, et al. Stealth monitoring of adherence to topical medication: adherence is very poor in children with atopic dermatitis. J Am Acad Dermatol. 2007;56:211-216.
- Conde JF, Kaur M, Fleischer AB Jr, et al. Adherence to clocortolone pivalate cream 0.1% in a pediatric population with atopic dermatitis. Cutis. 2008;81:435-441.
- Wilson R, Camacho F, Clark AR, et al. Adherence to topical hydrocortisone 17-butyrate 0.1% in different vehicles in adults with atopic dermatitis. J Am Acad Dermatol. 2009;60:166-168.
- Sagransky MJ, Yentzer BA, Williams LL, et al. A randomized controlled pilot study of the effects of an extra office visit on adherence and outcomes in atopic dermatitis. Arch Dermatol. 2010;146:1428-1430.
- Yentzer BA, Ade RA, Fountain JM, et al. Improvement in treatment adherence with a 3-day course of fluocinonide cream 0.1% for atopic dermatitis. Cutis. 2010;86:208-213.
- Yentzer BA, Camacho FT, Young T, et al. Good adherence and early efficacy using desonide hydrogel for atopic dermatitis: results from a program addressing patient compliance. J Drugs Dermatol. 2010;9:324-329.
- Hix E, Gustafson CJ, O’Neill JL, et al. Adherence to a five day treatment course of topical fluocinonide 0.1% cream in atopic dermatitis. Dermatol Online J. 2013;19:20029.
- Taheri A, Cantrell J, Feldman SR. Tachyphylaxis to topical glucocorticoids; what is the evidence? Dermatol Online J. 2013;19:18954.
- Santer M, Burgess H, Yardley L, et al. Managing childhood eczema: qualitative study exploring carers’ experiences of barriers and facilitators to treatment adherence. J Adv Nurs. 2013;69:2493-2501.
- Ohya Y, Williams H, Steptoe A, et al. Psychosocial factors and adherence to treatment advice in childhood atopic dermatitis. J Invest Dermatol. 2001;117:852-857.
- Ou HT, Feldman SR, Balkrishnan R. Understanding and improving treatment adherence in pediatric patients. Semin Cutan Med Surg. 2010;29:137-140.
- Chisolm SS, Taylor SL, Balkrishnan R, et al. Written action plans: potential for improving outcomes in children with atopic dermatitis. J Am Acad Dermatol. 2008;59:677-683.
- Ulff E, Maroti M, Serup J. Fluorescent cream used as an educational intervention to improve the effectiveness of self-application by patients with atopic dermatitis. J Dermatolog Treat. 2013;24:268-271.
- Aubert-Wastiaux H, Moret L, Le Rhun A, et al. Topical corticosteroid phobia in atopic dermatitis: a study of its nature, origins and frequency. Br J Dermatol. 2011;165:808-814.
Practice Points
- When used correctly, topical treatments for atopic dermatitis (AD) generally are straightforward and efficacious, but poor adherence to treatment can prevent patients from achieving disease control.
- Patients tend to overestimate their adherence to topical treatment regimens for AD compared to actual adherence rates.
- Improved treatment adherence in this patient population may be achieved by allowing patients to choose their preferred topical vehicle and providing patient education about how to apply medications effectively; for pediatric patients, AD action plans also may be useful.

Pharmacotherapy for Tobacco Use and COPD
Up to one‐third of the 700,000 patients admitted annually for an exacerbation of chronic obstructive pulmonary disease (COPD) continue to smoke tobacco.[1, 2] Smokers with COPD are at high risk for poor health outcomes directly attributable to tobacco‐related conditions, including progression of lung disease and cardiovascular diseases.[3, 4, 5] Treatment for tobacco addiction is the most essential intervention for these patients.
Hospital admission has been suggested as an opportune time for the initiation of smoking cessation.[6] Hospitalized patients are already in a smoke‐free environment, and have access to physicians, nurses, and pharmacists who can prescribe medications for support.[7] Documenting smoking status and offering smoking cessation treatment during and after discharge are quality metrics required by the Joint Commission, and recommended by the National Quality Forum.[8, 9] Hospitals have made significant efforts to comply with these requirements.[10]
Limited data exist regarding the effectiveness and utilization of treatments known to reduce cigarette use among COPD patients in nontrial environments. Prescribing patterns of medications for smoking cessation in the real world following admission for COPD are not well studied. We sought to examine the utilization of inpatient brief tobacco counseling and postdischarge pharmacotherapy following discharge for exacerbation of COPD, as well as to (1) examine the association of postdischarge pharmacotherapy with self‐reported smoking cessation at 6 to 12 months and (2) assess differences in effectiveness between cessation medications prescribed.
METHODS
We conducted a cohort study of current smokers discharged following a COPD exacerbation within the Veterans Affairs (VA) Veterans Integrated Service Network (VISN)‐20. This study was approved by the VA Puget Sound Health Care System Institutional Review Board (#00461).
We utilized clinical information from the VISN‐20 data warehouse that collects data using the VA electronic medical record, including demographics, prescription medications, hospital admissions, hospital and outpatient diagnoses, and dates of death, and is commonly used for research. In addition, we utilized health factors, coded electronic entries describing patient health behaviors that are entered by nursing staff at the time of a patient encounter, and the text of chart notes that were available for electronic query.
Study Cohort
We identified all smokers aged 40 years hospitalized between 2005 and 2012 with either a primary discharge diagnosis of COPD based on International Classification of Diseases, 9th Revision codes (491, 492, 493.2, and 496) or an admission diagnosis from the text of the admit notes indicating an exacerbation of COPD. We limited to patients aged 40 years to improve the specificity of the diagnosis of COPD, and we selected the first hospitalization that met inclusion criteria. We excluded subjects who died within 6 months of discharge (Figure 1).
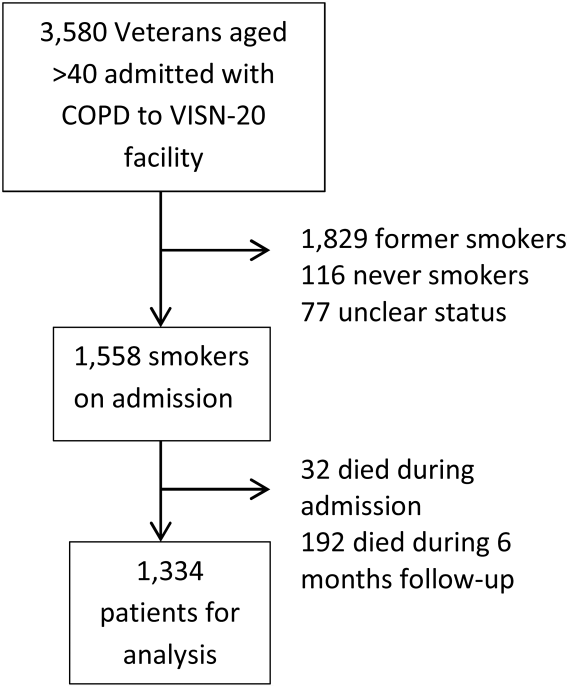
To establish tobacco status, we built on previously developed and validated methodology,[11] and performed truncated natural language processing using phrases in the medical record that reflected patients' tobacco status, querying all notes from the day of admission up to 6 months prior. If no tobacco status was indicated in the notes, we identified the status encoded by the most recent health factor. We manually examined the results of the natural language processing and the determination of health factors to confirm the tobacco status. Manual review was undertaken by 1 of 2 trained study personnel. In the case of an ambiguous or contradictory status, an additional team member reviewed the information to attempt to make a determination. If no determination could be made, the record was coded to unknown. This method allowed us to identify a baseline status for all but 77 of the 3580 patients admitted for COPD.
Outcome and Exposure
The outcome was tobacco status at 6 to 12 months after discharge. Using the same methods developed for identification of baseline smoking status, we obtained smoking status for each subject up to 12 months postdischarge. If multiple notes and encounters were available indicating smoking status, we chose the latest within 12 months of discharge. Subjects lacking a follow‐up status were presumed to be smokers, a common assumption.[12] The 6 to 12month time horizon was chosen as these are the most common time points used to examine a sustained change in tobacco status,[13, 14, 15] and allowed for adequate time for treatment and clinical follow‐up.
Our primary exposure was any smoking cessation medication or combination dispensed within 90 days of discharge. This time horizon for treatment was chosen due to recent studies indicating this is a meaningful period for postdischarge treatment.[14] We assessed the use of nicotine patch, short‐acting nicotine, varenicline, buproprion, or any combination. Accurate data on the prescription and dispensing of these medications were available from the VA pharmacy record. Secondary exposure was the choice of medication dispensed among treated patients. We assessed additional exposures including receipt of cessation medications within 48 hours of discharge, treatment in the year prior to admission, and predischarge counseling. Predischarge counseling was determined as having occurred if nurses documented that they completed a discharge process focused on smoking cessation. Referral to a quit line is part of this process; however, due to the confidential nature of these interactions, generally low use of this service, and lack of linkage to the VA electronic health record, it was not considered in the analysis.
Confounders
Potential confounders were assessed in the year prior to admission up to discharge from the index hospitalization, with the use of mechanical or noninvasive ventilation assessed during the hospitalization. We adjusted for variables chosen a priori for their known or expected association with smoking cessation including demographics, Charlson Comorbidity Index,[16] markers of COPD severity (need for invasive or noninvasive mechanical ventilation during index hospitalization, use of oral steroids, long‐acting inhaled bronchodilators, and/or canister count of short‐acting bronchodilators in the year prior to admission), history of drug or alcohol abuse, homelessness, depression, psychosis, post‐traumatic stress disorder, lung cancer, coronary artery disease, and under‐ or overweight status. Nurse‐based counseling prior to discharge was included as a variable for adjustment for our primary and secondary predictors to assess the influence of pharmacotherapy specifically. Due to 3.1% missingness in body mass index, multiple imputation with chained equations was used to impute missing values, with 10 imputations performed. The imputation was performed using a linear regression model containing all variables included in the final model, grouped by facility.
Statistical Analysis
All analyses were performed using Stata 13 (StataCorp, College Station, TX) software. 2 tests and t tests were used to assess for unadjusted bivariate associations. Using the pooled imputed datasets, we performed multivariable logistic regression to compare odds ratios for a change in smoking status, adjusting the estimates of coefficients and standard errors by applying combination rules to the 10 completed‐data estimates.[17] We analyzed our primary and secondary predictors, adjusting for the confounders chosen a priori, clustered by facility with robust standard errors. An level of <0.05 was considered significant.
Sensitivity Analysis
We assumed that subjects missing a follow‐up status were ongoing smokers. However, given the high mortality rate observed in our cohort, we were concerned that some subjects lacking a follow‐up status may have died, missing the opportunity to have a quit attempt recorded. Therefore, we performed sensitivity analysis excluding subjects who died during the 6 to 12 months of follow‐up, repeating the imputation and analysis as described above. In addition, due to concern for indication bias in the choice of medication used for our secondary analysis, we performed propensity score matching for treatment with each medication in comparison to nicotine patch, using the teffects command, with 3 nearest neighbor matches. We included additional comorbidities in the propensity score matching.[18]
RESULTS
Among these 1334 subjects at 6 to 12 months of follow‐up, 63.7% reported ongoing smoking, 19.8% of patients reported quitting, and 17.5% of patients had no reported status and were presumed to be smokers. Four hundred fifty (33.7%) patients were dispensed a smoking cessation medication within 90 days of discharge. Patients who were dispensed medications were younger and more likely to be female. Nearly all patients who received medications also received documented predischarge counseling (94.6%), as did the majority of patients who did not receive medications (83.8%) (Table 1).
| Variable | No Medication Dispensed, n = 884, No. (%) | Medication Dispensed, n = 450, No. (%) | P Value |
|---|---|---|---|
| |||
| Not smoking at 612 months | 179 (20.2) | 85 (18.9) | 0.56 |
| Brief counseling at discharge | 742 (83.8%) | 424 (94.6%) | <0.001* |
| Age | 64.49.13 (4094) | 61.07.97 (4185) | <0.001* |
| Male | 852 (96.3) | 423 (94.0) | 0.05* |
| Race | 0.12 | ||
| White | 744 (84.2) | 377 (83.8) | |
| Black | 41 (4.6) | 12 (2.7) | |
| Other/unknown | 99 (11.1) | 61 (13.6) | |
| BMI | 28.09.5 (12.669.0) | 28.910.8 (14.860.0) | 0.15 |
| Homeless | 68 (7.7) | 36 (8.0) | 0.84 |
| Psychiatric conditions/substance abuse | |||
| History of alcohol abuse | 205 (23.2) | 106 (23.6) | 0.88 |
| History of drug abuse | 110 (12.4) | 72 (16.0) | 0.07 |
| Depression | 39 (4.4) | 29 (6.4) | 0.11 |
| Psychosis | 201 (22.7) | 88 (19.6) | 0.18 |
| PTSD | 146 (16.5) | 88 (19.6) | 0.17 |
| Comorbidities | |||
| Coronary artery disease | 254 (28.7) | 110 (24.4) | 0.10 |
| Cerebrovascular accident | 80 (9.0) | 28 (2.2) | 0.86 |
| Obstructive sleep apnea | 42 (4.8) | 23 (5.1) | 0.77 |
| Lung cancer | 21 (2.4) | 10 (2.2) | 0.86 |
| Charlson Comorbidity Index | 2.251.93 (014) | 2.111.76 (010) | 0.49 |
| Markers of COPD severity | |||
| Mechanical ventilation during admission | 28 (3.2) | 14 (3.1) | 0.96 |
| NIPPV during admission | 97 (11.0) | 51 (11.3) | 0.84 |
| Oral steroids prescribed in the past year | 334 (37.8) | 154 (34.2) | 0.20 |
| Treatment with tiotropium in the past year | 97 (11.0) | 55 (12.2) | 0.50 |
| Treatment with LABA in the past year | 264 (29.9) | 155 (34.4) | 0.09 |
| Canisters of SABA used in past year | 6.639.8, (084) | 7.469.63 (045) | 0.14 |
| Canisters of ipratropium used in past year | 6.458.81 (054) | 6.869.08 (064) | 0.42 |
| Died during 612 months of follow‐up | 78 (8.8) | 28 (6.6) | 0.10 |
Of patients dispensed a study medication, 246 (18.4% of patients, 54.7% of all medications dispensed) were dispensed medications within 48 hours of discharge (Table 2). Of the patients dispensed medication, the majority received nicotine patches alone (Table 3), and 18.9% of patients received combination therapy, with the majority receiving nicotine patch and short‐acting nicotine replacement therapy (NRT) or patch and buproprion. A significant number of patients were prescribed medications within 90 days of discharge, but did not have them dispensed within that timeframe (n = 224, 16.8%).
| Medication Dispensed | No. (%) | % Quit (Unadjusted) | OR (95% CI) | P Value |
|---|---|---|---|---|
| ||||
| No medications dispensed | 884 (66.3) | 20.2 | Referent | |
| Any medication from | ||||
| Discharge to 90 days | 450 (33.7) | 18.9 | 0.88 (0.741.04) | 0.137 |
| Within 48 hours of discharge | 246 (18.4) | 18.3 | 0.87 (0.661.14) | 0.317 |
| Treated in the year prior to admission | 221 (16.6) | 19.6 | Referent | |
| Treated in the year prior to admission + 090 days postdischarge | 152 (11.4) | 18.4 | 0.95 (0.791.13) | 0.534 |
| No nurse‐provided counseling prior to discharge | 169 (12.7) | 20.5 | Referent | |
| Nurse‐provided counseling prior to discharge | 1,165 (87.3) | 19.5 | 0.95 (0.661.36) | 0.774 |
| Medication Dispensed | No. (%) | % Quit (Unadjusted) | OR (95% CI) | P Value |
|---|---|---|---|---|
| ||||
| Nicotine patch | 242 (53.8) | 18.6 | Referent | |
| Monotherapy with | ||||
| Varenicline | 36 (8.0) | 30.6 | 2.44 (1.484.05) | 0.001 |
| Short‐acting NRT | 34 (7.6) | 11.8 | 0.66 (0.510.85) | 0.001 |
| Buproprion | 55 (12.2) | 21.8 | 1.05 (0.671.62) | 0.843 |
| Combination therapy | 85 (18.9) | 15.7 | 0.94 (0.711.24) | 0.645 |
Association of Treatment With Study Medications and Quitting Smoking
In adjusted analyses, the odds of quitting smoking at 6 to 12 months were not greater among patients who were dispensed a study medication within 90 days of discharge (odds ratio [OR]: 0.88, 95% confidence interval [CI]: 0.74‐1.04). We found no association between counseling provided at discharge and smoking cessation (OR: 0.95, 95% CI: 0.0.66‐1.), adjusted for the receipt of medications. There was no difference in quit rate between patients dispensed medication within 48 hours of discharge, or between patients treated in the year prior to admission and again postdischarge (Table 2).
We then assessed differences in effectiveness between specific medications among the 450 patients who were dispensed medications. Using nicotine patch alone as the referent group, patients treated with varenicline demonstrated greater odds of smoking cessation (OR: 2.44, 95% CI: 1.48‐4.05). Patients treated with short‐acting NRT alone were less likely to report smoking cessation (OR: 0.66, 95% CI: 0.51‐0.85). Patients treated with buproprion or combination therapy were no more likely to report cessation (Table 3). When sensitivity analysis was performed using propensity score matching with additional variables included, there were no significant differences in the observed associations.
Our overall mortality rate observed at 1 year was 19.5%, nearly identical to previous cohort studies of patients admitted for COPD.[19, 20] Because of the possibility of behavioral differences on the part of patients and physicians regarding subjects with a limited life expectancy, we performed sensitivity analysis limited to the patients who survived to at least 12 months of follow‐up. One hundred six patients (7.9%) died during 6 to 12 months of follow‐up. There was no change in inference for our primary exposure (OR: 0.95, 95% CI: 0.79‐1.14) or any of the secondary exposures examined.
DISCUSSION
In this observational study, postdischarge pharmacotherapy within 90 days of discharge was provided to a minority of high‐risk smokers admitted for COPD, and was not associated with smoking cessation at 6 to 12 months. In comparison to nicotine patch alone, varenicline was associated with a higher odds of cessation, with decreased odds of cessation among patients treated with short‐acting NRT alone. The overall quit rate was significant at 19.8%, and is consistent with annual quit rates observed among patients with COPD in other settings,[21, 22] but is far lower than quit rates observed after admission for acute myocardial infarction.[23, 24, 25] Although the proportion of patients treated at the time of discharge or within 90 days was low, our findings are in keeping with previous studies, which demonstrated low rates of pharmacologic treatment following hospitalization, averaging 14%.[26] Treatment for tobacco use is likely underutilized for this group of high‐risk smokers. However, a significant proportion of patients who were prescribed medications in the postdischarge period did not have medications filled. This likely reflects both the rapid changes in motivation that characterize quit attempts,[27] as well as efforts on the part of primary care physicians to make these medications available to facilitate future quit attempts.
There are several possible explanations for the findings in our study. Pharmaceutical therapies were not provided at random. The provision of pharmacotherapy and the ultimate success of a quit attempt reflects a complex interaction of patient beliefs concerning medications, level of addiction and motivation, physician behavior and knowledge, and organizational factors. Organizational factors such as the structure of electronic discharge orders and the availability of decision support materials may influence a physician's likelihood of prescribing medications, the choice of medication prescribed, and therefore the adequacy of control of withdrawal symptoms. NRT is often under dosed to control ongoing symptoms,[28] and needs to be adjusted until relief is obtained, providing an additional barrier to effectiveness during the transition out of the hospital. Because most smokers with COPD are highly addicted to nicotine,[29] high‐dose NRT, combination therapy, or varenicline would be necessary to adequately control symptoms.[30] However, a significant minority of patients received short‐acting NRT alone.
Despite a high observed efficacy in recent trials,[31, 32] few subjects in our study received varenicline. This may be related to both secular trends and administrative barriers to the use of varenicline in the VA system. Use of this medication was limited among patients with psychiatric disorders due to safety concerns. These concerns have since been largely disproven, but may have limited access to this medication.[33, 34, 35] Although we adjusted for a history of mental illness, patients who received varenicline may have had more past quit attempts and less active mental illness, which may be associated with improved cessation rates. Despite the high prevalence of mental illness we observed, this is typical of the population of smokers, with studies indicating nearly one‐third of smokers overall suffer from mental illness.[36]
Although the majority of our patients received a brief, nurse‐based counseling intervention, there is considerable concern about the overall effectiveness of a single predischarge interaction to produce sustained smoking cessation among highly addicted smokers.[37, 38, 39, 40] The Joint Commission has recently restructured the requirements for smoking cessation treatment for hospitalized patients, and it is now up to hospitals to implement treatment mechanisms that not only meet the national requirements, but also provide a meaningful clinical effect. Though the optimum treatment for hospitalized smokers with COPD is unknown, previous positive studies of smoking cessation among hospitalized patients underscore the need for a higher‐intensity counseling intervention that begins during hospitalization and continues after discharge.[13, 41] Cessation counseling services including tobacco cessation groups and quit lines are available through the VA; however, the use of these services is typically low and requires the patient to enroll independently after discharge, an additional barrier. The lack of association between medications and smoking cessation found in our study could reflect poor effectiveness of medications in the absence of a systematic counseling intervention. Alternatively, the association may be explained that patients who were more highly addicted and perhaps less motivated to quit received tobacco cessation medications more often, but were also less likely to stop tobacco use, a form of indication bias.
Our study has several limitations. We do not have addiction or motivation levels for a cessation attempt, a potential unmeasured confounder. Although predictive of quit attempts, motivation factors are less predictive of cessation maintenance, and may therefore have an unclear effect on our outcome.[42, 43] Our outcome was gathered as part of routine clinical care, which may have introduced bias if patients over‐reported cessation because of social desirability. In healthcare settings, however, this form of assessing smoking status is generally valid.[44] Exposure to counseling or medications obtained outside of the VA system would not have been captured. Given the financial incentive, we believe it is unlikely that many patients admitted to a VA medical center obtained medications elsewhere.[45] The diagnosis of COPD was made administratively. However, all subjects were admitted for an exacerbation, which is associated with more severe COPD by Global Initiative for Obstructive Lung Disease (GOLD) stage.[46] Patients with more severe COPD are often excluded from studies of smoking cessation due to concerns of high dropout and lower prevalence of smoking among patients with GOLD stage IV disease,[47, 48] making this a strength of our study. Subjects who died may have quit only in extremis, or failed to document their quit attempts. However, our sensitivity analysis limited to survivors did not change the study results. There may have been some misclassification in the use of buproprion, which may also be prescribed as an antidepressant. Finally, although representative of the veterans who seek care within the VISN‐20, our patients were primarily white and male, limiting the ability to generalize outside of this group.
Our study had several strengths. We examined a large cohort of patients admitted to a complete care organization, including patients from a diverse group of VA settings comprising academically and nonacademically affiliated centers. We performed an unbiased collection of patients, including all smokers discharged for COPD. We had access to excellent completeness of medications prescribed and filled as collected within the VA system, enabling us to observe medications dispensed and prescribed at several time points. We also had near complete ascertainment of outcomes including by using natural language processing with manual confirmation of smoking status.
In summary, we found that provision of medications to treat ongoing tobacco use among patients discharged for COPD was low, and receipt of medications was not associated with a reduction in smoking tobacco at 6 to 12 months postdischarge. However, among those treated, varenicline appears to be superior to the nicotine patch, with short‐acting nicotine replacement potentially less effective, a biologically plausible finding. The motivation to quit smoking changes rapidly over time. Providing these medications in the hospital and during the time after discharge is a potential means to improve quit rates, but medications need to be paired with counseling to be most effective. Collectively, these data suggest that systems‐based interventions are needed to increase the availability of intense counseling and the use of tailored pharmacotherapy to these patients.
Acknowledgements
The authors acknowledge Mr. Robert Plumley, who performed the data extraction and natural language processing necessary to complete this project.
Disclosures: Dr. Melzer conceived of the research question and performed background reading, analyses, primary drafting, and final revision of the manuscript. Drs. Collins and Feemster participated in finalizing the research question, developing the cohort, performing data collection, and revising the manuscript. Dr. Au provided the database for analysis, helped finalize the research question, and assisted in interpretation of the data and revision of the manuscript. Dr. Au has personally reviewed the data, understands the statistical methods employed, and confirms an understanding of this analysis, that the methods are clearly described, and that they are a fair way to report the results. This material is based upon work supported in part by the Department of Veterans Affairs, Veterans Health Administration, Office of Research and Development, who provided access to data, office space, and programming and data management. The views expressed in this article are those of the authors and do not necessarily reflect the position or policy of the Department of Veterans Affairs, the United States government, or the National Institutes of Health. Dr. Au is an unpaid research consultant for Analysis Group. None of the other authors have any conflicts of interest to disclose. Dr. Melzer is supported by an institutional F‐32 (HL007287‐36) through the University of Washington Department of Pulmonary and Critical Care. Dr. Feemster is supported by an National Institutes of Health, National Heart, Lung, and Blood Institute, K23 Mentored Career Development Award (HL111116). Partial support of this project was provided by Gilead Sciences with research funding to the Seattle Institute for Biomedical and Clinical Research. Additional support was received through the VA Health Services Research and Development. A portion of this work was presented in abstract form at the American Thoracic Society International Meeting, May 2015, in Denver, Colorado.
- , , , , , . Patients hospitalized for COPD have a high prevalence of modifiable risk factors for exacerbation (EFRAM study). Eur Respir J. 2000;16(6):1037–1042.
- , , , et al. Analysis of hospitalizations for COPD exacerbation: opportunities for improving care. COPD. 2010;7(2):85–92.
- , , , . Mortality in COPD: role of comorbidities. Eur Respir J. 2006;28(6):1245–1257.
- , , , . Cardiovascular comorbidity in COPD: systematic literature review. Chest. 2013;144(4):1163–1178.
- . Engaging patients and clinicians in treating tobacco addiction. JAMA Intern Med. 2014;174(8):1299–1300.
- , . Smokers who are hospitalized: a window of opportunity for cessation interventions. Prev Med. 1992;21(2):262–269.
- , , , . Interventions for smoking cessation in hospitalised patients. Cochrane Database Syst Rev. 2012;5:CD001837.
- Specifications Manual for National Hospital Inpatient Quality Measures. Available at: http://www.jointcommission.org/specifications_manual_for_national_hospital_inpatient_quality_measures.aspx. Accessed January 15, 2015.
- Treating Tobacco Use and Dependence. April 2013. Agency for Healthcare Research and Quality, Rockford, MD. Available at: http://www.ahrq.gov/professionals/clinicians‐providers/guidelines‐recommendations/tobacco/clinicians/update/index.html. Accessed January 15, 2015.
- , , , . Smoking cessation advice rates in US hospitals. Arch Intern Med. 2011;171(18):1682–1684.
- , , , et al. Validating smoking data from the Veteran's Affairs Health Factors dataset, an electronic data source. Nicotine Tob Res. 2011;13(12):1233–1239.
- , , , et al. Do u smoke after txt? Results of a randomised trial of smoking cessation using mobile phone text messaging. Tob Control. 2005;14(4):255–261.
- , , , . The effectiveness of smoking cessation groups offered to hospitalised patients with symptoms of exacerbations of chronic obstructive pulmonary disease (COPD). Clin Respir J. 2008;2(3):158–165.
- , , , et al. Sustained care intervention and postdischarge smoking cessation among hospitalized adults: a randomized clinical trial. JAMA. 2014;312(7):719–728.
- , , , et al. Bupropion for smokers hospitalized with acute cardiovascular disease. Am J Med. 2006;119(12):1080–1087.
- , , . Adapting a clinical comorbidity index for use with ICD‐9‐CM administrative databases. J Clin Epidemiol. 1992;45(6):613–619.
- . Multiple Imputation for Nonresponse in Surveys. New York, NY: Wiley; 1987.
- , , , et al. Methods for constructing and assessing propensity scores. Health Serv Res. 2014;49(5):1701–1720.
- , , . Mortality and mortality‐related factors after hospitalization for acute exacerbation of COPD. Chest. 2003;124(2):459–467.
- , , , et al. Mortality after hospitalization for COPD. Chest. 2002;121(5):1441–1448.
- , , , , , . State quitlines and cessation patterns among adults with selected chronic diseases in 15 states, 2005–2008. Prev Chronic Dis. 2012;9(10):120105.
- , , . The effects of counseling on smoking cessation among patients hospitalized with chronic obstructive pulmonary disease: a randomized clinical trial. Int J Addict. 1991;26(1):107–119.
- , , , et al. Predictors of smoking cessation after a myocardial infarction: the role of institutional smoking cessation programs in improving success. Arch Intern Med. 2008;168(18):1961–1967.
- , , , , , . Post‐myocardial infarction smoking cessation counseling: associations with immediate and late mortality in older Medicare patients. Am J Med. 2005;118(3):269–275.
- , , , . Smoking cessation after acute myocardial infarction: effects of a nurse‐‐managed intervention. Ann Intern Med. 1990;113(2):118–123.
- , , , et al. Smoking care provision in hospitals: a review of prevalence. Nicotine Tob Res. 2008;10(5):757–774.
- , , , . Intentions to quit smoking change over short periods of time. Addict Behav. 2005;30(4):653–662.
- , , , , . Association of amount and duration of NRT use in smokers with cigarette consumption and motivation to stop smoking: a national survey of smokers in England. Addict Behav. 2015;40(0):33–38.
- , . Smoking prevalence, behaviours, and cessation among individuals with COPD or asthma. Respir Med. 2011;105(3):477–484.
- , , , et al. American College of Chest Physicians. Tobacco Dependence Treatment ToolKit. 3rd ed. Available at: http://tobaccodependence.chestnet.org. Accessed January 29, 2015.
- , , , , , . Effects of varenicline on smoking cessation in patients with mild to moderate COPD: a randomized controlled trial. Chest. 2011;139(3):591–599.
- , , , et al. Varenicline versus transdermal nicotine patch for smoking cessation: results from a randomised open‐label trial. Thorax. 2008;63(8):717–724.
- , , , , . Psychiatric adverse events in randomized, double‐blind, placebo‐controlled clinical trials of varenicline. Drug Saf. 2010;33(4):289–301.
- . Studies linking smoking‐cessation drug with suicide risk spark concerns. JAMA. 2009;301(10):1007–1008.
- , , , et al. A randomized, double‐blind, placebo‐controlled study evaluating the safety and efficacy of varenicline for smoking cessation in patients with schizophrenia or schizoaffective disorder. J Clin Psychiatry. 2012;73(5):654–660.
- , , . Smoking and mental illness: results from population surveys in Australia and the United States. BMC Public Health. 2009;9(1):285.
- , , , . Implementation and effectiveness of a brief smoking‐cessation intervention for hospital patients. Med Care. 2000;38(5):451–459.
- , , , et al. Clinical trial comparing nicotine replacement therapy (NRT) plus brief counselling, brief counselling alone, and minimal intervention on smoking cessation in hospital inpatients. Thorax. 2003;58(6):484–488.
- , , , et al. Dissociation between hospital performance of the smoking cessation counseling quality metric and cessation outcomes after myocardial infarction. Arch Intern Med. 2008;168(19):2111–2117.
- , , , , . Smoking cessation in hospitalized patients: Results of a randomized trial. Arch Intern Med. 1997;157(4):409–415.
- , , , , . Intensive smoking cessation counseling versus minimal counseling among hospitalized smokers treated with transdermal nicotine replacement: a randomized trial. Am J Med. 2003;114(7):555–562.
- , , , et al. Motivational factors predict quit attempts but not maintenance of smoking cessation: findings from the International Tobacco Control Four country project. Nicotine Tob Res. 2010;12(suppl):S4–S11.
- , , , , . Predictors of attempts to stop smoking and their success in adult general population samples: a systematic review. Addiction. 2011;106(12):2110–2121.
- , , , et al. Validity of self‐reported smoking status among participants in a lung cancer screening trial. Cancer Epidemiol Biomarkers Prev. 2006;15(10):1825–1828.
- , , , . VHA enrollees' health care coverage and use of care. Med Care Res Rev. 2003;60(2):253–67.
- , , , , . Association between lung function and exacerbation frequency in patients with COPD. Int J Chron Obstruct Pulmon Dis. 2010;5:435–444.
- , , , et al. Smoking cessation in patients with chronic obstructive pulmonary disease: a double‐blind, placebo‐controlled, randomised trial. Lancet. 2001;357(9268):1571–1575.
- , , . Nurse‐conducted smoking cessation in patients with COPD using nicotine sublingual tablets and behavioral support. Chest. 2006;130(2):334–342.
Up to one‐third of the 700,000 patients admitted annually for an exacerbation of chronic obstructive pulmonary disease (COPD) continue to smoke tobacco.[1, 2] Smokers with COPD are at high risk for poor health outcomes directly attributable to tobacco‐related conditions, including progression of lung disease and cardiovascular diseases.[3, 4, 5] Treatment for tobacco addiction is the most essential intervention for these patients.
Hospital admission has been suggested as an opportune time for the initiation of smoking cessation.[6] Hospitalized patients are already in a smoke‐free environment, and have access to physicians, nurses, and pharmacists who can prescribe medications for support.[7] Documenting smoking status and offering smoking cessation treatment during and after discharge are quality metrics required by the Joint Commission, and recommended by the National Quality Forum.[8, 9] Hospitals have made significant efforts to comply with these requirements.[10]
Limited data exist regarding the effectiveness and utilization of treatments known to reduce cigarette use among COPD patients in nontrial environments. Prescribing patterns of medications for smoking cessation in the real world following admission for COPD are not well studied. We sought to examine the utilization of inpatient brief tobacco counseling and postdischarge pharmacotherapy following discharge for exacerbation of COPD, as well as to (1) examine the association of postdischarge pharmacotherapy with self‐reported smoking cessation at 6 to 12 months and (2) assess differences in effectiveness between cessation medications prescribed.
METHODS
We conducted a cohort study of current smokers discharged following a COPD exacerbation within the Veterans Affairs (VA) Veterans Integrated Service Network (VISN)‐20. This study was approved by the VA Puget Sound Health Care System Institutional Review Board (#00461).
We utilized clinical information from the VISN‐20 data warehouse that collects data using the VA electronic medical record, including demographics, prescription medications, hospital admissions, hospital and outpatient diagnoses, and dates of death, and is commonly used for research. In addition, we utilized health factors, coded electronic entries describing patient health behaviors that are entered by nursing staff at the time of a patient encounter, and the text of chart notes that were available for electronic query.
Study Cohort
We identified all smokers aged 40 years hospitalized between 2005 and 2012 with either a primary discharge diagnosis of COPD based on International Classification of Diseases, 9th Revision codes (491, 492, 493.2, and 496) or an admission diagnosis from the text of the admit notes indicating an exacerbation of COPD. We limited to patients aged 40 years to improve the specificity of the diagnosis of COPD, and we selected the first hospitalization that met inclusion criteria. We excluded subjects who died within 6 months of discharge (Figure 1).
To establish tobacco status, we built on previously developed and validated methodology,[11] and performed truncated natural language processing using phrases in the medical record that reflected patients' tobacco status, querying all notes from the day of admission up to 6 months prior. If no tobacco status was indicated in the notes, we identified the status encoded by the most recent health factor. We manually examined the results of the natural language processing and the determination of health factors to confirm the tobacco status. Manual review was undertaken by 1 of 2 trained study personnel. In the case of an ambiguous or contradictory status, an additional team member reviewed the information to attempt to make a determination. If no determination could be made, the record was coded to unknown. This method allowed us to identify a baseline status for all but 77 of the 3580 patients admitted for COPD.
Outcome and Exposure
The outcome was tobacco status at 6 to 12 months after discharge. Using the same methods developed for identification of baseline smoking status, we obtained smoking status for each subject up to 12 months postdischarge. If multiple notes and encounters were available indicating smoking status, we chose the latest within 12 months of discharge. Subjects lacking a follow‐up status were presumed to be smokers, a common assumption.[12] The 6 to 12month time horizon was chosen as these are the most common time points used to examine a sustained change in tobacco status,[13, 14, 15] and allowed for adequate time for treatment and clinical follow‐up.
Our primary exposure was any smoking cessation medication or combination dispensed within 90 days of discharge. This time horizon for treatment was chosen due to recent studies indicating this is a meaningful period for postdischarge treatment.[14] We assessed the use of nicotine patch, short‐acting nicotine, varenicline, buproprion, or any combination. Accurate data on the prescription and dispensing of these medications were available from the VA pharmacy record. Secondary exposure was the choice of medication dispensed among treated patients. We assessed additional exposures including receipt of cessation medications within 48 hours of discharge, treatment in the year prior to admission, and predischarge counseling. Predischarge counseling was determined as having occurred if nurses documented that they completed a discharge process focused on smoking cessation. Referral to a quit line is part of this process; however, due to the confidential nature of these interactions, generally low use of this service, and lack of linkage to the VA electronic health record, it was not considered in the analysis.
Confounders
Potential confounders were assessed in the year prior to admission up to discharge from the index hospitalization, with the use of mechanical or noninvasive ventilation assessed during the hospitalization. We adjusted for variables chosen a priori for their known or expected association with smoking cessation including demographics, Charlson Comorbidity Index,[16] markers of COPD severity (need for invasive or noninvasive mechanical ventilation during index hospitalization, use of oral steroids, long‐acting inhaled bronchodilators, and/or canister count of short‐acting bronchodilators in the year prior to admission), history of drug or alcohol abuse, homelessness, depression, psychosis, post‐traumatic stress disorder, lung cancer, coronary artery disease, and under‐ or overweight status. Nurse‐based counseling prior to discharge was included as a variable for adjustment for our primary and secondary predictors to assess the influence of pharmacotherapy specifically. Due to 3.1% missingness in body mass index, multiple imputation with chained equations was used to impute missing values, with 10 imputations performed. The imputation was performed using a linear regression model containing all variables included in the final model, grouped by facility.
Statistical Analysis
All analyses were performed using Stata 13 (StataCorp, College Station, TX) software. 2 tests and t tests were used to assess for unadjusted bivariate associations. Using the pooled imputed datasets, we performed multivariable logistic regression to compare odds ratios for a change in smoking status, adjusting the estimates of coefficients and standard errors by applying combination rules to the 10 completed‐data estimates.[17] We analyzed our primary and secondary predictors, adjusting for the confounders chosen a priori, clustered by facility with robust standard errors. An level of <0.05 was considered significant.
Sensitivity Analysis
We assumed that subjects missing a follow‐up status were ongoing smokers. However, given the high mortality rate observed in our cohort, we were concerned that some subjects lacking a follow‐up status may have died, missing the opportunity to have a quit attempt recorded. Therefore, we performed sensitivity analysis excluding subjects who died during the 6 to 12 months of follow‐up, repeating the imputation and analysis as described above. In addition, due to concern for indication bias in the choice of medication used for our secondary analysis, we performed propensity score matching for treatment with each medication in comparison to nicotine patch, using the teffects command, with 3 nearest neighbor matches. We included additional comorbidities in the propensity score matching.[18]
RESULTS
Among these 1334 subjects at 6 to 12 months of follow‐up, 63.7% reported ongoing smoking, 19.8% of patients reported quitting, and 17.5% of patients had no reported status and were presumed to be smokers. Four hundred fifty (33.7%) patients were dispensed a smoking cessation medication within 90 days of discharge. Patients who were dispensed medications were younger and more likely to be female. Nearly all patients who received medications also received documented predischarge counseling (94.6%), as did the majority of patients who did not receive medications (83.8%) (Table 1).
| Variable | No Medication Dispensed, n = 884, No. (%) | Medication Dispensed, n = 450, No. (%) | P Value |
|---|---|---|---|
| |||
| Not smoking at 612 months | 179 (20.2) | 85 (18.9) | 0.56 |
| Brief counseling at discharge | 742 (83.8%) | 424 (94.6%) | <0.001* |
| Age | 64.49.13 (4094) | 61.07.97 (4185) | <0.001* |
| Male | 852 (96.3) | 423 (94.0) | 0.05* |
| Race | 0.12 | ||
| White | 744 (84.2) | 377 (83.8) | |
| Black | 41 (4.6) | 12 (2.7) | |
| Other/unknown | 99 (11.1) | 61 (13.6) | |
| BMI | 28.09.5 (12.669.0) | 28.910.8 (14.860.0) | 0.15 |
| Homeless | 68 (7.7) | 36 (8.0) | 0.84 |
| Psychiatric conditions/substance abuse | |||
| History of alcohol abuse | 205 (23.2) | 106 (23.6) | 0.88 |
| History of drug abuse | 110 (12.4) | 72 (16.0) | 0.07 |
| Depression | 39 (4.4) | 29 (6.4) | 0.11 |
| Psychosis | 201 (22.7) | 88 (19.6) | 0.18 |
| PTSD | 146 (16.5) | 88 (19.6) | 0.17 |
| Comorbidities | |||
| Coronary artery disease | 254 (28.7) | 110 (24.4) | 0.10 |
| Cerebrovascular accident | 80 (9.0) | 28 (2.2) | 0.86 |
| Obstructive sleep apnea | 42 (4.8) | 23 (5.1) | 0.77 |
| Lung cancer | 21 (2.4) | 10 (2.2) | 0.86 |
| Charlson Comorbidity Index | 2.251.93 (014) | 2.111.76 (010) | 0.49 |
| Markers of COPD severity | |||
| Mechanical ventilation during admission | 28 (3.2) | 14 (3.1) | 0.96 |
| NIPPV during admission | 97 (11.0) | 51 (11.3) | 0.84 |
| Oral steroids prescribed in the past year | 334 (37.8) | 154 (34.2) | 0.20 |
| Treatment with tiotropium in the past year | 97 (11.0) | 55 (12.2) | 0.50 |
| Treatment with LABA in the past year | 264 (29.9) | 155 (34.4) | 0.09 |
| Canisters of SABA used in past year | 6.639.8, (084) | 7.469.63 (045) | 0.14 |
| Canisters of ipratropium used in past year | 6.458.81 (054) | 6.869.08 (064) | 0.42 |
| Died during 612 months of follow‐up | 78 (8.8) | 28 (6.6) | 0.10 |
Of patients dispensed a study medication, 246 (18.4% of patients, 54.7% of all medications dispensed) were dispensed medications within 48 hours of discharge (Table 2). Of the patients dispensed medication, the majority received nicotine patches alone (Table 3), and 18.9% of patients received combination therapy, with the majority receiving nicotine patch and short‐acting nicotine replacement therapy (NRT) or patch and buproprion. A significant number of patients were prescribed medications within 90 days of discharge, but did not have them dispensed within that timeframe (n = 224, 16.8%).
| Medication Dispensed | No. (%) | % Quit (Unadjusted) | OR (95% CI) | P Value |
|---|---|---|---|---|
| ||||
| No medications dispensed | 884 (66.3) | 20.2 | Referent | |
| Any medication from | ||||
| Discharge to 90 days | 450 (33.7) | 18.9 | 0.88 (0.741.04) | 0.137 |
| Within 48 hours of discharge | 246 (18.4) | 18.3 | 0.87 (0.661.14) | 0.317 |
| Treated in the year prior to admission | 221 (16.6) | 19.6 | Referent | |
| Treated in the year prior to admission + 090 days postdischarge | 152 (11.4) | 18.4 | 0.95 (0.791.13) | 0.534 |
| No nurse‐provided counseling prior to discharge | 169 (12.7) | 20.5 | Referent | |
| Nurse‐provided counseling prior to discharge | 1,165 (87.3) | 19.5 | 0.95 (0.661.36) | 0.774 |
| Medication Dispensed | No. (%) | % Quit (Unadjusted) | OR (95% CI) | P Value |
|---|---|---|---|---|
| ||||
| Nicotine patch | 242 (53.8) | 18.6 | Referent | |
| Monotherapy with | ||||
| Varenicline | 36 (8.0) | 30.6 | 2.44 (1.484.05) | 0.001 |
| Short‐acting NRT | 34 (7.6) | 11.8 | 0.66 (0.510.85) | 0.001 |
| Buproprion | 55 (12.2) | 21.8 | 1.05 (0.671.62) | 0.843 |
| Combination therapy | 85 (18.9) | 15.7 | 0.94 (0.711.24) | 0.645 |
Association of Treatment With Study Medications and Quitting Smoking
In adjusted analyses, the odds of quitting smoking at 6 to 12 months were not greater among patients who were dispensed a study medication within 90 days of discharge (odds ratio [OR]: 0.88, 95% confidence interval [CI]: 0.74‐1.04). We found no association between counseling provided at discharge and smoking cessation (OR: 0.95, 95% CI: 0.0.66‐1.), adjusted for the receipt of medications. There was no difference in quit rate between patients dispensed medication within 48 hours of discharge, or between patients treated in the year prior to admission and again postdischarge (Table 2).
We then assessed differences in effectiveness between specific medications among the 450 patients who were dispensed medications. Using nicotine patch alone as the referent group, patients treated with varenicline demonstrated greater odds of smoking cessation (OR: 2.44, 95% CI: 1.48‐4.05). Patients treated with short‐acting NRT alone were less likely to report smoking cessation (OR: 0.66, 95% CI: 0.51‐0.85). Patients treated with buproprion or combination therapy were no more likely to report cessation (Table 3). When sensitivity analysis was performed using propensity score matching with additional variables included, there were no significant differences in the observed associations.
Our overall mortality rate observed at 1 year was 19.5%, nearly identical to previous cohort studies of patients admitted for COPD.[19, 20] Because of the possibility of behavioral differences on the part of patients and physicians regarding subjects with a limited life expectancy, we performed sensitivity analysis limited to the patients who survived to at least 12 months of follow‐up. One hundred six patients (7.9%) died during 6 to 12 months of follow‐up. There was no change in inference for our primary exposure (OR: 0.95, 95% CI: 0.79‐1.14) or any of the secondary exposures examined.
DISCUSSION
In this observational study, postdischarge pharmacotherapy within 90 days of discharge was provided to a minority of high‐risk smokers admitted for COPD, and was not associated with smoking cessation at 6 to 12 months. In comparison to nicotine patch alone, varenicline was associated with a higher odds of cessation, with decreased odds of cessation among patients treated with short‐acting NRT alone. The overall quit rate was significant at 19.8%, and is consistent with annual quit rates observed among patients with COPD in other settings,[21, 22] but is far lower than quit rates observed after admission for acute myocardial infarction.[23, 24, 25] Although the proportion of patients treated at the time of discharge or within 90 days was low, our findings are in keeping with previous studies, which demonstrated low rates of pharmacologic treatment following hospitalization, averaging 14%.[26] Treatment for tobacco use is likely underutilized for this group of high‐risk smokers. However, a significant proportion of patients who were prescribed medications in the postdischarge period did not have medications filled. This likely reflects both the rapid changes in motivation that characterize quit attempts,[27] as well as efforts on the part of primary care physicians to make these medications available to facilitate future quit attempts.
There are several possible explanations for the findings in our study. Pharmaceutical therapies were not provided at random. The provision of pharmacotherapy and the ultimate success of a quit attempt reflects a complex interaction of patient beliefs concerning medications, level of addiction and motivation, physician behavior and knowledge, and organizational factors. Organizational factors such as the structure of electronic discharge orders and the availability of decision support materials may influence a physician's likelihood of prescribing medications, the choice of medication prescribed, and therefore the adequacy of control of withdrawal symptoms. NRT is often under dosed to control ongoing symptoms,[28] and needs to be adjusted until relief is obtained, providing an additional barrier to effectiveness during the transition out of the hospital. Because most smokers with COPD are highly addicted to nicotine,[29] high‐dose NRT, combination therapy, or varenicline would be necessary to adequately control symptoms.[30] However, a significant minority of patients received short‐acting NRT alone.
Despite a high observed efficacy in recent trials,[31, 32] few subjects in our study received varenicline. This may be related to both secular trends and administrative barriers to the use of varenicline in the VA system. Use of this medication was limited among patients with psychiatric disorders due to safety concerns. These concerns have since been largely disproven, but may have limited access to this medication.[33, 34, 35] Although we adjusted for a history of mental illness, patients who received varenicline may have had more past quit attempts and less active mental illness, which may be associated with improved cessation rates. Despite the high prevalence of mental illness we observed, this is typical of the population of smokers, with studies indicating nearly one‐third of smokers overall suffer from mental illness.[36]
Although the majority of our patients received a brief, nurse‐based counseling intervention, there is considerable concern about the overall effectiveness of a single predischarge interaction to produce sustained smoking cessation among highly addicted smokers.[37, 38, 39, 40] The Joint Commission has recently restructured the requirements for smoking cessation treatment for hospitalized patients, and it is now up to hospitals to implement treatment mechanisms that not only meet the national requirements, but also provide a meaningful clinical effect. Though the optimum treatment for hospitalized smokers with COPD is unknown, previous positive studies of smoking cessation among hospitalized patients underscore the need for a higher‐intensity counseling intervention that begins during hospitalization and continues after discharge.[13, 41] Cessation counseling services including tobacco cessation groups and quit lines are available through the VA; however, the use of these services is typically low and requires the patient to enroll independently after discharge, an additional barrier. The lack of association between medications and smoking cessation found in our study could reflect poor effectiveness of medications in the absence of a systematic counseling intervention. Alternatively, the association may be explained that patients who were more highly addicted and perhaps less motivated to quit received tobacco cessation medications more often, but were also less likely to stop tobacco use, a form of indication bias.
Our study has several limitations. We do not have addiction or motivation levels for a cessation attempt, a potential unmeasured confounder. Although predictive of quit attempts, motivation factors are less predictive of cessation maintenance, and may therefore have an unclear effect on our outcome.[42, 43] Our outcome was gathered as part of routine clinical care, which may have introduced bias if patients over‐reported cessation because of social desirability. In healthcare settings, however, this form of assessing smoking status is generally valid.[44] Exposure to counseling or medications obtained outside of the VA system would not have been captured. Given the financial incentive, we believe it is unlikely that many patients admitted to a VA medical center obtained medications elsewhere.[45] The diagnosis of COPD was made administratively. However, all subjects were admitted for an exacerbation, which is associated with more severe COPD by Global Initiative for Obstructive Lung Disease (GOLD) stage.[46] Patients with more severe COPD are often excluded from studies of smoking cessation due to concerns of high dropout and lower prevalence of smoking among patients with GOLD stage IV disease,[47, 48] making this a strength of our study. Subjects who died may have quit only in extremis, or failed to document their quit attempts. However, our sensitivity analysis limited to survivors did not change the study results. There may have been some misclassification in the use of buproprion, which may also be prescribed as an antidepressant. Finally, although representative of the veterans who seek care within the VISN‐20, our patients were primarily white and male, limiting the ability to generalize outside of this group.
Our study had several strengths. We examined a large cohort of patients admitted to a complete care organization, including patients from a diverse group of VA settings comprising academically and nonacademically affiliated centers. We performed an unbiased collection of patients, including all smokers discharged for COPD. We had access to excellent completeness of medications prescribed and filled as collected within the VA system, enabling us to observe medications dispensed and prescribed at several time points. We also had near complete ascertainment of outcomes including by using natural language processing with manual confirmation of smoking status.
In summary, we found that provision of medications to treat ongoing tobacco use among patients discharged for COPD was low, and receipt of medications was not associated with a reduction in smoking tobacco at 6 to 12 months postdischarge. However, among those treated, varenicline appears to be superior to the nicotine patch, with short‐acting nicotine replacement potentially less effective, a biologically plausible finding. The motivation to quit smoking changes rapidly over time. Providing these medications in the hospital and during the time after discharge is a potential means to improve quit rates, but medications need to be paired with counseling to be most effective. Collectively, these data suggest that systems‐based interventions are needed to increase the availability of intense counseling and the use of tailored pharmacotherapy to these patients.
Acknowledgements
The authors acknowledge Mr. Robert Plumley, who performed the data extraction and natural language processing necessary to complete this project.
Disclosures: Dr. Melzer conceived of the research question and performed background reading, analyses, primary drafting, and final revision of the manuscript. Drs. Collins and Feemster participated in finalizing the research question, developing the cohort, performing data collection, and revising the manuscript. Dr. Au provided the database for analysis, helped finalize the research question, and assisted in interpretation of the data and revision of the manuscript. Dr. Au has personally reviewed the data, understands the statistical methods employed, and confirms an understanding of this analysis, that the methods are clearly described, and that they are a fair way to report the results. This material is based upon work supported in part by the Department of Veterans Affairs, Veterans Health Administration, Office of Research and Development, who provided access to data, office space, and programming and data management. The views expressed in this article are those of the authors and do not necessarily reflect the position or policy of the Department of Veterans Affairs, the United States government, or the National Institutes of Health. Dr. Au is an unpaid research consultant for Analysis Group. None of the other authors have any conflicts of interest to disclose. Dr. Melzer is supported by an institutional F‐32 (HL007287‐36) through the University of Washington Department of Pulmonary and Critical Care. Dr. Feemster is supported by an National Institutes of Health, National Heart, Lung, and Blood Institute, K23 Mentored Career Development Award (HL111116). Partial support of this project was provided by Gilead Sciences with research funding to the Seattle Institute for Biomedical and Clinical Research. Additional support was received through the VA Health Services Research and Development. A portion of this work was presented in abstract form at the American Thoracic Society International Meeting, May 2015, in Denver, Colorado.
- , , , , , . Patients hospitalized for COPD have a high prevalence of modifiable risk factors for exacerbation (EFRAM study). Eur Respir J. 2000;16(6):1037–1042.
- , , , et al. Analysis of hospitalizations for COPD exacerbation: opportunities for improving care. COPD. 2010;7(2):85–92.
- , , , . Mortality in COPD: role of comorbidities. Eur Respir J. 2006;28(6):1245–1257.
- , , , . Cardiovascular comorbidity in COPD: systematic literature review. Chest. 2013;144(4):1163–1178.
- . Engaging patients and clinicians in treating tobacco addiction. JAMA Intern Med. 2014;174(8):1299–1300.
- , . Smokers who are hospitalized: a window of opportunity for cessation interventions. Prev Med. 1992;21(2):262–269.
- , , , . Interventions for smoking cessation in hospitalised patients. Cochrane Database Syst Rev. 2012;5:CD001837.
- Specifications Manual for National Hospital Inpatient Quality Measures. Available at: http://www.jointcommission.org/specifications_manual_for_national_hospital_inpatient_quality_measures.aspx. Accessed January 15, 2015.
- Treating Tobacco Use and Dependence. April 2013. Agency for Healthcare Research and Quality, Rockford, MD. Available at: http://www.ahrq.gov/professionals/clinicians‐providers/guidelines‐recommendations/tobacco/clinicians/update/index.html. Accessed January 15, 2015.
- , , , . Smoking cessation advice rates in US hospitals. Arch Intern Med. 2011;171(18):1682–1684.
- , , , et al. Validating smoking data from the Veteran's Affairs Health Factors dataset, an electronic data source. Nicotine Tob Res. 2011;13(12):1233–1239.
- , , , et al. Do u smoke after txt? Results of a randomised trial of smoking cessation using mobile phone text messaging. Tob Control. 2005;14(4):255–261.
- , , , . The effectiveness of smoking cessation groups offered to hospitalised patients with symptoms of exacerbations of chronic obstructive pulmonary disease (COPD). Clin Respir J. 2008;2(3):158–165.
- , , , et al. Sustained care intervention and postdischarge smoking cessation among hospitalized adults: a randomized clinical trial. JAMA. 2014;312(7):719–728.
- , , , et al. Bupropion for smokers hospitalized with acute cardiovascular disease. Am J Med. 2006;119(12):1080–1087.
- , , . Adapting a clinical comorbidity index for use with ICD‐9‐CM administrative databases. J Clin Epidemiol. 1992;45(6):613–619.
- . Multiple Imputation for Nonresponse in Surveys. New York, NY: Wiley; 1987.
- , , , et al. Methods for constructing and assessing propensity scores. Health Serv Res. 2014;49(5):1701–1720.
- , , . Mortality and mortality‐related factors after hospitalization for acute exacerbation of COPD. Chest. 2003;124(2):459–467.
- , , , et al. Mortality after hospitalization for COPD. Chest. 2002;121(5):1441–1448.
- , , , , , . State quitlines and cessation patterns among adults with selected chronic diseases in 15 states, 2005–2008. Prev Chronic Dis. 2012;9(10):120105.
- , , . The effects of counseling on smoking cessation among patients hospitalized with chronic obstructive pulmonary disease: a randomized clinical trial. Int J Addict. 1991;26(1):107–119.
- , , , et al. Predictors of smoking cessation after a myocardial infarction: the role of institutional smoking cessation programs in improving success. Arch Intern Med. 2008;168(18):1961–1967.
- , , , , , . Post‐myocardial infarction smoking cessation counseling: associations with immediate and late mortality in older Medicare patients. Am J Med. 2005;118(3):269–275.
- , , , . Smoking cessation after acute myocardial infarction: effects of a nurse‐‐managed intervention. Ann Intern Med. 1990;113(2):118–123.
- , , , et al. Smoking care provision in hospitals: a review of prevalence. Nicotine Tob Res. 2008;10(5):757–774.
- , , , . Intentions to quit smoking change over short periods of time. Addict Behav. 2005;30(4):653–662.
- , , , , . Association of amount and duration of NRT use in smokers with cigarette consumption and motivation to stop smoking: a national survey of smokers in England. Addict Behav. 2015;40(0):33–38.
- , . Smoking prevalence, behaviours, and cessation among individuals with COPD or asthma. Respir Med. 2011;105(3):477–484.
- , , , et al. American College of Chest Physicians. Tobacco Dependence Treatment ToolKit. 3rd ed. Available at: http://tobaccodependence.chestnet.org. Accessed January 29, 2015.
- , , , , , . Effects of varenicline on smoking cessation in patients with mild to moderate COPD: a randomized controlled trial. Chest. 2011;139(3):591–599.
- , , , et al. Varenicline versus transdermal nicotine patch for smoking cessation: results from a randomised open‐label trial. Thorax. 2008;63(8):717–724.
- , , , , . Psychiatric adverse events in randomized, double‐blind, placebo‐controlled clinical trials of varenicline. Drug Saf. 2010;33(4):289–301.
- . Studies linking smoking‐cessation drug with suicide risk spark concerns. JAMA. 2009;301(10):1007–1008.
- , , , et al. A randomized, double‐blind, placebo‐controlled study evaluating the safety and efficacy of varenicline for smoking cessation in patients with schizophrenia or schizoaffective disorder. J Clin Psychiatry. 2012;73(5):654–660.
- , , . Smoking and mental illness: results from population surveys in Australia and the United States. BMC Public Health. 2009;9(1):285.
- , , , . Implementation and effectiveness of a brief smoking‐cessation intervention for hospital patients. Med Care. 2000;38(5):451–459.
- , , , et al. Clinical trial comparing nicotine replacement therapy (NRT) plus brief counselling, brief counselling alone, and minimal intervention on smoking cessation in hospital inpatients. Thorax. 2003;58(6):484–488.
- , , , et al. Dissociation between hospital performance of the smoking cessation counseling quality metric and cessation outcomes after myocardial infarction. Arch Intern Med. 2008;168(19):2111–2117.
- , , , , . Smoking cessation in hospitalized patients: Results of a randomized trial. Arch Intern Med. 1997;157(4):409–415.
- , , , , . Intensive smoking cessation counseling versus minimal counseling among hospitalized smokers treated with transdermal nicotine replacement: a randomized trial. Am J Med. 2003;114(7):555–562.
- , , , et al. Motivational factors predict quit attempts but not maintenance of smoking cessation: findings from the International Tobacco Control Four country project. Nicotine Tob Res. 2010;12(suppl):S4–S11.
- , , , , . Predictors of attempts to stop smoking and their success in adult general population samples: a systematic review. Addiction. 2011;106(12):2110–2121.
- , , , et al. Validity of self‐reported smoking status among participants in a lung cancer screening trial. Cancer Epidemiol Biomarkers Prev. 2006;15(10):1825–1828.
- , , , . VHA enrollees' health care coverage and use of care. Med Care Res Rev. 2003;60(2):253–67.
- , , , , . Association between lung function and exacerbation frequency in patients with COPD. Int J Chron Obstruct Pulmon Dis. 2010;5:435–444.
- , , , et al. Smoking cessation in patients with chronic obstructive pulmonary disease: a double‐blind, placebo‐controlled, randomised trial. Lancet. 2001;357(9268):1571–1575.
- , , . Nurse‐conducted smoking cessation in patients with COPD using nicotine sublingual tablets and behavioral support. Chest. 2006;130(2):334–342.
© 2015 Society of Hospital Medicine

Warfarin‐Associated Adverse Events
Warfarin is 1 of the most common causes of adverse drug events, with hospitalized patients being particularly at risk compared to outpatients.[1] Despite the availability of new oral anticoagulants (NOACs), physicians commonly prescribe warfarin to hospitalized patients,[2] likely in part due to the greater difficulty in reversing NOACs compared to warfarin. Furthermore, uptake of the NOACs is likely to be slow in resource‐poor countries due to the lower cost of warfarin.[3] However, the narrow therapeutic index, frequent drug‐drug interactions, and patient variability in metabolism of warfarin makes management challenging.[4] Thus, warfarin remains a significant cause of adverse events in hospitalized patients, occurring in approximately 3% to 8% of exposed patients, depending on underlying condition.[2, 5]
An elevated international normalized ratio (INR) is a strong predictor of drug‐associated adverse events (patient harm). In a study employing 21 different electronic triggers to identify potential adverse events, an elevated INR had the highest yield for events associated with harm (96% of INRs >5.0 associated with harm).[6] Although pharmacist‐managed inpatient anticoagulation services have been shown to improve warfarin management,[7, 8] there are evidence gaps regarding the causes of warfarin‐related adverse events and practice changes that could decrease their frequency. Although overanticoagulation is a well‐known risk factor for warfarin‐related adverse events,[9, 10] there are few evidence‐based warfarin monitoring and dosing recommendations for hospitalized patients.[10] For example, the 2012 American College of Chest Physicians Antithrombotic Guidelines[11] provide a weak recommendation on initial dosing of warfarin, but no recommendations on how frequently to monitor the INR, or appropriate dosing responses to INR levels. Although many hospitals employ protocols that suggest daily INR monitoring until stable, there are no evidence‐based guidelines to support this practice.[12] Conversely, there are reports of flags to order an INR level that are not activated unless greater than 2[13] or 3 days[14] pass since the prior INR. Protocols from some major academic medical centers suggest that after a therapeutic INR is reached, INR levels can be measured intermittently, as infrequently as twice a week.[15, 16]
The 2015 Joint Commission anticoagulant‐focused National Patient Safety Goal[17] (initially issued in 2008) mandates the assessment of baseline coagulation status before starting warfarin, and warfarin dosing based on a current INR; however, current is not defined. Neither the extent to which the mandate for assessing baseline coagulation status is adhered to nor the relationship between this process of care and patient outcomes is known. The importance of adverse drug events associated with anticoagulants, included warfarin, was also recently highlighted in the 2014 federal National Action Plan for Adverse Drug Event Prevention. In this document, the prevention of adverse drug events associated with anticoagulants was 1 of the 3 areas selected for special national attention and action.[18]
The Medicare Patient Safety Monitoring System (MPSMS) is a national chart abstraction‐based system that includes 21 in‐hospital adverse event measures, including warfarin‐associated adverse drug events.[2] Because of the importance of warfarin‐associated bleeding in hospitalized patients, we analyzed MPSMS data to determine what factors related to INR monitoring practices place patients at risk for these events. We were particularly interested in determining if we could detect potentially modifiable predictors of overanticoagulation and warfarin‐associated adverse events.
METHODS
Study Sample
We combined 2009 to 2013 MPSMS all payer data from the Centers for Medicare & Medicaid Services Hospital Inpatient Quality Reporting program for 4 common medical conditions: (1) acute myocardial infarction, (2) heart failure, (3) pneumonia, and (4) major surgery (as defined by the national Surgical Care Improvement Project).[19] To increase the sample size for cardiac patients, we combined myocardial infarction patients and heart failure patients into 1 group: acute cardiovascular disease. Patients under 18 years of age are excluded from the MPSMS sample, and we excluded patients whose INR never exceeded 1.5 after the initiation of warfarin therapy.
Patient Characteristics
Patient characteristics included demographics (age, sex, race [white, black, and other race]) and comorbidities. Comorbidities abstracted from medical records included: histories at the time of hospital admission of heart failure, obesity, coronary artery disease, renal disease, cerebrovascular disease, chronic obstructive pulmonary disease, cancer, diabetes, and smoking. The use of anticoagulants other than warfarin was also captured.
INRs
The INR measurement period for each patient started from the initial date of warfarin administration and ended on the date the maximum INR occurred. If a patient had more than 1 INR value on any day, the higher INR value was selected. A day without an INR measurement was defined as no INR value documented for a calendar day within the INR measurement period, starting on the third day of warfarin and ending on the day of the maximum INR level.
Outcomes
The study was performed to assess the association between the number of days on which a patient did not have an INR measured while receiving warfarin and the occurrence of (1) an INR 6.0[20, 21] (intermediate outcome) and (2) a warfarin‐associated adverse event. A description of the MPSMS measure of warfarin‐associated adverse events has been previously published.[2] Warfarin‐associated adverse events must have occurred within 48 hours of predefined triggers: an INR 4.0, cessation of warfarin therapy, administration of vitamin K or fresh frozen plasma, or transfusion of packed red blood cells other than in the setting of a surgical procedure. Warfarin‐associated adverse events were divided into minor and major events for this analysis. Minor events were defined as bleeding, drop in hematocrit of 3 points (occurring more than 48 hours after admission and not associated with surgery), or development of a hematoma. Major events were death, intracranial bleeding, or cardiac arrest. A patient who had both a major and a minor event was considered as having had a major event.
To assess the relationship between a rapidly rising INR and a subsequent INR 5.0 or 6.0, we determined the increase in INR between the measurement done 2 days prior to the maximum INR and 1 day prior to the maximum INR. This analysis was performed only on patients whose INR was 2.0 and 3.5 on the day prior to the maximum INR. In doing so, we sought to determine if the INR rise could predict the occurrence of a subsequent severely elevated INR in patients whose INR was within or near the therapeutic range.
Statistical Analysis
We conducted bivariate analysis to quantify the associations between lapses in measurement of the INR and subsequent warfarin‐associated adverse events, using the Mantel‐Haenszel 2 test for categorical variables. We fitted a generalized linear model with a logit link function to estimate the association of days on which an INR was not measured and the occurrence of the composite adverse event measure or the occurrence of an INR 6.0, adjusting for baseline patient characteristics, the number of days on warfarin, and receipt of heparin and low‐molecular‐weight heparin (LMWH). To account for potential imbalances in baseline patient characteristics and warfarin use prior to admission, we conducted a second analysis using the stabilized inverse probability weights approach. Specifically, we weighted each patient by the patient's inverse propensity scores of having only 1 day, at least 1 day, and at least 2 days without an INR measurement while receiving warfarin.[22, 23, 24, 25] To obtain the propensity scores, we fitted 3 logistic models with all variables included in the above primary mixed models except receipt of LMWH, heparin, and the number of days on warfarin as predictors, but 3 different outcomes, 1 day without an INR measurement, 1 or more days without an INR measurement, and 2 or more days without an INR measurement. Analyses were conducted using SAS version 9.2 (SAS Institute Inc., Cary, NC). All statistical testing was 2‐sided, at a significance level of 0.05. The institutional review board at Solutions IRB (Little Rock, AR) determined that the requirement for informed consent could be waived based on the nature of the study.
RESULTS
There were 130,828 patients included in the 2009 to 2013 MPSMS sample, of whom 19,445 (14.9%) received warfarin during their hospital stay and had at least 1 INR measurement. Among these patients, 5228 (26.9%) had no INR level above 1.5 and were excluded from further analysis, leaving 14,217 included patients. Of these patients, 1055 (7.4%) developed a warfarin‐associated adverse event. Table 1 demonstrates the baseline demographics and comorbidities of the included patients.
| Characteristics | Acute Cardiovascular Disease, No. (%), N = 6,394 | Pneumonia, No. (%), N = 3,668 | Major Surgery, No. (%), N = 4,155 | All, No. (%), N = 14,217 |
|---|---|---|---|---|
| ||||
| Age, mean [SD] | 75.3 [12.4] | 74.5 [13.3] | 69.4 [11.8] | 73.4 [12.7] |
| Sex, female | 3,175 (49.7) | 1,741 (47.5) | 2,639 (63.5) | 7,555 (53.1) |
| Race | ||||
| White | 5,388 (84.3) | 3,268 (89.1) | 3,760 (90.5) | 12,416 (87.3) |
| Other | 1,006 (15.7) | 400 (10.9) | 395 (9.5) | 1,801 (12.7) |
| Comorbidities | ||||
| Cancer | 1,186 (18.6) | 939 (25.6) | 708 (17.0) | 2,833 (19.9) |
| Diabetes | 3,043 (47.6) | 1,536 (41.9) | 1,080 (26.0) | 5,659 (39.8) |
| Obesity | 1,938 (30.3) | 896 (24.4) | 1,260 (30.3) | 4,094 (28.8) |
| Cerebrovascular disease | 1,664 (26.0) | 910 (24.8) | 498 (12.0) | 3,072 (21.6) |
| Heart failure/pulmonary edema | 5,882 (92.0) | 2,052 (55.9) | 607 (14.6) | 8,541 (60.1) |
| Chronic obstructive pulmonary disease | 2,636 (41.2) | 1,929 (52.6) | 672 (16.2) | 5,237 (36.8) |
| Smoking | 895 (14.0) | 662 (18.1) | 623 (15.0) | 2,180 (15.3) |
| Corticosteroids | 490 (7.7) | 568 (15.5) | 147 (3.5) | 1,205 (8.5) |
| Coronary artery disease | 4,628 (72.4) | 1,875 (51.1) | 1,228 (29.6) | 7,731 (54.4) |
| Renal disease | 3,000 (46.9) | 1,320 (36.0) | 565 (13.6) | 4,885 (34.4) |
| Warfarin prior to arrival | 5,074 (79.4) | 3,020 (82.3) | 898 (21.6) | 8,992 (63.3) |
| Heparin given during hospitalization | 850 (13.3) | 282 (7.7) | 314 (7.6) | 1,446 (10.7) |
| LMWH given during hospitalization | 1,591 (24.9) | 1,070 (29.2) | 1,431 (34.4) | 4,092 (28.8) |
Warfarin was started on hospital day 1 for 6825 (48.0%) of 14,217 patients. Among these patients, 6539 (95.8%) had an INR measured within 1 calendar day. We were unable to determine how many patients who started warfarin later in their hospital stay had a baseline INR, as we did not capture INRs performed prior to the day that warfarin was initiated.
Supporting Table 1 in the online version of this article demonstrates the association between an INR 6.0 and the occurrence of warfarin‐associated adverse events. A maximum INR 6.0 occurred in 469 (3.3%) of the patients included in the study, and among those patients, 133 (28.4%) experienced a warfarin‐associated adverse event compared to 922 (6.7%) adverse events in the 13,748 patients who did not develop an INR 6.0 (P < 0.001).
Among 8529 patients who received warfarin for at least 3 days, beginning on the third day of warfarin, 1549 patients (18.2%) did not have INR measured at least once each day that they received warfarin. Table 2 demonstrates that patients who had 2 or more days on which the INR was not measured had higher rates of INR 6.0 than patients for whom the INR was measured daily. A similar association was seen for warfarin‐associated adverse events (Table 2).
| No. of Patients, No. (%), N = 8,529 | Patients With INR on All Days, No. (%), N = 6,980 | Patients With 1 Day Without an INR, No. (%), N = 968 | Patients With 2 or More Days Without an INR, No. (%), N = 581 | P Value | |
|---|---|---|---|---|---|
| |||||
| Maximum INR | <0.01* | ||||
| 1.515.99 | 8,183 | 6,748 (96.7) | 911 (94.1) | 524 (90.2) | |
| 6.0 | 346 | 232 (3.3) | 57 (5.9) | 57 (9.8) | |
| Warfarin‐associated adverse events | <0.01* | ||||
| No adverse events | 7,689 (90.2) | 6,331 (90.7) | 872 (90.1) | 486 (83.6) | |
| Minor adverse events | 792 (9.3) | 617 (8.8) | 86 (8.9) | 89 (15.3) | |
| Major adverse events | 48 (0.6) | 32 (0.5) | 10 (1.0) | 6 (1.0) | |
Figure 1A demonstrates the association between the number of days without an INR measurement and the subsequent development of an INR 6.0 or a warfarin‐associated adverse event, adjusted for baseline patient characteristics, receipt of heparin and LMWH, and number of days on warfarin. Patients with 1 or more days without an INR measurement had higher risk‐adjusted ORs of a subsequent INR 6.0, although the difference was not statistically significant for surgical patients. The analysis results based on inverse propensity scoring are seen in Figure 1B. Cardiac and surgical patients with 2 or more days without an INR measurement were at higher risk of having a warfarin‐associated adverse event, whereas cardiac and pneumonia patients with 1 or more days without an INR measurement were at higher risk of developing an INR 6.0.
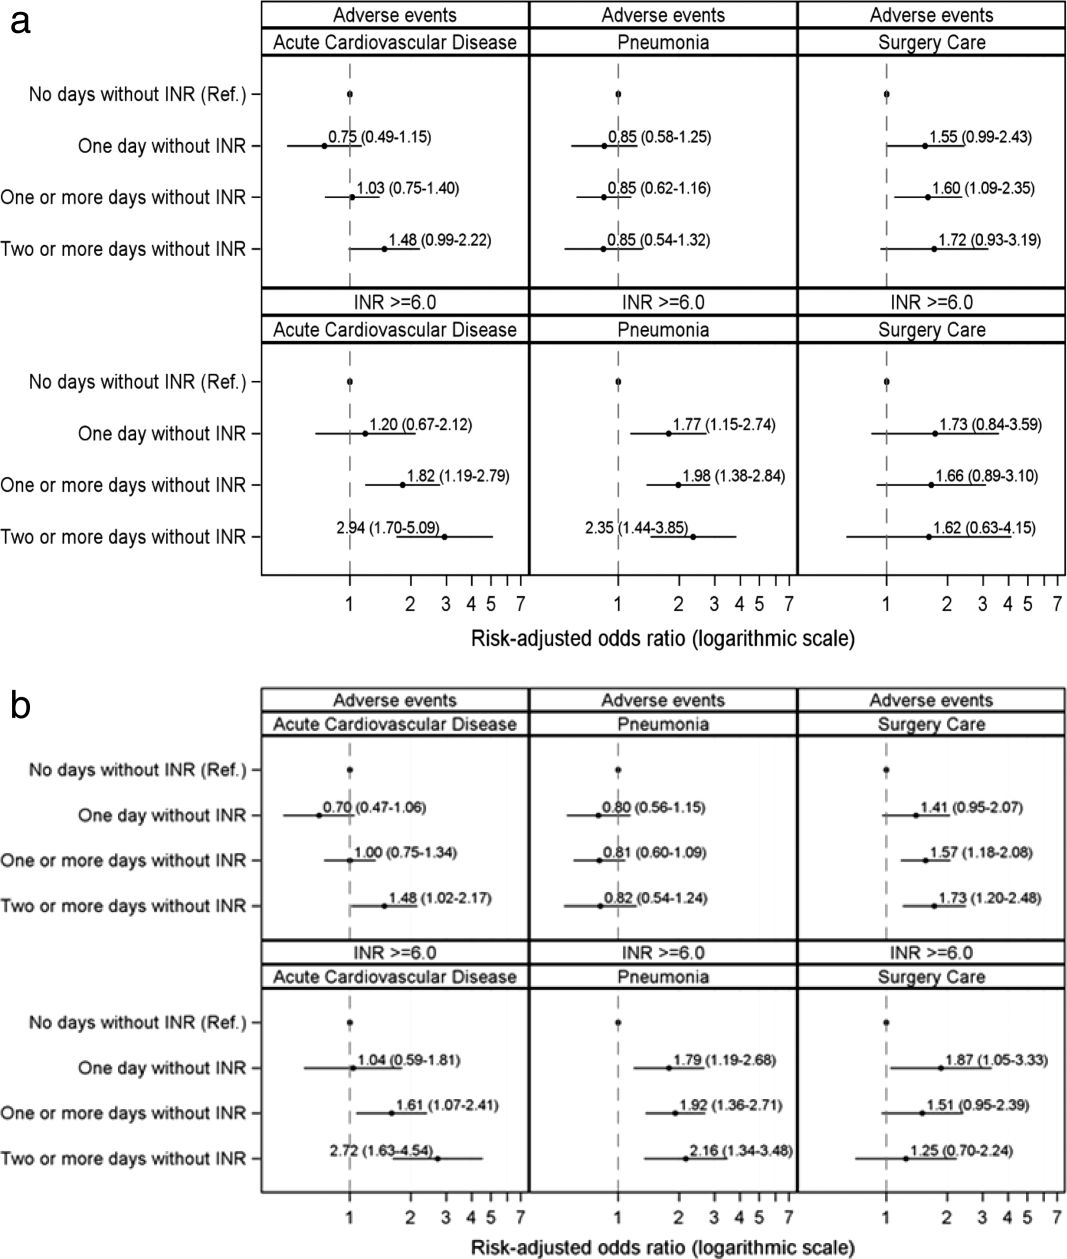
Supporting Table 2 in the online version of this article demonstrates the relationship between patient characteristics and the occurrence of an INR 6.0 or a warfarin‐related adverse event. The only characteristic that was associated with either of these outcomes for all 3 patient conditions was renal disease, which was positively associated with a warfarin‐associated adverse event. Warfarin use prior to arrival was associated with lower risks of both an INR 6.0 and a warfarin‐associated adverse event, except for among surgical patients. Supporting Table 3 in the online version of this article demonstrates the differences in patient characteristics between patients who had daily INR measurement and those who had at least 1 day without an INR measurement.
Figure 2 illustrates the relationship of the maximum INR to the prior 1‐day change in INR in 4963 patients whose INR on the day prior to the maximum INR was 2.0 to 3.5. When the increase in INR was <0.9, the risk of the next day's INR being 6.0 was 0.7%, and if the increase was 0.9, the risk was 5.2%. The risk of developing an INR 5.0 was 1.9% if the preceding day's INR increase was <0.9 and 15.3% if the prior day's INR rise was 0.9. Overall, 51% of INRs 6.0 and 55% of INRs 5.0 were immediately preceded by an INR increase of 0.9. The positive likelihood ratio (LR) for a 0.9 rise in INR predicting an INR of 6.0 was 4.2, and the positive LR was 4.9 for predicting an INR 5.0.
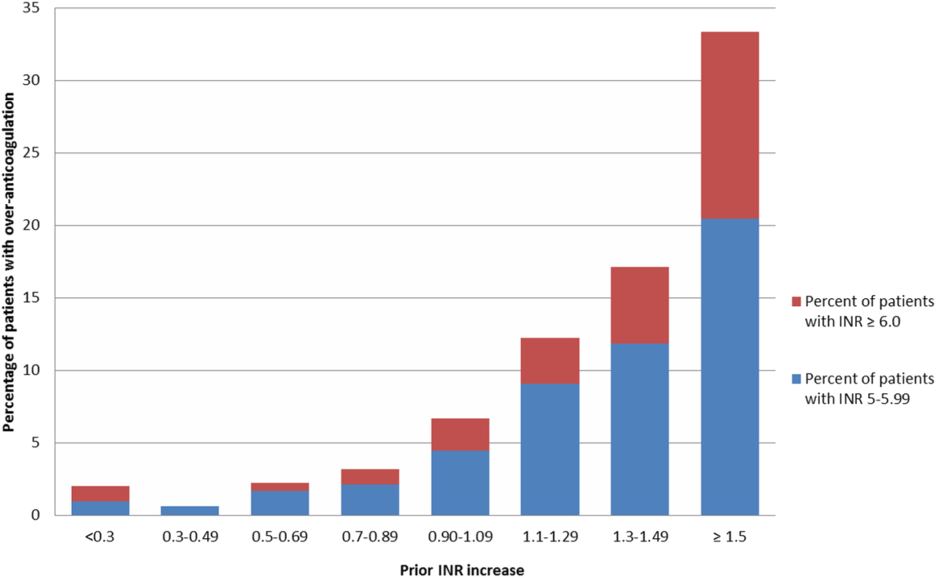
There was no decline in the frequency of warfarin use among the patients in the MPSMS sample during the study period (16.7% in 2009 and 17.3% in 2013).
DISCUSSION
We studied warfarin‐associated adverse events in a nationally representative study of patients who received warfarin while in an acute care hospital for a primary diagnosis of cardiac disease, pneumonia, or major surgery. Several findings resulted from our analysis. First, warfarin is still commonly prescribed to hospitalized patients and remains a frequent cause of adverse events; 7.4% of the 2009 to 2013 MPSMS population who received warfarin and had at least 1 INR >1.5 developed a warfarin‐associated adverse event.
Over 95% of patients who received warfarin on the day of hospital admission had an INR performed within 1 day. This is similar to the results from a 2006 single center study in which 95% of patients had an INR measured prior to their first dose of warfarin.[10] Since 2008, The Joint Commission's National Patient Safety Goal has required the assessment of coagulation status before starting warfarin.[17] The high level of adherence to this standard suggests that further attention to this process of care is unlikely to significantly improve patient safety.
We also found that the lack of daily INR measurements was associated with an increased risk of an INR 6.0 and warfarin‐associated adverse events in some patient populations. There is limited evidence addressing the appropriate frequency of INR measurement in hospitalized patients receiving warfarin. The Joint Commission National Patient Safety Goal requires use of a current INR to adjust this therapy, but provides no specifics.[17] Although some experts believe that INRs should be monitored daily in hospitalized patients, this does not appear to be uniformly accepted. In some reports, 2[13] or 3[14] consecutive days without the performance of an INR was required to activate a reminder. Protocols from some major teaching hospitals specify intermittent monitoring once the INR is therapeutic.[15, 16] Because our results suggest that lapses in INR measurement lead to overanticoagulation and warfarin‐related adverse events, it may be appropriate to measure INRs daily in most hospitalized patients receiving warfarin. This would be consistent with the many known causes of INR instability in patients admitted to the hospital, including drug‐drug interactions, hepatic dysfunction, and changes in volume of distribution, such that truly stable hospitalized patients are likely rare. Indeed, hospital admission is a well‐known predictor of instability of warfarin effect. [9] Although our results suggest that daily INR measurement is associated with a lower rate of overanticoagulation, future studies might better define lower risk patients for whom daily INR measurement would not be necessary.
A prior INR increase 0.9 in 1 day was associated with an increased risk of subsequent overanticoagulation. Although a rapidly rising INR is known to predict overanticoagulation[10, 14] we could find no evidence as to what specific rate of rise confers this risk. Our results suggest that use of a warfarin dosing protocol that considers both the absolute value of the INR and the rate of rise could reduce warfarin‐related adverse events.
There are important limitations of our study. We did not abstract warfarin dosages, which precluded study of the appropriateness of both initial warfarin dosing and adjustment of the warfarin dose based on INR results. MPSMS does not reliably capture antiplatelet agents or other agents that result in drug‐drug interactions with warfarin, such as antibiotics, so this factor could theoretically have confounded our results. Antibiotic use seems unlikely to be a major confounder, because patients with acute cardiovascular disease demonstrated a similar relationship between INR measurement and an INR 6.0 to that seen with pneumonia and surgical patients, despite the latter patients likely having greater antibiotics exposure. Furthermore, MPSMS does not capture indices of severity of illness, so other unmeasured confounders could have influenced our results. Although we have data for patients admitted to the hospital for only 4 conditions, these are conditions that represent approximately 22% of hospital admissions in the United States.[2] Strengths of our study include the nationally representative and randomly selected cases and use of data that were obtained from chart abstraction as opposed to administrative data. Through the use of centralized data abstraction, we avoided the potential bias introduced when hospitals self‐report adverse events.
In summary, in a national sample of patients admitted to the hospital for 4 common conditions, warfarin‐associated adverse events were detected in 7.4% of patients who received warfarin. Lack of daily INR measurement was associated with an increased risk of overanticoagulation and warfarin‐associated adverse events in certain patient populations. A 1‐day increase in the INR of 0.9 predicted subsequent overanticoagulation. These results provide actionable opportunities to improve safety in some hospitalized patients receiving warfarin.
Acknowledgements
The authors express their appreciation to Dan Budnitz, MD, MPH, for his advice regarding study design and his review and comments on a draft of this manuscript.
Disclosures: This work was supported by contract HHSA290201200003C from the Agency for Healthcare Research and Quality, United States Department of Health and Human Services, Rockville, Maryland. Qualidigm was the contractor. The authors assume full responsibility for the accuracy and completeness of the ideas. Dr. Metersky has worked on various quality improvement and patient safety projects with Qualidigm, Centers for Medicare & Medicaid Services, and the Agency for Healthcare Research and Quality. His employer has received remuneration for this work. Dr. Krumholz works under contract with the Centers for Medicare & Medicaid Services to develop and maintain performance measures. Dr. Krumholz is the chair of a cardiac scientific advisory board for UnitedHealth and the recipient of a research grant from Medtronic, Inc. through Yale University. The other authors report no conflicts of interest.
- , , , , , . Delivery of optimized inpatient anticoagulation therapy: consensus statement from the anticoagulation forum. Ann Pharmacother. 2013;47:714–724.
- , , , et al. National trends in patient safety for four common conditions, 2005–2011. N Engl J Med. 2014;370:341–351.
- , . Update on antithrombotic therapy: new anticoagulants. Circulation. 2010;121:1523–1532
- , , , . The pharmacogenetics of coumarin therapy. Pharmacogenomics. 2005;6:503–513.
- , , . Adverse drug events among hospitalized Medicare patients: epidemiology and national estimates from a new approach to surveillance. Jt Comm J Qual Patient Saf. 2010;36:12–21.
- , , , et al. Active surveillance using electronic triggers to detect adverse events in hospitalized patients. Qual Saf Health Care. 2006;15:184–190.
- , , , et al. Inpatient warfarin management: pharmacist management using a detailed dosing protocol. J Thromb Thrombolysis. 2012;33:178–184.
- , , , , . Efficacy and safety of a pharmacist‐managed inpatient anticoagulation service for warfarin initiation and titration. J Clin Pharm Ther. 2011;36:585–591.
- , , , et al. Bleeding complications of oral anticoagulant treatment: an inception‐cohort, prospective collaborative study (ISCOAT). Italian Study on Complications of Oral Anticoagulant Therapy. Lancet. 1996;348:423–428.
- , , , , , . Oral anticoagulation in the hospital: analysis of patients at risk. J Thromb Thrombolysis. 2011;31:22–26.
- , , , et al. Evidence‐based management of anticoagulant therapy: Antithrombotic Therapy and Prevention of Thrombosis, 9th ed: American College of Chest Physicians Evidence‐Based Clinical Practice Guidelines. Chest. 2012;141:e152S–e184S.
- Agency for Healthcare Research and Quality. National Guideline Clearinghouse. Available at: http://www.guideline.gov. Accessed April 30, 2015.
- , . Reduction in anticoagulation‐related adverse drug events using a trigger‐based methodology. Jt Comm J Qual Patient Saf. 2005;31:313–318.
- , , . Use of specific indicators to detect warfarin‐related adverse events. Am J Health Syst Pharm. 2005;62:1683–1688.
- University of Wisconsin Health. Warfarin management– adult–inpatient clinical practice guideline. Available at: http://www.uwhealth.org/files/uwhealth/docs/pdf3/Inpatient_Warfarin_Guideline.pdf. Accessed April 30, 2015
- Anticoagulation Guidelines ‐ LSU Health Shreveport. Available at: http://myhsc.lsuhscshreveport.edu/pharmacy/PT%20Policies/Anticoagulation_Safety.pdf. Accessed November 29, 2015.
- The Joint Commission. National patient safety goals effective January 1, 2015. Available at: http://www.jointcommission.org/assets/1/6/2015_NPSG_HAP.pdf. Accessed November 29, 2015.
- U.S. Department of Health and Human Services. Office of Disease Prevention and Health Promotion. Available at: http://health.gov/hcq/pdfs/ade-action-plan-508c.pdf. Accessed November 29, 2015.
- The Joint Commission. Surgical care improvement project. Available at: http://www.jointcommission.org/surgical_care_improvement_project. Accessed May 5, 2015.
- , , , et al. Optimization of inpatient warfarin therapy: Impact of daily consultation by a pharmacist‐managed anticoagulation service. Ann Pharmacother. 2000;34:567–572.
- , , . Effects of requiring a baseline International Normalized Ratio for inpatients treated with warfarin. Am J Health Syst Pharm. 2010;67:17–22.
- , . Weighting regressions by propensity scores. Eval Rev. 2008;32:392–409.
- . An introduction to propensity score methods for reducing the effects of confounding in observational studies. Multivar Behav Res. 2011;46:399–424.
- . Propensity score methods for bias reduction in the comparison of a treatment to a non‐randomized control group. Stat Med. 1998;17:2265–2281.
- , . The central role of the propensity score in observational studies for causal effects. Biometrika. 1983;70:41–55.
Warfarin is 1 of the most common causes of adverse drug events, with hospitalized patients being particularly at risk compared to outpatients.[1] Despite the availability of new oral anticoagulants (NOACs), physicians commonly prescribe warfarin to hospitalized patients,[2] likely in part due to the greater difficulty in reversing NOACs compared to warfarin. Furthermore, uptake of the NOACs is likely to be slow in resource‐poor countries due to the lower cost of warfarin.[3] However, the narrow therapeutic index, frequent drug‐drug interactions, and patient variability in metabolism of warfarin makes management challenging.[4] Thus, warfarin remains a significant cause of adverse events in hospitalized patients, occurring in approximately 3% to 8% of exposed patients, depending on underlying condition.[2, 5]
An elevated international normalized ratio (INR) is a strong predictor of drug‐associated adverse events (patient harm). In a study employing 21 different electronic triggers to identify potential adverse events, an elevated INR had the highest yield for events associated with harm (96% of INRs >5.0 associated with harm).[6] Although pharmacist‐managed inpatient anticoagulation services have been shown to improve warfarin management,[7, 8] there are evidence gaps regarding the causes of warfarin‐related adverse events and practice changes that could decrease their frequency. Although overanticoagulation is a well‐known risk factor for warfarin‐related adverse events,[9, 10] there are few evidence‐based warfarin monitoring and dosing recommendations for hospitalized patients.[10] For example, the 2012 American College of Chest Physicians Antithrombotic Guidelines[11] provide a weak recommendation on initial dosing of warfarin, but no recommendations on how frequently to monitor the INR, or appropriate dosing responses to INR levels. Although many hospitals employ protocols that suggest daily INR monitoring until stable, there are no evidence‐based guidelines to support this practice.[12] Conversely, there are reports of flags to order an INR level that are not activated unless greater than 2[13] or 3 days[14] pass since the prior INR. Protocols from some major academic medical centers suggest that after a therapeutic INR is reached, INR levels can be measured intermittently, as infrequently as twice a week.[15, 16]
The 2015 Joint Commission anticoagulant‐focused National Patient Safety Goal[17] (initially issued in 2008) mandates the assessment of baseline coagulation status before starting warfarin, and warfarin dosing based on a current INR; however, current is not defined. Neither the extent to which the mandate for assessing baseline coagulation status is adhered to nor the relationship between this process of care and patient outcomes is known. The importance of adverse drug events associated with anticoagulants, included warfarin, was also recently highlighted in the 2014 federal National Action Plan for Adverse Drug Event Prevention. In this document, the prevention of adverse drug events associated with anticoagulants was 1 of the 3 areas selected for special national attention and action.[18]
The Medicare Patient Safety Monitoring System (MPSMS) is a national chart abstraction‐based system that includes 21 in‐hospital adverse event measures, including warfarin‐associated adverse drug events.[2] Because of the importance of warfarin‐associated bleeding in hospitalized patients, we analyzed MPSMS data to determine what factors related to INR monitoring practices place patients at risk for these events. We were particularly interested in determining if we could detect potentially modifiable predictors of overanticoagulation and warfarin‐associated adverse events.
METHODS
Study Sample
We combined 2009 to 2013 MPSMS all payer data from the Centers for Medicare & Medicaid Services Hospital Inpatient Quality Reporting program for 4 common medical conditions: (1) acute myocardial infarction, (2) heart failure, (3) pneumonia, and (4) major surgery (as defined by the national Surgical Care Improvement Project).[19] To increase the sample size for cardiac patients, we combined myocardial infarction patients and heart failure patients into 1 group: acute cardiovascular disease. Patients under 18 years of age are excluded from the MPSMS sample, and we excluded patients whose INR never exceeded 1.5 after the initiation of warfarin therapy.
Patient Characteristics
Patient characteristics included demographics (age, sex, race [white, black, and other race]) and comorbidities. Comorbidities abstracted from medical records included: histories at the time of hospital admission of heart failure, obesity, coronary artery disease, renal disease, cerebrovascular disease, chronic obstructive pulmonary disease, cancer, diabetes, and smoking. The use of anticoagulants other than warfarin was also captured.
INRs
The INR measurement period for each patient started from the initial date of warfarin administration and ended on the date the maximum INR occurred. If a patient had more than 1 INR value on any day, the higher INR value was selected. A day without an INR measurement was defined as no INR value documented for a calendar day within the INR measurement period, starting on the third day of warfarin and ending on the day of the maximum INR level.
Outcomes
The study was performed to assess the association between the number of days on which a patient did not have an INR measured while receiving warfarin and the occurrence of (1) an INR 6.0[20, 21] (intermediate outcome) and (2) a warfarin‐associated adverse event. A description of the MPSMS measure of warfarin‐associated adverse events has been previously published.[2] Warfarin‐associated adverse events must have occurred within 48 hours of predefined triggers: an INR 4.0, cessation of warfarin therapy, administration of vitamin K or fresh frozen plasma, or transfusion of packed red blood cells other than in the setting of a surgical procedure. Warfarin‐associated adverse events were divided into minor and major events for this analysis. Minor events were defined as bleeding, drop in hematocrit of 3 points (occurring more than 48 hours after admission and not associated with surgery), or development of a hematoma. Major events were death, intracranial bleeding, or cardiac arrest. A patient who had both a major and a minor event was considered as having had a major event.
To assess the relationship between a rapidly rising INR and a subsequent INR 5.0 or 6.0, we determined the increase in INR between the measurement done 2 days prior to the maximum INR and 1 day prior to the maximum INR. This analysis was performed only on patients whose INR was 2.0 and 3.5 on the day prior to the maximum INR. In doing so, we sought to determine if the INR rise could predict the occurrence of a subsequent severely elevated INR in patients whose INR was within or near the therapeutic range.
Statistical Analysis
We conducted bivariate analysis to quantify the associations between lapses in measurement of the INR and subsequent warfarin‐associated adverse events, using the Mantel‐Haenszel 2 test for categorical variables. We fitted a generalized linear model with a logit link function to estimate the association of days on which an INR was not measured and the occurrence of the composite adverse event measure or the occurrence of an INR 6.0, adjusting for baseline patient characteristics, the number of days on warfarin, and receipt of heparin and low‐molecular‐weight heparin (LMWH). To account for potential imbalances in baseline patient characteristics and warfarin use prior to admission, we conducted a second analysis using the stabilized inverse probability weights approach. Specifically, we weighted each patient by the patient's inverse propensity scores of having only 1 day, at least 1 day, and at least 2 days without an INR measurement while receiving warfarin.[22, 23, 24, 25] To obtain the propensity scores, we fitted 3 logistic models with all variables included in the above primary mixed models except receipt of LMWH, heparin, and the number of days on warfarin as predictors, but 3 different outcomes, 1 day without an INR measurement, 1 or more days without an INR measurement, and 2 or more days without an INR measurement. Analyses were conducted using SAS version 9.2 (SAS Institute Inc., Cary, NC). All statistical testing was 2‐sided, at a significance level of 0.05. The institutional review board at Solutions IRB (Little Rock, AR) determined that the requirement for informed consent could be waived based on the nature of the study.
RESULTS
There were 130,828 patients included in the 2009 to 2013 MPSMS sample, of whom 19,445 (14.9%) received warfarin during their hospital stay and had at least 1 INR measurement. Among these patients, 5228 (26.9%) had no INR level above 1.5 and were excluded from further analysis, leaving 14,217 included patients. Of these patients, 1055 (7.4%) developed a warfarin‐associated adverse event. Table 1 demonstrates the baseline demographics and comorbidities of the included patients.
| Characteristics | Acute Cardiovascular Disease, No. (%), N = 6,394 | Pneumonia, No. (%), N = 3,668 | Major Surgery, No. (%), N = 4,155 | All, No. (%), N = 14,217 |
|---|---|---|---|---|
| ||||
| Age, mean [SD] | 75.3 [12.4] | 74.5 [13.3] | 69.4 [11.8] | 73.4 [12.7] |
| Sex, female | 3,175 (49.7) | 1,741 (47.5) | 2,639 (63.5) | 7,555 (53.1) |
| Race | ||||
| White | 5,388 (84.3) | 3,268 (89.1) | 3,760 (90.5) | 12,416 (87.3) |
| Other | 1,006 (15.7) | 400 (10.9) | 395 (9.5) | 1,801 (12.7) |
| Comorbidities | ||||
| Cancer | 1,186 (18.6) | 939 (25.6) | 708 (17.0) | 2,833 (19.9) |
| Diabetes | 3,043 (47.6) | 1,536 (41.9) | 1,080 (26.0) | 5,659 (39.8) |
| Obesity | 1,938 (30.3) | 896 (24.4) | 1,260 (30.3) | 4,094 (28.8) |
| Cerebrovascular disease | 1,664 (26.0) | 910 (24.8) | 498 (12.0) | 3,072 (21.6) |
| Heart failure/pulmonary edema | 5,882 (92.0) | 2,052 (55.9) | 607 (14.6) | 8,541 (60.1) |
| Chronic obstructive pulmonary disease | 2,636 (41.2) | 1,929 (52.6) | 672 (16.2) | 5,237 (36.8) |
| Smoking | 895 (14.0) | 662 (18.1) | 623 (15.0) | 2,180 (15.3) |
| Corticosteroids | 490 (7.7) | 568 (15.5) | 147 (3.5) | 1,205 (8.5) |
| Coronary artery disease | 4,628 (72.4) | 1,875 (51.1) | 1,228 (29.6) | 7,731 (54.4) |
| Renal disease | 3,000 (46.9) | 1,320 (36.0) | 565 (13.6) | 4,885 (34.4) |
| Warfarin prior to arrival | 5,074 (79.4) | 3,020 (82.3) | 898 (21.6) | 8,992 (63.3) |
| Heparin given during hospitalization | 850 (13.3) | 282 (7.7) | 314 (7.6) | 1,446 (10.7) |
| LMWH given during hospitalization | 1,591 (24.9) | 1,070 (29.2) | 1,431 (34.4) | 4,092 (28.8) |
Warfarin was started on hospital day 1 for 6825 (48.0%) of 14,217 patients. Among these patients, 6539 (95.8%) had an INR measured within 1 calendar day. We were unable to determine how many patients who started warfarin later in their hospital stay had a baseline INR, as we did not capture INRs performed prior to the day that warfarin was initiated.
Supporting Table 1 in the online version of this article demonstrates the association between an INR 6.0 and the occurrence of warfarin‐associated adverse events. A maximum INR 6.0 occurred in 469 (3.3%) of the patients included in the study, and among those patients, 133 (28.4%) experienced a warfarin‐associated adverse event compared to 922 (6.7%) adverse events in the 13,748 patients who did not develop an INR 6.0 (P < 0.001).
Among 8529 patients who received warfarin for at least 3 days, beginning on the third day of warfarin, 1549 patients (18.2%) did not have INR measured at least once each day that they received warfarin. Table 2 demonstrates that patients who had 2 or more days on which the INR was not measured had higher rates of INR 6.0 than patients for whom the INR was measured daily. A similar association was seen for warfarin‐associated adverse events (Table 2).
| No. of Patients, No. (%), N = 8,529 | Patients With INR on All Days, No. (%), N = 6,980 | Patients With 1 Day Without an INR, No. (%), N = 968 | Patients With 2 or More Days Without an INR, No. (%), N = 581 | P Value | |
|---|---|---|---|---|---|
| |||||
| Maximum INR | <0.01* | ||||
| 1.515.99 | 8,183 | 6,748 (96.7) | 911 (94.1) | 524 (90.2) | |
| 6.0 | 346 | 232 (3.3) | 57 (5.9) | 57 (9.8) | |
| Warfarin‐associated adverse events | <0.01* | ||||
| No adverse events | 7,689 (90.2) | 6,331 (90.7) | 872 (90.1) | 486 (83.6) | |
| Minor adverse events | 792 (9.3) | 617 (8.8) | 86 (8.9) | 89 (15.3) | |
| Major adverse events | 48 (0.6) | 32 (0.5) | 10 (1.0) | 6 (1.0) | |
Figure 1A demonstrates the association between the number of days without an INR measurement and the subsequent development of an INR 6.0 or a warfarin‐associated adverse event, adjusted for baseline patient characteristics, receipt of heparin and LMWH, and number of days on warfarin. Patients with 1 or more days without an INR measurement had higher risk‐adjusted ORs of a subsequent INR 6.0, although the difference was not statistically significant for surgical patients. The analysis results based on inverse propensity scoring are seen in Figure 1B. Cardiac and surgical patients with 2 or more days without an INR measurement were at higher risk of having a warfarin‐associated adverse event, whereas cardiac and pneumonia patients with 1 or more days without an INR measurement were at higher risk of developing an INR 6.0.
Supporting Table 2 in the online version of this article demonstrates the relationship between patient characteristics and the occurrence of an INR 6.0 or a warfarin‐related adverse event. The only characteristic that was associated with either of these outcomes for all 3 patient conditions was renal disease, which was positively associated with a warfarin‐associated adverse event. Warfarin use prior to arrival was associated with lower risks of both an INR 6.0 and a warfarin‐associated adverse event, except for among surgical patients. Supporting Table 3 in the online version of this article demonstrates the differences in patient characteristics between patients who had daily INR measurement and those who had at least 1 day without an INR measurement.
Figure 2 illustrates the relationship of the maximum INR to the prior 1‐day change in INR in 4963 patients whose INR on the day prior to the maximum INR was 2.0 to 3.5. When the increase in INR was <0.9, the risk of the next day's INR being 6.0 was 0.7%, and if the increase was 0.9, the risk was 5.2%. The risk of developing an INR 5.0 was 1.9% if the preceding day's INR increase was <0.9 and 15.3% if the prior day's INR rise was 0.9. Overall, 51% of INRs 6.0 and 55% of INRs 5.0 were immediately preceded by an INR increase of 0.9. The positive likelihood ratio (LR) for a 0.9 rise in INR predicting an INR of 6.0 was 4.2, and the positive LR was 4.9 for predicting an INR 5.0.
There was no decline in the frequency of warfarin use among the patients in the MPSMS sample during the study period (16.7% in 2009 and 17.3% in 2013).
DISCUSSION
We studied warfarin‐associated adverse events in a nationally representative study of patients who received warfarin while in an acute care hospital for a primary diagnosis of cardiac disease, pneumonia, or major surgery. Several findings resulted from our analysis. First, warfarin is still commonly prescribed to hospitalized patients and remains a frequent cause of adverse events; 7.4% of the 2009 to 2013 MPSMS population who received warfarin and had at least 1 INR >1.5 developed a warfarin‐associated adverse event.
Over 95% of patients who received warfarin on the day of hospital admission had an INR performed within 1 day. This is similar to the results from a 2006 single center study in which 95% of patients had an INR measured prior to their first dose of warfarin.[10] Since 2008, The Joint Commission's National Patient Safety Goal has required the assessment of coagulation status before starting warfarin.[17] The high level of adherence to this standard suggests that further attention to this process of care is unlikely to significantly improve patient safety.
We also found that the lack of daily INR measurements was associated with an increased risk of an INR 6.0 and warfarin‐associated adverse events in some patient populations. There is limited evidence addressing the appropriate frequency of INR measurement in hospitalized patients receiving warfarin. The Joint Commission National Patient Safety Goal requires use of a current INR to adjust this therapy, but provides no specifics.[17] Although some experts believe that INRs should be monitored daily in hospitalized patients, this does not appear to be uniformly accepted. In some reports, 2[13] or 3[14] consecutive days without the performance of an INR was required to activate a reminder. Protocols from some major teaching hospitals specify intermittent monitoring once the INR is therapeutic.[15, 16] Because our results suggest that lapses in INR measurement lead to overanticoagulation and warfarin‐related adverse events, it may be appropriate to measure INRs daily in most hospitalized patients receiving warfarin. This would be consistent with the many known causes of INR instability in patients admitted to the hospital, including drug‐drug interactions, hepatic dysfunction, and changes in volume of distribution, such that truly stable hospitalized patients are likely rare. Indeed, hospital admission is a well‐known predictor of instability of warfarin effect. [9] Although our results suggest that daily INR measurement is associated with a lower rate of overanticoagulation, future studies might better define lower risk patients for whom daily INR measurement would not be necessary.
A prior INR increase 0.9 in 1 day was associated with an increased risk of subsequent overanticoagulation. Although a rapidly rising INR is known to predict overanticoagulation[10, 14] we could find no evidence as to what specific rate of rise confers this risk. Our results suggest that use of a warfarin dosing protocol that considers both the absolute value of the INR and the rate of rise could reduce warfarin‐related adverse events.
There are important limitations of our study. We did not abstract warfarin dosages, which precluded study of the appropriateness of both initial warfarin dosing and adjustment of the warfarin dose based on INR results. MPSMS does not reliably capture antiplatelet agents or other agents that result in drug‐drug interactions with warfarin, such as antibiotics, so this factor could theoretically have confounded our results. Antibiotic use seems unlikely to be a major confounder, because patients with acute cardiovascular disease demonstrated a similar relationship between INR measurement and an INR 6.0 to that seen with pneumonia and surgical patients, despite the latter patients likely having greater antibiotics exposure. Furthermore, MPSMS does not capture indices of severity of illness, so other unmeasured confounders could have influenced our results. Although we have data for patients admitted to the hospital for only 4 conditions, these are conditions that represent approximately 22% of hospital admissions in the United States.[2] Strengths of our study include the nationally representative and randomly selected cases and use of data that were obtained from chart abstraction as opposed to administrative data. Through the use of centralized data abstraction, we avoided the potential bias introduced when hospitals self‐report adverse events.
In summary, in a national sample of patients admitted to the hospital for 4 common conditions, warfarin‐associated adverse events were detected in 7.4% of patients who received warfarin. Lack of daily INR measurement was associated with an increased risk of overanticoagulation and warfarin‐associated adverse events in certain patient populations. A 1‐day increase in the INR of 0.9 predicted subsequent overanticoagulation. These results provide actionable opportunities to improve safety in some hospitalized patients receiving warfarin.
Acknowledgements
The authors express their appreciation to Dan Budnitz, MD, MPH, for his advice regarding study design and his review and comments on a draft of this manuscript.
Disclosures: This work was supported by contract HHSA290201200003C from the Agency for Healthcare Research and Quality, United States Department of Health and Human Services, Rockville, Maryland. Qualidigm was the contractor. The authors assume full responsibility for the accuracy and completeness of the ideas. Dr. Metersky has worked on various quality improvement and patient safety projects with Qualidigm, Centers for Medicare & Medicaid Services, and the Agency for Healthcare Research and Quality. His employer has received remuneration for this work. Dr. Krumholz works under contract with the Centers for Medicare & Medicaid Services to develop and maintain performance measures. Dr. Krumholz is the chair of a cardiac scientific advisory board for UnitedHealth and the recipient of a research grant from Medtronic, Inc. through Yale University. The other authors report no conflicts of interest.
- , , , , , . Delivery of optimized inpatient anticoagulation therapy: consensus statement from the anticoagulation forum. Ann Pharmacother. 2013;47:714–724.
- , , , et al. National trends in patient safety for four common conditions, 2005–2011. N Engl J Med. 2014;370:341–351.
- , . Update on antithrombotic therapy: new anticoagulants. Circulation. 2010;121:1523–1532
- , , , . The pharmacogenetics of coumarin therapy. Pharmacogenomics. 2005;6:503–513.
- , , . Adverse drug events among hospitalized Medicare patients: epidemiology and national estimates from a new approach to surveillance. Jt Comm J Qual Patient Saf. 2010;36:12–21.
- , , , et al. Active surveillance using electronic triggers to detect adverse events in hospitalized patients. Qual Saf Health Care. 2006;15:184–190.
- , , , et al. Inpatient warfarin management: pharmacist management using a detailed dosing protocol. J Thromb Thrombolysis. 2012;33:178–184.
- , , , , . Efficacy and safety of a pharmacist‐managed inpatient anticoagulation service for warfarin initiation and titration. J Clin Pharm Ther. 2011;36:585–591.
- , , , et al. Bleeding complications of oral anticoagulant treatment: an inception‐cohort, prospective collaborative study (ISCOAT). Italian Study on Complications of Oral Anticoagulant Therapy. Lancet. 1996;348:423–428.
- , , , , , . Oral anticoagulation in the hospital: analysis of patients at risk. J Thromb Thrombolysis. 2011;31:22–26.
- , , , et al. Evidence‐based management of anticoagulant therapy: Antithrombotic Therapy and Prevention of Thrombosis, 9th ed: American College of Chest Physicians Evidence‐Based Clinical Practice Guidelines. Chest. 2012;141:e152S–e184S.
- Agency for Healthcare Research and Quality. National Guideline Clearinghouse. Available at: http://www.guideline.gov. Accessed April 30, 2015.
- , . Reduction in anticoagulation‐related adverse drug events using a trigger‐based methodology. Jt Comm J Qual Patient Saf. 2005;31:313–318.
- , , . Use of specific indicators to detect warfarin‐related adverse events. Am J Health Syst Pharm. 2005;62:1683–1688.
- University of Wisconsin Health. Warfarin management– adult–inpatient clinical practice guideline. Available at: http://www.uwhealth.org/files/uwhealth/docs/pdf3/Inpatient_Warfarin_Guideline.pdf. Accessed April 30, 2015
- Anticoagulation Guidelines ‐ LSU Health Shreveport. Available at: http://myhsc.lsuhscshreveport.edu/pharmacy/PT%20Policies/Anticoagulation_Safety.pdf. Accessed November 29, 2015.
- The Joint Commission. National patient safety goals effective January 1, 2015. Available at: http://www.jointcommission.org/assets/1/6/2015_NPSG_HAP.pdf. Accessed November 29, 2015.
- U.S. Department of Health and Human Services. Office of Disease Prevention and Health Promotion. Available at: http://health.gov/hcq/pdfs/ade-action-plan-508c.pdf. Accessed November 29, 2015.
- The Joint Commission. Surgical care improvement project. Available at: http://www.jointcommission.org/surgical_care_improvement_project. Accessed May 5, 2015.
- , , , et al. Optimization of inpatient warfarin therapy: Impact of daily consultation by a pharmacist‐managed anticoagulation service. Ann Pharmacother. 2000;34:567–572.
- , , . Effects of requiring a baseline International Normalized Ratio for inpatients treated with warfarin. Am J Health Syst Pharm. 2010;67:17–22.
- , . Weighting regressions by propensity scores. Eval Rev. 2008;32:392–409.
- . An introduction to propensity score methods for reducing the effects of confounding in observational studies. Multivar Behav Res. 2011;46:399–424.
- . Propensity score methods for bias reduction in the comparison of a treatment to a non‐randomized control group. Stat Med. 1998;17:2265–2281.
- , . The central role of the propensity score in observational studies for causal effects. Biometrika. 1983;70:41–55.
© 2015 Society of Hospital Medicine

Functional Knee Outcomes in Infrapatellar and Suprapatellar Tibial Nailing: Does Approach Matter?
With an incidence of 75,000 per year in the United States alone, fractures of the tibial shaft are among the most common long-bone fractures.1 Diaphyseal tibial fractures present a unique treatment challenge because of complications, including nonunion, malunion, and the potential for an open injury. Intramedullary fixation of these fractures has long been the standard of care, allowing for early mobilization, shorter time to weight-bearing, and high union rates.2-4
The classic infrapatellar approach to intramedullary nailing involves placing the knee in hyperflexion over a bump or radiolucent triangle and inserting the nail through a longitudinal incision in line with the fibers of the patellar tendon. Deforming muscle forces often cause proximal-third tibial fractures and segmental fractures to fall into valgus and procurvatum. To counter these deforming forces, orthopedic surgeons have used some novel surgical approaches, including use of blocking screws5 and a parapatellar approach that could be used with the knee in semi-extended position.6 Anterior knee pain has been reported as a common complication of tibial nailing (reported incidence, 56%).7 In a prospective randomized controlled study, Toivanen and colleagues8 found no difference in incidence of knee pain between patellar tendon splitting and parapatellar approaches.
Techniques have been developed to insert the nail through a semi-extended suprapatellar approach to facilitate intraoperative imaging, allow easier access to starting-site position, and counter deforming forces. Although outcomes of traditional infrapatellar nailing have been well documented, there is a paucity of literature on outcomes of using a suprapatellar approach. Splitting the quadriceps tendon causes scar tissue to form superior to the patella versus the anterior knee, which may reduce flexion-related pain or kneeling pain.9 The infrapatellar nerve is also well protected with this approach.
We conducted a study to determine differences in functional knee pain in patients who underwent either traditional infrapatellar nailing or suprapatellar nailing. We hypothesized that there would be no difference in functional knee scores between these approaches and that, when compared with the infrapatellar approach, the suprapatellar approach would result in improved postoperative reduction and reduced intraoperative fluoroscopy time.
Materials and Methods
This study was approved by our institutional review board. We searched our level I trauma center’s database for Current Procedural Terminology (CPT) code 27759 to identify all patients who had a tibial shaft fracture fixed with an intramedullary implant between January 2009 and February 2013. Radiographs, operative reports, and inpatient records were reviewed. Patients older than 18 years at time of injury and patients with an isolated tibial shaft fracture (Orthopaedic Trauma Association type 42 A-C) surgically fixed with an intramedullary nail through either a traditional infrapatellar approach or a suprapatellar approach were included in the study. Exclusion criteria were required fasciotomy, Gustilo type 3B or 3C open fracture, prior knee surgery, additional orthopedic injury, and preexisting radiographic evidence of degenerative joint disease.
In addition to surgical approach, demographic data, including body mass index (BMI), age, sex, and mechanism of injury, were documented from the medical record. Each patient was contacted by telephone by an investigator blinded to surgical exposure, and the 12-item Oxford Knee Score (OKS) questionnaire was administered (Figure). Operative time, quality of reduction on postoperative radiographs, and intraoperative fluoroscopy time were compared between the 2 approaches. We determined quality of reduction by measuring the angle between the line perpendicular to the tibial plateau and plafond on both the anteroposterior and lateral postoperative radiographs. Rotation was determined by measuring displacement of the fracture by cortical widths. The infrapatellar and suprapatellar groups were statistically analyzed with an unpaired, 2-tailed Student t test. Categorical variables between groups were analyzed with the χ2 test or, when expected values in a cell were less than 5, the Fisher exact test.
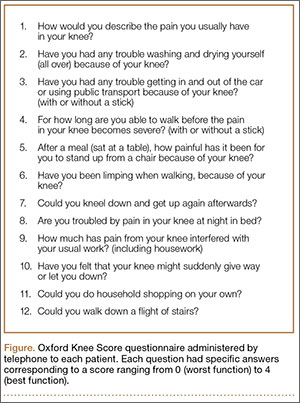
We then conducted an a priori power analysis to determine the appropriate sample size. To detect the reported minimally clinically important difference in the OKS of 5.2,10 estimating an approximate 20% larger patient population in the infrapatellar group, we would need to enroll 24 infrapatellar patients and 20 suprapatellar patients to achieve a power of 0.80 with a type I error rate of 0.05.11 This analysis is also based on an estimated OKS standard deviation of 6, which has been reported in several studies.12,13
Results
We identified 176 patients who had the CPT code for intramedullary fixation of a tibial shaft fracture between January 2009 and February 2013. After analysis of radiographs and medical records, 82 patients met the inclusion criteria. Thirty-six (45%) of the original 82 patients were lost to follow-up after attempts to contact them by telephone. One patient refused to participate in the study. Twenty-four patients underwent traditional infrapatellar nailing, and 21 patients had a suprapatellar nail placed with approach-specific instrumentation. Nine patients had an open fracture. There was no significant difference between the groups in terms of sex, age, BMI, mechanism of injury, or operative time (Table 1). There was also no difference (P = .210) in fracture location between groups (0 proximal-third, 14 midshaft, 10 distal-third vs 3 proximal-third, 10 midshaft, 8 distal-third). Mean age was 37.6 years (range, 20-65 years) for the infrapatellar group and 38.5 years (range, 18-68 years) for the suprapatellar group (P = .839). Mean follow-up was significantly (P < .001) shorter for the suprapatellar group (12 mo; range, 3-33 mo) than for the infrapatellar group (25 mo; range, 4-43 mo).
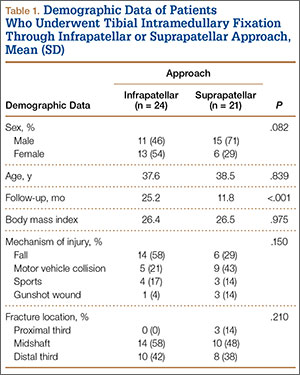
Mean OKS (maximum, 48 points) was 40.1 (range, 11-48) for the infrapatellar group and 36.7 (range, 2-48) for the suprapatellar group (P = .293). Table 2 summarizes the data. Radiographic reduction in the sagittal plane was improved (P = .044) in the suprapatellar group (2.90°) compared with the infrapatellar group (4.58°). There was no difference in rotational malreduction (0.31 vs 0.25 cortical width; P = .599) or in reduction in the coronal plane (2.52° vs 3.17°; P = .280). All patients in both groups maintained radiographic reduction within 5° in any plane throughout follow-up. There was no difference (P = .654) in radiographic follow-up between the infrapatellar group (11 mo) and the suprapatellar group (12 mo). The 1 nonunion in the suprapatellar group required return to the operating room for exchange intramedullary nailing. The suprapatellar approach required less (P = .003) operative fluoroscopy time (80.8 s; range, 46-180 s) than the standard infrapatellar approach (122.1 s; range, 71-240 s). Two patients in the suprapatellar group and 8 in the infrapatellar group did not have their fluoroscopy time recorded in the operative report.
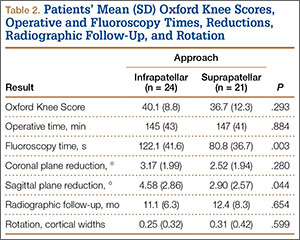
Discussion
We have described the first retrospective cohort-comparison study of functional knee scores associated with traditional infrapatellar nailing and suprapatellar nailing. Although much has been written about the incidence of anterior knee pain with use of a patellar splitting or parapatellar approach, the clinical effects of knee pain after use of suprapatellar nails are yet to be addressed. In a cadaveric study, Gelbke and colleagues14 found higher mean patellofemoral pressures and higher peak contact pressures with a suprapatellar approach. These numbers, however, were still far below the threshold for chondrocyte damage, and that study is yet to be clinically validated. Our data showed no difference in OKS between the 2 groups. Despite being intra-articular, approach-specific instrumentation may protect the trochlea and patellar cartilage.
Although the OKS questionnaire was originally developed and widely validated to describe clinical outcomes of total knee arthroplasty,15,16 it has also been evaluated for other interventions, including viscosupplementation injections17 and high tibial osteotomy.18 We used the OKS questionnaire in our study because it is simple to administer by telephone and is not as cumbersome as the Knee Society Score or the Western Ontario and McMaster Universities Osteoarthritis Index. It is also more specific to the knee than generalized outcome measures used in trauma, such as the Short Form 36 (SF-36). Sanders and colleagues19 reported excellent tibial alignment, radiographic union, and knee range of motion using semi-extended tibial nailing with a suprapatellar approach. For outcome measures, they used the Lysholm Knee Score and the SF-36. Our clinical and radiographic results confirmed their finding—that the semi-extended suprapatellar approach is an option for tibial nailing.
OKS results by question (Table 3) showed that the infrapatellar group had less pain walking down stairs. This result approached statistical significance (P = .063). As surgeons at our institution began using the suprapatellar approach only during the final 2 years of the study period, mean follow-up was significantly (P < .001) less than for the infrapatellar group (12 vs 25 mo). Although there was no statistically significant difference in reduction quality on anteroposterior radiographs, the suprapatellar approach had improved (P = .044) reduction on lateral radiographs (2.90° vs 4.58°).
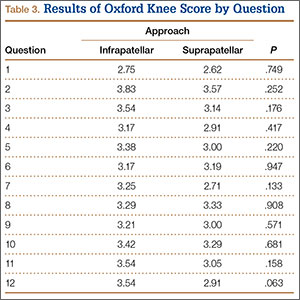
Although operative time did not differ between our 2 groups, significantly (P = .003) less fluoroscopy time was required for suprapatellar nails (80.8 s) than for infrapatellar nails (122.1 s). Positioning the knee in the semi-extended position offers easier access for fluoroscopy and less radiation exposure for the patient. Placing the nail in extension also helps eliminate the deforming forces that cause malreduction of proximal tibial shaft or segmental fractures. However, our study was limited in that only 2 surgeons at our institution used the suprapatellar approach, and both were fellowship-trained in orthopedic traumatology. This situation could have introduced bias into the interpretation of fluoroscopy data, as these surgeons may have been more comfortable with the procedure and less likely to use fluoroscopy. Both surgeons also performed infrapatellar nailing during the study period, and there was no statistical difference in fracture patterns between the groups, thus minimizing bias.
This study was retrospective but had several strengths. Sample size met the prestudy power analysis to determine a minimally clinically important difference in OKS results. The investigator who administered the telephone survey was blinded to surgical approach. This study was also the first clinical study to compare outcomes of infrapatellar and suprapatellar nailing. However, the study’s follow-up rate was a weakness. The patient population at our academic, urban, level I trauma center is transient. We lost 36 patients (45%) to follow-up; their telephone numbers in the hospital records likely changed since surgery, and we could not contact these patients.
Conclusion
Our retrospective cohort study found no difference in OKS between traditional infrapatellar nailing and suprapatellar nailing for diaphyseal tibia fractures. Suprapatellar nails require less fluoroscopy time and may show improved radiographic reduction in the sagittal plane. Although further study is needed, the suprapatellar entry portal appears to be a safe alternative for tibial nailing with use of appropriate instrumentation.
1. Praemer A, Furner S, Rice DP. Musculoskeletal Conditions in the United States. Park Ridge, IL: American Academy of Orthopaedic Surgeons; 1992.
2. Bone LB, Sucato D, Stegemann PM, Rohrbacher BJ. Displaced isolated fractures of the tibial shaft treated with either a cast or intramedullary nailing. An outcome analysis of matched pairs of patients. J Bone Joint Surg Am. 1997;79(9):1336-1341.
3. Hooper GJ, Keddell RG, Penny ID. Conservative management or closed nailing for tibial shaft fractures. A randomised prospective trial. J Bone Joint Surg Br. 1991;73(1):83-85.
4. Alho A, Benterud JG, Høgevold HE, Ekeland A, Strømsøe K. Comparison of functional bracing and locked intramedullary nailing in the treatment of displaced tibial shaft fractures. Clin Orthop Relat Res. 1992;(277):243-250.
5. Ricci WM, O’Boyle M, Borrelli J, Bellabarba C, Sanders R. Fractures of the proximal third of the tibial shaft treated with intramedullary nails and blocking screws. J Orthop Trauma. 2001;15(4):264-270.
6. Tornetta P 3rd, Collins E. Semiextended position of intramedullary nailing of the proximal tibia. Clin Orthop Relat Res. 1996;(328):185-189.
7. Court-Brown CM, Gustilo T, Shaw AD. Knee pain after intramedullary tibial nailing: its incidence, etiology, and outcome. J Orthop Trauma. 1997;11(2):103-105.
8. Toivanen JA, Väistö O, Kannus P, Latvala K, Honkonen SE, Järvinen MJ. Anterior knee pain after intramedullary nailing of fractures of the tibial shaft. A prospective, randomized study comparing two different nail-insertion techniques. J Bone Joint Surg Am. 2002;84(4):580-585.
9. Morandi M, Banka T, Gairarsa GP, et al. Intramedullary nailing of tibial fractures: review of surgical techniques and description of a percutaneous lateral suprapatellar approach. Orthopaedics. 2010;33(3):172-179.
10. Bohm ER, Loucks L, Tan QE, et al. Determining minimum clinically important difference and targeted clinical improvement values for the Oxford 12. Presented at: Annual Meeting of the American Academy of Orthopaedic Surgeons; 2012; San Francisco, CA.
11. Dupont WD, Plummer WD Jr. Power and sample size calculations. A review and computer program. Control Clin Trials. 1990;11(2):116-128.
12. Streit MR, Walker T, Bruckner T, et al. Mobile-bearing lateral unicompartmental knee replacement with the Oxford domed tibial component: an independent series. J Bone Joint Surg Br. 2012;94(10):1356-1361.
13. Jenny JY, Diesinger Y. The Oxford Knee Score: compared performance before and after knee replacement. Orthop Traumatol Surg Res. 2012;98(4):409-412.
14. Gelbke MK, Coombs D, Powell S, et al. Suprapatellar versus infra-patellar intramedullary nail insertion of the tibia: a cadaveric model for comparison of patellofemoral contact pressures and forces. J Orthop Trauma. 2010;24(11):665-671.
15. Dawson J, Fitzpatrick R, Murray D, Carr A. Questionnaire on the perceptions of patients about total knee replacement. J Bone Joint Surg Br. 1998;80(1):63-69.
16. Dunbar MJ, Robertsson O, Ryd L, Lidgren L. Translation and validation of the Oxford-12 item knee score for use in Sweden. Acta Orthop Scand. 2000;71(3):268-274.
17. Clarke S, Lock V, Duddy J, Sharif M, Newman JH, Kirwan JR. Intra-articular hylan G-F 20 (Synvisc) in the management of patellofemoral osteoarthritis of the knee (POAK). Knee. 2005;12(1):57-62.
18. Weale AE, Lee AS, MacEachern AG. High tibial osteotomy using a dynamic axial external fixator. Clin Orthop Relat Res. 2001;(382):154-167.
19. Sanders RW, DiPasquale TG, Jordan CJ, Arrington JA, Sagi HC. Semiextended intramedullary nailing of the tibia using a suprapatellar approach: radiographic results and clinical outcomes at a minimum of 12 months follow-up. J Orthop Trauma. 2014;28(suppl 8):S29-S39.
With an incidence of 75,000 per year in the United States alone, fractures of the tibial shaft are among the most common long-bone fractures.1 Diaphyseal tibial fractures present a unique treatment challenge because of complications, including nonunion, malunion, and the potential for an open injury. Intramedullary fixation of these fractures has long been the standard of care, allowing for early mobilization, shorter time to weight-bearing, and high union rates.2-4
The classic infrapatellar approach to intramedullary nailing involves placing the knee in hyperflexion over a bump or radiolucent triangle and inserting the nail through a longitudinal incision in line with the fibers of the patellar tendon. Deforming muscle forces often cause proximal-third tibial fractures and segmental fractures to fall into valgus and procurvatum. To counter these deforming forces, orthopedic surgeons have used some novel surgical approaches, including use of blocking screws5 and a parapatellar approach that could be used with the knee in semi-extended position.6 Anterior knee pain has been reported as a common complication of tibial nailing (reported incidence, 56%).7 In a prospective randomized controlled study, Toivanen and colleagues8 found no difference in incidence of knee pain between patellar tendon splitting and parapatellar approaches.
Techniques have been developed to insert the nail through a semi-extended suprapatellar approach to facilitate intraoperative imaging, allow easier access to starting-site position, and counter deforming forces. Although outcomes of traditional infrapatellar nailing have been well documented, there is a paucity of literature on outcomes of using a suprapatellar approach. Splitting the quadriceps tendon causes scar tissue to form superior to the patella versus the anterior knee, which may reduce flexion-related pain or kneeling pain.9 The infrapatellar nerve is also well protected with this approach.
We conducted a study to determine differences in functional knee pain in patients who underwent either traditional infrapatellar nailing or suprapatellar nailing. We hypothesized that there would be no difference in functional knee scores between these approaches and that, when compared with the infrapatellar approach, the suprapatellar approach would result in improved postoperative reduction and reduced intraoperative fluoroscopy time.
Materials and Methods
This study was approved by our institutional review board. We searched our level I trauma center’s database for Current Procedural Terminology (CPT) code 27759 to identify all patients who had a tibial shaft fracture fixed with an intramedullary implant between January 2009 and February 2013. Radiographs, operative reports, and inpatient records were reviewed. Patients older than 18 years at time of injury and patients with an isolated tibial shaft fracture (Orthopaedic Trauma Association type 42 A-C) surgically fixed with an intramedullary nail through either a traditional infrapatellar approach or a suprapatellar approach were included in the study. Exclusion criteria were required fasciotomy, Gustilo type 3B or 3C open fracture, prior knee surgery, additional orthopedic injury, and preexisting radiographic evidence of degenerative joint disease.
In addition to surgical approach, demographic data, including body mass index (BMI), age, sex, and mechanism of injury, were documented from the medical record. Each patient was contacted by telephone by an investigator blinded to surgical exposure, and the 12-item Oxford Knee Score (OKS) questionnaire was administered (Figure). Operative time, quality of reduction on postoperative radiographs, and intraoperative fluoroscopy time were compared between the 2 approaches. We determined quality of reduction by measuring the angle between the line perpendicular to the tibial plateau and plafond on both the anteroposterior and lateral postoperative radiographs. Rotation was determined by measuring displacement of the fracture by cortical widths. The infrapatellar and suprapatellar groups were statistically analyzed with an unpaired, 2-tailed Student t test. Categorical variables between groups were analyzed with the χ2 test or, when expected values in a cell were less than 5, the Fisher exact test.
We then conducted an a priori power analysis to determine the appropriate sample size. To detect the reported minimally clinically important difference in the OKS of 5.2,10 estimating an approximate 20% larger patient population in the infrapatellar group, we would need to enroll 24 infrapatellar patients and 20 suprapatellar patients to achieve a power of 0.80 with a type I error rate of 0.05.11 This analysis is also based on an estimated OKS standard deviation of 6, which has been reported in several studies.12,13
Results
We identified 176 patients who had the CPT code for intramedullary fixation of a tibial shaft fracture between January 2009 and February 2013. After analysis of radiographs and medical records, 82 patients met the inclusion criteria. Thirty-six (45%) of the original 82 patients were lost to follow-up after attempts to contact them by telephone. One patient refused to participate in the study. Twenty-four patients underwent traditional infrapatellar nailing, and 21 patients had a suprapatellar nail placed with approach-specific instrumentation. Nine patients had an open fracture. There was no significant difference between the groups in terms of sex, age, BMI, mechanism of injury, or operative time (Table 1). There was also no difference (P = .210) in fracture location between groups (0 proximal-third, 14 midshaft, 10 distal-third vs 3 proximal-third, 10 midshaft, 8 distal-third). Mean age was 37.6 years (range, 20-65 years) for the infrapatellar group and 38.5 years (range, 18-68 years) for the suprapatellar group (P = .839). Mean follow-up was significantly (P < .001) shorter for the suprapatellar group (12 mo; range, 3-33 mo) than for the infrapatellar group (25 mo; range, 4-43 mo).
Mean OKS (maximum, 48 points) was 40.1 (range, 11-48) for the infrapatellar group and 36.7 (range, 2-48) for the suprapatellar group (P = .293). Table 2 summarizes the data. Radiographic reduction in the sagittal plane was improved (P = .044) in the suprapatellar group (2.90°) compared with the infrapatellar group (4.58°). There was no difference in rotational malreduction (0.31 vs 0.25 cortical width; P = .599) or in reduction in the coronal plane (2.52° vs 3.17°; P = .280). All patients in both groups maintained radiographic reduction within 5° in any plane throughout follow-up. There was no difference (P = .654) in radiographic follow-up between the infrapatellar group (11 mo) and the suprapatellar group (12 mo). The 1 nonunion in the suprapatellar group required return to the operating room for exchange intramedullary nailing. The suprapatellar approach required less (P = .003) operative fluoroscopy time (80.8 s; range, 46-180 s) than the standard infrapatellar approach (122.1 s; range, 71-240 s). Two patients in the suprapatellar group and 8 in the infrapatellar group did not have their fluoroscopy time recorded in the operative report.
Discussion
We have described the first retrospective cohort-comparison study of functional knee scores associated with traditional infrapatellar nailing and suprapatellar nailing. Although much has been written about the incidence of anterior knee pain with use of a patellar splitting or parapatellar approach, the clinical effects of knee pain after use of suprapatellar nails are yet to be addressed. In a cadaveric study, Gelbke and colleagues14 found higher mean patellofemoral pressures and higher peak contact pressures with a suprapatellar approach. These numbers, however, were still far below the threshold for chondrocyte damage, and that study is yet to be clinically validated. Our data showed no difference in OKS between the 2 groups. Despite being intra-articular, approach-specific instrumentation may protect the trochlea and patellar cartilage.
Although the OKS questionnaire was originally developed and widely validated to describe clinical outcomes of total knee arthroplasty,15,16 it has also been evaluated for other interventions, including viscosupplementation injections17 and high tibial osteotomy.18 We used the OKS questionnaire in our study because it is simple to administer by telephone and is not as cumbersome as the Knee Society Score or the Western Ontario and McMaster Universities Osteoarthritis Index. It is also more specific to the knee than generalized outcome measures used in trauma, such as the Short Form 36 (SF-36). Sanders and colleagues19 reported excellent tibial alignment, radiographic union, and knee range of motion using semi-extended tibial nailing with a suprapatellar approach. For outcome measures, they used the Lysholm Knee Score and the SF-36. Our clinical and radiographic results confirmed their finding—that the semi-extended suprapatellar approach is an option for tibial nailing.
OKS results by question (Table 3) showed that the infrapatellar group had less pain walking down stairs. This result approached statistical significance (P = .063). As surgeons at our institution began using the suprapatellar approach only during the final 2 years of the study period, mean follow-up was significantly (P < .001) less than for the infrapatellar group (12 vs 25 mo). Although there was no statistically significant difference in reduction quality on anteroposterior radiographs, the suprapatellar approach had improved (P = .044) reduction on lateral radiographs (2.90° vs 4.58°).
Although operative time did not differ between our 2 groups, significantly (P = .003) less fluoroscopy time was required for suprapatellar nails (80.8 s) than for infrapatellar nails (122.1 s). Positioning the knee in the semi-extended position offers easier access for fluoroscopy and less radiation exposure for the patient. Placing the nail in extension also helps eliminate the deforming forces that cause malreduction of proximal tibial shaft or segmental fractures. However, our study was limited in that only 2 surgeons at our institution used the suprapatellar approach, and both were fellowship-trained in orthopedic traumatology. This situation could have introduced bias into the interpretation of fluoroscopy data, as these surgeons may have been more comfortable with the procedure and less likely to use fluoroscopy. Both surgeons also performed infrapatellar nailing during the study period, and there was no statistical difference in fracture patterns between the groups, thus minimizing bias.
This study was retrospective but had several strengths. Sample size met the prestudy power analysis to determine a minimally clinically important difference in OKS results. The investigator who administered the telephone survey was blinded to surgical approach. This study was also the first clinical study to compare outcomes of infrapatellar and suprapatellar nailing. However, the study’s follow-up rate was a weakness. The patient population at our academic, urban, level I trauma center is transient. We lost 36 patients (45%) to follow-up; their telephone numbers in the hospital records likely changed since surgery, and we could not contact these patients.
Conclusion
Our retrospective cohort study found no difference in OKS between traditional infrapatellar nailing and suprapatellar nailing for diaphyseal tibia fractures. Suprapatellar nails require less fluoroscopy time and may show improved radiographic reduction in the sagittal plane. Although further study is needed, the suprapatellar entry portal appears to be a safe alternative for tibial nailing with use of appropriate instrumentation.
1. Praemer A, Furner S, Rice DP. Musculoskeletal Conditions in the United States. Park Ridge, IL: American Academy of Orthopaedic Surgeons; 1992.
2. Bone LB, Sucato D, Stegemann PM, Rohrbacher BJ. Displaced isolated fractures of the tibial shaft treated with either a cast or intramedullary nailing. An outcome analysis of matched pairs of patients. J Bone Joint Surg Am. 1997;79(9):1336-1341.
3. Hooper GJ, Keddell RG, Penny ID. Conservative management or closed nailing for tibial shaft fractures. A randomised prospective trial. J Bone Joint Surg Br. 1991;73(1):83-85.
4. Alho A, Benterud JG, Høgevold HE, Ekeland A, Strømsøe K. Comparison of functional bracing and locked intramedullary nailing in the treatment of displaced tibial shaft fractures. Clin Orthop Relat Res. 1992;(277):243-250.
5. Ricci WM, O’Boyle M, Borrelli J, Bellabarba C, Sanders R. Fractures of the proximal third of the tibial shaft treated with intramedullary nails and blocking screws. J Orthop Trauma. 2001;15(4):264-270.
6. Tornetta P 3rd, Collins E. Semiextended position of intramedullary nailing of the proximal tibia. Clin Orthop Relat Res. 1996;(328):185-189.
7. Court-Brown CM, Gustilo T, Shaw AD. Knee pain after intramedullary tibial nailing: its incidence, etiology, and outcome. J Orthop Trauma. 1997;11(2):103-105.
8. Toivanen JA, Väistö O, Kannus P, Latvala K, Honkonen SE, Järvinen MJ. Anterior knee pain after intramedullary nailing of fractures of the tibial shaft. A prospective, randomized study comparing two different nail-insertion techniques. J Bone Joint Surg Am. 2002;84(4):580-585.
9. Morandi M, Banka T, Gairarsa GP, et al. Intramedullary nailing of tibial fractures: review of surgical techniques and description of a percutaneous lateral suprapatellar approach. Orthopaedics. 2010;33(3):172-179.
10. Bohm ER, Loucks L, Tan QE, et al. Determining minimum clinically important difference and targeted clinical improvement values for the Oxford 12. Presented at: Annual Meeting of the American Academy of Orthopaedic Surgeons; 2012; San Francisco, CA.
11. Dupont WD, Plummer WD Jr. Power and sample size calculations. A review and computer program. Control Clin Trials. 1990;11(2):116-128.
12. Streit MR, Walker T, Bruckner T, et al. Mobile-bearing lateral unicompartmental knee replacement with the Oxford domed tibial component: an independent series. J Bone Joint Surg Br. 2012;94(10):1356-1361.
13. Jenny JY, Diesinger Y. The Oxford Knee Score: compared performance before and after knee replacement. Orthop Traumatol Surg Res. 2012;98(4):409-412.
14. Gelbke MK, Coombs D, Powell S, et al. Suprapatellar versus infra-patellar intramedullary nail insertion of the tibia: a cadaveric model for comparison of patellofemoral contact pressures and forces. J Orthop Trauma. 2010;24(11):665-671.
15. Dawson J, Fitzpatrick R, Murray D, Carr A. Questionnaire on the perceptions of patients about total knee replacement. J Bone Joint Surg Br. 1998;80(1):63-69.
16. Dunbar MJ, Robertsson O, Ryd L, Lidgren L. Translation and validation of the Oxford-12 item knee score for use in Sweden. Acta Orthop Scand. 2000;71(3):268-274.
17. Clarke S, Lock V, Duddy J, Sharif M, Newman JH, Kirwan JR. Intra-articular hylan G-F 20 (Synvisc) in the management of patellofemoral osteoarthritis of the knee (POAK). Knee. 2005;12(1):57-62.
18. Weale AE, Lee AS, MacEachern AG. High tibial osteotomy using a dynamic axial external fixator. Clin Orthop Relat Res. 2001;(382):154-167.
19. Sanders RW, DiPasquale TG, Jordan CJ, Arrington JA, Sagi HC. Semiextended intramedullary nailing of the tibia using a suprapatellar approach: radiographic results and clinical outcomes at a minimum of 12 months follow-up. J Orthop Trauma. 2014;28(suppl 8):S29-S39.
US National Practice Patterns in Ambulatory Operative Management of Lateral Epicondylitis
First described by Runge1 in 1873 and later termed lawn-tennis arm by Major2 in 1883, lateral epicondylitis is a common cause of elbow pain, affecting 1% to 3% of the general population each year.3,4 Given that prevalence estimates are up to 15% among workers in repetitive hand task industries,5-7 symptoms of lateral epicondylitis are thought to be related to recurring wrist extension and alternating forearm pronation and supination.8 Between 80% and 90% of patients with lateral epicondylitis experience symptomatic improvement with conservative therapy,9-11 including rest and use of nonsteroidal anti-inflammatory medications,12 physical therapy,13,14 corticosteroid injections,10,15,16 orthoses,17,18 and shock wave therapy.19 However, between 4% and 11% of patients with newly diagnosed lateral epicondylitis do not respond to prolonged (6- to 12-month) conservative treatment and then require operative intervention,11,20,21 with some referral practices reporting rates as high as 25%.22
Traditionally, operative management of lateral epicondylitis involved open débridement of the extensor carpi radialis brevis (ECRB).11,20 More recently, the spectrum of operations for lateral epicondylitis has expanded to include procedures that repair the extensor origin after débridement of the torn tendon and angiofibroblastic dysplasia; procedures that use fasciotomy or direct release of the extensor origin from the epicondyle to relieve tension on the common extensor; procedures directed at the radial or posterior interosseous nerve; and procedures that use arthroscopic techniques to divide the orbicular ligament, reshape the radial head, or release the extensor origin.23 There has been debate about the value of repairing the ECRB, lengthening the ECRB, simultaneously decompressing the radial nerve or resecting epicondylar bone, and performing the procedures percutaneously, endoscopically, or arthroscopically.24-28 Despite multiple studies of the outcomes of these procedures,11,29-31 little is known regarding US national trends for operative treatment of lateral epicondylitis. Understanding national practice patterns and disease burden is essential to allocation of limited health care resources.
We conducted a study to determine US national trends in use of ambulatory surgery for lateral epicondylitis. We focused on age, sex, surgical setting, anesthetic type, and payment method.
Methods
As the National Survey of Ambulatory Surgery32 (NSAS) is an administrative dataset in which all data are deidentified and available for public use, this study was exempt from requiring institutional review board approval.
NSAS data were used to analyze trends in treatment of lateral epicondylitis between 1994 and 2006. NSAS was undertaken by the National Center for Health Statistics (NCHS) of the Centers for Disease Control and Prevention (CDC) to obtain information about the use of ambulatory surgery in the United States. Since the early 1980s, ambulatory surgery has increased in the United States because of advances in medical technology and cost-containment initiatives.33 The number of procedures being performed in ambulatory surgery centers increased from 31.5 million in 1996 to 53.3 million in 2006.34 Funded by the CDC, NSAS is a national study that involves both hospital-based and freestanding ambulatory surgery centers and provides the most recent and comprehensive overview of ambulatory surgery in the United States.35 Because of budgetary limitations, 2006 was the last year in which data for NSAS were collected. Data for NSAS come from Medicare-participating, noninstitutional hospitals (excluding military hospitals, federal facilities, and Veteran Affairs hospitals) in all 50 states and the District of Columbia with a minimum of 6 beds staffed for patient use. NSAS used only short-stay hospitals (hospitals with an average length of stay for all patients of less than 30 days) or hospitals that had a specialty of general (medical or surgical) or children’s general. NSAS was conducted in 1994, 1996, and 2006 with medical information recorded on patient abstracts coded by contract staff. NSAS selected a sample of ambulatory surgery visits using a systematic random sampling procedure, and selection of visits within each facility was done separately for each location where ambulatory surgery was performed. In 1994, 751 facilities were sampled, and 88% of hospitals responded. In 1996, 750 facilities were sampled, and 91% of hospitals responded. In 2006, 696 facilities were sampled, and 75% responded. The surveys used International Classification of Diseases, 9th Revision, Clinical Modification (ICD-9-CM) codes36 to classify medical diagnoses and procedures. To produce an unbiased national estimate, NCHS used multistage estimate procedures, including inflation by reciprocals of the probabilities of sample selection, population-weighting ratio adjustments, and adjustment for no response.37
Demographic and medical information was obtained for people with an ICD-9-CM diagnosis code of lateral epicondylitis (726.32), using previously described techniques.38 Data were then recorded for age, sex, facility type, insurance type, anesthesia type, diagnoses, and procedures.
Descriptive statistics consisted of means and standard deviations for continuous variables and frequency and percentages for discrete variables. Because NSAS data were collected on the basis of a probabilistic sample scheme, they were analyzed using a sampling weighting method. Sampling weights (inverse of selection probability) provided by the CDC were used to account for unequal sampling probabilities and to produce estimates for all visits in the United States. A Taylor linearization model provided by the CDC estimates was used to calculate standard error and confidence intervals (CIs) of the data. Standard error is a measure of sampling variability that occurs by chance because only a sample rather than the entire universe is surveyed. To define population parameters, NCHS chose 95% CIs along with a point estimate. Direct statistical comparison between years cannot be performed because of sampling differences in the database compared between years. The CIs, however, can suggest statistical differences if the data are nonoverlapping. US census data were used to obtain national population estimates for each year of the study (1994, 1996, 2006).39 Rates were presented as number of procedures per 100,000 standard population. For age, a direct adjustment procedure was used, and the US population in 2000 was selected as the standard population. Applying sex-specific rates to the standard population and dividing by the total in the standard population, we calculated sex-adjusted rates for each year. All data were analyzed using SPSS Version 20 software.
Results
A total of 30,311 ambulatory surgical procedures (95% CI, 27,292-33,330) or 10.44 per 100,000 capita were recorded by NSAS for the treatment of lateral epicondylitis in 2006 (Table 1). This represents a large increase in the total number of ambulatory procedures, from 21,852 in 1994 (95% CI, 19,981-23,722; 7.29/100,000) and 20,372 in 1996 (95% CI, 18,660-22,083; 6.73/100,000).
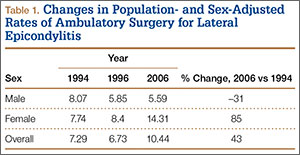
Between 1994 and 2006, the sex-adjusted rate of ambulatory surgery for lateral epicondylitis increased by 85% among females (7.74/100,000 to 14.31/100,000), whereas the rate decreased by 31% among males (8.07/100,000 to 5.59/100,000) (Table 1). The age-adjusted rate of ambulatory surgery for lateral epicondylitis increased among all age groups except the 30–39 years group (Table 2). The largest increase in age-adjusted rates was found for patients older than 50 years (275%) between 1994 and 2006.
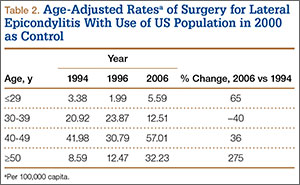
During the study period, use of regional anesthesia nearly doubled, from 17% to 30%, whereas use of general anesthesia decreased, from 69% to 57% (Table 3). At all time points, the most common procedure performed for lateral epicondylitis in ambulatory surgery centers was division/release of the joint capsule of the elbow (Table 4). Private insurance remained the most common source of payment for all study years, ranging from 52% to 60% (Table 5). The Figure shows that, between 1994 and 2006, the proportion of surgeries performed in a freestanding ambulatory center increased.
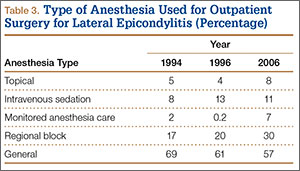
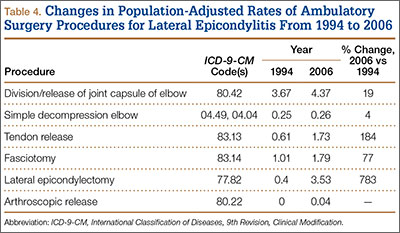
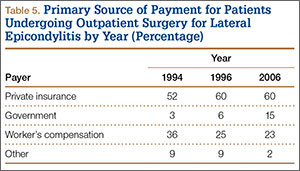
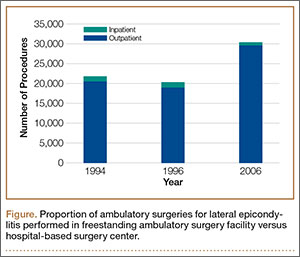
Discussion
In this descriptive epidemiologic study, we used NSAS data to investigate trends in ambulatory surgery for lateral epicondylitis between 1994 and 2006.32 Our results showed that total number of procedures and the population-adjusted rate of procedures for lateral epicondylitis increased during the study period. The largest increase in age-adjusted rates of surgery for lateral epicondylitis was found among patients older than 50 years, whereas the highest age-adjusted rate of ambulatory surgery for lateral epicondylitis was found among patients between ages 40 and 49 years. These findings are similar to those of previous studies, which have shown that most patients with lateral epicondylitis present in the fourth and fifth decades of life.22 Prior reports have suggested that the incidence of lateral epicondylitis in men and women is equal.22 The present study found a change in sex-adjusted rates of ambulatory surgery for lateral epicondylitis between 1994 and 2006. Specifically, in 1994, surgery rates for men and women were similar (8.07/100,000 and 7.74/100,000), but in 2006 the sex-adjusted rate of surgery for lateral epicondylitis was almost 3 times higher for women than for men (14.31/100,000 vs 5.59/100,000).
We also found that the population-adjusted rate of lateral epicondylectomy increased drastically, from 0.4 per 100,000 in 1994 to 3.53 per 100,000 in 2006. Lateral epicondylectomy involves excision of the tip of the lateral epicondyle (typically, 0.5 cm) to produce a cancellous bone surface to which the edges of the débrided extensor tendon can be approximated without tension.23 It is possible that the increased rate of lateral epicondylectomy reflects evidence-based practice changes during the study period,27 though denervation was found more favorable than epicondylectomy in a recent study by Berry and colleagues.40 Future studies should investigate whether rates of epicondylectomy have changed since 2006. In addition, the present study showed a correlation between the introduction of arthroscopic techniques for the treatment of lateral epicondylitis and the period when much research was being conducted on the topic.24,25,28 As arthroscopic techniques improve, their rates are likely to continue to increase.
Our results also showed an increase in procedures performed in freestanding facilities. The rise in ambulatory surgical volume, speculated to result from more procedures being performed in freestanding facilities,34 has been reported with knee and shoulder arthroscopy.41 In addition, though general anesthesia remained the most used technique, our results showed a shift toward peripheral nerve blocks. The increase in regional anesthesia, which has also been noted in joint arthroscopy, is thought to stem from the advent of nerve-localizing technology, such as nerve stimulation and ultrasound guidance.41 Peripheral nerve blocks are favorable on both economic and quality measures, are associated with fewer opioid-related side effects, and overall provide better analgesia in comparison with opioids, highlighting their importance in the ambulatory setting.42
Although large, national databases are well suited to epidemiologic research,43 our study had limitations. As with all databases, NSAS is subject to data entry errors and coding errors.44,45 However, the database administrators corrected for this by using a multistage estimate procedure with weighting adjustments for no response and population-weighting ratio adjustments.35 Another limitation of this study is its lack of clinical detail, as procedure codes are general and do not allow differentiation between specific patients. Because of the retrospective nature of the analysis and the heterogeneity of the data, assessment of specific surgeries for lateral epicondylitis was limited. Although a strength of using NSAS to perform epidemiologic analyses is its large sample size, this also sacrifices specificity in terms of clinical insight. The results of this study may influence investigations to distinguish differences between procedures used in the treatment of lateral epicondylitis. Furthermore, the results of this study are limited to ambulatory surgery practice patterns in the United States between 1996 and 2006. Last, our ability to perform economic analyses was limited, as data on total hospital cost were not recorded by the surveys.
Conclusion
The increase in ambulatory surgery for lateral epicondylitis, demonstrated in this study, emphasizes the importance of national funding for surveys such as NSAS beyond 2006, as utilization trends may have considerable effects on health care policies that influence the quality of patient care.
1. Runge F. Zur genese und behandlung des schreibekramfes. Berl Klin Wochenschr. 1873;10:245.
2. Major HP. Lawn-tennis elbow. Br Med J. 1883;2:557.
3. Allander E. Prevalence, incidence, and remission rates of some common rheumatic diseases or syndromes. Scand J Rheumatol. 1974;3(3):145-153.
4. Verhaar JA. Tennis elbow. Anatomical, epidemiological and therapeutic aspects. Int Orthop. 1994;18(5):263-267.
5. Kurppa K, Viikari-Juntura E, Kuosma E, Huuskonen M, Kivi P. Incidence of tenosynovitis or peritendinitis and epicondylitis in a meat-processing factory. Scand J Work Environ Health. 1991;17(1):32-37.
6. Ranney D, Wells R, Moore A. Upper limb musculoskeletal disorders in highly repetitive industries: precise anatomical physical findings. Ergonomics. 1995;38(7):1408-1423.
7. Haahr JP, Andersen JH. Physical and psychosocial risk factors for lateral epicondylitis: a population based case-referent study. Occup Environ Med. 2003;60(5):322-329.
8. Goldie I. Epicondylitis lateralis humeri (epicondylalgia or tennis elbow). A pathogenetical study. Acta Chir Scand Suppl. 1964;57(suppl 399):1+.
9. Binder AI, Hazleman BL. Lateral humeral epicondylitis—a study of natural history and the effect of conservative therapy. Br J Rheumatol. 1983;22(2):73-76.
10. Smidt N, van der Windt DA, Assendelft WJ, Devillé WL, Korthals-de Bos IB, Bouter LM. Corticosteroid injections, physiotherapy, or a wait-and-see policy for lateral epicondylitis: a randomised controlled trial. Lancet. 2002;359(9307):657-662.
11. Nirschl RP, Pettrone FA. Tennis elbow. The surgical treatment of lateral epicondylitis. J Bone Joint Surg Am. 1979;61(6):832-839.
12. Burnham R, Gregg R, Healy P, Steadward R. The effectiveness of topical diclofenac for lateral epicondylitis. Clin J Sport Med. 1998;8(2):78-81.
13. Martinez-Silvestrini JA, Newcomer KL, Gay RE, Schaefer MP, Kortebein P, Arendt KW. Chronic lateral epicondylitis: comparative effectiveness of a home exercise program including stretching alone versus stretching supplemented with eccentric or concentric strengthening. J Hand Ther. 2005;18(4):411-419.
14. Svernlöv B, Adolfsson L. Non-operative treatment regime including eccentric training for lateral humeral epicondylalgia. Scand J Med Sci Sports. 2001;11(6):328-334.
15. Hay EM, Paterson SM, Lewis M, Hosie G, Croft P. Pragmatic randomised controlled trial of local corticosteroid injection and naproxen for treatment of lateral epicondylitis of elbow in primary care. BMJ. 1999;319(7215):964-968.
16. Lewis M, Hay EM, Paterson SM, Croft P. Local steroid injections for tennis elbow: does the pain get worse before it gets better? Results from a randomized controlled trial. Clin J Pain. 2005;21(4):330-334.
17. Van De Streek MD, Van Der Schans CP, De Greef MH, Postema K. The effect of a forearm/hand splint compared with an elbow band as a treatment for lateral epicondylitis. Prosthet Orthot Int. 2004;28(2):183-189.
18. Struijs PA, Smidt N, Arola H, Dijk vC, Buchbinder R, Assendelft WJ. Orthotic devices for the treatment of tennis elbow. Cochrane Database Syst Rev. 2002;(1):CD001821.
19. Buchbinder R, Green SE, Youd JM, Assendelft WJ, Barnsley L, Smidt N. Shock wave therapy for lateral elbow pain. Cochrane Database Syst Rev. 2005;(4):CD003524.
20. Boyd HB, McLeod AC Jr. Tennis elbow. J Bone Joint Surg Am. 1973;55(6):1183-1187.
21. Coonrad RW, Hooper WR. Tennis elbow: its course, natural history, conservative and surgical management. J Bone Joint Surg Am. 1973;55(6):1177-1182.
22. Calfee RP, Patel A, DaSilva MF, Akelman E. Management of lateral epicondylitis: current concepts. J Am Acad Orthop Surg. 2008;16(1):19-29.
23. Plancher KD, Bishai SK. Open lateral epicondylectomy: a simple technique update for the 21st century. Tech Orthop. 2006;21(4):276-282.
24. Peart RE, Strickler SS, Schweitzer KM Jr. Lateral epicondylitis: a comparative study of open and arthroscopic lateral release. Am J Orthop. 2004;33(11):565-567.
25. Dunkow PD, Jatti M, Muddu BN. A comparison of open and percutaneous techniques in the surgical treatment of tennis elbow. J Bone Joint Surg Br. 2004;86(5):701-704.
26. Rosenberg N, Henderson I. Surgical treatment of resistant lateral epicondylitis. Follow-up study of 19 patients after excision, release and repair of proximal common extensor tendon origin. Arch Orthop Trauma Surg. 2002;122(9-10):514-517.
27. Almquist EE, Necking L, Bach AW. Epicondylar resection with anconeus muscle transfer for chronic lateral epicondylitis. J Hand Surg Am. 1998;23(4):723-731.
28. Smith AM, Castle JA, Ruch DS. Arthroscopic resection of the common extensor origin: anatomic considerations. J Shoulder Elbow Surg. 2003;12(4):375-379.
29. Baker CL Jr, Murphy KP, Gottlob CA, Curd DT. Arthroscopic classification and treatment of lateral epicondylitis: two-year clinical results. J Shoulder Elbow Surg. 2000;9(6):475-482.
30. Owens BD, Murphy KP, Kuklo TR. Arthroscopic release for lateral epicondylitis. Arthroscopy. 2001;17(6):582-587.
31. Mullett H, Sprague M, Brown G, Hausman M. Arthroscopic treatment of lateral epicondylitis: clinical and cadaveric studies. Clin Orthop Relat Res. 2005;(439):123-128.
32. National Survey of Ambulatory Surgery. Centers for Disease Control and Prevention website. http://www.cdc.gov/nchs/nsas/nsas_questionnaires.htm. Published May 4, 2010. Accessed November 10, 2015.
33. Leader S, Moon M. Medicare trends in ambulatory surgery. Health Aff. 1989;8(1):158-170.
34. Cullen KA, Hall MJ, Golosinskiy A. Ambulatory surgery in the United States, 2006. Natl Health Stat Rep. 2009;(11):1-25.
35. Kim S, Bosque J, Meehan JP, Jamali A, Marder R. Increase in outpatient knee arthroscopy in the United States: a comparison of National Surveys of Ambulatory Surgery, 1996 and 2006. J Bone Joint Surg Am. 2011;93(11):994-1000.
36. Centers for Disease Control and Prevention, National Center for Health Statistics. International Classification of Diseases, Ninth Revision, Clinical Modification (ICD-9-CM). http://www.cdc.gov/nchs/icd/icd9cm.htm. Updated June 18, 2013. Accessed October 28, 2015.
37. Dennison C, Pokras R. Design and operation of the National Hospital Discharge Survey: 1988 redesign. Vital Health Stat 1. 2000;(39):1-42.
38. Stundner O, Kirksey M, Chiu YL, et al. Demographics and perioperative outcome in patients with depression and anxiety undergoing total joint arthroplasty: a population-based study. Psychosomatics. 2013;54(2):149-157.
39. Population estimates. US Department of Commerce, United States Census Bureau website. http://www.census.gov/popest/index.html. Accessed November 16, 2015.
40. Berry N, Neumeister MW, Russell RC, Dellon AL. Epicondylectomy versus denervation for lateral humeral epicondylitis. Hand. 2011;6(2):174-178.
41. Memtsoudis SG, Kuo C, Ma Y, Edwards A, Mazumdar M, Liguori G. Changes in anesthesia-related factors in ambulatory knee and shoulder surgery: United States 1996–2006. Reg Anesth Pain Med. 2011;36(4):327-331.
42. Richman JM, Liu SS, Courpas G, et al. Does continuous peripheral nerve block provide superior pain control to opioids? A meta-analysis. Anesth Analg. 2006;102(1):248-257.
43. Bohl DD, Basques BA, Golinvaux NS, Baumgaertner MR, Grauer JN. Nationwide Inpatient Sample and National Surgical Quality Improvement Program give different results in hip fracture studies. Clin Orthop Relat Res. 2014;472(6):1672-1680.
44. Gray DT, Hodge DO, Ilstrup DM, Butterfield LC, Baratz KH, Concordance of Medicare data and population-based clinical data on cataract surgery utilization in Olmsted County, Minnesota. Am J Epidemiol. 1997;145(12):1123-1126.
45. Memtsoudis SG. Limitations associated with the analysis of data from administrative databases. Anesthesiology. 2009;111(2):449.
First described by Runge1 in 1873 and later termed lawn-tennis arm by Major2 in 1883, lateral epicondylitis is a common cause of elbow pain, affecting 1% to 3% of the general population each year.3,4 Given that prevalence estimates are up to 15% among workers in repetitive hand task industries,5-7 symptoms of lateral epicondylitis are thought to be related to recurring wrist extension and alternating forearm pronation and supination.8 Between 80% and 90% of patients with lateral epicondylitis experience symptomatic improvement with conservative therapy,9-11 including rest and use of nonsteroidal anti-inflammatory medications,12 physical therapy,13,14 corticosteroid injections,10,15,16 orthoses,17,18 and shock wave therapy.19 However, between 4% and 11% of patients with newly diagnosed lateral epicondylitis do not respond to prolonged (6- to 12-month) conservative treatment and then require operative intervention,11,20,21 with some referral practices reporting rates as high as 25%.22
Traditionally, operative management of lateral epicondylitis involved open débridement of the extensor carpi radialis brevis (ECRB).11,20 More recently, the spectrum of operations for lateral epicondylitis has expanded to include procedures that repair the extensor origin after débridement of the torn tendon and angiofibroblastic dysplasia; procedures that use fasciotomy or direct release of the extensor origin from the epicondyle to relieve tension on the common extensor; procedures directed at the radial or posterior interosseous nerve; and procedures that use arthroscopic techniques to divide the orbicular ligament, reshape the radial head, or release the extensor origin.23 There has been debate about the value of repairing the ECRB, lengthening the ECRB, simultaneously decompressing the radial nerve or resecting epicondylar bone, and performing the procedures percutaneously, endoscopically, or arthroscopically.24-28 Despite multiple studies of the outcomes of these procedures,11,29-31 little is known regarding US national trends for operative treatment of lateral epicondylitis. Understanding national practice patterns and disease burden is essential to allocation of limited health care resources.
We conducted a study to determine US national trends in use of ambulatory surgery for lateral epicondylitis. We focused on age, sex, surgical setting, anesthetic type, and payment method.
Methods
As the National Survey of Ambulatory Surgery32 (NSAS) is an administrative dataset in which all data are deidentified and available for public use, this study was exempt from requiring institutional review board approval.
NSAS data were used to analyze trends in treatment of lateral epicondylitis between 1994 and 2006. NSAS was undertaken by the National Center for Health Statistics (NCHS) of the Centers for Disease Control and Prevention (CDC) to obtain information about the use of ambulatory surgery in the United States. Since the early 1980s, ambulatory surgery has increased in the United States because of advances in medical technology and cost-containment initiatives.33 The number of procedures being performed in ambulatory surgery centers increased from 31.5 million in 1996 to 53.3 million in 2006.34 Funded by the CDC, NSAS is a national study that involves both hospital-based and freestanding ambulatory surgery centers and provides the most recent and comprehensive overview of ambulatory surgery in the United States.35 Because of budgetary limitations, 2006 was the last year in which data for NSAS were collected. Data for NSAS come from Medicare-participating, noninstitutional hospitals (excluding military hospitals, federal facilities, and Veteran Affairs hospitals) in all 50 states and the District of Columbia with a minimum of 6 beds staffed for patient use. NSAS used only short-stay hospitals (hospitals with an average length of stay for all patients of less than 30 days) or hospitals that had a specialty of general (medical or surgical) or children’s general. NSAS was conducted in 1994, 1996, and 2006 with medical information recorded on patient abstracts coded by contract staff. NSAS selected a sample of ambulatory surgery visits using a systematic random sampling procedure, and selection of visits within each facility was done separately for each location where ambulatory surgery was performed. In 1994, 751 facilities were sampled, and 88% of hospitals responded. In 1996, 750 facilities were sampled, and 91% of hospitals responded. In 2006, 696 facilities were sampled, and 75% responded. The surveys used International Classification of Diseases, 9th Revision, Clinical Modification (ICD-9-CM) codes36 to classify medical diagnoses and procedures. To produce an unbiased national estimate, NCHS used multistage estimate procedures, including inflation by reciprocals of the probabilities of sample selection, population-weighting ratio adjustments, and adjustment for no response.37
Demographic and medical information was obtained for people with an ICD-9-CM diagnosis code of lateral epicondylitis (726.32), using previously described techniques.38 Data were then recorded for age, sex, facility type, insurance type, anesthesia type, diagnoses, and procedures.
Descriptive statistics consisted of means and standard deviations for continuous variables and frequency and percentages for discrete variables. Because NSAS data were collected on the basis of a probabilistic sample scheme, they were analyzed using a sampling weighting method. Sampling weights (inverse of selection probability) provided by the CDC were used to account for unequal sampling probabilities and to produce estimates for all visits in the United States. A Taylor linearization model provided by the CDC estimates was used to calculate standard error and confidence intervals (CIs) of the data. Standard error is a measure of sampling variability that occurs by chance because only a sample rather than the entire universe is surveyed. To define population parameters, NCHS chose 95% CIs along with a point estimate. Direct statistical comparison between years cannot be performed because of sampling differences in the database compared between years. The CIs, however, can suggest statistical differences if the data are nonoverlapping. US census data were used to obtain national population estimates for each year of the study (1994, 1996, 2006).39 Rates were presented as number of procedures per 100,000 standard population. For age, a direct adjustment procedure was used, and the US population in 2000 was selected as the standard population. Applying sex-specific rates to the standard population and dividing by the total in the standard population, we calculated sex-adjusted rates for each year. All data were analyzed using SPSS Version 20 software.
Results
A total of 30,311 ambulatory surgical procedures (95% CI, 27,292-33,330) or 10.44 per 100,000 capita were recorded by NSAS for the treatment of lateral epicondylitis in 2006 (Table 1). This represents a large increase in the total number of ambulatory procedures, from 21,852 in 1994 (95% CI, 19,981-23,722; 7.29/100,000) and 20,372 in 1996 (95% CI, 18,660-22,083; 6.73/100,000).
Between 1994 and 2006, the sex-adjusted rate of ambulatory surgery for lateral epicondylitis increased by 85% among females (7.74/100,000 to 14.31/100,000), whereas the rate decreased by 31% among males (8.07/100,000 to 5.59/100,000) (Table 1). The age-adjusted rate of ambulatory surgery for lateral epicondylitis increased among all age groups except the 30–39 years group (Table 2). The largest increase in age-adjusted rates was found for patients older than 50 years (275%) between 1994 and 2006.
During the study period, use of regional anesthesia nearly doubled, from 17% to 30%, whereas use of general anesthesia decreased, from 69% to 57% (Table 3). At all time points, the most common procedure performed for lateral epicondylitis in ambulatory surgery centers was division/release of the joint capsule of the elbow (Table 4). Private insurance remained the most common source of payment for all study years, ranging from 52% to 60% (Table 5). The Figure shows that, between 1994 and 2006, the proportion of surgeries performed in a freestanding ambulatory center increased.
Discussion
In this descriptive epidemiologic study, we used NSAS data to investigate trends in ambulatory surgery for lateral epicondylitis between 1994 and 2006.32 Our results showed that total number of procedures and the population-adjusted rate of procedures for lateral epicondylitis increased during the study period. The largest increase in age-adjusted rates of surgery for lateral epicondylitis was found among patients older than 50 years, whereas the highest age-adjusted rate of ambulatory surgery for lateral epicondylitis was found among patients between ages 40 and 49 years. These findings are similar to those of previous studies, which have shown that most patients with lateral epicondylitis present in the fourth and fifth decades of life.22 Prior reports have suggested that the incidence of lateral epicondylitis in men and women is equal.22 The present study found a change in sex-adjusted rates of ambulatory surgery for lateral epicondylitis between 1994 and 2006. Specifically, in 1994, surgery rates for men and women were similar (8.07/100,000 and 7.74/100,000), but in 2006 the sex-adjusted rate of surgery for lateral epicondylitis was almost 3 times higher for women than for men (14.31/100,000 vs 5.59/100,000).
We also found that the population-adjusted rate of lateral epicondylectomy increased drastically, from 0.4 per 100,000 in 1994 to 3.53 per 100,000 in 2006. Lateral epicondylectomy involves excision of the tip of the lateral epicondyle (typically, 0.5 cm) to produce a cancellous bone surface to which the edges of the débrided extensor tendon can be approximated without tension.23 It is possible that the increased rate of lateral epicondylectomy reflects evidence-based practice changes during the study period,27 though denervation was found more favorable than epicondylectomy in a recent study by Berry and colleagues.40 Future studies should investigate whether rates of epicondylectomy have changed since 2006. In addition, the present study showed a correlation between the introduction of arthroscopic techniques for the treatment of lateral epicondylitis and the period when much research was being conducted on the topic.24,25,28 As arthroscopic techniques improve, their rates are likely to continue to increase.
Our results also showed an increase in procedures performed in freestanding facilities. The rise in ambulatory surgical volume, speculated to result from more procedures being performed in freestanding facilities,34 has been reported with knee and shoulder arthroscopy.41 In addition, though general anesthesia remained the most used technique, our results showed a shift toward peripheral nerve blocks. The increase in regional anesthesia, which has also been noted in joint arthroscopy, is thought to stem from the advent of nerve-localizing technology, such as nerve stimulation and ultrasound guidance.41 Peripheral nerve blocks are favorable on both economic and quality measures, are associated with fewer opioid-related side effects, and overall provide better analgesia in comparison with opioids, highlighting their importance in the ambulatory setting.42
Although large, national databases are well suited to epidemiologic research,43 our study had limitations. As with all databases, NSAS is subject to data entry errors and coding errors.44,45 However, the database administrators corrected for this by using a multistage estimate procedure with weighting adjustments for no response and population-weighting ratio adjustments.35 Another limitation of this study is its lack of clinical detail, as procedure codes are general and do not allow differentiation between specific patients. Because of the retrospective nature of the analysis and the heterogeneity of the data, assessment of specific surgeries for lateral epicondylitis was limited. Although a strength of using NSAS to perform epidemiologic analyses is its large sample size, this also sacrifices specificity in terms of clinical insight. The results of this study may influence investigations to distinguish differences between procedures used in the treatment of lateral epicondylitis. Furthermore, the results of this study are limited to ambulatory surgery practice patterns in the United States between 1996 and 2006. Last, our ability to perform economic analyses was limited, as data on total hospital cost were not recorded by the surveys.
Conclusion
The increase in ambulatory surgery for lateral epicondylitis, demonstrated in this study, emphasizes the importance of national funding for surveys such as NSAS beyond 2006, as utilization trends may have considerable effects on health care policies that influence the quality of patient care.
1. Runge F. Zur genese und behandlung des schreibekramfes. Berl Klin Wochenschr. 1873;10:245.
2. Major HP. Lawn-tennis elbow. Br Med J. 1883;2:557.
3. Allander E. Prevalence, incidence, and remission rates of some common rheumatic diseases or syndromes. Scand J Rheumatol. 1974;3(3):145-153.
4. Verhaar JA. Tennis elbow. Anatomical, epidemiological and therapeutic aspects. Int Orthop. 1994;18(5):263-267.
5. Kurppa K, Viikari-Juntura E, Kuosma E, Huuskonen M, Kivi P. Incidence of tenosynovitis or peritendinitis and epicondylitis in a meat-processing factory. Scand J Work Environ Health. 1991;17(1):32-37.
6. Ranney D, Wells R, Moore A. Upper limb musculoskeletal disorders in highly repetitive industries: precise anatomical physical findings. Ergonomics. 1995;38(7):1408-1423.
7. Haahr JP, Andersen JH. Physical and psychosocial risk factors for lateral epicondylitis: a population based case-referent study. Occup Environ Med. 2003;60(5):322-329.
8. Goldie I. Epicondylitis lateralis humeri (epicondylalgia or tennis elbow). A pathogenetical study. Acta Chir Scand Suppl. 1964;57(suppl 399):1+.
9. Binder AI, Hazleman BL. Lateral humeral epicondylitis—a study of natural history and the effect of conservative therapy. Br J Rheumatol. 1983;22(2):73-76.
10. Smidt N, van der Windt DA, Assendelft WJ, Devillé WL, Korthals-de Bos IB, Bouter LM. Corticosteroid injections, physiotherapy, or a wait-and-see policy for lateral epicondylitis: a randomised controlled trial. Lancet. 2002;359(9307):657-662.
11. Nirschl RP, Pettrone FA. Tennis elbow. The surgical treatment of lateral epicondylitis. J Bone Joint Surg Am. 1979;61(6):832-839.
12. Burnham R, Gregg R, Healy P, Steadward R. The effectiveness of topical diclofenac for lateral epicondylitis. Clin J Sport Med. 1998;8(2):78-81.
13. Martinez-Silvestrini JA, Newcomer KL, Gay RE, Schaefer MP, Kortebein P, Arendt KW. Chronic lateral epicondylitis: comparative effectiveness of a home exercise program including stretching alone versus stretching supplemented with eccentric or concentric strengthening. J Hand Ther. 2005;18(4):411-419.
14. Svernlöv B, Adolfsson L. Non-operative treatment regime including eccentric training for lateral humeral epicondylalgia. Scand J Med Sci Sports. 2001;11(6):328-334.
15. Hay EM, Paterson SM, Lewis M, Hosie G, Croft P. Pragmatic randomised controlled trial of local corticosteroid injection and naproxen for treatment of lateral epicondylitis of elbow in primary care. BMJ. 1999;319(7215):964-968.
16. Lewis M, Hay EM, Paterson SM, Croft P. Local steroid injections for tennis elbow: does the pain get worse before it gets better? Results from a randomized controlled trial. Clin J Pain. 2005;21(4):330-334.
17. Van De Streek MD, Van Der Schans CP, De Greef MH, Postema K. The effect of a forearm/hand splint compared with an elbow band as a treatment for lateral epicondylitis. Prosthet Orthot Int. 2004;28(2):183-189.
18. Struijs PA, Smidt N, Arola H, Dijk vC, Buchbinder R, Assendelft WJ. Orthotic devices for the treatment of tennis elbow. Cochrane Database Syst Rev. 2002;(1):CD001821.
19. Buchbinder R, Green SE, Youd JM, Assendelft WJ, Barnsley L, Smidt N. Shock wave therapy for lateral elbow pain. Cochrane Database Syst Rev. 2005;(4):CD003524.
20. Boyd HB, McLeod AC Jr. Tennis elbow. J Bone Joint Surg Am. 1973;55(6):1183-1187.
21. Coonrad RW, Hooper WR. Tennis elbow: its course, natural history, conservative and surgical management. J Bone Joint Surg Am. 1973;55(6):1177-1182.
22. Calfee RP, Patel A, DaSilva MF, Akelman E. Management of lateral epicondylitis: current concepts. J Am Acad Orthop Surg. 2008;16(1):19-29.
23. Plancher KD, Bishai SK. Open lateral epicondylectomy: a simple technique update for the 21st century. Tech Orthop. 2006;21(4):276-282.
24. Peart RE, Strickler SS, Schweitzer KM Jr. Lateral epicondylitis: a comparative study of open and arthroscopic lateral release. Am J Orthop. 2004;33(11):565-567.
25. Dunkow PD, Jatti M, Muddu BN. A comparison of open and percutaneous techniques in the surgical treatment of tennis elbow. J Bone Joint Surg Br. 2004;86(5):701-704.
26. Rosenberg N, Henderson I. Surgical treatment of resistant lateral epicondylitis. Follow-up study of 19 patients after excision, release and repair of proximal common extensor tendon origin. Arch Orthop Trauma Surg. 2002;122(9-10):514-517.
27. Almquist EE, Necking L, Bach AW. Epicondylar resection with anconeus muscle transfer for chronic lateral epicondylitis. J Hand Surg Am. 1998;23(4):723-731.
28. Smith AM, Castle JA, Ruch DS. Arthroscopic resection of the common extensor origin: anatomic considerations. J Shoulder Elbow Surg. 2003;12(4):375-379.
29. Baker CL Jr, Murphy KP, Gottlob CA, Curd DT. Arthroscopic classification and treatment of lateral epicondylitis: two-year clinical results. J Shoulder Elbow Surg. 2000;9(6):475-482.
30. Owens BD, Murphy KP, Kuklo TR. Arthroscopic release for lateral epicondylitis. Arthroscopy. 2001;17(6):582-587.
31. Mullett H, Sprague M, Brown G, Hausman M. Arthroscopic treatment of lateral epicondylitis: clinical and cadaveric studies. Clin Orthop Relat Res. 2005;(439):123-128.
32. National Survey of Ambulatory Surgery. Centers for Disease Control and Prevention website. http://www.cdc.gov/nchs/nsas/nsas_questionnaires.htm. Published May 4, 2010. Accessed November 10, 2015.
33. Leader S, Moon M. Medicare trends in ambulatory surgery. Health Aff. 1989;8(1):158-170.
34. Cullen KA, Hall MJ, Golosinskiy A. Ambulatory surgery in the United States, 2006. Natl Health Stat Rep. 2009;(11):1-25.
35. Kim S, Bosque J, Meehan JP, Jamali A, Marder R. Increase in outpatient knee arthroscopy in the United States: a comparison of National Surveys of Ambulatory Surgery, 1996 and 2006. J Bone Joint Surg Am. 2011;93(11):994-1000.
36. Centers for Disease Control and Prevention, National Center for Health Statistics. International Classification of Diseases, Ninth Revision, Clinical Modification (ICD-9-CM). http://www.cdc.gov/nchs/icd/icd9cm.htm. Updated June 18, 2013. Accessed October 28, 2015.
37. Dennison C, Pokras R. Design and operation of the National Hospital Discharge Survey: 1988 redesign. Vital Health Stat 1. 2000;(39):1-42.
38. Stundner O, Kirksey M, Chiu YL, et al. Demographics and perioperative outcome in patients with depression and anxiety undergoing total joint arthroplasty: a population-based study. Psychosomatics. 2013;54(2):149-157.
39. Population estimates. US Department of Commerce, United States Census Bureau website. http://www.census.gov/popest/index.html. Accessed November 16, 2015.
40. Berry N, Neumeister MW, Russell RC, Dellon AL. Epicondylectomy versus denervation for lateral humeral epicondylitis. Hand. 2011;6(2):174-178.
41. Memtsoudis SG, Kuo C, Ma Y, Edwards A, Mazumdar M, Liguori G. Changes in anesthesia-related factors in ambulatory knee and shoulder surgery: United States 1996–2006. Reg Anesth Pain Med. 2011;36(4):327-331.
42. Richman JM, Liu SS, Courpas G, et al. Does continuous peripheral nerve block provide superior pain control to opioids? A meta-analysis. Anesth Analg. 2006;102(1):248-257.
43. Bohl DD, Basques BA, Golinvaux NS, Baumgaertner MR, Grauer JN. Nationwide Inpatient Sample and National Surgical Quality Improvement Program give different results in hip fracture studies. Clin Orthop Relat Res. 2014;472(6):1672-1680.
44. Gray DT, Hodge DO, Ilstrup DM, Butterfield LC, Baratz KH, Concordance of Medicare data and population-based clinical data on cataract surgery utilization in Olmsted County, Minnesota. Am J Epidemiol. 1997;145(12):1123-1126.
45. Memtsoudis SG. Limitations associated with the analysis of data from administrative databases. Anesthesiology. 2009;111(2):449.
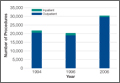
Total Knee Arthroplasty in Hemophilic Arthropathy
Chronic hemophilic arthropathy, a well-known complication of hemophilia, develops as a long-term consequence of recurrent joint bleeds resulting in synovial hypertrophy (chronic proliferative synovitis) and joint cartilage destruction. Hemophilic arthropathy mostly affects the knees, ankles, and elbows and causes chronic joint pain and functional impairment in relatively young patients who have not received adequate primary prophylactic replacement therapy with factor concentrates from early childhood.1-3
In the late stages of hemophilic arthropathy of the knee, total knee arthroplasty (TKA) provides dramatic joint pain relief, improves knee functional status, and reduces rebleeding into the joint.4-8 TKA performed on a patient with hemophilia was first reported in the mid-1970s.9,10 In these cases, the surgical procedure itself is often complicated by severe fibrosis developing in the joint soft tissues, flexion joint contracture, and poor quality of the joint bone structures. Even though TKA significantly reduces joint pain in patients with chronic hemophilic arthropathy, some authors have achieved only modest functional outcomes and experienced a high rate of complications (infection, prosthetic loosening).11-13 Data on TKA outcomes are still scarce, and most studies have enrolled a limited number of patients.
We retrospectively evaluated the outcomes of 88 primary TKAs performed on patients with severe hemophilia at a single institution. Clinical outcomes and complications were assessed with a special focus on prosthetic survival and infection.
Patients and Methods
Ninety-one primary TKAs were performed in 77 patients with severe hemophilia A and B (factor VIII [FVIII] and factor IX plasma concentration, <1% each) between January 1, 1999, and December 31, 2011, and the medical records of all these patients were thoroughly reviewed in 2013. The cases of 3 patients who died shortly after surgery were excluded from analysis. Thus, 88 TKAs and 74 patients (74 males) were finally available for evaluation. Fourteen patients underwent bilateral TKAs but none concurrently. The patients provided written informed consent for print and electronic publication of their outcomes.
We recorded demographic data, type and severity of hemophilia, human immunodeficiency virus (HIV) status, hepatitis C virus (HCV) status, and Knee Society Scale (KSS) scores.14 KSS scores include Knee score (pain, range of motion [ROM], stability) and Function score (walking, stairs), both of which range from 0 (normal knee) to 100 (most affected knee). Prosthetic infection was classified (Segawa and colleagues15) as early or late, depending on timing of symptom onset (4 weeks after replacement surgery was the threshold used).
Patients received an intravenous bolus infusion of the deficient factor concentrate followed by continuous infusion to reach a plasma factor level of 100% just before surgery and during the first 7 postoperative days and 50% over the next 7 days (Table 1). Patients with a circulating inhibitor (3 overall) received bypassing agents FEIBA (FVIII inhibitor bypassing agent) or rFVIIa (recombinant factor VII activated) (Table 2). Patients were not given any antifibrinolytic treatment or thromboprophylaxis.
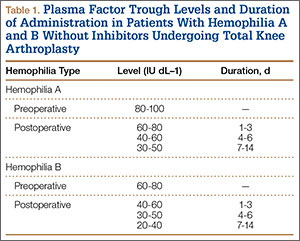

Surgery was performed in a standard surgical room. Patients were placed on the operating table in decubitus supinus position. A parapatellar medial incision was made on a bloodless surgical field (achieved with tourniquet ischemia). The prosthesis model used was always the cemented (gentamicin bone cement) NexGen (Zimmer). Patellar resurfacing was done in all cases (Figures 1A–1D). All TKAs were performed by Dr. Rodríguez-Merchán. Intravenous antibiotic prophylaxis was administered at anesthetic induction and during the first 48 hours after surgery (3 further doses). Active exercises were started on postoperative day 1. Joint load aided with 2 crutches was allowed starting on postoperative day 2.
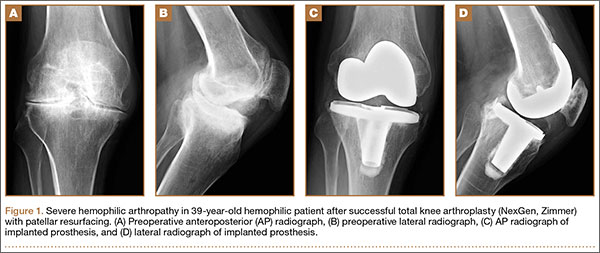
Mean patient age was 38.2 years (range, 24-73 years). Of the 74 patients, 55 had a diagnosis of severe hemophilia A, and 19 had a diagnosis of severe hemophilia B. During the follow-up period, 23 patients died (mean time, 6.4 years; range, 4-9 years). Causes of death were acquired immune deficiency syndrome (AIDS), liver cirrhosis, and intracranial bleeding. Mean follow-up for the full series of patients was 8 years (range, 1-13 years).
Descriptive statistical analysis was performed with SPSS Windows Version 18.0. Prosthetic failure was regarded as implant removal for any reason. Student t test was used to compare continuous variables, and either χ2 test or Fisher exact test was used to compare categorical variables. P < .05 (2-sided) was considered significant.
Results
Prosthetic survival rates with implant removal for any reason regarded as final endpoint was 92%. Causes of failure were prosthetic infection (6 cases, 6.8%) and loosening (2 cases, 2.2%). Of the 6 prosthetic infections, 5 were regarded as late and 1 as early. Late infections were successfully sorted by performing 2-stage revision TKA with the Constrained Condylar Knee (Zimmer). Acute infections were managed by open joint débridement and polyethylene exchange. Both cases of aseptic loosening of the TKA were successfully managed with 1-stage revision TKA using the same implant model (Figures 2A–2D).
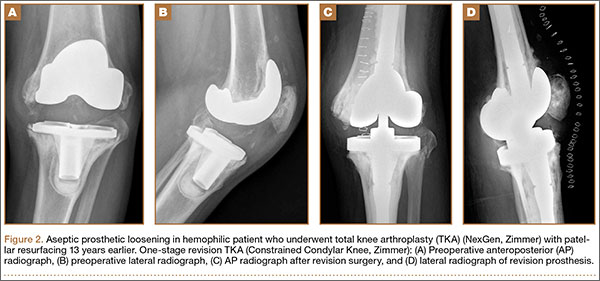
Mean KSS Knee score improved from 79 before surgery to 36 after surgery, and mean KSS Function score improved from 63 to 33. KSS Pain score, which is included in the Knee score, 0 (no pain) to 50 (most severe pain), improved from 47 to 8. Patients receiving inhibitors and patients who were HIV- or HCV-positive did not have poorer outcomes relative to those of patients not receiving inhibitors and patients who were HIV- or HCV-negative. Patients with liver cirrhosis had a lower prosthetic survival rate and lower Knee scores.
Discussion
The prosthetic survival rate found in this study compares well with other reported rates for patients with hemophilia and other bleeding disorders. However, evidence regarding long-term prosthesis survival in TKAs performed for patients with hemophilia is limited. Table 3 summarizes the main reported series of patients with hemophilia with 10-year prosthetic survival rates, number of TKAs performed, and mean follow-up period; in all these series, implant removal for any reason was regarded as the final endpoint.5-8,16,17 Mean follow-up in our study was 8 years. Clinical outcomes of TKA in patients with severe hemophilia and related disorders are expected to be inferior to those achieved in patients without a bleeding condition. The overall 10-year prosthetic survival rate for cemented TKA implants, as reported by the Norwegian Arthroplasty Register, was on the order of 93%.18 Mean age of our patients at time of surgery was only 38.2 years. TKAs performed in younger patients without a bleeding disorder have been associated with shorter implant survival times relative to those of elderly patients.19 Thus, Diduch and colleagues20 reported a prosthetic survival rate of 87% at 18 years in 108 TKAs performed on patients under age 55 years. Lonner and colleagues21 reported a better implant survival rate (90% at 8 years) in a series of patients under age 40 years (32 TKAs). In a study by Duffy and colleagues,22 the implant survival rate was 85% at 15 years in patients under age 55 years (74 TKAs). The results from our retrospective case assessment are quite similar to the overall prosthetic survival rates reported for TKAs performed on patients without hemophilia.

Rates of periprosthetic infection after primary TKA in patients with hemophilia and other bleeding conditions are much higher (up to 11%), with a mean infection rate of 6.2% (range, 1% to 11%), consistent with the rate found in our series of patients (6.8%)7,16,17,23,24 (Table 4). This rate is much higher than that reported after primary TKA in patients without hemophilia but is similar to some rates reported for patients with hemophilia. In our experience, most periprosthetic infections (5/6) were sorted as late.
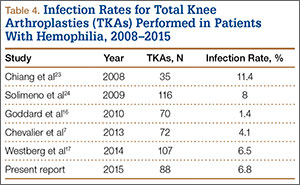
Late infection is a major concern after TKA in patients with hemophilia, and various factors have been hypothesized as contributing to the high prevalence. An important factor is the high rate of HIV-positive patients among patients with hemophilia—which acts as a strong predisposing factor because of the often low CD4 counts and associated immune deficiency,25 but different reports have provided conflicting results in this respect.5,6,12 We found no relationship between HIV status and risk for periprosthetic infection, but conclusions are limited by the low number of HIV-positive patients in our series (14/74, 18.9%). Our patients’ late periprosthetic infections were diagnosed several years after TKA, suggesting hematogenous spread of infection. Most of these patients either were on regular prophylactic factor infusions or were being treated on demand, which might entail a risk for contamination of infusions by skin bacteria from the puncture site. Therefore, having an aseptic technique for administering coagulation factor concentrates is of paramount importance for patients with hemophilia and a knee implant.
Another important complication of TKA surgery is aseptic loosening of the prosthesis. Aseptic loosening occurred in 2.2% of our patients, but higher rates have been reported elsewhere.11,26 Rates of this complication increase over follow-up, and some authors have linked this complication to TKA polyethylene wear.27 Development of a reactive and destructive bone–cement interface and microhemorrhages into such interface might be implicated in the higher rate of loosening observed among patients with hemophilia.28
In the present study, preoperative and postoperative functional outcomes differed significantly. A modest postoperative total ROM of 69º to 79º has been reported by several authors.5,6 Postoperative ROM may vary—may be slightly increased, remain unchanged, or may even be reduced.4,23,26 Even though little improvement in total ROM is achieved after TKA, many authors have reported reduced flexion contracture and hence an easier gait. However, along with functional improvement, dramatic pain relief after TKA is perhaps the most remarkable aspect, and it has a strong effect on patient satisfaction after surgery.5,7,8,18,23
Our study had 2 main limitations. First, it was a retrospective case series evaluation with the usual issues of potential inaccuracy of medical records and information bias. Second, the study did not include a control group.
Conclusion
The primary TKAs performed in our patients with hemophilia have had a good prosthetic survival rate. Even though such a result is slightly inferior to results in patients without hemophilia, our prosthetic survival rate is not significantly different from the rates reported in other, younger patient subsets. Late periprosthetic infections are a major concern, and taking precautions to avoid hematogenous spread of infections during factor concentrate infusions is strongly encouraged.
1. Arnold WD, Hilgartner MW. Hemophilic arthropathy. Current concepts of pathogenesis and management. J Bone Joint Surg Am. 1977;59(3):287-305.
2. Rodriguez-Merchan EC. Common orthopaedic problems in haemophilia. Haemophilia. 1999;5(suppl 1):53-60.
3. Steen Carlsson K, Höjgård S, Glomstein A, et al. On-demand vs. prophylactic treatment for severe haemophilia in Norway and Sweden: differences in treatment characteristics and outcome. Haemophilia. 2003;9(5):555-566.
4. Teigland JC, Tjønnfjord GE, Evensen SA, Charania B. Knee arthroplasty in hemophilia. 5-12 year follow-up of 15 patients. Acta Orthop Scand. 1993;64(2):153-156.
5. Silva M, Luck JV Jr. Long-term results of primary total knee replacement in patients with hemophilia. J Bone Joint Surg Am. 2005;87(1):85-91.
6. Wang K, Street A, Dowrick A, Liew S. Clinical outcomes and patient satisfaction following total joint replacement in haemophilia—23-year experience in knees, hips and elbows. Haemophilia. 2012;18(1):86-93.
7. Chevalier Y, Dargaud Y, Lienhart A, Chamouard V, Negrier C. Seventy-two total knee arthroplasties performed in patients with haemophilia using continuous infusion. Vox Sang. 2013;104(2):135-143.
8. Zingg PO, Fucentese SF, Lutz W, Brand B, Mamisch N, Koch PP. Haemophilic knee arthropathy: long-term outcome after total knee replacement. Knee Surg Sports Traumatol Arthrosc. 2012;20(12):2465-2470.
9. Kjaersgaard-Andersen P, Christiansen SE, Ingerslev J, Sneppen O. Total knee arthroplasty in classic hemophilia. Clin Orthop Relat Res. 1990;(256):137-146.
10. Cohen I, Heim M, Martinowitz U, Chechick A. Orthopaedic outcome of total knee replacement in haemophilia A. Haemophilia. 2000;6(2):104-109.
11. Fehily M, Fleming P, O’Shea E, Smith O, Smyth H. Total knee arthroplasty in patients with severe haemophilia. Int Orthop. 2002;26(2):89-91.
12. Legroux-Gérot I, Strouk G, Parquet A, Goodemand J, Gougeon F, Duquesnoy B. Total knee arthroplasty in hemophilic arthropathy. Joint Bone Spine. 2003;70(1):22-32.
13. Sheth DS, Oldfield D, Ambrose C, Clyburn T. Total knee arthroplasty in hemophilic arthropathy. J Arthroplasty. 2004;19(1):56-60.
14. Insall JN, Dorr LD, Scott RD, Scott WN. Rationale of the Knee Society clinical rating system. Clin Orthop Relat Res. 1989;(248):13-14.
15. Segawa H, Tsukayama DT, Kyle RF, Becker DA, Gustilo RB. Infection after total knee arthroplasty. A retrospective study of the treatment of eighty-one infections. J Bone Joint Surg Am. 1999;81(10):1434-1445.
16. Goddard NJ, Mann HA, Lee CA. Total knee replacement in patients with end-stage haemophilic arthropathy. 25-year results. J Bone Joint Surg Br. 2010;92(8):1085-1089.
17. Westberg M, Paus AC, Holme PA, Tjønnfjord GE. Haemophilic arthropathy: long-term outcomes in 107 primary total knee arthroplasties. Knee. 2014;21(1):147-150.
18. Lygre SH, Espehaug B, Havelin LI, Vollset SE, Furnes O. Failure of total knee arthroplasty with or without patella resurfacing. A study from the Norwegian Arthroplasty Register with 0-15 years of follow-up. Acta Orthop. 2011;82(3):282-292.
19. Post M, Telfer MC. Surgery in hemophilic patients. J Bone Joint Surg Am. 1975;57(8):1136-1145.
20. Diduch DR, Insall JN, Scott WN, Scuderi GR, Font-Rodriguez D. Total knee replacement in young, active patients. Long-term follow-up and functional outcome. J Bone Joint Surg Am. 1997;79(4):575-582.
21. Lonner JH, Hershman S, Mont M, Lotke PA. Total knee arthroplasty in patients 40 years of age and younger with osteoarthritis. Clin Orthop Relat Res. 2000;(380):85-90.
22. Duffy GP, Crowder AR, Trousdale RR, Berry DJ. Cemented total knee arthroplasty using a modern prosthesis in young patients with osteoarthritis. J Arthroplasty. 2007;22(6 suppl 2):67-70.
23. Chiang CC, Chen PQ, Shen MC, Tsai W. Total knee arthroplasty for severe haemophilic arthropathy: long-term experience in Taiwan. Haemophilia. 2008;14(4):828-834.
24. Solimeno LP, Mancuso ME, Pasta G, Santagostino E, Perfetto S, Mannucci PM. Factors influencing the long-term outcome of primary total knee replacement in haemophiliacs: a review of 116 procedures at a single institution. Br J Haematol. 2009;145(2):227-234.
25. Jämsen E, Varonen M, Huhtala H, et al. Incidence of prosthetic joint infections after primary knee arthroplasty. J Arthroplasty. 2010;25(1):87-92.
26. Ragni MV, Crossett LS, Herndon JH. Postoperative infection following orthopaedic surgery in human immunodeficiency virus–infected hemophiliacs with CD4 counts < or = 200/mm3. J Arthroplasty. 1995;10(6):716-721.
27. Hicks JL, Ribbans WJ, Buzzard B, et al. Infected joint replacements in HIV-positive patients with haemophilia. J Bone Joint Surg Br. 2001;83(7):1050-1054.
28. Figgie MP, Goldberg VM, Figgie HE 3rd, Heiple KG, Sobel M. Total knee arthroplasty for the treatment of chronic hemophilic arthropathy. Clin Orthop Relat Res. 1989;(248):98-107.
Chronic hemophilic arthropathy, a well-known complication of hemophilia, develops as a long-term consequence of recurrent joint bleeds resulting in synovial hypertrophy (chronic proliferative synovitis) and joint cartilage destruction. Hemophilic arthropathy mostly affects the knees, ankles, and elbows and causes chronic joint pain and functional impairment in relatively young patients who have not received adequate primary prophylactic replacement therapy with factor concentrates from early childhood.1-3
In the late stages of hemophilic arthropathy of the knee, total knee arthroplasty (TKA) provides dramatic joint pain relief, improves knee functional status, and reduces rebleeding into the joint.4-8 TKA performed on a patient with hemophilia was first reported in the mid-1970s.9,10 In these cases, the surgical procedure itself is often complicated by severe fibrosis developing in the joint soft tissues, flexion joint contracture, and poor quality of the joint bone structures. Even though TKA significantly reduces joint pain in patients with chronic hemophilic arthropathy, some authors have achieved only modest functional outcomes and experienced a high rate of complications (infection, prosthetic loosening).11-13 Data on TKA outcomes are still scarce, and most studies have enrolled a limited number of patients.
We retrospectively evaluated the outcomes of 88 primary TKAs performed on patients with severe hemophilia at a single institution. Clinical outcomes and complications were assessed with a special focus on prosthetic survival and infection.
Patients and Methods
Ninety-one primary TKAs were performed in 77 patients with severe hemophilia A and B (factor VIII [FVIII] and factor IX plasma concentration, <1% each) between January 1, 1999, and December 31, 2011, and the medical records of all these patients were thoroughly reviewed in 2013. The cases of 3 patients who died shortly after surgery were excluded from analysis. Thus, 88 TKAs and 74 patients (74 males) were finally available for evaluation. Fourteen patients underwent bilateral TKAs but none concurrently. The patients provided written informed consent for print and electronic publication of their outcomes.
We recorded demographic data, type and severity of hemophilia, human immunodeficiency virus (HIV) status, hepatitis C virus (HCV) status, and Knee Society Scale (KSS) scores.14 KSS scores include Knee score (pain, range of motion [ROM], stability) and Function score (walking, stairs), both of which range from 0 (normal knee) to 100 (most affected knee). Prosthetic infection was classified (Segawa and colleagues15) as early or late, depending on timing of symptom onset (4 weeks after replacement surgery was the threshold used).
Patients received an intravenous bolus infusion of the deficient factor concentrate followed by continuous infusion to reach a plasma factor level of 100% just before surgery and during the first 7 postoperative days and 50% over the next 7 days (Table 1). Patients with a circulating inhibitor (3 overall) received bypassing agents FEIBA (FVIII inhibitor bypassing agent) or rFVIIa (recombinant factor VII activated) (Table 2). Patients were not given any antifibrinolytic treatment or thromboprophylaxis.
Surgery was performed in a standard surgical room. Patients were placed on the operating table in decubitus supinus position. A parapatellar medial incision was made on a bloodless surgical field (achieved with tourniquet ischemia). The prosthesis model used was always the cemented (gentamicin bone cement) NexGen (Zimmer). Patellar resurfacing was done in all cases (Figures 1A–1D). All TKAs were performed by Dr. Rodríguez-Merchán. Intravenous antibiotic prophylaxis was administered at anesthetic induction and during the first 48 hours after surgery (3 further doses). Active exercises were started on postoperative day 1. Joint load aided with 2 crutches was allowed starting on postoperative day 2.
Mean patient age was 38.2 years (range, 24-73 years). Of the 74 patients, 55 had a diagnosis of severe hemophilia A, and 19 had a diagnosis of severe hemophilia B. During the follow-up period, 23 patients died (mean time, 6.4 years; range, 4-9 years). Causes of death were acquired immune deficiency syndrome (AIDS), liver cirrhosis, and intracranial bleeding. Mean follow-up for the full series of patients was 8 years (range, 1-13 years).
Descriptive statistical analysis was performed with SPSS Windows Version 18.0. Prosthetic failure was regarded as implant removal for any reason. Student t test was used to compare continuous variables, and either χ2 test or Fisher exact test was used to compare categorical variables. P < .05 (2-sided) was considered significant.
Results
Prosthetic survival rates with implant removal for any reason regarded as final endpoint was 92%. Causes of failure were prosthetic infection (6 cases, 6.8%) and loosening (2 cases, 2.2%). Of the 6 prosthetic infections, 5 were regarded as late and 1 as early. Late infections were successfully sorted by performing 2-stage revision TKA with the Constrained Condylar Knee (Zimmer). Acute infections were managed by open joint débridement and polyethylene exchange. Both cases of aseptic loosening of the TKA were successfully managed with 1-stage revision TKA using the same implant model (Figures 2A–2D).
Mean KSS Knee score improved from 79 before surgery to 36 after surgery, and mean KSS Function score improved from 63 to 33. KSS Pain score, which is included in the Knee score, 0 (no pain) to 50 (most severe pain), improved from 47 to 8. Patients receiving inhibitors and patients who were HIV- or HCV-positive did not have poorer outcomes relative to those of patients not receiving inhibitors and patients who were HIV- or HCV-negative. Patients with liver cirrhosis had a lower prosthetic survival rate and lower Knee scores.
Discussion
The prosthetic survival rate found in this study compares well with other reported rates for patients with hemophilia and other bleeding disorders. However, evidence regarding long-term prosthesis survival in TKAs performed for patients with hemophilia is limited. Table 3 summarizes the main reported series of patients with hemophilia with 10-year prosthetic survival rates, number of TKAs performed, and mean follow-up period; in all these series, implant removal for any reason was regarded as the final endpoint.5-8,16,17 Mean follow-up in our study was 8 years. Clinical outcomes of TKA in patients with severe hemophilia and related disorders are expected to be inferior to those achieved in patients without a bleeding condition. The overall 10-year prosthetic survival rate for cemented TKA implants, as reported by the Norwegian Arthroplasty Register, was on the order of 93%.18 Mean age of our patients at time of surgery was only 38.2 years. TKAs performed in younger patients without a bleeding disorder have been associated with shorter implant survival times relative to those of elderly patients.19 Thus, Diduch and colleagues20 reported a prosthetic survival rate of 87% at 18 years in 108 TKAs performed on patients under age 55 years. Lonner and colleagues21 reported a better implant survival rate (90% at 8 years) in a series of patients under age 40 years (32 TKAs). In a study by Duffy and colleagues,22 the implant survival rate was 85% at 15 years in patients under age 55 years (74 TKAs). The results from our retrospective case assessment are quite similar to the overall prosthetic survival rates reported for TKAs performed on patients without hemophilia.
Rates of periprosthetic infection after primary TKA in patients with hemophilia and other bleeding conditions are much higher (up to 11%), with a mean infection rate of 6.2% (range, 1% to 11%), consistent with the rate found in our series of patients (6.8%)7,16,17,23,24 (Table 4). This rate is much higher than that reported after primary TKA in patients without hemophilia but is similar to some rates reported for patients with hemophilia. In our experience, most periprosthetic infections (5/6) were sorted as late.
Late infection is a major concern after TKA in patients with hemophilia, and various factors have been hypothesized as contributing to the high prevalence. An important factor is the high rate of HIV-positive patients among patients with hemophilia—which acts as a strong predisposing factor because of the often low CD4 counts and associated immune deficiency,25 but different reports have provided conflicting results in this respect.5,6,12 We found no relationship between HIV status and risk for periprosthetic infection, but conclusions are limited by the low number of HIV-positive patients in our series (14/74, 18.9%). Our patients’ late periprosthetic infections were diagnosed several years after TKA, suggesting hematogenous spread of infection. Most of these patients either were on regular prophylactic factor infusions or were being treated on demand, which might entail a risk for contamination of infusions by skin bacteria from the puncture site. Therefore, having an aseptic technique for administering coagulation factor concentrates is of paramount importance for patients with hemophilia and a knee implant.
Another important complication of TKA surgery is aseptic loosening of the prosthesis. Aseptic loosening occurred in 2.2% of our patients, but higher rates have been reported elsewhere.11,26 Rates of this complication increase over follow-up, and some authors have linked this complication to TKA polyethylene wear.27 Development of a reactive and destructive bone–cement interface and microhemorrhages into such interface might be implicated in the higher rate of loosening observed among patients with hemophilia.28
In the present study, preoperative and postoperative functional outcomes differed significantly. A modest postoperative total ROM of 69º to 79º has been reported by several authors.5,6 Postoperative ROM may vary—may be slightly increased, remain unchanged, or may even be reduced.4,23,26 Even though little improvement in total ROM is achieved after TKA, many authors have reported reduced flexion contracture and hence an easier gait. However, along with functional improvement, dramatic pain relief after TKA is perhaps the most remarkable aspect, and it has a strong effect on patient satisfaction after surgery.5,7,8,18,23
Our study had 2 main limitations. First, it was a retrospective case series evaluation with the usual issues of potential inaccuracy of medical records and information bias. Second, the study did not include a control group.
Conclusion
The primary TKAs performed in our patients with hemophilia have had a good prosthetic survival rate. Even though such a result is slightly inferior to results in patients without hemophilia, our prosthetic survival rate is not significantly different from the rates reported in other, younger patient subsets. Late periprosthetic infections are a major concern, and taking precautions to avoid hematogenous spread of infections during factor concentrate infusions is strongly encouraged.
1. Arnold WD, Hilgartner MW. Hemophilic arthropathy. Current concepts of pathogenesis and management. J Bone Joint Surg Am. 1977;59(3):287-305.
2. Rodriguez-Merchan EC. Common orthopaedic problems in haemophilia. Haemophilia. 1999;5(suppl 1):53-60.
3. Steen Carlsson K, Höjgård S, Glomstein A, et al. On-demand vs. prophylactic treatment for severe haemophilia in Norway and Sweden: differences in treatment characteristics and outcome. Haemophilia. 2003;9(5):555-566.
4. Teigland JC, Tjønnfjord GE, Evensen SA, Charania B. Knee arthroplasty in hemophilia. 5-12 year follow-up of 15 patients. Acta Orthop Scand. 1993;64(2):153-156.
5. Silva M, Luck JV Jr. Long-term results of primary total knee replacement in patients with hemophilia. J Bone Joint Surg Am. 2005;87(1):85-91.
6. Wang K, Street A, Dowrick A, Liew S. Clinical outcomes and patient satisfaction following total joint replacement in haemophilia—23-year experience in knees, hips and elbows. Haemophilia. 2012;18(1):86-93.
7. Chevalier Y, Dargaud Y, Lienhart A, Chamouard V, Negrier C. Seventy-two total knee arthroplasties performed in patients with haemophilia using continuous infusion. Vox Sang. 2013;104(2):135-143.
8. Zingg PO, Fucentese SF, Lutz W, Brand B, Mamisch N, Koch PP. Haemophilic knee arthropathy: long-term outcome after total knee replacement. Knee Surg Sports Traumatol Arthrosc. 2012;20(12):2465-2470.
9. Kjaersgaard-Andersen P, Christiansen SE, Ingerslev J, Sneppen O. Total knee arthroplasty in classic hemophilia. Clin Orthop Relat Res. 1990;(256):137-146.
10. Cohen I, Heim M, Martinowitz U, Chechick A. Orthopaedic outcome of total knee replacement in haemophilia A. Haemophilia. 2000;6(2):104-109.
11. Fehily M, Fleming P, O’Shea E, Smith O, Smyth H. Total knee arthroplasty in patients with severe haemophilia. Int Orthop. 2002;26(2):89-91.
12. Legroux-Gérot I, Strouk G, Parquet A, Goodemand J, Gougeon F, Duquesnoy B. Total knee arthroplasty in hemophilic arthropathy. Joint Bone Spine. 2003;70(1):22-32.
13. Sheth DS, Oldfield D, Ambrose C, Clyburn T. Total knee arthroplasty in hemophilic arthropathy. J Arthroplasty. 2004;19(1):56-60.
14. Insall JN, Dorr LD, Scott RD, Scott WN. Rationale of the Knee Society clinical rating system. Clin Orthop Relat Res. 1989;(248):13-14.
15. Segawa H, Tsukayama DT, Kyle RF, Becker DA, Gustilo RB. Infection after total knee arthroplasty. A retrospective study of the treatment of eighty-one infections. J Bone Joint Surg Am. 1999;81(10):1434-1445.
16. Goddard NJ, Mann HA, Lee CA. Total knee replacement in patients with end-stage haemophilic arthropathy. 25-year results. J Bone Joint Surg Br. 2010;92(8):1085-1089.
17. Westberg M, Paus AC, Holme PA, Tjønnfjord GE. Haemophilic arthropathy: long-term outcomes in 107 primary total knee arthroplasties. Knee. 2014;21(1):147-150.
18. Lygre SH, Espehaug B, Havelin LI, Vollset SE, Furnes O. Failure of total knee arthroplasty with or without patella resurfacing. A study from the Norwegian Arthroplasty Register with 0-15 years of follow-up. Acta Orthop. 2011;82(3):282-292.
19. Post M, Telfer MC. Surgery in hemophilic patients. J Bone Joint Surg Am. 1975;57(8):1136-1145.
20. Diduch DR, Insall JN, Scott WN, Scuderi GR, Font-Rodriguez D. Total knee replacement in young, active patients. Long-term follow-up and functional outcome. J Bone Joint Surg Am. 1997;79(4):575-582.
21. Lonner JH, Hershman S, Mont M, Lotke PA. Total knee arthroplasty in patients 40 years of age and younger with osteoarthritis. Clin Orthop Relat Res. 2000;(380):85-90.
22. Duffy GP, Crowder AR, Trousdale RR, Berry DJ. Cemented total knee arthroplasty using a modern prosthesis in young patients with osteoarthritis. J Arthroplasty. 2007;22(6 suppl 2):67-70.
23. Chiang CC, Chen PQ, Shen MC, Tsai W. Total knee arthroplasty for severe haemophilic arthropathy: long-term experience in Taiwan. Haemophilia. 2008;14(4):828-834.
24. Solimeno LP, Mancuso ME, Pasta G, Santagostino E, Perfetto S, Mannucci PM. Factors influencing the long-term outcome of primary total knee replacement in haemophiliacs: a review of 116 procedures at a single institution. Br J Haematol. 2009;145(2):227-234.
25. Jämsen E, Varonen M, Huhtala H, et al. Incidence of prosthetic joint infections after primary knee arthroplasty. J Arthroplasty. 2010;25(1):87-92.
26. Ragni MV, Crossett LS, Herndon JH. Postoperative infection following orthopaedic surgery in human immunodeficiency virus–infected hemophiliacs with CD4 counts < or = 200/mm3. J Arthroplasty. 1995;10(6):716-721.
27. Hicks JL, Ribbans WJ, Buzzard B, et al. Infected joint replacements in HIV-positive patients with haemophilia. J Bone Joint Surg Br. 2001;83(7):1050-1054.
28. Figgie MP, Goldberg VM, Figgie HE 3rd, Heiple KG, Sobel M. Total knee arthroplasty for the treatment of chronic hemophilic arthropathy. Clin Orthop Relat Res. 1989;(248):98-107.

Effects of Tranexamic Acid Cytotoxicity on In Vitro Chondrocytes
For decades, tranexamic acid (TXA) has been used off-label to reduce perioperative blood loss in various surgical procedures, including orthopedic surgery, neurosurgery, urologic surgery, obstetrics and gynecology, and trauma surgery.1 TXA, a synthetic derivative of the amino acid lysine, produces antifibrinolytic activity by competitively inhibiting lysine-binding sites on plasminogen molecules—inhibiting the activation of plasmin and thus preserving the function of fibrin in clot formation. It is believed that, through this method, TXA retains blood clots more effectively, thereby reducing bleeding. Although intravenous delivery of TXA is generally accepted as safe, some studies have indicated that it may contribute to postoperative seizure activity as well as increased thromboembolic events.2,3 For these and other reasons, interest in topical (intra-articular) administration of TXA has increased.
Use of topical TXA in surgery has been expanding over the past several years, with reports of significant reductions in perioperative blood loss and transfusion requirements.4 Orthopedic surgeons specifically have explored the topical use of TXA, especially in total joint arthroplasty (TJA).5 The benefits are increased concentration at the operative site with reduced systemic exposure; cost reduction; and surgeon control.6,7 Several recent studies have yielded significant reductions in perioperative blood loss and transfusions with use of topical TXA.8-10 In the literature, effective dosing for topical TXA in TJA ranges from 250 mg to 3 g.11 The concentration of topical TXA is not consistently described but appears to fall between 15 and 100 mg/mL.12,13 Our institutions14 and several investigators15,16 have used topical TXA in TJA at a concentration of 100 mg/mL, so this was the initial TXA concentration we decided to study. We selected certain time points to allow for relatively early detection of cartilage damage and then followed it to 48 hours of exposure. In cases in which TXA is injected after capsular closure, it is unclear how rapidly the TXA diffuses out of the joint or to what degree it becomes diluted by bleeding or synovial fluid. Certainly, this varies from patient to patient. Clearly, TXA generally passes through the body unmodified when injected intravenously1 and therefore is unlikely to be chemically modified while in the joint.
Very little has been published on use of topical TXA in other orthopedic surgeries, such as intra-articular fracture fixation, ligament reconstruction, hemiarthroplasty, and unicompartmental arthroplasty. Unlike TJA, which removes all native cartilage, these procedures retain and depend on the viability of the native cartilage. Sitek and colleagues17 noted the effect of TXA on chondrocytes within the context of creating an extracellular fibrin matrix for chondrocyte transplant. There was no decrease in chondrocyte viability with TXA 10 mg/mL or 20 mg/mL. Use of fresh bovine cartilage explants as a model for the in vitro study of cartilage damage is well established, including chondrocyte viability and glycosaminoglycan (GAG) release as outcome measures.18,19 Human cartilage has also been studied in vitro using this model.20
In the present study, the primary goal was to test the hypothesis that TXA could be safely used in the presence of native cartilage. The secondary goal was to identify a safe concentration for intra-articular use if toxic characteristics were noted.
Materials and Methods
Young bovine stifle joints were obtained within 3 hours of slaughter at a local abattoir. The joint was disarticulated under sterile conditions, and the distal femoral articular surface was evaluated for any signs of damage or arthritis. All specimens contained healthy, undamaged articular surfaces. Full-thickness cartilage explants (excluding subchondral bone) were then immediately harvested—with use of a scalpel blade and a dermatologic biopsy punch 4 mm in diameter—from the distal, weight-bearing femur. The explants were placed in 24-well tissue-culture plates (USA Scientific), incubated in culture media (high-glucose Dulbecco’s Modified Eagle Medium, 10% fetal bovine serum, 1% penicillin/streptomycin, 1% fungizone; Life Technologies), and kept at 37°C and 5% CO2. Explants were allowed to rest in culture media for a minimum of 24 hours after harvest. The pH of the medium was not altered by the addition of TXA.
Bovine explants were randomly assigned to either TXA-exposure or control groups at several time points in replicates of 6. Culture medium was aspirated, and each explant was washed twice with sterile phosphate-buffered saline (PBS). Explants were then incubated at 37°C in culture medium as previously described, or in the same culture medium containing dissolved TXA at a concentration of 100 mg/mL. The explants were incubated at 37°C until harvest at 8, 24, or 48 hours after media addition. For harvest, the media were aspirated and stored at –20°C for GAG content analysis, and the explants were then harvested for LIVE/DEAD assay (Life Technologies) and GAG content analysis.
Explants were washed once in 75% ethanol and then digested in 0.5 mL papain digestion buffer (100 mM sodium phosphate, 10 mM EDTA, 10 mM L-cysteine, 0.125 mg/mL papain; Sigma-Aldrich) at 60°C for 24 hours. Digested samples were then diluted and subjected to GAG analysis.
Murine chondrocytes were harvested from the freshly harvested rib cages and sternums of mice (1-4 days old) as previously described.21 In brief, rib cages were washed twice in D-PBS and then incubated at 37°C for 60 min in 5 mL of 0.25% Trypsin-EDTA (Life Technologies). They were then washed in DMEM with 10% FBS, centrifuged at 1500 rpm for 5 min to remove the supernatant, and washed in sterile PBS. After removal of the PBS wash, the ribs were incubated in 2 mg/mL hyaluronidase in plain DMEM on a shaker at 37°C for 2 hours. Once soft tissue was removed, the rib cages were discarded, and the remaining soft tissue was incubated in a collagenase D/hyaluronidase digestion solution (collagenase D, 1 mg/mL; hyaluronidase, 1 mg/mL; BSA, 40 mg/mL in plain DMEM; Life Technologies) for 8 hours. The resultant cell suspension was filtered through a 40-µm cell strainer (BD Falcon). Isolated chondrocytes were then plated on culture slides (0.5×x106 cells; BD Falcon) and incubated in DMEM/F12 (1:1) complete media at 37°C and 5% CO2. Before experimental treatment, all cultures were visualized under phase microscopy to verify viability and morphology.
Murine chondrocytes were incubated in media (described above) containing TXA 0, 25, 50, or 100 mg/mL and were harvested 8, 24, or 48 hours after initial exposure. Cultures were maintained at 37°C and 5% CO2 until harvest. Culture medium was aspirated, and each sample was washed twice in sterile PBS before analysis with the LIVE/DEAD assay.
The amount of GAG released into the culture media was measured with a 1,9-dimethyl-methylene blue colorimetric assay (DMMB; 38.5 µM 1,9-dimethylmethylene blue, 40 mM glycine, 40.5 mM sodium chloride, 9.5 mM hydrochloric acid; Sigma-Aldrich) based on the method of Farndale and colleagues.22 In brief, 20 µL of media was mixed with the DMMB assay solution in a 96-well plate, and absorbance was read immediately at 530 nm on a microplate reader. Chondroitin 4-sulfate was used to produce a standard curve. Total GAG released into the media was then calculated based on the standard curve and calculated as a percentage of the total GAG content of each explant. Each sample time point and concentration had a replicate of 3.
Chondrocyte viability was assessed with use of the LIVE/DEAD Viability/Cytotoxicity Kit (Life Technologies) following the protocol. Cartilage explants were sectioned orthogonally to the articular surface at 100 µm per section. Four sections were obtained from each explant. Sections were then incubated in 60 µL of 1-µM calcein AM/1-µM ethidium homodimer-1 solution at room temperature in the dark for 30 minutes. Sections were then viewed with a fluorescent microscope, and 3 digital photographs (magnification ×4) were taken per sample with use of a fluorescein filter and a Texas red filter. The live and dead cells in an area were quantified with use of ImageJ, freely available image analysis software.23 This software was verified initially by blinded, manual count for accuracy. Each sample time point and concentration had a replicate of 3 or 4 explants.
Chondrocyte viability was assessed with the LIVE/DEAD Viability/Cytotoxicity Kit following the protocol. Slides were incubated in 200 µL of 1-µM calcein AM/1-µM ethidium homodimer-1 solution at 37°C in the dark for 30 minutes. Sections were then viewed with a fluorescent microscope, and 4 digital photographs (magnification ×4) were taken with use of a fluorescein filter and a Texas red filter. Live and dead cells in an area were quantified with use of ImageJ. Each sample time point and concentration had a replicate of 4 plates.
Statistical analyses were performed in the statistical environment R.24 Data were analyzed with a 2-tailed Student t test with Holm-Bonferroni correction made for multiple comparisons, and a family-wise error rate was set at α = 0.05.
Results
GAG release was notably higher in the explants exposed to TXA 100 mg/mL at all time points (Figure 1). Beginning 8 hours after initial incubation, there was a small but significant (P = .01) loss of GAG in TXA-treated explants (mean, 1.86%; SD, 0.44%) versus control explants (mean, 0.31%; SD, 0.24%). There was a trend of increasing loss with increasing time after initial incubation through 24 hours, GAG (mean, 3.92%; SD, 0.83%) versus control (mean, 1.63%; SD, 0.65%) (P = .02), reaching a peak at 48 hours, GAG (mean, 8.29%; SD, 1.82%) versus control (mean, 3.19%; SD, 0.53%) (P = .03).
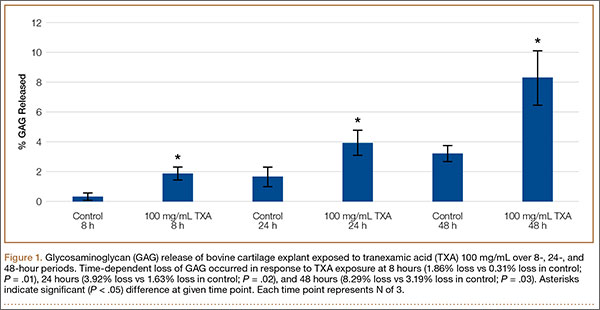
Cell viability was notably higher in the control groups 24 and 48 hours after initial incubation (Figure 2), with a visually observable (Figure 3) but variable and nonsignificant (P = .33) difference in viability at 8 hours, control (mean, 63.87%; SD, 13.63%) versus TXA (mean, 46.08%; SD, 22.51%). As incubation time increased from 8 hours, there were significant decreases in cell viability at 24 hours (mean, 39.28%; SD, 4.12%; P = .024) and 48 hours (mean, 21.98%; SD, 2.15%; P = .0005) relative to controls.
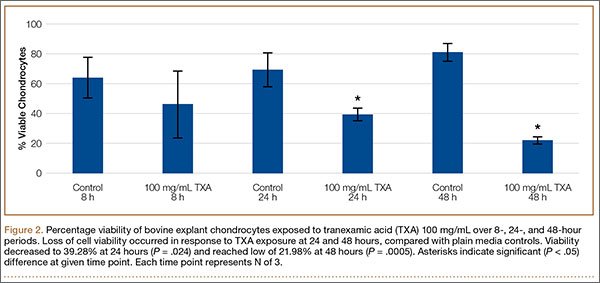
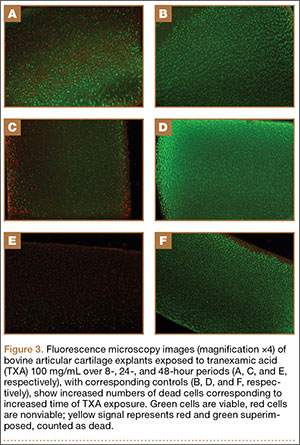
After results of exposing murine cells to TXA at different concentrations were obtained, bovine explants were exposed to TXA 25 mg/mL, and viability was recorded 24 and 48 hours after exposure (Figure 4). There was no significant difference in viability between samples.
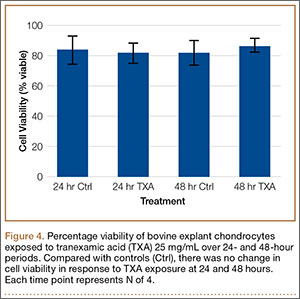
Cell viability was similar between the TXA 25 mg/mL and control samples at all time points (Figure 5). The TXA 50 mg/mL sample dropped from 66.51% viability at 8 hours to 6.81% viability at 24 hours and complete cell death by 48 hours. The TXA 100 mg/mL samples had no observable viable cells at 8, 24, and 48 hours (Figure 6, confirmed with light microscopy). The TXA 0 mg/mL and 25 mg/mL samples remained largely unchanged: 78.28% and 92.99% viable at 8 hours, 97.29% and 90.22% viable at 24 hours, and 91.62% and 91.35% viable at 48 hours, respectively. See Figures 4 and 5 for viability at all time points and concentrations. Statistical analyses were not performed on these data because the zero values obtained for all samples incubated in TXA 100 mg/mL and the 48-hour TXA 50 mg/mL samples prevented accurate estimation of P values and thus meaningful comparisons of the treatment groups.
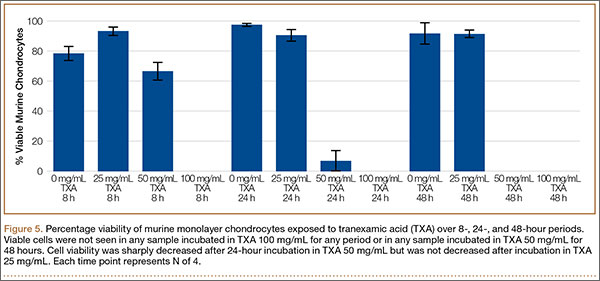
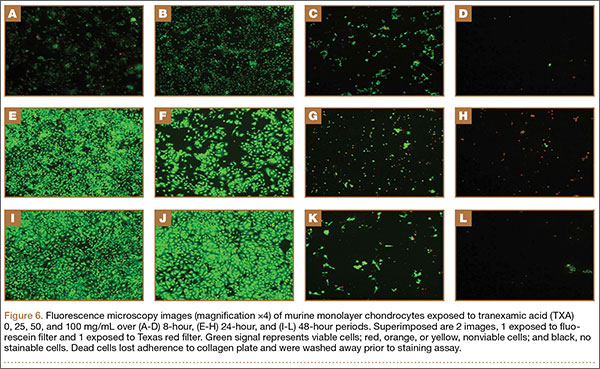
Discussion
The results of this study showed that TXA is cytotoxic to both bovine and murine chondrocytes at a concentration of 100 mg/mL. There is a time-dependent increase in GAG release as well as a decrease in chondrocyte viability in intact bovine cartilage. These data suggest that topical or intra-articular administration of TXA at this concentration in the setting of native cartilage may have unintended, detrimental effects.
Murine chondrocyte monolayer cultures exposed to TXA at lower concentrations did not exhibit a concentration-dependent curve with respect to viability. Chondrocytes exposed to TXA 25 mg/mL had no reduction in viability relative to control samples. When the concentration was doubled to 50 mg/mL, however, viability was reduced to 6.81% by 24 hours (Figure 5). These data suggest that, between 25 mg/mL and 50 mg/mL, there is a concentration at which TXA becomes cytotoxic to murine chondrocytes. It should be cautioned that, though TXA was cytotoxic to chondrocytes in this study, the effects are still unknown and indeed may be similar to effects on other types of cells that are present in a replaced joint—such as synovial cells, inflammatory cells, and osteoblasts.
The unaffected viability of murine chondrocytes with TXA 25 mg/mL indicated that this may be a cutoff concentration for safety in the presence of cartilage. To confirm these results, we exposed the bovine explants to TXA 25 mg/mL as well. Consistent with the prior study, chondrocyte viability was unaffected at 48 hours. Some clinical studies have effectively used topical TXA at this concentration, or at a lower concentration, to reduce blood loss in TJA,25 which suggests that 25 mg/mL may be a safe yet effective dose for clinical use of topical TXA.
As the methods used in this study did not distinguish between late-apoptotic and necrotic cell death, we could not determine which mechanism of death led to the viability loss observed. If apoptosis is occurring, how TXA initiates this sequence is unclear. There have been no studies directly linking TXA to apoptotic events, though some studies have indicated that TXA interacts with several molecules other than plasminogen, including GABA (γ-aminobutyric acid) receptors, glycine receptors, and tachykinin neurokinin 1 receptors.26-28 According to these studies, these interactions may be responsible for seizure activity and increased emesis caused by TXA use. In addition, TXA-containing compounds, such as trans-aminomethylcyclohexanecarbonyl-l-(O-picolyl)tyrosine-octylamide, have been shown to induce apoptosis.29
It appears that the extracellular matrix (ECM) of native cartilage explants has a protective effect on chondrocytes. With exposure to TXA 100 mg/mL, the explants retained 52% viability at 24 hours, whereas the monolayer cultures were nonviable at that point. The weak negative charge of the molecule may retard its penetration into the ECM, though there was an inconsistent presentation of cell death at explant superficial zones in treated samples (Figure 3). Consistent surface layer cell death would be expected if slowed penetration were the only protective mechanism. It is possible that the ECM acts as a buffer or solvent, effectively reducing the concentration of TXA directly interacting with the chondrocytes. Further exploration is needed to elucidate the significance of the ECM in protecting chondrocytes from TXA.
Although its findings were highly reproducible, the present study had several limitations, including its in vitro nature and its use of a bovine and murine model rather than a human cell and tissue platform. It may be prudent to expose chondrocytes to TXA for a shorter time to try to mimic what theoretically occurs in vivo. In vivo studies may be a reasonable direction for experimentation. Clarifying the mechanism of cell death is of experimental interest as well. As the first of its kind, the present study provides an important initial database for exploration.
This study is the first to show that TXA has a cytotoxic effect on chondrocytes and that it damages cartilage at clinically used concentrations. Although more studies are needed to verify a safe concentration of TXA for topical use with human cartilage, our data indicate that TXA 25 mg/mL may be an effective yet safe dose for intra-articular use in native joints.
1. McCormack PL. Tranexamic acid: a review of its use in the treatment of hyperfibrinolysis. Drugs. 2012;72(5):585-617.
2. Murkin JM, Falter F, Granton J, Young B, Burt C, Chu M. High-dose tranexamic acid is associated with nonischemic clinical seizures in cardiac surgical patients. Anesth Analg. 2010;110(2):350-353.
3. Morrison JJ, Dubose JJ, Rasmussen TE, Midwinter MJ. Military Application of Tranexamic Acid in Trauma Emergency Resuscitation (MATTERs) study. Arch Surg. 2012;147(2):113-119.
4. Ker K, Prieto‐Merino D, Roberts I. Systematic review, meta‐analysis and meta‐regression of the effect of tranexamic acid on surgical blood loss. Br J Surg. 2013;100(10):1271-1279.
5. Panteli M, Papakostidis C, Dahabreh Z, Giannoudis PV. Topical tranexamic acid in total knee replacement: a systematic review and meta-analysis. Knee. 2013;20(5):300-309.
6. Alshryda S, Mason J, Vaghela M, et al. Topical (intra-articular) tranexamic acid reduces blood loss and transfusion rates following total knee replacement: a randomized controlled trial (TRANX-K). J Bone Joint Surg Am. 2013;95(21):1961-1968.
7. Alshryda S, Mason J, Sarda P, et al. Topical (intra-articular) tranexamic acid reduces blood loss and transfusion rates following total hip replacement: a randomized controlled trial (TRANX-H). J Bone Joint Surg Am. 2013;95(21):1969-1974.
8. Konig G, Hamlin BR, Waters JH. Topical tranexamic acid reduces blood loss and transfusion rates in total hip and total knee arthroplasty. J Arthroplasty. 2013;28(9):1473-1476.
9. Lee SH, Cho KY, Khurana S, Kim KI. Less blood loss under concomitant administration of tranexamic acid and indirect factor Xa inhibitor following total knee arthroplasty: a prospective randomized controlled trial. Knee Surg Sports Traumatol Arthrosc. 2013;21(11):2611-2617.
10. Chimento GF, Huff T, Ochsner JL Jr, Meyer M, Brandner L, Babin S. An evaluation of the use of topical tranexamic acid in total knee arthroplasty. J Arthroplasty. 2013;28(8 suppl):74-77.
11. Aguilera-Roig X, Jordán-Sales M, Natera-Cisneros L, Monllau-García JC, Martínez-Zapata MJ. Tranexamic acid in orthopedic surgery [in Spanish]. Rev Esp Cir Ortop Traumatol. 2014;58(1):52-56.
12. Wong J, Abrishami A, El Beheiry H, et al. Topical application of tranexamic acid reduces postoperative blood loss in total knee arthroplasty: a randomized, controlled trial. J Bone Joint Surg Am. 2010;92(15):2503-2513.
13. Georgiadis AG, Muh SJ, Silverton CD, Weir RM, Laker MW. A prospective double-blind placebo controlled trial of topical tranexamic acid in total knee arthroplasty. J Arthroplasty. 2013;28(8 suppl):78-82.
14. Tuttle JR, Ritterman SA, Cassidy DB, Anazonwu WA, Froehlich JA, Rubin LE. Cost benefit analysis of topical tranexamic acid in primary total hip and knee arthroplasty. J Arthroplasty. 2014;29(8):1512-1515.
15. Roy SP, Tanki UF, Dutta A, Jain SK, Nagi ON. Efficacy of intra-articular tranexamic acid in blood loss reduction following primary unilateral total knee arthroplasty. Knee Surg Sports Traumatol Arthrosc. 2012;20(12):2494-2501.
16. Ishida K, Tsumura N, Kitagawa A, et al. Intra-articular injection of tranexamic acid reduces not only blood loss but also knee joint swelling after total knee arthroplasty. Int Orthop. 2011;35(11):1639-1645.
17. Sitek P, Wysocka-Wycisk A, Kępski F, Król D, Bursig H, Dyląg S. PRP-fibrinogen gel-like chondrocyte carrier stabilized by TXA-preliminary study. Cell Tissue Bank. 2013;14(1):133-140.
18. Lo IK, Sciore P, Chung M, et al. Local anesthetics induce chondrocyte death in bovine articular cartilage disks in a dose- and duration-dependent manner. Arthroscopy. 2009;25(7):707-715.
19. Blumberg TJ, Natoli RM, Athanasiou KA. Effects of doxycycline on articular cartilage GAG release and mechanical properties following impact. Biotechnol Bioeng. 2008;100(3):506-515.
20. Piper SL, Kim HT. Comparison of ropivacaine and bupivacaine toxicity in human articular chondrocytes. J Bone Joint Surg Am. 2008;90(5):986-991.
21. Lefebvre V, Garofalo S, Zhou G, Metsäranta M, Vuorio E, De Crombrugghe B. Characterization of primary cultures of chondrocytes from type II collagen/beta-galactosidase transgenic mice. Matrix Biol. 1994;14(4):329-335.
22. Farndale RW, Buttle DJ, Barrett AJ. Improved quantitation and discrimination of sulphated glycosaminoglycans by use of dimethylmethylene blue. Biochim Biophys Acta. 1986;833(2):173-177.
23. Schneider CA, Rasband WS, Eliceiri KW. NIH Image to ImageJ: 25 years of image analysis. Nat Methods. 2012;9(7):671-675.
24. R Development Core Team. R: A Language and Environment for Statistical Computing. Vienna, Austria: R Foundation for Statistical Computing; 2008.
25. Sa-Ngasoongsong P, Channoom T, Kawinwonggowit V, et al. Postoperative blood loss reduction in computer-assisted surgery total knee replacement by low dose intra-articular tranexamic acid injection together with 2-hour clamp drain: a prospective triple-blinded randomized controlled trial. Orthop Rev. 2011;3(2):e12.
26. Lecker I, Wang DS, Romaschin AD, Peterson M, Mazer CD, Orser BA. Tranexamic acid concentrations associated with human seizures inhibit glycine receptors. J Clin Invest. 2012;122(12):4654-4666.
27. Kakiuchi H, Kawarai-Shimamura A, Kuwagata M, Orito K. Tranexamic acid induces kaolin intake stimulating a pathway involving tachykinin neurokinin 1 receptors in rats. Eur J Pharmacol. 2014;723:1-6.
28. Kratzer S, Irl H, Mattusch C, et al. Tranexamic acid impairs γ-aminobutyric acid receptor type A–mediated synaptic transmission in the murine amygdala: a potential mechanism for drug-induced seizures? Anesthesiology. 2014;120(3):639-649.
29. Lee E, Enomoto R, Takemura K, Tsuda Y, Okada Y. A selective plasmin inhibitor, trans-aminomethylcyclohexanecarbonyl-L-(O-picolyl)tyrosine-octylamide (YO-2), induces thymocyte apoptosis. Biochem Pharmacol. 2002;63(7):1315-1323.
For decades, tranexamic acid (TXA) has been used off-label to reduce perioperative blood loss in various surgical procedures, including orthopedic surgery, neurosurgery, urologic surgery, obstetrics and gynecology, and trauma surgery.1 TXA, a synthetic derivative of the amino acid lysine, produces antifibrinolytic activity by competitively inhibiting lysine-binding sites on plasminogen molecules—inhibiting the activation of plasmin and thus preserving the function of fibrin in clot formation. It is believed that, through this method, TXA retains blood clots more effectively, thereby reducing bleeding. Although intravenous delivery of TXA is generally accepted as safe, some studies have indicated that it may contribute to postoperative seizure activity as well as increased thromboembolic events.2,3 For these and other reasons, interest in topical (intra-articular) administration of TXA has increased.
Use of topical TXA in surgery has been expanding over the past several years, with reports of significant reductions in perioperative blood loss and transfusion requirements.4 Orthopedic surgeons specifically have explored the topical use of TXA, especially in total joint arthroplasty (TJA).5 The benefits are increased concentration at the operative site with reduced systemic exposure; cost reduction; and surgeon control.6,7 Several recent studies have yielded significant reductions in perioperative blood loss and transfusions with use of topical TXA.8-10 In the literature, effective dosing for topical TXA in TJA ranges from 250 mg to 3 g.11 The concentration of topical TXA is not consistently described but appears to fall between 15 and 100 mg/mL.12,13 Our institutions14 and several investigators15,16 have used topical TXA in TJA at a concentration of 100 mg/mL, so this was the initial TXA concentration we decided to study. We selected certain time points to allow for relatively early detection of cartilage damage and then followed it to 48 hours of exposure. In cases in which TXA is injected after capsular closure, it is unclear how rapidly the TXA diffuses out of the joint or to what degree it becomes diluted by bleeding or synovial fluid. Certainly, this varies from patient to patient. Clearly, TXA generally passes through the body unmodified when injected intravenously1 and therefore is unlikely to be chemically modified while in the joint.
Very little has been published on use of topical TXA in other orthopedic surgeries, such as intra-articular fracture fixation, ligament reconstruction, hemiarthroplasty, and unicompartmental arthroplasty. Unlike TJA, which removes all native cartilage, these procedures retain and depend on the viability of the native cartilage. Sitek and colleagues17 noted the effect of TXA on chondrocytes within the context of creating an extracellular fibrin matrix for chondrocyte transplant. There was no decrease in chondrocyte viability with TXA 10 mg/mL or 20 mg/mL. Use of fresh bovine cartilage explants as a model for the in vitro study of cartilage damage is well established, including chondrocyte viability and glycosaminoglycan (GAG) release as outcome measures.18,19 Human cartilage has also been studied in vitro using this model.20
In the present study, the primary goal was to test the hypothesis that TXA could be safely used in the presence of native cartilage. The secondary goal was to identify a safe concentration for intra-articular use if toxic characteristics were noted.
Materials and Methods
Young bovine stifle joints were obtained within 3 hours of slaughter at a local abattoir. The joint was disarticulated under sterile conditions, and the distal femoral articular surface was evaluated for any signs of damage or arthritis. All specimens contained healthy, undamaged articular surfaces. Full-thickness cartilage explants (excluding subchondral bone) were then immediately harvested—with use of a scalpel blade and a dermatologic biopsy punch 4 mm in diameter—from the distal, weight-bearing femur. The explants were placed in 24-well tissue-culture plates (USA Scientific), incubated in culture media (high-glucose Dulbecco’s Modified Eagle Medium, 10% fetal bovine serum, 1% penicillin/streptomycin, 1% fungizone; Life Technologies), and kept at 37°C and 5% CO2. Explants were allowed to rest in culture media for a minimum of 24 hours after harvest. The pH of the medium was not altered by the addition of TXA.
Bovine explants were randomly assigned to either TXA-exposure or control groups at several time points in replicates of 6. Culture medium was aspirated, and each explant was washed twice with sterile phosphate-buffered saline (PBS). Explants were then incubated at 37°C in culture medium as previously described, or in the same culture medium containing dissolved TXA at a concentration of 100 mg/mL. The explants were incubated at 37°C until harvest at 8, 24, or 48 hours after media addition. For harvest, the media were aspirated and stored at –20°C for GAG content analysis, and the explants were then harvested for LIVE/DEAD assay (Life Technologies) and GAG content analysis.
Explants were washed once in 75% ethanol and then digested in 0.5 mL papain digestion buffer (100 mM sodium phosphate, 10 mM EDTA, 10 mM L-cysteine, 0.125 mg/mL papain; Sigma-Aldrich) at 60°C for 24 hours. Digested samples were then diluted and subjected to GAG analysis.
Murine chondrocytes were harvested from the freshly harvested rib cages and sternums of mice (1-4 days old) as previously described.21 In brief, rib cages were washed twice in D-PBS and then incubated at 37°C for 60 min in 5 mL of 0.25% Trypsin-EDTA (Life Technologies). They were then washed in DMEM with 10% FBS, centrifuged at 1500 rpm for 5 min to remove the supernatant, and washed in sterile PBS. After removal of the PBS wash, the ribs were incubated in 2 mg/mL hyaluronidase in plain DMEM on a shaker at 37°C for 2 hours. Once soft tissue was removed, the rib cages were discarded, and the remaining soft tissue was incubated in a collagenase D/hyaluronidase digestion solution (collagenase D, 1 mg/mL; hyaluronidase, 1 mg/mL; BSA, 40 mg/mL in plain DMEM; Life Technologies) for 8 hours. The resultant cell suspension was filtered through a 40-µm cell strainer (BD Falcon). Isolated chondrocytes were then plated on culture slides (0.5×x106 cells; BD Falcon) and incubated in DMEM/F12 (1:1) complete media at 37°C and 5% CO2. Before experimental treatment, all cultures were visualized under phase microscopy to verify viability and morphology.
Murine chondrocytes were incubated in media (described above) containing TXA 0, 25, 50, or 100 mg/mL and were harvested 8, 24, or 48 hours after initial exposure. Cultures were maintained at 37°C and 5% CO2 until harvest. Culture medium was aspirated, and each sample was washed twice in sterile PBS before analysis with the LIVE/DEAD assay.
The amount of GAG released into the culture media was measured with a 1,9-dimethyl-methylene blue colorimetric assay (DMMB; 38.5 µM 1,9-dimethylmethylene blue, 40 mM glycine, 40.5 mM sodium chloride, 9.5 mM hydrochloric acid; Sigma-Aldrich) based on the method of Farndale and colleagues.22 In brief, 20 µL of media was mixed with the DMMB assay solution in a 96-well plate, and absorbance was read immediately at 530 nm on a microplate reader. Chondroitin 4-sulfate was used to produce a standard curve. Total GAG released into the media was then calculated based on the standard curve and calculated as a percentage of the total GAG content of each explant. Each sample time point and concentration had a replicate of 3.
Chondrocyte viability was assessed with use of the LIVE/DEAD Viability/Cytotoxicity Kit (Life Technologies) following the protocol. Cartilage explants were sectioned orthogonally to the articular surface at 100 µm per section. Four sections were obtained from each explant. Sections were then incubated in 60 µL of 1-µM calcein AM/1-µM ethidium homodimer-1 solution at room temperature in the dark for 30 minutes. Sections were then viewed with a fluorescent microscope, and 3 digital photographs (magnification ×4) were taken per sample with use of a fluorescein filter and a Texas red filter. The live and dead cells in an area were quantified with use of ImageJ, freely available image analysis software.23 This software was verified initially by blinded, manual count for accuracy. Each sample time point and concentration had a replicate of 3 or 4 explants.
Chondrocyte viability was assessed with the LIVE/DEAD Viability/Cytotoxicity Kit following the protocol. Slides were incubated in 200 µL of 1-µM calcein AM/1-µM ethidium homodimer-1 solution at 37°C in the dark for 30 minutes. Sections were then viewed with a fluorescent microscope, and 4 digital photographs (magnification ×4) were taken with use of a fluorescein filter and a Texas red filter. Live and dead cells in an area were quantified with use of ImageJ. Each sample time point and concentration had a replicate of 4 plates.
Statistical analyses were performed in the statistical environment R.24 Data were analyzed with a 2-tailed Student t test with Holm-Bonferroni correction made for multiple comparisons, and a family-wise error rate was set at α = 0.05.
Results
GAG release was notably higher in the explants exposed to TXA 100 mg/mL at all time points (Figure 1). Beginning 8 hours after initial incubation, there was a small but significant (P = .01) loss of GAG in TXA-treated explants (mean, 1.86%; SD, 0.44%) versus control explants (mean, 0.31%; SD, 0.24%). There was a trend of increasing loss with increasing time after initial incubation through 24 hours, GAG (mean, 3.92%; SD, 0.83%) versus control (mean, 1.63%; SD, 0.65%) (P = .02), reaching a peak at 48 hours, GAG (mean, 8.29%; SD, 1.82%) versus control (mean, 3.19%; SD, 0.53%) (P = .03).
Cell viability was notably higher in the control groups 24 and 48 hours after initial incubation (Figure 2), with a visually observable (Figure 3) but variable and nonsignificant (P = .33) difference in viability at 8 hours, control (mean, 63.87%; SD, 13.63%) versus TXA (mean, 46.08%; SD, 22.51%). As incubation time increased from 8 hours, there were significant decreases in cell viability at 24 hours (mean, 39.28%; SD, 4.12%; P = .024) and 48 hours (mean, 21.98%; SD, 2.15%; P = .0005) relative to controls.
After results of exposing murine cells to TXA at different concentrations were obtained, bovine explants were exposed to TXA 25 mg/mL, and viability was recorded 24 and 48 hours after exposure (Figure 4). There was no significant difference in viability between samples.
Cell viability was similar between the TXA 25 mg/mL and control samples at all time points (Figure 5). The TXA 50 mg/mL sample dropped from 66.51% viability at 8 hours to 6.81% viability at 24 hours and complete cell death by 48 hours. The TXA 100 mg/mL samples had no observable viable cells at 8, 24, and 48 hours (Figure 6, confirmed with light microscopy). The TXA 0 mg/mL and 25 mg/mL samples remained largely unchanged: 78.28% and 92.99% viable at 8 hours, 97.29% and 90.22% viable at 24 hours, and 91.62% and 91.35% viable at 48 hours, respectively. See Figures 4 and 5 for viability at all time points and concentrations. Statistical analyses were not performed on these data because the zero values obtained for all samples incubated in TXA 100 mg/mL and the 48-hour TXA 50 mg/mL samples prevented accurate estimation of P values and thus meaningful comparisons of the treatment groups.
Discussion
The results of this study showed that TXA is cytotoxic to both bovine and murine chondrocytes at a concentration of 100 mg/mL. There is a time-dependent increase in GAG release as well as a decrease in chondrocyte viability in intact bovine cartilage. These data suggest that topical or intra-articular administration of TXA at this concentration in the setting of native cartilage may have unintended, detrimental effects.
Murine chondrocyte monolayer cultures exposed to TXA at lower concentrations did not exhibit a concentration-dependent curve with respect to viability. Chondrocytes exposed to TXA 25 mg/mL had no reduction in viability relative to control samples. When the concentration was doubled to 50 mg/mL, however, viability was reduced to 6.81% by 24 hours (Figure 5). These data suggest that, between 25 mg/mL and 50 mg/mL, there is a concentration at which TXA becomes cytotoxic to murine chondrocytes. It should be cautioned that, though TXA was cytotoxic to chondrocytes in this study, the effects are still unknown and indeed may be similar to effects on other types of cells that are present in a replaced joint—such as synovial cells, inflammatory cells, and osteoblasts.
The unaffected viability of murine chondrocytes with TXA 25 mg/mL indicated that this may be a cutoff concentration for safety in the presence of cartilage. To confirm these results, we exposed the bovine explants to TXA 25 mg/mL as well. Consistent with the prior study, chondrocyte viability was unaffected at 48 hours. Some clinical studies have effectively used topical TXA at this concentration, or at a lower concentration, to reduce blood loss in TJA,25 which suggests that 25 mg/mL may be a safe yet effective dose for clinical use of topical TXA.
As the methods used in this study did not distinguish between late-apoptotic and necrotic cell death, we could not determine which mechanism of death led to the viability loss observed. If apoptosis is occurring, how TXA initiates this sequence is unclear. There have been no studies directly linking TXA to apoptotic events, though some studies have indicated that TXA interacts with several molecules other than plasminogen, including GABA (γ-aminobutyric acid) receptors, glycine receptors, and tachykinin neurokinin 1 receptors.26-28 According to these studies, these interactions may be responsible for seizure activity and increased emesis caused by TXA use. In addition, TXA-containing compounds, such as trans-aminomethylcyclohexanecarbonyl-l-(O-picolyl)tyrosine-octylamide, have been shown to induce apoptosis.29
It appears that the extracellular matrix (ECM) of native cartilage explants has a protective effect on chondrocytes. With exposure to TXA 100 mg/mL, the explants retained 52% viability at 24 hours, whereas the monolayer cultures were nonviable at that point. The weak negative charge of the molecule may retard its penetration into the ECM, though there was an inconsistent presentation of cell death at explant superficial zones in treated samples (Figure 3). Consistent surface layer cell death would be expected if slowed penetration were the only protective mechanism. It is possible that the ECM acts as a buffer or solvent, effectively reducing the concentration of TXA directly interacting with the chondrocytes. Further exploration is needed to elucidate the significance of the ECM in protecting chondrocytes from TXA.
Although its findings were highly reproducible, the present study had several limitations, including its in vitro nature and its use of a bovine and murine model rather than a human cell and tissue platform. It may be prudent to expose chondrocytes to TXA for a shorter time to try to mimic what theoretically occurs in vivo. In vivo studies may be a reasonable direction for experimentation. Clarifying the mechanism of cell death is of experimental interest as well. As the first of its kind, the present study provides an important initial database for exploration.
This study is the first to show that TXA has a cytotoxic effect on chondrocytes and that it damages cartilage at clinically used concentrations. Although more studies are needed to verify a safe concentration of TXA for topical use with human cartilage, our data indicate that TXA 25 mg/mL may be an effective yet safe dose for intra-articular use in native joints.
1. McCormack PL. Tranexamic acid: a review of its use in the treatment of hyperfibrinolysis. Drugs. 2012;72(5):585-617.
2. Murkin JM, Falter F, Granton J, Young B, Burt C, Chu M. High-dose tranexamic acid is associated with nonischemic clinical seizures in cardiac surgical patients. Anesth Analg. 2010;110(2):350-353.
3. Morrison JJ, Dubose JJ, Rasmussen TE, Midwinter MJ. Military Application of Tranexamic Acid in Trauma Emergency Resuscitation (MATTERs) study. Arch Surg. 2012;147(2):113-119.
4. Ker K, Prieto‐Merino D, Roberts I. Systematic review, meta‐analysis and meta‐regression of the effect of tranexamic acid on surgical blood loss. Br J Surg. 2013;100(10):1271-1279.
5. Panteli M, Papakostidis C, Dahabreh Z, Giannoudis PV. Topical tranexamic acid in total knee replacement: a systematic review and meta-analysis. Knee. 2013;20(5):300-309.
6. Alshryda S, Mason J, Vaghela M, et al. Topical (intra-articular) tranexamic acid reduces blood loss and transfusion rates following total knee replacement: a randomized controlled trial (TRANX-K). J Bone Joint Surg Am. 2013;95(21):1961-1968.
7. Alshryda S, Mason J, Sarda P, et al. Topical (intra-articular) tranexamic acid reduces blood loss and transfusion rates following total hip replacement: a randomized controlled trial (TRANX-H). J Bone Joint Surg Am. 2013;95(21):1969-1974.
8. Konig G, Hamlin BR, Waters JH. Topical tranexamic acid reduces blood loss and transfusion rates in total hip and total knee arthroplasty. J Arthroplasty. 2013;28(9):1473-1476.
9. Lee SH, Cho KY, Khurana S, Kim KI. Less blood loss under concomitant administration of tranexamic acid and indirect factor Xa inhibitor following total knee arthroplasty: a prospective randomized controlled trial. Knee Surg Sports Traumatol Arthrosc. 2013;21(11):2611-2617.
10. Chimento GF, Huff T, Ochsner JL Jr, Meyer M, Brandner L, Babin S. An evaluation of the use of topical tranexamic acid in total knee arthroplasty. J Arthroplasty. 2013;28(8 suppl):74-77.
11. Aguilera-Roig X, Jordán-Sales M, Natera-Cisneros L, Monllau-García JC, Martínez-Zapata MJ. Tranexamic acid in orthopedic surgery [in Spanish]. Rev Esp Cir Ortop Traumatol. 2014;58(1):52-56.
12. Wong J, Abrishami A, El Beheiry H, et al. Topical application of tranexamic acid reduces postoperative blood loss in total knee arthroplasty: a randomized, controlled trial. J Bone Joint Surg Am. 2010;92(15):2503-2513.
13. Georgiadis AG, Muh SJ, Silverton CD, Weir RM, Laker MW. A prospective double-blind placebo controlled trial of topical tranexamic acid in total knee arthroplasty. J Arthroplasty. 2013;28(8 suppl):78-82.
14. Tuttle JR, Ritterman SA, Cassidy DB, Anazonwu WA, Froehlich JA, Rubin LE. Cost benefit analysis of topical tranexamic acid in primary total hip and knee arthroplasty. J Arthroplasty. 2014;29(8):1512-1515.
15. Roy SP, Tanki UF, Dutta A, Jain SK, Nagi ON. Efficacy of intra-articular tranexamic acid in blood loss reduction following primary unilateral total knee arthroplasty. Knee Surg Sports Traumatol Arthrosc. 2012;20(12):2494-2501.
16. Ishida K, Tsumura N, Kitagawa A, et al. Intra-articular injection of tranexamic acid reduces not only blood loss but also knee joint swelling after total knee arthroplasty. Int Orthop. 2011;35(11):1639-1645.
17. Sitek P, Wysocka-Wycisk A, Kępski F, Król D, Bursig H, Dyląg S. PRP-fibrinogen gel-like chondrocyte carrier stabilized by TXA-preliminary study. Cell Tissue Bank. 2013;14(1):133-140.
18. Lo IK, Sciore P, Chung M, et al. Local anesthetics induce chondrocyte death in bovine articular cartilage disks in a dose- and duration-dependent manner. Arthroscopy. 2009;25(7):707-715.
19. Blumberg TJ, Natoli RM, Athanasiou KA. Effects of doxycycline on articular cartilage GAG release and mechanical properties following impact. Biotechnol Bioeng. 2008;100(3):506-515.
20. Piper SL, Kim HT. Comparison of ropivacaine and bupivacaine toxicity in human articular chondrocytes. J Bone Joint Surg Am. 2008;90(5):986-991.
21. Lefebvre V, Garofalo S, Zhou G, Metsäranta M, Vuorio E, De Crombrugghe B. Characterization of primary cultures of chondrocytes from type II collagen/beta-galactosidase transgenic mice. Matrix Biol. 1994;14(4):329-335.
22. Farndale RW, Buttle DJ, Barrett AJ. Improved quantitation and discrimination of sulphated glycosaminoglycans by use of dimethylmethylene blue. Biochim Biophys Acta. 1986;833(2):173-177.
23. Schneider CA, Rasband WS, Eliceiri KW. NIH Image to ImageJ: 25 years of image analysis. Nat Methods. 2012;9(7):671-675.
24. R Development Core Team. R: A Language and Environment for Statistical Computing. Vienna, Austria: R Foundation for Statistical Computing; 2008.
25. Sa-Ngasoongsong P, Channoom T, Kawinwonggowit V, et al. Postoperative blood loss reduction in computer-assisted surgery total knee replacement by low dose intra-articular tranexamic acid injection together with 2-hour clamp drain: a prospective triple-blinded randomized controlled trial. Orthop Rev. 2011;3(2):e12.
26. Lecker I, Wang DS, Romaschin AD, Peterson M, Mazer CD, Orser BA. Tranexamic acid concentrations associated with human seizures inhibit glycine receptors. J Clin Invest. 2012;122(12):4654-4666.
27. Kakiuchi H, Kawarai-Shimamura A, Kuwagata M, Orito K. Tranexamic acid induces kaolin intake stimulating a pathway involving tachykinin neurokinin 1 receptors in rats. Eur J Pharmacol. 2014;723:1-6.
28. Kratzer S, Irl H, Mattusch C, et al. Tranexamic acid impairs γ-aminobutyric acid receptor type A–mediated synaptic transmission in the murine amygdala: a potential mechanism for drug-induced seizures? Anesthesiology. 2014;120(3):639-649.
29. Lee E, Enomoto R, Takemura K, Tsuda Y, Okada Y. A selective plasmin inhibitor, trans-aminomethylcyclohexanecarbonyl-L-(O-picolyl)tyrosine-octylamide (YO-2), induces thymocyte apoptosis. Biochem Pharmacol. 2002;63(7):1315-1323.