User login
Assessing Vascular Nursing Experience
Peripherally inserted central catheters (PICCs) are among the most prevalent of venous access devices in hospitalized patients.[1, 2] Although growing use of these devices reflects clinical advantages, such as a reduced risk of complications during insertion and durable venous access, use of PICCs is also likely related to the growth of vascular access nursing.[3, 4] A relatively new specialty, vascular access nurses obtain, maintain, and manage venous access in hospitalized patients.[4, 5] Depending on their scope of practice, these professionals are responsible not only for insertion of devices, such as peripheral intravenous catheters and PICCs, but also nontunneled central venous catheters and arterial catheters in some settings.[6]
Although a growing number of US hospitals have introduced vascular nursing teams,[7] little is known about the experience, practice, knowledge, and beliefs of vascular access nurses. This knowledge gap is relevant for hospitalists and hospital medicine as (1) vascular access nurses increasingly represent a key partner in the care of hospitalized patients; (2) the knowledge and practice of these individuals directly affects patient safety and clinical outcomes; and (3) understanding experience, practice, and beliefs of these specialists can help inform decision making and quality‐improvement efforts related to PICCs. As hospitalists increasingly order the placement of and care for patients with PICCs, they are also well suited to improve PICC practice.
Therefore, we conducted a survey of vascular access nurses employed by hospitals that participate in the Michigan Hospital Medicine Safety (HMS) Consortium, a Blue Cross Blue Shield of Michiganfunded collaborative quality initiative.[6] We aimed to understand experience, practice, knowledge, and beliefs related to PICC care and use.
METHODS
Study Setting and Participants
To quantify vascular nursing experience, practice, knowledge, and beliefs, we conducted a Web‐based survey of vascular nurses across 47 Michigan hospitals that participate in HMS. A statewide quality‐improvement initiative, HMS aims to prevent adverse events in hospitalized medical patients through the creation of a data registry and sharing of best practices. The setting and design of this multicenter initiative have been previously described.[8, 9] Although participation is voluntary, each hospital receives payment for participating in the consortium and for data collection. Because HMS has an ongoing initiative aimed at identifying and preventing PICC‐related complications, this study was particularly relevant for participating hospitals and nurses.
Each HMS site has a designated quality‐improvement lead, physician champion, and data abstractor. To coordinate distribution and dissemination of the survey, we contacted the quality‐improvement leads at each site and enquired whether their hospital employed vascular access nurses who placed PICCs. Because we were only interested in responses from vascular access nurses, HMS hospitals that did not have these providers or stated PICCs were placed by other specialists (eg, interventional radiology) were excluded. At eligible sites, we obtained the total number of vascular nurses employed so as to determine the number of eligible respondents. In this manner, a purposeful sample of vascular nurses at participating HMS hospitals was constituted.
Participation in the survey was solicited through hospital quality leads that either distributed an electronic survey link to vascular nurses at their facilities or sent us individual email addresses to contact them directly. A cover letter explaining the rationale and the purpose of the survey along with the survey link was then sent to respondents through either of these routes. The survey was administered at all HMS sites contemporaneously and kept open for a period of 5 weeks. During the 5‐week period, 2 e‐mail reminders were sent to encourage participation. As a token of appreciation, a $10 Amazon gift card was offered to those who took the survey.
Development and Validation of the Survey
We developed the survey instrument (which we call PICC1 as we hope to administer longitudinally to track changes over time) by first conducting a literature search to identify relevant evidence‐based guidelines and studies regarding vascular access nursing practices and experiences.[10, 11, 12, 13] In addition, we consulted and involved national and international leaders in vascular access nursing to ensure validity and representativeness of the questions posed. We were specifically interested in nursing background, hospital practices, types of PICCs used, use of various technologies, relationships with healthcare providers, and management of complications. To understand participant characteristics and quantify potential variation in responses, we collected basic participant data including demographics, years in practice, number of PICCs placed, leadership roles, and vascular access certification status. Based on clinical reasoning and existing studies,[14, 15] we hypothesized that responses regarding certain practices (ultrasound use, electrocardiography [ECG] guidance system use), management of complications, or perceptions regarding leadership might vary based on years of experience, number of PICCs placed, or certification status. We therefore examined these associations as prespecified subgroup analyses.
The initial survey instrument was pilot tested with vascular nurses outside of the sampling frame. Based on feedback from the pilot testers, the instrument was refined and edited to improve clarity of the questions. In addition, specific skip patterns and logic were programmed into the final survey to reduce respondent burden and allow participants to seamlessly bypass questions that were contingent on a prior response (eg, use of ECG to place PICCs would lead to a series of questions about ECG‐assisted placement only for those respondents who used the technology). This final version of the survey was tested by members of the study team (V.C., L.K., S.L.K.) and then posted to SurveyMonkey for dissemination.
Statistical Analysis
Descriptive statistics (percentage, n/N) were used to tabulate results. In accordance with our a priori hypothesis that variation to responses might be associated with respondent characteristics, responses to questions regarding insertion practice (eg, use of ultrasound, measurement of catheter:vein ratio, trimming of catheters) and approach to complications (eg, catheter occlusion, deep vein thrombosis [DVT] notification, and PICC removal in the setting of fever) were compared by respondent years in practice (dichotomized to <5 vs >5 years), volume of PICCs placed (<999 vs 1000), and certification status (yes/no). Bivariate comparisons were made using 2 or Fisher exact tests based on the number of responses in a cell as appropriate; 2‐sided with a P value <0.05 was considered statistically significant. All statistical analyses were conducted using SAS version 9.3 (SAS Institute, Cary, NC).
Ethical and Regulatory Oversight
Because our study sought to describe existing practice without collecting any individual or facility level identifiable information, the project received a Not Regulated status by the University of Michigan Medical School Institutional Review Board (HUM00088351).
RESULTS
Of 172 vascular nurses who received invitations, 140 completed the survey for a response rate of 81%. Respondents reported working in not‐for‐profit hospitals (36%), academic medical centers (29%), and for‐profit hospitals (21%). Although multiple providers (eg, interventional radiology staff and providers, physicians) placed PICCs, 95% of those surveyed reported that they placed the majority of the PICCs at their institutions. Although most respondents placed PICCs in adult patients (86%), a few also placed PICCs in pediatric populations (17%). Vascular nursing programs were largely housed in their own department, but some reported to general nursing or subspecialties such as interventional radiology, cardiology, and critical care. Most respondents indicated their facilities had written policies regarding standard insertion and care practices (87% and 95%, respectively), but only 30% had policies regarding the necessity or appropriateness of PICCs.
Experience among respondents was variable: approximately a third had placed PICCs for <5 years (28.6%), whereas 58% reported placing PICCs for 5 years Correspondingly, 26% reported having placed 100 to 500 PICCs, whereas 34% had placed 1000 or more PICCs. Only 23% of those surveyed held a dedicated vascular access certification, such as board certified in vascular access or certified registered nurse infusion, whereas 16% indicated that they served as the vascular access lead nurse for their facility. Following placement, 94% of respondents reported that their facilities tracked the number of PICCs inserted, but only 40% indicated that dwell times of devices were also recorded. Only 30% of nurses reported that their hospitals had a written policy to evaluate PICC necessity or appropriateness following placement (Table 1).
| No.* | % | |
|---|---|---|
| ||
| Participant characteristics | ||
| For how many years have you been inserting PICCs? | ||
| <5 years | 40 | 28.6% |
| 5 years | 81 | 57.9% |
| Missing | ||
| In which of the following populations do you insert PICCs? | ||
| Adult patients | 121 | 86.4% |
| Pediatric patients | 24 | 17.1% |
| Neonatal patients | 1 | 0.7% |
| In which of the following locations do you place PICCs? (Select all that apply.) | ||
| Adult medical ward | 115 | 82.1% |
| General adult surgical ward | 110 | 78.6% |
| General pediatric medical ward | 34 | 24.3% |
| General pediatric surgical ward | 24 | 17.1% |
| Adult intensive care unit | 114 | 81.4% |
| Pediatric intensive care unit | 19 | 13.6% |
| Neonatal intensive care unit | 3 | 2.1% |
| Other intensive care unit | 59 | 42.1% |
| Outpatient clinic or emergency department | 17 | 12.1% |
| Other | 10 | 7.1% |
| Approximately how many PICCs may you have placed in your career? | ||
| 099 | 15 | 10.7% |
| 100499 | 36 | 25.7% |
| 500999 | 23 | 16.4% |
| 1,000 | 47 | 33.6% |
| Are you the vascular access lead nurse for your facility or organization? | ||
| Yes | 22 | 15.7% |
| No | 98 | 70.0% |
| Do you currently hold a dedicated vascular access certification (BC‐VA, CRNI, etc.)? | ||
| Yes | 32 | 22.9% |
| No | 89 | 63.6% |
| Facility characteristics | ||
| Which of the following best describes your primary work location? | ||
| Academic medical center | 41 | 29.3% |
| For‐profit community‐based hospital or medical center | 30 | 21.4% |
| Not‐for‐profit community‐based hospital or medical center | 50 | 35.7% |
| Who inserts the most PICCs in your facility? | ||
| Vascular access nurses | 133 | 95.0% |
| Interventional radiology or other providers | 7 | 5.0% |
| In which department is vascular access nursing located? | ||
| Vascular nursing | 76 | 54.3% |
| General nursing | 38 | 27.1% |
| Interventional radiology | 15 | 10.7% |
| Other | 11 | 7.9% |
| Using your best guess, how many PICCs do you think your facility inserts each month? | ||
| <25 | 5 | 3.6% |
| 2549 | 13 | 9.3% |
| 50100 | 39 | 27.9% |
| >100 | 78 | 55.7% |
| Unknown | 2 | 1.4% |
| How many vascular access nurses are employed by your facility? | ||
| <4 | 14 | 10.0% |
| 46 | 33 | 23.6% |
| 79 | 15 | 10.7% |
| 1015 | 25 | 17.9% |
| >15 | 53 | 37.9% |
| Does your facility track the number of PICCs placed? | ||
| Yes | 132 | 94.3% |
| No | 5 | 3.6% |
| Unknown | 3 | 2.1% |
| Does your facility track the duration or dwell time of PICCs? | ||
| Yes | 56 | 40.0% |
| No | 60 | 42.9% |
| Unknown | 24 | 17.1% |
| Does your facility have a written policy regarding standard PICC insertion practices? | ||
| Yes | 122 | 87.1% |
| No | 8 | 5.7% |
| Unknown | 7 | 5.0% |
| Does your facility have a written policy regarding standard PICC care and maintenance? | ||
| Yes | 133 | 95.0% |
| No | 3 | 2.1% |
| Unknown | 1 | 0.7% |
| Does your facility have a written process to review the necessity or appropriateness of a PICC? | ||
| Yes | 42 | 30.0% |
| No | 63 | 45.0% |
| Unknown | 20 | 14.3% |
The most commonly reported indications for PICC placement included intravenous antibiotics at discharge, difficult venous access, and placement for chemotherapy in patients with cancer. Forty‐six percent of nurses indicated they had placed a PICC in a patient receiving some form of dialysis in the past several months; however, 91% of these respondents reported receiving approval from nephrology prior to placement in these patients. Although almost all nurses (91%) used ultrasound to find a suitable vein for PICC placement, a smaller percentage used ultrasound to estimate the catheter‐to‐vein ratio to prevent thrombosis (79%), and only a few (14%) documented this figure in the medical record. Three‐quarters of those surveyed (76%) indicated they used ECG‐based systems to position PICC tips at the cavoatrial junction to prevent thrombosis. Of those who used this technology, 36% still obtained chest x‐rays to verify the position of the PICC tip. According to 84% of respondents, flushing of PICCs was performed mainly by bedside nurses, whereas scheduled weekly dressing changes were most often performed by vascular access nurses (Table 2).
| Question | No. | % |
|---|---|---|
| ||
| Do you use ultrasound to find a suitable vein prior to PICC insertion? | ||
| Yes | 128 | 91.4% |
| No | 0 | 0.0% |
| Do you use ultrasound to estimate the catheter‐to‐vein ratio prior to PICC insertion? | ||
| Yes | 110 | 78.6% |
| No | 18 | 12.9% |
| When using ultrasound, do you document the catheter‐to‐vein ratio in the PICC insertion note? | ||
| Yes | 20 | 14.3% |
| No | 89 | 63.6% |
| Do you use ECG guidance‐assisted systems to place PICCs? | ||
| Yes | 106 | 75.7% |
| No | 21 | 15.0% |
| If using ECG guidance, do you still routinely obtain a chest x‐ray to verify PICC tip position after placing the PICC using ECG guidance? | ||
| Yes | 38 | 27.1% |
| No | 68 | 48.6% |
| Who is primarily responsible for administering and adhering to a flushing protocol after PICC insertion at your facility? | ||
| Bedside nurses | 118 | 83.6% |
| Patients | 1 | 0.7% |
| Vascular access nurses | 8 | 5.7% |
| Which of the following agents are most often used to flush PICCs? | ||
| Both heparin and normal saline flushes | 61 | 43.6% |
| Normal saline only | 63 | 45.0% |
| Heparin only | 3 | 2.1% |
| Who is responsible for scheduled weekly dressing changes for PICCs? | ||
| Vascular access nurses | 110 | 78.6% |
| Bedside nurses | 14 | 10.0% |
| Other (eg, IR staff, ICU staff) | 3 | 2.1% |
| In the past few months, have you placed a PICC in a patient who was receiving a form of dialysis (eg, peritoneal or hemodialysis)? | ||
| Yes | 65 | 46.4% |
| No | 64 | 45.7% |
| If you have placed PICCs in patients on dialysis, do you discuss PICC placement or receive approval from nephrology prior to inserting the PICC? | ||
| Yes | 59 | 90.8% |
| No | 6 | 9.2% |
With respect to complications, catheter occlusion, migration, and DVT were reported as the 3 most prevalent adverse events. Interestingly, respondents did not report central lineassociated bloodstream infection (CLABSI) as a common complication. Additionally, 51% of those surveyed indicated that physicians unnecessarily removed PICCs when CLABSI was suspected but not confirmed. When managing catheter occlusion, 50% of respondents began with normal saline flushes but used tissue‐plasminogen activator if saline failed to resolve occlusion. Management of catheter migration varied based on degree of device movement: when the PICC had migrated <5 cm, most respondents (77%) indicated they would first obtain a chest x‐ray to determine the position of the PICC tip, with few (4%) performing catheter exchange. However, if the PICC had migrated more than 5 cm, a significantly greater proportion of respondents (21%) indicated they would perform a catheter exchange. With regard to managing DVT, most vascular nurses reported they notified nurses and physicians to continue using the PICC but recommended tests to confirm the diagnosis.
To better understand the experiences of vascular nurses, we asked for their perceptions regarding appropriateness of PICC use and relationships with bedside nurses, physicians, and leadership. Over a third of respondents (36%) felt that <5% of all PICCs may be inappropriate in their facility, whereas 1 in 5 indicated that 10% to 24% of PICCs placed in their facilities may be inappropriate or could have been avoided. Almost all (98%) of the nurses stated they were not empowered to remove idle or clinically unnecessary PICCs without physician authorization. Although 51% of nurses described the support received from hospital leadership as excellent, very good, or good, 43% described leadership support as either fair or poor. Conversely, relationships with bedside nurses and physicians were rated as being very good or good by nearly two‐thirds of those surveyed (64% and 65%, respectively) (Table 3).
| Question | No. | % |
|---|---|---|
| ||
| Which of the following PICC‐related complications have you most frequently encountered in your practice? | ||
| Catheter occlusion | 81 | 57.9% |
| Catheter migration | 27 | 19.3% |
| PICC‐associated DVT | 6 | 4.3% |
| Catheter fracture or embolization | 3 | 2.1% |
| Exit site infection | 3 | 2.1% |
| Coiling or kinking after insertion | 2 | 1.4% |
| If you suspect a patient has catheter occlusion, which of the following best describes your approach to resolving this problem? | ||
| Begin with normal saline but use a tPA product if this fails to restore patency | 70 | 50.0% |
| Use a tPA product (eg, Cathflo, Activase, or Retavase) to restore patency | 44 | 31.4% |
| Begin with heparin‐based flushes but use a tPA product if this fails to restore | 7 | 5.0% |
| Use only normal saline flushes to restore patency | 3 | 2.1% |
| If you find a PICC that has migrated out or has been accidentally dislodged <5 cm in a patient without symptoms, and the device is still clinically needed, which of the following best describes your practice? | ||
| Obtain a chest x‐ray to verify tip position | 108 | 77.1% |
| Perform a complete catheter exchange over a guidewire if possible | 5 | 3.6% |
| Notify/discuss next steps with physician | 5 | 3.6% |
| Other | 6 | 4.3% |
| If you find a PICC that has migrated out or has been accidentally dislodged >5 cm in a patient without symptoms, and the device is still clinically needed, which of the following best describes your practice? | ||
| Obtain a chest x‐ray to verify tip position | 72 | 51.4% |
| Perform a catheter exchange over a guidewire if possible | 30 | 21.4% |
| Notify/discuss next steps with physician | 10 | 7.1% |
| Other | 12 | 8.6% |
| Which of the following best describes your first approach when you suspect a patient has PICC‐associated phlebitis? | ||
| Discuss best course of action with physician or nurse | 79 | 56.4% |
| Supportive measures (eg, warm compresses, analgesics, monitoring) | 25 | 17.9% |
| Remove the PICC | 15 | 10.7% |
| Other | 5 | 3.6% |
| Which of the following best describes your first approach when you suspect a patient has a PICC‐related DVT? | ||
| Notify caregivers to continue using PICC and consider tests such as ultrasound | 82 | 58.6% |
| Notify bedside nurse and physician not to continue use of the PICC and consider tests such as ultrasound | 42 | 30.0% |
| PICCs are often removed when physicians suspect, but have not yet confirmed, CLABSI. Considering your experiences, what percentage of PICCs may have been removed in this manner at your facility? | ||
| <5% | 11 | 7.9% |
| 59% | 16 | 11.4% |
| 1024% | 24 | 17.1% |
| 25% | 71 | 50.7% |
| Based on your experience, what percentage of PICCs do you think are inappropriate or could have been avoided at your facility? | ||
| <5% | 51 | 36.4% |
| 59% | 25 | 17.9% |
| 1024% | 28 | 20.0% |
| 2550% | 13 | 9.3% |
| >50% | 5 | 3.6% |
| Are vascular access nurses empowered to remove PICCs that are idle or clinically unnecessary without physician authorization? | ||
| Yes | 3 | 2.1% |
| No | 122 | 87.1% |
| How would you rank the overall support your vascular access service receives from hospital leadership? | ||
| Excellent | 5 | 3.6% |
| Very good | 32 | 22.9% |
| Good | 40 | 28.6% |
| Fair | 35 | 25.0% |
| Poor | 25 | 17.9% |
| How would you describe your relationship with physicians at your facility when it comes to communicating recommendations or management of PICCs? | ||
| Very good | 28 | 20.0% |
| Good | 63 | 45.0% |
| Fair | 35 | 25.0% |
| Poor | 7 | 5.0% |
| Very poor | 4 | 2.9% |
| How would you describe your relationship with bedside nurses at your facility when it comes to communicating recommendations or management of PICCs? | ||
| Very good | 32 | 22.9% |
| Good | 58 | 41.4% |
| Fair | 38 | 27.1% |
| Poor | 7 | 5.0% |
| Very poor | 2 | 1.4% |
Variation in Responses Based on Years in Practice or Certification
We initially hypothesized that responses regarding practice (ultrasound use, ECG guidance system use), management of complications, or perceptions regarding leadership might vary based on years of experience, number of PICCs placed, or certification status. However, no statistically significant associations with these factors and individual responses were identified.
DISCUSSION
In this survey of 140 vascular access nurses in hospitals across Michigan, new insights regarding the experience, practice, knowledge, and beliefs of this group of providers were obtained. We found that vascular access nurses varied with respect to years in practice, volume of PICCs placed, and certification status, reflecting heterogeneity in this provider group. Variation in insertion techniques, such as use of ultrasound to examine catheter‐to‐vein ratio (a key way to prevent thrombosis) or newer ECG technology to position the PICC, was also noted. Although indications for PICC insertion appeared consistent with published literature, the frequency with which these devices were placed in patients receiving dialysis (reportedly with nephrology approval) was surprising given national calls to avoid such use.[16] Opportunities to improve hospital practices, such as tracking PICC dwell times and PICC necessity, as well as the potential need to better educate physicians on when to remove PICCs for suspected CLABSI, were also identified. Collectively, these data are highly relevant to hospitalists and health systems as they help to identify areas for quality improvement and inform clinical practice regarding the use of PICCs in hospitalized patients. As hospitalists increasingly order PICCs and manage complications associated with these devices, they are well suited to use these data so as to improve patient safety and clinical outcomes.
Venous access is the most common medical procedure performed in hospitalized medical patients. Although a number of devices including peripheral intravenous catheters, central venous catheters, and PICCs are used for this purpose, the growing use of PICCs to secure venous access has been documented in several studies.[17] Such growth, in part, undoubtedly reflects increasing availability of vascular access nurses. Traditionally placed by interventional radiologists, the creation of dedicated vascular nursing teams has resulted in these subspecialists now serving in more of a backup or trouble‐shooting role rather than that of primary operator.[4, 14] This paradigm shift is well illustrated in a recent survey of infection preventionists, where over 60% of respondents reported that they had a vascular nursing team in their facility.[7] The growth of these nursing‐led vascular access teams has produced not only high rates of insertion success and low rates of complications, but also greater cost‐effectiveness when compared to interventional radiologybased insertion.[18]
Nonetheless, our survey also identified a number of important concerns regarding PICC practices and vascular nursing providers. First, we found variation in areas such as insertion practices and management of complications. Such variability highlights the importance of both growing and disseminating the evidence base for consistent practice in vascular nursing. Through their close clinical affiliation with vascular nurses and shared interests in obtaining safe and appropriate venous access for patients, hospitalists are ideally poised to lead this effort. Second, similarities between vascular nurse opinions regarding appropriateness of PICCs and those of hospitalists from a prior survey were noted.[19] Namely, a substantial proportion of both vascular nurses and hospitalists felt that some PICCs were inappropriate and could be avoided. Third, although relationships between vascular access nurses and leadership were reported as being variable, the survey responses suggested relatively good interprovider relationships with bedside nurses and physicians. Such relationships likely reflect the close clinical ties that emerge from being in the trenches of patient care and suggest that interventions to improve care in partnership with these providers are highly viable.
Our study has some limitations. First, despite a high response rate, our study used a survey design and reports findings from a convenience sample of vascular access nurses in a single state. Thus, nonrespondent and selection biases remain threats to our conclusions. Additionally, some respondents did not complete all responses, perhaps due to nonapplicability to practice or other unknown reasons. The pattern of missingness observed, however, suggested that such responses were missing at random. Second, we surveyed vascular nurses in hospitals that are actively engaged in improving PICC practices; our findings may therefore not be representative of vascular nursing professionals as a whole and may instead reflect those of a highly motivated group of individuals. Relatedly, the underlying reasons for adoption of specific practices or techniques cannot be discerned from our study. Third, although we did not find differences based on years in practice or certification status, our sample size was relatively small and likely underpowered for these comparisons. Finally, our study sample consists of vascular nurses who are clustered within hospitals in which they are employed. Therefore, overlap between reported practices and those required by the facility are possible.
Despite these limitations, our study has important strengths. First, this is among the most comprehensive of surveys examining vascular nursing experience, practice, knowledge, and beliefs. The growing presence of these providers across US hospitals, coupled with limited insight regarding their clinical practices, highlight the importance and utility of these data. Second, we noted important differences in experience, practices, and interprovider relationships between vascular providers in this field. Although we are unable to ascertain the drivers or significance of such variation, hospitals and health systems focused on improving patient safety should consider quantifying and exploring these factors. Third, findings from our survey within Michigan suggest the need for similar, larger studies across the country. Partnerships with nursing organizations or larger professional groups that represent vascular nursing specialists may be helpful in this regard.
In conclusion, we found important similarities and differences in vascular nursing experience, practice, knowledge, and beliefs in Michigan. These data are useful as they help provide context regarding the constitution of these teams, current practices, and opportunities for improving care. Hospitalists seeking to improve patient safety may use these data to better inform vascular access practice in hospitalized patients.
Acknowledgements
The authors thank Claire Rickard, PhD, RN, Britt Meyer, RN, Peter Carr, PhD, and David Dempsey, RN for their assistance in developing the survey instrument used in this study.
Disclosures: This project was funded through an Investigator Initiated Research Grant from the Blue Cross Blue Shield of Michigan (BCBSM) Foundation (grant number 2140.II). The funding source played no role in study design, data acquisition, analysis, or reporting of the data. Support for the Hospital Medicine Safety (HMS) Consortium is provided by BCBSM and the Blue Care Network as part of the BCBSM Value Partnerships program. Although BCBSM and HMS work collaboratively, the opinions, beliefs, and viewpoints expressed by the authors do not necessarily reflect the opinions, beliefs, and viewpoints of BCBSM or any of its employees. This work was also supported with resources from the Veterans Affairs Ann Arbor Healthcare System. The views expressed in this article are those of the authors and do not necessarily reflect the position or policy of the Department of Veterans Affairs or the United States government.
- , , , et al. Peripherally inserted central venous catheters in the acute care setting: a safe alternative to high‐risk short‐term central venous catheters. Am J Infect Control. 2010;38(2):149–153.
- , , , , . Risk of venous thromboembolism in hospitalized patients with peripherally inserted central catheters. J Hosp Med. 2009;4(7):417–422.
- , , , , , . Central venous catheter placement by advanced practice nurses demonstrates low procedural complication and infection rates‐‐a report from 13 years of service. Crit Care Med. 2014;42(3):536–543.
- . Developing an alternative workflow model for peripherally inserted central catheter placement. J Infus Nurs. 2012;34(1):34–42.
- , . Facility wide benefits of radiology vascular access teams. Radiol Manage. 2010;32(1):28–32; quiz 33–34.
- , . Moving the needle forward: the imperative for collaboration in vascular access. J Infus Nurs. 2015;38(2):100–102.
- , , , . Use of designated PICC teams by U.S. hospitals: a survey‐based study [published online November 10, 2015]. J Patient Saf. doi: 10.1097/PTS.0000000000000246
- , , , , . The association between PICC use and venous thromboembolism in upper and lower extremities. American J Med. 2015;128(9):986–993.e1.
- , , , et al. Hospital performance for pharmacologic venous thromboembolism prophylaxis and rate of venous thromboembolism: a cohort study. JAMA Intern Med. 2014;174(10):1577–1584.
- , , , et al. Risk of venous thromboembolism associated with peripherally inserted central catheters: a systematic review and meta‐analysis. Lancet. 2013;382(9889):311–325.
- Infusion Nurses Society. Infusion nursing standards of practice. J Infus Nurs. 2006;29(1 suppl):S1–S92.
- , , , et al. Guidelines for the prevention of intravascular catheter‐related infections. Am J Infect Control. 2011;39(4 suppl 1):S1–S34.
- , , , et al. International evidence‐based recommendations on ultrasound‐guided vascular access. Intensive Care Med. 2012;38(7):1105–1117.
- , , . A single institution experience of seven hundred consecutively placed peripherally inserted central venous catheters. J Vasc Access. 2014;15(6):498–502.
- , , . Central venous access devices site care practices: an international survey of 34 countries [published online September 3, 2015]. J Vasc Access. doi: 10.5301/jva.5000450
- American Society of Nephrology. World's Leading Kidney Society Joins Effort to Reduce Unnecessary Medical Tests and Procedures. Available at: https://www.asn‐online.org/policy/choosingwisely/PressReleaseChoosingWisely.pdf. Accessed September 4, 2015.
- , , , . A survey of the current use of peripherally inserted central venous catheter (PICC) in Swedish oncology departments. Acta Oncol. 2013;52(6):1241–1242.
- , . Nurse‐led PICC insertion: is it cost effective? Br J Nurs. 2013;22(19):S9–S15.
- , , , et al. Hospitalist experiences, practice, opinions, and knowledge regarding peripherally inserted central catheters: a Michigan survey. J Hosp Med. 2013;8(6):309–314.
Peripherally inserted central catheters (PICCs) are among the most prevalent of venous access devices in hospitalized patients.[1, 2] Although growing use of these devices reflects clinical advantages, such as a reduced risk of complications during insertion and durable venous access, use of PICCs is also likely related to the growth of vascular access nursing.[3, 4] A relatively new specialty, vascular access nurses obtain, maintain, and manage venous access in hospitalized patients.[4, 5] Depending on their scope of practice, these professionals are responsible not only for insertion of devices, such as peripheral intravenous catheters and PICCs, but also nontunneled central venous catheters and arterial catheters in some settings.[6]
Although a growing number of US hospitals have introduced vascular nursing teams,[7] little is known about the experience, practice, knowledge, and beliefs of vascular access nurses. This knowledge gap is relevant for hospitalists and hospital medicine as (1) vascular access nurses increasingly represent a key partner in the care of hospitalized patients; (2) the knowledge and practice of these individuals directly affects patient safety and clinical outcomes; and (3) understanding experience, practice, and beliefs of these specialists can help inform decision making and quality‐improvement efforts related to PICCs. As hospitalists increasingly order the placement of and care for patients with PICCs, they are also well suited to improve PICC practice.
Therefore, we conducted a survey of vascular access nurses employed by hospitals that participate in the Michigan Hospital Medicine Safety (HMS) Consortium, a Blue Cross Blue Shield of Michiganfunded collaborative quality initiative.[6] We aimed to understand experience, practice, knowledge, and beliefs related to PICC care and use.
METHODS
Study Setting and Participants
To quantify vascular nursing experience, practice, knowledge, and beliefs, we conducted a Web‐based survey of vascular nurses across 47 Michigan hospitals that participate in HMS. A statewide quality‐improvement initiative, HMS aims to prevent adverse events in hospitalized medical patients through the creation of a data registry and sharing of best practices. The setting and design of this multicenter initiative have been previously described.[8, 9] Although participation is voluntary, each hospital receives payment for participating in the consortium and for data collection. Because HMS has an ongoing initiative aimed at identifying and preventing PICC‐related complications, this study was particularly relevant for participating hospitals and nurses.
Each HMS site has a designated quality‐improvement lead, physician champion, and data abstractor. To coordinate distribution and dissemination of the survey, we contacted the quality‐improvement leads at each site and enquired whether their hospital employed vascular access nurses who placed PICCs. Because we were only interested in responses from vascular access nurses, HMS hospitals that did not have these providers or stated PICCs were placed by other specialists (eg, interventional radiology) were excluded. At eligible sites, we obtained the total number of vascular nurses employed so as to determine the number of eligible respondents. In this manner, a purposeful sample of vascular nurses at participating HMS hospitals was constituted.
Participation in the survey was solicited through hospital quality leads that either distributed an electronic survey link to vascular nurses at their facilities or sent us individual email addresses to contact them directly. A cover letter explaining the rationale and the purpose of the survey along with the survey link was then sent to respondents through either of these routes. The survey was administered at all HMS sites contemporaneously and kept open for a period of 5 weeks. During the 5‐week period, 2 e‐mail reminders were sent to encourage participation. As a token of appreciation, a $10 Amazon gift card was offered to those who took the survey.
Development and Validation of the Survey
We developed the survey instrument (which we call PICC1 as we hope to administer longitudinally to track changes over time) by first conducting a literature search to identify relevant evidence‐based guidelines and studies regarding vascular access nursing practices and experiences.[10, 11, 12, 13] In addition, we consulted and involved national and international leaders in vascular access nursing to ensure validity and representativeness of the questions posed. We were specifically interested in nursing background, hospital practices, types of PICCs used, use of various technologies, relationships with healthcare providers, and management of complications. To understand participant characteristics and quantify potential variation in responses, we collected basic participant data including demographics, years in practice, number of PICCs placed, leadership roles, and vascular access certification status. Based on clinical reasoning and existing studies,[14, 15] we hypothesized that responses regarding certain practices (ultrasound use, electrocardiography [ECG] guidance system use), management of complications, or perceptions regarding leadership might vary based on years of experience, number of PICCs placed, or certification status. We therefore examined these associations as prespecified subgroup analyses.
The initial survey instrument was pilot tested with vascular nurses outside of the sampling frame. Based on feedback from the pilot testers, the instrument was refined and edited to improve clarity of the questions. In addition, specific skip patterns and logic were programmed into the final survey to reduce respondent burden and allow participants to seamlessly bypass questions that were contingent on a prior response (eg, use of ECG to place PICCs would lead to a series of questions about ECG‐assisted placement only for those respondents who used the technology). This final version of the survey was tested by members of the study team (V.C., L.K., S.L.K.) and then posted to SurveyMonkey for dissemination.
Statistical Analysis
Descriptive statistics (percentage, n/N) were used to tabulate results. In accordance with our a priori hypothesis that variation to responses might be associated with respondent characteristics, responses to questions regarding insertion practice (eg, use of ultrasound, measurement of catheter:vein ratio, trimming of catheters) and approach to complications (eg, catheter occlusion, deep vein thrombosis [DVT] notification, and PICC removal in the setting of fever) were compared by respondent years in practice (dichotomized to <5 vs >5 years), volume of PICCs placed (<999 vs 1000), and certification status (yes/no). Bivariate comparisons were made using 2 or Fisher exact tests based on the number of responses in a cell as appropriate; 2‐sided with a P value <0.05 was considered statistically significant. All statistical analyses were conducted using SAS version 9.3 (SAS Institute, Cary, NC).
Ethical and Regulatory Oversight
Because our study sought to describe existing practice without collecting any individual or facility level identifiable information, the project received a Not Regulated status by the University of Michigan Medical School Institutional Review Board (HUM00088351).
RESULTS
Of 172 vascular nurses who received invitations, 140 completed the survey for a response rate of 81%. Respondents reported working in not‐for‐profit hospitals (36%), academic medical centers (29%), and for‐profit hospitals (21%). Although multiple providers (eg, interventional radiology staff and providers, physicians) placed PICCs, 95% of those surveyed reported that they placed the majority of the PICCs at their institutions. Although most respondents placed PICCs in adult patients (86%), a few also placed PICCs in pediatric populations (17%). Vascular nursing programs were largely housed in their own department, but some reported to general nursing or subspecialties such as interventional radiology, cardiology, and critical care. Most respondents indicated their facilities had written policies regarding standard insertion and care practices (87% and 95%, respectively), but only 30% had policies regarding the necessity or appropriateness of PICCs.
Experience among respondents was variable: approximately a third had placed PICCs for <5 years (28.6%), whereas 58% reported placing PICCs for 5 years Correspondingly, 26% reported having placed 100 to 500 PICCs, whereas 34% had placed 1000 or more PICCs. Only 23% of those surveyed held a dedicated vascular access certification, such as board certified in vascular access or certified registered nurse infusion, whereas 16% indicated that they served as the vascular access lead nurse for their facility. Following placement, 94% of respondents reported that their facilities tracked the number of PICCs inserted, but only 40% indicated that dwell times of devices were also recorded. Only 30% of nurses reported that their hospitals had a written policy to evaluate PICC necessity or appropriateness following placement (Table 1).
| No.* | % | |
|---|---|---|
| ||
| Participant characteristics | ||
| For how many years have you been inserting PICCs? | ||
| <5 years | 40 | 28.6% |
| 5 years | 81 | 57.9% |
| Missing | ||
| In which of the following populations do you insert PICCs? | ||
| Adult patients | 121 | 86.4% |
| Pediatric patients | 24 | 17.1% |
| Neonatal patients | 1 | 0.7% |
| In which of the following locations do you place PICCs? (Select all that apply.) | ||
| Adult medical ward | 115 | 82.1% |
| General adult surgical ward | 110 | 78.6% |
| General pediatric medical ward | 34 | 24.3% |
| General pediatric surgical ward | 24 | 17.1% |
| Adult intensive care unit | 114 | 81.4% |
| Pediatric intensive care unit | 19 | 13.6% |
| Neonatal intensive care unit | 3 | 2.1% |
| Other intensive care unit | 59 | 42.1% |
| Outpatient clinic or emergency department | 17 | 12.1% |
| Other | 10 | 7.1% |
| Approximately how many PICCs may you have placed in your career? | ||
| 099 | 15 | 10.7% |
| 100499 | 36 | 25.7% |
| 500999 | 23 | 16.4% |
| 1,000 | 47 | 33.6% |
| Are you the vascular access lead nurse for your facility or organization? | ||
| Yes | 22 | 15.7% |
| No | 98 | 70.0% |
| Do you currently hold a dedicated vascular access certification (BC‐VA, CRNI, etc.)? | ||
| Yes | 32 | 22.9% |
| No | 89 | 63.6% |
| Facility characteristics | ||
| Which of the following best describes your primary work location? | ||
| Academic medical center | 41 | 29.3% |
| For‐profit community‐based hospital or medical center | 30 | 21.4% |
| Not‐for‐profit community‐based hospital or medical center | 50 | 35.7% |
| Who inserts the most PICCs in your facility? | ||
| Vascular access nurses | 133 | 95.0% |
| Interventional radiology or other providers | 7 | 5.0% |
| In which department is vascular access nursing located? | ||
| Vascular nursing | 76 | 54.3% |
| General nursing | 38 | 27.1% |
| Interventional radiology | 15 | 10.7% |
| Other | 11 | 7.9% |
| Using your best guess, how many PICCs do you think your facility inserts each month? | ||
| <25 | 5 | 3.6% |
| 2549 | 13 | 9.3% |
| 50100 | 39 | 27.9% |
| >100 | 78 | 55.7% |
| Unknown | 2 | 1.4% |
| How many vascular access nurses are employed by your facility? | ||
| <4 | 14 | 10.0% |
| 46 | 33 | 23.6% |
| 79 | 15 | 10.7% |
| 1015 | 25 | 17.9% |
| >15 | 53 | 37.9% |
| Does your facility track the number of PICCs placed? | ||
| Yes | 132 | 94.3% |
| No | 5 | 3.6% |
| Unknown | 3 | 2.1% |
| Does your facility track the duration or dwell time of PICCs? | ||
| Yes | 56 | 40.0% |
| No | 60 | 42.9% |
| Unknown | 24 | 17.1% |
| Does your facility have a written policy regarding standard PICC insertion practices? | ||
| Yes | 122 | 87.1% |
| No | 8 | 5.7% |
| Unknown | 7 | 5.0% |
| Does your facility have a written policy regarding standard PICC care and maintenance? | ||
| Yes | 133 | 95.0% |
| No | 3 | 2.1% |
| Unknown | 1 | 0.7% |
| Does your facility have a written process to review the necessity or appropriateness of a PICC? | ||
| Yes | 42 | 30.0% |
| No | 63 | 45.0% |
| Unknown | 20 | 14.3% |
The most commonly reported indications for PICC placement included intravenous antibiotics at discharge, difficult venous access, and placement for chemotherapy in patients with cancer. Forty‐six percent of nurses indicated they had placed a PICC in a patient receiving some form of dialysis in the past several months; however, 91% of these respondents reported receiving approval from nephrology prior to placement in these patients. Although almost all nurses (91%) used ultrasound to find a suitable vein for PICC placement, a smaller percentage used ultrasound to estimate the catheter‐to‐vein ratio to prevent thrombosis (79%), and only a few (14%) documented this figure in the medical record. Three‐quarters of those surveyed (76%) indicated they used ECG‐based systems to position PICC tips at the cavoatrial junction to prevent thrombosis. Of those who used this technology, 36% still obtained chest x‐rays to verify the position of the PICC tip. According to 84% of respondents, flushing of PICCs was performed mainly by bedside nurses, whereas scheduled weekly dressing changes were most often performed by vascular access nurses (Table 2).
| Question | No. | % |
|---|---|---|
| ||
| Do you use ultrasound to find a suitable vein prior to PICC insertion? | ||
| Yes | 128 | 91.4% |
| No | 0 | 0.0% |
| Do you use ultrasound to estimate the catheter‐to‐vein ratio prior to PICC insertion? | ||
| Yes | 110 | 78.6% |
| No | 18 | 12.9% |
| When using ultrasound, do you document the catheter‐to‐vein ratio in the PICC insertion note? | ||
| Yes | 20 | 14.3% |
| No | 89 | 63.6% |
| Do you use ECG guidance‐assisted systems to place PICCs? | ||
| Yes | 106 | 75.7% |
| No | 21 | 15.0% |
| If using ECG guidance, do you still routinely obtain a chest x‐ray to verify PICC tip position after placing the PICC using ECG guidance? | ||
| Yes | 38 | 27.1% |
| No | 68 | 48.6% |
| Who is primarily responsible for administering and adhering to a flushing protocol after PICC insertion at your facility? | ||
| Bedside nurses | 118 | 83.6% |
| Patients | 1 | 0.7% |
| Vascular access nurses | 8 | 5.7% |
| Which of the following agents are most often used to flush PICCs? | ||
| Both heparin and normal saline flushes | 61 | 43.6% |
| Normal saline only | 63 | 45.0% |
| Heparin only | 3 | 2.1% |
| Who is responsible for scheduled weekly dressing changes for PICCs? | ||
| Vascular access nurses | 110 | 78.6% |
| Bedside nurses | 14 | 10.0% |
| Other (eg, IR staff, ICU staff) | 3 | 2.1% |
| In the past few months, have you placed a PICC in a patient who was receiving a form of dialysis (eg, peritoneal or hemodialysis)? | ||
| Yes | 65 | 46.4% |
| No | 64 | 45.7% |
| If you have placed PICCs in patients on dialysis, do you discuss PICC placement or receive approval from nephrology prior to inserting the PICC? | ||
| Yes | 59 | 90.8% |
| No | 6 | 9.2% |
With respect to complications, catheter occlusion, migration, and DVT were reported as the 3 most prevalent adverse events. Interestingly, respondents did not report central lineassociated bloodstream infection (CLABSI) as a common complication. Additionally, 51% of those surveyed indicated that physicians unnecessarily removed PICCs when CLABSI was suspected but not confirmed. When managing catheter occlusion, 50% of respondents began with normal saline flushes but used tissue‐plasminogen activator if saline failed to resolve occlusion. Management of catheter migration varied based on degree of device movement: when the PICC had migrated <5 cm, most respondents (77%) indicated they would first obtain a chest x‐ray to determine the position of the PICC tip, with few (4%) performing catheter exchange. However, if the PICC had migrated more than 5 cm, a significantly greater proportion of respondents (21%) indicated they would perform a catheter exchange. With regard to managing DVT, most vascular nurses reported they notified nurses and physicians to continue using the PICC but recommended tests to confirm the diagnosis.
To better understand the experiences of vascular nurses, we asked for their perceptions regarding appropriateness of PICC use and relationships with bedside nurses, physicians, and leadership. Over a third of respondents (36%) felt that <5% of all PICCs may be inappropriate in their facility, whereas 1 in 5 indicated that 10% to 24% of PICCs placed in their facilities may be inappropriate or could have been avoided. Almost all (98%) of the nurses stated they were not empowered to remove idle or clinically unnecessary PICCs without physician authorization. Although 51% of nurses described the support received from hospital leadership as excellent, very good, or good, 43% described leadership support as either fair or poor. Conversely, relationships with bedside nurses and physicians were rated as being very good or good by nearly two‐thirds of those surveyed (64% and 65%, respectively) (Table 3).
| Question | No. | % |
|---|---|---|
| ||
| Which of the following PICC‐related complications have you most frequently encountered in your practice? | ||
| Catheter occlusion | 81 | 57.9% |
| Catheter migration | 27 | 19.3% |
| PICC‐associated DVT | 6 | 4.3% |
| Catheter fracture or embolization | 3 | 2.1% |
| Exit site infection | 3 | 2.1% |
| Coiling or kinking after insertion | 2 | 1.4% |
| If you suspect a patient has catheter occlusion, which of the following best describes your approach to resolving this problem? | ||
| Begin with normal saline but use a tPA product if this fails to restore patency | 70 | 50.0% |
| Use a tPA product (eg, Cathflo, Activase, or Retavase) to restore patency | 44 | 31.4% |
| Begin with heparin‐based flushes but use a tPA product if this fails to restore | 7 | 5.0% |
| Use only normal saline flushes to restore patency | 3 | 2.1% |
| If you find a PICC that has migrated out or has been accidentally dislodged <5 cm in a patient without symptoms, and the device is still clinically needed, which of the following best describes your practice? | ||
| Obtain a chest x‐ray to verify tip position | 108 | 77.1% |
| Perform a complete catheter exchange over a guidewire if possible | 5 | 3.6% |
| Notify/discuss next steps with physician | 5 | 3.6% |
| Other | 6 | 4.3% |
| If you find a PICC that has migrated out or has been accidentally dislodged >5 cm in a patient without symptoms, and the device is still clinically needed, which of the following best describes your practice? | ||
| Obtain a chest x‐ray to verify tip position | 72 | 51.4% |
| Perform a catheter exchange over a guidewire if possible | 30 | 21.4% |
| Notify/discuss next steps with physician | 10 | 7.1% |
| Other | 12 | 8.6% |
| Which of the following best describes your first approach when you suspect a patient has PICC‐associated phlebitis? | ||
| Discuss best course of action with physician or nurse | 79 | 56.4% |
| Supportive measures (eg, warm compresses, analgesics, monitoring) | 25 | 17.9% |
| Remove the PICC | 15 | 10.7% |
| Other | 5 | 3.6% |
| Which of the following best describes your first approach when you suspect a patient has a PICC‐related DVT? | ||
| Notify caregivers to continue using PICC and consider tests such as ultrasound | 82 | 58.6% |
| Notify bedside nurse and physician not to continue use of the PICC and consider tests such as ultrasound | 42 | 30.0% |
| PICCs are often removed when physicians suspect, but have not yet confirmed, CLABSI. Considering your experiences, what percentage of PICCs may have been removed in this manner at your facility? | ||
| <5% | 11 | 7.9% |
| 59% | 16 | 11.4% |
| 1024% | 24 | 17.1% |
| 25% | 71 | 50.7% |
| Based on your experience, what percentage of PICCs do you think are inappropriate or could have been avoided at your facility? | ||
| <5% | 51 | 36.4% |
| 59% | 25 | 17.9% |
| 1024% | 28 | 20.0% |
| 2550% | 13 | 9.3% |
| >50% | 5 | 3.6% |
| Are vascular access nurses empowered to remove PICCs that are idle or clinically unnecessary without physician authorization? | ||
| Yes | 3 | 2.1% |
| No | 122 | 87.1% |
| How would you rank the overall support your vascular access service receives from hospital leadership? | ||
| Excellent | 5 | 3.6% |
| Very good | 32 | 22.9% |
| Good | 40 | 28.6% |
| Fair | 35 | 25.0% |
| Poor | 25 | 17.9% |
| How would you describe your relationship with physicians at your facility when it comes to communicating recommendations or management of PICCs? | ||
| Very good | 28 | 20.0% |
| Good | 63 | 45.0% |
| Fair | 35 | 25.0% |
| Poor | 7 | 5.0% |
| Very poor | 4 | 2.9% |
| How would you describe your relationship with bedside nurses at your facility when it comes to communicating recommendations or management of PICCs? | ||
| Very good | 32 | 22.9% |
| Good | 58 | 41.4% |
| Fair | 38 | 27.1% |
| Poor | 7 | 5.0% |
| Very poor | 2 | 1.4% |
Variation in Responses Based on Years in Practice or Certification
We initially hypothesized that responses regarding practice (ultrasound use, ECG guidance system use), management of complications, or perceptions regarding leadership might vary based on years of experience, number of PICCs placed, or certification status. However, no statistically significant associations with these factors and individual responses were identified.
DISCUSSION
In this survey of 140 vascular access nurses in hospitals across Michigan, new insights regarding the experience, practice, knowledge, and beliefs of this group of providers were obtained. We found that vascular access nurses varied with respect to years in practice, volume of PICCs placed, and certification status, reflecting heterogeneity in this provider group. Variation in insertion techniques, such as use of ultrasound to examine catheter‐to‐vein ratio (a key way to prevent thrombosis) or newer ECG technology to position the PICC, was also noted. Although indications for PICC insertion appeared consistent with published literature, the frequency with which these devices were placed in patients receiving dialysis (reportedly with nephrology approval) was surprising given national calls to avoid such use.[16] Opportunities to improve hospital practices, such as tracking PICC dwell times and PICC necessity, as well as the potential need to better educate physicians on when to remove PICCs for suspected CLABSI, were also identified. Collectively, these data are highly relevant to hospitalists and health systems as they help to identify areas for quality improvement and inform clinical practice regarding the use of PICCs in hospitalized patients. As hospitalists increasingly order PICCs and manage complications associated with these devices, they are well suited to use these data so as to improve patient safety and clinical outcomes.
Venous access is the most common medical procedure performed in hospitalized medical patients. Although a number of devices including peripheral intravenous catheters, central venous catheters, and PICCs are used for this purpose, the growing use of PICCs to secure venous access has been documented in several studies.[17] Such growth, in part, undoubtedly reflects increasing availability of vascular access nurses. Traditionally placed by interventional radiologists, the creation of dedicated vascular nursing teams has resulted in these subspecialists now serving in more of a backup or trouble‐shooting role rather than that of primary operator.[4, 14] This paradigm shift is well illustrated in a recent survey of infection preventionists, where over 60% of respondents reported that they had a vascular nursing team in their facility.[7] The growth of these nursing‐led vascular access teams has produced not only high rates of insertion success and low rates of complications, but also greater cost‐effectiveness when compared to interventional radiologybased insertion.[18]
Nonetheless, our survey also identified a number of important concerns regarding PICC practices and vascular nursing providers. First, we found variation in areas such as insertion practices and management of complications. Such variability highlights the importance of both growing and disseminating the evidence base for consistent practice in vascular nursing. Through their close clinical affiliation with vascular nurses and shared interests in obtaining safe and appropriate venous access for patients, hospitalists are ideally poised to lead this effort. Second, similarities between vascular nurse opinions regarding appropriateness of PICCs and those of hospitalists from a prior survey were noted.[19] Namely, a substantial proportion of both vascular nurses and hospitalists felt that some PICCs were inappropriate and could be avoided. Third, although relationships between vascular access nurses and leadership were reported as being variable, the survey responses suggested relatively good interprovider relationships with bedside nurses and physicians. Such relationships likely reflect the close clinical ties that emerge from being in the trenches of patient care and suggest that interventions to improve care in partnership with these providers are highly viable.
Our study has some limitations. First, despite a high response rate, our study used a survey design and reports findings from a convenience sample of vascular access nurses in a single state. Thus, nonrespondent and selection biases remain threats to our conclusions. Additionally, some respondents did not complete all responses, perhaps due to nonapplicability to practice or other unknown reasons. The pattern of missingness observed, however, suggested that such responses were missing at random. Second, we surveyed vascular nurses in hospitals that are actively engaged in improving PICC practices; our findings may therefore not be representative of vascular nursing professionals as a whole and may instead reflect those of a highly motivated group of individuals. Relatedly, the underlying reasons for adoption of specific practices or techniques cannot be discerned from our study. Third, although we did not find differences based on years in practice or certification status, our sample size was relatively small and likely underpowered for these comparisons. Finally, our study sample consists of vascular nurses who are clustered within hospitals in which they are employed. Therefore, overlap between reported practices and those required by the facility are possible.
Despite these limitations, our study has important strengths. First, this is among the most comprehensive of surveys examining vascular nursing experience, practice, knowledge, and beliefs. The growing presence of these providers across US hospitals, coupled with limited insight regarding their clinical practices, highlight the importance and utility of these data. Second, we noted important differences in experience, practices, and interprovider relationships between vascular providers in this field. Although we are unable to ascertain the drivers or significance of such variation, hospitals and health systems focused on improving patient safety should consider quantifying and exploring these factors. Third, findings from our survey within Michigan suggest the need for similar, larger studies across the country. Partnerships with nursing organizations or larger professional groups that represent vascular nursing specialists may be helpful in this regard.
In conclusion, we found important similarities and differences in vascular nursing experience, practice, knowledge, and beliefs in Michigan. These data are useful as they help provide context regarding the constitution of these teams, current practices, and opportunities for improving care. Hospitalists seeking to improve patient safety may use these data to better inform vascular access practice in hospitalized patients.
Acknowledgements
The authors thank Claire Rickard, PhD, RN, Britt Meyer, RN, Peter Carr, PhD, and David Dempsey, RN for their assistance in developing the survey instrument used in this study.
Disclosures: This project was funded through an Investigator Initiated Research Grant from the Blue Cross Blue Shield of Michigan (BCBSM) Foundation (grant number 2140.II). The funding source played no role in study design, data acquisition, analysis, or reporting of the data. Support for the Hospital Medicine Safety (HMS) Consortium is provided by BCBSM and the Blue Care Network as part of the BCBSM Value Partnerships program. Although BCBSM and HMS work collaboratively, the opinions, beliefs, and viewpoints expressed by the authors do not necessarily reflect the opinions, beliefs, and viewpoints of BCBSM or any of its employees. This work was also supported with resources from the Veterans Affairs Ann Arbor Healthcare System. The views expressed in this article are those of the authors and do not necessarily reflect the position or policy of the Department of Veterans Affairs or the United States government.
- , , , et al. Peripherally inserted central venous catheters in the acute care setting: a safe alternative to high‐risk short‐term central venous catheters. Am J Infect Control. 2010;38(2):149–153.
- , , , , . Risk of venous thromboembolism in hospitalized patients with peripherally inserted central catheters. J Hosp Med. 2009;4(7):417–422.
- , , , , , . Central venous catheter placement by advanced practice nurses demonstrates low procedural complication and infection rates‐‐a report from 13 years of service. Crit Care Med. 2014;42(3):536–543.
- . Developing an alternative workflow model for peripherally inserted central catheter placement. J Infus Nurs. 2012;34(1):34–42.
- , . Facility wide benefits of radiology vascular access teams. Radiol Manage. 2010;32(1):28–32; quiz 33–34.
- , . Moving the needle forward: the imperative for collaboration in vascular access. J Infus Nurs. 2015;38(2):100–102.
- , , , . Use of designated PICC teams by U.S. hospitals: a survey‐based study [published online November 10, 2015]. J Patient Saf. doi: 10.1097/PTS.0000000000000246
- , , , , . The association between PICC use and venous thromboembolism in upper and lower extremities. American J Med. 2015;128(9):986–993.e1.
- , , , et al. Hospital performance for pharmacologic venous thromboembolism prophylaxis and rate of venous thromboembolism: a cohort study. JAMA Intern Med. 2014;174(10):1577–1584.
- , , , et al. Risk of venous thromboembolism associated with peripherally inserted central catheters: a systematic review and meta‐analysis. Lancet. 2013;382(9889):311–325.
- Infusion Nurses Society. Infusion nursing standards of practice. J Infus Nurs. 2006;29(1 suppl):S1–S92.
- , , , et al. Guidelines for the prevention of intravascular catheter‐related infections. Am J Infect Control. 2011;39(4 suppl 1):S1–S34.
- , , , et al. International evidence‐based recommendations on ultrasound‐guided vascular access. Intensive Care Med. 2012;38(7):1105–1117.
- , , . A single institution experience of seven hundred consecutively placed peripherally inserted central venous catheters. J Vasc Access. 2014;15(6):498–502.
- , , . Central venous access devices site care practices: an international survey of 34 countries [published online September 3, 2015]. J Vasc Access. doi: 10.5301/jva.5000450
- American Society of Nephrology. World's Leading Kidney Society Joins Effort to Reduce Unnecessary Medical Tests and Procedures. Available at: https://www.asn‐online.org/policy/choosingwisely/PressReleaseChoosingWisely.pdf. Accessed September 4, 2015.
- , , , . A survey of the current use of peripherally inserted central venous catheter (PICC) in Swedish oncology departments. Acta Oncol. 2013;52(6):1241–1242.
- , . Nurse‐led PICC insertion: is it cost effective? Br J Nurs. 2013;22(19):S9–S15.
- , , , et al. Hospitalist experiences, practice, opinions, and knowledge regarding peripherally inserted central catheters: a Michigan survey. J Hosp Med. 2013;8(6):309–314.
© 2015 Society of Hospital Medicine
Length of Different‐Hospital Readmissions
Readmissions within a relatively short time after discharge are receiving considerable attention as an area of quality improvement,[1, 2] with increasing emphasis on the relatively large share of readmissions to different hospitals, accounting for 20% to 30% of all readmissions.[3, 4, 5, 6] Returning to a different hospital may affect patient and healthcare outcomes due to breaches in continuity. When information from the previous recent hospitalization is not transferred efficiently and accurately to the next admitting hospital, omissions and duplications can occur, resulting in delayed care and potentially worse outcomes (compared to same hospital readmissions [SHRs]), such as longer length of readmission stay (LORS) and increased costs.[7]
Electronic health records (EHRs) and health information exchange (HIE) systems are increasingly used for storage and retrieval of patient information from various sources, such as laboratories and previous physician visits and hospitalizations, enabling informational continuity by providing vital historical medical information for decision‐making. Whereas EHRs collect, store, and present information that is locally created within a specific clinic or hospital, HIEs connect EHR systems between multiple institutions, allowing providers to share clinical data and achieve interorganizational continuity. Such integrative systems are increasingly being implemented across healthcare systems worldwide.[8, 9, 10] Yet, technical difficulties, costs, competitive concerns, data privacy, and workflow implementation challenges have been described as hindering HIE participation.[11, 12, 13, 14] Moreover, major concerns exist regarding the poor usability of EHRs, their limited ability to support multidisciplinary care, and major difficulties in achieving interoperability with HIEs, which undermine efforts to deliver integrated patient‐centered care.[15] Nonetheless, previous research has demonstrated that HIEs can positively affect healthcare resource use and outcomes, including reduced rates of repeated diagnostic imaging in the emergency evaluation of back pain,[16] reduction in admissions via the emergency department (ED),[17] and reduced rates of readmissions within 7 days.[18] However, it is not known whether HIEs can contribute to positive outcomes when patients are readmitted to a different hospital than the hospital from which they were recently (within the previous 30 days) discharged, potentially bridging the transitional‐care information divide.
In Israel, an innovative HIE system, OFEK (literally horizon), was implemented in 2005 at the largest not‐for‐profit insurer and provider of services, Clalit Health Services (Clalit). Clalit operates as an integrated healthcare delivery system, serving more than 50% of the Israeli population, as part of the country's national health insurance system. OFEK links information on all Clalit enrollees from all hospitals, primary care, and specialty care clinics, laboratories, and diagnostic services into a single, virtual, patient file, enabling providers to obtain complete, real‐time information needed for healthcare decision making at the point of care. Like similar HIE systems, OFEK includes information on previous medical encounters and hospitalizations, previous diagnoses, chronically prescribed medications, previous lab and imaging tests, known allergies, and some demographic information.[19] At the time of this study, OFEK was available in all Clalit hospitals as well as in 2 non‐Clalit (government‐owned and operated) large tertiary‐care centers, resulting in 40% coverage of all hospitalizations through the OFEK HIE system. As part of a large organization‐wide readmission reduction program recently implemented by Clalit for all its members admitted to any hospital in Israel, aimed at early detection and intervention,[20] OFEK was viewed as an important mechanism to help maintain continuity and improve transitions.
To inform current knowledge on different‐hospital readmissions (DHRs) and HIEs, we examined whether having HIE systems can contribute to information continuity and prevent delays in care and the need for more expensive, lengthy readmission stays when patients are readmitted to a different hospital. More specifically, we tested whether there is a difference in the LORS between SHRs and DHRs, and whether DHRs the LORS differ by the availability of an HIE (whether index and readmitting hospital are or are not connected through HIE systems).
METHODS
Study Design and Setting
We conducted a retrospective cohort study based on data of hospitalized Clalit members. Clalit has a centralized data warehouse with a comprehensive EHR containing data on all patients' medical encounters, administrative data, and clinical data compiled from laboratories, imaging centers, and hospitals. At the time of the study, OFEK was operating in all 8 Clalit hospitals and in 2 large government‐owned and operated hospitals in the central and northern parts of the country. Information is linked in the Clalit system and OFEK‐affiliated hospitals through an individual identity number assigned by the Israeli Interior Ministry to every Israeli resident for general identification purposes.
Population
The study examined all internal medicine and intensive‐care unit (ICU) readmissions of adult Clalit members (aged 18 years and older) previously (within the prior 30 days) discharged from internal medicine departments during January 1, 2010 until December 31, 2010 (ie, index hospitalizations). Only readmissions of index hospitalizations with more than a 24‐hour stay were included. A total of 146,266 index hospitalizations met the inclusion criteria. Index admissions that resulted in a transfer to another hospital, a long‐term care facility, or rehabilitation center were not included (N = 11,831). The final study sample included 27,057 readmissions (20.1% of the 134,435 index admissions), which could have resulted in any type of discharge (to patient's home, a long‐term care or rehabilitation facility, or due to death). The study was approved by Clalit's institutional review board.
Outcome Variable
We defined the LORS as the number of days from admission to discharge during readmission.
Main Independent Variable
We assessed information continuity as a categorical variable in which 0 = no information continuity (DHRs with either no HIE at either hospital or an HIE in only 1 of the hospitals), 1 = information continuity through an HIE (DHRs with both hospitals having an HIE), and 2 = full information continuity (readmission to the same hospital).
Covariates
We examined the following known correlates of length of stay (LOS): age, gender, residency in a nursing home, socioeconomic status (SES) based on an indicator of social security entitlement received by low‐income members,[21] and the occurrence of common chronic conditions registered in Clalit's EHR registries[22]: congestive heart failure (CHF), chronic obstructive pulmonary disease (COPD), chronic renal failure (CRF), malignancy, diabetes, hypertension, ischemic heart disease, atrial fibrillation, asthma, and disability (indication of a functional limitation). To provide comorbidity adjustment we used the Charlson Comorbidity Index.[23] Additionally, we assessed LOS of the index hospitalization. We included an indicator for the size of the index hospital: small, fewer than 100 beds; medium, 100 to 200 beds; and large, more than 200 beds. Finally, to account for a well‐known correlate of length of hospital stay,[24] we included an indicator for an ICU stay during the readmission.
Statistical Analysis
We first examined the study populations' characteristics and calculated the average LORS for each SHR and DHR category. Due to the skewed distribution of LORS, we also calculated the median and interquartile range (IQR) of LORS and evaluated the difference between categories using the Kruskall‐Wallis test.[25] Sample‐size calculations showed that we would need a sample of >3000 admissions to have 80% power to detect a difference of 0.8 hospitalization days given the 1:3 ratio between the DHR groups. To examine the association between LORS and information continuity, we employed a univariate marginal Cox model.[26] Variables that were significantly (P < 0.05) associated with LORS in the univariate model were entered into a multivariate marginal Cox model, clustering by patient and using a robust sandwich covariance matrix estimate. Additionally, we performed a sensitivity analysis using hierarchichal modeling to account for potential variations due to hospital level factors. A low hazard ratio (<1) represented an association of the covariate with decreased likelihood of discharge, that is, longer LORS. All analyses were conducted with SPSS version 20 (IBM, Armonk, NY) and SAS version 9.3 (SAS Institute Inc., Cary, NC).
RESULTS
The study included a total of 27,057 readmissions, of which 23,927 (88.4%) were SHRs and 3130 (11.6%) were DHRs. Of all DHRs, in 792 (2.9%) of the cases, both hospitals had HIEs (partial information continuity), and in 2338 (8.6%), either 1 or both did not have an HIE system (thus meaning there was no information continuity). Characteristics of the study population are shown in Table 1. Most (75%) of the readmissions were of patients over the age of 65 years, though only 7% were nursing home residents. More than half the study's population consisted of patients with low SES. The most common chronic conditions were hypertension (77%), ischemic heart disease (52%), and diabetes (48%). Other chronic conditions were arrhythmia (38%), CHF (35%), disability (31%), COPD (28%), malignancy (28%), and asthma (16%). In more than 55% of the index hospitalizations, the LOS was 4 days or less, and most index admissions (64%) were in large hospitals. Table 1 also displays the study population by the type of readmission: SHR, DHR with HIE, and DHR without HIE. As compared to patients readmitted to the same hospital, patients with DHRs were younger (P < 0.001), less likely to be nursing home residents (P < 0.001), and had longer LOS during the index admission (P < 0.001). Additionally, patients with SHRs were more likely to have their index admission at a large hospital (P < 0.001), had a higher comorbidity score (P < 0.043), and were less likely be treated in the ICU during their readmission (P < 0.001) compared to their DHR counterparts. Patients with DHRs without an HIE were similar in most characteristics to those with an HIE, except for having an ICU stay during their readmission (6.4% compared with 9.2%, respectively).
| Characteristics | All Readmissions, n = 27,057 | SHR, n = 23,927 | DHR With HIE, n = 792 | DHR Without HIE, n = 2,338 | P Value |
|---|---|---|---|---|---|
| |||||
| All personal characteristics | |||||
| Age, n (%) | <0.001 | ||||
| 1844 years | 1,328 (4.9) | 1,095 (4.6) | 58 (7.3) | 175 (7.5) | |
| 4564 years | 5,370 (19.8) | 4,597 (19.2) | 197 (24.9) | 576 (24.6) | |
| 6584 years | 14,059 (52.0) | 12,500 (52.2) | 402 (50.8) | 1,157 (49.5) | |
| 85+ years | 6,300 (23.3) | 5,735 (24.0) | 135 (17.0) | 430 (18.4) | |
| Female sex, n (%) | 13,742 (50.8) | 12,040 (50.3) | 418 (52.8) | 1,284 (54.9) | <0.001 |
| Low socioeconomic status, n (%) | 15,473 (57.2) | 13,670 (57.1) | 453 (57.2) | 1,350 (57.7) | |
| Residency in a nursing home, n (%) | 1,857 (6.9) | 1,743 (7.3) | 27 (3.4) | 87 (3.7) | <0.001 |
| Common chronic conditions, n (%) | |||||
| Hypertension | 20,797 (76.9) | 18,484 (77.3) | 588 (74.2) | 1,725 (73.8) | <0.001 |
| Ischemic heart disease | 14,150 (52.3) | 12,577 (52.6) | 397 (50.1) | 1,176 (50.3) | 0.052 |
| Diabetes | 13,052 (48.2) | 11,589 (48.4) | 345 (43.6) | 1,118 (47.8) | 0.024 |
| Arrhythmia | 10,306 (38.1) | 9,197 (38.4) | 292 (36.9) | 817 (34.9) | 0.003 |
| Chronic renal failure | 9,486 (35.1) | 8,454 (35.3) | 262 (33.1) | 770 (32.9) | 0.034 |
| Congestive heart failure | 9,216 (34.1) | 8,232 (34.4) | 270 (34.1) | 714 (30.5) | 0.001 |
| Disability | 8,362 (30.9) | 7,600 (31.8) | 165 (20.8) | 597 (25.5) | <0.001 |
| Chronic obstructive pulmonary disease | 7,671 (28.4) | 6,888 (28.8) | 201 (25.4) | 582 (24.9) | <0.001 |
| Malignancy | 7,642 (28.2) | 6,763 (28.3) | 220 (27.8) | 659 (28.2) | 0.954 |
| Asthma | 4,491 (16.6) | 4,040 (16.9) | 109 (13.8) | 342 (14.6) | 0.002 |
| Charlson score, mean [SD] | 4.54 [3.15] | 4.58 [3.14] | 4.14 [3.08] | 4.25 [3.24] | 0.043 |
| Index hospitalization characteristics (LOS during index hospitalization), n (%) | <0.001 | ||||
| 24 days | 14,961 (55.3) | 13,310 (55.6) | 428 (54.0) | 1,223 (52.3) | |
| 57 days | 6,366 (23.5) | 5,654 (23.6) | 174 (22.0) | 538 (23.0) | |
| 8 days and more | 5,730 (21.2) | 4,963 (20.7) | 190 (24.0) | 577 (24.7) | |
| Hospital size in index hospitalization (no. of hospitals in each category), n (%) | <0.001 | ||||
| Small, <100 beds (8) | 1,498 (5.5) | 1,166 (4.9) | 23 (2.9) | 309 (13.2) | |
| Medium, 100200 beds (9) | 8,129 (30.0) | 7,113 (29.7) | 316 (39.9) | 700 (29.9) | |
| Large, >200 beds (10) | 17,430 (64.4) | 15,648 (65.4) | 453 (57.2) | 1,329 (56.8) | |
| Intensive care unit during readmission, n (%) | 869 (3.2) | 647 (2.7) | 73 (9.2) | 149 (6.4) | <0.001 |
The mean LORS in SHRs was shorter by 1 day than the mean LORS for DHRs: 6.3 (95% confidence interval [CI]: 6.2‐6.4) versus 7.3 (95% CI: 7.0‐7.6), respectively. Mean LORS in DHRs with or without HIE was 7.6 (95% CI: 7.0‐8.3) and 7.2 (95% CI: 6.8‐7.6), respectively. Although median LORS was similar (4 days), the IQR differed, resulting in significant differences between the SHR and DHR groups (Table 2).
| Information Continuity | No. of Readmissions | Mean LORS (95% CI) | Median (Q1Q3) | Kruskal‐Wallis P Value |
|---|---|---|---|---|
| ||||
| SHRs | 23,927 (88.4) | 6.3 (6.26.4) | 4 (27) | |
| DHRs | 3,130 (11.6) | 7.3 (7.07.6) | 4 (28) | |
| DHRs with HIE | 792 (2.9) | 7.6 (7.08.3) | 4 (29) | |
| DHRs without HIE | 2,338 (8.7) | 7.2 (6.87.6) | 4 (28) | |
| Total | 27,057 | 6.4 (6.36.5) | 4 (27) | <0.001 |
In the multivariate model, partial continuity (DHRs with an HIE) was associated with decreased likelihood of discharge on any given day compared with full continuity (SHR) (hazard ratio [HR] = 0.85, 95% CI: 0.79‐0.91). Similar results were obtained for no continuity (DHRs without an HIE) (HR = 0.90, 95% CI: 0.86‐0.94). The difference between DHRs with and without an HIE was not significant (overlapping confidence intervals). Other factors associated with a lower HR for discharge during each day of the readmission were older age, residency in a nursing home, CHF, CRF, disability, malignancy, and long LOS (8+ days) during the index hospitalization. Patients with asthma or ischemic heart disease had a higher HR for discharge during each readmission day (Table 3). We performed a sensitivity analysis using hierarchical modeling (patients nested within hospitals), which resulted in similar findings in terms of directionality and magnitude of the relationships and significance levels.
| Characteristics | Univariate Model | Multivariate Model | ||
|---|---|---|---|---|
| Hazard Ratio (95% CI) | P Value | Hazard Ratio (95% CI) | P Value | |
| ||||
| Information continuity | ||||
| SHR | Reference | Reference | ||
| DHR with HIE | 0.87 (0.810.93) | <0.001 | 0.86 (0.800.93) | <0.001 |
| DHR without HIE | 0.91 (0.870.94) | <0.001 | 0.90 (0.870.94) | <0.001 |
| Age | ||||
| 844 years | 1.22 (1.181.26) | <0.001 | 1.14 (1.071.22) | <0.001 |
| 4564 years | 1.16 (1.141.18) | <0.001 | 1.11 (1.061.1) | <0.001 |
| 6584 years | 1.01 (0.991.02) | 0.53 | 0.99 (0.961.02) | 0.60 |
| 85+ years | Reference | Reference | ||
| Sex | ||||
| Male | 0.97 (0.950.99) | 0.008 | 0.98 (0.961.01) | 0.19 |
| Female | Reference | Reference | ||
| Socioeconomic status | ||||
| Low | 0.98 (0.970.99) | 0.11 | ||
| Other | Reference | |||
| Residency in a nursing home | ||||
| Nursing home | 0.90 (0.880.92) | <0.001 | 0.90 (0.860.95) | <0.001 |
| All others | Reference | Reference | ||
| Common chronic conditions (reference: without condition) | ||||
| Hypertension | 0.94 (0.930.96) | <0.001 | 1.01 (0.971.04) | 0.69 |
| Ischemic heart disease | 1.00 (0.991.01) | 0.93 | 1.06 (1.031.09) | <0.001 |
| Diabetes | 0.97 (0.950.98) | 0.004 | 0.99 (0.971.02) | 0.64 |
| Arrhythmia | 0.96 (0.950.97) | 0.002 | 1.01 (0.981.04) | 0.39 |
| Chronic renal failure | 0.92 (0.910.93) | <0.001 | 0.96 (0.930.99) | 0.01 |
| Congestive heart failure | 0.93 (0.920.94) | <0.001 | 0.96 (0.930.99) | 0.01 |
| Disability | 0.86 (0.850.87) | <0.001 | 0.90 (0.870.92) | <0.001 |
| Chronic obstructive pulmonary disease | 0.99 (0.981.01) | 0.66 | ||
| Malignancy | 0.97 (0.960.98) | 0.03 | 0.98 (0.961.01) | 0.28 |
| Asthma | 1.04 (1.021.06) | 0.03 | 1.04 (1.001.07) | 0.03 |
| Charlson score | 0.99 (0.980.99) | <0.001 | 0.99 (0.991.00) | 0.04 |
| LOS during index hospitalization | ||||
| Days 24 | 1.52 (1.491.54) | <0.001 | 1.49 (1.451.54) | <0.001 |
| Days 57 | 1.21 (1.191.23) | <0.001 | 1.20 (1.161.24) | <0.001 |
| 8 days and more | Reference | Reference | ||
| Hospital size in index hospitalization | ||||
| Small, <100 beds (8) | 0.94 (0.920.97) | 0.02 | 1.00 (0.951.05) | 0.93 |
| Medium, 100200 beds (9) | 1.00 (0.991.02) | 0.78 | 1.01 (0.991.04) | 0.38 |
| Large, >200 beds (10) | Reference | Reference | ||
| Intensive care unit in readmission | ||||
| Yes | 0.75 (0.700.80) | <0.001 | 0.74 (0.690.79) | <0.001 |
| No | Reference | Reference | ||
DISCUSSION
This study shows that readmission to a different hospital results in longer duration of the readmission stay compared with readmission to the same index hospital. Our results also show that having HIE systems in both the index and readmitting hospitals does not protect against these negative outcomes, as there was no difference in the length of the readmission stay based on the availability of HIE systems. Factors that were found to be associated with longer readmission stays are well known indicators of the complexity of the patient's medical condition, such as the presence of disability, comorbidity, and ICU treatment during the readmission.[24, 27]
The shorter LORS in SHRs may be due to the familiarity of physicians and other healthcare providers with the patient and his or her condition, especially as the policy in SHRs in Israel is to readmit to the same unit from which the patient was recently discharged. This same hospital familiarity is especially important as hospital care in Israel follows the hospitalist model, in which responsibility for patient care is transferred from the patient's primary care physician to the hospital's physician, resulting in increased need for integration through HIE systems, especially when patients are readmitted to a different hospital.[28, 29]
Our findings, congruent with previous research on DHRs and poor outcomes,[7] could also be explained by the inefficiency associated with transitions. For example, patients frequently leave the hospital with pending lab tests, often with abnormal results that would change the course of care.[30] Because these pending tests are often omitted from the hospital discharge summaries,[31] if patients are hospitalized in a different hospital, the same tests may be ordered again, or a course of treatment that does not acknowledge the test results could be taken. Such time‐consuming duplication can be prevented in SHRs, where the index‐hospital records may be already more complete.
Our null findings regarding the contribution of HIE systems may be explained by the low levels of HIE actual use. Although we did not directly assess use, previous research reports that actual use of HIE is limited.[12] An Israeli study on the effects of the use of the OFEK system on ED physicians' admission decisions found that the patient's medical history was viewed in only 31.2% of all 281,750 ED referrals.[19] In another Israeli‐based ED study, even lower usage levels were found, with the OFEK system having been accessed in only 16% of all 3,219,910 ED referrals.[32] Low levels of HIE use have also been reported in the United States. An additional study, which tested the implementation of HIE in hospitals and clinics, showed that in only 2.3% of encounters did providers access the HIE record.[33] Another study conducted in 12 ED sites and 2 ambulatory clinics reported rates of 6.8% HIE use.[34] Moreover, the null effect of integrated health information reported here is congruent with findings from a US study on implementation of an electronic discharge instructions form with embedded computerized medication reconciliation, which was not found to be associated with postdischarge outcomes.[35]
A wide range of factors may influence decisions on HIE use: patient‐level factors,[36] perceived medical complexity of the patient,[33, 34] and the number of prior hospitalizations.[33, 34, 36] Healthcare systemlevel factors may include: time constraints, which may be positively[32] or negatively[33] associated with HIE use, and organizational policies or incentives.[33] Use may also be associated with features of the HIE technology itself, such as difficulty to access, difficulty to use once accessed, and the quality of information it contains.[37] Additionally, there is some evidence of the link between tight functional integration and higher proportions of usage.[38] Although comprehensive studies on factors affecting the use of the OFEK system in Israeli internal medicine units are still needed, the lack of its integration within each hospital's EHR system may serve as a major explanatory factor for the low usage levels.
The findings from this study should be interpreted in light of its limitations. First, compared with previously reported DHR rates (20%30%),[3, 5] the rate observed in our population was relatively low (about 12%). Previous research was restricted to heart failure patients[3] or assessed DHR in surgical, as well as internal medicine, patients.[5] Our lower rates may have been affected by the type of population (hospitalized internal medicine patients) and/or by characteristics of the Clalit healthcare system, which serves as an integrated provider network as well as insurer. Generalization from 1 health care system to others should be made with caution. Nonetheless, our results may underestimate the potential effect in other healthcare systems with less structural integration. Additionally, as noted above, information on the actual use of an HIE in the course of medical decision making during readmission was absent. Future studies should examine the potential benefit of an HIE with measures that capture providers' use of HIEs. Also, the LORS may be influenced by other factors not investigated here, and further future studies should examine additional outcomes such as costs, patient well‐being, and satisfaction. Finally, causality could not be determined, and future research in this realm should aim to search for the pathways connecting readmission to a different hospital, with and without HIEs, to readmission LOS and additional outcomes.
To conclude, our findings show that patients readmitted to a different hospital are at risk for prolonged LORS, regardless of the availability of HIE systems. Implementing HIE systems is the focus of substantial efforts by policymakers and is considered a key part of the meaningful use of electronic health information. HIE features in the provisions of the Health Information Technology for Economic and Clinical Health Act[39] because it can furnish providers with complete, timely information at the point of care. Moreover, although there has been substantial growth in the number of healthcare organizations that have operational an HIE, its ability to lead to improved outcomes has yet to be realized.[8, 10] The Israeli experience reported here suggests that provisions are needed that will ensure actual use of HIEs, which might in turn minimize the difference between DHRs and SHRs.
Acknowledgements
The authors acknowledge Chandra Cohen‐Stavi, MPA, and Orly Tonkikh, MA, for their contribution to this study.
Disclosures
The study was supported in part by a grant from the Israel National Institute for Health Policy Research (NIHP) (10/127). The authors report no conflicts of interest.
- , , , , , . Assessing preventability in the quest to reduce hospital readmissions. J Hosp Med. 2014;9:598–603.
- , , , et al. Preventing 30‐day hospital readmissions: a systematic review and meta‐analysis of randomized trials. JAMA Intern Med. 2014;174:1095–1107.
- , , , et al. Is same‐hospital readmission rate a good surrogate for all‐hospital readmission rate? Med Care. 2010;48:477–481.
- , , , . Hospital readmission rates: the impacts of age, payer, and mental health diagnoses. J Ambul Care Manage. 2013;36(2):147–155.
- , , , . Limitations of using same‐hospital readmission metrics. Int J Qual Health Care. 2013;25(6):633–639.
- Hospital inpatient and outpatient services. In: Report to the Congress: promoting greater efficiency in Medicare. Washington, DC: Medicare Payment Advisory Commission., March 2012;45–66.
- , , , , . For‐profit hospital status and rehospitalizations at different hospitals: an analysis of Medicare data. Ann Intern Med. 2010;153:718–727.
- , , , . Health information technology: an updated systematic review with a focus on meaningful use. Ann Intern Med. 2014;160:48–54.
- , , , . The benefits of health information technology: a review of the recent literature shows predominantly positive results. Health Aff (Millwood). 2011;30(3):464–471.
- , , . Health information exchange among US hospitals. Am J Manag Care. 2011;17:761–768.
- , , . A survey of health information exchange organizations in the United States: implications for meaningful use. Ann Intern Med. 2011;54:666–671.
- , , , , . Physicians' potential use and preferences related to health information exchange. Int J Med Inform. 2011;80:171–180.
- , , , et al. Provider stakeholders' perceived benefit from a nascent health information exchange: a qualitative analysis. J Med Syst. 2012;36:601–613.
- . More than just a question of technology: factors related to hospitals' adoption and implementation of health information exchange. Int J Med Inform. 2010;79:797–806.
- , , . Leveraging health information technology to achieve the “triple aim” of healthcare reform. J Am Med Inform Assoc. 2015;22(4):849–856.
- , , , , , . Health information exchange reduces repeated diagnostic imaging for back pain. Ann Emerg Med. 2013;62:16–24.
- , , , , . Association between use of a health information exchange system and hospital admissions. Appl Clin Inform. 2014;5:219.
- , , . The impact of EHR and HIE on reducing avoidable admissions: controlling main differential diagnoses. BMC Med Inform Decis Mak. 2013;13:49.
- , , , et al. The impact of an integrated hospital‐community medical information system on quality and service utilization in hospital departments. Int J Med Inform. 2010;79(9):649–657.
- , , , , , Predicting 30‐day readmissions with preadmission electronic health record data. Med Care. 2015;53:283–289.
- , , , , . Assessing socioeconomic health care utilization inequity in Israel: impact of alternative approaches to morbidity adjustment. BMC Public Health. 2011;11(1):609.
- , . Prevalence of selected chronic diseases in Israel. Isr Med Assoc J. 2001;3:404–408.
- , , , . A new method of classifying prognostic comorbidity in longitudinal studies: development and validation. J Chron Dis. 1987;40:373–383.
- , , , , . Systematic review of risk adjustment models of hospital length of stay (LOS). Med Care. 2015;53:355–365.
- , . Use of ranks in one‐criterion variance analysis. J Am Stat Assoc. 1952;47:583–621.
- , , . Regression analysis of multivariate incomplete failure time data by modeling marginal distributions. J Am Stat Assoc. 1989;84:1065–1073.
- , , , , , . Disability impacts length of stay in general internal medicine patients. J Gen Intern Med. 2014;29:885–890.
- . The hospitalist movement—time to move on. N Engl J Med. 2007;357:2627–2629.
- , , . Association of hospitalist presence and hospital‐level outcome measures among Medicare patients. J Hosp Med. 2014;9:1–6.
- , , , et al. Patient safety concerns arising from test results that return after hospital discharge. Ann Intern Med. 2005;143:121–128.
- , , , et al. Adequacy of hospital discharge summaries in documenting tests with pending results and outpatient follow‐up providers. J Gen Intern Med. 2009;24:1002–1006.
- , , . Using electronic medical record systems for admission decisions in emergency departments: examining the crowdedness effect. J Med Syst. 2012;36:3795–3803.
- , , , , , . Factors motivating and affecting health information exchange usage. J Am Med Inform Assoc. 2011;18(2):143–149.
- , , , et al. Health information exchange usage in emergency departments and clinics: the who, what, and why. J Am Med Inform Assoc. 2011;18:690–697.
- , , , , . Effect of standardized electronic discharge instructions on post‐discharge hospital utilization. J Gen Intern Med. 2011;26:718–723.
- , , . Health information exchange technology on the front lines of healthcare: workflow factors and patterns of use. J Am Med Inform Assoc. 2012;19:392–400.
- , . The DeLone and McLean model of information systems success: a ten‐year update. J Manag Inf Syst. 2003;19:9–30.
- , , , et al. Architectural strategies and issues with health information exchange. AMIA Annu Symp Proc. 2006:814–818.
- . Launching HITECH. N Engl J Med. 2010;362(5):382–385.
Readmissions within a relatively short time after discharge are receiving considerable attention as an area of quality improvement,[1, 2] with increasing emphasis on the relatively large share of readmissions to different hospitals, accounting for 20% to 30% of all readmissions.[3, 4, 5, 6] Returning to a different hospital may affect patient and healthcare outcomes due to breaches in continuity. When information from the previous recent hospitalization is not transferred efficiently and accurately to the next admitting hospital, omissions and duplications can occur, resulting in delayed care and potentially worse outcomes (compared to same hospital readmissions [SHRs]), such as longer length of readmission stay (LORS) and increased costs.[7]
Electronic health records (EHRs) and health information exchange (HIE) systems are increasingly used for storage and retrieval of patient information from various sources, such as laboratories and previous physician visits and hospitalizations, enabling informational continuity by providing vital historical medical information for decision‐making. Whereas EHRs collect, store, and present information that is locally created within a specific clinic or hospital, HIEs connect EHR systems between multiple institutions, allowing providers to share clinical data and achieve interorganizational continuity. Such integrative systems are increasingly being implemented across healthcare systems worldwide.[8, 9, 10] Yet, technical difficulties, costs, competitive concerns, data privacy, and workflow implementation challenges have been described as hindering HIE participation.[11, 12, 13, 14] Moreover, major concerns exist regarding the poor usability of EHRs, their limited ability to support multidisciplinary care, and major difficulties in achieving interoperability with HIEs, which undermine efforts to deliver integrated patient‐centered care.[15] Nonetheless, previous research has demonstrated that HIEs can positively affect healthcare resource use and outcomes, including reduced rates of repeated diagnostic imaging in the emergency evaluation of back pain,[16] reduction in admissions via the emergency department (ED),[17] and reduced rates of readmissions within 7 days.[18] However, it is not known whether HIEs can contribute to positive outcomes when patients are readmitted to a different hospital than the hospital from which they were recently (within the previous 30 days) discharged, potentially bridging the transitional‐care information divide.
In Israel, an innovative HIE system, OFEK (literally horizon), was implemented in 2005 at the largest not‐for‐profit insurer and provider of services, Clalit Health Services (Clalit). Clalit operates as an integrated healthcare delivery system, serving more than 50% of the Israeli population, as part of the country's national health insurance system. OFEK links information on all Clalit enrollees from all hospitals, primary care, and specialty care clinics, laboratories, and diagnostic services into a single, virtual, patient file, enabling providers to obtain complete, real‐time information needed for healthcare decision making at the point of care. Like similar HIE systems, OFEK includes information on previous medical encounters and hospitalizations, previous diagnoses, chronically prescribed medications, previous lab and imaging tests, known allergies, and some demographic information.[19] At the time of this study, OFEK was available in all Clalit hospitals as well as in 2 non‐Clalit (government‐owned and operated) large tertiary‐care centers, resulting in 40% coverage of all hospitalizations through the OFEK HIE system. As part of a large organization‐wide readmission reduction program recently implemented by Clalit for all its members admitted to any hospital in Israel, aimed at early detection and intervention,[20] OFEK was viewed as an important mechanism to help maintain continuity and improve transitions.
To inform current knowledge on different‐hospital readmissions (DHRs) and HIEs, we examined whether having HIE systems can contribute to information continuity and prevent delays in care and the need for more expensive, lengthy readmission stays when patients are readmitted to a different hospital. More specifically, we tested whether there is a difference in the LORS between SHRs and DHRs, and whether DHRs the LORS differ by the availability of an HIE (whether index and readmitting hospital are or are not connected through HIE systems).
METHODS
Study Design and Setting
We conducted a retrospective cohort study based on data of hospitalized Clalit members. Clalit has a centralized data warehouse with a comprehensive EHR containing data on all patients' medical encounters, administrative data, and clinical data compiled from laboratories, imaging centers, and hospitals. At the time of the study, OFEK was operating in all 8 Clalit hospitals and in 2 large government‐owned and operated hospitals in the central and northern parts of the country. Information is linked in the Clalit system and OFEK‐affiliated hospitals through an individual identity number assigned by the Israeli Interior Ministry to every Israeli resident for general identification purposes.
Population
The study examined all internal medicine and intensive‐care unit (ICU) readmissions of adult Clalit members (aged 18 years and older) previously (within the prior 30 days) discharged from internal medicine departments during January 1, 2010 until December 31, 2010 (ie, index hospitalizations). Only readmissions of index hospitalizations with more than a 24‐hour stay were included. A total of 146,266 index hospitalizations met the inclusion criteria. Index admissions that resulted in a transfer to another hospital, a long‐term care facility, or rehabilitation center were not included (N = 11,831). The final study sample included 27,057 readmissions (20.1% of the 134,435 index admissions), which could have resulted in any type of discharge (to patient's home, a long‐term care or rehabilitation facility, or due to death). The study was approved by Clalit's institutional review board.
Outcome Variable
We defined the LORS as the number of days from admission to discharge during readmission.
Main Independent Variable
We assessed information continuity as a categorical variable in which 0 = no information continuity (DHRs with either no HIE at either hospital or an HIE in only 1 of the hospitals), 1 = information continuity through an HIE (DHRs with both hospitals having an HIE), and 2 = full information continuity (readmission to the same hospital).
Covariates
We examined the following known correlates of length of stay (LOS): age, gender, residency in a nursing home, socioeconomic status (SES) based on an indicator of social security entitlement received by low‐income members,[21] and the occurrence of common chronic conditions registered in Clalit's EHR registries[22]: congestive heart failure (CHF), chronic obstructive pulmonary disease (COPD), chronic renal failure (CRF), malignancy, diabetes, hypertension, ischemic heart disease, atrial fibrillation, asthma, and disability (indication of a functional limitation). To provide comorbidity adjustment we used the Charlson Comorbidity Index.[23] Additionally, we assessed LOS of the index hospitalization. We included an indicator for the size of the index hospital: small, fewer than 100 beds; medium, 100 to 200 beds; and large, more than 200 beds. Finally, to account for a well‐known correlate of length of hospital stay,[24] we included an indicator for an ICU stay during the readmission.
Statistical Analysis
We first examined the study populations' characteristics and calculated the average LORS for each SHR and DHR category. Due to the skewed distribution of LORS, we also calculated the median and interquartile range (IQR) of LORS and evaluated the difference between categories using the Kruskall‐Wallis test.[25] Sample‐size calculations showed that we would need a sample of >3000 admissions to have 80% power to detect a difference of 0.8 hospitalization days given the 1:3 ratio between the DHR groups. To examine the association between LORS and information continuity, we employed a univariate marginal Cox model.[26] Variables that were significantly (P < 0.05) associated with LORS in the univariate model were entered into a multivariate marginal Cox model, clustering by patient and using a robust sandwich covariance matrix estimate. Additionally, we performed a sensitivity analysis using hierarchichal modeling to account for potential variations due to hospital level factors. A low hazard ratio (<1) represented an association of the covariate with decreased likelihood of discharge, that is, longer LORS. All analyses were conducted with SPSS version 20 (IBM, Armonk, NY) and SAS version 9.3 (SAS Institute Inc., Cary, NC).
RESULTS
The study included a total of 27,057 readmissions, of which 23,927 (88.4%) were SHRs and 3130 (11.6%) were DHRs. Of all DHRs, in 792 (2.9%) of the cases, both hospitals had HIEs (partial information continuity), and in 2338 (8.6%), either 1 or both did not have an HIE system (thus meaning there was no information continuity). Characteristics of the study population are shown in Table 1. Most (75%) of the readmissions were of patients over the age of 65 years, though only 7% were nursing home residents. More than half the study's population consisted of patients with low SES. The most common chronic conditions were hypertension (77%), ischemic heart disease (52%), and diabetes (48%). Other chronic conditions were arrhythmia (38%), CHF (35%), disability (31%), COPD (28%), malignancy (28%), and asthma (16%). In more than 55% of the index hospitalizations, the LOS was 4 days or less, and most index admissions (64%) were in large hospitals. Table 1 also displays the study population by the type of readmission: SHR, DHR with HIE, and DHR without HIE. As compared to patients readmitted to the same hospital, patients with DHRs were younger (P < 0.001), less likely to be nursing home residents (P < 0.001), and had longer LOS during the index admission (P < 0.001). Additionally, patients with SHRs were more likely to have their index admission at a large hospital (P < 0.001), had a higher comorbidity score (P < 0.043), and were less likely be treated in the ICU during their readmission (P < 0.001) compared to their DHR counterparts. Patients with DHRs without an HIE were similar in most characteristics to those with an HIE, except for having an ICU stay during their readmission (6.4% compared with 9.2%, respectively).
| Characteristics | All Readmissions, n = 27,057 | SHR, n = 23,927 | DHR With HIE, n = 792 | DHR Without HIE, n = 2,338 | P Value |
|---|---|---|---|---|---|
| |||||
| All personal characteristics | |||||
| Age, n (%) | <0.001 | ||||
| 1844 years | 1,328 (4.9) | 1,095 (4.6) | 58 (7.3) | 175 (7.5) | |
| 4564 years | 5,370 (19.8) | 4,597 (19.2) | 197 (24.9) | 576 (24.6) | |
| 6584 years | 14,059 (52.0) | 12,500 (52.2) | 402 (50.8) | 1,157 (49.5) | |
| 85+ years | 6,300 (23.3) | 5,735 (24.0) | 135 (17.0) | 430 (18.4) | |
| Female sex, n (%) | 13,742 (50.8) | 12,040 (50.3) | 418 (52.8) | 1,284 (54.9) | <0.001 |
| Low socioeconomic status, n (%) | 15,473 (57.2) | 13,670 (57.1) | 453 (57.2) | 1,350 (57.7) | |
| Residency in a nursing home, n (%) | 1,857 (6.9) | 1,743 (7.3) | 27 (3.4) | 87 (3.7) | <0.001 |
| Common chronic conditions, n (%) | |||||
| Hypertension | 20,797 (76.9) | 18,484 (77.3) | 588 (74.2) | 1,725 (73.8) | <0.001 |
| Ischemic heart disease | 14,150 (52.3) | 12,577 (52.6) | 397 (50.1) | 1,176 (50.3) | 0.052 |
| Diabetes | 13,052 (48.2) | 11,589 (48.4) | 345 (43.6) | 1,118 (47.8) | 0.024 |
| Arrhythmia | 10,306 (38.1) | 9,197 (38.4) | 292 (36.9) | 817 (34.9) | 0.003 |
| Chronic renal failure | 9,486 (35.1) | 8,454 (35.3) | 262 (33.1) | 770 (32.9) | 0.034 |
| Congestive heart failure | 9,216 (34.1) | 8,232 (34.4) | 270 (34.1) | 714 (30.5) | 0.001 |
| Disability | 8,362 (30.9) | 7,600 (31.8) | 165 (20.8) | 597 (25.5) | <0.001 |
| Chronic obstructive pulmonary disease | 7,671 (28.4) | 6,888 (28.8) | 201 (25.4) | 582 (24.9) | <0.001 |
| Malignancy | 7,642 (28.2) | 6,763 (28.3) | 220 (27.8) | 659 (28.2) | 0.954 |
| Asthma | 4,491 (16.6) | 4,040 (16.9) | 109 (13.8) | 342 (14.6) | 0.002 |
| Charlson score, mean [SD] | 4.54 [3.15] | 4.58 [3.14] | 4.14 [3.08] | 4.25 [3.24] | 0.043 |
| Index hospitalization characteristics (LOS during index hospitalization), n (%) | <0.001 | ||||
| 24 days | 14,961 (55.3) | 13,310 (55.6) | 428 (54.0) | 1,223 (52.3) | |
| 57 days | 6,366 (23.5) | 5,654 (23.6) | 174 (22.0) | 538 (23.0) | |
| 8 days and more | 5,730 (21.2) | 4,963 (20.7) | 190 (24.0) | 577 (24.7) | |
| Hospital size in index hospitalization (no. of hospitals in each category), n (%) | <0.001 | ||||
| Small, <100 beds (8) | 1,498 (5.5) | 1,166 (4.9) | 23 (2.9) | 309 (13.2) | |
| Medium, 100200 beds (9) | 8,129 (30.0) | 7,113 (29.7) | 316 (39.9) | 700 (29.9) | |
| Large, >200 beds (10) | 17,430 (64.4) | 15,648 (65.4) | 453 (57.2) | 1,329 (56.8) | |
| Intensive care unit during readmission, n (%) | 869 (3.2) | 647 (2.7) | 73 (9.2) | 149 (6.4) | <0.001 |
The mean LORS in SHRs was shorter by 1 day than the mean LORS for DHRs: 6.3 (95% confidence interval [CI]: 6.2‐6.4) versus 7.3 (95% CI: 7.0‐7.6), respectively. Mean LORS in DHRs with or without HIE was 7.6 (95% CI: 7.0‐8.3) and 7.2 (95% CI: 6.8‐7.6), respectively. Although median LORS was similar (4 days), the IQR differed, resulting in significant differences between the SHR and DHR groups (Table 2).
| Information Continuity | No. of Readmissions | Mean LORS (95% CI) | Median (Q1Q3) | Kruskal‐Wallis P Value |
|---|---|---|---|---|
| ||||
| SHRs | 23,927 (88.4) | 6.3 (6.26.4) | 4 (27) | |
| DHRs | 3,130 (11.6) | 7.3 (7.07.6) | 4 (28) | |
| DHRs with HIE | 792 (2.9) | 7.6 (7.08.3) | 4 (29) | |
| DHRs without HIE | 2,338 (8.7) | 7.2 (6.87.6) | 4 (28) | |
| Total | 27,057 | 6.4 (6.36.5) | 4 (27) | <0.001 |
In the multivariate model, partial continuity (DHRs with an HIE) was associated with decreased likelihood of discharge on any given day compared with full continuity (SHR) (hazard ratio [HR] = 0.85, 95% CI: 0.79‐0.91). Similar results were obtained for no continuity (DHRs without an HIE) (HR = 0.90, 95% CI: 0.86‐0.94). The difference between DHRs with and without an HIE was not significant (overlapping confidence intervals). Other factors associated with a lower HR for discharge during each day of the readmission were older age, residency in a nursing home, CHF, CRF, disability, malignancy, and long LOS (8+ days) during the index hospitalization. Patients with asthma or ischemic heart disease had a higher HR for discharge during each readmission day (Table 3). We performed a sensitivity analysis using hierarchical modeling (patients nested within hospitals), which resulted in similar findings in terms of directionality and magnitude of the relationships and significance levels.
| Characteristics | Univariate Model | Multivariate Model | ||
|---|---|---|---|---|
| Hazard Ratio (95% CI) | P Value | Hazard Ratio (95% CI) | P Value | |
| ||||
| Information continuity | ||||
| SHR | Reference | Reference | ||
| DHR with HIE | 0.87 (0.810.93) | <0.001 | 0.86 (0.800.93) | <0.001 |
| DHR without HIE | 0.91 (0.870.94) | <0.001 | 0.90 (0.870.94) | <0.001 |
| Age | ||||
| 844 years | 1.22 (1.181.26) | <0.001 | 1.14 (1.071.22) | <0.001 |
| 4564 years | 1.16 (1.141.18) | <0.001 | 1.11 (1.061.1) | <0.001 |
| 6584 years | 1.01 (0.991.02) | 0.53 | 0.99 (0.961.02) | 0.60 |
| 85+ years | Reference | Reference | ||
| Sex | ||||
| Male | 0.97 (0.950.99) | 0.008 | 0.98 (0.961.01) | 0.19 |
| Female | Reference | Reference | ||
| Socioeconomic status | ||||
| Low | 0.98 (0.970.99) | 0.11 | ||
| Other | Reference | |||
| Residency in a nursing home | ||||
| Nursing home | 0.90 (0.880.92) | <0.001 | 0.90 (0.860.95) | <0.001 |
| All others | Reference | Reference | ||
| Common chronic conditions (reference: without condition) | ||||
| Hypertension | 0.94 (0.930.96) | <0.001 | 1.01 (0.971.04) | 0.69 |
| Ischemic heart disease | 1.00 (0.991.01) | 0.93 | 1.06 (1.031.09) | <0.001 |
| Diabetes | 0.97 (0.950.98) | 0.004 | 0.99 (0.971.02) | 0.64 |
| Arrhythmia | 0.96 (0.950.97) | 0.002 | 1.01 (0.981.04) | 0.39 |
| Chronic renal failure | 0.92 (0.910.93) | <0.001 | 0.96 (0.930.99) | 0.01 |
| Congestive heart failure | 0.93 (0.920.94) | <0.001 | 0.96 (0.930.99) | 0.01 |
| Disability | 0.86 (0.850.87) | <0.001 | 0.90 (0.870.92) | <0.001 |
| Chronic obstructive pulmonary disease | 0.99 (0.981.01) | 0.66 | ||
| Malignancy | 0.97 (0.960.98) | 0.03 | 0.98 (0.961.01) | 0.28 |
| Asthma | 1.04 (1.021.06) | 0.03 | 1.04 (1.001.07) | 0.03 |
| Charlson score | 0.99 (0.980.99) | <0.001 | 0.99 (0.991.00) | 0.04 |
| LOS during index hospitalization | ||||
| Days 24 | 1.52 (1.491.54) | <0.001 | 1.49 (1.451.54) | <0.001 |
| Days 57 | 1.21 (1.191.23) | <0.001 | 1.20 (1.161.24) | <0.001 |
| 8 days and more | Reference | Reference | ||
| Hospital size in index hospitalization | ||||
| Small, <100 beds (8) | 0.94 (0.920.97) | 0.02 | 1.00 (0.951.05) | 0.93 |
| Medium, 100200 beds (9) | 1.00 (0.991.02) | 0.78 | 1.01 (0.991.04) | 0.38 |
| Large, >200 beds (10) | Reference | Reference | ||
| Intensive care unit in readmission | ||||
| Yes | 0.75 (0.700.80) | <0.001 | 0.74 (0.690.79) | <0.001 |
| No | Reference | Reference | ||
DISCUSSION
This study shows that readmission to a different hospital results in longer duration of the readmission stay compared with readmission to the same index hospital. Our results also show that having HIE systems in both the index and readmitting hospitals does not protect against these negative outcomes, as there was no difference in the length of the readmission stay based on the availability of HIE systems. Factors that were found to be associated with longer readmission stays are well known indicators of the complexity of the patient's medical condition, such as the presence of disability, comorbidity, and ICU treatment during the readmission.[24, 27]
The shorter LORS in SHRs may be due to the familiarity of physicians and other healthcare providers with the patient and his or her condition, especially as the policy in SHRs in Israel is to readmit to the same unit from which the patient was recently discharged. This same hospital familiarity is especially important as hospital care in Israel follows the hospitalist model, in which responsibility for patient care is transferred from the patient's primary care physician to the hospital's physician, resulting in increased need for integration through HIE systems, especially when patients are readmitted to a different hospital.[28, 29]
Our findings, congruent with previous research on DHRs and poor outcomes,[7] could also be explained by the inefficiency associated with transitions. For example, patients frequently leave the hospital with pending lab tests, often with abnormal results that would change the course of care.[30] Because these pending tests are often omitted from the hospital discharge summaries,[31] if patients are hospitalized in a different hospital, the same tests may be ordered again, or a course of treatment that does not acknowledge the test results could be taken. Such time‐consuming duplication can be prevented in SHRs, where the index‐hospital records may be already more complete.
Our null findings regarding the contribution of HIE systems may be explained by the low levels of HIE actual use. Although we did not directly assess use, previous research reports that actual use of HIE is limited.[12] An Israeli study on the effects of the use of the OFEK system on ED physicians' admission decisions found that the patient's medical history was viewed in only 31.2% of all 281,750 ED referrals.[19] In another Israeli‐based ED study, even lower usage levels were found, with the OFEK system having been accessed in only 16% of all 3,219,910 ED referrals.[32] Low levels of HIE use have also been reported in the United States. An additional study, which tested the implementation of HIE in hospitals and clinics, showed that in only 2.3% of encounters did providers access the HIE record.[33] Another study conducted in 12 ED sites and 2 ambulatory clinics reported rates of 6.8% HIE use.[34] Moreover, the null effect of integrated health information reported here is congruent with findings from a US study on implementation of an electronic discharge instructions form with embedded computerized medication reconciliation, which was not found to be associated with postdischarge outcomes.[35]
A wide range of factors may influence decisions on HIE use: patient‐level factors,[36] perceived medical complexity of the patient,[33, 34] and the number of prior hospitalizations.[33, 34, 36] Healthcare systemlevel factors may include: time constraints, which may be positively[32] or negatively[33] associated with HIE use, and organizational policies or incentives.[33] Use may also be associated with features of the HIE technology itself, such as difficulty to access, difficulty to use once accessed, and the quality of information it contains.[37] Additionally, there is some evidence of the link between tight functional integration and higher proportions of usage.[38] Although comprehensive studies on factors affecting the use of the OFEK system in Israeli internal medicine units are still needed, the lack of its integration within each hospital's EHR system may serve as a major explanatory factor for the low usage levels.
The findings from this study should be interpreted in light of its limitations. First, compared with previously reported DHR rates (20%30%),[3, 5] the rate observed in our population was relatively low (about 12%). Previous research was restricted to heart failure patients[3] or assessed DHR in surgical, as well as internal medicine, patients.[5] Our lower rates may have been affected by the type of population (hospitalized internal medicine patients) and/or by characteristics of the Clalit healthcare system, which serves as an integrated provider network as well as insurer. Generalization from 1 health care system to others should be made with caution. Nonetheless, our results may underestimate the potential effect in other healthcare systems with less structural integration. Additionally, as noted above, information on the actual use of an HIE in the course of medical decision making during readmission was absent. Future studies should examine the potential benefit of an HIE with measures that capture providers' use of HIEs. Also, the LORS may be influenced by other factors not investigated here, and further future studies should examine additional outcomes such as costs, patient well‐being, and satisfaction. Finally, causality could not be determined, and future research in this realm should aim to search for the pathways connecting readmission to a different hospital, with and without HIEs, to readmission LOS and additional outcomes.
To conclude, our findings show that patients readmitted to a different hospital are at risk for prolonged LORS, regardless of the availability of HIE systems. Implementing HIE systems is the focus of substantial efforts by policymakers and is considered a key part of the meaningful use of electronic health information. HIE features in the provisions of the Health Information Technology for Economic and Clinical Health Act[39] because it can furnish providers with complete, timely information at the point of care. Moreover, although there has been substantial growth in the number of healthcare organizations that have operational an HIE, its ability to lead to improved outcomes has yet to be realized.[8, 10] The Israeli experience reported here suggests that provisions are needed that will ensure actual use of HIEs, which might in turn minimize the difference between DHRs and SHRs.
Acknowledgements
The authors acknowledge Chandra Cohen‐Stavi, MPA, and Orly Tonkikh, MA, for their contribution to this study.
Disclosures
The study was supported in part by a grant from the Israel National Institute for Health Policy Research (NIHP) (10/127). The authors report no conflicts of interest.
- , , , , , . Assessing preventability in the quest to reduce hospital readmissions. J Hosp Med. 2014;9:598–603.
- , , , et al. Preventing 30‐day hospital readmissions: a systematic review and meta‐analysis of randomized trials. JAMA Intern Med. 2014;174:1095–1107.
- , , , et al. Is same‐hospital readmission rate a good surrogate for all‐hospital readmission rate? Med Care. 2010;48:477–481.
- , , , . Hospital readmission rates: the impacts of age, payer, and mental health diagnoses. J Ambul Care Manage. 2013;36(2):147–155.
- , , , . Limitations of using same‐hospital readmission metrics. Int J Qual Health Care. 2013;25(6):633–639.
- Hospital inpatient and outpatient services. In: Report to the Congress: promoting greater efficiency in Medicare. Washington, DC: Medicare Payment Advisory Commission., March 2012;45–66.
- , , , , . For‐profit hospital status and rehospitalizations at different hospitals: an analysis of Medicare data. Ann Intern Med. 2010;153:718–727.
- , , , . Health information technology: an updated systematic review with a focus on meaningful use. Ann Intern Med. 2014;160:48–54.
- , , , . The benefits of health information technology: a review of the recent literature shows predominantly positive results. Health Aff (Millwood). 2011;30(3):464–471.
- , , . Health information exchange among US hospitals. Am J Manag Care. 2011;17:761–768.
- , , . A survey of health information exchange organizations in the United States: implications for meaningful use. Ann Intern Med. 2011;54:666–671.
- , , , , . Physicians' potential use and preferences related to health information exchange. Int J Med Inform. 2011;80:171–180.
- , , , et al. Provider stakeholders' perceived benefit from a nascent health information exchange: a qualitative analysis. J Med Syst. 2012;36:601–613.
- . More than just a question of technology: factors related to hospitals' adoption and implementation of health information exchange. Int J Med Inform. 2010;79:797–806.
- , , . Leveraging health information technology to achieve the “triple aim” of healthcare reform. J Am Med Inform Assoc. 2015;22(4):849–856.
- , , , , , . Health information exchange reduces repeated diagnostic imaging for back pain. Ann Emerg Med. 2013;62:16–24.
- , , , , . Association between use of a health information exchange system and hospital admissions. Appl Clin Inform. 2014;5:219.
- , , . The impact of EHR and HIE on reducing avoidable admissions: controlling main differential diagnoses. BMC Med Inform Decis Mak. 2013;13:49.
- , , , et al. The impact of an integrated hospital‐community medical information system on quality and service utilization in hospital departments. Int J Med Inform. 2010;79(9):649–657.
- , , , , , Predicting 30‐day readmissions with preadmission electronic health record data. Med Care. 2015;53:283–289.
- , , , , . Assessing socioeconomic health care utilization inequity in Israel: impact of alternative approaches to morbidity adjustment. BMC Public Health. 2011;11(1):609.
- , . Prevalence of selected chronic diseases in Israel. Isr Med Assoc J. 2001;3:404–408.
- , , , . A new method of classifying prognostic comorbidity in longitudinal studies: development and validation. J Chron Dis. 1987;40:373–383.
- , , , , . Systematic review of risk adjustment models of hospital length of stay (LOS). Med Care. 2015;53:355–365.
- , . Use of ranks in one‐criterion variance analysis. J Am Stat Assoc. 1952;47:583–621.
- , , . Regression analysis of multivariate incomplete failure time data by modeling marginal distributions. J Am Stat Assoc. 1989;84:1065–1073.
- , , , , , . Disability impacts length of stay in general internal medicine patients. J Gen Intern Med. 2014;29:885–890.
- . The hospitalist movement—time to move on. N Engl J Med. 2007;357:2627–2629.
- , , . Association of hospitalist presence and hospital‐level outcome measures among Medicare patients. J Hosp Med. 2014;9:1–6.
- , , , et al. Patient safety concerns arising from test results that return after hospital discharge. Ann Intern Med. 2005;143:121–128.
- , , , et al. Adequacy of hospital discharge summaries in documenting tests with pending results and outpatient follow‐up providers. J Gen Intern Med. 2009;24:1002–1006.
- , , . Using electronic medical record systems for admission decisions in emergency departments: examining the crowdedness effect. J Med Syst. 2012;36:3795–3803.
- , , , , , . Factors motivating and affecting health information exchange usage. J Am Med Inform Assoc. 2011;18(2):143–149.
- , , , et al. Health information exchange usage in emergency departments and clinics: the who, what, and why. J Am Med Inform Assoc. 2011;18:690–697.
- , , , , . Effect of standardized electronic discharge instructions on post‐discharge hospital utilization. J Gen Intern Med. 2011;26:718–723.
- , , . Health information exchange technology on the front lines of healthcare: workflow factors and patterns of use. J Am Med Inform Assoc. 2012;19:392–400.
- , . The DeLone and McLean model of information systems success: a ten‐year update. J Manag Inf Syst. 2003;19:9–30.
- , , , et al. Architectural strategies and issues with health information exchange. AMIA Annu Symp Proc. 2006:814–818.
- . Launching HITECH. N Engl J Med. 2010;362(5):382–385.
© 2015 Society of Hospital Medicine
Female Athletes: Unique Challenges Facing Women Warriors
Since Title IX passed in 1972, women have become exponentially more involved in competitive sports, from high school to professional levels. With more women engaging in serious athletics, the specific challenges they face have come to the forefront of sports medicine. These problems include the female athlete triad, concussions, exercise safety in pregnancy, anterior cruciate ligament (ACL) injuries, and continued sex discrimination and social injustice. Orthopedists treating female athletes should be aware of these problems, each of which is discussed in this review.
1. Female athlete triad
In 1992, the term female athlete triad was coined to describe 3 problems that often coexist in high-intensity female athletes.1 Since then, the definition has evolved, but the problem has remained essentially the same. The modern definition incorporates menstrual abnormalities, low energy availability with or without disordered eating, and decreased bone mineral density (BMD).2
With intense exercise and weight loss comes a variety of menstrual disturbances.3 In affected athletes, the hypothalamus is underactivated, and changes in gonadotropin-releasing hormone and luteinizing hormone lead to decreased estrogen production. Research suggests abnormal menses result from having inadequate energy and insufficient caloric intake to support extensive exercise.1 This phenomenon can occur in athletes in any sport but is most prevalent in lean-body sports, such as swimming, gymnastics, and ballet. The incidence of abnormal menses is as high as 79% in ballet dancers but only 5% in the general population.3 Menstrual abnormalities indicate hormonal abnormalities that can interfere with growth and maturation in young athletes.
Although full-blown eating disorders are uncommon among female athletes, disordered eating patterns are often found among women in competitive sports. Disordered eating can involve a spectrum of inadequate caloric intake and purging behavior, such as vomiting or laxative abuse, and has been reported in up to 25% of collegiate female athletes.4 Physicians must recognize these conditions and initiate counseling and treatment when appropriate. Women with disordered eating are at risk for developing electrolyte imbalances, malnutrition syndromes, and osteopenia.
Although careful evaluation and counseling are important, physicians must note that, in most cases, athletics participation may also protect against disordered eating and body image difficulties. A study of 146 college-age women found better body satisfaction among athletes than among nonathletes.5 Lean-sport athletes (eg, swimmers, gymnasts) were at higher risk for disordered eating and body image problems than other athletes were. Similarly, other studies have found that a majority of athletes have healthy eating habits.4
For poorly nourished and hormonally imbalanced female athletes, decreased BMD poses substantial risk. One study found a significant difference in BMD between athletes with amenorrhea and athletes with normal menses.6 In a cohort of female Navy recruits, those with amenorrhea were at 91% higher risk for stress fractures; calcium and vitamin D supplementation reduced risk by 20%.7 Osteopenia may be a special problem for prepubescent athletes. Girls who engage in intense exercise and have delayed menarche may have a low estrogen state, predisposing them to low BMD.3 Osteopenia and osteoporosis are difficult to reverse and can put these athletes at risk for stress fractures the rest of their lives. If unrecognized, stress fractures can end an athlete’s career.
Recommendations for dual-energy X-ray absorptiometry (DXA) include testing female athletes who have a diagnosed eating disorder, body mass index under 17.5, history of delayed menarche, oligomenorrhea, 2 prior stress fractures, or prior abnormal DXA scan. Complete testing recommendations appear in the 2014 consensus statement on the female athlete triad and return to sport.2,8
Orthopedists performing physical examinations for sports participation can screen for the female athlete triad through thoughtful questioning about menstrual history, nutrition habits, and stress fracture symptoms. Best treatment for a diagnosed case of the triad is multidisciplinary care with strong social support. When abnormal menses are an issue, referral to a gynecologist or endocrinologist and consideration of estrogen replacement should be discussed. Some cases require a psychiatrist’s assistance in treating disordered eating. Athletic trainers, coaches, and parents should be involved over the treatment course.1 Orthopedists must counsel women with osteopenia and osteoporosis about decreasing exercise to a safe level, improving nutritional intake, and supplementing with calcium (1200-1500 mg/d) and vitamin D (600-800 IU/d).3,7
2. Concussions
Increasing awareness of males’ sport-related concussions, particularly of concussions that occur during National Football League practice and games, has made physicians and researchers more aware of the rate of concussion in female athletes. That rate has increased, and, according to some reports, the risk for sport-related injury is higher for female athletes.9 A study of high school athletes found that the rate of concussion in girl’s soccer was second only to that in football.10
Concussions are categorized as mild traumatic brain injuries, and manifestations of the diagnosis are divided into physical, emotional, cognitive, and observed symptoms. The spectrum of symptoms is wide, ranging from difficulty concentrating and thinking clearly to headaches and dizziness.11 Compared with male athletes who sustain a concussion, female athletes report more of these concussive symptoms and have worse visual memory scores.12
Efforts to change sports at the player level have been resisted. Helmets have been proposed for field hockey and lacrosse but have not passed stringent concussion testing. In soccer, which has a high rate of concussion, a reform to eliminate heading the ball has been considered. Resistance to these suggestions stems from the thought that changes could alter the traditions of the games. Some individuals have indicated that helmets may give players a false sense of security and thereby cause them to play more aggressively.
Orthopedic surgeons must be aware of concussion symptoms. Multiple concussions may have a cumulative effect on functional ability and emotional well-being and may lead to chronic traumatic encephalopathy.13 Concern about the long-term effects of concussion has led to the implementation of universal “return to play” laws. These laws vary by state but have 3 steps in common: Educate coaches, players, and athletes; remove athletes from play; and obtain health care professionals’ permission to return to play.14 These guidelines set up an action plan for treating an athlete who has sustained a concussion.
Encouraging results of educating coaches have been noted. Coaches who were given Centers for Disease Control and Prevention–sponsored material on preventing, recognizing, and responding to concussions were able to effectively address concussions; 6 months later, 63% were better able to appreciate the severity of concussions.15 Continued education of athletic communities should help bring this injury to the attention of those treating female athletes.
3. Exercise safety in pregnancy
Women in sports can continue their athletic regimens during pregnancy. It is important to address challenges to the pregnant woman and to the fetus when assessing the risks of exercise.
The physiologic changes that occur during pregnancy may affect how a pregnant athlete responds to stress. Plasma volume, red blood cell volume, and cardiac function and output all increase during normal pregnancy.3,16 Abnormal heart rate during pregnancy can adversely affect the fetus. During and after exercise, fetal bradycardia can occur. Therefore, recommendations should include not exceeding pre-pregnancy activity levels.3 Careful monitoring of exercise intensity is recommended by the American College of Obstetrics and Gynecology; the guideline is to maintain less than 70% of maximal heart rate.17,18
The negative effects of exercise on the pregnant athlete are limited, but it is important to educate patients and to consider preventive strategies. One physiologic change that occurs during pregnancy is ligamentous laxity, which is caused by the hormone relaxin.16 Ligamentous laxity has the potential to put pregnant athletes at risk for soft-tissue and bony injury during impact sports. However, the positive effects of exercise during pregnancy include improved appetite, sleep, and emotional health.19 Aerobic exercise during pregnancy may reverse insulin resistance as demonstrated in animal studies; though this outcome has not been demonstrated in human studies,20 women should be reassured that moderate exercise has overall beneficial effects.
Some research suggests that exercise may expose the fetus to hyperthermia, blood sugar changes, physical injury, and premature labor.16 Typically, fetal heat is dissipated from the mother. After intense exercise, maternal body temperature rises and leads to some degree of fetal hyperthermia.16 Animal model studies have suggested that hyperthermia may result in a slightly higher rate of congenital abnormalities. Pregnant women should keep their exercise routines to less than 60 minutes, should exercise in a thermally regulated environment, and should keep themselves hydrated to avoid fetal hyperthermia.18
Reduced blood flow, accompanied by a deficit of oxygen to the uterus and the developing fetus, is another concern for pregnant athletes. During exercise, when more blood is flowing to the muscles, less is flowing to the uterus.16 Furthermore, during the third trimester, women should avoid supine exercise, as venous outflow is poor with the body in that position.21
Elite athletes who continue training during pregnancy should be carefully counseled about adjusting their training regimens. Because of increased cardiac output and blood volume, the heart rate will be lower than usual, demanding an adjustment in interpretation. Blood cell counts do not increase as much as plasma volume does—often leading to relative anemia. For elite athletes, this means iron supplementation is crucial.22 Thermal regulation may be more difficult, as training regimens may demand prolonged exercise. Physicians should recommend adequate hydration for these athletes.18
Although continued exercise is generally safe for a pregnant athlete and her fetus, caution is required when there is increased risk for premature delivery, or other special conditions exist. Multiple gestation, placenta previa, history of early labor or premature births, and incompetent cervix all contraindicate aerobic exercise during pregnancy.18 With these exceptions in mind, physicians can safely counsel pregnant women to do moderate exercise 30 minutes every day.17,18 Other recommendations are listed at the American College of Obstetricians and Gynecologists website.23
4. Anterior cruciate ligament injuries
ACL injuries affect a staggering number of athletes. In the United States, approximately 100,000 people sustain these injuries annually.24 As they occur up to 8 times more often in women than in men, ACL injuries are a top concern for physicians treating female athletes.
This disproportionate injury rate is influenced by differences between male and female anatomy. The width and shape of the femoral intercondylar notch have been studied as potential variables influencing the risk for ACL injury. Analysis of notch-view radiographs revealed a significant inverse relationship between notch width and ACL injury.25 A-shaped notches, notches with a significantly larger base and a narrowed roof, were more prevalent in women but did not correlate with increased risk for ACL injury. Studies have shown that female athletes with a noncontact ACL injury have a higher lateral tibial plateau posterior slope; this slope is associated with increased peak anteromedial ACL strain, which may contribute to injury.26 An analysis of magnetic resonance imaging scans in patients with and without ACL injury revealed that, for female patients, decreased femoral intercondylar notch width at the anterior outlet combined with increased lateral compartment posterior slope correlated best with risk for ACL injury.27
Although static anatomical factors contribute to ACL injuries in female athletes, dynamic neuromuscular influences are potential opportunities for intervention. Female athletes with high relative quadriceps strength and weak hamstring strength may be at increased risk for ACL injury.28 This “quadriceps dominance” becomes important in sports involving high-risk activities, such as running, cutting, pivoting, and jumping. In addition, compared with male athletes, female athletes demonstrate increased lateral trunk motion and knee valgus torque while landing during noncontact ACL tears, making core stability a factor in ACL injury.29
The collaborative efforts of physicians, physical therapists, athletic trainers, and coaches have yielded multifactorial neuromuscular training programs for the prevention of noncontact ACL injuries. Ideal ACL prevention protocols involve sessions that last for at least 10 minutes and take place 3 times a week. At these sessions, exercises are focused on strengthening, balance, and proprioceptive training.30 The programs last about 8 weeks, but sustained benefits require maintenance after the program has been completed and during the off-season. Program adherence must be encouraged and can be facilitated by varying workouts and raising risk awareness. The most effective programs have reduced the relative risk of noncontact ACL injuries by 75% to 100%.31 These promising results have led to increased focus on program implementation in an effort to prevent ACL injury.
5. Continued sex discrimination and social injustice
In 1972, Title IX was passed as part of the Education Amendments Act. Title IX states, “No person in the United States shall, on the basis of sex, be excluded from participation in, be denied the benefits of, or be subjected to discrimination under any educational program or activity receiving Federal financial assistance.” Passage of this law, which has implications outside of athletic participation, marked an important turning point in women’s ability to participate equally in college sports.32,33 The Civil Rights Restoration Act, passed in 1988, strengthened Title IX and made it applicable to all institutions receiving federal funding.34 Before the 1970s, women typically were restricted to club sports, and funding and participation opportunities were weighted heavily toward men. Over the past 40 years, women’s participation in high school, college, and professional sports has taken a huge leap forward.32 For example, the number of women participating in high school sports increased from 294,000 (7.4% of all athletes) in 1972 to 3.4 million (>41% of all athletes) in 2014.
Despite advances in women’s civil rights, examples of inequality in US schools remain, particularly in the distribution of funding, which still strongly favors men’s football.32 Men’s sports receive 90% of media coverage.33 In 2002, women represented 55% of college students but only 42% of varsity athletes.34 The schools that have complied the least with Title IX are schools in the Midwest and the South and those with football teams.34 Women are underrepresented as coaches, and funding continues to be disproportionately spent on men’s sports.
For women, the benefits of participating in sports are far-reaching and significant. These benefits include improvements in academic success, mental health, and responsible behavior.33 Women’s gaining acceptance and respect throughout the athletic world seems to have carried over elsewhere. Although many institutions remain noncompliant with Title IX, efforts continue to have a strongly positive effect on gender equality in the United States.
1. Nattiv A, Loucks AB, Manore MM, Sanborn CF, Sundgot-Borgen J, Warren MP; American College of Sports Medicine. American College of Sports Medicine position stand. The female athlete triad. Med Sci Sports Exerc. 2007;39(10):1867-1882.
2. De Souza MJ, Nattiv A, Joy E, et al; Expert Panel. 2014 Female Athlete Triad Coalition consensus statement on treatment and return to play of the female athlete triad: 1st international conference held in San Francisco, California, May 2012 and 2nd international conference held in Indianapolis, Indiana, May 2013. Br J Sports Med. 2014;48(4):289.
3. Warren MP, Shantha S. The female athlete. Baillieres Best Pract Res Clin Endocrinol Metab. 2000;14(1):37-53.
4. Greenleaf C, Petrie TA, Carter J, Reel JJ. Female collegiate athletes: prevalence of eating disorders and disordered eating behaviors. J Am Coll Health. 2009;57(5):489-495.
5. Reinking MF, Alexander LE. Prevalence of disordered-eating behaviors in undergraduate female collegiate athletes and nonathletes. J Athl Train. 2005;40(1):47-51.
6. Rencken ML, Chesnut CH 3rd, Drinkwater BL. Bone density at multiple skeletal sites in amenorrheic athletes. JAMA. 1996;276(3):238-240.
7. Lappe J, Cullen D, Haynatzki G, Recker R, Ahlf R, Thompson K. Calcium and vitamin D supplementation decreases incidence of stress fractures in female Navy recruits. J Bone Miner Res. 2008;23(5):741-749.
8. De Souza MJ. 2014 Female athlete triad consensus statement on guidelines for treatment and return to play. National Collegiate Athletic Association (NCAA) website. http://www.ncaa.org/health-and-safety/nutrition-and-performance/2014-female-athlete-triad-consensus-statement-guidelines. Accessed November 24, 2015.
9. Preiss-Farzanegan SJ, Chapman B, Wong TM, Wu J, Bazarian JJ. The relationship between gender and postconcussion symptoms after sport-related mild traumatic brain injury. PM R. 2009;1(3):245-253.
10. Marar M, McIlvain NM, Fields SK, Comstock RD. Epidemiology of concussions among United States high school athletes in 20 sports. Am J Sports Med. 2012;40(4):747-755.
11. Uhl RL, Rosenbaum AJ, Czajka C, Mulligan M, King C. Minor traumatic brain injury: a primer for the orthopaedic surgeon. J Am Acad Orthop Surg. 2013;21(10):624-631.
12. Covassin T, Elbin RJ, Harris W, Parker T, Kontos A. The role of age and sex in symptoms, neurocognitive performance, and postural stability in athletes after concussion. Am J Sports Med. 2012;40(6):1303-1312.
13. Covassin T, Moran R, Wilhelm K. Concussion symptoms and neurocognitive performance of high school and college athletes who incur multiple concussions. Am J Sports Med. 2013;41(12):2885-2889.
14. Sports concussion policies and laws: information for parents, coaches, and school & sports professionals. Centers for Disease Control and Prevention website. http://www.cdc.gov/headsup/policy/index.html. Updated February 16, 2015. Accessed November 24, 2015.
15. Covassin T, Elbin RJ, Sarmiento K. Educating coaches about concussion in sports: evaluation of the CDC’s “Heads Up: concussion in youth sports” initiative. J Sch Health. 2012;82(5):233-238.
16. Lumbers ER. Exercise in pregnancy: physiological basis of exercise prescription for the pregnant woman. J Sci Med Sport. 2002;5(1):20-31.
17. ACOG Committee Obstetric Practice. ACOG Committee opinion. Number 267, January 2002: exercise during pregnancy and the postpartum period. Obstet Gynecol. 2002;99(1):171-173.
18. Artal R, O’Toole M. Guidelines of the American College of Obstetricians and Gynecologists for exercise during pregnancy and the postpartum period. Br J Sports Med. 2003;37(1):6-12.
19. Kramer MS. Regular aerobic exercise during pregnancy. Cochrane Database Syst Rev. 2000;(2):CD000180. Update in: Cochrane Database Syst Rev. 2002;(2):CD000180.
20. Stafne SN, Salvesen KA, Romundstad PR, Stuge B, Morkved S. Does regular exercise during pregnancy influence lumbopelvic pain? A randomized controlled trial. Acta Obstet Gynecol Scand. 2012;91(5):552-559.
21. Nascimento SL, Surita FG, Cecatti JG. Physical exercise during pregnancy: a systematic review. Curr Opin Obstet Gynecol. 2012;24(6):387-394.
22. Hale RW, Milne L. The elite athlete and exercise in pregnancy. Semin Perinatol. 1996;20(4):277-284.
23. Exercise during pregnancy. American College of Obstetricians and Gynecologists website. http://www.acog.org/Patients/FAQs/Exercise-During-Pregnancy. Published August 2011. Accessed November 24, 2015.
24. Giugliano DN, Solomon JL. ACL tears in female athletes. Phys Med Rehabil Clin North Am. 2007;18(3):417-438, viii.
25. Ireland ML, Ballantyne BT, Little K, McClay IS. A radiographic analysis of the relationship between the size and shape of the intercondylar notch and anterior cruciate ligament injury. Knee Surg Sports Traumatol Arthrosc. 2001;9(4):200-205.
26. Lipps DB, Oh YK, Ashton-Miller JA, Wojtys EM. Morphologic characteristics help explain the gender difference in peak anterior cruciate ligament strain during a simulated pivot landing. Am J Sports Med. 2012;40(1):32-40.
27. Sturnick DR, Vacek PM, DeSarno MJ, et al. Combined anatomic factors predicting risk of anterior cruciate ligament injury for males and females. Am J Sports Med. 2015;43(4):839-847.
28. Myer GD, Ford KR, Barber Foss KD, Liu C, Nick TG, Hewett TE. The relationship of hamstrings and quadriceps strength to anterior cruciate ligament injury in female athletes. Clin J Sport Med. 2009;19(1):3-8.
29. Hewett TE, Torg JS, Boden BP. Video analysis of trunk and knee motion during non-contact anterior cruciate ligament injury in female athletes: lateral trunk and knee abduction motion are combined components of the injury mechanism. Br J Sports Med. 2009;43(6):417-422.
30. Sutton KM, Bullock JM. Anterior cruciate ligament rupture: differences between males and females. J Am Acad Orthop Surg. 2013;21(1):41-50.
31. Noyes FR, Barber-Westin SD. Neuromuscular retraining intervention programs: do they reduce noncontact anterior cruciate ligament injury rates in adolescent female athletes? Arthroscopy. 2014;30(2):245-255.
32. Ladd AL. The sports bra, the ACL, and Title IX—the game in play. Clin Orthop Relat Res. 2014;472(6):1681-1684.
33. Lopiano DA. Modern history of women in sports. Twenty-five years of Title IX. Clin Sports Med. 2000;19(2):163-173, vii.
34. Anderson DJ, Cheslock JJ, Ehrenberg RG. Gender equity in intercollegiate athletics: determinants of Title IX compliance. J High Educ. 2006;77(2):225-250.
Since Title IX passed in 1972, women have become exponentially more involved in competitive sports, from high school to professional levels. With more women engaging in serious athletics, the specific challenges they face have come to the forefront of sports medicine. These problems include the female athlete triad, concussions, exercise safety in pregnancy, anterior cruciate ligament (ACL) injuries, and continued sex discrimination and social injustice. Orthopedists treating female athletes should be aware of these problems, each of which is discussed in this review.
1. Female athlete triad
In 1992, the term female athlete triad was coined to describe 3 problems that often coexist in high-intensity female athletes.1 Since then, the definition has evolved, but the problem has remained essentially the same. The modern definition incorporates menstrual abnormalities, low energy availability with or without disordered eating, and decreased bone mineral density (BMD).2
With intense exercise and weight loss comes a variety of menstrual disturbances.3 In affected athletes, the hypothalamus is underactivated, and changes in gonadotropin-releasing hormone and luteinizing hormone lead to decreased estrogen production. Research suggests abnormal menses result from having inadequate energy and insufficient caloric intake to support extensive exercise.1 This phenomenon can occur in athletes in any sport but is most prevalent in lean-body sports, such as swimming, gymnastics, and ballet. The incidence of abnormal menses is as high as 79% in ballet dancers but only 5% in the general population.3 Menstrual abnormalities indicate hormonal abnormalities that can interfere with growth and maturation in young athletes.
Although full-blown eating disorders are uncommon among female athletes, disordered eating patterns are often found among women in competitive sports. Disordered eating can involve a spectrum of inadequate caloric intake and purging behavior, such as vomiting or laxative abuse, and has been reported in up to 25% of collegiate female athletes.4 Physicians must recognize these conditions and initiate counseling and treatment when appropriate. Women with disordered eating are at risk for developing electrolyte imbalances, malnutrition syndromes, and osteopenia.
Although careful evaluation and counseling are important, physicians must note that, in most cases, athletics participation may also protect against disordered eating and body image difficulties. A study of 146 college-age women found better body satisfaction among athletes than among nonathletes.5 Lean-sport athletes (eg, swimmers, gymnasts) were at higher risk for disordered eating and body image problems than other athletes were. Similarly, other studies have found that a majority of athletes have healthy eating habits.4
For poorly nourished and hormonally imbalanced female athletes, decreased BMD poses substantial risk. One study found a significant difference in BMD between athletes with amenorrhea and athletes with normal menses.6 In a cohort of female Navy recruits, those with amenorrhea were at 91% higher risk for stress fractures; calcium and vitamin D supplementation reduced risk by 20%.7 Osteopenia may be a special problem for prepubescent athletes. Girls who engage in intense exercise and have delayed menarche may have a low estrogen state, predisposing them to low BMD.3 Osteopenia and osteoporosis are difficult to reverse and can put these athletes at risk for stress fractures the rest of their lives. If unrecognized, stress fractures can end an athlete’s career.
Recommendations for dual-energy X-ray absorptiometry (DXA) include testing female athletes who have a diagnosed eating disorder, body mass index under 17.5, history of delayed menarche, oligomenorrhea, 2 prior stress fractures, or prior abnormal DXA scan. Complete testing recommendations appear in the 2014 consensus statement on the female athlete triad and return to sport.2,8
Orthopedists performing physical examinations for sports participation can screen for the female athlete triad through thoughtful questioning about menstrual history, nutrition habits, and stress fracture symptoms. Best treatment for a diagnosed case of the triad is multidisciplinary care with strong social support. When abnormal menses are an issue, referral to a gynecologist or endocrinologist and consideration of estrogen replacement should be discussed. Some cases require a psychiatrist’s assistance in treating disordered eating. Athletic trainers, coaches, and parents should be involved over the treatment course.1 Orthopedists must counsel women with osteopenia and osteoporosis about decreasing exercise to a safe level, improving nutritional intake, and supplementing with calcium (1200-1500 mg/d) and vitamin D (600-800 IU/d).3,7
2. Concussions
Increasing awareness of males’ sport-related concussions, particularly of concussions that occur during National Football League practice and games, has made physicians and researchers more aware of the rate of concussion in female athletes. That rate has increased, and, according to some reports, the risk for sport-related injury is higher for female athletes.9 A study of high school athletes found that the rate of concussion in girl’s soccer was second only to that in football.10
Concussions are categorized as mild traumatic brain injuries, and manifestations of the diagnosis are divided into physical, emotional, cognitive, and observed symptoms. The spectrum of symptoms is wide, ranging from difficulty concentrating and thinking clearly to headaches and dizziness.11 Compared with male athletes who sustain a concussion, female athletes report more of these concussive symptoms and have worse visual memory scores.12
Efforts to change sports at the player level have been resisted. Helmets have been proposed for field hockey and lacrosse but have not passed stringent concussion testing. In soccer, which has a high rate of concussion, a reform to eliminate heading the ball has been considered. Resistance to these suggestions stems from the thought that changes could alter the traditions of the games. Some individuals have indicated that helmets may give players a false sense of security and thereby cause them to play more aggressively.
Orthopedic surgeons must be aware of concussion symptoms. Multiple concussions may have a cumulative effect on functional ability and emotional well-being and may lead to chronic traumatic encephalopathy.13 Concern about the long-term effects of concussion has led to the implementation of universal “return to play” laws. These laws vary by state but have 3 steps in common: Educate coaches, players, and athletes; remove athletes from play; and obtain health care professionals’ permission to return to play.14 These guidelines set up an action plan for treating an athlete who has sustained a concussion.
Encouraging results of educating coaches have been noted. Coaches who were given Centers for Disease Control and Prevention–sponsored material on preventing, recognizing, and responding to concussions were able to effectively address concussions; 6 months later, 63% were better able to appreciate the severity of concussions.15 Continued education of athletic communities should help bring this injury to the attention of those treating female athletes.
3. Exercise safety in pregnancy
Women in sports can continue their athletic regimens during pregnancy. It is important to address challenges to the pregnant woman and to the fetus when assessing the risks of exercise.
The physiologic changes that occur during pregnancy may affect how a pregnant athlete responds to stress. Plasma volume, red blood cell volume, and cardiac function and output all increase during normal pregnancy.3,16 Abnormal heart rate during pregnancy can adversely affect the fetus. During and after exercise, fetal bradycardia can occur. Therefore, recommendations should include not exceeding pre-pregnancy activity levels.3 Careful monitoring of exercise intensity is recommended by the American College of Obstetrics and Gynecology; the guideline is to maintain less than 70% of maximal heart rate.17,18
The negative effects of exercise on the pregnant athlete are limited, but it is important to educate patients and to consider preventive strategies. One physiologic change that occurs during pregnancy is ligamentous laxity, which is caused by the hormone relaxin.16 Ligamentous laxity has the potential to put pregnant athletes at risk for soft-tissue and bony injury during impact sports. However, the positive effects of exercise during pregnancy include improved appetite, sleep, and emotional health.19 Aerobic exercise during pregnancy may reverse insulin resistance as demonstrated in animal studies; though this outcome has not been demonstrated in human studies,20 women should be reassured that moderate exercise has overall beneficial effects.
Some research suggests that exercise may expose the fetus to hyperthermia, blood sugar changes, physical injury, and premature labor.16 Typically, fetal heat is dissipated from the mother. After intense exercise, maternal body temperature rises and leads to some degree of fetal hyperthermia.16 Animal model studies have suggested that hyperthermia may result in a slightly higher rate of congenital abnormalities. Pregnant women should keep their exercise routines to less than 60 minutes, should exercise in a thermally regulated environment, and should keep themselves hydrated to avoid fetal hyperthermia.18
Reduced blood flow, accompanied by a deficit of oxygen to the uterus and the developing fetus, is another concern for pregnant athletes. During exercise, when more blood is flowing to the muscles, less is flowing to the uterus.16 Furthermore, during the third trimester, women should avoid supine exercise, as venous outflow is poor with the body in that position.21
Elite athletes who continue training during pregnancy should be carefully counseled about adjusting their training regimens. Because of increased cardiac output and blood volume, the heart rate will be lower than usual, demanding an adjustment in interpretation. Blood cell counts do not increase as much as plasma volume does—often leading to relative anemia. For elite athletes, this means iron supplementation is crucial.22 Thermal regulation may be more difficult, as training regimens may demand prolonged exercise. Physicians should recommend adequate hydration for these athletes.18
Although continued exercise is generally safe for a pregnant athlete and her fetus, caution is required when there is increased risk for premature delivery, or other special conditions exist. Multiple gestation, placenta previa, history of early labor or premature births, and incompetent cervix all contraindicate aerobic exercise during pregnancy.18 With these exceptions in mind, physicians can safely counsel pregnant women to do moderate exercise 30 minutes every day.17,18 Other recommendations are listed at the American College of Obstetricians and Gynecologists website.23
4. Anterior cruciate ligament injuries
ACL injuries affect a staggering number of athletes. In the United States, approximately 100,000 people sustain these injuries annually.24 As they occur up to 8 times more often in women than in men, ACL injuries are a top concern for physicians treating female athletes.
This disproportionate injury rate is influenced by differences between male and female anatomy. The width and shape of the femoral intercondylar notch have been studied as potential variables influencing the risk for ACL injury. Analysis of notch-view radiographs revealed a significant inverse relationship between notch width and ACL injury.25 A-shaped notches, notches with a significantly larger base and a narrowed roof, were more prevalent in women but did not correlate with increased risk for ACL injury. Studies have shown that female athletes with a noncontact ACL injury have a higher lateral tibial plateau posterior slope; this slope is associated with increased peak anteromedial ACL strain, which may contribute to injury.26 An analysis of magnetic resonance imaging scans in patients with and without ACL injury revealed that, for female patients, decreased femoral intercondylar notch width at the anterior outlet combined with increased lateral compartment posterior slope correlated best with risk for ACL injury.27
Although static anatomical factors contribute to ACL injuries in female athletes, dynamic neuromuscular influences are potential opportunities for intervention. Female athletes with high relative quadriceps strength and weak hamstring strength may be at increased risk for ACL injury.28 This “quadriceps dominance” becomes important in sports involving high-risk activities, such as running, cutting, pivoting, and jumping. In addition, compared with male athletes, female athletes demonstrate increased lateral trunk motion and knee valgus torque while landing during noncontact ACL tears, making core stability a factor in ACL injury.29
The collaborative efforts of physicians, physical therapists, athletic trainers, and coaches have yielded multifactorial neuromuscular training programs for the prevention of noncontact ACL injuries. Ideal ACL prevention protocols involve sessions that last for at least 10 minutes and take place 3 times a week. At these sessions, exercises are focused on strengthening, balance, and proprioceptive training.30 The programs last about 8 weeks, but sustained benefits require maintenance after the program has been completed and during the off-season. Program adherence must be encouraged and can be facilitated by varying workouts and raising risk awareness. The most effective programs have reduced the relative risk of noncontact ACL injuries by 75% to 100%.31 These promising results have led to increased focus on program implementation in an effort to prevent ACL injury.
5. Continued sex discrimination and social injustice
In 1972, Title IX was passed as part of the Education Amendments Act. Title IX states, “No person in the United States shall, on the basis of sex, be excluded from participation in, be denied the benefits of, or be subjected to discrimination under any educational program or activity receiving Federal financial assistance.” Passage of this law, which has implications outside of athletic participation, marked an important turning point in women’s ability to participate equally in college sports.32,33 The Civil Rights Restoration Act, passed in 1988, strengthened Title IX and made it applicable to all institutions receiving federal funding.34 Before the 1970s, women typically were restricted to club sports, and funding and participation opportunities were weighted heavily toward men. Over the past 40 years, women’s participation in high school, college, and professional sports has taken a huge leap forward.32 For example, the number of women participating in high school sports increased from 294,000 (7.4% of all athletes) in 1972 to 3.4 million (>41% of all athletes) in 2014.
Despite advances in women’s civil rights, examples of inequality in US schools remain, particularly in the distribution of funding, which still strongly favors men’s football.32 Men’s sports receive 90% of media coverage.33 In 2002, women represented 55% of college students but only 42% of varsity athletes.34 The schools that have complied the least with Title IX are schools in the Midwest and the South and those with football teams.34 Women are underrepresented as coaches, and funding continues to be disproportionately spent on men’s sports.
For women, the benefits of participating in sports are far-reaching and significant. These benefits include improvements in academic success, mental health, and responsible behavior.33 Women’s gaining acceptance and respect throughout the athletic world seems to have carried over elsewhere. Although many institutions remain noncompliant with Title IX, efforts continue to have a strongly positive effect on gender equality in the United States.
1. Nattiv A, Loucks AB, Manore MM, Sanborn CF, Sundgot-Borgen J, Warren MP; American College of Sports Medicine. American College of Sports Medicine position stand. The female athlete triad. Med Sci Sports Exerc. 2007;39(10):1867-1882.
2. De Souza MJ, Nattiv A, Joy E, et al; Expert Panel. 2014 Female Athlete Triad Coalition consensus statement on treatment and return to play of the female athlete triad: 1st international conference held in San Francisco, California, May 2012 and 2nd international conference held in Indianapolis, Indiana, May 2013. Br J Sports Med. 2014;48(4):289.
3. Warren MP, Shantha S. The female athlete. Baillieres Best Pract Res Clin Endocrinol Metab. 2000;14(1):37-53.
4. Greenleaf C, Petrie TA, Carter J, Reel JJ. Female collegiate athletes: prevalence of eating disorders and disordered eating behaviors. J Am Coll Health. 2009;57(5):489-495.
5. Reinking MF, Alexander LE. Prevalence of disordered-eating behaviors in undergraduate female collegiate athletes and nonathletes. J Athl Train. 2005;40(1):47-51.
6. Rencken ML, Chesnut CH 3rd, Drinkwater BL. Bone density at multiple skeletal sites in amenorrheic athletes. JAMA. 1996;276(3):238-240.
7. Lappe J, Cullen D, Haynatzki G, Recker R, Ahlf R, Thompson K. Calcium and vitamin D supplementation decreases incidence of stress fractures in female Navy recruits. J Bone Miner Res. 2008;23(5):741-749.
8. De Souza MJ. 2014 Female athlete triad consensus statement on guidelines for treatment and return to play. National Collegiate Athletic Association (NCAA) website. http://www.ncaa.org/health-and-safety/nutrition-and-performance/2014-female-athlete-triad-consensus-statement-guidelines. Accessed November 24, 2015.
9. Preiss-Farzanegan SJ, Chapman B, Wong TM, Wu J, Bazarian JJ. The relationship between gender and postconcussion symptoms after sport-related mild traumatic brain injury. PM R. 2009;1(3):245-253.
10. Marar M, McIlvain NM, Fields SK, Comstock RD. Epidemiology of concussions among United States high school athletes in 20 sports. Am J Sports Med. 2012;40(4):747-755.
11. Uhl RL, Rosenbaum AJ, Czajka C, Mulligan M, King C. Minor traumatic brain injury: a primer for the orthopaedic surgeon. J Am Acad Orthop Surg. 2013;21(10):624-631.
12. Covassin T, Elbin RJ, Harris W, Parker T, Kontos A. The role of age and sex in symptoms, neurocognitive performance, and postural stability in athletes after concussion. Am J Sports Med. 2012;40(6):1303-1312.
13. Covassin T, Moran R, Wilhelm K. Concussion symptoms and neurocognitive performance of high school and college athletes who incur multiple concussions. Am J Sports Med. 2013;41(12):2885-2889.
14. Sports concussion policies and laws: information for parents, coaches, and school & sports professionals. Centers for Disease Control and Prevention website. http://www.cdc.gov/headsup/policy/index.html. Updated February 16, 2015. Accessed November 24, 2015.
15. Covassin T, Elbin RJ, Sarmiento K. Educating coaches about concussion in sports: evaluation of the CDC’s “Heads Up: concussion in youth sports” initiative. J Sch Health. 2012;82(5):233-238.
16. Lumbers ER. Exercise in pregnancy: physiological basis of exercise prescription for the pregnant woman. J Sci Med Sport. 2002;5(1):20-31.
17. ACOG Committee Obstetric Practice. ACOG Committee opinion. Number 267, January 2002: exercise during pregnancy and the postpartum period. Obstet Gynecol. 2002;99(1):171-173.
18. Artal R, O’Toole M. Guidelines of the American College of Obstetricians and Gynecologists for exercise during pregnancy and the postpartum period. Br J Sports Med. 2003;37(1):6-12.
19. Kramer MS. Regular aerobic exercise during pregnancy. Cochrane Database Syst Rev. 2000;(2):CD000180. Update in: Cochrane Database Syst Rev. 2002;(2):CD000180.
20. Stafne SN, Salvesen KA, Romundstad PR, Stuge B, Morkved S. Does regular exercise during pregnancy influence lumbopelvic pain? A randomized controlled trial. Acta Obstet Gynecol Scand. 2012;91(5):552-559.
21. Nascimento SL, Surita FG, Cecatti JG. Physical exercise during pregnancy: a systematic review. Curr Opin Obstet Gynecol. 2012;24(6):387-394.
22. Hale RW, Milne L. The elite athlete and exercise in pregnancy. Semin Perinatol. 1996;20(4):277-284.
23. Exercise during pregnancy. American College of Obstetricians and Gynecologists website. http://www.acog.org/Patients/FAQs/Exercise-During-Pregnancy. Published August 2011. Accessed November 24, 2015.
24. Giugliano DN, Solomon JL. ACL tears in female athletes. Phys Med Rehabil Clin North Am. 2007;18(3):417-438, viii.
25. Ireland ML, Ballantyne BT, Little K, McClay IS. A radiographic analysis of the relationship between the size and shape of the intercondylar notch and anterior cruciate ligament injury. Knee Surg Sports Traumatol Arthrosc. 2001;9(4):200-205.
26. Lipps DB, Oh YK, Ashton-Miller JA, Wojtys EM. Morphologic characteristics help explain the gender difference in peak anterior cruciate ligament strain during a simulated pivot landing. Am J Sports Med. 2012;40(1):32-40.
27. Sturnick DR, Vacek PM, DeSarno MJ, et al. Combined anatomic factors predicting risk of anterior cruciate ligament injury for males and females. Am J Sports Med. 2015;43(4):839-847.
28. Myer GD, Ford KR, Barber Foss KD, Liu C, Nick TG, Hewett TE. The relationship of hamstrings and quadriceps strength to anterior cruciate ligament injury in female athletes. Clin J Sport Med. 2009;19(1):3-8.
29. Hewett TE, Torg JS, Boden BP. Video analysis of trunk and knee motion during non-contact anterior cruciate ligament injury in female athletes: lateral trunk and knee abduction motion are combined components of the injury mechanism. Br J Sports Med. 2009;43(6):417-422.
30. Sutton KM, Bullock JM. Anterior cruciate ligament rupture: differences between males and females. J Am Acad Orthop Surg. 2013;21(1):41-50.
31. Noyes FR, Barber-Westin SD. Neuromuscular retraining intervention programs: do they reduce noncontact anterior cruciate ligament injury rates in adolescent female athletes? Arthroscopy. 2014;30(2):245-255.
32. Ladd AL. The sports bra, the ACL, and Title IX—the game in play. Clin Orthop Relat Res. 2014;472(6):1681-1684.
33. Lopiano DA. Modern history of women in sports. Twenty-five years of Title IX. Clin Sports Med. 2000;19(2):163-173, vii.
34. Anderson DJ, Cheslock JJ, Ehrenberg RG. Gender equity in intercollegiate athletics: determinants of Title IX compliance. J High Educ. 2006;77(2):225-250.

Patient-Directed Valgus Stress Radiograph of the Knee: A New and Novel Technique
Medial-compartment partial knee arthroplasty (unicompartmental replacement) is an accepted surgical intervention for anteromedial osteoarthritis of the knee.1 The radiographic investigations required in the workup of these patients should include weight-bearing standing anteroposterior (AP), lateral, and sunrise (Merchant) views, as well as a valgus stress AP radiograph to assess the functionality of the lateral compartment. The method of properly obtaining the valgus stress film has been well described by the Oxford Group.2 Its recommended radiographic technique requires that a surgeon or a radiologic technologist perform the valgus stress maneuver, manually, while another technologist shoots the film. The 2 consequences of this technique are that it requires 2 individuals to obtain the film, and it subjects the individual who is applying the stress to some level of radiation exposure, which is undesirable. Because of this and the time inconvenience, many surgeons omit the valgus stress radiograph, which can lead to the adverse outcome of missing a lateral compartment that is functionally incompetent, resulting in the potential for early lateral compartment progression of osteoarthritis and the need for revision surgery, usually to a total knee arthroplasty.
In an attempt to mitigate these barriers to obtaining the necessary valgus stress radiograph, Dr. Mauerhan’s team developed a technique that could be done with the assistance of the patient and would require only 1 technologist to perform. Additionally, this project was a quality improvement initiative, because it lowered radiation exposure to all personnel involved in obtaining the correct films.
Materials and Methods
We initiated the project using weight-bearing strategies to impart the valgus stress view of the knee. After trying several different wedges and blocks, and varying patient instructions, we realized a different approach to this problem would be required to find an acceptable solution. We redirected our efforts to effectively performing the stress view with the patient in a supine position on the radiograph table. Ultimately, we decided that a much stiffer wedge and a denser object to squeeze would facilitate obtaining a proper film. Considering all available options, a youth size 4 soccer ball (diameter, 11 in) was introduced along with a slightly larger positioning wedge. The soccer ball was wrapped with 4-in Coban wrap (3M) to create a nonslip surface. This change in patient positioning, along with a standardized 7º to 10º cephalic radiographic tube angulation, helped to correct issues with tibial plateau visualization. Once these changes were enacted, we obtained fairly consistent positive results, and we instituted this patient-directed valgus stress view of the knee, along with a manual valgus stress view for comparison.
The protocol for obtaining the patient-directed valgus stress view of the knee is as follows: The patient lays supine with a dense 45º spine-positioning wedge (Burlington Medical Supplies) placed under both knees and the patient’s heels on the examining table. The radiographic tube is angled cephalad 7º to 10º centered on the inferior pole of the patella, using a 40-in source to image-receptor distance, collimated to part; the image receptor is placed under the affected knee, below the positioning wedge. The affected knee is rotated to the “true” AP position (the patella will be centered between the femoral condyles on the AP exposure), and the ball is placed between the patient’s legs just above the ankle joint. The technologist demonstrates to the patient how to squeeze the ball while maintaining contact of heels with the table. The technologist can exit the room and obtain the exposure, which is taken while the patient is squeezing the ball, as shown in Figures 1A and 1B. Examples of the standing AP, manual stress, and patient-directed valgus radiographs are shown in Figures 2A-2C. The entire technique is demonstrated in the Video.

Results
During the 9 months of this quality improvement project, 78 examinations were performed. Five studies did not show complete correction of the varus deformity. Of these, 3 showed complete correction on a manual valgus stress radiograph, and 2 did not, contraindicating the use of partial knee replacement. Three patients displayed collapse of the lateral compartment, indicating a nonfunctional lateral compartment, and, therefore, were also a contraindication to partial knee arthroplasty. The remaining 70 patients had identical radiographic results with both the manual and patient-directed valgus stress tests. There was no instance of examination failure or need to repeat as a result of difficulty of the examination for the patient. Repeat films because of positioning errors were very rare, usually early in the learning curve, and no more prevalent than when using the manual stress method. The technique was reproducible and easy to teach and adopt.
Discussion
In total, 73 patients (93.5%) with the patient-directed stress film showed the desired result, either correction of the medial compartment narrowing in conjunction with an intact lateral compartment or narrowing of the lateral compartment. Of the 5 patients (6.5%) whose patient-directed stress films did not show correction of the varus deformity, 3 patients displayed correction with a manually applied stress radiograph and 2 did not. Based on this observation, our recommendation would be for those patients who do not show adequate correction on the patient-directed stress radiograph to have a manual examination to establish the presence or absence of the desired correction.
Performing a valgus stress radiograph is an integral part of the investigation to determine if the patient is an appropriate candidate for partial knee arthroplasty.3 The historical, manually performed valgus stress radiograph requires 2 individuals, 1 to apply the stress with the patient on the table and 1 to shoot the exposure. For the individual or individuals applying this stress, there is an increased radiation exposure that would be undesirable over a long career. The authors developed a new technique using a commercially available spinal positioning wedge and 11-in youth soccer ball wrapped with Coban wrap, as described, which is economical and easy to obtain and use in the clinical setting. We believe this cost-effective method will offer surgeons who perform partial knee arthroplasty a novel method to obtain the important information gleaned from the valgus stress radiograph and to improve surgical outcomes through the preoperative assessment of the lateral compartment. Additionally, as a quality and safety improvement initiative, we believe this technique will reduce radiographic exposure for those performing these studies, and, because the examination can be carried out by a single technologist, it will significantly improve efficiency in the radiology suite.
Conclusion
We have developed a new method of obtaining the important valgus stress radiograph as part of the workup of patients with medial-compartment osteoarthritis of the knee. The technique can be performed with easily obtainable, commercially available products and is reliable 93.5% of the time. It also adds to the efficiency of the radiology suite and reduces radiographic exposure for technologists.
1. White SH, Ludkowski PF, Goodfellow JW. Anteromedial osteoarthritis of the knee. J Bone Joint Surg Br. 1991;73(4):582-586.
2. Goodfellow JW, O’Conner JJ, Dodd CA, Murray DW. Unicompartmental Arthroplasty with the Oxford Knee. Woodeaton, Oxford, England: Goodfellow Publishers Limited; 2006:38-39.
3. Gibson PH, Goodfellow JW. Stress radiography in degenerative arthritis of the knee. J Bone Joint Surg Br. 1986;68(4):608-609.
Medial-compartment partial knee arthroplasty (unicompartmental replacement) is an accepted surgical intervention for anteromedial osteoarthritis of the knee.1 The radiographic investigations required in the workup of these patients should include weight-bearing standing anteroposterior (AP), lateral, and sunrise (Merchant) views, as well as a valgus stress AP radiograph to assess the functionality of the lateral compartment. The method of properly obtaining the valgus stress film has been well described by the Oxford Group.2 Its recommended radiographic technique requires that a surgeon or a radiologic technologist perform the valgus stress maneuver, manually, while another technologist shoots the film. The 2 consequences of this technique are that it requires 2 individuals to obtain the film, and it subjects the individual who is applying the stress to some level of radiation exposure, which is undesirable. Because of this and the time inconvenience, many surgeons omit the valgus stress radiograph, which can lead to the adverse outcome of missing a lateral compartment that is functionally incompetent, resulting in the potential for early lateral compartment progression of osteoarthritis and the need for revision surgery, usually to a total knee arthroplasty.
In an attempt to mitigate these barriers to obtaining the necessary valgus stress radiograph, Dr. Mauerhan’s team developed a technique that could be done with the assistance of the patient and would require only 1 technologist to perform. Additionally, this project was a quality improvement initiative, because it lowered radiation exposure to all personnel involved in obtaining the correct films.
Materials and Methods
We initiated the project using weight-bearing strategies to impart the valgus stress view of the knee. After trying several different wedges and blocks, and varying patient instructions, we realized a different approach to this problem would be required to find an acceptable solution. We redirected our efforts to effectively performing the stress view with the patient in a supine position on the radiograph table. Ultimately, we decided that a much stiffer wedge and a denser object to squeeze would facilitate obtaining a proper film. Considering all available options, a youth size 4 soccer ball (diameter, 11 in) was introduced along with a slightly larger positioning wedge. The soccer ball was wrapped with 4-in Coban wrap (3M) to create a nonslip surface. This change in patient positioning, along with a standardized 7º to 10º cephalic radiographic tube angulation, helped to correct issues with tibial plateau visualization. Once these changes were enacted, we obtained fairly consistent positive results, and we instituted this patient-directed valgus stress view of the knee, along with a manual valgus stress view for comparison.
The protocol for obtaining the patient-directed valgus stress view of the knee is as follows: The patient lays supine with a dense 45º spine-positioning wedge (Burlington Medical Supplies) placed under both knees and the patient’s heels on the examining table. The radiographic tube is angled cephalad 7º to 10º centered on the inferior pole of the patella, using a 40-in source to image-receptor distance, collimated to part; the image receptor is placed under the affected knee, below the positioning wedge. The affected knee is rotated to the “true” AP position (the patella will be centered between the femoral condyles on the AP exposure), and the ball is placed between the patient’s legs just above the ankle joint. The technologist demonstrates to the patient how to squeeze the ball while maintaining contact of heels with the table. The technologist can exit the room and obtain the exposure, which is taken while the patient is squeezing the ball, as shown in Figures 1A and 1B. Examples of the standing AP, manual stress, and patient-directed valgus radiographs are shown in Figures 2A-2C. The entire technique is demonstrated in the Video.
Results
During the 9 months of this quality improvement project, 78 examinations were performed. Five studies did not show complete correction of the varus deformity. Of these, 3 showed complete correction on a manual valgus stress radiograph, and 2 did not, contraindicating the use of partial knee replacement. Three patients displayed collapse of the lateral compartment, indicating a nonfunctional lateral compartment, and, therefore, were also a contraindication to partial knee arthroplasty. The remaining 70 patients had identical radiographic results with both the manual and patient-directed valgus stress tests. There was no instance of examination failure or need to repeat as a result of difficulty of the examination for the patient. Repeat films because of positioning errors were very rare, usually early in the learning curve, and no more prevalent than when using the manual stress method. The technique was reproducible and easy to teach and adopt.
Discussion
In total, 73 patients (93.5%) with the patient-directed stress film showed the desired result, either correction of the medial compartment narrowing in conjunction with an intact lateral compartment or narrowing of the lateral compartment. Of the 5 patients (6.5%) whose patient-directed stress films did not show correction of the varus deformity, 3 patients displayed correction with a manually applied stress radiograph and 2 did not. Based on this observation, our recommendation would be for those patients who do not show adequate correction on the patient-directed stress radiograph to have a manual examination to establish the presence or absence of the desired correction.
Performing a valgus stress radiograph is an integral part of the investigation to determine if the patient is an appropriate candidate for partial knee arthroplasty.3 The historical, manually performed valgus stress radiograph requires 2 individuals, 1 to apply the stress with the patient on the table and 1 to shoot the exposure. For the individual or individuals applying this stress, there is an increased radiation exposure that would be undesirable over a long career. The authors developed a new technique using a commercially available spinal positioning wedge and 11-in youth soccer ball wrapped with Coban wrap, as described, which is economical and easy to obtain and use in the clinical setting. We believe this cost-effective method will offer surgeons who perform partial knee arthroplasty a novel method to obtain the important information gleaned from the valgus stress radiograph and to improve surgical outcomes through the preoperative assessment of the lateral compartment. Additionally, as a quality and safety improvement initiative, we believe this technique will reduce radiographic exposure for those performing these studies, and, because the examination can be carried out by a single technologist, it will significantly improve efficiency in the radiology suite.
Conclusion
We have developed a new method of obtaining the important valgus stress radiograph as part of the workup of patients with medial-compartment osteoarthritis of the knee. The technique can be performed with easily obtainable, commercially available products and is reliable 93.5% of the time. It also adds to the efficiency of the radiology suite and reduces radiographic exposure for technologists.
1. White SH, Ludkowski PF, Goodfellow JW. Anteromedial osteoarthritis of the knee. J Bone Joint Surg Br. 1991;73(4):582-586.
2. Goodfellow JW, O’Conner JJ, Dodd CA, Murray DW. Unicompartmental Arthroplasty with the Oxford Knee. Woodeaton, Oxford, England: Goodfellow Publishers Limited; 2006:38-39.
3. Gibson PH, Goodfellow JW. Stress radiography in degenerative arthritis of the knee. J Bone Joint Surg Br. 1986;68(4):608-609.
Concomitant Ulnar Styloid Fracture and Distal Radius Fracture Portend Poorer Outcome
Distal radius fracture is a common injury treated by orthopedic surgeons. Fifty percent or more of distal radius fractures (DRFs) occur with concomitant ulnar styloid fractures (USFs)1-3 (Figure). The base of the ulnar styloid is the insertion site for portions of the triangular fibrocartilaginous complex (TFCC), which is a primary stabilizer of the distal radioulnar joint (DRUJ).4,5
Although the topic has received significant attention in the literature, there remains a lack of consensus on the prognostic and clinical significance of USF occurring with DRF. In a series reported by May and colleagues,6 all patients with DRUJ instability after DRF also had an USF. Some authors have reported USF as a poor prognostic indicator for DRF, as the occurrence of USF was taken as a proxy for DRUJ instability.7,8 Conversely, other authors have reported that USF nonunion has no effect on the outcome of volar plating of DRF.9-11 In a retrospective cohort study of 182 patients, Li and colleagues12 found no clinically significant difference in outcome between presence or absence of USF with DRF. They also reported that the quality of the DRF reduction was the main determinant of clinical outcome in patients with USF.
We examined a large cohort of patients treated for DRF to identify any possible effect of an associated USF on clinical outcome. All patients provided written informed consent for study inclusion.
Materials and Methods
We retrospectively evaluated 315 cases of DRFs treated (184 operatively, 131 nonoperatively) by members of the Trauma and Hand divisions at our institution over a 7-year period. All cases had sufficient follow-up. In each group, patients with concomitant USF were identified.
At presentation, all displaced fractures underwent closed reduction and immobilization with a sugar-tong splint. Baseline demographic data, injury information, and baseline functional scores on the Disabilities of the Arm, Shoulder, and Hand (DASH) questionnaire and the 36-Item Short Form Health Survey (SF-36) were recorded. Complete histories were taken and physical examinations performed. Standard radiographs of the injured and contralateral wrists were obtained at time of initial injury.13
Surgery was indicated in patients with an open fracture and in patients with an inherently unstable fracture pattern, using the instability criteria of Cooney and colleagues.14 According to these criteria, unstable fractures have lost alignment after closed reduction or have more than 20° of dorsal angulation, more than 10 mm of longitudinal shortening, or more than 2 mm of articular displacement.14 Patients were treated with either a volar locked plate or bridging external fixation with supplemental Kirschner-wire fixation (usually 2 or 3 wires). Patients in both groups (operative, nonoperative) participated in a formal outpatient therapy program that emphasized active and passive range of motion (ROM) of the finger, wrist motion (if clinically appropriate), and forearm motion. Mean clinical follow-up was 12 months (range, 8-18 months). At each clinic visit, we used a handheld dynamometer to measure ROM, grip strength, and other parameters and compared them with the same parameters on the uninjured side, along with functional outcome.
Differences in demographic characteristics were evaluated with 2 tests—the χ2 test for categorical variables (eg, USF incidence, sex, hand dominance, fracture pattern) and the Student t test for continuous variables. Mann-Whitney U tests were used to assess differences between groups in DASH and SF-36 scores at long-term follow-up, as well as differences in ROM and radiographic measurements. Statistical significance was set at P < .05.
Results
DRFs occurred in the dominant-side wrist more commonly (P < .05) in the nonoperative group than in the operative group, though there was no difference in hand dominance and presence or absence of USF. There was a significant correlation of intra-articular fractures in the operative group (70%) compared with the nonoperative group (34%), though no association was found between presence of USF and intra-articular fracture location.
The percentage of concomitant USF was higher (P< .0002) in patients treated operatively (64.1%) than in those treated nonoperatively (38.9%). Mean (SD) pain score was higher (P = .0001) for patients with USF, 1.80 (2.43), than for patients without USF, 0.80 (1.55). This relationship held in both the operative group, 1.95 (2.48) versus 1.04 (1.58) (P = .027), and the nonoperative group, 1.29 (2.09) versus 0.66 (1.53) (P = .048). Similarly, at long-term follow-up for the entire patient cohort, mean (SD) DASH score was negatively affected by presence of USF, 17.03 (18.94) versus 9.21 (14.06) (P = .001), as was mean (SD) SF-36 score, 77.16 (17.69) versus 82.68 (16.10) (P = .022). This relationship also held in the operative and nonoperative groups with respect to pain and DASH scores, though there were only trends in this direction with respect to SF-36 scores. At final follow-up, there was no significant correlation of pain, SF-36, or DASH scores with presence of an intra-articular fracture as compared with an extra-articular fracture.
Time to radiographic healing was not influenced by presence of USF compared with absence of USF (11 vs 10.06 weeks; P > .05). Similarly, healing was no different in intra-articular fractures compared with extra-articular fractures (11 vs 10 weeks; P > .05).
Wrist ROM at final follow-up was not affected by presence of USF; there was no significant difference in wrist flexion, extension, or forearm rotation. In addition, mean (SD) grip strength was unaffected (P = .132) by presence or absence of USF with DRF overall, 45.45% (31.92) of contralateral versus 52.88% (30.03). However, grip strength was negatively affected (P = .035) by presence of USF in the nonoperative group, 37.79% (20.58) versus 54.52% (31.89) (Table).
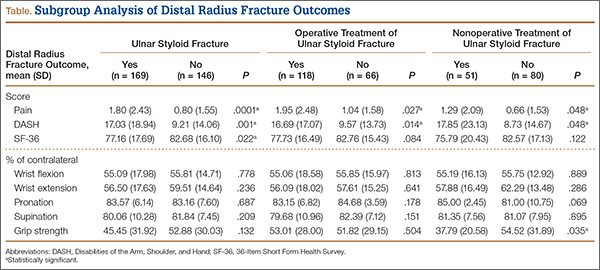
Discussion
In this study, we determined that presence of USF was a negative predictor for clinical outcomes after DRF. Given the higher incidence of USF in operatively treated DRFs, USF likely represents a higher-energy mechanism of injury. We think these inferior clinical results are attributable to other wrist pathologies that commonly occur with these injuries. These pathologies, identified in the past, include stylocarpal impaction, extensor carpi ulnaris tendinitis, and pain at USF site.6,10,15 In addition, intracarpal ligamentous injuries, including damage to scapholunate and lunotriquetral ligaments, have been shown to occur in roughly 80% of patients who sustain DRFs, with TFCC injuries occurring at a rate of 60%.16
Patient outcome is multifactorial and depends on initial injury characteristics, reduction quality, associated injuries, and patient demographics and lifestyle factors. Li and colleagues12 showed that the quality of the DRF reduction influenced outcomes in these injuries, as the ulnar styloid and its associated TFCC are in turn reduced more anatomically with a restored DRF reduction. This concept applies to injuries treated both operatively and nonoperatively. Similarly, Xarchas and colleagues17 identified malunion of the ulnar styloid as causing chronic wrist pain because of triquetral impingement, which was treated successfully with ulnar styloidectomy. The poor results at final follow-up in their study may reflect severity of the initial injury, as reported by Frykman.18
Additional factors may compromise clinical outcomes after such injuries. For example, the effect of USF fragment size on outcome has been suggested and debated. In a retrospective series, May and colleagues6 identified fractures involving the base of the ulnar styloid or fovea as potentially destabilizing the DRUJ and in turn leading to chronic instability. This mechanism should be considered a potential contributor to protracted clinical recovery. Other studies have shown that, irrespective of USF fragment size, presence of USF with DRF is not a reliable predictor of DRUJ instability.2,10,19 In the present study, we simply identified presence or absence of USF, irrespective of either stability or fragment size. In cases in which there was an USF without instability, we fixed the DRF in isolation, without surgically addressing the USF. Our data demonstrated that, even in the absence of DRUJ instability, presence of USF was a negative prognostic indicator for patient outcome.
This study had several limitations. First, its design was retrospective. A prospective study would have been ideal for eliminating certain inherent bias. Second, USF represents a higher association with DRUJ instability.6 As there are no validated tests for this clinical entity, identification is somewhat subjective. We did not separate patients by presence or absence of DRUJ instability and thus were not able to directly correlate the connection between USF, DRUJ instability, and poor outcomes in association with DRF. In addition, management of an unstable DRUJ after operative fixation of DRF is controversial, with techniques ranging from splinting in supination to pinning the DRUJ. This inconsistency likely contributed to some error between groups of patients in this study. Last, we did not stratify patients by USF fragment size, as previously discussed, which may have affected outcomes within patient groups.
Our data add to the evidence showing that USF in association with DRF portends poorer clinical outcomes. Concomitant USF should alert the treating physician to a higher-energy mechanism of injury and raise the index of suspicion for other associated injuries in the carpus.
1. Richards RS, Bennett JD, Roth JH, Milne K Jr. Arthroscopic diagnosis of intra-articular soft tissue injuries associated with distal radial fractures. J Hand Surg Am. 1997;22(5):772-776.
2. Sammer DM, Shah HM, Shauver MJ, Chung KC. The effect of ulnar styloid fractures on patient-rated outcomes after volar locking plating of distal radius fractures. J Hand Surg Am. 2009;34(9):1595-1602.
3. Villar RN, Marsh D, Rushton N, Greatorex RA. Three years after Colles’ fracture. A prospective review. J Bone Joint Surg Br. 1987;69(4):635-638.
4. Palmer AK, Werner FW. The triangular fibrocartilage complex of the wrist—anatomy and function. J Hand Surg Am. 1981;6(2):153-162.
5. Stuart PR, Berger RA, Linscheid RL, An KN. The dorsopalmar stability of the distal radioulnar joint. J Hand Surg Am. 2000;25(4):689-699.
6. May MM, Lawton JN, Blazar PE. Ulnar styloid fractures associated with distal radius fractures: incidence and implications for distal radioulnar joint instability. J Hand Surg Am. 2002;27(6):965-971.
7. Oskarsson GV, Aaser P, Hjall A. Do we underestimate the predictive value of the ulnar styloid affection in Colles fractures? Arch Orthop Trauma Surg. 1997;116(6-7):341-344.
8. Stoffelen D, De Smet L, Broos P. The importance of the distal radioulnar joint in distal radial fractures. J Hand Surg Br. 1998;23(4):507-511.
9. Buijze GA, Ring D. Clinical impact of united versus nonunited fractures of the proximal half of the ulnar styloid following volar plate fixation of the distal radius. J Hand Surg Am. 2010;35(2):223-227.
10. Kim JK, Yun YH, Kim DJ, Yun GU. Comparison of united and nonunited fractures of the ulnar styloid following volar-plate fixation of distal radius fractures. Injury. 2011;42(4):371-375.
11. Wijffels M, Ring D. The influence of non-union of the ulnar styloid on pain, wrist function and instability after distal radius fracture. J Hand Microsurg. 2011;3(1):11-14.
12. Li S, Chen Y, Lin Z, Fan Q, Cui W, Feng Z. Effect of associated ulnar styloid fracture on wrist function after distal radius [in Chinese]. Zhongguo Xiu Fu Chong Jian Wai Ke Za Zhi. 2012;26(6):666-670.
13. Egol KA, Walsh M, Romo-Cardoso S, Dorsky S, Paksima N. Distal radial fractures in the elderly: operative compared with nonoperative treatment. J Bone Joint Surg Am. 2010;92(9):1851-1857.
14. Cooney WP 3rd, Linscheid RL, Dobyns JH. External pin fixation for unstable Colles’ fractures. J Bone Joint Surg Am. 1979;61(6):840-845.
15. Cerezal L, del Piñal F, Abascal F, García-Valtuille R, Pereda T, Canga A. Imaging findings in ulnar-sided wrist impaction syndromes. Radiographics. 2002;22(1):105-121.
16. Ogawa T, Tanaka T, Yanai T, Kumagai H, Ochiai N. Analysis of soft tissue injuries associated with distal radius fractures. BMC Sports Sci Med Rehabil. 2013;5(1):19.
17. Xarchas KC, Yfandithis P, Kazakos K. Malunion of the ulnar styloid as a cause of ulnar wrist pain. Clin Anat. 2004;17(5):418-422.
18. Frykman G. Fracture of the distal radius including sequelae—shoulder–hand–finger syndrome, disturbance in the distal radio-ulnar joint and impairment of nerve function. A clinical and experimental study. Acta Orthop Scand. 1967:(suppl 108):3+.
19. Fujitani R, Omokawa S, Akahane M, Iida A, Ono H, Tanaka Y. Predictors of distal radioulnar joint instability in distal radius fractures. J Hand Surg Am. 2011;36(12):1919-1925.
Distal radius fracture is a common injury treated by orthopedic surgeons. Fifty percent or more of distal radius fractures (DRFs) occur with concomitant ulnar styloid fractures (USFs)1-3 (Figure). The base of the ulnar styloid is the insertion site for portions of the triangular fibrocartilaginous complex (TFCC), which is a primary stabilizer of the distal radioulnar joint (DRUJ).4,5
Although the topic has received significant attention in the literature, there remains a lack of consensus on the prognostic and clinical significance of USF occurring with DRF. In a series reported by May and colleagues,6 all patients with DRUJ instability after DRF also had an USF. Some authors have reported USF as a poor prognostic indicator for DRF, as the occurrence of USF was taken as a proxy for DRUJ instability.7,8 Conversely, other authors have reported that USF nonunion has no effect on the outcome of volar plating of DRF.9-11 In a retrospective cohort study of 182 patients, Li and colleagues12 found no clinically significant difference in outcome between presence or absence of USF with DRF. They also reported that the quality of the DRF reduction was the main determinant of clinical outcome in patients with USF.
We examined a large cohort of patients treated for DRF to identify any possible effect of an associated USF on clinical outcome. All patients provided written informed consent for study inclusion.
Materials and Methods
We retrospectively evaluated 315 cases of DRFs treated (184 operatively, 131 nonoperatively) by members of the Trauma and Hand divisions at our institution over a 7-year period. All cases had sufficient follow-up. In each group, patients with concomitant USF were identified.
At presentation, all displaced fractures underwent closed reduction and immobilization with a sugar-tong splint. Baseline demographic data, injury information, and baseline functional scores on the Disabilities of the Arm, Shoulder, and Hand (DASH) questionnaire and the 36-Item Short Form Health Survey (SF-36) were recorded. Complete histories were taken and physical examinations performed. Standard radiographs of the injured and contralateral wrists were obtained at time of initial injury.13
Surgery was indicated in patients with an open fracture and in patients with an inherently unstable fracture pattern, using the instability criteria of Cooney and colleagues.14 According to these criteria, unstable fractures have lost alignment after closed reduction or have more than 20° of dorsal angulation, more than 10 mm of longitudinal shortening, or more than 2 mm of articular displacement.14 Patients were treated with either a volar locked plate or bridging external fixation with supplemental Kirschner-wire fixation (usually 2 or 3 wires). Patients in both groups (operative, nonoperative) participated in a formal outpatient therapy program that emphasized active and passive range of motion (ROM) of the finger, wrist motion (if clinically appropriate), and forearm motion. Mean clinical follow-up was 12 months (range, 8-18 months). At each clinic visit, we used a handheld dynamometer to measure ROM, grip strength, and other parameters and compared them with the same parameters on the uninjured side, along with functional outcome.
Differences in demographic characteristics were evaluated with 2 tests—the χ2 test for categorical variables (eg, USF incidence, sex, hand dominance, fracture pattern) and the Student t test for continuous variables. Mann-Whitney U tests were used to assess differences between groups in DASH and SF-36 scores at long-term follow-up, as well as differences in ROM and radiographic measurements. Statistical significance was set at P < .05.
Results
DRFs occurred in the dominant-side wrist more commonly (P < .05) in the nonoperative group than in the operative group, though there was no difference in hand dominance and presence or absence of USF. There was a significant correlation of intra-articular fractures in the operative group (70%) compared with the nonoperative group (34%), though no association was found between presence of USF and intra-articular fracture location.
The percentage of concomitant USF was higher (P< .0002) in patients treated operatively (64.1%) than in those treated nonoperatively (38.9%). Mean (SD) pain score was higher (P = .0001) for patients with USF, 1.80 (2.43), than for patients without USF, 0.80 (1.55). This relationship held in both the operative group, 1.95 (2.48) versus 1.04 (1.58) (P = .027), and the nonoperative group, 1.29 (2.09) versus 0.66 (1.53) (P = .048). Similarly, at long-term follow-up for the entire patient cohort, mean (SD) DASH score was negatively affected by presence of USF, 17.03 (18.94) versus 9.21 (14.06) (P = .001), as was mean (SD) SF-36 score, 77.16 (17.69) versus 82.68 (16.10) (P = .022). This relationship also held in the operative and nonoperative groups with respect to pain and DASH scores, though there were only trends in this direction with respect to SF-36 scores. At final follow-up, there was no significant correlation of pain, SF-36, or DASH scores with presence of an intra-articular fracture as compared with an extra-articular fracture.
Time to radiographic healing was not influenced by presence of USF compared with absence of USF (11 vs 10.06 weeks; P > .05). Similarly, healing was no different in intra-articular fractures compared with extra-articular fractures (11 vs 10 weeks; P > .05).
Wrist ROM at final follow-up was not affected by presence of USF; there was no significant difference in wrist flexion, extension, or forearm rotation. In addition, mean (SD) grip strength was unaffected (P = .132) by presence or absence of USF with DRF overall, 45.45% (31.92) of contralateral versus 52.88% (30.03). However, grip strength was negatively affected (P = .035) by presence of USF in the nonoperative group, 37.79% (20.58) versus 54.52% (31.89) (Table).
Discussion
In this study, we determined that presence of USF was a negative predictor for clinical outcomes after DRF. Given the higher incidence of USF in operatively treated DRFs, USF likely represents a higher-energy mechanism of injury. We think these inferior clinical results are attributable to other wrist pathologies that commonly occur with these injuries. These pathologies, identified in the past, include stylocarpal impaction, extensor carpi ulnaris tendinitis, and pain at USF site.6,10,15 In addition, intracarpal ligamentous injuries, including damage to scapholunate and lunotriquetral ligaments, have been shown to occur in roughly 80% of patients who sustain DRFs, with TFCC injuries occurring at a rate of 60%.16
Patient outcome is multifactorial and depends on initial injury characteristics, reduction quality, associated injuries, and patient demographics and lifestyle factors. Li and colleagues12 showed that the quality of the DRF reduction influenced outcomes in these injuries, as the ulnar styloid and its associated TFCC are in turn reduced more anatomically with a restored DRF reduction. This concept applies to injuries treated both operatively and nonoperatively. Similarly, Xarchas and colleagues17 identified malunion of the ulnar styloid as causing chronic wrist pain because of triquetral impingement, which was treated successfully with ulnar styloidectomy. The poor results at final follow-up in their study may reflect severity of the initial injury, as reported by Frykman.18
Additional factors may compromise clinical outcomes after such injuries. For example, the effect of USF fragment size on outcome has been suggested and debated. In a retrospective series, May and colleagues6 identified fractures involving the base of the ulnar styloid or fovea as potentially destabilizing the DRUJ and in turn leading to chronic instability. This mechanism should be considered a potential contributor to protracted clinical recovery. Other studies have shown that, irrespective of USF fragment size, presence of USF with DRF is not a reliable predictor of DRUJ instability.2,10,19 In the present study, we simply identified presence or absence of USF, irrespective of either stability or fragment size. In cases in which there was an USF without instability, we fixed the DRF in isolation, without surgically addressing the USF. Our data demonstrated that, even in the absence of DRUJ instability, presence of USF was a negative prognostic indicator for patient outcome.
This study had several limitations. First, its design was retrospective. A prospective study would have been ideal for eliminating certain inherent bias. Second, USF represents a higher association with DRUJ instability.6 As there are no validated tests for this clinical entity, identification is somewhat subjective. We did not separate patients by presence or absence of DRUJ instability and thus were not able to directly correlate the connection between USF, DRUJ instability, and poor outcomes in association with DRF. In addition, management of an unstable DRUJ after operative fixation of DRF is controversial, with techniques ranging from splinting in supination to pinning the DRUJ. This inconsistency likely contributed to some error between groups of patients in this study. Last, we did not stratify patients by USF fragment size, as previously discussed, which may have affected outcomes within patient groups.
Our data add to the evidence showing that USF in association with DRF portends poorer clinical outcomes. Concomitant USF should alert the treating physician to a higher-energy mechanism of injury and raise the index of suspicion for other associated injuries in the carpus.
1. Richards RS, Bennett JD, Roth JH, Milne K Jr. Arthroscopic diagnosis of intra-articular soft tissue injuries associated with distal radial fractures. J Hand Surg Am. 1997;22(5):772-776.
2. Sammer DM, Shah HM, Shauver MJ, Chung KC. The effect of ulnar styloid fractures on patient-rated outcomes after volar locking plating of distal radius fractures. J Hand Surg Am. 2009;34(9):1595-1602.
3. Villar RN, Marsh D, Rushton N, Greatorex RA. Three years after Colles’ fracture. A prospective review. J Bone Joint Surg Br. 1987;69(4):635-638.
4. Palmer AK, Werner FW. The triangular fibrocartilage complex of the wrist—anatomy and function. J Hand Surg Am. 1981;6(2):153-162.
5. Stuart PR, Berger RA, Linscheid RL, An KN. The dorsopalmar stability of the distal radioulnar joint. J Hand Surg Am. 2000;25(4):689-699.
6. May MM, Lawton JN, Blazar PE. Ulnar styloid fractures associated with distal radius fractures: incidence and implications for distal radioulnar joint instability. J Hand Surg Am. 2002;27(6):965-971.
7. Oskarsson GV, Aaser P, Hjall A. Do we underestimate the predictive value of the ulnar styloid affection in Colles fractures? Arch Orthop Trauma Surg. 1997;116(6-7):341-344.
8. Stoffelen D, De Smet L, Broos P. The importance of the distal radioulnar joint in distal radial fractures. J Hand Surg Br. 1998;23(4):507-511.
9. Buijze GA, Ring D. Clinical impact of united versus nonunited fractures of the proximal half of the ulnar styloid following volar plate fixation of the distal radius. J Hand Surg Am. 2010;35(2):223-227.
10. Kim JK, Yun YH, Kim DJ, Yun GU. Comparison of united and nonunited fractures of the ulnar styloid following volar-plate fixation of distal radius fractures. Injury. 2011;42(4):371-375.
11. Wijffels M, Ring D. The influence of non-union of the ulnar styloid on pain, wrist function and instability after distal radius fracture. J Hand Microsurg. 2011;3(1):11-14.
12. Li S, Chen Y, Lin Z, Fan Q, Cui W, Feng Z. Effect of associated ulnar styloid fracture on wrist function after distal radius [in Chinese]. Zhongguo Xiu Fu Chong Jian Wai Ke Za Zhi. 2012;26(6):666-670.
13. Egol KA, Walsh M, Romo-Cardoso S, Dorsky S, Paksima N. Distal radial fractures in the elderly: operative compared with nonoperative treatment. J Bone Joint Surg Am. 2010;92(9):1851-1857.
14. Cooney WP 3rd, Linscheid RL, Dobyns JH. External pin fixation for unstable Colles’ fractures. J Bone Joint Surg Am. 1979;61(6):840-845.
15. Cerezal L, del Piñal F, Abascal F, García-Valtuille R, Pereda T, Canga A. Imaging findings in ulnar-sided wrist impaction syndromes. Radiographics. 2002;22(1):105-121.
16. Ogawa T, Tanaka T, Yanai T, Kumagai H, Ochiai N. Analysis of soft tissue injuries associated with distal radius fractures. BMC Sports Sci Med Rehabil. 2013;5(1):19.
17. Xarchas KC, Yfandithis P, Kazakos K. Malunion of the ulnar styloid as a cause of ulnar wrist pain. Clin Anat. 2004;17(5):418-422.
18. Frykman G. Fracture of the distal radius including sequelae—shoulder–hand–finger syndrome, disturbance in the distal radio-ulnar joint and impairment of nerve function. A clinical and experimental study. Acta Orthop Scand. 1967:(suppl 108):3+.
19. Fujitani R, Omokawa S, Akahane M, Iida A, Ono H, Tanaka Y. Predictors of distal radioulnar joint instability in distal radius fractures. J Hand Surg Am. 2011;36(12):1919-1925.
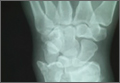
Radiofrequency Microtenotomy for Elbow Epicondylitis: Midterm Results
Elbow epicondylitis is a painful condition caused by overuse and development of tendon degeneration. It is one of the most common elbow problems in adults, occurring both laterally and medially. “Tennis elbow” or lateral epicondylitis is diagnosed 7 to 10 times more often than the medial form, “golfer’s elbow.”1 Although these injuries are often associated with racquet sports, activities such as bowling and weightlifting and the professions of carpentry, plumbing, and meat-cutting have been described as causes.2,3
Elbow epicondylitis is thought to be the result of multiple microtraumatic events that cause disruption of the internal structure of the tendon and degeneration of the cells and matrix.4 Lesions caused by chronic overuse are now commonly called tendinosis and are not considered inflammatory in nature. Although the term tendinitis is used frequently and indiscriminately, histopathologic studies have shown that specimens of tendon obtained from areas of chronic overuse do not contain large numbers of macrophages, lymphocytes, or neutrophils.5 Rather, tendinosis appears to be a degenerative process that is characterized by the presence of dense populations of fibroblasts, vascular hyperplasia, and disorganized collagen. This constellation of findings has been termed by some authors as angiofibroblastic hyperplasia.6
Conservative care for the treatment of chronic tendinosis has been well described and is often successful. Treatment consists of rest, ice, compression, and elevation in the acute phase. This can be followed with bracing, activity modification, physical therapy, oral nonsteroidal anti-inflammatory drugs, topical applications, and injections of cortisone or platelet-rich plasma. When conservative treatment fails, surgical intervention may be considered. Procedures for the treatment of lateral epicondylitis include open débridement and release, arthroscopic débridement, percutaneous release, and radiofrequency (RF) coblation. The goals of operative treatment are to resect pathological material, to stimulate neovascularization by producing focused local bleeding, and to create a healthy scar while doing the least possible structural damage to surrounding tissues.4
The efficacy of a bipolar RF-based approach for using microtenotomy was first recognized when researchers studied the effects of transmyocardial revascularization for treating congestive heart failure.7 The use of RF- and laser-based transmyocardial revascularization initiated an angiogenic response in degenerated (ischemic) heart tissue. This success led to investigating the use of a RF-based approach for performing microtenotomy. Preclinical studies demonstrated that RF-based microtenotomy was effective for stimulating an angiogenic-healing response in tendon tissue.8 Histologic evaluation of treated tendons showed an early inflammatory response, with new blood-vessel formation by 28 days. In 2005, short-term results of this technique were published.9 This preliminary prospective case series showed that the treatment was safe and effectively improved or eliminated clinical symptoms.9 In the present midterm study, we hypothesized that pain scores would improve after RF microtenotomy and that these favorable results would continue to be observed over a longer term postoperatively.
Materials and Methods
Patients
This was a prospective, nonrandomized, single-center clinical study. After receiving institutional review board approval, patients who were 18 to 65 years of age with a diagnosis of tendinosis were approached for enrollment. For inclusion, patients had to be symptomatic for at least 6 months and had to have failed extensive conservative treatments. Nonoperative treatment included activity modification, enrollment in a facility- or home-based exercise program, bracing, oral nonsteroidal anti-inflammatory medication, and cortisone injection. Candidates with diabetes, confirmed or suspected pregnancy, surgery in the same tendon, implanted hardware adjacent to the target treatment region, or who were receiving care under workers’ compensation or had litigation-related injury were excluded. A single clinician performed a thorough medical history and clinical evaluation. The clinical follow-up and data collection were performed by an independent medical technician.
Clinical Outcomes
Pain status was assessed by using a visual analog scale (VAS). Postoperative clinical assessment was conducted within the first 2 days; at 7 to 10 days; at 4 to 6 weeks; and at 3, 6, 12, and 24 months, up to 9 years postoperatively. The VAS scales were completed annually up to 9 years after the procedure.
The percent improvement of VAS score was calculated. This value represented the difference between the patient’s preoperative and most recent VAS assessments. Failure of the procedure was defined as less than 50% improvement of the VAS score.
The RF-Based Microtenotomy Device
The Topaz Microdebrider (ArthroCare), connected to a System 2000 generator at setting 4 (175 V-RMS), was used to perform the RF-based microtenotomy. The device uses a controlled plasma-mediated RF-based process (coblation). Radiofrequency energy is used to excite the electrolytes in a conductive medium, such as a saline solution, to create precisely focused plasma. The energized particles in the plasma have sufficient energy to break molecular bonds,10,11 excising or dissolving (ie, ablating) soft tissue at relatively low temperatures (typically, 40°-70° C).12,13 The diameter of the active tip of the Topaz device is 0.8 mm.
Surgical Procedure
The senior author performed the majority of procedures in this study. Near the end of the series, the senior author’s associate also performed procedures. The symptomatic area of the tendon was identified and marked while the patient was alert. After the patient was positioned appropriately, light sedation was administered. A tourniquet was placed over the treatment limb and inflated to 250 mm Hg. A small incision, approximately 3 cm in length, was made over the marked treatment site to expose the involved tendon. After initiating sterile isotonic saline flow of 1 drop every 1 to 2 seconds from a line connected to the RF system, the tip of the device was placed on the tendon perpendicular to its surface (Figure 1). Using a light touch, it was activated for 500 milliseconds using a timer accessory for the control box. Five to 8 grams of pressure were applied with the device to penetrate the tendon and achieve successful ablation. The RF applications were performed at 5-mm intervals, to create a grid-like pattern on and throughout the symptomatic tendon area. The tendon was perforated to a depth of several millimeters on every second or third application throughout the treatment grid. After treatment of the symptomatic area, the wound was irrigated with copious amounts of normal saline solution and closed with interrupted nylon suture. Local anesthetic was injected only in the skin and in subcutaneous tissue. Standard wound dressings were applied. In the immediate postoperative period, the patient was advised to begin gentle active and passive range-of-motion exercises. Each patient was evaluated at 1 week postoperatively. At 6 weeks, patients were permitted to increase the intensity of their activities. Return to sports and heavy lifting was allowed once the patient was asymptomatic and had achieved full strength and range of motion; this typically occurred at 6 to 9 weeks after surgery.
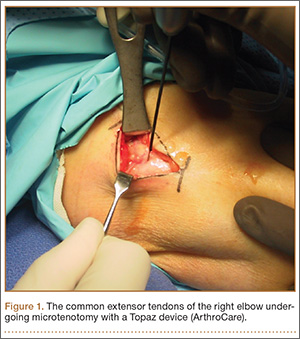
Statistical Analysis
Normally distributed data were described using standard parametric statistics (ie, mean and standard deviation); non-normally distributed data were characterized using nonparametric descriptors (ie, median and quartiles). Statistical evaluation of improvement in pain status was performed by calculating 99% confidence intervals and using the Student t test for change between subsequent time points. Use of confidence intervals provides a descriptive analysis of the observed treatment effect, while permitting determination of statistical relevance. In all statistical testing, confidence bounds not including 0 were considered statistically significant. Probability of P ≤ .01 for committing type I experiment-wise error (rejecting a true null hypothesis) was selected for all statistical testing because of our lack of a control group, small sample size, and evaluation of multiple postoperative time points.
Results
Eighty consecutive patients with tendinosis of the elbow were included in this study. Sixty-nine patients were treated for lateral epicondylitis and 11 for medial epicondylitis. The average age of the patients (33 women, 47 men) was 50 years. The duration of follow-up evaluation ranged from 6 months to 9 years (mean, 2.5 years; median, 2 years). The Table presents the VAS improvement for these patients after the RF microtenotomy.
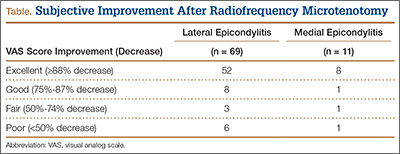
Within the lateral epicondylitis group, 91% (63/69) of the patients reported a successful outcome. The postoperative VAS improved to 1.3 from 6.9, which demonstrated an 81% improvement. Of the 6 patients that did not improve, 2 underwent repeat surgery.
Among the patients treated for medial epicondylitis, 91% (10/11) reported improvement in symptoms. The postoperative VAS improved to 1.3 from 6.1, a 79% improvement. One patient did not improve and did not undergo repeat surgery.
Discussion
For the treatment of medial and lateral elbow epicondylitis, RF microtenotomy is successful in 91% of patients. Symptomatic improvement was observed up to 9 years postoperatively. During this study, no complications were recorded; 7 treatment failures occurred. When compared with other techniques, the results with RF microtenotomy are equivalent or better.
In a retrospective study, Szabo and colleagues14 compared open, arthroscopic, and percutaneous release for lateral elbow tendinosis. They found the 3 methods to be highly effective for the treatment of tendinosis with no significant difference between them. Resection of the epicondyle and transfer of the anconeus muscle was found to be effective (94%) in a retrospective study by Almquist and colleagues.15 Dunn and coauthors16 reported a 97% success rate at 10 to 14 years postoperatively with a mini-open technique. Rubenthaler and colleagues17 showed 88% effectiveness for the open technique and 93% for the arthroscopic technique. With arthroscopic release of the extensor carpi radialis brevis tendon, Lattermann and coauthors18 reported clinical improvement in 94% of patients. In a study by Rose and colleagues,19 denervation of the lateral epicondyle was effective in relieving pain in 80% of patients who had had a positive response to a local anesthetic block. In a recently published study by Koh and coauthors,20 19 of 20 patients experienced a favorable outcome after treatment with ultrasonic microresection.
Regardless of surgical methods and their reported success rate, complications are associated with elbow surgery. Postoperative problems may include restricted function, elbow instability, persistent muscle weakness, and painful neuroma of the posterior cutaneous nerve.10,21,22 The recent introduction of arthroscopic release offers the potential for less morbidity and enables visualization of the elbow joint. However, disadvantages of the arthroscopic approach include violation of the joint for extra-articular pathology, increased operative time and cost, and neurovascular complications. Additionally, it is possible that the entire spectrum of extra-articular tendinosis cannot be effectively identified arthroscopically.23 In a prospective, randomized study, Meknas and colleagues24 compared RF microtenotomy with extensor tendon release and repair. They showed that patients treated with RF-microtenotomy experienced earlier pain relief and improved grip strength over the release group.
Different proposed mechanisms of action have been described to explain the favorable effects of the RF-based microtenotomy procedure, such as induced healing by an angiogenic response in the tendon tissue. In an animal study, Harwood and colleagues8 showed that low-dose RF-based plasma microtenotomy has the ability to stimulate angiogenic growth factors in tendons, such as αv integrin and vascular endothelial growth factor. These factors have been shown to be associated with healing.8 Early inflammatory response with new-vessel formation after 28 days was found in another animal study using the same method.25 Evaluation of RF-based methods in a prospective controlled laboratory study using a rabbit-tendon model showed histologic evidence of early inflammation with development of neovasculature after treatment.8 A later histologic study using an aged Achilles rabbit tendon model was performed to evaluate the effect of RF-based plasma microtenotomy on collagen remodeling.25 The degenerated tendon showed gaps, few normal crimpings, and a lack of reflectivity under polarized light. At 9 days after treatment, the treated tendon showed localized irregular crimpings, and, at 30 days, it showed regular crimping, tightly dense collagen fibers, and hypercellularity with good reflectivity. This was similar in appearance to a normal nondegenerated tendon (Figures 2A-2D). The RF-treated tendon also demonstrated an increase in production of insulin-like growth factor-1, β-fibroblast growth factor-1, αv integrin, and vascular endothelial growth factor.
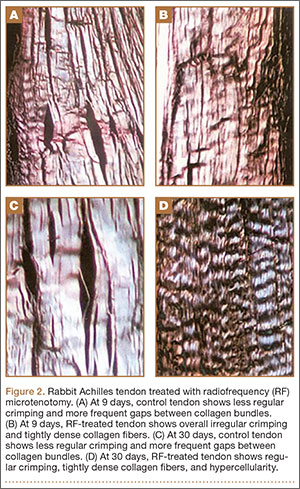
Pathologic nerve ingrowth or nerve irritation in the tendon substance has been considered a possible cause of the pain experienced with tendinosis. Radiofrequency treatment has been shown to induce acute degeneration and ablation of sensory nerve fibers.26 These degenerated nerve fibers were observed to regenerate at 90 days after treatment.27 These findings provide potential evidence for early pain relief that is maintained long term as the nerves regenerate.
This midterm follow-up of patients with elbow epicondylitis has shown that RF-based microtenotomy can produce successful, durable results. Microtenotomy is a technically simple procedure to perform and is associated with a rapid and uncomplicated recovery. It is safe and can effectively eliminate or markedly reduce clinical symptoms.
Limitations
Lateral epicondylitis has been described as a self-limited disease, with resolution of symptoms at 12 to 18 months with conservative treatment. This perspective challenges the indication of any proposed surgical treatment for the condition. Although the results of this research demonstrated the benefits of RF microtenotomy, there are inherent limitations of the study design. The study lacks a control group, and randomization would improve the strength of the study. Additional outcome measures, such as Disabilities of the Arm, Shoulder, and Hand score, and grip strength could complement pain scores to provide more data. These data were collected in a preliminary study.9 Postoperative histologic analysis of treated human tissue would be ideal, but ethical considerations limit study to animal models. An additional limitation is potential examiner bias. Data collection was performed by an independent medical technician; a third-party blinded evaluation could have been performed, but this was not feasible in a clinical setting.
Conclusion
Radiofrequency-based microtenotomy is a safe and effective procedure for elbow epicondylitis. The results are durable with successful outcomes observed 9 years after surgery.
1. Leach RE, Miller JK. Lateral and medial epicondylitis of the elbow. Clin Sports Med. 1987;6(2):259-272.
2. Vangsness CT Jr, Jobe FW. Surgical technique of medial epicondylitis: Results in 35 elbows. J Bone Joint Surg Br. 1991;73(3):409-411.
3. Galloway M, DeMaio M, Mangine R. Rehabilitative techniques in the treatment of medial and lateral epicondylitis. Orthopedics. 1992;15(9):1089-1096.
4. Kraushaar BS, Nirschl RP. Tendinosis of the elbow (tennis elbow). Clinical features and findings of histological, immunohistochemical, and electron microscopy studies. J Bone Joint Surg Am. 1999;81(2):259-278.
5. Leadbetter WB. Cell-matrix response in tendon injury. Clin Sports Med. 1992;11(3):533-578.
6. Nirschl RP. Tennis elbow tendinosis: pathoanatomy, nonsurgical and surgical management. In: Fine LJ, ed. Repetitive Motion Disorders of the Upper Extremity. Rosemont, IL: American Academy of Orthopaedic Surgeons; 1995:467-479.
7. Chu V, Kuang J, Aiaid A, Korkola S, Chiu RC. Angiogenic response induced by mechanical transmyocardial revascularization. J Thorac Cardiovasc Surg 1999;118:849-856.
8. Harwood R, Bowden K, Amiel M, Tasto JP, Amiel D. Structural and angiogenic response to bipolar radiofrequency treatment of normal rabbit achilles tendon: a potential application to the treatment of tendinosis. Trans Orthop Res Soc. 2003;28:819.
9. Tasto JP, Cummings J, Medlock V, Hardesty R, Amiel D. Microtenotomy using a radiofrequency probe to treat lateral epicondylitis. Arthroscopy. 2005;21(7):851-860.
10. Woloszko J, Stalder KR, Brown IG. Plasma characteristics of repetitively-pulsed electrical discharges in saline solutions used for surgical procedures. IEEE Trans Plasma Sci. 2002;30:1376-1383.
11. Stalder KR, Woloszko J, Brown IG, Smith CD. Repetitive plasma discharges in saline solutions. Appl Phys Lett. 2001;79:4503-4505.
12. Woloszko J, Gilbride C. Coblation technology (plasma mediated ablation for otolaryngology applications). Proc SPIE. 2000;3907:306–316.
13. Woloszko J, Kwende MM, Stalder KR. Coblation in otolaryngology. Proc SPIE. 2003;4949:341–352.
14. Szabo SJ, Savoie FH 3rd, Field LD, Ramsey JR, Hosemann CD. Tendinosis of the extensor carpi radialis brevis: an evaluation of three methods of operative treatment. J Shoulder Elbow Surg Am. 2006;15(6):721-727.
15. Almquist EE, Necking L, Bach AW. Epicondylar resection with anconeus transfer for chronic lateral epicondylitis. J Hand Surg Am. 1998;23(4):723-731.
16. Dunn JH, Kim JJ, Davis L, Nirschl RP. Ten- to 14-year follow-up of the Nirschl surgical technique for lateral epicondylitis. Am J Sports Med. 2008;36(2):261-266.
17. Rubenthaler F, Wiese M, Senge A, Keller L, Wittenberg RH. Long-term follow-up of open and endoscopic Hohmann procedures for lateral epicondylitis. Arthroscopy. 2005;21(6):684-690.
18. Lattermann C, Romeo AA, Anbari A, et al. Arthroscopic debridement of the extensor carpi radialis brevis for the treatment of recalcitrant lateral epicondylitis. J Shoulder Elbow Surg. 2010;19(5):651-656.
19. Rose NE, Forman SK, Dellon AL. Denervation of the lateral epicondyle for treatment of chronic lateral epicondylitis. J Hand Surg Am. 2013;38(2):344-349.
20. Koh JS, Mohan PC, Howe TS, et al. Fasciotomy and surgical tenotomy for recalcitrant lateral elbow tendonopathy: early clinical experience with a novel device for minimally invasive percutaneous microresection. Am J Sports Med. 2013;41(3):636-644.
21. Nirschl RP, Ashman ES. Elbow tendonopathy: tennis elbow. Clin Sports Med. 2003;22(4):813-836.
22. Dellon AL, Kim J, Ducic I. Painful neuroma of the posterior cutaneous nerve of the forearm after surgery for lateral humeral epicondylitis. J Hand Surg Am. 2004;29(3):387-390.
23. Cummins CA. Lateral epicondylitis: in-vivo assessment of arthroscopic debridement and correlation with patient outcomes. Am J Sports Med. 2006;34(9):1486-1491.
24. Meknas K, Odden-Miland A, Mercer JB, Castillejo M, Johansen O. Radiofrequency microtenotomy: a promising method for treatment of recalcitrant lateral epicondylitis. Am J Sports Med. 2008;36(10):1960-1965.
25. Takahashi N, Tasto JP, Locke J, et al. The use of radiofrequency (RF) for the treatment of chronic tendinosis. Paper presented at: 6th Biennial Congress of the International Society of Arthroscopy, Knee Surgery, and Orthopaedic Sports Medicine Congress; May 2007; Florence, Italy. Abstract 1433.
26. Takahashi N, Tasto JP, Ritter M, et al. Pain relief through an antinociceptive effect after radiofrequency application. Am J Sports Med. 2007;35(5):805-810.
27. Ochiai N, Tasto JP, Ohtori S, Takahashi N, Moriya H, Amiel D. Nerve regeneration after radiofrequency ablation. Am J Sports Med. 2007;35(11):1940-1944.
Elbow epicondylitis is a painful condition caused by overuse and development of tendon degeneration. It is one of the most common elbow problems in adults, occurring both laterally and medially. “Tennis elbow” or lateral epicondylitis is diagnosed 7 to 10 times more often than the medial form, “golfer’s elbow.”1 Although these injuries are often associated with racquet sports, activities such as bowling and weightlifting and the professions of carpentry, plumbing, and meat-cutting have been described as causes.2,3
Elbow epicondylitis is thought to be the result of multiple microtraumatic events that cause disruption of the internal structure of the tendon and degeneration of the cells and matrix.4 Lesions caused by chronic overuse are now commonly called tendinosis and are not considered inflammatory in nature. Although the term tendinitis is used frequently and indiscriminately, histopathologic studies have shown that specimens of tendon obtained from areas of chronic overuse do not contain large numbers of macrophages, lymphocytes, or neutrophils.5 Rather, tendinosis appears to be a degenerative process that is characterized by the presence of dense populations of fibroblasts, vascular hyperplasia, and disorganized collagen. This constellation of findings has been termed by some authors as angiofibroblastic hyperplasia.6
Conservative care for the treatment of chronic tendinosis has been well described and is often successful. Treatment consists of rest, ice, compression, and elevation in the acute phase. This can be followed with bracing, activity modification, physical therapy, oral nonsteroidal anti-inflammatory drugs, topical applications, and injections of cortisone or platelet-rich plasma. When conservative treatment fails, surgical intervention may be considered. Procedures for the treatment of lateral epicondylitis include open débridement and release, arthroscopic débridement, percutaneous release, and radiofrequency (RF) coblation. The goals of operative treatment are to resect pathological material, to stimulate neovascularization by producing focused local bleeding, and to create a healthy scar while doing the least possible structural damage to surrounding tissues.4
The efficacy of a bipolar RF-based approach for using microtenotomy was first recognized when researchers studied the effects of transmyocardial revascularization for treating congestive heart failure.7 The use of RF- and laser-based transmyocardial revascularization initiated an angiogenic response in degenerated (ischemic) heart tissue. This success led to investigating the use of a RF-based approach for performing microtenotomy. Preclinical studies demonstrated that RF-based microtenotomy was effective for stimulating an angiogenic-healing response in tendon tissue.8 Histologic evaluation of treated tendons showed an early inflammatory response, with new blood-vessel formation by 28 days. In 2005, short-term results of this technique were published.9 This preliminary prospective case series showed that the treatment was safe and effectively improved or eliminated clinical symptoms.9 In the present midterm study, we hypothesized that pain scores would improve after RF microtenotomy and that these favorable results would continue to be observed over a longer term postoperatively.
Materials and Methods
Patients
This was a prospective, nonrandomized, single-center clinical study. After receiving institutional review board approval, patients who were 18 to 65 years of age with a diagnosis of tendinosis were approached for enrollment. For inclusion, patients had to be symptomatic for at least 6 months and had to have failed extensive conservative treatments. Nonoperative treatment included activity modification, enrollment in a facility- or home-based exercise program, bracing, oral nonsteroidal anti-inflammatory medication, and cortisone injection. Candidates with diabetes, confirmed or suspected pregnancy, surgery in the same tendon, implanted hardware adjacent to the target treatment region, or who were receiving care under workers’ compensation or had litigation-related injury were excluded. A single clinician performed a thorough medical history and clinical evaluation. The clinical follow-up and data collection were performed by an independent medical technician.
Clinical Outcomes
Pain status was assessed by using a visual analog scale (VAS). Postoperative clinical assessment was conducted within the first 2 days; at 7 to 10 days; at 4 to 6 weeks; and at 3, 6, 12, and 24 months, up to 9 years postoperatively. The VAS scales were completed annually up to 9 years after the procedure.
The percent improvement of VAS score was calculated. This value represented the difference between the patient’s preoperative and most recent VAS assessments. Failure of the procedure was defined as less than 50% improvement of the VAS score.
The RF-Based Microtenotomy Device
The Topaz Microdebrider (ArthroCare), connected to a System 2000 generator at setting 4 (175 V-RMS), was used to perform the RF-based microtenotomy. The device uses a controlled plasma-mediated RF-based process (coblation). Radiofrequency energy is used to excite the electrolytes in a conductive medium, such as a saline solution, to create precisely focused plasma. The energized particles in the plasma have sufficient energy to break molecular bonds,10,11 excising or dissolving (ie, ablating) soft tissue at relatively low temperatures (typically, 40°-70° C).12,13 The diameter of the active tip of the Topaz device is 0.8 mm.
Surgical Procedure
The senior author performed the majority of procedures in this study. Near the end of the series, the senior author’s associate also performed procedures. The symptomatic area of the tendon was identified and marked while the patient was alert. After the patient was positioned appropriately, light sedation was administered. A tourniquet was placed over the treatment limb and inflated to 250 mm Hg. A small incision, approximately 3 cm in length, was made over the marked treatment site to expose the involved tendon. After initiating sterile isotonic saline flow of 1 drop every 1 to 2 seconds from a line connected to the RF system, the tip of the device was placed on the tendon perpendicular to its surface (Figure 1). Using a light touch, it was activated for 500 milliseconds using a timer accessory for the control box. Five to 8 grams of pressure were applied with the device to penetrate the tendon and achieve successful ablation. The RF applications were performed at 5-mm intervals, to create a grid-like pattern on and throughout the symptomatic tendon area. The tendon was perforated to a depth of several millimeters on every second or third application throughout the treatment grid. After treatment of the symptomatic area, the wound was irrigated with copious amounts of normal saline solution and closed with interrupted nylon suture. Local anesthetic was injected only in the skin and in subcutaneous tissue. Standard wound dressings were applied. In the immediate postoperative period, the patient was advised to begin gentle active and passive range-of-motion exercises. Each patient was evaluated at 1 week postoperatively. At 6 weeks, patients were permitted to increase the intensity of their activities. Return to sports and heavy lifting was allowed once the patient was asymptomatic and had achieved full strength and range of motion; this typically occurred at 6 to 9 weeks after surgery.
Statistical Analysis
Normally distributed data were described using standard parametric statistics (ie, mean and standard deviation); non-normally distributed data were characterized using nonparametric descriptors (ie, median and quartiles). Statistical evaluation of improvement in pain status was performed by calculating 99% confidence intervals and using the Student t test for change between subsequent time points. Use of confidence intervals provides a descriptive analysis of the observed treatment effect, while permitting determination of statistical relevance. In all statistical testing, confidence bounds not including 0 were considered statistically significant. Probability of P ≤ .01 for committing type I experiment-wise error (rejecting a true null hypothesis) was selected for all statistical testing because of our lack of a control group, small sample size, and evaluation of multiple postoperative time points.
Results
Eighty consecutive patients with tendinosis of the elbow were included in this study. Sixty-nine patients were treated for lateral epicondylitis and 11 for medial epicondylitis. The average age of the patients (33 women, 47 men) was 50 years. The duration of follow-up evaluation ranged from 6 months to 9 years (mean, 2.5 years; median, 2 years). The Table presents the VAS improvement for these patients after the RF microtenotomy.
Within the lateral epicondylitis group, 91% (63/69) of the patients reported a successful outcome. The postoperative VAS improved to 1.3 from 6.9, which demonstrated an 81% improvement. Of the 6 patients that did not improve, 2 underwent repeat surgery.
Among the patients treated for medial epicondylitis, 91% (10/11) reported improvement in symptoms. The postoperative VAS improved to 1.3 from 6.1, a 79% improvement. One patient did not improve and did not undergo repeat surgery.
Discussion
For the treatment of medial and lateral elbow epicondylitis, RF microtenotomy is successful in 91% of patients. Symptomatic improvement was observed up to 9 years postoperatively. During this study, no complications were recorded; 7 treatment failures occurred. When compared with other techniques, the results with RF microtenotomy are equivalent or better.
In a retrospective study, Szabo and colleagues14 compared open, arthroscopic, and percutaneous release for lateral elbow tendinosis. They found the 3 methods to be highly effective for the treatment of tendinosis with no significant difference between them. Resection of the epicondyle and transfer of the anconeus muscle was found to be effective (94%) in a retrospective study by Almquist and colleagues.15 Dunn and coauthors16 reported a 97% success rate at 10 to 14 years postoperatively with a mini-open technique. Rubenthaler and colleagues17 showed 88% effectiveness for the open technique and 93% for the arthroscopic technique. With arthroscopic release of the extensor carpi radialis brevis tendon, Lattermann and coauthors18 reported clinical improvement in 94% of patients. In a study by Rose and colleagues,19 denervation of the lateral epicondyle was effective in relieving pain in 80% of patients who had had a positive response to a local anesthetic block. In a recently published study by Koh and coauthors,20 19 of 20 patients experienced a favorable outcome after treatment with ultrasonic microresection.
Regardless of surgical methods and their reported success rate, complications are associated with elbow surgery. Postoperative problems may include restricted function, elbow instability, persistent muscle weakness, and painful neuroma of the posterior cutaneous nerve.10,21,22 The recent introduction of arthroscopic release offers the potential for less morbidity and enables visualization of the elbow joint. However, disadvantages of the arthroscopic approach include violation of the joint for extra-articular pathology, increased operative time and cost, and neurovascular complications. Additionally, it is possible that the entire spectrum of extra-articular tendinosis cannot be effectively identified arthroscopically.23 In a prospective, randomized study, Meknas and colleagues24 compared RF microtenotomy with extensor tendon release and repair. They showed that patients treated with RF-microtenotomy experienced earlier pain relief and improved grip strength over the release group.
Different proposed mechanisms of action have been described to explain the favorable effects of the RF-based microtenotomy procedure, such as induced healing by an angiogenic response in the tendon tissue. In an animal study, Harwood and colleagues8 showed that low-dose RF-based plasma microtenotomy has the ability to stimulate angiogenic growth factors in tendons, such as αv integrin and vascular endothelial growth factor. These factors have been shown to be associated with healing.8 Early inflammatory response with new-vessel formation after 28 days was found in another animal study using the same method.25 Evaluation of RF-based methods in a prospective controlled laboratory study using a rabbit-tendon model showed histologic evidence of early inflammation with development of neovasculature after treatment.8 A later histologic study using an aged Achilles rabbit tendon model was performed to evaluate the effect of RF-based plasma microtenotomy on collagen remodeling.25 The degenerated tendon showed gaps, few normal crimpings, and a lack of reflectivity under polarized light. At 9 days after treatment, the treated tendon showed localized irregular crimpings, and, at 30 days, it showed regular crimping, tightly dense collagen fibers, and hypercellularity with good reflectivity. This was similar in appearance to a normal nondegenerated tendon (Figures 2A-2D). The RF-treated tendon also demonstrated an increase in production of insulin-like growth factor-1, β-fibroblast growth factor-1, αv integrin, and vascular endothelial growth factor.
Pathologic nerve ingrowth or nerve irritation in the tendon substance has been considered a possible cause of the pain experienced with tendinosis. Radiofrequency treatment has been shown to induce acute degeneration and ablation of sensory nerve fibers.26 These degenerated nerve fibers were observed to regenerate at 90 days after treatment.27 These findings provide potential evidence for early pain relief that is maintained long term as the nerves regenerate.
This midterm follow-up of patients with elbow epicondylitis has shown that RF-based microtenotomy can produce successful, durable results. Microtenotomy is a technically simple procedure to perform and is associated with a rapid and uncomplicated recovery. It is safe and can effectively eliminate or markedly reduce clinical symptoms.
Limitations
Lateral epicondylitis has been described as a self-limited disease, with resolution of symptoms at 12 to 18 months with conservative treatment. This perspective challenges the indication of any proposed surgical treatment for the condition. Although the results of this research demonstrated the benefits of RF microtenotomy, there are inherent limitations of the study design. The study lacks a control group, and randomization would improve the strength of the study. Additional outcome measures, such as Disabilities of the Arm, Shoulder, and Hand score, and grip strength could complement pain scores to provide more data. These data were collected in a preliminary study.9 Postoperative histologic analysis of treated human tissue would be ideal, but ethical considerations limit study to animal models. An additional limitation is potential examiner bias. Data collection was performed by an independent medical technician; a third-party blinded evaluation could have been performed, but this was not feasible in a clinical setting.
Conclusion
Radiofrequency-based microtenotomy is a safe and effective procedure for elbow epicondylitis. The results are durable with successful outcomes observed 9 years after surgery.
1. Leach RE, Miller JK. Lateral and medial epicondylitis of the elbow. Clin Sports Med. 1987;6(2):259-272.
2. Vangsness CT Jr, Jobe FW. Surgical technique of medial epicondylitis: Results in 35 elbows. J Bone Joint Surg Br. 1991;73(3):409-411.
3. Galloway M, DeMaio M, Mangine R. Rehabilitative techniques in the treatment of medial and lateral epicondylitis. Orthopedics. 1992;15(9):1089-1096.
4. Kraushaar BS, Nirschl RP. Tendinosis of the elbow (tennis elbow). Clinical features and findings of histological, immunohistochemical, and electron microscopy studies. J Bone Joint Surg Am. 1999;81(2):259-278.
5. Leadbetter WB. Cell-matrix response in tendon injury. Clin Sports Med. 1992;11(3):533-578.
6. Nirschl RP. Tennis elbow tendinosis: pathoanatomy, nonsurgical and surgical management. In: Fine LJ, ed. Repetitive Motion Disorders of the Upper Extremity. Rosemont, IL: American Academy of Orthopaedic Surgeons; 1995:467-479.
7. Chu V, Kuang J, Aiaid A, Korkola S, Chiu RC. Angiogenic response induced by mechanical transmyocardial revascularization. J Thorac Cardiovasc Surg 1999;118:849-856.
8. Harwood R, Bowden K, Amiel M, Tasto JP, Amiel D. Structural and angiogenic response to bipolar radiofrequency treatment of normal rabbit achilles tendon: a potential application to the treatment of tendinosis. Trans Orthop Res Soc. 2003;28:819.
9. Tasto JP, Cummings J, Medlock V, Hardesty R, Amiel D. Microtenotomy using a radiofrequency probe to treat lateral epicondylitis. Arthroscopy. 2005;21(7):851-860.
10. Woloszko J, Stalder KR, Brown IG. Plasma characteristics of repetitively-pulsed electrical discharges in saline solutions used for surgical procedures. IEEE Trans Plasma Sci. 2002;30:1376-1383.
11. Stalder KR, Woloszko J, Brown IG, Smith CD. Repetitive plasma discharges in saline solutions. Appl Phys Lett. 2001;79:4503-4505.
12. Woloszko J, Gilbride C. Coblation technology (plasma mediated ablation for otolaryngology applications). Proc SPIE. 2000;3907:306–316.
13. Woloszko J, Kwende MM, Stalder KR. Coblation in otolaryngology. Proc SPIE. 2003;4949:341–352.
14. Szabo SJ, Savoie FH 3rd, Field LD, Ramsey JR, Hosemann CD. Tendinosis of the extensor carpi radialis brevis: an evaluation of three methods of operative treatment. J Shoulder Elbow Surg Am. 2006;15(6):721-727.
15. Almquist EE, Necking L, Bach AW. Epicondylar resection with anconeus transfer for chronic lateral epicondylitis. J Hand Surg Am. 1998;23(4):723-731.
16. Dunn JH, Kim JJ, Davis L, Nirschl RP. Ten- to 14-year follow-up of the Nirschl surgical technique for lateral epicondylitis. Am J Sports Med. 2008;36(2):261-266.
17. Rubenthaler F, Wiese M, Senge A, Keller L, Wittenberg RH. Long-term follow-up of open and endoscopic Hohmann procedures for lateral epicondylitis. Arthroscopy. 2005;21(6):684-690.
18. Lattermann C, Romeo AA, Anbari A, et al. Arthroscopic debridement of the extensor carpi radialis brevis for the treatment of recalcitrant lateral epicondylitis. J Shoulder Elbow Surg. 2010;19(5):651-656.
19. Rose NE, Forman SK, Dellon AL. Denervation of the lateral epicondyle for treatment of chronic lateral epicondylitis. J Hand Surg Am. 2013;38(2):344-349.
20. Koh JS, Mohan PC, Howe TS, et al. Fasciotomy and surgical tenotomy for recalcitrant lateral elbow tendonopathy: early clinical experience with a novel device for minimally invasive percutaneous microresection. Am J Sports Med. 2013;41(3):636-644.
21. Nirschl RP, Ashman ES. Elbow tendonopathy: tennis elbow. Clin Sports Med. 2003;22(4):813-836.
22. Dellon AL, Kim J, Ducic I. Painful neuroma of the posterior cutaneous nerve of the forearm after surgery for lateral humeral epicondylitis. J Hand Surg Am. 2004;29(3):387-390.
23. Cummins CA. Lateral epicondylitis: in-vivo assessment of arthroscopic debridement and correlation with patient outcomes. Am J Sports Med. 2006;34(9):1486-1491.
24. Meknas K, Odden-Miland A, Mercer JB, Castillejo M, Johansen O. Radiofrequency microtenotomy: a promising method for treatment of recalcitrant lateral epicondylitis. Am J Sports Med. 2008;36(10):1960-1965.
25. Takahashi N, Tasto JP, Locke J, et al. The use of radiofrequency (RF) for the treatment of chronic tendinosis. Paper presented at: 6th Biennial Congress of the International Society of Arthroscopy, Knee Surgery, and Orthopaedic Sports Medicine Congress; May 2007; Florence, Italy. Abstract 1433.
26. Takahashi N, Tasto JP, Ritter M, et al. Pain relief through an antinociceptive effect after radiofrequency application. Am J Sports Med. 2007;35(5):805-810.
27. Ochiai N, Tasto JP, Ohtori S, Takahashi N, Moriya H, Amiel D. Nerve regeneration after radiofrequency ablation. Am J Sports Med. 2007;35(11):1940-1944.
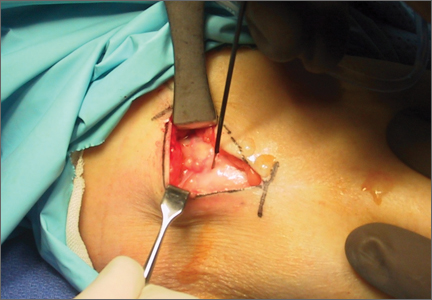
Giant Bone Island of the Tibia in a Child
A bone island is a focus of normal cortical bone located within the medullary cavity. The vast majority of bone islands are small, measuring from 1 mm to 2 cm in size. They are found more frequently in adults than in children. The lesion can be virtually diagnosed on the basis of its characteristic clinical and imaging features. Differential diagnosis may be difficult when the lesion manifests itself uncharacteristically by being symptomatic, very large, and hot on bone scan.1-4
The term giant bone island has been used to describe a large lesion1 that measures more than 2 cm in any dimension.5 Giant bone islands have been described only in adults,1,5-15 and the longest bone island length reported is 10.5 cm.10 They are usually symptomatic and associated with increased radionuclide uptake on bone scintigraphy.14
The history and the clinical and imaging presentation of an even longer, symptomatic, and scintigraphically hot lesion in the tibial diaphysis of a 10-year-old boy is reported. The lesion further exhibited several atypical imaging features necessitating an open biopsy, which confirmed the diagnosis of a giant bone island. The pertinent differential diagnosis and the clinical and radiographic findings after 15-year follow-up are also presented and discussed. The patient provided written informed consent for print and electronic publication of this case report.
Case Report
A 10-year-old boy was admitted for surgical repair of an inguinal hernia. Physical examination revealed a painless but tender anterior bowing of the right tibial diaphysis. The patient was a healthy-appearing white male with normal vital signs, gait, and posture. His parents noticed a slight protuberance of the tibia at age 2.5 years. No medical advice was asked for the bone swelling after that time. After recovery from the inguinal hernia repair 3 weeks later, the bone lesion was thoroughly examined. Radiographs showed an oblong, homogenous region of dense sclerosis in the diaphysis of the right tibia. The lesion had relatively well-defined margins and was located in the medullary cavity. Speculations were not obvious in the periphery of the lesion, which exhibited a sharp circumscription (Figures 1A, 1B). A well-defined lytic area was evident at the distal part of the lesion (Figure 1B). There was no periosteal reaction. Blood and serum chemistries were within normal limits, including serum calcium, phosphorus, and alkaline phosphatase. A conventional 3-phase bone scintigraphy (300 MBq) with technetium-99m HDP (hydroxydiphosphonate) indicated increased uptake in the area of the lesion but no other skeletal abnormality (Figure 2). Computed tomography (CT) showed that the lesion was purely intramedullary and densely blastic. The lesion originated from the medial cortex, which was thickened (Figure 3A). The lesion extended to the anterolateral cortex, which was thinned and included a lytic area. In the distal part of the lesion, the anterolateral cortex was thickened, included lytic areas, and exhibited an anterior portion of cortical destruction (Figure 3B). The fatty marrow adjacent to the region of sclerosis appeared normal. There was no evidence of extraosseous soft-tissue changes. On both T1- and T2-weighted magnetic resonance imaging (MRI), the lesion exhibited low-signal intensity. The lesion measured 10.8×2.2×1 cm. It originated from the medial cortical bone of the tibia, blended into the medullary cavity, and extended anteriorly towards and through the anterior cortex. The area of cortical destruction was clearly evident on the axial MRI. The periosteum was displaced and eroded anteriorly by focal radiating bony streaks. No enhancement was seen after the intravenous administration of gadolinium-diethylenetriamine pentaacetic acid (Gd-DTPA) as a contrast medium. There were no extraosseous soft-tissue changes. In the distal part of the lesion, sagittal and axial MRI showed a 1.2×0.8×0.7-cm well-defined ovoid focus, with characteristics of cystic degeneration that exhibited intermediate-signal intensity on T1-weighted MRI (Figure 4) and high-signal intensity on T2-weighted MRI.
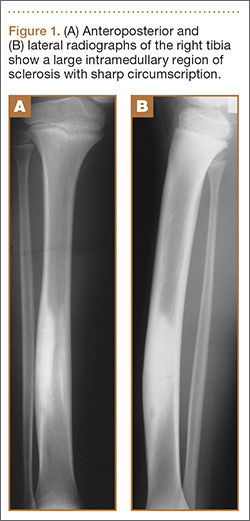
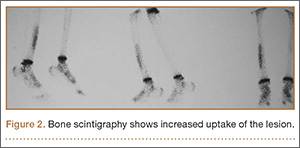
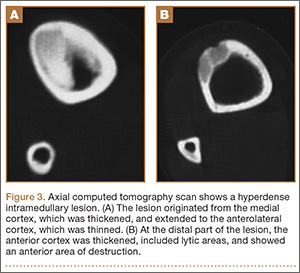
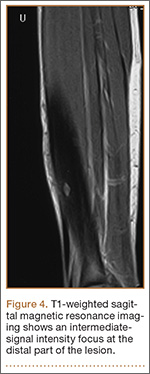
An open biopsy was performed. Macroscopically, a wedge of compact bone measuring 3×1.7×0.6 cm was taken. Microscopic examination showed a thinned periphery of lamellar (mature) bone with haversian canals and, beneath it, woven (immature) bone with long-surface processes projecting within adjacent cancellous bone (Figure 5A). The woven bone contained loose vascular fibrous tissue. No osteoclasts were noted, and the very few osteoblasts lining the bone trabeculae were small, single-layered, and flat (Figure 5B). There was no evidence of neoplastic cells. There was no abnormality of the periosteum and the surrounding soft tissues.
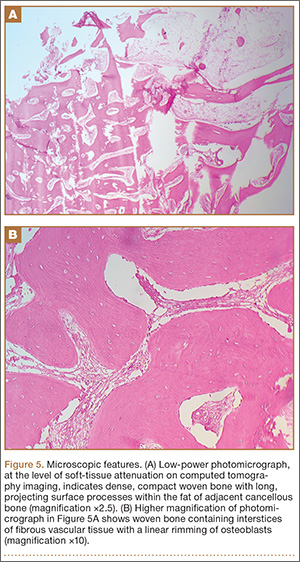
The histology was pathognomonic of a giant bone island. No additional surgical intervention was recommended.
The postoperative course was uncomplicated, and the patient was discharged 2 weeks later. An above-the-knee plaster was recommended for 3 months and a below-the-knee splint for an additional 2-month period. Full weight-bearing was allowed only after the postsurgical sixth month to prevent an impending fracture. The tibial bowing was tender to pressure or palpation, and the patient reported mild spontaneous pain during follow-up. Radiographs 1 year after surgery indicated that the bone area removed for biopsy was replaced by compact bone. MRI performed 4 years after surgery showed that the volume of the lesion in relation to the host bone was not changed.
At the last follow-up 15 years after surgery, the anterior tibial bowing was not changed (Figure 6A), but the patient additionally complained of skin irritation after intense training wearing boots during military service. The radiographic appearance of the lesion was also not changed, while the periphery of the lesion exhibited scarce radiating bony streaks with rounded contours (Figures 6B, 6C). The clinical symptoms and signs from wearing military boots completely subsided after a couple of weeks’ rest from daily army activities, but the mild spontaneous pain and the local tenderness over the tibial bowing persisted.
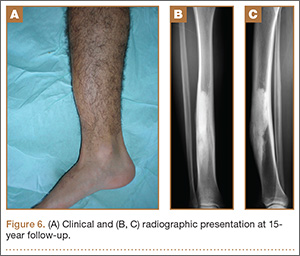
Discussion
Giant bone islands are more likely to be associated with clinical symptoms than the usual small-sized bone island. Some degree of pain was detected in 8 of 10 patients with a giant bone island presented in the literature, but it was induced by trauma in 3 of them.14
Radiographic appearance is among the distinguishing diagnostic features of a giant bone island. It appears as an ovoid, round, or oblong, homogenously dense, single or multiple focus of sclerosis within the medullary cavity; it is oriented along the long axis of the host bone, and it exhibits peripheral pseudopodia or radiating spicules producing the typical “thorny” or “paintbrush” appearance.8,16,17 It does not exhibit cortical penetration and it is not associated with periosteal reaction.10
The CT findings include a sclerotic and hyperdense focus with spiculated margins extending into the adjacent cancellous bone. The lack of bone destruction and soft-tissue mass are also diagnostic.3,7 MRI findings will reflect the low-signal intensity characteristics of cortical bone on all pulse sequences.18
Enostoses usually exhibit no activity on skeletal scintigraphy, while giant lesions generally show increased radiotracer uptake.5,9-11,14,19-27 The latter may result from the increased amount of bone turnover, which is seen more often with larger lesions because of active bone deposition and remodeling.20,21,23,28 Histopathology of a giant bone island appears identical to the well-described pathologic appearance of smaller bone islands. The lesion is composed of compact lamellar bone and haversian systems, which blend with the adjacent spongiosa. The surrounding cancellous bone forms thorn-like trabeculae radiating from the lesion and merging with the cancellous bone.1,4,5,8,28
The presumptive diagnosis of a bone island is based on the clinical findings, imaging features, and follow-up examinations. An asymptomatic, isolated, sclerotic bone lesion showing the typical features of a bone island on plain radiography, CT, and MRI, whatever its size, that is nonactive on bone scan may be easily diagnosed. However, a symptomatic patient with a hot lesion on scintigraphy should be carefully observed. In addition, larger lesions may raise the suspicion of a neoplasm, such as a sclerotic variant of osteosarcoma. In such cases, an open biopsy may be undertaken. No specific treatment is required after the diagnosis has been confirmed. There is no literature to suggest that, after adequate biopsy confirmation, excision or resection is necessary. Follow-up radiographic examination of the lesion should be suggested to monitor for any potential growth.2,10,23
The first giant bone island appearing in a child is presented in this report. The lack of a causative factor leading to the anterior tibial bowing indicated that the bone deformity was caused primarily by the lesion. The present case is unusual for the appearance of several atypical features, some of which have not been previously described. Peripheral radiating spiculated margin was absent on the patient’s initial radiographs and CT imaging. MRI indicated only the presence of radiating bony streaks that displaced and eroded the periosteum on the anterior border of the lesion. The CT findings that the lesion likely originated or was in close proximity with the medial cortex of the tibia were also atypical. It has been previously reported that spinal lesions located immediately below the cortex tend to fuse with the endosteal surface, while similar features may also be seen in the appendicular enostoses.4,29 Other CT findings, such as the thinning of the overlying anterolateral cortical bone, as well as the cortical thickening at the periphery of the lesion associated with areas of soft-tissue attenuation and anterior cortical destruction, have not been described even in the atypical features of a giant bone island. The lytic area resembling a nidus that was evident at the distal part of the lesion was more likely consistent with an area of resorption, which, although rare, has been described on giant lesions.2,9,29 The substantial amount of woven bone transforming to lamellar bone that was evident in the present patient’s microscopic features is also an atypical finding, although it may be expected to some degree in scintigraphically hot, large lesions.28 The clinical and imaging progress of the lesion supported the diagnosis of a giant bone island. The degree of the anterior tibial bowing and the volume of the lesion in relation to the host bone were not changed throughout the follow-up period, indicating that the growth of the lesion followed the growth of the normal bone.
The differential diagnosis of a giant bone island includes a variety of benign tumors and tumor-like lesions, as well as malignant bone lesions.2,4,23,28,30,31 In the patient presented in this report, the diagnosis of an atypical sclerotic presentation of a nonossifying fibroma or healing stage of this lesion could be consistent with some of the CT findings, including the eccentric origin from the cortex associated with medial cortical thickening, the anterolateral cortical thinning, and the soft-tissue attenuation of cortical areas. In addition, unifocal osteofibrous dysplasia may also present with a long intracortical diaphyseal lucency within an area of marked cortical sclerosis and cause a bowing deformity. Both diagnoses were excluded, since no fibrous stroma was evident on the histologic examination of the lesion. A large or giant long-bone osteoma would be associated with the outer cortical margin of bone but would not involve the intramedullary space. The scintigraphically increased uptake of radioisotope, as well as the CT and MRI findings, were not consistent with the diagnosis of osteoid osteoma, osteoblastoma, or osteomyelitis. Although most imaging findings were consistent with a benign lesion, and contrast-enhanced MRI showed no increased vascularity, anterior cortical disruption necessitated a bone biopsy to rule out any potential malignancy.
The histopathology in association with the clinical and imaging findings indicated the diagnosis of a giant bone island. The increased proportion of maturing woven bone over lamellar bone indicated an active remodeling lesion that could be related to the patient’s age, since the clinical and radiographic features of the lesion were not changed after 15-year follow-up.
Conclusion
This is the first giant bone island diagnosed in a patient before puberty. Its greatest length was 10.8 cm, which is the longest reported in the literature. The imaging appearance included several atypical features that are very rare or have not been reported. Microscopic features indicated less mature lamellar bone and a prominent proportion of maturing woven bone. The clinical and the radiographic appearance of the lesion were not changed after 15-year follow-up.
1. Smith J. Giant bone islands. Radiology. 1973;7(1):35-36.
2. Mirra JM. Bone Tumors: Clinical, Radiologic and Pathologic Correlations. Philadelphia, PA: Lea & Febiger; 1989.
3. Greenspan A. Bone island (enostosis): current concept - a review. Skeletal Radiol. 1995;24(2):111-115.
4. Kransdorf MJ, Peterson JJ, Bancroft LW. MR imaging of the knee: incidental osseous lesions. Radiol Clin North Am. 2007;45(6):943-954.
5. Gold RH, Mirra JM, Remotti F, Pignatti G. Case report 527: Giant bone island of tibia. Skeletal Radiol. 1989;18(2):129-132.
6. Onitsuka H. Roentgenologic aspects of bone islands. Radiology. 1977;123(3):607-612.
7. Ehara S, Kattapuram SV, Rosenberg AE. Giant bone island. Computed tomography findings. Clin Imaging. 1989;13(3):231-233.
8. Greenspan A, Steiner G, Knutzon R. Bone island (enostosis): clinical significance and radiologic and pathologic correlations. Skeletal Radiol. 1991;20(2):85-90.
9. Avery GR, Wilsdon JB, Malcolm AJ. Giant bone island with some central resorption. Skeletal Radiol. 1995;24(1):59-60.
10. Brien EW, Mirra JM, Latanza L, Fedenko A, Luck J Jr. Giant bone island of femur. Case report, literature review, and its distinction from low grade osteosarcoma. Skeletal Radiol. 1995;24(7):546-550.
11. Greenspan A, Klein MJ. Giant bone island. Skeletal Radiol. 1996;25(1):67-69.
12. Trombetti A, Noël E. Giant bone islands: a case with 31 years of follow-up. Joint Bone Spine. 2002;69(1):81-84.
13. Dhaon BK, Gautam VK, Jain P, Jaiswal A, Nigam V. Giant bone island of femur complicating replacement arthroplasty: a report of two cases. J Surg Orthop Adv. 2004;13(4):220-223.
14. Park HS, Kim JR, Lee SY, Jang KY. Symptomatic giant (10-cm) bone island of the tibia. Skeletal Radiol. 2005;34(6):347-350.
15. Ikeuchi M, Komatsu M, Tani T. Giant bone island of femur with femoral head necrosis: a case report. Arch Orthop Trauma Surg. 2010;130(4):447-450.
16. Kim SK, Barry WF Jr. Bone island. Am J Roentgenol Radium Ther Nucl Med. 1964;92:1301-1306.
17. Kim SK, Barry WF Jr. Bone islands. Radiology. 1968;90(1):77-78.
18. Cerase A, Priolo F. Skeletal benign bone-forming lesions. Eur J Radiol. 1998;27:S91–S97.
19. Go RT, El-Khoury GY, Wehbe MA. Radionuclide bone image in growing and stable bone island. Skeletal Radiol. 1980;5(1):15-18.
20. Hall FM, Goldberg RP, Davies JA, Fainsinger MH. Scintigraphic assessment of bone islands. Radiology. 1980;135(3):737-742.
21. Greenspan A, Stadalnik RC. Bone island: scintigraphic findings and their clinical application. Can Assoc Radiol J. 1995;46(5):368-379.
22. Sickles EA, Genant HK, Hoffer PB. Increased localization of 99mTc-pyrophosphate in a bone island: case report. J Nucl Med. 1976;17(2):113-115.
23. Dorfman HD, Czerniak B. Bone Tumors. St Louis: Mosby; 1998.
24. Ngan H. Growing bone islands. Clin Radiol. 1972;23(2):199-201.
25. Davies JA, Hall FM, Goldberg RP, Kasdon EJ. Positive bone scan in a bone island. Case report. J Bone Joint Surg Am. 1979;61(6):943-945.
26. Simon K, Mulligan ME. Growing bone islands revisited. A case report. J Bone Joint Surg Am. 1985;67(5):809-811.
27. Blank N, Lieber A. The significance of growing bone islands. Radiology. 1965;85(3):508-511.
28. Greenspan A, Gernot J, Wolfgang R. Differential Diagnosis of Orthopaedic Oncology. Philadelphia, PA: Lippincott Williams & Wilkins; 2007.
29. Kransdorf MJ, Murphey MD. Osseous tumors. In: Davies AM, Sundaram M, James SLJ, eds. Imaging of Bone Tumors and Tumor-Like Lesions. Berlin, Germany: Springer-Verlag; 2009.
30. Mödder B, Guhl B, Schaefer HE. Growing bone islands as differential diagnosis of osteoplastic metastases. Rontgenblatter. 1980;33(6):286-288.
31. Flechner RE, Mills SE. Atlas of Tumor Pathology: Tumors of the Bones and Joints. Washington, DC: Armed Forces Institute of Pathology; 1993.
A bone island is a focus of normal cortical bone located within the medullary cavity. The vast majority of bone islands are small, measuring from 1 mm to 2 cm in size. They are found more frequently in adults than in children. The lesion can be virtually diagnosed on the basis of its characteristic clinical and imaging features. Differential diagnosis may be difficult when the lesion manifests itself uncharacteristically by being symptomatic, very large, and hot on bone scan.1-4
The term giant bone island has been used to describe a large lesion1 that measures more than 2 cm in any dimension.5 Giant bone islands have been described only in adults,1,5-15 and the longest bone island length reported is 10.5 cm.10 They are usually symptomatic and associated with increased radionuclide uptake on bone scintigraphy.14
The history and the clinical and imaging presentation of an even longer, symptomatic, and scintigraphically hot lesion in the tibial diaphysis of a 10-year-old boy is reported. The lesion further exhibited several atypical imaging features necessitating an open biopsy, which confirmed the diagnosis of a giant bone island. The pertinent differential diagnosis and the clinical and radiographic findings after 15-year follow-up are also presented and discussed. The patient provided written informed consent for print and electronic publication of this case report.
Case Report
A 10-year-old boy was admitted for surgical repair of an inguinal hernia. Physical examination revealed a painless but tender anterior bowing of the right tibial diaphysis. The patient was a healthy-appearing white male with normal vital signs, gait, and posture. His parents noticed a slight protuberance of the tibia at age 2.5 years. No medical advice was asked for the bone swelling after that time. After recovery from the inguinal hernia repair 3 weeks later, the bone lesion was thoroughly examined. Radiographs showed an oblong, homogenous region of dense sclerosis in the diaphysis of the right tibia. The lesion had relatively well-defined margins and was located in the medullary cavity. Speculations were not obvious in the periphery of the lesion, which exhibited a sharp circumscription (Figures 1A, 1B). A well-defined lytic area was evident at the distal part of the lesion (Figure 1B). There was no periosteal reaction. Blood and serum chemistries were within normal limits, including serum calcium, phosphorus, and alkaline phosphatase. A conventional 3-phase bone scintigraphy (300 MBq) with technetium-99m HDP (hydroxydiphosphonate) indicated increased uptake in the area of the lesion but no other skeletal abnormality (Figure 2). Computed tomography (CT) showed that the lesion was purely intramedullary and densely blastic. The lesion originated from the medial cortex, which was thickened (Figure 3A). The lesion extended to the anterolateral cortex, which was thinned and included a lytic area. In the distal part of the lesion, the anterolateral cortex was thickened, included lytic areas, and exhibited an anterior portion of cortical destruction (Figure 3B). The fatty marrow adjacent to the region of sclerosis appeared normal. There was no evidence of extraosseous soft-tissue changes. On both T1- and T2-weighted magnetic resonance imaging (MRI), the lesion exhibited low-signal intensity. The lesion measured 10.8×2.2×1 cm. It originated from the medial cortical bone of the tibia, blended into the medullary cavity, and extended anteriorly towards and through the anterior cortex. The area of cortical destruction was clearly evident on the axial MRI. The periosteum was displaced and eroded anteriorly by focal radiating bony streaks. No enhancement was seen after the intravenous administration of gadolinium-diethylenetriamine pentaacetic acid (Gd-DTPA) as a contrast medium. There were no extraosseous soft-tissue changes. In the distal part of the lesion, sagittal and axial MRI showed a 1.2×0.8×0.7-cm well-defined ovoid focus, with characteristics of cystic degeneration that exhibited intermediate-signal intensity on T1-weighted MRI (Figure 4) and high-signal intensity on T2-weighted MRI.
An open biopsy was performed. Macroscopically, a wedge of compact bone measuring 3×1.7×0.6 cm was taken. Microscopic examination showed a thinned periphery of lamellar (mature) bone with haversian canals and, beneath it, woven (immature) bone with long-surface processes projecting within adjacent cancellous bone (Figure 5A). The woven bone contained loose vascular fibrous tissue. No osteoclasts were noted, and the very few osteoblasts lining the bone trabeculae were small, single-layered, and flat (Figure 5B). There was no evidence of neoplastic cells. There was no abnormality of the periosteum and the surrounding soft tissues.
The histology was pathognomonic of a giant bone island. No additional surgical intervention was recommended.
The postoperative course was uncomplicated, and the patient was discharged 2 weeks later. An above-the-knee plaster was recommended for 3 months and a below-the-knee splint for an additional 2-month period. Full weight-bearing was allowed only after the postsurgical sixth month to prevent an impending fracture. The tibial bowing was tender to pressure or palpation, and the patient reported mild spontaneous pain during follow-up. Radiographs 1 year after surgery indicated that the bone area removed for biopsy was replaced by compact bone. MRI performed 4 years after surgery showed that the volume of the lesion in relation to the host bone was not changed.
At the last follow-up 15 years after surgery, the anterior tibial bowing was not changed (Figure 6A), but the patient additionally complained of skin irritation after intense training wearing boots during military service. The radiographic appearance of the lesion was also not changed, while the periphery of the lesion exhibited scarce radiating bony streaks with rounded contours (Figures 6B, 6C). The clinical symptoms and signs from wearing military boots completely subsided after a couple of weeks’ rest from daily army activities, but the mild spontaneous pain and the local tenderness over the tibial bowing persisted.
Discussion
Giant bone islands are more likely to be associated with clinical symptoms than the usual small-sized bone island. Some degree of pain was detected in 8 of 10 patients with a giant bone island presented in the literature, but it was induced by trauma in 3 of them.14
Radiographic appearance is among the distinguishing diagnostic features of a giant bone island. It appears as an ovoid, round, or oblong, homogenously dense, single or multiple focus of sclerosis within the medullary cavity; it is oriented along the long axis of the host bone, and it exhibits peripheral pseudopodia or radiating spicules producing the typical “thorny” or “paintbrush” appearance.8,16,17 It does not exhibit cortical penetration and it is not associated with periosteal reaction.10
The CT findings include a sclerotic and hyperdense focus with spiculated margins extending into the adjacent cancellous bone. The lack of bone destruction and soft-tissue mass are also diagnostic.3,7 MRI findings will reflect the low-signal intensity characteristics of cortical bone on all pulse sequences.18
Enostoses usually exhibit no activity on skeletal scintigraphy, while giant lesions generally show increased radiotracer uptake.5,9-11,14,19-27 The latter may result from the increased amount of bone turnover, which is seen more often with larger lesions because of active bone deposition and remodeling.20,21,23,28 Histopathology of a giant bone island appears identical to the well-described pathologic appearance of smaller bone islands. The lesion is composed of compact lamellar bone and haversian systems, which blend with the adjacent spongiosa. The surrounding cancellous bone forms thorn-like trabeculae radiating from the lesion and merging with the cancellous bone.1,4,5,8,28
The presumptive diagnosis of a bone island is based on the clinical findings, imaging features, and follow-up examinations. An asymptomatic, isolated, sclerotic bone lesion showing the typical features of a bone island on plain radiography, CT, and MRI, whatever its size, that is nonactive on bone scan may be easily diagnosed. However, a symptomatic patient with a hot lesion on scintigraphy should be carefully observed. In addition, larger lesions may raise the suspicion of a neoplasm, such as a sclerotic variant of osteosarcoma. In such cases, an open biopsy may be undertaken. No specific treatment is required after the diagnosis has been confirmed. There is no literature to suggest that, after adequate biopsy confirmation, excision or resection is necessary. Follow-up radiographic examination of the lesion should be suggested to monitor for any potential growth.2,10,23
The first giant bone island appearing in a child is presented in this report. The lack of a causative factor leading to the anterior tibial bowing indicated that the bone deformity was caused primarily by the lesion. The present case is unusual for the appearance of several atypical features, some of which have not been previously described. Peripheral radiating spiculated margin was absent on the patient’s initial radiographs and CT imaging. MRI indicated only the presence of radiating bony streaks that displaced and eroded the periosteum on the anterior border of the lesion. The CT findings that the lesion likely originated or was in close proximity with the medial cortex of the tibia were also atypical. It has been previously reported that spinal lesions located immediately below the cortex tend to fuse with the endosteal surface, while similar features may also be seen in the appendicular enostoses.4,29 Other CT findings, such as the thinning of the overlying anterolateral cortical bone, as well as the cortical thickening at the periphery of the lesion associated with areas of soft-tissue attenuation and anterior cortical destruction, have not been described even in the atypical features of a giant bone island. The lytic area resembling a nidus that was evident at the distal part of the lesion was more likely consistent with an area of resorption, which, although rare, has been described on giant lesions.2,9,29 The substantial amount of woven bone transforming to lamellar bone that was evident in the present patient’s microscopic features is also an atypical finding, although it may be expected to some degree in scintigraphically hot, large lesions.28 The clinical and imaging progress of the lesion supported the diagnosis of a giant bone island. The degree of the anterior tibial bowing and the volume of the lesion in relation to the host bone were not changed throughout the follow-up period, indicating that the growth of the lesion followed the growth of the normal bone.
The differential diagnosis of a giant bone island includes a variety of benign tumors and tumor-like lesions, as well as malignant bone lesions.2,4,23,28,30,31 In the patient presented in this report, the diagnosis of an atypical sclerotic presentation of a nonossifying fibroma or healing stage of this lesion could be consistent with some of the CT findings, including the eccentric origin from the cortex associated with medial cortical thickening, the anterolateral cortical thinning, and the soft-tissue attenuation of cortical areas. In addition, unifocal osteofibrous dysplasia may also present with a long intracortical diaphyseal lucency within an area of marked cortical sclerosis and cause a bowing deformity. Both diagnoses were excluded, since no fibrous stroma was evident on the histologic examination of the lesion. A large or giant long-bone osteoma would be associated with the outer cortical margin of bone but would not involve the intramedullary space. The scintigraphically increased uptake of radioisotope, as well as the CT and MRI findings, were not consistent with the diagnosis of osteoid osteoma, osteoblastoma, or osteomyelitis. Although most imaging findings were consistent with a benign lesion, and contrast-enhanced MRI showed no increased vascularity, anterior cortical disruption necessitated a bone biopsy to rule out any potential malignancy.
The histopathology in association with the clinical and imaging findings indicated the diagnosis of a giant bone island. The increased proportion of maturing woven bone over lamellar bone indicated an active remodeling lesion that could be related to the patient’s age, since the clinical and radiographic features of the lesion were not changed after 15-year follow-up.
Conclusion
This is the first giant bone island diagnosed in a patient before puberty. Its greatest length was 10.8 cm, which is the longest reported in the literature. The imaging appearance included several atypical features that are very rare or have not been reported. Microscopic features indicated less mature lamellar bone and a prominent proportion of maturing woven bone. The clinical and the radiographic appearance of the lesion were not changed after 15-year follow-up.
1. Smith J. Giant bone islands. Radiology. 1973;7(1):35-36.
2. Mirra JM. Bone Tumors: Clinical, Radiologic and Pathologic Correlations. Philadelphia, PA: Lea & Febiger; 1989.
3. Greenspan A. Bone island (enostosis): current concept - a review. Skeletal Radiol. 1995;24(2):111-115.
4. Kransdorf MJ, Peterson JJ, Bancroft LW. MR imaging of the knee: incidental osseous lesions. Radiol Clin North Am. 2007;45(6):943-954.
5. Gold RH, Mirra JM, Remotti F, Pignatti G. Case report 527: Giant bone island of tibia. Skeletal Radiol. 1989;18(2):129-132.
6. Onitsuka H. Roentgenologic aspects of bone islands. Radiology. 1977;123(3):607-612.
7. Ehara S, Kattapuram SV, Rosenberg AE. Giant bone island. Computed tomography findings. Clin Imaging. 1989;13(3):231-233.
8. Greenspan A, Steiner G, Knutzon R. Bone island (enostosis): clinical significance and radiologic and pathologic correlations. Skeletal Radiol. 1991;20(2):85-90.
9. Avery GR, Wilsdon JB, Malcolm AJ. Giant bone island with some central resorption. Skeletal Radiol. 1995;24(1):59-60.
10. Brien EW, Mirra JM, Latanza L, Fedenko A, Luck J Jr. Giant bone island of femur. Case report, literature review, and its distinction from low grade osteosarcoma. Skeletal Radiol. 1995;24(7):546-550.
11. Greenspan A, Klein MJ. Giant bone island. Skeletal Radiol. 1996;25(1):67-69.
12. Trombetti A, Noël E. Giant bone islands: a case with 31 years of follow-up. Joint Bone Spine. 2002;69(1):81-84.
13. Dhaon BK, Gautam VK, Jain P, Jaiswal A, Nigam V. Giant bone island of femur complicating replacement arthroplasty: a report of two cases. J Surg Orthop Adv. 2004;13(4):220-223.
14. Park HS, Kim JR, Lee SY, Jang KY. Symptomatic giant (10-cm) bone island of the tibia. Skeletal Radiol. 2005;34(6):347-350.
15. Ikeuchi M, Komatsu M, Tani T. Giant bone island of femur with femoral head necrosis: a case report. Arch Orthop Trauma Surg. 2010;130(4):447-450.
16. Kim SK, Barry WF Jr. Bone island. Am J Roentgenol Radium Ther Nucl Med. 1964;92:1301-1306.
17. Kim SK, Barry WF Jr. Bone islands. Radiology. 1968;90(1):77-78.
18. Cerase A, Priolo F. Skeletal benign bone-forming lesions. Eur J Radiol. 1998;27:S91–S97.
19. Go RT, El-Khoury GY, Wehbe MA. Radionuclide bone image in growing and stable bone island. Skeletal Radiol. 1980;5(1):15-18.
20. Hall FM, Goldberg RP, Davies JA, Fainsinger MH. Scintigraphic assessment of bone islands. Radiology. 1980;135(3):737-742.
21. Greenspan A, Stadalnik RC. Bone island: scintigraphic findings and their clinical application. Can Assoc Radiol J. 1995;46(5):368-379.
22. Sickles EA, Genant HK, Hoffer PB. Increased localization of 99mTc-pyrophosphate in a bone island: case report. J Nucl Med. 1976;17(2):113-115.
23. Dorfman HD, Czerniak B. Bone Tumors. St Louis: Mosby; 1998.
24. Ngan H. Growing bone islands. Clin Radiol. 1972;23(2):199-201.
25. Davies JA, Hall FM, Goldberg RP, Kasdon EJ. Positive bone scan in a bone island. Case report. J Bone Joint Surg Am. 1979;61(6):943-945.
26. Simon K, Mulligan ME. Growing bone islands revisited. A case report. J Bone Joint Surg Am. 1985;67(5):809-811.
27. Blank N, Lieber A. The significance of growing bone islands. Radiology. 1965;85(3):508-511.
28. Greenspan A, Gernot J, Wolfgang R. Differential Diagnosis of Orthopaedic Oncology. Philadelphia, PA: Lippincott Williams & Wilkins; 2007.
29. Kransdorf MJ, Murphey MD. Osseous tumors. In: Davies AM, Sundaram M, James SLJ, eds. Imaging of Bone Tumors and Tumor-Like Lesions. Berlin, Germany: Springer-Verlag; 2009.
30. Mödder B, Guhl B, Schaefer HE. Growing bone islands as differential diagnosis of osteoplastic metastases. Rontgenblatter. 1980;33(6):286-288.
31. Flechner RE, Mills SE. Atlas of Tumor Pathology: Tumors of the Bones and Joints. Washington, DC: Armed Forces Institute of Pathology; 1993.
New Developments in Adult Vaccination: Challenges and Opportunities to Protect Vulnerable Veterans From Pneumococcal Disease
Streptococcus pneumoniae (S pneumoniae), also known as pneumococcus, is a successful human pathogen with significant clinical impact that causes pneumonia and invasive infections, including bacteremia and meningitis.1 In the preantibiotic era, nearly 80% of patients with bacteremic pneumococcal pneumonia died.2 The introduction of sulfas and penicillin in the mid-20th century, subsequent refinements in antibiotic chemotherapy, and improvements in supportive care rendered pneumococcal disease readily treatable, notwithstanding the threat of antibiotic-resistant pneumococcus.3 Despite the availability of effective antibiotic therapy against S pneumoniae, pneumococcal disease remains a significant cause of morbidity and mortality among people with increased susceptibility, such as older adults and those living with chronic illness or immunosuppressive conditions. In developed countries like the U.S., where a growing portion of the population is vulnerable to S pneumoniae by virtue of their advanced age and underlying medical conditions, pneumococcal disease is still an important public health concern.4
Penumococcal Vaccines: A Long Time Coming
Vaccination against S pneumoniae has proven an efficacious strategy to reduce the morbidity and mortality associated with this pathogen.5 The original efforts to develop a pneumococcal vaccine culminated in 1945 with a vaccine containing pneumococcal capsular polysaccharides, which elicited a protective immune response among U.S. soldiers (Table 1).Subsequent investigations determined that the protective response was specific to pneumococcal disease caused by the 4 pneumococcal capsular serotypes included in the vaccine, that the carrier rate of pneumococcus with the vaccine serotypes decreased by about 50%, and that the incidence of pneumonia from the vaccine serotypes was reduced even in nonimmunized soldiers.6 These early observations remain relevant to our contemporary understanding of the impact of pneumococcal vaccination: Protection is limited to serotypes included in the vaccine; the vaccine reduces colonization; and the vaccine leads to herd immunity—the protection of unvaccinated subjects.
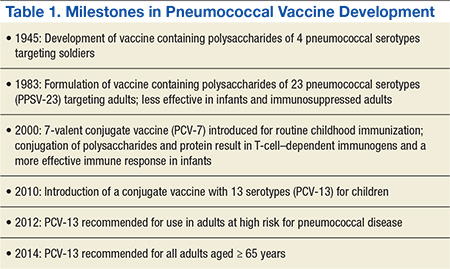
Despite this achievement, the use of vaccines as a strategy to combat pneumococcal disease was upstaged in the subsequent decades by the success of antibiotics. Renewed interest in pneumococcal vaccines resulted from the efforts of Robert Austrian, MD, who astutely observed that “highly effective antimicrobial drugs must be supplemented by other measures, both prophylactic and therapeutic, if the significant mortality resulting still from pneumococcal infection is to be reduced.”7
After initial studies carried out in South African gold miners, the FDA approved a pneumococcal polysaccharide vaccine (PPSV) against 23 of about 90 circulating serotypes.8 The CDC and the Advisory Committee on Immunization Practices (ACIP) initially recommended PPSV-23 for persons perceived to be at high risk for pneumococcal disease, including those with chronic diseases, immunocompromising conditions, and older adults.9
Three decades later, the analysis of a large body of available evidence demonstrated the protective effects of PPSV-23 against invasive pneumococcal disease caused by pneumococcal types included in the vaccine, especially bacteremic pneumonia (about 75% reduction, odds ratio [OR] 0.26, 95% confidence interval [CI] 0.14-0.45).10 A perceived shortcoming of PPSV-23, which some experts dispute, is the lack of definite protection against nonbacteremic pneumococcal pneumonia.11 Studies of nursing home residents demonstrated a 50% reduction in the incidence of both pneumococcal pneumonia and all-cause pneumonia, suggesting that PPSV-23 offers protection against noninvasive pneumococcal pneumonia in specific populations.12 Additional potential limitations of PPSV-23 include reduced benefit in patients aged > 65 years and waning of protection over time.13
Related: Identification and Management of Middle East Respiratory Syndrome
Protein-Conjugate Vaccines
Clearly, the most important limitation of PPSV-23, inherent to all capsular polysaccharide vaccines, is that it does not elicit an immune response in children aged < 2 years. The successful development of a vaccine against Haemophilus influenzae type b (Hib) gave rise to a new generation of pneumococcal vaccines.14 Specifically, the Hib vaccine covalently binds, or conjugates, the capsule polysaccharide to an antigenic protein, leading to effective T-cell–mediated antibody production in infants and toddlers.
In 2000, children received the first iteration of a protein-conjugate vaccine containing the 7 most relevant pneumococcal serotypes (PCV-7).15 The effects of PCV-7 on pneumococcal disease have been extraordinary, practically eliminating infections caused by the pneumococcal serotypes included in the vaccine. Immunizing children with PCV-7 also ushered in a fundamental public health benefit for adults aged > 65 years: a reduction of nearly 90% in the incidence of pneumococcal infections caused by serotypes included in the vaccine. By eliciting mucosal immunity, which leads to decreased nasal carriage of the covered pneumococcal strains among children, PVC-7 generates herd immunity, leading to reductions in transmission, colonization, and infection with vaccine serotypes among adults.16
In 2010, a conjugate vaccine containing 13 serotypes (PCV-13) replaced PCV-7 administration for children.17,18 The PCV-13 is expected to protect children and the herd from disease caused by 6 additional pneumococcal serotypes, including those that surged as replacement strains, filling the ecologic niche created by PCV-7, such as the epidemiologically relevant serotype 19A.19,20
Immune-Compromised Adults
One of the shortcomings of PPSV-23 is its lack of efficacy in patients with advanced HIV, a group with an exquisite vulnerability to pneumococcal disease, as demonstrated by a randomized controlled trial of PPSV-23 in African patients with advanced, untreated HIV infection.21 Similarly, there is concern that patients with lymphoma, leukemia, multiple myeloma, and Hodgkin disease, also at high risk of pneumococcal infection, do not mount sufficient immune responses to polysaccharide antigens or that these responses are adversely affected by chemotherapy or immune suppressing medications. In these populations, a conjugate vaccine (PCV-7 or PCV-13) may elicit a more robust and durable immune response than a polysaccharide vaccine (PPSV-23). A randomized placebo-controlled trial demonstrated the efficacy of PCV-7 in protecting patients with advanced HIV against pneumococcal disease in Africa.22 Based in part on this observation, the ACIP now recommends the use of PCV-13 in patients with HIV and other immunosuppressing conditions, including chronic renal failure.23 A direct comparison of the relative protection of PPSV-23 vs PCV-7 in this population has not been performed.
Pneumococcal Vaccines in the Elderly
Although PPSV-23 was widely adopted in the U.S. with the intention to protect adults aged > 65 years from pneumococcal infection, this vaccine did not achieve global appeal. In the Netherlands, for instance, PPSV-23 had very low penetration and was never endorsed by public health authorities. Concerns have been issued about the decreased immunogenicity of a polysaccharide vaccine in older adults, invoking the concept of immune senescence, a term that describes a diminished capacity to mount robust immune responses due to aging.
Protein-conjugated antigens, on the other hand, can elicit a better initial immune response than a polysaccharide vaccine can in an older adult. Whether the effect is sustained and translates to better clinical outcomes remains unknown. The adoption of PCV-13 and the continued role of PPSV-23 in adults aged > 65 years have been examined carefully by experts.24,25
Dutch investigators organized the Community Acquired Pneumonia Immunization Trial in Adults (CAPITA), randomizing about 85,000 adults aged > 65 years toreceive eitherPCV-13 or a placebo.26 After 3 years of observation, the occurrence of invasive pneumococcal disease (caused by the vaccine serotypes) decreased by 85% in participants who received the vaccine compared with those who received a placebo. Additionally, the incidence of pneumococcal pneumonia (caused by the vaccine serotypes) decreased by 45% (Table 2). The findings of this trial largely inform the recommendation issued by APIC in October 2014 to administer PCV-13 vaccine to adults aged > 65 years.27

Polysaccharide Vaccine in Adults
A crucial limitation of the CAPITA study is that it does not provide a head-to-head comparison with PPSV-23. Similarly, the recommendation to use PCV-13 in patients with immune system compromising conditions did not arise from a direct comparison between PCV-13 and PPSV-23. In both groups of patients, ACIP continues to recommend PPSV-23 to extend protection to the 10 additional pneumococcal serotypes not included in PCV-13.28 Additionally, ACIP maintains its long-standing recommendation to administer PPSV-23 to adults aged < 65 years who have diabetes mellitus, or chronic liver, lung, or heart disease, or those who are tobacco smokers or misuse alcohol.
Notably, the order in which the vaccines are administered may influence their effectiveness. In adults aged 50 to 64 years, initial vaccination with PCV-13 followed by PPSV-23 lead to a better antipneumococcal immune response.14,29 Specifically, PCV-13 enhanced the response to subsequent administration of PPSV-23, whereas an initial PPSV-23 vaccine resulted in a decreased response to subsequent administration of PCV-13. After a 1-year interval between vaccines, immune titers to a second vaccination were not inferior.30 All the above considerations have shaped the ACIP recommendations for the administration of pneumococcal vaccines.27,31 Pneumococcal vaccination was a straightforward exercise when PPSV-23 was the only vaccine available for adults. The advent of PCV-13, however, renders pneumococcal immunization of adults more complicated (Figure 1).
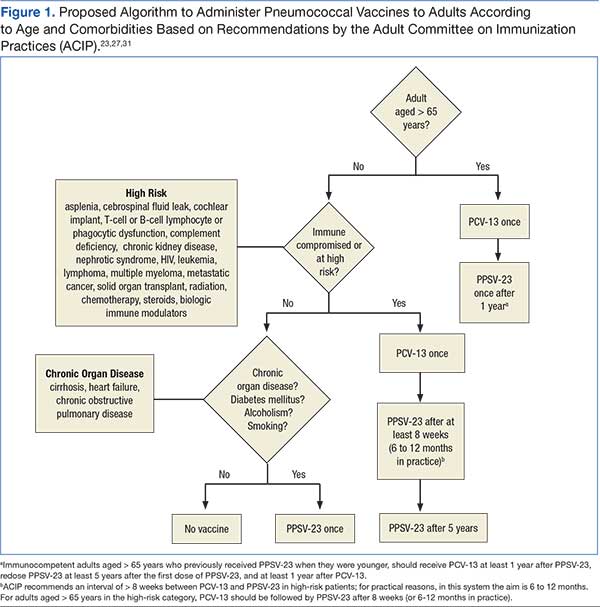
Improving Vaccination Rates
The complex recommendations to vaccinate adults against pneumococcus may reveal obstacles to effective pneumococcal vaccination programs.32 From the perspective of health care institutions, the adoption of the new pneumococcal vaccine implies an added cost. A pneumococcal vaccination strategy that incorporates PCV-13 may be cost-effective, at least under certain parameters.33-35 There remains, however, the issue of affordability and the opportunity cost—the need to decrease funding for other health care programs to accommodate an increased budget for pneumococcal vaccination. Logistically, maintaining a reliable supply of vaccines to meet the demand of practitioners at various sites requires careful planning. Consequently, tracking vaccinated and unvaccinated patients and carefully coordinating among clinical providers, nurses, and pharmacists are essential.
From the perspective of clinical providers, an additional pneumococcal vaccine complicating the vaccination schedule for adults represents an increased burden. Providers will need information to reach their own conclusions regarding the rationale behind the development and use of pneumococcal conjugate vaccines, the existing and evolving recommendations from public health authorities, and the strengths and limitations of the evidence supporting the use of pneumococcal vaccines. Otherwise, providers may find it difficult to incorporate new data and guidelines supporting pneumococcal vaccination into their decision-making (Boxes 1-4). An additional and formidable challenge is to carve out time during an already busy clinical encounter to discuss pneumococcal vaccines and other immunizations.36
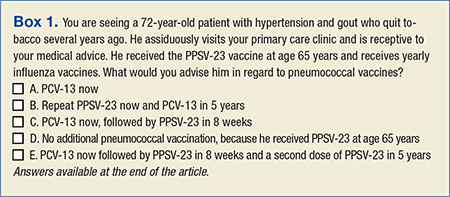

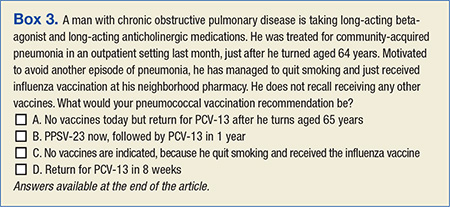
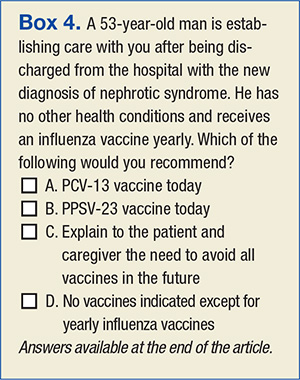
Related: The Importance of an Antimicrobial Stewardship Program
Similarly, older adults or patients with chronic health conditions may not recognize the important role that vaccines can play in their health maintenance and are likely to prioritize other issues during medical visits. It is not obvious for patients that multiple vaccines may be necessary to prevent pneumococcal disease. Furthermore, many patients, not unreasonably, may assume that their yearly influenza vaccine is sufficiently protective against pneumonia. Therefore, patients need to be educated about the rationale behind pneumococcal conjugate vaccination. Ultimately, access to immunization—the opportunity for patients to have an encounter with their providers and with the health care system that results in the administration of an appropriate vaccine—will determine whether goals for pneumococcal vaccination are achieved.
The evolving landscape for the implementation of pneumococcal vaccines creates the need to develop, implement, and refine organizational changes to adhere to the new guidelines for the use of PCV-13 and PPSV-23 vaccines. These interventions, if effective, may help improve pneumococcal vaccination coverage among adults (Table 3).
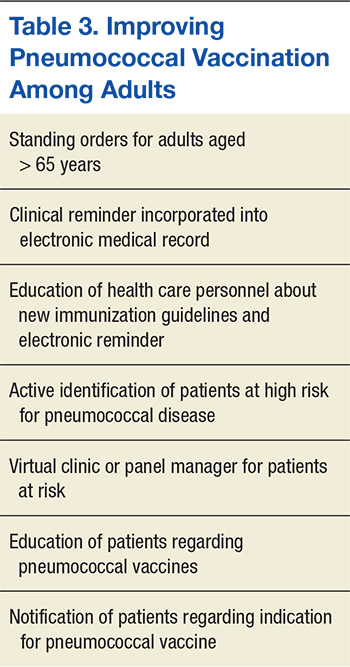
Harnessing the Power of the EMR
Interventions to improve the adherence to pneumococcal vaccination guidelines begin by identifying persons eligible for vaccination based on their age, their vaccination status (ie, persons previously unvaccinated or due for vaccination according to the recommended schedule), or the presence of medical conditions conferring high risk for pneumococcal disease. This, in turn, depends on adequate documentation of patients’ underlying medical diagnosis, as well as up-to-date records of vaccine administration to patients.
Health care systems possessing a mature and sophisticated electronic medical record (EMR), such as the VHA Computerized Patient Record System (CPRS), are in a good position to wield such information to plan, implement, and assure the quality of activities designed to improve pneumococcal vaccination rates. An analysis of the proportion of veterans in VISN 10 who received pneumococcal vaccination revealed that even with the advantages of a robust EMR and a highly developed infrastructure devoted to primary care, pneumococcal vaccine coverage remains below the 60% target goal, although well above national averages (Figure 2).37,38
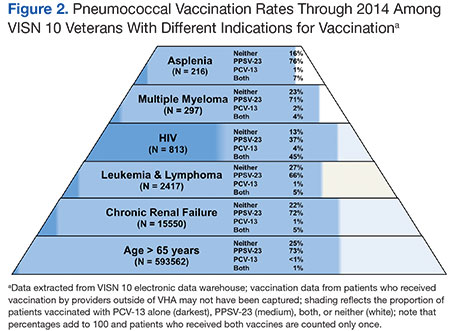
Standing Orders
Standing orders make it possible for nurses and pharmacists to administer vaccines according to a preestablished protocol without a physician’s direct evaluation of each patient. Standing orders are a versatile intervention, with a record of effective implementation in both outpatient and inpatient facilities, in acute-care and long-term care facilities, and in most instances where patients interact with the health care system. Based on strong scientific evidence, ACIP recommends the adoption of standing-order programs to improve pneumococcal vaccination rates among adults.39 Indeed, standing-order programs may prove a very effective intervention to fulfill the recommendation to administer PCV-13 to adults aged > 65 years.
The Virtual Vaccination Clinic
Unfortunately, with 2 vaccines that have to be administered at different times to various groups of patients at risk, the current state of pneumococcal vaccination may be too complex to be readily reduced to a comprehensible set of standing orders. An innovative way to realize the benefit of standing orders is to target high-risk groups for pneumococcal disease who are eligible for vaccination by selecting them using the EMR and entering standing orders tailored to their specific vaccination needs. The selection of patients according to comorbidities and vaccination status and the determination of the appropriate pneumococcal vaccine takes place in the context of a “virtual” vaccination clinic.40
Enhancing Vaccinations
Further improvement in pneumococcal vaccination rates are likely to result from interventions that increase the demand for vaccines among patients and practitioners. Efforts to disseminate information and provide advice regarding pneumococcal vaccination are likely to result in patients seeking and clinicians offering the appropriate vaccine. Similarly, interventions to enhance the supply of vaccines at the point of care may reduce barriers that patients might encounter when attempting to receive vaccinations.
Another set of system-based interventions that can assist clinicians in making timely and appropriate vaccination decisions are EMR reminders, especially those targeting patients at high risk for pneumococcal disease because of underlying illnesses.41 Previous experience with pneumococcal vaccination in patients aged > 65 years indicates that EMR reminders facilitate improvements in vaccination. The involvement of a panel manager who coordinated with the primary care provider and contacted patients directly augmented the effect of the EMR reminder by 25%.42
Related: Venous Thromboembolism Prophylaxis in Acutely Ill Veterans With Respiratory Disease
Patient reminder and recall systems also demonstrated effectiveness in improving immunization rates.43 In certain groups, notification of patients has been achieved through electronic methods, such as short text messaging or e-mail.44 Determining which interventions within a bundle are essential may be impossible, because the various interventions reinforce one another, and the likelihood of patients benefitting from at least one of the activities increases when multiple interventions are administered together. Therefore, the Task Force on Community Preventive Services supports combining provider reminder systems with education and other measures that encourage use of vaccines in patients and providers.45
Box answer key: 1: A; 2: A; 3: B; 4: A.
Conclusion
The increasing role of vaccines in the health maintenance of adults represents a change in paradigm for primary care and specialty providers. Physicians must assess the value and limitations of vaccines and find time to discuss immunizations with their adult patients. Health care systems can increase opportunities for vaccination and facilitate encounters that result in vaccination by educating patients and health care personnel and through the innovative use of reminders and standing orders in the EMR. Undertaking these activities may limit the burden of pneumococcal disease, an important cause of morbidity and mortality in adults that is preventable through immunization.
Acknowledgements
This work is dedicated to the memory of John M. Rieger, Information Technology Specialist at the Cleveland VAMC and Chief Master Sergeant, Air Force Reserve.
Author Disclosure
This work was supported by a research grant from Pfizer and by the Louis Stokes Cleveland VAMC, the VISN 10 Geriatric Research Education and Clinical Center, and the Clinical and Translational Science Collaborative of Cleveland (award UL1TR000439 from the National Center for Advancing Translational Sciences of the National Institutes of Health NIH). The content is the responsibility of the authors and does not represent the official views of the NIH or the VA.
Disclaimer
The opinions expressed herein are those of the authors and do not necessarily reflect those of Federal Practitioner, Frontline Medical Communications Inc., the U.S. Government, or any of its agencies. This article may discuss unlabeled or investigational use of certain drugs. Please review complete prescribing information for specific drugs or drug combinations—including indications, contraindications, warnings, and adverse effects—before administering pharmacologic therapy to patients.
1. Bogaert D, De Groot R, Hermans PW. Streptococcus pneumoniae colonisation: the key to pneumococcal disease. Lancet Infect Dis. 2004;4(3):144-154.
2. Tilghman RC, Finland M. Clinical significance of bacteremia in pneumococcic pneumonia. Arch Intern Med (Chic). 1937;59(4):602-619.
3. Jones RN, Jacobs MR, Sader HS. Evolving trends in Streptococcus pneumoniae resistance: implications for therapy of community-acquired bacterial pneumonia. Int J Antimicrob Agents. 2010;36(3):197-204.
4. Lexau CA, Lynfield R, Danila R, et al; Active Bacterial Core Surveillance Team. Changing epidemiology of invasive pneumococcal disease among older adults in the era of pediatric pneumococcal conjugate vaccine. JAMA. 2005;294(16):2043-2051.
5. Musher DM. How effective is vaccination in preventing pneumococcal disease? Infect Dis Clin North Am. 2013;27(1):229-241.
6. Macleod CM, Hodges RG, Heidelberger M, Bernhard WG. Prevention of pneumococcal pneumonia by immunization with specific capsular polysaccharides. J Exp Med. 1945;82(6):445-465.
7. Austrian R, Gold J. Pneumococcal bacteremia with especial reference to bacteremic pneumococcal pneumonia. Ann Intern Med. 1964;60:759-776.
8. Austrian R. The Jeremiah Metzger Lecture: Of gold and pneumococci: a history of pneumococcal vaccines in South Africa. Trans Am Clin Climatol Assoc. 1978;89:141-161.
9. Centers for Disease Control (CDC). Pneumococcal polysaccharide vaccine. MMWR Morb Mortal Wkly Rep. 1981;30(33):410-412, 417-419.
10. Moberley S, Holden J, Tatham DP, Andrews RM. Vaccines for preventing pneumococcal infection in adults. Cochrane Database Syst Rev. 2013;1:CD000422.
11. Huss A, Scott P, Stuck AE, Trotter C, Egger M. Efficacy of pneumococcal vaccination in adults: a meta-analysis. CMAJ. 2009;180(1):48-58.
12. Maruyama T, Taguchi O, Niederman MS, et al. Efficacy of 23-valent pneumococcal vaccine in preventing pneumonia and improving survival in nursing home residents: double blind, randomised and placebo controlled trial. BMJ. 2010;340:c1004.
13. Shapiro ED, Berg AT, Austrian R, et al. The protective efficacy of polyvalent pneumococcal polysaccharide vaccine. N Eng J Med. 1991;325(21):1453-1460.
14. Musher DM, Sampath R, Rodriguez-Barradas MC. The potential role for protein-conjugate pneumococcal vaccine in adults: what is the supporting evidence? Clin Infect Dis. 2011;52(5):633-640.
15. Advisory Committee on Immunization Practices. Preventing pneumococcal disease among infants and young children. Recommendations of the Advisory Committee on Immunization Practices (ACIP). MMWR Recomm Rep. 2000;49(RR-9):1-35.
16. Griffin MR, Zhu Y, Moore MR, Whitney CG, Grijalva CG. U.S. hospitalizations for pneumonia after a decade of pneumococcal vaccination. N Eng J Med. 2013;369(2):155-163.
17. Nuorti JP, Whitney CG, Centers for Disease Control and Prevention (CDC). Prevention of pneumococcal disease among infants and children - use of 13-valent pneumococcal conjugate vaccine and 23-valent pneumococcal polysaccharide vaccine - recommendations of the Advisory Committee on Immunization Practices (ACIP). MMWR Recomm Rep. 2010;59(RR-11):1-18.
18. Centers for Disease Control and Prevention (CDC). Licensure of a 13-valent pneumococcal conjugate vaccine (PCV13) and recommendations for use among children--Advisory Committee on Immunization Practices (ACIP), 2010. MMWR Morb Mortal Wkly Rep. 2010;59(9):258-261.
19. Iroh Tam PY, Madoff LC, Coombes B, Pelton SI. Invasive pneumococcal disease after implementation of 13-valent conjugate vaccine. Pediatrics. 2014;134(2):210-217.
20. Waight PA, Andrews NJ, Ladhani SN, Sheppard CL, Slack MP, Miller E. Effect of the 13-valent pneumococcal conjugate vaccine on invasive pneumococcal disease in England and Wales 4 years after its introduction: an observational cohort study. Lancet Infect Dis. 2015;15(5):535-543.
21. French N, Nakiyingi J, Carpenter LM, et al. 23-valent pneumococcal polysaccharide vaccine in HIV-1-infected Ugandan adults: double-blind, randomised and placebo controlled trial. Lancet. 2000;355(9221):2106-2111.
22. French N, Gordon SB, Mwalukomo T, et al. A trial of a 7-valent pneumococcal conjugate vaccine in HIV-infected adults. N Eng J Med. 2010;362(9):812-822.
23. Centers for Disease Control and Prevention (CDC). Use of 13-valent pneumococcal conjugate vaccine and 23-valent pneumococcal polysaccharide vaccine for adults with immunocompromising conditions: recommendations of the Advisory Committee on Immunization Practices (ACIP). MMWR Morb Mortal Wkly Rep. 2012;61(40):816-819.
24. Paradiso PR. Pneumococcal conjugate vaccine for adults: a new paradigm. Clin Infect Dis. 2012;55(2):259-264.
25. Musher DM. Editorial commentary: should 13-valent protein-conjugate pneumococcal vaccine be used routinely in adults? Clin Infect Dis. 2012;55(2):265-267.
26. Bonten MJ, Huijts SM, Bolkenbaas M, et al. Polysaccharide conjugate vaccine against pneumococcal pneumonia in adults. N Eng J Med. 2015;372(12):1114-1125.
27. Tomczyk S, Bennett NM, Stoecker C, et al; Centers for Disease Control and Prevention (CDC). Use of 13-valent pneumococcal conjugate vaccine and 23-valent pneumococcal polysaccharide vaccine among adults aged ≥ 65 years: recommendations of the Advisory Committee on Immunization Practices (ACIP). MMWR Morb Mortal Wkly Rep. 2014;63(37):822-825.
28. Grabenstein JD. Effectiveness and serotype coverage: key criteria for pneumococcal vaccines for adults. Clin Infect Dis. 2012;55(2):255-258.
29. Jackson LA, Gurtman A, van Cleeff M, et al. Influence of initial vaccination with 13-valent pneumococcal conjugate vaccine or 23-valent pneumococcal polysaccharide vaccine on anti-pneumococcal responses following subsequent pneumococcal vaccination in adults 50 years and older. Vaccine. 2013;31(35):3594-3602.
30. Greenberg RN, Gurtman A, Frenck RW, et al. Sequential administration of 13-valent pneumococcal conjugate vaccine and 23-valent pneumococcal polysaccharide vaccine in pneumococcal vaccine-naïve adults 60-64 years of age. Vaccine. 2014;32(20):2364-2374.
31. Kobayashi M, Bennett NM, Gierke R, et al. Intervals between PCV13 and PPSV23 vaccines: recommendations of the Advisory Committee on Immunization Practices (ACIP). MMWR Morb Mortal Wkly Rep. 2015;64(34):944-947.
32. Walton LR, Orenstein WA, Pickering LK. Lessons learned from making and implementing vaccine recommendations in the U.S. Am J Prev Med. 2015;pii:S0749-3797(15)00333-00335 [Epub ahead of print].
33. Cho BH, Stoecker C, Link-Gelles R, Moore MR. Cost-effectiveness of administering 13-valent pneumococcal conjugate vaccine in addition to 23-valent pneumococcal polysaccharide vaccine to adults with immunocompromising conditions. Vaccine. 2013;31(50):6011-6021.
34. Smith KJ, Nowalk MP, Raymund M, Zimmerman RK. Cost-effectiveness of pneumococcal conjugate vaccination in immunocompromised adults. Vaccine. 2013;31(37):3950-3956.
35. Smith KJ, Wateska AR, Nowalk MP, Raymund M, Nuorti JP, Zimmerman RK. Cost-effectiveness of adult vaccination strategies using pneumococcal conjugate vaccine compared with pneumococcal polysaccharide vaccine. JAMA. 2012;307(8):804-812.
36. Kyaw MH, Greene CM, Schaffner W, et al; Active Bacterial Core Surveillance Program of the Emerging Infections Program Network. Adults with invasive pneumococcal disease: missed opportunities for vaccination. Am J Prev Med. 2006;31(4):286-292.
37. Williams WW, Lu PJ, O'Halloran A, et al; Centers for Disease Control and Prevention (CDC). Vaccination coverage among adults, excluding influenza vaccination - United States, 2013. MMWR Morb Mortal Wkly Rep. 2015;64(4):95-102.
38. Committee on Review of Priorities in the National Vaccine Plan, Institute of Medicine. Priorities for the National Vaccine Plan. Washington, DC: National Academies Press; 2010.
39. McKibben LJ, Stange PV, Sneller VP, Strikas RA, Rodewald LE; Advisory Committee on Immunization Practices. Use of standing orders programs to increase adult vaccination rates. MMWR Recomm Rep. 2000;49(RR-1):15-16.
40. Jump RLP, Banks R, Wilson B, et al. A virtual clinic improves pneumococcal vaccination for asplenic veterans at high-risk for pneumococcal disease. Open Forum Infect Dis. In press.
41. Ledwich LJ, Harrington TM, Ayoub WT, Sartorius JA, Newman ED. Improved influenza and pneumococcal vaccination in rheumatology patients taking immunosuppressants using an electronic health record best practice alert. Arthritis Rheum. 2009;61(11):1505-1510.
42. Loo TS, Davis RB, Lipsitz LA, et al. Electronic medical record reminders and panel management to improve primary care of elderly patients. Arch Intern Med. 2011;171(17):1552-1558.
43. Jacobson Vann JC, Szilagyi P. Patient reminder and patient recall systems to improve immunization rates. Cochrane Database Syst Rev. 2005;(3):CD003941.
44. Ghadieh AS, Hamadeh GN, Mahmassani DM, Lakkis NA. The effect of various types of patients' reminders on the uptake of pneumococcal vaccine in adults: a randomized controlled trial. Vaccine. 2015;33(43):5868-5872.
45. Ndiaye SM, Hopkins DP, Shefer AM, et al; Task Force on Community Preventive Services. Interventions to improve influenza, pneumococcal polysaccharide, and hepatitis B vaccination coverage among high-risk adults: a systematic review. Am J Prev Med. 2005;28(5)(suppl):248-279.
Streptococcus pneumoniae (S pneumoniae), also known as pneumococcus, is a successful human pathogen with significant clinical impact that causes pneumonia and invasive infections, including bacteremia and meningitis.1 In the preantibiotic era, nearly 80% of patients with bacteremic pneumococcal pneumonia died.2 The introduction of sulfas and penicillin in the mid-20th century, subsequent refinements in antibiotic chemotherapy, and improvements in supportive care rendered pneumococcal disease readily treatable, notwithstanding the threat of antibiotic-resistant pneumococcus.3 Despite the availability of effective antibiotic therapy against S pneumoniae, pneumococcal disease remains a significant cause of morbidity and mortality among people with increased susceptibility, such as older adults and those living with chronic illness or immunosuppressive conditions. In developed countries like the U.S., where a growing portion of the population is vulnerable to S pneumoniae by virtue of their advanced age and underlying medical conditions, pneumococcal disease is still an important public health concern.4
Penumococcal Vaccines: A Long Time Coming
Vaccination against S pneumoniae has proven an efficacious strategy to reduce the morbidity and mortality associated with this pathogen.5 The original efforts to develop a pneumococcal vaccine culminated in 1945 with a vaccine containing pneumococcal capsular polysaccharides, which elicited a protective immune response among U.S. soldiers (Table 1).Subsequent investigations determined that the protective response was specific to pneumococcal disease caused by the 4 pneumococcal capsular serotypes included in the vaccine, that the carrier rate of pneumococcus with the vaccine serotypes decreased by about 50%, and that the incidence of pneumonia from the vaccine serotypes was reduced even in nonimmunized soldiers.6 These early observations remain relevant to our contemporary understanding of the impact of pneumococcal vaccination: Protection is limited to serotypes included in the vaccine; the vaccine reduces colonization; and the vaccine leads to herd immunity—the protection of unvaccinated subjects.
Despite this achievement, the use of vaccines as a strategy to combat pneumococcal disease was upstaged in the subsequent decades by the success of antibiotics. Renewed interest in pneumococcal vaccines resulted from the efforts of Robert Austrian, MD, who astutely observed that “highly effective antimicrobial drugs must be supplemented by other measures, both prophylactic and therapeutic, if the significant mortality resulting still from pneumococcal infection is to be reduced.”7
After initial studies carried out in South African gold miners, the FDA approved a pneumococcal polysaccharide vaccine (PPSV) against 23 of about 90 circulating serotypes.8 The CDC and the Advisory Committee on Immunization Practices (ACIP) initially recommended PPSV-23 for persons perceived to be at high risk for pneumococcal disease, including those with chronic diseases, immunocompromising conditions, and older adults.9
Three decades later, the analysis of a large body of available evidence demonstrated the protective effects of PPSV-23 against invasive pneumococcal disease caused by pneumococcal types included in the vaccine, especially bacteremic pneumonia (about 75% reduction, odds ratio [OR] 0.26, 95% confidence interval [CI] 0.14-0.45).10 A perceived shortcoming of PPSV-23, which some experts dispute, is the lack of definite protection against nonbacteremic pneumococcal pneumonia.11 Studies of nursing home residents demonstrated a 50% reduction in the incidence of both pneumococcal pneumonia and all-cause pneumonia, suggesting that PPSV-23 offers protection against noninvasive pneumococcal pneumonia in specific populations.12 Additional potential limitations of PPSV-23 include reduced benefit in patients aged > 65 years and waning of protection over time.13
Related: Identification and Management of Middle East Respiratory Syndrome
Protein-Conjugate Vaccines
Clearly, the most important limitation of PPSV-23, inherent to all capsular polysaccharide vaccines, is that it does not elicit an immune response in children aged < 2 years. The successful development of a vaccine against Haemophilus influenzae type b (Hib) gave rise to a new generation of pneumococcal vaccines.14 Specifically, the Hib vaccine covalently binds, or conjugates, the capsule polysaccharide to an antigenic protein, leading to effective T-cell–mediated antibody production in infants and toddlers.
In 2000, children received the first iteration of a protein-conjugate vaccine containing the 7 most relevant pneumococcal serotypes (PCV-7).15 The effects of PCV-7 on pneumococcal disease have been extraordinary, practically eliminating infections caused by the pneumococcal serotypes included in the vaccine. Immunizing children with PCV-7 also ushered in a fundamental public health benefit for adults aged > 65 years: a reduction of nearly 90% in the incidence of pneumococcal infections caused by serotypes included in the vaccine. By eliciting mucosal immunity, which leads to decreased nasal carriage of the covered pneumococcal strains among children, PVC-7 generates herd immunity, leading to reductions in transmission, colonization, and infection with vaccine serotypes among adults.16
In 2010, a conjugate vaccine containing 13 serotypes (PCV-13) replaced PCV-7 administration for children.17,18 The PCV-13 is expected to protect children and the herd from disease caused by 6 additional pneumococcal serotypes, including those that surged as replacement strains, filling the ecologic niche created by PCV-7, such as the epidemiologically relevant serotype 19A.19,20
Immune-Compromised Adults
One of the shortcomings of PPSV-23 is its lack of efficacy in patients with advanced HIV, a group with an exquisite vulnerability to pneumococcal disease, as demonstrated by a randomized controlled trial of PPSV-23 in African patients with advanced, untreated HIV infection.21 Similarly, there is concern that patients with lymphoma, leukemia, multiple myeloma, and Hodgkin disease, also at high risk of pneumococcal infection, do not mount sufficient immune responses to polysaccharide antigens or that these responses are adversely affected by chemotherapy or immune suppressing medications. In these populations, a conjugate vaccine (PCV-7 or PCV-13) may elicit a more robust and durable immune response than a polysaccharide vaccine (PPSV-23). A randomized placebo-controlled trial demonstrated the efficacy of PCV-7 in protecting patients with advanced HIV against pneumococcal disease in Africa.22 Based in part on this observation, the ACIP now recommends the use of PCV-13 in patients with HIV and other immunosuppressing conditions, including chronic renal failure.23 A direct comparison of the relative protection of PPSV-23 vs PCV-7 in this population has not been performed.
Pneumococcal Vaccines in the Elderly
Although PPSV-23 was widely adopted in the U.S. with the intention to protect adults aged > 65 years from pneumococcal infection, this vaccine did not achieve global appeal. In the Netherlands, for instance, PPSV-23 had very low penetration and was never endorsed by public health authorities. Concerns have been issued about the decreased immunogenicity of a polysaccharide vaccine in older adults, invoking the concept of immune senescence, a term that describes a diminished capacity to mount robust immune responses due to aging.
Protein-conjugated antigens, on the other hand, can elicit a better initial immune response than a polysaccharide vaccine can in an older adult. Whether the effect is sustained and translates to better clinical outcomes remains unknown. The adoption of PCV-13 and the continued role of PPSV-23 in adults aged > 65 years have been examined carefully by experts.24,25
Dutch investigators organized the Community Acquired Pneumonia Immunization Trial in Adults (CAPITA), randomizing about 85,000 adults aged > 65 years toreceive eitherPCV-13 or a placebo.26 After 3 years of observation, the occurrence of invasive pneumococcal disease (caused by the vaccine serotypes) decreased by 85% in participants who received the vaccine compared with those who received a placebo. Additionally, the incidence of pneumococcal pneumonia (caused by the vaccine serotypes) decreased by 45% (Table 2). The findings of this trial largely inform the recommendation issued by APIC in October 2014 to administer PCV-13 vaccine to adults aged > 65 years.27
Polysaccharide Vaccine in Adults
A crucial limitation of the CAPITA study is that it does not provide a head-to-head comparison with PPSV-23. Similarly, the recommendation to use PCV-13 in patients with immune system compromising conditions did not arise from a direct comparison between PCV-13 and PPSV-23. In both groups of patients, ACIP continues to recommend PPSV-23 to extend protection to the 10 additional pneumococcal serotypes not included in PCV-13.28 Additionally, ACIP maintains its long-standing recommendation to administer PPSV-23 to adults aged < 65 years who have diabetes mellitus, or chronic liver, lung, or heart disease, or those who are tobacco smokers or misuse alcohol.
Notably, the order in which the vaccines are administered may influence their effectiveness. In adults aged 50 to 64 years, initial vaccination with PCV-13 followed by PPSV-23 lead to a better antipneumococcal immune response.14,29 Specifically, PCV-13 enhanced the response to subsequent administration of PPSV-23, whereas an initial PPSV-23 vaccine resulted in a decreased response to subsequent administration of PCV-13. After a 1-year interval between vaccines, immune titers to a second vaccination were not inferior.30 All the above considerations have shaped the ACIP recommendations for the administration of pneumococcal vaccines.27,31 Pneumococcal vaccination was a straightforward exercise when PPSV-23 was the only vaccine available for adults. The advent of PCV-13, however, renders pneumococcal immunization of adults more complicated (Figure 1).
Improving Vaccination Rates
The complex recommendations to vaccinate adults against pneumococcus may reveal obstacles to effective pneumococcal vaccination programs.32 From the perspective of health care institutions, the adoption of the new pneumococcal vaccine implies an added cost. A pneumococcal vaccination strategy that incorporates PCV-13 may be cost-effective, at least under certain parameters.33-35 There remains, however, the issue of affordability and the opportunity cost—the need to decrease funding for other health care programs to accommodate an increased budget for pneumococcal vaccination. Logistically, maintaining a reliable supply of vaccines to meet the demand of practitioners at various sites requires careful planning. Consequently, tracking vaccinated and unvaccinated patients and carefully coordinating among clinical providers, nurses, and pharmacists are essential.
From the perspective of clinical providers, an additional pneumococcal vaccine complicating the vaccination schedule for adults represents an increased burden. Providers will need information to reach their own conclusions regarding the rationale behind the development and use of pneumococcal conjugate vaccines, the existing and evolving recommendations from public health authorities, and the strengths and limitations of the evidence supporting the use of pneumococcal vaccines. Otherwise, providers may find it difficult to incorporate new data and guidelines supporting pneumococcal vaccination into their decision-making (Boxes 1-4). An additional and formidable challenge is to carve out time during an already busy clinical encounter to discuss pneumococcal vaccines and other immunizations.36
Related: The Importance of an Antimicrobial Stewardship Program
Similarly, older adults or patients with chronic health conditions may not recognize the important role that vaccines can play in their health maintenance and are likely to prioritize other issues during medical visits. It is not obvious for patients that multiple vaccines may be necessary to prevent pneumococcal disease. Furthermore, many patients, not unreasonably, may assume that their yearly influenza vaccine is sufficiently protective against pneumonia. Therefore, patients need to be educated about the rationale behind pneumococcal conjugate vaccination. Ultimately, access to immunization—the opportunity for patients to have an encounter with their providers and with the health care system that results in the administration of an appropriate vaccine—will determine whether goals for pneumococcal vaccination are achieved.
The evolving landscape for the implementation of pneumococcal vaccines creates the need to develop, implement, and refine organizational changes to adhere to the new guidelines for the use of PCV-13 and PPSV-23 vaccines. These interventions, if effective, may help improve pneumococcal vaccination coverage among adults (Table 3).
Harnessing the Power of the EMR
Interventions to improve the adherence to pneumococcal vaccination guidelines begin by identifying persons eligible for vaccination based on their age, their vaccination status (ie, persons previously unvaccinated or due for vaccination according to the recommended schedule), or the presence of medical conditions conferring high risk for pneumococcal disease. This, in turn, depends on adequate documentation of patients’ underlying medical diagnosis, as well as up-to-date records of vaccine administration to patients.
Health care systems possessing a mature and sophisticated electronic medical record (EMR), such as the VHA Computerized Patient Record System (CPRS), are in a good position to wield such information to plan, implement, and assure the quality of activities designed to improve pneumococcal vaccination rates. An analysis of the proportion of veterans in VISN 10 who received pneumococcal vaccination revealed that even with the advantages of a robust EMR and a highly developed infrastructure devoted to primary care, pneumococcal vaccine coverage remains below the 60% target goal, although well above national averages (Figure 2).37,38
Standing Orders
Standing orders make it possible for nurses and pharmacists to administer vaccines according to a preestablished protocol without a physician’s direct evaluation of each patient. Standing orders are a versatile intervention, with a record of effective implementation in both outpatient and inpatient facilities, in acute-care and long-term care facilities, and in most instances where patients interact with the health care system. Based on strong scientific evidence, ACIP recommends the adoption of standing-order programs to improve pneumococcal vaccination rates among adults.39 Indeed, standing-order programs may prove a very effective intervention to fulfill the recommendation to administer PCV-13 to adults aged > 65 years.
The Virtual Vaccination Clinic
Unfortunately, with 2 vaccines that have to be administered at different times to various groups of patients at risk, the current state of pneumococcal vaccination may be too complex to be readily reduced to a comprehensible set of standing orders. An innovative way to realize the benefit of standing orders is to target high-risk groups for pneumococcal disease who are eligible for vaccination by selecting them using the EMR and entering standing orders tailored to their specific vaccination needs. The selection of patients according to comorbidities and vaccination status and the determination of the appropriate pneumococcal vaccine takes place in the context of a “virtual” vaccination clinic.40
Enhancing Vaccinations
Further improvement in pneumococcal vaccination rates are likely to result from interventions that increase the demand for vaccines among patients and practitioners. Efforts to disseminate information and provide advice regarding pneumococcal vaccination are likely to result in patients seeking and clinicians offering the appropriate vaccine. Similarly, interventions to enhance the supply of vaccines at the point of care may reduce barriers that patients might encounter when attempting to receive vaccinations.
Another set of system-based interventions that can assist clinicians in making timely and appropriate vaccination decisions are EMR reminders, especially those targeting patients at high risk for pneumococcal disease because of underlying illnesses.41 Previous experience with pneumococcal vaccination in patients aged > 65 years indicates that EMR reminders facilitate improvements in vaccination. The involvement of a panel manager who coordinated with the primary care provider and contacted patients directly augmented the effect of the EMR reminder by 25%.42
Related: Venous Thromboembolism Prophylaxis in Acutely Ill Veterans With Respiratory Disease
Patient reminder and recall systems also demonstrated effectiveness in improving immunization rates.43 In certain groups, notification of patients has been achieved through electronic methods, such as short text messaging or e-mail.44 Determining which interventions within a bundle are essential may be impossible, because the various interventions reinforce one another, and the likelihood of patients benefitting from at least one of the activities increases when multiple interventions are administered together. Therefore, the Task Force on Community Preventive Services supports combining provider reminder systems with education and other measures that encourage use of vaccines in patients and providers.45
Box answer key: 1: A; 2: A; 3: B; 4: A.
Conclusion
The increasing role of vaccines in the health maintenance of adults represents a change in paradigm for primary care and specialty providers. Physicians must assess the value and limitations of vaccines and find time to discuss immunizations with their adult patients. Health care systems can increase opportunities for vaccination and facilitate encounters that result in vaccination by educating patients and health care personnel and through the innovative use of reminders and standing orders in the EMR. Undertaking these activities may limit the burden of pneumococcal disease, an important cause of morbidity and mortality in adults that is preventable through immunization.
Acknowledgements
This work is dedicated to the memory of John M. Rieger, Information Technology Specialist at the Cleveland VAMC and Chief Master Sergeant, Air Force Reserve.
Author Disclosure
This work was supported by a research grant from Pfizer and by the Louis Stokes Cleveland VAMC, the VISN 10 Geriatric Research Education and Clinical Center, and the Clinical and Translational Science Collaborative of Cleveland (award UL1TR000439 from the National Center for Advancing Translational Sciences of the National Institutes of Health NIH). The content is the responsibility of the authors and does not represent the official views of the NIH or the VA.
Disclaimer
The opinions expressed herein are those of the authors and do not necessarily reflect those of Federal Practitioner, Frontline Medical Communications Inc., the U.S. Government, or any of its agencies. This article may discuss unlabeled or investigational use of certain drugs. Please review complete prescribing information for specific drugs or drug combinations—including indications, contraindications, warnings, and adverse effects—before administering pharmacologic therapy to patients.
1. Bogaert D, De Groot R, Hermans PW. Streptococcus pneumoniae colonisation: the key to pneumococcal disease. Lancet Infect Dis. 2004;4(3):144-154.
2. Tilghman RC, Finland M. Clinical significance of bacteremia in pneumococcic pneumonia. Arch Intern Med (Chic). 1937;59(4):602-619.
3. Jones RN, Jacobs MR, Sader HS. Evolving trends in Streptococcus pneumoniae resistance: implications for therapy of community-acquired bacterial pneumonia. Int J Antimicrob Agents. 2010;36(3):197-204.
4. Lexau CA, Lynfield R, Danila R, et al; Active Bacterial Core Surveillance Team. Changing epidemiology of invasive pneumococcal disease among older adults in the era of pediatric pneumococcal conjugate vaccine. JAMA. 2005;294(16):2043-2051.
5. Musher DM. How effective is vaccination in preventing pneumococcal disease? Infect Dis Clin North Am. 2013;27(1):229-241.
6. Macleod CM, Hodges RG, Heidelberger M, Bernhard WG. Prevention of pneumococcal pneumonia by immunization with specific capsular polysaccharides. J Exp Med. 1945;82(6):445-465.
7. Austrian R, Gold J. Pneumococcal bacteremia with especial reference to bacteremic pneumococcal pneumonia. Ann Intern Med. 1964;60:759-776.
8. Austrian R. The Jeremiah Metzger Lecture: Of gold and pneumococci: a history of pneumococcal vaccines in South Africa. Trans Am Clin Climatol Assoc. 1978;89:141-161.
9. Centers for Disease Control (CDC). Pneumococcal polysaccharide vaccine. MMWR Morb Mortal Wkly Rep. 1981;30(33):410-412, 417-419.
10. Moberley S, Holden J, Tatham DP, Andrews RM. Vaccines for preventing pneumococcal infection in adults. Cochrane Database Syst Rev. 2013;1:CD000422.
11. Huss A, Scott P, Stuck AE, Trotter C, Egger M. Efficacy of pneumococcal vaccination in adults: a meta-analysis. CMAJ. 2009;180(1):48-58.
12. Maruyama T, Taguchi O, Niederman MS, et al. Efficacy of 23-valent pneumococcal vaccine in preventing pneumonia and improving survival in nursing home residents: double blind, randomised and placebo controlled trial. BMJ. 2010;340:c1004.
13. Shapiro ED, Berg AT, Austrian R, et al. The protective efficacy of polyvalent pneumococcal polysaccharide vaccine. N Eng J Med. 1991;325(21):1453-1460.
14. Musher DM, Sampath R, Rodriguez-Barradas MC. The potential role for protein-conjugate pneumococcal vaccine in adults: what is the supporting evidence? Clin Infect Dis. 2011;52(5):633-640.
15. Advisory Committee on Immunization Practices. Preventing pneumococcal disease among infants and young children. Recommendations of the Advisory Committee on Immunization Practices (ACIP). MMWR Recomm Rep. 2000;49(RR-9):1-35.
16. Griffin MR, Zhu Y, Moore MR, Whitney CG, Grijalva CG. U.S. hospitalizations for pneumonia after a decade of pneumococcal vaccination. N Eng J Med. 2013;369(2):155-163.
17. Nuorti JP, Whitney CG, Centers for Disease Control and Prevention (CDC). Prevention of pneumococcal disease among infants and children - use of 13-valent pneumococcal conjugate vaccine and 23-valent pneumococcal polysaccharide vaccine - recommendations of the Advisory Committee on Immunization Practices (ACIP). MMWR Recomm Rep. 2010;59(RR-11):1-18.
18. Centers for Disease Control and Prevention (CDC). Licensure of a 13-valent pneumococcal conjugate vaccine (PCV13) and recommendations for use among children--Advisory Committee on Immunization Practices (ACIP), 2010. MMWR Morb Mortal Wkly Rep. 2010;59(9):258-261.
19. Iroh Tam PY, Madoff LC, Coombes B, Pelton SI. Invasive pneumococcal disease after implementation of 13-valent conjugate vaccine. Pediatrics. 2014;134(2):210-217.
20. Waight PA, Andrews NJ, Ladhani SN, Sheppard CL, Slack MP, Miller E. Effect of the 13-valent pneumococcal conjugate vaccine on invasive pneumococcal disease in England and Wales 4 years after its introduction: an observational cohort study. Lancet Infect Dis. 2015;15(5):535-543.
21. French N, Nakiyingi J, Carpenter LM, et al. 23-valent pneumococcal polysaccharide vaccine in HIV-1-infected Ugandan adults: double-blind, randomised and placebo controlled trial. Lancet. 2000;355(9221):2106-2111.
22. French N, Gordon SB, Mwalukomo T, et al. A trial of a 7-valent pneumococcal conjugate vaccine in HIV-infected adults. N Eng J Med. 2010;362(9):812-822.
23. Centers for Disease Control and Prevention (CDC). Use of 13-valent pneumococcal conjugate vaccine and 23-valent pneumococcal polysaccharide vaccine for adults with immunocompromising conditions: recommendations of the Advisory Committee on Immunization Practices (ACIP). MMWR Morb Mortal Wkly Rep. 2012;61(40):816-819.
24. Paradiso PR. Pneumococcal conjugate vaccine for adults: a new paradigm. Clin Infect Dis. 2012;55(2):259-264.
25. Musher DM. Editorial commentary: should 13-valent protein-conjugate pneumococcal vaccine be used routinely in adults? Clin Infect Dis. 2012;55(2):265-267.
26. Bonten MJ, Huijts SM, Bolkenbaas M, et al. Polysaccharide conjugate vaccine against pneumococcal pneumonia in adults. N Eng J Med. 2015;372(12):1114-1125.
27. Tomczyk S, Bennett NM, Stoecker C, et al; Centers for Disease Control and Prevention (CDC). Use of 13-valent pneumococcal conjugate vaccine and 23-valent pneumococcal polysaccharide vaccine among adults aged ≥ 65 years: recommendations of the Advisory Committee on Immunization Practices (ACIP). MMWR Morb Mortal Wkly Rep. 2014;63(37):822-825.
28. Grabenstein JD. Effectiveness and serotype coverage: key criteria for pneumococcal vaccines for adults. Clin Infect Dis. 2012;55(2):255-258.
29. Jackson LA, Gurtman A, van Cleeff M, et al. Influence of initial vaccination with 13-valent pneumococcal conjugate vaccine or 23-valent pneumococcal polysaccharide vaccine on anti-pneumococcal responses following subsequent pneumococcal vaccination in adults 50 years and older. Vaccine. 2013;31(35):3594-3602.
30. Greenberg RN, Gurtman A, Frenck RW, et al. Sequential administration of 13-valent pneumococcal conjugate vaccine and 23-valent pneumococcal polysaccharide vaccine in pneumococcal vaccine-naïve adults 60-64 years of age. Vaccine. 2014;32(20):2364-2374.
31. Kobayashi M, Bennett NM, Gierke R, et al. Intervals between PCV13 and PPSV23 vaccines: recommendations of the Advisory Committee on Immunization Practices (ACIP). MMWR Morb Mortal Wkly Rep. 2015;64(34):944-947.
32. Walton LR, Orenstein WA, Pickering LK. Lessons learned from making and implementing vaccine recommendations in the U.S. Am J Prev Med. 2015;pii:S0749-3797(15)00333-00335 [Epub ahead of print].
33. Cho BH, Stoecker C, Link-Gelles R, Moore MR. Cost-effectiveness of administering 13-valent pneumococcal conjugate vaccine in addition to 23-valent pneumococcal polysaccharide vaccine to adults with immunocompromising conditions. Vaccine. 2013;31(50):6011-6021.
34. Smith KJ, Nowalk MP, Raymund M, Zimmerman RK. Cost-effectiveness of pneumococcal conjugate vaccination in immunocompromised adults. Vaccine. 2013;31(37):3950-3956.
35. Smith KJ, Wateska AR, Nowalk MP, Raymund M, Nuorti JP, Zimmerman RK. Cost-effectiveness of adult vaccination strategies using pneumococcal conjugate vaccine compared with pneumococcal polysaccharide vaccine. JAMA. 2012;307(8):804-812.
36. Kyaw MH, Greene CM, Schaffner W, et al; Active Bacterial Core Surveillance Program of the Emerging Infections Program Network. Adults with invasive pneumococcal disease: missed opportunities for vaccination. Am J Prev Med. 2006;31(4):286-292.
37. Williams WW, Lu PJ, O'Halloran A, et al; Centers for Disease Control and Prevention (CDC). Vaccination coverage among adults, excluding influenza vaccination - United States, 2013. MMWR Morb Mortal Wkly Rep. 2015;64(4):95-102.
38. Committee on Review of Priorities in the National Vaccine Plan, Institute of Medicine. Priorities for the National Vaccine Plan. Washington, DC: National Academies Press; 2010.
39. McKibben LJ, Stange PV, Sneller VP, Strikas RA, Rodewald LE; Advisory Committee on Immunization Practices. Use of standing orders programs to increase adult vaccination rates. MMWR Recomm Rep. 2000;49(RR-1):15-16.
40. Jump RLP, Banks R, Wilson B, et al. A virtual clinic improves pneumococcal vaccination for asplenic veterans at high-risk for pneumococcal disease. Open Forum Infect Dis. In press.
41. Ledwich LJ, Harrington TM, Ayoub WT, Sartorius JA, Newman ED. Improved influenza and pneumococcal vaccination in rheumatology patients taking immunosuppressants using an electronic health record best practice alert. Arthritis Rheum. 2009;61(11):1505-1510.
42. Loo TS, Davis RB, Lipsitz LA, et al. Electronic medical record reminders and panel management to improve primary care of elderly patients. Arch Intern Med. 2011;171(17):1552-1558.
43. Jacobson Vann JC, Szilagyi P. Patient reminder and patient recall systems to improve immunization rates. Cochrane Database Syst Rev. 2005;(3):CD003941.
44. Ghadieh AS, Hamadeh GN, Mahmassani DM, Lakkis NA. The effect of various types of patients' reminders on the uptake of pneumococcal vaccine in adults: a randomized controlled trial. Vaccine. 2015;33(43):5868-5872.
45. Ndiaye SM, Hopkins DP, Shefer AM, et al; Task Force on Community Preventive Services. Interventions to improve influenza, pneumococcal polysaccharide, and hepatitis B vaccination coverage among high-risk adults: a systematic review. Am J Prev Med. 2005;28(5)(suppl):248-279.

Therapeutic Interchange From Rosuvastatin to Atorvastatin in a Veteran Population
Patients with known cardiovascular (CV) disease are at greater risk for CV events.1 Hydroxymethylglutaryl-CoA (HMG Co-A) reductase inhibitors, or statins, have been shown to reduce CV events and to reduce all-cause mortality.1,2 Thus, these agents should be a standard approach to secondary prevention of CV events.1,2 Although the main function of statins is to lower total cholesterol (TC) and low-density lipoprotein cholesterol (LDL-C) levels, trials have shown that other lipid-lowering agents have reduced the incidence of CV events but have failed to show any difference in mortality.1 Thus, the therapeutic effects of statins may be a result of “pleiotropic” effects in addition to a reduction in LDL-C.3
As a result, prescribing practices and professional society guidelines have deferred to statins as a first-line choice for lipid-lowering therapy.1 Although each statin varies in its ability to lower LDL-C and inhibit HMG Co-A reductase, as a class, statins have been proven to be safe and efficacious in reducing LDL-C, decreasing risk of coronary artery disease, and decreasing mortality.
The 2013 American College of Cardiology (ACC) and American Heart Association (AHA) guideline on the treatment of blood cholesterol to reduce CV risk in adults resulted in a major shift in clinical practice recommendations. The focus of treatment has changed from LDL-C and TC goals to stratifying patients to either high-intensity or moderate-intensity statin therapy, based on their comorbidities and risk of atherosclerotic CV disease (ASCVD).1 Primary prevention of CV disease has been proposed for patients with diabetes mellitus aged 40 to 75 years, familial hypercholesterolemia (LDL-C > 190 mg/dL), and for patients with an ASCVD risk score > 7.5%. Secondary prevention has been proposed for all patients with a history of ASCVD. Among the available choices for intensive statin therapy, the 2 most potent regimens are atorvastatin (40-80 mg) and rosuvastatin (20-40 mg) daily. The ACC/AHA guideline recommends high-potency therapy with either rosuvastatin or atorvastatin with equal preference.1
Related: New Incentives for Helping Prevent Heart Disease
Statin therapy is generally well tolerated; however, the use of statins is not without risk of adverse drug reactions (ADRs). Skeletal muscle discomfort has been reported in 4% to 10% of patients taking either atorvastatin or rosuvastatin.4,5 Liver enzyme abnormalities are less common, having been reported in only about 2% to 3% of patients taking either atorvastatin or rosuvastatin.4,5 Although muscle-related intolerance and liver enzyme abnormalities are considered to be class effects, research speculates that the therapeutic and safety effects of statins may differ, based on tissue solubility.2,6 Variability in the myotoxic and hepatotoxic effects of statins has been attributed to differences in tissue solubility, hypothesizing that lipophilic statins are more easily taken up into myocytes and hepatocytes, resulting in an increase in toxic effects.2,6
This study assessed differences in therapeutic and safety endpoints resulting from the recent interchange from rosuvastatin to atorvastatin within the North Florida/South Georgia Veterans Health System (NF/SGVHS). Although both these agents are high-potency HMG Co-A reductase inhibitors and share a mechanism of action, they have pharmacokinetic differences, including a key difference in tissue solubility (Table 1).
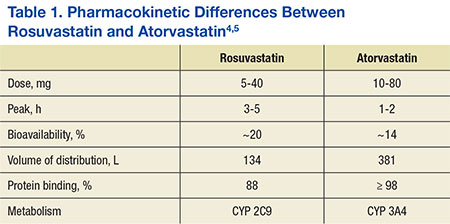
With the availability of low-cost generic atorvastatin in early 2012, the VA Medical Advisory Panel and Pharmacy Benefits Management (VA MAP/PBM) added atorvastatin to the VA National Formulary as the preferred high-potency statin.7,8 Before October 2012, rosuvastatin had been the preferred high-potency statin within the VA. With support from VA MAP/PBM leadership, NF/SGVHS instituted an interchange from rosuvastatin to atorvastatin for cost-savings purposes.9
Before the interchange, the records of patients were reviewed to determine whether justification existed for continued use of rosuvastatin. Patients were converted to atorvastatin if deemed appropriate and received education and consultation through direct patient contact or a letter regarding the interchange. Justifications for continued use of rosuvastatin included documentation of an atorvastatin ADR, active liver disease, or patients taking cyclosporine or certain protease inhibitors.8
The objective of this retrospective evaluation was to assess the efficacy and safety of the interchange from rosuvastatin to atorvastatin within NF/SGVHS. The results of this review are helpful to confirm the efficacy and safety of the interchange and identify any differences in efficacy and safety that may have occurred as a result of the interchange to a different high-potency statin. For this review, statin efficacy was assessed via review of pre- and postinterchange lipid panel values, assessing for a significant difference between equipotent atorvastatin and rosuvastatin therapy. Similarly, safety was assessed by analysis of pre- and postinterchange liver enzyme panels and assessing for significant differences as a result of the interchange.
Methods
The therapeutic interchange was conducted within the NF/SGVHS, which provides patient care at hospitals in Gainesville, Florida, and Lake City, Florida, and 11 outpatient clinics located throughout North Florida and South Georgia. Like other VA facilities, NF/SGVHS uses Computerized Patient Records System (CPRS) to electronically integrate all clinical patient information, including medical progress notes, consults, admission and discharge summaries, allergies and ADRs, patient problem lists (diagnoses), vital signs, medication orders, and laboratory test results. Approval to conduct this study was granted by the University of Florida Investigational Review Board and the Research and Development Committee at NF/SGVHS.
Therapeutic Interchange Process
Interchange from rosuvastatin to atorvastatin was expected to provide about $643,000 annually in drug cost savings to NF/SGVHS while providing equivalent therapy. The cost for a 30-day supply of rosuvastatin was about $22.56 at the time of interchange, and a 30-day supply of generic atorvastatin was $1.77.The interchange from rosuvastatin to atorvastatin was approved by the Pharmacy and Therapeutics Committee Meeting on August 8, 2012, and began shortly thereafter. Interchanges were halted temporarily in November 2012 due to a shortage of manufacturer supply, but the process fully resumed in January 2013 once the drug shortage resolved. Direction was provided to VA facilities by a guidance letter issued through PBM leadership.8 The interchange used a standard interchange guide to complete the process (Table 2).

Posttherapeutic Interchange Analysis
Researchers conducted an internal pharmacy computerizedprescription records search to identify VA outpatients who were converted from rosuvastatin to atorvastatin from February 1, 2012, to August 1, 2013. A total of 202 patients were randomly selected and included in this retrospective chart review. Investigators analyzed data points for safety and efficacy, including liver function tests (LFTs), lipid panels, and ADR reports. This information was obtained from laboratory data, vital signs, allergy information, ADR data, and progress notes using CPRS. Two sets of laboratory data were obtained for research purposes, the most recent laboratory values pre-interchange and the most recent laboratory values postinterchange to atorvastatin.
Investigators determined whether patients were converted to an equivalent dose of atorvastatin through an assessment of the most recent dosage of rosuvastatin before the interchange and the dosage of atorvastatin postinterchange. Researchers also analyzed refill history and interacting medications to assess possible confounding factors. Medication adherence was assessed via refill history. Medication adherence was defined as a medication possession ratio of at least 70%, which correlated to receipt of 3 or more 90-day supplies in the year prior to interchange. The above data were collected via retrospective chart review and entered into a spreadsheet.
Statistics
All identifying information was removed from the data set prior to statistical analysis. The data analysis for this project was generated using SAS/STAT software, version 9.3 of the SAS System for Linux x64 (SAS Institute, Cary, North Carolina).
Researchers assumed an equal variance in preinterchange and postinterchange lipid and liver panel values. Preinterchange and postinterchange lipid values (LDL-C, HDL-C, total cholesterol [TC], and triglycerides [TGs]) and liver values (aspartate aminotransferase [AST], alanine aminotransferase [ALT], alkaline phosphatase [ALP], and creatinine phosphokinase [CPK]) were analyzed by paired t test. All values were reported as mean (SD), and significance was defined as P < .05.
Results
More than 6,000 veterans within the NF/SGVHS were identified as eligible for the interchange. Of those who were converted, 202 patient records were randomly selected and reviewed. Patient population characteristics are summarized in Table 3. Most patients were aged > 65 years (61.4%) with an average body mass index (BMI) of 32.4. Most patients were converted to the correct corresponding dose of atorvastatin (82.7%) and achieved adherence with statin therapy (84.2%). There was no difference in pre- and postinterchange adherence detected as a result of this review.
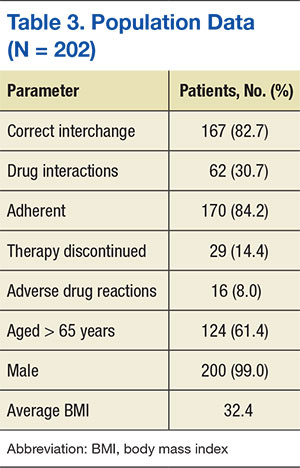
Related: New Guideline on Dyslipidemia: Less Is More
Adverse drug reactions were documented in 16 cases, accounting for 8% of the study population. The most commonly reported ADR was myalgia or arthralgia, which was found in 10 cases (5%). Other ADRs identified in this retrospective review included treatment failure, nausea, vomiting, abdominal discomfort, abnormal liver enzymes, nasopharyngitis, and pruritis (Table 4). Of note, treatment failure was determined on a case-by-case basis but was generally defined as a failure to reach LDL-C goal (< 100 mg/dL or < 70 mg/dL), despite titration of atorvastatin. Interacting medications were identified in 30.7% of patients; however, no reported ADRs were associated with interacting medications. The most common drug interaction was concomitant niacin, followed by antiarrhythmics (ie, amiodarone, diltiazem, etc), and fibrates (ie, gemfibrozil, fenofibrate). All potentially interacting medications identified in this retrospective chart review are compiled in Table 5.
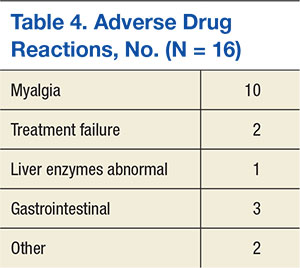
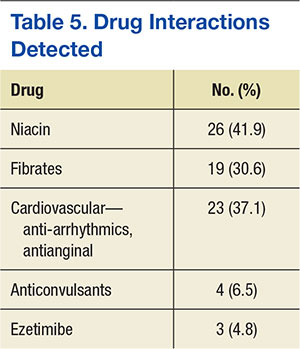
No significant difference between mean pre- and postinterchange lipid panel values was identified in this retrospective chart review (Table 6). In addition, no significant difference was detected in pre- and post-interchange AST, ALT, and CPK values (Table 7). However, a statistically significant increase in ALP was detected, with a mean ALP of 73.33 IU/L prior to interchange and 83.64 IU/L postinterchange (P < .0001).
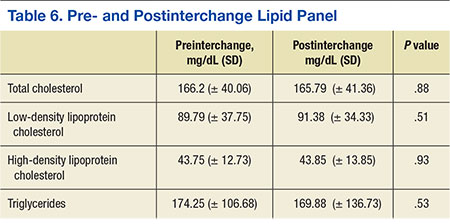
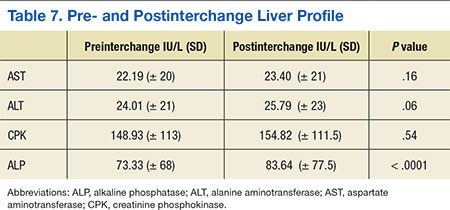
Discussion
The goal of this retrospective observation was to ensure that safety and efficacy were not compromised as a result of this cost-saving therapeutic interchange. No differences in liver enzymes (safety) and lipid control (effectiveness) were observed in this study. There were no statistically significant changes to the lipid panel or liver panel detected with the exception of ALP. The reason for this statistically significant increase is unknown; however, it may support the hypothesis of variation in hepatocellular effects between the statins due to lipophilic properties.3,6 In general, liver enzymes can be affected by extrahepatic functions. Serum ALP and other liver enzymes can be affected by bone disease, abdominal adiposity, alcoholism, and other concomitant diseases.10 No comorbid conditions were assessed, thus differences in liver enzymes may not be fully attributable to statin therapy. This retrospective review found no clinically significant effect correlated with the increase in ALP.
The results of this analysis are congruent with similar therapeutic interchange studies, which resulted in cost savings without compromising safety or efficacy.9,11 Unlike other therapeutic interchange studies, this study analyzed both safety and lipid-lowering efficacy outcomes, instead of focusing solely on changes in LDL-C lowering, total cost savings, and/or adherence.12,13 By including the entire lipid panel and liver panel into the review, this study conducted a more inclusive review of interchangeability with statins, addressing issues such as HDL-C lowering, TG changes, and liver enzyme fluctuation on conversion. There had not been a sufficient time to assess efficacy in terms of CV outcomes.
Related: Poor Outcomes for African Americans in Cardiac Rehabilitation
Two adverse events alluded to therapeutic failure as a reason for discontinuing atorvastatin. In the previous ATP III lipid guidelines, therapeutic failure was achieved when patients did not reach their LDL-C goals despite appropriate titration of statin therapy.2 However, the ACC/AHA lipid guidelines have done away with lipid goals as a measurement of treatment therapy, focusing rather on evidence-based high- or moderate-intensity statin therapy that has been proven in clinical trials to reduce mortality and CV events.1 Although measurement of efficacy via lipid panel values is no longer a guideline recommendation, the results of this chart review have shown no difference in lipid values as a result of the interchange, confirming the interchangeability of rosuvastatin and atorvastatin at their equivalent doses.
Limitations
The interchange of rosuvastatin to atorvastatin was a policy change affecting all patients within the NF/SGVHS. In order to reflect true population data and more accurately predict the effects of such a policy change, this study used intention-to-treat analysis, including all patients, even patients who were found to be nonadherent. This study is also limited by sample size (N = 202). Additionally, the generalizability of these findings may be limited. The study population was mostly males aged > 65 years with an average BMI of 32.4. Researchers did not compile comorbidity, race, or concomitant medication data. Additionally, the duration of statin therapy prior to laboratory value collection was undefined.
A retrospective chart review lends itself to limitations in data collection. Medication adherence is a factor that is assumed to have a significant effect on the results of this interchange. In this review, adherence was assessed via refill history. Researchers were unable to confirm actual consumption of the medication.
Additionally, researchers did not analyze comorbid conditions, which may have had an effect on lipid panel and liver panel values. For those veterans who discontinued atorvastatin therapy, the reason for discontinuation was often not documented. Thus, researchers were unable to assess reasons for discontinuation.
Conclusion
The results generated from a review of the therapeutic exchange of rosuvastatin to atorvastatin within a veteran population affirm that the interchange was not associated with any differences in safety or lipid control, but did result in significant drug cost savings. This study provides support for health care systems considering therapeutic interchange with high-intensity statins safely and effectively.
Acknowledgements
This material is the result of work supported with resources and the use of facilities at the North Florida/South Georgia Veterans Health System in Gainesville, Florida. The authors would like to acknowledge Kim Hoang, PharmD, for her contributions to this project.
Author disclosures
The authors report no actual or potential conflicts of interest with regard to this article.
Disclaimer
The opinions expressed herein are those of the authors and do not necessarily reflect those of Federal Practitioner, Frontline Medical Communications Inc., the U.S. Government, or any of its agencies. This article may discuss unlabeled or investigational use of certain drugs. Please review the complete prescribing information for specific drugs or drug combinations—including indications, contraindications, warnings, and adverse effects—before administering pharmacologic therapy to patients.
1. Stone NJ, Robinson JG, Lichtenstein AH, et al; American College of Cardiology/American Heart Association Task Force on Practice Guidelines. 2013 ACC/AHA guideline on the treatment of blood cholesterol to reduce atherosclerotic cardiovascular risk in adults: a report of the American College of Cardiology/American Heart Association Task Force on Practice Guidelines. J Am Coll Cardiol. 2014;63(25 pt B):2889-2934.
2. Grundy SM, Cleeman JI, Merz CN, et al; National Heart, Lung, and Blood Institute; American College of Cardiology Foundation; American Heart Association. Implications of recent clinical trials for the National Cholesterol Education Program Adult Treatment Panel III guidelines. Circulation. 2004;110(2):227-239.
3. McKenney JM. Pharmacologic characteristics of statins. Clin Cardiol. 2003;26(4 suppl 3):III32-III38.
4. Pfizer. Lipitor [package insert]. New York, NY: Pfizer; 2015.
5. Crestor [package insert]. Wilmington, DE:AstraZeneca; 2015.
6. Rosenson RS. Current overview of statin-induced myopathy. Am J Med. 2004;116(6):408-416.
7. FDA approves first generic version of cholesterol-lowering drug Lipitor [news release]. U.S. Food and Drug Administration; November 30, 2011. http://www.fda.gov/NewsEvents/Newsroom/PressAnnouncements/ucm281817.htm. Accessed November 11, 2015.
8. U.S. Department of Veterans Affairs. VHA Pharmacy Benefits Management Services, Medical Advisory Panel and VISN Pharmacist Executives. Interchange to generic atorvastatin-recommendations. Atorvastatin Conversion Guidance. 2012. U.S. Department of Veterans Affairs intranet website. https://vaww.cmopnational.va.gov/cmop/PBM/Clinical%20Guidance/Therapeutic%20Interchange%20Guidance/Atorvastatin%20Conversion%20Guidance%20(PBM-MAP-VPE)-Final.docx. Accessed November 16, 2015.
9. Pratt DS, Kaplan MM. Evaluation of Liver Function. In: Longo DL, Fauci AS, Kasper DL, Hauser SL, Jameson JL, Loscalzo J, eds. Harrison's Principles of Internal Medicine. 18th ed. New York: McGraw Hill Professional Publishing; 2011:2527-2530.
10. Taylor AJ, Grace K, Swiecki J, et al. Lipid-lowering efficacy, safety, and costs of a large-scale therapeutic statin formulary conversion program. Pharmacotherapy . 2001;21(9):1130-1139.
11. Billups SJ, Plushner SL, Olson KI, Koehler TJ, Kerzee J. Clinical and economic outcomes of conversion of simvastatin to lovastatin in a group-model health maintenance organization. J Manag Care Pharm. 2005;11(8):681-686.
12. Schachtner JM, Guharoy R, Medicis JJ, Newman N, Speizer R. Prevalence and cost savings of therapeutic interchange among U.S. hospitals. Am J Health Syst Pharm. 2002;59(6):529-533.
13. Hilleman DE, Wurdeman RL, Lenz TL. Therapeutic change of HMG-CoA reductase inhibitors in patients with coronary artery disease. Pharmacotherapy. 2001;21(4):410-415.
Patients with known cardiovascular (CV) disease are at greater risk for CV events.1 Hydroxymethylglutaryl-CoA (HMG Co-A) reductase inhibitors, or statins, have been shown to reduce CV events and to reduce all-cause mortality.1,2 Thus, these agents should be a standard approach to secondary prevention of CV events.1,2 Although the main function of statins is to lower total cholesterol (TC) and low-density lipoprotein cholesterol (LDL-C) levels, trials have shown that other lipid-lowering agents have reduced the incidence of CV events but have failed to show any difference in mortality.1 Thus, the therapeutic effects of statins may be a result of “pleiotropic” effects in addition to a reduction in LDL-C.3
As a result, prescribing practices and professional society guidelines have deferred to statins as a first-line choice for lipid-lowering therapy.1 Although each statin varies in its ability to lower LDL-C and inhibit HMG Co-A reductase, as a class, statins have been proven to be safe and efficacious in reducing LDL-C, decreasing risk of coronary artery disease, and decreasing mortality.
The 2013 American College of Cardiology (ACC) and American Heart Association (AHA) guideline on the treatment of blood cholesterol to reduce CV risk in adults resulted in a major shift in clinical practice recommendations. The focus of treatment has changed from LDL-C and TC goals to stratifying patients to either high-intensity or moderate-intensity statin therapy, based on their comorbidities and risk of atherosclerotic CV disease (ASCVD).1 Primary prevention of CV disease has been proposed for patients with diabetes mellitus aged 40 to 75 years, familial hypercholesterolemia (LDL-C > 190 mg/dL), and for patients with an ASCVD risk score > 7.5%. Secondary prevention has been proposed for all patients with a history of ASCVD. Among the available choices for intensive statin therapy, the 2 most potent regimens are atorvastatin (40-80 mg) and rosuvastatin (20-40 mg) daily. The ACC/AHA guideline recommends high-potency therapy with either rosuvastatin or atorvastatin with equal preference.1
Related: New Incentives for Helping Prevent Heart Disease
Statin therapy is generally well tolerated; however, the use of statins is not without risk of adverse drug reactions (ADRs). Skeletal muscle discomfort has been reported in 4% to 10% of patients taking either atorvastatin or rosuvastatin.4,5 Liver enzyme abnormalities are less common, having been reported in only about 2% to 3% of patients taking either atorvastatin or rosuvastatin.4,5 Although muscle-related intolerance and liver enzyme abnormalities are considered to be class effects, research speculates that the therapeutic and safety effects of statins may differ, based on tissue solubility.2,6 Variability in the myotoxic and hepatotoxic effects of statins has been attributed to differences in tissue solubility, hypothesizing that lipophilic statins are more easily taken up into myocytes and hepatocytes, resulting in an increase in toxic effects.2,6
This study assessed differences in therapeutic and safety endpoints resulting from the recent interchange from rosuvastatin to atorvastatin within the North Florida/South Georgia Veterans Health System (NF/SGVHS). Although both these agents are high-potency HMG Co-A reductase inhibitors and share a mechanism of action, they have pharmacokinetic differences, including a key difference in tissue solubility (Table 1).
With the availability of low-cost generic atorvastatin in early 2012, the VA Medical Advisory Panel and Pharmacy Benefits Management (VA MAP/PBM) added atorvastatin to the VA National Formulary as the preferred high-potency statin.7,8 Before October 2012, rosuvastatin had been the preferred high-potency statin within the VA. With support from VA MAP/PBM leadership, NF/SGVHS instituted an interchange from rosuvastatin to atorvastatin for cost-savings purposes.9
Before the interchange, the records of patients were reviewed to determine whether justification existed for continued use of rosuvastatin. Patients were converted to atorvastatin if deemed appropriate and received education and consultation through direct patient contact or a letter regarding the interchange. Justifications for continued use of rosuvastatin included documentation of an atorvastatin ADR, active liver disease, or patients taking cyclosporine or certain protease inhibitors.8
The objective of this retrospective evaluation was to assess the efficacy and safety of the interchange from rosuvastatin to atorvastatin within NF/SGVHS. The results of this review are helpful to confirm the efficacy and safety of the interchange and identify any differences in efficacy and safety that may have occurred as a result of the interchange to a different high-potency statin. For this review, statin efficacy was assessed via review of pre- and postinterchange lipid panel values, assessing for a significant difference between equipotent atorvastatin and rosuvastatin therapy. Similarly, safety was assessed by analysis of pre- and postinterchange liver enzyme panels and assessing for significant differences as a result of the interchange.
Methods
The therapeutic interchange was conducted within the NF/SGVHS, which provides patient care at hospitals in Gainesville, Florida, and Lake City, Florida, and 11 outpatient clinics located throughout North Florida and South Georgia. Like other VA facilities, NF/SGVHS uses Computerized Patient Records System (CPRS) to electronically integrate all clinical patient information, including medical progress notes, consults, admission and discharge summaries, allergies and ADRs, patient problem lists (diagnoses), vital signs, medication orders, and laboratory test results. Approval to conduct this study was granted by the University of Florida Investigational Review Board and the Research and Development Committee at NF/SGVHS.
Therapeutic Interchange Process
Interchange from rosuvastatin to atorvastatin was expected to provide about $643,000 annually in drug cost savings to NF/SGVHS while providing equivalent therapy. The cost for a 30-day supply of rosuvastatin was about $22.56 at the time of interchange, and a 30-day supply of generic atorvastatin was $1.77.The interchange from rosuvastatin to atorvastatin was approved by the Pharmacy and Therapeutics Committee Meeting on August 8, 2012, and began shortly thereafter. Interchanges were halted temporarily in November 2012 due to a shortage of manufacturer supply, but the process fully resumed in January 2013 once the drug shortage resolved. Direction was provided to VA facilities by a guidance letter issued through PBM leadership.8 The interchange used a standard interchange guide to complete the process (Table 2).
Posttherapeutic Interchange Analysis
Researchers conducted an internal pharmacy computerizedprescription records search to identify VA outpatients who were converted from rosuvastatin to atorvastatin from February 1, 2012, to August 1, 2013. A total of 202 patients were randomly selected and included in this retrospective chart review. Investigators analyzed data points for safety and efficacy, including liver function tests (LFTs), lipid panels, and ADR reports. This information was obtained from laboratory data, vital signs, allergy information, ADR data, and progress notes using CPRS. Two sets of laboratory data were obtained for research purposes, the most recent laboratory values pre-interchange and the most recent laboratory values postinterchange to atorvastatin.
Investigators determined whether patients were converted to an equivalent dose of atorvastatin through an assessment of the most recent dosage of rosuvastatin before the interchange and the dosage of atorvastatin postinterchange. Researchers also analyzed refill history and interacting medications to assess possible confounding factors. Medication adherence was assessed via refill history. Medication adherence was defined as a medication possession ratio of at least 70%, which correlated to receipt of 3 or more 90-day supplies in the year prior to interchange. The above data were collected via retrospective chart review and entered into a spreadsheet.
Statistics
All identifying information was removed from the data set prior to statistical analysis. The data analysis for this project was generated using SAS/STAT software, version 9.3 of the SAS System for Linux x64 (SAS Institute, Cary, North Carolina).
Researchers assumed an equal variance in preinterchange and postinterchange lipid and liver panel values. Preinterchange and postinterchange lipid values (LDL-C, HDL-C, total cholesterol [TC], and triglycerides [TGs]) and liver values (aspartate aminotransferase [AST], alanine aminotransferase [ALT], alkaline phosphatase [ALP], and creatinine phosphokinase [CPK]) were analyzed by paired t test. All values were reported as mean (SD), and significance was defined as P < .05.
Results
More than 6,000 veterans within the NF/SGVHS were identified as eligible for the interchange. Of those who were converted, 202 patient records were randomly selected and reviewed. Patient population characteristics are summarized in Table 3. Most patients were aged > 65 years (61.4%) with an average body mass index (BMI) of 32.4. Most patients were converted to the correct corresponding dose of atorvastatin (82.7%) and achieved adherence with statin therapy (84.2%). There was no difference in pre- and postinterchange adherence detected as a result of this review.
Related: New Guideline on Dyslipidemia: Less Is More
Adverse drug reactions were documented in 16 cases, accounting for 8% of the study population. The most commonly reported ADR was myalgia or arthralgia, which was found in 10 cases (5%). Other ADRs identified in this retrospective review included treatment failure, nausea, vomiting, abdominal discomfort, abnormal liver enzymes, nasopharyngitis, and pruritis (Table 4). Of note, treatment failure was determined on a case-by-case basis but was generally defined as a failure to reach LDL-C goal (< 100 mg/dL or < 70 mg/dL), despite titration of atorvastatin. Interacting medications were identified in 30.7% of patients; however, no reported ADRs were associated with interacting medications. The most common drug interaction was concomitant niacin, followed by antiarrhythmics (ie, amiodarone, diltiazem, etc), and fibrates (ie, gemfibrozil, fenofibrate). All potentially interacting medications identified in this retrospective chart review are compiled in Table 5.
No significant difference between mean pre- and postinterchange lipid panel values was identified in this retrospective chart review (Table 6). In addition, no significant difference was detected in pre- and post-interchange AST, ALT, and CPK values (Table 7). However, a statistically significant increase in ALP was detected, with a mean ALP of 73.33 IU/L prior to interchange and 83.64 IU/L postinterchange (P < .0001).
Discussion
The goal of this retrospective observation was to ensure that safety and efficacy were not compromised as a result of this cost-saving therapeutic interchange. No differences in liver enzymes (safety) and lipid control (effectiveness) were observed in this study. There were no statistically significant changes to the lipid panel or liver panel detected with the exception of ALP. The reason for this statistically significant increase is unknown; however, it may support the hypothesis of variation in hepatocellular effects between the statins due to lipophilic properties.3,6 In general, liver enzymes can be affected by extrahepatic functions. Serum ALP and other liver enzymes can be affected by bone disease, abdominal adiposity, alcoholism, and other concomitant diseases.10 No comorbid conditions were assessed, thus differences in liver enzymes may not be fully attributable to statin therapy. This retrospective review found no clinically significant effect correlated with the increase in ALP.
The results of this analysis are congruent with similar therapeutic interchange studies, which resulted in cost savings without compromising safety or efficacy.9,11 Unlike other therapeutic interchange studies, this study analyzed both safety and lipid-lowering efficacy outcomes, instead of focusing solely on changes in LDL-C lowering, total cost savings, and/or adherence.12,13 By including the entire lipid panel and liver panel into the review, this study conducted a more inclusive review of interchangeability with statins, addressing issues such as HDL-C lowering, TG changes, and liver enzyme fluctuation on conversion. There had not been a sufficient time to assess efficacy in terms of CV outcomes.
Related: Poor Outcomes for African Americans in Cardiac Rehabilitation
Two adverse events alluded to therapeutic failure as a reason for discontinuing atorvastatin. In the previous ATP III lipid guidelines, therapeutic failure was achieved when patients did not reach their LDL-C goals despite appropriate titration of statin therapy.2 However, the ACC/AHA lipid guidelines have done away with lipid goals as a measurement of treatment therapy, focusing rather on evidence-based high- or moderate-intensity statin therapy that has been proven in clinical trials to reduce mortality and CV events.1 Although measurement of efficacy via lipid panel values is no longer a guideline recommendation, the results of this chart review have shown no difference in lipid values as a result of the interchange, confirming the interchangeability of rosuvastatin and atorvastatin at their equivalent doses.
Limitations
The interchange of rosuvastatin to atorvastatin was a policy change affecting all patients within the NF/SGVHS. In order to reflect true population data and more accurately predict the effects of such a policy change, this study used intention-to-treat analysis, including all patients, even patients who were found to be nonadherent. This study is also limited by sample size (N = 202). Additionally, the generalizability of these findings may be limited. The study population was mostly males aged > 65 years with an average BMI of 32.4. Researchers did not compile comorbidity, race, or concomitant medication data. Additionally, the duration of statin therapy prior to laboratory value collection was undefined.
A retrospective chart review lends itself to limitations in data collection. Medication adherence is a factor that is assumed to have a significant effect on the results of this interchange. In this review, adherence was assessed via refill history. Researchers were unable to confirm actual consumption of the medication.
Additionally, researchers did not analyze comorbid conditions, which may have had an effect on lipid panel and liver panel values. For those veterans who discontinued atorvastatin therapy, the reason for discontinuation was often not documented. Thus, researchers were unable to assess reasons for discontinuation.
Conclusion
The results generated from a review of the therapeutic exchange of rosuvastatin to atorvastatin within a veteran population affirm that the interchange was not associated with any differences in safety or lipid control, but did result in significant drug cost savings. This study provides support for health care systems considering therapeutic interchange with high-intensity statins safely and effectively.
Acknowledgements
This material is the result of work supported with resources and the use of facilities at the North Florida/South Georgia Veterans Health System in Gainesville, Florida. The authors would like to acknowledge Kim Hoang, PharmD, for her contributions to this project.
Author disclosures
The authors report no actual or potential conflicts of interest with regard to this article.
Disclaimer
The opinions expressed herein are those of the authors and do not necessarily reflect those of Federal Practitioner, Frontline Medical Communications Inc., the U.S. Government, or any of its agencies. This article may discuss unlabeled or investigational use of certain drugs. Please review the complete prescribing information for specific drugs or drug combinations—including indications, contraindications, warnings, and adverse effects—before administering pharmacologic therapy to patients.
1. Stone NJ, Robinson JG, Lichtenstein AH, et al; American College of Cardiology/American Heart Association Task Force on Practice Guidelines. 2013 ACC/AHA guideline on the treatment of blood cholesterol to reduce atherosclerotic cardiovascular risk in adults: a report of the American College of Cardiology/American Heart Association Task Force on Practice Guidelines. J Am Coll Cardiol. 2014;63(25 pt B):2889-2934.
2. Grundy SM, Cleeman JI, Merz CN, et al; National Heart, Lung, and Blood Institute; American College of Cardiology Foundation; American Heart Association. Implications of recent clinical trials for the National Cholesterol Education Program Adult Treatment Panel III guidelines. Circulation. 2004;110(2):227-239.
3. McKenney JM. Pharmacologic characteristics of statins. Clin Cardiol. 2003;26(4 suppl 3):III32-III38.
4. Pfizer. Lipitor [package insert]. New York, NY: Pfizer; 2015.
5. Crestor [package insert]. Wilmington, DE:AstraZeneca; 2015.
6. Rosenson RS. Current overview of statin-induced myopathy. Am J Med. 2004;116(6):408-416.
7. FDA approves first generic version of cholesterol-lowering drug Lipitor [news release]. U.S. Food and Drug Administration; November 30, 2011. http://www.fda.gov/NewsEvents/Newsroom/PressAnnouncements/ucm281817.htm. Accessed November 11, 2015.
8. U.S. Department of Veterans Affairs. VHA Pharmacy Benefits Management Services, Medical Advisory Panel and VISN Pharmacist Executives. Interchange to generic atorvastatin-recommendations. Atorvastatin Conversion Guidance. 2012. U.S. Department of Veterans Affairs intranet website. https://vaww.cmopnational.va.gov/cmop/PBM/Clinical%20Guidance/Therapeutic%20Interchange%20Guidance/Atorvastatin%20Conversion%20Guidance%20(PBM-MAP-VPE)-Final.docx. Accessed November 16, 2015.
9. Pratt DS, Kaplan MM. Evaluation of Liver Function. In: Longo DL, Fauci AS, Kasper DL, Hauser SL, Jameson JL, Loscalzo J, eds. Harrison's Principles of Internal Medicine. 18th ed. New York: McGraw Hill Professional Publishing; 2011:2527-2530.
10. Taylor AJ, Grace K, Swiecki J, et al. Lipid-lowering efficacy, safety, and costs of a large-scale therapeutic statin formulary conversion program. Pharmacotherapy . 2001;21(9):1130-1139.
11. Billups SJ, Plushner SL, Olson KI, Koehler TJ, Kerzee J. Clinical and economic outcomes of conversion of simvastatin to lovastatin in a group-model health maintenance organization. J Manag Care Pharm. 2005;11(8):681-686.
12. Schachtner JM, Guharoy R, Medicis JJ, Newman N, Speizer R. Prevalence and cost savings of therapeutic interchange among U.S. hospitals. Am J Health Syst Pharm. 2002;59(6):529-533.
13. Hilleman DE, Wurdeman RL, Lenz TL. Therapeutic change of HMG-CoA reductase inhibitors in patients with coronary artery disease. Pharmacotherapy. 2001;21(4):410-415.
Treatment Failure With Atorvastatin After Change From Rosuvastatin to Atorvastatin
Due to the growing number of drug shortages and increasing cost of medications, large-scale formulary conversions are becoming more common and necessary for pharmacies to stay within their budget allocations. Statins are widely recognized as first-line therapy for cholesterol lowering and have been proven to reduce cardiovascular morbidity and mortality.1-5 In addition to statin therapy, weight loss and lifestyle changes are often necessary to meet optimum low-density lipoprotein cholesterol (LDL-C) goals.6 According to the Adult Treatment Panel III (ATP III) guidelines, the optimum LDL-C for each patient varies based on the presence of coronary artery disease (CAD), CAD risk equivalents, and other risk factors.7 Patients with CAD or CAD risk equivalents have an LDL-C goal of < 100 mg/dL. Those with multiple risk factors have an LDL-C goal of < 130 mg/dL, and those with 0 to 1 risk factors have an LDL-C goal of < 160 mg/dL.1-3,7,8
Numerous trials have compared the safety and efficacy of the 3-hydroxy-3-methylglutaryl-coenzyme A inhibitors, stating that rosuvastatin 5 to 10 mg per day is equivalent to 20 mg per day of atorvastatin in terms of its ability to lower LDL-C levels.7,9-14 The LUNAR (Limiting Under treatment of lipids in Acute coronary syndrome with Rosuvastatin) study compared the efficacy of rosuvastatin with that of atorvastatin in decreasing LDL-C in patients with acute coronary syndrome.8 Rosuvastatin 40 mg was significantly more successful in lowering LDL-C and increasing high-density lipoprotein cholesterol (HDL-C) compared with atorvastatin 80-mg daily therapy.
In October 2012, the national VA Pharmacy Benefits Management (PBM) Services released guidance regarding the conversion from rosuvastatin to atorvastatin, including the dosing conversion (Table 1), stating that rosuvastatin 5 mg daily should be considered equivalent and converted to atorvastatin 20 mg daily. In general, adverse events (AEs), such as increased liver enzymes, myopathies, and increased creatinine phosphokinase (CPK), are considered a class effect of the statins.13,14
Related: Statins showed no benefit in reducing risk of recurrent VTE
The recent 2013 American College of Cardiology/American Heart Association (ACC/AHA) Blood Cholesterol Guideline on the Treatment of Blood Cholesterol to Reduce Atherosclerotic Cardiovascular Risk in Adults has identified a large number of patients as candidates for high-intensity statins, which the authors defined as atorvastatin and rosuvastatin.4 These guidelines do not recommend LDL-C goals and instead use a risk calculator to determine which intensity of statin therapy is appropriate for certain patients. This change in practice will lead to a higher volume of high-intensity statin prescriptions and higher drug costs for some medical centers. Given the volume of prescriptions and the increased use of large-scale formulary conversions to reduce costs, more research is warranted to ensure equivalent dosing. With more data available and equivalent dosing defined, pharmacists may be better able to improve clinical results in patients that are included in these large-scale formulary conversions.
Methods
A retrospective chart review was performed on all LDL-C levels in patients receiving atorvastatin therapy due to the formulary conversion from rosuvastatin to atorvastatin at the Huntington VAMC (HVAMC) in Huntington, West Virginia, per the guidance published by the national VA PBM Services. The number of patients not at their LDL-C goal (as defined by ATP III guidelines) as a result of atorvastatin therapy was determined. Furthermore, AEs due to atorvastatin therapy such as increased liver enzymes, myopathy, and increased CPK were identified and analyzed.
The primary endpoint of this study focused on the rate of treatment failure in LDL-C reduction with atorvastatin treatment in patients previously at their LDL-C goal, as defined by the ATP III guidelines, with rosuvastatin therapy. Secondary endpoints included rate of AEs due to atorvastatin therapy, percentage increase in CPK and liver enzymes as a result of atorvastatin therapy, and percentage LDL-C, HDL-C, total cholesterol (TC), and triglyceride (TGs) changes since conversion from rosuvastatin to atorvastatin.
Patients were included in the study if they were aged 18 to 89 years, previously at LDL-C goal with rosuvastatin therapy for at least 3 months, had never previously received atorvastatin, were converted to atorvastatin therapy as a result of a large-scale formulary conversion at HVAMC, and had a fasting lipid panel completed 1 to 6 months after conversion. Patients were excluded from the study if they received other lipid-lowering medications (eg, bile acid sequestrants, fibrates, niacin, or ezetimibe) in the 12 months before or after receiving statin therapy, had previously documented AEs (eg, myopathy, increased liver enzymes, increased CPK as a result of statin therapy, or history of known homozygous familial hypercholesterolemia) current active liver disease (ALT > 2x ULN [upper limit of normal]), unexplained CPK ≥ 3x ULN, serum creatinine (SCr) > 2 mg/dL, or history of alcohol or drug abuse within the last 5 years.
Results
Three hundred twenty-three patients were identified and reviewed as converted from rosuvastatin to atorvastatin during the study period with no prior use of atorvastatin. Of the 323 charts that were reviewed, 195 patients met the study inclusion criteria and were analyzed for rate of treatment failure in terms of lipid goals and rate of AEs. Twenty of 195 patients (10.3%) were no longer at their LDL-C goal after conversion from rosuvastatin to atorvastatin. Of those 195 patients, 29 (14.9%) experienced an adverse drug reaction (ADR) as a result of atorvastatin treatment that was severe enough to result in discontinuation of the drug and switching the patient back to the originally prescribed dose of rosuvastatin. Figure 1 illustrates the number of patients and documented atorvastatin ADRs. The most common ADR documented to atorvastatin was myalgias (8.2%).
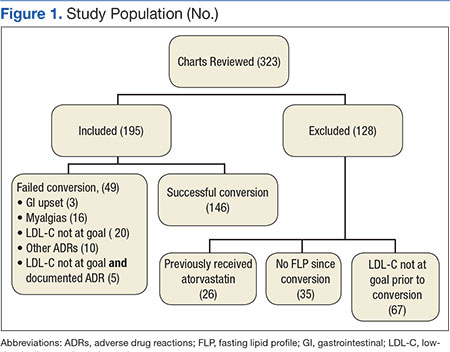
The average change in lipid levels was calculated and atorvastatin therapy was found to result in clinically insignificant changes to the lipid panel (Table 2). A 2-tailed paired t test was used to assess the statistical significance of these changes. Atorvastatin therapy resulted in an average decrease of LDL-C by 5.0 mg/dL (P < .01) in comparison to previous therapy with equivalent rosuvastatin dose. Other noted changes to lipid profile after formulary conversion included TG reduction by 2 mg/dL (P = .69), TC increased by 0.58 mg/dL (P = .80), and HDL-C reduction by 4.66 mg/dL (P < .01).
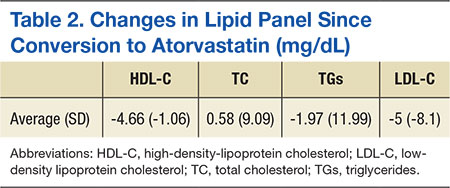
Although the decrease in LDL-C and HDL-C as a result of the formulary change was found to be statistically significant, they are not thought to result in a clinical difference. Clinically and statistically insignificant changes in liver enzymes and CPK were also discovered as a result of atorvastatin therapy conversion (Table 3). Atorvastatin therapy resulted in an averaged decrease of aspartate aminotransferase by 2.2 IU/L (P = .19) and an increase in alanine aminotransferase by 1.4 IU/L (P = .47). Average change in CPK was -6 IU/L (P = 89).
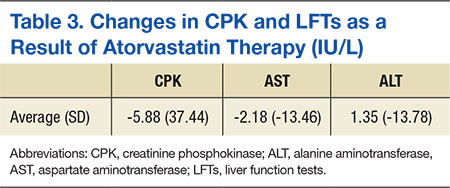
Related: New Guideline on Dyslipidemia: Less Is More
Discussion
Lipid levels were found to be mostly unchanged and remained at therapy goals, demonstrating use and appropriate equivalent dosing of rosuvastatin and atorvastatin following the formulary conversion defined in Table 1. Documented ADRs were minimal, indicating the ingredient conversion was well tolerated overall by our patients. Following the release of the 2013ACC/AHA guidelines, many patients in the VA required treatment with high-potency statins such as rosuvastatin and atorvastatin. Given the volume of statin prescriptions in the VA and the significant potential for providing the most cost-efficient lipid therapy (Table 4), the formulary conversion from rosuvastatin to atorvastatin was warranted.
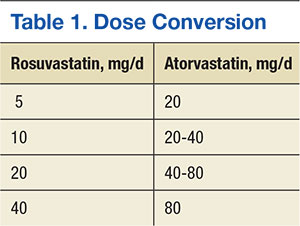
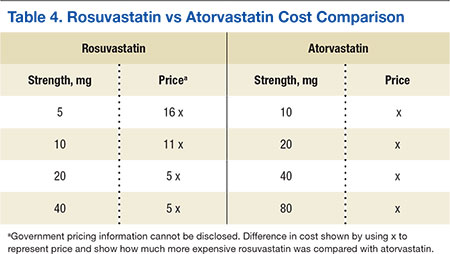
Limitations
There are several limitations for extrapolating results from this study to the general population. Due to the retrospective design of the study, no formal assessment of adherence was conducted. A prospective trial, with a researcher monitoring refills and tablet counts would be more accurate to ensure patients adherence with statin therapy.
Many of the patients that were included in the formulary conversion did not have follow-up laboratory work at the time of this study and were therefore excluded, leading to a smaller study population. A larger study population with a similar study design may be able to detect more significant correlations.
There are also several potential complications in regard to formulary conversions, including the inability to ensure the exact period that the patient switched therapies. During the conversion of rosuvastatin to atorvastatin at HVAMC, an attempt was made to minimize this confounder by converting patients on request for a refill of their rosuvastatin therapy. Last, all 185 patients that were studied were male; therefore, it is difficult to extrapolate these results for female patients.
Conclusions
This study shows that the conversion of patients from rosuvastatin therapy to atorvastatin was effective when it targeted a specific LDL-C goal or specific reduction in LDL-C. A similar conversion would likely lead to lower drug costs for many other health systems. Additional studies will be necessary given the recent changes in the national lipid guidelines. Furthermore, studies will be needed to assess concrete clinical endpoints (cardiovascular mortality, all-cause mortality, and cardiac events).
Related: Poor Outcomes for African Americans in Cardiac Rehabilitation
Author disclosures
The authors report no actual or potential conflicts of interest with regard to this article.
Disclaimer
The opinions expressed herein are those of the authors and do not necessarily reflect those of Federal Practitioner, Frontline Medical Communications Inc., the U.S. Government, or any of its agencies. This article may discuss unlabeled or investigational use of certain drugs. Please review the complete prescribing information for specific drugs or drug combinations—including indications, contraindications, warnings, and adverse effects—before administering pharmacologic therapy to patients.
1. Krasuski RA, Doeppenschmidt D, Henry JS, et al. Conversion to atorvastatin in patients intolerant or refractory to simvastatin therapy: the CAPISH study. Mayo Clin Proc. 2005;80(9):1163-1168.
2. Clearfield MB, Amerena J, Bassand JP, et al. Comparison of the efficacy and safety of rosuvastatin 10 mg and atorvastatin 20 mg in high-risk patients with hypercholesterolemia--Prospective study to evaluate the Use of Low doses of the Statins Atorvastatin and Rosuvastatin (PULSAR). Trials. 2006;7:35.
3. Park JS, Kim YJ, Choi JY, et al. Comparative study of low doses of rosuvastatin and atorvastatin on lipid and glycemic control in patients with metabolic syndrome and hypercholesterolemia. Korean J Intern Med. 2010;25(1):27-35.
4. Stone NJ, Robinson JG, Lichtenstein AH, et al; American College of Cardiology/American Heart Association Task Force on Practice Guidelines. 2013 ACC/AHA guideline on the treatment of blood cholesterol to reduce atherosclerotic cardiovascular risk in adults: a report of the American College of Cardiology/American Heart Association Task Force on Practice Guidelines. J Am Coll Cardiol. 2014;63(25, pt B):2889-2934.
5. Schuster H, Barter PJ, Stender S, et al; Effective Reductions in Cholesterol Using Rosuvastatin Therapy I study group. Effects of switching statin on achievement of lipid goals: Measuring Effective Reductions in Cholesterol Using Rosuvastatin Therapy (MERCURY I) study. Am Heart J. 2004;147(4):705-713.
6. Ballantyne CM, Bertolami M, Garcia HR, et al. Achieving LDL cholesterol, non-HDL cholesterol and apolipoprotein B target levels in high-risk patients: Measuring effective Reductions in Cholesterol Using Rosuvastatin therapY (MERCURY) II. Am Heart J. 2006;151(5):975.e1-975.e9.
7. Expert Panel on Detection, Evaluation, and Treatment of High Blood Cholesterol in Adults. Executive Summary of the Third Report of the National Cholesterol Education Program (NCEP) Expert Panel on Detection, Evaluation, and Treatment of High Blood Cholesterol In Adults (Adult Treatment Panel III). JAMA. 2001;285(19):2486-2497.
8. Pitt B, Loscalzo J, Monyak J, Miller E, Raichlen J. Comparison of lipid-modifying efficacy of rosuvastatin versus atorvastatin in patients with acute coronary syndrome (from the LUNAR study). Am J Cardiol. 2012;109(9);1239-1246.
9. Takagi H, Niwa M, Mizuno Y, Yamamoto H, Goto SN, Umemoto T. Effects of rosuvastatin versus atorvastatin on small dense low-density lipoprotein: a meta-analysis of randomized trials. Heart Vessels. 2014;29(3);287-299.
10. Fox KM, Gandhi SK, Ohsfeldt RL, Davidson MH. Comparison of low-density lipoprotein cholesterol reduction after switching patients on other statins to rosuvastatin or simvastatin in a real-world clinical practice setting. Am J Manag Care. 2007;13(suppl 10):S270-S275.
11. Taylor AJ, Grace K, Swiecki J, et al. Lipid-lowering efficacy, safety, and costs of a large-scale therapeutic statin formulary conversion program. Pharmacotherapy. 2001;21(9):1130-1139.
12. Bullano MF, Kamat S, Wertz DA, et al. Effectiveness of rosuvastatin versus atorvastatin in reducing lipid levels and achieving low-density-lipoprotein cholesterol goals in a usual care setting. Am J Health Syst Pharm. 2007;64(3):276-284.
13. Palmer MK, Nicholls SJ, Lundman P, Barter PJ, Karison BW. Achievement of LDL-C goals depends on baseline LDL-C and choice and dose of statin: an analysis from the VOYAGER database. Eur J Prev Cardiol. 2013;20(6):1080-1087.
14. Berne C, Siewert-Delle A; URANUS study investigators. Comparison of rosuvastatin and atorvastatin for lipid lowering in patients with type 2 diabetes mellitus: results from the URANUS study. Cardiovasc Diabetol. 2005;4:7.
Due to the growing number of drug shortages and increasing cost of medications, large-scale formulary conversions are becoming more common and necessary for pharmacies to stay within their budget allocations. Statins are widely recognized as first-line therapy for cholesterol lowering and have been proven to reduce cardiovascular morbidity and mortality.1-5 In addition to statin therapy, weight loss and lifestyle changes are often necessary to meet optimum low-density lipoprotein cholesterol (LDL-C) goals.6 According to the Adult Treatment Panel III (ATP III) guidelines, the optimum LDL-C for each patient varies based on the presence of coronary artery disease (CAD), CAD risk equivalents, and other risk factors.7 Patients with CAD or CAD risk equivalents have an LDL-C goal of < 100 mg/dL. Those with multiple risk factors have an LDL-C goal of < 130 mg/dL, and those with 0 to 1 risk factors have an LDL-C goal of < 160 mg/dL.1-3,7,8
Numerous trials have compared the safety and efficacy of the 3-hydroxy-3-methylglutaryl-coenzyme A inhibitors, stating that rosuvastatin 5 to 10 mg per day is equivalent to 20 mg per day of atorvastatin in terms of its ability to lower LDL-C levels.7,9-14 The LUNAR (Limiting Under treatment of lipids in Acute coronary syndrome with Rosuvastatin) study compared the efficacy of rosuvastatin with that of atorvastatin in decreasing LDL-C in patients with acute coronary syndrome.8 Rosuvastatin 40 mg was significantly more successful in lowering LDL-C and increasing high-density lipoprotein cholesterol (HDL-C) compared with atorvastatin 80-mg daily therapy.
In October 2012, the national VA Pharmacy Benefits Management (PBM) Services released guidance regarding the conversion from rosuvastatin to atorvastatin, including the dosing conversion (Table 1), stating that rosuvastatin 5 mg daily should be considered equivalent and converted to atorvastatin 20 mg daily. In general, adverse events (AEs), such as increased liver enzymes, myopathies, and increased creatinine phosphokinase (CPK), are considered a class effect of the statins.13,14
Related: Statins showed no benefit in reducing risk of recurrent VTE
The recent 2013 American College of Cardiology/American Heart Association (ACC/AHA) Blood Cholesterol Guideline on the Treatment of Blood Cholesterol to Reduce Atherosclerotic Cardiovascular Risk in Adults has identified a large number of patients as candidates for high-intensity statins, which the authors defined as atorvastatin and rosuvastatin.4 These guidelines do not recommend LDL-C goals and instead use a risk calculator to determine which intensity of statin therapy is appropriate for certain patients. This change in practice will lead to a higher volume of high-intensity statin prescriptions and higher drug costs for some medical centers. Given the volume of prescriptions and the increased use of large-scale formulary conversions to reduce costs, more research is warranted to ensure equivalent dosing. With more data available and equivalent dosing defined, pharmacists may be better able to improve clinical results in patients that are included in these large-scale formulary conversions.
Methods
A retrospective chart review was performed on all LDL-C levels in patients receiving atorvastatin therapy due to the formulary conversion from rosuvastatin to atorvastatin at the Huntington VAMC (HVAMC) in Huntington, West Virginia, per the guidance published by the national VA PBM Services. The number of patients not at their LDL-C goal (as defined by ATP III guidelines) as a result of atorvastatin therapy was determined. Furthermore, AEs due to atorvastatin therapy such as increased liver enzymes, myopathy, and increased CPK were identified and analyzed.
The primary endpoint of this study focused on the rate of treatment failure in LDL-C reduction with atorvastatin treatment in patients previously at their LDL-C goal, as defined by the ATP III guidelines, with rosuvastatin therapy. Secondary endpoints included rate of AEs due to atorvastatin therapy, percentage increase in CPK and liver enzymes as a result of atorvastatin therapy, and percentage LDL-C, HDL-C, total cholesterol (TC), and triglyceride (TGs) changes since conversion from rosuvastatin to atorvastatin.
Patients were included in the study if they were aged 18 to 89 years, previously at LDL-C goal with rosuvastatin therapy for at least 3 months, had never previously received atorvastatin, were converted to atorvastatin therapy as a result of a large-scale formulary conversion at HVAMC, and had a fasting lipid panel completed 1 to 6 months after conversion. Patients were excluded from the study if they received other lipid-lowering medications (eg, bile acid sequestrants, fibrates, niacin, or ezetimibe) in the 12 months before or after receiving statin therapy, had previously documented AEs (eg, myopathy, increased liver enzymes, increased CPK as a result of statin therapy, or history of known homozygous familial hypercholesterolemia) current active liver disease (ALT > 2x ULN [upper limit of normal]), unexplained CPK ≥ 3x ULN, serum creatinine (SCr) > 2 mg/dL, or history of alcohol or drug abuse within the last 5 years.
Results
Three hundred twenty-three patients were identified and reviewed as converted from rosuvastatin to atorvastatin during the study period with no prior use of atorvastatin. Of the 323 charts that were reviewed, 195 patients met the study inclusion criteria and were analyzed for rate of treatment failure in terms of lipid goals and rate of AEs. Twenty of 195 patients (10.3%) were no longer at their LDL-C goal after conversion from rosuvastatin to atorvastatin. Of those 195 patients, 29 (14.9%) experienced an adverse drug reaction (ADR) as a result of atorvastatin treatment that was severe enough to result in discontinuation of the drug and switching the patient back to the originally prescribed dose of rosuvastatin. Figure 1 illustrates the number of patients and documented atorvastatin ADRs. The most common ADR documented to atorvastatin was myalgias (8.2%).
The average change in lipid levels was calculated and atorvastatin therapy was found to result in clinically insignificant changes to the lipid panel (Table 2). A 2-tailed paired t test was used to assess the statistical significance of these changes. Atorvastatin therapy resulted in an average decrease of LDL-C by 5.0 mg/dL (P < .01) in comparison to previous therapy with equivalent rosuvastatin dose. Other noted changes to lipid profile after formulary conversion included TG reduction by 2 mg/dL (P = .69), TC increased by 0.58 mg/dL (P = .80), and HDL-C reduction by 4.66 mg/dL (P < .01).
Although the decrease in LDL-C and HDL-C as a result of the formulary change was found to be statistically significant, they are not thought to result in a clinical difference. Clinically and statistically insignificant changes in liver enzymes and CPK were also discovered as a result of atorvastatin therapy conversion (Table 3). Atorvastatin therapy resulted in an averaged decrease of aspartate aminotransferase by 2.2 IU/L (P = .19) and an increase in alanine aminotransferase by 1.4 IU/L (P = .47). Average change in CPK was -6 IU/L (P = 89).
Related: New Guideline on Dyslipidemia: Less Is More
Discussion
Lipid levels were found to be mostly unchanged and remained at therapy goals, demonstrating use and appropriate equivalent dosing of rosuvastatin and atorvastatin following the formulary conversion defined in Table 1. Documented ADRs were minimal, indicating the ingredient conversion was well tolerated overall by our patients. Following the release of the 2013ACC/AHA guidelines, many patients in the VA required treatment with high-potency statins such as rosuvastatin and atorvastatin. Given the volume of statin prescriptions in the VA and the significant potential for providing the most cost-efficient lipid therapy (Table 4), the formulary conversion from rosuvastatin to atorvastatin was warranted.
Limitations
There are several limitations for extrapolating results from this study to the general population. Due to the retrospective design of the study, no formal assessment of adherence was conducted. A prospective trial, with a researcher monitoring refills and tablet counts would be more accurate to ensure patients adherence with statin therapy.
Many of the patients that were included in the formulary conversion did not have follow-up laboratory work at the time of this study and were therefore excluded, leading to a smaller study population. A larger study population with a similar study design may be able to detect more significant correlations.
There are also several potential complications in regard to formulary conversions, including the inability to ensure the exact period that the patient switched therapies. During the conversion of rosuvastatin to atorvastatin at HVAMC, an attempt was made to minimize this confounder by converting patients on request for a refill of their rosuvastatin therapy. Last, all 185 patients that were studied were male; therefore, it is difficult to extrapolate these results for female patients.
Conclusions
This study shows that the conversion of patients from rosuvastatin therapy to atorvastatin was effective when it targeted a specific LDL-C goal or specific reduction in LDL-C. A similar conversion would likely lead to lower drug costs for many other health systems. Additional studies will be necessary given the recent changes in the national lipid guidelines. Furthermore, studies will be needed to assess concrete clinical endpoints (cardiovascular mortality, all-cause mortality, and cardiac events).
Related: Poor Outcomes for African Americans in Cardiac Rehabilitation
Author disclosures
The authors report no actual or potential conflicts of interest with regard to this article.
Disclaimer
The opinions expressed herein are those of the authors and do not necessarily reflect those of Federal Practitioner, Frontline Medical Communications Inc., the U.S. Government, or any of its agencies. This article may discuss unlabeled or investigational use of certain drugs. Please review the complete prescribing information for specific drugs or drug combinations—including indications, contraindications, warnings, and adverse effects—before administering pharmacologic therapy to patients.
1. Krasuski RA, Doeppenschmidt D, Henry JS, et al. Conversion to atorvastatin in patients intolerant or refractory to simvastatin therapy: the CAPISH study. Mayo Clin Proc. 2005;80(9):1163-1168.
2. Clearfield MB, Amerena J, Bassand JP, et al. Comparison of the efficacy and safety of rosuvastatin 10 mg and atorvastatin 20 mg in high-risk patients with hypercholesterolemia--Prospective study to evaluate the Use of Low doses of the Statins Atorvastatin and Rosuvastatin (PULSAR). Trials. 2006;7:35.
3. Park JS, Kim YJ, Choi JY, et al. Comparative study of low doses of rosuvastatin and atorvastatin on lipid and glycemic control in patients with metabolic syndrome and hypercholesterolemia. Korean J Intern Med. 2010;25(1):27-35.
4. Stone NJ, Robinson JG, Lichtenstein AH, et al; American College of Cardiology/American Heart Association Task Force on Practice Guidelines. 2013 ACC/AHA guideline on the treatment of blood cholesterol to reduce atherosclerotic cardiovascular risk in adults: a report of the American College of Cardiology/American Heart Association Task Force on Practice Guidelines. J Am Coll Cardiol. 2014;63(25, pt B):2889-2934.
5. Schuster H, Barter PJ, Stender S, et al; Effective Reductions in Cholesterol Using Rosuvastatin Therapy I study group. Effects of switching statin on achievement of lipid goals: Measuring Effective Reductions in Cholesterol Using Rosuvastatin Therapy (MERCURY I) study. Am Heart J. 2004;147(4):705-713.
6. Ballantyne CM, Bertolami M, Garcia HR, et al. Achieving LDL cholesterol, non-HDL cholesterol and apolipoprotein B target levels in high-risk patients: Measuring effective Reductions in Cholesterol Using Rosuvastatin therapY (MERCURY) II. Am Heart J. 2006;151(5):975.e1-975.e9.
7. Expert Panel on Detection, Evaluation, and Treatment of High Blood Cholesterol in Adults. Executive Summary of the Third Report of the National Cholesterol Education Program (NCEP) Expert Panel on Detection, Evaluation, and Treatment of High Blood Cholesterol In Adults (Adult Treatment Panel III). JAMA. 2001;285(19):2486-2497.
8. Pitt B, Loscalzo J, Monyak J, Miller E, Raichlen J. Comparison of lipid-modifying efficacy of rosuvastatin versus atorvastatin in patients with acute coronary syndrome (from the LUNAR study). Am J Cardiol. 2012;109(9);1239-1246.
9. Takagi H, Niwa M, Mizuno Y, Yamamoto H, Goto SN, Umemoto T. Effects of rosuvastatin versus atorvastatin on small dense low-density lipoprotein: a meta-analysis of randomized trials. Heart Vessels. 2014;29(3);287-299.
10. Fox KM, Gandhi SK, Ohsfeldt RL, Davidson MH. Comparison of low-density lipoprotein cholesterol reduction after switching patients on other statins to rosuvastatin or simvastatin in a real-world clinical practice setting. Am J Manag Care. 2007;13(suppl 10):S270-S275.
11. Taylor AJ, Grace K, Swiecki J, et al. Lipid-lowering efficacy, safety, and costs of a large-scale therapeutic statin formulary conversion program. Pharmacotherapy. 2001;21(9):1130-1139.
12. Bullano MF, Kamat S, Wertz DA, et al. Effectiveness of rosuvastatin versus atorvastatin in reducing lipid levels and achieving low-density-lipoprotein cholesterol goals in a usual care setting. Am J Health Syst Pharm. 2007;64(3):276-284.
13. Palmer MK, Nicholls SJ, Lundman P, Barter PJ, Karison BW. Achievement of LDL-C goals depends on baseline LDL-C and choice and dose of statin: an analysis from the VOYAGER database. Eur J Prev Cardiol. 2013;20(6):1080-1087.
14. Berne C, Siewert-Delle A; URANUS study investigators. Comparison of rosuvastatin and atorvastatin for lipid lowering in patients with type 2 diabetes mellitus: results from the URANUS study. Cardiovasc Diabetol. 2005;4:7.