User login
Education Pitfalls of Insulin Administration in Patients With Diabetes
Diabetes mellitus is a growing problem in the U.S., with the number of disease-related complications on the rise. It affects 29.1 million people of all ages; however, only 21 million people are diagnosed, leaving 8.1 million people undiagnosed.1 Heart disease death rates among adults with diabetes are 2 to 4 times higher than the rates for adults without diabetes.2 At least 68% of patients with diabetes aged > 65 years die of some form of heart disease; 16% die of stroke.2
Type 2 diabetes remains the leading cause for cardiovascular disorders, blindness, end-stage renal disease, amputations, and hospitalizations.3 Due to the long-term complications of diabetes, it is important to help patients control their disease. However, diabetes control in patients can be difficult because of the broad disease education needed and its medication administration.
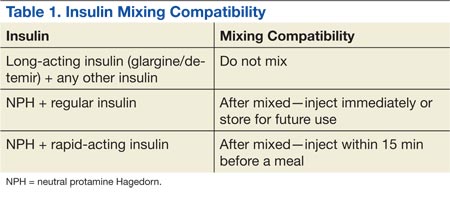
Insulin requires the most extensive instruction when educating patients with diabetes. Specifically, patient counseling needs to incorporate the importance of proper insulin administration. If patients are not properly administering their insulin, controlling their diabetes will be very difficult. Many clinicians know to educate the patient about drawing insulin into a syringe and how to inject insulin properly. However, clinicians do not always think about other aspects of insulin administration education, such as the mixing of different insulins in 1 syringe. Patients and family members need to be taught about the types of insulins that can and cannot be mixed. The American Diabetes Association (ADA) provides recommendations on the appropriate time to mix insulin and the types of insulin that can and cannot be mixed (Table 1).4
CASE REPORT
A white male, aged 69 years, presented to a pharmacist-run pharmacotherapy clinic for a follow-up appointment for uncontrolled diabetes. The patient’s wife, who managed his medications, accompanied him. Significant past medical history included diabetes, nephropathy, retinopathy, degenerative joint disease, migraines, gastroesophageal reflux disease, depression, posttraumatic stress disorder, hyperlipidemia, hypertension, lumbago, panic attacks, medication noncompliance, status post cerebral vascular accident, and renal insufficiency.
The patient had a long history of type 2 diabetes, and his insulin had been titrated multiple times since he was established in this clinic in 2009. At his establishing visit, he was taken off his insulin pump due to noncompliance with blood glucose checks and placed on basal-bolus therapy with insulin glargine and insulin aspart. The patient then titrated his basal-bolus insulin for 6 weeks but stated his blood sugars were consistently elevated (reaching 600 mg/dL); therefore, he self-reinitiated the insulin pump. After restarting the insulin pump, the clinic made several attempts to follow-up with the patient, but none were successful. He was subsequently dismissed from the clinic following his admission to a local nursing home.
The patient was reestablished at the clinic in 2010 (about 1 year after dismissal). He reported discontinuing the insulin pump and using insulin glargine and insulin aspart injections but was self-adjusting insulin glargine based on readings. He was told not to self-adjust insulin glargine dose and was given a sliding scale for self-adjustment of his insulin aspart dose based on blood glucose readings. Since the reestablished visit, both insulin therapies were titrated without much success in controlling his blood glucose levels. He was also advised to check his fasting blood glucose (FBG) more often and was demonstrated correct insulin drawing technique.
At a follow-up visit in August 2012, the patient’s A1c was 10.7%, and FBG readings ranged from 108 mg/dL to 555 mg/dL. Goal A1c was between 8% and 8.5% per VA/DoD diabetes guidelines.5 After a discussion with the patient’s wife, it was discovered that the patient was improperly administrating his insulin. The patient had been administrating the insulin glargine and insulin aspart in the same syringe. Since the combined dose of insulin was greater than his syringe would allow, he adjusted the insulin glargine dose downward if more insulin aspart was needed per the sliding scale. He did this to avoid more injections than he thought were necessary. Based on his A1c and home blood glucose readings, it was also suspected that insulin doses were being missed. The patient and wife were instructed about the importance of adherence and not mixing these insulins in the same syringe.
At the most recent visit, the patient’s FBG readings (200 mg/dL-500 mg/dL) and A1c (10.7%) were still greatly elevated. He reported taking 40 units insulin glargine in the morning and 60 units at bedtime, along with 40 units insulin aspart plus sliding scale insulin (1:20 > 120 mg/dL) at breakfast and 40 to 70 units at lunch and supper. The patient reported compliance with insulin therapy; however, it was likely he was not dosing accurately, according to his sliding scale. He stated he was eating less and was worried about hypoglycemia. Due to the patient’s FBG and A1c still being elevated, insulin aspart was titrated again, which was closer to a 50% basal and 50% bolus regimen, and he was again educated about proper dosing.
DISCUSSION
Patients have many obstacles to managing their diseases. This is especially prevalent in patients with diabetes. These patients both experience the emotional stress of being diagnosed with diabetes and are given a wealth of information on diabetes, nutrition, therapy, and insulin-dosing technique at the same time. The information can be overwhelming for patients to hear and for the educator to present. Sometimes health care professionals (HCPs) overlook a patient’s hindrances due to the amount of information they have to give to the patient. For example, in this case, the patient was mixing insulin inappropriately, and it was overlooked by the HCP.
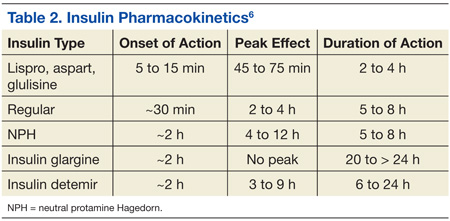
Insulin therapy has been used for several decades. It is obtained from either a pork pancreas or is chemically manufactured to be identical to human insulin. This can be achieved by recombinant DNA technology or chemical modification of pork insulin.4 Insulin is available as short-, intermediate-, or long-acting duration. The pharmacokinetics of available insulins is listed in Table 2.6
Some insulin can be mixed in the same syringe, but these mainly consist of the short- and intermediate-acting insulin. Insulin glargine, a long-acting formulation, should not be mixed with any other insulin due to its pharmacokinetic properties.7 Insulin glargine has been designed to have a low solubility at a neutral pH. After injection, the pH rises and leads to the formation of microprecipitates, causing a slow release of the insulin over 24 hours with no peak. If insulin glargine is mixed, it is likely the pH would be altered before entering the body. In addition, mixing insulin in the same syringe could likely contaminate the dose.
The maker of insulin glargine advises against mixing it with any other insulin.7 Several different studies have been done with admixtures of insulin glargine with short- or rapid-acting insulin. The studies revealed no differences in glycemic control, blunted and delayed rapid-acting insulin peak, the need for larger doses, or worsened glycemic control.8-12
Other education points about insulin administration that are often overlooked or sometimes ignored by patients and that require follow-up for compliance include the following:
• Manufacturers recommend discarding an open bottle of insulin at room temperature after 28 days.7
• Insulin should be kept in a temperature-controlled environment between 36°F and 86°F.4,7
• Rotation of injection sites is necessary to prevent lipodystrophy.4,7
• It is recommended that patients stick with 1 approved anatomical site for all insulin injections, such as the abdomen or leg, to maintain consistent pharmacokinetics.4,13,14
It is also important to know the constitution of the different insulins and whether they have been compromised. For example, if a clear solution insulin turns cloudy, it is considered compromised and should be thrown away.
CONCLUSION
Patients are diagnosed every day with diabetes, and many treatment regimens include insulin therapy. With the diagnosis of diabetes, patients are given extensive information on therapy, nutrition, preventative measures, and technique. Since controlling diabetes can call for intensive insulin therapy, medication administration instruction by HCPs is important. It is important to discuss in detail how the patient manages their insulin therapy at each visit so that issues will not be overlooked. Long-term, inappropriate use of insulin may lead to uncontrolled diabetes.
Diabetes is a complex disease to manage and takes a joint effort by both the HCP and patient to control. Patients need to understand the importance of compliance in all aspects of the disease, and the HCP needs to understand the importance of extensive counseling, including diet, exercise, and medication therapy.
Author disclosures
The authors report no actual or potential conflicts of interest with regard to this article.
Disclaimer
The opinions expressed herein are those of the authors and do not necessarily reflect those of Federal Practitioner, Frontline Medical Communications Inc., the U.S. Government, or any of its agencies. This article may discuss unlabeled or investigational use of certain drugs. Please review the complete prescribing information for specific drugs or drug combinations—including indications, contraindications, warnings, and adverse effects—before administering pharmacologic therapy to patients.
1. Centers for Disease Control and Prevention. National Diabetes Statistics Report: Estimates of Diabetes and Its Burden in the United States, 2014. Atlanta, GA: U.S. Department of Health and Human Services; 2014. http://www.cdc.gov/diabetes/pubs/statsreport14.htm. Updated July 28, 2014. Accessed August 12, 2014.
2. Roger VL, Go AS, Lloyd-Jones DM. et al; American Heart Association Statistics Committee and Stroke Statistics Subcommittee. Heart disease and stroke statistics—2012 update: A report from the American Heart Association. Circulation. 2012;125(1):e2-e220.
3. Inzucchi SE, Bergenstal RM, Buse JB, et al; American Diabetes Association (ADA); European Association for the Study of Diabetes (EASD). Management of hyperglycemia in type 2 diabetes: A patient-centered approach: Position statement of the American Diabetes Association (ADA) and the European Association for the Study of Diabetes (EASD). Diabetes Care. 2012;35(6):1364-1379.
4. American Diabetes Association. Insulin administration. Diabetes Care. 2004;27(suppl 1): S106-S109.
5. VA/DoD Clinical Practice Guidelines: Management of Diabetes Mellitus (DM). Version 4.0. Website: http://www.healthquality.va.gov/guidelines/CD/diabetes/DM2010_FUL-v4e.pdf. Updated August 2010. Accessed August 12, 2014.
6. McCulloch DK. General principles of isulin therapy in diabetes mellitus. UpToDate Website. http://www .uptodate.com /contents/general-principles-of-insulin-therapy-in-diabetes-mellitus. Accessed August 5, 2014.
7. Lantus [package insert]. Bridgewater, NJ: sanofi-aventis US; 2013.
8. Cengiz E, Tamborlane WV, Martin-Fredericksen M, Dziura J, Weinzimer SA. Early pharmacokinetic and pharmacodynamic effects of mixing lispro with glargine insulin: Results of glucose clamp studies in youth with type 1 diabetes. Diabetes Care. 2010;33(5):1009-1012.
9. Lucchesi MB, Komatsu WR, Gabbay MA, Dib SA. A 12-wk follow-up study to evaluate the effects of mixing insulin lispro and insulin glargine in young individuals with type 1 diabetes. Pediatr Diabetes. 2012;13(7):519-524.
10. Kaplan W, Rodriguez LM, Smith OE, Haymond MW, Heptulla RA. Effects of mixing glargine and short-acting insulin analogs on glucose control. Diabetes Care. 2004;27(11):2739-2740.
11. Fiallo-Scharer R, Horner B, McFann K, Walravens P, Chase HP. Mixing rapid-acting insulin analogs with insulin glargine in children with type 1 diabetes mellitus. J Pediatr. 2006;148(4):481-484.
12. Hassan K, Rodriguez LM, Johnson SE, Tadlock S, Heptulla RA. A randomized, controlled trial comparing twice-a-day insulin glargine mixed with rapid-acting insulin analogs versus standard neutral protamine Hagedorn (NPH) therapy in newly diagnosed type 1 diabetes. Pediatrics. 2008;121(3):e466 -e472.
13. Koivisto VA, Felig P. Alterations in insulin absorption and in blood glucose control associated with varying insulin injection sites in diabetic patients. Ann Intern Med. 1980;92(1):59-61.
14. Berger M, Cüppers HJ, Hegner H, Jörgens V, Berchtold P. Absorption kinetics and biologic effects of subcutaneously injected insulin preparations. Diabetes Care. 1982;5(2):77-91.
Diabetes mellitus is a growing problem in the U.S., with the number of disease-related complications on the rise. It affects 29.1 million people of all ages; however, only 21 million people are diagnosed, leaving 8.1 million people undiagnosed.1 Heart disease death rates among adults with diabetes are 2 to 4 times higher than the rates for adults without diabetes.2 At least 68% of patients with diabetes aged > 65 years die of some form of heart disease; 16% die of stroke.2
Type 2 diabetes remains the leading cause for cardiovascular disorders, blindness, end-stage renal disease, amputations, and hospitalizations.3 Due to the long-term complications of diabetes, it is important to help patients control their disease. However, diabetes control in patients can be difficult because of the broad disease education needed and its medication administration.
Insulin requires the most extensive instruction when educating patients with diabetes. Specifically, patient counseling needs to incorporate the importance of proper insulin administration. If patients are not properly administering their insulin, controlling their diabetes will be very difficult. Many clinicians know to educate the patient about drawing insulin into a syringe and how to inject insulin properly. However, clinicians do not always think about other aspects of insulin administration education, such as the mixing of different insulins in 1 syringe. Patients and family members need to be taught about the types of insulins that can and cannot be mixed. The American Diabetes Association (ADA) provides recommendations on the appropriate time to mix insulin and the types of insulin that can and cannot be mixed (Table 1).4
CASE REPORT
A white male, aged 69 years, presented to a pharmacist-run pharmacotherapy clinic for a follow-up appointment for uncontrolled diabetes. The patient’s wife, who managed his medications, accompanied him. Significant past medical history included diabetes, nephropathy, retinopathy, degenerative joint disease, migraines, gastroesophageal reflux disease, depression, posttraumatic stress disorder, hyperlipidemia, hypertension, lumbago, panic attacks, medication noncompliance, status post cerebral vascular accident, and renal insufficiency.
The patient had a long history of type 2 diabetes, and his insulin had been titrated multiple times since he was established in this clinic in 2009. At his establishing visit, he was taken off his insulin pump due to noncompliance with blood glucose checks and placed on basal-bolus therapy with insulin glargine and insulin aspart. The patient then titrated his basal-bolus insulin for 6 weeks but stated his blood sugars were consistently elevated (reaching 600 mg/dL); therefore, he self-reinitiated the insulin pump. After restarting the insulin pump, the clinic made several attempts to follow-up with the patient, but none were successful. He was subsequently dismissed from the clinic following his admission to a local nursing home.
The patient was reestablished at the clinic in 2010 (about 1 year after dismissal). He reported discontinuing the insulin pump and using insulin glargine and insulin aspart injections but was self-adjusting insulin glargine based on readings. He was told not to self-adjust insulin glargine dose and was given a sliding scale for self-adjustment of his insulin aspart dose based on blood glucose readings. Since the reestablished visit, both insulin therapies were titrated without much success in controlling his blood glucose levels. He was also advised to check his fasting blood glucose (FBG) more often and was demonstrated correct insulin drawing technique.
At a follow-up visit in August 2012, the patient’s A1c was 10.7%, and FBG readings ranged from 108 mg/dL to 555 mg/dL. Goal A1c was between 8% and 8.5% per VA/DoD diabetes guidelines.5 After a discussion with the patient’s wife, it was discovered that the patient was improperly administrating his insulin. The patient had been administrating the insulin glargine and insulin aspart in the same syringe. Since the combined dose of insulin was greater than his syringe would allow, he adjusted the insulin glargine dose downward if more insulin aspart was needed per the sliding scale. He did this to avoid more injections than he thought were necessary. Based on his A1c and home blood glucose readings, it was also suspected that insulin doses were being missed. The patient and wife were instructed about the importance of adherence and not mixing these insulins in the same syringe.
At the most recent visit, the patient’s FBG readings (200 mg/dL-500 mg/dL) and A1c (10.7%) were still greatly elevated. He reported taking 40 units insulin glargine in the morning and 60 units at bedtime, along with 40 units insulin aspart plus sliding scale insulin (1:20 > 120 mg/dL) at breakfast and 40 to 70 units at lunch and supper. The patient reported compliance with insulin therapy; however, it was likely he was not dosing accurately, according to his sliding scale. He stated he was eating less and was worried about hypoglycemia. Due to the patient’s FBG and A1c still being elevated, insulin aspart was titrated again, which was closer to a 50% basal and 50% bolus regimen, and he was again educated about proper dosing.
DISCUSSION
Patients have many obstacles to managing their diseases. This is especially prevalent in patients with diabetes. These patients both experience the emotional stress of being diagnosed with diabetes and are given a wealth of information on diabetes, nutrition, therapy, and insulin-dosing technique at the same time. The information can be overwhelming for patients to hear and for the educator to present. Sometimes health care professionals (HCPs) overlook a patient’s hindrances due to the amount of information they have to give to the patient. For example, in this case, the patient was mixing insulin inappropriately, and it was overlooked by the HCP.
Insulin therapy has been used for several decades. It is obtained from either a pork pancreas or is chemically manufactured to be identical to human insulin. This can be achieved by recombinant DNA technology or chemical modification of pork insulin.4 Insulin is available as short-, intermediate-, or long-acting duration. The pharmacokinetics of available insulins is listed in Table 2.6
Some insulin can be mixed in the same syringe, but these mainly consist of the short- and intermediate-acting insulin. Insulin glargine, a long-acting formulation, should not be mixed with any other insulin due to its pharmacokinetic properties.7 Insulin glargine has been designed to have a low solubility at a neutral pH. After injection, the pH rises and leads to the formation of microprecipitates, causing a slow release of the insulin over 24 hours with no peak. If insulin glargine is mixed, it is likely the pH would be altered before entering the body. In addition, mixing insulin in the same syringe could likely contaminate the dose.
The maker of insulin glargine advises against mixing it with any other insulin.7 Several different studies have been done with admixtures of insulin glargine with short- or rapid-acting insulin. The studies revealed no differences in glycemic control, blunted and delayed rapid-acting insulin peak, the need for larger doses, or worsened glycemic control.8-12
Other education points about insulin administration that are often overlooked or sometimes ignored by patients and that require follow-up for compliance include the following:
• Manufacturers recommend discarding an open bottle of insulin at room temperature after 28 days.7
• Insulin should be kept in a temperature-controlled environment between 36°F and 86°F.4,7
• Rotation of injection sites is necessary to prevent lipodystrophy.4,7
• It is recommended that patients stick with 1 approved anatomical site for all insulin injections, such as the abdomen or leg, to maintain consistent pharmacokinetics.4,13,14
It is also important to know the constitution of the different insulins and whether they have been compromised. For example, if a clear solution insulin turns cloudy, it is considered compromised and should be thrown away.
CONCLUSION
Patients are diagnosed every day with diabetes, and many treatment regimens include insulin therapy. With the diagnosis of diabetes, patients are given extensive information on therapy, nutrition, preventative measures, and technique. Since controlling diabetes can call for intensive insulin therapy, medication administration instruction by HCPs is important. It is important to discuss in detail how the patient manages their insulin therapy at each visit so that issues will not be overlooked. Long-term, inappropriate use of insulin may lead to uncontrolled diabetes.
Diabetes is a complex disease to manage and takes a joint effort by both the HCP and patient to control. Patients need to understand the importance of compliance in all aspects of the disease, and the HCP needs to understand the importance of extensive counseling, including diet, exercise, and medication therapy.
Author disclosures
The authors report no actual or potential conflicts of interest with regard to this article.
Disclaimer
The opinions expressed herein are those of the authors and do not necessarily reflect those of Federal Practitioner, Frontline Medical Communications Inc., the U.S. Government, or any of its agencies. This article may discuss unlabeled or investigational use of certain drugs. Please review the complete prescribing information for specific drugs or drug combinations—including indications, contraindications, warnings, and adverse effects—before administering pharmacologic therapy to patients.
1. Centers for Disease Control and Prevention. National Diabetes Statistics Report: Estimates of Diabetes and Its Burden in the United States, 2014. Atlanta, GA: U.S. Department of Health and Human Services; 2014. http://www.cdc.gov/diabetes/pubs/statsreport14.htm. Updated July 28, 2014. Accessed August 12, 2014.
2. Roger VL, Go AS, Lloyd-Jones DM. et al; American Heart Association Statistics Committee and Stroke Statistics Subcommittee. Heart disease and stroke statistics—2012 update: A report from the American Heart Association. Circulation. 2012;125(1):e2-e220.
3. Inzucchi SE, Bergenstal RM, Buse JB, et al; American Diabetes Association (ADA); European Association for the Study of Diabetes (EASD). Management of hyperglycemia in type 2 diabetes: A patient-centered approach: Position statement of the American Diabetes Association (ADA) and the European Association for the Study of Diabetes (EASD). Diabetes Care. 2012;35(6):1364-1379.
4. American Diabetes Association. Insulin administration. Diabetes Care. 2004;27(suppl 1): S106-S109.
5. VA/DoD Clinical Practice Guidelines: Management of Diabetes Mellitus (DM). Version 4.0. Website: http://www.healthquality.va.gov/guidelines/CD/diabetes/DM2010_FUL-v4e.pdf. Updated August 2010. Accessed August 12, 2014.
6. McCulloch DK. General principles of isulin therapy in diabetes mellitus. UpToDate Website. http://www .uptodate.com /contents/general-principles-of-insulin-therapy-in-diabetes-mellitus. Accessed August 5, 2014.
7. Lantus [package insert]. Bridgewater, NJ: sanofi-aventis US; 2013.
8. Cengiz E, Tamborlane WV, Martin-Fredericksen M, Dziura J, Weinzimer SA. Early pharmacokinetic and pharmacodynamic effects of mixing lispro with glargine insulin: Results of glucose clamp studies in youth with type 1 diabetes. Diabetes Care. 2010;33(5):1009-1012.
9. Lucchesi MB, Komatsu WR, Gabbay MA, Dib SA. A 12-wk follow-up study to evaluate the effects of mixing insulin lispro and insulin glargine in young individuals with type 1 diabetes. Pediatr Diabetes. 2012;13(7):519-524.
10. Kaplan W, Rodriguez LM, Smith OE, Haymond MW, Heptulla RA. Effects of mixing glargine and short-acting insulin analogs on glucose control. Diabetes Care. 2004;27(11):2739-2740.
11. Fiallo-Scharer R, Horner B, McFann K, Walravens P, Chase HP. Mixing rapid-acting insulin analogs with insulin glargine in children with type 1 diabetes mellitus. J Pediatr. 2006;148(4):481-484.
12. Hassan K, Rodriguez LM, Johnson SE, Tadlock S, Heptulla RA. A randomized, controlled trial comparing twice-a-day insulin glargine mixed with rapid-acting insulin analogs versus standard neutral protamine Hagedorn (NPH) therapy in newly diagnosed type 1 diabetes. Pediatrics. 2008;121(3):e466 -e472.
13. Koivisto VA, Felig P. Alterations in insulin absorption and in blood glucose control associated with varying insulin injection sites in diabetic patients. Ann Intern Med. 1980;92(1):59-61.
14. Berger M, Cüppers HJ, Hegner H, Jörgens V, Berchtold P. Absorption kinetics and biologic effects of subcutaneously injected insulin preparations. Diabetes Care. 1982;5(2):77-91.
The VALOR Program: Preparing Nursing Students to Care for Our Veterans
The VA Learning Opportunity Residency (VALOR) program is a prelicensure experience with a nurse preceptor for rising senior students enrolled in a bachelor of science in nursing program. Students must have a minimum 3.0 grade-point average to apply. The program provides 800 hours of paid learning experiences in diverse didactic and hands-on clinical situations. The first 400 hours of the program (10 weeks) occur over the summer, and the second 400 hours take place during the fall and spring semesters of the student’s last year of school.1 During the last 400 hours, students are placed in the areas they are interested in working as new graduate nurses.
The aim of the Salem VALOR program is to develop the next generation of VAMC nurses by recruiting new graduate nurses. The Salem VAMC structures the VALOR program to meet the needs of both the students and the facility. According to Glenda Fuller, the student programs manager for the VA, national VALOR retention rates from 2007 to 2011 have averaged 38%. However, more applicants apply for new graduate nurse positions than are available. Included in the VHA Directive 2011-039, facilities that hire a nurse with ≤ 1 year of experience must enroll them in a yearlong transition-to-practice program.2 Therefore, facilities may limit the number of new graduate nurse positions.
On entry into the VALOR program, participants write a journal entry regarding their fears and concerns about becoming a new graduate nurse. In addition, each student turns in a written reflection about their experiences each week and participates in daily group discussions with the program coordinator. The last day of the summer portion of the program, students again write about their fears and concerns about becoming a new graduate nurse. After reviewing the VALOR journals, conducting focus groups, and taking notes during the daily meetings, the authors describe the following VALOR experience from the summer of 2013 at the Salem VAMC.
Preparing New Graduates
Hospitals are under pressure to provide high-quality nursing care despite hiring new graduate nurses who are unfamiliar and inexperienced in caring for patients’ complex health care needs. New graduate nurses currently make up more than 10% of hospital nursing staff, and that number is expected to grow as baby boomers retire.3 Boswell and colleagues suggest that those new graduate nurses are unprepared for the registered nurse role.4 Identifying strategies to facilitate the transition from student to the new graduate nurse role will likely decrease attrition rates and increase the effectiveness and the quality of patient care. Nursing programs, such as the VALOR, can ease the transition from the classroom to the working environment.5
This result is evident when observing how VALOR students enhance their nursing skills after the 10-week summer program. VALOR participant Andrea King published her summer experience at the Salem VAMC in The Torch, the Virginia Nursing Students’ Association newsletter.6 “I had so much practice and eventually confidence in my nursing skills,” she wrote, “that I had the autonomy and independence to feel like I was working as an actual nurse.”6
The VALOR Experience
During the summer months, senior nursing students have the opportunity to go on rounds with the chaplain, work with nurse practitioners, attend outings with mental health patients, participate in home health visits, interact with patients in groups, and rotate to different hospital units. Students attend FranklinCovey classes (which specialize in employee performance improvement), participate in an evidence-based practice (EBP) project (which helps them to learn about teamwork), and collaborate with interdisciplinary health care professionals. At the end of the summer, students present their team EBP project to the nurse executive committee. Presentation experience assists students in acquiring public speaking skills. Students are nervous about presenting to a room full of executives. However, they learn to depend on one another and to strengthen weaknesses and build on strengths.
When high-performing students come together as one cohort, this dynamic poses challenges for the VALOR participants. One student described her vulnerability in relation to her VALOR peers as “the hardest hit to my self-confidence has been working with such intelligent and accomplished cohorts.” Another student found that even though she was at the top of her class, working with the other VALORs “challenged her self-confidence” because all the program participants were high-performing students. She found it pushed her to perform better. One person reflected, “I feel the VALOR experience has really given all of us the opportunity to unleash our full potential. I have no doubt that these students will become future health care leaders.”
Building Skills
Learning new skills and interacting with physicians are stressful experiences for new graduate nurses.7 A study by Casey and colleagues suggests that new graduate nurses feel inadequate and lack self-confidence.8 VALOR participants share these concerns. The initial journal entries revealed fears of making a mistake, harming patients, fitting in to the work culture, working with doctors, feeling anxious about patient interactions, and performing clinical skills competently.
Initially, students focused on needing extensive practice with nursing skills as evidenced by one student’s comments, “I’m honestly concerned about some of the procedures; I’ve only put in 3 IVs during nursing school, I am not confident walking in to a room and performing a procedure on my own. I would be overwhelmed.” When considering RN-to-MD communication, one student commented, “I’m nervous, doctors can be very hard on new nurses, I’ve witnessed this over and over.”
During the first weeks, the participants discussed the fear of being “on their own” without the benefit of their instructor once they graduate. One person noted this feeling as “The seed of fear grows as graduation approaches.” This lack of self-confidence and feeling scared is a consistent issue with all the VALOR students the first day of the program.
During the program, VALOR students developed nursing skills and became certified in advanced cardiac life support (ACLS). One student suggested that the ACLS class was a great team builder and instilled confidence among the VALOR participants. Another student shared, “We all agreed that attaining this certification was a culmination of our overall VA experience.” A student who was working in an acute care area applied the newly learned ACLS skills the following week when a patient coded. The student’s journal reflected how preparation makes a difference and described his experience and knowing how to react as “powerful.”
The Reality of Nursing
The VALOR program helps connect the academic environment with the realities of the workplace. Wilson found bridging the theory-practice gap between school and workplace improves learning opportunities for students.9 Wilson also suggests that having peers to identify with helps to bridge the theory-practice gap.9 Journal entries reflected “the perfect hospital” of textbooks was different from working every day and “almost being a nurse.” During the VALOR program, students immerse themselves in the realistic nursing environment of staff shortages, equipment unavailability, disgruntled patients, and peer-to-peer communication that is not always civil. The 40-hour workweek provides a realistic hands-on view of nursing and introduces students to socializing as a nurse and the nursing work culture.
After the 2013 summer portion of the program, students were able to differentiate between the realities of the world of health care and the academic view of the health care environment. As students progressed over the summer, a noticeable transformation took place. The student who wrote about needing more skills practice on day 1 found that she was comfortable with injections, hanging IVs, and providing patient care at the end of week 3. Students grew more comfortable collaborating with doctors and other interdisciplinary professionals. They also became competent with basic nursing skills and had a realistic view of the nursing world.
In addition, students became aware of the emotional aspects of nursing. One student discussed making a difference in a veteran’s life after participating in a substance abuse group. “While I was on my way home I started thinking about those vets and their stories, and I started getting emotional. I just felt bad that after doing the great deed of fighting for our country that they became victims of substance abuse,” the student explained. “That afternoon, as I departed the vets, I left hopeful and realized I could make a difference in the life of a veteran.” Another student perceived that doctors were discussing a veteran’s terminal lung cancer “nonchalantly” and reflected, “though I do recognize that a certain degree of disconnection must take place, a certain measure of empathy must remain at all times to effect positive outcomes in the patient’s health.”
VALOR students noted that the program gave them exposure to different areas of nursing. This experience assisted them in deciding on an area of nursing interest. One student who always wanted to be an emergency department nurse found that after that rotation, she was not “cut out to be an emergency department nurse.” Some students came into the program thinking they knew precisely what they wanted to do following graduation, but found a new interest.
Daily Debriefings
Through daily debriefing discussions, students learn about best practices, patient advocacy, nursing leadership, and communication skills. Some have said that it has helped them “get through the day” knowing they had an outlet to review their experiences with VALOR peers. Discussions focus on both the positive and negative aspects of their day.
Students found that group discussions bonded them as a team and allowed them to share their feelings openly. One student found, “What really impacted me was just the amount of learning I received from my VALOR friends.” The group discussions and projects allow students who may typically work in isolation to come together as a team, providing a safe outlet for reflection and self-expression. Meeting daily with peers to share personal experiences increases team cohesion. Research suggests that students learn from their peers.10,11 Working closely with these students, the benefit of peer-to-peer learning was obvious. Students support and teach one another in a nonthreatening environment, which enhances their learning process.
End of the Summer Journey
For the students’ final journal entry, they are asked to identify their greatest fear from week 1 and describe how that has changed by week 10. Journal entries indicated that the students were no longer afraid of being a new nurse, and doctors were “not so scary anymore.” Students already know that nursing is not “going to be peachy,” but participating in the VALOR program allayed their worst fears. One student wrote, “When I had the experiences of doctors, dieticians, and physical therapists asking me questions about my patient and taking what I said seriously, it really boosted my confidence.”
Students seemed less nervous taking on the new graduate nurse role, because they practiced skills and experienced the real life of a nurse. The student who was worried about starting IVs stated, “It is second nature now.” The student who was worried about talking to doctors is now paging and communicating with them in teams. “I feel that I’m more likely to converse with other members of the health care team because of this experience,” one student reported. Another student experienced being afraid of practicing clinical skills because of her lack of experience. “I had put in only 3 IVs previously. I had never seen a cardiac catheterization,” she related. “I had never run an electrocardiography (EKG), and I had never had an opportunity to see many of the things I have seen. I was afraid of taking a full patient load, and I was apprehensive about simple things such as hanging IV medications. I was unsure of myself, and desperately needed practice. I lacked confidence, and needed to gain experience. Now, looking back, those things seem silly.”
Coming out of this program, one student suggested, “I have found that my expectations were blown away.” The 2013 cohort walked away from the summer portion of the program with ACLS training, EKG classes, interdisciplinary team experiences, FranklinCovey personal development seminars, and most of all, hands-on experience that provided these future nurses with confidence in their abilities. Participants felt that after this summer they would be “a step ahead” of their peers when they returned to school in the fall. One student related, after returning to school, “My professor asked me to help teach an EKG class since I was ACLS certified.”
Conclusion
The goal of sharing the VALOR program and students’ experiences at the Salem VAMC is to highlight how students grow clinically and professionally. The program is not a single-person endeavor. The chief nurse executive, managers, interdisciplinary health care professionals, and nursing preceptors support the program. Gaining stakeholder buy-in for the program results in positive experiences for both students and veterans.
Taking top-performing students and grouping them as a cohort creates a learning experience for students and benefits the facility. Students develop essential nursing skills, which assist their transition to the new graduate nurse role. In the words of one student, “As this experience comes to a close, I find myself increasingly apprehensive of finishing. The VALOR position has been like a dream come true for me. I have developed as a person and a future nurse.” As the new generation of nurses, the VALORs provide the institution with fresh eyes and new ideas on how to improve the system and to care for our nation’s veterans.
Author disclosures
The authors report no actual or potential conflicts of interest with regard to this article.
Disclaimer
The opinions expressed herein are those of the authors and do not necessarily reflect those of Federal Practitioner, Frontline Medical Communications Inc., the U.S. Government, or any of its agencies. This article may discuss unlabeled or investigational use of certain drugs. Please review the complete prescribing information for specific drugs or drug combinations—including indications, contraindications, warnings, and adverse effects—before administering pharmacologic therapy to patients.
1. Shipman D, Garrison M, Hooten J. VALOR: A win-win for VA medical centers and BSN students. Fed Pract. 2010;27(7):31-33.
2. U.S. Department of Veterans Affairs. VHA registered nurses (RN) transition-to-practice program. Veterans Health Administration Website.
http://www1.va.gov/vhapublications/ViewPublication.asp?pub_ID=2469. Published November 23, 2011. Accessed July 1, 2014.
3. Nursing Executive Center. Bridging the Preparation-Practice Gap. Vol. 1: Quantifying new graduate nurse improvement needs. Washington, DC: The Advisory Board Company; 2008. https://hci-portal.hci.utah.edu/sites/hch-nursing/staff-development/Shared%20Documents/Manager%20Tools/Published%20Articles/Bridging%20the%20Preparation%20Practice%20Gap.10.10.pdf. Published 2008. Accessed July 1, 2014.
4. Boswell S, Lowry LW, Wilhoit K. New nurses’ perceptions of nursing practice and quality patient care. J Nurs Care Qual. 2004;19(1):76-81.
5. Rhoads J, Sensenig K, Ruth-Sahd L, Thompson E. Nursing externship: A collaborative endeavor between nursing education and nursing administration. Dimens Crit Care Nurs. 2003;22(6):255-258.
6. King A. My summer externship experience. The Torch. Virginia Nursing Students’ Association Newsletter. Fall 2013. VNSA Website. http://www.vnsa.us/uploads/1/9/0/2/19025131/fall2013torch-final-1.pdf. Accessed July 1, 2014.
7. Oermann MH, Moffitt-Wolf A. New graduates’ perceptions of clinical practice. J Contin Educ Nurs. 1997;28(1):20-25.
8. Casey K, Fink R, Krugman M, Propst J. The graduate nurse experience. J Nurs Adm. 2004;34(6):303-311.
9. Wilson J. Bridging the theory practice gap. Aust Nurs J. 2008;16(4):25.
10. Etheridge SA. Learning to think like a nurse: Stories from new nurse graduates. J Contin Educ Nurs. 2007;38(1):24-30.
11. Roberts D. Friendship fosters learning: The importance of friendship in clinical practice. Nurse Educ Pract. 2009;9(6):367-371.
The VA Learning Opportunity Residency (VALOR) program is a prelicensure experience with a nurse preceptor for rising senior students enrolled in a bachelor of science in nursing program. Students must have a minimum 3.0 grade-point average to apply. The program provides 800 hours of paid learning experiences in diverse didactic and hands-on clinical situations. The first 400 hours of the program (10 weeks) occur over the summer, and the second 400 hours take place during the fall and spring semesters of the student’s last year of school.1 During the last 400 hours, students are placed in the areas they are interested in working as new graduate nurses.
The aim of the Salem VALOR program is to develop the next generation of VAMC nurses by recruiting new graduate nurses. The Salem VAMC structures the VALOR program to meet the needs of both the students and the facility. According to Glenda Fuller, the student programs manager for the VA, national VALOR retention rates from 2007 to 2011 have averaged 38%. However, more applicants apply for new graduate nurse positions than are available. Included in the VHA Directive 2011-039, facilities that hire a nurse with ≤ 1 year of experience must enroll them in a yearlong transition-to-practice program.2 Therefore, facilities may limit the number of new graduate nurse positions.
On entry into the VALOR program, participants write a journal entry regarding their fears and concerns about becoming a new graduate nurse. In addition, each student turns in a written reflection about their experiences each week and participates in daily group discussions with the program coordinator. The last day of the summer portion of the program, students again write about their fears and concerns about becoming a new graduate nurse. After reviewing the VALOR journals, conducting focus groups, and taking notes during the daily meetings, the authors describe the following VALOR experience from the summer of 2013 at the Salem VAMC.
Preparing New Graduates
Hospitals are under pressure to provide high-quality nursing care despite hiring new graduate nurses who are unfamiliar and inexperienced in caring for patients’ complex health care needs. New graduate nurses currently make up more than 10% of hospital nursing staff, and that number is expected to grow as baby boomers retire.3 Boswell and colleagues suggest that those new graduate nurses are unprepared for the registered nurse role.4 Identifying strategies to facilitate the transition from student to the new graduate nurse role will likely decrease attrition rates and increase the effectiveness and the quality of patient care. Nursing programs, such as the VALOR, can ease the transition from the classroom to the working environment.5
This result is evident when observing how VALOR students enhance their nursing skills after the 10-week summer program. VALOR participant Andrea King published her summer experience at the Salem VAMC in The Torch, the Virginia Nursing Students’ Association newsletter.6 “I had so much practice and eventually confidence in my nursing skills,” she wrote, “that I had the autonomy and independence to feel like I was working as an actual nurse.”6
The VALOR Experience
During the summer months, senior nursing students have the opportunity to go on rounds with the chaplain, work with nurse practitioners, attend outings with mental health patients, participate in home health visits, interact with patients in groups, and rotate to different hospital units. Students attend FranklinCovey classes (which specialize in employee performance improvement), participate in an evidence-based practice (EBP) project (which helps them to learn about teamwork), and collaborate with interdisciplinary health care professionals. At the end of the summer, students present their team EBP project to the nurse executive committee. Presentation experience assists students in acquiring public speaking skills. Students are nervous about presenting to a room full of executives. However, they learn to depend on one another and to strengthen weaknesses and build on strengths.
When high-performing students come together as one cohort, this dynamic poses challenges for the VALOR participants. One student described her vulnerability in relation to her VALOR peers as “the hardest hit to my self-confidence has been working with such intelligent and accomplished cohorts.” Another student found that even though she was at the top of her class, working with the other VALORs “challenged her self-confidence” because all the program participants were high-performing students. She found it pushed her to perform better. One person reflected, “I feel the VALOR experience has really given all of us the opportunity to unleash our full potential. I have no doubt that these students will become future health care leaders.”
Building Skills
Learning new skills and interacting with physicians are stressful experiences for new graduate nurses.7 A study by Casey and colleagues suggests that new graduate nurses feel inadequate and lack self-confidence.8 VALOR participants share these concerns. The initial journal entries revealed fears of making a mistake, harming patients, fitting in to the work culture, working with doctors, feeling anxious about patient interactions, and performing clinical skills competently.
Initially, students focused on needing extensive practice with nursing skills as evidenced by one student’s comments, “I’m honestly concerned about some of the procedures; I’ve only put in 3 IVs during nursing school, I am not confident walking in to a room and performing a procedure on my own. I would be overwhelmed.” When considering RN-to-MD communication, one student commented, “I’m nervous, doctors can be very hard on new nurses, I’ve witnessed this over and over.”
During the first weeks, the participants discussed the fear of being “on their own” without the benefit of their instructor once they graduate. One person noted this feeling as “The seed of fear grows as graduation approaches.” This lack of self-confidence and feeling scared is a consistent issue with all the VALOR students the first day of the program.
During the program, VALOR students developed nursing skills and became certified in advanced cardiac life support (ACLS). One student suggested that the ACLS class was a great team builder and instilled confidence among the VALOR participants. Another student shared, “We all agreed that attaining this certification was a culmination of our overall VA experience.” A student who was working in an acute care area applied the newly learned ACLS skills the following week when a patient coded. The student’s journal reflected how preparation makes a difference and described his experience and knowing how to react as “powerful.”
The Reality of Nursing
The VALOR program helps connect the academic environment with the realities of the workplace. Wilson found bridging the theory-practice gap between school and workplace improves learning opportunities for students.9 Wilson also suggests that having peers to identify with helps to bridge the theory-practice gap.9 Journal entries reflected “the perfect hospital” of textbooks was different from working every day and “almost being a nurse.” During the VALOR program, students immerse themselves in the realistic nursing environment of staff shortages, equipment unavailability, disgruntled patients, and peer-to-peer communication that is not always civil. The 40-hour workweek provides a realistic hands-on view of nursing and introduces students to socializing as a nurse and the nursing work culture.
After the 2013 summer portion of the program, students were able to differentiate between the realities of the world of health care and the academic view of the health care environment. As students progressed over the summer, a noticeable transformation took place. The student who wrote about needing more skills practice on day 1 found that she was comfortable with injections, hanging IVs, and providing patient care at the end of week 3. Students grew more comfortable collaborating with doctors and other interdisciplinary professionals. They also became competent with basic nursing skills and had a realistic view of the nursing world.
In addition, students became aware of the emotional aspects of nursing. One student discussed making a difference in a veteran’s life after participating in a substance abuse group. “While I was on my way home I started thinking about those vets and their stories, and I started getting emotional. I just felt bad that after doing the great deed of fighting for our country that they became victims of substance abuse,” the student explained. “That afternoon, as I departed the vets, I left hopeful and realized I could make a difference in the life of a veteran.” Another student perceived that doctors were discussing a veteran’s terminal lung cancer “nonchalantly” and reflected, “though I do recognize that a certain degree of disconnection must take place, a certain measure of empathy must remain at all times to effect positive outcomes in the patient’s health.”
VALOR students noted that the program gave them exposure to different areas of nursing. This experience assisted them in deciding on an area of nursing interest. One student who always wanted to be an emergency department nurse found that after that rotation, she was not “cut out to be an emergency department nurse.” Some students came into the program thinking they knew precisely what they wanted to do following graduation, but found a new interest.
Daily Debriefings
Through daily debriefing discussions, students learn about best practices, patient advocacy, nursing leadership, and communication skills. Some have said that it has helped them “get through the day” knowing they had an outlet to review their experiences with VALOR peers. Discussions focus on both the positive and negative aspects of their day.
Students found that group discussions bonded them as a team and allowed them to share their feelings openly. One student found, “What really impacted me was just the amount of learning I received from my VALOR friends.” The group discussions and projects allow students who may typically work in isolation to come together as a team, providing a safe outlet for reflection and self-expression. Meeting daily with peers to share personal experiences increases team cohesion. Research suggests that students learn from their peers.10,11 Working closely with these students, the benefit of peer-to-peer learning was obvious. Students support and teach one another in a nonthreatening environment, which enhances their learning process.
End of the Summer Journey
For the students’ final journal entry, they are asked to identify their greatest fear from week 1 and describe how that has changed by week 10. Journal entries indicated that the students were no longer afraid of being a new nurse, and doctors were “not so scary anymore.” Students already know that nursing is not “going to be peachy,” but participating in the VALOR program allayed their worst fears. One student wrote, “When I had the experiences of doctors, dieticians, and physical therapists asking me questions about my patient and taking what I said seriously, it really boosted my confidence.”
Students seemed less nervous taking on the new graduate nurse role, because they practiced skills and experienced the real life of a nurse. The student who was worried about starting IVs stated, “It is second nature now.” The student who was worried about talking to doctors is now paging and communicating with them in teams. “I feel that I’m more likely to converse with other members of the health care team because of this experience,” one student reported. Another student experienced being afraid of practicing clinical skills because of her lack of experience. “I had put in only 3 IVs previously. I had never seen a cardiac catheterization,” she related. “I had never run an electrocardiography (EKG), and I had never had an opportunity to see many of the things I have seen. I was afraid of taking a full patient load, and I was apprehensive about simple things such as hanging IV medications. I was unsure of myself, and desperately needed practice. I lacked confidence, and needed to gain experience. Now, looking back, those things seem silly.”
Coming out of this program, one student suggested, “I have found that my expectations were blown away.” The 2013 cohort walked away from the summer portion of the program with ACLS training, EKG classes, interdisciplinary team experiences, FranklinCovey personal development seminars, and most of all, hands-on experience that provided these future nurses with confidence in their abilities. Participants felt that after this summer they would be “a step ahead” of their peers when they returned to school in the fall. One student related, after returning to school, “My professor asked me to help teach an EKG class since I was ACLS certified.”
Conclusion
The goal of sharing the VALOR program and students’ experiences at the Salem VAMC is to highlight how students grow clinically and professionally. The program is not a single-person endeavor. The chief nurse executive, managers, interdisciplinary health care professionals, and nursing preceptors support the program. Gaining stakeholder buy-in for the program results in positive experiences for both students and veterans.
Taking top-performing students and grouping them as a cohort creates a learning experience for students and benefits the facility. Students develop essential nursing skills, which assist their transition to the new graduate nurse role. In the words of one student, “As this experience comes to a close, I find myself increasingly apprehensive of finishing. The VALOR position has been like a dream come true for me. I have developed as a person and a future nurse.” As the new generation of nurses, the VALORs provide the institution with fresh eyes and new ideas on how to improve the system and to care for our nation’s veterans.
Author disclosures
The authors report no actual or potential conflicts of interest with regard to this article.
Disclaimer
The opinions expressed herein are those of the authors and do not necessarily reflect those of Federal Practitioner, Frontline Medical Communications Inc., the U.S. Government, or any of its agencies. This article may discuss unlabeled or investigational use of certain drugs. Please review the complete prescribing information for specific drugs or drug combinations—including indications, contraindications, warnings, and adverse effects—before administering pharmacologic therapy to patients.
1. Shipman D, Garrison M, Hooten J. VALOR: A win-win for VA medical centers and BSN students. Fed Pract. 2010;27(7):31-33.
2. U.S. Department of Veterans Affairs. VHA registered nurses (RN) transition-to-practice program. Veterans Health Administration Website.
http://www1.va.gov/vhapublications/ViewPublication.asp?pub_ID=2469. Published November 23, 2011. Accessed July 1, 2014.
3. Nursing Executive Center. Bridging the Preparation-Practice Gap. Vol. 1: Quantifying new graduate nurse improvement needs. Washington, DC: The Advisory Board Company; 2008. https://hci-portal.hci.utah.edu/sites/hch-nursing/staff-development/Shared%20Documents/Manager%20Tools/Published%20Articles/Bridging%20the%20Preparation%20Practice%20Gap.10.10.pdf. Published 2008. Accessed July 1, 2014.
4. Boswell S, Lowry LW, Wilhoit K. New nurses’ perceptions of nursing practice and quality patient care. J Nurs Care Qual. 2004;19(1):76-81.
5. Rhoads J, Sensenig K, Ruth-Sahd L, Thompson E. Nursing externship: A collaborative endeavor between nursing education and nursing administration. Dimens Crit Care Nurs. 2003;22(6):255-258.
6. King A. My summer externship experience. The Torch. Virginia Nursing Students’ Association Newsletter. Fall 2013. VNSA Website. http://www.vnsa.us/uploads/1/9/0/2/19025131/fall2013torch-final-1.pdf. Accessed July 1, 2014.
7. Oermann MH, Moffitt-Wolf A. New graduates’ perceptions of clinical practice. J Contin Educ Nurs. 1997;28(1):20-25.
8. Casey K, Fink R, Krugman M, Propst J. The graduate nurse experience. J Nurs Adm. 2004;34(6):303-311.
9. Wilson J. Bridging the theory practice gap. Aust Nurs J. 2008;16(4):25.
10. Etheridge SA. Learning to think like a nurse: Stories from new nurse graduates. J Contin Educ Nurs. 2007;38(1):24-30.
11. Roberts D. Friendship fosters learning: The importance of friendship in clinical practice. Nurse Educ Pract. 2009;9(6):367-371.
NP and PA Scope of Practice
Nurse practitioners (NPs) and physician assistants (PAs) provide healthcare in numerous environments internationally and in the United States.[1, 2] However, their role in the inpatient medicine setting is not well described.[2] In the United States, there are more than 157,000 NPs and 85,000 PAs with projected increases.[3, 4] Although both professions provide direct medical care, there are key differences.[1, 3, 4, 5] NPs typically complete a master's or doctoral degree with advanced clinical training beyond nursing. PAs complete at least 2 years of college courses similar to premedical school requirements. PA programs use a medical school‐based curriculum and train for about 2 years before awarding a master's degree. NPs are regulated through state nursing boards, whereas PAs are regulated through state licensing or medical boards. NPs and PAs have different, yet overlapping scopes of practice. A key difference is that PAs can only practice collaborating with a physician.[5, 6] Overall, both have been shown to provide healthcare that is similar in quality to physicians in specific primary care and surgical settings.[2]
NPs and PAs, often referred to as advanced practice providers (APPs), are employed primarily in outpatient clinic settings providing direct patient care. Most APP studies have focused on the outpatient setting, despite nearly a third of US healthcare expenditure for hospital care.[2, 7] Little is known about APP involvement, specific roles, or impact on outcomes in inpatient medicine settings where they are often referred to as NP or PA hospitalists.[2, 8, 9, 10]
The Veterans Health Administration (VHA) is 1 of the largest employers of APPs, with 3.6% of all NPs and 2.1% of all PAs reported to practice in the VHA.[11, 12, 13] As the largest fully integrated healthcare system in the US, the VHA had 8.8 million veterans enrolled and 703,500 inpatient admissions in 2012.[14] Although this makes the VHA an ideal environment to study the role of APPs, few studies have done so.[13, 15, 16, 17, 18, 19] Although studies have compared NPs and PAs to physicians, very little is known about how NPs differ from PAs when practicing in the same environment.
Our objective was to describe the scope of practice, defined as activities that an individual healthcare practitioner is licensed to perform, of NPs and PAs in the inpatient medicine setting and in the VHA. A secondary objective was to explore important outcomes that could potentially be affected by the presence of NPs and PAs on inpatient medicine.
METHODS
The Organizational Factors and Inpatient Medical Care Quality and Efficiency (OFIM) study provides a basis for this study with detail published elsewhere.[20] The OFIM study was conducted between 2010 and 2011 to evaluate quality of care in VHA inpatient medicine surveying chiefs of medicine (COM), inpatient medicine nurse managers (NM), attending physicians, and extant VHA survey data. The COM is the senior attending physician in charge of departments of medicine that include most medical subspecialties within the VHA medical centers. We used the subset of questions specific to NPs and PAs from the COM and NM surveys. Both COMs and NMs answered identical questions for NPs and PAs in 2 separate sections to avoid overlap of responses. NM survey responses were only used for the coordination of care regression model. Surveys were conducted by e‐mail with up to 4 reminders and a subsequent paper mailing. The inpatient medicine service included adult general internal medicine, medical subspecialties, and critical care. The study was approved by the institutional review boards of the VA Boston Healthcare System, the University of Iowa, and the Iowa City VA Healthcare System.
Measurements
To create our primary variable of interestNP and PA employmentwe used the COM survey. Respondents indicated the number and full‐time employee equivalent (FTEE) values for APPs on inpatient medicine. Based on responses, we created a categorical variable with 4 options: (1) facilities with NPs only, (2) facilities with PAs only, (3) facilities with both NPs and PAs, and (4) facilities with neither NPs nor PAs. We selected 3 outcomes that could potentially be affected by the presence of NPs and PAs on inpatient medicine: patient satisfaction, registered nurse (RN) satisfaction, and coordination of care. Patient satisfaction has been shown to improve with NPs and PAs in prior studies, and improving coordination of care has been a stated goal of medical centers in hiring NPs and PAs.[2, 9] Based on our personal experience and previous studies that have shown that nurses report better communication with NPs than physicians,[21] and that NPs retain a visible nursing component in their NP role,[22] we hypothesized that nurse satisfaction on inpatient medicine would improve with the presence of NPs and PAs.
Patient satisfaction was obtained from the 2010 VHA Survey of Healthcare Experiences of Patients (SHEP).[23] The average response rate was 45%. Approximately half the questions on the SHEP are identical to the Hospital Consumer Assessment of Healthcare Providers and Systems survey (HCAHPS).[24] We examined 2 items: an overall rating and willingness to recommend the facility. For the overall rating, patients rated their hospitalization on a scale from 0 (worst hospital possible) to 10 (best hospital possible). Following HCAHPS guidelines, responses of either 9 or 10 were coded as positive and all other nonmissing responses were coded 0. For willingness to recommend, patients were asked Would you recommend this hospital to your friends and family? using a 4‐point response scale. Responses of definitely and probably no were coded as 0, and probably and definitely yes were coded as 1.
Nurse satisfaction was obtained from the 2011 Veterans Administration Nursing Outcomes Database, an annual survey of VHA nurses that includes demographic, work environment and satisfaction data.[25] The survey, a modified version of the Practice Environment Scale,[26] had a response rate of 52.9% (out of 51,870). For this analysis, we selected only inpatient medicine RNs. We used 2 measures: overall job satisfaction and collegial RN/MD (physician) relations. The former was assessed using the item Compared to what you think it should be, what is your current overall level of satisfaction with your job? The RN/MD relations scale had 3 items, including Physicians and nurses have good working relationships. Both items were evaluated on a similar 5‐point response scale.
Coordination of care was assessed from COM and NM surveys. Overall coordination was evaluated from the COM survey using 1 of 8 items in a question about care coordination, In the past month, how would you rate the following aspects of coordination of patient care inpatient coordination overall. Overall coordination was also evaluated from the NM survey using a similar item. Discharge coordination was evaluated only from the NM survey using 1 of 8 items, Thinking about your experiences during the past month, how would you rate the following aspects of the coordination of patient care related to the discharge process on your inpatient medicine unit discharge coordination overall. When a service had more than 1 response from the NM survey, we took an average of responses to represent the mean score. Responses for all questions ranged from 1 for poor to 5 for excellent (for all of the questions see Supporting Information, Appendix 1, in the online version of this article).
Last, we modeled for several contextual features that could influence outcomes: geographic region as a 4‐item categorical variable; teaching affiliation as a dichotomous variable based on whether the hospital was a member of the Council of Teaching Hospitals, urban or rural status, and facility size as a continuous variable using the number of inpatient medicine service beds.
Statistical Analysis
Descriptive bivariate analyses used t tests, 2, or 2‐tailed Fisher tests when appropriate to compare NP and PA autonomy, tasks, location of care, work schedule, clinical workload, organizational characteristics (ie, academic, urban, facility complexity, inpatient medicine team structure), and performance evaluations.
Next, we examined whether any of the contextual characteristics were associated with use of NPs or PAs using inferential statistics. For patient satisfaction, we developed a hierarchical linear model (HLM) that nested patients within facilities. We controlled for patient age, sex, health status, and length of stay. For nurse satisfaction, individual responses of RNs also were analyzed using the HLM. We controlled for whether the nurse had a leadership position, worked during the daily shift, and job tenure. Ordinary least squares regression was used to examine the 3 measures of coordination from the COM and NM surveys. All analyses were performed using Stata version 12 (StataCorp, College Station, TX) and SAS version 9.2 (SAS Institute Inc., Cary, NC).
RESULTS
Of 123 inpatient medicine services that we surveyed, we included responses from the COMs of 118 services (response rate 95.2%); 5 responses were incomplete. Across 123 inpatient medicine services, we surveyed 264 nurse managers and received 198 responses (75.0%) from 114 inpatient medicine services. In the only model using NM responsesthe care coordination model104 inpatient medicine services had responses from both COM and NM surveys.
Of 118 VHA inpatient medicine services, 56 (47.5%) had APPs, of which 27 (48.2%) had NPs only, 15 (26.8%) had PAs only, and 14 (25.0%) had both NPs and PAs. FTEEs for NPs ranged from 0.5 to 7 (mean=2.22) and for PAs from 1 to 9 (mean=2.23) on the inpatient medicine service per hospital.
There were no significant differences on use of NPs and PAs by teaching affiliation, urban or rural setting, and geography. A significant difference was observed based on bed size (F[3,109]=5.13, P<0.001); facilities with both NPs and PAs had, on average, a larger number of inpatient beds (mean=79.0, standard deviation [SD]=32.3) compared to those without NPs or PAs (mean=50.1, SD=29.4) or with PAs only (mean=44.2, SD=20.5) using Tukey post hoc analysis.
The most common staffing model used staff (attending) physicians only working directly with APPs (N=29, 24.6%). Next most common was an academic model with staff physicians, housestaff, and APPs working together in teams (N=16, 13.4%). For performance evaluations, COMs contributed for both NPs (60.2%) and PAs (56.4%); in fewer cases, COMs completed evaluations of NPs (12.9%) and of PAs (29.0%) without input from other service managers (P=0.02).
Table 1 shows the differences reported by COMs between NPs and PAs scope of practice. Overall, 58.9% of NPs and 65.4% of PAs functioned somewhat or completely autonomously; 23.1% of NPs and 30.8% of PAs worked in a role closer to a ward assistant (eg, work directly with a physician, cowriting orders, and making care decisions with physician oversight). Tasks frequently performed by the majority of NPs and PAs included writing orders (87.9%), coordinating discharge plans (86.7%), communicating with consultants (83.1%), performing history and physicals (82.5%), writing daily progress notes (80.7%), communicating with primary care providers (73.5%), and working directly with hospitalists (72.8%). Less common tasks included serving on committees (46.4%), championing quality improvement activities (40.6%), and research (2.9%). There were no statistically significant differences between tasks, except for a higher proportion of services reporting PAs rather than NPs performing procedures (50.0% vs 22.0%, P=0.02) and teaching nonphysicians (50.0% vs 24.4%, P=0.04).
| Services With NPs, | Services With PAs, | P Value | |
|---|---|---|---|
| |||
| How do NPs and PAs function in conjunction with inpatient medicine staff (attending) physicians in the day‐to‐day care of patients (ie, scope of practice)? | N=39 (%)* | N=26 (%)* | |
| Autonomously, in a manner similar to physicians | 10 (25.6%) | 5 (19.2%) | 0.77 |
| Somewhat autonomously, but with limitations | 13 (33.3%) | 12 (46.2%) | 0.31 |
| In a role closer to a ward assistant | 9 (23.1%) | 8 (30.8%) | 0.57 |
| Administrative | 2 (5.1%) | 0 (0.0%) | 0.51 |
| Other | 6 (15.4%) | 1 (3.8%) | 0.23 |
| What types of tasks do NPs and PAs perform? | N=41 (%)* | N=28 (%)* | |
| Write orders | 34 (82.9%) | 26 (92.9%) | 0.29 |
| Coordinate discharge plans | 33 (80.5%) | 26 (92.9%) | 0.18 |
| Communicate with consultants | 33 (80.5%) | 24 (85.7%) | 0.75 |
| History and physicals | 31 (75.6%) | 25 (89.3%) | 0.22 |
| Daily progress notes | 31 (75.6%) | 24 (85.7%) | 0.37 |
| Communicate with primary care providers | 31 (75.6%) | 20 (71.4% | 0.78 |
| Work directly with hospitalists | 26 (63.4%) | 23 (82.1%) | 0.18 |
| Committees | 16 (39.0%) | 16 (57.1%) | 0.15 |
| Champion quality improvement activities | 14 (34.1%) | 14 (50.0%) | 0.22 |
| Teach nonphysician students | 10 (24.4%) | 14 (50.0%) | 0.04 |
| Perform procedures | 9 (22.0%) | 14 (50.0%) | 0.02 |
| Research | 1 (2.4%) | 1 (3.6%) | 1.00 |
| Other | 6 (14.6%) | 0 (0.0%) | 0.04 |
Table 2 reports location of practice in the hospital and workload. There were no significant differences in locations where NPs and PAs provided care. Overall, 81.9% of APPs worked in inpatient wards, 23.1% in step‐down units, 18.6% in intensive care units, 13.8% in skilled care units, and 4.9% in other locations. In addition, 97.4% of NPs and 89.3% of PAs worked weekdays, whereas only 7.9% of NPs and 17.9% of PAs worked nights. More PAs than NPs worked federal holidays (32.1% vs 7.9%, P=0.02) and weekends (32.1% vs 13.2%, P=0.08). Most NPs and PAs handled a caseload of 4 to 10 patients with a mean of 6.5, with no difference between the 2. The minority, 27.0% of NPs and 23.1% of PAs, were not assigned specific patients.
| Services With NPs | Services With PAs | P Value | |
|---|---|---|---|
| |||
| Where do NPs and PAs provide care? | N=38 (%)* | N=28 (%)* | |
| Wards | 31 (81.6%) | 23 (82.1%) | 1.00 |
| Step‐down unit | 8 (21.1%) | 7 (25.0%) | 0.77 |
| Intensive care unit | 6 (15.8%) | 6 (21.4%) | 0.75 |
| Skilled care units | 5 (13.2%) | 4 (14.3%) | 1.00 |
| Other | 1 (2.6%) | 2 (7.1%) | 0.57 |
| What are NPs and PAs tours of duty? | N=38 (%)* | N=28 (%)* | |
| Weekdays | 37 (97.4%) | 25 (89.3%) | 0.30 |
| Weekends | 5 (13.2%) | 9 (32.1%) | 0.08 |
| Nights | 3 (7.9%) | 5 (17.9%) | 0.27 |
| Federal holidays | 3 (7.9%) | 9 (32.1%) | 0.02 |
| Other | 2 (5.3%) | 1 (3.6%) | 1.00 |
| What is the average clinical workload for NPs and PAs? | N=37 (%)* | N=26 (%)* | |
| Mean no. of patients | 6.81 | 6.18 | 0.45 |
| N/A | 10 (27.0%) | 6 (23.1%) | 0.56 |
| Other | 1 (2.7%) | 0 (0.0%) | |
In multivariable adjusted analyses evaluating the association between patient satisfaction and use of APPs (Table 3), no significant differences were observed for patients' rating of the hospital (F[3,95]=0.19; P=0.90) or willingness to recommend the hospital (F[3,95]=0.54; P=0.65). Similarly, no significant differences were observed based on use of APPs for nurse overall job satisfaction (F[3,101]=1.85; P=0.14) or collegial relations with physicians (F[3,101]=0.96; P=0.41).
| Patient Satisfaction | Nurse Satisfaction | Coordination of Care | |||||
|---|---|---|---|---|---|---|---|
| Overall Rating | Willingness to Recommend | RN Overall Job Satisfaction | RN/MD Relations | Chief of Medicine: Inpatient Coordination | Nurse Manager: Inpatient Coordination | Nurse Manager: Discharge Coordination | |
| |||||||
| Intercept | 0.67 (0.14) | 10.20 (0.15) | 30.41 (0.13) | 20.89 (0.07) | 30.78 (0.26) | 30.67 (0.24) | 30.23 (0.26) |
| Facilities with NPs only | 0.06 (0.10) | 0.12 (0.09) | 0.14 (0.09) | 0.02 (0.05) | 10.63 (0.91) | 0.00 (0.19) | 0.42 (0.20)* |
| Facilities with PAs only | 0.06 (0.09) | 0.10 (0.11) | 0.10 (0.10) | 0.06 (0.05) | 10.08 (0.87) | 0.41 (0.22) | 0.36 (0.25) |
| Facilities with both NPs and PAs | 0.02 (0.12) | 0.11 (0.130 | 0.17 (0.11) | 0.00 (0.00) | 0.31 (0.92) | 0.03 (0.27) | 0.21 (0.30) |
| Facilities with neither NPs nor PAs | |||||||
COM ratings of overall inpatient coordination were also nonsignificant (F[3, 100]=2.01; P=0.12), but their ratings of coordination were higher in facilities with NPs only than in those without either NPs or PAs (=1.63, P=0.08). Nurse manager ratings of overall inpatient coordination were not associated with APP use (F[3,91]=1.24; P=0.30), but were marginally lower with facilities using only PAs (=1.48; P=0.06). Nurse manager ratings of discharge coordination showed a significant effect for APP use (F[3,90]=3.30; P=0.02) with facilities having NPs only significantly higher than places without either NPs or PAs (=1.84, P=0.04).
DISCUSSION
Little evidence exists regarding the role of APPs in the inpatient medicine setting,[2] and important deficit concerns in medical knowledge, technical skills, and clinical experience have been raised.[27, 28] These concerns have called into question the appropriateness of involving APPs in the care of medical inpatients with extensive differential diagnoses and complex care requirements.[27, 28] In spite of these concerns, we found widespread use of APPs with almost half of the VHA inpatient medicine services reporting use, which stands in contrast to prior research.[9, 10, 22, 29, 30, 31, 32, 33, 34, 35] APPs practice in a variety of acute and subacute inpatient medicine settings including academic, community, rural, and urban settings without many discernable differences. The spectrum of activities performed by APPs in the VHA is similar to those reported in these inpatient medicine studies, although their scope of practice appears to be much broader than in these few small single academic center studies.[10, 22, 29, 30, 31, 32, 33, 34, 35, 36] For example, only 11% of hospitalist PAs did procedures in a 2006 Society of Hospital Medicine survey, whereas 50% did in our study.[36]
Interestingly, we found that VHA NPs and PAs perform very similar tasks with similar caseloads despite differences in their background, training, regulation, reimbursement, and the longstanding observation that nurse practitioners are not physician assistants.[1, 3, 4, 5] These findings may reflect that APP scope can be more extensive in the VHA. For example, PAs in the VHA practice under federal jurisdiction and can bypass state legislation of scope of practice.[13] It also may reflect ongoing expansion of the role of APPs in the healthcare system since prior studies.[33, 36]
We did, however, note a few significant differences in NP and PA scope. PAs are twice as likely to perform procedures as NPs in inpatient medicine. It is unclear why PAs may do more procedures, as acute care NPs also are commonly taught and perform similar procedures.[33] We also found that PAs teach nonphysician students twice as often as NPs. This may reflect the deep commitment shown by the VHA to PA education dating back to the 1960s.[13] Finally, we found that PAs were significantly more likely to work weekends and federal holidays, a finding that may have implications for inpatient medicine services hiring APPs. Although not statistically significant, PAs, in general, performed more clinically oriented tasks like history and physicals and more often worked directly with hospitalists.
We found no difference in patient satisfaction or nurse satisfaction related to the presence of APPs, consistent with prior studies, where higher levels of satisfaction with APPs are observed in primary care but not hospital settings.[2, 10] However, it is surprising that no differences were observed for nurse satisfaction. NPs traditionally have a nursing focus, which might foster better relationships with nurses.[22] Expecting changes in either patient or nurse satisfaction with just the addition of APPs in the inpatient medicine setting without addressing other factors may be unrealistic. Patient satisfaction is a complex amalgam of various factors including patient expectations, sociodemographics, emotional and physical state, quality of care, and physician communication.[24] Similarly, nurse satisfaction depends on many factors including job stress, nursephysician collaboration, autonomy, staffing, and support.[37]
Finally, we found higher perception of both overall coordination of inpatient care and discharge coordination on services with NPs. A primary reason stated by medical centers to hire APPs is to improve continuity of care.[9] Prior research has shown better communication and collaboration between nurses, physicians, and NPs on inpatient medicine services.[21] NPs may feel that coordination of care is a major focus for their profession and may spend more time than physicians on care coordination activities.[38] Moreover, their background in both nursing and medicine may better lend itself to coordinating care between disciplines.[39] However, we were surprised to find that services with PAs had lower ratings of overall coordination by nurse managers given that care coordination also is a core competency of PA practice and a primary reason for medical centers to employ them.[9] The lack of a nursing background for PAs and potentially less overall medical experience than NPs possibly may contribute to this finding. However, our study does not suggest a direct explanation for this finding, and we had no measure of prior clinical experience, and thus it should be an area for further research.
There are a number of limitations to our study. First, findings from the VHA may not be generalizable to other healthcare systems.[39] However, VHA inpatient medicine services are, in general, structured similarly to non‐VHA settings and are often affiliated with academic medical centers. Further, this is the largest study to our knowledge to look at the specific roles and perceptions of care provided by both NPs and PAs in inpatient medicine. Second, we did not measure other outcomes of care that may be affected by the use of APPs, such as clinical outcomes, process of care measures, or cost‐effectiveness, some of which have been shown in small studies to be impacted by APPs in inpatient medicine.[10, 22, 29, 30, 31, 32, 33, 34, 35] Third, we are unable to attribute causality to our findings and may not have accounted for all the differences between services. Ideally, a randomized controlled trial of APPs in inpatient medicine would be helpful to address these concerns, but no such trials have been conducted. Finally, we did not survey APPs directly, but surveyed the chiefs of their service instead. The chiefs, however, are directly responsible for the scope of practice of all providers on their service and were directly involved in performance evaluations of most of these practitioners.
In conclusion, we found that NPs and PAs, functioning as APP hospitalists are more widely used and have a broader scope of practice on inpatient medicine than previously known or appreciated, at least in the VHA. In spite of their different backgrounds, training, regulations, and reimbursements, they appear to have a similar scope of practice with few differences in roles or perceived impact. Their impact on inpatient healthcare should be a subject of future research. In the meantime, inpatient medicine services should factor these findings into their decision making as they rapidly expand the use of APPs to provide better care to their patients and to address challenges in healthcare reform.[3, 27, 28, 40]
Acknowledgments
Disclosures: The work reported here was supported by the Department of Veterans Affairs, Veterans Health Administration, Health Services Research and Development Service (IIR 08067) and the Comprehensive Access & Delivery Research and Evaluation (CADRE) Center at the Iowa City VAMC (CIN 13412), and the Center for Healthcare Organization and Implementation Research (CHOIR) at the Boston VA Healthcare System (HFP 04145). The funders did not play any role in the design and conduct of the study; in the collection, analysis, and interpretation of data; and in preparation, review, and approval of the manuscript. The authors do not have any conflicts of interest or financial relationships related to the content of this manuscript. The authors had full access to and take full responsibility for the integrity of the data and the accuracy of the data analysis. The views expressed in this article are those of the authors and do not necessarily represent the views of the Department of Veterans Affairs.
- . Advanced nurse practitioners and physician assistants: what is the difference? Comparing the USA and UK. Hosp Med. 2001;62:169–171.
- , , , , , . The impact of nonphysician clinicians: do they improve the quality and cost‐effectiveness of health care services? Med Care Res Rev. 2009;66(6 suppl):36S–89S.
- . Will the NP workforce grow in the future? New forecasts and implications for healthcare delivery. Med Care. 2012;50(7):606–610.
- , , . The certified physician assistant iin the United States: a 2011 snapshot. JAAPA. 2012;25(4):58.
- , , . The use of nonphysician providers in adult intensive care units. Am J Respir Crit Care Med. 2012;185(6):600–605.
- American Academy of Physician Assistants. State law issues: supervision of PAs: access and excellence in patient care. October 2011. Available at: http://www.aapa.org/WorkArea/DownloadAsset.aspx?id=632. Accessed on June 22, 2014.
- Centers for Medicare 5(2):99–102.
- , , , . Physician assistant and nurse practitioner utilization in academic medical centers. Am J Med Qual. 2011;26(6):452–460.
- , , , et al. Implementation of a physician assistant/hospitalist service in an academic medical center: impact on efficiency and patient outcomes. J Hosp Med. 2008;3(5):361–368.
- American Academy of Physician Assistants. 2010 AAPA Physician Assistant Census. Alexandria, VA, 2011. Available at: http://www.aapa.org/WorkArea/DownloadAsset.aspx?id=838. Accessed on June 22, 2014.
- . 2009–2010 AANP national nurse practitioner sample survey: an overview. J Am Acad Nurse Pract. 2011;23(5):266–268.
- , . Physician assistants working in the Department of Veterans Affairs. JAAPA 2010;23(11):41–44.
- National Center for Veterans Analysis and Statistics. Selected Veterans Health Administration Characteristics: FY2002 to FY2012. 2013; http://www.va.gov/vetdata/docs/Utilization/VHAStats.xls. Accessed January 7, 2014.
- , , , . The physician assistant profession and military veterans. Mil Med. 2011;176(2):197–203.
- , , , . Veterans' perceptions of care by nurse practitioners, physician assistants, and physicians: a comparison from satisfaction surveys. J Am Acad Nurse Pract. 2010;22(3):170–176.
- , , , . Nurse practitioners as primary care providers within the VA. Mil Med. 2011;176(7):791–797.
- . Federally employed physician assistants. Mil Med. 2008;173(9):895–899.
- , , , , . Variations in nurse practitioner use in Veterans Affairs primary care practices. Health Serv Res. 2004;39(4 pt 1):887–904.
- , , , , . The association of hospital characteristics and quality improvement activities in inpatient medical services. J Gen Intern Med. 2014;29(5):715–722.
- , , , . Effect of a multidisciplinary intervention on communication and collaboration among physicians and nurses. Am J Crit Care. 2005;14(1):71–77.
- , , , , . Utilization‐focused evaluation of acute care nurse practitioner role. Outcomes Manag Nurs Pract. 1998;2(4):152–160; quiz 160–151.
- , , , , . Factors affecting the use of patient survey data for quality improvement in the Veterans Health Administration. BMC Health Serv Res. 2011;11:334.
- , , , . Patients' perception of hospital care in the United States. N Engl J Med. 2008;359(18):1921–1931.
- , , , et al. Nurse staffing and patient outcomes in Veterans Affairs hospitals. J Nurs Adm. 2005;35(10):459–466.
- . Development of the practice environment scale of the Nursing Work Index. Res Nurs Health. 2002;25(3):176–188.
- , , , . Broadening the scope of nursing practice. N Engl J Med. 2011;364(3):193–196.
- . Expanding the role of advanced nurse practitioners—risks and rewards. N Engl J Med. 2013;368(20):1935–1941.
- , , , et al. The effect of a multidisciplinary hospitalist/physician and advanced practice nurse collaboration on hospital costs. J Nurs Adm. 2006;36(2):79–85.
- , , , . Description of a nurse practitioner inpatient service in a public teaching hospital. J Gen Intern Med. 1993;8(1):29–30.
- , . Acute care nurse practitioners: creating and implementing a model of care for an inpatient general medical service. Am J Crit Care. 2002;11(5):448–458.
- , , , , . Improving resource utilization in a teaching hospital: development of a nonteaching service for chest pain admissions. Acad Med. 2006;81(5):432–435.
- , , , et al. Care activities and outcomes of patients cared for by acute care nurse practitioners, physician assistants, and resident physicians: a comparison. Am J Crit Care. 1998;7(4):267–281.
- , , , et al. Impact of localizing general medical teams to a single nursing unit. J Hosp Med. 2012;7(7):551–556.
- , , . Resource use by physician assistant services versus teaching services. JAAPA 2002;15(1):33–38, 40, 42.
- . Physician assistants in hospital medicine. In: Ballweg R, Sullivan EM, Brown D, Vetrosky D, eds. Physician Assistant: A Guide to Clinical Practice. 5th ed. Philadelphia, PA: W.B. Saunders; 2013:450–455.
- , , . Factors contributing to nurse job satisfaction in the acute hospital setting: a review of recent literature. J Nurs Manage. 2010;18(7):804–814.
- , , , , . Outcomes of care managed by an acute care nurse practitioner/attending physician team in a subacute medical intensive care unit. Am J Crit Care. 2005;14(2):121–130; quiz 131–132.
- , . The organizational and performance effects of nurse practitioner roles. J Adv Nurs. 2004;47(6):672–681.
- , , . Gaps in the supply of physicians, advance practice nurses, and physician assistants. J Am Coll Surg. 2011;212(6):991–999.
Nurse practitioners (NPs) and physician assistants (PAs) provide healthcare in numerous environments internationally and in the United States.[1, 2] However, their role in the inpatient medicine setting is not well described.[2] In the United States, there are more than 157,000 NPs and 85,000 PAs with projected increases.[3, 4] Although both professions provide direct medical care, there are key differences.[1, 3, 4, 5] NPs typically complete a master's or doctoral degree with advanced clinical training beyond nursing. PAs complete at least 2 years of college courses similar to premedical school requirements. PA programs use a medical school‐based curriculum and train for about 2 years before awarding a master's degree. NPs are regulated through state nursing boards, whereas PAs are regulated through state licensing or medical boards. NPs and PAs have different, yet overlapping scopes of practice. A key difference is that PAs can only practice collaborating with a physician.[5, 6] Overall, both have been shown to provide healthcare that is similar in quality to physicians in specific primary care and surgical settings.[2]
NPs and PAs, often referred to as advanced practice providers (APPs), are employed primarily in outpatient clinic settings providing direct patient care. Most APP studies have focused on the outpatient setting, despite nearly a third of US healthcare expenditure for hospital care.[2, 7] Little is known about APP involvement, specific roles, or impact on outcomes in inpatient medicine settings where they are often referred to as NP or PA hospitalists.[2, 8, 9, 10]
The Veterans Health Administration (VHA) is 1 of the largest employers of APPs, with 3.6% of all NPs and 2.1% of all PAs reported to practice in the VHA.[11, 12, 13] As the largest fully integrated healthcare system in the US, the VHA had 8.8 million veterans enrolled and 703,500 inpatient admissions in 2012.[14] Although this makes the VHA an ideal environment to study the role of APPs, few studies have done so.[13, 15, 16, 17, 18, 19] Although studies have compared NPs and PAs to physicians, very little is known about how NPs differ from PAs when practicing in the same environment.
Our objective was to describe the scope of practice, defined as activities that an individual healthcare practitioner is licensed to perform, of NPs and PAs in the inpatient medicine setting and in the VHA. A secondary objective was to explore important outcomes that could potentially be affected by the presence of NPs and PAs on inpatient medicine.
METHODS
The Organizational Factors and Inpatient Medical Care Quality and Efficiency (OFIM) study provides a basis for this study with detail published elsewhere.[20] The OFIM study was conducted between 2010 and 2011 to evaluate quality of care in VHA inpatient medicine surveying chiefs of medicine (COM), inpatient medicine nurse managers (NM), attending physicians, and extant VHA survey data. The COM is the senior attending physician in charge of departments of medicine that include most medical subspecialties within the VHA medical centers. We used the subset of questions specific to NPs and PAs from the COM and NM surveys. Both COMs and NMs answered identical questions for NPs and PAs in 2 separate sections to avoid overlap of responses. NM survey responses were only used for the coordination of care regression model. Surveys were conducted by e‐mail with up to 4 reminders and a subsequent paper mailing. The inpatient medicine service included adult general internal medicine, medical subspecialties, and critical care. The study was approved by the institutional review boards of the VA Boston Healthcare System, the University of Iowa, and the Iowa City VA Healthcare System.
Measurements
To create our primary variable of interestNP and PA employmentwe used the COM survey. Respondents indicated the number and full‐time employee equivalent (FTEE) values for APPs on inpatient medicine. Based on responses, we created a categorical variable with 4 options: (1) facilities with NPs only, (2) facilities with PAs only, (3) facilities with both NPs and PAs, and (4) facilities with neither NPs nor PAs. We selected 3 outcomes that could potentially be affected by the presence of NPs and PAs on inpatient medicine: patient satisfaction, registered nurse (RN) satisfaction, and coordination of care. Patient satisfaction has been shown to improve with NPs and PAs in prior studies, and improving coordination of care has been a stated goal of medical centers in hiring NPs and PAs.[2, 9] Based on our personal experience and previous studies that have shown that nurses report better communication with NPs than physicians,[21] and that NPs retain a visible nursing component in their NP role,[22] we hypothesized that nurse satisfaction on inpatient medicine would improve with the presence of NPs and PAs.
Patient satisfaction was obtained from the 2010 VHA Survey of Healthcare Experiences of Patients (SHEP).[23] The average response rate was 45%. Approximately half the questions on the SHEP are identical to the Hospital Consumer Assessment of Healthcare Providers and Systems survey (HCAHPS).[24] We examined 2 items: an overall rating and willingness to recommend the facility. For the overall rating, patients rated their hospitalization on a scale from 0 (worst hospital possible) to 10 (best hospital possible). Following HCAHPS guidelines, responses of either 9 or 10 were coded as positive and all other nonmissing responses were coded 0. For willingness to recommend, patients were asked Would you recommend this hospital to your friends and family? using a 4‐point response scale. Responses of definitely and probably no were coded as 0, and probably and definitely yes were coded as 1.
Nurse satisfaction was obtained from the 2011 Veterans Administration Nursing Outcomes Database, an annual survey of VHA nurses that includes demographic, work environment and satisfaction data.[25] The survey, a modified version of the Practice Environment Scale,[26] had a response rate of 52.9% (out of 51,870). For this analysis, we selected only inpatient medicine RNs. We used 2 measures: overall job satisfaction and collegial RN/MD (physician) relations. The former was assessed using the item Compared to what you think it should be, what is your current overall level of satisfaction with your job? The RN/MD relations scale had 3 items, including Physicians and nurses have good working relationships. Both items were evaluated on a similar 5‐point response scale.
Coordination of care was assessed from COM and NM surveys. Overall coordination was evaluated from the COM survey using 1 of 8 items in a question about care coordination, In the past month, how would you rate the following aspects of coordination of patient care inpatient coordination overall. Overall coordination was also evaluated from the NM survey using a similar item. Discharge coordination was evaluated only from the NM survey using 1 of 8 items, Thinking about your experiences during the past month, how would you rate the following aspects of the coordination of patient care related to the discharge process on your inpatient medicine unit discharge coordination overall. When a service had more than 1 response from the NM survey, we took an average of responses to represent the mean score. Responses for all questions ranged from 1 for poor to 5 for excellent (for all of the questions see Supporting Information, Appendix 1, in the online version of this article).
Last, we modeled for several contextual features that could influence outcomes: geographic region as a 4‐item categorical variable; teaching affiliation as a dichotomous variable based on whether the hospital was a member of the Council of Teaching Hospitals, urban or rural status, and facility size as a continuous variable using the number of inpatient medicine service beds.
Statistical Analysis
Descriptive bivariate analyses used t tests, 2, or 2‐tailed Fisher tests when appropriate to compare NP and PA autonomy, tasks, location of care, work schedule, clinical workload, organizational characteristics (ie, academic, urban, facility complexity, inpatient medicine team structure), and performance evaluations.
Next, we examined whether any of the contextual characteristics were associated with use of NPs or PAs using inferential statistics. For patient satisfaction, we developed a hierarchical linear model (HLM) that nested patients within facilities. We controlled for patient age, sex, health status, and length of stay. For nurse satisfaction, individual responses of RNs also were analyzed using the HLM. We controlled for whether the nurse had a leadership position, worked during the daily shift, and job tenure. Ordinary least squares regression was used to examine the 3 measures of coordination from the COM and NM surveys. All analyses were performed using Stata version 12 (StataCorp, College Station, TX) and SAS version 9.2 (SAS Institute Inc., Cary, NC).
RESULTS
Of 123 inpatient medicine services that we surveyed, we included responses from the COMs of 118 services (response rate 95.2%); 5 responses were incomplete. Across 123 inpatient medicine services, we surveyed 264 nurse managers and received 198 responses (75.0%) from 114 inpatient medicine services. In the only model using NM responsesthe care coordination model104 inpatient medicine services had responses from both COM and NM surveys.
Of 118 VHA inpatient medicine services, 56 (47.5%) had APPs, of which 27 (48.2%) had NPs only, 15 (26.8%) had PAs only, and 14 (25.0%) had both NPs and PAs. FTEEs for NPs ranged from 0.5 to 7 (mean=2.22) and for PAs from 1 to 9 (mean=2.23) on the inpatient medicine service per hospital.
There were no significant differences on use of NPs and PAs by teaching affiliation, urban or rural setting, and geography. A significant difference was observed based on bed size (F[3,109]=5.13, P<0.001); facilities with both NPs and PAs had, on average, a larger number of inpatient beds (mean=79.0, standard deviation [SD]=32.3) compared to those without NPs or PAs (mean=50.1, SD=29.4) or with PAs only (mean=44.2, SD=20.5) using Tukey post hoc analysis.
The most common staffing model used staff (attending) physicians only working directly with APPs (N=29, 24.6%). Next most common was an academic model with staff physicians, housestaff, and APPs working together in teams (N=16, 13.4%). For performance evaluations, COMs contributed for both NPs (60.2%) and PAs (56.4%); in fewer cases, COMs completed evaluations of NPs (12.9%) and of PAs (29.0%) without input from other service managers (P=0.02).
Table 1 shows the differences reported by COMs between NPs and PAs scope of practice. Overall, 58.9% of NPs and 65.4% of PAs functioned somewhat or completely autonomously; 23.1% of NPs and 30.8% of PAs worked in a role closer to a ward assistant (eg, work directly with a physician, cowriting orders, and making care decisions with physician oversight). Tasks frequently performed by the majority of NPs and PAs included writing orders (87.9%), coordinating discharge plans (86.7%), communicating with consultants (83.1%), performing history and physicals (82.5%), writing daily progress notes (80.7%), communicating with primary care providers (73.5%), and working directly with hospitalists (72.8%). Less common tasks included serving on committees (46.4%), championing quality improvement activities (40.6%), and research (2.9%). There were no statistically significant differences between tasks, except for a higher proportion of services reporting PAs rather than NPs performing procedures (50.0% vs 22.0%, P=0.02) and teaching nonphysicians (50.0% vs 24.4%, P=0.04).
| Services With NPs, | Services With PAs, | P Value | |
|---|---|---|---|
| |||
| How do NPs and PAs function in conjunction with inpatient medicine staff (attending) physicians in the day‐to‐day care of patients (ie, scope of practice)? | N=39 (%)* | N=26 (%)* | |
| Autonomously, in a manner similar to physicians | 10 (25.6%) | 5 (19.2%) | 0.77 |
| Somewhat autonomously, but with limitations | 13 (33.3%) | 12 (46.2%) | 0.31 |
| In a role closer to a ward assistant | 9 (23.1%) | 8 (30.8%) | 0.57 |
| Administrative | 2 (5.1%) | 0 (0.0%) | 0.51 |
| Other | 6 (15.4%) | 1 (3.8%) | 0.23 |
| What types of tasks do NPs and PAs perform? | N=41 (%)* | N=28 (%)* | |
| Write orders | 34 (82.9%) | 26 (92.9%) | 0.29 |
| Coordinate discharge plans | 33 (80.5%) | 26 (92.9%) | 0.18 |
| Communicate with consultants | 33 (80.5%) | 24 (85.7%) | 0.75 |
| History and physicals | 31 (75.6%) | 25 (89.3%) | 0.22 |
| Daily progress notes | 31 (75.6%) | 24 (85.7%) | 0.37 |
| Communicate with primary care providers | 31 (75.6%) | 20 (71.4% | 0.78 |
| Work directly with hospitalists | 26 (63.4%) | 23 (82.1%) | 0.18 |
| Committees | 16 (39.0%) | 16 (57.1%) | 0.15 |
| Champion quality improvement activities | 14 (34.1%) | 14 (50.0%) | 0.22 |
| Teach nonphysician students | 10 (24.4%) | 14 (50.0%) | 0.04 |
| Perform procedures | 9 (22.0%) | 14 (50.0%) | 0.02 |
| Research | 1 (2.4%) | 1 (3.6%) | 1.00 |
| Other | 6 (14.6%) | 0 (0.0%) | 0.04 |
Table 2 reports location of practice in the hospital and workload. There were no significant differences in locations where NPs and PAs provided care. Overall, 81.9% of APPs worked in inpatient wards, 23.1% in step‐down units, 18.6% in intensive care units, 13.8% in skilled care units, and 4.9% in other locations. In addition, 97.4% of NPs and 89.3% of PAs worked weekdays, whereas only 7.9% of NPs and 17.9% of PAs worked nights. More PAs than NPs worked federal holidays (32.1% vs 7.9%, P=0.02) and weekends (32.1% vs 13.2%, P=0.08). Most NPs and PAs handled a caseload of 4 to 10 patients with a mean of 6.5, with no difference between the 2. The minority, 27.0% of NPs and 23.1% of PAs, were not assigned specific patients.
| Services With NPs | Services With PAs | P Value | |
|---|---|---|---|
| |||
| Where do NPs and PAs provide care? | N=38 (%)* | N=28 (%)* | |
| Wards | 31 (81.6%) | 23 (82.1%) | 1.00 |
| Step‐down unit | 8 (21.1%) | 7 (25.0%) | 0.77 |
| Intensive care unit | 6 (15.8%) | 6 (21.4%) | 0.75 |
| Skilled care units | 5 (13.2%) | 4 (14.3%) | 1.00 |
| Other | 1 (2.6%) | 2 (7.1%) | 0.57 |
| What are NPs and PAs tours of duty? | N=38 (%)* | N=28 (%)* | |
| Weekdays | 37 (97.4%) | 25 (89.3%) | 0.30 |
| Weekends | 5 (13.2%) | 9 (32.1%) | 0.08 |
| Nights | 3 (7.9%) | 5 (17.9%) | 0.27 |
| Federal holidays | 3 (7.9%) | 9 (32.1%) | 0.02 |
| Other | 2 (5.3%) | 1 (3.6%) | 1.00 |
| What is the average clinical workload for NPs and PAs? | N=37 (%)* | N=26 (%)* | |
| Mean no. of patients | 6.81 | 6.18 | 0.45 |
| N/A | 10 (27.0%) | 6 (23.1%) | 0.56 |
| Other | 1 (2.7%) | 0 (0.0%) | |
In multivariable adjusted analyses evaluating the association between patient satisfaction and use of APPs (Table 3), no significant differences were observed for patients' rating of the hospital (F[3,95]=0.19; P=0.90) or willingness to recommend the hospital (F[3,95]=0.54; P=0.65). Similarly, no significant differences were observed based on use of APPs for nurse overall job satisfaction (F[3,101]=1.85; P=0.14) or collegial relations with physicians (F[3,101]=0.96; P=0.41).
| Patient Satisfaction | Nurse Satisfaction | Coordination of Care | |||||
|---|---|---|---|---|---|---|---|
| Overall Rating | Willingness to Recommend | RN Overall Job Satisfaction | RN/MD Relations | Chief of Medicine: Inpatient Coordination | Nurse Manager: Inpatient Coordination | Nurse Manager: Discharge Coordination | |
| |||||||
| Intercept | 0.67 (0.14) | 10.20 (0.15) | 30.41 (0.13) | 20.89 (0.07) | 30.78 (0.26) | 30.67 (0.24) | 30.23 (0.26) |
| Facilities with NPs only | 0.06 (0.10) | 0.12 (0.09) | 0.14 (0.09) | 0.02 (0.05) | 10.63 (0.91) | 0.00 (0.19) | 0.42 (0.20)* |
| Facilities with PAs only | 0.06 (0.09) | 0.10 (0.11) | 0.10 (0.10) | 0.06 (0.05) | 10.08 (0.87) | 0.41 (0.22) | 0.36 (0.25) |
| Facilities with both NPs and PAs | 0.02 (0.12) | 0.11 (0.130 | 0.17 (0.11) | 0.00 (0.00) | 0.31 (0.92) | 0.03 (0.27) | 0.21 (0.30) |
| Facilities with neither NPs nor PAs | |||||||
COM ratings of overall inpatient coordination were also nonsignificant (F[3, 100]=2.01; P=0.12), but their ratings of coordination were higher in facilities with NPs only than in those without either NPs or PAs (=1.63, P=0.08). Nurse manager ratings of overall inpatient coordination were not associated with APP use (F[3,91]=1.24; P=0.30), but were marginally lower with facilities using only PAs (=1.48; P=0.06). Nurse manager ratings of discharge coordination showed a significant effect for APP use (F[3,90]=3.30; P=0.02) with facilities having NPs only significantly higher than places without either NPs or PAs (=1.84, P=0.04).
DISCUSSION
Little evidence exists regarding the role of APPs in the inpatient medicine setting,[2] and important deficit concerns in medical knowledge, technical skills, and clinical experience have been raised.[27, 28] These concerns have called into question the appropriateness of involving APPs in the care of medical inpatients with extensive differential diagnoses and complex care requirements.[27, 28] In spite of these concerns, we found widespread use of APPs with almost half of the VHA inpatient medicine services reporting use, which stands in contrast to prior research.[9, 10, 22, 29, 30, 31, 32, 33, 34, 35] APPs practice in a variety of acute and subacute inpatient medicine settings including academic, community, rural, and urban settings without many discernable differences. The spectrum of activities performed by APPs in the VHA is similar to those reported in these inpatient medicine studies, although their scope of practice appears to be much broader than in these few small single academic center studies.[10, 22, 29, 30, 31, 32, 33, 34, 35, 36] For example, only 11% of hospitalist PAs did procedures in a 2006 Society of Hospital Medicine survey, whereas 50% did in our study.[36]
Interestingly, we found that VHA NPs and PAs perform very similar tasks with similar caseloads despite differences in their background, training, regulation, reimbursement, and the longstanding observation that nurse practitioners are not physician assistants.[1, 3, 4, 5] These findings may reflect that APP scope can be more extensive in the VHA. For example, PAs in the VHA practice under federal jurisdiction and can bypass state legislation of scope of practice.[13] It also may reflect ongoing expansion of the role of APPs in the healthcare system since prior studies.[33, 36]
We did, however, note a few significant differences in NP and PA scope. PAs are twice as likely to perform procedures as NPs in inpatient medicine. It is unclear why PAs may do more procedures, as acute care NPs also are commonly taught and perform similar procedures.[33] We also found that PAs teach nonphysician students twice as often as NPs. This may reflect the deep commitment shown by the VHA to PA education dating back to the 1960s.[13] Finally, we found that PAs were significantly more likely to work weekends and federal holidays, a finding that may have implications for inpatient medicine services hiring APPs. Although not statistically significant, PAs, in general, performed more clinically oriented tasks like history and physicals and more often worked directly with hospitalists.
We found no difference in patient satisfaction or nurse satisfaction related to the presence of APPs, consistent with prior studies, where higher levels of satisfaction with APPs are observed in primary care but not hospital settings.[2, 10] However, it is surprising that no differences were observed for nurse satisfaction. NPs traditionally have a nursing focus, which might foster better relationships with nurses.[22] Expecting changes in either patient or nurse satisfaction with just the addition of APPs in the inpatient medicine setting without addressing other factors may be unrealistic. Patient satisfaction is a complex amalgam of various factors including patient expectations, sociodemographics, emotional and physical state, quality of care, and physician communication.[24] Similarly, nurse satisfaction depends on many factors including job stress, nursephysician collaboration, autonomy, staffing, and support.[37]
Finally, we found higher perception of both overall coordination of inpatient care and discharge coordination on services with NPs. A primary reason stated by medical centers to hire APPs is to improve continuity of care.[9] Prior research has shown better communication and collaboration between nurses, physicians, and NPs on inpatient medicine services.[21] NPs may feel that coordination of care is a major focus for their profession and may spend more time than physicians on care coordination activities.[38] Moreover, their background in both nursing and medicine may better lend itself to coordinating care between disciplines.[39] However, we were surprised to find that services with PAs had lower ratings of overall coordination by nurse managers given that care coordination also is a core competency of PA practice and a primary reason for medical centers to employ them.[9] The lack of a nursing background for PAs and potentially less overall medical experience than NPs possibly may contribute to this finding. However, our study does not suggest a direct explanation for this finding, and we had no measure of prior clinical experience, and thus it should be an area for further research.
There are a number of limitations to our study. First, findings from the VHA may not be generalizable to other healthcare systems.[39] However, VHA inpatient medicine services are, in general, structured similarly to non‐VHA settings and are often affiliated with academic medical centers. Further, this is the largest study to our knowledge to look at the specific roles and perceptions of care provided by both NPs and PAs in inpatient medicine. Second, we did not measure other outcomes of care that may be affected by the use of APPs, such as clinical outcomes, process of care measures, or cost‐effectiveness, some of which have been shown in small studies to be impacted by APPs in inpatient medicine.[10, 22, 29, 30, 31, 32, 33, 34, 35] Third, we are unable to attribute causality to our findings and may not have accounted for all the differences between services. Ideally, a randomized controlled trial of APPs in inpatient medicine would be helpful to address these concerns, but no such trials have been conducted. Finally, we did not survey APPs directly, but surveyed the chiefs of their service instead. The chiefs, however, are directly responsible for the scope of practice of all providers on their service and were directly involved in performance evaluations of most of these practitioners.
In conclusion, we found that NPs and PAs, functioning as APP hospitalists are more widely used and have a broader scope of practice on inpatient medicine than previously known or appreciated, at least in the VHA. In spite of their different backgrounds, training, regulations, and reimbursements, they appear to have a similar scope of practice with few differences in roles or perceived impact. Their impact on inpatient healthcare should be a subject of future research. In the meantime, inpatient medicine services should factor these findings into their decision making as they rapidly expand the use of APPs to provide better care to their patients and to address challenges in healthcare reform.[3, 27, 28, 40]
Acknowledgments
Disclosures: The work reported here was supported by the Department of Veterans Affairs, Veterans Health Administration, Health Services Research and Development Service (IIR 08067) and the Comprehensive Access & Delivery Research and Evaluation (CADRE) Center at the Iowa City VAMC (CIN 13412), and the Center for Healthcare Organization and Implementation Research (CHOIR) at the Boston VA Healthcare System (HFP 04145). The funders did not play any role in the design and conduct of the study; in the collection, analysis, and interpretation of data; and in preparation, review, and approval of the manuscript. The authors do not have any conflicts of interest or financial relationships related to the content of this manuscript. The authors had full access to and take full responsibility for the integrity of the data and the accuracy of the data analysis. The views expressed in this article are those of the authors and do not necessarily represent the views of the Department of Veterans Affairs.
- . Advanced nurse practitioners and physician assistants: what is the difference? Comparing the USA and UK. Hosp Med. 2001;62:169–171.
- , , , , , . The impact of nonphysician clinicians: do they improve the quality and cost‐effectiveness of health care services? Med Care Res Rev. 2009;66(6 suppl):36S–89S.
- . Will the NP workforce grow in the future? New forecasts and implications for healthcare delivery. Med Care. 2012;50(7):606–610.
- , , . The certified physician assistant iin the United States: a 2011 snapshot. JAAPA. 2012;25(4):58.
- , , . The use of nonphysician providers in adult intensive care units. Am J Respir Crit Care Med. 2012;185(6):600–605.
- American Academy of Physician Assistants. State law issues: supervision of PAs: access and excellence in patient care. October 2011. Available at: http://www.aapa.org/WorkArea/DownloadAsset.aspx?id=632. Accessed on June 22, 2014.
- Centers for Medicare 5(2):99–102.
- , , , . Physician assistant and nurse practitioner utilization in academic medical centers. Am J Med Qual. 2011;26(6):452–460.
- , , , et al. Implementation of a physician assistant/hospitalist service in an academic medical center: impact on efficiency and patient outcomes. J Hosp Med. 2008;3(5):361–368.
- American Academy of Physician Assistants. 2010 AAPA Physician Assistant Census. Alexandria, VA, 2011. Available at: http://www.aapa.org/WorkArea/DownloadAsset.aspx?id=838. Accessed on June 22, 2014.
- . 2009–2010 AANP national nurse practitioner sample survey: an overview. J Am Acad Nurse Pract. 2011;23(5):266–268.
- , . Physician assistants working in the Department of Veterans Affairs. JAAPA 2010;23(11):41–44.
- National Center for Veterans Analysis and Statistics. Selected Veterans Health Administration Characteristics: FY2002 to FY2012. 2013; http://www.va.gov/vetdata/docs/Utilization/VHAStats.xls. Accessed January 7, 2014.
- , , , . The physician assistant profession and military veterans. Mil Med. 2011;176(2):197–203.
- , , , . Veterans' perceptions of care by nurse practitioners, physician assistants, and physicians: a comparison from satisfaction surveys. J Am Acad Nurse Pract. 2010;22(3):170–176.
- , , , . Nurse practitioners as primary care providers within the VA. Mil Med. 2011;176(7):791–797.
- . Federally employed physician assistants. Mil Med. 2008;173(9):895–899.
- , , , , . Variations in nurse practitioner use in Veterans Affairs primary care practices. Health Serv Res. 2004;39(4 pt 1):887–904.
- , , , , . The association of hospital characteristics and quality improvement activities in inpatient medical services. J Gen Intern Med. 2014;29(5):715–722.
- , , , . Effect of a multidisciplinary intervention on communication and collaboration among physicians and nurses. Am J Crit Care. 2005;14(1):71–77.
- , , , , . Utilization‐focused evaluation of acute care nurse practitioner role. Outcomes Manag Nurs Pract. 1998;2(4):152–160; quiz 160–151.
- , , , , . Factors affecting the use of patient survey data for quality improvement in the Veterans Health Administration. BMC Health Serv Res. 2011;11:334.
- , , , . Patients' perception of hospital care in the United States. N Engl J Med. 2008;359(18):1921–1931.
- , , , et al. Nurse staffing and patient outcomes in Veterans Affairs hospitals. J Nurs Adm. 2005;35(10):459–466.
- . Development of the practice environment scale of the Nursing Work Index. Res Nurs Health. 2002;25(3):176–188.
- , , , . Broadening the scope of nursing practice. N Engl J Med. 2011;364(3):193–196.
- . Expanding the role of advanced nurse practitioners—risks and rewards. N Engl J Med. 2013;368(20):1935–1941.
- , , , et al. The effect of a multidisciplinary hospitalist/physician and advanced practice nurse collaboration on hospital costs. J Nurs Adm. 2006;36(2):79–85.
- , , , . Description of a nurse practitioner inpatient service in a public teaching hospital. J Gen Intern Med. 1993;8(1):29–30.
- , . Acute care nurse practitioners: creating and implementing a model of care for an inpatient general medical service. Am J Crit Care. 2002;11(5):448–458.
- , , , , . Improving resource utilization in a teaching hospital: development of a nonteaching service for chest pain admissions. Acad Med. 2006;81(5):432–435.
- , , , et al. Care activities and outcomes of patients cared for by acute care nurse practitioners, physician assistants, and resident physicians: a comparison. Am J Crit Care. 1998;7(4):267–281.
- , , , et al. Impact of localizing general medical teams to a single nursing unit. J Hosp Med. 2012;7(7):551–556.
- , , . Resource use by physician assistant services versus teaching services. JAAPA 2002;15(1):33–38, 40, 42.
- . Physician assistants in hospital medicine. In: Ballweg R, Sullivan EM, Brown D, Vetrosky D, eds. Physician Assistant: A Guide to Clinical Practice. 5th ed. Philadelphia, PA: W.B. Saunders; 2013:450–455.
- , , . Factors contributing to nurse job satisfaction in the acute hospital setting: a review of recent literature. J Nurs Manage. 2010;18(7):804–814.
- , , , , . Outcomes of care managed by an acute care nurse practitioner/attending physician team in a subacute medical intensive care unit. Am J Crit Care. 2005;14(2):121–130; quiz 131–132.
- , . The organizational and performance effects of nurse practitioner roles. J Adv Nurs. 2004;47(6):672–681.
- , , . Gaps in the supply of physicians, advance practice nurses, and physician assistants. J Am Coll Surg. 2011;212(6):991–999.
© 2014 Society of Hospital Medicine
HAC Diagnosis Code and MS‐DRG Assignment
One financial incentive to improve quality of care is the Centers for Medicare and Medicaid Services' (CMS) policy to not pay additionally for certain adverse events that are classified as hospital‐acquired conditions (HACs).[1, 2, 3] HACs are specific conditions that occur during the hospital stay and presumably could have been prevented.[4, 5, 6] Under the CMS policy, if an HAC occurs during a patient's stay, that condition is not included in the Medicare Severity Diagnosis‐Related Group (MS‐DRG) assignment.
The MS‐DRG assigned to a patient discharge determines reimbursement. Each MS‐DRG is assigned a weight, which is used to adjust for the fact that the treatment of different conditions consume different resources and have difference costs. Groups of patients who are expected to require above‐average resources have a higher weight than those who require fewer resources, and higher‐weighted MS‐DRG assignment results in a higher payment. In some cases, the inclusion of the diagnosis code of an HAC in the determination of the MS‐DRG results in a higher complexity level and higher DRG weight. The policy is designed to shift the incremental costs associated with treating the HAC to the hospital. As of October 2009, there were 10 HACs included in the CMS nonpayment program (see Supporting Table 1 in the online version of this article). CMS expanded the list of HACs to include 13 conditions in 2013.
| Variable | MS‐DRG Change, No. (%) or MSD, N=980 | No MS‐DRG Change, No. (%) or MSD, N=6,047 | P Value |
|---|---|---|---|
| |||
| Patient sociodemographic characteristics | |||
| Age, y | 62.718.9 | 57.521.9 | <0.001 |
| Race | |||
| White | 687 (70.1) | 4,006 (66.3) | 0.024 |
| Black | 166 (16.9) | 1,100 (18.2) | |
| Hispanic | 45 (4.6) | 416 (6.9) | |
| Other | 82 (8.4) | 525 (8.7) | |
| Sex | <0.001 | ||
| Male | 441 (45.0) | 3,298 (54.5) | |
| Female | 539 (55.0) | 2,749 (45.5) | |
| Payer | <0.001 | ||
| Commercial | 279 (28.5) | 1,609 (26.6) | |
| Medicaid | 88 (9.0) | 910 (15.1) | |
| Medicare | 532 (54.3) | 3,003 (49.7) | |
| Self‐pay/charity | 52 (5.3) | 331 (5.5) | |
| Other | 29 (3.0) | 194 (3.2) | |
| Severity of illness | <0.001 | ||
| Minor | 50 (5.1) | 71 (1.2) | |
| Moderate | 216 (22.0) | 359 (5.9) | |
| Major | 599 (61.1) | 1,318 (21.8) | |
| Extreme | 115 (11.7) | 4,299 (71.1) | |
| Patient clinical characteristics | |||
| Number of ICD‐9 diagnosis codes per patient | 13.76.0 | 20.26.6 | <0.001 |
| MS‐DRG weight | 2.92.1 | 5.96.1 | <0.001 |
| Hospital characteristics | |||
| Mean number of ICD‐9 diagnosis codes per patient per hospital | 8.51.4 | 8.61.4 | 0.280 |
| Total hospital discharges | 15,9576,553 | 16,8576,634 | <0.001 |
| HACs per 1,000 discharges | 9.83.7 | 10.23.7 | <0.001 |
| Hospital‐acquired condition | |||
| Type of HAC | <0.001 | ||
| Pressure ulcer | 334 (34.1) | 1,599 (26.4) | |
| Falls/trauma | 96 (9.8) | 440 (7.3) | |
| Catheter‐associated UTI | 19 (1.9) | 215 (3.6) | |
| Vascular catheter infection | 26 (2.7) | 1,179 (19.5) | |
| DVT/pulmonary embolism | 448 (45.7) | 2,145 (35.5) | |
| Other conditions | 57 (5.8) | 469 (7.8) | |
| HAC position | <0.001 | ||
| 2nd code | 850 (86.7) | 697 (11.5) | |
| 3rd code | 45 (4.6) | 739 (12.2) | |
| 4th code | 30 (3.1) | 641 (10.6) | |
| 5th code | 15 (1.5) | 569 (9.4) | |
| 6th code or higher | 40 (4.1) | 3,401 (56.2) | |
Withholding additional reimbursement for an HAC has been controversial. One area of debate is that the assignment of an HAC may be imprecise, in part due to the variation in how physicians document in the medical record.[1, 2, 6, 7, 8, 9] Coding is derived from documentation in physician notes and is the primary mechanism for assigning International Classification of Diseases, 9th Revision, Clinical Modification (ICD‐9) diagnosis codes to the patient's encounter. The coding process begins with health information technicians (ie, medical record coders) reviewing all medical record documentation to assign diagnosis and procedure codes using the ICD‐9 codes.[10] Primary and secondary diagnoses are determined by certain definitions in the hospital setting. Secondary diagnoses can be further separated into complications or comorbidities in the MS‐DRG system, which can affect reimbursement. The MS‐DRG is then determined using these diagnosis and procedure codes. Physician documentation is the principal source of data for hospital billing, because health information technicians (ie, medical record coders) must assign a code based on what is documented in the chart. If key medical detail is missing or language is ambiguous, then coding can be inaccurate, which may lead to inappropriate compensation.[11]
Accurate and complete ICD‐9 diagnosis and procedure coding is essential for correct MS‐DRG assignment and reimbursement.[12] Physicians may influence coding prioritization by either over‐emphasizing a patient diagnosis or by downplaying the significance of new findings. In addition, unless the physician uses specific, accurate, and accepted terminology, the diagnosis may not even appear in the list of diagnosis codes. Medical records with nonstandard abbreviations may result in coder‐omission of key diagnoses. Finally, when clinicians use qualified diagnoses such as rule‐out or probable, the final diagnosis coded may not be accurate.[10]
Although the CMS policy creates a financial incentive for hospitals to improve quality, the extent to which the policy actually impacts reimbursement across multiple HACs has not been quantified. Additionally, if HACsas a policy initiativereflect actual quality of care, then the position of the ICD‐9 code should not affect MS‐DRG assignment. In this study we evaluated the extent to which MS‐DRG assignment would have been influenced by the presence of an HAC and tested the association of the position of an HAC in the list of ICD‐9 diagnosis codes with changes in MS‐DRG assignment.
METHODS
Study Population
This study was a retrospective analysis of all patients discharged from hospital members of the University HealthSystem Consortium's (UHC) Clinical Data Base between October 2007 and April 2008. The data set was limited to patient discharge records with at least 1 of 10 HACs for which CMS no longer provides additional reimbursement (see Supporting Table 1 in the online version of this article). The presence of an HAC was indicated by the corresponding diagnosis code using the ICD‐9 diagnosis and procedure codes.
Data Source
UHC's Clinical Data Base is a database of patient discharge‐level administrative data used primarily for billing purposes. UHC's Clinical Data Base provides comparative data for in‐hospital healthcare outcomes using encounter‐level and line‐item transactional information from each member organization. UHC is a nonprofit alliance of 116 academic medical centers and 276 of their affiliated hospitals.
Dependent Variable: Change in MS‐DRG Assignment
The dependent variable was a change in MS‐DRG assignment. MS‐DRG assignment was calculated by comparing the MS‐DRG assigned when the HAC's ICD‐9 diagnosis code was considered a no‐payment event and was not included in the determination (ie, post‐policy DRG) with the MS‐DRG that would have been assigned when the HAC was not included in the determination (ie, pre‐policy DRG). The list of ICD‐9 diagnosis codes was entered into MS‐DRG grouping software with the ICD‐9 diagnosis code for each HAC in the identical position presented to CMS. Up to 29 secondary ICD‐9 diagnosis and procedure codes were entered, but the analyses of association on the position of the HAC used the first 9 diagnosis and 6 procedure codes processed by CMS, as only codes in these positions would have changed the MS‐DRG assigned during the study time period. If the 2 MS‐DRGs (pre‐policy DRG and post‐policy DRG) did not match, the case was classified as having a change in MS‐DRG assignment (MS‐DRG change).
Independent variables included in this analysis were coding variables and patient characteristics. Coding variables included the total number of ICD‐9 diagnosis codes recorded in the discharge record, absolute position of the HAC ICD‐9 diagnosis code in the order of all diagnosis codes, weight for the actual MS‐DRG, and specific type of HAC. The absolute position of the HAC was included in the analysis as a categorical variable (second position, third, fourth, fifth, and sixth position and higher). In addition, patient‐level characteristics including sociodemographic characteristics, clinical factors and severity of illness (minor, moderate, major, extreme),[6] and hospital‐level characteristics.
Statistical Analysis
Means and standard deviations or frequencies and percentages were used to describe the variables. A 2 test was used to test for differences in the absolute position of the HAC with change in MS‐DRG assignment (change/no change). In addition, 2 tests were used to test for differences in each of the other categorical independent variables with change in MS‐DRG assignment; t tests were used to test for differences in the continuous variables with change in MS‐DRG assignment.
Two multivariable binary logistic regression models were fit to test the relationship between change in MS‐DRG assignment with the absolute position of the HAC, adjusting for coding variables, patient characteristics, and hospital characteristics that were associated with change in MS‐DRG assignment in the bivariate analysis. The first model tested the relationship between change in MS‐DRG and position of the HAC, without accounting for the specific type of HAC, and the second tested the relationship including both position and the specific type of HAC. Receiver operating characteristic (ROC) curves were developed for each model to evaluate the predictive accuracy. Additionally, analyses were stratified by severity of illness, and the areas under the ROC curves for 3 models were compared to determine whether the predictive accuracy increased with the inclusion of variables other than HAC position. The first model included HAC position only, the second model added type of HAC, and the third model added other coding variables and patient‐ and hospital‐level variables.
Two sensitivity analyses were performed to test the robustness of the results. The first analysis tested the sensitivity of the results to the specification of comorbid disease burden, as measured by number of diagnosis codes. We used Elixhauser's method[13] for identifying comorbid conditions to create binary variables indicating the presence or absence of 29 distinct comorbid conditions, then calculated the total number of comorbid conditions. The binary logistic regression model was refit, with the total number of comorbid conditions in place of the number of diagnosis codes. An additional binary logistic regression model was fit that included the individual comorbid conditions that were associated with change in MS‐DRG assignment in a bivariate analysis (P<0.05). The second sensitivity analysis evaluated whether hospital‐level variation in coding practices explained change in MS‐DRG assignment using a hierarchical binary logistic regression model that included hospital as a random effect.
All statistical analyses were conducted using the SAS version 9.2 statistical software package (SAS Institute Inc., Cary, NC). The Rush University Medical Center Institutional Review Board approved the study protocol.
RESULTS
Of the 954,946 discharges from UHC academic medical centers, 7027 patients (0.7%) had an HAC. Of the patients with an HAC, 6047 did not change MS‐DRG assignment, whereas 980 patients (13.8%) had a change in MS‐DRG assignment. Patients with a change in MS‐DRG assignment were significantly different from those without a change in MS‐DRG assignment on all patient‐level characteristics and all but 1 hospital characteristic (Table 1). The variable with the largest absolute difference between those with and without a change in MS‐DRG was the actual position of the HAC; 86.7% of those with an MS‐DRG change had their HAC in the second position, whereas those without a change had only 11.5% in the second position.
After controlling for patient and hospital characteristics, an HAC in the second position in the list of ICD‐9 codes was associated with the greatest likelihood of a change in MS‐DRG assignment (P<0.001) (Table 2). Each additional ICD‐9 code decreased the odds of an MS‐DRG change (P=0.004), demonstrating that having more secondary diagnosis codes was associated with a lesser likelihood of an MS‐DRG change. After including the individual HACs in the regression model, the second position remained associated with the likelihood of a change in MS‐DRG assignment (results not shown). The predictive accuracy of our model did not improve, however, with the addition of type of HAC. The area under the ROC curve was 0.94 in both models, indicating high predictive power.
| Intercept | Odds Ratio | P Value |
|---|---|---|
| ||
| Minor severity of illness | 6.80 | <0.001 |
| Moderate severity of illness | 5.52 | <0.001 |
| Major severity of illness | 8.02 | <0.001 |
| Number of ICD‐9 diagnosis codes per patient | 0.97 | 0.004 |
| HAC ICD‐9 diagnosis code in 2nd position | 40.52 | <0.001 |
| HAC ICD‐9 diagnosis code in 3rd position | 1.82 | 0.009 |
| HAC ICD‐9 diagnosis code in 4th position | 1.72 | 0.032 |
| HAC ICD‐9 diagnosis code in 5th position | 1.15 | 0.662 |
| Area under the ROC curve | 0.94 | <0.001* |
| Area under the ROC curve, model with patient socio‐demographic characteristics only | 0.85 | |
The proportion of cases with a change in MS‐DRG by severity of illness is reported in Table 3. The largest proportion of cases with a change in MS‐DRG was in the minor severity of illness category (41.3%), whereas only 2.6% of cases with an extreme severity of illness had a change in MS‐DRG. Figure 1 shows ROC curves stratified by severity of illness. Figure 1A illustrates the ROC curves for the 121 (1.7%) patients with minor severity of illness. The area under the ROC curve for the model including HAC position only was 0.74, indicating moderate predictive power. The inclusion of HAC type increased the predictive power to 0.91, and inclusion of sociodemographic characteristics further increased the predictive power to 0.95. Figure 1BD illustrates the ROC curves for moderate, major, and extreme severities of illness. For more severe illnesses, the predictive accuracy of the models with only HAC position were similar to the full models, demonstrating that HAC position alone had a high predictive power for change in MS‐DRG assignment.
| Variable | No. | Within Category Percent With MS‐DRG Change |
|---|---|---|
| ||
| Severity of illness | ||
| Minor | 121 | 41.3 |
| Moderate | 575 | 37.6 |
| Major | 1,917 | 31.3 |
| Extreme | 4,414 | 2.6 |
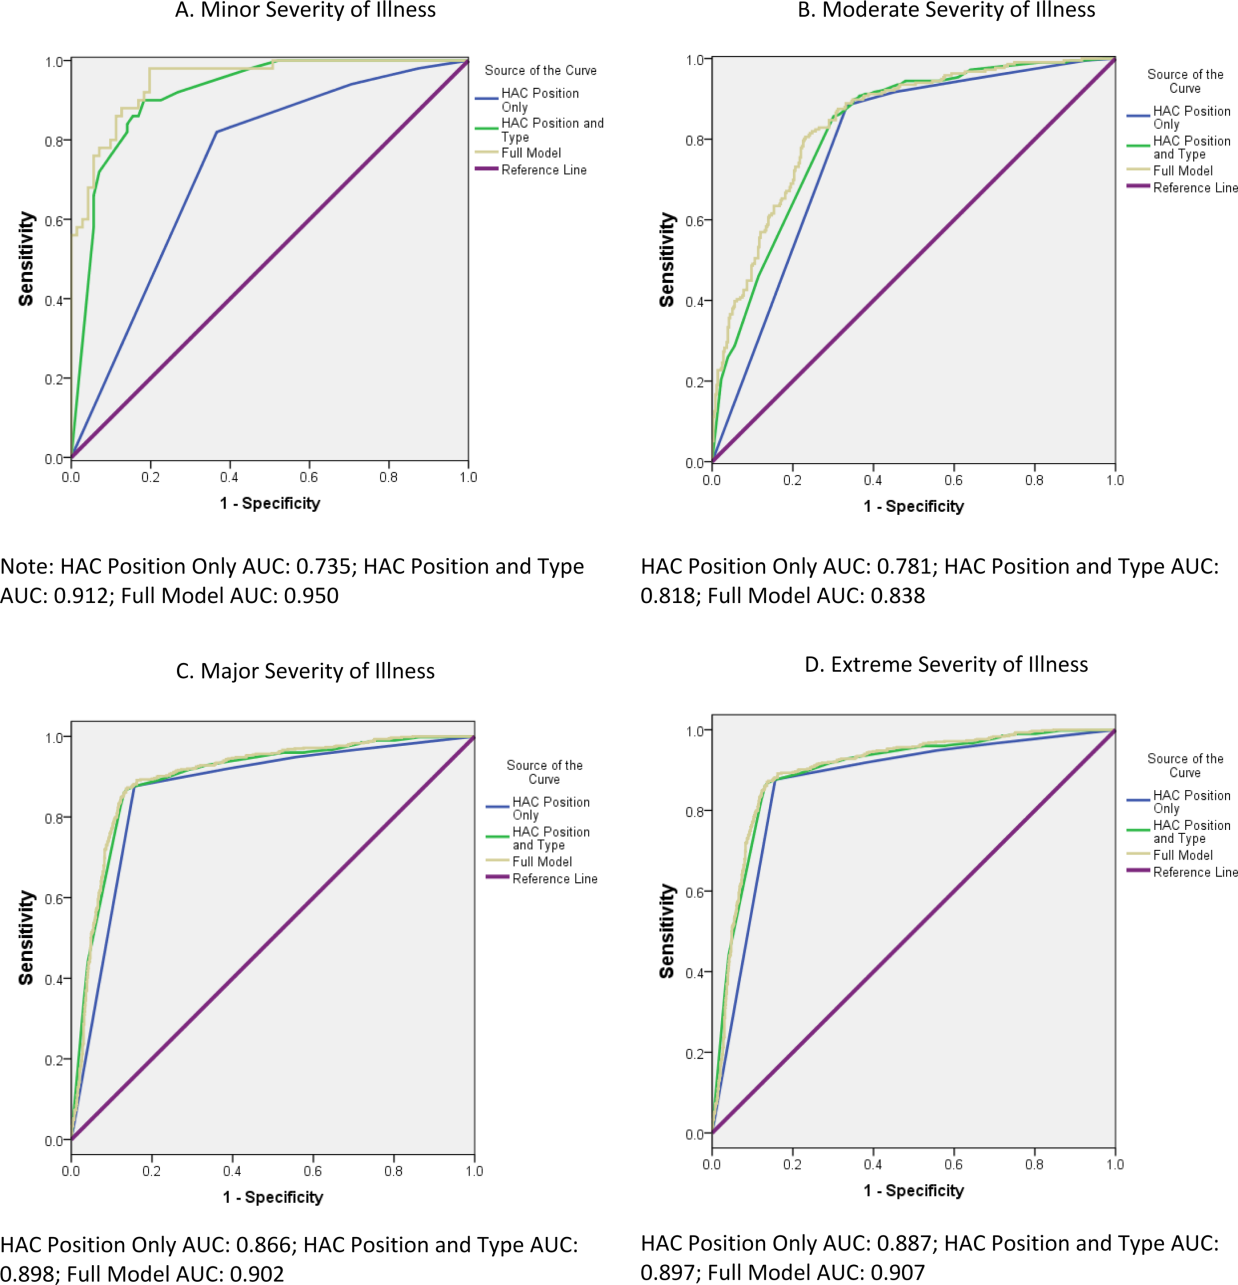
In a sensitivity analysis that evaluated the robustness of our results to the specification of disease burden, inclusion of the number of comorbid conditions did not improve the predictive accuracy of the model. Although inclusion of individual comorbid conditions rather than number of diagnosis codes attenuated the odds ratio (OR) for HAC position (OR: 40.5 in the original model vs OR: 32.9 in the model with individual comorbid conditions), the improvement of the predictive accuracy of the model was small (area under the ROC curve=0.936 in the original model vs 0.943 in the model with individual conditions, P<0.001) (results not shown). In a sensitivity analysis using a hierarchical logistic regression model that included hospital random effects, hospital‐level variation in coding practices did not attenuate the relationship between HAC position and MS‐DRG change (results not shown).
DISCUSSION
This study investigated the association of a change in MS‐DRG assignment and position of the ICD‐9 diagnosis codes for HACs in a sample of patients discharged from US academic medical centers. We found that only 14% of the MS‐DRGs for patients with an HAC would have experienced a change in DRG assignment. Our results are consistent with those of Teufack et al.,[14] who estimated the economic impact of CMS' HAC policy for neurosurgery services at a single hospital to be 0.007% of overall net revenues. Nevertheless, the majority of hospitals have increased their efforts to prevent HACs that are included in CMS' policy.[15] At the same time, most hospitals have not increased their budgets for preventing HACs, and instead have reallocated resources from nontargeted HACs to those included in CMS' policy.
The low proportion of records that are impacted by the policy may be partially explained by the fact that CMS' policy only has an impact on reimbursement for MS‐DRGs with multiple levels. For example, heart failure has 3 levels of reimbursement in the MS‐DRG system (Table 4). Prior to CMS' policy, a heart failure patient with an air embolism as an HAC would have been classified in the most severe MS‐DRG (291), whereas after implementation the patient would be classified in the least severe MS‐DRG, if no other complication or comorbidity (CC) or a major complication or comorbidity (MCC) were present. Chest pain has only 1 level, and reimbursement for a patient with an HAC and classified in the chest pain MS‐DRG would not be impacted by CMS' policy. Most hospitalized patients are complicated, and the proportion of patients who are complicated will continue to increase over time as less complex care shifts to the ambulatory setting. The relative effectiveness of CMS' policy is likely to diminish with the continued shift of care to the ambulatory setting.
| Variable | MS‐DRG | DRG Weight |
|---|---|---|
| ||
| Heart failure and shock | ||
| With major complications and comorbidities (MS‐DRG 291) | 291 | 1.5062 |
| With complications and comorbidities | 292 | 0.9952 |
| Without major complications or comorbidities | 293 | 0.6718 |
| Chest pain | 313 | 0.5992 |
Patient discharges with a diagnosis code for as HAC in the second position were substantially more likely to have a change in MS‐DRG assignment compared to cases with an HAC listed lower in the final list of diagnosis codes. Perhaps it is not surprising that MS‐DRG assignment is most likely to change when the HAC is in the second position, because an ICD‐9 diagnosis code in this position is more likely to be a major complication or comorbidity. For HACs listed in a lower position of the list of ICD‐9 diagnosis codes, it is likely that the patient had another major complication or comorbidity listed in the second position that would have maintained classification in the same MS‐DRG. Our results suggest that physicians and hospitals caring for patients with lower complexity of illness will sustain a higher financial burden as a result of an HAC under CMS' policy compared to providers whose patients sustain the exact same HAC but have underlying medical care of greater complexity.
These results raise further concerns about the ability of CMS' payment policy to improve quality. One criticism of CMS' policy is that all HACs are not universally preventable. If they are not preventable, payment reductions promulgated via the policy would be punitive rather than incentivizing. In their study of central catheter‐associated bloodstream infections and catheter‐associated urinary tract infections, for example, Lee et al. found no change in infection rates after implementation of CMS' policy.[16] As such, some have suggested HACs should not be used to determine reimbursement, and CMS should abandon its current nonpayment policy.[4, 17] Our findings echo this criticism given that the financial penalty for an HAC depends on whether a patient is more or less complex.
Because coding emanates from physician documentation, a uniform documentation process must exist to ensure nonvariable coding practices.[1, 2, 7, 9] This is not the case, however, and some hospitals comanage documentation to refine or maximize the number of ICD‐9 diagnosis and procedure codes. Furthermore, there are certain differences in the documentation practices of individual physicians. If physician documentation and coding variation leads to fewer ICD‐9 codes during an encounter, the chance that an HAC will influence MS‐DRG change increases.
Another source of variation in coding practices found in this study was code sequencing. Although guidelines for appropriate ICD‐9 diagnosis coding currently exist, individual subjectivity remains. The most essential step in the coding process is identifying the principal diagnosis by extrapolating from physician documentation and clinical data. For example, when a patient is admitted for chest pain, and after some evaluation it is determined that the patient experienced a myocardial infarction, then myocardial infarction becomes the principal diagnosis. Based on that principal diagnosis, coders must select the relevant secondary diagnoses. The process involves a series of steps that must be followed exactly in order to ensure accurate coding.[12] There are no guidelines by which coding personnel must follow to sequence secondary diagnoses, with the exception of listed MCCs and CCs prior to other secondary diagnoses. Ultimately, the order by which these codes are assigned may result in unfavorable variation in MS‐DRG assignment.[1, 2, 4, 7, 8, 9, 17]
There are a number of limitations to this study. First, our cohort included only UHC‐affiliated academic medical centers, which may not represent all acute‐care hospitals and their coding practices. Although our data are for discharges prior to implementation of the policy, we were able to analyze the anticipated impact of the policy prior to any direct or indirect changes in coding that may have occurred in response to CMS' policy. Additionally, the number of diagnosis codes accepted by CMS was expanded from 9 to 25 in 2011. Future analyses that include MS‐DRG classifications with the expanded number of diagnosis codes should be conducted to validate our findings and determine whether any changes have occurred over time. It is not known whether low illness severity scores signify patient or hospital characteristics. If they represent patient characteristics, then CMS' policy will disproportionately affect hospitals taking care of less severely ill patients. Alternatively, if hospital coding practice explains more of the variation in the number of ICD‐9 codes (and thus severity of illness), then the system of adjudicating reimbursement via HACs to incentivize quality of care will be flawed, as there is no standard position for HACs on a more lengthy diagnosis list. Finally, we did not evaluate the change in DRG weight with the reassignment of MS‐DRG if the HAC had been included in the calculation. Future work should evaluate whether there is a differential impact of the policy by change in MS‐DRG weight.
CONCLUSION
Under CMS' current policy, hospitals and physicians caring for patients with lower severity of illness and have an HAC will be penalized by CMS disproportionately more than those caring for more complex, sicker patients with the identical HAC. If, in fact, HACs are indicators of a hospital's quality of care, then the CMS policy will likely do little to foster improved quality unless there is a reduction in coding practice variation and modifications to ensure that the policy impacts reimbursement, independent of severity of illness.
Disclosures
The authors acknowledge the financial support for data acquisition from the Rush University College of Health Sciences. The authors report no conflicts of interest.
- Centers for Medicare and Medicaid Services. Hospital‐acquired conditions (present on admission indicator). Available at: http://www.cms.hhs.gov/HospitalAcqCond/05_Coding.asp#TopOfPage. Updated 2012. Accessed September 20, 2012.
- Centers for Medicare and Medicaid Services. Hospital‐acquired conditions: coding. Available at: http://www.cms.gov/Medicare/Medicare‐Fee‐for‐Service‐Payment/HospitalAcqCond/Coding.html. Updated 2012. Accessed February 2, 2012.
- ICD‐9‐CM 2009 Coders' Desk Reference for Procedures. Eden Prairie, MN: Ingenix; 2009.
- , , , . Hospital complications: linking payment reduction to preventability. Jt Comm J Qual Patient Saf. 2009;35(5):283–285.
- , , , et al. Change in MS‐DRG assignment and hospital reimbursement as a result of Centers for Medicare
One financial incentive to improve quality of care is the Centers for Medicare and Medicaid Services' (CMS) policy to not pay additionally for certain adverse events that are classified as hospital‐acquired conditions (HACs).[1, 2, 3] HACs are specific conditions that occur during the hospital stay and presumably could have been prevented.[4, 5, 6] Under the CMS policy, if an HAC occurs during a patient's stay, that condition is not included in the Medicare Severity Diagnosis‐Related Group (MS‐DRG) assignment.
The MS‐DRG assigned to a patient discharge determines reimbursement. Each MS‐DRG is assigned a weight, which is used to adjust for the fact that the treatment of different conditions consume different resources and have difference costs. Groups of patients who are expected to require above‐average resources have a higher weight than those who require fewer resources, and higher‐weighted MS‐DRG assignment results in a higher payment. In some cases, the inclusion of the diagnosis code of an HAC in the determination of the MS‐DRG results in a higher complexity level and higher DRG weight. The policy is designed to shift the incremental costs associated with treating the HAC to the hospital. As of October 2009, there were 10 HACs included in the CMS nonpayment program (see Supporting Table 1 in the online version of this article). CMS expanded the list of HACs to include 13 conditions in 2013.
| Variable | MS‐DRG Change, No. (%) or MSD, N=980 | No MS‐DRG Change, No. (%) or MSD, N=6,047 | P Value |
|---|---|---|---|
| |||
| Patient sociodemographic characteristics | |||
| Age, y | 62.718.9 | 57.521.9 | <0.001 |
| Race | |||
| White | 687 (70.1) | 4,006 (66.3) | 0.024 |
| Black | 166 (16.9) | 1,100 (18.2) | |
| Hispanic | 45 (4.6) | 416 (6.9) | |
| Other | 82 (8.4) | 525 (8.7) | |
| Sex | <0.001 | ||
| Male | 441 (45.0) | 3,298 (54.5) | |
| Female | 539 (55.0) | 2,749 (45.5) | |
| Payer | <0.001 | ||
| Commercial | 279 (28.5) | 1,609 (26.6) | |
| Medicaid | 88 (9.0) | 910 (15.1) | |
| Medicare | 532 (54.3) | 3,003 (49.7) | |
| Self‐pay/charity | 52 (5.3) | 331 (5.5) | |
| Other | 29 (3.0) | 194 (3.2) | |
| Severity of illness | <0.001 | ||
| Minor | 50 (5.1) | 71 (1.2) | |
| Moderate | 216 (22.0) | 359 (5.9) | |
| Major | 599 (61.1) | 1,318 (21.8) | |
| Extreme | 115 (11.7) | 4,299 (71.1) | |
| Patient clinical characteristics | |||
| Number of ICD‐9 diagnosis codes per patient | 13.76.0 | 20.26.6 | <0.001 |
| MS‐DRG weight | 2.92.1 | 5.96.1 | <0.001 |
| Hospital characteristics | |||
| Mean number of ICD‐9 diagnosis codes per patient per hospital | 8.51.4 | 8.61.4 | 0.280 |
| Total hospital discharges | 15,9576,553 | 16,8576,634 | <0.001 |
| HACs per 1,000 discharges | 9.83.7 | 10.23.7 | <0.001 |
| Hospital‐acquired condition | |||
| Type of HAC | <0.001 | ||
| Pressure ulcer | 334 (34.1) | 1,599 (26.4) | |
| Falls/trauma | 96 (9.8) | 440 (7.3) | |
| Catheter‐associated UTI | 19 (1.9) | 215 (3.6) | |
| Vascular catheter infection | 26 (2.7) | 1,179 (19.5) | |
| DVT/pulmonary embolism | 448 (45.7) | 2,145 (35.5) | |
| Other conditions | 57 (5.8) | 469 (7.8) | |
| HAC position | <0.001 | ||
| 2nd code | 850 (86.7) | 697 (11.5) | |
| 3rd code | 45 (4.6) | 739 (12.2) | |
| 4th code | 30 (3.1) | 641 (10.6) | |
| 5th code | 15 (1.5) | 569 (9.4) | |
| 6th code or higher | 40 (4.1) | 3,401 (56.2) | |
Withholding additional reimbursement for an HAC has been controversial. One area of debate is that the assignment of an HAC may be imprecise, in part due to the variation in how physicians document in the medical record.[1, 2, 6, 7, 8, 9] Coding is derived from documentation in physician notes and is the primary mechanism for assigning International Classification of Diseases, 9th Revision, Clinical Modification (ICD‐9) diagnosis codes to the patient's encounter. The coding process begins with health information technicians (ie, medical record coders) reviewing all medical record documentation to assign diagnosis and procedure codes using the ICD‐9 codes.[10] Primary and secondary diagnoses are determined by certain definitions in the hospital setting. Secondary diagnoses can be further separated into complications or comorbidities in the MS‐DRG system, which can affect reimbursement. The MS‐DRG is then determined using these diagnosis and procedure codes. Physician documentation is the principal source of data for hospital billing, because health information technicians (ie, medical record coders) must assign a code based on what is documented in the chart. If key medical detail is missing or language is ambiguous, then coding can be inaccurate, which may lead to inappropriate compensation.[11]
Accurate and complete ICD‐9 diagnosis and procedure coding is essential for correct MS‐DRG assignment and reimbursement.[12] Physicians may influence coding prioritization by either over‐emphasizing a patient diagnosis or by downplaying the significance of new findings. In addition, unless the physician uses specific, accurate, and accepted terminology, the diagnosis may not even appear in the list of diagnosis codes. Medical records with nonstandard abbreviations may result in coder‐omission of key diagnoses. Finally, when clinicians use qualified diagnoses such as rule‐out or probable, the final diagnosis coded may not be accurate.[10]
Although the CMS policy creates a financial incentive for hospitals to improve quality, the extent to which the policy actually impacts reimbursement across multiple HACs has not been quantified. Additionally, if HACsas a policy initiativereflect actual quality of care, then the position of the ICD‐9 code should not affect MS‐DRG assignment. In this study we evaluated the extent to which MS‐DRG assignment would have been influenced by the presence of an HAC and tested the association of the position of an HAC in the list of ICD‐9 diagnosis codes with changes in MS‐DRG assignment.
METHODS
Study Population
This study was a retrospective analysis of all patients discharged from hospital members of the University HealthSystem Consortium's (UHC) Clinical Data Base between October 2007 and April 2008. The data set was limited to patient discharge records with at least 1 of 10 HACs for which CMS no longer provides additional reimbursement (see Supporting Table 1 in the online version of this article). The presence of an HAC was indicated by the corresponding diagnosis code using the ICD‐9 diagnosis and procedure codes.
Data Source
UHC's Clinical Data Base is a database of patient discharge‐level administrative data used primarily for billing purposes. UHC's Clinical Data Base provides comparative data for in‐hospital healthcare outcomes using encounter‐level and line‐item transactional information from each member organization. UHC is a nonprofit alliance of 116 academic medical centers and 276 of their affiliated hospitals.
Dependent Variable: Change in MS‐DRG Assignment
The dependent variable was a change in MS‐DRG assignment. MS‐DRG assignment was calculated by comparing the MS‐DRG assigned when the HAC's ICD‐9 diagnosis code was considered a no‐payment event and was not included in the determination (ie, post‐policy DRG) with the MS‐DRG that would have been assigned when the HAC was not included in the determination (ie, pre‐policy DRG). The list of ICD‐9 diagnosis codes was entered into MS‐DRG grouping software with the ICD‐9 diagnosis code for each HAC in the identical position presented to CMS. Up to 29 secondary ICD‐9 diagnosis and procedure codes were entered, but the analyses of association on the position of the HAC used the first 9 diagnosis and 6 procedure codes processed by CMS, as only codes in these positions would have changed the MS‐DRG assigned during the study time period. If the 2 MS‐DRGs (pre‐policy DRG and post‐policy DRG) did not match, the case was classified as having a change in MS‐DRG assignment (MS‐DRG change).
Independent variables included in this analysis were coding variables and patient characteristics. Coding variables included the total number of ICD‐9 diagnosis codes recorded in the discharge record, absolute position of the HAC ICD‐9 diagnosis code in the order of all diagnosis codes, weight for the actual MS‐DRG, and specific type of HAC. The absolute position of the HAC was included in the analysis as a categorical variable (second position, third, fourth, fifth, and sixth position and higher). In addition, patient‐level characteristics including sociodemographic characteristics, clinical factors and severity of illness (minor, moderate, major, extreme),[6] and hospital‐level characteristics.
Statistical Analysis
Means and standard deviations or frequencies and percentages were used to describe the variables. A 2 test was used to test for differences in the absolute position of the HAC with change in MS‐DRG assignment (change/no change). In addition, 2 tests were used to test for differences in each of the other categorical independent variables with change in MS‐DRG assignment; t tests were used to test for differences in the continuous variables with change in MS‐DRG assignment.
Two multivariable binary logistic regression models were fit to test the relationship between change in MS‐DRG assignment with the absolute position of the HAC, adjusting for coding variables, patient characteristics, and hospital characteristics that were associated with change in MS‐DRG assignment in the bivariate analysis. The first model tested the relationship between change in MS‐DRG and position of the HAC, without accounting for the specific type of HAC, and the second tested the relationship including both position and the specific type of HAC. Receiver operating characteristic (ROC) curves were developed for each model to evaluate the predictive accuracy. Additionally, analyses were stratified by severity of illness, and the areas under the ROC curves for 3 models were compared to determine whether the predictive accuracy increased with the inclusion of variables other than HAC position. The first model included HAC position only, the second model added type of HAC, and the third model added other coding variables and patient‐ and hospital‐level variables.
Two sensitivity analyses were performed to test the robustness of the results. The first analysis tested the sensitivity of the results to the specification of comorbid disease burden, as measured by number of diagnosis codes. We used Elixhauser's method[13] for identifying comorbid conditions to create binary variables indicating the presence or absence of 29 distinct comorbid conditions, then calculated the total number of comorbid conditions. The binary logistic regression model was refit, with the total number of comorbid conditions in place of the number of diagnosis codes. An additional binary logistic regression model was fit that included the individual comorbid conditions that were associated with change in MS‐DRG assignment in a bivariate analysis (P<0.05). The second sensitivity analysis evaluated whether hospital‐level variation in coding practices explained change in MS‐DRG assignment using a hierarchical binary logistic regression model that included hospital as a random effect.
All statistical analyses were conducted using the SAS version 9.2 statistical software package (SAS Institute Inc., Cary, NC). The Rush University Medical Center Institutional Review Board approved the study protocol.
RESULTS
Of the 954,946 discharges from UHC academic medical centers, 7027 patients (0.7%) had an HAC. Of the patients with an HAC, 6047 did not change MS‐DRG assignment, whereas 980 patients (13.8%) had a change in MS‐DRG assignment. Patients with a change in MS‐DRG assignment were significantly different from those without a change in MS‐DRG assignment on all patient‐level characteristics and all but 1 hospital characteristic (Table 1). The variable with the largest absolute difference between those with and without a change in MS‐DRG was the actual position of the HAC; 86.7% of those with an MS‐DRG change had their HAC in the second position, whereas those without a change had only 11.5% in the second position.
After controlling for patient and hospital characteristics, an HAC in the second position in the list of ICD‐9 codes was associated with the greatest likelihood of a change in MS‐DRG assignment (P<0.001) (Table 2). Each additional ICD‐9 code decreased the odds of an MS‐DRG change (P=0.004), demonstrating that having more secondary diagnosis codes was associated with a lesser likelihood of an MS‐DRG change. After including the individual HACs in the regression model, the second position remained associated with the likelihood of a change in MS‐DRG assignment (results not shown). The predictive accuracy of our model did not improve, however, with the addition of type of HAC. The area under the ROC curve was 0.94 in both models, indicating high predictive power.
| Intercept | Odds Ratio | P Value |
|---|---|---|
| ||
| Minor severity of illness | 6.80 | <0.001 |
| Moderate severity of illness | 5.52 | <0.001 |
| Major severity of illness | 8.02 | <0.001 |
| Number of ICD‐9 diagnosis codes per patient | 0.97 | 0.004 |
| HAC ICD‐9 diagnosis code in 2nd position | 40.52 | <0.001 |
| HAC ICD‐9 diagnosis code in 3rd position | 1.82 | 0.009 |
| HAC ICD‐9 diagnosis code in 4th position | 1.72 | 0.032 |
| HAC ICD‐9 diagnosis code in 5th position | 1.15 | 0.662 |
| Area under the ROC curve | 0.94 | <0.001* |
| Area under the ROC curve, model with patient socio‐demographic characteristics only | 0.85 | |
The proportion of cases with a change in MS‐DRG by severity of illness is reported in Table 3. The largest proportion of cases with a change in MS‐DRG was in the minor severity of illness category (41.3%), whereas only 2.6% of cases with an extreme severity of illness had a change in MS‐DRG. Figure 1 shows ROC curves stratified by severity of illness. Figure 1A illustrates the ROC curves for the 121 (1.7%) patients with minor severity of illness. The area under the ROC curve for the model including HAC position only was 0.74, indicating moderate predictive power. The inclusion of HAC type increased the predictive power to 0.91, and inclusion of sociodemographic characteristics further increased the predictive power to 0.95. Figure 1BD illustrates the ROC curves for moderate, major, and extreme severities of illness. For more severe illnesses, the predictive accuracy of the models with only HAC position were similar to the full models, demonstrating that HAC position alone had a high predictive power for change in MS‐DRG assignment.
| Variable | No. | Within Category Percent With MS‐DRG Change |
|---|---|---|
| ||
| Severity of illness | ||
| Minor | 121 | 41.3 |
| Moderate | 575 | 37.6 |
| Major | 1,917 | 31.3 |
| Extreme | 4,414 | 2.6 |
In a sensitivity analysis that evaluated the robustness of our results to the specification of disease burden, inclusion of the number of comorbid conditions did not improve the predictive accuracy of the model. Although inclusion of individual comorbid conditions rather than number of diagnosis codes attenuated the odds ratio (OR) for HAC position (OR: 40.5 in the original model vs OR: 32.9 in the model with individual comorbid conditions), the improvement of the predictive accuracy of the model was small (area under the ROC curve=0.936 in the original model vs 0.943 in the model with individual conditions, P<0.001) (results not shown). In a sensitivity analysis using a hierarchical logistic regression model that included hospital random effects, hospital‐level variation in coding practices did not attenuate the relationship between HAC position and MS‐DRG change (results not shown).
DISCUSSION
This study investigated the association of a change in MS‐DRG assignment and position of the ICD‐9 diagnosis codes for HACs in a sample of patients discharged from US academic medical centers. We found that only 14% of the MS‐DRGs for patients with an HAC would have experienced a change in DRG assignment. Our results are consistent with those of Teufack et al.,[14] who estimated the economic impact of CMS' HAC policy for neurosurgery services at a single hospital to be 0.007% of overall net revenues. Nevertheless, the majority of hospitals have increased their efforts to prevent HACs that are included in CMS' policy.[15] At the same time, most hospitals have not increased their budgets for preventing HACs, and instead have reallocated resources from nontargeted HACs to those included in CMS' policy.
The low proportion of records that are impacted by the policy may be partially explained by the fact that CMS' policy only has an impact on reimbursement for MS‐DRGs with multiple levels. For example, heart failure has 3 levels of reimbursement in the MS‐DRG system (Table 4). Prior to CMS' policy, a heart failure patient with an air embolism as an HAC would have been classified in the most severe MS‐DRG (291), whereas after implementation the patient would be classified in the least severe MS‐DRG, if no other complication or comorbidity (CC) or a major complication or comorbidity (MCC) were present. Chest pain has only 1 level, and reimbursement for a patient with an HAC and classified in the chest pain MS‐DRG would not be impacted by CMS' policy. Most hospitalized patients are complicated, and the proportion of patients who are complicated will continue to increase over time as less complex care shifts to the ambulatory setting. The relative effectiveness of CMS' policy is likely to diminish with the continued shift of care to the ambulatory setting.
| Variable | MS‐DRG | DRG Weight |
|---|---|---|
| ||
| Heart failure and shock | ||
| With major complications and comorbidities (MS‐DRG 291) | 291 | 1.5062 |
| With complications and comorbidities | 292 | 0.9952 |
| Without major complications or comorbidities | 293 | 0.6718 |
| Chest pain | 313 | 0.5992 |
Patient discharges with a diagnosis code for as HAC in the second position were substantially more likely to have a change in MS‐DRG assignment compared to cases with an HAC listed lower in the final list of diagnosis codes. Perhaps it is not surprising that MS‐DRG assignment is most likely to change when the HAC is in the second position, because an ICD‐9 diagnosis code in this position is more likely to be a major complication or comorbidity. For HACs listed in a lower position of the list of ICD‐9 diagnosis codes, it is likely that the patient had another major complication or comorbidity listed in the second position that would have maintained classification in the same MS‐DRG. Our results suggest that physicians and hospitals caring for patients with lower complexity of illness will sustain a higher financial burden as a result of an HAC under CMS' policy compared to providers whose patients sustain the exact same HAC but have underlying medical care of greater complexity.
These results raise further concerns about the ability of CMS' payment policy to improve quality. One criticism of CMS' policy is that all HACs are not universally preventable. If they are not preventable, payment reductions promulgated via the policy would be punitive rather than incentivizing. In their study of central catheter‐associated bloodstream infections and catheter‐associated urinary tract infections, for example, Lee et al. found no change in infection rates after implementation of CMS' policy.[16] As such, some have suggested HACs should not be used to determine reimbursement, and CMS should abandon its current nonpayment policy.[4, 17] Our findings echo this criticism given that the financial penalty for an HAC depends on whether a patient is more or less complex.
Because coding emanates from physician documentation, a uniform documentation process must exist to ensure nonvariable coding practices.[1, 2, 7, 9] This is not the case, however, and some hospitals comanage documentation to refine or maximize the number of ICD‐9 diagnosis and procedure codes. Furthermore, there are certain differences in the documentation practices of individual physicians. If physician documentation and coding variation leads to fewer ICD‐9 codes during an encounter, the chance that an HAC will influence MS‐DRG change increases.
Another source of variation in coding practices found in this study was code sequencing. Although guidelines for appropriate ICD‐9 diagnosis coding currently exist, individual subjectivity remains. The most essential step in the coding process is identifying the principal diagnosis by extrapolating from physician documentation and clinical data. For example, when a patient is admitted for chest pain, and after some evaluation it is determined that the patient experienced a myocardial infarction, then myocardial infarction becomes the principal diagnosis. Based on that principal diagnosis, coders must select the relevant secondary diagnoses. The process involves a series of steps that must be followed exactly in order to ensure accurate coding.[12] There are no guidelines by which coding personnel must follow to sequence secondary diagnoses, with the exception of listed MCCs and CCs prior to other secondary diagnoses. Ultimately, the order by which these codes are assigned may result in unfavorable variation in MS‐DRG assignment.[1, 2, 4, 7, 8, 9, 17]
There are a number of limitations to this study. First, our cohort included only UHC‐affiliated academic medical centers, which may not represent all acute‐care hospitals and their coding practices. Although our data are for discharges prior to implementation of the policy, we were able to analyze the anticipated impact of the policy prior to any direct or indirect changes in coding that may have occurred in response to CMS' policy. Additionally, the number of diagnosis codes accepted by CMS was expanded from 9 to 25 in 2011. Future analyses that include MS‐DRG classifications with the expanded number of diagnosis codes should be conducted to validate our findings and determine whether any changes have occurred over time. It is not known whether low illness severity scores signify patient or hospital characteristics. If they represent patient characteristics, then CMS' policy will disproportionately affect hospitals taking care of less severely ill patients. Alternatively, if hospital coding practice explains more of the variation in the number of ICD‐9 codes (and thus severity of illness), then the system of adjudicating reimbursement via HACs to incentivize quality of care will be flawed, as there is no standard position for HACs on a more lengthy diagnosis list. Finally, we did not evaluate the change in DRG weight with the reassignment of MS‐DRG if the HAC had been included in the calculation. Future work should evaluate whether there is a differential impact of the policy by change in MS‐DRG weight.
CONCLUSION
Under CMS' current policy, hospitals and physicians caring for patients with lower severity of illness and have an HAC will be penalized by CMS disproportionately more than those caring for more complex, sicker patients with the identical HAC. If, in fact, HACs are indicators of a hospital's quality of care, then the CMS policy will likely do little to foster improved quality unless there is a reduction in coding practice variation and modifications to ensure that the policy impacts reimbursement, independent of severity of illness.
Disclosures
The authors acknowledge the financial support for data acquisition from the Rush University College of Health Sciences. The authors report no conflicts of interest.
- Centers for Medicare and Medicaid Services. Hospital‐acquired conditions (present on admission indicator). Available at: http://www.cms.hhs.gov/HospitalAcqCond/05_Coding.asp#TopOfPage. Updated 2012. Accessed September 20, 2012.
- Centers for Medicare and Medicaid Services. Hospital‐acquired conditions: coding. Available at: http://www.cms.gov/Medicare/Medicare‐Fee‐for‐Service‐Payment/HospitalAcqCond/Coding.html. Updated 2012. Accessed February 2, 2012.
- ICD‐9‐CM 2009 Coders' Desk Reference for Procedures. Eden Prairie, MN: Ingenix; 2009.
- , , , . Hospital complications: linking payment reduction to preventability. Jt Comm J Qual Patient Saf. 2009;35(5):283–285.
- , , , et al. Change in MS‐DRG assignment and hospital reimbursement as a result of Centers for Medicare
© 2014 Society of Hospital Medicine

Hospital and Primary Care Collaboration
Poorly coordinated care between hospital and outpatient settings contributes to medical errors, poor outcomes, and high costs.[1, 2, 3] Recent policy has sought to motivate better care coordination after hospital discharge. Financial penalties for excessive hospital readmissionsa perceived marker of poorly coordinated carehave motivated hospitals to adopt transitional care programs to improve postdischarge care coordination.[4] However, the success of hospital‐initiated transitional care strategies in reducing hospital readmissions has been limited.[5] This may be due to the fact that many factors driving hospital readmissions, such as chronic medical illness, patient education, and availability of outpatient care, are outside of a hospital's control.[5, 6] Even among the most comprehensive hospital‐based transitional care intervention strategies, there is little evidence of active engagement of primary care providers or collaboration between hospitals and primary care practices in the transitional care planning process.[5] Better engagement of primary care into transitional care strategies may improve postdischarge care coordination.[7, 8]
The potential benefits of collaboration are particularly salient in healthcare safety nets.[9] The US health safety net is a patchwork of providers, funding, and programs unified by a shared missiondelivering care to patients regardless of ability to payrather than a coordinated system with shared governance.[9] Safety‐net hospitals are at risk for higher‐than‐average readmissions penalties.[10, 11] Medicaid expansion under the Affordable Care Act will likely increase demand for services in these settings, which could worsen fragmentation of care as a result of strained capacity.[12] Collaboration between hospitals and primary care clinics in the safety net could help overcome fragmentation, improve efficiencies in care, and reduce costs and readmissions.[12, 13, 14, 15]
Despite the potential benefits, we found no studies on how to enable collaboration between hospitals and primary care. We sought to understand systems‐level factors limiting and facilitating collaboration between hospitals and primary care practices around coordinating inpatient‐to‐outpatient care transitions by conducting a qualitative study, focusing on the perspective of primary care leaders in the safety net.
STUDY DATA AND METHODS
We conducted semistructured telephone interviews with primary care leaders in health safety nets across California from August 2012 through October 2012, prior to the implementation of the federal hospital readmissions penalties program. Primary care leaders were defined as clinicians or nonclinicians holding leadership positions, including chief executive officers, clinic medical directors, and local experts in care coordination or quality improvement. We defined safety‐net clinics as federally qualified health centers (FQHCs) and/or FQHC Look‐Alikes (clinics that meet eligibility requirements and receive the same benefits as FQHCs, except for Public Health Service Section 330 grants), community health centers, and public hospital‐affiliated clinics operating under a traditional fee‐for‐service model and serving a high proportion of Medicaid and uninsured patients.[9, 16] We defined public hospitals as government‐owned hospitals that provide care for individuals with limited access elsewhere.[17]
Sampling and Recruitment
We purposefully sampled participants to maximize diversity in geographic region, metropolitan status,[18] and type of county health delivery system to enable identification of common themes across different settings and contexts. Delivery systems were defined as per the Insure the Uninsured Project, a 501(c)(3) nonprofit organization that conducts research on the uninsured in California.[19] Provider systems are counties with a public hospital; payer systems are counties that contract with private hospitals to deliver uncompensated care in place of a public hospital; and County Medical Services Program is a state program that administers county health care in participating small counties, in lieu of a provider or payer system. We used the county delivery system type as a composite proxy of available county resources and market context given variations in funding, access, and eligibility by system type.
Participants were identified through online public directories, community clinic consortiums, and departments of public health websites. Additional participants were sought using snowball sampling. Potential participants were e‐mailed a recruitment letter describing the study, its purpose, topics to be covered, and confidentiality assurance. Participants who did not respond were called or e‐mailed within 1 week. When initial recruitment was unsuccessful, we attempted to recruit another participant within the same organization when possible. We recruited participants until reaching thematic saturation (i.e., no further new themes emerged from our interviews).[20] No participants were recruited through snowballing.
Data Collection and Interview Guides
We conducted in‐depth, semistructured interviews using interview guides informed by existing literature on collaboration and integration across healthcare systems[21, 22, 23] (see Supporting Information, Appendix 1, in the online version of this article). Interviews were digitally recorded and professionally transcribed verbatim.
We obtained contextual information for settings represented by each respondent, such as number of clinics and annual visits, through the California Primary Care Annual Utilization Data Report and clinic websites.[24]
Analysis
We employed thematic analysis[25] using an inductive framework to identify emergent and recurring themes. We developed and refined a coding template iteratively. Our multidisciplinary team included 2 general internists (O.K.N., L.E.G), 1 hospitalist (S.R.G.), a clinical nurse specialist with a doctorate in nursing (A.L.), and research staff with a public health background (J.K.). Two team members (O.K.N., J.K.) systematically coded all transcripts. Disagreements in coding were resolved through negotiated consensus. All investigators reviewed and discussed identified themes. We emailed summary findings to participants for confirmation to enhance the reliability of our findings.
The institutional review board at the University of California, San Francisco approved the study protocol.
RESULTS
Of 52 individuals contacted from 39 different organizations, 23 did not respond, 4 declined to participate, and 25 were scheduled for an interview. We interviewed 22 primary care leaders across 11 California counties (Table 1) and identified themes around factors influencing collaboration with hospitals (Table 2). Most respondents had prior positive experiences collaborating with hospitals on small, focused projects. However, they asserted the need for better hospitalclinic collaboration, and thought collaboration was critical to achieving high‐quality care transitions. We did not observe any differences in perspectives expressed by clinician versus nonclinician leaders. Nonparticipants were more likely than participants to be from northern rural or central counties, FQHCs, and smaller clinic settings.
| |
| Leadership position | No. (%) |
| Chief executive officer or equivalent* | 9 (41) |
| Chief medical officer or medical director | 7 (32) |
| Other | 6 (27) |
| Clinical experience | |
| Physician (MD or DO) | 15 (68) |
| Registered nurse | 1 (5) |
| Nonclinician | 6 (27) |
| Clinic setting | |
| Clinic type | |
| FQHC and FQHC Look‐Alikes | 15 (68) |
| Hospital based | 2 (9) |
| Other | 5 (23) |
| No. of clinics in system | |
| 14 | 9 (41) |
| 59 | 6 (27) |
| 10 | 7 (32) |
| Annual no. of visits | |
| <100,000 | 9 (41) |
| 100,000499,999 | 11 (50) |
| 500,000 | 2 (9) |
| County characteristics | |
| Health delivery system type | |
| Provider | 13 (59) |
| Payer | 2 (9) |
| County Medical Services Program∥ | 7 (32) |
| Rural county | 7 (32) |
| Theme | Subtheme | Quote |
|---|---|---|
| ||
| Lack of institutional financial incentives for collaboration. | Collaboration may lead to increased responsibility without reimbursement for clinic. | Where the [payment] model breaks down is that the savings is only to the hospital; and there's an expectation on our part to go ahead and take on those additional patients. If that $400,000 savings doesn't at least have a portion to the team that's going to help keep the people out of the hospital, then it won't work. (Participant 17) |
| Collaboration may lead to competition from the hospital for primary care patients. | Our biggest issues with working with the hospital[are] that we have a finite number of [Medicaid] patients [in our catchment area for whom] you get larger reimbursement. For a federally qualified health center, it is [crucial] to ensure we have a revenue stream that helps us take care of the uninsured. So you can see the natural kind of conflict when your pool of patients is very small. (Participant 10) | |
| Collaboration may lead to increased financial risk for the hospital. | 70% to 80% of our adult patients have no insurance and the fact is that none of these hospitals want those patients. They do get disproportionate hospital savings and other thingsbut they don't have a strong business model when they have uninsured patients coming in their doors. That's just the reality. (Participant 21) | |
| Collaboration may lead to decreased financial risk for the hospital. | Most of these patients either have very low reimbursement or no reimbursement, and so [the hospital doesn't] really want these people to end up in very expensive care because it's a burden on their systemphilosophically, everyone agrees that if we keep people well in the outpatient setting, that would be better for everyone. No, there is no financial incentive whatsoever for [the hospital] to not work with us. [emphasis added] (Participant 18) | |
| Competing priorities limit primary care's ability to focus on care transitions. | I wouldn't say [improving care transitions is a high priority]. It's not because we don't want to do the job. We have other priorities. [T]he big issue is access. There's a massive demand for primary care in our communityand we're just trying to make sure we have enough capacity. [There are] requirements HRSA has been asking of health centers and other priorities. We're starting up a residency program. We're recruiting more doctors. We're upping our quality improvement processes internally. We're making a reinvestment in our [electronic medical record]. It never stops. (Participant 22) | |
| The multitude of [care transitions and other quality] improvement imperatives makes it difficult to focus. It's not that any one of these things necessarily represents a flawed approach. It's just that when you have a variety of folks from the national, state, and local levels who all have different ideas about what constitutes appropriate improvement, it's very hard to respond to it all at once. (Participant 6) | ||
| Mismatched expectations about the role and capacity of primary care in care transitions limit collaboration. | Perception of primary care being undervalued by hospitals as a key stakeholder in care transitions. | They just make sure the paperwork is set up.and they have it written down, See doctor in 7 days. And I think they [the hospitals] think that's where their responsibility stops. They don't actually look at our records or talk to us. (Participant 2) |
| Perceived unrealistic expectations of primary care capacity to deliver postdischarge care. | [The hospital will] send anyone that's poor to us whether they are our patient or not. [T]hey say go to [our clinic] and they'll give you your outpatient medications. [But] we're at capacity. [W]e have a 79 month wait for a [new] primary care appointment. So then, we're stuck with the ethical dilemma of [do we send the patient back to the ER/hospital] for their medication or do we just [try to] take them in? (Participant 13) | |
| The hospitals feel every undoctored patient must be ours. [But] it's not like we're sitting on our hands. We have more than enough patients. (Participant 22) | ||
| Informal affiliations and partnerships, formed through personal relationships and interpersonal networking, facilitate collaboration. | Informal affiliations arise from existing personal relationships and/or interpersonal networking. | Our CEO [has been here] for the past 40 years, and has had very deep and ongoing relationships with the [hospital]. Those doors are very wide open. (Participant 18) |
| Informal partnerships are particularly important for FQHCs. | As an FQHC we can't have any ties financially or politically, but there's a traditional connection. (Participant 2) | |
| Increasing demands on clinical productivity lead to a loss of networking opportunities. | We're one of the few clinics that has their own inpatient service. I would say that the transitions between the hospital and [our] clinic start from a much higher level than anybody else. [However] we're about to close our hospital service. It's just too much work for our [clinic] doctors. (Participant 8) | |
| There used to be a meeting once a month where quality improvement programs and issues were discussed. Our administration eliminated these in favor of productivity, to increase our numbers of patients seen. (Participant 12) | ||
| Loss of relationships with hospital personnel amplifies challenges to collaboration. | Because the primary care docs are not visible in the hospital[quality improvement] projects [become] hospital‐based. Usually they forget that we exist. (Participant 11) | |
| External funding and support can enable opportunities for networking and relationship building. | The [national stakeholder organization] has done a lot of work with us to bring us together and figure out what we're doing [across] different counties, settings, providers. (Participant 20) | |
| Electronic health records enable collaboration by improving communication between hospitals and primary care. | Lack of timely communication between inpatient and outpatient settings is a major obstacle to postdischarge care coordination. | It's a lot of effort to get medical records back. It is often not timely. Patients are going to cycle in and out of more costly acute care because we don't know that it's happening. Communication between [outpatient and inpatient] facilities is one of the most challenging issues. (Participant 13) |
| Optimism about potential of EHRs. | A lot of people are depending on [the EHR] to make a lot of communication changes [where there was] a disconnect in the past. (Participant 7) | |
| Lack of EHR interoperability. | We have an EHR that's pieced together. The [emergency department] has their own [system]. The clinics have their own. The inpatient has their own. They're all electronic but they don't all talk to each other that well. (Participant 20) | |
| Our system has reached our maximum capacity and we've had to rely on our community partners to see the overflow. [T]he difficult communication [is] magnified. (Participant 11) | ||
| Privacy and legal concerns (nonuniform application of HIPAA standards). | There is a very different view from hospital to hospital about what it is they feel that they can share legally under HIPAA or not. It's a very strange thing and it almost depends more on the chief information officer at [each] hospital and less on what the [regulations] actually say. (Participant 21) | |
| Yes, [the EHR] does communicate with the hospitals and the hospitals [communicate] back [with us]. [T]here are some technical issues, butthe biggest impediments to making the technology work are new issues around confidentiality and access. (Participant 17) | ||
| Interpersonal contact is still needed even with robust EHRs. | I think [communication between systems is] getting better [due to the EHR], but there's still quite a few holes and a sense of the loop not being completely closed. It's like when you pick up the phoneyou don't want the automated system, you want to actually talk to somebody. (Participant 18) | |
Lack of Institutional Financial Incentives for Collaboration
Primary care leaders felt that current reimbursement strategies rewarded hospitals for reducing readmissions rather than promoting shared savings with primary care. Seeking collaboration with hospitals would potentially increase clinic responsibility for postdischarge patient care without reimbursement for additional work.
In counties without public hospitals, leaders worried that collaboration with hospitals could lead to active loss of Medicaid patients from their practices. Developing closer relationships with local hospitals would enable those hospitals to redirect Medicaid patients to hospital‐owned primary care clinics, leading to a loss of important revenue and financial stability for their clinics.
A subset of these leaders also perceived that nonpublic hospitals were reluctant to collaborate with their clinics. They hypothesized that hospital leaders worried that collaborating with their primary care practices would lead to more uninsured patients at their hospitals, leading to an increase in uncompensated hospital care and reduced reimbursement. However, a second subset of leaders thought that nonpublic hospitals had increased financial incentives to collaborate with safety‐net clinics, because improved coordination with outpatient care could prevent uncompensated hospital care.
Competing Clinic Priorities Limit Primary Care Ability to Focus on Care Transitions
Clinic leaders struggled to balance competing priorities, including strained clinic capacity, regulatory/accreditation requirements, and financial strain. New patient‐centered medical home initiatives, which improve primary care financial incentives for postdischarge care coordination, were perceived as well intentioned but added to an overwhelming burden of ongoing quality improvement efforts.
Mismatched Expectations About the Role and Capacity of Primary Care in Care Transitions Limits Collaboration
Many leaders felt that hospitals undervalued the role of primary care as stakeholders in improving care transitions. They perceived that hospitals made little effort to directly contact primary care physicians about their patients' hospitalizations and discharges. Leaders were frustrated that hospitals had unrealistic expectations of primary care to deliver timely postdischarge care, given their strained capacity. Consequently, some were reluctant to seek opportunities to collaborate with hospitals to improve care transitions.
Informal Affiliations and Partnerships, Formed Through Personal Relationships and Interpersonal Networking, Facilitate Collaboration
Informal affiliations between hospitals and primary care clinics helped improve awareness of organizational roles and capacity and create a sense of shared mission, thus enabling collaboration in spite of other barriers. Such affiliations arose from existing, longstanding personal relationships and/or interpersonal networking between individual providers across settings. These informal affiliations were important for safety‐net clinics that were FQHCs or FQHC Look‐Alikes, because formal hospital affiliations are discouraged by federal regulations.[26]
Opportunities for building relationships and networking with hospital personnel arose when clinic physicians had hospital admitting privileges. This on‐site presence facilitated personal relationships and communication between clinic and hospital physicians, thus enabling better collaboration. However, increasing demands on outpatient clinical productivity often made a hospital presence infeasible. One health system promoted interpersonal networking through regular meetings between the clinic and the local hospital to foster collaboration on quality improvement and care delivery; however, clinical productivity demands ultimately took priority over these meetings. Although delegating inpatient care to hospitalists enabled clinics to maximize their productivity, it also decreased opportunities for networking, and consequently, clinic physicians felt their voices and opinions were not represented in improvement initiatives.
Outside funding and support, such as incentive programs and conferences sponsored by local health plans, clinic consortiums, or national stakeholder organizations, enabled the most successful networking. These successes were independent of whether the clinic staff rounded in the hospital.
Electronic Health Records Enable Collaboration By Improving Communication Between Hospitals And Primary Care
Challenges in communication and information flow were also challenges to collaboration with hospitals. No respondents reported receiving routine notification of patient hospitalizations at the time of admission. Many clinics were dedicating significant attention to implementing electronic health record (EHR) systems to receive financial incentives associated with meaningful use.[27] Implementation of EHRs helped mitigate issues with communication with hospitals, though to a lesser degree than expected. Clinics early in the process of EHR adoption were optimistic about the potential of EHRs to improve communication with hospitals. However, clinic leaders in settings with greater EHR experience were more guarded in their enthusiasm. They observed that lack of interoperability between clinic and hospital EHRs was a persistent and major issue in spite of meaningful use standards, limiting timely flow of information across settings. Even when hospitals and their associated clinics had integrated or interoperable EHRs (n=3), or were working toward EHR integration (n=5), the need to expand networks to include other community healthcare settings using different systems presented ongoing challenges to achieving seamless communication due to a lack of interoperability.
When information sharing was technically feasible, leaders noted that inconsistent understanding and application of privacy rules dictated by the Health Insurance Portability and Accountability Act (HIPAA) limited information sharing. The quality and types of information shared varied widely across settings, depending on how HIPAA regulations were interpreted.
Even with robust EHRs, interpersonal contact was still perceived as crucial to enabling collaboration. EHRs were perceived to help with information flow, but did not facilitate relationship building across settings.
DISCUSSION
We found that safety‐net primary care leaders identified several barriers to collaboration with hospitals: (1) lack of financial incentives for collaboration, (2) competing priorities, (3) mismatched expectations about the role and capacity of primary care, and (4) poor communication infrastructure. Interpersonal networking and use of EHRs helped overcome these obstacles to a limited extent.
Prior studies demonstrate that early follow‐up, timely communication, and continuity with primary care after hospital discharge are associated with improved postdischarge outcomes.[8, 28, 29, 30] Despite evidence that collaboration between primary care and hospitals may help optimize postdischarge outcomes, our study is the first to describe primary care leaders' perspectives on potential targets for improving collaboration between hospitals and primary care to improve care transitions.
Our results highlight the need to modify payment models to align financial incentives across settings for collaboration. Otherwise, it may be difficult for hospitals to engage primary care in collaborative efforts to improve care transitions. Recent pilot payment models aim to motivate improved postdischarge care coordination. The Centers for Medicare and Medicaid Services implemented two new Current Procedural Terminology Transitional Care Management codes to enable reimbursement of outpatient physicians for management of patients transitioning from the hospital to the community. This model does not require communication between accepting (outpatient) and discharging (hospital) physicians or other hospital staff.[31] Another pilot program pays primary care clinics $6 per beneficiary per month if they become level 3 patient‐centered medical homes, which have stringent requirements for communication and coordination with hospitals for postdischarge care.[32] Capitated payment models, such as expansion of Medicaid managed care, and shared‐savings models, such accountable care organizations, aim to promote shared responsibility between hospitals and primary care by creating financial incentives to prevent hospitalizations through effective use of outpatient resources. The effectiveness of these strategies to improve care transitions is not yet established.
Many tout the adoption of EHRs as a means to improve communication and collaboration across settings.[33] However, policies narrowly focused on EHR adoption fail to address broader issues regarding lack of EHR interoperability and inconsistently applied privacy regulations under HIPAA, which were substantial barriers to information sharing. Stage 2 meaningful use criteria will address some interoperability issues by implementing standards for exchange of laboratory data and summary care records for care transitions.[34] Additional regulatory policies should promote uniform application of privacy regulations to enable more fluid sharing of electronic data across various healthcare settings. Locally and regionally negotiated data sharing agreements, as well as arrangements such as regional health information exchanges, could temporize these issues until broader policies are enacted.
EHRs did not obviate the need for meaningful interpersonal communication between providers. Hospital‐based quality improvement teams could create networking opportunities to foster relationship‐building and communication across settings. Leadership should consider scheduling protected time to facilitate attendance. Colocation of outpatient staff, such as nurse coordinators and office managers, in the hospital may also improve relationship building and care coordination.[35] Such measures would bridge the perceived divide between inpatient and outpatient care, and create avenues to find mutually beneficial solutions to improving postdischarge care transitions.[36]
Our results should be interpreted in light of several limitations. This study focused on primary care practices in the California safety net; given variations in safety nets across different contexts, the transferability of our findings may be limited. Second, rural perspectives were relatively under‐represented in our study sample; there may be additional unidentified issues specific to rural areas or specific to other nonparticipants that may have not been captured in this study. For this hypothesis‐generating study, we focused on the perspectives of primary care leaders. Triangulating perspectives of other stakeholders, including hospital leadership, mental health, social services, and payer organizations, will offer a more comprehensive analysis of barriers and enablers to hospitalprimary care collaboration. We were unable to collect data on the payer mix of each facility, which may influence the perceived financial barriers to collaboration among facilities. However, we anticipate that the broader theme of lack of financial incentives for collaboration will resonate across many settings, as collaboration between inpatient and outpatient providers in general has been largely unfunded by payers.[37, 38, 39] Further, most primary care providers (PCPs) in and outside of safety‐net settings operate on slim margins that cannot support additional time by PCPs or staff to coordinate care transitions.[39, 40] Because our study was completed prior to the implementation of several new payment models motivating postdischarge care coordination, we were unable to assess their effect on clinics' collaboration with hospitals.
In conclusion, efforts to improve collaboration between clinical settings around postdischarge care transitions will require targeted policy and quality improvement efforts in 3 specific areas. Policy makers and administrators with the power to negotiate payment schemes and regulatory policies should first align financial incentives across settings to support postdischarge transitions and care coordination, and second, improve EHR interoperability and uniform application of HIPAA regulations. Third, clinic and hospital leaders, and front‐line providers should enhance opportunities for interpersonal networking between providers in hospital and primary care settings. With the expansion of insurance coverage and increased demand for primary care in the safety net and other settings, policies to promote care coordination should consider the perspective of both hospital and clinic incentives and mechanisms for coordinating care across settings.
Disclosures
Preliminary results from this study were presented at the Society of General Internal Medicine 36th Annual Meeting in Denver, Colorado, April 2013. Dr. Nguyen's work on this project was funded by a federal training grant from the National Research Service Award (NRSA T32HP19025‐07‐00). Dr. Goldman is the recipient of grants from the Agency for Health Care Research and Quality (K08 HS018090‐01). Drs. Goldman, Greysen, and Lyndon are supported by the National Institutes of Health, National Center for Research Resources, Office of the Director (UCSF‐CTSI grant no. KL2 RR024130). The authors report no conflicts of interest.
- Crossing the Quality Chasm: A New Health System for the 21st Century. Washington, DC: The National Academies Press; 2001.
- , , , , , . Deficits in communication and information transfer between hospital‐based and primary care physicians: implications for patient safety and continuity of care. JAMA. 2007;297(8):831–841.
- , , , . Medical errors related to discontinuity of care from an inpatient to an outpatient setting. J Gen Intern Med. 2003;18(8):646–651.
- Medicare Payment Advisory Commission. Report to the Congress: Promoting Greater Efficiency in Medicare. Washington, DC: Medicare Payment Advisory Commission; 2007.
- , , , , , . Hospital‐initiated transitional care interventions as a patient safety strategy: a systematic review. Ann Intern Med. 2013;158(5 pt 2):433–440.
- , , . Thirty‐day readmission rates for Medicare beneficiaries by race and site of care. JAMA. 2011;305(7):675–681.
- , . Improving care transitions: hospitalists partnering with primary care. J Hosp Med. 2010;5(7):375–377.
- , , , , . Primary care physician communication at hospital discharge reduces medication discrepancies. J Hosp Med. 2013;8(12):672–677.
- Institute of Medicine. America's Health Care Safety Net: Intact but Endangered. Washington, DC: Institute of Medicine; 2000.
- , . Higher readmissions at safety‐net hospitals and potential policy solutions. Issue Brief (Commonw Fund). 2012;34:1–16.
- , . Characteristics of hospitals receiving penalties under the hospital readmissions reduction program. JAMA. 2013;309(4):342–343.
- , , , et al. Ensuring Equity: A Post‐Reform Framework to Achieve High Performance Health Care for Vulnerable Populations. New York, NY: The Commonwealth Fund; 2011.
- , , , , . Enhancing the Capacity of Community Centers to Achieve High Performance: Findings from the 2009 Commonwealth Fund National Survey of Federally Qualified Health Centers. New York, NY: The Commonwealth Fund; 2010.
- , , . Integration mechanisms and hospital efficiency in integrated health care delivery systems. J Med Syst. 2002;26(2):127–143.
- , , . Effect of physician collaboration network on hospitalization cost and readmission rate. Eur J Public Health. 2012;22(5):629–633.
- Health Resources and Services Administration. Health Center Look‐Alikes Program. Available at: http://bphc.hrsa.gov/about/lookalike/index.html?IsPopUp=true. Accessed on September 5, 2014.
- , , , . Public hospitals in the United States, 2008. Healthcare Cost and Utilization Project. Agency for Healthcare Research and Quality, Rockville, MD. Available at: http://www.hcup‐us.ahrq.gov/reports/statbriefs/sb95.jsp. Published September 2010. Accessed on September 5, 2014.
- U.S. Department of Health and Human Services. Health Resources and Services Administration. Available at: http://www.hrsa.gov/shortage/. Accessed on September 5, 2014.
- , . California's Safety Net and The Need to Improve Local Collaboration in Care for the Uninsured: Counties, Clinics, Hospitals, and Local Health Plans. Available at: http://www.itup.org/Reports/Statewide/Safetynet_Report_Final.pdf. Published October 2008. Accessed on September 5, 2014.
- , . Unsatisfactory saturation: a critical exploration of the notion of saturated sample sizes in qualitative research. Qual Res. 2013;13(2):190–197.
- . Leading successful interinstitutional collaborations using the collaboration success measurement model. Paper presented at: The Chair Academy's 16th Annual International Conference: Navigating the Future through Authentic Leadership; 2007; Jacksonville, FL. Available at http://www.chairacademy.com/conference/2007/papers/leading_successful_interinstitutional_collaborations.pdf. Accessed on September 5, 2014.
- , , , , . The difference between integration and collaboration in patient care: results from key informant interviews working in multiprofessional health care teams. J Manipulative Physiol Ther. 2009;32(9):715–722.
- , , , , , . Implementing organized delivery systems: an integration scorecard. Health Care Manag Rev. 1994;19(3):7–20.
- State of California Office of Statewide Health Planning 3(2):77–101.
- Health Resources and Services Administration Primary Care: The Health Center Program. Affiliation agreements of community 303(17):1716–1722.
- , , , , . Reducing hospital readmissions through primary care practice transformation. Journal Fam Pract. 2014;63(2):67–73.
- , , . Post‐hospitalization transitions: Examining the effects of timing of primary care provider follow‐up. J Hosp Med. 2010;5(7):392–397.
- U.S. Department of Health and Human Services. Centers for Medicare 2009.
- , , , . Hospitalists and care transitions: the divorce of inpatient and outpatient care. Health Aff (Millwood). 2008;27(5):1315–1327.
- , , . Reducing hospital readmissions: lessons from top‐performing hospitals. Available at: http://www.commonwealthfund.org/publications/case‐studies/2011/apr/reducing‐hospital‐readmissions. Published April 2011. Accessed on September 5, 2014.
- , , . Recasting readmissions by placing the hospital role in community context. JAMA. 2013;309(4):351–352.
- . A primary care physician's ideal transitions of care—where's the evidence? J Hosp Med. 2013;8(8):472–477.
- , . Primary care: current problems and proposed solutions. Health Aff (Millwood). 2010;29(5):799–805.
Poorly coordinated care between hospital and outpatient settings contributes to medical errors, poor outcomes, and high costs.[1, 2, 3] Recent policy has sought to motivate better care coordination after hospital discharge. Financial penalties for excessive hospital readmissionsa perceived marker of poorly coordinated carehave motivated hospitals to adopt transitional care programs to improve postdischarge care coordination.[4] However, the success of hospital‐initiated transitional care strategies in reducing hospital readmissions has been limited.[5] This may be due to the fact that many factors driving hospital readmissions, such as chronic medical illness, patient education, and availability of outpatient care, are outside of a hospital's control.[5, 6] Even among the most comprehensive hospital‐based transitional care intervention strategies, there is little evidence of active engagement of primary care providers or collaboration between hospitals and primary care practices in the transitional care planning process.[5] Better engagement of primary care into transitional care strategies may improve postdischarge care coordination.[7, 8]
The potential benefits of collaboration are particularly salient in healthcare safety nets.[9] The US health safety net is a patchwork of providers, funding, and programs unified by a shared missiondelivering care to patients regardless of ability to payrather than a coordinated system with shared governance.[9] Safety‐net hospitals are at risk for higher‐than‐average readmissions penalties.[10, 11] Medicaid expansion under the Affordable Care Act will likely increase demand for services in these settings, which could worsen fragmentation of care as a result of strained capacity.[12] Collaboration between hospitals and primary care clinics in the safety net could help overcome fragmentation, improve efficiencies in care, and reduce costs and readmissions.[12, 13, 14, 15]
Despite the potential benefits, we found no studies on how to enable collaboration between hospitals and primary care. We sought to understand systems‐level factors limiting and facilitating collaboration between hospitals and primary care practices around coordinating inpatient‐to‐outpatient care transitions by conducting a qualitative study, focusing on the perspective of primary care leaders in the safety net.
STUDY DATA AND METHODS
We conducted semistructured telephone interviews with primary care leaders in health safety nets across California from August 2012 through October 2012, prior to the implementation of the federal hospital readmissions penalties program. Primary care leaders were defined as clinicians or nonclinicians holding leadership positions, including chief executive officers, clinic medical directors, and local experts in care coordination or quality improvement. We defined safety‐net clinics as federally qualified health centers (FQHCs) and/or FQHC Look‐Alikes (clinics that meet eligibility requirements and receive the same benefits as FQHCs, except for Public Health Service Section 330 grants), community health centers, and public hospital‐affiliated clinics operating under a traditional fee‐for‐service model and serving a high proportion of Medicaid and uninsured patients.[9, 16] We defined public hospitals as government‐owned hospitals that provide care for individuals with limited access elsewhere.[17]
Sampling and Recruitment
We purposefully sampled participants to maximize diversity in geographic region, metropolitan status,[18] and type of county health delivery system to enable identification of common themes across different settings and contexts. Delivery systems were defined as per the Insure the Uninsured Project, a 501(c)(3) nonprofit organization that conducts research on the uninsured in California.[19] Provider systems are counties with a public hospital; payer systems are counties that contract with private hospitals to deliver uncompensated care in place of a public hospital; and County Medical Services Program is a state program that administers county health care in participating small counties, in lieu of a provider or payer system. We used the county delivery system type as a composite proxy of available county resources and market context given variations in funding, access, and eligibility by system type.
Participants were identified through online public directories, community clinic consortiums, and departments of public health websites. Additional participants were sought using snowball sampling. Potential participants were e‐mailed a recruitment letter describing the study, its purpose, topics to be covered, and confidentiality assurance. Participants who did not respond were called or e‐mailed within 1 week. When initial recruitment was unsuccessful, we attempted to recruit another participant within the same organization when possible. We recruited participants until reaching thematic saturation (i.e., no further new themes emerged from our interviews).[20] No participants were recruited through snowballing.
Data Collection and Interview Guides
We conducted in‐depth, semistructured interviews using interview guides informed by existing literature on collaboration and integration across healthcare systems[21, 22, 23] (see Supporting Information, Appendix 1, in the online version of this article). Interviews were digitally recorded and professionally transcribed verbatim.
We obtained contextual information for settings represented by each respondent, such as number of clinics and annual visits, through the California Primary Care Annual Utilization Data Report and clinic websites.[24]
Analysis
We employed thematic analysis[25] using an inductive framework to identify emergent and recurring themes. We developed and refined a coding template iteratively. Our multidisciplinary team included 2 general internists (O.K.N., L.E.G), 1 hospitalist (S.R.G.), a clinical nurse specialist with a doctorate in nursing (A.L.), and research staff with a public health background (J.K.). Two team members (O.K.N., J.K.) systematically coded all transcripts. Disagreements in coding were resolved through negotiated consensus. All investigators reviewed and discussed identified themes. We emailed summary findings to participants for confirmation to enhance the reliability of our findings.
The institutional review board at the University of California, San Francisco approved the study protocol.
RESULTS
Of 52 individuals contacted from 39 different organizations, 23 did not respond, 4 declined to participate, and 25 were scheduled for an interview. We interviewed 22 primary care leaders across 11 California counties (Table 1) and identified themes around factors influencing collaboration with hospitals (Table 2). Most respondents had prior positive experiences collaborating with hospitals on small, focused projects. However, they asserted the need for better hospitalclinic collaboration, and thought collaboration was critical to achieving high‐quality care transitions. We did not observe any differences in perspectives expressed by clinician versus nonclinician leaders. Nonparticipants were more likely than participants to be from northern rural or central counties, FQHCs, and smaller clinic settings.
| |
| Leadership position | No. (%) |
| Chief executive officer or equivalent* | 9 (41) |
| Chief medical officer or medical director | 7 (32) |
| Other | 6 (27) |
| Clinical experience | |
| Physician (MD or DO) | 15 (68) |
| Registered nurse | 1 (5) |
| Nonclinician | 6 (27) |
| Clinic setting | |
| Clinic type | |
| FQHC and FQHC Look‐Alikes | 15 (68) |
| Hospital based | 2 (9) |
| Other | 5 (23) |
| No. of clinics in system | |
| 14 | 9 (41) |
| 59 | 6 (27) |
| 10 | 7 (32) |
| Annual no. of visits | |
| <100,000 | 9 (41) |
| 100,000499,999 | 11 (50) |
| 500,000 | 2 (9) |
| County characteristics | |
| Health delivery system type | |
| Provider | 13 (59) |
| Payer | 2 (9) |
| County Medical Services Program∥ | 7 (32) |
| Rural county | 7 (32) |
| Theme | Subtheme | Quote |
|---|---|---|
| ||
| Lack of institutional financial incentives for collaboration. | Collaboration may lead to increased responsibility without reimbursement for clinic. | Where the [payment] model breaks down is that the savings is only to the hospital; and there's an expectation on our part to go ahead and take on those additional patients. If that $400,000 savings doesn't at least have a portion to the team that's going to help keep the people out of the hospital, then it won't work. (Participant 17) |
| Collaboration may lead to competition from the hospital for primary care patients. | Our biggest issues with working with the hospital[are] that we have a finite number of [Medicaid] patients [in our catchment area for whom] you get larger reimbursement. For a federally qualified health center, it is [crucial] to ensure we have a revenue stream that helps us take care of the uninsured. So you can see the natural kind of conflict when your pool of patients is very small. (Participant 10) | |
| Collaboration may lead to increased financial risk for the hospital. | 70% to 80% of our adult patients have no insurance and the fact is that none of these hospitals want those patients. They do get disproportionate hospital savings and other thingsbut they don't have a strong business model when they have uninsured patients coming in their doors. That's just the reality. (Participant 21) | |
| Collaboration may lead to decreased financial risk for the hospital. | Most of these patients either have very low reimbursement or no reimbursement, and so [the hospital doesn't] really want these people to end up in very expensive care because it's a burden on their systemphilosophically, everyone agrees that if we keep people well in the outpatient setting, that would be better for everyone. No, there is no financial incentive whatsoever for [the hospital] to not work with us. [emphasis added] (Participant 18) | |
| Competing priorities limit primary care's ability to focus on care transitions. | I wouldn't say [improving care transitions is a high priority]. It's not because we don't want to do the job. We have other priorities. [T]he big issue is access. There's a massive demand for primary care in our communityand we're just trying to make sure we have enough capacity. [There are] requirements HRSA has been asking of health centers and other priorities. We're starting up a residency program. We're recruiting more doctors. We're upping our quality improvement processes internally. We're making a reinvestment in our [electronic medical record]. It never stops. (Participant 22) | |
| The multitude of [care transitions and other quality] improvement imperatives makes it difficult to focus. It's not that any one of these things necessarily represents a flawed approach. It's just that when you have a variety of folks from the national, state, and local levels who all have different ideas about what constitutes appropriate improvement, it's very hard to respond to it all at once. (Participant 6) | ||
| Mismatched expectations about the role and capacity of primary care in care transitions limit collaboration. | Perception of primary care being undervalued by hospitals as a key stakeholder in care transitions. | They just make sure the paperwork is set up.and they have it written down, See doctor in 7 days. And I think they [the hospitals] think that's where their responsibility stops. They don't actually look at our records or talk to us. (Participant 2) |
| Perceived unrealistic expectations of primary care capacity to deliver postdischarge care. | [The hospital will] send anyone that's poor to us whether they are our patient or not. [T]hey say go to [our clinic] and they'll give you your outpatient medications. [But] we're at capacity. [W]e have a 79 month wait for a [new] primary care appointment. So then, we're stuck with the ethical dilemma of [do we send the patient back to the ER/hospital] for their medication or do we just [try to] take them in? (Participant 13) | |
| The hospitals feel every undoctored patient must be ours. [But] it's not like we're sitting on our hands. We have more than enough patients. (Participant 22) | ||
| Informal affiliations and partnerships, formed through personal relationships and interpersonal networking, facilitate collaboration. | Informal affiliations arise from existing personal relationships and/or interpersonal networking. | Our CEO [has been here] for the past 40 years, and has had very deep and ongoing relationships with the [hospital]. Those doors are very wide open. (Participant 18) |
| Informal partnerships are particularly important for FQHCs. | As an FQHC we can't have any ties financially or politically, but there's a traditional connection. (Participant 2) | |
| Increasing demands on clinical productivity lead to a loss of networking opportunities. | We're one of the few clinics that has their own inpatient service. I would say that the transitions between the hospital and [our] clinic start from a much higher level than anybody else. [However] we're about to close our hospital service. It's just too much work for our [clinic] doctors. (Participant 8) | |
| There used to be a meeting once a month where quality improvement programs and issues were discussed. Our administration eliminated these in favor of productivity, to increase our numbers of patients seen. (Participant 12) | ||
| Loss of relationships with hospital personnel amplifies challenges to collaboration. | Because the primary care docs are not visible in the hospital[quality improvement] projects [become] hospital‐based. Usually they forget that we exist. (Participant 11) | |
| External funding and support can enable opportunities for networking and relationship building. | The [national stakeholder organization] has done a lot of work with us to bring us together and figure out what we're doing [across] different counties, settings, providers. (Participant 20) | |
| Electronic health records enable collaboration by improving communication between hospitals and primary care. | Lack of timely communication between inpatient and outpatient settings is a major obstacle to postdischarge care coordination. | It's a lot of effort to get medical records back. It is often not timely. Patients are going to cycle in and out of more costly acute care because we don't know that it's happening. Communication between [outpatient and inpatient] facilities is one of the most challenging issues. (Participant 13) |
| Optimism about potential of EHRs. | A lot of people are depending on [the EHR] to make a lot of communication changes [where there was] a disconnect in the past. (Participant 7) | |
| Lack of EHR interoperability. | We have an EHR that's pieced together. The [emergency department] has their own [system]. The clinics have their own. The inpatient has their own. They're all electronic but they don't all talk to each other that well. (Participant 20) | |
| Our system has reached our maximum capacity and we've had to rely on our community partners to see the overflow. [T]he difficult communication [is] magnified. (Participant 11) | ||
| Privacy and legal concerns (nonuniform application of HIPAA standards). | There is a very different view from hospital to hospital about what it is they feel that they can share legally under HIPAA or not. It's a very strange thing and it almost depends more on the chief information officer at [each] hospital and less on what the [regulations] actually say. (Participant 21) | |
| Yes, [the EHR] does communicate with the hospitals and the hospitals [communicate] back [with us]. [T]here are some technical issues, butthe biggest impediments to making the technology work are new issues around confidentiality and access. (Participant 17) | ||
| Interpersonal contact is still needed even with robust EHRs. | I think [communication between systems is] getting better [due to the EHR], but there's still quite a few holes and a sense of the loop not being completely closed. It's like when you pick up the phoneyou don't want the automated system, you want to actually talk to somebody. (Participant 18) | |
Lack of Institutional Financial Incentives for Collaboration
Primary care leaders felt that current reimbursement strategies rewarded hospitals for reducing readmissions rather than promoting shared savings with primary care. Seeking collaboration with hospitals would potentially increase clinic responsibility for postdischarge patient care without reimbursement for additional work.
In counties without public hospitals, leaders worried that collaboration with hospitals could lead to active loss of Medicaid patients from their practices. Developing closer relationships with local hospitals would enable those hospitals to redirect Medicaid patients to hospital‐owned primary care clinics, leading to a loss of important revenue and financial stability for their clinics.
A subset of these leaders also perceived that nonpublic hospitals were reluctant to collaborate with their clinics. They hypothesized that hospital leaders worried that collaborating with their primary care practices would lead to more uninsured patients at their hospitals, leading to an increase in uncompensated hospital care and reduced reimbursement. However, a second subset of leaders thought that nonpublic hospitals had increased financial incentives to collaborate with safety‐net clinics, because improved coordination with outpatient care could prevent uncompensated hospital care.
Competing Clinic Priorities Limit Primary Care Ability to Focus on Care Transitions
Clinic leaders struggled to balance competing priorities, including strained clinic capacity, regulatory/accreditation requirements, and financial strain. New patient‐centered medical home initiatives, which improve primary care financial incentives for postdischarge care coordination, were perceived as well intentioned but added to an overwhelming burden of ongoing quality improvement efforts.
Mismatched Expectations About the Role and Capacity of Primary Care in Care Transitions Limits Collaboration
Many leaders felt that hospitals undervalued the role of primary care as stakeholders in improving care transitions. They perceived that hospitals made little effort to directly contact primary care physicians about their patients' hospitalizations and discharges. Leaders were frustrated that hospitals had unrealistic expectations of primary care to deliver timely postdischarge care, given their strained capacity. Consequently, some were reluctant to seek opportunities to collaborate with hospitals to improve care transitions.
Informal Affiliations and Partnerships, Formed Through Personal Relationships and Interpersonal Networking, Facilitate Collaboration
Informal affiliations between hospitals and primary care clinics helped improve awareness of organizational roles and capacity and create a sense of shared mission, thus enabling collaboration in spite of other barriers. Such affiliations arose from existing, longstanding personal relationships and/or interpersonal networking between individual providers across settings. These informal affiliations were important for safety‐net clinics that were FQHCs or FQHC Look‐Alikes, because formal hospital affiliations are discouraged by federal regulations.[26]
Opportunities for building relationships and networking with hospital personnel arose when clinic physicians had hospital admitting privileges. This on‐site presence facilitated personal relationships and communication between clinic and hospital physicians, thus enabling better collaboration. However, increasing demands on outpatient clinical productivity often made a hospital presence infeasible. One health system promoted interpersonal networking through regular meetings between the clinic and the local hospital to foster collaboration on quality improvement and care delivery; however, clinical productivity demands ultimately took priority over these meetings. Although delegating inpatient care to hospitalists enabled clinics to maximize their productivity, it also decreased opportunities for networking, and consequently, clinic physicians felt their voices and opinions were not represented in improvement initiatives.
Outside funding and support, such as incentive programs and conferences sponsored by local health plans, clinic consortiums, or national stakeholder organizations, enabled the most successful networking. These successes were independent of whether the clinic staff rounded in the hospital.
Electronic Health Records Enable Collaboration By Improving Communication Between Hospitals And Primary Care
Challenges in communication and information flow were also challenges to collaboration with hospitals. No respondents reported receiving routine notification of patient hospitalizations at the time of admission. Many clinics were dedicating significant attention to implementing electronic health record (EHR) systems to receive financial incentives associated with meaningful use.[27] Implementation of EHRs helped mitigate issues with communication with hospitals, though to a lesser degree than expected. Clinics early in the process of EHR adoption were optimistic about the potential of EHRs to improve communication with hospitals. However, clinic leaders in settings with greater EHR experience were more guarded in their enthusiasm. They observed that lack of interoperability between clinic and hospital EHRs was a persistent and major issue in spite of meaningful use standards, limiting timely flow of information across settings. Even when hospitals and their associated clinics had integrated or interoperable EHRs (n=3), or were working toward EHR integration (n=5), the need to expand networks to include other community healthcare settings using different systems presented ongoing challenges to achieving seamless communication due to a lack of interoperability.
When information sharing was technically feasible, leaders noted that inconsistent understanding and application of privacy rules dictated by the Health Insurance Portability and Accountability Act (HIPAA) limited information sharing. The quality and types of information shared varied widely across settings, depending on how HIPAA regulations were interpreted.
Even with robust EHRs, interpersonal contact was still perceived as crucial to enabling collaboration. EHRs were perceived to help with information flow, but did not facilitate relationship building across settings.
DISCUSSION
We found that safety‐net primary care leaders identified several barriers to collaboration with hospitals: (1) lack of financial incentives for collaboration, (2) competing priorities, (3) mismatched expectations about the role and capacity of primary care, and (4) poor communication infrastructure. Interpersonal networking and use of EHRs helped overcome these obstacles to a limited extent.
Prior studies demonstrate that early follow‐up, timely communication, and continuity with primary care after hospital discharge are associated with improved postdischarge outcomes.[8, 28, 29, 30] Despite evidence that collaboration between primary care and hospitals may help optimize postdischarge outcomes, our study is the first to describe primary care leaders' perspectives on potential targets for improving collaboration between hospitals and primary care to improve care transitions.
Our results highlight the need to modify payment models to align financial incentives across settings for collaboration. Otherwise, it may be difficult for hospitals to engage primary care in collaborative efforts to improve care transitions. Recent pilot payment models aim to motivate improved postdischarge care coordination. The Centers for Medicare and Medicaid Services implemented two new Current Procedural Terminology Transitional Care Management codes to enable reimbursement of outpatient physicians for management of patients transitioning from the hospital to the community. This model does not require communication between accepting (outpatient) and discharging (hospital) physicians or other hospital staff.[31] Another pilot program pays primary care clinics $6 per beneficiary per month if they become level 3 patient‐centered medical homes, which have stringent requirements for communication and coordination with hospitals for postdischarge care.[32] Capitated payment models, such as expansion of Medicaid managed care, and shared‐savings models, such accountable care organizations, aim to promote shared responsibility between hospitals and primary care by creating financial incentives to prevent hospitalizations through effective use of outpatient resources. The effectiveness of these strategies to improve care transitions is not yet established.
Many tout the adoption of EHRs as a means to improve communication and collaboration across settings.[33] However, policies narrowly focused on EHR adoption fail to address broader issues regarding lack of EHR interoperability and inconsistently applied privacy regulations under HIPAA, which were substantial barriers to information sharing. Stage 2 meaningful use criteria will address some interoperability issues by implementing standards for exchange of laboratory data and summary care records for care transitions.[34] Additional regulatory policies should promote uniform application of privacy regulations to enable more fluid sharing of electronic data across various healthcare settings. Locally and regionally negotiated data sharing agreements, as well as arrangements such as regional health information exchanges, could temporize these issues until broader policies are enacted.
EHRs did not obviate the need for meaningful interpersonal communication between providers. Hospital‐based quality improvement teams could create networking opportunities to foster relationship‐building and communication across settings. Leadership should consider scheduling protected time to facilitate attendance. Colocation of outpatient staff, such as nurse coordinators and office managers, in the hospital may also improve relationship building and care coordination.[35] Such measures would bridge the perceived divide between inpatient and outpatient care, and create avenues to find mutually beneficial solutions to improving postdischarge care transitions.[36]
Our results should be interpreted in light of several limitations. This study focused on primary care practices in the California safety net; given variations in safety nets across different contexts, the transferability of our findings may be limited. Second, rural perspectives were relatively under‐represented in our study sample; there may be additional unidentified issues specific to rural areas or specific to other nonparticipants that may have not been captured in this study. For this hypothesis‐generating study, we focused on the perspectives of primary care leaders. Triangulating perspectives of other stakeholders, including hospital leadership, mental health, social services, and payer organizations, will offer a more comprehensive analysis of barriers and enablers to hospitalprimary care collaboration. We were unable to collect data on the payer mix of each facility, which may influence the perceived financial barriers to collaboration among facilities. However, we anticipate that the broader theme of lack of financial incentives for collaboration will resonate across many settings, as collaboration between inpatient and outpatient providers in general has been largely unfunded by payers.[37, 38, 39] Further, most primary care providers (PCPs) in and outside of safety‐net settings operate on slim margins that cannot support additional time by PCPs or staff to coordinate care transitions.[39, 40] Because our study was completed prior to the implementation of several new payment models motivating postdischarge care coordination, we were unable to assess their effect on clinics' collaboration with hospitals.
In conclusion, efforts to improve collaboration between clinical settings around postdischarge care transitions will require targeted policy and quality improvement efforts in 3 specific areas. Policy makers and administrators with the power to negotiate payment schemes and regulatory policies should first align financial incentives across settings to support postdischarge transitions and care coordination, and second, improve EHR interoperability and uniform application of HIPAA regulations. Third, clinic and hospital leaders, and front‐line providers should enhance opportunities for interpersonal networking between providers in hospital and primary care settings. With the expansion of insurance coverage and increased demand for primary care in the safety net and other settings, policies to promote care coordination should consider the perspective of both hospital and clinic incentives and mechanisms for coordinating care across settings.
Disclosures
Preliminary results from this study were presented at the Society of General Internal Medicine 36th Annual Meeting in Denver, Colorado, April 2013. Dr. Nguyen's work on this project was funded by a federal training grant from the National Research Service Award (NRSA T32HP19025‐07‐00). Dr. Goldman is the recipient of grants from the Agency for Health Care Research and Quality (K08 HS018090‐01). Drs. Goldman, Greysen, and Lyndon are supported by the National Institutes of Health, National Center for Research Resources, Office of the Director (UCSF‐CTSI grant no. KL2 RR024130). The authors report no conflicts of interest.
- Crossing the Quality Chasm: A New Health System for the 21st Century. Washington, DC: The National Academies Press; 2001.
- , , , , , . Deficits in communication and information transfer between hospital‐based and primary care physicians: implications for patient safety and continuity of care. JAMA. 2007;297(8):831–841.
- , , , . Medical errors related to discontinuity of care from an inpatient to an outpatient setting. J Gen Intern Med. 2003;18(8):646–651.
- Medicare Payment Advisory Commission. Report to the Congress: Promoting Greater Efficiency in Medicare. Washington, DC: Medicare Payment Advisory Commission; 2007.
- , , , , , . Hospital‐initiated transitional care interventions as a patient safety strategy: a systematic review. Ann Intern Med. 2013;158(5 pt 2):433–440.
- , , . Thirty‐day readmission rates for Medicare beneficiaries by race and site of care. JAMA. 2011;305(7):675–681.
- , . Improving care transitions: hospitalists partnering with primary care. J Hosp Med. 2010;5(7):375–377.
- , , , , . Primary care physician communication at hospital discharge reduces medication discrepancies. J Hosp Med. 2013;8(12):672–677.
- Institute of Medicine. America's Health Care Safety Net: Intact but Endangered. Washington, DC: Institute of Medicine; 2000.
- , . Higher readmissions at safety‐net hospitals and potential policy solutions. Issue Brief (Commonw Fund). 2012;34:1–16.
- , . Characteristics of hospitals receiving penalties under the hospital readmissions reduction program. JAMA. 2013;309(4):342–343.
- , , , et al. Ensuring Equity: A Post‐Reform Framework to Achieve High Performance Health Care for Vulnerable Populations. New York, NY: The Commonwealth Fund; 2011.
- , , , , . Enhancing the Capacity of Community Centers to Achieve High Performance: Findings from the 2009 Commonwealth Fund National Survey of Federally Qualified Health Centers. New York, NY: The Commonwealth Fund; 2010.
- , , . Integration mechanisms and hospital efficiency in integrated health care delivery systems. J Med Syst. 2002;26(2):127–143.
- , , . Effect of physician collaboration network on hospitalization cost and readmission rate. Eur J Public Health. 2012;22(5):629–633.
- Health Resources and Services Administration. Health Center Look‐Alikes Program. Available at: http://bphc.hrsa.gov/about/lookalike/index.html?IsPopUp=true. Accessed on September 5, 2014.
- , , , . Public hospitals in the United States, 2008. Healthcare Cost and Utilization Project. Agency for Healthcare Research and Quality, Rockville, MD. Available at: http://www.hcup‐us.ahrq.gov/reports/statbriefs/sb95.jsp. Published September 2010. Accessed on September 5, 2014.
- U.S. Department of Health and Human Services. Health Resources and Services Administration. Available at: http://www.hrsa.gov/shortage/. Accessed on September 5, 2014.
- , . California's Safety Net and The Need to Improve Local Collaboration in Care for the Uninsured: Counties, Clinics, Hospitals, and Local Health Plans. Available at: http://www.itup.org/Reports/Statewide/Safetynet_Report_Final.pdf. Published October 2008. Accessed on September 5, 2014.
- , . Unsatisfactory saturation: a critical exploration of the notion of saturated sample sizes in qualitative research. Qual Res. 2013;13(2):190–197.
- . Leading successful interinstitutional collaborations using the collaboration success measurement model. Paper presented at: The Chair Academy's 16th Annual International Conference: Navigating the Future through Authentic Leadership; 2007; Jacksonville, FL. Available at http://www.chairacademy.com/conference/2007/papers/leading_successful_interinstitutional_collaborations.pdf. Accessed on September 5, 2014.
- , , , , . The difference between integration and collaboration in patient care: results from key informant interviews working in multiprofessional health care teams. J Manipulative Physiol Ther. 2009;32(9):715–722.
- , , , , , . Implementing organized delivery systems: an integration scorecard. Health Care Manag Rev. 1994;19(3):7–20.
- State of California Office of Statewide Health Planning 3(2):77–101.
- Health Resources and Services Administration Primary Care: The Health Center Program. Affiliation agreements of community 303(17):1716–1722.
- , , , , . Reducing hospital readmissions through primary care practice transformation. Journal Fam Pract. 2014;63(2):67–73.
- , , . Post‐hospitalization transitions: Examining the effects of timing of primary care provider follow‐up. J Hosp Med. 2010;5(7):392–397.
- U.S. Department of Health and Human Services. Centers for Medicare 2009.
- , , , . Hospitalists and care transitions: the divorce of inpatient and outpatient care. Health Aff (Millwood). 2008;27(5):1315–1327.
- , , . Reducing hospital readmissions: lessons from top‐performing hospitals. Available at: http://www.commonwealthfund.org/publications/case‐studies/2011/apr/reducing‐hospital‐readmissions. Published April 2011. Accessed on September 5, 2014.
- , , . Recasting readmissions by placing the hospital role in community context. JAMA. 2013;309(4):351–352.
- . A primary care physician's ideal transitions of care—where's the evidence? J Hosp Med. 2013;8(8):472–477.
- , . Primary care: current problems and proposed solutions. Health Aff (Millwood). 2010;29(5):799–805.
© 2014 Society of Hospital Medicine
Getting Hip to Vitamin D
Hip fracture is a common clinical problem, with an incidence of 957 cases/100,000 adults in the United States.[1] Studies have found a high prevalence of vitamin D deficiency among elderly patients with fragility fractures, though many of these studies were performed in high latitude regions.[2, 3, 4, 5, 6, 7, 8, 9, 10] Endocrine Society clinical practice guidelines recommend screening patients with fragility fractures for vitamin D deficiency.[11]
Our hospitalist group practices in an academic tertiary care facility in the southeastern United States. Beginning in June 2010, all patients with acute hip fracture were admitted to our service with consultative comanagement from orthopedics. Our group did not have a standardized approach for the assessment or treatment of vitamin D deficiency in this population. Preliminary analysis of a subgroup of our patients with acute hip fracture revealed that only 29% had been screened for vitamin D deficiency. Of these patients, 68% were deficient or insufficient, yet less than half had been discharged on an appropriate dose of vitamin D. We concluded that our group practice was both varied and substandard.
In this report we describe the creation and implementation of a process for improving the assessment and treatment of vitamin D deficiency in elderly patients with fragility hip fracture. We evaluated the effect of our process on the percentages of patients screened and treated appropriately for vitamin D deficiency.
METHODS
Creation of Intervention
We assembled a task force, consisting of 4 hospitalist physicians. The task force reviewed available literature on the prevalence of vitamin D deficiency in elderly patients with fragility fracture and major practice guidelines related to vitamin D. We utilized Endocrine Society clinical practice guidelines to define vitamin D deficiency, insufficiency, and recommended treatment dosing for each condition[11] (Table 1).
| Vitamin D Level (25‐OH) | Vitamin D Status | Treatment Dose Recommendation |
|---|---|---|
| 019 ng/mL | Deficient | 50,000 IU/week for 68 weeks |
| 2029 ng/mL | Insufficient | 1,000 to 2,000 IU/day or 50,000 IU/month |
We developed 2 processes for improving group practice. First, we presented a review of evidence and preliminary data from our group practice at a meeting of hospitalist staff. Second, we revised the computerized physician order entry (CPOE) set for patients with hip fractures to include 2 new orders: (1) an automatic order for 25‐OH vitamin D level to be drawn the morning after admission and (2) an order for initiation of 1000 IU daily of vitamin D at admission.
The reasons for starting empiric vitamin D supplementation were 2fold. First was to prompt dosing of vitamin D at the time of discharge by already having it on the patient's medication list. Second was to conform to US Preventive Services Task Force guidelines for fall prevention.[12] The dose of 1000 IU was selected due to its being adequate treatment for insufficient (though not deficient) patients, and yet a low enough dose to minimize risk of toxicity.
Providers
Our hospitalist group includes 21 physicians and 3 physician extenders. Two nocturnist positions were added to our group in July 2013, part way through our intervention. There were no other additions or subtractions to the staff during the study period.
Patients
Patients were identified by search of University of North Carolina (UNC) Hospitals' database using International Classification of Diseases, 9th Revision codes for femoral neck fracture (821.x) and femur fracture NOS (820.x), linked to hospital services covered by our group. Exclusion criteria included age 50 years, fracture due to high‐speed trauma, fracture due to malignancy, end‐stage renal disease, and death or transition to comfort care during the index hospitalization.
Outcome Measures
Primary outcome measures were the percentage of patients with acute hip fracture with vitamin D level checked during hospitalization and the percentage of deficient patients discharged on the recommended dose of vitamin D. Outcomes were measured for the 28 months before intervention (when our group assumed direct care for hip fracture patients) and were compared with the 12 months after intervention. We also report the prevalence of vitamin D deficiency in our population.
Laboratory Methodology
25‐OH vitamin D assays were performed by UNC Hospitals' core laboratories. Assays were performed using liquid chromatography tandem mass spectroscopy technique. Methodology remained constant through the study period.
During implementation of the project, we identified slow turnaround time in reporting of the vitamin D assays as an issue. We subsequently plotted the percentage of assays returned within 48 hours for each month of the study period on a run chart.
Analysis
Primary outcome measures and demographic data were tested for statistical significance with the 2 test. As a separate means of analysis, we plotted a control chart for the percentage of patients with vitamin D level checked and a run chart for the percentage of deficient or insufficient patients discharged on the recommended dose of vitamin D. To ensure a constant sample size, consecutive samples of patients were plotted in chronologic order. Results were interpreted with standard Shewhart rules.[13] 2 testing and plotting of control and run charts were performed using Microsoft Excel (Microsoft Corp., Redmond, WA) and QI Charts (Process Improvement Products, Austin, TX).
Implementation
In October 2012, we presented the review of evidence and preliminary data to the hospitalist group and made the new CPOE hip fracture order set available. Implementation was monitored by solicitation of qualitative feedback from group physicians and analysis of outcome data every 6 months. Issues that arose during implementation are described in a project timeline (Figure 1) and discussed in detail in manuscript discussion. We received institutional review board approval to study the project's implementation.

RESULTS
Patients
There were 220 patients identified in the 28 months before implementation. Twenty‐four were excluded by criteria, leaving 196 for analysis. One hundred thirteen patients were identified after implementation. Six patients were excluded by criteria, leaving 107 for analysis.
The mean patient age was 80 years, and the median age was 83 years. Seventy‐five percent were female. Race categories were 85% Caucasian, 8% African American, 3% Asian, 1% Native American, 1% Hispanic, and 3% other.
The preintervention group had mean and median ages of 80 and 82 years, respectively, compared with 81 and 84 years, respectively, in the postintervention group. Seventy‐five percent of the preintervention group was female, compared with 74% postintervention. The only statistically significant difference was in the percentage of Caucasian patients81% of preintervention group compared with 91% of the postintervention group (P = 0.028).
Primary Outcomes
The percentage of patients with acute hip fracture with vitamin D level checked before project implementation was 37.2% (n = 196). After implementation, the percentage improved to 93.5% (n = 107, P < 0.001).
The proportion chart plot of the same data (Figure 2) shows evidence of a fundamental change after intervention. Data points showing the proportion of consecutive samples of 15 patients were plotted chronologically. All points after implementation were above the upper control limit, meeting Shewhart control chart rules for special cause variation.[13]
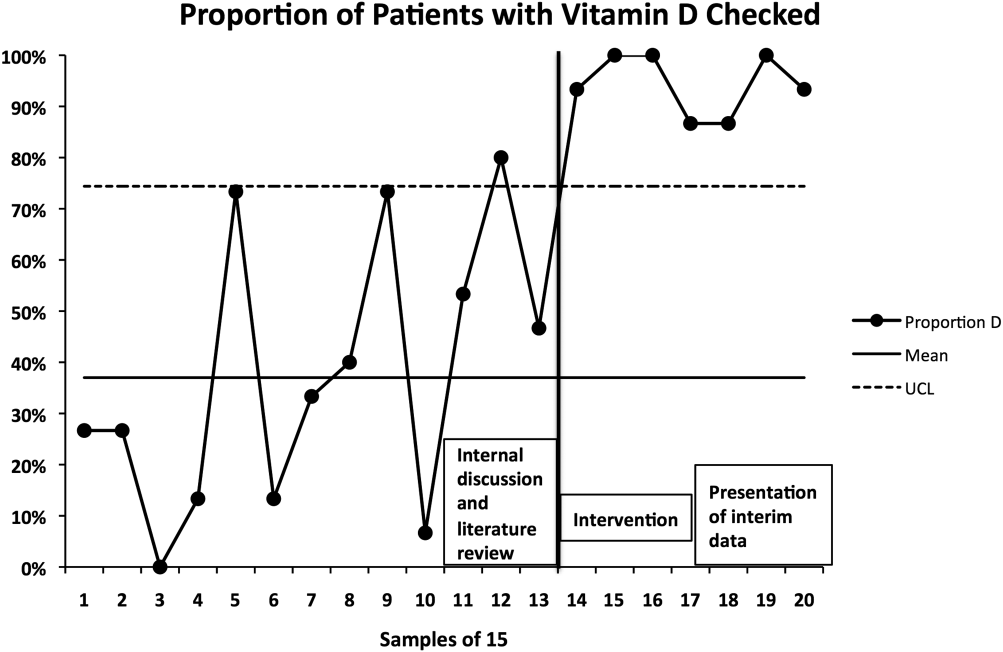
The percentage of vitamin D deficient/emnsufficient patients discharged on the recommended dose of vitamin D also improved, rising from 40.9% (n = 44) before to 68.0% (n = 50) after implementation (P = 0.008). Because there were fewer candidates for this outcome, we plotted samples of 10 patients consecutively on a run chart (Figure 3). Although there were insufficient data to establish a trend by run chart rules, the last 4 consecutive data points showed sequential improvement.
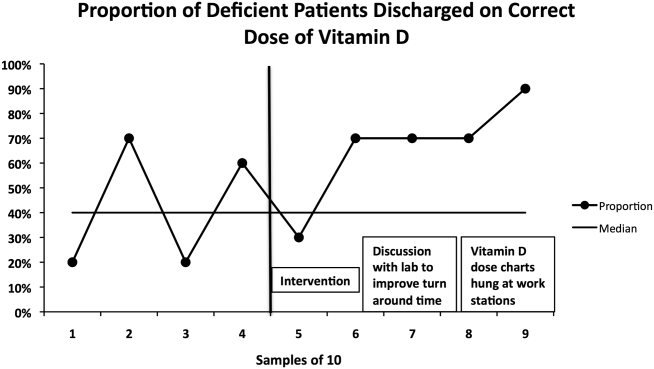
Prevalence of Vitamin D Insufficiency and Deficiency
Before implementation, 44 of the 73 patients (60.3%) with vitamin D levels checked were deficient or insufficient (25‐OH vitamin D <30 ng/mL); of those 44 patients, 21 (28.8% of total checked) had 25‐OH vitamin D levels <20 ng/mL. After implementation, 50 of 100 patients with levels checked were identified as deficient or insufficient (50%); of those 50 patients, 23 (23% of total) had 25‐OH vitamin D levels <20 ng/mL.
DISCUSSION
Our interventions correlated with significant improvements in the assessment and treatment of vitamin D deficiency in elderly patients with fragility hip fractures. Our study demonstrates a systematic method groups may use to adopt and reliably implement practice guidelines. Moreover, we report several steps to implementation that enhanced our ability to standardize clinical care.
The prevalence of vitamin D deficiency and insufficiency we identified50.0% after change implementationis within the range reported in prior studies, though our result is notable for being in a southern region of the United States. The prevalence we found before implementation (60.3%) may have been subject to selection bias in screening, so 50.0% is likely the more correct prevalence. Other US studies of vitamin D deficiency prevalence in hip fracture patients report rates from 50% to 65.8%.[2, 8, 10]
The percentage of hip fracture patients screened for vitamin D deficiency showed significant improvement after our interventions, rising to 93.5%. As a comparison with our results, a 2008 study after implementation of a hip fracture pathway reported only screening 37% of patients for vitamin D deficiency.[14] The main barrier we identified was occasional failure to use the electronic order set. This was in large part due to moonlighting physicians, who occasionally cover hospitalist shifts. They accounted for 5 of the 7 missed patients. The other 2 misses were due to group physicians not using the order set. These findings were first identified after 6 months of data were analyzed. These data were presented to the hospitalist group, with reminders to reinforce order set use with moonlighters and to manually order levels after admission if the order set was not utilized.
We found more difficulty with discharging deficient patients on the recommended dose of vitamin D. Our low level at the time of implementation40.9%was actually higher than a recent Swiss study, which found that only 27% of patients with acute hip fracture were discharged on any vitamin D, despite 91% of patients having 25‐OH vitamin D levels <30 ng/mL.[15] However, our proportion of deficient patients discharged on the recommended vitamin D dose only improved to 68.0% during our interventions. This is similar to Glowacki et al., who reported discharging 76% of hip fracture patients on vitamin D and/or calcium through utilization of a discharge pathway, though they did not differentiate vitamin D from calcium in results or attempt to identify patient‐specific vitamin D dosing based on serum levels.[14]
We did identify and address several barriers to discharging patients on the recommended dose. First, we experienced slow turnaround time in measurement of 25‐OH vitamin D. Early into the project, we received several reports of patients being discharged before vitamin D levels had returned. We communicated with the director of UNC Hospitals' core laboratories. A major issue was that the special chemistry section of the core laboratory did not report results directly into the hospital's main electronic reporting system, so that the results had to be hand entered. Over several months, the laboratory worked to improve turnaround times. A run chart plot of the percentage of assays reported within 48 hours for each month showed significant improvement with these efforts (see Supporting Information, Figure 1, in the online version of this article). All 9 data points after our initial discussion with the laboratory director were above the mean established during the prior 4 months, meeting run chart rules for a fundamental change in the system.[13]
The second issue identified was that the ranges for deficiency and insufficiency recommended by Endocrine Society guidelines did not match the reference ranges provided by UNC Hospitals. UNC Hospitals reported levels of 25‐OH vitamin D as normal if above 24, whereas the Endocrine Society defined normal as above 29. When analyzing data after 6 months, we found several patients who had been screened appropriately with results available and noted by the discharging physician, but with results in the normal range per our laboratory. Several of these patients, though low in vitamin D by Endocrine Society standards, were not treated. The laboratory director was again contacted, who noted that the UNC reference ranges had been formed before the Endocrine Society guidelines had been published. We elected to continue with the more conservative ranges recommended by the Endocrine Society. We presented results to the group after 6 months of data had been collected and emphasized our recommended reference ranges and vitamin D dosing (Table 1). We also created reference charts with this information and hung them by all computer workstations in the hospitalist office. With this continued assessment of data and provider education, we did note further improvement through the implementation period, with 90.0% of the last sample of deficient/emnsufficient patients discharged on the recommended dose of vitamin D (Figure 3).
We debated whether to include calcium supplementation as part of our intervention, but given known potential harms from calcium supplementation, including nephrolithiasis and possible increased cardiovascular risk,[16] we elected to focus exclusively on vitamin D. Although studies of primary and secondary fragility fracture prevention with vitamin D have not demonstrated consistently positive results, the studies were not specifically targeted to vitamin D‐deficient patients.[17, 18] Even in the absence of definitively proven secondary fracture prevention, given the multiple health issues associated with vitamin D deficiency, we believe that screening high prevalence populations and treating appropriately is best practice. With minimal patient costs (our institution charges $93 per assay) and a high prevalence (50% in our population), we believe universal screening of elderly patients with hip fracture for vitamin D deficiency is also cost‐effective.
Our project was specifically designed to address the issue of vitamin D deficiency in elderly hip fracture patients, but most of these patients also have osteoporosis. Although vitamin D deficiency contributes to osteoporosis, it is certainly not the only factor. It is also recognized that a minority of patients with fragility fractures receives subsequent evaluation and treatment for osteoporosis, <20% in a recent large population‐based study.[19] The American Orthopedic Association has recently launched a website and campaign entitled Own the Bone to improve the quality of care for patients after osteoporotic fracture.[20] A number of measures have been studied to improve the deficit in care, often termed the osteoporosis treatment gap. Edwards and colleagues recently described an intervention based on their institutional electronic medical record.[21] The intervention included order sets for diagnosing osteoporosis and educational materials for patients and providers, but did not demonstrate any change in percentage of patients evaluated for osteoporosis after fragility fracture. Successful randomized controlled trials have been reported using mail notification of physicians and patients after osteoporotic fracture[22]; multifaceted telephone, education and mail notification interventions after wrist fracture[23]; and through the use of a central osteoporosis coordinator to coordinate osteoporosis treatment after a fragility fracture.[24] These successful trials were broad in scope and yet reported modest (10%20%) gains in improvement.
Although bisphophonate therapy is of proven benefit in secondary fracture prevention, there are a number of barriers to initiating it in the acute setting after fragility fracture, as the difficulty in getting large improvement during the above trials suggests. These include recommendations from some experts for bone density testing before starting treatment and theoretic concerns of impairing fracture healing in the initial weeks after acute fracture. Both of these concerns make a hospitalist‐based intervention for osteoporosis evaluation and treatment challenging and beyond the scope of our project's quality improvement efforts.
Our study has some limitations. It was conducted in a single institution and electronic order entry system, which could limit the ability to generalize the results. We did not assess vitamin D compliance or follow‐up after hospitalization, so we are unable to determine if patients successfully completed treatment after it was prescribed. We also found slight differences in race between the pre‐ and postintervention groups. Although we did not perform multivariable regression to account for these differences, we feel such analyses would be unlikely to alter our results. Last, it should be noted that there may be unintended consequences from preselected orders, such as the ones we utilized for vitamin D assays and empiric supplementation. For example, patients with a recently checked vitamin D assay would have duplication of that lab. Similarly, patients who were already taking vitamin D could theoretically be placed on double therapy at admission. With safeguards in the electronic system to flag duplicate medications, low toxicity of standard doses of vitamin D, and minimal economic harm with duplicate laboratory therapy in the context of a hospitalization for hip fracture, we believe the risks are outweighed by the benefits of screening.
In summary, with review of evidence, modification of a computerized physician order set, provider education and feedback, and collaboration with our clinical laboratory, we were able to standardize and improve group practice for the assessment and treatment of vitamin D deficiency in elderly patients with hip fracture. We believe that our model could be applied to other institutions to further improve patient care. Given the extremely high incidence of hip fracture and consistently high prevalence of vitamin D deficiency in this population across studies, these findings have important implications for the care of this commonly encountered and vulnerable group of patients.
Disclosures: Data from this project were presented in abstract form at the Society of Hospital Medicine Annual Meetings in 2013 and 2014 and as an abstract at the Society of General Internal Medicine Annual Meeting in 2014. Dr. Catherine Hammett‐Stabler, Director of UNC Hospitals McLendon Core Laboratories, provided data on vitamin D assay turnaround times. The authors report no conflicts of interest.
- , , , . Incidence and mortality of hip fractures in the United States. JAMA. 2009;302(14):1573–1579.
- , , , , , . Occult vitamin D deficiency in postmenopausal US women with acute hip fracture. JAMA. 1999;281(16):1505–1511.
- , , , , , . Prevalence of vitamin D inadequacy in Scottish adults with non‐vertebral fragility fractures. Curr Med Res Opin. 2005;21(9):1355–1361.
- , , . Prevalence of vitamin D inadequacy in osteoporotic hip fracture patients in London. Curr Med Res Opin. 2005;21(12):1891–1894.
- , , , et al. Half of the patients with an acute hip fracture suffer from hypovitaminosis D: a prospective study in southeastern Finland. Osteoporos Int. 2005;16(12):2018–2024.
- , , , et al. Prevalence of vitamin D inadequacy in Belfast following fragility fracture. Curr Med Res Opin. 2006;22(1):101–105.
- , , , , , . High prevalence of hypovitaminosis D and K in patients with hip fracture. Asia Pac J Clin Nutr. 2011;20(1):56–61.
- , , , . Vitamin D insufficiency in patients with acute hip fractures of all ages and both sexes in a sunny climate. J Orthop Trauma. 2013;27(12):e275–e280.
- , , , et al. Vitamin D and intact PTH status in patients with hip fracture. Osteoporos Int. 2006;17(11):1608–1614.
- , , , et al. Distribution and correlates of serum 25‐hydroxyvitamin D levels in a sample of patients with hip fracture. Am J Geriatr Pharmacother. 2007;5(4):335–340.
- , , , et al. Evaluation, treatment, and prevention of vitamin D deficiency: an Endocrine Society clinical practice guideline. J Clin Endocrinol Metab. 2011;96(7):1911–1930.
- , . Prevention of falls in community‐dwelling older adults: U.S. Preventive Services Task Force recommendation statement. Ann Intern Med. 2012;157(3):197–204.
- , . The Health Care Data Guide: Learning From Data for Improvement. 1st ed. San Francisco, CA: Jossey‐Bass; 2011.
- , , , , . Importance of vitamin D in hospital‐based fracture care pathways. J Nutr Health Aging. 2008;12(5):291–293.
- , , , et al. Before and after hip fracture, vitamin D deficiency may not be treated sufficiently. Osteoporos Int. 2013;24(11):2765–2773.
- , , , et al. Effect of calcium supplements on risk of myocardial infarction and cardiovascular events: meta‐analysis. BMJ. 2010;341:c3691.
- , , , et al. A pooled analysis of vitamin D dose requirements for fracture prevention. N Engl J Med. 2012;367(1):40–49.
- , , , et al. Oral vitamin D3 and calcium for secondary prevention of low‐trauma fractures in elderly people (Randomised Evaluation of Calcium Or vitamin D, RECORD): a randomised placebo‐controlled trial. Lancet. 2005;365(9471):1621–1628.
- , , , et al. A population‐based analysis of the post‐fracture care gap 1996–2008: the situation is not improving. Osteoporos Int. 2012;23(5):1623–1629.
- American Orthopedic Association. Own the Bone website. 2011. Available at: http://www.ownthebone.org. Accessed August 1, 2014.
- , , , et al. Development of an electronic medical record based intervention to improve medical care of osteoporosis. Osteoporos Int. 2012;23(10):2489–2498.
- , , , , . Closing the gap in postfracture care at the population level: a randomized controlled trial. CMAJ. 2012;184(3):290–296.
- , , , et al. Multifaceted intervention to improve diagnosis and treatment of osteoporosis in patients with recent wrist fracture: a randomized controlled trial. CMAJ. 2008;178(5):569–575.
- , , , et al. Impact of a centralized osteoporosis coordinator on post‐fracture osteoporosis management: a cluster randomized trial. Osteoporos Int. 2012;23(1):87–95.
Hip fracture is a common clinical problem, with an incidence of 957 cases/100,000 adults in the United States.[1] Studies have found a high prevalence of vitamin D deficiency among elderly patients with fragility fractures, though many of these studies were performed in high latitude regions.[2, 3, 4, 5, 6, 7, 8, 9, 10] Endocrine Society clinical practice guidelines recommend screening patients with fragility fractures for vitamin D deficiency.[11]
Our hospitalist group practices in an academic tertiary care facility in the southeastern United States. Beginning in June 2010, all patients with acute hip fracture were admitted to our service with consultative comanagement from orthopedics. Our group did not have a standardized approach for the assessment or treatment of vitamin D deficiency in this population. Preliminary analysis of a subgroup of our patients with acute hip fracture revealed that only 29% had been screened for vitamin D deficiency. Of these patients, 68% were deficient or insufficient, yet less than half had been discharged on an appropriate dose of vitamin D. We concluded that our group practice was both varied and substandard.
In this report we describe the creation and implementation of a process for improving the assessment and treatment of vitamin D deficiency in elderly patients with fragility hip fracture. We evaluated the effect of our process on the percentages of patients screened and treated appropriately for vitamin D deficiency.
METHODS
Creation of Intervention
We assembled a task force, consisting of 4 hospitalist physicians. The task force reviewed available literature on the prevalence of vitamin D deficiency in elderly patients with fragility fracture and major practice guidelines related to vitamin D. We utilized Endocrine Society clinical practice guidelines to define vitamin D deficiency, insufficiency, and recommended treatment dosing for each condition[11] (Table 1).
| Vitamin D Level (25‐OH) | Vitamin D Status | Treatment Dose Recommendation |
|---|---|---|
| 019 ng/mL | Deficient | 50,000 IU/week for 68 weeks |
| 2029 ng/mL | Insufficient | 1,000 to 2,000 IU/day or 50,000 IU/month |
We developed 2 processes for improving group practice. First, we presented a review of evidence and preliminary data from our group practice at a meeting of hospitalist staff. Second, we revised the computerized physician order entry (CPOE) set for patients with hip fractures to include 2 new orders: (1) an automatic order for 25‐OH vitamin D level to be drawn the morning after admission and (2) an order for initiation of 1000 IU daily of vitamin D at admission.
The reasons for starting empiric vitamin D supplementation were 2fold. First was to prompt dosing of vitamin D at the time of discharge by already having it on the patient's medication list. Second was to conform to US Preventive Services Task Force guidelines for fall prevention.[12] The dose of 1000 IU was selected due to its being adequate treatment for insufficient (though not deficient) patients, and yet a low enough dose to minimize risk of toxicity.
Providers
Our hospitalist group includes 21 physicians and 3 physician extenders. Two nocturnist positions were added to our group in July 2013, part way through our intervention. There were no other additions or subtractions to the staff during the study period.
Patients
Patients were identified by search of University of North Carolina (UNC) Hospitals' database using International Classification of Diseases, 9th Revision codes for femoral neck fracture (821.x) and femur fracture NOS (820.x), linked to hospital services covered by our group. Exclusion criteria included age 50 years, fracture due to high‐speed trauma, fracture due to malignancy, end‐stage renal disease, and death or transition to comfort care during the index hospitalization.
Outcome Measures
Primary outcome measures were the percentage of patients with acute hip fracture with vitamin D level checked during hospitalization and the percentage of deficient patients discharged on the recommended dose of vitamin D. Outcomes were measured for the 28 months before intervention (when our group assumed direct care for hip fracture patients) and were compared with the 12 months after intervention. We also report the prevalence of vitamin D deficiency in our population.
Laboratory Methodology
25‐OH vitamin D assays were performed by UNC Hospitals' core laboratories. Assays were performed using liquid chromatography tandem mass spectroscopy technique. Methodology remained constant through the study period.
During implementation of the project, we identified slow turnaround time in reporting of the vitamin D assays as an issue. We subsequently plotted the percentage of assays returned within 48 hours for each month of the study period on a run chart.
Analysis
Primary outcome measures and demographic data were tested for statistical significance with the 2 test. As a separate means of analysis, we plotted a control chart for the percentage of patients with vitamin D level checked and a run chart for the percentage of deficient or insufficient patients discharged on the recommended dose of vitamin D. To ensure a constant sample size, consecutive samples of patients were plotted in chronologic order. Results were interpreted with standard Shewhart rules.[13] 2 testing and plotting of control and run charts were performed using Microsoft Excel (Microsoft Corp., Redmond, WA) and QI Charts (Process Improvement Products, Austin, TX).
Implementation
In October 2012, we presented the review of evidence and preliminary data to the hospitalist group and made the new CPOE hip fracture order set available. Implementation was monitored by solicitation of qualitative feedback from group physicians and analysis of outcome data every 6 months. Issues that arose during implementation are described in a project timeline (Figure 1) and discussed in detail in manuscript discussion. We received institutional review board approval to study the project's implementation.
RESULTS
Patients
There were 220 patients identified in the 28 months before implementation. Twenty‐four were excluded by criteria, leaving 196 for analysis. One hundred thirteen patients were identified after implementation. Six patients were excluded by criteria, leaving 107 for analysis.
The mean patient age was 80 years, and the median age was 83 years. Seventy‐five percent were female. Race categories were 85% Caucasian, 8% African American, 3% Asian, 1% Native American, 1% Hispanic, and 3% other.
The preintervention group had mean and median ages of 80 and 82 years, respectively, compared with 81 and 84 years, respectively, in the postintervention group. Seventy‐five percent of the preintervention group was female, compared with 74% postintervention. The only statistically significant difference was in the percentage of Caucasian patients81% of preintervention group compared with 91% of the postintervention group (P = 0.028).
Primary Outcomes
The percentage of patients with acute hip fracture with vitamin D level checked before project implementation was 37.2% (n = 196). After implementation, the percentage improved to 93.5% (n = 107, P < 0.001).
The proportion chart plot of the same data (Figure 2) shows evidence of a fundamental change after intervention. Data points showing the proportion of consecutive samples of 15 patients were plotted chronologically. All points after implementation were above the upper control limit, meeting Shewhart control chart rules for special cause variation.[13]
The percentage of vitamin D deficient/emnsufficient patients discharged on the recommended dose of vitamin D also improved, rising from 40.9% (n = 44) before to 68.0% (n = 50) after implementation (P = 0.008). Because there were fewer candidates for this outcome, we plotted samples of 10 patients consecutively on a run chart (Figure 3). Although there were insufficient data to establish a trend by run chart rules, the last 4 consecutive data points showed sequential improvement.
Prevalence of Vitamin D Insufficiency and Deficiency
Before implementation, 44 of the 73 patients (60.3%) with vitamin D levels checked were deficient or insufficient (25‐OH vitamin D <30 ng/mL); of those 44 patients, 21 (28.8% of total checked) had 25‐OH vitamin D levels <20 ng/mL. After implementation, 50 of 100 patients with levels checked were identified as deficient or insufficient (50%); of those 50 patients, 23 (23% of total) had 25‐OH vitamin D levels <20 ng/mL.
DISCUSSION
Our interventions correlated with significant improvements in the assessment and treatment of vitamin D deficiency in elderly patients with fragility hip fractures. Our study demonstrates a systematic method groups may use to adopt and reliably implement practice guidelines. Moreover, we report several steps to implementation that enhanced our ability to standardize clinical care.
The prevalence of vitamin D deficiency and insufficiency we identified50.0% after change implementationis within the range reported in prior studies, though our result is notable for being in a southern region of the United States. The prevalence we found before implementation (60.3%) may have been subject to selection bias in screening, so 50.0% is likely the more correct prevalence. Other US studies of vitamin D deficiency prevalence in hip fracture patients report rates from 50% to 65.8%.[2, 8, 10]
The percentage of hip fracture patients screened for vitamin D deficiency showed significant improvement after our interventions, rising to 93.5%. As a comparison with our results, a 2008 study after implementation of a hip fracture pathway reported only screening 37% of patients for vitamin D deficiency.[14] The main barrier we identified was occasional failure to use the electronic order set. This was in large part due to moonlighting physicians, who occasionally cover hospitalist shifts. They accounted for 5 of the 7 missed patients. The other 2 misses were due to group physicians not using the order set. These findings were first identified after 6 months of data were analyzed. These data were presented to the hospitalist group, with reminders to reinforce order set use with moonlighters and to manually order levels after admission if the order set was not utilized.
We found more difficulty with discharging deficient patients on the recommended dose of vitamin D. Our low level at the time of implementation40.9%was actually higher than a recent Swiss study, which found that only 27% of patients with acute hip fracture were discharged on any vitamin D, despite 91% of patients having 25‐OH vitamin D levels <30 ng/mL.[15] However, our proportion of deficient patients discharged on the recommended vitamin D dose only improved to 68.0% during our interventions. This is similar to Glowacki et al., who reported discharging 76% of hip fracture patients on vitamin D and/or calcium through utilization of a discharge pathway, though they did not differentiate vitamin D from calcium in results or attempt to identify patient‐specific vitamin D dosing based on serum levels.[14]
We did identify and address several barriers to discharging patients on the recommended dose. First, we experienced slow turnaround time in measurement of 25‐OH vitamin D. Early into the project, we received several reports of patients being discharged before vitamin D levels had returned. We communicated with the director of UNC Hospitals' core laboratories. A major issue was that the special chemistry section of the core laboratory did not report results directly into the hospital's main electronic reporting system, so that the results had to be hand entered. Over several months, the laboratory worked to improve turnaround times. A run chart plot of the percentage of assays reported within 48 hours for each month showed significant improvement with these efforts (see Supporting Information, Figure 1, in the online version of this article). All 9 data points after our initial discussion with the laboratory director were above the mean established during the prior 4 months, meeting run chart rules for a fundamental change in the system.[13]
The second issue identified was that the ranges for deficiency and insufficiency recommended by Endocrine Society guidelines did not match the reference ranges provided by UNC Hospitals. UNC Hospitals reported levels of 25‐OH vitamin D as normal if above 24, whereas the Endocrine Society defined normal as above 29. When analyzing data after 6 months, we found several patients who had been screened appropriately with results available and noted by the discharging physician, but with results in the normal range per our laboratory. Several of these patients, though low in vitamin D by Endocrine Society standards, were not treated. The laboratory director was again contacted, who noted that the UNC reference ranges had been formed before the Endocrine Society guidelines had been published. We elected to continue with the more conservative ranges recommended by the Endocrine Society. We presented results to the group after 6 months of data had been collected and emphasized our recommended reference ranges and vitamin D dosing (Table 1). We also created reference charts with this information and hung them by all computer workstations in the hospitalist office. With this continued assessment of data and provider education, we did note further improvement through the implementation period, with 90.0% of the last sample of deficient/emnsufficient patients discharged on the recommended dose of vitamin D (Figure 3).
We debated whether to include calcium supplementation as part of our intervention, but given known potential harms from calcium supplementation, including nephrolithiasis and possible increased cardiovascular risk,[16] we elected to focus exclusively on vitamin D. Although studies of primary and secondary fragility fracture prevention with vitamin D have not demonstrated consistently positive results, the studies were not specifically targeted to vitamin D‐deficient patients.[17, 18] Even in the absence of definitively proven secondary fracture prevention, given the multiple health issues associated with vitamin D deficiency, we believe that screening high prevalence populations and treating appropriately is best practice. With minimal patient costs (our institution charges $93 per assay) and a high prevalence (50% in our population), we believe universal screening of elderly patients with hip fracture for vitamin D deficiency is also cost‐effective.
Our project was specifically designed to address the issue of vitamin D deficiency in elderly hip fracture patients, but most of these patients also have osteoporosis. Although vitamin D deficiency contributes to osteoporosis, it is certainly not the only factor. It is also recognized that a minority of patients with fragility fractures receives subsequent evaluation and treatment for osteoporosis, <20% in a recent large population‐based study.[19] The American Orthopedic Association has recently launched a website and campaign entitled Own the Bone to improve the quality of care for patients after osteoporotic fracture.[20] A number of measures have been studied to improve the deficit in care, often termed the osteoporosis treatment gap. Edwards and colleagues recently described an intervention based on their institutional electronic medical record.[21] The intervention included order sets for diagnosing osteoporosis and educational materials for patients and providers, but did not demonstrate any change in percentage of patients evaluated for osteoporosis after fragility fracture. Successful randomized controlled trials have been reported using mail notification of physicians and patients after osteoporotic fracture[22]; multifaceted telephone, education and mail notification interventions after wrist fracture[23]; and through the use of a central osteoporosis coordinator to coordinate osteoporosis treatment after a fragility fracture.[24] These successful trials were broad in scope and yet reported modest (10%20%) gains in improvement.
Although bisphophonate therapy is of proven benefit in secondary fracture prevention, there are a number of barriers to initiating it in the acute setting after fragility fracture, as the difficulty in getting large improvement during the above trials suggests. These include recommendations from some experts for bone density testing before starting treatment and theoretic concerns of impairing fracture healing in the initial weeks after acute fracture. Both of these concerns make a hospitalist‐based intervention for osteoporosis evaluation and treatment challenging and beyond the scope of our project's quality improvement efforts.
Our study has some limitations. It was conducted in a single institution and electronic order entry system, which could limit the ability to generalize the results. We did not assess vitamin D compliance or follow‐up after hospitalization, so we are unable to determine if patients successfully completed treatment after it was prescribed. We also found slight differences in race between the pre‐ and postintervention groups. Although we did not perform multivariable regression to account for these differences, we feel such analyses would be unlikely to alter our results. Last, it should be noted that there may be unintended consequences from preselected orders, such as the ones we utilized for vitamin D assays and empiric supplementation. For example, patients with a recently checked vitamin D assay would have duplication of that lab. Similarly, patients who were already taking vitamin D could theoretically be placed on double therapy at admission. With safeguards in the electronic system to flag duplicate medications, low toxicity of standard doses of vitamin D, and minimal economic harm with duplicate laboratory therapy in the context of a hospitalization for hip fracture, we believe the risks are outweighed by the benefits of screening.
In summary, with review of evidence, modification of a computerized physician order set, provider education and feedback, and collaboration with our clinical laboratory, we were able to standardize and improve group practice for the assessment and treatment of vitamin D deficiency in elderly patients with hip fracture. We believe that our model could be applied to other institutions to further improve patient care. Given the extremely high incidence of hip fracture and consistently high prevalence of vitamin D deficiency in this population across studies, these findings have important implications for the care of this commonly encountered and vulnerable group of patients.
Disclosures: Data from this project were presented in abstract form at the Society of Hospital Medicine Annual Meetings in 2013 and 2014 and as an abstract at the Society of General Internal Medicine Annual Meeting in 2014. Dr. Catherine Hammett‐Stabler, Director of UNC Hospitals McLendon Core Laboratories, provided data on vitamin D assay turnaround times. The authors report no conflicts of interest.
- , , , . Incidence and mortality of hip fractures in the United States. JAMA. 2009;302(14):1573–1579.
- , , , , , . Occult vitamin D deficiency in postmenopausal US women with acute hip fracture. JAMA. 1999;281(16):1505–1511.
- , , , , , . Prevalence of vitamin D inadequacy in Scottish adults with non‐vertebral fragility fractures. Curr Med Res Opin. 2005;21(9):1355–1361.
- , , . Prevalence of vitamin D inadequacy in osteoporotic hip fracture patients in London. Curr Med Res Opin. 2005;21(12):1891–1894.
- , , , et al. Half of the patients with an acute hip fracture suffer from hypovitaminosis D: a prospective study in southeastern Finland. Osteoporos Int. 2005;16(12):2018–2024.
- , , , et al. Prevalence of vitamin D inadequacy in Belfast following fragility fracture. Curr Med Res Opin. 2006;22(1):101–105.
- , , , , , . High prevalence of hypovitaminosis D and K in patients with hip fracture. Asia Pac J Clin Nutr. 2011;20(1):56–61.
- , , , . Vitamin D insufficiency in patients with acute hip fractures of all ages and both sexes in a sunny climate. J Orthop Trauma. 2013;27(12):e275–e280.
- , , , et al. Vitamin D and intact PTH status in patients with hip fracture. Osteoporos Int. 2006;17(11):1608–1614.
- , , , et al. Distribution and correlates of serum 25‐hydroxyvitamin D levels in a sample of patients with hip fracture. Am J Geriatr Pharmacother. 2007;5(4):335–340.
- , , , et al. Evaluation, treatment, and prevention of vitamin D deficiency: an Endocrine Society clinical practice guideline. J Clin Endocrinol Metab. 2011;96(7):1911–1930.
- , . Prevention of falls in community‐dwelling older adults: U.S. Preventive Services Task Force recommendation statement. Ann Intern Med. 2012;157(3):197–204.
- , . The Health Care Data Guide: Learning From Data for Improvement. 1st ed. San Francisco, CA: Jossey‐Bass; 2011.
- , , , , . Importance of vitamin D in hospital‐based fracture care pathways. J Nutr Health Aging. 2008;12(5):291–293.
- , , , et al. Before and after hip fracture, vitamin D deficiency may not be treated sufficiently. Osteoporos Int. 2013;24(11):2765–2773.
- , , , et al. Effect of calcium supplements on risk of myocardial infarction and cardiovascular events: meta‐analysis. BMJ. 2010;341:c3691.
- , , , et al. A pooled analysis of vitamin D dose requirements for fracture prevention. N Engl J Med. 2012;367(1):40–49.
- , , , et al. Oral vitamin D3 and calcium for secondary prevention of low‐trauma fractures in elderly people (Randomised Evaluation of Calcium Or vitamin D, RECORD): a randomised placebo‐controlled trial. Lancet. 2005;365(9471):1621–1628.
- , , , et al. A population‐based analysis of the post‐fracture care gap 1996–2008: the situation is not improving. Osteoporos Int. 2012;23(5):1623–1629.
- American Orthopedic Association. Own the Bone website. 2011. Available at: http://www.ownthebone.org. Accessed August 1, 2014.
- , , , et al. Development of an electronic medical record based intervention to improve medical care of osteoporosis. Osteoporos Int. 2012;23(10):2489–2498.
- , , , , . Closing the gap in postfracture care at the population level: a randomized controlled trial. CMAJ. 2012;184(3):290–296.
- , , , et al. Multifaceted intervention to improve diagnosis and treatment of osteoporosis in patients with recent wrist fracture: a randomized controlled trial. CMAJ. 2008;178(5):569–575.
- , , , et al. Impact of a centralized osteoporosis coordinator on post‐fracture osteoporosis management: a cluster randomized trial. Osteoporos Int. 2012;23(1):87–95.
© 2014 Society of Hospital Medicine
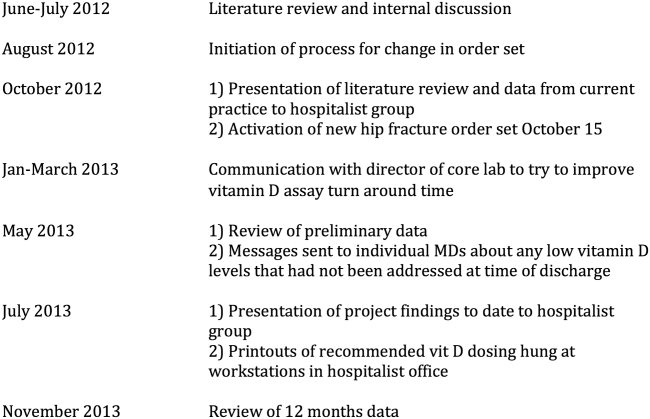
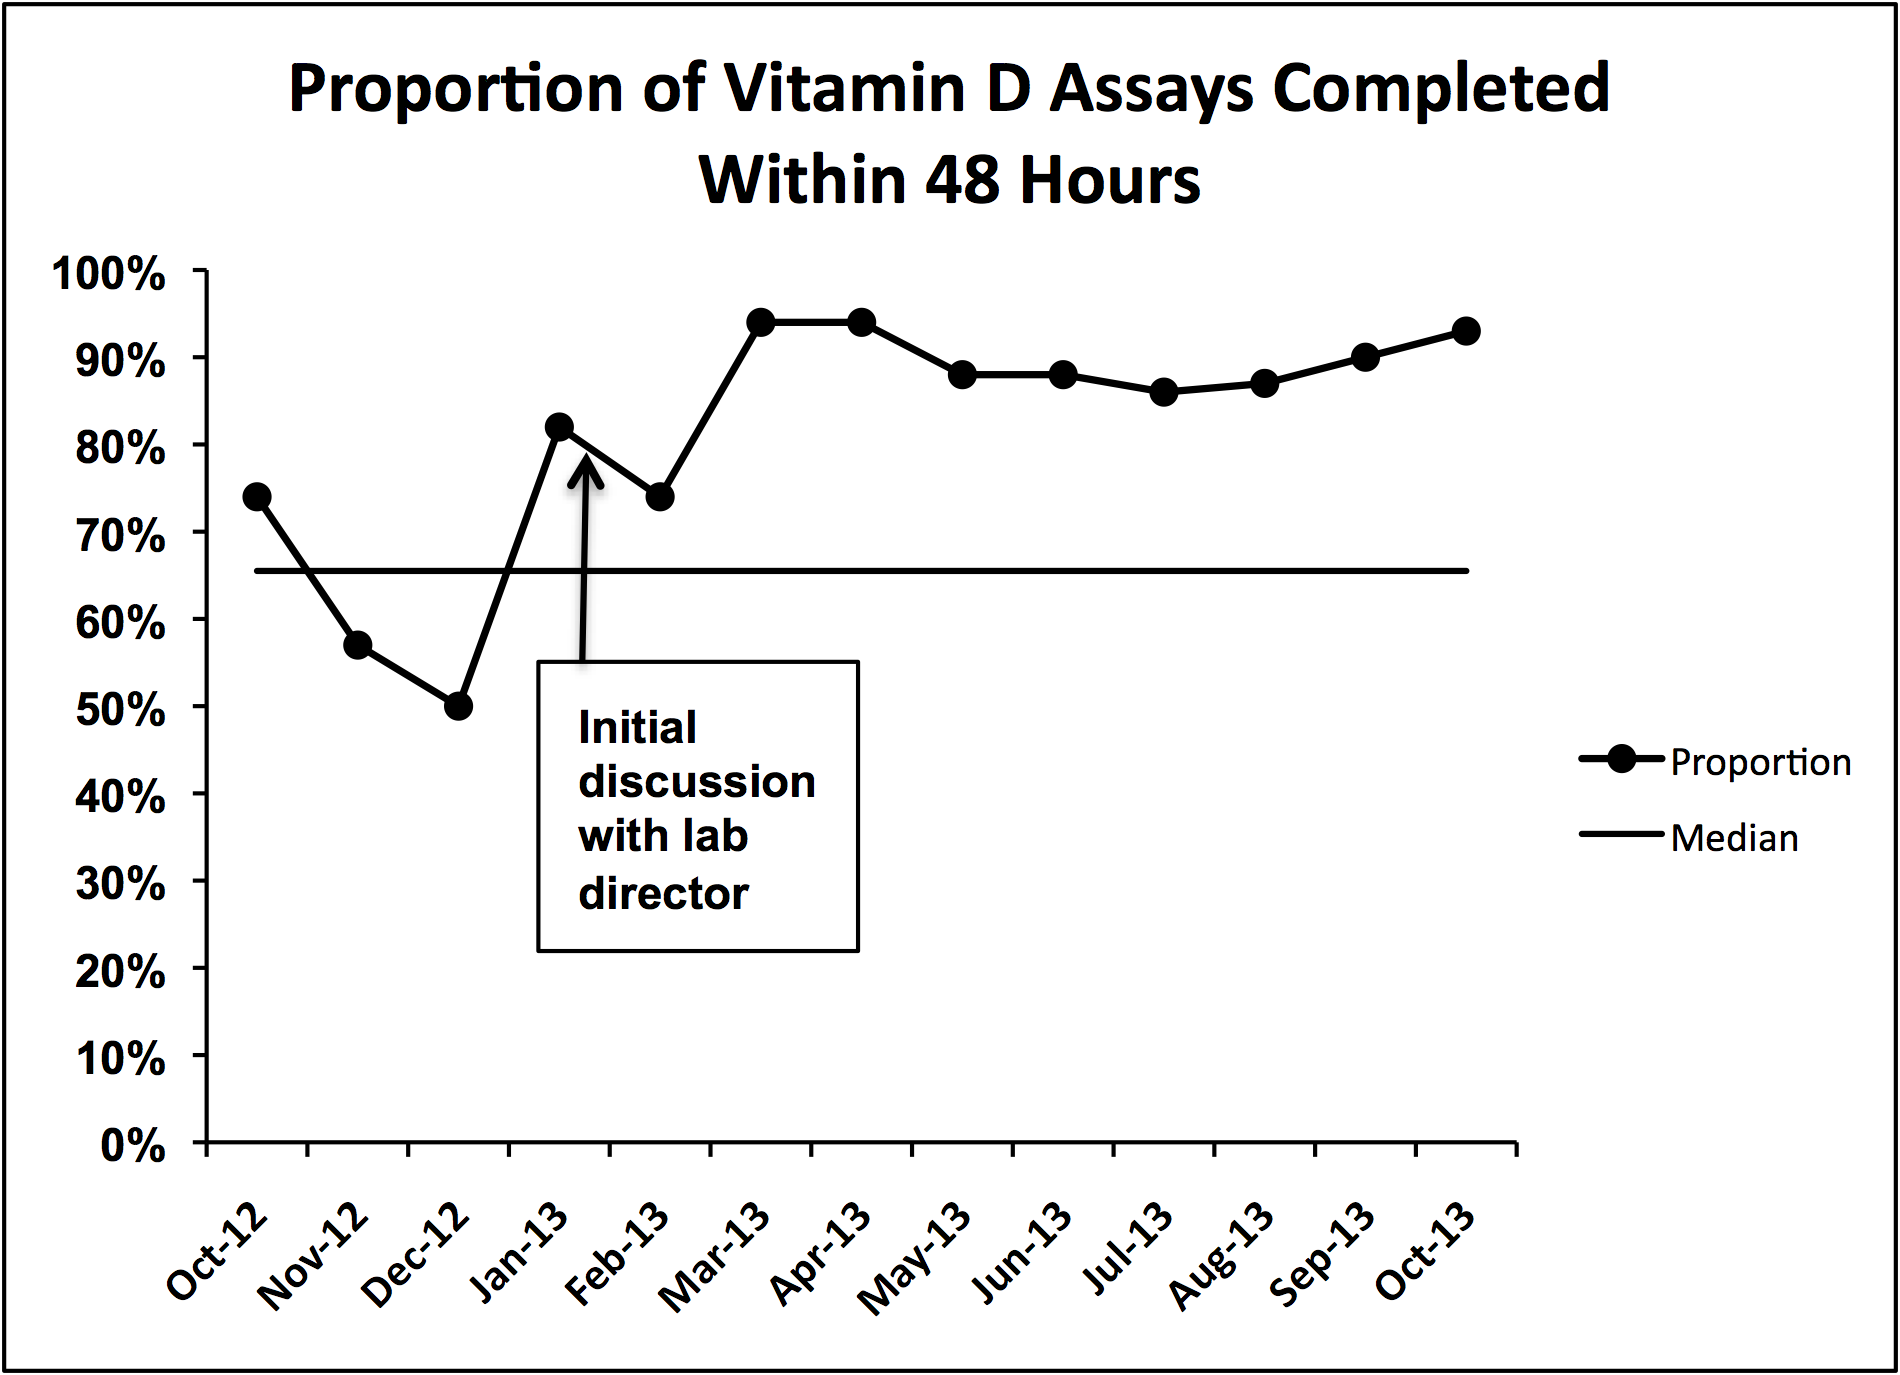
Problems Identified by Advice Line Calls
The period immediately following hospital discharge is particularly hazardous for patients.[1, 2, 3, 4, 5] Problems occurring after discharge may result in high rates of rehospitalization and unscheduled visits to healthcare providers.[6, 7, 8, 9, 10] Numerous investigators have tried to identify patients who are at increased risk for rehospitalizations within 30 days of discharge, and many studies have examined whether various interventions could decrease these adverse events (summarized in Hansen et al.[11]). An increasing fraction of patients discharged by medicine and surgery services have some or all of their care supervised by hospitalists. Thus, hospitals increasingly look to hospitalists for ways to reduce rehospitalizations.
Patients discharged from our hospital are instructed to call an advice line (AL) if and when questions or concerns arise. Accordingly, we examined when these calls were made and what issues were raised, with the idea that the information collected might identify aspects of our discharge processes that needed improvement.
METHODS
Study Design
We conducted a prospective study of a cohort consisting of all unduplicated patients with a matching medical record number in our data warehouse who called our AL between September 1, 2011 and September 1, 2012, and reported being hospitalized or having surgery (inpatient or outpatient) within 30 days preceding their call. We excluded patients who were incarcerated, those who were transferred from other hospitals, those admitted for routine chemotherapy or emergent dialysis, and those discharged to a skilled nursing facility or hospice. The study involved no intervention. It was approved by the Colorado Multiple Institutional Review Board.
Setting
The study was conducted at Denver Health Medical Center, a 525‐bed, university‐affiliated, public safety‐net hospital. At the time of discharge, all patients were given paperwork that listed the telephone number of the AL and written instructions in English or Spanish telling them to call the AL or their primary care physician if they had any of a list of symptoms that was selected by their discharging physician as being relevant to that specific patient's condition(s).
The AL was established in 1997 to provide medical triage to patients of Denver Health. It operates 24 hours a day, 7 days per week, and receives approximately 100,000 calls per year. A language line service is used with nonEnglish‐speaking callers. Calls are handled by a nurse who, with the assistance of a commercial software program (E‐Centaurus; LVM Systems, Phoenix, AZ) containing clinical algorithms (Schmitt‐Thompson Clinical Content, Windsor, CO), makes a triage recommendation. Nurses rarely contact hospital or clinic physicians to assist with triage decisions.
Variables Assessed
We categorized the nature of the callers' reported problem(s) to the AL using the taxonomy summarized in the online appendix (see Supporting Appendix in the online version of this article). We then queried our data warehouse for each patient's demographic information, patient‐level comorbidities, discharging service, discharge date and diagnoses, hospital length of stay, discharge disposition, and whether they had been hospitalized or sought care in our urgent care center or emergency department within 30 days of discharge. The same variables were collected for all unduplicated patients who met the same inclusion and exclusion criteria and were discharged from Denver Health during the same time period but did not call the AL.
Statistics
Data were analyzed using SAS Enterprise Guide 4.1 (SAS Institute, Inc., Cary, NC). Because we made multiple statistical comparisons, we applied the Bonferroni correction when comparing patients calling the AL with those who did not, such that P<0.004 indicated statistical significance. A Student t test or a Wilcoxon rank sum test was used to compare continuous variables depending on results of normality tests. 2 tests were used to compare categorical variables. The intervals between hospital discharge and the call to the AL for patients discharged from medicine versus surgery services were compared using a log‐rank test, with P<0.05 indicating statistical significance.
RESULTS
During the 1‐year study period, 19,303 unique patients were discharged home with instructions regarding the use of the AL. A total of 310 patients called the AL and reported being hospitalized or having surgery within the preceding 30 days. Of these, 2 were excluded (1 who was incarcerated and 1 who was discharged to a skilled nursing facility), leaving 308 patients in the cohort. This represented 1.5% of the total number of unduplicated patients discharged during this same time period (minus the exclusions described above). The large majority of the calls (277/308, 90%) came directly from patients. The remaining 10% came from a proxy, usually a patient's family member. Compared with patients who were discharged during the same time period who did not call the AL, those who called were more likely to speak English, less likely to speak Spanish, more likely to be medically indigent, had slightly longer lengths of stays for their index hospitalization, and were more likely to be discharged from surgery than medicine services (particularly following inpatient surgery) (Table 1).
| Patient Characteristics | Patients Calling Advice Line After Discharge, N=308 | Patients Not Calling Advice Line After Discharge, N=18,995 | P Valuea |
|---|---|---|---|
| |||
| Age, y (meanSD) | 4217 | 3921 | 0.0210 |
| Gender, female, n (%) | 162 (53) | 10,655 (56) | |
| Race/ethnicity, n (%) | 0.1208 | ||
| Hispanic/Latino/Spanish | 129 (42) | 8,896 (47) | |
| African American | 44 (14) | 2,674 (14) | |
| White | 125 (41) | 6,569 (35) | |
| Language, n (%) | <0.0001 | ||
| English | 273 (89) | 14,236 (79) | |
| Spanish | 32 (10) | 3,744 (21) | |
| Payer, n (%) | |||
| Medicare | 45 (15) | 3,013 (16) | |
| Medicaid | 105 (34) | 7,777 (41) | 0.0152 |
| Commercial | 49 (16) | 2,863 (15) | |
| Medically indigentb | 93 (30) | 3,442 (18) | <0.0001 |
| Self‐pay | 5 (1) | 1,070 (5) | |
| Primary care provider, n (%)c | 168 (55) | 10,136 (53) | 0.6794 |
| Psychiatric comorbidity, n (%) | 81 (26) | 4,528 (24) | 0.3149 |
| Alcohol or substance abuse comorbidity, n (%) | 65 (21) | 3,178 (17) | 0.0417 |
| Discharging service, n (%) | <0.0001 | ||
| Surgery | 193 (63) | 7,247 (38) | |
| Inpatient | 123 (40) | 3,425 (18) | |
| Ambulatory | 70 (23) | 3,822 (20) | |
| Medicine | 93 (30) | 6,038 (32) | |
| Pediatric | 4 (1) | 1,315 (7) | |
| Obstetric | 11 (4) | 3,333 (18) | |
| Length of stay, median (IQR) | 2 (04.5) | 1 (03) | 0.0003 |
| Inpatient medicine | 4 (26) | 3 (15) | 0.0020 |
| Inpatient surgery | 3 (16) | 2 (14) | 0.0019 |
| Charlson Comorbidity Index, median (IQR) | |||
| Inpatient medicine | 1 (04) | 1 (02) | 0.0435 |
| Inpatient surgery | 0 (01) | 0 (01) | 0.0240 |
The median time from hospital discharge to the call was 3 days (interquartile range [IQR], 16), but 31% and 47% of calls occurred within 24 or 48 hours of discharge, respectively. Ten percent of patients called the AL the same day of discharge (Figure 1). We found no difference in timing of the calls as a function of discharging service.

The 308 patients reported a total of 612 problems or concerns (meanstandard deviation number of complaints per caller=21), the large majority of which (71%) were symptom‐related (Table 2). The most common symptom was uncontrolled pain, reported by 33% and 40% of patients discharged from medicine and surgery services, respectively. The next most common symptoms related to the gastrointestinal system and to surgical site issues in medicine and surgery patients, respectively (data not shown).
| Total Cohort, n (%) | Patients Discharged From Medicine, n (%) | Patients Discharged From Surgery, n (%) | ||||
|---|---|---|---|---|---|---|
| Patients | Complaints | Patients | Complaints | Patients | Complaints | |
| Symptom related | 280 (91) | 433 (71) | 89 (96) | 166 (77) | 171 (89) | 234 (66) |
| Discharge instructions | 65 (21) | 81 (13) | 18 (19) | 21 (10) | 43 (22) | 56 (16) |
| Medication related | 65 (21) | 87 (14) | 19 (20) | 25 (11) | 39 (20) | 54 (15) |
| Other | 10 (3) | 11 (2) | 4 (4) | 4 (2) | 6 (3) | 7 (2) |
| Total | 612 (100) | 216 (100) | 351 (100) | |||
Sixty‐five patients, representing 21% of the cohort, reported 81 problems understanding or executing discharge instructions. No difference was observed between the fraction of these problems reported by patients from medicine versus surgery (19% and 22%, respectively, P=0.54).
Sixty‐five patients, again representing 21% of the cohort, reported 87 medication‐related problems, 20% from both the medicine and surgery services (P=0.99). Medicine patients more frequently reported difficulties understanding their medication instructions, whereas surgery patients more frequently reported lack of efficacy of medications, particularly with respect to pain control (data not shown).
Thirty percent of patients who called the AL were advised by the nurse to go to the emergency department immediately. Medicine patients were more likely to be triaged to the emergency department compared with surgery patients (45% vs 22%, P<0.0001).
The 30‐day readmission rates and the rates of unscheduled urgent or emergent care visits were higher for patients calling the AL compared with those who did not call (46/308, 15% vs 706/18,995, 4%, and 92/308, 30% vs 1303/18,995, 7%, respectively, both P<0.0001). Similar differences were found for patients discharged from medicine or surgery services who called the AL compared with those who did not (data not shown, both P<0.0001). The median number of days between AL call and rehospitalization was 0 (IQR, 02) and 1 (IQR, 08) for medicine and surgery patients, respectively. Ninety‐three percent of rehospitalizations were related to the index hospitalization, and 78% of patients who were readmitted had no outpatient encounter in the interim between discharge and rehospitalization.
DISCUSSION
We investigated the source and nature of patient telephone calls to an AL following a hospitalization or surgery, and our data revealed the following important findings: (1) nearly one‐half of the calls to the AL occurred within the first 48 hours following discharge; (2) the majority of the calls came from surgery patients, and a greater fraction of patients discharged from surgery services called the AL than patients discharged from medicine services; (3) the most common issues were uncontrolled pain, questions about medications, and problems understanding or executing aftercare instructions (particularly pertaining to the care of surgical wounds); and (4) patients calling the AL had higher rates of 30‐day rehospitalization and of unscheduled urgent or emergent care visits.
The utilization of our patient‐initiated call line was only 1.5%, which was on the low end of the 1% to 10% reported in the literature.[7, 12] This can be attributed to a number of issues that are specific to our system. First, the discharge instructions provided to our patients stated that they should call their primary care provider or the AL if they had questions. Accordingly, because approximately 50% of our patients had a primary care provider in our system, some may have preferentially contacted their primary care provider rather than the AL. Second, the instructions stated that the patients should call if they were experiencing the symptoms listed on the instruction sheet, so those with other problems/complaints may not have called. Third, AL personnel identified patients as being in our cohort by asking if they had been discharged or underwent a surgical procedure within 30‐days of their call. This may have resulted in the under‐reporting of patients who were hospitalized or had outpatient surgical procedures. Fourth, there may have been a number of characteristics specific to patients in our system that reduced the frequency with which they utilized the AL (eg, access to telephones or other community providers).
Most previous studies of patient‐initiated call lines have included them as part of multi‐intervention pre‐ and/or postdischarge strategies.[7, 8, 9, 10, 11, 12, 13] One prior small study compared the information reported by 37 patients who called an AL with that elicited by nurse‐initiated patient contact.[12] The most frequently reported problems in this study were medication‐related issues (43%). However, this study only included medicine patients and did not document the proportion of calls occurring at various time intervals.
The problems we identified (in both medicine and surgery patients) have previously been described,[2, 3, 4, 13, 14, 15, 16] but all of the studies reporting these problems utilized calls that were initiated by health care providers to patients at various fixed intervals following discharge (ie, 730 days). Most of these used a scripted approach seeking responses to specific questions or outcomes, and the specific timing at which the problems arose was not addressed. In contrast, we examined unsolicited concerns expressed by patients calling an AL following discharge whenever they felt sufficient urgency to address whatever problems or questions arose. We found that a large fraction of calls occurred on the day of or within the first 48 hours following discharge, much earlier than when provider‐initiated calls in the studies cited above occurred. Accordingly, our results cannot be used to compare the utility of patient‐ versus provider‐initiated calls, or to suggest that other hospitals should create an AL system. Rather, we suggest that our findings might be complementary to those reported in studies of provider‐initiated calls and only propose that by examining calls placed by patients to ALs, problems with hospital discharge processes (some of which may result in increased rates of readmission) may be discovered.
The observation that such a large fraction of calls to our AL occurred within the first 48 hours following discharge, together with the fact that many of the questions asked or concerns raised pertained to issues that should have been discussed during the discharge process (eg, pain control, care of surgical wounds), suggests that suboptimal patient education was occurring prior to discharge as was suggested by Henderson and Zernike.[17] This finding has led us to expand our patient education processes prior to discharge on both medicine and surgery services. Because our hospitalists care for approximately 90% of the patients admitted to medicine services and are increasingly involved in the care of patients on surgery services, they are integrally involved with such quality improvement initiatives.
To our knowledge this is the first study in the literature that describes both medicine and surgery patients who call an AL because of problems or questions following hospital discharge, categorizes these problems, determines when the patients called following their discharge, and identifies those who called as being at increased risk for early rehospitalizations and unscheduled urgent or emergent care visits. Given the financial penalties issued to hospitals with high 30‐day readmission rates, these patients may warrant more attention than is customarily available from telephone call lines or during routine outpatient follow‐up. The majority of patients who called our AL had Medicare, Medicaid, or a commercial insurance, and, accordingly, may have been eligible for additional services such as home visits and/or expedited follow‐up appointments.
Our study has a number of limitations. First, it is a single‐center study, so the results might not generalize to other institutions. Second, because the study was performed in a university‐affiliated, public safety‐net hospital, patient characteristics and the rates and types of postdischarge concerns that we observed might differ from those encountered in different types of hospitals and/or from those in nonteaching institutions. We would suggest, however, that the idea of using concerns raised by patients discharged from any type of hospital in calls to ALs may similarly identify problems with that specific hospital's discharge processes. Third, the information collected from the AL came from summaries provided by nurses answering the calls rather than from actual transcripts. This could have resulted in insufficient or incorrect information pertaining to some of the variables assessed in Table 2. The information presented in Table 1, however, was obtained from our data warehouse after matching medical record numbers. Fourth, we could have underestimated the number of patients who had 30‐day rehospitalizations and/or unplanned for urgent or emergent care visits if patients sought care at other hospitals. Fifth, the number of patients calling the AL was too small to allow us to do any type of robust matching or multivariable analysis. Accordingly, the differences that appeared between patients who called and those who did not (ie, English speakers, being medically indigent, the length of stay for the index hospitalization and the discharging service) could be the result of inadequate matching or interactions among the variables. Although matching or multivariate analysis might have yielded different associations between patients who called the AL versus those who did not, those who called the AL still had an increased risk of readmission and urgent or emergent visits and may still benefit from targeted interventions. Finally, the fact that only 1.5% of unique patients who were discharged called the AL could have biased our results. Because only 55% and 53% of the patients who did or did not call the AL, respectively, saw primary care physicians within our system within the 3 years prior to their index hospitalization (P=0.679), the frequency of calls to the AL that we observed could have underestimated the frequency with which patients had contact with other care providers in the community.
In summary, information collected from patient‐initiated calls to our AL identified several aspects of our discharge processes that needed improvement. We concluded that our predischarge educational processes for both medicine and surgery services needed modification, especially with respect to pain management, which problems to expect after hospitalization or surgery, and how to deal with them. The high rates of 30‐day rehospitalization and of unscheduled urgent or emergent care visits among patients calling the AL identifies them as being at increased risk for these outcomes, although the likelihood of these events may be related to factors other than just calling the AL.
- , , , , . Implementation of the care transitions intervention: sustainability and lessons learned. Prof Case Manag. 2009;14(6):282–293.
- , , , et al. Problems after discharge and understanding of communication with their primary care physicians among hospitalized seniors: a mixed methods study. J Hosp Med. 2010;5(7):385–391.
- , , , et al. Adverse events among medical patients after discharge from hospital. CMAJ. 2004;170(3):345–349.
- , , , , . The incidence and severity of adverse events affecting patients after discharge from the hospital. Ann Intern Med. 2003;138(3):161–167.
- , , . Post‐hospitalization transitions: examining the effects of timing of primary care provider follow‐up. J Hosp Med. 2010;5(7):392–397.
- , , , . Telephone follow‐up after discharge from the hospital: does it make a difference? Appl Nurs Res. 1996;9(2) 47–52.
- , , , et al. The effect of real‐time teleconsultations between hospital‐based nurses and patients with severe COPD discharged after an exacerbation. J Telemed Telecare. 2013;19(8):466–474.
- , , , , , . A randomized, controlled trial of an intensive community nurse‐supported discharge program in preventing hospital readmissions of older patients with chronic lung disease. J Am Geriatr Soc. 2004;52(8):1240–1246.
- , , , et al. Effects of education and support on self‐care and resource utilization in patients with heart failure. Eur Heart J. 1999;20(9):673–682.
- , , , et al. Comprehensive discharge planning and home follow‐up of hospitalized elders: a randomized clinical trial. JAMA. 1999;281(7):613–620.
- , , , , . Interventions to reduce 30‐day rehospitalization: a systematic review. Ann Intern Med. 2011;155(8):520–528.
- , , , . Complementary telephone strategies to improve postdischarge communication. Am J Med. 2012;125(1):28–30.
- , , , , , . Integrated postdischarge transitional care in a hospitalist system to improve discharge outcome: an experimental study. BMC Med. 2011;9:96.
- , , , , , . Patient experiences after hospitalizations for elective surgery. Am J Surg. 2014;207(6):855–862.
- , , . Complications after discharge for surgical patients. ANZ J Surg. 2004;74(3):92–97.
- , , , . Surgeons are overlooking post‐discharge complications: a prospective cohort study. World J Surg. 2014;38(5):1019–1025.
- , . A study of the impact of discharge information for surgical patients. J Adv Nurs. 2001;35(3):435–441.
The period immediately following hospital discharge is particularly hazardous for patients.[1, 2, 3, 4, 5] Problems occurring after discharge may result in high rates of rehospitalization and unscheduled visits to healthcare providers.[6, 7, 8, 9, 10] Numerous investigators have tried to identify patients who are at increased risk for rehospitalizations within 30 days of discharge, and many studies have examined whether various interventions could decrease these adverse events (summarized in Hansen et al.[11]). An increasing fraction of patients discharged by medicine and surgery services have some or all of their care supervised by hospitalists. Thus, hospitals increasingly look to hospitalists for ways to reduce rehospitalizations.
Patients discharged from our hospital are instructed to call an advice line (AL) if and when questions or concerns arise. Accordingly, we examined when these calls were made and what issues were raised, with the idea that the information collected might identify aspects of our discharge processes that needed improvement.
METHODS
Study Design
We conducted a prospective study of a cohort consisting of all unduplicated patients with a matching medical record number in our data warehouse who called our AL between September 1, 2011 and September 1, 2012, and reported being hospitalized or having surgery (inpatient or outpatient) within 30 days preceding their call. We excluded patients who were incarcerated, those who were transferred from other hospitals, those admitted for routine chemotherapy or emergent dialysis, and those discharged to a skilled nursing facility or hospice. The study involved no intervention. It was approved by the Colorado Multiple Institutional Review Board.
Setting
The study was conducted at Denver Health Medical Center, a 525‐bed, university‐affiliated, public safety‐net hospital. At the time of discharge, all patients were given paperwork that listed the telephone number of the AL and written instructions in English or Spanish telling them to call the AL or their primary care physician if they had any of a list of symptoms that was selected by their discharging physician as being relevant to that specific patient's condition(s).
The AL was established in 1997 to provide medical triage to patients of Denver Health. It operates 24 hours a day, 7 days per week, and receives approximately 100,000 calls per year. A language line service is used with nonEnglish‐speaking callers. Calls are handled by a nurse who, with the assistance of a commercial software program (E‐Centaurus; LVM Systems, Phoenix, AZ) containing clinical algorithms (Schmitt‐Thompson Clinical Content, Windsor, CO), makes a triage recommendation. Nurses rarely contact hospital or clinic physicians to assist with triage decisions.
Variables Assessed
We categorized the nature of the callers' reported problem(s) to the AL using the taxonomy summarized in the online appendix (see Supporting Appendix in the online version of this article). We then queried our data warehouse for each patient's demographic information, patient‐level comorbidities, discharging service, discharge date and diagnoses, hospital length of stay, discharge disposition, and whether they had been hospitalized or sought care in our urgent care center or emergency department within 30 days of discharge. The same variables were collected for all unduplicated patients who met the same inclusion and exclusion criteria and were discharged from Denver Health during the same time period but did not call the AL.
Statistics
Data were analyzed using SAS Enterprise Guide 4.1 (SAS Institute, Inc., Cary, NC). Because we made multiple statistical comparisons, we applied the Bonferroni correction when comparing patients calling the AL with those who did not, such that P<0.004 indicated statistical significance. A Student t test or a Wilcoxon rank sum test was used to compare continuous variables depending on results of normality tests. 2 tests were used to compare categorical variables. The intervals between hospital discharge and the call to the AL for patients discharged from medicine versus surgery services were compared using a log‐rank test, with P<0.05 indicating statistical significance.
RESULTS
During the 1‐year study period, 19,303 unique patients were discharged home with instructions regarding the use of the AL. A total of 310 patients called the AL and reported being hospitalized or having surgery within the preceding 30 days. Of these, 2 were excluded (1 who was incarcerated and 1 who was discharged to a skilled nursing facility), leaving 308 patients in the cohort. This represented 1.5% of the total number of unduplicated patients discharged during this same time period (minus the exclusions described above). The large majority of the calls (277/308, 90%) came directly from patients. The remaining 10% came from a proxy, usually a patient's family member. Compared with patients who were discharged during the same time period who did not call the AL, those who called were more likely to speak English, less likely to speak Spanish, more likely to be medically indigent, had slightly longer lengths of stays for their index hospitalization, and were more likely to be discharged from surgery than medicine services (particularly following inpatient surgery) (Table 1).
| Patient Characteristics | Patients Calling Advice Line After Discharge, N=308 | Patients Not Calling Advice Line After Discharge, N=18,995 | P Valuea |
|---|---|---|---|
| |||
| Age, y (meanSD) | 4217 | 3921 | 0.0210 |
| Gender, female, n (%) | 162 (53) | 10,655 (56) | |
| Race/ethnicity, n (%) | 0.1208 | ||
| Hispanic/Latino/Spanish | 129 (42) | 8,896 (47) | |
| African American | 44 (14) | 2,674 (14) | |
| White | 125 (41) | 6,569 (35) | |
| Language, n (%) | <0.0001 | ||
| English | 273 (89) | 14,236 (79) | |
| Spanish | 32 (10) | 3,744 (21) | |
| Payer, n (%) | |||
| Medicare | 45 (15) | 3,013 (16) | |
| Medicaid | 105 (34) | 7,777 (41) | 0.0152 |
| Commercial | 49 (16) | 2,863 (15) | |
| Medically indigentb | 93 (30) | 3,442 (18) | <0.0001 |
| Self‐pay | 5 (1) | 1,070 (5) | |
| Primary care provider, n (%)c | 168 (55) | 10,136 (53) | 0.6794 |
| Psychiatric comorbidity, n (%) | 81 (26) | 4,528 (24) | 0.3149 |
| Alcohol or substance abuse comorbidity, n (%) | 65 (21) | 3,178 (17) | 0.0417 |
| Discharging service, n (%) | <0.0001 | ||
| Surgery | 193 (63) | 7,247 (38) | |
| Inpatient | 123 (40) | 3,425 (18) | |
| Ambulatory | 70 (23) | 3,822 (20) | |
| Medicine | 93 (30) | 6,038 (32) | |
| Pediatric | 4 (1) | 1,315 (7) | |
| Obstetric | 11 (4) | 3,333 (18) | |
| Length of stay, median (IQR) | 2 (04.5) | 1 (03) | 0.0003 |
| Inpatient medicine | 4 (26) | 3 (15) | 0.0020 |
| Inpatient surgery | 3 (16) | 2 (14) | 0.0019 |
| Charlson Comorbidity Index, median (IQR) | |||
| Inpatient medicine | 1 (04) | 1 (02) | 0.0435 |
| Inpatient surgery | 0 (01) | 0 (01) | 0.0240 |
The median time from hospital discharge to the call was 3 days (interquartile range [IQR], 16), but 31% and 47% of calls occurred within 24 or 48 hours of discharge, respectively. Ten percent of patients called the AL the same day of discharge (Figure 1). We found no difference in timing of the calls as a function of discharging service.
The 308 patients reported a total of 612 problems or concerns (meanstandard deviation number of complaints per caller=21), the large majority of which (71%) were symptom‐related (Table 2). The most common symptom was uncontrolled pain, reported by 33% and 40% of patients discharged from medicine and surgery services, respectively. The next most common symptoms related to the gastrointestinal system and to surgical site issues in medicine and surgery patients, respectively (data not shown).
| Total Cohort, n (%) | Patients Discharged From Medicine, n (%) | Patients Discharged From Surgery, n (%) | ||||
|---|---|---|---|---|---|---|
| Patients | Complaints | Patients | Complaints | Patients | Complaints | |
| Symptom related | 280 (91) | 433 (71) | 89 (96) | 166 (77) | 171 (89) | 234 (66) |
| Discharge instructions | 65 (21) | 81 (13) | 18 (19) | 21 (10) | 43 (22) | 56 (16) |
| Medication related | 65 (21) | 87 (14) | 19 (20) | 25 (11) | 39 (20) | 54 (15) |
| Other | 10 (3) | 11 (2) | 4 (4) | 4 (2) | 6 (3) | 7 (2) |
| Total | 612 (100) | 216 (100) | 351 (100) | |||
Sixty‐five patients, representing 21% of the cohort, reported 81 problems understanding or executing discharge instructions. No difference was observed between the fraction of these problems reported by patients from medicine versus surgery (19% and 22%, respectively, P=0.54).
Sixty‐five patients, again representing 21% of the cohort, reported 87 medication‐related problems, 20% from both the medicine and surgery services (P=0.99). Medicine patients more frequently reported difficulties understanding their medication instructions, whereas surgery patients more frequently reported lack of efficacy of medications, particularly with respect to pain control (data not shown).
Thirty percent of patients who called the AL were advised by the nurse to go to the emergency department immediately. Medicine patients were more likely to be triaged to the emergency department compared with surgery patients (45% vs 22%, P<0.0001).
The 30‐day readmission rates and the rates of unscheduled urgent or emergent care visits were higher for patients calling the AL compared with those who did not call (46/308, 15% vs 706/18,995, 4%, and 92/308, 30% vs 1303/18,995, 7%, respectively, both P<0.0001). Similar differences were found for patients discharged from medicine or surgery services who called the AL compared with those who did not (data not shown, both P<0.0001). The median number of days between AL call and rehospitalization was 0 (IQR, 02) and 1 (IQR, 08) for medicine and surgery patients, respectively. Ninety‐three percent of rehospitalizations were related to the index hospitalization, and 78% of patients who were readmitted had no outpatient encounter in the interim between discharge and rehospitalization.
DISCUSSION
We investigated the source and nature of patient telephone calls to an AL following a hospitalization or surgery, and our data revealed the following important findings: (1) nearly one‐half of the calls to the AL occurred within the first 48 hours following discharge; (2) the majority of the calls came from surgery patients, and a greater fraction of patients discharged from surgery services called the AL than patients discharged from medicine services; (3) the most common issues were uncontrolled pain, questions about medications, and problems understanding or executing aftercare instructions (particularly pertaining to the care of surgical wounds); and (4) patients calling the AL had higher rates of 30‐day rehospitalization and of unscheduled urgent or emergent care visits.
The utilization of our patient‐initiated call line was only 1.5%, which was on the low end of the 1% to 10% reported in the literature.[7, 12] This can be attributed to a number of issues that are specific to our system. First, the discharge instructions provided to our patients stated that they should call their primary care provider or the AL if they had questions. Accordingly, because approximately 50% of our patients had a primary care provider in our system, some may have preferentially contacted their primary care provider rather than the AL. Second, the instructions stated that the patients should call if they were experiencing the symptoms listed on the instruction sheet, so those with other problems/complaints may not have called. Third, AL personnel identified patients as being in our cohort by asking if they had been discharged or underwent a surgical procedure within 30‐days of their call. This may have resulted in the under‐reporting of patients who were hospitalized or had outpatient surgical procedures. Fourth, there may have been a number of characteristics specific to patients in our system that reduced the frequency with which they utilized the AL (eg, access to telephones or other community providers).
Most previous studies of patient‐initiated call lines have included them as part of multi‐intervention pre‐ and/or postdischarge strategies.[7, 8, 9, 10, 11, 12, 13] One prior small study compared the information reported by 37 patients who called an AL with that elicited by nurse‐initiated patient contact.[12] The most frequently reported problems in this study were medication‐related issues (43%). However, this study only included medicine patients and did not document the proportion of calls occurring at various time intervals.
The problems we identified (in both medicine and surgery patients) have previously been described,[2, 3, 4, 13, 14, 15, 16] but all of the studies reporting these problems utilized calls that were initiated by health care providers to patients at various fixed intervals following discharge (ie, 730 days). Most of these used a scripted approach seeking responses to specific questions or outcomes, and the specific timing at which the problems arose was not addressed. In contrast, we examined unsolicited concerns expressed by patients calling an AL following discharge whenever they felt sufficient urgency to address whatever problems or questions arose. We found that a large fraction of calls occurred on the day of or within the first 48 hours following discharge, much earlier than when provider‐initiated calls in the studies cited above occurred. Accordingly, our results cannot be used to compare the utility of patient‐ versus provider‐initiated calls, or to suggest that other hospitals should create an AL system. Rather, we suggest that our findings might be complementary to those reported in studies of provider‐initiated calls and only propose that by examining calls placed by patients to ALs, problems with hospital discharge processes (some of which may result in increased rates of readmission) may be discovered.
The observation that such a large fraction of calls to our AL occurred within the first 48 hours following discharge, together with the fact that many of the questions asked or concerns raised pertained to issues that should have been discussed during the discharge process (eg, pain control, care of surgical wounds), suggests that suboptimal patient education was occurring prior to discharge as was suggested by Henderson and Zernike.[17] This finding has led us to expand our patient education processes prior to discharge on both medicine and surgery services. Because our hospitalists care for approximately 90% of the patients admitted to medicine services and are increasingly involved in the care of patients on surgery services, they are integrally involved with such quality improvement initiatives.
To our knowledge this is the first study in the literature that describes both medicine and surgery patients who call an AL because of problems or questions following hospital discharge, categorizes these problems, determines when the patients called following their discharge, and identifies those who called as being at increased risk for early rehospitalizations and unscheduled urgent or emergent care visits. Given the financial penalties issued to hospitals with high 30‐day readmission rates, these patients may warrant more attention than is customarily available from telephone call lines or during routine outpatient follow‐up. The majority of patients who called our AL had Medicare, Medicaid, or a commercial insurance, and, accordingly, may have been eligible for additional services such as home visits and/or expedited follow‐up appointments.
Our study has a number of limitations. First, it is a single‐center study, so the results might not generalize to other institutions. Second, because the study was performed in a university‐affiliated, public safety‐net hospital, patient characteristics and the rates and types of postdischarge concerns that we observed might differ from those encountered in different types of hospitals and/or from those in nonteaching institutions. We would suggest, however, that the idea of using concerns raised by patients discharged from any type of hospital in calls to ALs may similarly identify problems with that specific hospital's discharge processes. Third, the information collected from the AL came from summaries provided by nurses answering the calls rather than from actual transcripts. This could have resulted in insufficient or incorrect information pertaining to some of the variables assessed in Table 2. The information presented in Table 1, however, was obtained from our data warehouse after matching medical record numbers. Fourth, we could have underestimated the number of patients who had 30‐day rehospitalizations and/or unplanned for urgent or emergent care visits if patients sought care at other hospitals. Fifth, the number of patients calling the AL was too small to allow us to do any type of robust matching or multivariable analysis. Accordingly, the differences that appeared between patients who called and those who did not (ie, English speakers, being medically indigent, the length of stay for the index hospitalization and the discharging service) could be the result of inadequate matching or interactions among the variables. Although matching or multivariate analysis might have yielded different associations between patients who called the AL versus those who did not, those who called the AL still had an increased risk of readmission and urgent or emergent visits and may still benefit from targeted interventions. Finally, the fact that only 1.5% of unique patients who were discharged called the AL could have biased our results. Because only 55% and 53% of the patients who did or did not call the AL, respectively, saw primary care physicians within our system within the 3 years prior to their index hospitalization (P=0.679), the frequency of calls to the AL that we observed could have underestimated the frequency with which patients had contact with other care providers in the community.
In summary, information collected from patient‐initiated calls to our AL identified several aspects of our discharge processes that needed improvement. We concluded that our predischarge educational processes for both medicine and surgery services needed modification, especially with respect to pain management, which problems to expect after hospitalization or surgery, and how to deal with them. The high rates of 30‐day rehospitalization and of unscheduled urgent or emergent care visits among patients calling the AL identifies them as being at increased risk for these outcomes, although the likelihood of these events may be related to factors other than just calling the AL.
- , , , , . Implementation of the care transitions intervention: sustainability and lessons learned. Prof Case Manag. 2009;14(6):282–293.
- , , , et al. Problems after discharge and understanding of communication with their primary care physicians among hospitalized seniors: a mixed methods study. J Hosp Med. 2010;5(7):385–391.
- , , , et al. Adverse events among medical patients after discharge from hospital. CMAJ. 2004;170(3):345–349.
- , , , , . The incidence and severity of adverse events affecting patients after discharge from the hospital. Ann Intern Med. 2003;138(3):161–167.
- , , . Post‐hospitalization transitions: examining the effects of timing of primary care provider follow‐up. J Hosp Med. 2010;5(7):392–397.
- , , , . Telephone follow‐up after discharge from the hospital: does it make a difference? Appl Nurs Res. 1996;9(2) 47–52.
- , , , et al. The effect of real‐time teleconsultations between hospital‐based nurses and patients with severe COPD discharged after an exacerbation. J Telemed Telecare. 2013;19(8):466–474.
- , , , , , . A randomized, controlled trial of an intensive community nurse‐supported discharge program in preventing hospital readmissions of older patients with chronic lung disease. J Am Geriatr Soc. 2004;52(8):1240–1246.
- , , , et al. Effects of education and support on self‐care and resource utilization in patients with heart failure. Eur Heart J. 1999;20(9):673–682.
- , , , et al. Comprehensive discharge planning and home follow‐up of hospitalized elders: a randomized clinical trial. JAMA. 1999;281(7):613–620.
- , , , , . Interventions to reduce 30‐day rehospitalization: a systematic review. Ann Intern Med. 2011;155(8):520–528.
- , , , . Complementary telephone strategies to improve postdischarge communication. Am J Med. 2012;125(1):28–30.
- , , , , , . Integrated postdischarge transitional care in a hospitalist system to improve discharge outcome: an experimental study. BMC Med. 2011;9:96.
- , , , , , . Patient experiences after hospitalizations for elective surgery. Am J Surg. 2014;207(6):855–862.
- , , . Complications after discharge for surgical patients. ANZ J Surg. 2004;74(3):92–97.
- , , , . Surgeons are overlooking post‐discharge complications: a prospective cohort study. World J Surg. 2014;38(5):1019–1025.
- , . A study of the impact of discharge information for surgical patients. J Adv Nurs. 2001;35(3):435–441.
© 2014 Society of Hospital Medicine