User login
Cost Analysis of Use of Tranexamic Acid to Prevent Major Bleeding Complications in Hip and Knee Arthroplasty Surgery

Diabetes Mellitus and Skin Infections
Diabetes mellitus is one of the most common comorbid conditions among patients hospitalized for acute bacterial skin infections.[1, 2, 3, 4, 5, 6] Acute bacterial skin infections in diabetics represent a spectrum of conditions ranging from cellulitis or cutaneous abscess to more complicated infections such as infected ulcers or deep tissue infections. Although most skin infections in diabetics are caused by gram‐positive pathogens (Staphylococcus aureus and streptococci), the risk of gram‐negative pathogens is increased in certain complicated infections such as diabetic foot infections.[7] For such complicated infections, national guidelines therefore recommend broad‐spectrum empiric antibiotic therapy.[7]
The role of gram‐negative pathogens has not been clearly established in diabetics with cellulitis or cutaneous abscess not associated with an infected ulcer or diabetic foot infection. National guidelines for the treatment of cellulitis and abscess recommend antibiotic therapy targeted toward S aureus and streptococcal species irrespective of the presence of diabetes mellitus.[8, 9] However, in a recent multicenter study of patients hospitalized with acute bacterial skin infections in which cases involving infected ulcers or deep tissue infection were excluded, diabetes mellitus was an independent predictor of use of antibiotics with broad gram‐negative activity.[2] This suggests that either gram‐negative pathogens are more common or providers perceive gram‐negative pathogens to be more common among diabetics with otherwise uncomplicated cellulitis or abscess.
A better understanding of the relationship between the microbiology and antibiotic prescribing practices for diabetics with cellulitis or abscess is therefore necessary to promote the most appropriate spectrum of therapy for these patients. We evaluated a large cohort of patients hospitalized with acute bacterial skin infections in order to: (1) compare the microbiology of diabetics and nondiabetics with cellulitis or cutaneous abscess not associated with an ulcer or deep tissue infection; and (2) compare antibiotic prescribing practices among diabetics and nondiabetics. We hypothesized that diabetics would have a similar spectrum of microorganisms as nondiabetics but would be more frequently treated with antibiotics with broad gram‐negative activity.
METHODS
Study Design
This was a secondary analysis of 2 published retrospective studies of patients hospitalized for cellulitis or cutaneous abscess between January 1, 2007 and May 31, 2012.[2, 10] For the purposes of this study, the terms cellulitis and abscess will refer to infections not involving an infected ulcer, osteomyelitis, or other deep tissue infection.
Study Setting and Population
The first of the 2 cohorts analyzed for the present study included patients hospitalized with cellulitis, abscess, or wound infection at 7 academic or community hospitals in Colorado.[2] The second cohort included patients hospitalized with cellulitis or abscess at a single academic medical center (1 of the 7 hospitals above) in Denver, Colorado.[10] The methods of these studies have been reported in detail elsewhere.[2, 10, 11] Briefly, potential cases were identified using International Classification of Diseases, 9th Revision, Clinical Modification codes. The main inclusion and exclusion criteria of the 2 studies were similar. In both studies, cases were excluded that involved infected ulcers or suspected or confirmed deep tissue involvement (eg, osteomyelitis, myositis, fasciitis). Cases were also excluded that involved other infections where empiric antibiotic therapy with gram‐negative activity is standard including infected human or animal bites, periorbital or orbital infections, and perineal infections. The combined cohort in the present study therefore represented a group of patients hospitalized with relatively uncomplicated cellulitis or cutaneous abscess.
Definitions and Study Outcomes
Only 1 of the 2 studies from which the current cohort was derived distinguished between nonpurulent cellulitis, purulent cellulitis, and wound infection.[2] In the other study, cases were more broadly defined as either cellulitis or cutaneous abscess.[10] Infected ulcers and deep tissue infections were excluded from both studies. In combining the data into the current cohort, all nondrainable infections (purulent or nonpurulent cellulitis and wound infection) were categorized generally as cellulitis. All cases with documentation of an abscess in the medical record were categorized as cutaneous abscess. Presence of diabetes mellitus was based on provider documentation of the condition during the hospitalization. Microbiological cultures were obtained at the discretion of treating providers. Exposure to antibiotics with a broad spectrum of gram‐negative activity was defined as receipt of 2 or more calendar days of ‐lactam/‐lactamase inhibitor combinations, second‐ through fifth‐generation cephalosporins, fluoroquinolones, carbapenems, tigecycline, aminoglycosides, or colistin.[2]
The follow‐up periods differed slightly between the 2 studies used to derive the current cohort. In 1 study, all clinical encounters within 30 days of hospital discharge were reviewed to assess clinical outcomes.[10] In the other, clinical encounters within 45 days from the date of hospitalization were reviewed.[2] Clinical failure was defined as any of the following within the 30‐ or 45‐day follow‐up periods, respectively: (1) treatment failure, defined as a change in antibiotic therapy or unplanned drainage procedure due to inadequate clinical response more than 5 days[2] or 7 days[10] after hospital admission; (2) recurrence, defined as reinitiation of antibiotics for skin infection after completion of the initial treatment course; or (3) rehospitalization due to skin infection.[11]
Statistical Analysis
Because the clinical factors, microbiology, and treatment of cellulitis and cutaneous abscesses differ, analyses were performed for the total cohort and stratified by type of infection. Microorganisms cultured, antibiotic selection, and treatment duration were compared between diabetics and nondiabetics using the Wilcoxon rank sum test, 2, or Fisher exact test, as appropriate.
Because we hypothesized that the presence of diabetes mellitus in patients with cellulitis or abscess leads to use of broad gram‐negative therapy, we developed a multivariable logistic regression model to identify factors independently associated with exposure to antibiotics with broad gram‐negative activity. We also developed a linear regression model to explore the relationship between diabetes mellitus and duration of antibiotic therapy after adjusting for covariates. To develop these models, we first performed bivariate analyses and retained variables with a P value 0.25 in the regression models. Variables that did not meet the P value threshold but were considered to be clinically relevant covariates were also included in the model. We assessed for effect modification, multicollinearity, and goodness of fit when developing the models. We used SAS version 9.3 (SAS Institute, Cary, NC) for data analysis.
RESULTS
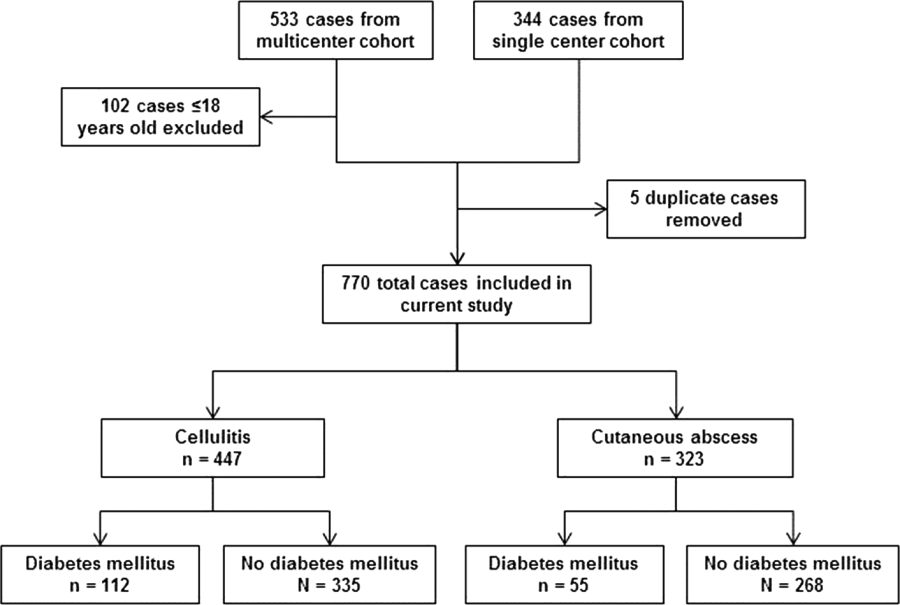
After excluding 102 pediatric cases and removing 5 duplicate cases, 770 total cases were included for analysis: 447 involved cellulitis and 323 involved cutaneous abscess (Figure 1). Overall, 167 (22%) patients had diabetes mellitus. Diabetics were significantly more likely than nondiabetics to have cellulitis as the presenting infection (67% of cases vs 56%, P=0.008) and to have lower extremity involvement (48% vs 33%, P<0.001) (Table 1). Diabetics were also older (median age 55 years vs 48 years, P<0.001), more likely to have cirrhosis or prior skin infection, and less likely to be injection‐drug users or human immunodeficiency virus (HIV) infected. Demographic and clinical characteristics among diabetics and nondiabetics stratified by the categorizations of cellulitis and cutaneous abscess are presented in the Supporting Information, Appendix Table 1, in the online version of this article.
| Diabetes Mellitus, N=167 | No Diabetes Mellitus, N=603 | |
|---|---|---|
| ||
| Type of infection | ||
| Cellulitis | 112 (67) | 335 (56)a |
| Cutaneous abscess | 55 (33) | 268 (44) |
| Age, y, median (IQR) | 55 (4763) | 48 (3658)a |
| Male | 102 (61) | 405 (67) |
| Injection drug use | 9 (5) | 117 (19)a |
| Alcohol abuse or dependence | 15 (9) | 86 (14) |
| Cirrhosis | 11 (7) | 17 (3)a |
| HIV infection | 0 | 29 (5)a |
| Dialysis dependence | 4 (2) | 5 (1) |
| Peripheral arterial disease | 4 (2) | 5 (1) |
| Saphenous vein harvest | 7 (4) | 11 (2) |
| Prior skin infection | 56 (34) | 125 (21)a |
| Prior MRSA infection or colonization | 20 (12) | 50 (8) |
| Anatomical location | ||
| Lower extremity | 80 (48) | 200 (33)a |
| Upper extremity | 6 (4) | 79 (13)a |
| Head and neck | 14 (8) | 38 (6) |
| Buttock or inguinal | 8 (5) | 35 (6) |
| Chest, abdomen, back, or axilla | 9 (5) | 25 (4) |
| Multiple distinct sites | 7 (4) | 34 (6) |
| Medical primary service | 139 (83) | 395 (66)a |
| Consultation requested | 99 (59) | 294 (49)a |
| Surgery | 58 (35) | 152 (25)a |
| Internal medicine | 18 (11) | 47 (8) |
| Infectious diseases | 41 (25) | 149 (25) |
| Failed initial outpatient antibiotic therapy | 52 (31) | 186 (31) |
| Fever (temperature 38.0C) | 20 (12) | 102 (17) |
| Leukocytosis (WBC >10,000 cells/mm3) | 78 (47) | 311 (52) |
The frequency of use of microbiological cultures was similar among diabetics and nondiabetics (Table 2). In cases of cellulitis, a microorganism was identified in 18% of diabetics and 12% of nondiabetics (P=0.09). In cases of cutaneous abscess, a microorganism was identified more commonly (69% and 74%, respectively, P=0.50). Among cases where a microorganism was identified, aerobic gram‐positive organisms were isolated in 90% of diabetics and 92% of nondiabetics (P=0.59). Aerobic gram‐negative organisms were isolated in 7% of diabetics and 12% of nondiabetics (P=0.28). Specific gram‐negative organisms isolated are shown in the Supporting Information, Appendix Table 2, in the online version of this article; no cases in diabetics involved Pseudomonas aeruginosa. The comparison of microbiological data among diabetics and nondiabetics was similar when stratified by cellulitis versus cutaneous abscess (Table 2).
| Cellulitis | Cutaneous Abscess | All Cases | |||||||
|---|---|---|---|---|---|---|---|---|---|
| Diabetes Mellitus, N=112 | No Diabetes Mellitus, N=335 | P | Diabetes Mellitus, N=55 | No Diabetes Mellitus, N=268 | P | Diabetes Mellitus, N=167 | No Diabetes Mellitus, N=603 | P | |
| |||||||||
| Any microbiological culture obtaineda | 82 (73) | 234 (70) | 46 (84) | 239 (89) | 128 (77) | 473 (78) | |||
| Wound drainage or swab | 19 (17) | 36 (11) | 1 (2) | 8 (3) | 20 (12) | 44 (7) | |||
| Abscess material | 1 (1) | 3 (1) | 39 (71) | 205 (76) | 40 (24) | 208 (34) | |||
| Tissueb | 2 (2) | 17 (5) | 1 (2) | 8 (3) | 3 (2) | 25 (4) | |||
| Blood | 73 (65) | 212 (63) | 26 (47) | 121 (45) | 99 (59) | 333 (55) | |||
| Any microorganism identifiedc | 20 (18) | 39 (12) | 0.09 | 38 (69) | 197 (74) | 0.50 | 58 (35) | 236 (39) | 0.30 |
| Aerobic gram‐positive | 15 (75) | 36 (92) | 0.11 | 37 (97) | 182 (92) | 0.48 | 52 (90) | 218 (92) | 0.59 |
| Staphylococcus aureus | 11 (55) | 26 (67) | 0.38 | 28 (74) | 132 (67) | 0.42 | 39 (67) | 158 (67) | 0.97 |
| Methicillin‐susceptible | 4 (20) | 15 (38) | 0.15 | 12 (32) | 42 (21) | 0.17 | 16 (28) | 57 (24) | 0.59 |
| Methicillin‐resistant | 5 (25) | 11 (28) | 1.00 | 14 (37) | 85 (43) | 0.47 | 19 (33) | 96 (41) | 0.27 |
| Susceptibility not performed | 2 (10) | 0 | 0.11 | 2 (5) | 5 (3) | 0.32 | 4 (7) | 5 (2) | 0.08 |
| Streptococcal species | 6 (30) | 15 (38) | 0.52 | 12 (32) | 69 (35) | 0.68 | 18 (31) | 84 (36) | 0.51 |
| ‐hemolytic streptococcus | 3 (15) | 13 (33) | 0.13 | 6 (16) | 32 (16) | 0.94 | 9 (16) | 45 (19) | 0.53 |
| Streptococcus anginosus/Streptococcus milleri group | 1 (5) | 0 | 0.34 | 2 (5) | 29 (15) | 0.11 | 3 (5) | 29 (12) | 0.12 |
| Other ‐hemolytic streptococcus | 2 (10) | 2 (5) | 0.60 | 4 (11) | 12 (6) | 0.30 | 6 (10) | 14 (6) | 0.25 |
| Other streptococcus | 0 | 0 | 1 (3) | 3 (2) | 0.51 | 1 (2) | 3 (1) | 0.59 | |
| Staphylococcus aureus or streptococci | 15 (75) | 35 (90) | 0.25 | 37 (97) | 182 (92) | 0.48 | 52 (90) | 217 (92) | 0.60 |
| Enterococcus species | 0 | 2 (5) | 0.54 | 0 | 4 (2) | 1.00 | 0 | 6 (3) | 0.60 |
| Aerobic gram‐negative | 2 (10) | 7 (18) | 0.70 | 2 (5) | 21 (11) | 0.39 | 4 (7) | 28 (12) | 0.28 |
| Anaerobic organism(s) | 2 (10) | 3 (8) | 1.00 | 8 (21) | 30 (15) | 0.37 | 10 (17) | 33 (14) | 0.53 |
| Mixed skin or oral flora | 1 (5) | 1 (3) | 1.00 | 0 | 1 (1) | 1.00 | 1 (2) | 2 (1) | 0.48 |
| Other | 1 (5) | 3 (8) | 1.00 | 2 (5) | 3 (2) | 0.19 | 3 (5) | 6 (3) | 0.39 |
| Polymicrobial | 3 (15) | 17 (45) | 0.03 | 11 (29) | 47 (24) | 0.51 | 14 (24) | 64 (27) | 0.65 |
| Positive blood cultured | 4 (5) | 8 (4) | 0.51 | 2 (8) | 3 (2) | 0.21 | 6 (6) | 11 (3) | 0.24 |
Antibiotic utilization is summarized in Table 3. Among patients who were started on antibiotic therapy in the emergency department or urgent care, the initial regimen included an agent with broad gram‐negative activity in 31% of both diabetics and nondiabetics (P=0.97). During the entire hospital stay (including the emergency department or urgent care), diabetics were significantly more likely to be treated with ‐lactam/‐lactamase inhibitor combinations (42% vs 33%, P=0.04). At the time of hospital discharge, diabetics were more likely to be prescribed fluoroquinolones (11% vs 5%, P=0.01) (Table 3) particularly for cases of cellulitis (13% vs 6%, P=0.008) (see Supporting Information, Appendix Table 3, in the online version of this article). Diabetics were somewhat more likely to be prescribed parenteral antibiotics (10% vs 6%, P=0.07) after discharge. When considering both inpatient and discharge therapy, more diabetics than nondiabetics were exposed to at least 2 calendar days of broad gram‐negative therapy (54% vs 44%, P=0.02) and more were prescribed an antipseudomonal agent (38% vs 25%, P=0.002). In the group of patients who received at least 1 dose of an antibiotic with broad gram‐negative activity, broad gram‐negative agents accounted for 33% of the total days of therapy prescribed for diabetics and 32% for nondiabetics. Overall prescribing patterns were similar when stratified by cellulitis versus cutaneous abscess (see Supporting Information, Appendix Table 3, in the online version of this article).
| Diabetes Mellitus, N=167 | No Diabetes Mellitus, N=603 | P | |
|---|---|---|---|
| |||
| Individual antibiotics prescribed during the inpatient stayab | |||
| Vancomycin | 142 (85) | 504 (84) | 0.65 |
| Clindamycin | 27 (16) | 131 (22) | 0.12 |
| Parenteral ‐lactam/‐lactamase inhibitor | 70 (42) | 200 (33) | 0.04 |
| Second‐generation or higher cephalosporin | 13 (8) | 51 (8) | 0.78 |
| Cefazolin | 17 (10) | 91 (15) | 0.11 |
| Carbapenem | 9 (5) | 34 (6) | 0.90 |
| Fluoroquinolone | 20 (12) | 53 (9) | 0.21 |
| Daptomycin | 8 (5) | 24 (4) | 0.64 |
| Linezolid | 2 (1) | 8 (1) | 1.00 |
| Other ‐lactam | 6 (4) | 30 (5) | 0.45 |
| Trimethoprim‐sulfamethoxazole | 12 (7) | 30 (5) | 0.27 |
| Doxycycline | 15 (9) | 44 (7) | 0.47 |
| Cephalexin | 7 (4) | 22 (4) | 0.74 |
| Amoxicillin‐clavulanate | 11 (7) | 24 (4) | 0.15 |
| Antibiotics prescribed at hospital dischargeb | 163 (98) | 580 (96) | 0.38 |
| Clindamycin | 20 (12) | 95 (16) | 0.23 |
| Trimethoprim‐sulfamethoxazole | 52 (31) | 215 (36) | 0.28 |
| Doxycycline | 32 (19) | 91 (15) | 0.20 |
| Cephalexin | 12 (7) | 46 (8) | 0.85 |
| Amoxicillin‐clavulanate | 24 (14) | 82 (14) | 0.80 |
| Fluoroquinolone | 18 (11) | 32 (5) | 0.01 |
| Linezolid | 8 (5) | 19 (3) | 0.31 |
| Other oral ‐lactam | 3 (2) | 28 (5) | 0.10 |
| Other oral antibiotic | 1 (1) | 2 (0.3) | 0.52 |
| Vancomycin | 8 (5) | 15 (2) | 0.13 |
| Daptomycin | 5 (3) | 10 (2) | 0.34 |
| Other parenteral antibiotic | 4 (2) | 11 (2) | 0.75 |
| Antibiotic with broad gram‐negative activity initiated in emergency department or urgent care | 46/149 (31) | 174/561 (31) | 0.97 |
| Exposed to any antibiotic with broad gram‐negative activityc | 101 (62) | 311 (53) | 0.048 |
| Exposed to any antibiotic with antipseudomonal activity | 62 (38) | 149 (25) | 0.002 |
| Exposed to at least 2 calendar days of antibiotics with broad gram‐negative activityc | 89 (54) | 259 (44) | 0.02 |
| Treatment durationd | |||
| Total duration of therapy, d, median (IQR) | 13 (1015) | 12 (1015) | 0.09 |
| Duration of inpatient therapy, d, median (IQR) | 4 (36) | 4 (35) | 0.03 |
| Duration of therapy after discharge, d, median (IQR) | 8 (710) | 8 (710) | 0.58 |
After adjusting for covariates in the logistic regression model, diabetes mellitus was an independent predictor of exposure to broad gram‐negative therapy (see Supporting Information, Appendix Table 4, in the online version of this article). In addition to diabetes mellitus, culture of an aerobic gram‐negative microorganism, infectious diseases service consultation, presence of fever, and nonmedical admitting services were significantly associated with exposure to broad gram‐negative therapy. Prior methicillin‐resistant S aureus infection or colonization and HIV infection were inversely associated. Compared with nondiabetics, the total duration of antibiotic therapy in diabetics was somewhat longer (median 13 days vs 12 days, P=0.09) (Table 3). After adjusting for covariates in the linear regression model, there was a significant association between diabetes mellitus and treatment duration. On average, diabetics were treated 1 day (95% confidence interval: 0.2‐1.7 days) longer than nondiabetics.
Compared with nondiabetics, diabetics were more likely to have an outpatient follow‐up visit (73% vs 61%, P=0.002) and to be rehospitalized for any reason after discharge (16% vs 9%, P=0.02) (Table 4). Diabetics were overall more likely to be classified as clinical failure (15% vs 9%, P=0.02); this difference was driven by the cellulitis subgroup (19% vs 10%, P=0.01).
| Cellulitis | Cutaneous Abscess | All Cases | |||||||
|---|---|---|---|---|---|---|---|---|---|
| Diabetes Mellitus, N=112 | No Diabetes Mellitus, N=335 | P | Diabetes Mellitus, N=55 | No Diabetes Mellitus, N=268 | P | Diabetes Mellitus, N=167 | No Diabetes Mellitus, N=603 | P | |
| |||||||||
| Survived to discharge | 111 (99) | 335 (100) | 0.25 | 55 (100) | 268 (100) | 166 (99) | 603 (100) | 0.22 | |
| Outpatient follow‐up documented | 82 (74) | 204 (61) | 0.01 | 40 (73) | 161 (60) | 0.08 | 122 (73) | 365 (61) | 0.002 |
| Rehospitalized | 22 (20) | 34 (10) | 0.008 | 4 (7) | 21 (8) | 1.00 | 26 (16) | 55 (9) | 0.02 |
| Clinical failure | 21 (19) | 34 (10) | 0.01 | 4 (7) | 20 (7) | 1.00 | 25 (15) | 54 (9) | 0.02 |
| Treatment failure | 7 (6) | 17 (5) | 0.62 | 2 (4) | 7 (3) | 0.65 | 9 (5) | 24 (4) | 0.42 |
| Recurrence | 10 (9) | 16 (5) | 0.10 | 1 (2) | 11 (4) | 0.70 | 11 (7) | 27 (4) | 0.26 |
| Rehospitalization due to skin infection | 14 (13) | 17 (5) | 0.01 | 3 (5) | 11 (4) | 0.71 | 17 (10) | 28 (5) | 0.01 |
| Length of stay, d, median (IQR) | 4 (36) | 4 (35) | 0.03 | 4 (36) | 4 (35) | 0.28 | 4 (36) | 4 (35) | 0.02 |
DISCUSSION
Diabetes mellitus is a common comorbidity in patients with acute bacterial skin infections. In this large cohort of patients hospitalized for cellulitis or cutaneous abscess, where those with infected ulcers or deep tissue infections were excluded, microbiological findings in cases associated with positive cultures were similar among diabetics and nondiabetics. Although aerobic gram‐negative microorganisms were not more likely to be identified in diabetics, diabetics were significantly more likely to be exposed to at least 2 calendar days of antibiotics with broad gram‐negative activity. After adjusting for covariates, diabetes mellitus was independently associated with exposure to broad gram‐negative therapy.
To our knowledge, this is the first study to compare the microbiology of cellulitis and cutaneous abscess among diabetics and nondiabetics. Lipsky and colleagues previously described the microbiology of a cohort of diabetic patients hospitalized with a broader range of skin infections including cellulitis, infected ulcers, and surgical site infections.[12] Similar to our findings, gram‐negative pathogens were uncommonly isolated in that study; however, in the absence of a comparator group, whether diabetics were at higher risk for gram‐negative involvement than nondiabetics was not known. Similar to the study by Lipsky and colleagues, most studies of skin infections in diabetics have included a relatively heterogeneous group of infections.[12, 13, 14, 15] The present study therefore contributes to the literature by providing a focused comparison of the microbiology of inpatient cellulitis and abscess in the absence of complicating factors such as an infected ulcer or deep tissue involvement. We found that among cases with a positive culture (13% of cases in the cellulitis group and 73% in the abscess group), the microbiology was similar among diabetics and nondiabetics. Although a microorganism was identified in only a minority of cases of cellulitis, our findings do not support the need for broad gram‐negative therapy in diabetics with cellulitis not associated with an ulcer or deep tissue infection. In diabetics with an abscess, antibiotics with broad gram‐negative activity do not appear to be indicated.
The present study also adds to the literature by providing a detailed comparison of antibiotic utilization patterns among diabetics and nondiabetics. We demonstrated that diabetics were more likely to have significant exposure to antibiotics with broad gram‐negative activity, particularly antipseudomonal agents (the broadest‐spectrum antibiotics). Because initiation of broad gram‐negative therapy in the emergency department or urgent care was not more common among diabetics, the increased use of these agents among diabetics appeared to be driven by inpatient providers. It is also notable that of patients who received any antibiotic with broad gram‐negative activity, these agents accounted for similar proportions of the total days of therapy in both diabetics and nondiabetics. In aggregate, our findings demonstrate that diabetics are more likely to be started on antibiotics with broad gram‐negative activity by inpatient providers, diabetics are not necessarily continued on longer durations of broad gram‐negative therapy once started, and the total amount of exposure to broad gram‐negative agents is substantial.
Overall, our findings suggest that inpatient providers perceive diabetics with cellulitis or abscess to be at increased risk for gram‐negative pathogens. This perhaps reflects an extrapolation of recommendations to use broad‐spectrum empiric therapy in diabetics with certain complicated skin infections.[7] However, for patients with cellulitis or cutaneous abscess, Infectious Diseases Society of America (IDSA) guidelines recommend antibiotic therapy targeted toward S aureus and streptococcal species; there is no suggestion to use a broader spectrum of therapy in diabetics.[8, 9] Our findings therefore highlight an important opportunity to improve antibiotic selection for all patients hospitalized with cellulitis and abscess, but particularly diabetics. It is also noteworthy that by linear regression, diabetes mellitus was independently associated with longer treatment durations. Although the average increase in treatment duration was small (1 day), this finding adds to the evidence that the presence of diabetes mellitus alters providers' treatment approach to cellulitis or abscess.
We found that despite more frequent treatment with broad gram‐negative therapy, diabetics were more likely than nondiabetics to be classified as clinical failures. It is important to point out that diabetics were also more likely than nondiabetics to have postdischarge outpatient follow‐up visits, raising the possibility of biased ascertainment of clinical failure events in this group. However, we also demonstrated that diabetics with cellulitis were more likely to be rehospitalized than nondiabetics. This is similar to a finding by Suaya and colleagues who showed that diabetics with skin infections were about twice as likely to be rehospitalized as nondiabetics.[13] One could hypothesize that the increased frequency of clinical failure events among diabetics was due to their older age, hyperglycemia, or vascular insufficiency; however, other factors may have contributed. For example, providers may have mistaken residual erythema for ongoing or recurrent cellulitis, or the diagnosis of cellulitis could have been incorrect to begin with. Additionally, there may have been uncertainty about the microbiology of cellulitis because the infecting pathogen was not usually identified. These factors may have led to alterations in treatment that would have resulted in a classification of clinical failure, and it is possible that providers had a lower threshold to alter treatment in diabetics. It is therefore not clear whether our findings represent a true difference in clinical outcomes between diabetics or nondiabetics. Regardless, in cases associated with a positive culture, our microbiological results do not support that the difference in clinical failure between diabetics and nondiabetics with cellulitis was related to a different spectrum of microorganisms.
In addition to the limitations outlined previously[2, 10] and above, the present study has at least 5 additional limitations. First, this was a secondary analysis of studies that were not designed to evaluate the effect of diabetes mellitus on the microbiology and treatment of skin infections. For example, hemoglobin A1C values were not collected; therefore, we could not examine whether the microbiology and antibiotic prescribing practices differed based on control of diabetes mellitus. Second, there were minor differences in inclusion and exclusion criteria between the 2 cohorts included in this study. Because the proportion of patients with diabetes mellitus was similar among both cohorts, and comparisons were not made between the cohorts, this should not have impacted our results. Third, the broad categorization of cellulitis used when combining the 2 cohorts raised the possibility of differences in infection characteristics between diabetics and nondiabetics (eg, presence of a wound) that could have confounded our findings regarding use of gram‐negative therapy. In the larger of the 2 cohorts from which the combined cohort was derived, only 17 (3%) of 533 patients had wound infections, whereas those with infected ulcers or suspected deep‐tissue infection were excluded from both cohorts. Furthermore, in the combined cohort, the increased frequency of broad gram‐negative therapy among diabetics was also observed in the cutaneous abscess group. It is therefore unlikely that the categorization of cellulitis had a significant impact on our results. Fourth, given the observational nature of the study, the microbiological data were subject to limitations. Importantly, because the infecting pathogen was identified in only 13% of cases of cellulitis, firm conclusions regarding the microbiology of cellulitis cannot be drawn. Finally, the small number of gram‐negative organisms isolated precluded comparisons of specific pathogens among diabetics and nondiabetics. In addition, because a number of gram‐negative organisms were isolated from wound cultures, it is not known whether they were clinically relevant or simply represented colonization.
In conclusion, in cases of cellulitis or abscess associated with a positive culture, gram‐negative microorganisms were not isolated more commonly among diabetics compared with nondiabetics. However, in general, diabetics were more likely to be treated with broad gram‐negative therapy suggesting that, particularly for cutaneous abscesses, this prescribing practice may not be warranted. These findings support current IDSA guidelines that recommend antibiotic therapy targeted toward gram‐positive pathogens for cellulitis or abscess, irrespective of the presence of diabetes mellitus.[8, 9] Because nearly one‐fourth of patients hospitalized with cellulitis or abscess are diabetic, these findings have relevance for national antimicrobial stewardship efforts aimed at curbing antimicrobial resistance through reducing use of antibiotics with broad gram‐negative activity in hospitals.[16]
Disclosures: This work was supported by the National Institute of Allergy and Infectious Diseases, National Institute of Health (TCJ: K23 AI099082). D.M.P. reports potential conflicts of interests with Optimer, Cubist, and Forest Pharmaceuticals. The authors report no other conflicts of interest.
- , , , et al. Increased risk of common infections in patients with type 1 and type 2 diabetes mellitus. Clin Infect Dis. 2005;41(3):281–288.
- , , , et al. Antibiotic prescribing practices in a multicenter cohort of patients hospitalized for acute bacterial skin and skin structure infection. Infect Control Hosp Epidemiol. 2014;35(10):1241–1250.
- , , , . The role of beta‐hemolytic streptococci in causing diffuse, nonculturable cellulitis: a prospective investigation. Medicine. 2010;89(4):217–226.
- , , , et al. Factors associated with complications and mortality in adult patients hospitalized for infectious cellulitis. Eur J Clin Microbiol Infect Dis. 2003;22(3):151–157.
- , , , et al. Epidemiology and outcomes of complicated skin and soft tissue infections in hospitalized patients. J Clin Microbiol. 2012;50(2):238–245.
- , , , , , . Current management of patients hospitalized with complicated skin and soft tissue infections across Europe (2010–2011): assessment of clinical practice patterns and real‐life effectiveness of antibiotics from the REACH study. Clin Microbiol Infect. 2013;19(9):E377–E385.
- , , , et al. 2012 Infectious Diseases Society of America clinical practice guideline for the diagnosis and treatment of diabetic foot infections. Clin Infect Dis. 2012;54(12):e132–e173.
- , , , et al. Clinical practice guidelines by the Infectious Diseases Society Of America for the treatment of methicillin‐resistant Staphylococcus aureus infections in adults and children: executive summary. Clin Infect Dis. 2011;52(3):285–292.
- , , , et al. Practice guidelines for the diagnosis and management of skin and soft tissue infections: 2014 update by the Infectious Diseases Society Of America. Clin Infect Dis. 2014;59(2):e10–e52.
- , , , et al. Decreased antibiotic utilization after implementation of a guideline for inpatient cellulitis and cutaneous abscess. Arch Intern Med. 2011;171(12):1072–1079.
- , , , , , . Skin and soft‐tissue infections requiring hospitalization at an academic medical center: opportunities for antimicrobial stewardship. Clin Infect Dis. 2010;51(8):895–903.
- , , , , , . Skin and soft tissue infections in hospitalised patients with diabetes: culture isolates and risk factors associated with mortality, length of stay and cost. Diabetologia. 2010;53(5):914–923.
- , , , . Skin and soft tissue infections and associated complications among commercially insured patients aged 0–64 years with and without diabetes in the U.S. PLoS One. 2013;8(4):e60057.
- , , . A post hoc subgroup analysis of meropenem versus imipenem/cilastatin in a multicenter, double‐blind, randomized study of complicated skin and skin‐structure infections in patients with diabetes mellitus. Clin Ther. 2006;28(8):1164–1174.
- , , , . Treating diabetic foot infections with sequential intravenous to oral moxifloxacin compared with piperacillin‐tazobactam/amoxicillin‐clavulanate. J Antimicr Chemo. 2007;60(2):370–376.
- , , , et al. Vital signs: improving antibiotic use among hospitalized patients. MMWR Morb Mortal Wkly Rep. 2014;63(9):194–200.
Diabetes mellitus is one of the most common comorbid conditions among patients hospitalized for acute bacterial skin infections.[1, 2, 3, 4, 5, 6] Acute bacterial skin infections in diabetics represent a spectrum of conditions ranging from cellulitis or cutaneous abscess to more complicated infections such as infected ulcers or deep tissue infections. Although most skin infections in diabetics are caused by gram‐positive pathogens (Staphylococcus aureus and streptococci), the risk of gram‐negative pathogens is increased in certain complicated infections such as diabetic foot infections.[7] For such complicated infections, national guidelines therefore recommend broad‐spectrum empiric antibiotic therapy.[7]
The role of gram‐negative pathogens has not been clearly established in diabetics with cellulitis or cutaneous abscess not associated with an infected ulcer or diabetic foot infection. National guidelines for the treatment of cellulitis and abscess recommend antibiotic therapy targeted toward S aureus and streptococcal species irrespective of the presence of diabetes mellitus.[8, 9] However, in a recent multicenter study of patients hospitalized with acute bacterial skin infections in which cases involving infected ulcers or deep tissue infection were excluded, diabetes mellitus was an independent predictor of use of antibiotics with broad gram‐negative activity.[2] This suggests that either gram‐negative pathogens are more common or providers perceive gram‐negative pathogens to be more common among diabetics with otherwise uncomplicated cellulitis or abscess.
A better understanding of the relationship between the microbiology and antibiotic prescribing practices for diabetics with cellulitis or abscess is therefore necessary to promote the most appropriate spectrum of therapy for these patients. We evaluated a large cohort of patients hospitalized with acute bacterial skin infections in order to: (1) compare the microbiology of diabetics and nondiabetics with cellulitis or cutaneous abscess not associated with an ulcer or deep tissue infection; and (2) compare antibiotic prescribing practices among diabetics and nondiabetics. We hypothesized that diabetics would have a similar spectrum of microorganisms as nondiabetics but would be more frequently treated with antibiotics with broad gram‐negative activity.
METHODS
Study Design
This was a secondary analysis of 2 published retrospective studies of patients hospitalized for cellulitis or cutaneous abscess between January 1, 2007 and May 31, 2012.[2, 10] For the purposes of this study, the terms cellulitis and abscess will refer to infections not involving an infected ulcer, osteomyelitis, or other deep tissue infection.
Study Setting and Population
The first of the 2 cohorts analyzed for the present study included patients hospitalized with cellulitis, abscess, or wound infection at 7 academic or community hospitals in Colorado.[2] The second cohort included patients hospitalized with cellulitis or abscess at a single academic medical center (1 of the 7 hospitals above) in Denver, Colorado.[10] The methods of these studies have been reported in detail elsewhere.[2, 10, 11] Briefly, potential cases were identified using International Classification of Diseases, 9th Revision, Clinical Modification codes. The main inclusion and exclusion criteria of the 2 studies were similar. In both studies, cases were excluded that involved infected ulcers or suspected or confirmed deep tissue involvement (eg, osteomyelitis, myositis, fasciitis). Cases were also excluded that involved other infections where empiric antibiotic therapy with gram‐negative activity is standard including infected human or animal bites, periorbital or orbital infections, and perineal infections. The combined cohort in the present study therefore represented a group of patients hospitalized with relatively uncomplicated cellulitis or cutaneous abscess.
Definitions and Study Outcomes
Only 1 of the 2 studies from which the current cohort was derived distinguished between nonpurulent cellulitis, purulent cellulitis, and wound infection.[2] In the other study, cases were more broadly defined as either cellulitis or cutaneous abscess.[10] Infected ulcers and deep tissue infections were excluded from both studies. In combining the data into the current cohort, all nondrainable infections (purulent or nonpurulent cellulitis and wound infection) were categorized generally as cellulitis. All cases with documentation of an abscess in the medical record were categorized as cutaneous abscess. Presence of diabetes mellitus was based on provider documentation of the condition during the hospitalization. Microbiological cultures were obtained at the discretion of treating providers. Exposure to antibiotics with a broad spectrum of gram‐negative activity was defined as receipt of 2 or more calendar days of ‐lactam/‐lactamase inhibitor combinations, second‐ through fifth‐generation cephalosporins, fluoroquinolones, carbapenems, tigecycline, aminoglycosides, or colistin.[2]
The follow‐up periods differed slightly between the 2 studies used to derive the current cohort. In 1 study, all clinical encounters within 30 days of hospital discharge were reviewed to assess clinical outcomes.[10] In the other, clinical encounters within 45 days from the date of hospitalization were reviewed.[2] Clinical failure was defined as any of the following within the 30‐ or 45‐day follow‐up periods, respectively: (1) treatment failure, defined as a change in antibiotic therapy or unplanned drainage procedure due to inadequate clinical response more than 5 days[2] or 7 days[10] after hospital admission; (2) recurrence, defined as reinitiation of antibiotics for skin infection after completion of the initial treatment course; or (3) rehospitalization due to skin infection.[11]
Statistical Analysis
Because the clinical factors, microbiology, and treatment of cellulitis and cutaneous abscesses differ, analyses were performed for the total cohort and stratified by type of infection. Microorganisms cultured, antibiotic selection, and treatment duration were compared between diabetics and nondiabetics using the Wilcoxon rank sum test, 2, or Fisher exact test, as appropriate.
Because we hypothesized that the presence of diabetes mellitus in patients with cellulitis or abscess leads to use of broad gram‐negative therapy, we developed a multivariable logistic regression model to identify factors independently associated with exposure to antibiotics with broad gram‐negative activity. We also developed a linear regression model to explore the relationship between diabetes mellitus and duration of antibiotic therapy after adjusting for covariates. To develop these models, we first performed bivariate analyses and retained variables with a P value 0.25 in the regression models. Variables that did not meet the P value threshold but were considered to be clinically relevant covariates were also included in the model. We assessed for effect modification, multicollinearity, and goodness of fit when developing the models. We used SAS version 9.3 (SAS Institute, Cary, NC) for data analysis.
RESULTS
After excluding 102 pediatric cases and removing 5 duplicate cases, 770 total cases were included for analysis: 447 involved cellulitis and 323 involved cutaneous abscess (Figure 1). Overall, 167 (22%) patients had diabetes mellitus. Diabetics were significantly more likely than nondiabetics to have cellulitis as the presenting infection (67% of cases vs 56%, P=0.008) and to have lower extremity involvement (48% vs 33%, P<0.001) (Table 1). Diabetics were also older (median age 55 years vs 48 years, P<0.001), more likely to have cirrhosis or prior skin infection, and less likely to be injection‐drug users or human immunodeficiency virus (HIV) infected. Demographic and clinical characteristics among diabetics and nondiabetics stratified by the categorizations of cellulitis and cutaneous abscess are presented in the Supporting Information, Appendix Table 1, in the online version of this article.
| Diabetes Mellitus, N=167 | No Diabetes Mellitus, N=603 | |
|---|---|---|
| ||
| Type of infection | ||
| Cellulitis | 112 (67) | 335 (56)a |
| Cutaneous abscess | 55 (33) | 268 (44) |
| Age, y, median (IQR) | 55 (4763) | 48 (3658)a |
| Male | 102 (61) | 405 (67) |
| Injection drug use | 9 (5) | 117 (19)a |
| Alcohol abuse or dependence | 15 (9) | 86 (14) |
| Cirrhosis | 11 (7) | 17 (3)a |
| HIV infection | 0 | 29 (5)a |
| Dialysis dependence | 4 (2) | 5 (1) |
| Peripheral arterial disease | 4 (2) | 5 (1) |
| Saphenous vein harvest | 7 (4) | 11 (2) |
| Prior skin infection | 56 (34) | 125 (21)a |
| Prior MRSA infection or colonization | 20 (12) | 50 (8) |
| Anatomical location | ||
| Lower extremity | 80 (48) | 200 (33)a |
| Upper extremity | 6 (4) | 79 (13)a |
| Head and neck | 14 (8) | 38 (6) |
| Buttock or inguinal | 8 (5) | 35 (6) |
| Chest, abdomen, back, or axilla | 9 (5) | 25 (4) |
| Multiple distinct sites | 7 (4) | 34 (6) |
| Medical primary service | 139 (83) | 395 (66)a |
| Consultation requested | 99 (59) | 294 (49)a |
| Surgery | 58 (35) | 152 (25)a |
| Internal medicine | 18 (11) | 47 (8) |
| Infectious diseases | 41 (25) | 149 (25) |
| Failed initial outpatient antibiotic therapy | 52 (31) | 186 (31) |
| Fever (temperature 38.0C) | 20 (12) | 102 (17) |
| Leukocytosis (WBC >10,000 cells/mm3) | 78 (47) | 311 (52) |
The frequency of use of microbiological cultures was similar among diabetics and nondiabetics (Table 2). In cases of cellulitis, a microorganism was identified in 18% of diabetics and 12% of nondiabetics (P=0.09). In cases of cutaneous abscess, a microorganism was identified more commonly (69% and 74%, respectively, P=0.50). Among cases where a microorganism was identified, aerobic gram‐positive organisms were isolated in 90% of diabetics and 92% of nondiabetics (P=0.59). Aerobic gram‐negative organisms were isolated in 7% of diabetics and 12% of nondiabetics (P=0.28). Specific gram‐negative organisms isolated are shown in the Supporting Information, Appendix Table 2, in the online version of this article; no cases in diabetics involved Pseudomonas aeruginosa. The comparison of microbiological data among diabetics and nondiabetics was similar when stratified by cellulitis versus cutaneous abscess (Table 2).
| Cellulitis | Cutaneous Abscess | All Cases | |||||||
|---|---|---|---|---|---|---|---|---|---|
| Diabetes Mellitus, N=112 | No Diabetes Mellitus, N=335 | P | Diabetes Mellitus, N=55 | No Diabetes Mellitus, N=268 | P | Diabetes Mellitus, N=167 | No Diabetes Mellitus, N=603 | P | |
| |||||||||
| Any microbiological culture obtaineda | 82 (73) | 234 (70) | 46 (84) | 239 (89) | 128 (77) | 473 (78) | |||
| Wound drainage or swab | 19 (17) | 36 (11) | 1 (2) | 8 (3) | 20 (12) | 44 (7) | |||
| Abscess material | 1 (1) | 3 (1) | 39 (71) | 205 (76) | 40 (24) | 208 (34) | |||
| Tissueb | 2 (2) | 17 (5) | 1 (2) | 8 (3) | 3 (2) | 25 (4) | |||
| Blood | 73 (65) | 212 (63) | 26 (47) | 121 (45) | 99 (59) | 333 (55) | |||
| Any microorganism identifiedc | 20 (18) | 39 (12) | 0.09 | 38 (69) | 197 (74) | 0.50 | 58 (35) | 236 (39) | 0.30 |
| Aerobic gram‐positive | 15 (75) | 36 (92) | 0.11 | 37 (97) | 182 (92) | 0.48 | 52 (90) | 218 (92) | 0.59 |
| Staphylococcus aureus | 11 (55) | 26 (67) | 0.38 | 28 (74) | 132 (67) | 0.42 | 39 (67) | 158 (67) | 0.97 |
| Methicillin‐susceptible | 4 (20) | 15 (38) | 0.15 | 12 (32) | 42 (21) | 0.17 | 16 (28) | 57 (24) | 0.59 |
| Methicillin‐resistant | 5 (25) | 11 (28) | 1.00 | 14 (37) | 85 (43) | 0.47 | 19 (33) | 96 (41) | 0.27 |
| Susceptibility not performed | 2 (10) | 0 | 0.11 | 2 (5) | 5 (3) | 0.32 | 4 (7) | 5 (2) | 0.08 |
| Streptococcal species | 6 (30) | 15 (38) | 0.52 | 12 (32) | 69 (35) | 0.68 | 18 (31) | 84 (36) | 0.51 |
| ‐hemolytic streptococcus | 3 (15) | 13 (33) | 0.13 | 6 (16) | 32 (16) | 0.94 | 9 (16) | 45 (19) | 0.53 |
| Streptococcus anginosus/Streptococcus milleri group | 1 (5) | 0 | 0.34 | 2 (5) | 29 (15) | 0.11 | 3 (5) | 29 (12) | 0.12 |
| Other ‐hemolytic streptococcus | 2 (10) | 2 (5) | 0.60 | 4 (11) | 12 (6) | 0.30 | 6 (10) | 14 (6) | 0.25 |
| Other streptococcus | 0 | 0 | 1 (3) | 3 (2) | 0.51 | 1 (2) | 3 (1) | 0.59 | |
| Staphylococcus aureus or streptococci | 15 (75) | 35 (90) | 0.25 | 37 (97) | 182 (92) | 0.48 | 52 (90) | 217 (92) | 0.60 |
| Enterococcus species | 0 | 2 (5) | 0.54 | 0 | 4 (2) | 1.00 | 0 | 6 (3) | 0.60 |
| Aerobic gram‐negative | 2 (10) | 7 (18) | 0.70 | 2 (5) | 21 (11) | 0.39 | 4 (7) | 28 (12) | 0.28 |
| Anaerobic organism(s) | 2 (10) | 3 (8) | 1.00 | 8 (21) | 30 (15) | 0.37 | 10 (17) | 33 (14) | 0.53 |
| Mixed skin or oral flora | 1 (5) | 1 (3) | 1.00 | 0 | 1 (1) | 1.00 | 1 (2) | 2 (1) | 0.48 |
| Other | 1 (5) | 3 (8) | 1.00 | 2 (5) | 3 (2) | 0.19 | 3 (5) | 6 (3) | 0.39 |
| Polymicrobial | 3 (15) | 17 (45) | 0.03 | 11 (29) | 47 (24) | 0.51 | 14 (24) | 64 (27) | 0.65 |
| Positive blood cultured | 4 (5) | 8 (4) | 0.51 | 2 (8) | 3 (2) | 0.21 | 6 (6) | 11 (3) | 0.24 |
Antibiotic utilization is summarized in Table 3. Among patients who were started on antibiotic therapy in the emergency department or urgent care, the initial regimen included an agent with broad gram‐negative activity in 31% of both diabetics and nondiabetics (P=0.97). During the entire hospital stay (including the emergency department or urgent care), diabetics were significantly more likely to be treated with ‐lactam/‐lactamase inhibitor combinations (42% vs 33%, P=0.04). At the time of hospital discharge, diabetics were more likely to be prescribed fluoroquinolones (11% vs 5%, P=0.01) (Table 3) particularly for cases of cellulitis (13% vs 6%, P=0.008) (see Supporting Information, Appendix Table 3, in the online version of this article). Diabetics were somewhat more likely to be prescribed parenteral antibiotics (10% vs 6%, P=0.07) after discharge. When considering both inpatient and discharge therapy, more diabetics than nondiabetics were exposed to at least 2 calendar days of broad gram‐negative therapy (54% vs 44%, P=0.02) and more were prescribed an antipseudomonal agent (38% vs 25%, P=0.002). In the group of patients who received at least 1 dose of an antibiotic with broad gram‐negative activity, broad gram‐negative agents accounted for 33% of the total days of therapy prescribed for diabetics and 32% for nondiabetics. Overall prescribing patterns were similar when stratified by cellulitis versus cutaneous abscess (see Supporting Information, Appendix Table 3, in the online version of this article).
| Diabetes Mellitus, N=167 | No Diabetes Mellitus, N=603 | P | |
|---|---|---|---|
| |||
| Individual antibiotics prescribed during the inpatient stayab | |||
| Vancomycin | 142 (85) | 504 (84) | 0.65 |
| Clindamycin | 27 (16) | 131 (22) | 0.12 |
| Parenteral ‐lactam/‐lactamase inhibitor | 70 (42) | 200 (33) | 0.04 |
| Second‐generation or higher cephalosporin | 13 (8) | 51 (8) | 0.78 |
| Cefazolin | 17 (10) | 91 (15) | 0.11 |
| Carbapenem | 9 (5) | 34 (6) | 0.90 |
| Fluoroquinolone | 20 (12) | 53 (9) | 0.21 |
| Daptomycin | 8 (5) | 24 (4) | 0.64 |
| Linezolid | 2 (1) | 8 (1) | 1.00 |
| Other ‐lactam | 6 (4) | 30 (5) | 0.45 |
| Trimethoprim‐sulfamethoxazole | 12 (7) | 30 (5) | 0.27 |
| Doxycycline | 15 (9) | 44 (7) | 0.47 |
| Cephalexin | 7 (4) | 22 (4) | 0.74 |
| Amoxicillin‐clavulanate | 11 (7) | 24 (4) | 0.15 |
| Antibiotics prescribed at hospital dischargeb | 163 (98) | 580 (96) | 0.38 |
| Clindamycin | 20 (12) | 95 (16) | 0.23 |
| Trimethoprim‐sulfamethoxazole | 52 (31) | 215 (36) | 0.28 |
| Doxycycline | 32 (19) | 91 (15) | 0.20 |
| Cephalexin | 12 (7) | 46 (8) | 0.85 |
| Amoxicillin‐clavulanate | 24 (14) | 82 (14) | 0.80 |
| Fluoroquinolone | 18 (11) | 32 (5) | 0.01 |
| Linezolid | 8 (5) | 19 (3) | 0.31 |
| Other oral ‐lactam | 3 (2) | 28 (5) | 0.10 |
| Other oral antibiotic | 1 (1) | 2 (0.3) | 0.52 |
| Vancomycin | 8 (5) | 15 (2) | 0.13 |
| Daptomycin | 5 (3) | 10 (2) | 0.34 |
| Other parenteral antibiotic | 4 (2) | 11 (2) | 0.75 |
| Antibiotic with broad gram‐negative activity initiated in emergency department or urgent care | 46/149 (31) | 174/561 (31) | 0.97 |
| Exposed to any antibiotic with broad gram‐negative activityc | 101 (62) | 311 (53) | 0.048 |
| Exposed to any antibiotic with antipseudomonal activity | 62 (38) | 149 (25) | 0.002 |
| Exposed to at least 2 calendar days of antibiotics with broad gram‐negative activityc | 89 (54) | 259 (44) | 0.02 |
| Treatment durationd | |||
| Total duration of therapy, d, median (IQR) | 13 (1015) | 12 (1015) | 0.09 |
| Duration of inpatient therapy, d, median (IQR) | 4 (36) | 4 (35) | 0.03 |
| Duration of therapy after discharge, d, median (IQR) | 8 (710) | 8 (710) | 0.58 |
After adjusting for covariates in the logistic regression model, diabetes mellitus was an independent predictor of exposure to broad gram‐negative therapy (see Supporting Information, Appendix Table 4, in the online version of this article). In addition to diabetes mellitus, culture of an aerobic gram‐negative microorganism, infectious diseases service consultation, presence of fever, and nonmedical admitting services were significantly associated with exposure to broad gram‐negative therapy. Prior methicillin‐resistant S aureus infection or colonization and HIV infection were inversely associated. Compared with nondiabetics, the total duration of antibiotic therapy in diabetics was somewhat longer (median 13 days vs 12 days, P=0.09) (Table 3). After adjusting for covariates in the linear regression model, there was a significant association between diabetes mellitus and treatment duration. On average, diabetics were treated 1 day (95% confidence interval: 0.2‐1.7 days) longer than nondiabetics.
Compared with nondiabetics, diabetics were more likely to have an outpatient follow‐up visit (73% vs 61%, P=0.002) and to be rehospitalized for any reason after discharge (16% vs 9%, P=0.02) (Table 4). Diabetics were overall more likely to be classified as clinical failure (15% vs 9%, P=0.02); this difference was driven by the cellulitis subgroup (19% vs 10%, P=0.01).
| Cellulitis | Cutaneous Abscess | All Cases | |||||||
|---|---|---|---|---|---|---|---|---|---|
| Diabetes Mellitus, N=112 | No Diabetes Mellitus, N=335 | P | Diabetes Mellitus, N=55 | No Diabetes Mellitus, N=268 | P | Diabetes Mellitus, N=167 | No Diabetes Mellitus, N=603 | P | |
| |||||||||
| Survived to discharge | 111 (99) | 335 (100) | 0.25 | 55 (100) | 268 (100) | 166 (99) | 603 (100) | 0.22 | |
| Outpatient follow‐up documented | 82 (74) | 204 (61) | 0.01 | 40 (73) | 161 (60) | 0.08 | 122 (73) | 365 (61) | 0.002 |
| Rehospitalized | 22 (20) | 34 (10) | 0.008 | 4 (7) | 21 (8) | 1.00 | 26 (16) | 55 (9) | 0.02 |
| Clinical failure | 21 (19) | 34 (10) | 0.01 | 4 (7) | 20 (7) | 1.00 | 25 (15) | 54 (9) | 0.02 |
| Treatment failure | 7 (6) | 17 (5) | 0.62 | 2 (4) | 7 (3) | 0.65 | 9 (5) | 24 (4) | 0.42 |
| Recurrence | 10 (9) | 16 (5) | 0.10 | 1 (2) | 11 (4) | 0.70 | 11 (7) | 27 (4) | 0.26 |
| Rehospitalization due to skin infection | 14 (13) | 17 (5) | 0.01 | 3 (5) | 11 (4) | 0.71 | 17 (10) | 28 (5) | 0.01 |
| Length of stay, d, median (IQR) | 4 (36) | 4 (35) | 0.03 | 4 (36) | 4 (35) | 0.28 | 4 (36) | 4 (35) | 0.02 |
DISCUSSION
Diabetes mellitus is a common comorbidity in patients with acute bacterial skin infections. In this large cohort of patients hospitalized for cellulitis or cutaneous abscess, where those with infected ulcers or deep tissue infections were excluded, microbiological findings in cases associated with positive cultures were similar among diabetics and nondiabetics. Although aerobic gram‐negative microorganisms were not more likely to be identified in diabetics, diabetics were significantly more likely to be exposed to at least 2 calendar days of antibiotics with broad gram‐negative activity. After adjusting for covariates, diabetes mellitus was independently associated with exposure to broad gram‐negative therapy.
To our knowledge, this is the first study to compare the microbiology of cellulitis and cutaneous abscess among diabetics and nondiabetics. Lipsky and colleagues previously described the microbiology of a cohort of diabetic patients hospitalized with a broader range of skin infections including cellulitis, infected ulcers, and surgical site infections.[12] Similar to our findings, gram‐negative pathogens were uncommonly isolated in that study; however, in the absence of a comparator group, whether diabetics were at higher risk for gram‐negative involvement than nondiabetics was not known. Similar to the study by Lipsky and colleagues, most studies of skin infections in diabetics have included a relatively heterogeneous group of infections.[12, 13, 14, 15] The present study therefore contributes to the literature by providing a focused comparison of the microbiology of inpatient cellulitis and abscess in the absence of complicating factors such as an infected ulcer or deep tissue involvement. We found that among cases with a positive culture (13% of cases in the cellulitis group and 73% in the abscess group), the microbiology was similar among diabetics and nondiabetics. Although a microorganism was identified in only a minority of cases of cellulitis, our findings do not support the need for broad gram‐negative therapy in diabetics with cellulitis not associated with an ulcer or deep tissue infection. In diabetics with an abscess, antibiotics with broad gram‐negative activity do not appear to be indicated.
The present study also adds to the literature by providing a detailed comparison of antibiotic utilization patterns among diabetics and nondiabetics. We demonstrated that diabetics were more likely to have significant exposure to antibiotics with broad gram‐negative activity, particularly antipseudomonal agents (the broadest‐spectrum antibiotics). Because initiation of broad gram‐negative therapy in the emergency department or urgent care was not more common among diabetics, the increased use of these agents among diabetics appeared to be driven by inpatient providers. It is also notable that of patients who received any antibiotic with broad gram‐negative activity, these agents accounted for similar proportions of the total days of therapy in both diabetics and nondiabetics. In aggregate, our findings demonstrate that diabetics are more likely to be started on antibiotics with broad gram‐negative activity by inpatient providers, diabetics are not necessarily continued on longer durations of broad gram‐negative therapy once started, and the total amount of exposure to broad gram‐negative agents is substantial.
Overall, our findings suggest that inpatient providers perceive diabetics with cellulitis or abscess to be at increased risk for gram‐negative pathogens. This perhaps reflects an extrapolation of recommendations to use broad‐spectrum empiric therapy in diabetics with certain complicated skin infections.[7] However, for patients with cellulitis or cutaneous abscess, Infectious Diseases Society of America (IDSA) guidelines recommend antibiotic therapy targeted toward S aureus and streptococcal species; there is no suggestion to use a broader spectrum of therapy in diabetics.[8, 9] Our findings therefore highlight an important opportunity to improve antibiotic selection for all patients hospitalized with cellulitis and abscess, but particularly diabetics. It is also noteworthy that by linear regression, diabetes mellitus was independently associated with longer treatment durations. Although the average increase in treatment duration was small (1 day), this finding adds to the evidence that the presence of diabetes mellitus alters providers' treatment approach to cellulitis or abscess.
We found that despite more frequent treatment with broad gram‐negative therapy, diabetics were more likely than nondiabetics to be classified as clinical failures. It is important to point out that diabetics were also more likely than nondiabetics to have postdischarge outpatient follow‐up visits, raising the possibility of biased ascertainment of clinical failure events in this group. However, we also demonstrated that diabetics with cellulitis were more likely to be rehospitalized than nondiabetics. This is similar to a finding by Suaya and colleagues who showed that diabetics with skin infections were about twice as likely to be rehospitalized as nondiabetics.[13] One could hypothesize that the increased frequency of clinical failure events among diabetics was due to their older age, hyperglycemia, or vascular insufficiency; however, other factors may have contributed. For example, providers may have mistaken residual erythema for ongoing or recurrent cellulitis, or the diagnosis of cellulitis could have been incorrect to begin with. Additionally, there may have been uncertainty about the microbiology of cellulitis because the infecting pathogen was not usually identified. These factors may have led to alterations in treatment that would have resulted in a classification of clinical failure, and it is possible that providers had a lower threshold to alter treatment in diabetics. It is therefore not clear whether our findings represent a true difference in clinical outcomes between diabetics or nondiabetics. Regardless, in cases associated with a positive culture, our microbiological results do not support that the difference in clinical failure between diabetics and nondiabetics with cellulitis was related to a different spectrum of microorganisms.
In addition to the limitations outlined previously[2, 10] and above, the present study has at least 5 additional limitations. First, this was a secondary analysis of studies that were not designed to evaluate the effect of diabetes mellitus on the microbiology and treatment of skin infections. For example, hemoglobin A1C values were not collected; therefore, we could not examine whether the microbiology and antibiotic prescribing practices differed based on control of diabetes mellitus. Second, there were minor differences in inclusion and exclusion criteria between the 2 cohorts included in this study. Because the proportion of patients with diabetes mellitus was similar among both cohorts, and comparisons were not made between the cohorts, this should not have impacted our results. Third, the broad categorization of cellulitis used when combining the 2 cohorts raised the possibility of differences in infection characteristics between diabetics and nondiabetics (eg, presence of a wound) that could have confounded our findings regarding use of gram‐negative therapy. In the larger of the 2 cohorts from which the combined cohort was derived, only 17 (3%) of 533 patients had wound infections, whereas those with infected ulcers or suspected deep‐tissue infection were excluded from both cohorts. Furthermore, in the combined cohort, the increased frequency of broad gram‐negative therapy among diabetics was also observed in the cutaneous abscess group. It is therefore unlikely that the categorization of cellulitis had a significant impact on our results. Fourth, given the observational nature of the study, the microbiological data were subject to limitations. Importantly, because the infecting pathogen was identified in only 13% of cases of cellulitis, firm conclusions regarding the microbiology of cellulitis cannot be drawn. Finally, the small number of gram‐negative organisms isolated precluded comparisons of specific pathogens among diabetics and nondiabetics. In addition, because a number of gram‐negative organisms were isolated from wound cultures, it is not known whether they were clinically relevant or simply represented colonization.
In conclusion, in cases of cellulitis or abscess associated with a positive culture, gram‐negative microorganisms were not isolated more commonly among diabetics compared with nondiabetics. However, in general, diabetics were more likely to be treated with broad gram‐negative therapy suggesting that, particularly for cutaneous abscesses, this prescribing practice may not be warranted. These findings support current IDSA guidelines that recommend antibiotic therapy targeted toward gram‐positive pathogens for cellulitis or abscess, irrespective of the presence of diabetes mellitus.[8, 9] Because nearly one‐fourth of patients hospitalized with cellulitis or abscess are diabetic, these findings have relevance for national antimicrobial stewardship efforts aimed at curbing antimicrobial resistance through reducing use of antibiotics with broad gram‐negative activity in hospitals.[16]
Disclosures: This work was supported by the National Institute of Allergy and Infectious Diseases, National Institute of Health (TCJ: K23 AI099082). D.M.P. reports potential conflicts of interests with Optimer, Cubist, and Forest Pharmaceuticals. The authors report no other conflicts of interest.
- , , , et al. Increased risk of common infections in patients with type 1 and type 2 diabetes mellitus. Clin Infect Dis. 2005;41(3):281–288.
- , , , et al. Antibiotic prescribing practices in a multicenter cohort of patients hospitalized for acute bacterial skin and skin structure infection. Infect Control Hosp Epidemiol. 2014;35(10):1241–1250.
- , , , . The role of beta‐hemolytic streptococci in causing diffuse, nonculturable cellulitis: a prospective investigation. Medicine. 2010;89(4):217–226.
- , , , et al. Factors associated with complications and mortality in adult patients hospitalized for infectious cellulitis. Eur J Clin Microbiol Infect Dis. 2003;22(3):151–157.
- , , , et al. Epidemiology and outcomes of complicated skin and soft tissue infections in hospitalized patients. J Clin Microbiol. 2012;50(2):238–245.
- , , , , , . Current management of patients hospitalized with complicated skin and soft tissue infections across Europe (2010–2011): assessment of clinical practice patterns and real‐life effectiveness of antibiotics from the REACH study. Clin Microbiol Infect. 2013;19(9):E377–E385.
- , , , et al. 2012 Infectious Diseases Society of America clinical practice guideline for the diagnosis and treatment of diabetic foot infections. Clin Infect Dis. 2012;54(12):e132–e173.
- , , , et al. Clinical practice guidelines by the Infectious Diseases Society Of America for the treatment of methicillin‐resistant Staphylococcus aureus infections in adults and children: executive summary. Clin Infect Dis. 2011;52(3):285–292.
- , , , et al. Practice guidelines for the diagnosis and management of skin and soft tissue infections: 2014 update by the Infectious Diseases Society Of America. Clin Infect Dis. 2014;59(2):e10–e52.
- , , , et al. Decreased antibiotic utilization after implementation of a guideline for inpatient cellulitis and cutaneous abscess. Arch Intern Med. 2011;171(12):1072–1079.
- , , , , , . Skin and soft‐tissue infections requiring hospitalization at an academic medical center: opportunities for antimicrobial stewardship. Clin Infect Dis. 2010;51(8):895–903.
- , , , , , . Skin and soft tissue infections in hospitalised patients with diabetes: culture isolates and risk factors associated with mortality, length of stay and cost. Diabetologia. 2010;53(5):914–923.
- , , , . Skin and soft tissue infections and associated complications among commercially insured patients aged 0–64 years with and without diabetes in the U.S. PLoS One. 2013;8(4):e60057.
- , , . A post hoc subgroup analysis of meropenem versus imipenem/cilastatin in a multicenter, double‐blind, randomized study of complicated skin and skin‐structure infections in patients with diabetes mellitus. Clin Ther. 2006;28(8):1164–1174.
- , , , . Treating diabetic foot infections with sequential intravenous to oral moxifloxacin compared with piperacillin‐tazobactam/amoxicillin‐clavulanate. J Antimicr Chemo. 2007;60(2):370–376.
- , , , et al. Vital signs: improving antibiotic use among hospitalized patients. MMWR Morb Mortal Wkly Rep. 2014;63(9):194–200.
© 2014 Society of Hospital Medicine

Effect of Acetabular Cup Abduction Angle on Wear of Ultrahigh-Molecular-Weight Polyethylene in Hip Simulator Testing

Pneumonia Guideline Therapy Outcomes
Community‐acquired pneumonia (CAP) is a common and serious infection in children. With more than 150,000 children requiring hospitalization annually, CAP is the fifth most prevalent and the second most costly diagnosis of all pediatric hospitalizations in the United States.[1, 2, 3]
In August 2011, the Pediatric Infectious Diseases Society (PIDS) and the Infectious Diseases Society of America (IDSA) published an evidence‐based guideline for the management of CAP in children. This guideline recommended that fully immunized children without underlying complications who require hospitalization receive an aminopenicillin as first‐line antibiotic therapy.[4] Additionally, the guideline recommends empirically adding a macrolide to an aminopenicillin when atypical pneumonia is a diagnostic consideration.
This recommendation was a substantial departure from practice for hospitals nationwide, as a multicenter study of children's hospitals (20052010) demonstrated that <10% of patients diagnosed with CAP received aminopenicillins as empiric therapy.[5] Since publication of the PIDS/IDSA guidelines, the use of aminopenicillins has increased significantly across institutions, but the majority of hospitalized patients still receive broad‐spectrum cephalosporin therapy for CAP.[6]
At baseline, 30% of patients hospitalized with CAP received guideline‐recommended antibiotic therapy at our institution. Through the use of quality‐improvement methods, the proportion of patients receiving guideline‐recommended therapy increased to 100%.[7] The objective of this study was to ensure that there were not unintended negative consequences to guideline implementation. Specifically, we sought to identify changes in length of stay (LOS), hospital costs, and treatment failures associated with use of guideline‐recommended antibiotic therapy for children hospitalized with uncomplicated CAP.
METHODS
Study Design and Study Population
This retrospective cohort study included children age 3 months to 18 years, hospitalized with CAP, between May 2, 2011 and July 30, 2012, at Cincinnati Children's Hospital Medical Center (CCHMC), a 512‐bed free‐standing children's hospital. The CCHMC Institutional Review Board approved this study with a waiver of informed consent.
Patients were eligible for inclusion if they were admitted to the hospital for inpatient or observation level care with a primary or secondary International Classification of Disease, 9th Revision discharge diagnosis code of pneumonia (480.02, 480.89, 481, 482.0, 482.30‐2, 482.41‐2, 482.83, 482.8990, 483.8, 484.3, 485, 486, 487.0) or effusion/empyema (510.0, 510.9, 511.01, 511.89, 513).[8] Patients with complex chronic conditions[9] were excluded. Medical records of eligible patients (n=260) were reviewed by 2 members of the study team to ensure that patients fell into the purview of the guideline. Patients who did not receive antibiotics (n=11) or for whom there was documented concern for aspiration (n=1) were excluded. Additionally, patients with immunodeficiency (n=1) or who had not received age‐appropriate vaccinations (n=2), and patients who required intensive care unit admission on presentation (n=17) or who had a complicated pneumonia, defined by presence of moderate or large pleural effusion at time of admission (n=8), were also excluded.[7] Finally, for patients with multiple pneumonia admissions, only the index visit was included; subsequent visits occurring within 30 days of discharge were considered readmissions.
Treatment Measure
The primary exposure of interest was empiric antibiotic therapy upon hospital admission. Antibiotic therapy was classified as guideline recommended or nonguideline recommended. Guideline‐recommended therapy was defined as follows:
- For children without drug allergies: ampicillin (200 mg/kg/day intravenously) or amoxicillin (90 mg/kg/day orally);
- For children with penicillin allergy: ceftriaxone (50100 mg/kg/day intravenously or intramuscularly) or cefdinir (14 mg/kg/day orally);
- For children with penicillin and cephalosporin allergy: clindamycin (40 mg/kg/day orally or intravenously); and
- Or azithromycin (10 mg/kg/day orally or intravenously on day 1) in combination with antibiotic category 1 or 2 or 3 above.
Outcome Measures
The primary outcomes examined were hospital LOS, total cost of hospitalization, and inpatient pharmacy costs. LOS was measured in hours and defined as the difference in time between departure from and arrival to the inpatient unit. Total cost of index hospitalization included both direct and indirect costs, obtained from the Centers for Medicare & Medicaid Services' Relative Value Units data for Current Procedural Terminology codes.[10]
Secondary outcomes included broadening of antibiotic therapy during the hospital course, pneumonia‐related emergency department (ED) revisits within 30 days, and pneumonia‐related inpatient readmissions within 30 days. Broadening of antibiotic therapy was defined as addition of a second antibiotic (eg, adding azithromycin on day 3 of hospitalization) or change in empiric antibiotic to a class with broader antimicrobial activity (eg, ampicillin to ceftriaxone) at any time during hospitalization. As our study population included only patients with uncomplicated pneumonia at the time of admission, this outcome was used to capture possible treatment failure. ED revisits and inpatient readmissions were reviewed by 3 investigators to identify pneumonia‐related visits. To encompass all possible treatment failures, all respiratory‐related complaints (eg, wheezing, respiratory distress) were considered as pneumonia‐related. Disagreements were resolved by group discussion.
Covariates
Severity of illness on presentation was evaluated using the Emergency Severity Index version 4,[11] abnormal vital signs on presentation (as defined by Pediatric Advanced Life Support age‐specific criteria[12]), and need for oxygen in the first 24 hours of hospitalization. Supplemental oxygen is administered for saturations <91% per protocol at our institution. The patient's highest Pediatric Early Warning Scale score[13] during hospitalization was used as a proxy for disease severity. Exam findings on presentation (eg, increased respiratory effort, rales, wheezing) were determined through chart review. Laboratory tests and radiologic imaging variables included complete blood cell count, blood culture, chest radiograph, chest ultrasound, and chest computed tomography. Abnormal white blood cell count was defined as <5000 or >15,000 cells/mL, the defined reference range for the CCHMC clinical laboratory.
Data Analysis
Continuous variables were described using median and interquartile range (IQR) and compared across groups using Wilcoxon rank sum test due to non‐normal distributions. Categorical variables were described by counts and frequencies and compared using the 2 test.
Multivariable linear regression analysis was performed to assess the independent effect of receipt of empiric guideline‐recommended antibiotic therapy on outcomes of LOS and costs while adjusting for covariates. As LOS and costs were non‐normally distributed, we logarithmically transformed these values to use as the dependent variables in our models. The resulting coefficients were back‐transformed to reflect the percent change in LOS and costs incurred between subjects who received empiric guideline therapy compared with those who did not.[14] Covariates were chosen a priori due to their clinical and biological relevance to the outcomes of LOS (eg, wheezing on presentation and need for supplemental oxygen), total cost of hospitalization (eg, LOS and need for repeat imaging), and inpatient pharmacy costs (eg, LOS and wheezing on presentation) (Table 1).
| Characteristic | Overall Cohort, n=220 | Guideline Therapy, n=166 | Nonguideline Therapy, n=54 | P Value |
|---|---|---|---|---|
| ||||
| Age, y, median (IQR) | 2.9 (1.36.3) | 2.5 (1.35.2) | 5.6 (2.38.8) | <0.01* |
| Male, no. (%) | 122 (55.5%) | 89 (53.6%) | 33 (61.1%) | 0.34 |
| Emergency Severity Index, no. (%) | 0.11 | |||
| 2 | 90 (40.9%) | 73 (44.0%) | 17 (31.5%) | |
| 3 | 116 (52.7%) | 85 (51.2%) | 31 (57.4%) | |
| 4 | 14 (6.4%) | 8 (4.8%) | 6 (11.1%) | |
| Abnormal vital signs on presentation, no. (%) | ||||
| Fever | 99 (45.0%) | 80 (48.2%) | 19 (35.2%) | 0.10 |
| Tachycardia | 100 (45.5%) | 76 (45.8%) | 24 (44.4%) | 0.86 |
| Tachypnea | 124 (56.4%) | 100 (60.2%) | 24 (44.4%) | 0.04* |
| Hypotension | 0 | 0 | 0 | |
| Hypoxia | 27 (12.3%) | 24 (14.5%) | 3 (5.6%) | 0.08 |
| Physical exam on presentation, no. (%) | ||||
| Increased respiratory effort | 146 (66.4%) | 111 (66.9%) | 35 (64.8%) | 0.78 |
| Distressed | 110 (50.0%) | 86 (51.8%) | 24 (44.4%) | 0.35 |
| Retraction | 103 (46.8%) | 81 (48.8%) | 22 (40.7%) | 0.30 |
| Grunting | 17 (7.7%) | 14 (8.4%) | 3 (5.6%) | 0.49 |
| Nasal flaring | 19 (8.6%) | 17 (10.2%) | 2 (3.7%) | 0.14 |
| Rales | 135 (61.4%) | 99 (59.6%) | 36 (66.7%) | 0.36 |
| Wheeze | 91 (41.4%) | 66 (39.8%) | 25 (46.3%) | 0.40 |
| Decreased breath sounds | 89 (40.5%) | 65 (39.2%) | 24 (44.4%) | 0.49 |
| Dehydration | 21 (9.6%) | 13 (7.8%) | 8 (14.8%) | 0.13 |
| PEWS 5 during admission, no. (%) | 43 (19.6%) | 34 (20.5%) | 9 (16.7%) | 0.54 |
| Oxygen requirement in first 24 hours, no. (%) | 114 (51.8%) | 90 (53.6%) | 24 (46.2%) | 0.35 |
| Complete blood count obtained, no. (%) | 99 (45.0%) | 72 (43.4%) | 27 (50.0%) | 0.40 |
| Abnormal white blood cell count | 35 (35.7%) | 23 (32.4%) | 12 (44.4%) | 0.27 |
| Blood culture obtained, no. (%) | 104 (47.3%) | 80 (48.2%) | 24 (44.4%) | 0.63 |
| Positive | 2 (1.9%) | 1 (1.3%) | 1 (4.2%) | 0.36 |
| Chest radiograph available, no. (%) | 214 (97.3%) | 161 (97.0%) | 53 (98.2%) | 0.65 |
| Infiltrate | 178 (83.2%) | 139 (86.3%) | 39 (73.6%) | 0.03* |
| Bilateral | 29 (16.3%) | 20 (14.4%) | 9 (23.1%) | 0.19 |
| Multilobar | 46 (25.8%) | 33 (23.7%) | 13 (33.3%) | 0.23 |
| Effusion | 24 (11.2%) | 16 (9.9%) | 8 (15.1%) | 0.30 |
| Additional imaging, no. (%) | ||||
| Repeat chest radiograph | 26 (11.8%) | 17 (10.2%) | 9 (16.7%) | 0.20 |
| Chest ultrasound | 4 (1.8%) | 3 (1.8%) | 1 (1.9%) | 0.98 |
| Chest CT | 2 (0.9%) | 1 (0.6%) | 1 (1.9%) | 0.40 |
| Antibiotic, no. (%) | <0.01* | |||
| Aminopenicillin | 140 (63.6%) | 140 (84.3%) | 0 (0%) | |
| Third‐generation cephalosporin | 37 (16.8%) | 8 (4.8%) | 29 (53.7%) | |
| Macrolide monotherapy | 18 (8.2%) | 0 (0%) | 18 (33.3%) | |
| Clindamycin | 2 (0.9%) | 1 (0.6%) | 1 (1.9%) | |
| Levofloxacin | 1 (0.5%) | 0 (0%) | 1 (1.9%) | |
| Aminopenicillin+macrolide | 16 (7.3%) | 16 (9.6%) | 0 (0%) | |
| Cephalosporin+macrolide | 6 (2.7%) | 1 (0.6%) | 5 (9.3%) | |
Secondary outcomes of broadened antibiotic therapy, ED revisits, and hospital readmissions were assessed using the Fisher exact test. Due to the small number of events, we were unable to evaluate these associations in models adjusted for potential confounders.
All analyses were performed with SAS version 9.3 (SAS Institute, Cary, NC), and P values <0.05 were considered significant.
RESULTS
Of the 220 unique patients included, 122 (55%) were male. The median age was 2.9 years (IQR: 1.36.3 years). Empiric guideline‐recommended therapy was prescribed to 168 (76%) patients (Table 1). Aminopenicillins were the most common guideline‐recommended therapy, accounting for 84% of guideline‐recommended antibiotics. An additional 10% of patients received the guideline‐recommended combination therapy with an aminopenicillin and a macrolide. Nonguideline‐recommended therapy included third‐generation cephalosporin antibiotics (54%) and macrolide monotherapy (33%).
Those who received empiric guideline‐recommended antibiotic therapy were similar to those who received nonguideline‐recommended therapy with respect to sex, Emergency Severity Index, physical exam findings on presentation, oxygen requirement in the first 24 hours, abnormal laboratory findings, presence of effusion on chest radiograph, and need for additional imaging (Table 1). However, patients in the guideline‐recommended therapy group were significantly younger (median 2.5 years vs 5.6 years, P0.01), more likely to have elevated respiratory rate on presentation (60.2% vs 44.4%, P=0.04), and more likely to have an infiltrate on chest radiograph (86.3% vs 73.6%, P=0.03) (Table 1). Patients who received nonguideline‐recommended macrolide monotherapy had a median age of 7.4 years (IQR: 5.89.8 years).
Median hospital LOS for the total cohort was 1.3 days (IQR: 0.91.9 days) (Table 2). There were no differences in LOS between patients who received and did not receive guideline‐recommended therapy in the unadjusted or the adjusted model (Table 3).
| Outcome | Guideline Therapy, n=166 | Nonguideline Therapy, n=54 | P Value |
|---|---|---|---|
| |||
| Length of stay, d, median (IQR) | 1.3 (0.91.9) | 1.3 (0.92.0) | 0.74 |
| Total costs, median, (IQR) | $4118 ($2,647$6,004) | $4045 ($2,829$6,200) | 0.44 |
| Pharmacy total costs, median, (IQR) | $84 ($40$179) | $106 ($58$217) | 0.12 |
| Broadened therapy, no. (%) | 10 (6.0%) | 4 (7.4%) | 0.75 |
| Emergency department revisit, no. (%) | 7 (4.2%) | 2 (3.7%) | 1.00 |
| Readmission, no. (%) | 1 (0.6%) | 1 (1.9%) | 0.43 |
| Outcome | Unadjusted Coefficient (95% CI) | Adjusted Coefficient (95% CI) | Adjusted % Change in Outcome (95% CI)* |
|---|---|---|---|
| |||
| Length of stay | 0.06 (0.27 to 0.15) | 0.06 (0.25 to 0.12) | 5.8 (22.1 to 12.8) |
| Total costs | 0.18 (0.40 to 0.04) | 0.11 (0.32 to 0.09) | 10.9 (27.4 to 9.4) |
| Pharmacy total costs | 0.44 (0.46 to 0.02) | 0.16 (0.57 to 0.24) | 14.8 (43.4 to 27.1) |
Median total costs of the index hospitalization for the total cohort were $4097 (IQR: $2657$6054), with median inpatient pharmacy costs of $92 (IQR: $40$183) (Table 2). There were no differences in total or inpatient pharmacy costs for patients who received guideline‐recommended therapy compared with those who did not in unadjusted or adjusted analyses. Fourteen patients (6.4%) had antibiotic therapy broadened during hospitalization, 10 were initially prescribed guideline‐recommended therapy, and 4 were initially prescribed nonguideline‐recommended therapy (Table 4).
| Initial Therapy | Reasons for Antibiotic Change Identified From Chart Review |
|---|---|
| Guideline=10 | Ampicillin to ceftriaxone: |
| 1 patient with clinical worsening | |
| 1 patient with coincident urinary tract infection due to resistant organism | |
| 4 patients without evidence of clinical worsening or documentation of rationale | |
| Addition of a macrolide: | |
| 3 patients without evidence of clinical worsening or documentation of rationale | |
| Addition of clindamycin: | |
| 1 patient with clinical worsening | |
| Nonguideline=4 | Ceftriaxone to clindamycin: |
| 1 patient with clinical worsening | |
| Addition of a macrolide: | |
| 1 patient with clinical worsening | |
| 1 patients without evidence of clinical worsening or documentation of rationale | |
| Addition of clindamycin: | |
| 1 patient with clinical worsening |
Of the 9 pneumonia‐related ED revisits within 30 days of discharge, 7 occurred in patients prescribed empiric guideline‐recommended therapy (Table 5). No ED revisit resulted in hospital readmission or antibiotic change related to pneumonia. Two ED revisits resulted in new antibiotic prescriptions for diagnoses other than pneumonia.
| Revisit | Initial Therapy | Day Postdischarge | Clinical Symptoms at Return Visit | Clinical Diagnosis | Antibiotic Prescription |
|---|---|---|---|---|---|
| |||||
| ED | Guideline | 3 | Poor oral intake and fever | Pneumonia | Continued prior antibiotic |
| ED | Guideline | 8 | Recurrent cough and fever | Resolving pneumonia | Continued prior antibiotic |
| ED | Guideline | 13 | Follow‐up | Resolved pneumonia | No further antibiotic |
| ED | Guideline | 16 | Increased work of breathing | Reactive airway disease | No antibiotic |
| ED | Guideline | 20 | Persistent cough | Viral illness | No antibiotic |
| ED | Guideline | 22 | Recurrent cough and congestion | Sinusitis | Augmentin |
| ED | Guideline | 26 | Increased work of breathing | Reactive airway disease | No antibiotic |
| ED | Nonguideline | 16 | Recurrent fever | Acute otitis media | Amoxicillin |
| ED | Nonguideline | 20 | Recurrent cough and fever | Viral illness | No antibiotic |
| Admission | Guideline | 3 | Increased work of breathing | Pneumonia | IV ampicillin |
| Admission | Nonguideline | 9 | Refusal to take oral clindamycin | Pneumonia | IV clindamycin |
Two patients were readmitted for a pneumonia‐related illness within 30 days of discharge; 1 had received guideline‐recommended therapy (Table 5). Both patients were directly admitted to the inpatient ward without an associated ED visit. Antibiotic class was not changed for either patient upon readmission, despite the decision to convert to intravenous form.
DISCUSSION
In this retrospective cohort study, patients who received empiric guideline‐recommended antibiotic therapy on admission for CAP had no difference in LOS, total cost of hospitalization, or inpatient pharmacy costs compared with those who received therapy that varied from guideline recommendations. Our study suggests that prescribing narrow‐spectrum therapy and, in some circumstances, combination therapy, as recommended by the 2011 PIDS/IDSA pneumonia guideline, did not result in negative unintended consequences.
In our study, children receiving guideline‐recommended therapy were younger, more likely to have elevated respiratory rate on presentation, and more likely to have an infiltrate on chest radiograph. We hypothesize the age difference is a reflection of common use of nonguideline macrolide monotherapy in the older, school‐age child, as macrolides are commonly used for coverage of Mycoplasma pneumonia in older children with CAP.[15] Children receiving macrolide monotherapy were older than those receiving guideline‐recommended therapy (median age of 7.4 years and 2.5 years, respectively). We also hypothesize that some providers may prescribe macrolide monotherapy to children deemed less ill than expected for CAP (eg, normal percutaneous oxygen saturation). This hypothesis is supported by the finding that 60% of patients who had a normal respiratory rate and received nonguideline therapy were prescribed macrolide monotherapy. We did control for the characteristics that varied between the two treatment groups in our models to eliminate potential confounding.
One prior study evaluated the effects of guideline implementation in CAP. In evaluation of a clinical practice guideline that recommended ampicillin as first‐line therapy for CAP, no significant difference was found following guideline introduction in the number of treatment failures (defined as the need to broaden therapy or development of complicated pneumonia within 48 hours or 30‐day inpatient readmission).[16] Our study builds on these findings by directly comparing outcomes between recipients of guideline and nonguideline therapy, which was not done in the prestudy or poststudy design of prior work.[16] We believe that classifying patients based on empiric therapy received rather than timing of guideline introduction thoroughly examines the effect of following guideline recommendations. Additionally, outcomes other than treatment failures were examined in our study including LOS, costs, and ED revisits.
Our results are similar to other observational studies that compared narrow‐ and broad‐spectrum antibiotics for children hospitalized with CAP. Using administrative data, Williams et al. found no significant difference in LOS or cost between narrow‐ and broad‐spectrum intravenous antibiotic recipients ages 6 months to 18 years at 43 children's hospitals.[17] Queen et al. compared narrow‐ and broad‐spectrum antibiotic therapy for children ages 2 months to 18 years at 4 children's hospitals.[18] Differences in average daily cost were not significant, but children who received narrow‐spectrum antibiotics had a significantly shorter LOS. Finally, an observational study of 319 Israeli children <2 years of age found no significant difference in duration of oxygen requirement, LOS, or need for change in antibiotic therapy between the 66 children prescribed aminopenicillins and the 253 children prescribed cefuroxime.[19] These studies suggest that prescribing narrow‐spectrum antimicrobial therapy, as per the guideline recommendations, results in similar outcomes to broad‐spectrum antimicrobial therapy.
Our study adds to prior studies that compared narrow‐ and broad‐spectrum therapy by comparing outcomes associated with guideline‐recommended therapy to nonguideline therapy. We considered antibiotic therapy as guideline recommended if appropriately chosen per the guideline, not just by simple classification of antibiotic. For example, the use of a cephalosporin in a patient with aminopenicillin allergy was considered guideline‐recommended therapy. We chose to classify the exposure of empiric antibiotic therapy in this manner to reflect true clinical application of the guideline, as not all children are able to receive aminopenicillins. Additionally, as our study stemmed from our prior improvement work aimed at increasing guideline adherent therapy,[7] we have a higher frequency of narrow‐spectrum antibiotic use than prior studies. In our study, almost two‐thirds of patients received narrow‐spectrum therapy, whereas narrow‐spectrum use in prior studies ranged from 10% to 33%.[17, 18, 19] Finally, we were able to confirm the diagnosis of pneumonia via medical record review and to adjust for severity of illness using clinical variables including vital signs, physical exam findings, and laboratory and radiologic study results.
This study must be interpreted in the context of several limitations. First, our study population was defined through discharge diagnosis codes, and therefore dependent on the accuracy of coding. However, we minimized potential for misclassification through use of a previously validated approach to identify patients with CAP and through medical record review to confirm the diagnosis. Second, we may be unable to detect very small differences in outcomes given limited power, specifically for outcomes of LOS, ED revisits, hospital readmissions, and need to broaden antibiotic therapy. Third, residual confounding may be present. Although we controlled for many clinical variables in our analyses, antibiotic prescribing practices may be influenced by unmeasured factors. The potential of system level confounding is mitigated by standardized care for patients with CAP at our institution. Prior system‐level changes using quality‐improvement science have resulted in a high level of adherence with guideline‐recommended antimicrobials as well as standardized medical discharge criteria.[7, 20] Additionally, nonmedical factors may influence LOS, limiting its use as an outcome measure. This limitation was minimized in our study by standardizing medical discharge criteria. Prior work at our institution demonstrated that the majority of patients, including those with CAP, were discharged within 2 hours of meeting medical discharge criteria.[20] Fourth, discharged patients who experienced adverse outcomes may have received care at a nearby adult emergency department or at their pediatrician's office. Although these events would not have been captured in our electronic health record, serious complications due to treatment failure (eg, empyema) would require hospitalization. As our hospital is the only children's hospital in the Greater Cincinnati metropolitan area, these patents would receive care at our institution. Therefore, any misclassification of revisits or readmissions is likely to be minimal. Finally, study patients were admitted to a large tertiary academic children's hospital, warranting further investigation to determine if these findings can be translated to smaller community settings.
In conclusion, receipt of guideline‐recommended antibiotic therapy for patients hospitalized with CAP was not associated with increases in LOS, total costs of hospitalization, or inpatient pharmacy costs. Our findings highlight the importance of changing antibiotic prescribing practices to reflect guideline recommendations, as there was no evidence of negative unintended consequences with our local practice change.
Acknowledgments
Disclosures: Dr. Ambroggio and Dr. Thomson were supported by funds from the NRSA T32HP10027‐14. Dr. Shah was supported by funds from NIAID K01A173729. The authors report no conflicts of interest.
- , , , , , . Ambulatory visit rates and antibiotic prescribing for children with pneumonia, 1994–2007. Pediatrics. 2011;127(3):411–418.
- , , , , . National hospitalization trends for pediatric pneumonia and associated complications. Pediatrics. 2010;126(2):204–213.
- , , , et al. Prioritization of comparative effectiveness research topics in hospital pediatrics. Arch Pediatr Adolesc Med. 2012;166(12):1155–1164.
- , , , et al. The management of community‐acquired pneumonia in infants and children older than 3 months of age: clinical practice guidelines by the Pediatric Infectious Diseases Society and the Infectious Diseases Society of America. Clin Infect Dis. 2011;53(7):e25–e76.
- , , , et al. Variability in processes of care and outcomes among children hospitalized with community‐acquired pneumonia. Pediatr Infect Dis J. 2012;31(10):1036–1041.
- , , , et al. Impact of IDSA/PIDS guidelines on treatment of community‐acquired pneumonia in hospitalized children. Clin Infect Dis. 2014;58(6):834–838.
- , , , et al. Quality improvement methods increase appropriate antibiotic prescribing for childhood pneumonia. Pediatrics. 2013;131(5):e1623–e1631.
- , , , et al. Identifying pediatric community‐acquired pneumonia hospitalizations: accuracy of administrative billing codes. JAMA Pediatr. 2013;167(9):851–858.
- , , , , , . Deaths attributed to pediatric complex chronic conditions: national trends and implications for supportive care services. Pediatrics. 2001;107(6):E99.
- Centers for Medicare 2011.
- , , , et al. Pediatric advanced life support: 2010 American Heart Association guidelines for cardiopulmonary resuscitation and emergency cardiovascular care. Pediatrics. 2010;126(5):e1361–e1399.
- , , , , . Prospective evaluation of a pediatric inpatient early warning scoring system. J Spec Pediatr Nurs. 2009;14(2):79–85.
- , , , . Regression Methods in Biostatistics: Linear, Logistic, Survival, and Repeated Measures Models. New York, NY: Springer; 2005.
- , , , , . Treatment of mycoplasma pneumonia: a systematic review. Pediatrics. 2014;133(6):1081–1090.
- , , , , , . Impact of a guideline on management of children hospitalized with community‐acquired pneumonia. Pediatrics. 2012;129(3):e597–e604.
- , , , et al. Narrow vs broad‐spectrum antimicrobial therapy for children hospitalized with pneumonia. Pediatrics. 2013;132(5):e1141–e1148.
- , , , et al. Comparative effectiveness of empiric antibiotics for community‐acquired pneumonia. Pediatrics. 2014;133(1):e23–e29.
- , , , et al. Antibiotic treatment of children with community‐acquired pneumonia: comparison of penicillin or ampicillin versus cefuroxime. Pediatr Pulmonol. 2013;48(1):52–58.
- , , , et al. Using quality improvement to optimise paediatric discharge efficiency. BMJ Qual Saf. 2014;23(5):428–436.
Community‐acquired pneumonia (CAP) is a common and serious infection in children. With more than 150,000 children requiring hospitalization annually, CAP is the fifth most prevalent and the second most costly diagnosis of all pediatric hospitalizations in the United States.[1, 2, 3]
In August 2011, the Pediatric Infectious Diseases Society (PIDS) and the Infectious Diseases Society of America (IDSA) published an evidence‐based guideline for the management of CAP in children. This guideline recommended that fully immunized children without underlying complications who require hospitalization receive an aminopenicillin as first‐line antibiotic therapy.[4] Additionally, the guideline recommends empirically adding a macrolide to an aminopenicillin when atypical pneumonia is a diagnostic consideration.
This recommendation was a substantial departure from practice for hospitals nationwide, as a multicenter study of children's hospitals (20052010) demonstrated that <10% of patients diagnosed with CAP received aminopenicillins as empiric therapy.[5] Since publication of the PIDS/IDSA guidelines, the use of aminopenicillins has increased significantly across institutions, but the majority of hospitalized patients still receive broad‐spectrum cephalosporin therapy for CAP.[6]
At baseline, 30% of patients hospitalized with CAP received guideline‐recommended antibiotic therapy at our institution. Through the use of quality‐improvement methods, the proportion of patients receiving guideline‐recommended therapy increased to 100%.[7] The objective of this study was to ensure that there were not unintended negative consequences to guideline implementation. Specifically, we sought to identify changes in length of stay (LOS), hospital costs, and treatment failures associated with use of guideline‐recommended antibiotic therapy for children hospitalized with uncomplicated CAP.
METHODS
Study Design and Study Population
This retrospective cohort study included children age 3 months to 18 years, hospitalized with CAP, between May 2, 2011 and July 30, 2012, at Cincinnati Children's Hospital Medical Center (CCHMC), a 512‐bed free‐standing children's hospital. The CCHMC Institutional Review Board approved this study with a waiver of informed consent.
Patients were eligible for inclusion if they were admitted to the hospital for inpatient or observation level care with a primary or secondary International Classification of Disease, 9th Revision discharge diagnosis code of pneumonia (480.02, 480.89, 481, 482.0, 482.30‐2, 482.41‐2, 482.83, 482.8990, 483.8, 484.3, 485, 486, 487.0) or effusion/empyema (510.0, 510.9, 511.01, 511.89, 513).[8] Patients with complex chronic conditions[9] were excluded. Medical records of eligible patients (n=260) were reviewed by 2 members of the study team to ensure that patients fell into the purview of the guideline. Patients who did not receive antibiotics (n=11) or for whom there was documented concern for aspiration (n=1) were excluded. Additionally, patients with immunodeficiency (n=1) or who had not received age‐appropriate vaccinations (n=2), and patients who required intensive care unit admission on presentation (n=17) or who had a complicated pneumonia, defined by presence of moderate or large pleural effusion at time of admission (n=8), were also excluded.[7] Finally, for patients with multiple pneumonia admissions, only the index visit was included; subsequent visits occurring within 30 days of discharge were considered readmissions.
Treatment Measure
The primary exposure of interest was empiric antibiotic therapy upon hospital admission. Antibiotic therapy was classified as guideline recommended or nonguideline recommended. Guideline‐recommended therapy was defined as follows:
- For children without drug allergies: ampicillin (200 mg/kg/day intravenously) or amoxicillin (90 mg/kg/day orally);
- For children with penicillin allergy: ceftriaxone (50100 mg/kg/day intravenously or intramuscularly) or cefdinir (14 mg/kg/day orally);
- For children with penicillin and cephalosporin allergy: clindamycin (40 mg/kg/day orally or intravenously); and
- Or azithromycin (10 mg/kg/day orally or intravenously on day 1) in combination with antibiotic category 1 or 2 or 3 above.
Outcome Measures
The primary outcomes examined were hospital LOS, total cost of hospitalization, and inpatient pharmacy costs. LOS was measured in hours and defined as the difference in time between departure from and arrival to the inpatient unit. Total cost of index hospitalization included both direct and indirect costs, obtained from the Centers for Medicare & Medicaid Services' Relative Value Units data for Current Procedural Terminology codes.[10]
Secondary outcomes included broadening of antibiotic therapy during the hospital course, pneumonia‐related emergency department (ED) revisits within 30 days, and pneumonia‐related inpatient readmissions within 30 days. Broadening of antibiotic therapy was defined as addition of a second antibiotic (eg, adding azithromycin on day 3 of hospitalization) or change in empiric antibiotic to a class with broader antimicrobial activity (eg, ampicillin to ceftriaxone) at any time during hospitalization. As our study population included only patients with uncomplicated pneumonia at the time of admission, this outcome was used to capture possible treatment failure. ED revisits and inpatient readmissions were reviewed by 3 investigators to identify pneumonia‐related visits. To encompass all possible treatment failures, all respiratory‐related complaints (eg, wheezing, respiratory distress) were considered as pneumonia‐related. Disagreements were resolved by group discussion.
Covariates
Severity of illness on presentation was evaluated using the Emergency Severity Index version 4,[11] abnormal vital signs on presentation (as defined by Pediatric Advanced Life Support age‐specific criteria[12]), and need for oxygen in the first 24 hours of hospitalization. Supplemental oxygen is administered for saturations <91% per protocol at our institution. The patient's highest Pediatric Early Warning Scale score[13] during hospitalization was used as a proxy for disease severity. Exam findings on presentation (eg, increased respiratory effort, rales, wheezing) were determined through chart review. Laboratory tests and radiologic imaging variables included complete blood cell count, blood culture, chest radiograph, chest ultrasound, and chest computed tomography. Abnormal white blood cell count was defined as <5000 or >15,000 cells/mL, the defined reference range for the CCHMC clinical laboratory.
Data Analysis
Continuous variables were described using median and interquartile range (IQR) and compared across groups using Wilcoxon rank sum test due to non‐normal distributions. Categorical variables were described by counts and frequencies and compared using the 2 test.
Multivariable linear regression analysis was performed to assess the independent effect of receipt of empiric guideline‐recommended antibiotic therapy on outcomes of LOS and costs while adjusting for covariates. As LOS and costs were non‐normally distributed, we logarithmically transformed these values to use as the dependent variables in our models. The resulting coefficients were back‐transformed to reflect the percent change in LOS and costs incurred between subjects who received empiric guideline therapy compared with those who did not.[14] Covariates were chosen a priori due to their clinical and biological relevance to the outcomes of LOS (eg, wheezing on presentation and need for supplemental oxygen), total cost of hospitalization (eg, LOS and need for repeat imaging), and inpatient pharmacy costs (eg, LOS and wheezing on presentation) (Table 1).
| Characteristic | Overall Cohort, n=220 | Guideline Therapy, n=166 | Nonguideline Therapy, n=54 | P Value |
|---|---|---|---|---|
| ||||
| Age, y, median (IQR) | 2.9 (1.36.3) | 2.5 (1.35.2) | 5.6 (2.38.8) | <0.01* |
| Male, no. (%) | 122 (55.5%) | 89 (53.6%) | 33 (61.1%) | 0.34 |
| Emergency Severity Index, no. (%) | 0.11 | |||
| 2 | 90 (40.9%) | 73 (44.0%) | 17 (31.5%) | |
| 3 | 116 (52.7%) | 85 (51.2%) | 31 (57.4%) | |
| 4 | 14 (6.4%) | 8 (4.8%) | 6 (11.1%) | |
| Abnormal vital signs on presentation, no. (%) | ||||
| Fever | 99 (45.0%) | 80 (48.2%) | 19 (35.2%) | 0.10 |
| Tachycardia | 100 (45.5%) | 76 (45.8%) | 24 (44.4%) | 0.86 |
| Tachypnea | 124 (56.4%) | 100 (60.2%) | 24 (44.4%) | 0.04* |
| Hypotension | 0 | 0 | 0 | |
| Hypoxia | 27 (12.3%) | 24 (14.5%) | 3 (5.6%) | 0.08 |
| Physical exam on presentation, no. (%) | ||||
| Increased respiratory effort | 146 (66.4%) | 111 (66.9%) | 35 (64.8%) | 0.78 |
| Distressed | 110 (50.0%) | 86 (51.8%) | 24 (44.4%) | 0.35 |
| Retraction | 103 (46.8%) | 81 (48.8%) | 22 (40.7%) | 0.30 |
| Grunting | 17 (7.7%) | 14 (8.4%) | 3 (5.6%) | 0.49 |
| Nasal flaring | 19 (8.6%) | 17 (10.2%) | 2 (3.7%) | 0.14 |
| Rales | 135 (61.4%) | 99 (59.6%) | 36 (66.7%) | 0.36 |
| Wheeze | 91 (41.4%) | 66 (39.8%) | 25 (46.3%) | 0.40 |
| Decreased breath sounds | 89 (40.5%) | 65 (39.2%) | 24 (44.4%) | 0.49 |
| Dehydration | 21 (9.6%) | 13 (7.8%) | 8 (14.8%) | 0.13 |
| PEWS 5 during admission, no. (%) | 43 (19.6%) | 34 (20.5%) | 9 (16.7%) | 0.54 |
| Oxygen requirement in first 24 hours, no. (%) | 114 (51.8%) | 90 (53.6%) | 24 (46.2%) | 0.35 |
| Complete blood count obtained, no. (%) | 99 (45.0%) | 72 (43.4%) | 27 (50.0%) | 0.40 |
| Abnormal white blood cell count | 35 (35.7%) | 23 (32.4%) | 12 (44.4%) | 0.27 |
| Blood culture obtained, no. (%) | 104 (47.3%) | 80 (48.2%) | 24 (44.4%) | 0.63 |
| Positive | 2 (1.9%) | 1 (1.3%) | 1 (4.2%) | 0.36 |
| Chest radiograph available, no. (%) | 214 (97.3%) | 161 (97.0%) | 53 (98.2%) | 0.65 |
| Infiltrate | 178 (83.2%) | 139 (86.3%) | 39 (73.6%) | 0.03* |
| Bilateral | 29 (16.3%) | 20 (14.4%) | 9 (23.1%) | 0.19 |
| Multilobar | 46 (25.8%) | 33 (23.7%) | 13 (33.3%) | 0.23 |
| Effusion | 24 (11.2%) | 16 (9.9%) | 8 (15.1%) | 0.30 |
| Additional imaging, no. (%) | ||||
| Repeat chest radiograph | 26 (11.8%) | 17 (10.2%) | 9 (16.7%) | 0.20 |
| Chest ultrasound | 4 (1.8%) | 3 (1.8%) | 1 (1.9%) | 0.98 |
| Chest CT | 2 (0.9%) | 1 (0.6%) | 1 (1.9%) | 0.40 |
| Antibiotic, no. (%) | <0.01* | |||
| Aminopenicillin | 140 (63.6%) | 140 (84.3%) | 0 (0%) | |
| Third‐generation cephalosporin | 37 (16.8%) | 8 (4.8%) | 29 (53.7%) | |
| Macrolide monotherapy | 18 (8.2%) | 0 (0%) | 18 (33.3%) | |
| Clindamycin | 2 (0.9%) | 1 (0.6%) | 1 (1.9%) | |
| Levofloxacin | 1 (0.5%) | 0 (0%) | 1 (1.9%) | |
| Aminopenicillin+macrolide | 16 (7.3%) | 16 (9.6%) | 0 (0%) | |
| Cephalosporin+macrolide | 6 (2.7%) | 1 (0.6%) | 5 (9.3%) | |
Secondary outcomes of broadened antibiotic therapy, ED revisits, and hospital readmissions were assessed using the Fisher exact test. Due to the small number of events, we were unable to evaluate these associations in models adjusted for potential confounders.
All analyses were performed with SAS version 9.3 (SAS Institute, Cary, NC), and P values <0.05 were considered significant.
RESULTS
Of the 220 unique patients included, 122 (55%) were male. The median age was 2.9 years (IQR: 1.36.3 years). Empiric guideline‐recommended therapy was prescribed to 168 (76%) patients (Table 1). Aminopenicillins were the most common guideline‐recommended therapy, accounting for 84% of guideline‐recommended antibiotics. An additional 10% of patients received the guideline‐recommended combination therapy with an aminopenicillin and a macrolide. Nonguideline‐recommended therapy included third‐generation cephalosporin antibiotics (54%) and macrolide monotherapy (33%).
Those who received empiric guideline‐recommended antibiotic therapy were similar to those who received nonguideline‐recommended therapy with respect to sex, Emergency Severity Index, physical exam findings on presentation, oxygen requirement in the first 24 hours, abnormal laboratory findings, presence of effusion on chest radiograph, and need for additional imaging (Table 1). However, patients in the guideline‐recommended therapy group were significantly younger (median 2.5 years vs 5.6 years, P0.01), more likely to have elevated respiratory rate on presentation (60.2% vs 44.4%, P=0.04), and more likely to have an infiltrate on chest radiograph (86.3% vs 73.6%, P=0.03) (Table 1). Patients who received nonguideline‐recommended macrolide monotherapy had a median age of 7.4 years (IQR: 5.89.8 years).
Median hospital LOS for the total cohort was 1.3 days (IQR: 0.91.9 days) (Table 2). There were no differences in LOS between patients who received and did not receive guideline‐recommended therapy in the unadjusted or the adjusted model (Table 3).
| Outcome | Guideline Therapy, n=166 | Nonguideline Therapy, n=54 | P Value |
|---|---|---|---|
| |||
| Length of stay, d, median (IQR) | 1.3 (0.91.9) | 1.3 (0.92.0) | 0.74 |
| Total costs, median, (IQR) | $4118 ($2,647$6,004) | $4045 ($2,829$6,200) | 0.44 |
| Pharmacy total costs, median, (IQR) | $84 ($40$179) | $106 ($58$217) | 0.12 |
| Broadened therapy, no. (%) | 10 (6.0%) | 4 (7.4%) | 0.75 |
| Emergency department revisit, no. (%) | 7 (4.2%) | 2 (3.7%) | 1.00 |
| Readmission, no. (%) | 1 (0.6%) | 1 (1.9%) | 0.43 |
| Outcome | Unadjusted Coefficient (95% CI) | Adjusted Coefficient (95% CI) | Adjusted % Change in Outcome (95% CI)* |
|---|---|---|---|
| |||
| Length of stay | 0.06 (0.27 to 0.15) | 0.06 (0.25 to 0.12) | 5.8 (22.1 to 12.8) |
| Total costs | 0.18 (0.40 to 0.04) | 0.11 (0.32 to 0.09) | 10.9 (27.4 to 9.4) |
| Pharmacy total costs | 0.44 (0.46 to 0.02) | 0.16 (0.57 to 0.24) | 14.8 (43.4 to 27.1) |
Median total costs of the index hospitalization for the total cohort were $4097 (IQR: $2657$6054), with median inpatient pharmacy costs of $92 (IQR: $40$183) (Table 2). There were no differences in total or inpatient pharmacy costs for patients who received guideline‐recommended therapy compared with those who did not in unadjusted or adjusted analyses. Fourteen patients (6.4%) had antibiotic therapy broadened during hospitalization, 10 were initially prescribed guideline‐recommended therapy, and 4 were initially prescribed nonguideline‐recommended therapy (Table 4).
| Initial Therapy | Reasons for Antibiotic Change Identified From Chart Review |
|---|---|
| Guideline=10 | Ampicillin to ceftriaxone: |
| 1 patient with clinical worsening | |
| 1 patient with coincident urinary tract infection due to resistant organism | |
| 4 patients without evidence of clinical worsening or documentation of rationale | |
| Addition of a macrolide: | |
| 3 patients without evidence of clinical worsening or documentation of rationale | |
| Addition of clindamycin: | |
| 1 patient with clinical worsening | |
| Nonguideline=4 | Ceftriaxone to clindamycin: |
| 1 patient with clinical worsening | |
| Addition of a macrolide: | |
| 1 patient with clinical worsening | |
| 1 patients without evidence of clinical worsening or documentation of rationale | |
| Addition of clindamycin: | |
| 1 patient with clinical worsening |
Of the 9 pneumonia‐related ED revisits within 30 days of discharge, 7 occurred in patients prescribed empiric guideline‐recommended therapy (Table 5). No ED revisit resulted in hospital readmission or antibiotic change related to pneumonia. Two ED revisits resulted in new antibiotic prescriptions for diagnoses other than pneumonia.
| Revisit | Initial Therapy | Day Postdischarge | Clinical Symptoms at Return Visit | Clinical Diagnosis | Antibiotic Prescription |
|---|---|---|---|---|---|
| |||||
| ED | Guideline | 3 | Poor oral intake and fever | Pneumonia | Continued prior antibiotic |
| ED | Guideline | 8 | Recurrent cough and fever | Resolving pneumonia | Continued prior antibiotic |
| ED | Guideline | 13 | Follow‐up | Resolved pneumonia | No further antibiotic |
| ED | Guideline | 16 | Increased work of breathing | Reactive airway disease | No antibiotic |
| ED | Guideline | 20 | Persistent cough | Viral illness | No antibiotic |
| ED | Guideline | 22 | Recurrent cough and congestion | Sinusitis | Augmentin |
| ED | Guideline | 26 | Increased work of breathing | Reactive airway disease | No antibiotic |
| ED | Nonguideline | 16 | Recurrent fever | Acute otitis media | Amoxicillin |
| ED | Nonguideline | 20 | Recurrent cough and fever | Viral illness | No antibiotic |
| Admission | Guideline | 3 | Increased work of breathing | Pneumonia | IV ampicillin |
| Admission | Nonguideline | 9 | Refusal to take oral clindamycin | Pneumonia | IV clindamycin |
Two patients were readmitted for a pneumonia‐related illness within 30 days of discharge; 1 had received guideline‐recommended therapy (Table 5). Both patients were directly admitted to the inpatient ward without an associated ED visit. Antibiotic class was not changed for either patient upon readmission, despite the decision to convert to intravenous form.
DISCUSSION
In this retrospective cohort study, patients who received empiric guideline‐recommended antibiotic therapy on admission for CAP had no difference in LOS, total cost of hospitalization, or inpatient pharmacy costs compared with those who received therapy that varied from guideline recommendations. Our study suggests that prescribing narrow‐spectrum therapy and, in some circumstances, combination therapy, as recommended by the 2011 PIDS/IDSA pneumonia guideline, did not result in negative unintended consequences.
In our study, children receiving guideline‐recommended therapy were younger, more likely to have elevated respiratory rate on presentation, and more likely to have an infiltrate on chest radiograph. We hypothesize the age difference is a reflection of common use of nonguideline macrolide monotherapy in the older, school‐age child, as macrolides are commonly used for coverage of Mycoplasma pneumonia in older children with CAP.[15] Children receiving macrolide monotherapy were older than those receiving guideline‐recommended therapy (median age of 7.4 years and 2.5 years, respectively). We also hypothesize that some providers may prescribe macrolide monotherapy to children deemed less ill than expected for CAP (eg, normal percutaneous oxygen saturation). This hypothesis is supported by the finding that 60% of patients who had a normal respiratory rate and received nonguideline therapy were prescribed macrolide monotherapy. We did control for the characteristics that varied between the two treatment groups in our models to eliminate potential confounding.
One prior study evaluated the effects of guideline implementation in CAP. In evaluation of a clinical practice guideline that recommended ampicillin as first‐line therapy for CAP, no significant difference was found following guideline introduction in the number of treatment failures (defined as the need to broaden therapy or development of complicated pneumonia within 48 hours or 30‐day inpatient readmission).[16] Our study builds on these findings by directly comparing outcomes between recipients of guideline and nonguideline therapy, which was not done in the prestudy or poststudy design of prior work.[16] We believe that classifying patients based on empiric therapy received rather than timing of guideline introduction thoroughly examines the effect of following guideline recommendations. Additionally, outcomes other than treatment failures were examined in our study including LOS, costs, and ED revisits.
Our results are similar to other observational studies that compared narrow‐ and broad‐spectrum antibiotics for children hospitalized with CAP. Using administrative data, Williams et al. found no significant difference in LOS or cost between narrow‐ and broad‐spectrum intravenous antibiotic recipients ages 6 months to 18 years at 43 children's hospitals.[17] Queen et al. compared narrow‐ and broad‐spectrum antibiotic therapy for children ages 2 months to 18 years at 4 children's hospitals.[18] Differences in average daily cost were not significant, but children who received narrow‐spectrum antibiotics had a significantly shorter LOS. Finally, an observational study of 319 Israeli children <2 years of age found no significant difference in duration of oxygen requirement, LOS, or need for change in antibiotic therapy between the 66 children prescribed aminopenicillins and the 253 children prescribed cefuroxime.[19] These studies suggest that prescribing narrow‐spectrum antimicrobial therapy, as per the guideline recommendations, results in similar outcomes to broad‐spectrum antimicrobial therapy.
Our study adds to prior studies that compared narrow‐ and broad‐spectrum therapy by comparing outcomes associated with guideline‐recommended therapy to nonguideline therapy. We considered antibiotic therapy as guideline recommended if appropriately chosen per the guideline, not just by simple classification of antibiotic. For example, the use of a cephalosporin in a patient with aminopenicillin allergy was considered guideline‐recommended therapy. We chose to classify the exposure of empiric antibiotic therapy in this manner to reflect true clinical application of the guideline, as not all children are able to receive aminopenicillins. Additionally, as our study stemmed from our prior improvement work aimed at increasing guideline adherent therapy,[7] we have a higher frequency of narrow‐spectrum antibiotic use than prior studies. In our study, almost two‐thirds of patients received narrow‐spectrum therapy, whereas narrow‐spectrum use in prior studies ranged from 10% to 33%.[17, 18, 19] Finally, we were able to confirm the diagnosis of pneumonia via medical record review and to adjust for severity of illness using clinical variables including vital signs, physical exam findings, and laboratory and radiologic study results.
This study must be interpreted in the context of several limitations. First, our study population was defined through discharge diagnosis codes, and therefore dependent on the accuracy of coding. However, we minimized potential for misclassification through use of a previously validated approach to identify patients with CAP and through medical record review to confirm the diagnosis. Second, we may be unable to detect very small differences in outcomes given limited power, specifically for outcomes of LOS, ED revisits, hospital readmissions, and need to broaden antibiotic therapy. Third, residual confounding may be present. Although we controlled for many clinical variables in our analyses, antibiotic prescribing practices may be influenced by unmeasured factors. The potential of system level confounding is mitigated by standardized care for patients with CAP at our institution. Prior system‐level changes using quality‐improvement science have resulted in a high level of adherence with guideline‐recommended antimicrobials as well as standardized medical discharge criteria.[7, 20] Additionally, nonmedical factors may influence LOS, limiting its use as an outcome measure. This limitation was minimized in our study by standardizing medical discharge criteria. Prior work at our institution demonstrated that the majority of patients, including those with CAP, were discharged within 2 hours of meeting medical discharge criteria.[20] Fourth, discharged patients who experienced adverse outcomes may have received care at a nearby adult emergency department or at their pediatrician's office. Although these events would not have been captured in our electronic health record, serious complications due to treatment failure (eg, empyema) would require hospitalization. As our hospital is the only children's hospital in the Greater Cincinnati metropolitan area, these patents would receive care at our institution. Therefore, any misclassification of revisits or readmissions is likely to be minimal. Finally, study patients were admitted to a large tertiary academic children's hospital, warranting further investigation to determine if these findings can be translated to smaller community settings.
In conclusion, receipt of guideline‐recommended antibiotic therapy for patients hospitalized with CAP was not associated with increases in LOS, total costs of hospitalization, or inpatient pharmacy costs. Our findings highlight the importance of changing antibiotic prescribing practices to reflect guideline recommendations, as there was no evidence of negative unintended consequences with our local practice change.
Acknowledgments
Disclosures: Dr. Ambroggio and Dr. Thomson were supported by funds from the NRSA T32HP10027‐14. Dr. Shah was supported by funds from NIAID K01A173729. The authors report no conflicts of interest.
- , , , , , . Ambulatory visit rates and antibiotic prescribing for children with pneumonia, 1994–2007. Pediatrics. 2011;127(3):411–418.
- , , , , . National hospitalization trends for pediatric pneumonia and associated complications. Pediatrics. 2010;126(2):204–213.
- , , , et al. Prioritization of comparative effectiveness research topics in hospital pediatrics. Arch Pediatr Adolesc Med. 2012;166(12):1155–1164.
- , , , et al. The management of community‐acquired pneumonia in infants and children older than 3 months of age: clinical practice guidelines by the Pediatric Infectious Diseases Society and the Infectious Diseases Society of America. Clin Infect Dis. 2011;53(7):e25–e76.
- , , , et al. Variability in processes of care and outcomes among children hospitalized with community‐acquired pneumonia. Pediatr Infect Dis J. 2012;31(10):1036–1041.
- , , , et al. Impact of IDSA/PIDS guidelines on treatment of community‐acquired pneumonia in hospitalized children. Clin Infect Dis. 2014;58(6):834–838.
- , , , et al. Quality improvement methods increase appropriate antibiotic prescribing for childhood pneumonia. Pediatrics. 2013;131(5):e1623–e1631.
- , , , et al. Identifying pediatric community‐acquired pneumonia hospitalizations: accuracy of administrative billing codes. JAMA Pediatr. 2013;167(9):851–858.
- , , , , , . Deaths attributed to pediatric complex chronic conditions: national trends and implications for supportive care services. Pediatrics. 2001;107(6):E99.
- Centers for Medicare 2011.
- , , , et al. Pediatric advanced life support: 2010 American Heart Association guidelines for cardiopulmonary resuscitation and emergency cardiovascular care. Pediatrics. 2010;126(5):e1361–e1399.
- , , , , . Prospective evaluation of a pediatric inpatient early warning scoring system. J Spec Pediatr Nurs. 2009;14(2):79–85.
- , , , . Regression Methods in Biostatistics: Linear, Logistic, Survival, and Repeated Measures Models. New York, NY: Springer; 2005.
- , , , , . Treatment of mycoplasma pneumonia: a systematic review. Pediatrics. 2014;133(6):1081–1090.
- , , , , , . Impact of a guideline on management of children hospitalized with community‐acquired pneumonia. Pediatrics. 2012;129(3):e597–e604.
- , , , et al. Narrow vs broad‐spectrum antimicrobial therapy for children hospitalized with pneumonia. Pediatrics. 2013;132(5):e1141–e1148.
- , , , et al. Comparative effectiveness of empiric antibiotics for community‐acquired pneumonia. Pediatrics. 2014;133(1):e23–e29.
- , , , et al. Antibiotic treatment of children with community‐acquired pneumonia: comparison of penicillin or ampicillin versus cefuroxime. Pediatr Pulmonol. 2013;48(1):52–58.
- , , , et al. Using quality improvement to optimise paediatric discharge efficiency. BMJ Qual Saf. 2014;23(5):428–436.
© 2014 Society of Hospital Medicine
EWRS for Sepsis
There are as many as 3 million cases of severe sepsis and 750,000 resulting deaths in the United States annually.[1] Interventions such as goal‐directed resuscitation and antibiotics can reduce sepsis mortality, but their effectiveness depends on early administration. Thus, timely recognition is critical.[2, 3, 4, 5]
Despite this, early recognition in hospitalized patients can be challenging. Using chart documentation as a surrogate for provider recognition, we recently found only 20% of patients with severe sepsis admitted to our hospital from the emergency department were recognized.[6] Given these challenges, there has been increasing interest in developing automated systems to improve the timeliness of sepsis detection.[7, 8, 9, 10] Systems described in the literature have varied considerably in triggering criteria, effector responses, and study settings. Of those examining the impact of automated surveillance and response in the nonintensive care unit (ICU) acute inpatient setting, results suggest an increase in the timeliness of diagnostic and therapeutic interventions,[10] but less impact on patient outcomes.[7] Whether these results reflect inadequacies in the criteria used to identify patients (parameters or their thresholds) or an ineffective response to the alert (magnitude or timeliness) is unclear.
Given the consequences of severe sepsis in hospitalized patients, as well as the introduction of vital sign (VS) and provider data in our electronic health record (EHR), we sought to develop and implement an electronic sepsis detection and response system to improve patient outcomes. This study describes the development, validation, and impact of that system.
METHODS
Setting and Data Sources
The University of Pennsylvania Health System (UPHS) includes 3 hospitals with a capacity of over 1500 beds and 70,000 annual admissions. All hospitals use the EHR Sunrise Clinical Manager version 5.5 (Allscripts, Chicago, IL). The study period began in October 2011, when VS and provider contact information became available electronically. Data were retrieved from the Penn Data Store, which includes professionally coded data as well as clinical data from our EHRs. The study received expedited approval and a Health Insurance Portability and Accountability Act waiver from our institutional review board.
Development of the Intervention
The early warning and response system (EWRS) for sepsis was designed to monitor laboratory values and VSs in real time in our inpatient EHR to detect patients at risk for clinical deterioration and development of severe sepsis. The development team was multidisciplinary, including informaticians, physicians, nurses, and data analysts from all 3 hospitals.
To identify at‐risk patients, we used established criteria for severe sepsis, including the systemic inflammatory response syndrome criteria (temperature <36C or >38C, heart rate >90 bpm, respiratory rate >20 breaths/min or PaCO2 <32 mm Hg, and total white blood cell count <4000 or >12,000 or >10% bands) coupled with criteria suggesting organ dysfunction (cardiovascular dysfunction based on a systolic blood pressure <100 mm Hg, and hypoperfusion based on a serum lactate measure >2.2 mmol/L [the threshold for an abnormal result in our lab]).[11, 12]
To establish a threshold for triggering the system, a derivation cohort was used and defined as patients admitted between October 1, 2011 to October 31, 2011 1 to any inpatient acute care service. Those <18 years old or admitted to hospice, research, and obstetrics services were excluded. We calculated a risk score for each patient, defined as the sum of criteria met at any single time during their visit. At any given point in time, we used the most recent value for each criteria, with a look‐back period of 24 hours for VSs and 48 hours for labs. The minimum and maximum number of criteria that a patient could achieve at any single time was 0 and 6, respectively. We then categorized patients by the maximum number of criteria achieved and estimated the proportion of patients in each category who: (1) were transferred to an ICU during their hospital visit; (2) had a rapid response team (RRT) called during their visit; (3) died during their visit; (4) had a composite of 1, 2, or 3; or (5) were coded as sepsis at discharge (see Supporting Information in the online version of this article for further information). Once a threshold was chosen, we examined the time from first trigger to: (1) any ICU transfer; (2) any RRT; (3) death; or (4) a composite of 1, 2, or 3. We then estimated the screen positive rate, test characteristics, predictive values, and likelihood ratios of the specified threshold.
The efferent response arm of the EWRS included the covering provider (usually an intern), the bedside nurse, and rapid response coordinators, who were engaged from the outset in developing the operational response to the alert. This team was required to perform a bedside evaluation within 30 minutes of the alert, and enact changes in management if warranted. The rapid response coordinator was required to complete a 3‐question follow‐up assessment in the EHR asking whether all 3 team members gathered at the bedside, the most likely condition triggering the EWRS, and whether management changed (see Supporting Figure 1 in the online version of this article). To minimize the number of triggers, once a patient triggered an alert, any additional alert triggers during the same hospital stay were censored.
Implementation of the EWRS
All inpatients on noncritical care services were screened continuously. Hospice, research, and obstetrics services were excluded. If a patient met the EWRS criteria threshold, an alert was sent to the covering provider and rapid response coordinator by text page. The bedside nurses, who do not carry text‐enabled devices, were alerted by pop‐up notification in the EHR (see Supporting Figure 2 in the online version of this article). The notification was linked to a task that required nurses to verify in the EHR the VSs triggering the EWRS, and adverse trends in VSs or labs (see Supporting Figure 3 in the online version of this article).
The Preimplementation (Silent) Period and EWRS Validation
The EWRS was initially activated for a preimplementation silent period (June 6, 2012September 4, 2012) to both validate the tool and provide the baseline data to which the postimplementation period was compared. During this time, new admissions could trigger the alert, but notifications were not sent. We used admissions from the first 30 days of the preimplementation period to estimate the tool's screen positive rate, test characteristics, predictive values, and likelihood ratios.
The Postimplementation (Live) Period and Impact Analysis
The EWRS went live September 12, 2012, upon which new admissions triggering the alert would result in a notification and response. Unadjusted analyses using the [2] test for dichotomous variables and the Wilcoxon rank sum test for continuous variables compared demographics and the proportion of clinical process and outcome measures for those admitted during the silent period (June 6, 2012September 4, 2012) and a similar timeframe 1 year later when the intervention was live (June 6, 2013September 4, 2013). To be included in either of the time periods, patients had to trigger the alert during the period and be discharged within 45 days of the end of the period. The pre‐ and post‐sepsis mortality index was also examined (see the Supporting Information in the online version of this article for a detailed description of study measures). Multivariable regression models estimated the impact of the EWRS on the process and outcome measures, adjusted for differences between the patients in the preimplementation and postimplementation periods with respect to age, gender, Charlson index on admission, admitting service, hospital, and admission month. Logistic regression models examined dichotomous variables. Continuous variables were log transformed and examined using linear regression models. Cox regression models explored time to ICU transfer from trigger. Among patients with sepsis, a logistic regression model was used to compare the odds of mortality between the silent and live periods, adjusted for expected mortality, both within each hospital and across all hospitals.
Because there is a risk of providers becoming overly reliant on automated systems and overlooking those not triggering the system, we also examined the discharge disposition and mortality outcomes of those in both study periods not identified by the EWRS.
The primary analysis examined the impact of the EWRS across UPHS; we also examined the EWRS impact at each of our hospitals. Last, we performed subgroup analyses examining the EWRS impact in those assigned an International Classification of Diseases, 9th Revision code for sepsis at discharge or death. All analyses were performed using SAS version 9.3 (SAS Institute Inc., Cary, NC).
RESULTS
In the derivation cohort, 4575 patients met the inclusion criteria. The proportion of those in each category (06) achieving our outcomes of interest are described in Supporting Table 1 in the online version of this article. We defined a positive trigger as a score 4, as this threshold identified a limited number of patients (3.9% [180/4575]) with a high proportion experiencing our composite outcome (25.6% [46/180]). The proportion of patients with an EWRS score 4 and their time to event by hospital and health system is described in Supporting Table 2 in the online version of this article. Those with a score 4 were almost 4 times as likely to be transferred to the ICU, almost 7 times as likely to experience an RRT, and almost 10 times as likely to die. The screen positive, sensitivity, specificity, and positive and negative predictive values and likelihood ratios using this threshold and our composite outcome in the derivation cohort were 6%, 16%, 97%, 26%, 94%, 5.3, and 0.9, respectively, and in our validation cohort were 6%, 17%, 97%, 28%, 95%, 5.7, and 0.9, respectively.
In the preimplementation period, 3.8% of admissions (595/15,567) triggered the alert, as compared to 3.5% (545/15,526) in the postimplementation period. Demographics were similar across periods, except that in the postimplementation period patients were slightly younger and had a lower Charlson Comorbidity Index at admission (Table 1). The distribution of alerts across medicine and surgery services were similar (Table 1).
| Hospitals AC | |||
|---|---|---|---|
| Preimplementation | Postimplementation | P Value | |
| |||
| No. of encounters | 15,567 | 15,526 | |
| No. of alerts | 595 (4%) | 545 (4%) | 0.14 |
| Age, y, median (IQR) | 62.0 (48.570.5) | 59.7 (46.169.6) | 0.04 |
| Female | 298 (50%) | 274 (50%) | 0.95 |
| Race | |||
| White | 343 (58%) | 312 (57%) | 0.14 |
| Black | 207 (35%) | 171 (31%) | |
| Other | 23 (4%) | 31 (6%) | |
| Unknown | 22 (4%) | 31 (6%) | |
| Admission type | |||
| Elective | 201 (34%) | 167 (31%) | 0.40 |
| ED | 300 (50%) | 278 (51%) | |
| Transfer | 94 (16%) | 99 (18%) | |
| BMI, kg/m2, median (IQR) | 27.0 (23.032.0) | 26.0 (22.031.0) | 0.24 |
| Previous ICU admission | 137 (23%) | 127 (23%) | 0.91 |
| RRT before alert | 27 (5%) | 20 (4%) | 0.46 |
| Admission Charlson index, median (IQR) | 2.0 (1.04.0) | 2.0 (1.04.0) | 0.04 |
| Admitting service | |||
| Medicine | 398 (67%) | 364 (67%) | 0.18 |
| Surgery | 173 (29%) | 169 (31%) | |
| Other | 24 (4%) | 12 (2%) | |
| Service where alert fired | |||
| Medicine | 391 (66%) | 365 (67%) | 0.18 |
| Surgery | 175 (29%) | 164 (30%) | |
| Other | 29 (5%) | 15 (3%) | |
In our postimplementation period, 99% of coordinator pages and over three‐fourths of provider notifications were sent successfully. Almost three‐fourths of nurses reviewed the initial alert notification, and over 99% completed the electronic data verification and adverse trend review, with over half documenting adverse trends. Ninety‐five percent of the time the coordinators completed the follow‐up assessment. Over 90% of the time, the entire team evaluated the patient at bedside within 30 minutes. Almost half of the time, the team thought the patient had no critical illness. Over a third of the time, they thought the patient had sepsis, but reported over 90% of the time that they were aware of the diagnosis prior to the alert. (Supporting Table 3 in the online version of this article includes more details about the responses to the electronic notifications and follow‐up assessments.)
In unadjusted and adjusted analyses, ordering of antibiotics, intravenous fluid boluses, and lactate and blood cultures within 3 hours of the trigger increased significantly, as did ordering of blood products, chest radiographs, and cardiac monitoring within 6 hours of the trigger (Tables 2 and 3).
| Hospitals AC | |||
|---|---|---|---|
| Preimplementation | Postimplementation | P Value | |
| |||
| No. of alerts | 595 | 545 | |
| 500 mL IV bolus order <3 h after alert | 92 (15%) | 142 (26%) | <0.01 |
| IV/PO antibiotic order <3 h after alert | 75 (13%) | 123 (23%) | <0.01 |
| IV/PO sepsis antibiotic order <3 h after alert | 61 (10%) | 85 (16%) | <0.01 |
| Lactic acid order <3 h after alert | 57 (10%) | 128 (23%) | <0.01 |
| Blood culture order <3 h after alert | 68 (11%) | 99 (18%) | <0.01 |
| Blood gas order <6 h after alert | 53 (9%) | 59 (11%) | 0.28 |
| CBC or BMP <6 h after alert | 247 (42%) | 219 (40%) | 0.65 |
| Vasopressor <6 h after alert | 17 (3%) | 21 (4%) | 0.35 |
| Bronchodilator administration <6 h after alert | 71 (12%) | 64 (12%) | 0.92 |
| RBC, plasma, or platelet transfusion order <6 h after alert | 31 (5%) | 52 (10%) | <0.01 |
| Naloxone order <6 h after alert | 0 (0%) | 1 (0%) | 0.30 |
| AV node blocker order <6 h after alert | 35 (6%) | 35 (6%) | 0.70 |
| Loop diuretic order <6 h after alert | 35 (6%) | 28 (5%) | 0.58 |
| CXR <6 h after alert | 92 (15%) | 113 (21%) | 0.02 |
| CT head, chest, or ABD <6 h after alert | 29 (5%) | 34 (6%) | 0.31 |
| Cardiac monitoring (ECG or telemetry) <6 h after alert | 70 (12%) | 90 (17%) | 0.02 |
| All Alerted Patients | Discharged With Sepsis Code* | |||
|---|---|---|---|---|
| Unadjusted Odds Ratio | Adjusted Odds Ratio | Unadjusted Odds Ratio | Adjusted Odds Ratio | |
| ||||
| 500 mL IV bolus order <3 h after alert | 1.93 (1.442.58) | 1.93 (1.432.61) | 1.64 (1.112.43) | 1.65 (1.102.47) |
| IV/PO antibiotic order <3 h after alert | 2.02 (1.482.77) | 2.02 (1.462.78) | 1.99 (1.323.00) | 2.02 (1.323.09) |
| IV/PO sepsis antibiotic order <3 h after alert | 1.62 (1.142.30) | 1.57 (1.102.25) | 1.63 (1.052.53) | 1.65 (1.052.58) |
| Lactic acid order <3 h after alert | 2.90 (2.074.06) | 3.11 (2.194.41) | 2.41 (1.583.67) | 2.79 (1.794.34) |
| Blood culture <3 h after alert | 1.72 (1.232.40) | 1.76 (1.252.47) | 1.36 (0.872.10) | 1.40 (0.902.20) |
| Blood gas order <6 h after alert | 1.24 (0.841.83) | 1.32 (0.891.97) | 1.06 (0.631.77) | 1.13 (0.671.92) |
| BMP or CBC order <6 h after alert | 0.95 (0.751.20) | 0.96 (0.751.21) | 1.00 (0.701.44) | 1.04 (0.721.50) |
| Vasopressor order <6 h after alert | 1.36 (0.712.61) | 1.47 (0.762.83) | 1.32 (0.583.04) | 1.38 (0.593.25) |
| Bronchodilator administration <6 h after alert | 0.98 (0.691.41) | 1.02 (0.701.47) | 1.13 (0.641.99) | 1.17 (0.652.10) |
| Transfusion order <6 h after alert | 1.92 (1.213.04) | 1.95 (1.233.11) | 1.65 (0.913.01) | 1.68 (0.913.10) |
| AV node blocker order <6 h after alert | 1.10 (0.681.78) | 1.20 (0.722.00) | 0.38 (0.131.08) | 0.39 (0.121.20) |
| Loop diuretic order <6 h after alert | 0.87 (0.521.44) | 0.93 (0.561.57) | 1.63 (0.634.21) | 1.87 (0.705.00) |
| CXR <6 h after alert | 1.43 (1.061.94) | 1.47 (1.081.99) | 1.45 (0.942.24) | 1.56 (1.002.43) |
| CT <6 h after alert | 1.30 (0.782.16) | 1.30 (0.782.19) | 0.97 (0.521.82) | 0.94 (0.491.79) |
| Cardiac monitoring <6 h after alert | 1.48 (1.062.08) | 1.54 (1.092.16) | 1.32 (0.792.18) | 1.44 (0.862.41) |
Hospital and ICU length of stay were similar in the preimplementation and postimplementation periods. There was no difference in the proportion of patients transferred to the ICU following the alert; however, the proportion transferred within 6 hours of the alert increased, and the time to ICU transfer was halved (see Supporting Figure 4 in the online version of this article), but neither change was statistically significant in unadjusted analyses. Transfer to the ICU within 6 hours became statistically significant after adjustment. All mortality measures were lower in the postimplementation period, but none reached statistical significance. Discharge to home and sepsis documentation were both statistically higher in the postimplementation period, but discharge to home lost statistical significance after adjustment (Tables 4 and 5) (see Supporting Table 4 in the online version of this article).
| Hospitals AC | ||||
|---|---|---|---|---|
| Preimplementation | Postimplementation | P Value | ||
| ||||
| No. of alerts | 595 | 545 | ||
| Hospital LOS, d, median (IQR) | 10.1 (5.119.1) | 9.4 (5.218.9) | 0.92 | |
| ICU LOS after alert, d, median (IQR) | 3.4 (1.77.4) | 3.6 (1.96.8) | 0.72 | |
| ICU transfer <6 h after alert | 40 (7%) | 53 (10%) | 0.06 | |
| ICU transfer <24 h after alert | 71 (12%) | 79 (14%) | 0.20 | |
| ICU transfer any time after alert | 134 (23%) | 124 (23%) | 0.93 | |
| Time to first ICU after alert, h, median (IQR) | 21.3 (4.463.9) | 11.0 (2.358.7) | 0.22 | |
| RRT 6 h after alert | 13 (2%) | 9 (2%) | 0.51 | |
| Mortality of all patients | 52 (9%) | 41 (8%) | 0.45 | |
| Mortality 30 days after alert | 48 (8%) | 33 (6%) | 0.19 | |
| Mortality of those transferred to ICU | 40 (30%) | 32 (26%) | 0.47 | |
| Deceased or IP hospice | 94 (16%) | 72 (13%) | 0.22 | |
| Discharge to home | 347 (58%) | 351 (64%) | 0.04 | |
| Disposition location | ||||
| Home | 347 (58%) | 351 (64%) | 0.25 | |
| SNF | 89 (15%) | 65 (12%) | ||
| Rehab | 24 (4%) | 20 (4%) | ||
| LTC | 8 (1%) | 9 (2%) | ||
| Other hospital | 16 (3%) | 6 (1%) | ||
| Expired | 52 (9%) | 41 (8%) | ||
| Hospice IP | 42 (7%) | 31 (6%) | ||
| Hospice other | 11 (2%) | 14 (3%) | ||
| Other location | 6 (1%) | 8 (1%) | ||
| Sepsis discharge diagnosis | 230 (39%) | 247 (45%) | 0.02 | |
| Sepsis O/E | 1.37 | 1.06 | 0.18 | |
| All Alerted Patients | Discharged With Sepsis Code* | |||
|---|---|---|---|---|
| Unadjusted Estimate | Adjusted Estimate | Unadjusted Estimate | Adjusted Estimate | |
| ||||
| Hospital LOS, d | 1.01 (0.921.11) | 1.02 (0.931.12) | 0.99 (0.851.15) | 1.00 (0.871.16) |
| ICU transfer | 1.49 (0.972.29) | 1.65 (1.072.55) | 1.61 (0.922.84) | 1.82 (1.023.25) |
| Time to first ICU transfer after alert, h‖ | 1.17 (0.871.57) | 1.23 (0.921.66) | 1.21 (0.831.75) | 1.31 (0.901.90) |
| ICU LOS, d | 1.01 (0.771.31) | 0.99 (0.761.28) | 0.87 (0.621.21) | 0.88 (0.641.21) |
| RRT | 0.75 (0.321.77) | 0.84 (0.352.02) | 0.81 (0.292.27) | 0.82 (0.272.43) |
| Mortality | 0.85 (0.551.30) | 0.98 (0.631.53) | 0.85 (0.551.30) | 0.98 (0.631.53) |
| Mortality within 30 days of alert | 0.73 (0.461.16) | 0.87 (0.541.40) | 0.59 (0.341.04) | 0.69 (0.381.26) |
| Mortality or inpatient hospice transfer | 0.82 (0.471.41) | 0.78 (0.441.41) | 0.67 (0.361.25) | 0.65 (0.331.29) |
| Discharge to home | 1.29 (1.021.64) | 1.18 (0.911.52) | 1.36 (0.951.95) | 1.22 (0.811.84) |
| Sepsis discharge diagnosis | 1.32 (1.041.67) | 1.43 (1.101.85) | NA | NA |
In a subanalysis of EWRS impact on patients documented with sepsis at discharge, unadjusted and adjusted changes in clinical process and outcome measures across the time periods were similar to that of the total population (see Supporting Tables 5 and 6 and Supporting Figure 5 in the online version of this article). The unadjusted composite outcome of mortality or inpatient hospice was statistically lower in the postimplementation period, but lost statistical significance after adjustment.
The disposition and mortality outcomes of those not triggering the alert were unchanged across the 2 periods (see Supporting Tables 7, 8, and 9 in the online version of this article).
DISCUSSION
This study demonstrated that a predictive tool can accurately identify non‐ICU inpatients at increased risk for deterioration and death. In addition, we demonstrated the feasibility of deploying our EHR to screen patients in real time for deterioration and to trigger electronically a timely, robust, multidisciplinary bedside clinical evaluation. Compared to the control (silent) period, the EWRS resulted in a marked increase in early sepsis care, transfer to the ICU, and sepsis documentation, and an indication of a decreased sepsis mortality index and mortality, and increased discharge to home, although none of these latter 3 findings reached statistical significance.
Our study is unique in that it was implemented across a multihospital health system, which has identical EHRs, but diverse cultures, populations, staffing, and practice models. In addition, our study includes a preimplementation population similar to the postimplementation population (in terms of setting, month of admission, and adjustment for potential confounders).
Interestingly, patients identified by the EWRS who were subsequently transferred to an ICU had higher mortality rates (30% and 26% in the preimplementation and postimplementation periods, respectively, across UPHS) than those transferred to an ICU who were not identified by the EWRS (7% and 6% in the preimplementation and postimplementation periods, respectively, across UPHS) (Table 4) (see Supporting Table 7 in the online version of this article). This finding was robust to the study period, so is likely not related to the bedside evaluation prompted by the EWRS. It suggests the EWRS could help triage patients for appropriateness of ICU transfer, a particularly valuable role that should be explored further given the typical strains on ICU capacity,[13] and the mortality resulting from delays in patient transfers into ICUs.[14, 15]
Although we did not find a statistically significant mortality reduction, our study may have been underpowered to detect this outcome. Our study has other limitations. First, our preimplementation/postimplementation design may not fully account for secular changes in sepsis mortality. However, our comparison of similar time periods and our adjustment for observed demographic differences allow us to estimate with more certainty the change in sepsis care and mortality attributable to the intervention. Second, our study did not examine the effect of the EWRS on mortality after hospital discharge, where many such events occur. However, our capture of at least 45 hospital days on all study patients, as well as our inclusion of only those who died or were discharged during our study period, and our assessment of discharge disposition such as hospice, increase the chance that mortality reductions directly attributable to the EWRS were captured. Third, although the EWRS changed patient management, we did not assess the appropriateness of management changes. However, the impact of care changes was captured crudely by examining mortality rates and discharge disposition. Fourth, our study was limited to a single academic healthcare system, and our experience may not be generalizable to other healthcare systems with different EHRs and staff. However, the integration of our automated alert into a commercial EHR serving a diverse array of patient populations, clinical services, and service models throughout our healthcare system may improve the generalizability of our experience to other settings.
CONCLUSION
By leveraging readily available electronic data, an automated prediction tool identified at‐risk patients and mobilized care teams, resulting in more timely sepsis care, improved sepsis documentation, and a suggestion of reduced mortality. This alert may be scalable to other healthcare systems.
Acknowledgements
The authors thank Jennifer Barger, MS, BSN, RN; Patty Baroni, MSN, RN; Patrick J. Donnelly, MS, RN, CCRN; Mika Epps, MSN, RN; Allen L. Fasnacht, MSN, RN; Neil O. Fishman, MD; Kevin M. Fosnocht, MD; David F. Gaieski, MD; Tonya Johnson, MSN, RN, CCRN; Craig R. Kean, MS; Arash Kia, MD, MS; Matthew D. Mitchell, PhD; Stacie Neefe, BSN, RN; Nina J. Renzi, BSN, RN, CCRN; Alexander Roederer, Jean C. Romano, MSN, RN, NE‐BC; Heather Ross, BSN, RN, CCRN; William D. Schweickert, MD; Esme Singer, MD; and Kendal Williams, MD, MPH for their help in developing, testing and operationalizing the EWRS examined in this study; their assistance in data acquisition; and for advice regarding data analysis. This study was previously presented as an oral abstract at the 2013 American Medical Informatics Association Meeting, November 1620, 2013, Washington, DC.
Disclosures: Dr. Umscheid's contribution to this project was supported in part by the National Center for Research Resources, grant UL1RR024134, which is now at the National Center for Advancing Translational Sciences, grant UL1TR000003. The content of this article is solely the responsibility of the authors and does not necessarily represent the official views of the National Institutes of Health. The authors report no potential financial conflicts of interest relevant to this article.
- , , , . Benchmarking the incidence and mortality of severe sepsis in the United States. Crit Care Med. 2013;41(5):1167–1174.
- , , , et al. Surviving sepsis campaign: international guidelines for management of severe sepsis and septic shock: 2012. Crit Care Med. 2013;41(2):580–637.
- , , , et al. The Surviving Sepsis Campaign: results of an international guideline‐based performance improvement program targeting severe sepsis. Crit Care Med. 2010;38(2):367–374.
- , , , et al. Early goal‐directed therapy in severe sepsis and septic shock revisited: concepts, controversies, and contemporary findings. Chest. 2006;130(5):1579–1595.
- , , , et al. Early goal‐directed therapy in the treatment of severe sepsis and septic shock. N Engl J Med. 2001;345(19):1368–1377.
- , , , , , . Severe sepsis cohorts derived from claims‐based strategies appear to be biased toward a more severely ill patient population. Crit Care Med. 2013;41(4):945–953.
- , , , et al. A trial of a real‐time alert for clinical deterioration in patients hospitalized on general medical wards. J Hosp Med. 2013;8(5):236–242.
- , , , , , . Bedside electronic capture of clinical observations and automated clinical alerts to improve compliance with an Early Warning Score protocol. Crit Care Resusc. 2011;13(2):83–88.
- , , , . Prospective trial of real‐time electronic surveillance to expedite early care of severe sepsis. Ann Emerg Med. 2011;57(5):500–504.
- , , , et al. Implementation of a real‐time computerized sepsis alert in nonintensive care unit patients. Crit Care Med. 2011;39(3):469–473.
- , , , et al. Definitions for sepsis and organ failure and guidelines for the use of innovative therapies in sepsis. The ACCP/SCCM Consensus Conference Committee. American College of Chest Physicians/Society of Critical Care Medicine. Chest. 1992;101(6):1644–1655.
- , , , et al. 2001 SCCM/ESICM/ACCP/ATS/SIS International Sepsis Definitions Conference. Crit Care Med. 2003;31(4):1250–1256.
- , , , , . Rationing critical care beds: a systematic review. Crit Care Med. 2004;32(7):1588–1597.
- . Delayed admission to intensive care unit for critically surgical patients is associated with increased mortality. Am J Surg. 2014;208:268–274.
- , , , et al. Impact of delayed admission to intensive care units on mortality of critically ill patients: a cohort study. Crit Care. 2011;15(1):R28.
There are as many as 3 million cases of severe sepsis and 750,000 resulting deaths in the United States annually.[1] Interventions such as goal‐directed resuscitation and antibiotics can reduce sepsis mortality, but their effectiveness depends on early administration. Thus, timely recognition is critical.[2, 3, 4, 5]
Despite this, early recognition in hospitalized patients can be challenging. Using chart documentation as a surrogate for provider recognition, we recently found only 20% of patients with severe sepsis admitted to our hospital from the emergency department were recognized.[6] Given these challenges, there has been increasing interest in developing automated systems to improve the timeliness of sepsis detection.[7, 8, 9, 10] Systems described in the literature have varied considerably in triggering criteria, effector responses, and study settings. Of those examining the impact of automated surveillance and response in the nonintensive care unit (ICU) acute inpatient setting, results suggest an increase in the timeliness of diagnostic and therapeutic interventions,[10] but less impact on patient outcomes.[7] Whether these results reflect inadequacies in the criteria used to identify patients (parameters or their thresholds) or an ineffective response to the alert (magnitude or timeliness) is unclear.
Given the consequences of severe sepsis in hospitalized patients, as well as the introduction of vital sign (VS) and provider data in our electronic health record (EHR), we sought to develop and implement an electronic sepsis detection and response system to improve patient outcomes. This study describes the development, validation, and impact of that system.
METHODS
Setting and Data Sources
The University of Pennsylvania Health System (UPHS) includes 3 hospitals with a capacity of over 1500 beds and 70,000 annual admissions. All hospitals use the EHR Sunrise Clinical Manager version 5.5 (Allscripts, Chicago, IL). The study period began in October 2011, when VS and provider contact information became available electronically. Data were retrieved from the Penn Data Store, which includes professionally coded data as well as clinical data from our EHRs. The study received expedited approval and a Health Insurance Portability and Accountability Act waiver from our institutional review board.
Development of the Intervention
The early warning and response system (EWRS) for sepsis was designed to monitor laboratory values and VSs in real time in our inpatient EHR to detect patients at risk for clinical deterioration and development of severe sepsis. The development team was multidisciplinary, including informaticians, physicians, nurses, and data analysts from all 3 hospitals.
To identify at‐risk patients, we used established criteria for severe sepsis, including the systemic inflammatory response syndrome criteria (temperature <36C or >38C, heart rate >90 bpm, respiratory rate >20 breaths/min or PaCO2 <32 mm Hg, and total white blood cell count <4000 or >12,000 or >10% bands) coupled with criteria suggesting organ dysfunction (cardiovascular dysfunction based on a systolic blood pressure <100 mm Hg, and hypoperfusion based on a serum lactate measure >2.2 mmol/L [the threshold for an abnormal result in our lab]).[11, 12]
To establish a threshold for triggering the system, a derivation cohort was used and defined as patients admitted between October 1, 2011 to October 31, 2011 1 to any inpatient acute care service. Those <18 years old or admitted to hospice, research, and obstetrics services were excluded. We calculated a risk score for each patient, defined as the sum of criteria met at any single time during their visit. At any given point in time, we used the most recent value for each criteria, with a look‐back period of 24 hours for VSs and 48 hours for labs. The minimum and maximum number of criteria that a patient could achieve at any single time was 0 and 6, respectively. We then categorized patients by the maximum number of criteria achieved and estimated the proportion of patients in each category who: (1) were transferred to an ICU during their hospital visit; (2) had a rapid response team (RRT) called during their visit; (3) died during their visit; (4) had a composite of 1, 2, or 3; or (5) were coded as sepsis at discharge (see Supporting Information in the online version of this article for further information). Once a threshold was chosen, we examined the time from first trigger to: (1) any ICU transfer; (2) any RRT; (3) death; or (4) a composite of 1, 2, or 3. We then estimated the screen positive rate, test characteristics, predictive values, and likelihood ratios of the specified threshold.
The efferent response arm of the EWRS included the covering provider (usually an intern), the bedside nurse, and rapid response coordinators, who were engaged from the outset in developing the operational response to the alert. This team was required to perform a bedside evaluation within 30 minutes of the alert, and enact changes in management if warranted. The rapid response coordinator was required to complete a 3‐question follow‐up assessment in the EHR asking whether all 3 team members gathered at the bedside, the most likely condition triggering the EWRS, and whether management changed (see Supporting Figure 1 in the online version of this article). To minimize the number of triggers, once a patient triggered an alert, any additional alert triggers during the same hospital stay were censored.
Implementation of the EWRS
All inpatients on noncritical care services were screened continuously. Hospice, research, and obstetrics services were excluded. If a patient met the EWRS criteria threshold, an alert was sent to the covering provider and rapid response coordinator by text page. The bedside nurses, who do not carry text‐enabled devices, were alerted by pop‐up notification in the EHR (see Supporting Figure 2 in the online version of this article). The notification was linked to a task that required nurses to verify in the EHR the VSs triggering the EWRS, and adverse trends in VSs or labs (see Supporting Figure 3 in the online version of this article).
The Preimplementation (Silent) Period and EWRS Validation
The EWRS was initially activated for a preimplementation silent period (June 6, 2012September 4, 2012) to both validate the tool and provide the baseline data to which the postimplementation period was compared. During this time, new admissions could trigger the alert, but notifications were not sent. We used admissions from the first 30 days of the preimplementation period to estimate the tool's screen positive rate, test characteristics, predictive values, and likelihood ratios.
The Postimplementation (Live) Period and Impact Analysis
The EWRS went live September 12, 2012, upon which new admissions triggering the alert would result in a notification and response. Unadjusted analyses using the [2] test for dichotomous variables and the Wilcoxon rank sum test for continuous variables compared demographics and the proportion of clinical process and outcome measures for those admitted during the silent period (June 6, 2012September 4, 2012) and a similar timeframe 1 year later when the intervention was live (June 6, 2013September 4, 2013). To be included in either of the time periods, patients had to trigger the alert during the period and be discharged within 45 days of the end of the period. The pre‐ and post‐sepsis mortality index was also examined (see the Supporting Information in the online version of this article for a detailed description of study measures). Multivariable regression models estimated the impact of the EWRS on the process and outcome measures, adjusted for differences between the patients in the preimplementation and postimplementation periods with respect to age, gender, Charlson index on admission, admitting service, hospital, and admission month. Logistic regression models examined dichotomous variables. Continuous variables were log transformed and examined using linear regression models. Cox regression models explored time to ICU transfer from trigger. Among patients with sepsis, a logistic regression model was used to compare the odds of mortality between the silent and live periods, adjusted for expected mortality, both within each hospital and across all hospitals.
Because there is a risk of providers becoming overly reliant on automated systems and overlooking those not triggering the system, we also examined the discharge disposition and mortality outcomes of those in both study periods not identified by the EWRS.
The primary analysis examined the impact of the EWRS across UPHS; we also examined the EWRS impact at each of our hospitals. Last, we performed subgroup analyses examining the EWRS impact in those assigned an International Classification of Diseases, 9th Revision code for sepsis at discharge or death. All analyses were performed using SAS version 9.3 (SAS Institute Inc., Cary, NC).
RESULTS
In the derivation cohort, 4575 patients met the inclusion criteria. The proportion of those in each category (06) achieving our outcomes of interest are described in Supporting Table 1 in the online version of this article. We defined a positive trigger as a score 4, as this threshold identified a limited number of patients (3.9% [180/4575]) with a high proportion experiencing our composite outcome (25.6% [46/180]). The proportion of patients with an EWRS score 4 and their time to event by hospital and health system is described in Supporting Table 2 in the online version of this article. Those with a score 4 were almost 4 times as likely to be transferred to the ICU, almost 7 times as likely to experience an RRT, and almost 10 times as likely to die. The screen positive, sensitivity, specificity, and positive and negative predictive values and likelihood ratios using this threshold and our composite outcome in the derivation cohort were 6%, 16%, 97%, 26%, 94%, 5.3, and 0.9, respectively, and in our validation cohort were 6%, 17%, 97%, 28%, 95%, 5.7, and 0.9, respectively.
In the preimplementation period, 3.8% of admissions (595/15,567) triggered the alert, as compared to 3.5% (545/15,526) in the postimplementation period. Demographics were similar across periods, except that in the postimplementation period patients were slightly younger and had a lower Charlson Comorbidity Index at admission (Table 1). The distribution of alerts across medicine and surgery services were similar (Table 1).
| Hospitals AC | |||
|---|---|---|---|
| Preimplementation | Postimplementation | P Value | |
| |||
| No. of encounters | 15,567 | 15,526 | |
| No. of alerts | 595 (4%) | 545 (4%) | 0.14 |
| Age, y, median (IQR) | 62.0 (48.570.5) | 59.7 (46.169.6) | 0.04 |
| Female | 298 (50%) | 274 (50%) | 0.95 |
| Race | |||
| White | 343 (58%) | 312 (57%) | 0.14 |
| Black | 207 (35%) | 171 (31%) | |
| Other | 23 (4%) | 31 (6%) | |
| Unknown | 22 (4%) | 31 (6%) | |
| Admission type | |||
| Elective | 201 (34%) | 167 (31%) | 0.40 |
| ED | 300 (50%) | 278 (51%) | |
| Transfer | 94 (16%) | 99 (18%) | |
| BMI, kg/m2, median (IQR) | 27.0 (23.032.0) | 26.0 (22.031.0) | 0.24 |
| Previous ICU admission | 137 (23%) | 127 (23%) | 0.91 |
| RRT before alert | 27 (5%) | 20 (4%) | 0.46 |
| Admission Charlson index, median (IQR) | 2.0 (1.04.0) | 2.0 (1.04.0) | 0.04 |
| Admitting service | |||
| Medicine | 398 (67%) | 364 (67%) | 0.18 |
| Surgery | 173 (29%) | 169 (31%) | |
| Other | 24 (4%) | 12 (2%) | |
| Service where alert fired | |||
| Medicine | 391 (66%) | 365 (67%) | 0.18 |
| Surgery | 175 (29%) | 164 (30%) | |
| Other | 29 (5%) | 15 (3%) | |
In our postimplementation period, 99% of coordinator pages and over three‐fourths of provider notifications were sent successfully. Almost three‐fourths of nurses reviewed the initial alert notification, and over 99% completed the electronic data verification and adverse trend review, with over half documenting adverse trends. Ninety‐five percent of the time the coordinators completed the follow‐up assessment. Over 90% of the time, the entire team evaluated the patient at bedside within 30 minutes. Almost half of the time, the team thought the patient had no critical illness. Over a third of the time, they thought the patient had sepsis, but reported over 90% of the time that they were aware of the diagnosis prior to the alert. (Supporting Table 3 in the online version of this article includes more details about the responses to the electronic notifications and follow‐up assessments.)
In unadjusted and adjusted analyses, ordering of antibiotics, intravenous fluid boluses, and lactate and blood cultures within 3 hours of the trigger increased significantly, as did ordering of blood products, chest radiographs, and cardiac monitoring within 6 hours of the trigger (Tables 2 and 3).
| Hospitals AC | |||
|---|---|---|---|
| Preimplementation | Postimplementation | P Value | |
| |||
| No. of alerts | 595 | 545 | |
| 500 mL IV bolus order <3 h after alert | 92 (15%) | 142 (26%) | <0.01 |
| IV/PO antibiotic order <3 h after alert | 75 (13%) | 123 (23%) | <0.01 |
| IV/PO sepsis antibiotic order <3 h after alert | 61 (10%) | 85 (16%) | <0.01 |
| Lactic acid order <3 h after alert | 57 (10%) | 128 (23%) | <0.01 |
| Blood culture order <3 h after alert | 68 (11%) | 99 (18%) | <0.01 |
| Blood gas order <6 h after alert | 53 (9%) | 59 (11%) | 0.28 |
| CBC or BMP <6 h after alert | 247 (42%) | 219 (40%) | 0.65 |
| Vasopressor <6 h after alert | 17 (3%) | 21 (4%) | 0.35 |
| Bronchodilator administration <6 h after alert | 71 (12%) | 64 (12%) | 0.92 |
| RBC, plasma, or platelet transfusion order <6 h after alert | 31 (5%) | 52 (10%) | <0.01 |
| Naloxone order <6 h after alert | 0 (0%) | 1 (0%) | 0.30 |
| AV node blocker order <6 h after alert | 35 (6%) | 35 (6%) | 0.70 |
| Loop diuretic order <6 h after alert | 35 (6%) | 28 (5%) | 0.58 |
| CXR <6 h after alert | 92 (15%) | 113 (21%) | 0.02 |
| CT head, chest, or ABD <6 h after alert | 29 (5%) | 34 (6%) | 0.31 |
| Cardiac monitoring (ECG or telemetry) <6 h after alert | 70 (12%) | 90 (17%) | 0.02 |
| All Alerted Patients | Discharged With Sepsis Code* | |||
|---|---|---|---|---|
| Unadjusted Odds Ratio | Adjusted Odds Ratio | Unadjusted Odds Ratio | Adjusted Odds Ratio | |
| ||||
| 500 mL IV bolus order <3 h after alert | 1.93 (1.442.58) | 1.93 (1.432.61) | 1.64 (1.112.43) | 1.65 (1.102.47) |
| IV/PO antibiotic order <3 h after alert | 2.02 (1.482.77) | 2.02 (1.462.78) | 1.99 (1.323.00) | 2.02 (1.323.09) |
| IV/PO sepsis antibiotic order <3 h after alert | 1.62 (1.142.30) | 1.57 (1.102.25) | 1.63 (1.052.53) | 1.65 (1.052.58) |
| Lactic acid order <3 h after alert | 2.90 (2.074.06) | 3.11 (2.194.41) | 2.41 (1.583.67) | 2.79 (1.794.34) |
| Blood culture <3 h after alert | 1.72 (1.232.40) | 1.76 (1.252.47) | 1.36 (0.872.10) | 1.40 (0.902.20) |
| Blood gas order <6 h after alert | 1.24 (0.841.83) | 1.32 (0.891.97) | 1.06 (0.631.77) | 1.13 (0.671.92) |
| BMP or CBC order <6 h after alert | 0.95 (0.751.20) | 0.96 (0.751.21) | 1.00 (0.701.44) | 1.04 (0.721.50) |
| Vasopressor order <6 h after alert | 1.36 (0.712.61) | 1.47 (0.762.83) | 1.32 (0.583.04) | 1.38 (0.593.25) |
| Bronchodilator administration <6 h after alert | 0.98 (0.691.41) | 1.02 (0.701.47) | 1.13 (0.641.99) | 1.17 (0.652.10) |
| Transfusion order <6 h after alert | 1.92 (1.213.04) | 1.95 (1.233.11) | 1.65 (0.913.01) | 1.68 (0.913.10) |
| AV node blocker order <6 h after alert | 1.10 (0.681.78) | 1.20 (0.722.00) | 0.38 (0.131.08) | 0.39 (0.121.20) |
| Loop diuretic order <6 h after alert | 0.87 (0.521.44) | 0.93 (0.561.57) | 1.63 (0.634.21) | 1.87 (0.705.00) |
| CXR <6 h after alert | 1.43 (1.061.94) | 1.47 (1.081.99) | 1.45 (0.942.24) | 1.56 (1.002.43) |
| CT <6 h after alert | 1.30 (0.782.16) | 1.30 (0.782.19) | 0.97 (0.521.82) | 0.94 (0.491.79) |
| Cardiac monitoring <6 h after alert | 1.48 (1.062.08) | 1.54 (1.092.16) | 1.32 (0.792.18) | 1.44 (0.862.41) |
Hospital and ICU length of stay were similar in the preimplementation and postimplementation periods. There was no difference in the proportion of patients transferred to the ICU following the alert; however, the proportion transferred within 6 hours of the alert increased, and the time to ICU transfer was halved (see Supporting Figure 4 in the online version of this article), but neither change was statistically significant in unadjusted analyses. Transfer to the ICU within 6 hours became statistically significant after adjustment. All mortality measures were lower in the postimplementation period, but none reached statistical significance. Discharge to home and sepsis documentation were both statistically higher in the postimplementation period, but discharge to home lost statistical significance after adjustment (Tables 4 and 5) (see Supporting Table 4 in the online version of this article).
| Hospitals AC | ||||
|---|---|---|---|---|
| Preimplementation | Postimplementation | P Value | ||
| ||||
| No. of alerts | 595 | 545 | ||
| Hospital LOS, d, median (IQR) | 10.1 (5.119.1) | 9.4 (5.218.9) | 0.92 | |
| ICU LOS after alert, d, median (IQR) | 3.4 (1.77.4) | 3.6 (1.96.8) | 0.72 | |
| ICU transfer <6 h after alert | 40 (7%) | 53 (10%) | 0.06 | |
| ICU transfer <24 h after alert | 71 (12%) | 79 (14%) | 0.20 | |
| ICU transfer any time after alert | 134 (23%) | 124 (23%) | 0.93 | |
| Time to first ICU after alert, h, median (IQR) | 21.3 (4.463.9) | 11.0 (2.358.7) | 0.22 | |
| RRT 6 h after alert | 13 (2%) | 9 (2%) | 0.51 | |
| Mortality of all patients | 52 (9%) | 41 (8%) | 0.45 | |
| Mortality 30 days after alert | 48 (8%) | 33 (6%) | 0.19 | |
| Mortality of those transferred to ICU | 40 (30%) | 32 (26%) | 0.47 | |
| Deceased or IP hospice | 94 (16%) | 72 (13%) | 0.22 | |
| Discharge to home | 347 (58%) | 351 (64%) | 0.04 | |
| Disposition location | ||||
| Home | 347 (58%) | 351 (64%) | 0.25 | |
| SNF | 89 (15%) | 65 (12%) | ||
| Rehab | 24 (4%) | 20 (4%) | ||
| LTC | 8 (1%) | 9 (2%) | ||
| Other hospital | 16 (3%) | 6 (1%) | ||
| Expired | 52 (9%) | 41 (8%) | ||
| Hospice IP | 42 (7%) | 31 (6%) | ||
| Hospice other | 11 (2%) | 14 (3%) | ||
| Other location | 6 (1%) | 8 (1%) | ||
| Sepsis discharge diagnosis | 230 (39%) | 247 (45%) | 0.02 | |
| Sepsis O/E | 1.37 | 1.06 | 0.18 | |
| All Alerted Patients | Discharged With Sepsis Code* | |||
|---|---|---|---|---|
| Unadjusted Estimate | Adjusted Estimate | Unadjusted Estimate | Adjusted Estimate | |
| ||||
| Hospital LOS, d | 1.01 (0.921.11) | 1.02 (0.931.12) | 0.99 (0.851.15) | 1.00 (0.871.16) |
| ICU transfer | 1.49 (0.972.29) | 1.65 (1.072.55) | 1.61 (0.922.84) | 1.82 (1.023.25) |
| Time to first ICU transfer after alert, h‖ | 1.17 (0.871.57) | 1.23 (0.921.66) | 1.21 (0.831.75) | 1.31 (0.901.90) |
| ICU LOS, d | 1.01 (0.771.31) | 0.99 (0.761.28) | 0.87 (0.621.21) | 0.88 (0.641.21) |
| RRT | 0.75 (0.321.77) | 0.84 (0.352.02) | 0.81 (0.292.27) | 0.82 (0.272.43) |
| Mortality | 0.85 (0.551.30) | 0.98 (0.631.53) | 0.85 (0.551.30) | 0.98 (0.631.53) |
| Mortality within 30 days of alert | 0.73 (0.461.16) | 0.87 (0.541.40) | 0.59 (0.341.04) | 0.69 (0.381.26) |
| Mortality or inpatient hospice transfer | 0.82 (0.471.41) | 0.78 (0.441.41) | 0.67 (0.361.25) | 0.65 (0.331.29) |
| Discharge to home | 1.29 (1.021.64) | 1.18 (0.911.52) | 1.36 (0.951.95) | 1.22 (0.811.84) |
| Sepsis discharge diagnosis | 1.32 (1.041.67) | 1.43 (1.101.85) | NA | NA |
In a subanalysis of EWRS impact on patients documented with sepsis at discharge, unadjusted and adjusted changes in clinical process and outcome measures across the time periods were similar to that of the total population (see Supporting Tables 5 and 6 and Supporting Figure 5 in the online version of this article). The unadjusted composite outcome of mortality or inpatient hospice was statistically lower in the postimplementation period, but lost statistical significance after adjustment.
The disposition and mortality outcomes of those not triggering the alert were unchanged across the 2 periods (see Supporting Tables 7, 8, and 9 in the online version of this article).
DISCUSSION
This study demonstrated that a predictive tool can accurately identify non‐ICU inpatients at increased risk for deterioration and death. In addition, we demonstrated the feasibility of deploying our EHR to screen patients in real time for deterioration and to trigger electronically a timely, robust, multidisciplinary bedside clinical evaluation. Compared to the control (silent) period, the EWRS resulted in a marked increase in early sepsis care, transfer to the ICU, and sepsis documentation, and an indication of a decreased sepsis mortality index and mortality, and increased discharge to home, although none of these latter 3 findings reached statistical significance.
Our study is unique in that it was implemented across a multihospital health system, which has identical EHRs, but diverse cultures, populations, staffing, and practice models. In addition, our study includes a preimplementation population similar to the postimplementation population (in terms of setting, month of admission, and adjustment for potential confounders).
Interestingly, patients identified by the EWRS who were subsequently transferred to an ICU had higher mortality rates (30% and 26% in the preimplementation and postimplementation periods, respectively, across UPHS) than those transferred to an ICU who were not identified by the EWRS (7% and 6% in the preimplementation and postimplementation periods, respectively, across UPHS) (Table 4) (see Supporting Table 7 in the online version of this article). This finding was robust to the study period, so is likely not related to the bedside evaluation prompted by the EWRS. It suggests the EWRS could help triage patients for appropriateness of ICU transfer, a particularly valuable role that should be explored further given the typical strains on ICU capacity,[13] and the mortality resulting from delays in patient transfers into ICUs.[14, 15]
Although we did not find a statistically significant mortality reduction, our study may have been underpowered to detect this outcome. Our study has other limitations. First, our preimplementation/postimplementation design may not fully account for secular changes in sepsis mortality. However, our comparison of similar time periods and our adjustment for observed demographic differences allow us to estimate with more certainty the change in sepsis care and mortality attributable to the intervention. Second, our study did not examine the effect of the EWRS on mortality after hospital discharge, where many such events occur. However, our capture of at least 45 hospital days on all study patients, as well as our inclusion of only those who died or were discharged during our study period, and our assessment of discharge disposition such as hospice, increase the chance that mortality reductions directly attributable to the EWRS were captured. Third, although the EWRS changed patient management, we did not assess the appropriateness of management changes. However, the impact of care changes was captured crudely by examining mortality rates and discharge disposition. Fourth, our study was limited to a single academic healthcare system, and our experience may not be generalizable to other healthcare systems with different EHRs and staff. However, the integration of our automated alert into a commercial EHR serving a diverse array of patient populations, clinical services, and service models throughout our healthcare system may improve the generalizability of our experience to other settings.
CONCLUSION
By leveraging readily available electronic data, an automated prediction tool identified at‐risk patients and mobilized care teams, resulting in more timely sepsis care, improved sepsis documentation, and a suggestion of reduced mortality. This alert may be scalable to other healthcare systems.
Acknowledgements
The authors thank Jennifer Barger, MS, BSN, RN; Patty Baroni, MSN, RN; Patrick J. Donnelly, MS, RN, CCRN; Mika Epps, MSN, RN; Allen L. Fasnacht, MSN, RN; Neil O. Fishman, MD; Kevin M. Fosnocht, MD; David F. Gaieski, MD; Tonya Johnson, MSN, RN, CCRN; Craig R. Kean, MS; Arash Kia, MD, MS; Matthew D. Mitchell, PhD; Stacie Neefe, BSN, RN; Nina J. Renzi, BSN, RN, CCRN; Alexander Roederer, Jean C. Romano, MSN, RN, NE‐BC; Heather Ross, BSN, RN, CCRN; William D. Schweickert, MD; Esme Singer, MD; and Kendal Williams, MD, MPH for their help in developing, testing and operationalizing the EWRS examined in this study; their assistance in data acquisition; and for advice regarding data analysis. This study was previously presented as an oral abstract at the 2013 American Medical Informatics Association Meeting, November 1620, 2013, Washington, DC.
Disclosures: Dr. Umscheid's contribution to this project was supported in part by the National Center for Research Resources, grant UL1RR024134, which is now at the National Center for Advancing Translational Sciences, grant UL1TR000003. The content of this article is solely the responsibility of the authors and does not necessarily represent the official views of the National Institutes of Health. The authors report no potential financial conflicts of interest relevant to this article.
- , , , . Benchmarking the incidence and mortality of severe sepsis in the United States. Crit Care Med. 2013;41(5):1167–1174.
- , , , et al. Surviving sepsis campaign: international guidelines for management of severe sepsis and septic shock: 2012. Crit Care Med. 2013;41(2):580–637.
- , , , et al. The Surviving Sepsis Campaign: results of an international guideline‐based performance improvement program targeting severe sepsis. Crit Care Med. 2010;38(2):367–374.
- , , , et al. Early goal‐directed therapy in severe sepsis and septic shock revisited: concepts, controversies, and contemporary findings. Chest. 2006;130(5):1579–1595.
- , , , et al. Early goal‐directed therapy in the treatment of severe sepsis and septic shock. N Engl J Med. 2001;345(19):1368–1377.
- , , , , , . Severe sepsis cohorts derived from claims‐based strategies appear to be biased toward a more severely ill patient population. Crit Care Med. 2013;41(4):945–953.
- , , , et al. A trial of a real‐time alert for clinical deterioration in patients hospitalized on general medical wards. J Hosp Med. 2013;8(5):236–242.
- , , , , , . Bedside electronic capture of clinical observations and automated clinical alerts to improve compliance with an Early Warning Score protocol. Crit Care Resusc. 2011;13(2):83–88.
- , , , . Prospective trial of real‐time electronic surveillance to expedite early care of severe sepsis. Ann Emerg Med. 2011;57(5):500–504.
- , , , et al. Implementation of a real‐time computerized sepsis alert in nonintensive care unit patients. Crit Care Med. 2011;39(3):469–473.
- , , , et al. Definitions for sepsis and organ failure and guidelines for the use of innovative therapies in sepsis. The ACCP/SCCM Consensus Conference Committee. American College of Chest Physicians/Society of Critical Care Medicine. Chest. 1992;101(6):1644–1655.
- , , , et al. 2001 SCCM/ESICM/ACCP/ATS/SIS International Sepsis Definitions Conference. Crit Care Med. 2003;31(4):1250–1256.
- , , , , . Rationing critical care beds: a systematic review. Crit Care Med. 2004;32(7):1588–1597.
- . Delayed admission to intensive care unit for critically surgical patients is associated with increased mortality. Am J Surg. 2014;208:268–274.
- , , , et al. Impact of delayed admission to intensive care units on mortality of critically ill patients: a cohort study. Crit Care. 2011;15(1):R28.
© 2014 Society of Hospital Medicine
Using Dashboard Technology to Monitor Overdose Risk
On October 10, 2013, a Congressional hearing was held to address the issue of opioid medication prescribing within VHA facilities and clinics (House Veteran Affairs Subcommittee hearing “Between Peril and Promise: Facing the Dangers of VA’s Skyrocketing Use of Prescription Painkillers to Treat Veterans”). Several individuals testified, including the widows of 2 veterans; both their husbands had overdosed on prescribed opioid medications. One husband had been taking as many as 15 pills a day and was additionally prescribed oxycodone/acetaminophen, which led to his death.1
Alongside the widows were 2 veterans who had been treated for chronic back pain injuries sustained before and during deployment in Iraq. Both had been prescribed several pain medications, including oxycodone/acetaminophen, methadone, and morphine. One reported that as his pain increased, his doctors continued to provide him additional prescriptions; at one point he had more than 13 prescriptions and could no longer work from being so “doped up.”1
In the past 2 decades, health care professionals (HCPs) have placed greater emphasis on chronic pain management. As a result, the rate of opioid medication prescribing has increased dramatically. Since 1994, the number of opioid medication prescriptions has nearly doubled; this change has been accompanied by an increase in opioid misuse, which has resulted in accidental or intentional overdose and death.2
Based on a recent National Institute on Drug Abuse (NIDA) report, the greatest impact has been on armed forces personnel.3 Prescriptions for pain relievers quadrupled between 2001 and 2009 to almost 3.8 million within the military population. Although civilian populations are more likely to abuse illicit drugs, military personnel are at particular risk of prescription abuse, including opioid medications.3 In 2008, 11% of armed forces service members reported misusing prescription drugs, with opioid medications being the most abused. This is an approximate 5- to 6-fold increase since 2002 (2% reported misuse in 2002).3 Particularly concerning is the associated rise in suicide rates among armed forces personnel, which surpassed civilian suicide rates in 2004. In 2009, one-third of suicides among armed forces personnel involved prescription drugs.3
Certain patient characteristics or factors are related to greater overdose risk. These risk factors include prescription dosage and frequency, history of suicide attempts or self-harm behavior, history of depression or posttraumatic stress disorder (PTSD) among other mental health-related diagnoses, a history of substance and/or alcohol abuse, and within the context of opioid medication use, the concurrent use of other central nervous system (CNS) depressants.4,5 Additionally, the stresses of deployment during wartime, physical injuries sustained in combat, and the unique military culture play a particularly important role in access to substances with high abuse potential and the subsequent development of substance abuse.3
Opioid Use and Risk Factors
More than 3% of adults in the U.S. are now receiving opioid medications for chronic noncancer pain.6 Substance abuse among patients with chronic pain ranges from 14% to 40%.5 Prescription opioid medications are the fastest growing drugs of abuse and the most common cause of unintentional overdose in the U.S.4 About 17,000 deaths occur each year as a result of prescription opioid medication overdose.7 Opioid medication-related overdose deaths began to increase in the early 2000s and continue to increase. Between 1999 and 2007, the rate of unintentional overdose-related deaths in the U.S. increased by 124%, largely due to the increase of prescription opioid medications.8
High-Dose Opioid Medication Use
A study by Dunn and colleagues found that patients receiving higher doses of prescribed opioid medications were at an increased risk of overdose.6 Patients receiving 50 mg to 99 mg morphine equivalent daily dose (MEDD) had a 3.7-fold increase in overdose risk (0.7% annual overdose rate) as compared with patients who received < 50 mg MEDD (0.2% annual overdose rate). Patients receiving ≥ 100 mg MEDD had a 1.8% annual overdose rate and a 9.8-fold increase in overdose risk as compared with patients who received < 50 mg MEDD. Overall, 51 patients experienced ≥ 1 overdose event, 40 of whom experienced fatal or serious overdoses and 6 of whom attempted suicide. Patients receiving the highest doses were male, current smokers, and had a history of depression and substance abuse.6 Similarly, a study by Bohnert and colleagues found that opioid medication overdose was most likely to occur in those patients with psychiatric and substance use disorders compared with patients who had no psychiatric illness history.8
Depression
Mood disorders are common in people with chronic pain.4,5,9,10 In particular, patients with a history of depression are more likely to receive chronic opioid medication prescriptions and are at a higher risk for opioid medication abuse. A substance abuse history is the most consistent predictor of both chronic opioid medication use and abuse. However, depression without substance abuse is significantly associated with 2 forms of opioid medication abuse: self-medication for stress or sleep and overmedication (using a higher dose than prescribed). More severe cases of depression show a stronger association for potential abuse.4
PTSD
Among Iraq and Afghanistan war veterans with ≥ 1 pain-related diagnosis, veterans with PTSD and veterans with a mental health disorder other than PTSD were significantly more likely to receive opioid medications for pain than were veterans without a mental health disorder (PTSD—17.8%, adjusted relative risk [RR] 2.58; other mental health disorder—11.7%, RR 1.74; no mental health disorder—6.5%).2 Although mental health disorders in general were related to a higher risk of opioid abuse, those with PTSD in particular were more likely to receive higher prescribed dosages; to continue taking opioids for a longer period; to receive concurrent prescriptions for opioid medications, sedative hypnotics, or both; to obtain early refills; and to have comorbid alcohol and substance use disorders. Based on these results, Seal and colleagues concluded that veterans with PTSD had the highest risk of alcohol, drug, and opioid-related accidents and overdose as well as self-inflicted injuries.2
Concurrent Use of Opioids and CNS Depressants
As mentioned earlier, studies suggest that people with PTSD are at a significantly higher risk for opioid medication overdose. One factor that may contribute to this higher risk is the concurrent use of CNS depressants/sedatives, particularly benzodiazepines and alcohol.
Benzodiazepines are often prescribed for people with PTSD. One study found that the concurrent use of benzodiazepines is significantly related to opioid overdose.5 Prescribing opioids for people already abusing or dependent on alcohol or other substances increases the risk of abuse and overdose. Furthermore, the concurrent use of multiple medications is associated with aberrant behaviors, cognitive impairment, and medication abuse, potentially leading to overdose. Overall, the combined administration of these medications is responsible for higher rates of adverse events, overdose, and death related to prescription opioid medication use.5,6,11
In summary, there are various risk factors that contribute to opioid medication overdose and more generally, risk of suicide, including (1) high-dose opioid medications; (2) history of psychiatric disorders, specifically depression and PTSD; (3) history of substance use disorders; and (4) concurrent use of opioid medications and prescription sedatives (specifically benzodiazepines) as well as alcohol and nonprescription drugs of abuse.
Suicide
Suicide is the tenth leading cause of death in the U.S., with 12.4 suicide deaths per 100,000 population.12 Suicide rates are even higher among veterans. According to the VHA, the age-adjusted rate of suicide for veterans using VHA facilities and clinics was 35.9 per 100,000 person-years for fiscal year 2009.13 Several risk factors for suicide attempts include depression and other mental health disorders, substance abuse, medical disorders, and prescription medications.
Prior suicide attempts or self-harm behavior is known to increase the risk of subsequent death by suicide. About 11 attempted suicides occur per suicide death where the medical severity of prior attempts increases the risk of future suicide, as does a history of multiple self-harm episodes.14,15 One study found that the single best predictor of suicide in a veteran population was an attempt in the previous 4 months.16
Among other risk factors, previous suicide attempts and violent behavior are major behavioral flags that warrant caution and require particular consideration when prescribing opioid medications. In a national survey on drug use and health, about 18% of prescription opioid users/abusers who experienced suicidal ideations actually attempted suicide. Only 11% of individuals who never used prescription opioid medications attempted suicide after reported suicidal ideations.17
Patient Data Aggregation
The early and widespread adoption of electronic medical records (EMRs) by the VHA allowed the aggregation of patient data for quality improvement. Initially, data were aggregated, and dashboards were designed retrospectively. However, the development of regional data warehouses that update patient information daily from the EMR allowed information to be aggregated prospectively, and dashboards were designed that provided real-time information.
The purpose of the current study is to demonstrate the efficacy and future potential of dashboard technology in assessing prospectively high-risk factors for opioid overdose. Dashboards are a user-friendly application that allows providers to isolate and calculate daily morphine equivalent opioid dosages and assess patients’ risk factors for overdose on an individual basis. By using this technology, providers who prescribe opioids can get a concise summary of opioid and other medications and adjust medications to decrease overdose risk on an individual basis.
What is the Dashboard?
The VISN 22 high-risk opioid dashboard is a business intelligence tool that serves as a report card, or progress report, to provide a global view of the number of veterans who are receiving opioid prescriptions totaling >120 mg MEDD and who have characteristics (history of depression, PTSD, substance abuse, or high-risk suicide flag) and prescriptions (concomitant CNS depressants) that may increase patient risk for overdose.
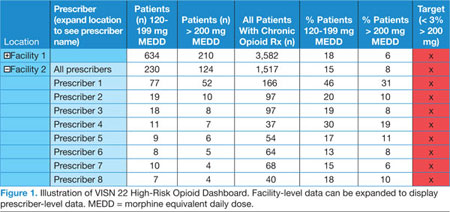
The VISN 22 dashboard allows the user to navigate to an individual HCP-level and patient-level report (Figures 1 and 2). Filter settings allow report users to select only high-risk patients; it serves as a single location for pertinent details to consider for safely prescribing opioids.
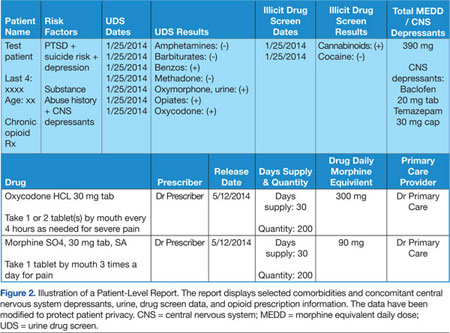
To calculate daily morphine equivalents, each patient’s opioid prescriptions were evaluated. The quantity was divided by the day’s supply to calculate an average daily quantity. From there, the drug strength was used to convert to MEDD. Health care providers were informed that these conversion factors were not recommendations for clinical opioid conversions.
Implementation and Design
In 2012, the VA Pharmacy Benefits Management (PBM) in VISN 21 created a dashboard that allowed users to identify patients on high-dose opioid prescriptions. Structured query language code was used to extract data from the regional data warehouse and calculate MEDD for all patients with active opioid prescriptions. In 2013, VISN 22 expanded that dashboard to incorporate factors that could indicate a high risk for overdose or other adverse outcomes, including a history of depression, PTSD, substance abuse or high-risk suicide flag, and concomitant use of CNS depressant medications.
The high-risk opioid dashboard (Figure 3) and accompanying patient-level report were first introduced to VISN 22 HCPs in January 2013. The business intelligence tools were introduced to each facility through the VISN 22 PBM group. Training on the use of the dashboard and the report was provided, with an initial target of decreasing MEDD of > 200 mg to < 5% of all veterans prescribed opioids at each VISN 22 facility. One month later (in February 2013), a second category of veterans (those with > 120 mg but < 199 mg MEDD) was added. Also the initial MEDD > 200 mg target of < 5% was decreased to < 3% to encourage additional progress.
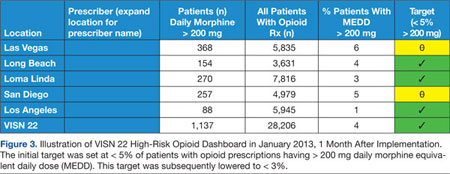
Eight months after the VISN 22 dashboard technology was implemented there was a 17% decrease in patients with total daily morphine equivalents > 200 mg (January 2013; 1,137 patients vs August 2013; 940 patients—a decrease of 197 patients).
From March 2013 to August 2013, VISN 22 also saw a 12% decrease in the number of patients prescribed > 120 mg MEDD but < 199 MEDD (March 2013; 2,295 vs August 2013; 2,018—a decrease of 277 patients).
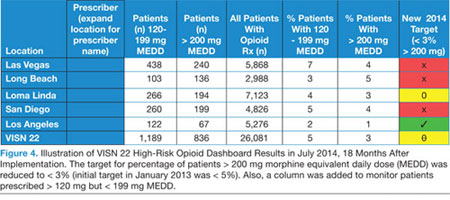
Figure 4 shows opioid use as of July 2014 for VISN 22 facilities. There were further reductions in the number of patients receiving > 120 mg but < 199 mg MEDD (August 2013; 2,018 patients vs July 2014; 1,189 patients) and patients receiving > 200 mg MEDD (August 2013; 940 patients vs July 2014; 836 patients).
Case Description
In January 2013, VISN 22 implemented dashboard technology to help providers assess and monitor opioid prescription levels in relation to high-risk variables. The benefits of this dashboard technology are illustrated in the case profile that follows.
A 67-year-old male veteran had a long history of chronic pain. Pain diagnoses included osteoarthritis with spine involvement, lumbar radiculopathy, arthralgia, and peripheral neuropathy. For the past 10 years, he was prescribed opioids with modest relief of his chronic pain symptoms despite recent prescriptions totaling 300 mg MEDD. This veteran had several risk factors for overdose, including a history of depression, suicide risk, PTSD, and concomitant use of the CNS depressants alprazolam and cyclobenzaprine.
More recently, in May 2013, the veteran exhibited aberrant behavior and requested early refills for alprazolam. In response, the pharmacist discussed the case with the HCP who prescribed the opioids, noting the concomitant overdose risk factors. As a result of this interaction, the veteran was referred for mental health services, and his prescriptions for opioids were gradually decreased. He is currently stable, now receiving 120 mg MEDD, and his pain is currently described as moderately controlled on the new lower dose.
In summary, this veteran was receiving > 200 mg MEDD with several known overdose risk factors. Once the HCP was made aware of these risk factors, necessary precautions were taken, and the veteran was safely tapered to a lower dose. Dashboard technology makes the list of risk factors readily available to HCPs who are prescribing (and the pharmacists reviewing the prescriptions), thus allowing a proactive discussion of risks and benefits before continuing, renewing, or initiating opioid prescriptions.
Discussion
As reported in 2013 by NIDA, the greater availability of opioid medications and the consequent increase in prescriptions may be contributing directly to their growing misuse by both civilians and military service personnel. A direct consequence has been an increase in both accidental and intentional overdose deaths.3 Several factors are related to the risk of overdose/death, including high-dose opioid medications, a history of psychiatric disorders (specifically depression and PTSD), a history of substance use disorders, concurrent use of opioid medications and prescription sedatives (specifically benzodiazepines) as well as alcohol and nonprescription drugs of abuse, and previous attempts of suicide.
The VISN 22 high-risk opioid dashboard was a rapid information technology response to the increasing risk faced by veterans who have chronic pain and comorbid psychiatric and substance use disorders and are prescribed opioids and CNS depressants. The purpose of implementing this dashboard technology was to assist HCPs in prescribing opioids safely, using a technology that allows for the monitoring and management of concomitant suicide risk factors. Following the national Opioid Safety Initiative, this dashboard tool is being used to identify veterans who are on high-dose opioids with the goal of reducing the number of veterans on > 200 mg MEDD. The dashboard allows data to be stratified, using the concomitant risk factors for suicide to assist facilities and their providers in the identification and prioritization of highest risk patients first.
An initial review of dashboard data in VISN 22 suggests that it is a useful tool for reducing high-dose opioid prescriptions (> 200 mg MEDD and > 120 mg but < 199 mg MEDD). Across the 5 VA locations in VISN 22, in the first 8 months of implementation, 4 locations were able to lower prescription opioid medication levels to the initial target of < 5%; 2 lowered rates even further (to < 3%). The VA Greater Los Angeles Healthcare System remains at a commendable 1%. Although the number of veterans with prescriptions totaling > 200 mg MEDD has decreased as a result, a greater reduction is expected with the coordinated education and systems improvement efforts associated with the national VHA Opioid Safety Initiative. As part of the process to lower the number of patients on high-dose opioids in the future, HCP and patient education will be provided in relation to the use of dashboard technology.
Limitations
There are several limitations that affect interpretation of the usefulness of the VISN 22 high-risk opioid dashboard. Prior to the implementation of the dashboard, 2 of 5 VISN sites already had efforts in place to reduce opioid overprescribing. The VA Greater Los Angeles Healthcare System had an opioid reduction program in place before the dashboard was implemented, so it is possible reductions in opioid prescribing were a result of their previous efforts and not related to the dashboard. Similarly the VA Long Beach Healthcare System had begun a quality improvement initiative to reduce high-dose opioid prescribing prior to dashboard implementation. However, it was difficult to pinpoint the direct effect the dashboard had on patient interventions due to lack of documentation of dashboard use in the clinical notes.
A direct relationship did exist between dashboard implementation and opioid dose reduction in patients with > 200 MEDD at the remaining 3 VISN 22 facilities. Overall, this suggests that the dashboard played a significant role across all sites. Implementation of the dashboard across VISN 22 was accompanied by an education effort that resulted in an increased awareness among HCPs to evaluate certain risks in patients on high-dose opioids and to evaluate the combination of opioid and CNS depressant use. Prior to dashboard implementation, there was no standardized monitoring system that cross-referenced high-dose opioid prescribing with psychiatric illness and suicide risk factors.
Conclusions
From 2000 to 2010, opioid prescriptions nearly doubled, yet this rate was not accompanied by a change/increase in the rate of nonopioid analgesic medication prescriptions.18 Health care providers need to account for veterans’ wishes for pain treatment and be aware of options other than opioids, particularly given the risk of opioid-related accidental or intentional overdose; it is imperative that treatment become more individualized and more closely monitored.19,20 It is recommended that opioids should be the treatment of last resort in managing chronic noncancer pain. The use of opioid prescription medications should be intended as a trial, supported by clear goals and an unequivocal understanding that doses will not be indiscriminately increased.20
Health care providers who prescribe opioids are ultimately responsible for monitoring risk factors that may increase overdose and death, and dashboard technology assists them in this effort. The VISN 22 high-risk opioid dashboard is a tool that allows providers to identify and prioritize veterans who are at high risk for overdose. Initial data collected suggest that the dashboard has decreased the risk of negative consequences associated with opioid medication use today. However, the authors wish to emphasize that this technology is only part of the solution; although it can be a tool to identify actions that may need to take place and can track progress of changes in care, there must be complementary efforts in provider and patient education, improved access to mental health care, and interdisciplinary models of care that expand current chronic pain treatment options. Future considerations of this technology may include incorporating other risk factors accounting for psychosocial variables specific to military personnel that may further increase the overall risk of overdose.
Acknowledgements
The authors wish to thank the leadership of VISN 22 for their support of this initiative. Dr. Kryskalla recognizes VA OI&T for making this work possible and her family for their support. Ms. Kern would like to thank Aaron, Leslie, and Rachel Kern for their continuous support. Dr. Hauser wishes to thank Cathy, Anika, Katia, Max, and Jirina Hauser for their unwavering support.
Author disclosures
The authors report no actual or potential conflicts of interest with regard to this article.
Disclaimer
The opinions expressed herein are those of the authors and do not necessarily reflect those of Federal Practitioner, Frontline Medical Communications Inc., the U.S. Government, or any of its agencies. This article may discuss unlabeled or investigational use of certain drugs. Please review the complete prescribing information for specific drugs or drug combinations—including indications, contraindications, warnings, and adverse effects—before administering pharmacologic therapy to patients.
[Published Online Ahead of Print: August 14, 2014.]
1. Brooks D. Hearing Spotlights painkiller overuse among soldiers. http://www.fayobserver.com/military/article_a6e4a2e9-827d-577c-a79a-87a6c07cf151.html. Fayobserver Website. Published October 10, 2013, Accessed June 9, 2014.
2. Seal KH, Shi Y, Cohen BE, Maguen S, Krebs EE, Neylan TC. Association of mental health disorders with prescription opioids and high-risk opioid use in US veterans of Iraq and Afghanistan. JAMA. 2012;307(9):940-947.
3. National Institute on Drug Abuse. DrugFacts: Substance Abuse in the Military. http://www.drugabuse.gov/publications/drugfacts/substance-abuse-in-military. National Institute on Drug Abuse Website. Revised March 2013. Accessed June 9, 2014.
4. Grattan A, Sullivan MD, Saunders KW, Campbell CI, Von Korff MR. Depression and prescription opioid misuse among chronic opioid therapy recipients with no history of substance abuse. Ann Fam Med. 2012;10(4):304-311.
5. Pergolizzi JV Jr, Gharibo C, Passik S, et al. Dynamic risk factors in the misuse of opioid analgesics. J Psychosom Res. 2012;72(6):443-451.
6. Dunn KM, Saunders KW, Rutter CM, et al. Opioid prescriptions for chronic pain and overdose: A cohort study. Ann Intern Med. 2010;152(2):85-92.
7. Substance Abuse and Mental Health Services Administration. SAMHSA Opioid Overdose Prevention Toolkit. HHS publication No. (SMA) 13-4742. Rockville, MD: Substance Abuse and Mental Health Service Administration; 2013.
8. Bohnert AS, Valenstein M, Bair MJ, et al. Association between opioid prescribing patterns and opioid overdose-related deaths. JAMA. 2011;305(13):1315-1321.
9. Campbell LC, Clauw DJ, Keefe FJ. Persistent pain and depression: A biopsychosocial perspective. Biol Psychiatry. 2003;54(3):399-409.
10. Gatchel RJ, Peng YB, Peters ML, Fuchs PN, Turk DC. The biopsychosocial approach to chronic pain: Scientific advances and future directions. Psychol Bull. 2007;133(4):581-624.
11. Gudin JA, Mogali S, Jones JD, Comer SD. Risks, management, and monitoring of combination opioid, benzodiazepine, and/or alcohol use. Postgrad Med. 2013;125(4):115-130.
12. Centers for Disease Control and Prevention. FastStats: Deaths and mortality. Centers for Disease Control and Prevention Website. http://www.cdc.gov/nchs/fastats/deaths.htm. Updated February 13, 2014. Accessed June 9, 2014.
13. Kemp J, Bossarte R. Suicide Data Report, 2012. U.S. Department of Veterans Affairs Website. http://www.va.gov/opa/docs/Suicide-Data-Report-2012-final.pdf. Accessed July 1, 2014.
14. National Institute of Mental Health. Suicide in the U.S. Statistics. National Institute of Mental Health Website. http://www.nimh.nih.gov/statistics/index.shtml. Accessed June 27, 2014.
15. Miller M, Hempstead K, Nguyen T, Barber C, Rosenberg-Wohl S, Azrael D. Method choice in nonfatal self-harm as a predictor of subsequent episodes of self-harm and suicide: Implications for clinical practice. Am J Public Health. 2013;103(6):e61-e68.
16. Hartl TL, Rosen C, Drescher K, Lee TT, Gusman F. Predicting high-risk behaviors in Veterans with posttraumatic stress disorder. J Nerv Ment Dis. 2005;193(7):464-472.
17. Substance Abuse and Mental Health Services Administration. Results from the 2010 National Survey on Drug Use and Health: Summary of National Findings. NSDUH Series H-41, HHS Publication No. (SMA) 11-4658. Rockville, MD: Substance Abuse and Mental Health Services Administration; 2011.
18. Daubresse M, Chang HY, Yu Y, et al. Ambulatory diagnosis and treatment of nonmalignant pain in the United States, 2000-2010. Med Care. 2013;51(10):870-878.
19. Bray RM, Pemberton MR, Lane ME, Hourani LL, Mattiko MJ, Babeu LA. Substance use and mental health trends among U.S. military active duty personnel. Key findings from the 2008 DoD Health Behavior Survey. Mil Med. 2010;175(6):390-399.
20. Cuevas-Trisan RL. The unfortunate turn of events in pain management. Fed Pract. 2013;30(3):8-9.
On October 10, 2013, a Congressional hearing was held to address the issue of opioid medication prescribing within VHA facilities and clinics (House Veteran Affairs Subcommittee hearing “Between Peril and Promise: Facing the Dangers of VA’s Skyrocketing Use of Prescription Painkillers to Treat Veterans”). Several individuals testified, including the widows of 2 veterans; both their husbands had overdosed on prescribed opioid medications. One husband had been taking as many as 15 pills a day and was additionally prescribed oxycodone/acetaminophen, which led to his death.1
Alongside the widows were 2 veterans who had been treated for chronic back pain injuries sustained before and during deployment in Iraq. Both had been prescribed several pain medications, including oxycodone/acetaminophen, methadone, and morphine. One reported that as his pain increased, his doctors continued to provide him additional prescriptions; at one point he had more than 13 prescriptions and could no longer work from being so “doped up.”1
In the past 2 decades, health care professionals (HCPs) have placed greater emphasis on chronic pain management. As a result, the rate of opioid medication prescribing has increased dramatically. Since 1994, the number of opioid medication prescriptions has nearly doubled; this change has been accompanied by an increase in opioid misuse, which has resulted in accidental or intentional overdose and death.2
Based on a recent National Institute on Drug Abuse (NIDA) report, the greatest impact has been on armed forces personnel.3 Prescriptions for pain relievers quadrupled between 2001 and 2009 to almost 3.8 million within the military population. Although civilian populations are more likely to abuse illicit drugs, military personnel are at particular risk of prescription abuse, including opioid medications.3 In 2008, 11% of armed forces service members reported misusing prescription drugs, with opioid medications being the most abused. This is an approximate 5- to 6-fold increase since 2002 (2% reported misuse in 2002).3 Particularly concerning is the associated rise in suicide rates among armed forces personnel, which surpassed civilian suicide rates in 2004. In 2009, one-third of suicides among armed forces personnel involved prescription drugs.3
Certain patient characteristics or factors are related to greater overdose risk. These risk factors include prescription dosage and frequency, history of suicide attempts or self-harm behavior, history of depression or posttraumatic stress disorder (PTSD) among other mental health-related diagnoses, a history of substance and/or alcohol abuse, and within the context of opioid medication use, the concurrent use of other central nervous system (CNS) depressants.4,5 Additionally, the stresses of deployment during wartime, physical injuries sustained in combat, and the unique military culture play a particularly important role in access to substances with high abuse potential and the subsequent development of substance abuse.3
Opioid Use and Risk Factors
More than 3% of adults in the U.S. are now receiving opioid medications for chronic noncancer pain.6 Substance abuse among patients with chronic pain ranges from 14% to 40%.5 Prescription opioid medications are the fastest growing drugs of abuse and the most common cause of unintentional overdose in the U.S.4 About 17,000 deaths occur each year as a result of prescription opioid medication overdose.7 Opioid medication-related overdose deaths began to increase in the early 2000s and continue to increase. Between 1999 and 2007, the rate of unintentional overdose-related deaths in the U.S. increased by 124%, largely due to the increase of prescription opioid medications.8
High-Dose Opioid Medication Use
A study by Dunn and colleagues found that patients receiving higher doses of prescribed opioid medications were at an increased risk of overdose.6 Patients receiving 50 mg to 99 mg morphine equivalent daily dose (MEDD) had a 3.7-fold increase in overdose risk (0.7% annual overdose rate) as compared with patients who received < 50 mg MEDD (0.2% annual overdose rate). Patients receiving ≥ 100 mg MEDD had a 1.8% annual overdose rate and a 9.8-fold increase in overdose risk as compared with patients who received < 50 mg MEDD. Overall, 51 patients experienced ≥ 1 overdose event, 40 of whom experienced fatal or serious overdoses and 6 of whom attempted suicide. Patients receiving the highest doses were male, current smokers, and had a history of depression and substance abuse.6 Similarly, a study by Bohnert and colleagues found that opioid medication overdose was most likely to occur in those patients with psychiatric and substance use disorders compared with patients who had no psychiatric illness history.8
Depression
Mood disorders are common in people with chronic pain.4,5,9,10 In particular, patients with a history of depression are more likely to receive chronic opioid medication prescriptions and are at a higher risk for opioid medication abuse. A substance abuse history is the most consistent predictor of both chronic opioid medication use and abuse. However, depression without substance abuse is significantly associated with 2 forms of opioid medication abuse: self-medication for stress or sleep and overmedication (using a higher dose than prescribed). More severe cases of depression show a stronger association for potential abuse.4
PTSD
Among Iraq and Afghanistan war veterans with ≥ 1 pain-related diagnosis, veterans with PTSD and veterans with a mental health disorder other than PTSD were significantly more likely to receive opioid medications for pain than were veterans without a mental health disorder (PTSD—17.8%, adjusted relative risk [RR] 2.58; other mental health disorder—11.7%, RR 1.74; no mental health disorder—6.5%).2 Although mental health disorders in general were related to a higher risk of opioid abuse, those with PTSD in particular were more likely to receive higher prescribed dosages; to continue taking opioids for a longer period; to receive concurrent prescriptions for opioid medications, sedative hypnotics, or both; to obtain early refills; and to have comorbid alcohol and substance use disorders. Based on these results, Seal and colleagues concluded that veterans with PTSD had the highest risk of alcohol, drug, and opioid-related accidents and overdose as well as self-inflicted injuries.2
Concurrent Use of Opioids and CNS Depressants
As mentioned earlier, studies suggest that people with PTSD are at a significantly higher risk for opioid medication overdose. One factor that may contribute to this higher risk is the concurrent use of CNS depressants/sedatives, particularly benzodiazepines and alcohol.
Benzodiazepines are often prescribed for people with PTSD. One study found that the concurrent use of benzodiazepines is significantly related to opioid overdose.5 Prescribing opioids for people already abusing or dependent on alcohol or other substances increases the risk of abuse and overdose. Furthermore, the concurrent use of multiple medications is associated with aberrant behaviors, cognitive impairment, and medication abuse, potentially leading to overdose. Overall, the combined administration of these medications is responsible for higher rates of adverse events, overdose, and death related to prescription opioid medication use.5,6,11
In summary, there are various risk factors that contribute to opioid medication overdose and more generally, risk of suicide, including (1) high-dose opioid medications; (2) history of psychiatric disorders, specifically depression and PTSD; (3) history of substance use disorders; and (4) concurrent use of opioid medications and prescription sedatives (specifically benzodiazepines) as well as alcohol and nonprescription drugs of abuse.
Suicide
Suicide is the tenth leading cause of death in the U.S., with 12.4 suicide deaths per 100,000 population.12 Suicide rates are even higher among veterans. According to the VHA, the age-adjusted rate of suicide for veterans using VHA facilities and clinics was 35.9 per 100,000 person-years for fiscal year 2009.13 Several risk factors for suicide attempts include depression and other mental health disorders, substance abuse, medical disorders, and prescription medications.
Prior suicide attempts or self-harm behavior is known to increase the risk of subsequent death by suicide. About 11 attempted suicides occur per suicide death where the medical severity of prior attempts increases the risk of future suicide, as does a history of multiple self-harm episodes.14,15 One study found that the single best predictor of suicide in a veteran population was an attempt in the previous 4 months.16
Among other risk factors, previous suicide attempts and violent behavior are major behavioral flags that warrant caution and require particular consideration when prescribing opioid medications. In a national survey on drug use and health, about 18% of prescription opioid users/abusers who experienced suicidal ideations actually attempted suicide. Only 11% of individuals who never used prescription opioid medications attempted suicide after reported suicidal ideations.17
Patient Data Aggregation
The early and widespread adoption of electronic medical records (EMRs) by the VHA allowed the aggregation of patient data for quality improvement. Initially, data were aggregated, and dashboards were designed retrospectively. However, the development of regional data warehouses that update patient information daily from the EMR allowed information to be aggregated prospectively, and dashboards were designed that provided real-time information.
The purpose of the current study is to demonstrate the efficacy and future potential of dashboard technology in assessing prospectively high-risk factors for opioid overdose. Dashboards are a user-friendly application that allows providers to isolate and calculate daily morphine equivalent opioid dosages and assess patients’ risk factors for overdose on an individual basis. By using this technology, providers who prescribe opioids can get a concise summary of opioid and other medications and adjust medications to decrease overdose risk on an individual basis.
What is the Dashboard?
The VISN 22 high-risk opioid dashboard is a business intelligence tool that serves as a report card, or progress report, to provide a global view of the number of veterans who are receiving opioid prescriptions totaling >120 mg MEDD and who have characteristics (history of depression, PTSD, substance abuse, or high-risk suicide flag) and prescriptions (concomitant CNS depressants) that may increase patient risk for overdose.
The VISN 22 dashboard allows the user to navigate to an individual HCP-level and patient-level report (Figures 1 and 2). Filter settings allow report users to select only high-risk patients; it serves as a single location for pertinent details to consider for safely prescribing opioids.
To calculate daily morphine equivalents, each patient’s opioid prescriptions were evaluated. The quantity was divided by the day’s supply to calculate an average daily quantity. From there, the drug strength was used to convert to MEDD. Health care providers were informed that these conversion factors were not recommendations for clinical opioid conversions.
Implementation and Design
In 2012, the VA Pharmacy Benefits Management (PBM) in VISN 21 created a dashboard that allowed users to identify patients on high-dose opioid prescriptions. Structured query language code was used to extract data from the regional data warehouse and calculate MEDD for all patients with active opioid prescriptions. In 2013, VISN 22 expanded that dashboard to incorporate factors that could indicate a high risk for overdose or other adverse outcomes, including a history of depression, PTSD, substance abuse or high-risk suicide flag, and concomitant use of CNS depressant medications.
The high-risk opioid dashboard (Figure 3) and accompanying patient-level report were first introduced to VISN 22 HCPs in January 2013. The business intelligence tools were introduced to each facility through the VISN 22 PBM group. Training on the use of the dashboard and the report was provided, with an initial target of decreasing MEDD of > 200 mg to < 5% of all veterans prescribed opioids at each VISN 22 facility. One month later (in February 2013), a second category of veterans (those with > 120 mg but < 199 mg MEDD) was added. Also the initial MEDD > 200 mg target of < 5% was decreased to < 3% to encourage additional progress.
Eight months after the VISN 22 dashboard technology was implemented there was a 17% decrease in patients with total daily morphine equivalents > 200 mg (January 2013; 1,137 patients vs August 2013; 940 patients—a decrease of 197 patients).
From March 2013 to August 2013, VISN 22 also saw a 12% decrease in the number of patients prescribed > 120 mg MEDD but < 199 MEDD (March 2013; 2,295 vs August 2013; 2,018—a decrease of 277 patients).
Figure 4 shows opioid use as of July 2014 for VISN 22 facilities. There were further reductions in the number of patients receiving > 120 mg but < 199 mg MEDD (August 2013; 2,018 patients vs July 2014; 1,189 patients) and patients receiving > 200 mg MEDD (August 2013; 940 patients vs July 2014; 836 patients).
Case Description
In January 2013, VISN 22 implemented dashboard technology to help providers assess and monitor opioid prescription levels in relation to high-risk variables. The benefits of this dashboard technology are illustrated in the case profile that follows.
A 67-year-old male veteran had a long history of chronic pain. Pain diagnoses included osteoarthritis with spine involvement, lumbar radiculopathy, arthralgia, and peripheral neuropathy. For the past 10 years, he was prescribed opioids with modest relief of his chronic pain symptoms despite recent prescriptions totaling 300 mg MEDD. This veteran had several risk factors for overdose, including a history of depression, suicide risk, PTSD, and concomitant use of the CNS depressants alprazolam and cyclobenzaprine.
More recently, in May 2013, the veteran exhibited aberrant behavior and requested early refills for alprazolam. In response, the pharmacist discussed the case with the HCP who prescribed the opioids, noting the concomitant overdose risk factors. As a result of this interaction, the veteran was referred for mental health services, and his prescriptions for opioids were gradually decreased. He is currently stable, now receiving 120 mg MEDD, and his pain is currently described as moderately controlled on the new lower dose.
In summary, this veteran was receiving > 200 mg MEDD with several known overdose risk factors. Once the HCP was made aware of these risk factors, necessary precautions were taken, and the veteran was safely tapered to a lower dose. Dashboard technology makes the list of risk factors readily available to HCPs who are prescribing (and the pharmacists reviewing the prescriptions), thus allowing a proactive discussion of risks and benefits before continuing, renewing, or initiating opioid prescriptions.
Discussion
As reported in 2013 by NIDA, the greater availability of opioid medications and the consequent increase in prescriptions may be contributing directly to their growing misuse by both civilians and military service personnel. A direct consequence has been an increase in both accidental and intentional overdose deaths.3 Several factors are related to the risk of overdose/death, including high-dose opioid medications, a history of psychiatric disorders (specifically depression and PTSD), a history of substance use disorders, concurrent use of opioid medications and prescription sedatives (specifically benzodiazepines) as well as alcohol and nonprescription drugs of abuse, and previous attempts of suicide.
The VISN 22 high-risk opioid dashboard was a rapid information technology response to the increasing risk faced by veterans who have chronic pain and comorbid psychiatric and substance use disorders and are prescribed opioids and CNS depressants. The purpose of implementing this dashboard technology was to assist HCPs in prescribing opioids safely, using a technology that allows for the monitoring and management of concomitant suicide risk factors. Following the national Opioid Safety Initiative, this dashboard tool is being used to identify veterans who are on high-dose opioids with the goal of reducing the number of veterans on > 200 mg MEDD. The dashboard allows data to be stratified, using the concomitant risk factors for suicide to assist facilities and their providers in the identification and prioritization of highest risk patients first.
An initial review of dashboard data in VISN 22 suggests that it is a useful tool for reducing high-dose opioid prescriptions (> 200 mg MEDD and > 120 mg but < 199 mg MEDD). Across the 5 VA locations in VISN 22, in the first 8 months of implementation, 4 locations were able to lower prescription opioid medication levels to the initial target of < 5%; 2 lowered rates even further (to < 3%). The VA Greater Los Angeles Healthcare System remains at a commendable 1%. Although the number of veterans with prescriptions totaling > 200 mg MEDD has decreased as a result, a greater reduction is expected with the coordinated education and systems improvement efforts associated with the national VHA Opioid Safety Initiative. As part of the process to lower the number of patients on high-dose opioids in the future, HCP and patient education will be provided in relation to the use of dashboard technology.
Limitations
There are several limitations that affect interpretation of the usefulness of the VISN 22 high-risk opioid dashboard. Prior to the implementation of the dashboard, 2 of 5 VISN sites already had efforts in place to reduce opioid overprescribing. The VA Greater Los Angeles Healthcare System had an opioid reduction program in place before the dashboard was implemented, so it is possible reductions in opioid prescribing were a result of their previous efforts and not related to the dashboard. Similarly the VA Long Beach Healthcare System had begun a quality improvement initiative to reduce high-dose opioid prescribing prior to dashboard implementation. However, it was difficult to pinpoint the direct effect the dashboard had on patient interventions due to lack of documentation of dashboard use in the clinical notes.
A direct relationship did exist between dashboard implementation and opioid dose reduction in patients with > 200 MEDD at the remaining 3 VISN 22 facilities. Overall, this suggests that the dashboard played a significant role across all sites. Implementation of the dashboard across VISN 22 was accompanied by an education effort that resulted in an increased awareness among HCPs to evaluate certain risks in patients on high-dose opioids and to evaluate the combination of opioid and CNS depressant use. Prior to dashboard implementation, there was no standardized monitoring system that cross-referenced high-dose opioid prescribing with psychiatric illness and suicide risk factors.
Conclusions
From 2000 to 2010, opioid prescriptions nearly doubled, yet this rate was not accompanied by a change/increase in the rate of nonopioid analgesic medication prescriptions.18 Health care providers need to account for veterans’ wishes for pain treatment and be aware of options other than opioids, particularly given the risk of opioid-related accidental or intentional overdose; it is imperative that treatment become more individualized and more closely monitored.19,20 It is recommended that opioids should be the treatment of last resort in managing chronic noncancer pain. The use of opioid prescription medications should be intended as a trial, supported by clear goals and an unequivocal understanding that doses will not be indiscriminately increased.20
Health care providers who prescribe opioids are ultimately responsible for monitoring risk factors that may increase overdose and death, and dashboard technology assists them in this effort. The VISN 22 high-risk opioid dashboard is a tool that allows providers to identify and prioritize veterans who are at high risk for overdose. Initial data collected suggest that the dashboard has decreased the risk of negative consequences associated with opioid medication use today. However, the authors wish to emphasize that this technology is only part of the solution; although it can be a tool to identify actions that may need to take place and can track progress of changes in care, there must be complementary efforts in provider and patient education, improved access to mental health care, and interdisciplinary models of care that expand current chronic pain treatment options. Future considerations of this technology may include incorporating other risk factors accounting for psychosocial variables specific to military personnel that may further increase the overall risk of overdose.
Acknowledgements
The authors wish to thank the leadership of VISN 22 for their support of this initiative. Dr. Kryskalla recognizes VA OI&T for making this work possible and her family for their support. Ms. Kern would like to thank Aaron, Leslie, and Rachel Kern for their continuous support. Dr. Hauser wishes to thank Cathy, Anika, Katia, Max, and Jirina Hauser for their unwavering support.
Author disclosures
The authors report no actual or potential conflicts of interest with regard to this article.
Disclaimer
The opinions expressed herein are those of the authors and do not necessarily reflect those of Federal Practitioner, Frontline Medical Communications Inc., the U.S. Government, or any of its agencies. This article may discuss unlabeled or investigational use of certain drugs. Please review the complete prescribing information for specific drugs or drug combinations—including indications, contraindications, warnings, and adverse effects—before administering pharmacologic therapy to patients.
[Published Online Ahead of Print: August 14, 2014.]
1. Brooks D. Hearing Spotlights painkiller overuse among soldiers. http://www.fayobserver.com/military/article_a6e4a2e9-827d-577c-a79a-87a6c07cf151.html. Fayobserver Website. Published October 10, 2013, Accessed June 9, 2014.
2. Seal KH, Shi Y, Cohen BE, Maguen S, Krebs EE, Neylan TC. Association of mental health disorders with prescription opioids and high-risk opioid use in US veterans of Iraq and Afghanistan. JAMA. 2012;307(9):940-947.
3. National Institute on Drug Abuse. DrugFacts: Substance Abuse in the Military. http://www.drugabuse.gov/publications/drugfacts/substance-abuse-in-military. National Institute on Drug Abuse Website. Revised March 2013. Accessed June 9, 2014.
4. Grattan A, Sullivan MD, Saunders KW, Campbell CI, Von Korff MR. Depression and prescription opioid misuse among chronic opioid therapy recipients with no history of substance abuse. Ann Fam Med. 2012;10(4):304-311.
5. Pergolizzi JV Jr, Gharibo C, Passik S, et al. Dynamic risk factors in the misuse of opioid analgesics. J Psychosom Res. 2012;72(6):443-451.
6. Dunn KM, Saunders KW, Rutter CM, et al. Opioid prescriptions for chronic pain and overdose: A cohort study. Ann Intern Med. 2010;152(2):85-92.
7. Substance Abuse and Mental Health Services Administration. SAMHSA Opioid Overdose Prevention Toolkit. HHS publication No. (SMA) 13-4742. Rockville, MD: Substance Abuse and Mental Health Service Administration; 2013.
8. Bohnert AS, Valenstein M, Bair MJ, et al. Association between opioid prescribing patterns and opioid overdose-related deaths. JAMA. 2011;305(13):1315-1321.
9. Campbell LC, Clauw DJ, Keefe FJ. Persistent pain and depression: A biopsychosocial perspective. Biol Psychiatry. 2003;54(3):399-409.
10. Gatchel RJ, Peng YB, Peters ML, Fuchs PN, Turk DC. The biopsychosocial approach to chronic pain: Scientific advances and future directions. Psychol Bull. 2007;133(4):581-624.
11. Gudin JA, Mogali S, Jones JD, Comer SD. Risks, management, and monitoring of combination opioid, benzodiazepine, and/or alcohol use. Postgrad Med. 2013;125(4):115-130.
12. Centers for Disease Control and Prevention. FastStats: Deaths and mortality. Centers for Disease Control and Prevention Website. http://www.cdc.gov/nchs/fastats/deaths.htm. Updated February 13, 2014. Accessed June 9, 2014.
13. Kemp J, Bossarte R. Suicide Data Report, 2012. U.S. Department of Veterans Affairs Website. http://www.va.gov/opa/docs/Suicide-Data-Report-2012-final.pdf. Accessed July 1, 2014.
14. National Institute of Mental Health. Suicide in the U.S. Statistics. National Institute of Mental Health Website. http://www.nimh.nih.gov/statistics/index.shtml. Accessed June 27, 2014.
15. Miller M, Hempstead K, Nguyen T, Barber C, Rosenberg-Wohl S, Azrael D. Method choice in nonfatal self-harm as a predictor of subsequent episodes of self-harm and suicide: Implications for clinical practice. Am J Public Health. 2013;103(6):e61-e68.
16. Hartl TL, Rosen C, Drescher K, Lee TT, Gusman F. Predicting high-risk behaviors in Veterans with posttraumatic stress disorder. J Nerv Ment Dis. 2005;193(7):464-472.
17. Substance Abuse and Mental Health Services Administration. Results from the 2010 National Survey on Drug Use and Health: Summary of National Findings. NSDUH Series H-41, HHS Publication No. (SMA) 11-4658. Rockville, MD: Substance Abuse and Mental Health Services Administration; 2011.
18. Daubresse M, Chang HY, Yu Y, et al. Ambulatory diagnosis and treatment of nonmalignant pain in the United States, 2000-2010. Med Care. 2013;51(10):870-878.
19. Bray RM, Pemberton MR, Lane ME, Hourani LL, Mattiko MJ, Babeu LA. Substance use and mental health trends among U.S. military active duty personnel. Key findings from the 2008 DoD Health Behavior Survey. Mil Med. 2010;175(6):390-399.
20. Cuevas-Trisan RL. The unfortunate turn of events in pain management. Fed Pract. 2013;30(3):8-9.

Another Reason Not to Smoke: Acute Eosinophilic Pneumonia
The following case was encountered and treated by Capt DellaVolpe during deployment with Operation Enduring Freedom-Trans Sahara on his tour as Special Operations Flight Surgeon with the Air Force Special Operations Command. The case highlights a rare but serious disease that can be particularly challenging to manage in military members serving overseas.
Case Presentation
After 2 days of worsening dyspnea on exertion, fever, and fatigue, a previously healthy 22-year-old man presented to a remote clinic established as part of a military deployment in central Africa. Despite having received azithromycin from a field medic, his condition continued to worsen. He had no cough, recent weight changes, or night sweats. The patient’s past medical history was unremarkable, including any prior history of pulmonary disorders.
The patient was a member of the U.S. Army Military Police Corps and had been deployed for 3 weeks. His job involved local patrols, and he had no history of airborne exposures, such as mold or chemical inhalants, or travel to sandy environments. Although he was previously a nonsmoker, he reported smoking local cigarettes to help him stay awake during night patrols over the past 2 weeks. The patient’s vaccination history included influenza, tetanus, measles/mumps/rubella, yellow fever, typhoid, hepatitis A/B, anthrax, meningococcus, and smallpox, all administered before deployment. At the time of evaluation, his temperature was 103.9°F, pulse 120 bpm, respiratory rate 32 breaths per minute, and blood pressure 110/70 mm Hg. His oxygen saturation was 80% on room air.
On examination, he was in significant distress and only able to speak in short sentences. There was no jugular venous distension or stridor. He was tachycardic, with a regular rhythm, without murmurs, rubs, or gallops. A pulmonary examination revealed decreased air movement bilaterally with bilateral inspiratory crackles at the bases. There was a tactile fremitus on the right side. He had no swelling or tenderness of the extremities, and no rashes were noted.
Laboratory capabilities were limited given the remote clinic location. Rapid malaria and rapid influenza were negative. A blood smear showed no organisms. A chest X-ray showed diffuse alveolar infiltrates and homogenous opacification of the right hemithorax.
The patient was placed on continuous oxygen by facemask and started on IV ceftriaxone and vancomycin. He was volume resuscitated with normal saline, with a modest effect on his heart rate. Attempts to wean his oxygen consumption were accompanied by an immediate oxygen desaturation to the low 80s. Because of the limited supply of oxygen available at the remote location as well as the patient’s poor response to broad-spectrum antibiotic coverage over the next 8 hours, he was evacuated by airborne casualty evacuation to the critical care team at Landstuhl Regional Medical Center in Germany.
Laboratory results revealed a peripheral leukocytosis with no eosinophilia. The patient underwent bronchoalveolar lavage (BAL), which showed 30% eosinophils. A diagnosis of acute eosinophilic pneumonia (AEP) was made, and the patient was started on IV methylprednisolone. He experienced a rapid resolution of symptoms and was completely weaned off oxygen 2 days later. The following week he was released from the hospital and able to return stateside to his unit.
Discussion
This case illustrates an uncommon but potentially life-threatening cause of respiratory failure, AEP. First described as a reversible, noninfectious cause of respiratory distress, AEP is now characterized as an uncommon yet severe febrile illness, which typically presents with hypoxia, pulmonary infiltrates, and increased eosinophilia on bronchoalveolar lavage in the absence of other causes.1-3 Untreated, AEP can progress to respiratory failure and death.
Acute eosinophilic pneumonia belongs to a heterogeneous group of disorders known as the eosinophilic lung syndromes. Although the pathophysiology has not been completely characterized, it is theorized that AEP is caused by a hypersensitivity reaction to an airborne antigen.2 Interleukin-5 has been implicated in the preferential activation of eosinophils and granule release and may be responsible for the eosinophilic alveolar exudates. In addition, interleukin-5 has been established as an eosinophil chemotactant.4-6
Acute eosinophilic pneumonia is relatively uncommon. Most epidemiologic studies have been limited to retrospective analyses and case series.7 However, the presentation of the disease suggests that it may be underdiagnosed.6,8 The most common presenting signs and symptoms are dyspnea, fever, cough, and crackles on inspiration. Acute eosinophilic pneumonia has been documented in men and women of all ages with a 2:1 male predominance, typically occurring in previously healthy individuals aged 18 to 40 years.9,10 Reports of AEP in infants also exist.11
Although idiopathic cases have been described in the literature, patients, on average, will have a history of airborne toxin exposure, including smoke, sand, dust, mold, or chemicals. However, a causal relationship has not been proven.12
Recent initiation of smoking has been associated with AEP, as was the case with this patient. This patient had no other history of airborne exposures, including burn pits, travel to sandy environments, mold, or chemical inhalants. Of all cases of AEP described to date, more than two-thirds have been associated with smoking.13,14 One Japanese case series further established the association through a “cigarette challenge test.”8,15,16 Typically, the patients described were in their mid-20s and rapidly developed symptoms consistent with AEP within 1 month of initiating smoking.
A high proportion of AEP has recently been described among newly deployed military personnel in Iraq.17 Out of 180,000 personnel deployed, 18 developed AEP with 14 having initiated smoking within 1 month of deployment. The authors concluded that compared with the controls, new-onset smokers had a significantly increased risk of developing AEP. Importantly, this case series describes 2 deaths associated with this disease, suggesting that this otherwise healthy population may have other environmental exposures that put them at a higher risk than that in the general population. Another case described a U.S. soldier in Korea with recent smoking history who was diagnosed with AEP on transbronchial lung biopsy.18
Given the nonspecific symptoms of the disease, early diagnosis relies on attention to clinical history, environmental exposures, and response to initial empiric treatment. Diagnosis is made based on pulmonary eosinophilia and exclusion of chronic causes of eosinophilic pulmonary disease, such as Churg-Strauss syndrome, chronic eosinophilic pneumonia, and tropical eosinophilia.9,19
Criteria for diagnosis has evolved since AEP was initially reported. Current criteria include acute onset febrile respiratory manifestations < 1-month duration, bilateral diffuse infiltrates on chest radiograph, arterial oxygen pressure of < 60 mm Hg or pulse oximetry < 90% on room air, and BAL > 25% eosinophils. Blood, sputum, and BAL cultures must be negative for bacteria, fungi, and parasitic causes.7 Exposure to toxins known to cause eosinophilia should also be ruled out. Therefore, timely BAL is of paramount importance in any suspected case of AEP. Peripheral blood count will usually show a nonspecific leukocytosis, with a normal distribution of eosinophils; however, it is not uncommon for peripheral eosinophilia to occur late in the disease.14,20 Pulmonary eosinophilia in the absence of a peripheral eosinophilia is likely due to pulmonary eosinophil sequestration.
In one case series, the mean duration of time from symptom onset until diagnosis was 3.5 days.13 Diagnosis usually occurs after the patient’s clinical status worsens despite broad-spectrum antibiotic therapy. Acute eosinophilic pneumonia typically appears on a chest radiograph as bilateral reticular nodules with interstitial patterning. Variability can exist between alveolar, interstitial, and mixed infiltrate patterns.19 Pleural effusions may also be seen. These nonspecific patterns allow AEP to be easily mistaken for a variety of other pathologies, such as acute respiratory distress syndrome and community acquired pneumonia.
Corticosteroid therapy is the mainstay of treatment for AEP. Intravenous methylprednisolone is typically administered at dosages of 60 mg to 125 mg every 6 hours, followed by an oral prednisone taper.21 Relapses of AEP are not typical, and the prognosis is typically excellent if identified rapidly and treated appropriately. In one study of 127 individuals treated with corticosteroids, all survived, and most were transferred out of the ICU after 3 days of treatment. Dyspnea improved on treatment day 3, and all symptoms disappeared with an average of 7 days of treatment.7
Conclusion
Acute eosinophilic pneumonia is likely to be underreported clinically. Presently, AEP is largely a diagnosis of exclusion; the current criteria for diagnosis are fairly rigid and rely on BAL while ruling out other identifiable causes (Table). Clinical suspicion should be raised in patients with a history of new-onset smoking or other airborne toxin exposure. The broad spectrum of clinical presentations and diagnostic findings leave important questions unanswered regarding the mechanisms of the disease.

This particular case illustrates the fundamental importance of taking a thorough history in any patient with a recent airborne exposure where AEP is suspected. Acute eosinophilic pneumonia should be considered in cases of pneumonia that continue to worsen despite the treatment of IV antibiotics; a BAL should be performed when appropriate.
Author disclosures
The authors report no actual or potential conflicts of interest with regard to this article.
Disclaimer
The opinions expressed herein are those of the authors and do not necessarily reflect those of Federal Practitioner, Frontline Medical Communications Inc., the U.S. Government, or any of its agencies. This article may discuss unlabeled or investigational use of certain drugs. Please review the complete prescribing information for specific drugs or drug combinations—including indications, contraindications, warnings, and adverse effects—before administering pharmacologic therapy to patients.
1. Allen JN, Pacht ER, Gadek JE, Davis WB. Acute eosinophilic pneumonia as a reversible cause of noninfectious respiratory failure. N Engl J Med. 1989;321(9):569-574.
2. Badesch DB, King TE Jr, Schwarz MI. Acute eosinophilic pneumonia: A hypersensitivity phenomenon? Am Rev Respir Dis. 1989;139(1):249-252.
3. Buchheit J, Eid N, Rodgers G Jr, Feger T, Yakoub O. Acute eosinophilic pneumonia with respiratory failure: A new syndrome? Am Rev Respir Dis. 1992;145(3):716-718.
4. Okubo Y, Hossain M, Kai R, et al. Adhesion molecules on eosinophils in acute eosinophilic pneumonia. Am J Respir Crit Care Med. 1995;151(4):1259-1262.
5. Allen JN, Liao Z, Wewers MD, Altenberger EA, Moore SA, Allen ED. Detection of IL-5 and IL-1 receptor antagonist in bronchoalveolar lavage fluid in acute eosinophilic pneumonia. J Allergy Clin Immunol. 1996;97(6):1366-1374.
6. Faustino L, da Fonseca DM, Takenaka MC, et al. Regulatory T cells migrate to airways via CCR4 and attenuate the severity of airway allergic inflammation. J Immunol. 2013;190(6):2614-2621.
7. Rhee CK, Min KH, Yim NY, et al. Clinical characteristics and corticosteroid treatment of acute eosinophilic pneumonia. Eur Respir J. 2013;41(2):402-409.
8. Shiota Y, Kawai T, Matsumoto H, et al. Acute eosinophilic pneumonia following cigarette smoking. Intern Med. 2000;39(10):830-833.
9. Pope-Harman AL, Davis WB, Allen ED, Christoforidis AJ, Allen JN. Acute eosinophilic pneumonia. A summary of 15 cases and review of the literature. Medicine (Baltimore). 1996;75(6):334-342.
10. Rose DM, Hrncir DE. Primary eosinophilic lung diseases. Allergy Asthma Proc. 2013;34(1):19-25.
11. Park HN, Chung BH, Pyun JE, et al. Idiopathic acute eosinophilic pneumonia in a 14-month-old girl. Korean J Pediatr. 2013;56(1):37-41.
12. Kolb AG, Ives ST, Davies SF. Diagnosis in just over a minute: A case of chronic eosinophilic pneumonia. J Gen Intern Med. 2013;28(7):972-975.
13. Janz DR, O’Neal HR Jr, Ely EW. Acute eosinophilic pneumonia: A case report and review of the literature. Crit Care Med. 2009;37(4):1470-1474.
14. Philit F, Etienne-Mastroïanni B, Parrot A, Guérin C, Robert D, Cordier JF. Idiopathic acute eosinophilic pneumonia: A study of 22 patients. Am J Respir Crit Care Med. 2002;166(9):1235-1239.
15. Miki K, Miki M, Nakamura Y, et al. Early-phase neutrophilia in cigarette smoke-induced acute eosinophilic pneumonia. Intern Med. 2003;42(9):839-845.
16. Watanabe K, Fujimura M, Kasahara K, et al. Acute eosinophilic pneumonia following cigarette smoking: A case report including cigarette-smoking challenge test. Intern Med. 2002;41(11):1016-1020.
17. Shorr AF, Scoville SL, Cersovsky SB, et al. Acute eosinophilic pneumonia among US Military personnel deployed in or near Iraq. JAMA.2004;
292(24):2997-3005.
18. Lim SY, Suh GY, Jeon K. Acute eosinophilic pneumonia presenting as life-threatening hypoxaemia necessitating extracorporeal membrane oxygenation. Int J Tuberc Lung Dis. 2012;16(12):1711-1712.
19. Allen JN, Davis WB. Eosinophilic lung diseases. Am J Respir Crit Care Med. 1994;150(5, pt 1):1423-1438.
20. Hayakawa H, Sato A, Toyoshima M, Imokawa S, Taniguchi M. A clinical study of idiopathic eosinophilic pneumonia. Chest. 1994;105(5):1462-1466.
21. Jantz MA, Sahn SA. Corticosteroids in acute respiratory failure. Am J Respir Crit Care Med. 1999;160(4):1079-1100.
The following case was encountered and treated by Capt DellaVolpe during deployment with Operation Enduring Freedom-Trans Sahara on his tour as Special Operations Flight Surgeon with the Air Force Special Operations Command. The case highlights a rare but serious disease that can be particularly challenging to manage in military members serving overseas.
Case Presentation
After 2 days of worsening dyspnea on exertion, fever, and fatigue, a previously healthy 22-year-old man presented to a remote clinic established as part of a military deployment in central Africa. Despite having received azithromycin from a field medic, his condition continued to worsen. He had no cough, recent weight changes, or night sweats. The patient’s past medical history was unremarkable, including any prior history of pulmonary disorders.
The patient was a member of the U.S. Army Military Police Corps and had been deployed for 3 weeks. His job involved local patrols, and he had no history of airborne exposures, such as mold or chemical inhalants, or travel to sandy environments. Although he was previously a nonsmoker, he reported smoking local cigarettes to help him stay awake during night patrols over the past 2 weeks. The patient’s vaccination history included influenza, tetanus, measles/mumps/rubella, yellow fever, typhoid, hepatitis A/B, anthrax, meningococcus, and smallpox, all administered before deployment. At the time of evaluation, his temperature was 103.9°F, pulse 120 bpm, respiratory rate 32 breaths per minute, and blood pressure 110/70 mm Hg. His oxygen saturation was 80% on room air.
On examination, he was in significant distress and only able to speak in short sentences. There was no jugular venous distension or stridor. He was tachycardic, with a regular rhythm, without murmurs, rubs, or gallops. A pulmonary examination revealed decreased air movement bilaterally with bilateral inspiratory crackles at the bases. There was a tactile fremitus on the right side. He had no swelling or tenderness of the extremities, and no rashes were noted.
Laboratory capabilities were limited given the remote clinic location. Rapid malaria and rapid influenza were negative. A blood smear showed no organisms. A chest X-ray showed diffuse alveolar infiltrates and homogenous opacification of the right hemithorax.
The patient was placed on continuous oxygen by facemask and started on IV ceftriaxone and vancomycin. He was volume resuscitated with normal saline, with a modest effect on his heart rate. Attempts to wean his oxygen consumption were accompanied by an immediate oxygen desaturation to the low 80s. Because of the limited supply of oxygen available at the remote location as well as the patient’s poor response to broad-spectrum antibiotic coverage over the next 8 hours, he was evacuated by airborne casualty evacuation to the critical care team at Landstuhl Regional Medical Center in Germany.
Laboratory results revealed a peripheral leukocytosis with no eosinophilia. The patient underwent bronchoalveolar lavage (BAL), which showed 30% eosinophils. A diagnosis of acute eosinophilic pneumonia (AEP) was made, and the patient was started on IV methylprednisolone. He experienced a rapid resolution of symptoms and was completely weaned off oxygen 2 days later. The following week he was released from the hospital and able to return stateside to his unit.
Discussion
This case illustrates an uncommon but potentially life-threatening cause of respiratory failure, AEP. First described as a reversible, noninfectious cause of respiratory distress, AEP is now characterized as an uncommon yet severe febrile illness, which typically presents with hypoxia, pulmonary infiltrates, and increased eosinophilia on bronchoalveolar lavage in the absence of other causes.1-3 Untreated, AEP can progress to respiratory failure and death.
Acute eosinophilic pneumonia belongs to a heterogeneous group of disorders known as the eosinophilic lung syndromes. Although the pathophysiology has not been completely characterized, it is theorized that AEP is caused by a hypersensitivity reaction to an airborne antigen.2 Interleukin-5 has been implicated in the preferential activation of eosinophils and granule release and may be responsible for the eosinophilic alveolar exudates. In addition, interleukin-5 has been established as an eosinophil chemotactant.4-6
Acute eosinophilic pneumonia is relatively uncommon. Most epidemiologic studies have been limited to retrospective analyses and case series.7 However, the presentation of the disease suggests that it may be underdiagnosed.6,8 The most common presenting signs and symptoms are dyspnea, fever, cough, and crackles on inspiration. Acute eosinophilic pneumonia has been documented in men and women of all ages with a 2:1 male predominance, typically occurring in previously healthy individuals aged 18 to 40 years.9,10 Reports of AEP in infants also exist.11
Although idiopathic cases have been described in the literature, patients, on average, will have a history of airborne toxin exposure, including smoke, sand, dust, mold, or chemicals. However, a causal relationship has not been proven.12
Recent initiation of smoking has been associated with AEP, as was the case with this patient. This patient had no other history of airborne exposures, including burn pits, travel to sandy environments, mold, or chemical inhalants. Of all cases of AEP described to date, more than two-thirds have been associated with smoking.13,14 One Japanese case series further established the association through a “cigarette challenge test.”8,15,16 Typically, the patients described were in their mid-20s and rapidly developed symptoms consistent with AEP within 1 month of initiating smoking.
A high proportion of AEP has recently been described among newly deployed military personnel in Iraq.17 Out of 180,000 personnel deployed, 18 developed AEP with 14 having initiated smoking within 1 month of deployment. The authors concluded that compared with the controls, new-onset smokers had a significantly increased risk of developing AEP. Importantly, this case series describes 2 deaths associated with this disease, suggesting that this otherwise healthy population may have other environmental exposures that put them at a higher risk than that in the general population. Another case described a U.S. soldier in Korea with recent smoking history who was diagnosed with AEP on transbronchial lung biopsy.18
Given the nonspecific symptoms of the disease, early diagnosis relies on attention to clinical history, environmental exposures, and response to initial empiric treatment. Diagnosis is made based on pulmonary eosinophilia and exclusion of chronic causes of eosinophilic pulmonary disease, such as Churg-Strauss syndrome, chronic eosinophilic pneumonia, and tropical eosinophilia.9,19
Criteria for diagnosis has evolved since AEP was initially reported. Current criteria include acute onset febrile respiratory manifestations < 1-month duration, bilateral diffuse infiltrates on chest radiograph, arterial oxygen pressure of < 60 mm Hg or pulse oximetry < 90% on room air, and BAL > 25% eosinophils. Blood, sputum, and BAL cultures must be negative for bacteria, fungi, and parasitic causes.7 Exposure to toxins known to cause eosinophilia should also be ruled out. Therefore, timely BAL is of paramount importance in any suspected case of AEP. Peripheral blood count will usually show a nonspecific leukocytosis, with a normal distribution of eosinophils; however, it is not uncommon for peripheral eosinophilia to occur late in the disease.14,20 Pulmonary eosinophilia in the absence of a peripheral eosinophilia is likely due to pulmonary eosinophil sequestration.
In one case series, the mean duration of time from symptom onset until diagnosis was 3.5 days.13 Diagnosis usually occurs after the patient’s clinical status worsens despite broad-spectrum antibiotic therapy. Acute eosinophilic pneumonia typically appears on a chest radiograph as bilateral reticular nodules with interstitial patterning. Variability can exist between alveolar, interstitial, and mixed infiltrate patterns.19 Pleural effusions may also be seen. These nonspecific patterns allow AEP to be easily mistaken for a variety of other pathologies, such as acute respiratory distress syndrome and community acquired pneumonia.
Corticosteroid therapy is the mainstay of treatment for AEP. Intravenous methylprednisolone is typically administered at dosages of 60 mg to 125 mg every 6 hours, followed by an oral prednisone taper.21 Relapses of AEP are not typical, and the prognosis is typically excellent if identified rapidly and treated appropriately. In one study of 127 individuals treated with corticosteroids, all survived, and most were transferred out of the ICU after 3 days of treatment. Dyspnea improved on treatment day 3, and all symptoms disappeared with an average of 7 days of treatment.7
Conclusion
Acute eosinophilic pneumonia is likely to be underreported clinically. Presently, AEP is largely a diagnosis of exclusion; the current criteria for diagnosis are fairly rigid and rely on BAL while ruling out other identifiable causes (Table). Clinical suspicion should be raised in patients with a history of new-onset smoking or other airborne toxin exposure. The broad spectrum of clinical presentations and diagnostic findings leave important questions unanswered regarding the mechanisms of the disease.
This particular case illustrates the fundamental importance of taking a thorough history in any patient with a recent airborne exposure where AEP is suspected. Acute eosinophilic pneumonia should be considered in cases of pneumonia that continue to worsen despite the treatment of IV antibiotics; a BAL should be performed when appropriate.
Author disclosures
The authors report no actual or potential conflicts of interest with regard to this article.
Disclaimer
The opinions expressed herein are those of the authors and do not necessarily reflect those of Federal Practitioner, Frontline Medical Communications Inc., the U.S. Government, or any of its agencies. This article may discuss unlabeled or investigational use of certain drugs. Please review the complete prescribing information for specific drugs or drug combinations—including indications, contraindications, warnings, and adverse effects—before administering pharmacologic therapy to patients.
1. Allen JN, Pacht ER, Gadek JE, Davis WB. Acute eosinophilic pneumonia as a reversible cause of noninfectious respiratory failure. N Engl J Med. 1989;321(9):569-574.
2. Badesch DB, King TE Jr, Schwarz MI. Acute eosinophilic pneumonia: A hypersensitivity phenomenon? Am Rev Respir Dis. 1989;139(1):249-252.
3. Buchheit J, Eid N, Rodgers G Jr, Feger T, Yakoub O. Acute eosinophilic pneumonia with respiratory failure: A new syndrome? Am Rev Respir Dis. 1992;145(3):716-718.
4. Okubo Y, Hossain M, Kai R, et al. Adhesion molecules on eosinophils in acute eosinophilic pneumonia. Am J Respir Crit Care Med. 1995;151(4):1259-1262.
5. Allen JN, Liao Z, Wewers MD, Altenberger EA, Moore SA, Allen ED. Detection of IL-5 and IL-1 receptor antagonist in bronchoalveolar lavage fluid in acute eosinophilic pneumonia. J Allergy Clin Immunol. 1996;97(6):1366-1374.
6. Faustino L, da Fonseca DM, Takenaka MC, et al. Regulatory T cells migrate to airways via CCR4 and attenuate the severity of airway allergic inflammation. J Immunol. 2013;190(6):2614-2621.
7. Rhee CK, Min KH, Yim NY, et al. Clinical characteristics and corticosteroid treatment of acute eosinophilic pneumonia. Eur Respir J. 2013;41(2):402-409.
8. Shiota Y, Kawai T, Matsumoto H, et al. Acute eosinophilic pneumonia following cigarette smoking. Intern Med. 2000;39(10):830-833.
9. Pope-Harman AL, Davis WB, Allen ED, Christoforidis AJ, Allen JN. Acute eosinophilic pneumonia. A summary of 15 cases and review of the literature. Medicine (Baltimore). 1996;75(6):334-342.
10. Rose DM, Hrncir DE. Primary eosinophilic lung diseases. Allergy Asthma Proc. 2013;34(1):19-25.
11. Park HN, Chung BH, Pyun JE, et al. Idiopathic acute eosinophilic pneumonia in a 14-month-old girl. Korean J Pediatr. 2013;56(1):37-41.
12. Kolb AG, Ives ST, Davies SF. Diagnosis in just over a minute: A case of chronic eosinophilic pneumonia. J Gen Intern Med. 2013;28(7):972-975.
13. Janz DR, O’Neal HR Jr, Ely EW. Acute eosinophilic pneumonia: A case report and review of the literature. Crit Care Med. 2009;37(4):1470-1474.
14. Philit F, Etienne-Mastroïanni B, Parrot A, Guérin C, Robert D, Cordier JF. Idiopathic acute eosinophilic pneumonia: A study of 22 patients. Am J Respir Crit Care Med. 2002;166(9):1235-1239.
15. Miki K, Miki M, Nakamura Y, et al. Early-phase neutrophilia in cigarette smoke-induced acute eosinophilic pneumonia. Intern Med. 2003;42(9):839-845.
16. Watanabe K, Fujimura M, Kasahara K, et al. Acute eosinophilic pneumonia following cigarette smoking: A case report including cigarette-smoking challenge test. Intern Med. 2002;41(11):1016-1020.
17. Shorr AF, Scoville SL, Cersovsky SB, et al. Acute eosinophilic pneumonia among US Military personnel deployed in or near Iraq. JAMA.2004;
292(24):2997-3005.
18. Lim SY, Suh GY, Jeon K. Acute eosinophilic pneumonia presenting as life-threatening hypoxaemia necessitating extracorporeal membrane oxygenation. Int J Tuberc Lung Dis. 2012;16(12):1711-1712.
19. Allen JN, Davis WB. Eosinophilic lung diseases. Am J Respir Crit Care Med. 1994;150(5, pt 1):1423-1438.
20. Hayakawa H, Sato A, Toyoshima M, Imokawa S, Taniguchi M. A clinical study of idiopathic eosinophilic pneumonia. Chest. 1994;105(5):1462-1466.
21. Jantz MA, Sahn SA. Corticosteroids in acute respiratory failure. Am J Respir Crit Care Med. 1999;160(4):1079-1100.
Pharmacists in the Emergency Department: Feasibility and Cost
Clinical pharmacists have expanded their role over the past few decades in both outpatient and inpatient settings and are now members of an interdisciplinary health care team that includes nutritionists, physical therapists, physicians, and nurses.1,2 The emergency department (ED), however, has lagged behind in the inclusion of pharmacists.3 Despite well documented financial and ED operational benefits of pharmacists and the recommendation of their inclusion by the Institute of Medicine, only about 30% of academic EDs in a 2009 survey employed a pharmacist.4-8 A larger 2005 survey of 510 hospital pharmacy directors revealed that only 3.5% of hospitals sampled (academic and nonacademic) provided clinical pharmacy services in the ED.9
About 3.8 million annual preventable medical errors occur in the ED, giving the ED the highest rate of medication errors among all hospital departments.4 In 2000, Schenkel found that 3% of all inpatient medication errors were initiated in the ED.10 Similarly, Chin and colleagues found that 3.6% of elderly patients were administered an inappropriate medication in the ED with 5.6% receiving an inappropriate prescription at discharge.11
In a 2008 study conducted at the Durham VAMC in North Carolina, Hastings and colleagues found that suboptimal pharmacy was common among elderly veterans discharged from the ED (11%) and that potentially inappropriate medication use was associated with a 32% greater risk of repeat ED visits, hospitalization, or death (P = .10).12 In 2010, Rothschild and colleagues found 7.8 medication errors per 100 ED patients or 2.9 errors per 100 prescribed medications.13 Despite this unacceptably high rate of medication errors, most EDs do not employ pharmacy specialists or have a pharmacist easily available for consultation—options that could not only streamline ED operations, but also reduce patient risk.
The pharmacist role in the ED has changed considerably. In the 1970s, ED pharmacists were used mainly to dispense medicine, maintain inventories, and participate in cardiopulmonary resuscitation.3,14,15 Today, following the guidelines set by the American Society for Health-System Pharmacists, emergency pharmacists have an expanded, more direct role in patient care and evaluation and support of the physicians and other ED staff who work alongside them.4,14,16,17 Pharmacists gather accurate and complete medication histories, review and reconcile medication lists, and screen ED medication orders for errors or anticipated drug interactions.13,18-23 They adjust medication doses on a patient-by-patient basis, accounting for renal and hepatic clearance and closely monitor patients for treatment response. They also provide one-on-one patient education on medication dosing, administration, adverse drug events (ADEs), and interactions, increasing patients’ drug knowledge and adherence.17,24 Pharmacists provide information to patients on vaccinations and medication assistance programs, which is unlikely to be shared by other providers.3,19,20 Pharmacists in the ED reduce medication delays and omissions that occur in admitted patients staying in the ED.25,26
Aside from patient education, clinical pharmacists have an important role in providing education and consultation to ED physicians, midlevel providers, and house staff on topics that include availability of new medications and local antibiotic resistance patterns.14,27-29 Additionally, pharmacists monitor drug supplies and restock medications to avoid shortages during critical moments, offer the ED perspective in hospital formulary reviews, and increase efficiency and throughput in the ED while decreasing costs by evaluating and treating patients who present simply for prescription refills alongside a supervising physician.14
With this in mind, the ED of the Atlanta VAMC in Decatur, Georgia, conducted a pilot study to assess the financial and logistic feasibility of a full-time pharmacist in the ED setting with the hope that a pharmacist would integrate well into the health care team, reducing overall departmental expense and the risk of medication error associated with patient harm and simultaneously improving patient satisfaction and departmental efficiency.
Methodology
The ED of the Atlanta VAMC is part of a tertiary care teaching hospital affiliated with both the Emory and Morehouse schools of medicine. At the time of the pilot, the facility had 128 acute care medical/surgical beds, 12 inpatient palliative care beds, 40 acute care psychiatric beds, 24 medical surgical intensive care unit beds, and 60 inpatient nursing home beds. The ED provides care to > 37,000 veterans annually, and in December 2011 when this study was conducted, 3,195 veterans were seen in the ED.
The ED was divided into the main ED and the urgent care. Patient intake occurred through a centralized triage, and based on acuity, patients were sent to the appropriate setting for treatment. The ED used a 5-tier triage system. Patients with triage levels 1, 2, and 3 were sent to the main ED, and patients with triage levels 4 and 5 were sent to the urgent care.
Pharmacists
Pharmacy services were provided by 5 residency-trained doctors of pharmacy employed by the medical center working as clinical pharmacists with the inpatient medical teams at the time of the pilot. The pilot was conducted over a 2-week period in December 2011, Monday through Friday, for a total of 10 days. The clinical pharmacists divided the days among themselves. Each pharmacist provided services for a total of 2 days, 3 hours per day, from about 3 pm to 6 pm. The pharmacists were given a room previously used as a physician workroom in which to evaluate patients.
Patient Selection
Patients to be seen by the clinical pharmacist were chosen by the triage nurse, the charge nurse, the ED physician, the urgent care provider (physician or midlevel provider), or by the pharmacists. The triage nurse or charge nurse, based on chief medical problem and acuity, chose patients directly out of triage. Only patients with triage acuity level 4 or 5 were taken directly from triage without first seeing a physician or midlevel provider. These patients presented with the chief problem of medication refill or coumadin/International Normalized Ratio check. Once chosen as appropriate for the clinical pharmacist, the charge nurse helped with patient flow, and if the pharmacist was occupied with other patients, the nurse redirected the patient to urgent care.
Additional patients were chosen to see the clinical pharmacist after an evaluation of their initial problem was completed by a physician or midlevel practitioner in the urgent care or main ED. Patients whom the provider felt could benefit from any of the following services were directed to the clinical pharmacist: anticoagulation consult, diabetic education, pharmacokinetic consult, medication history, medication reconciliation, formulary management, medication refills, therapeutic interchange, screening for drug interactions, allergy review, and nonformulary or restricted medications requests. Additionally, the clinical pharmacist reviewed the charts of patients in the main ED whom they were not asked to see. They offered assistance when needed in all the aforementioned areas and for order clarification, assuring IV compatibility, reporting medication errors and ADEs, promotion of safe medical practices, and elimination of duplicate/redundant medications.
Data Collection
The pharmacists developed a log to record their activities. The log included the date and time of the intervention, number of minutes spent with the patient, the reason for intervention, and recommendations, if applicable. They categorized their interventions into 16 categories: anticoagulation, pharmacokinetics, drug information, order clarification, medication reconciliation, therapeutic interchange, formulary management, medication history, IV compatibility, screening for drug interactions, patient education, allergy documentation, promotion of safe medical practices, reporting of medication error/ADEs, nonformulary and restricted medication requests, and prescription refills. Patients could receive more than 1 intervention.
Though not a focus of this pilot, all patients seen by a pharmacist received a postencounter survey seeking their opinion on whether the pharmacist improved the value of their visit.
Review Process
At the conclusion of the pilot, 2 independent reviewers, both physicians, reviewed the logs, and each task was reassigned to 1 of 8 categories. These categories included either medication refills or 1 of 7 other areas that had established cost avoidance estimates from 2 other well accepted studies (Lee and colleagues and Ling and colleagues).30,31 These 7 categories included adjusting dose or frequency of medication, elimination of duplication of therapy, education/information inquiry, formulary management, prevention and management of ADEs, prevention or management of allergies, and therapeutic interchange. If the independent reviewers did not have initial concordance of classification of the intervention, they discussed the intervention and came to an agreement.
Cost Analysis
Cost avoidance estimates for 7 individual interventions were made, using data from Lee and colleagues and Ling and colleagues.30,31 Four of these came from the study by Lee and colleagues: prevent or manage drug allergy, adjust dosage or frequency, prevent or manage ADEs, and eliminate duplication of therapy.30 Lee and colleagues’ “drug interaction” group was not clearly defined, thus this was included with the “prevent or manage ADE” group. Ling and colleagues provided data for the 3 additional groups of interventions that pharmacists performed: education and information inquiry, formulary management, and therapeutic interchange.31
Financial estimates of cost avoidance were adjusted for inflation, using the consumer price index (CPI) of the U.S. Bureau of Labor Statistics.32 The Lee study was conducted in 2002, and estimates for cost avoidance using their model were adjusted to 2011 values using the CPI inflation rate of 25%. The Ling study was conducted in 2005, and estimates for cost avoidance using their model were adjusted for 2011 values using the CPI rate of inflation of 15.2%.32
For the remaining intervention, prescription refill, cost savings was determined by calculating the average times spent by the ED pharmacist on each intervention and then using the difference between hourly physician and pharmacist pay (about $50/h difference based on VA wage tables).
RESULTS
During the 30-hour total time in which a pharmacist was present in the ED, a total of 42 patients were assisted through 71 interventions (Table 1).
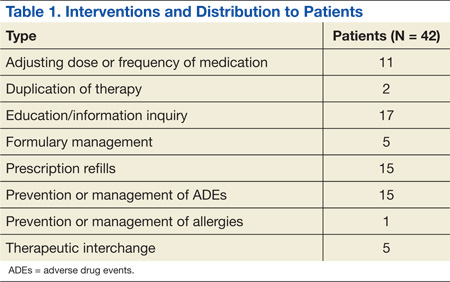
Pharmacists provided a diverse range of services to patients in the ED. The most common intervention was education and/or information inquiry. Tasks in this category included patient education about medication dosing, administration, AEs, interactions and warnings, as well as diabetes management. In several instances, education was provided to attending physicians or house staff, though it should be noted that this provider education was not counted as an intervention for this study unless it was associated with a patient (of which there were 3 total instances, eg, instruction on how to choose the proper insulin syringe).
Interventions, when a medication list was screened by the ED pharmacist for interactions or when drug choices were recommended to the physician or midlevel providers, were counted as prevention and management of ADEs. For example, the pharmacist noted a patient with a new diagnosis of gout who was prescribed hydrochlorothiazide; this was brought to the attention of the provider and alternative antihypertensives were suggested. In another instance, a patient was found to be on both ibuprofen and enoxaparin; the treating physician was alerted of this potential interaction. There were 15 such events in total.
Several other interventions arose from the screenings for ADEs, including adjusting dose or frequency of medication (11); therapeutic interchange (5); eliminating duplication of therapy (2); and prevention or management of allergies (1). Cases included hepatic and/or renal dose changes, substituting equivalent medications for better treatment outcome or adherence, or discontinuing 2 or more medications in a patient’s medication profile that were considered duplication.
During the pharmacist screening, one patient who had piperacillin/tazobactam ordered in the ED had a penicillin allergy. This intervention was categorized as prevention and management of an ADE as well as prevention and management of allergies. Interventions not accompanied by the “prevention of ADE” category included those in which the change did not provide a clear risk reduction. For example, one therapeutic interchange was from levofloxacin to moxifloxacin for a better-anticipated therapy. Another was a metformin dose increase, presumably for improved glycemic control.
Prescription refills occurred with the same frequency as prevention of ADEs.15 This intervention led in some cases to switching to pharmaceutical equivalents when a drug prescribed at another facility was not on the formulary. Other drugs that were not on the preferred list but available with nonformulary medication requests were ordered or approved with the assistance of the pharmacist. The pharmacist’s direct involvement significantly reduced the initial contact-to-approval time for these patients.
After tallying the total number of interventions, the potential financial cost savings to the ED were determined (Table 2). As mentioned previously, the Lee and Ling studies provided the categories for classification of 7 pharmacist interactions. The estimated cost avoidance for the 4 applicable groups from the Lee study had inflation-corrected values of $1,486 per adjusted dose or frequency of medication, $205 per elimination of duplication of therapy, $1,374 per prevention or management of ADEs, and $1,721 per prevention or management of allergies.30
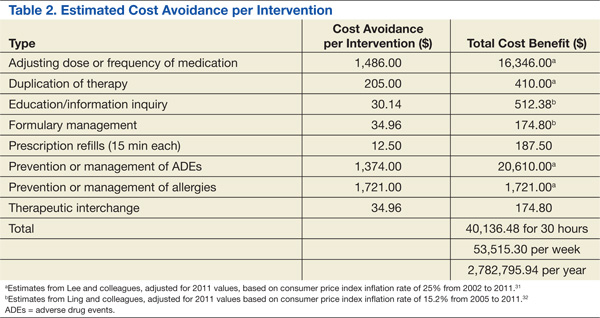
The estimated cost avoidance for the 3 applicable groups from the Ling study had inflation-corrected values of $512.38 per education/information inquiry, $174.80 per formulary management, and $174.80 per therapeutic interchange.31 The eighth group, prescription refills, was valued at $12.50 each, using the difference between physician and pharmacist salary for an average of 15 minutes per interaction.
When multiplied by the number of interventions in each of these groups, the total potential cost avoidance in the study period was about $40,136.48. Extrapolated into a yearly amount, that is a $2,782,795.94 potential cost savings for the medical center.
Seventeen of the 42 (40.5%) postencounter surveys from the patients seen by the pharmacists were received. Of these veterans, 100% reported that they were “extremely satisfied” with the treatment they had received during their visit to the ED.
DISCUSSION
There is the potential for significant cost avoidance by adding a single full-time pharmacist to the ED: Annually, more than $2.7 million in potential savings for the medical center. Though surprising, this figure is actually in line with the much larger study by Lada and colleagues in which an estimated $3 million was avoided.15 At the same hospital 12 years earlier, Levy noted about $1 million in cost avoidance (not inflation-adjusted).33 The Ling study, however, did not have as high a figure, with annual cost avoidance estimated at $600,000.31 All these figures are based on estimates and, therefore, imprecise, but it is clear even using the most conservative model that the cost to employ a clinical pharmacist is justified.
The final value of cost savings is likely significantly underestimated relative to non-VA hospitals due to the decision to correct for inflation, using the total market inflation rate rather than the medical sector inflation rate over the same time period. The Lee study values were increased by 25.0% and the Ling study values by 15.2%, to bring them to 2011 amounts. Using the medical inflation rate instead (42.3% and 25.2%, respectively), an additional $378,000 in annual savings would have been realized. The lower CPI inflation rate rather than the higher rate in the medical sector was chosen to make the cost avoidance outcomes more conservative.
The true value of a clinical pharmacist comes from the services they provide to patients. In this pilot, as well as in several others, it has been shown that education is a commonly performed and highly valued task. Education was a service lacking in this ED prior to this intervention due to financial and logistical constraints. It is unclear how much instruction patients receive at the outpatient pharmacy while picking up medications after leaving the ED, but it is likely limited, given the large volumes and long lines often found at the in-house pharmacy. Education has a demonstrated effect on prevention and management of ADEs and was the most interactive of the interventions the pharmacist provided during this study. This type of intervention was most likely the source of increased patient satisfaction that was noted in the postencounter surveys.17,24
Prevention of ADEs, which was a frequent intervention in this pilot, has been noted by many sources to be the single most beneficial task performed by a clinical pharmacist both from financial and risk reduction standpoints.13,21-23 Although not able to assess patient outcomes after this limited pilot, the authors anticipate such an evaluation when a full-time ED pharmacist joins the department.
The Joint Commission recommends that a pharmacist review all medication orders before administration, though there is an exception for the emergency setting.34 The Joint Commission also recommends medication reconciliation at every visit, including those in the ED setting. The addition of a clinical pharmacist would increase compliance with this and other standards and bring ED operations up to the same benchmark as other practice settings.
LIMITATIONS
The most significant limitation of this study was sample size. The volunteered time of the pharmacists in the ED totaled only 30 hours over 2 weeks. In that limited time, however, the pharmacists had more patient interactions than were anticipated. Had the pilot been conducted over a longer period, it is unclear whether this would have been sustained or whether this was a coincidental overestimate of the effect that a full-time pharmacist would have on the department. Likely, it is an underestimate of their potential, as the availability of the pharmacist was novel and likely underused by other providers. Given more time with the ED staff, pharmacists would be more frequently called on for their expertise, because their skills and knowledge set would be better understood. During this pilot, the pharmacist was located in a separate room in the ED where not all ED staff knew they were available for consultation.
The other major limitation of the pilot was the inherent imprecision of cost avoidance estimates. The dollar amounts attributed to the duties fulfilled by the pharmacists relied on 2 studies. The first, by Lee and colleagues, provided cost avoidance estimates of certain pharmacist actions based on a combination of 4 to 5 clinicians’ estimates of risk reduction, combined with their individual location’s costs for hospitalization, laboratory tests, diagnostic procedures, medications, telephone care, clinic visits, and emergency department visits.30 The numbers are based not only on a small number of individual estimations of risk, but also on facility costs that are highly variable. Despite this, the authors believe the estimates are actually on the conservative side, since they do not account for costs of lost productivity and/or litigation.
The current pilot was performed in a different type of setting than the one by Lee. That study was conducted in a similar VAMC setting, but their study data were obtained from other areas of the medical center. Of 600 pharmacist interventions, 250 were in an outpatient clinic, 250 were in an inpatient setting, and 100 were in a nursing home.30 Despite this, the estimates are likely still relevant to this study, given that drugs used in the ED are often a mix of inpatient and outpatient ones, with the same risks to an individual regardless of where they are initiated, changed, or discontinued.
The study by Ling and colleagues was performed in an ED setting more closely matching this study’s setting and was a larger, well powered study. As with the Lee study, it was difficult if not impossible to obtain exact numbers on the expenses each pharmacist recommendation spared the hospital and/or patients.31 Not all drug interactions avoided would have led to symptoms, reevaluation, or hospitalization.35 Not all drug “allergies” avoided are true allergies (as seen dramatically by Raja and colleagues), and thus this action may not have spared any cost at all.36 In the end, however, the estimates provided by both studies are averaged over many patients and thus provided the best numbers available.
Unlike the Lee study, this pilot did not evaluate the medication cost differences between original treatment and the new recommended treatment. Given the small number of patients with whom significant changes were made in this study, evaluating the cost differences between the treatments would likely be insignificant. A larger study, such as Lee, was much more sufficiently powered to evaluate such a figure.30
Of note, in this pilot there were no cases seen in which there was any change in route of delivery, ie, IV to equivalent po treatments. This is typically a large source of cost savings secondary to reduction in equipment and nursing time. The Lada study found 66 such changes among 2,150 pharmacist interventions in the ED.15 The authors hypothesize that had their pilot been conducted over a longer period, significant cost savings would have resulted from similar interventions.
In this pilot, a significant number of patients presented for prescription refills. Veterans often prefer to fill medications at the VA pharmacy because of reduced cost and often bring prescriptions written by private sector physicians. These veterans are required to have a primary care physician assigned within the VA, but until they have their initial intake appointment, they use the ED for these prescriptions. Additionally, veterans from other VA locations presenting as visitors to the area or relocating to the city and not yet assigned to a primary care physician require their medication lists from other location(s) be accessed and reentered into intrafacility computerized ordering systems. Given these particulars of VA operation, the authors’ facility assuredly sees more patients presenting for prescription refill than nongovernment facilities. Thus our savings with this particular task may not be generalizable to settings outside the VA, at least in as high a number of encounters.
CONCLUSIONS
About 37,000 veterans received care at the ED of the Atlanta VAMC in 2011. Given these numbers and the evidence that EDs have some of the highest rates of preventable ADEs of any clinical environment, the presence of a clinical pharmacist in the ED is a necessary intervention, based on safety considerations alone. In addition to providing a needed layer of safety in the vulnerable ED environment, a clinical pharmacist likely provides a cost saving benefit to the ED, as demonstrated by this pilot and other studies. Further, the overwhelmingly positive response to this pilot by the veterans who participated shows that they want and need this service. Adding a clinical pharmacist to the ED is integral to the VA mission of providing patient-centered care. A larger study to obtain a more precise cost savings benefit within the VA system should be considered.
Author disclosures
The authors report no actual or potential conflicts of interest with regard to this article.
Disclaimer
The opinions expressed herein are those of the authors and do not necessarily reflect those of Federal Practitioner, Frontline Medical Communications Inc., the U.S. Government, or any of its agencies. This article may discuss unlabeled or investigational use of certain drugs. Please review complete prescribing information for specific drugs or drug combinations—including indications, contraindications, warnings, and adverse effects—before administering pharmacologic therapy to patients.
1. Schumock GT, Butler MG, Meek PD, et al. Evidence of the economic benefit of clinical pharmacy services: 1996-2000. Pharmacotherapy. 2003;23(1):113-132.
2. Pedersen CA, Schneider PJ, Scheckelhoff DJ. ASHP national survey of pharmacy practice in hospital settings: Prescribing and transcribing—2010. Am J Health Syst Pharm. 2011;68(8):669-688.
3. Rudis MI, Attwood RJ. Emergency medicine pharmacy practice. J Pharm Pract. 2011; 4(2):135-145.
4. Clancy CM. Evidence shows cost and patient safety benefits of emergency pharmacists. Am J Med Qual. 2008;23(3):231-233.
5. Fairbanks RJ, Hays DP, Webster DF, et al. Clinical pharmacy services in an emergency department. Am J Health Syst Pharm. 2004;61(9):934-937.
6. Abu-Ramaileh AM, Shane R, Churchill W, Steffenhagen A, Patka J, Rothschild JM. Evaluating and classifying pharmacists’ quality interventions in the emergency department. Am J Health Syst Pharm. 2011;68(23):2271-2275.
7. Committee on the Future of Emergency Care in the United States Health System. Hospital-Based Emergency Care: At the Breaking Point. Washington, DC: National Academies Press; 2006.
8. Szczesiul JM, Fairbanks RJ, Hildebrand JM, Hays DP, Shah MN. Survey of physicians regarding clinical pharmacy services in academic emergency departments. Am J Health Syst Pharm. 2009;66(6):576-579.
9. Pedersen CA, Schneider PJ, Scheckelhoff DJ. ASHP national survey of pharmacy practice in hospital settings: Dispensing and Administration—2005. Am J Health Syst Pharm. 2006;63(4):327-345.
10. Schenkel S. Promoting patient safety and preventing medical error in emergency departments. Acad Emerg Med. 2000;7(11):1204-1222.
11. Chin MH, Wang LC, Jin L, et al. Appropriateness of medication selection for older persons in an urban academic emergency department. Acad Emerg Med. 1999;6(12):1232-1242.
12. Hastings SN, Schmader KE, Sloane RJ, et al. Quality of pharmacotherapy and outcomes for older veterans discharged from the emergency department. J Am Geriatr Soc. 2008;56(5):875-880.
13. Rothschild JM, Churchill W, Erickson A, et al. Medication errors recovered by emergency department pharmacists. Ann Emerg Med. 2010;55(6):513-521.
14. Eppert HD, Reznek AJ; American Society of Health-System Pharmacists. ASHP guidelines on emergency medicine pharmacist services. Am J Health Syst Pharm. 2011;68(23):e81-95.
15. Lada P, Delgado G Jr. Documentation of pharmacists’ interventions in an emergency department and associated cost avoidance. Am J Health Syst Pharm. 2007;64(1):63-68.
16. Cohen V, Jellineck SP, Hatch A, Motov S. Effect of clinical pharmacists on care in the emergency department: A systematic review. Am J Health Syst Pharm. 2009;66(15):1353-1361.
17. Randolph TC. Expansion of pharmacists’ responsibilities in an emergency department. Am J Health Syst Pharm. 2009;66(16):1484-1487.
18. Hayes BD, Donovan JL, Smith BS, Hartman CA. Pharmacist-conducted medication reconciliation in an emergency department. Am J Health Syst Pharm. 2007;64(16):1720-1723.
19. DeWinter S, Spriet I, Indevuyst C, et al. Pharmacist-versus physician-acquired medication history: A prospective study at the emergency department. Qual Saf Health Care. 2010; 19(5):371-375.
20. American Society of Health-System Pharmacists. ASHP statement on pharmacy services to the emergency department. Am J Health Syst Pharm. 2008;65(24):2380-2383.
21. Ernst AA, Weiss SJ, Sullivan A IV, et al. On-site pharmacists in the ED improve medical errors. Am J Emerg Med. 2011;30(5):717-725.
22. Weant KA, Humphries RL, Hite K, Armitstead JA. Effect of emergency medicine pharmacists on medication-error reporting in an emergency department. Am J Health Syst Pharm. 2010;67(21):1851-1855.
23. Brown JN, Barnes CL, Beasley B, et al. Effect of pharmacists on medication errors in an emergency department. Am J Health Syst Pharm. 2008;65(4):330-333.
24. Holland R, Desborough J, Goodyer L, Hall S, Wright D, Loke YK. Does pharmacist-led medication review help to reduce hospital admissions and deaths in older people? A systematic review and meta-analysis. Br J Clin Pharmacol. 2008;65(3):303-316.
25. Marconi GP, Claudius I. Impact of an emergency department pharmacy on medication omission and delay. Pediatr Emerg Care. 2012;28(1):30-33.
26. Jellinek SP, Cohen V, Fancher LB, et al. Pharmacist improves timely administration of medications to boarded patients in the emergency department. J Emerg Nurs. 2010;36(2):105-110.
27. Pantanwala AE, Sanders AB, Thomas MC, et al. A prospective, multicenter study of pharmacist activities resulting in medication error interception in the emergency department. Ann Emerg Med. 2012;59(5)369-373.
28. Fairbanks RJ, Hildebrand JM, Kolstee KE, Schneider SM, Shah MN. Medical and nursing staff highly value clinical pharmacists in the emergency department. Emerg Med J. 2007;24(10):716-718.
29. Randolph TC, Parker A, Meyer L, Zeina R. Effect of pharmacist-managed culture review process on antimicrobial therapy in an emergency department. Am J Health Syst Pharm. 2011; 68(10):916-919.
30. Lee AJ, Boro MS, Knapp KK, Meier JL, Kirman NE. Clinical and economic outcomes of pharmacist recommendations in a veterans affairs medical center. Am J Health Syst Pharm. 2002;59(21):2070-2077.
31. Ling JM, Mike LA, Rubin J, et al. Documentation of pharmacist interventions in the emergency department. Am J Health Syst Pharm. 2005;62(17):1793-1797.
32. U.S. Bureau of Labor Statistics. Database, tools and calculators by subject. CPI inflation calculator. U.S. Bureau of Labor Statistics Website. http://www.bls.gov/data/inflation_calculator.htm. Accessed August 05, 2014.
33. Levy DB. Documentation of clinical and cost-saving pharmacy interventions in the emergency room. Hosp Pharm. 1993;28(7):624-627, 630-634, 653.
34. Uselton JP, Kienle P, Murdaugh LB, eds. Assuring Continuous Compliance With Joint Commission Standards: A Pharmacy Guide. 8th ed. Bethesda, MD: American Society of Health-System Pharmacists; 2010.
35. Pantanwala AE, Hays DP, Sanders AB, Erstad BL. Severity and probability of harm of medication errors intercepted by an emergency pharmacist. Int J Pharm Pract. 2011;19(5):358-362.
36. Raja AS, Lindsell CJ, Bernstein JA, Codispoti CD Moellman JJ. The use of penicillin skin testing to assess the prevalence of penicillin allergy in an emergency department setting. Ann Emerg Med. 2009;54(1):72-77.
Clinical pharmacists have expanded their role over the past few decades in both outpatient and inpatient settings and are now members of an interdisciplinary health care team that includes nutritionists, physical therapists, physicians, and nurses.1,2 The emergency department (ED), however, has lagged behind in the inclusion of pharmacists.3 Despite well documented financial and ED operational benefits of pharmacists and the recommendation of their inclusion by the Institute of Medicine, only about 30% of academic EDs in a 2009 survey employed a pharmacist.4-8 A larger 2005 survey of 510 hospital pharmacy directors revealed that only 3.5% of hospitals sampled (academic and nonacademic) provided clinical pharmacy services in the ED.9
About 3.8 million annual preventable medical errors occur in the ED, giving the ED the highest rate of medication errors among all hospital departments.4 In 2000, Schenkel found that 3% of all inpatient medication errors were initiated in the ED.10 Similarly, Chin and colleagues found that 3.6% of elderly patients were administered an inappropriate medication in the ED with 5.6% receiving an inappropriate prescription at discharge.11
In a 2008 study conducted at the Durham VAMC in North Carolina, Hastings and colleagues found that suboptimal pharmacy was common among elderly veterans discharged from the ED (11%) and that potentially inappropriate medication use was associated with a 32% greater risk of repeat ED visits, hospitalization, or death (P = .10).12 In 2010, Rothschild and colleagues found 7.8 medication errors per 100 ED patients or 2.9 errors per 100 prescribed medications.13 Despite this unacceptably high rate of medication errors, most EDs do not employ pharmacy specialists or have a pharmacist easily available for consultation—options that could not only streamline ED operations, but also reduce patient risk.
The pharmacist role in the ED has changed considerably. In the 1970s, ED pharmacists were used mainly to dispense medicine, maintain inventories, and participate in cardiopulmonary resuscitation.3,14,15 Today, following the guidelines set by the American Society for Health-System Pharmacists, emergency pharmacists have an expanded, more direct role in patient care and evaluation and support of the physicians and other ED staff who work alongside them.4,14,16,17 Pharmacists gather accurate and complete medication histories, review and reconcile medication lists, and screen ED medication orders for errors or anticipated drug interactions.13,18-23 They adjust medication doses on a patient-by-patient basis, accounting for renal and hepatic clearance and closely monitor patients for treatment response. They also provide one-on-one patient education on medication dosing, administration, adverse drug events (ADEs), and interactions, increasing patients’ drug knowledge and adherence.17,24 Pharmacists provide information to patients on vaccinations and medication assistance programs, which is unlikely to be shared by other providers.3,19,20 Pharmacists in the ED reduce medication delays and omissions that occur in admitted patients staying in the ED.25,26
Aside from patient education, clinical pharmacists have an important role in providing education and consultation to ED physicians, midlevel providers, and house staff on topics that include availability of new medications and local antibiotic resistance patterns.14,27-29 Additionally, pharmacists monitor drug supplies and restock medications to avoid shortages during critical moments, offer the ED perspective in hospital formulary reviews, and increase efficiency and throughput in the ED while decreasing costs by evaluating and treating patients who present simply for prescription refills alongside a supervising physician.14
With this in mind, the ED of the Atlanta VAMC in Decatur, Georgia, conducted a pilot study to assess the financial and logistic feasibility of a full-time pharmacist in the ED setting with the hope that a pharmacist would integrate well into the health care team, reducing overall departmental expense and the risk of medication error associated with patient harm and simultaneously improving patient satisfaction and departmental efficiency.
Methodology
The ED of the Atlanta VAMC is part of a tertiary care teaching hospital affiliated with both the Emory and Morehouse schools of medicine. At the time of the pilot, the facility had 128 acute care medical/surgical beds, 12 inpatient palliative care beds, 40 acute care psychiatric beds, 24 medical surgical intensive care unit beds, and 60 inpatient nursing home beds. The ED provides care to > 37,000 veterans annually, and in December 2011 when this study was conducted, 3,195 veterans were seen in the ED.
The ED was divided into the main ED and the urgent care. Patient intake occurred through a centralized triage, and based on acuity, patients were sent to the appropriate setting for treatment. The ED used a 5-tier triage system. Patients with triage levels 1, 2, and 3 were sent to the main ED, and patients with triage levels 4 and 5 were sent to the urgent care.
Pharmacists
Pharmacy services were provided by 5 residency-trained doctors of pharmacy employed by the medical center working as clinical pharmacists with the inpatient medical teams at the time of the pilot. The pilot was conducted over a 2-week period in December 2011, Monday through Friday, for a total of 10 days. The clinical pharmacists divided the days among themselves. Each pharmacist provided services for a total of 2 days, 3 hours per day, from about 3 pm to 6 pm. The pharmacists were given a room previously used as a physician workroom in which to evaluate patients.
Patient Selection
Patients to be seen by the clinical pharmacist were chosen by the triage nurse, the charge nurse, the ED physician, the urgent care provider (physician or midlevel provider), or by the pharmacists. The triage nurse or charge nurse, based on chief medical problem and acuity, chose patients directly out of triage. Only patients with triage acuity level 4 or 5 were taken directly from triage without first seeing a physician or midlevel provider. These patients presented with the chief problem of medication refill or coumadin/International Normalized Ratio check. Once chosen as appropriate for the clinical pharmacist, the charge nurse helped with patient flow, and if the pharmacist was occupied with other patients, the nurse redirected the patient to urgent care.
Additional patients were chosen to see the clinical pharmacist after an evaluation of their initial problem was completed by a physician or midlevel practitioner in the urgent care or main ED. Patients whom the provider felt could benefit from any of the following services were directed to the clinical pharmacist: anticoagulation consult, diabetic education, pharmacokinetic consult, medication history, medication reconciliation, formulary management, medication refills, therapeutic interchange, screening for drug interactions, allergy review, and nonformulary or restricted medications requests. Additionally, the clinical pharmacist reviewed the charts of patients in the main ED whom they were not asked to see. They offered assistance when needed in all the aforementioned areas and for order clarification, assuring IV compatibility, reporting medication errors and ADEs, promotion of safe medical practices, and elimination of duplicate/redundant medications.
Data Collection
The pharmacists developed a log to record their activities. The log included the date and time of the intervention, number of minutes spent with the patient, the reason for intervention, and recommendations, if applicable. They categorized their interventions into 16 categories: anticoagulation, pharmacokinetics, drug information, order clarification, medication reconciliation, therapeutic interchange, formulary management, medication history, IV compatibility, screening for drug interactions, patient education, allergy documentation, promotion of safe medical practices, reporting of medication error/ADEs, nonformulary and restricted medication requests, and prescription refills. Patients could receive more than 1 intervention.
Though not a focus of this pilot, all patients seen by a pharmacist received a postencounter survey seeking their opinion on whether the pharmacist improved the value of their visit.
Review Process
At the conclusion of the pilot, 2 independent reviewers, both physicians, reviewed the logs, and each task was reassigned to 1 of 8 categories. These categories included either medication refills or 1 of 7 other areas that had established cost avoidance estimates from 2 other well accepted studies (Lee and colleagues and Ling and colleagues).30,31 These 7 categories included adjusting dose or frequency of medication, elimination of duplication of therapy, education/information inquiry, formulary management, prevention and management of ADEs, prevention or management of allergies, and therapeutic interchange. If the independent reviewers did not have initial concordance of classification of the intervention, they discussed the intervention and came to an agreement.
Cost Analysis
Cost avoidance estimates for 7 individual interventions were made, using data from Lee and colleagues and Ling and colleagues.30,31 Four of these came from the study by Lee and colleagues: prevent or manage drug allergy, adjust dosage or frequency, prevent or manage ADEs, and eliminate duplication of therapy.30 Lee and colleagues’ “drug interaction” group was not clearly defined, thus this was included with the “prevent or manage ADE” group. Ling and colleagues provided data for the 3 additional groups of interventions that pharmacists performed: education and information inquiry, formulary management, and therapeutic interchange.31
Financial estimates of cost avoidance were adjusted for inflation, using the consumer price index (CPI) of the U.S. Bureau of Labor Statistics.32 The Lee study was conducted in 2002, and estimates for cost avoidance using their model were adjusted to 2011 values using the CPI inflation rate of 25%. The Ling study was conducted in 2005, and estimates for cost avoidance using their model were adjusted for 2011 values using the CPI rate of inflation of 15.2%.32
For the remaining intervention, prescription refill, cost savings was determined by calculating the average times spent by the ED pharmacist on each intervention and then using the difference between hourly physician and pharmacist pay (about $50/h difference based on VA wage tables).
RESULTS
During the 30-hour total time in which a pharmacist was present in the ED, a total of 42 patients were assisted through 71 interventions (Table 1).
Pharmacists provided a diverse range of services to patients in the ED. The most common intervention was education and/or information inquiry. Tasks in this category included patient education about medication dosing, administration, AEs, interactions and warnings, as well as diabetes management. In several instances, education was provided to attending physicians or house staff, though it should be noted that this provider education was not counted as an intervention for this study unless it was associated with a patient (of which there were 3 total instances, eg, instruction on how to choose the proper insulin syringe).
Interventions, when a medication list was screened by the ED pharmacist for interactions or when drug choices were recommended to the physician or midlevel providers, were counted as prevention and management of ADEs. For example, the pharmacist noted a patient with a new diagnosis of gout who was prescribed hydrochlorothiazide; this was brought to the attention of the provider and alternative antihypertensives were suggested. In another instance, a patient was found to be on both ibuprofen and enoxaparin; the treating physician was alerted of this potential interaction. There were 15 such events in total.
Several other interventions arose from the screenings for ADEs, including adjusting dose or frequency of medication (11); therapeutic interchange (5); eliminating duplication of therapy (2); and prevention or management of allergies (1). Cases included hepatic and/or renal dose changes, substituting equivalent medications for better treatment outcome or adherence, or discontinuing 2 or more medications in a patient’s medication profile that were considered duplication.
During the pharmacist screening, one patient who had piperacillin/tazobactam ordered in the ED had a penicillin allergy. This intervention was categorized as prevention and management of an ADE as well as prevention and management of allergies. Interventions not accompanied by the “prevention of ADE” category included those in which the change did not provide a clear risk reduction. For example, one therapeutic interchange was from levofloxacin to moxifloxacin for a better-anticipated therapy. Another was a metformin dose increase, presumably for improved glycemic control.
Prescription refills occurred with the same frequency as prevention of ADEs.15 This intervention led in some cases to switching to pharmaceutical equivalents when a drug prescribed at another facility was not on the formulary. Other drugs that were not on the preferred list but available with nonformulary medication requests were ordered or approved with the assistance of the pharmacist. The pharmacist’s direct involvement significantly reduced the initial contact-to-approval time for these patients.
After tallying the total number of interventions, the potential financial cost savings to the ED were determined (Table 2). As mentioned previously, the Lee and Ling studies provided the categories for classification of 7 pharmacist interactions. The estimated cost avoidance for the 4 applicable groups from the Lee study had inflation-corrected values of $1,486 per adjusted dose or frequency of medication, $205 per elimination of duplication of therapy, $1,374 per prevention or management of ADEs, and $1,721 per prevention or management of allergies.30
The estimated cost avoidance for the 3 applicable groups from the Ling study had inflation-corrected values of $512.38 per education/information inquiry, $174.80 per formulary management, and $174.80 per therapeutic interchange.31 The eighth group, prescription refills, was valued at $12.50 each, using the difference between physician and pharmacist salary for an average of 15 minutes per interaction.
When multiplied by the number of interventions in each of these groups, the total potential cost avoidance in the study period was about $40,136.48. Extrapolated into a yearly amount, that is a $2,782,795.94 potential cost savings for the medical center.
Seventeen of the 42 (40.5%) postencounter surveys from the patients seen by the pharmacists were received. Of these veterans, 100% reported that they were “extremely satisfied” with the treatment they had received during their visit to the ED.
DISCUSSION
There is the potential for significant cost avoidance by adding a single full-time pharmacist to the ED: Annually, more than $2.7 million in potential savings for the medical center. Though surprising, this figure is actually in line with the much larger study by Lada and colleagues in which an estimated $3 million was avoided.15 At the same hospital 12 years earlier, Levy noted about $1 million in cost avoidance (not inflation-adjusted).33 The Ling study, however, did not have as high a figure, with annual cost avoidance estimated at $600,000.31 All these figures are based on estimates and, therefore, imprecise, but it is clear even using the most conservative model that the cost to employ a clinical pharmacist is justified.
The final value of cost savings is likely significantly underestimated relative to non-VA hospitals due to the decision to correct for inflation, using the total market inflation rate rather than the medical sector inflation rate over the same time period. The Lee study values were increased by 25.0% and the Ling study values by 15.2%, to bring them to 2011 amounts. Using the medical inflation rate instead (42.3% and 25.2%, respectively), an additional $378,000 in annual savings would have been realized. The lower CPI inflation rate rather than the higher rate in the medical sector was chosen to make the cost avoidance outcomes more conservative.
The true value of a clinical pharmacist comes from the services they provide to patients. In this pilot, as well as in several others, it has been shown that education is a commonly performed and highly valued task. Education was a service lacking in this ED prior to this intervention due to financial and logistical constraints. It is unclear how much instruction patients receive at the outpatient pharmacy while picking up medications after leaving the ED, but it is likely limited, given the large volumes and long lines often found at the in-house pharmacy. Education has a demonstrated effect on prevention and management of ADEs and was the most interactive of the interventions the pharmacist provided during this study. This type of intervention was most likely the source of increased patient satisfaction that was noted in the postencounter surveys.17,24
Prevention of ADEs, which was a frequent intervention in this pilot, has been noted by many sources to be the single most beneficial task performed by a clinical pharmacist both from financial and risk reduction standpoints.13,21-23 Although not able to assess patient outcomes after this limited pilot, the authors anticipate such an evaluation when a full-time ED pharmacist joins the department.
The Joint Commission recommends that a pharmacist review all medication orders before administration, though there is an exception for the emergency setting.34 The Joint Commission also recommends medication reconciliation at every visit, including those in the ED setting. The addition of a clinical pharmacist would increase compliance with this and other standards and bring ED operations up to the same benchmark as other practice settings.
LIMITATIONS
The most significant limitation of this study was sample size. The volunteered time of the pharmacists in the ED totaled only 30 hours over 2 weeks. In that limited time, however, the pharmacists had more patient interactions than were anticipated. Had the pilot been conducted over a longer period, it is unclear whether this would have been sustained or whether this was a coincidental overestimate of the effect that a full-time pharmacist would have on the department. Likely, it is an underestimate of their potential, as the availability of the pharmacist was novel and likely underused by other providers. Given more time with the ED staff, pharmacists would be more frequently called on for their expertise, because their skills and knowledge set would be better understood. During this pilot, the pharmacist was located in a separate room in the ED where not all ED staff knew they were available for consultation.
The other major limitation of the pilot was the inherent imprecision of cost avoidance estimates. The dollar amounts attributed to the duties fulfilled by the pharmacists relied on 2 studies. The first, by Lee and colleagues, provided cost avoidance estimates of certain pharmacist actions based on a combination of 4 to 5 clinicians’ estimates of risk reduction, combined with their individual location’s costs for hospitalization, laboratory tests, diagnostic procedures, medications, telephone care, clinic visits, and emergency department visits.30 The numbers are based not only on a small number of individual estimations of risk, but also on facility costs that are highly variable. Despite this, the authors believe the estimates are actually on the conservative side, since they do not account for costs of lost productivity and/or litigation.
The current pilot was performed in a different type of setting than the one by Lee. That study was conducted in a similar VAMC setting, but their study data were obtained from other areas of the medical center. Of 600 pharmacist interventions, 250 were in an outpatient clinic, 250 were in an inpatient setting, and 100 were in a nursing home.30 Despite this, the estimates are likely still relevant to this study, given that drugs used in the ED are often a mix of inpatient and outpatient ones, with the same risks to an individual regardless of where they are initiated, changed, or discontinued.
The study by Ling and colleagues was performed in an ED setting more closely matching this study’s setting and was a larger, well powered study. As with the Lee study, it was difficult if not impossible to obtain exact numbers on the expenses each pharmacist recommendation spared the hospital and/or patients.31 Not all drug interactions avoided would have led to symptoms, reevaluation, or hospitalization.35 Not all drug “allergies” avoided are true allergies (as seen dramatically by Raja and colleagues), and thus this action may not have spared any cost at all.36 In the end, however, the estimates provided by both studies are averaged over many patients and thus provided the best numbers available.
Unlike the Lee study, this pilot did not evaluate the medication cost differences between original treatment and the new recommended treatment. Given the small number of patients with whom significant changes were made in this study, evaluating the cost differences between the treatments would likely be insignificant. A larger study, such as Lee, was much more sufficiently powered to evaluate such a figure.30
Of note, in this pilot there were no cases seen in which there was any change in route of delivery, ie, IV to equivalent po treatments. This is typically a large source of cost savings secondary to reduction in equipment and nursing time. The Lada study found 66 such changes among 2,150 pharmacist interventions in the ED.15 The authors hypothesize that had their pilot been conducted over a longer period, significant cost savings would have resulted from similar interventions.
In this pilot, a significant number of patients presented for prescription refills. Veterans often prefer to fill medications at the VA pharmacy because of reduced cost and often bring prescriptions written by private sector physicians. These veterans are required to have a primary care physician assigned within the VA, but until they have their initial intake appointment, they use the ED for these prescriptions. Additionally, veterans from other VA locations presenting as visitors to the area or relocating to the city and not yet assigned to a primary care physician require their medication lists from other location(s) be accessed and reentered into intrafacility computerized ordering systems. Given these particulars of VA operation, the authors’ facility assuredly sees more patients presenting for prescription refill than nongovernment facilities. Thus our savings with this particular task may not be generalizable to settings outside the VA, at least in as high a number of encounters.
CONCLUSIONS
About 37,000 veterans received care at the ED of the Atlanta VAMC in 2011. Given these numbers and the evidence that EDs have some of the highest rates of preventable ADEs of any clinical environment, the presence of a clinical pharmacist in the ED is a necessary intervention, based on safety considerations alone. In addition to providing a needed layer of safety in the vulnerable ED environment, a clinical pharmacist likely provides a cost saving benefit to the ED, as demonstrated by this pilot and other studies. Further, the overwhelmingly positive response to this pilot by the veterans who participated shows that they want and need this service. Adding a clinical pharmacist to the ED is integral to the VA mission of providing patient-centered care. A larger study to obtain a more precise cost savings benefit within the VA system should be considered.
Author disclosures
The authors report no actual or potential conflicts of interest with regard to this article.
Disclaimer
The opinions expressed herein are those of the authors and do not necessarily reflect those of Federal Practitioner, Frontline Medical Communications Inc., the U.S. Government, or any of its agencies. This article may discuss unlabeled or investigational use of certain drugs. Please review complete prescribing information for specific drugs or drug combinations—including indications, contraindications, warnings, and adverse effects—before administering pharmacologic therapy to patients.
1. Schumock GT, Butler MG, Meek PD, et al. Evidence of the economic benefit of clinical pharmacy services: 1996-2000. Pharmacotherapy. 2003;23(1):113-132.
2. Pedersen CA, Schneider PJ, Scheckelhoff DJ. ASHP national survey of pharmacy practice in hospital settings: Prescribing and transcribing—2010. Am J Health Syst Pharm. 2011;68(8):669-688.
3. Rudis MI, Attwood RJ. Emergency medicine pharmacy practice. J Pharm Pract. 2011; 4(2):135-145.
4. Clancy CM. Evidence shows cost and patient safety benefits of emergency pharmacists. Am J Med Qual. 2008;23(3):231-233.
5. Fairbanks RJ, Hays DP, Webster DF, et al. Clinical pharmacy services in an emergency department. Am J Health Syst Pharm. 2004;61(9):934-937.
6. Abu-Ramaileh AM, Shane R, Churchill W, Steffenhagen A, Patka J, Rothschild JM. Evaluating and classifying pharmacists’ quality interventions in the emergency department. Am J Health Syst Pharm. 2011;68(23):2271-2275.
7. Committee on the Future of Emergency Care in the United States Health System. Hospital-Based Emergency Care: At the Breaking Point. Washington, DC: National Academies Press; 2006.
8. Szczesiul JM, Fairbanks RJ, Hildebrand JM, Hays DP, Shah MN. Survey of physicians regarding clinical pharmacy services in academic emergency departments. Am J Health Syst Pharm. 2009;66(6):576-579.
9. Pedersen CA, Schneider PJ, Scheckelhoff DJ. ASHP national survey of pharmacy practice in hospital settings: Dispensing and Administration—2005. Am J Health Syst Pharm. 2006;63(4):327-345.
10. Schenkel S. Promoting patient safety and preventing medical error in emergency departments. Acad Emerg Med. 2000;7(11):1204-1222.
11. Chin MH, Wang LC, Jin L, et al. Appropriateness of medication selection for older persons in an urban academic emergency department. Acad Emerg Med. 1999;6(12):1232-1242.
12. Hastings SN, Schmader KE, Sloane RJ, et al. Quality of pharmacotherapy and outcomes for older veterans discharged from the emergency department. J Am Geriatr Soc. 2008;56(5):875-880.
13. Rothschild JM, Churchill W, Erickson A, et al. Medication errors recovered by emergency department pharmacists. Ann Emerg Med. 2010;55(6):513-521.
14. Eppert HD, Reznek AJ; American Society of Health-System Pharmacists. ASHP guidelines on emergency medicine pharmacist services. Am J Health Syst Pharm. 2011;68(23):e81-95.
15. Lada P, Delgado G Jr. Documentation of pharmacists’ interventions in an emergency department and associated cost avoidance. Am J Health Syst Pharm. 2007;64(1):63-68.
16. Cohen V, Jellineck SP, Hatch A, Motov S. Effect of clinical pharmacists on care in the emergency department: A systematic review. Am J Health Syst Pharm. 2009;66(15):1353-1361.
17. Randolph TC. Expansion of pharmacists’ responsibilities in an emergency department. Am J Health Syst Pharm. 2009;66(16):1484-1487.
18. Hayes BD, Donovan JL, Smith BS, Hartman CA. Pharmacist-conducted medication reconciliation in an emergency department. Am J Health Syst Pharm. 2007;64(16):1720-1723.
19. DeWinter S, Spriet I, Indevuyst C, et al. Pharmacist-versus physician-acquired medication history: A prospective study at the emergency department. Qual Saf Health Care. 2010; 19(5):371-375.
20. American Society of Health-System Pharmacists. ASHP statement on pharmacy services to the emergency department. Am J Health Syst Pharm. 2008;65(24):2380-2383.
21. Ernst AA, Weiss SJ, Sullivan A IV, et al. On-site pharmacists in the ED improve medical errors. Am J Emerg Med. 2011;30(5):717-725.
22. Weant KA, Humphries RL, Hite K, Armitstead JA. Effect of emergency medicine pharmacists on medication-error reporting in an emergency department. Am J Health Syst Pharm. 2010;67(21):1851-1855.
23. Brown JN, Barnes CL, Beasley B, et al. Effect of pharmacists on medication errors in an emergency department. Am J Health Syst Pharm. 2008;65(4):330-333.
24. Holland R, Desborough J, Goodyer L, Hall S, Wright D, Loke YK. Does pharmacist-led medication review help to reduce hospital admissions and deaths in older people? A systematic review and meta-analysis. Br J Clin Pharmacol. 2008;65(3):303-316.
25. Marconi GP, Claudius I. Impact of an emergency department pharmacy on medication omission and delay. Pediatr Emerg Care. 2012;28(1):30-33.
26. Jellinek SP, Cohen V, Fancher LB, et al. Pharmacist improves timely administration of medications to boarded patients in the emergency department. J Emerg Nurs. 2010;36(2):105-110.
27. Pantanwala AE, Sanders AB, Thomas MC, et al. A prospective, multicenter study of pharmacist activities resulting in medication error interception in the emergency department. Ann Emerg Med. 2012;59(5)369-373.
28. Fairbanks RJ, Hildebrand JM, Kolstee KE, Schneider SM, Shah MN. Medical and nursing staff highly value clinical pharmacists in the emergency department. Emerg Med J. 2007;24(10):716-718.
29. Randolph TC, Parker A, Meyer L, Zeina R. Effect of pharmacist-managed culture review process on antimicrobial therapy in an emergency department. Am J Health Syst Pharm. 2011; 68(10):916-919.
30. Lee AJ, Boro MS, Knapp KK, Meier JL, Kirman NE. Clinical and economic outcomes of pharmacist recommendations in a veterans affairs medical center. Am J Health Syst Pharm. 2002;59(21):2070-2077.
31. Ling JM, Mike LA, Rubin J, et al. Documentation of pharmacist interventions in the emergency department. Am J Health Syst Pharm. 2005;62(17):1793-1797.
32. U.S. Bureau of Labor Statistics. Database, tools and calculators by subject. CPI inflation calculator. U.S. Bureau of Labor Statistics Website. http://www.bls.gov/data/inflation_calculator.htm. Accessed August 05, 2014.
33. Levy DB. Documentation of clinical and cost-saving pharmacy interventions in the emergency room. Hosp Pharm. 1993;28(7):624-627, 630-634, 653.
34. Uselton JP, Kienle P, Murdaugh LB, eds. Assuring Continuous Compliance With Joint Commission Standards: A Pharmacy Guide. 8th ed. Bethesda, MD: American Society of Health-System Pharmacists; 2010.
35. Pantanwala AE, Hays DP, Sanders AB, Erstad BL. Severity and probability of harm of medication errors intercepted by an emergency pharmacist. Int J Pharm Pract. 2011;19(5):358-362.
36. Raja AS, Lindsell CJ, Bernstein JA, Codispoti CD Moellman JJ. The use of penicillin skin testing to assess the prevalence of penicillin allergy in an emergency department setting. Ann Emerg Med. 2009;54(1):72-77.
Genetic Heart Failure in an Active-Duty Soldier
Left ventricular noncompaction (LVNC) is a rare disorder that is variably classified as a primary genetic cardiomyopathy (CM) by the American Heart Association.1 It is mostly believed to be a congenital abnormality, characterized by the arrest of the typical embryonic myocardial maturation process with the subsequent retention of the trabecular myocardial structure, which defines the early embryonic heart.2
During very early embryonic development, the left ventricular (LV)myocardium is composed of a loose network of fibers separated by deep recesses, which link it with the LV cavity. At 8 weeks of prenatal development, gradual compaction of these fibers occurs, and LVNC is thought to result from the arrest of this normal process.2,3 Significant variability in myocardial involvement exists, ranging from panventricular to isolated apical involvement, likely related to time of arrest of this maturation process.4 The decreased contractile capability and inadequate epicardial coronary system communication of this trabecular endocardium is thought to lead to the clinical manifestations of LVNC.1-7
This report describes the case of a 45-year-old male soldier who presented with a unique case of heart failure, diagnosed via cardiac magnetic resonance imaging (MRI).
Case Study
The patient presented to the San Antonio Military Medical Center emergency department in mid-2011 with increasing dyspnea for several weeks. He also reported significant lower-extremity and scrotal edema. Although the patient had been previously healthy, his recent medical history was remarkable for a severe combat injury suffered while on duty with the U.S. Army in Afghanistan: He was involved in an explosion from an improvised explosive device in August 2009. He was medically evacuated to the U.S., where he required multiple hospitalizations and surgeries. Prior to his current presentation, the patient had been briefly hospitalized for hospital-acquired pneumonia. During this hospitalization, he first noted abnormal swelling of his legs, a finding that was initially attributed to the large sodium load he had received with his IV antibiotics.
DIAGNOSIS
The patient’s vital signs on presentation were notable for 100/83 mm Hg blood pressure, 103 beats per minute (bpm) heart rate, and 18/min respiratory rate with a saturation of 100% on 4 liters of oxygen by nasal cannula. He was conversant but tachypneic and had to pause frequently to catch his breath. His neck veins were notably distended with jugular venous pulsations visible to the angle of the jaw with the patient at 30 degrees. His heart sounds were normal without an S3, but his lungs were notable for bilateral crackles over the lower- to mid-lung fields. He had profound bilateral upper and lower extremity and scrotal pitting edema. He had no lymphadenopathy or skin rashes.
On presentation, the patient’s laboratory results were remarkable for a 444 pg/mL brain natriuretic peptide. A chest X-ray revealed bilateral basilar opacities. An electrocardiogram showed normal sinus rhythm (70 bpm), with normal axis and poor R-wave progression across the precordium. An echocardiogram was performed and notable for a moderately dilated left ventricle with severely depressed systolic function of 10% to 15%, and elevated pulmonary artery pressures. Subsequently, the patient was referred for a coronary angiography, which showed no evidence of coronary atherosclerosis. A cardiac MRI was then performed to evaluate for nonischemic CM, which revealed prominent trabeculations in both ventricles, but most notably in the left ventricle, consistent with a diagnosis of LVNC.
The patient was treated with diuretics, beta-blockers, and an angiotensin-converting enzyme (ACE) inhibitor with improvement in his heart failure symptoms. He was started on systemic anticoagulation with warfarin for his severely depressed LV function. His hospital course was complicated by frequent, nonsustained ventricular tachycardia (VT), and he was referred to the electrophysiology service for implantation of an automated intracardiac cardioverter/defibrillator (AICD) for primary prevention of sudden cardiac death. His clinical course was otherwise unremarkable, and he was discharged after 8 days with complete resolution of his symptoms.
Discussion
The clinical presentation of LVNC is typically due to complications of ventricular dysfunction, including heart failure, arrhythmias, and cardioembolic events. Retrospective studies have shown much variability in the frequency of these complications, likely due to selection bias in earlier studies. These earlier studies had suggested a frequency of heart failure > 50%, but recent studies have shown a more modest frequency of 30% to 35% of affected patients.
Even greater variance has been found in the frequency of arrhythmias, but most studies have shown a frequency of at least 20% for VT. Poor blood flow in the deep intertrabecular recesses in patients with LVNC is additionally thought to lead to a predisposition for mural thrombus formation with an elevated frequency of systemic embolic events, ranging from 5% to 20% among previous studies.1-4,6,8
Much debate remains regarding the genetic association of this condition. The unique character of the resulting myocardium suggests a distinct CM, but the significant genetic heterogeneity with sarcomere protein gene mutations associated with several other CMs, including hypertrophic and dilated CM, suggests that LVNC may simply exist on a phenotypic continuum with these other conditions.4 Inheritance shows additional similarities to these other known CMs with autosomal-
dominant and X-linked modes of transmission shown with familial forms in about 25% of patients.5,7 This has led many to believe that screening of first-degree relatives of clinically affected patients may be appropriate.
The prevalence of LVNC in adults referred for echocardiography is about 0.014% to 1.3%.5 A recent increase in the rate of recognition has raised concerns of possible overdiagnosis, with attempts now made to develop specific imaging diagnostic criteria. Diagnosis of LVNC is most commonly suspected (but can be missed) on echocardiography using 2-D and color Doppler imaging modalities. Echocardiographic findings supporting the diagnosis of LVNC suggested by Oechslin and colleague include:
• Presence of multiple trabeculations, particularly in the LV apex and free wall;
• Multiple deep trabeculation recesses in communication with the LV cavity, usually seen on color Doppler imaging;
• A 2-layered structure of the endomyocardium with ratio of end systolic, noncompacted endocardial layer to compacted epicardial layer > 2 in adults; and
• Absence of other congenital or acquired heart disease, particularly those causing LV outflow obstruction.8
Another proposed standardized method for identifying LVNC via echocardiography by Chin and colleagues focuses on trabeculae at the LV apex on the parasternal short axis and apical views.2,3 LVNC is defined by a ratio of X/Y of ≤ 0.5, where X is the distance from the epicardial surface to the trough of the trabecular recess, and Y is the distance from the epicardial surface to the peak of the trabeculations.
Cardiac MRI is now a more common mode of imaging used for diagnosis of LVNC and often has better imaging characteristics than those of echocardiography. Using a ratio of noncompacted to compacted CM in diastole > 2.3 is suggestive of LVNC with sensitivity and specificity of 86% and 99%.9
The management of LVNC focuses primarily on treatment of complications, including heart failure, rhythm disturbances, and thromboembolic events. Treatment of heart failure is typically the same as for other CMs and includes medical therapy with salt restriction, diuretics, beta-blockers, and ACE inhibitors. In addition, exercise training, as tolerated, is beneficial to improve clinical status.3,10 Electrophysiology studies are often performed in these patients, and implantation of an AICD is typically done in cases of documented, sustained VT, presyncope with inducible VT or severally depressed ejection fraction of < 35%.4,10 Deep intertrabecular recesses and impaired blood flow increase the risk of thrombus formation. Hence, anticoagulation with warfarin (international normalized ratio target 2.3) for those with an impaired LV ejection fraction (< 40%) should be considered for the prevention of cardioembolic events.3,4,6,10
Summary
An active-duty solider with a history of battlefield trauma and multiple hospitalizations was admitted for symptomatic heart failure with cardiac MRI suggestive of LVNC. This condition is a phenotypic result of genetic heterogeneity with significant variability in clinical presentation and a predisposition for heart failure, ventricular arrhythmias, and systemic embolic events. The etiology of this patient’s clinical presentation remains unclear, and additional research is needed to understand whether his recent trauma and multiple hospitalizations played a role in the manifestation of his disease.
Author disclosures
The authors report no actual or potential conflicts of interest with regard to this article.
Disclaimer
The opinions expressed herein are those of the authors and do not necessarily reflect those of Federal Practitioner, Frontline Medical Communications Inc., the U.S. Government, or any of its agencies. This article may discuss unlabeled or investigational use of certain drugs. Please review complete prescribing information for specific drugs or drug combinations—including indications, contraindications, warnings, and adverse effects—before administering pharmacologic therapy to patients.
1. Maron BJ, Towbin JA, Thiene G, et al. Contemporary definitions and classification of the cardiomyopathies: An American Heart Association Scientific Statement from the Council on Clinical Cardiology, Heart Failure and Transplantation Committee; Quality of Care and Outcomes Research and Functional Genomics and Translational Biology Interdisciplinary Working Groups; and Council on Epidemiology and Prevention. Circulation. 2006;113(14):1807-1816.
2. Chin TK, Perloff JK, Williams RG, Jue K, Mohrmann R. Isolated noncompaction of left ventricular myocardium. A study of eight cases. Circulation. 1990;82(2):507-513.
3. Murphy RT, Thaman R, Blanes JG, et al. Natural history and familial characteristics of isolated left ventricular non-compaction. Eur Heart J. 2005;26(2):187-192.
4. Oechslin E, Jenni R. Left ventricular non-compaction revisited: A distinct phenotype with genetic heterogeneity? Eur Heart J. 2011;32(12):1446-1456.
5. Elliott P, Andersson B, Arbustini E, et al. Classification of the cardiomyopathies: A position statement from the European Society of Cardiology Working Group on Myocardial and Pericardial Diseases. Eur Heart J. 2008;29(2):270-276.
6. Oechslin EN, Attenhofer Jost CH, Rojas JR, Kaufmann PA, Jenni R. Longterm follow-up of 34 adults with isolated left ventricular noncompaction: A distinct cardiomyopathy with poor prognosis. J Am Coll Cardiol. 2000;36(2):493-500.
7. Spirito P, Autore C. Apical hypertrophic cardiomyopathy or left ventricular non-compaction? A difficult differential diagnosis [editorial]. Eur Heart J. 2007;28(16):1923-1924.
8. Oechslin E, Jenni R. Non-compaction of the left ventricular myocardium—From clinical observation to the discovery of a new disease. Eur Cardiol Review. 2005;1(1):23-24.
9. Petersen SE, Selvanayagam JB, Wiesmann F, et al. Left ventricular non-compaction: Insights from cardiovascular magnetic resonance imaging. J Am Coll Cardiol. 2005;46(1):101-105.
10. Hunt SA, Abraham WT, Chin MH, et al; American College of Cardiology Foundation; American Heart Association. 2009 Focused update incorporated into the ACC/AHA 2005 Guidelines for the Diagnosis and Management of Heart Failure in Adults: A Report of the American College of Cardiology Foundation/American Heart Association Task Force on Practice Guidelines Developed in Collaboration With the International Society for Heart and Lung Transplantation. Circulation. 2009;53(15):e1-e90.
Left ventricular noncompaction (LVNC) is a rare disorder that is variably classified as a primary genetic cardiomyopathy (CM) by the American Heart Association.1 It is mostly believed to be a congenital abnormality, characterized by the arrest of the typical embryonic myocardial maturation process with the subsequent retention of the trabecular myocardial structure, which defines the early embryonic heart.2
During very early embryonic development, the left ventricular (LV)myocardium is composed of a loose network of fibers separated by deep recesses, which link it with the LV cavity. At 8 weeks of prenatal development, gradual compaction of these fibers occurs, and LVNC is thought to result from the arrest of this normal process.2,3 Significant variability in myocardial involvement exists, ranging from panventricular to isolated apical involvement, likely related to time of arrest of this maturation process.4 The decreased contractile capability and inadequate epicardial coronary system communication of this trabecular endocardium is thought to lead to the clinical manifestations of LVNC.1-7
This report describes the case of a 45-year-old male soldier who presented with a unique case of heart failure, diagnosed via cardiac magnetic resonance imaging (MRI).
Case Study
The patient presented to the San Antonio Military Medical Center emergency department in mid-2011 with increasing dyspnea for several weeks. He also reported significant lower-extremity and scrotal edema. Although the patient had been previously healthy, his recent medical history was remarkable for a severe combat injury suffered while on duty with the U.S. Army in Afghanistan: He was involved in an explosion from an improvised explosive device in August 2009. He was medically evacuated to the U.S., where he required multiple hospitalizations and surgeries. Prior to his current presentation, the patient had been briefly hospitalized for hospital-acquired pneumonia. During this hospitalization, he first noted abnormal swelling of his legs, a finding that was initially attributed to the large sodium load he had received with his IV antibiotics.
DIAGNOSIS
The patient’s vital signs on presentation were notable for 100/83 mm Hg blood pressure, 103 beats per minute (bpm) heart rate, and 18/min respiratory rate with a saturation of 100% on 4 liters of oxygen by nasal cannula. He was conversant but tachypneic and had to pause frequently to catch his breath. His neck veins were notably distended with jugular venous pulsations visible to the angle of the jaw with the patient at 30 degrees. His heart sounds were normal without an S3, but his lungs were notable for bilateral crackles over the lower- to mid-lung fields. He had profound bilateral upper and lower extremity and scrotal pitting edema. He had no lymphadenopathy or skin rashes.
On presentation, the patient’s laboratory results were remarkable for a 444 pg/mL brain natriuretic peptide. A chest X-ray revealed bilateral basilar opacities. An electrocardiogram showed normal sinus rhythm (70 bpm), with normal axis and poor R-wave progression across the precordium. An echocardiogram was performed and notable for a moderately dilated left ventricle with severely depressed systolic function of 10% to 15%, and elevated pulmonary artery pressures. Subsequently, the patient was referred for a coronary angiography, which showed no evidence of coronary atherosclerosis. A cardiac MRI was then performed to evaluate for nonischemic CM, which revealed prominent trabeculations in both ventricles, but most notably in the left ventricle, consistent with a diagnosis of LVNC.
The patient was treated with diuretics, beta-blockers, and an angiotensin-converting enzyme (ACE) inhibitor with improvement in his heart failure symptoms. He was started on systemic anticoagulation with warfarin for his severely depressed LV function. His hospital course was complicated by frequent, nonsustained ventricular tachycardia (VT), and he was referred to the electrophysiology service for implantation of an automated intracardiac cardioverter/defibrillator (AICD) for primary prevention of sudden cardiac death. His clinical course was otherwise unremarkable, and he was discharged after 8 days with complete resolution of his symptoms.
Discussion
The clinical presentation of LVNC is typically due to complications of ventricular dysfunction, including heart failure, arrhythmias, and cardioembolic events. Retrospective studies have shown much variability in the frequency of these complications, likely due to selection bias in earlier studies. These earlier studies had suggested a frequency of heart failure > 50%, but recent studies have shown a more modest frequency of 30% to 35% of affected patients.
Even greater variance has been found in the frequency of arrhythmias, but most studies have shown a frequency of at least 20% for VT. Poor blood flow in the deep intertrabecular recesses in patients with LVNC is additionally thought to lead to a predisposition for mural thrombus formation with an elevated frequency of systemic embolic events, ranging from 5% to 20% among previous studies.1-4,6,8
Much debate remains regarding the genetic association of this condition. The unique character of the resulting myocardium suggests a distinct CM, but the significant genetic heterogeneity with sarcomere protein gene mutations associated with several other CMs, including hypertrophic and dilated CM, suggests that LVNC may simply exist on a phenotypic continuum with these other conditions.4 Inheritance shows additional similarities to these other known CMs with autosomal-
dominant and X-linked modes of transmission shown with familial forms in about 25% of patients.5,7 This has led many to believe that screening of first-degree relatives of clinically affected patients may be appropriate.
The prevalence of LVNC in adults referred for echocardiography is about 0.014% to 1.3%.5 A recent increase in the rate of recognition has raised concerns of possible overdiagnosis, with attempts now made to develop specific imaging diagnostic criteria. Diagnosis of LVNC is most commonly suspected (but can be missed) on echocardiography using 2-D and color Doppler imaging modalities. Echocardiographic findings supporting the diagnosis of LVNC suggested by Oechslin and colleague include:
• Presence of multiple trabeculations, particularly in the LV apex and free wall;
• Multiple deep trabeculation recesses in communication with the LV cavity, usually seen on color Doppler imaging;
• A 2-layered structure of the endomyocardium with ratio of end systolic, noncompacted endocardial layer to compacted epicardial layer > 2 in adults; and
• Absence of other congenital or acquired heart disease, particularly those causing LV outflow obstruction.8
Another proposed standardized method for identifying LVNC via echocardiography by Chin and colleagues focuses on trabeculae at the LV apex on the parasternal short axis and apical views.2,3 LVNC is defined by a ratio of X/Y of ≤ 0.5, where X is the distance from the epicardial surface to the trough of the trabecular recess, and Y is the distance from the epicardial surface to the peak of the trabeculations.
Cardiac MRI is now a more common mode of imaging used for diagnosis of LVNC and often has better imaging characteristics than those of echocardiography. Using a ratio of noncompacted to compacted CM in diastole > 2.3 is suggestive of LVNC with sensitivity and specificity of 86% and 99%.9
The management of LVNC focuses primarily on treatment of complications, including heart failure, rhythm disturbances, and thromboembolic events. Treatment of heart failure is typically the same as for other CMs and includes medical therapy with salt restriction, diuretics, beta-blockers, and ACE inhibitors. In addition, exercise training, as tolerated, is beneficial to improve clinical status.3,10 Electrophysiology studies are often performed in these patients, and implantation of an AICD is typically done in cases of documented, sustained VT, presyncope with inducible VT or severally depressed ejection fraction of < 35%.4,10 Deep intertrabecular recesses and impaired blood flow increase the risk of thrombus formation. Hence, anticoagulation with warfarin (international normalized ratio target 2.3) for those with an impaired LV ejection fraction (< 40%) should be considered for the prevention of cardioembolic events.3,4,6,10
Summary
An active-duty solider with a history of battlefield trauma and multiple hospitalizations was admitted for symptomatic heart failure with cardiac MRI suggestive of LVNC. This condition is a phenotypic result of genetic heterogeneity with significant variability in clinical presentation and a predisposition for heart failure, ventricular arrhythmias, and systemic embolic events. The etiology of this patient’s clinical presentation remains unclear, and additional research is needed to understand whether his recent trauma and multiple hospitalizations played a role in the manifestation of his disease.
Author disclosures
The authors report no actual or potential conflicts of interest with regard to this article.
Disclaimer
The opinions expressed herein are those of the authors and do not necessarily reflect those of Federal Practitioner, Frontline Medical Communications Inc., the U.S. Government, or any of its agencies. This article may discuss unlabeled or investigational use of certain drugs. Please review complete prescribing information for specific drugs or drug combinations—including indications, contraindications, warnings, and adverse effects—before administering pharmacologic therapy to patients.
1. Maron BJ, Towbin JA, Thiene G, et al. Contemporary definitions and classification of the cardiomyopathies: An American Heart Association Scientific Statement from the Council on Clinical Cardiology, Heart Failure and Transplantation Committee; Quality of Care and Outcomes Research and Functional Genomics and Translational Biology Interdisciplinary Working Groups; and Council on Epidemiology and Prevention. Circulation. 2006;113(14):1807-1816.
2. Chin TK, Perloff JK, Williams RG, Jue K, Mohrmann R. Isolated noncompaction of left ventricular myocardium. A study of eight cases. Circulation. 1990;82(2):507-513.
3. Murphy RT, Thaman R, Blanes JG, et al. Natural history and familial characteristics of isolated left ventricular non-compaction. Eur Heart J. 2005;26(2):187-192.
4. Oechslin E, Jenni R. Left ventricular non-compaction revisited: A distinct phenotype with genetic heterogeneity? Eur Heart J. 2011;32(12):1446-1456.
5. Elliott P, Andersson B, Arbustini E, et al. Classification of the cardiomyopathies: A position statement from the European Society of Cardiology Working Group on Myocardial and Pericardial Diseases. Eur Heart J. 2008;29(2):270-276.
6. Oechslin EN, Attenhofer Jost CH, Rojas JR, Kaufmann PA, Jenni R. Longterm follow-up of 34 adults with isolated left ventricular noncompaction: A distinct cardiomyopathy with poor prognosis. J Am Coll Cardiol. 2000;36(2):493-500.
7. Spirito P, Autore C. Apical hypertrophic cardiomyopathy or left ventricular non-compaction? A difficult differential diagnosis [editorial]. Eur Heart J. 2007;28(16):1923-1924.
8. Oechslin E, Jenni R. Non-compaction of the left ventricular myocardium—From clinical observation to the discovery of a new disease. Eur Cardiol Review. 2005;1(1):23-24.
9. Petersen SE, Selvanayagam JB, Wiesmann F, et al. Left ventricular non-compaction: Insights from cardiovascular magnetic resonance imaging. J Am Coll Cardiol. 2005;46(1):101-105.
10. Hunt SA, Abraham WT, Chin MH, et al; American College of Cardiology Foundation; American Heart Association. 2009 Focused update incorporated into the ACC/AHA 2005 Guidelines for the Diagnosis and Management of Heart Failure in Adults: A Report of the American College of Cardiology Foundation/American Heart Association Task Force on Practice Guidelines Developed in Collaboration With the International Society for Heart and Lung Transplantation. Circulation. 2009;53(15):e1-e90.
Dexmedetomidine to Remove a Large Thyroid Mass
The following case report describes the use of dexmedetomidine as the primary sedative for an awake endotracheal intubation, as an adjuvant for general anesthesia, and for postoperative sedation for mechanical ventilation. This case illustrates problems that attracted the attention of federal institutions, specifically the management of difficult airways (with and without anatomic distortion), obesity, and obstructive sleep apnea (OSA). As such, it is of potential interest not only to anesthesiologists, but also other health care providers in the VA, especially those who might practice in intensive care settings.
Dexmedetomidine has useful pharmacologic properties that have potential use in a wide variety of clinical scenarios. Dexmedetomidine is currently indicated for sedation in nonintubated patients before and during surgical and other procedures and in intubated and mechanically ventilated patients during treatment in an intensive care setting.
Large neck masses can produce numerous problems that complicate the anesthetic management in the intraoperative and immediate postoperative arenas. The adjuvant use of dexmedetomidine, an alpha-2 agonist that has useful properties for both the anesthetic and intensive care situations, will be discussed. The problems involved with the management and resection of large neck masses include tracheal deviation, tracheal compression, airway edema, distorted anatomy, difficult mask ventilation, difficult intubation, postoperative recurrent laryngeal nerve dysfunction, and difficult exposure for tracheostomy.
Case Report
A 46-year-old man was referred for removal of a large thyroid mass. His past medical history included hypertension, obesity, and type 2 diabetes mellitus. Clinically, the patient seemed to be at risk for OSA, but he had not received a formal diagnosis. The patient met many of the criteria for screening OSA that are listed for a STOP-Bang Questionnaire.1 He was clinically and serologically euthyroid. Neck ultrasound revealed a very large thyroid mass with cystic and solid lesions throughout. Other than hoarseness, the patient reported no compressive symptoms, such as dysphagia or airway compromise. He was maintained on metoprolol, fosinopril, a thiazide for hypertension, and metformin and insulin for diabetes. A physical examination was remarkable for a Mallampati IV airway classification, a 61-cm neck circumference, 177 cm height, 142 kg weight, and a body mass index of 45. These preoperative assessments were predictive of a high probability of very difficult mask ventilation and intubation after the induction of a general anesthetic, or in any other situation requiring tracheal intubation, such as respiratory failure in the postoperative period.
Preoperative laboratory studies, chest radiograph, and electrocardiogram (ECG) were unremarkable. Computed tomography (CT) imaging of the neck revealed marked enlargement of the thyroid, which had a multinodular, heterogeneous appearance with scattered calcifications. The left lobe of the thyroid measured 13.0 cm craniocaudal by 9.47 cm transverse by 6.8 cm anteroposterior. The right lobe of the thyroid measured 12.0 cm craniocaudal by 7.6 cm transverse by 7.0 cm anteroposterior (Figure 1).
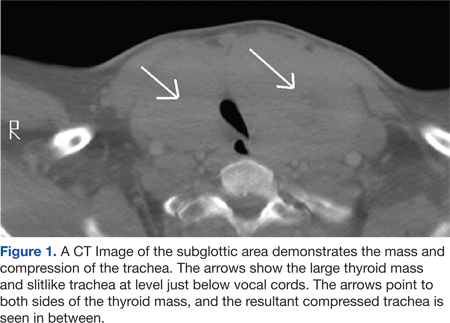
The first concern for this patient was a secure airway, which potentially could have been very difficult to procure with a standard IV induction of anesthesia followed by a direct laryngoscopy. This was further constrained by the surgical requirement that the patient be intubated with an electromyography (EMG) endotracheal tube for monitoring of the recurrent laryngeal nerves, as thyroid surgery carries the risk of injury to these nerves. The type of tube that was used had a larger diameter than that of a standard endotracheal tube (the EMG tube measured 10.2 mm outside diameter vs 9.6 mm outside diameter for a standard tube) but was also far more rigid, precluding nasal intubation and making navigation of the tip around corners and obstructions more difficult. A final laryngoscopy was also needed for confirmation of optimal electrode placement at the vocal cord level (Figure 2).
The anesthetic plan was to secure the airway with an awake oral fiberoptic intubation under sedation and topical local anesthetic to avoid the hypoxemia that would ensue if the patient lost spontaneous respiration. The patient was brought without preoperative sedation to the operating room, standard monitors (eg, ECG, noninvasive blood pressure, pulse oximetry) were applied and IV access was obtained. Blood pressure, heart rate, and oxygen saturation were within normal limits. He was placed on oxygen 2 L/min by nasal cannula and given a 1 μg/kg loading dose of dexmedetomidine over 10 minutes and thereafter maintained on a 0.4 μg/kg/h maintenance infusion during the entire airway intubation sequence. A topical anesthesia of 4% lidocaine spray was applied to the upper airway, and a transtracheal injection was performed with 2 mL of 4% lidocaine. The patient’s anatomy precluded the use of superior laryngeal nerve blocks. During the dexmedetomidine loading, he was given 1 mg midazolam and 100 μg fentanyl IV incrementally. No significant hemodynamic or respiratory changes occurred with this sedation regimen.
An attempt to place an oral intubation bite block failed, because the stiff EMG tube proved too difficult to pass through it. Therefore, the EMG tube and rolled gauze pads placed between the upper and lower teeth were used to protect the fiberoptic bronchoscope while it was guided past the base of the tongue. As was noted in the CT scan, the airway was deviated slightly to the left, and this information was useful for guiding the fiberscope. The location of the epiglottis was fairly difficult to ascertain due to redundant tissue in the hypopharyngeal area but was ultimately visible through the fiberscope.
The vocal cords were not visible, possibly due to the significant amount of airway edema and/or redundant tissue between the epiglottis and the vocal cords: Only the space beneath the epiglottis could be seen via the fiberscope. Passing the bronchoscope through the larynx also was problematic due to what may be described as altered spatial/angular relationships and due to the supraglottic edema/tissue leaving little room for the tip of the bronchoscope to be maneuvered. Figure 3 shows a CT scan image of the supraglottic area.
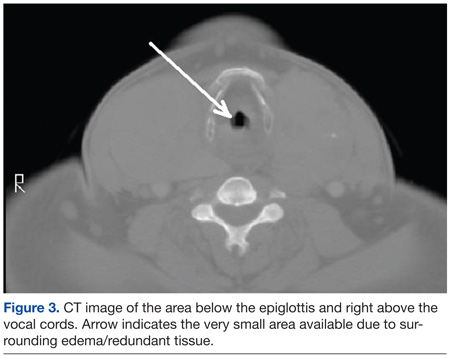
It took 45 minutes and multiple attempts to pass the bronchoscope into the trachea. The dexmedetomidine infusion was continued throughout this entire sequence. The patient tolerated this manipulation with little difficulty, despite the multiple airway maneuvers, and his hemodynamic and respiratory status remained clinically stable. Oxygen saturation was 95% to 100% during this sequence and the patient did not show evidence of significant upper airway collapse, desaturation, or apnea, which are sometimes encountered during sedation for airway manipulation.
The patient’s hemodynamic status remained near baseline values throughout the airway manipulation. The patient never lost his ability to cooperate. After manipulation of the fiberscope into the trachea, the tracheal rings and carina were visualized, and the tube was advanced over the scope. Minimal to mild coughing occurred once the tube passed through the vocal cords. The tube position in the trachea was verified with end-tidal CO2 and bronchoscopy and then the induction of anesthesia with propofol was completed. A laryngoscopy using a videolaryngoscope confirmed proper EMG electrode placement. Large-bore IV access and an arterial line were then secured.
The operation lasted about 15 hours. Maintenance of anesthesia was accomplished with the use of the volatile anesthetic desflurane, titrated to patient response to the surgical procedure. Additionally, 550 μg of IV fentanyl was used intermittently during the operation. Dexmedetomidine was infused at a rate of 0.2 to 0.4 μg/kg/h during the anesthetic, titrated to hemodynamic response. All hemodynamic parameters remained stable and within 20% of preoperative levels during the procedure. The blood loss during the procedure was minimal (< 100 mL), and acceptable readings from the EMG tube were confirmed throughout the surgical procedure.
The 686-gram thyroid mass was confirmed to be a multinodular goiter. Due to the difficulty with intubation, the length of the surgical procedure, and the likelihood of airway difficulties from edema possibly requiring reintubation, the patient was left intubated and mechanically ventilated overnight and sedated with a dexmedetomidine infusion of 0.3 μg/kg/h and propofol 35 mL/h. No further medications were required. He tolerated the ventilator without fighting, straining, coughing, or hypertensive responses and remained cooperative when aroused. He was successfully extubated the following day. Afterward, the patient maintained his airway and had only a mild right vocal cord paresis complicating his surgical management.
Discussion
The critical issues associated with this successful endotracheal intubation included the patient’s obesity, thyroid mass size, and deviation/compression of the trachea. Were this patient morbidly obese only, airway management would still be problematic; this was exacerbated by the concurrent pathologies. Dexmedetomidine possesses several advantageous properties for the perioperative period and was chosen as sedation for the awake intubation due to its sedative-analgesic effects, opioid sparing effects, lack of respiratory depression, maintenance of patient cooperation, and antisialagogue effect.2-5 Dexmedetomidine has previously been shown to be useful for awake intubation of difficult airway cases.4,6,7 Importantly, the dexmedetomidine sedation seemed to blunt the hypertensive responses often seen during airway maneuvers.8 It was also chosen as an intraoperative adjunct due to the above-noted opioid-sparing effects, given the importance of minimizing perioperative opioids needed for this morbidly obese individual with airway compromise.
In the literature, dexmedetomidine has been shown to greatly reduce the need for opioids, both intraoperatively and immediately postoperatively in many citations, for example, in postoperative mechanically ventilated coronary artery bypass graft patients.2,9 Opioid usage reduction is especially needed for the morbidly obese who are at increased risk of OSA and the attendant increased sensitivity to the respiratory depressant effects of narcotics. Postoperative opioids are being debated in the literature as potentially being a risk factor for cancer recurrence due to the effects on the immune system.5,10
Although the pathology report was benign for this patient, it was thought that prior to the surgery a reduction in opioid usage was important because he may have had a thyroid carcinoma in addition to the other respiratory considerations. Additionally, it was desired to decrease the amount of volatile anesthetic agents needed for this patient, because the surgical procedure was anticipated to be quite prolonged (it lasted 15 hours).
Conclusions
Recent research showed that a dexmedetomidine infusion combined with a low-dosage midazolam was superior to a higher dosage midazolam regimen for awake fiberoptic intubation in terms of stability, comfort, cooperation, and patient satisfaction.11 This is an example of the utility of dexmedetomidine. It is often insufficient when used alone, but as an adjunct will markedly reduce the dosage of other sedatives needed to achieve the desired Ramsey sedation scores and/or clinical benefit. Additionally, dexmedetomidine has been shown to facilitate weaning patients in a case series (who had previously failed weaning) from mechanical ventilation in surgical intensive care settings.12
The use of dexmedetomidine facilitated awake intubation for this patient and was helpful for postoperative sedation. The authors believe that dexmedetomidine has potential benefits in all phases of surgery and is a potentially valuable addition to the anesthesiologist’s and intensivist’s armamentarium.
Acknowledgements
This work was conducted at and supported by the G.V. (Sonny) Montgomery VA Medical Center in Jackson, Mississippi.
Author disclosures
The authors report no actual or potential conflicts of interest with regard to this article.
Disclaimer
The opinions expressed herein are those of the authors and do not necessarily reflect those of Federal Practitioner, Frontline Medical Communications Inc., the U.S. Government, or any of its agencies. This article may discuss unlabeled or investigational use of certain drugs. Please review the complete prescribing information for specific drugs or drug combinations—including indications, contraindications, warnings, and adverse effects—before administering pharmacologic therapy to patients.
1. Hathaway B, Johnson JT. Safety of uvulopalatopharyngoplasty as outpatient surgery. Otolaryngol Head Neck Surg. 2006;134(4):542-544.
2. Gertler R, Brown HC, Mitchell DH, Silvius EN. Dexmedetomidine: A novel sedative-analgesic agent. Proc (Bayl Univ Med Cen). 2001;14(1):13-21.
3. Gurbet A, Basagan-Mogol E, Turker G, Ugun F, Kaya FN, Ozcan B. Intraoperative infusion of dexmedetomidine reduces perioperative analgesic requirements. Can J Anaesth. 2006;53(7):646-652.
4. Ebert TJ, Hall JE, Barney JA, Uhrich TD, Colinco MD. The effects of increasing plasma concentrations of dexmedetomidine in humans. Anesthesiology. 2000;93(2):382-394.
5. Venn RM, Bradshaw CJ, Spencer R, et al. Preliminary UK experience of dexmedetomidine, a novel agent for postoperative sedation in the intensive care unit. Anaesthesia. 1999;54(12):1136-1142.
6. Bergese SD, Khabiri B, Roberts WD, Howie MB, McSweeney TD, Gerhardt MA. Dexmedetomidine for conscious sedation in difficult awake fiberoptic intubation cases. J Clin Anesth. 2007;19(4):141-144.
7. Grant SA, Breslin DS, MacLeod DB, Gleason D, Martin G. Dexmedetomidine infusion for sedation during fiberoptic intubation: A report of three cases. J Clin Anesth. 2004;16(2):124-126.
8. Yildiz M, Tavlan A, Tuncer S, Reisli R, Yosunkaya A, Otelcioglu S. Effect of dexmedetomidine on haemodynamic responses to laryngoscopy and intubation: Perioperative haemodynamics and anaesthetic requirements. Drugs R D. 2006;7(1):43-52.
9. Herr DL, Sum-Ping ST, England M. ICU sedation after coronary artery bypass graft surgery: Dexmedetomidine-based versus propofol-based sedation regimens. J Cardiothorac Vasc Anesth. 2003;17(5):576-584.
10. Biki B, Mascha E, Moriarty DC, Fitzpatrick JM, Sessler DI, Buggy DJ. Anesthetic technique for radical prostatectomy surgery affects cancer recurrence: A retrospective analysis. Anesthesiology. 2008;109(2):180-187.
11. Bergese SD, Patrick Bender S, McSweeney TD, Fernandez S, Dzwonczyk R, Sage K. A comparative study of dexmedetomidine with midazolam and midazolam alone for sedation during elective awake fiberoptic intubation. J Clin Anesth. 2010;22(1):35-40.
12. Siobal MS, Kallet RH, Kivett VA, Tang JF. Use of dexmedetomidine to facilitate extubation in surgical intensive-care-unit patients who failed previous weaning attempts following prolonged mechanical ventilation: A pilot study. Respir Care. 2006;51(5):492-496.
The following case report describes the use of dexmedetomidine as the primary sedative for an awake endotracheal intubation, as an adjuvant for general anesthesia, and for postoperative sedation for mechanical ventilation. This case illustrates problems that attracted the attention of federal institutions, specifically the management of difficult airways (with and without anatomic distortion), obesity, and obstructive sleep apnea (OSA). As such, it is of potential interest not only to anesthesiologists, but also other health care providers in the VA, especially those who might practice in intensive care settings.
Dexmedetomidine has useful pharmacologic properties that have potential use in a wide variety of clinical scenarios. Dexmedetomidine is currently indicated for sedation in nonintubated patients before and during surgical and other procedures and in intubated and mechanically ventilated patients during treatment in an intensive care setting.
Large neck masses can produce numerous problems that complicate the anesthetic management in the intraoperative and immediate postoperative arenas. The adjuvant use of dexmedetomidine, an alpha-2 agonist that has useful properties for both the anesthetic and intensive care situations, will be discussed. The problems involved with the management and resection of large neck masses include tracheal deviation, tracheal compression, airway edema, distorted anatomy, difficult mask ventilation, difficult intubation, postoperative recurrent laryngeal nerve dysfunction, and difficult exposure for tracheostomy.
Case Report
A 46-year-old man was referred for removal of a large thyroid mass. His past medical history included hypertension, obesity, and type 2 diabetes mellitus. Clinically, the patient seemed to be at risk for OSA, but he had not received a formal diagnosis. The patient met many of the criteria for screening OSA that are listed for a STOP-Bang Questionnaire.1 He was clinically and serologically euthyroid. Neck ultrasound revealed a very large thyroid mass with cystic and solid lesions throughout. Other than hoarseness, the patient reported no compressive symptoms, such as dysphagia or airway compromise. He was maintained on metoprolol, fosinopril, a thiazide for hypertension, and metformin and insulin for diabetes. A physical examination was remarkable for a Mallampati IV airway classification, a 61-cm neck circumference, 177 cm height, 142 kg weight, and a body mass index of 45. These preoperative assessments were predictive of a high probability of very difficult mask ventilation and intubation after the induction of a general anesthetic, or in any other situation requiring tracheal intubation, such as respiratory failure in the postoperative period.
Preoperative laboratory studies, chest radiograph, and electrocardiogram (ECG) were unremarkable. Computed tomography (CT) imaging of the neck revealed marked enlargement of the thyroid, which had a multinodular, heterogeneous appearance with scattered calcifications. The left lobe of the thyroid measured 13.0 cm craniocaudal by 9.47 cm transverse by 6.8 cm anteroposterior. The right lobe of the thyroid measured 12.0 cm craniocaudal by 7.6 cm transverse by 7.0 cm anteroposterior (Figure 1).
The first concern for this patient was a secure airway, which potentially could have been very difficult to procure with a standard IV induction of anesthesia followed by a direct laryngoscopy. This was further constrained by the surgical requirement that the patient be intubated with an electromyography (EMG) endotracheal tube for monitoring of the recurrent laryngeal nerves, as thyroid surgery carries the risk of injury to these nerves. The type of tube that was used had a larger diameter than that of a standard endotracheal tube (the EMG tube measured 10.2 mm outside diameter vs 9.6 mm outside diameter for a standard tube) but was also far more rigid, precluding nasal intubation and making navigation of the tip around corners and obstructions more difficult. A final laryngoscopy was also needed for confirmation of optimal electrode placement at the vocal cord level (Figure 2).
The anesthetic plan was to secure the airway with an awake oral fiberoptic intubation under sedation and topical local anesthetic to avoid the hypoxemia that would ensue if the patient lost spontaneous respiration. The patient was brought without preoperative sedation to the operating room, standard monitors (eg, ECG, noninvasive blood pressure, pulse oximetry) were applied and IV access was obtained. Blood pressure, heart rate, and oxygen saturation were within normal limits. He was placed on oxygen 2 L/min by nasal cannula and given a 1 μg/kg loading dose of dexmedetomidine over 10 minutes and thereafter maintained on a 0.4 μg/kg/h maintenance infusion during the entire airway intubation sequence. A topical anesthesia of 4% lidocaine spray was applied to the upper airway, and a transtracheal injection was performed with 2 mL of 4% lidocaine. The patient’s anatomy precluded the use of superior laryngeal nerve blocks. During the dexmedetomidine loading, he was given 1 mg midazolam and 100 μg fentanyl IV incrementally. No significant hemodynamic or respiratory changes occurred with this sedation regimen.
An attempt to place an oral intubation bite block failed, because the stiff EMG tube proved too difficult to pass through it. Therefore, the EMG tube and rolled gauze pads placed between the upper and lower teeth were used to protect the fiberoptic bronchoscope while it was guided past the base of the tongue. As was noted in the CT scan, the airway was deviated slightly to the left, and this information was useful for guiding the fiberscope. The location of the epiglottis was fairly difficult to ascertain due to redundant tissue in the hypopharyngeal area but was ultimately visible through the fiberscope.
The vocal cords were not visible, possibly due to the significant amount of airway edema and/or redundant tissue between the epiglottis and the vocal cords: Only the space beneath the epiglottis could be seen via the fiberscope. Passing the bronchoscope through the larynx also was problematic due to what may be described as altered spatial/angular relationships and due to the supraglottic edema/tissue leaving little room for the tip of the bronchoscope to be maneuvered. Figure 3 shows a CT scan image of the supraglottic area.
It took 45 minutes and multiple attempts to pass the bronchoscope into the trachea. The dexmedetomidine infusion was continued throughout this entire sequence. The patient tolerated this manipulation with little difficulty, despite the multiple airway maneuvers, and his hemodynamic and respiratory status remained clinically stable. Oxygen saturation was 95% to 100% during this sequence and the patient did not show evidence of significant upper airway collapse, desaturation, or apnea, which are sometimes encountered during sedation for airway manipulation.
The patient’s hemodynamic status remained near baseline values throughout the airway manipulation. The patient never lost his ability to cooperate. After manipulation of the fiberscope into the trachea, the tracheal rings and carina were visualized, and the tube was advanced over the scope. Minimal to mild coughing occurred once the tube passed through the vocal cords. The tube position in the trachea was verified with end-tidal CO2 and bronchoscopy and then the induction of anesthesia with propofol was completed. A laryngoscopy using a videolaryngoscope confirmed proper EMG electrode placement. Large-bore IV access and an arterial line were then secured.
The operation lasted about 15 hours. Maintenance of anesthesia was accomplished with the use of the volatile anesthetic desflurane, titrated to patient response to the surgical procedure. Additionally, 550 μg of IV fentanyl was used intermittently during the operation. Dexmedetomidine was infused at a rate of 0.2 to 0.4 μg/kg/h during the anesthetic, titrated to hemodynamic response. All hemodynamic parameters remained stable and within 20% of preoperative levels during the procedure. The blood loss during the procedure was minimal (< 100 mL), and acceptable readings from the EMG tube were confirmed throughout the surgical procedure.
The 686-gram thyroid mass was confirmed to be a multinodular goiter. Due to the difficulty with intubation, the length of the surgical procedure, and the likelihood of airway difficulties from edema possibly requiring reintubation, the patient was left intubated and mechanically ventilated overnight and sedated with a dexmedetomidine infusion of 0.3 μg/kg/h and propofol 35 mL/h. No further medications were required. He tolerated the ventilator without fighting, straining, coughing, or hypertensive responses and remained cooperative when aroused. He was successfully extubated the following day. Afterward, the patient maintained his airway and had only a mild right vocal cord paresis complicating his surgical management.
Discussion
The critical issues associated with this successful endotracheal intubation included the patient’s obesity, thyroid mass size, and deviation/compression of the trachea. Were this patient morbidly obese only, airway management would still be problematic; this was exacerbated by the concurrent pathologies. Dexmedetomidine possesses several advantageous properties for the perioperative period and was chosen as sedation for the awake intubation due to its sedative-analgesic effects, opioid sparing effects, lack of respiratory depression, maintenance of patient cooperation, and antisialagogue effect.2-5 Dexmedetomidine has previously been shown to be useful for awake intubation of difficult airway cases.4,6,7 Importantly, the dexmedetomidine sedation seemed to blunt the hypertensive responses often seen during airway maneuvers.8 It was also chosen as an intraoperative adjunct due to the above-noted opioid-sparing effects, given the importance of minimizing perioperative opioids needed for this morbidly obese individual with airway compromise.
In the literature, dexmedetomidine has been shown to greatly reduce the need for opioids, both intraoperatively and immediately postoperatively in many citations, for example, in postoperative mechanically ventilated coronary artery bypass graft patients.2,9 Opioid usage reduction is especially needed for the morbidly obese who are at increased risk of OSA and the attendant increased sensitivity to the respiratory depressant effects of narcotics. Postoperative opioids are being debated in the literature as potentially being a risk factor for cancer recurrence due to the effects on the immune system.5,10
Although the pathology report was benign for this patient, it was thought that prior to the surgery a reduction in opioid usage was important because he may have had a thyroid carcinoma in addition to the other respiratory considerations. Additionally, it was desired to decrease the amount of volatile anesthetic agents needed for this patient, because the surgical procedure was anticipated to be quite prolonged (it lasted 15 hours).
Conclusions
Recent research showed that a dexmedetomidine infusion combined with a low-dosage midazolam was superior to a higher dosage midazolam regimen for awake fiberoptic intubation in terms of stability, comfort, cooperation, and patient satisfaction.11 This is an example of the utility of dexmedetomidine. It is often insufficient when used alone, but as an adjunct will markedly reduce the dosage of other sedatives needed to achieve the desired Ramsey sedation scores and/or clinical benefit. Additionally, dexmedetomidine has been shown to facilitate weaning patients in a case series (who had previously failed weaning) from mechanical ventilation in surgical intensive care settings.12
The use of dexmedetomidine facilitated awake intubation for this patient and was helpful for postoperative sedation. The authors believe that dexmedetomidine has potential benefits in all phases of surgery and is a potentially valuable addition to the anesthesiologist’s and intensivist’s armamentarium.
Acknowledgements
This work was conducted at and supported by the G.V. (Sonny) Montgomery VA Medical Center in Jackson, Mississippi.
Author disclosures
The authors report no actual or potential conflicts of interest with regard to this article.
Disclaimer
The opinions expressed herein are those of the authors and do not necessarily reflect those of Federal Practitioner, Frontline Medical Communications Inc., the U.S. Government, or any of its agencies. This article may discuss unlabeled or investigational use of certain drugs. Please review the complete prescribing information for specific drugs or drug combinations—including indications, contraindications, warnings, and adverse effects—before administering pharmacologic therapy to patients.
1. Hathaway B, Johnson JT. Safety of uvulopalatopharyngoplasty as outpatient surgery. Otolaryngol Head Neck Surg. 2006;134(4):542-544.
2. Gertler R, Brown HC, Mitchell DH, Silvius EN. Dexmedetomidine: A novel sedative-analgesic agent. Proc (Bayl Univ Med Cen). 2001;14(1):13-21.
3. Gurbet A, Basagan-Mogol E, Turker G, Ugun F, Kaya FN, Ozcan B. Intraoperative infusion of dexmedetomidine reduces perioperative analgesic requirements. Can J Anaesth. 2006;53(7):646-652.
4. Ebert TJ, Hall JE, Barney JA, Uhrich TD, Colinco MD. The effects of increasing plasma concentrations of dexmedetomidine in humans. Anesthesiology. 2000;93(2):382-394.
5. Venn RM, Bradshaw CJ, Spencer R, et al. Preliminary UK experience of dexmedetomidine, a novel agent for postoperative sedation in the intensive care unit. Anaesthesia. 1999;54(12):1136-1142.
6. Bergese SD, Khabiri B, Roberts WD, Howie MB, McSweeney TD, Gerhardt MA. Dexmedetomidine for conscious sedation in difficult awake fiberoptic intubation cases. J Clin Anesth. 2007;19(4):141-144.
7. Grant SA, Breslin DS, MacLeod DB, Gleason D, Martin G. Dexmedetomidine infusion for sedation during fiberoptic intubation: A report of three cases. J Clin Anesth. 2004;16(2):124-126.
8. Yildiz M, Tavlan A, Tuncer S, Reisli R, Yosunkaya A, Otelcioglu S. Effect of dexmedetomidine on haemodynamic responses to laryngoscopy and intubation: Perioperative haemodynamics and anaesthetic requirements. Drugs R D. 2006;7(1):43-52.
9. Herr DL, Sum-Ping ST, England M. ICU sedation after coronary artery bypass graft surgery: Dexmedetomidine-based versus propofol-based sedation regimens. J Cardiothorac Vasc Anesth. 2003;17(5):576-584.
10. Biki B, Mascha E, Moriarty DC, Fitzpatrick JM, Sessler DI, Buggy DJ. Anesthetic technique for radical prostatectomy surgery affects cancer recurrence: A retrospective analysis. Anesthesiology. 2008;109(2):180-187.
11. Bergese SD, Patrick Bender S, McSweeney TD, Fernandez S, Dzwonczyk R, Sage K. A comparative study of dexmedetomidine with midazolam and midazolam alone for sedation during elective awake fiberoptic intubation. J Clin Anesth. 2010;22(1):35-40.
12. Siobal MS, Kallet RH, Kivett VA, Tang JF. Use of dexmedetomidine to facilitate extubation in surgical intensive-care-unit patients who failed previous weaning attempts following prolonged mechanical ventilation: A pilot study. Respir Care. 2006;51(5):492-496.