User login
Reducing Unnecessary Treatment of Asymptomatic Elevated Blood Pressure with Intravenous Medications on the General Internal Medicine Wards: A Quality Improvement Initiative
Elevated blood pressure (BP) is common among hospitalized adults, with prevalence estimates between 50% and 70%.1 Many factors can cause or exacerbate BP elevations in the setting of acute illness, such as pain, anxiety, medication withdrawal, and volume status, among others.2 While there are clear evidence-based recommendations for treating hypertension (HTN) in the ambulatory setting,3 guidelines for the management of elevated BP in the hospital are lacking.4,5
Hypertensive crises are generally recognized as warranting rapid reduction in BP;6-8 however, these represent the minority of cases.9,10 Far more common in the hospital are patients with asymptomatic elevated BP, a population for which there is no high-quality evidence and no guidelines supporting the use of intravenous (IV) antihypertensives.11,12 Treatment with such medications has been associated with highly variable clinical responses13-15 and may result in adverse events, such as hypotension.10
To date, only a small number of studies have investigated the treatment of asymptomatic elevated BP among hospitalized adults.10,13-15 These have suggested that IV antihypertensives are utilized frequently in this setting, often for only modestly elevated BPs; however, the studies have tended to be small, not racially diverse, and limited to noncritically ill patients. Furthermore, while it is generally accepted that reducing the use of IV antihypertensives among asymptomatic patients would have no adverse impact, to our knowledge there have been no published studies which have instituted such an initiative while measuring balancing outcomes.
The purpose of this study was to further the existing literature by defining the prevalence and effects of IV antihypertensive medication utilization among a medically complex, multiracial population of asymptomatic medical inpatients using a large electronic dataset and to evaluate the impact of a division-wide, two-tiered quality improvement (QI) initiative on the rates of IV antihypertensive utilization and patient outcomes.
METHODS
Setting
The study was conducted at the University of California, San Francisco (UCSF), an 800-bed tertiary care, academic medical center. It was approved by the UCSF Institutional Review Board. General medicine patients at UCSF are distributed between teaching and direct-care (hospitalist) services. The intensive care unit (ICU) is “open,” meaning the medicine service acts as the primary team for all nonsurgical ICU patients. This study included all adult general medicine patients admitted to UCSF Medical Center between January 1, 2017 and March 1, 2018, including those in the ICU.
Study Population and Data Collection
The UCSF Medical Center uses the electronic health record (EHR) Epic (Epic 2017, Epic Systems Corporation, Verona, Wisconsin) for all clinical care. We obtained computerized EHR data from Clarity, the relational database that stores Epic’s inpatient data in thousands of tables, including orders, medications, laboratory and radiology results, vital signs, patient demographics, and notes. We identified all adult patients hospitalized on the general medicine service with ≥1 episode of elevated BP (>160/90 mm Hg) at any point during their hospitalization who were not on a vasopressor medication at the time of the vital sign recording.
We further identified all instances in which either IV labetalol or hydralazine were administered to these patients. These two agents were chosen because they are the only IV antihypertensives used commonly at our institution for the treatment of asymptomatic elevated BP among internal medicine patients. Only those orders placed by a general medicine provider or reconciled by a general medicine provider upon transfer from another service were included. For each medication administration timestamp, we collected vital signs before and after the administration, along with the ordering provider and the clinical indication that was documented in the electronic order. To determine if a medication was administered with concern for end-organ injury, we also extracted orders that could serve as a proxy for the provider’s clinical assessment—namely electrocardiograms, serum troponins, chest x-rays, and computerized tomography scans of the head—which were placed in the one hour preceding or 15 minutes following administration of an IV antihypertensive medication.
To assess for comorbid conditions, including a preexisting diagnosis of HTN, we collected International Classification of Diseases (ICD)-9/10 diagnosis codes. Further, we also extracted All Patient Refined Diagnosis-Related Group (APR-DRG) weights, which are a standardized measure of illness severity based on relative resource consumption during hospitalization.16,17
Patients were categorized as having either “symptomatic” or “asymptomatic” elevated BP. We defined symptomatic elevated BP as having received treatment with an IV medication with provider concern for end-organ injury, as defined above. We further identified all patients in which tight BP control may be clinically indicated on the basis of the presence of any of the following ICD-9/10 diagnosis codes at the time of hospital discharge: myocardial infarction, ischemic stroke, intracranial hemorrhage, subarachnoid hemorrhage, subdural hematoma, aortic dissection, hypertensive emergency, or hypertensive encephalopathy. All patients with symptomatic elevated BP or any of the above ICD-9/10 diagnoses were excluded from the analysis, since administration of IV antihypertensive medications would plausibly be warranted in these clinical scenarios.
The encounter numbers from the dataset were used to link to patient demographic data, which included age, sex, race, ethnicity, primary language, and insurance status. Finally, we identified all instances of rapid response calls, ICU transfers, and code blues (cardiopulmonary arrests) for each patient in the dataset.
Blood Pressure Measurements
BP data were collected from invasive BP (IBP) monitoring devices and noninvasive BP cuffs. For patients with BP measurements recorded concomitantly from both IBP (ie, arterial lines) in addition to noninvasive BP cuffs, the arterial line reading was favored. All systolic BP (SBP) readings >240 mm Hg from arterial lines were excluded, as this has previously been described as the upper physiologic limit for IBP readings.18
Primary Outcome
The primary outcome for the study was the proportion of patients treated with IV antihypertensive medications (labetalol or hydralazine). Using aggregate data, we calculated the number of patients who were treated at least once with an IV antihypertensive in a given month (numerator), divided by the number of patients with ≥1 episode of asymptomatic elevated BP that month (denominator). The denominator was considered to be the population of patients “at risk” of being treated with IV antihypertensive medications. For patients with multiple admissions during the study period, each admission was considered separately. These results are displayed in the upper portion of the run chart (Figure).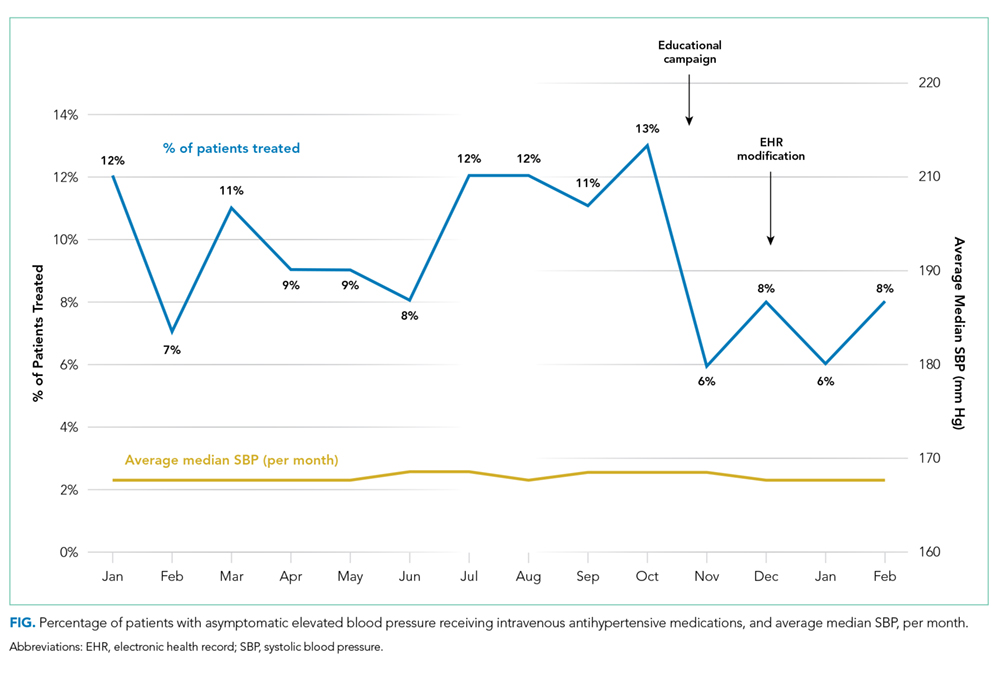
Secondary Outcomes
To investigate blood pressure trends over time, we analyzed BP in three ways. First, we analyzed the median SBP for the entire population. Second, to determine clinical responses to IV antihypertensive medications among patients receiving treatment, we calculated the population medians for the pretreatment SBP, the change in SBP from pretreatment baseline, and the posttreatment SBP. Third, we calculated the average median SBP on a monthly basis for the duration of the study. This was achieved by calculating the median value of all SBPs for an individual patient, then averaging across all patients in a given month. The average monthly median SBPs are displayed in the lower portion of the Figure.
To investigate whether the intervention was associated with negative patient outcomes, the proportions of several balancing outcomes were compared between pre- and postintervention periods, including ICU transfers, rapid response calls, and code blues (cardiopulmonary arrests).
Development and Implementation of an Intervention to Reduce Excessive IV Antihypertensive Use
After establishing the baseline prevalence of IV antihypertensive medication use at our institution, we developed a QI initiative with the goal of reducing IV antihypertensive medication utilization by the general medicine service for the treatment of asymptomatic patients. We hypothesized that potential contributors to overutilization might include lack of education, provider/nursing discomfort, and a system designed to mandate provider notification for even modestly elevated BPs. The QI initiative, which took place between October 2017 and December 2017, was designed to address these potential contributors and was comprised of a division-wide, two-tiered, bundled intervention. Our choice of a two-tiered approach was based on the fact that successful culture change is challenging, along with the existing evidence that multifaceted QI interventions are more often successful than single-tiered approaches.19
The first tier of the initiative included an educational campaign referred to colloquially as “NoIVForHighBP,” which targeted residents, hospitalists, and nursing staff. The campaign consisted of a series of presentations, best practice updates, handouts, and posters displayed prominently in shared workspaces. The educational content focused on alternative approaches to the management of asymptomatic elevated BP in the hospital, such as identification and treatment of pain, anxiety, volume overload, or other contributing factors (see supplemental materials). These educational outreaches occurred periodically between October 4, 2017 and November 20, 2017, with the bulk of the educational efforts taking place during November. Therefore, November 1, 2017 was designated the start date for the intervention period.
The second tier of the intervention included the liberalization of the EHR BP notification parameters on the standard inpatient admission order set from >160/90 mm Hg to >180/90 mm Hg. This change took effect on 12/6/2017. The decision to modify the BP notification parameters was based on the hypothesis that mandatory notifications for modestly elevated BPs may prompt providers to reflexively order IV antihypertensive medications, especially during times of cross-coverage or high clinical workload.
Statistical Analysis
All statistical analyses were performed using Stata software version 15 (StataCorp. 2017. Stata Statistical Software: Release 15. College Station, Texas: StataCorp LLC). Baseline patient characteristics were compared using nonparametric tests of significance. Population median SBPs were compared between pre- and postintervention periods using Mood’s Median Test, which was selected because the data were distributed nonnormally, and variances between samples were unequal.
Among patients treated with IV antihypertensive medications, we compared the proportion of pretreatment SBPs falling into each of three specified ranges (SBP <180 mm Hg, SBP 180-199 mm Hg, and SBP >200 mm Hg) between baseline and intervention periods using chi-squared tests.
Using aggregate data, we compared the unadjusted proportion of patients treated with IV antihypertensive medications between pre- and postintervention periods using a chi-squared test. Next, using patient-level data, a logistic regression analysis was performed to examine the association between receipt of IV antihypertensive medications and time (dichotomized between pre- and postintervention periods) while adjusting for age, sex, race, ethnicity, primary language, insurance status, preexisting HTN, length of stay, and APR-DRG weight.
Rates of balancing outcomes were compared using chi-squared tests. A logistic regression analysis using patient-level data was also performed to investigate the association between each of these outcomes and the intervention period (pre vs post) while adjusting for age, sex, race, ethnicity, primary language, insurance status, preexisting HTN, length of stay, and APR-DRG weight.
RESULTS
Baseline Period
We identified 2,306 patients with ≥1 episode of asymptomatic elevated BP during the 10-month preintervention period. Patients on average experienced 9 episodes of elevated BP per hospitalization, representing 21,207 potential opportunities for treatment. Baseline characteristics are summarized in Table 1. In general, this represents an older population that was medically complex and multiracial.
Of these patients, 251 (11%) received IV hydralazine and/or labetalol at least once during their hospitalization, with a total of 597 doses administered. Among those treated, a median of 2 doses were given per patient (IQR: 1-4), 64% of which were hydralazine. The majority (380 [64%]) were ordered on an “as needed” basis, while 217 (36%) were administered as a one-time dose. Three-quarters of all doses were ordered by the teaching service (456 [76%]), with the remaining 24% ordered by the direct-care (hospitalist) service.
During the baseline period among patients receiving IV antihypertensive medications, the median SBP of the population prior to treatment was 187 mm Hg (IQR 177-199; Table 2). Treatment was initiated in 30% of patients for an SBP <180 mm Hg and in 75% for an SBP <200 mm Hg. The median time to follow-up BP check was 34 minutes (IQR 15-58). The median decrement in SBP was 20 mm Hg (IQR 5-37); however, the response to treatment was highly variable, with 2% of patients experiencing no change and 14% experiencing an increase in SBP. Seventy-nine patients (14%) had a decrement in SBP >25% following treatment.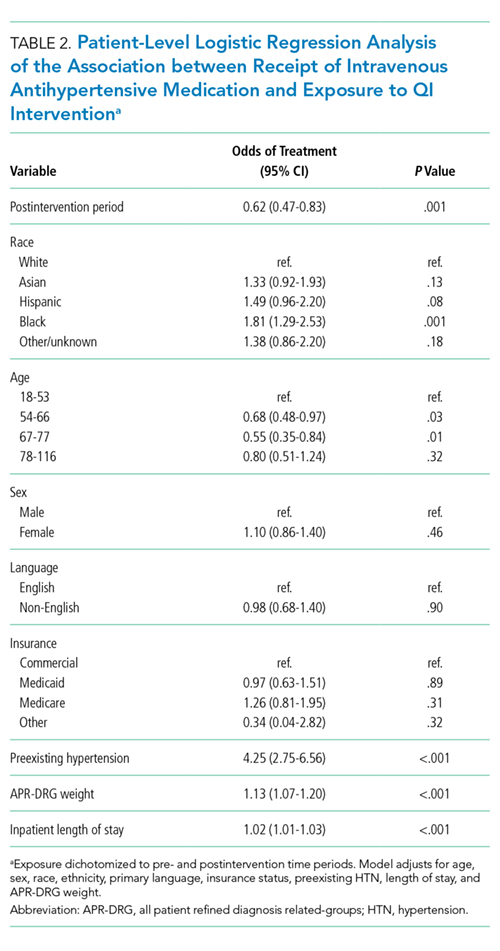
Description of Quality Improvement Results
Following the QI initiative, a total of 934 patients experienced 9,743 episodes of asymptomatic elevated blood pressure over a 4-month period (November 1, 2017 to February 28, 2018). As shown in Table 1, patients in the postintervention period had a slightly higher median age (67 [IQR 55-80] vs 69 [IQR 57-83]; P = .01), a higher median APR-DRG weight (1.34 [IQR 0.99-1.77] vs 1.48 [1.00-1.82]; P < .001), and a longer median length of stay (4.6 [2.8-8.0] days vs 5.1 [2.9-9.2] days; P = .004). There was also a higher proportion of nonEnglish speakers, fewer Black patients, and a lower proportion of preexisting HTN, in the postintervention period.
Of the 934 patients with ≥1 episode of asymptomatic elevated BP, 70 (7%) were treated with IV antihypertensive medications, with a total of 196 doses administered. The proportion of patients treated per month during the postintervention period ranged from 6% to 8%, which was the lowest of the entire study period and below the baseline average of 10% (Figure).
In a patient-level logistic regression pre-post analysis adjusting for age, sex, race, ethnicity, primary language, insurance status, preexisting HTN, length of stay, and APR-DRG weight, patients admitted to the general medicine service during the postintervention period had 38% lower odds of receiving IV antihypertensive medications than those admitted during the baseline period (OR = 0.62; 95% CI 0.47-0.83; P = .001). In this adjusted model, the following factors were independently associated with increased odds of receiving treatment: APR-DRG weight (OR 1.13; 95% CI 1.07-1.20; P < .001), Black race (OR 1.81; 95% CI 1.29-2.53; P = .001), length of stay (OR 1.02; 95% CI 1.01-1.03; P < .001), and preexisting HTN (OR 4.25; 95% CI 2.75-6.56; P < .001). Older age was associated with lower odds of treatment (Table 2).
Among patients who received treatment, there were no differences between pre- and postintervention periods in the proportion of pretreatment SBP <180 mm Hg (29% vs 32%; P = .40), 180-199 mm Hg (47% vs 40%; P = .10), or >200 mm Hg (25% vs 28%; P = .31; Table 3).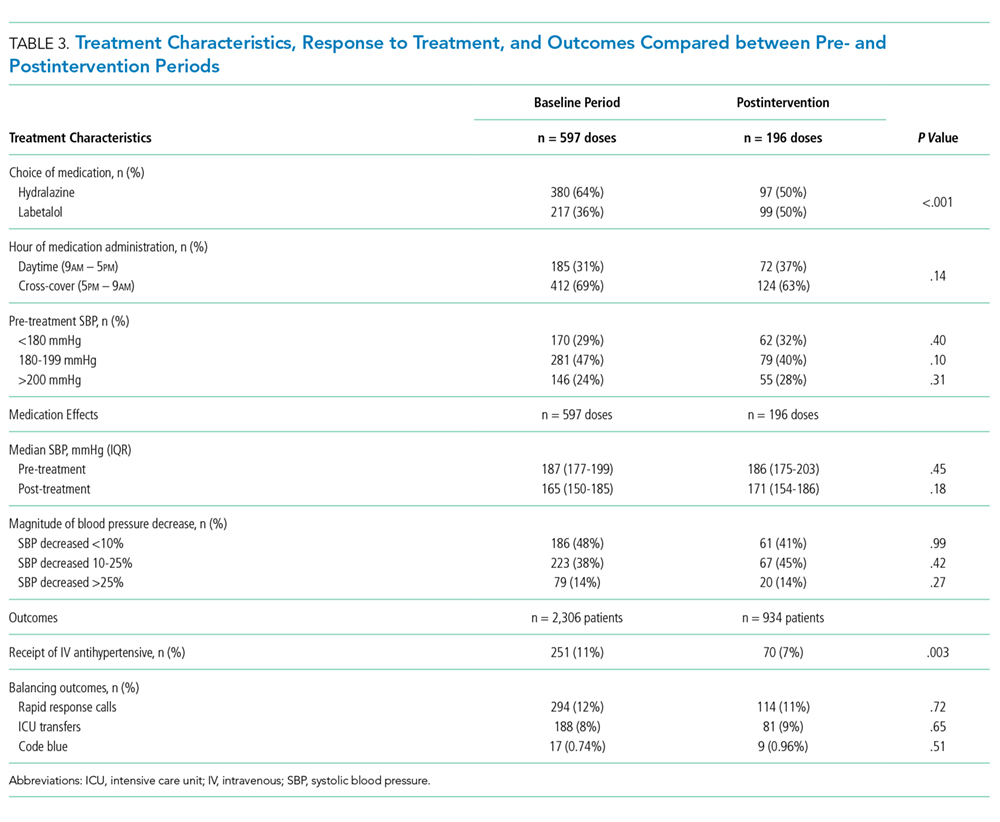
Population-level median SBP was similar between pre- and postintervention periods (167 mm Hg vs 168 mm Hg, P = .78), as were unadjusted rates of rapid response calls, ICU transfers, and code blues (Table 3). After adjustment for baseline characteristics and illness severity at the patient level, the odds of rapid response calls (OR 0.84; 95% CI 0.65-1.10; P = .21) and ICU transfers (OR 1.01; 95% CI 0.75-1.38; P = .93) did not differ between pre- and postintervention periods. A regression model was not fit for cardiopulmonary arrests due to the low absolute number of events.
CONCLUSIONS
Our results suggest that treatment of asymptomatic elevated BP using IV antihypertensive medications is common practice at our institution. We found that treatment is often initiated for only modestly elevated BPs and that the clinical response to these medications is highly variable. In the baseline period, one in seven patients experienced a decrement in BP >25% following treatment, which could potentially cause harm.11 There is no evidence, neither are there any consensus guidelines, to support the rapid reduction of BP among asymptomatic patients, making this a potential valuable opportunity for reducing unnecessary treatment, minimizing waste, and avoiding harm.
While there are a few previously published studies with similar results, we add to the existing literature by studying a larger population of more than 3,000 total patients, which was uniquely multiracial, including a high proportion of non-English speakers. Furthermore, our cohort included patients in the ICU, which is reflected in the higher-than-average APR-DRG weights. Despite being critically ill, these patients arguably still do not warrant aggressive treatment of elevated BP when asymptomatic. By excluding symptomatic BP elevations using surrogate markers for end-organ damage in addition to discharge diagnosis codes indicative of conditions in which tight BP control may be warranted, we were able to study a more critically ill patient population. We were also able to describe which baseline patient characteristics convey higher adjusted odds of receiving treatment, such as preexisting HTN, younger age, illness severity, and black race.
Perhaps most significantly, our study is the first to demonstrate an effective QI intervention aimed at reducing unnecessary utilization of IV antihypertensives. We found that this can feasibly be accomplished through a combination of educational efforts and systems changes, which could easily be replicated at other institutions. While the absolute reduction in the number of patients receiving treatment was modest, if these findings were to be widely accepted and resulted in a wide-spread change in culture, there would be a potential for greater impact.
Despite the reduction in the proportion of patients receiving IV antihypertensive medications, we found no change in the median SBP compared with the baseline period, which seems to support that the intervention was well tolerated. We also found no difference in the number of ICU transfers, rapid response calls, and cardiopulmonary arrests between groups. While these findings are both reassuring, it is impossible to draw definitive conclusions about safety given the small absolute number of patients having received treatment in each group. Fortunately, current guidelines and literature support the safety of such an intervention, as there is no existing evidence to suggest that failing to rapidly lower BP among asymptomatic patients is potentially harmful.11
There are several limitations to our study. First, by utilizing a large electronic dataset, the quality of our analyses was reliant on the accuracy of the recorded EHR data. Second, in the absence of a controlled trial or control group, we cannot say definitively that our QI initiative was the direct cause of the improved rates of IV antihypertensive utilization, though the effect did persist after adjusting for baseline characteristics in patient-level models. Third, our follow-up period was relatively short, with fewer than half as many patients as in the preintervention period. This is an important limitation, since the impact of QI interventions often diminishes over time. We plan to continually monitor IV antihypertensive use, feed those data back to our group, and revitalize educational efforts should rates begin to rise. Fourth, we were unable to directly measure which patients had true end-organ injury and instead used orders placed around the time of medication administration as a surrogate marker. While this is an imperfect measure, we feel that in cases where a provider was concerned enough to even test for end-organ injury, the use of IV antihypertensives was likely justified and was therefore appropriately excluded from the analysis. Lastly, we were limited in our ability to describe associations with true clinical outcomes, such as stroke or myocardial infarction, which could theoretically be propagated by either the use or the avoidance of IV antihypertensive medications. Fortunately, based on clinical guidelines and existing evidence, there is no reason to believe that reducing IV antihypertensive use would result in increased rates of these outcomes.
Our study reaffirms the fact that overutilization of IV antihypertensive medications among asymptomatic hospitalized patients is pervasive across hospital systems. This represents a potential target for a concerted change in culture, which we have demonstrated can be feasibly accomplished through education and systems changes.
Disclosures
Dr. Auerbach has current or pending grants from the CDC, PCORI, and FDA that are unrelated to this research manuscript. He also receives royalties from UpToDate, and received an honorarium for being editor of JHM. Dr. Jacobs received a $1,000 Resident/Fellow Travel Grant from the Society of Hospital Medicine to support the cost of travel to SHM, where he presented this research as a poster in 2018. Dr. Prasad receives money from EpiExcellence, LLC for consultation, which is unrelated to this research manuscript. All other authors have nothing to disclose.
1. Axon RN, Cousineau L, Egan BM. Prevalence and management of hypertension in the inpatient setting: A systematic review. J Hosp Med. 2011;6(7):417-422. doi: 10.1002/jhm.804. PubMed
2. Herzog E, Frankenberger O, Aziz E, et al. A novel pathway for the management of ypertension for hospitalized patients. Crit Pathw Cardiol. 2007;6(4):150-160. doi: 10.1097/HPC.0b013e318160c3a7. PubMed
3. James PA, Oparil S, Carter BL, et al. 2014 evidence-based guideline for the management of high blood pressure in adults: report from the panel members appointed to the eighth Joint National Committee (JNC 8). JAMA. 2014;311(5):507-520. doi: 10.1001/jama.2013.284427. PubMed
4. Weder AB. Treating acute hypertension in the hospital: A lacuna in the guidelines [editorial]. Hypertension. 2011;57(1):18-20. PubMed
5. Axon RN, Turner M, Buckley R. An update on inpatient hypertension management. Curr Cardiol Rep. 2015;17(11):94. doi: 10.1007/s11886-015-0648-y. PubMed
6. Marik PE, Rivera R. Hypertensive emergencies: an update. Curr Opin Crit Care. 2011;17(6):569-580. doi:10.1097/MCC.0b013e32834cd31d. PubMed
7. Cherney D, Straus S. Management of patients with hypertensive urgencies and emergencies: a systematic review of the literature. J Gen Intern Med. 2002;17(12):937-945. doi: 10.1046/j.1525-1497.2002.20389.x. PubMed
8. Padilla Ramos A, Varon J. Current and newer agents for hypertensive emergencies. Curr Hypertens Rep. 2014;16(7):450. doi: 10.1007/s11906-014-0450-z. PubMed
9. Whitworth JA, World Health Organization, International Society of Hypertension Writing Group. 2003 World Health Organization (WHO)/International Society of Hypertension (ISH) statement on management of hypertension. J Hypertens. 2003;21(11):1983-1992. doi: 10.1097/01.hjh.0000084751.37215.d2. PubMed
10. Campbell P, Baker WL, Bendel SD, White WB. Intravenous hydralazine for blood pressure management in the hospitalized patient: its use is often unjustified. J Am Soc Hypertens. 2011;5(6):473-477. doi: 10.1016/j.jash.2011.07.002. PubMed
11. Chobanian AV, Bakris GL, Black HR, et al. The Seventh Report of the Joint National Committee on Prevention, Detection, Evaluation, and Treatment of High Blood Pressure: the JNC 7 report. JAMA. 2003;289(19):2560-2572. doi: 10.1001/jama.289.19.2560. PubMed
12. Gauer R. Severe asymptomatic hypertension: Evaluation and treatment. Am Fam Physician. 2017;95(8):492-500. PubMed
13. Lipari M, Moser LR, Petrovitch EA, Farber M, Flack JM. As-needed intravenous antihypertensive therapy and blood pressure control: Antihypertensive Therapy and BP Control. J Hosp Med. 2016;11(3):193-198. doi: 10.1002/jhm.2510. PubMed
14. Gaynor MF, Wright GC, Vondracek S. Retrospective review of the use of as-needed hydralazine and labetalol for the treatment of acute hypertension in hospitalized medicine patients. Ther Adv Cardiovasc Dis. 2017;12(1):7-15. doi: 10.1177/1753944717746613. PubMed
15. Weder AB, Erickson S. Treatment of hypertension in the inpatient setting: Use of intravenous labetalol and hydralazine. J Clin Hypertens. 2010;12(1):29-33. doi: 10.1111/j.1751-7176.2009.00196.x. PubMed
16. Averill RF, Goldfield N, Hughes, JS, et al. All Patient Refined Diagnosis Related Groups (APR-DRGs) Version 20.0: Methodology Overview. Clinical Research and Documentation Departments of 3M Health Information Systems, Wallingford, Connecticut and Murray, Utah, 2003. https://www.hcup-us.ahrq.gov/. Accessed February 19, 2018.
17. Iezzoni LI, Ash AS, Shwartz M, Daley J, Hughes JS, Mackiernan YD. Predicting who dies depends on how severity is measured: Implications for evaluating patient outcomes. Ann Intern Med. 1995;123(10):763-770. PubMed
18. Romagnoli S, Ricci Z, Quattrone D, et al. Accuracy of invasive arterial pressure monitoring in cardiovascular patients: an observational study. Crit Care. 2014;18(6):644. doi: 10.1186/s13054-014-0644-4. PubMed
19. Shojania K, Grimshaw JM. Evidence-based quality improvement: The state of the science. Health Aff (Millwood). 2005;24(1):138-150. doi: 10.1377/hlthaff.24.1.138. PubMed
Elevated blood pressure (BP) is common among hospitalized adults, with prevalence estimates between 50% and 70%.1 Many factors can cause or exacerbate BP elevations in the setting of acute illness, such as pain, anxiety, medication withdrawal, and volume status, among others.2 While there are clear evidence-based recommendations for treating hypertension (HTN) in the ambulatory setting,3 guidelines for the management of elevated BP in the hospital are lacking.4,5
Hypertensive crises are generally recognized as warranting rapid reduction in BP;6-8 however, these represent the minority of cases.9,10 Far more common in the hospital are patients with asymptomatic elevated BP, a population for which there is no high-quality evidence and no guidelines supporting the use of intravenous (IV) antihypertensives.11,12 Treatment with such medications has been associated with highly variable clinical responses13-15 and may result in adverse events, such as hypotension.10
To date, only a small number of studies have investigated the treatment of asymptomatic elevated BP among hospitalized adults.10,13-15 These have suggested that IV antihypertensives are utilized frequently in this setting, often for only modestly elevated BPs; however, the studies have tended to be small, not racially diverse, and limited to noncritically ill patients. Furthermore, while it is generally accepted that reducing the use of IV antihypertensives among asymptomatic patients would have no adverse impact, to our knowledge there have been no published studies which have instituted such an initiative while measuring balancing outcomes.
The purpose of this study was to further the existing literature by defining the prevalence and effects of IV antihypertensive medication utilization among a medically complex, multiracial population of asymptomatic medical inpatients using a large electronic dataset and to evaluate the impact of a division-wide, two-tiered quality improvement (QI) initiative on the rates of IV antihypertensive utilization and patient outcomes.
METHODS
Setting
The study was conducted at the University of California, San Francisco (UCSF), an 800-bed tertiary care, academic medical center. It was approved by the UCSF Institutional Review Board. General medicine patients at UCSF are distributed between teaching and direct-care (hospitalist) services. The intensive care unit (ICU) is “open,” meaning the medicine service acts as the primary team for all nonsurgical ICU patients. This study included all adult general medicine patients admitted to UCSF Medical Center between January 1, 2017 and March 1, 2018, including those in the ICU.
Study Population and Data Collection
The UCSF Medical Center uses the electronic health record (EHR) Epic (Epic 2017, Epic Systems Corporation, Verona, Wisconsin) for all clinical care. We obtained computerized EHR data from Clarity, the relational database that stores Epic’s inpatient data in thousands of tables, including orders, medications, laboratory and radiology results, vital signs, patient demographics, and notes. We identified all adult patients hospitalized on the general medicine service with ≥1 episode of elevated BP (>160/90 mm Hg) at any point during their hospitalization who were not on a vasopressor medication at the time of the vital sign recording.
We further identified all instances in which either IV labetalol or hydralazine were administered to these patients. These two agents were chosen because they are the only IV antihypertensives used commonly at our institution for the treatment of asymptomatic elevated BP among internal medicine patients. Only those orders placed by a general medicine provider or reconciled by a general medicine provider upon transfer from another service were included. For each medication administration timestamp, we collected vital signs before and after the administration, along with the ordering provider and the clinical indication that was documented in the electronic order. To determine if a medication was administered with concern for end-organ injury, we also extracted orders that could serve as a proxy for the provider’s clinical assessment—namely electrocardiograms, serum troponins, chest x-rays, and computerized tomography scans of the head—which were placed in the one hour preceding or 15 minutes following administration of an IV antihypertensive medication.
To assess for comorbid conditions, including a preexisting diagnosis of HTN, we collected International Classification of Diseases (ICD)-9/10 diagnosis codes. Further, we also extracted All Patient Refined Diagnosis-Related Group (APR-DRG) weights, which are a standardized measure of illness severity based on relative resource consumption during hospitalization.16,17
Patients were categorized as having either “symptomatic” or “asymptomatic” elevated BP. We defined symptomatic elevated BP as having received treatment with an IV medication with provider concern for end-organ injury, as defined above. We further identified all patients in which tight BP control may be clinically indicated on the basis of the presence of any of the following ICD-9/10 diagnosis codes at the time of hospital discharge: myocardial infarction, ischemic stroke, intracranial hemorrhage, subarachnoid hemorrhage, subdural hematoma, aortic dissection, hypertensive emergency, or hypertensive encephalopathy. All patients with symptomatic elevated BP or any of the above ICD-9/10 diagnoses were excluded from the analysis, since administration of IV antihypertensive medications would plausibly be warranted in these clinical scenarios.
The encounter numbers from the dataset were used to link to patient demographic data, which included age, sex, race, ethnicity, primary language, and insurance status. Finally, we identified all instances of rapid response calls, ICU transfers, and code blues (cardiopulmonary arrests) for each patient in the dataset.
Blood Pressure Measurements
BP data were collected from invasive BP (IBP) monitoring devices and noninvasive BP cuffs. For patients with BP measurements recorded concomitantly from both IBP (ie, arterial lines) in addition to noninvasive BP cuffs, the arterial line reading was favored. All systolic BP (SBP) readings >240 mm Hg from arterial lines were excluded, as this has previously been described as the upper physiologic limit for IBP readings.18
Primary Outcome
The primary outcome for the study was the proportion of patients treated with IV antihypertensive medications (labetalol or hydralazine). Using aggregate data, we calculated the number of patients who were treated at least once with an IV antihypertensive in a given month (numerator), divided by the number of patients with ≥1 episode of asymptomatic elevated BP that month (denominator). The denominator was considered to be the population of patients “at risk” of being treated with IV antihypertensive medications. For patients with multiple admissions during the study period, each admission was considered separately. These results are displayed in the upper portion of the run chart (Figure).
Secondary Outcomes
To investigate blood pressure trends over time, we analyzed BP in three ways. First, we analyzed the median SBP for the entire population. Second, to determine clinical responses to IV antihypertensive medications among patients receiving treatment, we calculated the population medians for the pretreatment SBP, the change in SBP from pretreatment baseline, and the posttreatment SBP. Third, we calculated the average median SBP on a monthly basis for the duration of the study. This was achieved by calculating the median value of all SBPs for an individual patient, then averaging across all patients in a given month. The average monthly median SBPs are displayed in the lower portion of the Figure.
To investigate whether the intervention was associated with negative patient outcomes, the proportions of several balancing outcomes were compared between pre- and postintervention periods, including ICU transfers, rapid response calls, and code blues (cardiopulmonary arrests).
Development and Implementation of an Intervention to Reduce Excessive IV Antihypertensive Use
After establishing the baseline prevalence of IV antihypertensive medication use at our institution, we developed a QI initiative with the goal of reducing IV antihypertensive medication utilization by the general medicine service for the treatment of asymptomatic patients. We hypothesized that potential contributors to overutilization might include lack of education, provider/nursing discomfort, and a system designed to mandate provider notification for even modestly elevated BPs. The QI initiative, which took place between October 2017 and December 2017, was designed to address these potential contributors and was comprised of a division-wide, two-tiered, bundled intervention. Our choice of a two-tiered approach was based on the fact that successful culture change is challenging, along with the existing evidence that multifaceted QI interventions are more often successful than single-tiered approaches.19
The first tier of the initiative included an educational campaign referred to colloquially as “NoIVForHighBP,” which targeted residents, hospitalists, and nursing staff. The campaign consisted of a series of presentations, best practice updates, handouts, and posters displayed prominently in shared workspaces. The educational content focused on alternative approaches to the management of asymptomatic elevated BP in the hospital, such as identification and treatment of pain, anxiety, volume overload, or other contributing factors (see supplemental materials). These educational outreaches occurred periodically between October 4, 2017 and November 20, 2017, with the bulk of the educational efforts taking place during November. Therefore, November 1, 2017 was designated the start date for the intervention period.
The second tier of the intervention included the liberalization of the EHR BP notification parameters on the standard inpatient admission order set from >160/90 mm Hg to >180/90 mm Hg. This change took effect on 12/6/2017. The decision to modify the BP notification parameters was based on the hypothesis that mandatory notifications for modestly elevated BPs may prompt providers to reflexively order IV antihypertensive medications, especially during times of cross-coverage or high clinical workload.
Statistical Analysis
All statistical analyses were performed using Stata software version 15 (StataCorp. 2017. Stata Statistical Software: Release 15. College Station, Texas: StataCorp LLC). Baseline patient characteristics were compared using nonparametric tests of significance. Population median SBPs were compared between pre- and postintervention periods using Mood’s Median Test, which was selected because the data were distributed nonnormally, and variances between samples were unequal.
Among patients treated with IV antihypertensive medications, we compared the proportion of pretreatment SBPs falling into each of three specified ranges (SBP <180 mm Hg, SBP 180-199 mm Hg, and SBP >200 mm Hg) between baseline and intervention periods using chi-squared tests.
Using aggregate data, we compared the unadjusted proportion of patients treated with IV antihypertensive medications between pre- and postintervention periods using a chi-squared test. Next, using patient-level data, a logistic regression analysis was performed to examine the association between receipt of IV antihypertensive medications and time (dichotomized between pre- and postintervention periods) while adjusting for age, sex, race, ethnicity, primary language, insurance status, preexisting HTN, length of stay, and APR-DRG weight.
Rates of balancing outcomes were compared using chi-squared tests. A logistic regression analysis using patient-level data was also performed to investigate the association between each of these outcomes and the intervention period (pre vs post) while adjusting for age, sex, race, ethnicity, primary language, insurance status, preexisting HTN, length of stay, and APR-DRG weight.
RESULTS
Baseline Period
We identified 2,306 patients with ≥1 episode of asymptomatic elevated BP during the 10-month preintervention period. Patients on average experienced 9 episodes of elevated BP per hospitalization, representing 21,207 potential opportunities for treatment. Baseline characteristics are summarized in Table 1. In general, this represents an older population that was medically complex and multiracial.
Of these patients, 251 (11%) received IV hydralazine and/or labetalol at least once during their hospitalization, with a total of 597 doses administered. Among those treated, a median of 2 doses were given per patient (IQR: 1-4), 64% of which were hydralazine. The majority (380 [64%]) were ordered on an “as needed” basis, while 217 (36%) were administered as a one-time dose. Three-quarters of all doses were ordered by the teaching service (456 [76%]), with the remaining 24% ordered by the direct-care (hospitalist) service.
During the baseline period among patients receiving IV antihypertensive medications, the median SBP of the population prior to treatment was 187 mm Hg (IQR 177-199; Table 2). Treatment was initiated in 30% of patients for an SBP <180 mm Hg and in 75% for an SBP <200 mm Hg. The median time to follow-up BP check was 34 minutes (IQR 15-58). The median decrement in SBP was 20 mm Hg (IQR 5-37); however, the response to treatment was highly variable, with 2% of patients experiencing no change and 14% experiencing an increase in SBP. Seventy-nine patients (14%) had a decrement in SBP >25% following treatment.
Description of Quality Improvement Results
Following the QI initiative, a total of 934 patients experienced 9,743 episodes of asymptomatic elevated blood pressure over a 4-month period (November 1, 2017 to February 28, 2018). As shown in Table 1, patients in the postintervention period had a slightly higher median age (67 [IQR 55-80] vs 69 [IQR 57-83]; P = .01), a higher median APR-DRG weight (1.34 [IQR 0.99-1.77] vs 1.48 [1.00-1.82]; P < .001), and a longer median length of stay (4.6 [2.8-8.0] days vs 5.1 [2.9-9.2] days; P = .004). There was also a higher proportion of nonEnglish speakers, fewer Black patients, and a lower proportion of preexisting HTN, in the postintervention period.
Of the 934 patients with ≥1 episode of asymptomatic elevated BP, 70 (7%) were treated with IV antihypertensive medications, with a total of 196 doses administered. The proportion of patients treated per month during the postintervention period ranged from 6% to 8%, which was the lowest of the entire study period and below the baseline average of 10% (Figure).
In a patient-level logistic regression pre-post analysis adjusting for age, sex, race, ethnicity, primary language, insurance status, preexisting HTN, length of stay, and APR-DRG weight, patients admitted to the general medicine service during the postintervention period had 38% lower odds of receiving IV antihypertensive medications than those admitted during the baseline period (OR = 0.62; 95% CI 0.47-0.83; P = .001). In this adjusted model, the following factors were independently associated with increased odds of receiving treatment: APR-DRG weight (OR 1.13; 95% CI 1.07-1.20; P < .001), Black race (OR 1.81; 95% CI 1.29-2.53; P = .001), length of stay (OR 1.02; 95% CI 1.01-1.03; P < .001), and preexisting HTN (OR 4.25; 95% CI 2.75-6.56; P < .001). Older age was associated with lower odds of treatment (Table 2).
Among patients who received treatment, there were no differences between pre- and postintervention periods in the proportion of pretreatment SBP <180 mm Hg (29% vs 32%; P = .40), 180-199 mm Hg (47% vs 40%; P = .10), or >200 mm Hg (25% vs 28%; P = .31; Table 3).
Population-level median SBP was similar between pre- and postintervention periods (167 mm Hg vs 168 mm Hg, P = .78), as were unadjusted rates of rapid response calls, ICU transfers, and code blues (Table 3). After adjustment for baseline characteristics and illness severity at the patient level, the odds of rapid response calls (OR 0.84; 95% CI 0.65-1.10; P = .21) and ICU transfers (OR 1.01; 95% CI 0.75-1.38; P = .93) did not differ between pre- and postintervention periods. A regression model was not fit for cardiopulmonary arrests due to the low absolute number of events.
CONCLUSIONS
Our results suggest that treatment of asymptomatic elevated BP using IV antihypertensive medications is common practice at our institution. We found that treatment is often initiated for only modestly elevated BPs and that the clinical response to these medications is highly variable. In the baseline period, one in seven patients experienced a decrement in BP >25% following treatment, which could potentially cause harm.11 There is no evidence, neither are there any consensus guidelines, to support the rapid reduction of BP among asymptomatic patients, making this a potential valuable opportunity for reducing unnecessary treatment, minimizing waste, and avoiding harm.
While there are a few previously published studies with similar results, we add to the existing literature by studying a larger population of more than 3,000 total patients, which was uniquely multiracial, including a high proportion of non-English speakers. Furthermore, our cohort included patients in the ICU, which is reflected in the higher-than-average APR-DRG weights. Despite being critically ill, these patients arguably still do not warrant aggressive treatment of elevated BP when asymptomatic. By excluding symptomatic BP elevations using surrogate markers for end-organ damage in addition to discharge diagnosis codes indicative of conditions in which tight BP control may be warranted, we were able to study a more critically ill patient population. We were also able to describe which baseline patient characteristics convey higher adjusted odds of receiving treatment, such as preexisting HTN, younger age, illness severity, and black race.
Perhaps most significantly, our study is the first to demonstrate an effective QI intervention aimed at reducing unnecessary utilization of IV antihypertensives. We found that this can feasibly be accomplished through a combination of educational efforts and systems changes, which could easily be replicated at other institutions. While the absolute reduction in the number of patients receiving treatment was modest, if these findings were to be widely accepted and resulted in a wide-spread change in culture, there would be a potential for greater impact.
Despite the reduction in the proportion of patients receiving IV antihypertensive medications, we found no change in the median SBP compared with the baseline period, which seems to support that the intervention was well tolerated. We also found no difference in the number of ICU transfers, rapid response calls, and cardiopulmonary arrests between groups. While these findings are both reassuring, it is impossible to draw definitive conclusions about safety given the small absolute number of patients having received treatment in each group. Fortunately, current guidelines and literature support the safety of such an intervention, as there is no existing evidence to suggest that failing to rapidly lower BP among asymptomatic patients is potentially harmful.11
There are several limitations to our study. First, by utilizing a large electronic dataset, the quality of our analyses was reliant on the accuracy of the recorded EHR data. Second, in the absence of a controlled trial or control group, we cannot say definitively that our QI initiative was the direct cause of the improved rates of IV antihypertensive utilization, though the effect did persist after adjusting for baseline characteristics in patient-level models. Third, our follow-up period was relatively short, with fewer than half as many patients as in the preintervention period. This is an important limitation, since the impact of QI interventions often diminishes over time. We plan to continually monitor IV antihypertensive use, feed those data back to our group, and revitalize educational efforts should rates begin to rise. Fourth, we were unable to directly measure which patients had true end-organ injury and instead used orders placed around the time of medication administration as a surrogate marker. While this is an imperfect measure, we feel that in cases where a provider was concerned enough to even test for end-organ injury, the use of IV antihypertensives was likely justified and was therefore appropriately excluded from the analysis. Lastly, we were limited in our ability to describe associations with true clinical outcomes, such as stroke or myocardial infarction, which could theoretically be propagated by either the use or the avoidance of IV antihypertensive medications. Fortunately, based on clinical guidelines and existing evidence, there is no reason to believe that reducing IV antihypertensive use would result in increased rates of these outcomes.
Our study reaffirms the fact that overutilization of IV antihypertensive medications among asymptomatic hospitalized patients is pervasive across hospital systems. This represents a potential target for a concerted change in culture, which we have demonstrated can be feasibly accomplished through education and systems changes.
Disclosures
Dr. Auerbach has current or pending grants from the CDC, PCORI, and FDA that are unrelated to this research manuscript. He also receives royalties from UpToDate, and received an honorarium for being editor of JHM. Dr. Jacobs received a $1,000 Resident/Fellow Travel Grant from the Society of Hospital Medicine to support the cost of travel to SHM, where he presented this research as a poster in 2018. Dr. Prasad receives money from EpiExcellence, LLC for consultation, which is unrelated to this research manuscript. All other authors have nothing to disclose.
1. Axon RN, Cousineau L, Egan BM. Prevalence and management of hypertension in the inpatient setting: A systematic review. J Hosp Med. 2011;6(7):417-422. doi: 10.1002/jhm.804. PubMed
2. Herzog E, Frankenberger O, Aziz E, et al. A novel pathway for the management of ypertension for hospitalized patients. Crit Pathw Cardiol. 2007;6(4):150-160. doi: 10.1097/HPC.0b013e318160c3a7. PubMed
3. James PA, Oparil S, Carter BL, et al. 2014 evidence-based guideline for the management of high blood pressure in adults: report from the panel members appointed to the eighth Joint National Committee (JNC 8). JAMA. 2014;311(5):507-520. doi: 10.1001/jama.2013.284427. PubMed
4. Weder AB. Treating acute hypertension in the hospital: A lacuna in the guidelines [editorial]. Hypertension. 2011;57(1):18-20. PubMed
5. Axon RN, Turner M, Buckley R. An update on inpatient hypertension management. Curr Cardiol Rep. 2015;17(11):94. doi: 10.1007/s11886-015-0648-y. PubMed
6. Marik PE, Rivera R. Hypertensive emergencies: an update. Curr Opin Crit Care. 2011;17(6):569-580. doi:10.1097/MCC.0b013e32834cd31d. PubMed
7. Cherney D, Straus S. Management of patients with hypertensive urgencies and emergencies: a systematic review of the literature. J Gen Intern Med. 2002;17(12):937-945. doi: 10.1046/j.1525-1497.2002.20389.x. PubMed
8. Padilla Ramos A, Varon J. Current and newer agents for hypertensive emergencies. Curr Hypertens Rep. 2014;16(7):450. doi: 10.1007/s11906-014-0450-z. PubMed
9. Whitworth JA, World Health Organization, International Society of Hypertension Writing Group. 2003 World Health Organization (WHO)/International Society of Hypertension (ISH) statement on management of hypertension. J Hypertens. 2003;21(11):1983-1992. doi: 10.1097/01.hjh.0000084751.37215.d2. PubMed
10. Campbell P, Baker WL, Bendel SD, White WB. Intravenous hydralazine for blood pressure management in the hospitalized patient: its use is often unjustified. J Am Soc Hypertens. 2011;5(6):473-477. doi: 10.1016/j.jash.2011.07.002. PubMed
11. Chobanian AV, Bakris GL, Black HR, et al. The Seventh Report of the Joint National Committee on Prevention, Detection, Evaluation, and Treatment of High Blood Pressure: the JNC 7 report. JAMA. 2003;289(19):2560-2572. doi: 10.1001/jama.289.19.2560. PubMed
12. Gauer R. Severe asymptomatic hypertension: Evaluation and treatment. Am Fam Physician. 2017;95(8):492-500. PubMed
13. Lipari M, Moser LR, Petrovitch EA, Farber M, Flack JM. As-needed intravenous antihypertensive therapy and blood pressure control: Antihypertensive Therapy and BP Control. J Hosp Med. 2016;11(3):193-198. doi: 10.1002/jhm.2510. PubMed
14. Gaynor MF, Wright GC, Vondracek S. Retrospective review of the use of as-needed hydralazine and labetalol for the treatment of acute hypertension in hospitalized medicine patients. Ther Adv Cardiovasc Dis. 2017;12(1):7-15. doi: 10.1177/1753944717746613. PubMed
15. Weder AB, Erickson S. Treatment of hypertension in the inpatient setting: Use of intravenous labetalol and hydralazine. J Clin Hypertens. 2010;12(1):29-33. doi: 10.1111/j.1751-7176.2009.00196.x. PubMed
16. Averill RF, Goldfield N, Hughes, JS, et al. All Patient Refined Diagnosis Related Groups (APR-DRGs) Version 20.0: Methodology Overview. Clinical Research and Documentation Departments of 3M Health Information Systems, Wallingford, Connecticut and Murray, Utah, 2003. https://www.hcup-us.ahrq.gov/. Accessed February 19, 2018.
17. Iezzoni LI, Ash AS, Shwartz M, Daley J, Hughes JS, Mackiernan YD. Predicting who dies depends on how severity is measured: Implications for evaluating patient outcomes. Ann Intern Med. 1995;123(10):763-770. PubMed
18. Romagnoli S, Ricci Z, Quattrone D, et al. Accuracy of invasive arterial pressure monitoring in cardiovascular patients: an observational study. Crit Care. 2014;18(6):644. doi: 10.1186/s13054-014-0644-4. PubMed
19. Shojania K, Grimshaw JM. Evidence-based quality improvement: The state of the science. Health Aff (Millwood). 2005;24(1):138-150. doi: 10.1377/hlthaff.24.1.138. PubMed
© 2019 Society of Hospital Medicine
Frontal Fibrosing Alopecia Demographics: A Survey of 29 Patients
Frontal fibrosing alopecia (FFA) is a form of lymphocytic cicatricial alopecia that presents as frontotemporal hairline recession, typically in postmenopausal women.1 The condition is considered to be a variant of lichen planopilaris (LPP) due to its similar histologic appearance.2 Loss of eyebrow1-11 and body5-11 hair also is commonly present in FFA, and histologic findings are identical to those for hair loss on the scalp,8,9 suggesting that FFA may be a form of generalized alopecia.
The pathogenesis of FFA is unknown, but several etiologies have been postulated. Some suggest that as a variant of LPP, FFA is a hair-specific autoimmune disorder characterized by a T cell–mediated immune reaction against epithelial hair follicle stem cells, leading to fibrosis and depletion of hair regeneration potential.12 In support of this theory, FFA has been associated with other autoimmune diseases including hypothyroidism,6,8,13-16 mucocutaneous lichen planus,8,15,17 vitiligo,15,18 Sjögren syndrome,19 and lichen sclerosus et atrophicus.15,20 Another hypothesis suggests that the proandrogenic state in postmenopausal women may be related to the disease process.1 This hypothesis is supported by the reported success of antiandrogen therapy with 5α-reductase inhibitors (5α-RIs) in stabilizing FFA.3-5,7 Finally, genetic16,21 and environmental factors related to smoking and socioeconomic status5 also have been postulated to be risk factors for FFA. A variety of treatments have shown varying success, including topical and intralesional corticosteroids, hydroxychloroquine, immunomodulators, antibiotics, and 5α-RIs.1,3-6,8,15,17,22 However, FFA is considered to be relatively difficult to treat and commonly progresses regardless of treatment before spontaneously stabilizing.2-4,6,8,10
Since its discovery in 1994,1 FFA has become increasingly prevalent, comprising 17% of new referrals for hair loss in one study (N=57).6 Although growing recognition of the condition likely plays a role in its increasing presentation, other unidentified factors may contribute to its expanding incidence. In this report, we describe the demographics, clinical features, and disease progression of 29 cases of FFA treated within our division using a series of surveys and chart reviews.
Methods
Upon receiving approval for the project from the institutional review board, we identified 29 patients who met the criteria for diagnosis of FFA through a chart review of all patients being treated for hair loss by clinics within the Washington University Division of Dermatology (St. Louis, Missouri). Diagnostic criteria for FFA included scarring alopecia in the frontotemporal distribution with associated perifollicular erythema or papules and, if performed, a scalp biopsy of the involved area of alopecia showing lymphocytic cicatricial alopecia, compatible with LPP. The diagnosis was confirmed by biopsy in 18 patients (62%), while the remainder of the diagnoses were made clinically. Most biopsy specimens were diagnosed by board-certified dermatopathologists at Washington University, with the remainder diagnosed by outside pathologists if the patient was initially diagnosed at another institution.
Patients meeting criteria for FFA were mailed a study consent form, as well as a 2-page survey to assess demographics, clinical features of hair loss, medical histories, social and family histories, and treatments utilized. After receiving consent from patients, survey results were collected and summarized. If there was any need for clarification of answers, follow-up questions were conducted via email prior to any data analysis that was performed.
For analysis of treatment response, patients were asked what treatments they had utilized and about the progression of their hair loss. Patients reporting stabilization of hair loss or hair regrowth were classified as treatment responsive. Patients who underwent multiple treatments were included in the analyses for each of those treatments. Physician records for treatment response were not correlated with patient responses due to inconsistent documentation, care received outside of our medical system, and prolonged or loss to follow-up. Physician-reported data were only used to identify qualifying patients and their biopsy results, as described above.
Results
Patient Demographic
Between October 2013 and May 2014, 29 patients with FFA were recruited into the study. Patients were diagnosed between January 2006 and December 2013. There were 28 female patients (97%) and 1 male patient (3%). The average age of disease onset was 55.4 years (range, 29–75 years). Twenty-five patients (86%) self-identified as non-Hispanic white, 3 patients (10%) as Asian, and 1 patient (3%) as black. Patients also appeared to be a more affluent group than the general St. Louis County population, with a median household income between $75,000 and $100,000. In comparison, the median household income reported in St. Louis County from 2008 to 2012 was $58,485.23 The patient population was primarily composed of nonsmokers, with 22 (76%) patients who had never smoked, 6 (21%) who were present smokers, and 1 (3%) smoked in the past. These results were comparable to the reported number of female smokers in Missouri.24
Clinicopathologic Features
The clinical features of FFA are described in Table 1. All patients had frontotemporal recession of the hairline with some degree of scarring and perifollicular erythema (Figure 1). Most patients also reported hair loss at other sites, including 25 patients (86%) with eyebrow hair loss, 18 (62%) with limb hair loss, 11 (38%) with axillary hair loss, 11 (38%) with pubic hair loss, and 1 (3%) with eyelash hair loss. Patients also frequently reported inflammatory symptoms, including 19 patients (66%) with itching, 18 (62%) with redness, 3 (10%) with pain, 2 (7%) with papular lesions, and 1 (3%) with sores and erosions on the skin. Regarding progression of hair loss over time, 16 patients (55%) reported stabilization of hair loss, 11 (38%) reported progressive hair loss, and 2 (7%) reported some hair regrowth. Thirteen patients (45%) identified some inciting event that they believed to have triggered the disease. Ten patients (35%) identified stress as the inciting event, and 5 patients (17%) specifically referred to health-related stressors, including hip-replacement surgery, new diagnoses of systemic diseases, starting new medications, and stopping hormone replacement therapy. Furthermore, 2 (7%) patients reported exposure to chemicals and pesticides as suspected triggers.

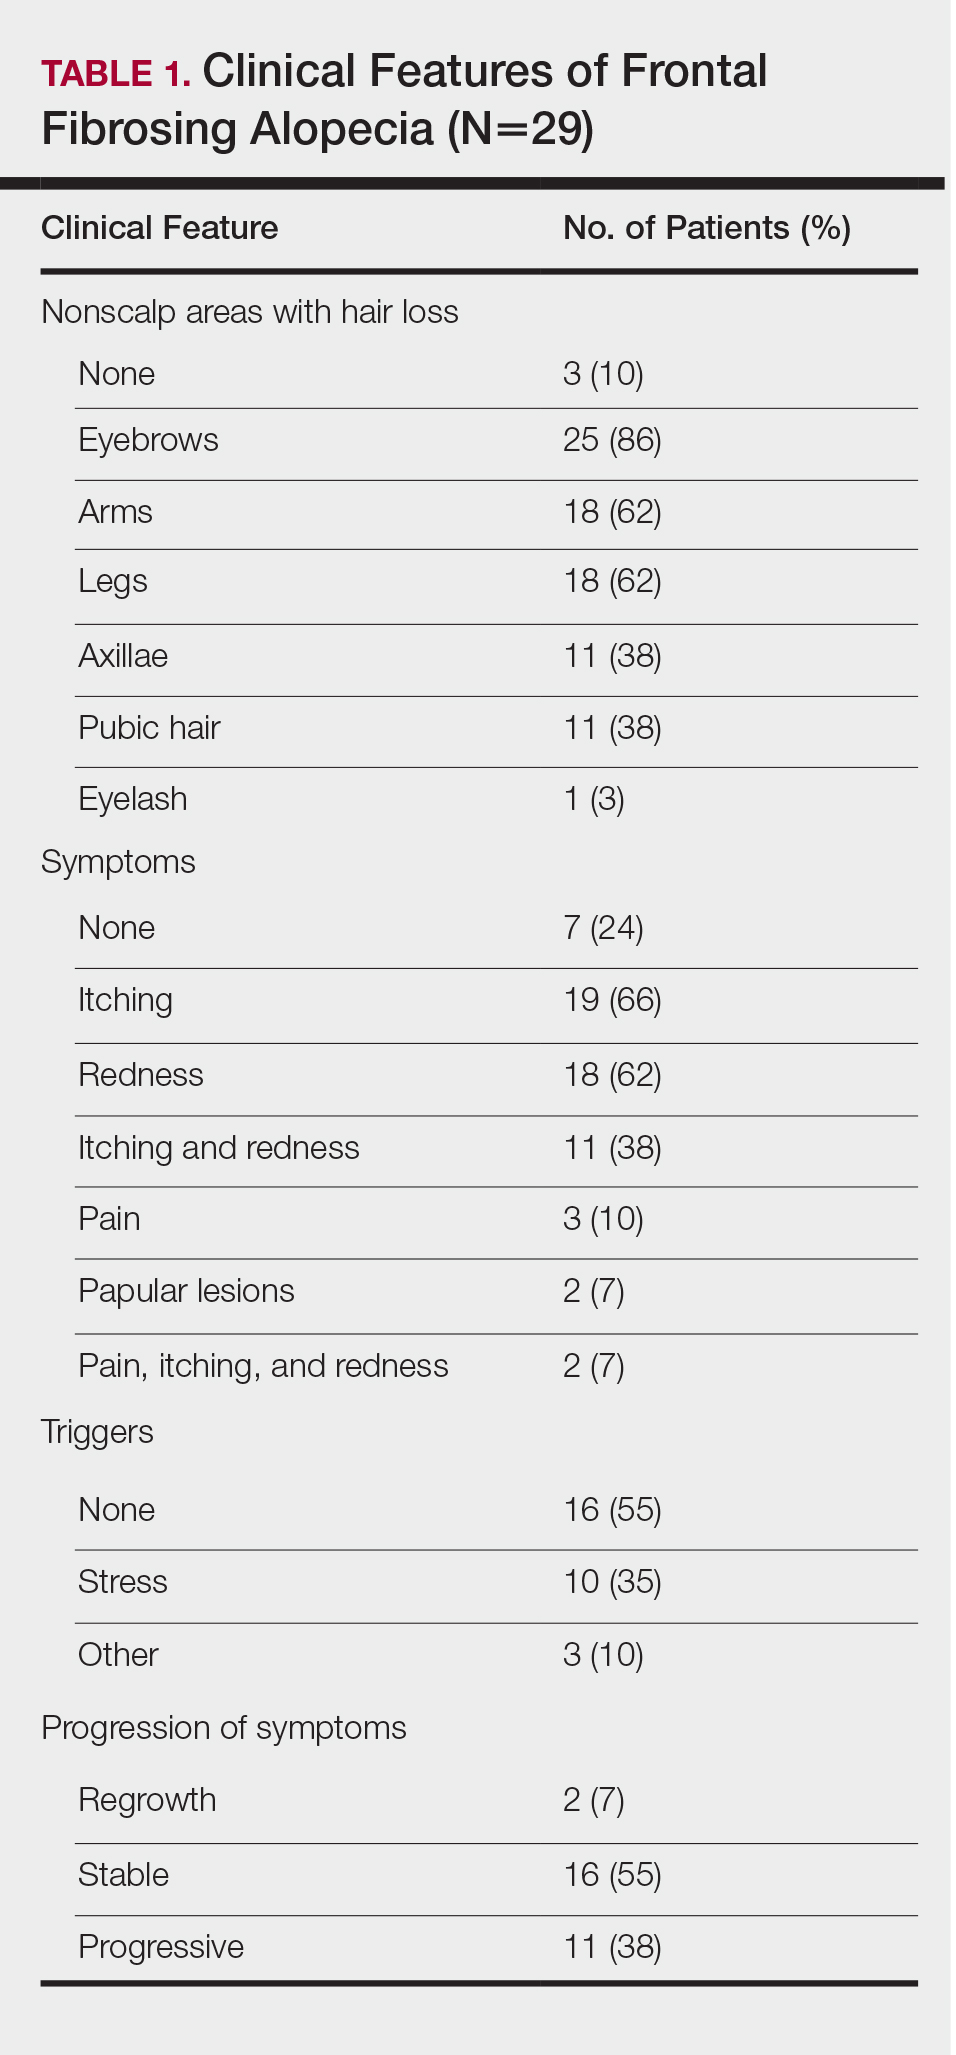
Typical biopsy results showed a perifollicular lymphocytic infiltrate and fibrosis surrounding the infundibulum and isthmus of hair follicles (Figure 2). There were associated vacuolar changes in the basal layer and scattered dyskeratosis throughout the follicular epithelium. As the disease progressed to end-stage scarring, there was marked reduction in the number of hair follicles, which were replaced by fibrous tracts, and a disappearance of the previous inflammatory infiltrate.
Medical History
Of the 26 female patients who provided data about menopause status at time of disease onset, 16 (62%) were postmenopausal, 5 (19%) were menopausal, and 5 (19%) were premenopausal. Of the 28 female patients in the study, 8 (29%) had a history of hysterectomy and 2 (7%) also had surgically induced menopause through bilateral surgical oophorectomy. Twenty-four patients (86%) had a childbearing history, with an average of 2.3 children. Twelve patients (43%) reported use of hormone replacement therapy after menopause. Twelve patients (43%) also reported a history of oral contraceptive use.
Table 2 describes the comorbidities of all 29 patients. A history of autoimmune disease was prominent, found in 16 patients (55%). Thirteen patients (45%) reported thyroid disease, including 10 patients (35%) with hypothyroidism. Additionally, 8 patients (28%) had a history of mucocutaneous lichen planus, 2 (7%) of psoriasis/psoriatic arthritis, 1 (3%) of vitiligo, 1 (3%) of systemic lupus erythematosus, 1 (3%) of iritis, 1 (3%) of Sjögren syndrome, and 1 (3%) of ulcerative colitis. Six patients (21%) also reported a history of breast cancer.
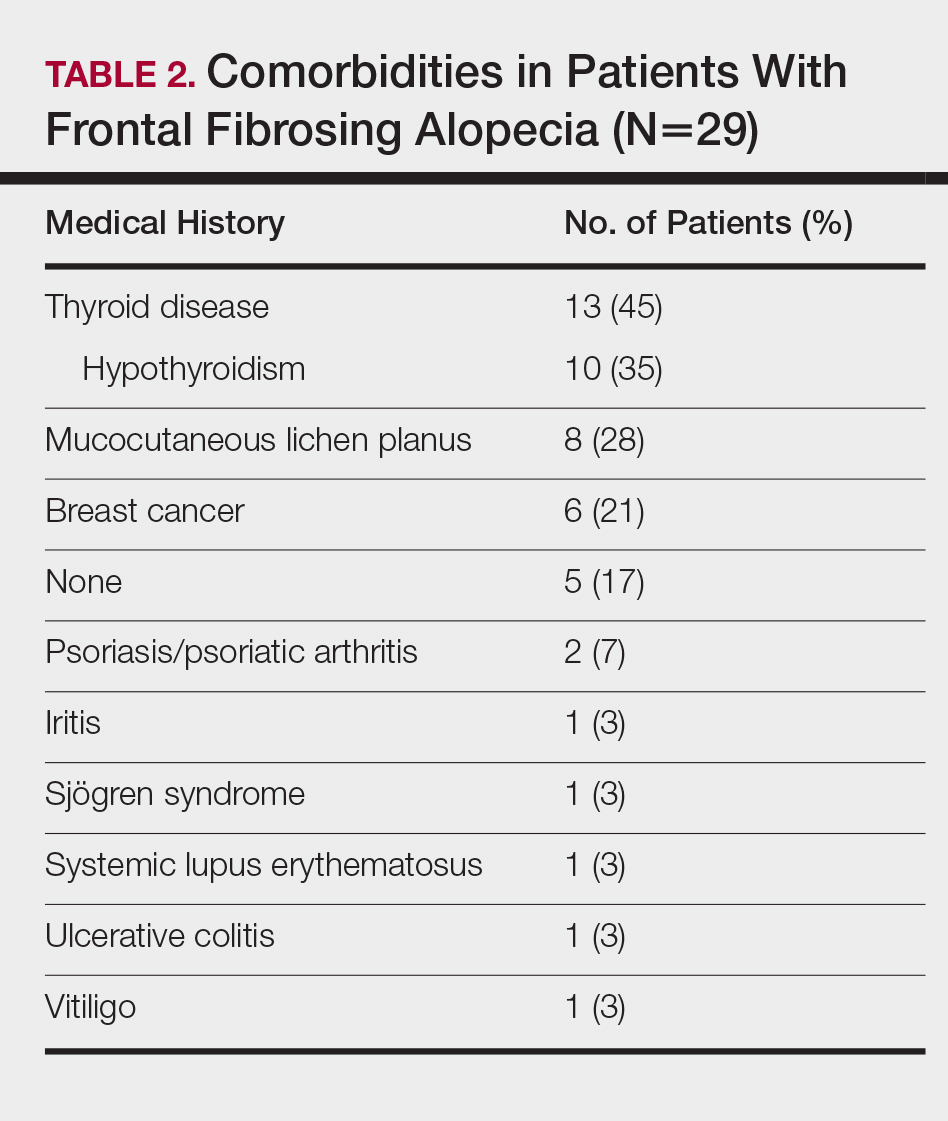
A dental history was obtained in 24 patients. All 24 patients reported having some dental implant or filling placed. Twenty-four patients (100%) had a history of metal amalgam implants, 8 (33%) had gold alloy implants, 4 (17%) had composite resin implants, and 3 (13%) had porcelain implants. Two patients had metal amalgam implants that had since been replaced by nonmetal implants. Both patients reported no change in their clinical conditions with removal of the metal implants. Six of 8 patients (75%) with mucocutaneous lichen planus reported having dental implants. Of them, all 6 patients (100%) reported having metal amalgam implants, and 3 patients (50%) additionally reported having gold alloy implants.
Treatments
On average, patients were treated with 3 different therapies for FFA (range, 0–14). The treatments utilized are listed in Table 3, and responses to treatments are summarized in Table 4. Topical steroids were the most popular treatment modality and were used by 21 patients (72%). Approximately half of those patients reported treatment response with stabilization of hair loss or regrowth (n=11; 52%). Hydroxychloroquine was the second most commonly used modality (16 patients [55%]), with 10 of those patients (63%) reporting treatment response. Intralesional steroids were used in 11 patients (38%), with a treatment response in 36% (4/11) of those patients. Topical pimecrolimus and tacrolimus were used by 6 patients (21%), with 5 of those patients (83%) reporting treatment response. UVB excimer laser therapy was used on 3 patients (10%) with 100% treatment response.
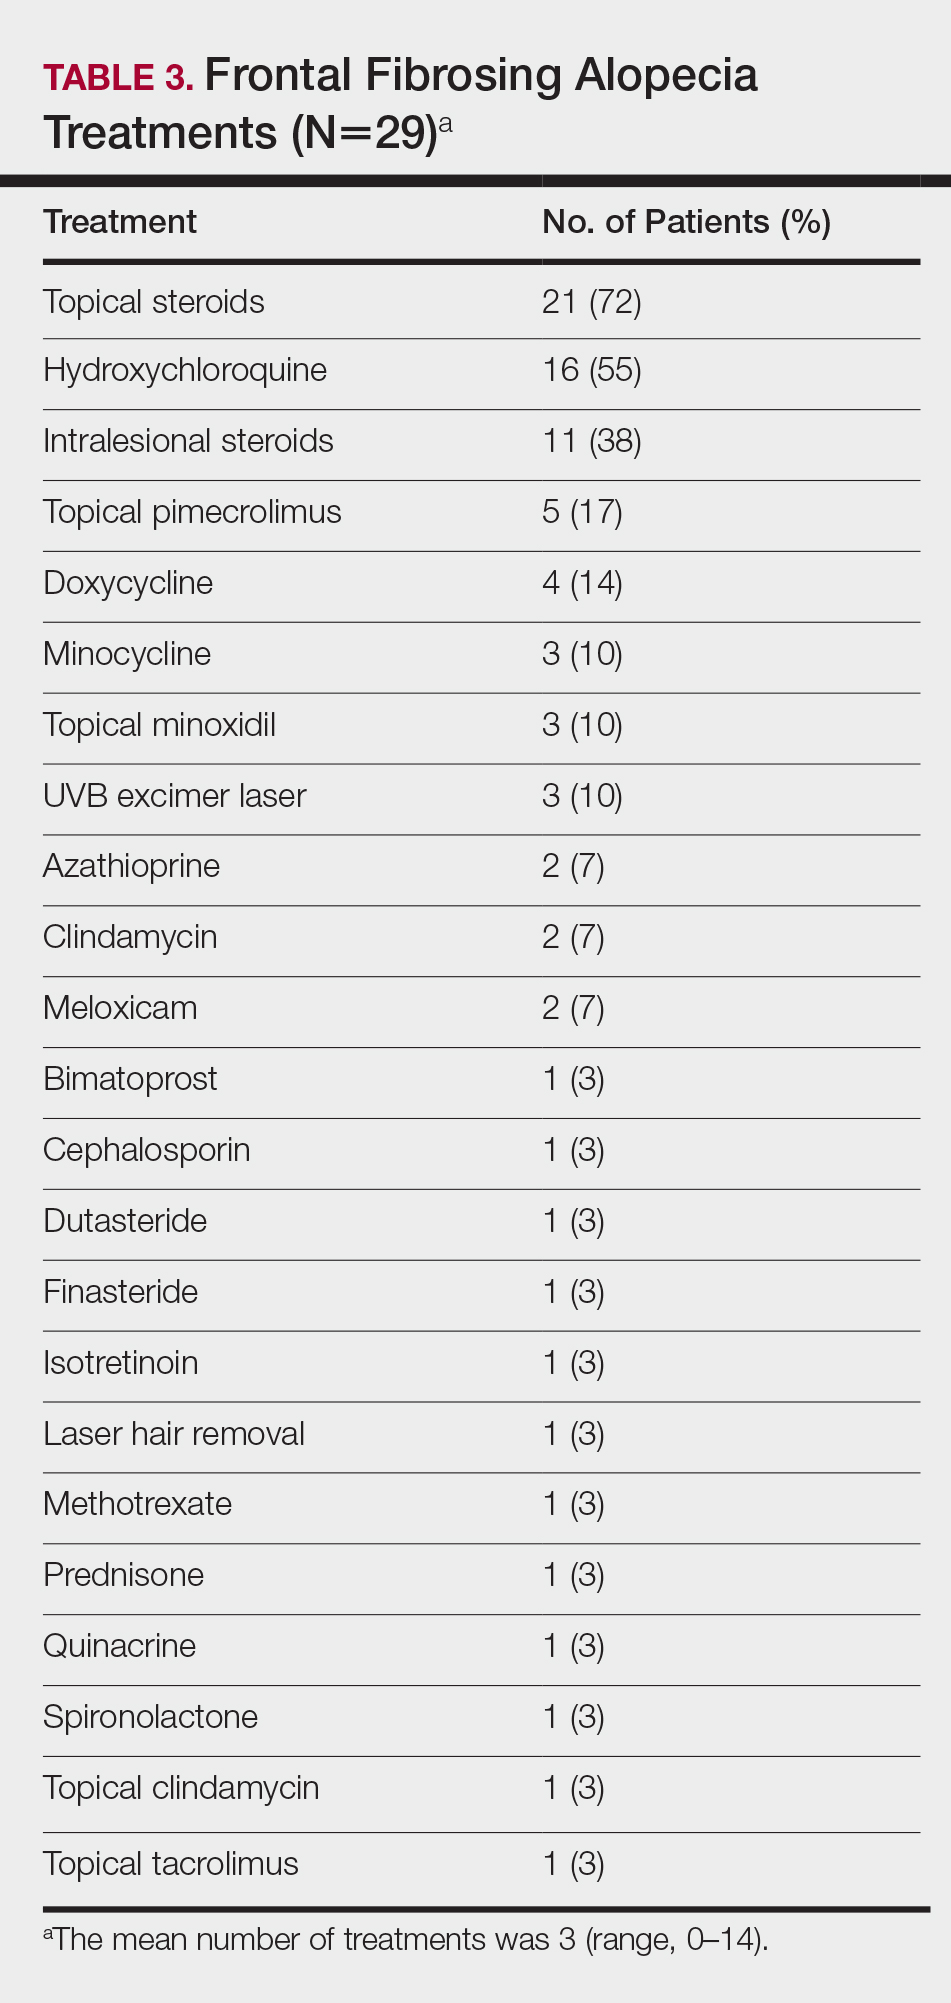
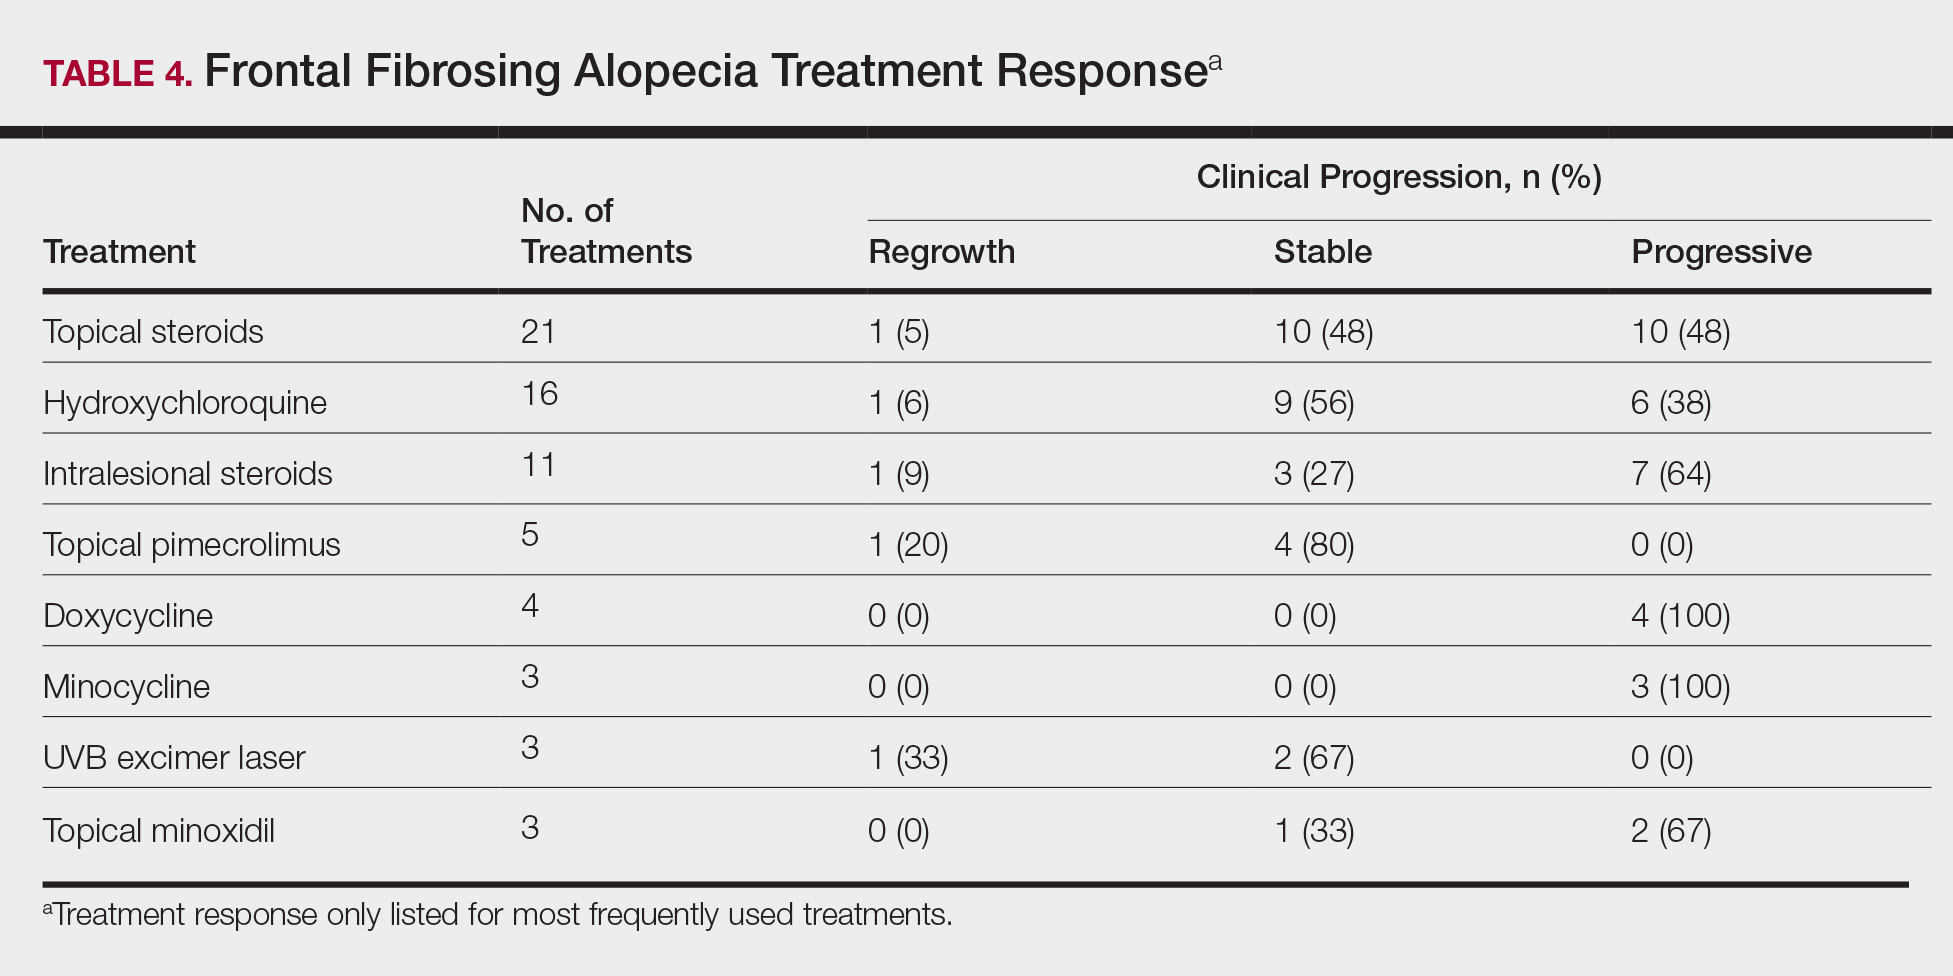
Treatments with little or no treatment response to hair loss include doxycycline, minocycline, and topical minoxidil. Seven patients (24%) were treated with doxycycline or minocycline, all of whom reported no clinical response. Topical minoxidil was used by 3 patients (10%), with only 1 patient (33%) reporting stabilization of hair loss but no regrowth of hair. 5α-reductase inhibitors such as finasteride and dutasteride were only used by 1 patient (3%), who reported no treatment response. Other treatments that were rarely used include meloxicam (n=2), azathioprine (n=2), oral clindamycin (n=2), bimatoprost (n=1), quinacrine (n=1), cephalosporin (n=1), prednisone (n=1), isotretinoin (n=1), methotrexate (n=1), spironolactone (n=1), topical clindamycin (n=1), and laser hair removal (n=1). Of these, only meloxicam and quinacrine were anecdotally associated with stabilization of hair loss, while the rest of the treatments were associated with progressive hair loss despite therapy.
Comment
Frontal fibrosing alopecia is a form of cicatricial alopecia considered to be a clinical subset of LPP. Although the pathogeneses of both diseases are poorly understood, LPP is the better-studied model and is generally considered to be an autoimmune disease specific to the hair follicle, involving a cell-mediated inflammatory response to epithelial hair follicle stem cells.12 In support of this hypothesis, FFA and LPP have been frequently associated with autoimmune diseases, particularly with hypothyroidism.6,13-15 We found that 55% of our patients had a history of autoimmune disease, including 35% with hypothyroidism, 28% with mucocutaneous lichen planus, 7% with psoriasis, 3% with vitiligo, 3% with systemic lupus erythematosus, 3% with iritis, 3% with Sjögren syndrome, and 3% with ulcerative colitis. The link between FFA and hypothyroidism has been the best studied, with a large study by Atanskova Mesinkovska et al14 finding that 34% of 166 patients with LPP and FFA have some kind of thyroid disease and 29% have hypothyroidism. Fron
Although FFA has been classically described to affect postmenopausal women, recent studies have consistently identified that premenopausal women4-6,8,16,17 and men14,16 also can be affected by the condition. In our patient cohort, there was 1 male patient (3%), and a substantial number of the female patients were premenopausal (19%) and menopausal (19%) at the time of disease onset. Most of the patients studied were white; Asian and black patients were a consistent minority across FFA studies,5,13-16,25 highlighting the importance of screening for FFA in all demographics.
In our study, FFA patients also appeared to be more affluent than the general population and were predominantly nonsmokers (76%). These statistics are consistent with the United Kingdom population studied by MacDonald et al,6 which demonstrated a higher socioeconomic status and higher incidence of nonsmoking in their cases of FFA. Another large retrospective study of FFA patients in Spain found that 87% of their FFA cases (N=355) were nonsmokers, though they did not note a difference from the general unaffected population.15 In our study, we replicated these trends, finding an above average affluence level and a high but not statistically significant incidence of nonsmokers. Although it is not clear how socioeconomic status or smoking factors into the pathology of FFA, these studies may show a general trend in the environmental demographics of the disease.
Clinically, patients with FFA typically present with hair loss of the scalp as well as other sites. The eyebrows are the most common site to be affected outside of the scalp, affecting 86% of our patients, whereas eyelashes are the least commonly affected, presenting in only 3% of our patients. Body hair loss also is common, with almost two-thirds of our cohort reporting hair loss on the limbs and more than one-third reporting loss of axillary and pubic hair. These findings are consistent with those of other studies.3-6,8,13,15 Eyelash loss, body hair loss, and facial papules have been found to be associated with more severe forms of FFA,15 though we did not investigate these forms in our study. Inflammatory symptoms are common, with pruritus affecting 66% of our patients and pain affecting 10% of patients, consistent with the published literature.3,13,15,17
Multiple studies have shown that female FFA patients have a higher incidence of hysterectomies in their medical history.5,8,15 This observation has been used to further support the hypothesis that a change in sex hormone balance may trigger the initial onset of disease.5,8,15 A considerable number of the female patients in our study had also undergone hysterectomies (29%). Only 2 patients (7%) underwent premature surgical menopause through bilateral removal of the ovaries, and neither of these patients had abnormally early onset of FFA (age at onset, 52 and 65 years). Many patients in our study also reported a history of pharmacologic manipulation of sex hormones with hormone replacement therapy (43%) and oral contraceptive use (43%). However, patients with FFA have not been identified to have abnormal hormone levels compared to unaffected postmenopausal women.1 Additionally, the disease does not exclusively affect androgen-dependent hair, as indicated by the high prevalence of eyebrow hair loss. We hypothesize that the link between increased prevalence of hysterectomy and FFA is not due to hormonal changes but rather from the stresses related to the hysterectomy or associated conditions that required the surgery. In our study, 35% of patients identified stress as the inciting event prior to their onset of hair loss, with 17% specifically referring to health-related stress such as surgery or new diagnoses as the cause. Although this pattern is purely observational, it is valuable to consider that stress could contribute to the initial onset of FFA as with alopecia areata.26
A dental history was obtained in 24 patients to explore the possibility of FFA as a manifestation of contact allergy secondary to exposure to metal dental implants. Contact allergies to metal amalgam and gold alloy dental implants/fillings frequently have been described as presenting as oral lichen planus in the literature.27-34 Given the histologic overlap between oral lichen planus and LPP/FFA, it is worth exploring the possibility that LPP and FFA are other manifestations of contact allergic response. In our study, 100% of the patients who provided a dental history had metal amalgam implants and 33% had gold alloy implants. It is an interesting observation, but it should be noted that none of the patients in our study had undergone patch testing for contact allergies to the metals in their dental implants, and further studies are required to explore this hypothesis.
Frontal fibrosing alopecia is a difficult condition to treat. In our study, patients tried an average of 3 different treatments, the most common being topical steroids (72%), hydroxychloroquine (55%), and intralesional steroids (38%).
A PubMed search of articles indexed for MEDLINE using the terms randomized control trial and frontal fibrosing alopecia yielded no randomized controlled trials that have been performed to demonstrate the most efficacious treatments of FFA. However, one systematic review of 114 patients found 5α-RIs, antimalarials, and intralesional corticosteroids to yield the best responses in treating FFA.22 Another large, multicenter, retrospective study of 355 patients also demonstrated that 5α-RIs and intralesional corticosteroids minimized hair loss most effectively across treatment modalities.15 One treatment that was not discussed in either study but was utilized in ours was the UVB excimer laser, which has been demonstrated to induce T-cell apoptosis and decrease inflammation in psoriasis but has been infrequently studied in the use of FFA or LPP. In one study of 13 patients with LPP, excimer laser treatment was successful in reducing inflammatory symptoms and improving hair loss.35 Our results reaffirm that laser therapy could be considered more frequently as a treatment of FFA.
This study is subject to several limitations. The study size was comprised of a relatively small number of patients with the condition. Additionally, only one-third of patients contacted agreed to participate in the study, and therefore the responses received may not be completely representative of all FFA patients. With a retrospective study, there is potential for recall bias in the data that are collected. Physician chart correlation to patient responses could not be reliably performed due to inconsistent documentation, care received outside our medical system, and prolonged or loss to follow-up. Another concern is that not all diagnoses of FFA in this study were biopsy confirmed. In one patient with systemic lupus erythematous who declined biopsy, it cannot be confirmed that her etiology of scarring alopecia was FFA rather than discoid lupus erythematous. Finally, because patients were treated with multiple medications, often concurrently, it was difficult to parse out which medications were efficacious and which were not. Despite these limitations, the findings in the study add to the growing literature about a rare but increasingly prevalent presentation.
Conclusion
Frontal fibrosing alopecia is a condition that predominantly affects white postmenopausal women but should not be overlooked in other demographics; higher socioeconomic status and nonsmoking are consistent with cases of FFA worldwide. Alopecia frequently involves other body hair, particularly the eyebrows, and is commonly associated with pruritus and pain. Many patients can identify an inciting event, usually stress, a health crisis, or new external exposures that they believe to have triggered the event. Consistent with data about LPP, FFA is frequently associated with autoimmune conditions, particularly hypothyroidism. A substantial portion of patients with FFA have had metal amalgam or gold alloy dental implants placed, though no patch testing was done to confirm that these patients have a contact allergy to these metals. Treatment for the condition is difficult, but topical and intralesional steroids, hydroxychloroquine, calcineurin inhibitors, and excimer laser therapy are efficacious in a large proportion of patients. Nevertheless, further research through prospective randomized trials is necessary to determine the best treatment modalities for FFA. Frontal fibrosing alopecia is a scarring form of hair loss that causes substantial emotional distress; therefore, it is critical to continue to investigate its etiology and treatments to improve patient care.
- Kossard S. Postmenopausal frontal fibrosing alopecia: scarring alopecia in a pattern distribution. Arch Dermatol. 1994;130:770-774.
- Kossard S, Lee MS, Wilkinson B. Postmenopausal frontal fibrosing alopecia: a frontal variant of lichen planopilaris. J Am Acad Dermatol. 1997;36:59-66.
- Tosti A, Piraccini BM, Iorizzo M, et al. Frontal fibrosing alopecia in postmenopausal women. J Am Acad Dermatol. 2005;52:55-60.
- Moreno-Ramírez D, Camacho Martínez F. Frontal fibrosing alopecia: a survey in 16 patients. J Eur Acad Dermatol Venereol. 2005;19:700-705.
- Ladizinski B, Bazakas A, Selim MA, et al. Frontal fibrosing alopecia: a retrospective review of 19 patients seen at Duke University. J Am Acad Dermatol. 2013;68:749-755.
- MacDonald A, Clark C, Holmes S. Frontal fibrosing alopecia: a review of 60 cases. J Am Acad Dermatol. 2012;67:955-961.
- Georgala S, Katoulis AC, Befon A, et al. Treatment of postmenopausal frontal fibrosing alopecia with oral dutasteride. J Am Acad Dermatol. 2009;61:157-158.
- Tan KT, Messenger AG. Frontal fibrosing alopecia: clinical presentations and prognosis. Br J Dermatol. 2009;160:75-79.
- Chew AL, Bashir SJ, Wain EM, et al. Expanding the spectrum of frontal fibrosing alopecia: a unifying concept. J Am Acad Dermatol. 2010;63:653-660.
- Miteva M, Camacho I, Romanelli P, et al. Acute hair loss on the limbs in frontal fibrosing alopecia: a clinicopathological study of two cases. Br J Dermatol. 2010;163:426-428.
- Abbas O, Chedraoui A, Ghosn S. Frontal fibrosing alopecia presenting with components of Piccardi-Lassueur-Graham-Little syndrome. J Am Acad Dermatol. 2007;57(2 suppl):S15-S18.
- Harries MJ, Meyer K, Chaudhry I, et al. Lichen planopilaris is characterized by immune privilege collapse of the hair follicle’s epithelial stem cell niche. J Pathol. 2013;231:236-247.
- Dlova NC, Jordaan HF, Skenjane A, et al. Frontal fibrosing alopecia: a clinical review of 20 black patients from South Africa. Br J Dermatol. 2013;169:939-941.
- Atanaskova Mesinkovska N, Brankov N, Piliang M, et al. Association of lichen planopilaris with thyroid disease: a retrospective case-control study. J Am Acad Dermatol. 2014;70:889-892.
- Vañó-Galván S, Molina-Ruiz AM, Serrano-Falcón C, et al. Frontal fibrosing alopecia: a multicenter review of 355 patients. J Am Acad Dermatol. 2014;70:670-678.
- Dlova N, Goh CL, Tosti A. Familial frontal fibrosing alopecia. Br J Dermatol. 2013;168:220-222.
- Samrao A, Chew AL, Price V. Frontal fibrosing alopecia: a clinical review of 36 patients. Br J Dermatol. 2010;163:1296-1300.
- Miteva M, Aber C, Torres F, et al. Frontal fibrosing alopecia occurring on scalp vitiligo: report of four cases. Br J Dermatol. 2011;165:445-447.
- Sato M, Saga K, Takahashi H. Postmenopausal frontal fibrosing alopecia in a Japanese woman with Sjögren’s syndrome. J Dermatol. 2008;35:729-731.
- Feldmann R, Harms M, Saurat JH. Postmenopausal frontal fibrosing alopecia. Hautarzt. 1996;47:533-536.
- Junqueira Ribeiro Pereira AF, Vincenzi C, Tosti A. Frontal fibrosing alopecia in two sisters. Br J Dermatol. 2010;162:1154-1155.
- Rácz E, Gho C, Moorman PW, et al. Treatment of frontal fibrosing alopecia and lichen planopilaris: a systematic review. J Eur Acad Dermatol Venereol. 2013;27:1461-1470.
- QuickFacts: St. Louis County, Missouri. United States Census Bureau website. https://www.census.gov/quickfacts/fact/table/stlouiscountymissouri/PST045217. Accessed February 6, 2019.
- State tobacco activities tracking and evaluation (STATE) system. State highlights. Centers for Disease Control and Prevention website. https://nccd.cdc.gov/STATESystem/rdPage.aspx?rdReport=OSH_STATE.Highlights. Accessed February 6, 2019.
- Miteva M, Whiting D, Harries M, et al. Frontal fibrosing alopecia in black patients. Br J Dermatol. 2012;167:208-210.
- Willemsen R, Vanderlinden J, Roseeuw D, et al. Increased history of childhood and lifetime traumatic events among adults with alopecia areata. J Am Acad Dermatol. 2009;60:388-393.
- Segura-Egea JJ, Bullón-Fernández P. Lichenoid reaction associated to amalgam restoration. Med Oral Patol Oral Cir Bucal. 2004;9:421-424.
- Laeijendecker R, van Joost T. Oral manifestations of gold allergy. J Am Acad Dermatol. 1994;30:205-209.
- Marcusson JA. Contact allergies to nickel sulfate, gold sodium thiosulfate and palladium chloride in patients claiming side-effects from dental alloy components. Contact Dermatitis. 1996;34:320-323.
- Nordlind K, Lidén S. Patch test reactions to metal salts in patients with oral mucosal lesions associated with amalgam restorations. Contact Dermatitis. 1992;27:157-160.
- Koch P, Bahmer FA. Oral lichenoid lesions, mercury hypersensitivity and combined hypersensitivity to mercury and other metals: histologically-proven reproduction of the reaction by patch testing with metal salts. Contact Dermatitis. 1995;33:323-328.
- Laine J, Kalimo K, Happonen RP. Contact allergy to dental restorative materials in patients with oral lichenoid lesions. Contact Dermatitis. 1997;36:141-146.
- Yiannias JA, el-Azhary RA, Hand JH, et al. Relevant contact sensitivities in patients with the diagnosis of oral lichen planus. J Am Acad Dermatol. 2000;42:177-182.
- Scalf LA, Fowler JF Jr, Morgan KW, et al. Dental metal allergy in patients with oral, cutaneous, and genital lichenoid reactions. Am J Contact Dermat. 2001;12:146-150.
- Navarini AA, Kolios AG, Prinz-Vavricka BM, et al. Low-dose excimer 308-nm laser for treatment of lichen planopilaris. Arch Dermatol. 2011;147:1325-1326.
Frontal fibrosing alopecia (FFA) is a form of lymphocytic cicatricial alopecia that presents as frontotemporal hairline recession, typically in postmenopausal women.1 The condition is considered to be a variant of lichen planopilaris (LPP) due to its similar histologic appearance.2 Loss of eyebrow1-11 and body5-11 hair also is commonly present in FFA, and histologic findings are identical to those for hair loss on the scalp,8,9 suggesting that FFA may be a form of generalized alopecia.
The pathogenesis of FFA is unknown, but several etiologies have been postulated. Some suggest that as a variant of LPP, FFA is a hair-specific autoimmune disorder characterized by a T cell–mediated immune reaction against epithelial hair follicle stem cells, leading to fibrosis and depletion of hair regeneration potential.12 In support of this theory, FFA has been associated with other autoimmune diseases including hypothyroidism,6,8,13-16 mucocutaneous lichen planus,8,15,17 vitiligo,15,18 Sjögren syndrome,19 and lichen sclerosus et atrophicus.15,20 Another hypothesis suggests that the proandrogenic state in postmenopausal women may be related to the disease process.1 This hypothesis is supported by the reported success of antiandrogen therapy with 5α-reductase inhibitors (5α-RIs) in stabilizing FFA.3-5,7 Finally, genetic16,21 and environmental factors related to smoking and socioeconomic status5 also have been postulated to be risk factors for FFA. A variety of treatments have shown varying success, including topical and intralesional corticosteroids, hydroxychloroquine, immunomodulators, antibiotics, and 5α-RIs.1,3-6,8,15,17,22 However, FFA is considered to be relatively difficult to treat and commonly progresses regardless of treatment before spontaneously stabilizing.2-4,6,8,10
Since its discovery in 1994,1 FFA has become increasingly prevalent, comprising 17% of new referrals for hair loss in one study (N=57).6 Although growing recognition of the condition likely plays a role in its increasing presentation, other unidentified factors may contribute to its expanding incidence. In this report, we describe the demographics, clinical features, and disease progression of 29 cases of FFA treated within our division using a series of surveys and chart reviews.
Methods
Upon receiving approval for the project from the institutional review board, we identified 29 patients who met the criteria for diagnosis of FFA through a chart review of all patients being treated for hair loss by clinics within the Washington University Division of Dermatology (St. Louis, Missouri). Diagnostic criteria for FFA included scarring alopecia in the frontotemporal distribution with associated perifollicular erythema or papules and, if performed, a scalp biopsy of the involved area of alopecia showing lymphocytic cicatricial alopecia, compatible with LPP. The diagnosis was confirmed by biopsy in 18 patients (62%), while the remainder of the diagnoses were made clinically. Most biopsy specimens were diagnosed by board-certified dermatopathologists at Washington University, with the remainder diagnosed by outside pathologists if the patient was initially diagnosed at another institution.
Patients meeting criteria for FFA were mailed a study consent form, as well as a 2-page survey to assess demographics, clinical features of hair loss, medical histories, social and family histories, and treatments utilized. After receiving consent from patients, survey results were collected and summarized. If there was any need for clarification of answers, follow-up questions were conducted via email prior to any data analysis that was performed.
For analysis of treatment response, patients were asked what treatments they had utilized and about the progression of their hair loss. Patients reporting stabilization of hair loss or hair regrowth were classified as treatment responsive. Patients who underwent multiple treatments were included in the analyses for each of those treatments. Physician records for treatment response were not correlated with patient responses due to inconsistent documentation, care received outside of our medical system, and prolonged or loss to follow-up. Physician-reported data were only used to identify qualifying patients and their biopsy results, as described above.
Results
Patient Demographic
Between October 2013 and May 2014, 29 patients with FFA were recruited into the study. Patients were diagnosed between January 2006 and December 2013. There were 28 female patients (97%) and 1 male patient (3%). The average age of disease onset was 55.4 years (range, 29–75 years). Twenty-five patients (86%) self-identified as non-Hispanic white, 3 patients (10%) as Asian, and 1 patient (3%) as black. Patients also appeared to be a more affluent group than the general St. Louis County population, with a median household income between $75,000 and $100,000. In comparison, the median household income reported in St. Louis County from 2008 to 2012 was $58,485.23 The patient population was primarily composed of nonsmokers, with 22 (76%) patients who had never smoked, 6 (21%) who were present smokers, and 1 (3%) smoked in the past. These results were comparable to the reported number of female smokers in Missouri.24
Clinicopathologic Features
The clinical features of FFA are described in Table 1. All patients had frontotemporal recession of the hairline with some degree of scarring and perifollicular erythema (Figure 1). Most patients also reported hair loss at other sites, including 25 patients (86%) with eyebrow hair loss, 18 (62%) with limb hair loss, 11 (38%) with axillary hair loss, 11 (38%) with pubic hair loss, and 1 (3%) with eyelash hair loss. Patients also frequently reported inflammatory symptoms, including 19 patients (66%) with itching, 18 (62%) with redness, 3 (10%) with pain, 2 (7%) with papular lesions, and 1 (3%) with sores and erosions on the skin. Regarding progression of hair loss over time, 16 patients (55%) reported stabilization of hair loss, 11 (38%) reported progressive hair loss, and 2 (7%) reported some hair regrowth. Thirteen patients (45%) identified some inciting event that they believed to have triggered the disease. Ten patients (35%) identified stress as the inciting event, and 5 patients (17%) specifically referred to health-related stressors, including hip-replacement surgery, new diagnoses of systemic diseases, starting new medications, and stopping hormone replacement therapy. Furthermore, 2 (7%) patients reported exposure to chemicals and pesticides as suspected triggers.
Typical biopsy results showed a perifollicular lymphocytic infiltrate and fibrosis surrounding the infundibulum and isthmus of hair follicles (Figure 2). There were associated vacuolar changes in the basal layer and scattered dyskeratosis throughout the follicular epithelium. As the disease progressed to end-stage scarring, there was marked reduction in the number of hair follicles, which were replaced by fibrous tracts, and a disappearance of the previous inflammatory infiltrate.
Medical History
Of the 26 female patients who provided data about menopause status at time of disease onset, 16 (62%) were postmenopausal, 5 (19%) were menopausal, and 5 (19%) were premenopausal. Of the 28 female patients in the study, 8 (29%) had a history of hysterectomy and 2 (7%) also had surgically induced menopause through bilateral surgical oophorectomy. Twenty-four patients (86%) had a childbearing history, with an average of 2.3 children. Twelve patients (43%) reported use of hormone replacement therapy after menopause. Twelve patients (43%) also reported a history of oral contraceptive use.
Table 2 describes the comorbidities of all 29 patients. A history of autoimmune disease was prominent, found in 16 patients (55%). Thirteen patients (45%) reported thyroid disease, including 10 patients (35%) with hypothyroidism. Additionally, 8 patients (28%) had a history of mucocutaneous lichen planus, 2 (7%) of psoriasis/psoriatic arthritis, 1 (3%) of vitiligo, 1 (3%) of systemic lupus erythematosus, 1 (3%) of iritis, 1 (3%) of Sjögren syndrome, and 1 (3%) of ulcerative colitis. Six patients (21%) also reported a history of breast cancer.
A dental history was obtained in 24 patients. All 24 patients reported having some dental implant or filling placed. Twenty-four patients (100%) had a history of metal amalgam implants, 8 (33%) had gold alloy implants, 4 (17%) had composite resin implants, and 3 (13%) had porcelain implants. Two patients had metal amalgam implants that had since been replaced by nonmetal implants. Both patients reported no change in their clinical conditions with removal of the metal implants. Six of 8 patients (75%) with mucocutaneous lichen planus reported having dental implants. Of them, all 6 patients (100%) reported having metal amalgam implants, and 3 patients (50%) additionally reported having gold alloy implants.
Treatments
On average, patients were treated with 3 different therapies for FFA (range, 0–14). The treatments utilized are listed in Table 3, and responses to treatments are summarized in Table 4. Topical steroids were the most popular treatment modality and were used by 21 patients (72%). Approximately half of those patients reported treatment response with stabilization of hair loss or regrowth (n=11; 52%). Hydroxychloroquine was the second most commonly used modality (16 patients [55%]), with 10 of those patients (63%) reporting treatment response. Intralesional steroids were used in 11 patients (38%), with a treatment response in 36% (4/11) of those patients. Topical pimecrolimus and tacrolimus were used by 6 patients (21%), with 5 of those patients (83%) reporting treatment response. UVB excimer laser therapy was used on 3 patients (10%) with 100% treatment response.
Treatments with little or no treatment response to hair loss include doxycycline, minocycline, and topical minoxidil. Seven patients (24%) were treated with doxycycline or minocycline, all of whom reported no clinical response. Topical minoxidil was used by 3 patients (10%), with only 1 patient (33%) reporting stabilization of hair loss but no regrowth of hair. 5α-reductase inhibitors such as finasteride and dutasteride were only used by 1 patient (3%), who reported no treatment response. Other treatments that were rarely used include meloxicam (n=2), azathioprine (n=2), oral clindamycin (n=2), bimatoprost (n=1), quinacrine (n=1), cephalosporin (n=1), prednisone (n=1), isotretinoin (n=1), methotrexate (n=1), spironolactone (n=1), topical clindamycin (n=1), and laser hair removal (n=1). Of these, only meloxicam and quinacrine were anecdotally associated with stabilization of hair loss, while the rest of the treatments were associated with progressive hair loss despite therapy.
Comment
Frontal fibrosing alopecia is a form of cicatricial alopecia considered to be a clinical subset of LPP. Although the pathogeneses of both diseases are poorly understood, LPP is the better-studied model and is generally considered to be an autoimmune disease specific to the hair follicle, involving a cell-mediated inflammatory response to epithelial hair follicle stem cells.12 In support of this hypothesis, FFA and LPP have been frequently associated with autoimmune diseases, particularly with hypothyroidism.6,13-15 We found that 55% of our patients had a history of autoimmune disease, including 35% with hypothyroidism, 28% with mucocutaneous lichen planus, 7% with psoriasis, 3% with vitiligo, 3% with systemic lupus erythematosus, 3% with iritis, 3% with Sjögren syndrome, and 3% with ulcerative colitis. The link between FFA and hypothyroidism has been the best studied, with a large study by Atanskova Mesinkovska et al14 finding that 34% of 166 patients with LPP and FFA have some kind of thyroid disease and 29% have hypothyroidism. Fron
Although FFA has been classically described to affect postmenopausal women, recent studies have consistently identified that premenopausal women4-6,8,16,17 and men14,16 also can be affected by the condition. In our patient cohort, there was 1 male patient (3%), and a substantial number of the female patients were premenopausal (19%) and menopausal (19%) at the time of disease onset. Most of the patients studied were white; Asian and black patients were a consistent minority across FFA studies,5,13-16,25 highlighting the importance of screening for FFA in all demographics.
In our study, FFA patients also appeared to be more affluent than the general population and were predominantly nonsmokers (76%). These statistics are consistent with the United Kingdom population studied by MacDonald et al,6 which demonstrated a higher socioeconomic status and higher incidence of nonsmoking in their cases of FFA. Another large retrospective study of FFA patients in Spain found that 87% of their FFA cases (N=355) were nonsmokers, though they did not note a difference from the general unaffected population.15 In our study, we replicated these trends, finding an above average affluence level and a high but not statistically significant incidence of nonsmokers. Although it is not clear how socioeconomic status or smoking factors into the pathology of FFA, these studies may show a general trend in the environmental demographics of the disease.
Clinically, patients with FFA typically present with hair loss of the scalp as well as other sites. The eyebrows are the most common site to be affected outside of the scalp, affecting 86% of our patients, whereas eyelashes are the least commonly affected, presenting in only 3% of our patients. Body hair loss also is common, with almost two-thirds of our cohort reporting hair loss on the limbs and more than one-third reporting loss of axillary and pubic hair. These findings are consistent with those of other studies.3-6,8,13,15 Eyelash loss, body hair loss, and facial papules have been found to be associated with more severe forms of FFA,15 though we did not investigate these forms in our study. Inflammatory symptoms are common, with pruritus affecting 66% of our patients and pain affecting 10% of patients, consistent with the published literature.3,13,15,17
Multiple studies have shown that female FFA patients have a higher incidence of hysterectomies in their medical history.5,8,15 This observation has been used to further support the hypothesis that a change in sex hormone balance may trigger the initial onset of disease.5,8,15 A considerable number of the female patients in our study had also undergone hysterectomies (29%). Only 2 patients (7%) underwent premature surgical menopause through bilateral removal of the ovaries, and neither of these patients had abnormally early onset of FFA (age at onset, 52 and 65 years). Many patients in our study also reported a history of pharmacologic manipulation of sex hormones with hormone replacement therapy (43%) and oral contraceptive use (43%). However, patients with FFA have not been identified to have abnormal hormone levels compared to unaffected postmenopausal women.1 Additionally, the disease does not exclusively affect androgen-dependent hair, as indicated by the high prevalence of eyebrow hair loss. We hypothesize that the link between increased prevalence of hysterectomy and FFA is not due to hormonal changes but rather from the stresses related to the hysterectomy or associated conditions that required the surgery. In our study, 35% of patients identified stress as the inciting event prior to their onset of hair loss, with 17% specifically referring to health-related stress such as surgery or new diagnoses as the cause. Although this pattern is purely observational, it is valuable to consider that stress could contribute to the initial onset of FFA as with alopecia areata.26
A dental history was obtained in 24 patients to explore the possibility of FFA as a manifestation of contact allergy secondary to exposure to metal dental implants. Contact allergies to metal amalgam and gold alloy dental implants/fillings frequently have been described as presenting as oral lichen planus in the literature.27-34 Given the histologic overlap between oral lichen planus and LPP/FFA, it is worth exploring the possibility that LPP and FFA are other manifestations of contact allergic response. In our study, 100% of the patients who provided a dental history had metal amalgam implants and 33% had gold alloy implants. It is an interesting observation, but it should be noted that none of the patients in our study had undergone patch testing for contact allergies to the metals in their dental implants, and further studies are required to explore this hypothesis.
Frontal fibrosing alopecia is a difficult condition to treat. In our study, patients tried an average of 3 different treatments, the most common being topical steroids (72%), hydroxychloroquine (55%), and intralesional steroids (38%).
A PubMed search of articles indexed for MEDLINE using the terms randomized control trial and frontal fibrosing alopecia yielded no randomized controlled trials that have been performed to demonstrate the most efficacious treatments of FFA. However, one systematic review of 114 patients found 5α-RIs, antimalarials, and intralesional corticosteroids to yield the best responses in treating FFA.22 Another large, multicenter, retrospective study of 355 patients also demonstrated that 5α-RIs and intralesional corticosteroids minimized hair loss most effectively across treatment modalities.15 One treatment that was not discussed in either study but was utilized in ours was the UVB excimer laser, which has been demonstrated to induce T-cell apoptosis and decrease inflammation in psoriasis but has been infrequently studied in the use of FFA or LPP. In one study of 13 patients with LPP, excimer laser treatment was successful in reducing inflammatory symptoms and improving hair loss.35 Our results reaffirm that laser therapy could be considered more frequently as a treatment of FFA.
This study is subject to several limitations. The study size was comprised of a relatively small number of patients with the condition. Additionally, only one-third of patients contacted agreed to participate in the study, and therefore the responses received may not be completely representative of all FFA patients. With a retrospective study, there is potential for recall bias in the data that are collected. Physician chart correlation to patient responses could not be reliably performed due to inconsistent documentation, care received outside our medical system, and prolonged or loss to follow-up. Another concern is that not all diagnoses of FFA in this study were biopsy confirmed. In one patient with systemic lupus erythematous who declined biopsy, it cannot be confirmed that her etiology of scarring alopecia was FFA rather than discoid lupus erythematous. Finally, because patients were treated with multiple medications, often concurrently, it was difficult to parse out which medications were efficacious and which were not. Despite these limitations, the findings in the study add to the growing literature about a rare but increasingly prevalent presentation.
Conclusion
Frontal fibrosing alopecia is a condition that predominantly affects white postmenopausal women but should not be overlooked in other demographics; higher socioeconomic status and nonsmoking are consistent with cases of FFA worldwide. Alopecia frequently involves other body hair, particularly the eyebrows, and is commonly associated with pruritus and pain. Many patients can identify an inciting event, usually stress, a health crisis, or new external exposures that they believe to have triggered the event. Consistent with data about LPP, FFA is frequently associated with autoimmune conditions, particularly hypothyroidism. A substantial portion of patients with FFA have had metal amalgam or gold alloy dental implants placed, though no patch testing was done to confirm that these patients have a contact allergy to these metals. Treatment for the condition is difficult, but topical and intralesional steroids, hydroxychloroquine, calcineurin inhibitors, and excimer laser therapy are efficacious in a large proportion of patients. Nevertheless, further research through prospective randomized trials is necessary to determine the best treatment modalities for FFA. Frontal fibrosing alopecia is a scarring form of hair loss that causes substantial emotional distress; therefore, it is critical to continue to investigate its etiology and treatments to improve patient care.
- Kossard S. Postmenopausal frontal fibrosing alopecia: scarring alopecia in a pattern distribution. Arch Dermatol. 1994;130:770-774.
- Kossard S, Lee MS, Wilkinson B. Postmenopausal frontal fibrosing alopecia: a frontal variant of lichen planopilaris. J Am Acad Dermatol. 1997;36:59-66.
- Tosti A, Piraccini BM, Iorizzo M, et al. Frontal fibrosing alopecia in postmenopausal women. J Am Acad Dermatol. 2005;52:55-60.
- Moreno-Ramírez D, Camacho Martínez F. Frontal fibrosing alopecia: a survey in 16 patients. J Eur Acad Dermatol Venereol. 2005;19:700-705.
- Ladizinski B, Bazakas A, Selim MA, et al. Frontal fibrosing alopecia: a retrospective review of 19 patients seen at Duke University. J Am Acad Dermatol. 2013;68:749-755.
- MacDonald A, Clark C, Holmes S. Frontal fibrosing alopecia: a review of 60 cases. J Am Acad Dermatol. 2012;67:955-961.
- Georgala S, Katoulis AC, Befon A, et al. Treatment of postmenopausal frontal fibrosing alopecia with oral dutasteride. J Am Acad Dermatol. 2009;61:157-158.
- Tan KT, Messenger AG. Frontal fibrosing alopecia: clinical presentations and prognosis. Br J Dermatol. 2009;160:75-79.
- Chew AL, Bashir SJ, Wain EM, et al. Expanding the spectrum of frontal fibrosing alopecia: a unifying concept. J Am Acad Dermatol. 2010;63:653-660.
- Miteva M, Camacho I, Romanelli P, et al. Acute hair loss on the limbs in frontal fibrosing alopecia: a clinicopathological study of two cases. Br J Dermatol. 2010;163:426-428.
- Abbas O, Chedraoui A, Ghosn S. Frontal fibrosing alopecia presenting with components of Piccardi-Lassueur-Graham-Little syndrome. J Am Acad Dermatol. 2007;57(2 suppl):S15-S18.
- Harries MJ, Meyer K, Chaudhry I, et al. Lichen planopilaris is characterized by immune privilege collapse of the hair follicle’s epithelial stem cell niche. J Pathol. 2013;231:236-247.
- Dlova NC, Jordaan HF, Skenjane A, et al. Frontal fibrosing alopecia: a clinical review of 20 black patients from South Africa. Br J Dermatol. 2013;169:939-941.
- Atanaskova Mesinkovska N, Brankov N, Piliang M, et al. Association of lichen planopilaris with thyroid disease: a retrospective case-control study. J Am Acad Dermatol. 2014;70:889-892.
- Vañó-Galván S, Molina-Ruiz AM, Serrano-Falcón C, et al. Frontal fibrosing alopecia: a multicenter review of 355 patients. J Am Acad Dermatol. 2014;70:670-678.
- Dlova N, Goh CL, Tosti A. Familial frontal fibrosing alopecia. Br J Dermatol. 2013;168:220-222.
- Samrao A, Chew AL, Price V. Frontal fibrosing alopecia: a clinical review of 36 patients. Br J Dermatol. 2010;163:1296-1300.
- Miteva M, Aber C, Torres F, et al. Frontal fibrosing alopecia occurring on scalp vitiligo: report of four cases. Br J Dermatol. 2011;165:445-447.
- Sato M, Saga K, Takahashi H. Postmenopausal frontal fibrosing alopecia in a Japanese woman with Sjögren’s syndrome. J Dermatol. 2008;35:729-731.
- Feldmann R, Harms M, Saurat JH. Postmenopausal frontal fibrosing alopecia. Hautarzt. 1996;47:533-536.
- Junqueira Ribeiro Pereira AF, Vincenzi C, Tosti A. Frontal fibrosing alopecia in two sisters. Br J Dermatol. 2010;162:1154-1155.
- Rácz E, Gho C, Moorman PW, et al. Treatment of frontal fibrosing alopecia and lichen planopilaris: a systematic review. J Eur Acad Dermatol Venereol. 2013;27:1461-1470.
- QuickFacts: St. Louis County, Missouri. United States Census Bureau website. https://www.census.gov/quickfacts/fact/table/stlouiscountymissouri/PST045217. Accessed February 6, 2019.
- State tobacco activities tracking and evaluation (STATE) system. State highlights. Centers for Disease Control and Prevention website. https://nccd.cdc.gov/STATESystem/rdPage.aspx?rdReport=OSH_STATE.Highlights. Accessed February 6, 2019.
- Miteva M, Whiting D, Harries M, et al. Frontal fibrosing alopecia in black patients. Br J Dermatol. 2012;167:208-210.
- Willemsen R, Vanderlinden J, Roseeuw D, et al. Increased history of childhood and lifetime traumatic events among adults with alopecia areata. J Am Acad Dermatol. 2009;60:388-393.
- Segura-Egea JJ, Bullón-Fernández P. Lichenoid reaction associated to amalgam restoration. Med Oral Patol Oral Cir Bucal. 2004;9:421-424.
- Laeijendecker R, van Joost T. Oral manifestations of gold allergy. J Am Acad Dermatol. 1994;30:205-209.
- Marcusson JA. Contact allergies to nickel sulfate, gold sodium thiosulfate and palladium chloride in patients claiming side-effects from dental alloy components. Contact Dermatitis. 1996;34:320-323.
- Nordlind K, Lidén S. Patch test reactions to metal salts in patients with oral mucosal lesions associated with amalgam restorations. Contact Dermatitis. 1992;27:157-160.
- Koch P, Bahmer FA. Oral lichenoid lesions, mercury hypersensitivity and combined hypersensitivity to mercury and other metals: histologically-proven reproduction of the reaction by patch testing with metal salts. Contact Dermatitis. 1995;33:323-328.
- Laine J, Kalimo K, Happonen RP. Contact allergy to dental restorative materials in patients with oral lichenoid lesions. Contact Dermatitis. 1997;36:141-146.
- Yiannias JA, el-Azhary RA, Hand JH, et al. Relevant contact sensitivities in patients with the diagnosis of oral lichen planus. J Am Acad Dermatol. 2000;42:177-182.
- Scalf LA, Fowler JF Jr, Morgan KW, et al. Dental metal allergy in patients with oral, cutaneous, and genital lichenoid reactions. Am J Contact Dermat. 2001;12:146-150.
- Navarini AA, Kolios AG, Prinz-Vavricka BM, et al. Low-dose excimer 308-nm laser for treatment of lichen planopilaris. Arch Dermatol. 2011;147:1325-1326.
Practice Points
- Frontal fibrosing alopecia (FFA) may be associated with other autoimmune conditions, and patients should be screened accordingly.
- The most efficacious treatments for FFA include topical and intralesional steroids, hydroxychloroquine, calcineurin inhibitors, and excimer laser therapy.
- A stressful precipitating event or metal dental implants/fillings are 2 possible environmental triggers for this condition.

Increasing Mobility via In-hospital Ambulation Protocol Delivered by Mobility Technicians: A Pilot Randomized Controlled Trial
Individuals aged 65 years and over represent 13% of the United States population and account for nearly 40% of hospital discharges.1 Bedrest hastens the functional decline of older patients2-5 and is associated with risk of serious complications, such as falls, delirium, venous thrombosis, and skin breakdown.6,7 Ambulation is widely recognized as important for improving hospital outcomes.8-10 Observational studies suggest that increases of 600 steps per day are associated with shortened length of hospital stay.9 However, randomized trials of assisted ambulation have not demonstrated consistent benefit.11-14 As a result, usual care at most hospitals in the United States does not include assisted ambulation. Even when ambulation is ordered, execution of the orders is inconsistent.15-17
Studies have demonstrated the benefits of various exercise protocols for older patients in rehabilitation facilities,18,19 medical intensive care units,20 and medical and surgical wards.13,18,21 These interventions are usually nursing centered; however, assisting patients with ambulation multiple times per day may be a burdensome addition to the myriad responsibilities of nurses.19,22,23 In fact, ambulation orders are the most frequently overlooked nursing task.24
We designed a graded protocol of assisted ambulation implemented by a dedicated patient care nursing assistant (PCNA) multiple times daily to increase patient mobility. The objective of this study was to assess the feasibility and effectiveness of such an intervention for older inpatients. We hypothesized that the intervention would prove feasible and improve hospital outcomes, including less need for inpatient rehabilitation and shorter length of stay.
METHODS
We conducted a single-blind randomized controlled trial of patients aged ≥60 years and admitted as medical inpatients to the Cleveland Clinic Main Campus, a tertiary care center with over 1,440 inpatient beds. The consent form and study protocol were approved by the Cleveland Clinic Institutional Review Board, and the study was registered with ClinicalTrials.gov (NCT02757131).
Patients
All patients who were admitted to study wards for a medical illness and evaluated by Physical Therapy (PT) were eligible for the study. PT evaluations were ordered by the medical team if deemed necessary on the basis of factors, such as age, estimated mobility, and concerns raised by the ancillary staff. All patients who were expected to be discharged to a skilled nursing facility placement or who required home PT received a PT evaluation. Assessment of mobility was documented via Activity Measure for Postacute Care Inpatient Basic Mobility “six-clicks” short form, hereafter abbreviated as “six-clicks.” Based on past experience, patients with scores <16 rarely go home (<20% of the time), and those with scores >20 usually go home regardless of ambulation. Therefore, only patients with scores of 16-20 were invited to participate in the study. Although patients who were not evaluated by PT might also benefit from the intervention, we required a six-clicks score to assess eligibility. The exclusion criteria included anticipated remaining length of stay less than three days, admission under observation status, admission to the intensive care unit (ICU,) patients receiving comfort care measures, and patients with medical conditions precluding ambulation, such as decompensated heart failure or unstable angina.
Randomization
Patients were randomized to “usual care” or “mobility technician” after baseline evaluation using a computerized system. A block randomization scheme with a size of four was used to ensure an approximately equal number of patients per group.
Intervention
Patients randomized to the intervention group were asked to participate in the ambulation protocol outlined by the PT three times daily under the supervision of the mobility technician. The protocol involved four exercise levels (sitting, standing, walking, and stairs), which were implemented depending on the patient’s physical capacity. The mobility technicians, who were PCNAs, were trained by the PT team. PCNAs have no specific degrees or certification. They are taught safe handling techniques during their job orientation, so they already had an understanding of how to transfer and assist a patient with ambulation. The mobility technician training consisted of one four-hour session run by the PT team in the physical therapy department and the nursing unit. The training included safe handling practices and basic mobility, such as transfers from bed to chair, bed to standing, walking with assistance, and walking independently with equipment such as cane, rolling walker, and walking belt. All instruction was demonstrated by the trainer, and the mobility technician was then able to practice. The mobility technician then shadowed the trainer and practiced the techniques under supervision. Competency was assessed by the trainer.
The cohort of patients randomized to “usual care” was not seen by the mobility technicians but was not otherwise restricted in nursing’s baseline ability to execute recommendations placed by the PT team. Compliance with the recommendations is highly variable and dependent on patient acuity during the shift, staffing issues, and competing duties. Cleveland Clinic promotes a “culture of mobility,” and nurses are encouraged to get patients out of bed and assist with ambulation.
Study Instruments—Measures of Mobility
The six-clicks instrument is a tool for measuring basic mobility. It was adapted from the Activity Measures for Post-Acute Care (AM-PAC) instrument.25 Although initially created for self-report in the post-acute care setting, six-clicks has been validated for use by PTs in the acute care setting26 and is currently in use at more than 1,000 US hospitals. Cleveland Clinic PTs have used this measure for routine evaluation since 2011. The instrument has high interrater reliability and can predict discharge disposition.27-29
Each patient was provided with a tracking device (Fitbit) attached at the wrist to record daily steps for measuring mobility. The use of Fitbit has been validated in ambulatory and inpatient settings.30 The device produces step counts within 3% of the observed step count for most patients but may undercount steps in patients with very slow gait.31 The device was provided to each enrollee and collected at discharge.
Variables
Demographic information, comorbid diagnoses, and discharge destination were extracted from the electronic medical record. Information on prehospitalization physical activity level was obtained from the initial PT assessment. Falls were tracked through the safety event reporting system.
Outcomes
The primary outcomes were discharge disposition and hospital length of stay. The secondary outcomes included average steps per day, change in six-clicks score from admission to discharge, inpatient mortality, admission to ICU, falls, deep vein thrombosis, pulmonary embolism, or pneumonia, and readmission within 30 days.
Statistical Analysis
Patient characteristics were summarized as means and standard deviations or medians and interquartile ranges for continuous variables and as frequencies and percentages for categorical variables. The t-test or Wilcoxon rank sum test was applied to compare continuous characteristics between the intervention and control groups. Chi-squared test or Fisher’s exact test was applied to compare categorical characteristics. Given its skewed distribution, the length of stay was log-transformed and compared between the two groups using Student’s t-test. Chi-squared test was used to compare categorical outcomes. The analysis of final six-clicks scores was adjusted for baseline scores, and the least-square estimates are provided. A linear mixed effects model was used to compare the number of daily steps taken because each participant had multiple steps measured. Results were adjusted for prehospital activity. In addition to comparing the total steps taken by each group, we determined the proportion of patients who exceeded a particular threshold by taking the average number of steps per day for all subjects and relating it to home discharge using the Receiver Operating Characteristics (ROC) curve. An optimal cut-off was determined to maximize the Youden index. We also compared the proportion of patients who exceeded 900 steps because this value was previously reported as an important threshold.32 All analyses were conducted using intention-to-treat principles. We also conducted a per-protocol analysis in which we limited the intervention group to those who received at least one assisted ambulation session. A dose-response analysis was also performed, in which patients were categorized as not receiving the therapy, receiving sessions on one or two days, or receiving them on more than two days.
All analyses were conducted using R-studio (Boston, MA). Statistical significance was defined as a P-value < .05. Given that this is a pilot study, the results were not adjusted for multiple comparisons.
RESULTS
Characteristics of patients in the intervention and control groups are shown in Table 1. The patients were mostly white and female, with an average age in the mid-70s (range 61-98). All measures evaluated were not significantly different between the intervention and control groups. However, more patients in the intervention group had a prehospital activity level classified as independent.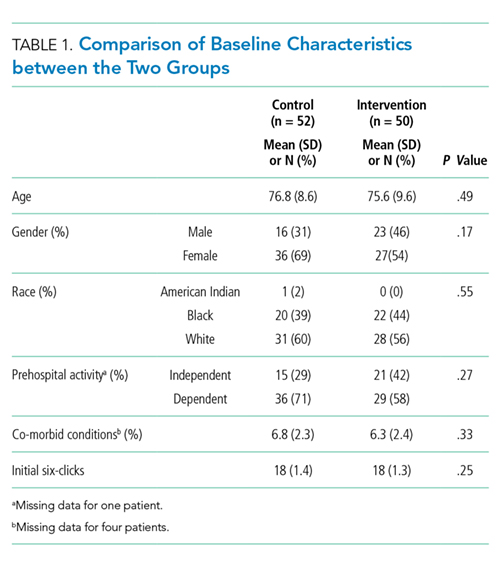
Table 2 demonstrates the feasibility of the intervention. Of patients randomized to the intervention group, 74% were ambulated at least once. Once enrolled, the patients successfully participated in assisted ambulation for about two-thirds of their hospital stay. However, the intervention was delivered for only one-third of the total length of stay because most patients were not enrolled on admission. On average, the mobility technicians made 11 attempts to ambulate each patient and 56% of these attempts were successful. The proportion of unsuccessful attempts did not change over the course of the study. The reasons for unsuccessful attempts included patient refusal (n = 102) or unavailability (n = 68), mobility technicians running out of time (n = 2), and other (n = 12).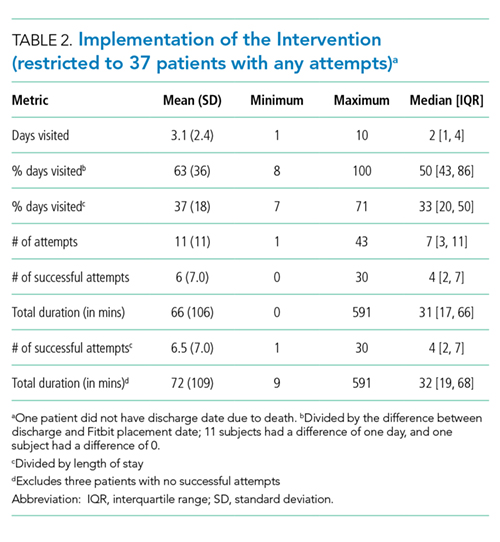
Initially, the mobility technicians were not available on weekends. In addition, they were often reassigned to other duties by their nurse managers, who were dealing with staffing shortages. As the study progressed, we were able to secure the mobility technicians to work seven days per week and to convince the nurse managers that their role should be protected. Consequently, the median number [IQR] of successful attempts increased from 1.5 [0, 2] in the first two months to 3 [0, 5] in the next three months and finally to 5 [1.5, 13] in the final months (P < .002). The median visit duration was 10 minutes, with an interquartile range of 6-15 minutes.
In the intention-to-treat analysis, patients in the intervention group took close to 50% more steps than did the control patients. After adjustment for prehospital activity level, the difference was not statistically significant. The intervention also did not significantly affect the length of stay or discharge disposition (Table 3). In the per protocol analysis, the difference in the step count was significant, even after adjustment. The six-clicks score also significantly increased.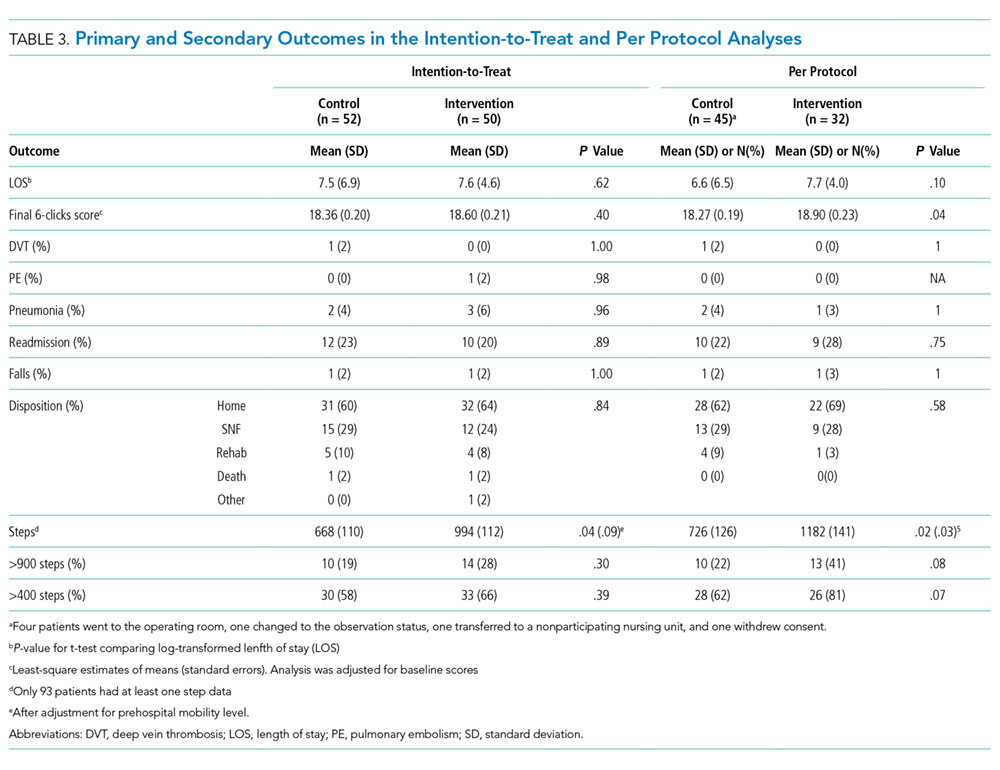
To assess for dose response, we compared outcomes among patients who received no intervention, those who received two or fewer days of intervention, and those who received more than two days of intervention (Table 4). The length of stay was significantly longer in patients with more than two days of intervention, likely reflecting greater opportunities for exposure to the intervention. The longer intervention time significantly increased the six-clicks score.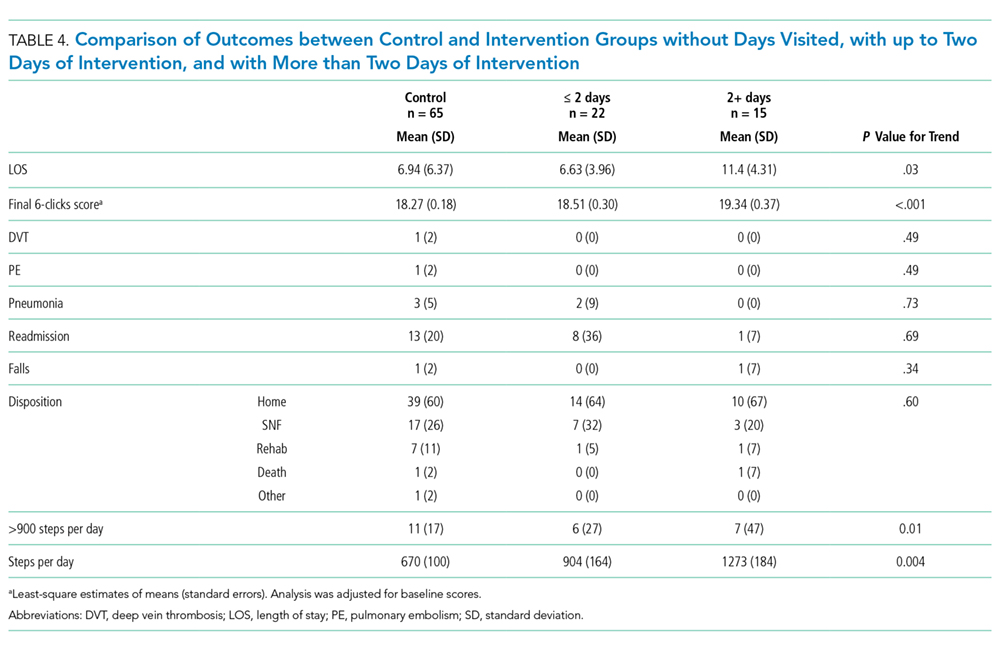
We examined the relationship between steps achieved and discharge disposition. Patients who achieved at least 900 steps more often went home than those who did not (79% vs. 56%, P < .05). The ROC for the model of discharge disposition using steps taken as the only predictor had an area under the curve of 0.67, with optimal discrimination at 411 steps. At a threshold of 400 steps, the model had a sensitivity of 75.9% and a specificity of 51.4%. Patients achieving 400 steps were more likely to go home than those who did not achieve that goal (71% vs. 46%, P =.01). More patients in the intervention group achieved the 900 step goal (28% vs. 19%, P = .30) and the 400 step goal (66% vs. 58%, P = .39), but neither association reached statistical significance.
DISCUSSION
In this pilot study conducted with older medical inpatients, we found that assisted ambulation provided by a dedicated mobility technician was feasible and increased the number of steps taken by patients. Not all patients in the treatment group received the intervention partly due to the fact that the program initially did not include weekends and the mobility technicians were sometimes redirected to other nursing duties. Both issues were addressed during the course of the study. In the per protocol analysis, the intervention increased the average six-clicks score and there was a nonsignificant reduction in the percentage of patients discharged to a rehabilitation facility.
A range of hospital-based mobility interventions have been described. Several of which were complex multidisciplinary interventions that included a mobility component. The compliance rates have ranged from 82% to 93.7%,12,13 although a systematic review noted that many studies do not provide this level of information.11 Interventions were carried out by nursing staff and PT with support from family members and social workers.33-35 Ambulation-specific programs have also relied on nurses and PT13,14,36 and, occasionally, on research assistants to implement assisted ambulation protocols.12,37 A recent study that employed research assistants to deliver inhospital ambulation reported achieving 51.3% of intended walks.37
In contradistinction to previous studies, we created a new role, employing PCNAs as dedicated mobility technicians. We did this for two reasons. First, the approach is less expensive than deploying registered nurses or PTs to ambulate patients and therefore more likely to be adopted by hospitals, especially if it can decrease the cost of an episode of care by avoiding subsequent inpatient rehabilitation. Mobility technicians have no degree or certification requirements and are therefore paid less than nurses or physical therapists. Second, by having a single responsibility, mobility technicians were more likely to engage in their task than nurses, who have competing responsibilities. However, when nurse staffing was short, nurse managers were tempted to recall the PCNAs for other nursing duties. It took time before PCNAs and supervisors prioritized this new responsibility. When they did, the number of attempted walks increased substantially, but the percentage of successful attempts remained constant at 56%, highlighting the difficulty of getting hospitalized patients to walk.
On average, patients who received the intervention engaged in 72 minutes of additional physical activity and averaged 990 steps per day. Observational data suggest patients accrue about 1,100 steps in the day before discharge, with older patients accruing closer to 900.21 One study found that older patients with fewer than 900 steps per day were likely to experience a functional decline.32 We also found that patients who achieved at least 900 steps were more likely to go home. However, we found that a lower threshold, namely, 400 steps, offered better discrimination between patients who go home and those who do not. Future prospective studies are needed to establish the appropriate goal for exercise interventions. A lower step goal could dramatically enhance the efficiency of the intervention.
A Cochrane review found that pooled analysis of multidisciplinary interventions that included exercise, often in the form of walking, achieved a small but significant increase in the proportion of patients discharged to home (RR 1.08, 95%CI 1.03 to 1.14).11 We found no significant change in the discharge disposition, but our study was underpowered for this endpoint. The six-clicks score showed a small but significant change in the per protocol analysis. The six-clicks score has been shown to correlate with discharge disposition,28,29 and an improvement in the score suggests that discharge disposition may be influenced.
The intervention may also not have been implemented for long enough. On average, visits were achieved for one-third of the hospital stay partly because of the delay in PT evaluation, which we required for eligibility. In practice, PT evaluation can occur just a few days before the anticipated discharge. We observed a dose dependent response among patients in the intervention group, suggesting that earlier intervention could be more effective. Earlier intervention might be achieved if the MT performed the six-clicks on potentially eligible patients.
The effects of hospitalization on mobility may be the most pronounced in the long term; one study found that 40% of hospitalized older patients manifested new ADL or IADL disability three months after discharge compared with 31% at discharge.7 Hospital-based mobility interventions may continue to affect subjects’ independence for weeks or months. In one RCT, an inpatient ambulation intervention improved mobility in the community one month after discharge.37 A hospital-based exercise program that included ambulation achieved better functional outcomes one month later.13 One RCT that combined inpatient exercise with outpatient care coordination also decreased readmission rates.34 We found that the intervention did not affect readmission.
This pilot study has several limitations. The sample size was small, and the findings need to be replicated in a larger randomized controlled trial. This is particularly important because the two study arms were not balanced in terms of their prehospital activity. After adjustment for prehospital activity, the differences in the step count in the intention-to-treat analysis were no longer significant. As we adjusted the intervention to hospital workflow, the intervention changed over time. The intention-to-treat analysis may therefore underestimate the effect of the intervention. This work provides a basis for future trial. Finally, discharge disposition depends on a complex interplay of factors, including social factors and preferences, which may not be affected by a mobility intervention.
In summary, an inhospital mobility protocol of attempting ambulation delivered by dedicated mobility technicians three times daily successfully increased the daily step counts and mobility scores of the patients. Studies with a larger sample size are needed to determine whether the proposed approach can affect length of hospital stay, discharge disposition, and overall cost of an episode of care.
Disclosures
Mary Stilphen reports consulting for CreCare and Adeo, which license and distribute AM-PAC short forms, including 6 clicks. All other authors report no conflicts of interest.
Funding
This study was supported by a Research Program Committee grant from the Cleveland Clinic.
1. National Center for Health Statistics. National Hospital Discharge Survey. 2010. PubMed
2. Corcoran PJ. Use it or lose it--the hazards of bed rest and inactivity. West J Med. 1991;154(5):536-538. PubMed
3. Gillick MR, Serrell NA, Gillick LS. Adverse consequences of hospitalization in the elderly. Soc Sci Med. 1982;16(10):1033-1038. doi: 10.1016/0277-9536(82)90175-7. PubMed
4. Hirsch CH, Sommers L, Olsen A, Mullen L, Winograd CH. The natural history of functional morbidity in hospitalized older patients. J Am Geriatr Soc. 1990;38(12):1296-1303. doi: 10.1111/j.1532-5415.1990.tb03451.x. PubMed
5. Zisberg A, Shadmi E, Sinoff G, Gur-Yaish N, Srulovici E, Admi H. Low mobility during hospitalization and functional decline in older adults. J Am Geriatr Soc. 2011;59(2):266-273. doi: 10.1111/j.1532-5415.2010.03276.x. PubMed
6. Heit JA, Silverstein MD, Mohr DN, Petterson TM, O’Fallon WM, Melton LJ, 3rd. Risk factors for deep vein thrombosis and pulmonary embolism: A population-based case-control study. Arch Intern Med. 2000;160(6):809-815. doi: 10.1067/mob.2001.107919. PubMed
7. Sager MA, Franke T, Inouye SK, et al. Functional outcomes of acute medical illness and hospitalization in older persons. Arch Intern Med. 1996;156(6):645-652. doi: 10.1001/archinte.1996.00440060067008. PubMed
8. Campbell AJ, Borrie MJ, Spears GF. Risk factors for falls in a community-based prospective study of people 70 years and older. J Gerontol. 1989;44(4):M112-M117. doi: 10.1093/geronj/44.4.M112. PubMed
9. Fisher SR, Kuo YF, Graham JE, Ottenbacher KJ, Ostir GV. Early ambulation and length of stay in older adults hospitalized for acute illness. Arch Intern Med. 2010;170(21):1942-1943. doi: 0.1001/archinternmed.2010.422. PubMed
10. Graf C. Functional decline in hospitalized older adults. Am J Nurs. 2006;106(1):58-67, quiz 67-58. PubMed
11. de Morton NA, Keating JL, Jeffs K. Exercise for acutely hospitalised older medical patients. Cochrane Database Syst Rev. 2007(1):CD005955. doi: 10.1002/14651858.CD005955. PubMed
12. Jones CT, Lowe AJ, MacGregor L, Brand CA, Tweddle N, Russell DM. A randomised controlled trial of an exercise intervention to reduce functional decline and health service utilisation in the hospitalised elderly. Australas J Ageing. 2006;25(3):126-133. doi: 10.1111/j.1741-6612.2006.00167.x.
13. Siebens H, Aronow H, Edwards D, Ghasemi Z. A randomized controlled trial of exercise to improve outcomes of acute hospitalization in older adults. J Am Geriatr Soc. 2000;48(12):1545-1552. doi: 10.1111/j.1532-5415.2000.tb03862.x. PubMed
14. Mundy LM, Leet TL, Darst K, Schnitzler MA, Dunagan WC. Early mobilization of patients hospitalized with community-acquired pneumonia. Chest. 2003;124(3):883-889. doi: 10.1378/chest.124.3.883. PubMed
15. Brown CJ, Redden DT, Flood KL, Allman RM. The underrecognized epidemic of low mobility during hospitalization of older adults. J Am Geriatr Soc. 2009;57(9):1660-1665. doi: 10.1111/j.1532-5415.2009.02393.x. PubMed
16. Callen BL, Mahoney JE, Grieves CB, Wells TJ, Enloe M. Frequency of hallway ambulation by hospitalized older adults on medical units of an academic hospital. Geriatr Nurs. 2004;25(4):212-217. doi: 10.1016/j.gerinurse.2004.06.016. PubMed
17. Fisher SR, Goodwin JS, Protas EJ, et al. Ambulatory activity of older adults hospitalized with acute medical illness. J Am Geriatr Soc. 2011;59(1):91-95. doi: 10.1111/j.1532-5415.2010.03202.x. PubMed
18. McVey LJ, Becker PM, Saltz CC, Feussner JR, Cohen HJ. Effect of a geriatric consultation team on functional status of elderly hospitalized patients: A randomized, controlled clinical trial. Ann Intern Med. 1989;110(1):79-84. doi: PubMed
19. Said CM, Morris ME, Woodward M, Churilov L, Bernhardt J. Enhancing physical activity in older adults receiving hospital based rehabilitation: A phase II feasibility study. BMC Geriatr. 2012;12:26. doi: 10.1186/1471-2318-12-26. PubMed
20. Timmerman RA. A mobility protocol for critically ill adults. Dimens Crit Care Nurs. 2007;26(5):175-179; quiz 180-171. doi: 10.1097/01.DCC.0000286816.40570.da. PubMed
21. Sallis R, Roddy-Sturm Y, Chijioke E, et al. Stepping toward discharge: Level of ambulation in hospitalized patients. J Hosp Med. 2015;10(6):384-389. doi: 10.1002/jhm.2343. PubMed
22. Inouye SK, Wagner DR, Acampora D, Horwitz RI, Cooney LM, Jr., Tinetii ME. A controlled trial of a nursing-centered intervention in hospitalized elderly medical patients: The yale geriatric care program. J Am Geriatr Soc. 1993;41(12):1353-1360. doi: 10.1111/j.1532-5415.1993.tb06487.x. PubMed
23. Kalisch BJ, Landstrom GL, Hinshaw AS. Missed nursing care: A concept analysis. J Adv Nurs. 2009;65(7):1509-1517. doi: 10.1111/j.1365-2648.2009.05027.x. PubMed
24. Kalisch BJ, Tschannen D, Lee H, Friese CR. Hospital variation in missed nursing care. Am J Med Qual. 2011;26(4):291-299. doi: 10.1177/1062860610395929. PubMed
25. Haley SM, Coster WJ, Andres PL, et al. Activity outcome measurement for postacute care. Med Care. 2004;42(1 Suppl):I49-161. doi: 10.1097/01.mlr.0000103520.43902.6c. PubMed
26. Jette DU, Stilphen M, Ranganathan VK, Passek SD, Frost FS, Jette AM. Validity of the AM-PAC “6-Clicks” inpatient daily activity and basic mobility short forms. Phys Ther. 2014;94(3):379-391. doi: 10.2522/ptj.20130199. PubMed
27. Jette DU, Stilphen M, Ranganathan VK, Passek S, Frost FS, Jette AM. Interrater reliability of AM-PAC 6-Clicks” basic mobility and daily activity short forms. Phys Ther. 2015;95(5):758-766. doi: 10.2522/ptj.20140174. PubMed
28. Jette DU, Stilphen M, Ranganathan VK, Passek SD, Frost FS, Jette AM. AM-PAC “6-Clicks” functional assessment scores predict acute care hospital discharge destination. Phys Ther. 2014;94(9):1252-1261. doi: 10.2522/ptj.20130359. PubMed
29. Menendez ME, Schumacher CS, Ring D, Freiberg AA, Rubash HE, Kwon YM. Does “6-Clicks” day 1 postoperative mobility score predict discharge disposition after total hip and knee arthroplasties? J Arthroplasty. 2016;31(9):1916-1920. doi: 10.1016/j.arth.2016.02.017. PubMed
30. Feehan LM, Geldman J, Sayre EC, et al. Accuracy of fitbit devices: Systematic review and narrative syntheses of quantitative data. JMIR Mhealth Uhealth. 2018;6(8):e10527-e10527. doi: 10.2196/10527. PubMed
31. Treacy D, Hassett L, Schurr K, Chagpar S, Paul SS, Sherrington C. Validity of different activity monitors to count steps in an inpatient rehabilitation setting. Phys Ther. 2017;97(5):581-588. doi: 10.1093/ptj/pzx010. PubMed
32. Agmon M, Zisberg A, Gil E, Rand D, Gur-Yaish N, Azriel M. Association between 900 steps a day and functional decline in older hospitalized patients. JAMA Intern Med. 2017;177(2):272-274. doi: 10.1001/jamainternmed.2016.7266. PubMed
33. Counsell SR, Holder CM, Liebenauer LL, et al. Effects of a multicomponent intervention on functional outcomes and process of care in hospitalized older patients: a randomized controlled trial of Acute Care for Elders (ACE) in a community hospital. J Am Geriatr Soc. 2000;48(12):1572-1581. doi: 10.1111/j.1532-5415.2000.tb03866.x. PubMed
34. Courtney M, Edwards H, Chang A, Parker A, Finlayson K, Hamilton K. Fewer emergency readmissions and better quality of life for older adults at risk of hospital readmission: a randomized controlled trial to determine the effectiveness of a 24-week exercise and telephone follow-up program. J Am Geriatr Soc. 2009;57(3):395-402. doi: 10.1111/j.1532-5415.2009.02138.x. PubMed
35. Landefeld CS, Palmer RM, Kresevic DM, Fortinsky RH, Kowal J. A randomized trial of care in a hospital medical unit especially designed to improve the functional outcomes of acutely ill older patients. N Engl J Med. 1995;332(20):1338-1344. doi: 10.1056/NEJM199505183322006. PubMed
36. Hoyer EH, Friedman M, Lavezza A, et al. Promoting mobility and reducing length of stay in hospitalized general medicine patients: A quality-improvement project. J Hosp Med. 2016;11(5):341-347. doi: 10.1002/jhm.2546. PubMed
37. Brown CJ, Foley KT, Lowman JD, Jr., et al. comparison of posthospitalization function and community mobility in hospital mobility program and usual care patients: a randomized clinical trial. JAMA Intern Med. 2016;176(7):921-927. doi: 10.1001/jamainternmed.2016.1870. PubMed
Individuals aged 65 years and over represent 13% of the United States population and account for nearly 40% of hospital discharges.1 Bedrest hastens the functional decline of older patients2-5 and is associated with risk of serious complications, such as falls, delirium, venous thrombosis, and skin breakdown.6,7 Ambulation is widely recognized as important for improving hospital outcomes.8-10 Observational studies suggest that increases of 600 steps per day are associated with shortened length of hospital stay.9 However, randomized trials of assisted ambulation have not demonstrated consistent benefit.11-14 As a result, usual care at most hospitals in the United States does not include assisted ambulation. Even when ambulation is ordered, execution of the orders is inconsistent.15-17
Studies have demonstrated the benefits of various exercise protocols for older patients in rehabilitation facilities,18,19 medical intensive care units,20 and medical and surgical wards.13,18,21 These interventions are usually nursing centered; however, assisting patients with ambulation multiple times per day may be a burdensome addition to the myriad responsibilities of nurses.19,22,23 In fact, ambulation orders are the most frequently overlooked nursing task.24
We designed a graded protocol of assisted ambulation implemented by a dedicated patient care nursing assistant (PCNA) multiple times daily to increase patient mobility. The objective of this study was to assess the feasibility and effectiveness of such an intervention for older inpatients. We hypothesized that the intervention would prove feasible and improve hospital outcomes, including less need for inpatient rehabilitation and shorter length of stay.
METHODS
We conducted a single-blind randomized controlled trial of patients aged ≥60 years and admitted as medical inpatients to the Cleveland Clinic Main Campus, a tertiary care center with over 1,440 inpatient beds. The consent form and study protocol were approved by the Cleveland Clinic Institutional Review Board, and the study was registered with ClinicalTrials.gov (NCT02757131).
Patients
All patients who were admitted to study wards for a medical illness and evaluated by Physical Therapy (PT) were eligible for the study. PT evaluations were ordered by the medical team if deemed necessary on the basis of factors, such as age, estimated mobility, and concerns raised by the ancillary staff. All patients who were expected to be discharged to a skilled nursing facility placement or who required home PT received a PT evaluation. Assessment of mobility was documented via Activity Measure for Postacute Care Inpatient Basic Mobility “six-clicks” short form, hereafter abbreviated as “six-clicks.” Based on past experience, patients with scores <16 rarely go home (<20% of the time), and those with scores >20 usually go home regardless of ambulation. Therefore, only patients with scores of 16-20 were invited to participate in the study. Although patients who were not evaluated by PT might also benefit from the intervention, we required a six-clicks score to assess eligibility. The exclusion criteria included anticipated remaining length of stay less than three days, admission under observation status, admission to the intensive care unit (ICU,) patients receiving comfort care measures, and patients with medical conditions precluding ambulation, such as decompensated heart failure or unstable angina.
Randomization
Patients were randomized to “usual care” or “mobility technician” after baseline evaluation using a computerized system. A block randomization scheme with a size of four was used to ensure an approximately equal number of patients per group.
Intervention
Patients randomized to the intervention group were asked to participate in the ambulation protocol outlined by the PT three times daily under the supervision of the mobility technician. The protocol involved four exercise levels (sitting, standing, walking, and stairs), which were implemented depending on the patient’s physical capacity. The mobility technicians, who were PCNAs, were trained by the PT team. PCNAs have no specific degrees or certification. They are taught safe handling techniques during their job orientation, so they already had an understanding of how to transfer and assist a patient with ambulation. The mobility technician training consisted of one four-hour session run by the PT team in the physical therapy department and the nursing unit. The training included safe handling practices and basic mobility, such as transfers from bed to chair, bed to standing, walking with assistance, and walking independently with equipment such as cane, rolling walker, and walking belt. All instruction was demonstrated by the trainer, and the mobility technician was then able to practice. The mobility technician then shadowed the trainer and practiced the techniques under supervision. Competency was assessed by the trainer.
The cohort of patients randomized to “usual care” was not seen by the mobility technicians but was not otherwise restricted in nursing’s baseline ability to execute recommendations placed by the PT team. Compliance with the recommendations is highly variable and dependent on patient acuity during the shift, staffing issues, and competing duties. Cleveland Clinic promotes a “culture of mobility,” and nurses are encouraged to get patients out of bed and assist with ambulation.
Study Instruments—Measures of Mobility
The six-clicks instrument is a tool for measuring basic mobility. It was adapted from the Activity Measures for Post-Acute Care (AM-PAC) instrument.25 Although initially created for self-report in the post-acute care setting, six-clicks has been validated for use by PTs in the acute care setting26 and is currently in use at more than 1,000 US hospitals. Cleveland Clinic PTs have used this measure for routine evaluation since 2011. The instrument has high interrater reliability and can predict discharge disposition.27-29
Each patient was provided with a tracking device (Fitbit) attached at the wrist to record daily steps for measuring mobility. The use of Fitbit has been validated in ambulatory and inpatient settings.30 The device produces step counts within 3% of the observed step count for most patients but may undercount steps in patients with very slow gait.31 The device was provided to each enrollee and collected at discharge.
Variables
Demographic information, comorbid diagnoses, and discharge destination were extracted from the electronic medical record. Information on prehospitalization physical activity level was obtained from the initial PT assessment. Falls were tracked through the safety event reporting system.
Outcomes
The primary outcomes were discharge disposition and hospital length of stay. The secondary outcomes included average steps per day, change in six-clicks score from admission to discharge, inpatient mortality, admission to ICU, falls, deep vein thrombosis, pulmonary embolism, or pneumonia, and readmission within 30 days.
Statistical Analysis
Patient characteristics were summarized as means and standard deviations or medians and interquartile ranges for continuous variables and as frequencies and percentages for categorical variables. The t-test or Wilcoxon rank sum test was applied to compare continuous characteristics between the intervention and control groups. Chi-squared test or Fisher’s exact test was applied to compare categorical characteristics. Given its skewed distribution, the length of stay was log-transformed and compared between the two groups using Student’s t-test. Chi-squared test was used to compare categorical outcomes. The analysis of final six-clicks scores was adjusted for baseline scores, and the least-square estimates are provided. A linear mixed effects model was used to compare the number of daily steps taken because each participant had multiple steps measured. Results were adjusted for prehospital activity. In addition to comparing the total steps taken by each group, we determined the proportion of patients who exceeded a particular threshold by taking the average number of steps per day for all subjects and relating it to home discharge using the Receiver Operating Characteristics (ROC) curve. An optimal cut-off was determined to maximize the Youden index. We also compared the proportion of patients who exceeded 900 steps because this value was previously reported as an important threshold.32 All analyses were conducted using intention-to-treat principles. We also conducted a per-protocol analysis in which we limited the intervention group to those who received at least one assisted ambulation session. A dose-response analysis was also performed, in which patients were categorized as not receiving the therapy, receiving sessions on one or two days, or receiving them on more than two days.
All analyses were conducted using R-studio (Boston, MA). Statistical significance was defined as a P-value < .05. Given that this is a pilot study, the results were not adjusted for multiple comparisons.
RESULTS
Characteristics of patients in the intervention and control groups are shown in Table 1. The patients were mostly white and female, with an average age in the mid-70s (range 61-98). All measures evaluated were not significantly different between the intervention and control groups. However, more patients in the intervention group had a prehospital activity level classified as independent.
Table 2 demonstrates the feasibility of the intervention. Of patients randomized to the intervention group, 74% were ambulated at least once. Once enrolled, the patients successfully participated in assisted ambulation for about two-thirds of their hospital stay. However, the intervention was delivered for only one-third of the total length of stay because most patients were not enrolled on admission. On average, the mobility technicians made 11 attempts to ambulate each patient and 56% of these attempts were successful. The proportion of unsuccessful attempts did not change over the course of the study. The reasons for unsuccessful attempts included patient refusal (n = 102) or unavailability (n = 68), mobility technicians running out of time (n = 2), and other (n = 12).
Initially, the mobility technicians were not available on weekends. In addition, they were often reassigned to other duties by their nurse managers, who were dealing with staffing shortages. As the study progressed, we were able to secure the mobility technicians to work seven days per week and to convince the nurse managers that their role should be protected. Consequently, the median number [IQR] of successful attempts increased from 1.5 [0, 2] in the first two months to 3 [0, 5] in the next three months and finally to 5 [1.5, 13] in the final months (P < .002). The median visit duration was 10 minutes, with an interquartile range of 6-15 minutes.
In the intention-to-treat analysis, patients in the intervention group took close to 50% more steps than did the control patients. After adjustment for prehospital activity level, the difference was not statistically significant. The intervention also did not significantly affect the length of stay or discharge disposition (Table 3). In the per protocol analysis, the difference in the step count was significant, even after adjustment. The six-clicks score also significantly increased.
To assess for dose response, we compared outcomes among patients who received no intervention, those who received two or fewer days of intervention, and those who received more than two days of intervention (Table 4). The length of stay was significantly longer in patients with more than two days of intervention, likely reflecting greater opportunities for exposure to the intervention. The longer intervention time significantly increased the six-clicks score.
We examined the relationship between steps achieved and discharge disposition. Patients who achieved at least 900 steps more often went home than those who did not (79% vs. 56%, P < .05). The ROC for the model of discharge disposition using steps taken as the only predictor had an area under the curve of 0.67, with optimal discrimination at 411 steps. At a threshold of 400 steps, the model had a sensitivity of 75.9% and a specificity of 51.4%. Patients achieving 400 steps were more likely to go home than those who did not achieve that goal (71% vs. 46%, P =.01). More patients in the intervention group achieved the 900 step goal (28% vs. 19%, P = .30) and the 400 step goal (66% vs. 58%, P = .39), but neither association reached statistical significance.
DISCUSSION
In this pilot study conducted with older medical inpatients, we found that assisted ambulation provided by a dedicated mobility technician was feasible and increased the number of steps taken by patients. Not all patients in the treatment group received the intervention partly due to the fact that the program initially did not include weekends and the mobility technicians were sometimes redirected to other nursing duties. Both issues were addressed during the course of the study. In the per protocol analysis, the intervention increased the average six-clicks score and there was a nonsignificant reduction in the percentage of patients discharged to a rehabilitation facility.
A range of hospital-based mobility interventions have been described. Several of which were complex multidisciplinary interventions that included a mobility component. The compliance rates have ranged from 82% to 93.7%,12,13 although a systematic review noted that many studies do not provide this level of information.11 Interventions were carried out by nursing staff and PT with support from family members and social workers.33-35 Ambulation-specific programs have also relied on nurses and PT13,14,36 and, occasionally, on research assistants to implement assisted ambulation protocols.12,37 A recent study that employed research assistants to deliver inhospital ambulation reported achieving 51.3% of intended walks.37
In contradistinction to previous studies, we created a new role, employing PCNAs as dedicated mobility technicians. We did this for two reasons. First, the approach is less expensive than deploying registered nurses or PTs to ambulate patients and therefore more likely to be adopted by hospitals, especially if it can decrease the cost of an episode of care by avoiding subsequent inpatient rehabilitation. Mobility technicians have no degree or certification requirements and are therefore paid less than nurses or physical therapists. Second, by having a single responsibility, mobility technicians were more likely to engage in their task than nurses, who have competing responsibilities. However, when nurse staffing was short, nurse managers were tempted to recall the PCNAs for other nursing duties. It took time before PCNAs and supervisors prioritized this new responsibility. When they did, the number of attempted walks increased substantially, but the percentage of successful attempts remained constant at 56%, highlighting the difficulty of getting hospitalized patients to walk.
On average, patients who received the intervention engaged in 72 minutes of additional physical activity and averaged 990 steps per day. Observational data suggest patients accrue about 1,100 steps in the day before discharge, with older patients accruing closer to 900.21 One study found that older patients with fewer than 900 steps per day were likely to experience a functional decline.32 We also found that patients who achieved at least 900 steps were more likely to go home. However, we found that a lower threshold, namely, 400 steps, offered better discrimination between patients who go home and those who do not. Future prospective studies are needed to establish the appropriate goal for exercise interventions. A lower step goal could dramatically enhance the efficiency of the intervention.
A Cochrane review found that pooled analysis of multidisciplinary interventions that included exercise, often in the form of walking, achieved a small but significant increase in the proportion of patients discharged to home (RR 1.08, 95%CI 1.03 to 1.14).11 We found no significant change in the discharge disposition, but our study was underpowered for this endpoint. The six-clicks score showed a small but significant change in the per protocol analysis. The six-clicks score has been shown to correlate with discharge disposition,28,29 and an improvement in the score suggests that discharge disposition may be influenced.
The intervention may also not have been implemented for long enough. On average, visits were achieved for one-third of the hospital stay partly because of the delay in PT evaluation, which we required for eligibility. In practice, PT evaluation can occur just a few days before the anticipated discharge. We observed a dose dependent response among patients in the intervention group, suggesting that earlier intervention could be more effective. Earlier intervention might be achieved if the MT performed the six-clicks on potentially eligible patients.
The effects of hospitalization on mobility may be the most pronounced in the long term; one study found that 40% of hospitalized older patients manifested new ADL or IADL disability three months after discharge compared with 31% at discharge.7 Hospital-based mobility interventions may continue to affect subjects’ independence for weeks or months. In one RCT, an inpatient ambulation intervention improved mobility in the community one month after discharge.37 A hospital-based exercise program that included ambulation achieved better functional outcomes one month later.13 One RCT that combined inpatient exercise with outpatient care coordination also decreased readmission rates.34 We found that the intervention did not affect readmission.
This pilot study has several limitations. The sample size was small, and the findings need to be replicated in a larger randomized controlled trial. This is particularly important because the two study arms were not balanced in terms of their prehospital activity. After adjustment for prehospital activity, the differences in the step count in the intention-to-treat analysis were no longer significant. As we adjusted the intervention to hospital workflow, the intervention changed over time. The intention-to-treat analysis may therefore underestimate the effect of the intervention. This work provides a basis for future trial. Finally, discharge disposition depends on a complex interplay of factors, including social factors and preferences, which may not be affected by a mobility intervention.
In summary, an inhospital mobility protocol of attempting ambulation delivered by dedicated mobility technicians three times daily successfully increased the daily step counts and mobility scores of the patients. Studies with a larger sample size are needed to determine whether the proposed approach can affect length of hospital stay, discharge disposition, and overall cost of an episode of care.
Disclosures
Mary Stilphen reports consulting for CreCare and Adeo, which license and distribute AM-PAC short forms, including 6 clicks. All other authors report no conflicts of interest.
Funding
This study was supported by a Research Program Committee grant from the Cleveland Clinic.
1. National Center for Health Statistics. National Hospital Discharge Survey. 2010. PubMed
2. Corcoran PJ. Use it or lose it--the hazards of bed rest and inactivity. West J Med. 1991;154(5):536-538. PubMed
3. Gillick MR, Serrell NA, Gillick LS. Adverse consequences of hospitalization in the elderly. Soc Sci Med. 1982;16(10):1033-1038. doi: 10.1016/0277-9536(82)90175-7. PubMed
4. Hirsch CH, Sommers L, Olsen A, Mullen L, Winograd CH. The natural history of functional morbidity in hospitalized older patients. J Am Geriatr Soc. 1990;38(12):1296-1303. doi: 10.1111/j.1532-5415.1990.tb03451.x. PubMed
5. Zisberg A, Shadmi E, Sinoff G, Gur-Yaish N, Srulovici E, Admi H. Low mobility during hospitalization and functional decline in older adults. J Am Geriatr Soc. 2011;59(2):266-273. doi: 10.1111/j.1532-5415.2010.03276.x. PubMed
6. Heit JA, Silverstein MD, Mohr DN, Petterson TM, O’Fallon WM, Melton LJ, 3rd. Risk factors for deep vein thrombosis and pulmonary embolism: A population-based case-control study. Arch Intern Med. 2000;160(6):809-815. doi: 10.1067/mob.2001.107919. PubMed
7. Sager MA, Franke T, Inouye SK, et al. Functional outcomes of acute medical illness and hospitalization in older persons. Arch Intern Med. 1996;156(6):645-652. doi: 10.1001/archinte.1996.00440060067008. PubMed
8. Campbell AJ, Borrie MJ, Spears GF. Risk factors for falls in a community-based prospective study of people 70 years and older. J Gerontol. 1989;44(4):M112-M117. doi: 10.1093/geronj/44.4.M112. PubMed
9. Fisher SR, Kuo YF, Graham JE, Ottenbacher KJ, Ostir GV. Early ambulation and length of stay in older adults hospitalized for acute illness. Arch Intern Med. 2010;170(21):1942-1943. doi: 0.1001/archinternmed.2010.422. PubMed
10. Graf C. Functional decline in hospitalized older adults. Am J Nurs. 2006;106(1):58-67, quiz 67-58. PubMed
11. de Morton NA, Keating JL, Jeffs K. Exercise for acutely hospitalised older medical patients. Cochrane Database Syst Rev. 2007(1):CD005955. doi: 10.1002/14651858.CD005955. PubMed
12. Jones CT, Lowe AJ, MacGregor L, Brand CA, Tweddle N, Russell DM. A randomised controlled trial of an exercise intervention to reduce functional decline and health service utilisation in the hospitalised elderly. Australas J Ageing. 2006;25(3):126-133. doi: 10.1111/j.1741-6612.2006.00167.x.
13. Siebens H, Aronow H, Edwards D, Ghasemi Z. A randomized controlled trial of exercise to improve outcomes of acute hospitalization in older adults. J Am Geriatr Soc. 2000;48(12):1545-1552. doi: 10.1111/j.1532-5415.2000.tb03862.x. PubMed
14. Mundy LM, Leet TL, Darst K, Schnitzler MA, Dunagan WC. Early mobilization of patients hospitalized with community-acquired pneumonia. Chest. 2003;124(3):883-889. doi: 10.1378/chest.124.3.883. PubMed
15. Brown CJ, Redden DT, Flood KL, Allman RM. The underrecognized epidemic of low mobility during hospitalization of older adults. J Am Geriatr Soc. 2009;57(9):1660-1665. doi: 10.1111/j.1532-5415.2009.02393.x. PubMed
16. Callen BL, Mahoney JE, Grieves CB, Wells TJ, Enloe M. Frequency of hallway ambulation by hospitalized older adults on medical units of an academic hospital. Geriatr Nurs. 2004;25(4):212-217. doi: 10.1016/j.gerinurse.2004.06.016. PubMed
17. Fisher SR, Goodwin JS, Protas EJ, et al. Ambulatory activity of older adults hospitalized with acute medical illness. J Am Geriatr Soc. 2011;59(1):91-95. doi: 10.1111/j.1532-5415.2010.03202.x. PubMed
18. McVey LJ, Becker PM, Saltz CC, Feussner JR, Cohen HJ. Effect of a geriatric consultation team on functional status of elderly hospitalized patients: A randomized, controlled clinical trial. Ann Intern Med. 1989;110(1):79-84. doi: PubMed
19. Said CM, Morris ME, Woodward M, Churilov L, Bernhardt J. Enhancing physical activity in older adults receiving hospital based rehabilitation: A phase II feasibility study. BMC Geriatr. 2012;12:26. doi: 10.1186/1471-2318-12-26. PubMed
20. Timmerman RA. A mobility protocol for critically ill adults. Dimens Crit Care Nurs. 2007;26(5):175-179; quiz 180-171. doi: 10.1097/01.DCC.0000286816.40570.da. PubMed
21. Sallis R, Roddy-Sturm Y, Chijioke E, et al. Stepping toward discharge: Level of ambulation in hospitalized patients. J Hosp Med. 2015;10(6):384-389. doi: 10.1002/jhm.2343. PubMed
22. Inouye SK, Wagner DR, Acampora D, Horwitz RI, Cooney LM, Jr., Tinetii ME. A controlled trial of a nursing-centered intervention in hospitalized elderly medical patients: The yale geriatric care program. J Am Geriatr Soc. 1993;41(12):1353-1360. doi: 10.1111/j.1532-5415.1993.tb06487.x. PubMed
23. Kalisch BJ, Landstrom GL, Hinshaw AS. Missed nursing care: A concept analysis. J Adv Nurs. 2009;65(7):1509-1517. doi: 10.1111/j.1365-2648.2009.05027.x. PubMed
24. Kalisch BJ, Tschannen D, Lee H, Friese CR. Hospital variation in missed nursing care. Am J Med Qual. 2011;26(4):291-299. doi: 10.1177/1062860610395929. PubMed
25. Haley SM, Coster WJ, Andres PL, et al. Activity outcome measurement for postacute care. Med Care. 2004;42(1 Suppl):I49-161. doi: 10.1097/01.mlr.0000103520.43902.6c. PubMed
26. Jette DU, Stilphen M, Ranganathan VK, Passek SD, Frost FS, Jette AM. Validity of the AM-PAC “6-Clicks” inpatient daily activity and basic mobility short forms. Phys Ther. 2014;94(3):379-391. doi: 10.2522/ptj.20130199. PubMed
27. Jette DU, Stilphen M, Ranganathan VK, Passek S, Frost FS, Jette AM. Interrater reliability of AM-PAC 6-Clicks” basic mobility and daily activity short forms. Phys Ther. 2015;95(5):758-766. doi: 10.2522/ptj.20140174. PubMed
28. Jette DU, Stilphen M, Ranganathan VK, Passek SD, Frost FS, Jette AM. AM-PAC “6-Clicks” functional assessment scores predict acute care hospital discharge destination. Phys Ther. 2014;94(9):1252-1261. doi: 10.2522/ptj.20130359. PubMed
29. Menendez ME, Schumacher CS, Ring D, Freiberg AA, Rubash HE, Kwon YM. Does “6-Clicks” day 1 postoperative mobility score predict discharge disposition after total hip and knee arthroplasties? J Arthroplasty. 2016;31(9):1916-1920. doi: 10.1016/j.arth.2016.02.017. PubMed
30. Feehan LM, Geldman J, Sayre EC, et al. Accuracy of fitbit devices: Systematic review and narrative syntheses of quantitative data. JMIR Mhealth Uhealth. 2018;6(8):e10527-e10527. doi: 10.2196/10527. PubMed
31. Treacy D, Hassett L, Schurr K, Chagpar S, Paul SS, Sherrington C. Validity of different activity monitors to count steps in an inpatient rehabilitation setting. Phys Ther. 2017;97(5):581-588. doi: 10.1093/ptj/pzx010. PubMed
32. Agmon M, Zisberg A, Gil E, Rand D, Gur-Yaish N, Azriel M. Association between 900 steps a day and functional decline in older hospitalized patients. JAMA Intern Med. 2017;177(2):272-274. doi: 10.1001/jamainternmed.2016.7266. PubMed
33. Counsell SR, Holder CM, Liebenauer LL, et al. Effects of a multicomponent intervention on functional outcomes and process of care in hospitalized older patients: a randomized controlled trial of Acute Care for Elders (ACE) in a community hospital. J Am Geriatr Soc. 2000;48(12):1572-1581. doi: 10.1111/j.1532-5415.2000.tb03866.x. PubMed
34. Courtney M, Edwards H, Chang A, Parker A, Finlayson K, Hamilton K. Fewer emergency readmissions and better quality of life for older adults at risk of hospital readmission: a randomized controlled trial to determine the effectiveness of a 24-week exercise and telephone follow-up program. J Am Geriatr Soc. 2009;57(3):395-402. doi: 10.1111/j.1532-5415.2009.02138.x. PubMed
35. Landefeld CS, Palmer RM, Kresevic DM, Fortinsky RH, Kowal J. A randomized trial of care in a hospital medical unit especially designed to improve the functional outcomes of acutely ill older patients. N Engl J Med. 1995;332(20):1338-1344. doi: 10.1056/NEJM199505183322006. PubMed
36. Hoyer EH, Friedman M, Lavezza A, et al. Promoting mobility and reducing length of stay in hospitalized general medicine patients: A quality-improvement project. J Hosp Med. 2016;11(5):341-347. doi: 10.1002/jhm.2546. PubMed
37. Brown CJ, Foley KT, Lowman JD, Jr., et al. comparison of posthospitalization function and community mobility in hospital mobility program and usual care patients: a randomized clinical trial. JAMA Intern Med. 2016;176(7):921-927. doi: 10.1001/jamainternmed.2016.1870. PubMed
© 2019 Society of Hospital Medicine
Examining the Utility of 30-day Readmission Rates and Hospital Profiling in the Veterans Health Administration
Using methodology created by the Centers for Medicare & Medicaid Services (CMS), the Department of Veterans Affairs (VA) calculates and reports hospital performance measures for several key conditions, including acute myocardial infarction (AMI), heart failure (HF), and pneumonia.1 These measures are designed to benchmark individual hospitals against how average hospitals perform when caring for a similar case-mix index. Because readmissions to the hospital within 30-days of discharge are common and costly, this metric has garnered extensive attention in recent years.
To summarize the 30-day readmission metric, the VA utilizes the Strategic Analytics for Improvement and Learning (SAIL) system to present internally its findings to VA practitioners and leadership.2 The VA provides these data as a means to drive quality improvement and allow for comparison of individual hospitals’ performance across measures throughout the VA healthcare system. Since 2010, the VA began using and publicly reporting the CMS-derived 30-day Risk-Stratified Readmission Rate (RSRR) on the Hospital Compare website.3 Similar to CMS, the VA uses three years of combined data so that patients, providers, and other stakeholders can compare individual hospitals’ performance across these measures.1 In response to this, hospitals and healthcare organizations have implemented quality improvement and large-scale programmatic interventions in an attempt to improve quality around readmissions.4-6 A recent assessment on how hospitals within the Medicare fee-for-service program have responded to such reporting found large degrees of variability, with more than half of the participating institutions facing penalties due to greater-than-expected readmission rates.5 Although the VA utilizes the same CMS-derived model in its assessments and reporting, the variability and distribution around this metric are not publicly reported—thus making it difficult to ascertain how individual VA hospitals compare with one another. Without such information, individual facilities may not know how to benchmark the quality of their care to others, nor would the VA recognize which interventions addressing readmissions are working, and which are not. Although previous assessments of interinstitutional variance have been performed in Medicare populations,7 a focused analysis of such variance within the VA has yet to be performed.
In this study, we performed a multiyear assessment of the CMS-derived 30-day RSRR metric for AMI, HF, and pneumonia as a useful measure to drive VA quality improvement or distinguish VA facility performance based on its ability to detect interfacility variability.
METHODS
Data Source
We used VA administrative and Medicare claims data from 2010 to 2012. After identifying index hospitalizations to VA hospitals, we obtained patients’ respective inpatient Medicare claims data from the Medicare Provider Analysis and Review (MedPAR) and Outpatient files. All Medicare records were linked to VA records via scrambled Social Security numbers and were provided by the VA Information Resource Center. This study was approved by the San Francisco VA Medical Center Institutional Review Board.
Study Sample
Our cohort consisted of hospitalized VA beneficiary and Medicare fee-for-service patients who were aged ≥65 years and admitted to and discharged from a VA acute care center with a primary discharge diagnosis of AMI, HF, or pneumonia. These comorbidities were chosen as they are publicly reported and frequently used for interfacility comparisons. Because studies have found that inclusion of secondary payer data (ie, CMS data) may affect hospital-profiling outcomes, we included Medicare data on all available patients.8 We excluded hospitalizations that resulted in a transfer to another acute care facility and those admitted to observation status at their index admission. To ensure a full year of data for risk adjustment, beneficiaries were included only if they were enrolled in Medicare for 12 months prior to and including the date of the index admission.
Index hospitalizations were first identified using VA-only inpatient data similar to methods outlined by the CMS and endorsed by the National Quality Forum for Hospital Profiling.9 An index hospitalization was defined as an acute inpatient discharge between 2010 and 2012 in which the principal diagnosis was AMI, HF, or pneumonia. We excluded in-hospital deaths, discharges against medical advice, and--for the AMI cohort only--discharges on the same day as admission. Patients may have multiple admissions per year, but only admissions after 30 days of discharge from an index admission were eligible to be included as an additional index admission.
Outcomes
A readmission was defined as any unplanned rehospitalization to either non-VA or VA acute care facilities for any cause within 30 days of discharge from the index hospitalization. Readmissions to observation status or nonacute or rehabilitation units, such as skilled nursing facilities, were not included. Planned readmissions for elective procedures, such as elective chemotherapy and revascularization following an AMI index admission, were not considered as an outcome event.
Risk Standardization for 30-day Readmission
Using approaches developed by CMS,10-12 we calculated hospital-specific 30-day RSRRs for each VA. Briefly, the RSRR is a ratio of the number of predicted readmissions within 30 days of discharge to the expected number of readmissions within 30 days of hospital discharge, multiplied by the national unadjusted 30-day readmission rate. This measure calculates hospital-specific RSRRs using hierarchical logistic regression models, which account for clustering of patients within hospitals and risk-adjusting for differences in case-mix, during the assessed time periods.13 This approach simultaneously models two levels (patient and hospital) to account for the variance in patient outcomes within and between hospitals.14 At the patient level, the model uses the log odds of readmissions as the dependent variable and age and selected comorbidities as the independent variables. The second level models the hospital-specific intercepts. According to CMS guidelines, the analysis was limited to facilities with at least 25 patient admissions annually for each condition. All readmissions were attributed to the hospital that initially discharged the patient to a nonacute setting.
Analysis
We examined and reported the distribution of patient and clinical characteristics at the hospital level. For each condition, we determined the number of hospitals that had a sufficient number of admissions (n ≥ 25) to be included in the analyses. We calculated the mean, median, and interquartile range for the observed unadjusted readmission rates across all included hospitals.
Similar to methods used by CMS, we used one year of data in the VA to assess hospital quality and variation in facility performance. First, we calculated the 30-day RSRRs using one year (2012) of data. To assess how variability changed with higher facility volume (ie, more years included in the analysis), we also calculated the 30-day RSRRs using two and three years of data. For this, we identified and quantified the number of hospitals whose RSRRs were calculated as being above or below the national VA average (mean ± 95% CI). Specifically, we calculated the number and percentage of hospitals that were classified as either above (+95% CI) or below the national average (−95% CI) using data from all three time periods. All analyses were conducted using SAS Enterprise Guide, Version 7.1. The SAS statistical packages made available by the CMS Measure Team were used to calculate RSRRs.
RESULTS
Patient Characteristics
Patients were predominantly older males (98.3%). Among those hospitalized for AMI, most of them had a history of previous coronary artery bypass graft (CABG) (69.1%), acute coronary syndrome (ACS; 66.2%), or documented coronary atherosclerosis (89.8%). Similarly, patients admitted for HF had high rates of CABG (71.3%) and HF (94.6%), in addition to cardiac arrhythmias (69.3%) and diabetes (60.8%). Patients admitted with a diagnosis of pneumonia had high rates of CABG (61.9%), chronic obstructive pulmonary disease (COPD; 58.1%), and previous diagnosis of pneumonia (78.8%; Table 1). Patient characteristics for two and three years of data are presented in Supplementary Table 1.
VA Hospitals with Sufficient Volume to Be Included in Profiling Assessments
There were 146 acute-care hospitals in the VA. In 2012, 56 (38%) VA hospitals had at least 25 admissions for AMI, 102 (70%) hospitals had at least 25 admissions for CHF, and 106 (73%) hospitals had at least 25 admissions for pneumonia (Table 1) and therefore qualified for analysis based on CMS criteria for 30-day RSRR calculation. The study sample included 3,571 patients with AMI, 10,609 patients with CHF, and 10,191 patients with pneumonia.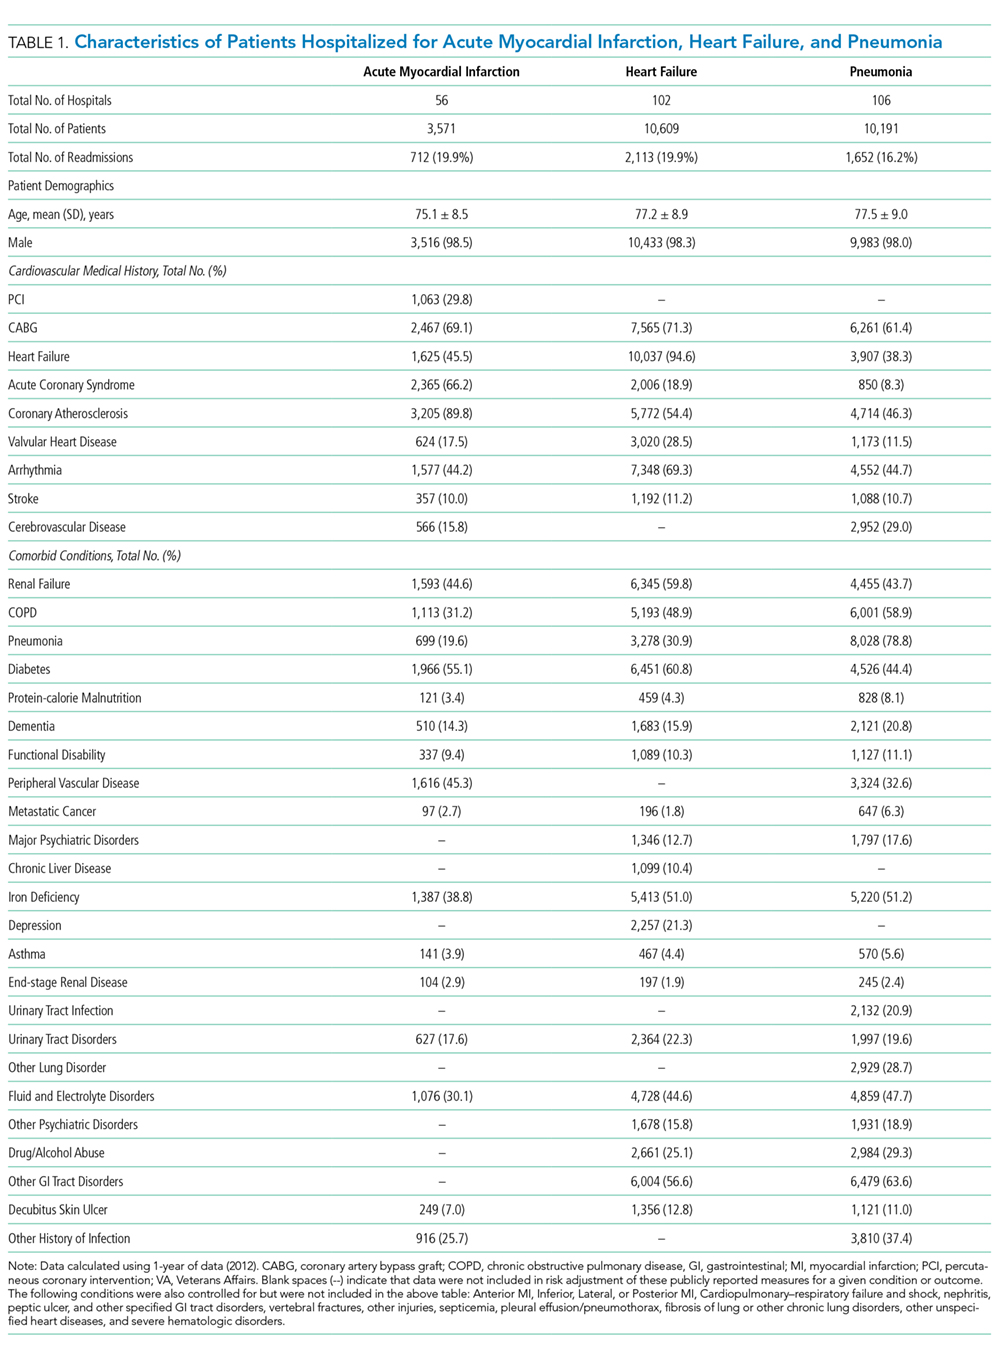
30-Day Readmission Rates
The mean observed readmission rates in 2012 were 20% (95% CI 19%-21%) among patients admitted for AMI, 20% (95% CI 19%-20%) for patients admitted with CHF, and 15% (95% CI 15%-16%) for patients admitted with pneumonia. No significant variation from these rates was noted following risk standardization across hospitals (Table 2). Observed and risk-standardized rates were also calculated for two and three years of data (Supplementary Table 2) but were not found to be grossly different when utilizing a single year of data.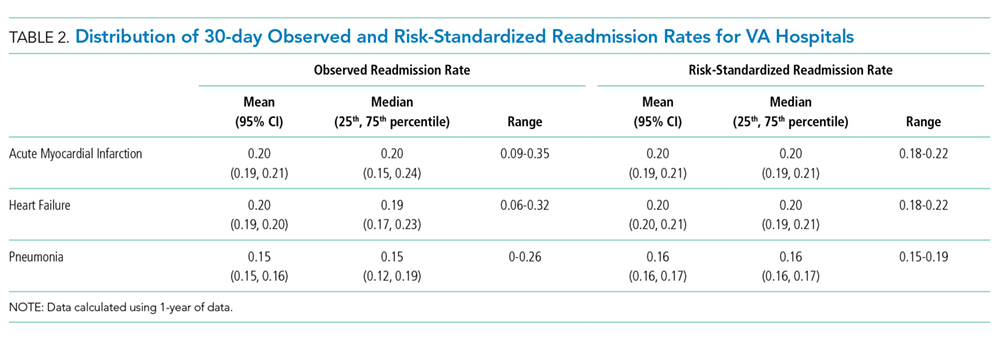
In 2012, two hospitals (2%) exhibited HF RSRRs worse than the national average (+95% CI), whereas no hospital demonstrated worse-than-average rates (+95% CI) for AMI or pneumonia (Table 3, Figure 1). Similarly, in 2012, only three hospitals had RSRRs better than the national average (−95% CI) for HF and pneumonia.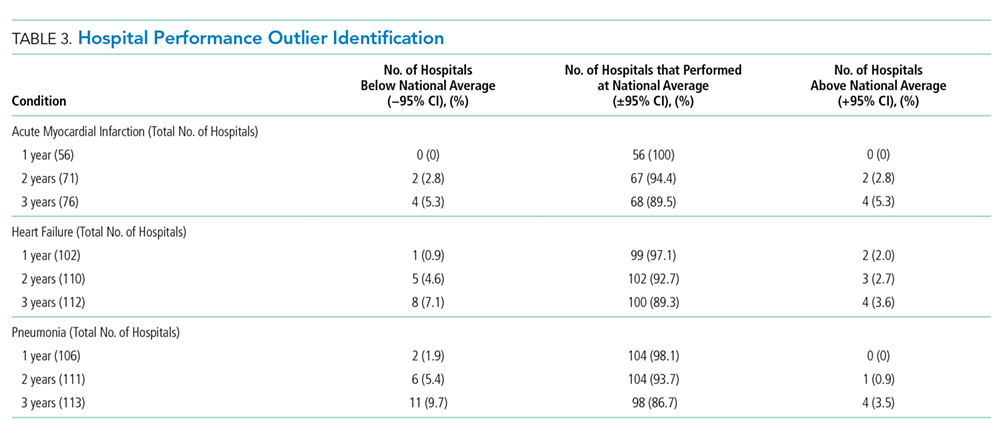
We combined data from three years to increase the volume of admissions per hospital. Even after combining three years of data across all three conditions, only four hospitals (range: 3.5%-5.3%) had RSRRs worse than the national average (+95% CI). However, four (5.3%), eight (7.1%), and 11 (9.7%) VA hospitals had RSRRs better than the national average (−95% CI).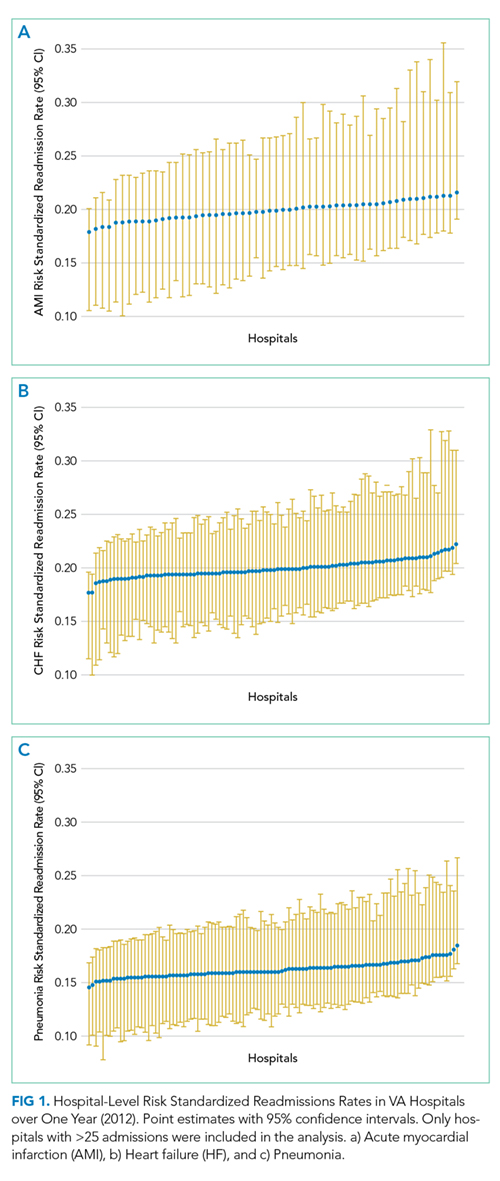
DISCUSSION
We found that the CMS-derived 30-day risk-stratified readmission metric for AMI, HF, and pneumonia showed little variation among VA hospitals. The lack of institutional 30-day readmission volume appears to be a fundamental limitation that subsequently requires multiple years of data to make this metric clinically meaningful. As the largest integrated healthcare system in the United States, the VA relies upon and makes large-scale programmatic decisions based on such performance data. The inability to detect meaningful interhospital variation in a timely manner suggests that the CMS-derived 30-day RSRR may not be a sensitive metric to distinguish facility performance or drive quality improvement initiatives within the VA.
First, we found it notable that among the 146 VA medical centers available for analysis,15 between 38% and 77% of hospitals qualified for evaluation when using CMS-based participation criteria—which excludes institutions with fewer than 25 episodes per year. Although this low degree of qualification for profiling was most dramatic when using one year of data (range: 38%-72%), we noted that it did not dramatically improve when we combined three years of data (range: 52%-77%). These findings act to highlight the population and systems differences between CMS and VA populations16 and further support the idea that CMS-derived models may not be optimized for use in the VA healthcare system.
Our findings are particularly relevant within the VA given the quarterly rate with which these data are reported within the VA SAIL scorecard.2 The VA designed SAIL for internal benchmarking to spotlight successful strategies of top performing institutions and promote high-quality, value-based care. Using one year of data, the minimum required to utilize CMS models, showed that quarterly feedback (ie, three months of data) may not be informative or useful given that few hospitals are able to differentiate themselves from the mean (±95% CI). Although the capacity to distinguish between high and low performers does improve by combining hospital admissions over three years, this is not a reasonable timeline for institutions to wait for quality comparisons. Furthermore, although the VA does present its data on CMS’s Hospital Compare website using three years of combined data, the variability and distribution of such results are not supplied.3
This lack of discriminability raises concerns about the ability to compare hospital performance between low- and high-volume institutions. Although these models function well in CMS settings with large patient volumes in which greater variability exists,5 they lose their capacity to discriminate when applied to low-volume settings such as the VA. Given that several hospitals in the US are small community hospitals with low patient volumes,17 this issue probably occurs in other non-VA settings. Although our study focuses on the VA, others have been able to compare VA and non-VA settings’ variation and distribution. For example, Nuti et al. explored the differences in 30-day RSRRs among hospitalized patients with AMI, HF, and pneumonia and similarly showed little variation, narrow distributions, and few outliers in the VA setting compared to those in the non-VA setting. For small patient volume institutions, including the VA, a focus on high-volume services, outcomes, and measures (ie, blood pressure control, medication reconciliation, etc.) may offer more discriminability between high- and low-performing facilities. For example, Patel et al. found that VA process measures in patients with HF (ie, beta-blocker and ACE-inhibitor use) can be used as valid quality measures as they exhibited consistent reliability over time and validity with adjusted mortality rates, whereas the 30-day RSRR did not.18
Our findings may have substantial financial, resource, and policy implications. Automatically developing and reporting measures created for the Medicare program in the VA may not be a good use of VA resources. In addition, facilities may react to these reported outcomes and expend local resources and finances to implement interventions to improve on a performance outcome whose measure is statistically no different than the vast majority of its comparators. Such events have been highlighted in the public media and have pointed to the fact that small changes in quality, or statistical errors themselves, can have large ramifications within the VA’s hospital rating system.19
These findings may also add to the discussion on whether public reporting of health and quality outcomes improves patient care. Since the CMS began public reporting on RSRRs in 2009, these rates have fallen for all three examined conditions (AMI, HF, and pneumonia),7,20,21 in addition to several other health outcomes.17 Although recent studies have suggested that these decreased rates have been driven by the CMS-sponsored Hospital Readmissions Reduction Program (HRRP),22 others have suggested that these findings are consistent with ongoing secular trends toward decreased readmissions and may not be completely explained by public reporting alone.23 Moreover, prior work has also found that readmissions may be strongly impacted by factors external to the hospital setting, such as patients’ social demographics (ie, household income, social isolation), that are not currently captured in risk-prediction models.24 Given the small variability we see in our data, public reporting within the VA is probably not beneficial, as only a small number of facilities are outliers based on RSRR.
Our study has several limitations. First, although we adapted the CMS model to the VA, we did not include gender in the model because >99% of all patient admissions were male. Second, we assessed only three medical conditions that were being tracked by both CMS and VA during this time period, and these outcomes may not be representative of other aspects of care and cannot be generalized to other medical conditions. Finally, more contemporary data could lead to differing results – though we note that no large-scale structural or policy changes addressing readmission rates have been implemented within the VA since our study period.
The results of this study suggest that the CMS-derived 30-day risk-stratified readmission metric for AMI, HF, and pneumonia may not have the capacity to properly detect interfacility variance and thus may not be an optimal quality indicator within the VA. As the VA and other healthcare systems continually strive to improve the quality of care they provide, they will require more accurate and timely metrics for which to index their performance.
Disclosures
The authors have nothing to disclose
1. Medicare C for, Baltimore MS 7500 SB, Usa M. VA Data. https://www.cms.gov/Medicare/Quality-Initiatives-Patient-Assessment-Instruments/HospitalQualityInits/VA-Data.html. Published October 19, 2016. Accessed July 15, 2018.
2. Strategic Analytics for Improvement and Learning (SAIL) - Quality of Care. https://www.va.gov/QUALITYOFCARE/measure-up/Strategic_Analytics_for_Improvement_and_Learning_SAIL.asp. Accessed July 15, 2018.
3. Snapshot. https://www.cms.gov/Medicare/Quality-Initiatives-Patient-Assessment-Instruments/HospitalQualityInits/VA-Data.html. Accessed September 10, 2018.
4. Bradley EH, Curry L, Horwitz LI, et al. Hospital strategies associated with 30-day readmission rates for patients with heart failure. Circ Cardiovasc Qual Outcomes. 2013;6(4):444-450. doi: 10.1161/CIRCOUTCOMES.111.000101. PubMed
5. Desai NR, Ross JS, Kwon JY, et al. Association between hospital penalty status under the hospital readmission reduction program and readmission rates for target and nontarget conditions. JAMA. 2016;316(24):2647-2656. doi: 10.1001/jama.2016.18533. PubMed
6. McIlvennan CK, Eapen ZJ, Allen LA. Hospital readmissions reduction program. Circulation. 2015;131(20):1796-1803. doi: 10.1161/CIRCULATIONAHA.114.010270. PubMed
7. Suter LG, Li S-X, Grady JN, et al. National patterns of risk-standardized mortality and readmission after hospitalization for acute myocardial infarction, heart failure, and pneumonia: update on publicly reported outcomes measures based on the 2013 release. J Gen Intern Med. 2014;29(10):1333-1340. doi: 10.1007/s11606-014-2862-5. PubMed
8. O’Brien WJ, Chen Q, Mull HJ, et al. What is the value of adding Medicare data in estimating VA hospital readmission rates? Health Serv Res. 2015;50(1):40-57. doi: 10.1111/1475-6773.12207. PubMed
9. NQF: All-Cause Admissions and Readmissions 2015-2017 Technical Report. https://www.qualityforum.org/Publications/2017/04/All-Cause_Admissions_and_Readmissions_2015-2017_Technical_Report.aspx. Accessed August 2, 2018.
10. Keenan PS, Normand S-LT, Lin Z, et al. An administrative claims measure suitable for profiling hospital performance on the basis of 30-day all-cause readmission rates among patients with heart failure. Circ Cardiovasc Qual Outcomes. 2008;1(1):29-37. doi: 10.1161/CIRCOUTCOMES.108.802686. PubMed
11. Krumholz HM, Lin Z, Drye EE, et al. An administrative claims measure suitable for profiling hospital performance based on 30-day all-cause readmission rates among patients with acute myocardial infarction. Circ Cardiovasc Qual Outcomes. 2011;4(2):243-252. doi: 10.1161/CIRCOUTCOMES.110.957498. PubMed
12. Lindenauer PK, Normand S-LT, Drye EE, et al. Development, validation, and results of a measure of 30-day readmission following hospitalization for pneumonia. J Hosp Med. 2011;6(3):142-150. doi: 10.1002/jhm.890. PubMed
13. Medicare C for, Baltimore MS 7500 SB, Usa M. OutcomeMeasures. https://www.cms.gov/Medicare/Quality-Initiatives-Patient-Assessment-Instruments/HospitalQualityInits/OutcomeMeasures.html. Published October 13, 2017. Accessed July 19, 2018.
14. Nuti SV, Qin L, Rumsfeld JS, et al. Association of admission to Veterans Affairs hospitals vs non-Veterans Affairs hospitals with mortality and readmission rates among older hospitalized with acute myocardial infarction, heart failure, or pneumonia. JAMA. 2016;315(6):582-592. doi: 10.1001/jama.2016.0278. PubMed
15. Solutions VW. Veterans Health Administration - Locations. https://www.va.gov/directory/guide/division.asp?dnum=1. Accessed September 13, 2018.
16. Duan-Porter W (Denise), Martinson BC, Taylor B, et al. Evidence Review: Social Determinants of Health for Veterans. Washington (DC): Department of Veterans Affairs (US); 2017. http://www.ncbi.nlm.nih.gov/books/NBK488134/. Accessed June 13, 2018.
17. Fast Facts on U.S. Hospitals, 2018 | AHA. American Hospital Association. https://www.aha.org/statistics/fast-facts-us-hospitals. Accessed September 5, 2018.
18. Patel J, Sandhu A, Parizo J, Moayedi Y, Fonarow GC, Heidenreich PA. Validity of performance and outcome measures for heart failure. Circ Heart Fail. 2018;11(9):e005035. PubMed
19. Philipps D. Canceled Operations. Unsterile Tools. The V.A. Gave This Hospital 5 Stars. The New York Times. https://www.nytimes.com/2018/11/01/us/veterans-hospitals-rating-system-star.html. Published November 3, 2018. Accessed November 19, 2018.
20. DeVore AD, Hammill BG, Hardy NC, Eapen ZJ, Peterson ED, Hernandez AF. Has public reporting of hospital readmission rates affected patient outcomes?: Analysis of Medicare claims data. J Am Coll Cardiol. 2016;67(8):963-972. doi: 10.1016/j.jacc.2015.12.037. PubMed
21. Wasfy JH, Zigler CM, Choirat C, Wang Y, Dominici F, Yeh RW. Readmission rates after passage of the hospital readmissions reduction program: a pre-post analysis. Ann Intern Med. 2017;166(5):324-331. doi: 10.7326/M16-0185. PubMed
22. Medicare C for, Baltimore MS 7500 SB, Usa M. Hospital Readmission Reduction Program. https://www.cms.gov/Medicare/Quality-Initiatives-Patient-Assessment-Instruments/Value-Based-Programs/HRRP/Hospital-Readmission-Reduction-Program.html. Published March 26, 2018. Accessed July 19, 2018.
23. Radford MJ. Does public reporting improve care? J Am Coll Cardiol. 2016;67(8):973-975. doi: 10.1016/j.jacc.2015.12.038. PubMed
24. Barnett ML, Hsu J, McWilliams JM. Patient characteristics and differences in hospital readmission rates. JAMA Intern Med. 2015;175(11):1803-1812. doi: 10.1001/jamainternmed.2015.4660. PubMed
Using methodology created by the Centers for Medicare & Medicaid Services (CMS), the Department of Veterans Affairs (VA) calculates and reports hospital performance measures for several key conditions, including acute myocardial infarction (AMI), heart failure (HF), and pneumonia.1 These measures are designed to benchmark individual hospitals against how average hospitals perform when caring for a similar case-mix index. Because readmissions to the hospital within 30-days of discharge are common and costly, this metric has garnered extensive attention in recent years.
To summarize the 30-day readmission metric, the VA utilizes the Strategic Analytics for Improvement and Learning (SAIL) system to present internally its findings to VA practitioners and leadership.2 The VA provides these data as a means to drive quality improvement and allow for comparison of individual hospitals’ performance across measures throughout the VA healthcare system. Since 2010, the VA began using and publicly reporting the CMS-derived 30-day Risk-Stratified Readmission Rate (RSRR) on the Hospital Compare website.3 Similar to CMS, the VA uses three years of combined data so that patients, providers, and other stakeholders can compare individual hospitals’ performance across these measures.1 In response to this, hospitals and healthcare organizations have implemented quality improvement and large-scale programmatic interventions in an attempt to improve quality around readmissions.4-6 A recent assessment on how hospitals within the Medicare fee-for-service program have responded to such reporting found large degrees of variability, with more than half of the participating institutions facing penalties due to greater-than-expected readmission rates.5 Although the VA utilizes the same CMS-derived model in its assessments and reporting, the variability and distribution around this metric are not publicly reported—thus making it difficult to ascertain how individual VA hospitals compare with one another. Without such information, individual facilities may not know how to benchmark the quality of their care to others, nor would the VA recognize which interventions addressing readmissions are working, and which are not. Although previous assessments of interinstitutional variance have been performed in Medicare populations,7 a focused analysis of such variance within the VA has yet to be performed.
In this study, we performed a multiyear assessment of the CMS-derived 30-day RSRR metric for AMI, HF, and pneumonia as a useful measure to drive VA quality improvement or distinguish VA facility performance based on its ability to detect interfacility variability.
METHODS
Data Source
We used VA administrative and Medicare claims data from 2010 to 2012. After identifying index hospitalizations to VA hospitals, we obtained patients’ respective inpatient Medicare claims data from the Medicare Provider Analysis and Review (MedPAR) and Outpatient files. All Medicare records were linked to VA records via scrambled Social Security numbers and were provided by the VA Information Resource Center. This study was approved by the San Francisco VA Medical Center Institutional Review Board.
Study Sample
Our cohort consisted of hospitalized VA beneficiary and Medicare fee-for-service patients who were aged ≥65 years and admitted to and discharged from a VA acute care center with a primary discharge diagnosis of AMI, HF, or pneumonia. These comorbidities were chosen as they are publicly reported and frequently used for interfacility comparisons. Because studies have found that inclusion of secondary payer data (ie, CMS data) may affect hospital-profiling outcomes, we included Medicare data on all available patients.8 We excluded hospitalizations that resulted in a transfer to another acute care facility and those admitted to observation status at their index admission. To ensure a full year of data for risk adjustment, beneficiaries were included only if they were enrolled in Medicare for 12 months prior to and including the date of the index admission.
Index hospitalizations were first identified using VA-only inpatient data similar to methods outlined by the CMS and endorsed by the National Quality Forum for Hospital Profiling.9 An index hospitalization was defined as an acute inpatient discharge between 2010 and 2012 in which the principal diagnosis was AMI, HF, or pneumonia. We excluded in-hospital deaths, discharges against medical advice, and--for the AMI cohort only--discharges on the same day as admission. Patients may have multiple admissions per year, but only admissions after 30 days of discharge from an index admission were eligible to be included as an additional index admission.
Outcomes
A readmission was defined as any unplanned rehospitalization to either non-VA or VA acute care facilities for any cause within 30 days of discharge from the index hospitalization. Readmissions to observation status or nonacute or rehabilitation units, such as skilled nursing facilities, were not included. Planned readmissions for elective procedures, such as elective chemotherapy and revascularization following an AMI index admission, were not considered as an outcome event.
Risk Standardization for 30-day Readmission
Using approaches developed by CMS,10-12 we calculated hospital-specific 30-day RSRRs for each VA. Briefly, the RSRR is a ratio of the number of predicted readmissions within 30 days of discharge to the expected number of readmissions within 30 days of hospital discharge, multiplied by the national unadjusted 30-day readmission rate. This measure calculates hospital-specific RSRRs using hierarchical logistic regression models, which account for clustering of patients within hospitals and risk-adjusting for differences in case-mix, during the assessed time periods.13 This approach simultaneously models two levels (patient and hospital) to account for the variance in patient outcomes within and between hospitals.14 At the patient level, the model uses the log odds of readmissions as the dependent variable and age and selected comorbidities as the independent variables. The second level models the hospital-specific intercepts. According to CMS guidelines, the analysis was limited to facilities with at least 25 patient admissions annually for each condition. All readmissions were attributed to the hospital that initially discharged the patient to a nonacute setting.
Analysis
We examined and reported the distribution of patient and clinical characteristics at the hospital level. For each condition, we determined the number of hospitals that had a sufficient number of admissions (n ≥ 25) to be included in the analyses. We calculated the mean, median, and interquartile range for the observed unadjusted readmission rates across all included hospitals.
Similar to methods used by CMS, we used one year of data in the VA to assess hospital quality and variation in facility performance. First, we calculated the 30-day RSRRs using one year (2012) of data. To assess how variability changed with higher facility volume (ie, more years included in the analysis), we also calculated the 30-day RSRRs using two and three years of data. For this, we identified and quantified the number of hospitals whose RSRRs were calculated as being above or below the national VA average (mean ± 95% CI). Specifically, we calculated the number and percentage of hospitals that were classified as either above (+95% CI) or below the national average (−95% CI) using data from all three time periods. All analyses were conducted using SAS Enterprise Guide, Version 7.1. The SAS statistical packages made available by the CMS Measure Team were used to calculate RSRRs.
RESULTS
Patient Characteristics
Patients were predominantly older males (98.3%). Among those hospitalized for AMI, most of them had a history of previous coronary artery bypass graft (CABG) (69.1%), acute coronary syndrome (ACS; 66.2%), or documented coronary atherosclerosis (89.8%). Similarly, patients admitted for HF had high rates of CABG (71.3%) and HF (94.6%), in addition to cardiac arrhythmias (69.3%) and diabetes (60.8%). Patients admitted with a diagnosis of pneumonia had high rates of CABG (61.9%), chronic obstructive pulmonary disease (COPD; 58.1%), and previous diagnosis of pneumonia (78.8%; Table 1). Patient characteristics for two and three years of data are presented in Supplementary Table 1.
VA Hospitals with Sufficient Volume to Be Included in Profiling Assessments
There were 146 acute-care hospitals in the VA. In 2012, 56 (38%) VA hospitals had at least 25 admissions for AMI, 102 (70%) hospitals had at least 25 admissions for CHF, and 106 (73%) hospitals had at least 25 admissions for pneumonia (Table 1) and therefore qualified for analysis based on CMS criteria for 30-day RSRR calculation. The study sample included 3,571 patients with AMI, 10,609 patients with CHF, and 10,191 patients with pneumonia.
30-Day Readmission Rates
The mean observed readmission rates in 2012 were 20% (95% CI 19%-21%) among patients admitted for AMI, 20% (95% CI 19%-20%) for patients admitted with CHF, and 15% (95% CI 15%-16%) for patients admitted with pneumonia. No significant variation from these rates was noted following risk standardization across hospitals (Table 2). Observed and risk-standardized rates were also calculated for two and three years of data (Supplementary Table 2) but were not found to be grossly different when utilizing a single year of data.
In 2012, two hospitals (2%) exhibited HF RSRRs worse than the national average (+95% CI), whereas no hospital demonstrated worse-than-average rates (+95% CI) for AMI or pneumonia (Table 3, Figure 1). Similarly, in 2012, only three hospitals had RSRRs better than the national average (−95% CI) for HF and pneumonia.
We combined data from three years to increase the volume of admissions per hospital. Even after combining three years of data across all three conditions, only four hospitals (range: 3.5%-5.3%) had RSRRs worse than the national average (+95% CI). However, four (5.3%), eight (7.1%), and 11 (9.7%) VA hospitals had RSRRs better than the national average (−95% CI).
DISCUSSION
We found that the CMS-derived 30-day risk-stratified readmission metric for AMI, HF, and pneumonia showed little variation among VA hospitals. The lack of institutional 30-day readmission volume appears to be a fundamental limitation that subsequently requires multiple years of data to make this metric clinically meaningful. As the largest integrated healthcare system in the United States, the VA relies upon and makes large-scale programmatic decisions based on such performance data. The inability to detect meaningful interhospital variation in a timely manner suggests that the CMS-derived 30-day RSRR may not be a sensitive metric to distinguish facility performance or drive quality improvement initiatives within the VA.
First, we found it notable that among the 146 VA medical centers available for analysis,15 between 38% and 77% of hospitals qualified for evaluation when using CMS-based participation criteria—which excludes institutions with fewer than 25 episodes per year. Although this low degree of qualification for profiling was most dramatic when using one year of data (range: 38%-72%), we noted that it did not dramatically improve when we combined three years of data (range: 52%-77%). These findings act to highlight the population and systems differences between CMS and VA populations16 and further support the idea that CMS-derived models may not be optimized for use in the VA healthcare system.
Our findings are particularly relevant within the VA given the quarterly rate with which these data are reported within the VA SAIL scorecard.2 The VA designed SAIL for internal benchmarking to spotlight successful strategies of top performing institutions and promote high-quality, value-based care. Using one year of data, the minimum required to utilize CMS models, showed that quarterly feedback (ie, three months of data) may not be informative or useful given that few hospitals are able to differentiate themselves from the mean (±95% CI). Although the capacity to distinguish between high and low performers does improve by combining hospital admissions over three years, this is not a reasonable timeline for institutions to wait for quality comparisons. Furthermore, although the VA does present its data on CMS’s Hospital Compare website using three years of combined data, the variability and distribution of such results are not supplied.3
This lack of discriminability raises concerns about the ability to compare hospital performance between low- and high-volume institutions. Although these models function well in CMS settings with large patient volumes in which greater variability exists,5 they lose their capacity to discriminate when applied to low-volume settings such as the VA. Given that several hospitals in the US are small community hospitals with low patient volumes,17 this issue probably occurs in other non-VA settings. Although our study focuses on the VA, others have been able to compare VA and non-VA settings’ variation and distribution. For example, Nuti et al. explored the differences in 30-day RSRRs among hospitalized patients with AMI, HF, and pneumonia and similarly showed little variation, narrow distributions, and few outliers in the VA setting compared to those in the non-VA setting. For small patient volume institutions, including the VA, a focus on high-volume services, outcomes, and measures (ie, blood pressure control, medication reconciliation, etc.) may offer more discriminability between high- and low-performing facilities. For example, Patel et al. found that VA process measures in patients with HF (ie, beta-blocker and ACE-inhibitor use) can be used as valid quality measures as they exhibited consistent reliability over time and validity with adjusted mortality rates, whereas the 30-day RSRR did not.18
Our findings may have substantial financial, resource, and policy implications. Automatically developing and reporting measures created for the Medicare program in the VA may not be a good use of VA resources. In addition, facilities may react to these reported outcomes and expend local resources and finances to implement interventions to improve on a performance outcome whose measure is statistically no different than the vast majority of its comparators. Such events have been highlighted in the public media and have pointed to the fact that small changes in quality, or statistical errors themselves, can have large ramifications within the VA’s hospital rating system.19
These findings may also add to the discussion on whether public reporting of health and quality outcomes improves patient care. Since the CMS began public reporting on RSRRs in 2009, these rates have fallen for all three examined conditions (AMI, HF, and pneumonia),7,20,21 in addition to several other health outcomes.17 Although recent studies have suggested that these decreased rates have been driven by the CMS-sponsored Hospital Readmissions Reduction Program (HRRP),22 others have suggested that these findings are consistent with ongoing secular trends toward decreased readmissions and may not be completely explained by public reporting alone.23 Moreover, prior work has also found that readmissions may be strongly impacted by factors external to the hospital setting, such as patients’ social demographics (ie, household income, social isolation), that are not currently captured in risk-prediction models.24 Given the small variability we see in our data, public reporting within the VA is probably not beneficial, as only a small number of facilities are outliers based on RSRR.
Our study has several limitations. First, although we adapted the CMS model to the VA, we did not include gender in the model because >99% of all patient admissions were male. Second, we assessed only three medical conditions that were being tracked by both CMS and VA during this time period, and these outcomes may not be representative of other aspects of care and cannot be generalized to other medical conditions. Finally, more contemporary data could lead to differing results – though we note that no large-scale structural or policy changes addressing readmission rates have been implemented within the VA since our study period.
The results of this study suggest that the CMS-derived 30-day risk-stratified readmission metric for AMI, HF, and pneumonia may not have the capacity to properly detect interfacility variance and thus may not be an optimal quality indicator within the VA. As the VA and other healthcare systems continually strive to improve the quality of care they provide, they will require more accurate and timely metrics for which to index their performance.
Disclosures
The authors have nothing to disclose
1. Medicare C for, Baltimore MS 7500 SB, Usa M. VA Data. https://www.cms.gov/Medicare/Quality-Initiatives-Patient-Assessment-Instruments/HospitalQualityInits/VA-Data.html. Published October 19, 2016. Accessed July 15, 2018.
2. Strategic Analytics for Improvement and Learning (SAIL) - Quality of Care. https://www.va.gov/QUALITYOFCARE/measure-up/Strategic_Analytics_for_Improvement_and_Learning_SAIL.asp. Accessed July 15, 2018.
3. Snapshot. https://www.cms.gov/Medicare/Quality-Initiatives-Patient-Assessment-Instruments/HospitalQualityInits/VA-Data.html. Accessed September 10, 2018.
4. Bradley EH, Curry L, Horwitz LI, et al. Hospital strategies associated with 30-day readmission rates for patients with heart failure. Circ Cardiovasc Qual Outcomes. 2013;6(4):444-450. doi: 10.1161/CIRCOUTCOMES.111.000101. PubMed
5. Desai NR, Ross JS, Kwon JY, et al. Association between hospital penalty status under the hospital readmission reduction program and readmission rates for target and nontarget conditions. JAMA. 2016;316(24):2647-2656. doi: 10.1001/jama.2016.18533. PubMed
6. McIlvennan CK, Eapen ZJ, Allen LA. Hospital readmissions reduction program. Circulation. 2015;131(20):1796-1803. doi: 10.1161/CIRCULATIONAHA.114.010270. PubMed
7. Suter LG, Li S-X, Grady JN, et al. National patterns of risk-standardized mortality and readmission after hospitalization for acute myocardial infarction, heart failure, and pneumonia: update on publicly reported outcomes measures based on the 2013 release. J Gen Intern Med. 2014;29(10):1333-1340. doi: 10.1007/s11606-014-2862-5. PubMed
8. O’Brien WJ, Chen Q, Mull HJ, et al. What is the value of adding Medicare data in estimating VA hospital readmission rates? Health Serv Res. 2015;50(1):40-57. doi: 10.1111/1475-6773.12207. PubMed
9. NQF: All-Cause Admissions and Readmissions 2015-2017 Technical Report. https://www.qualityforum.org/Publications/2017/04/All-Cause_Admissions_and_Readmissions_2015-2017_Technical_Report.aspx. Accessed August 2, 2018.
10. Keenan PS, Normand S-LT, Lin Z, et al. An administrative claims measure suitable for profiling hospital performance on the basis of 30-day all-cause readmission rates among patients with heart failure. Circ Cardiovasc Qual Outcomes. 2008;1(1):29-37. doi: 10.1161/CIRCOUTCOMES.108.802686. PubMed
11. Krumholz HM, Lin Z, Drye EE, et al. An administrative claims measure suitable for profiling hospital performance based on 30-day all-cause readmission rates among patients with acute myocardial infarction. Circ Cardiovasc Qual Outcomes. 2011;4(2):243-252. doi: 10.1161/CIRCOUTCOMES.110.957498. PubMed
12. Lindenauer PK, Normand S-LT, Drye EE, et al. Development, validation, and results of a measure of 30-day readmission following hospitalization for pneumonia. J Hosp Med. 2011;6(3):142-150. doi: 10.1002/jhm.890. PubMed
13. Medicare C for, Baltimore MS 7500 SB, Usa M. OutcomeMeasures. https://www.cms.gov/Medicare/Quality-Initiatives-Patient-Assessment-Instruments/HospitalQualityInits/OutcomeMeasures.html. Published October 13, 2017. Accessed July 19, 2018.
14. Nuti SV, Qin L, Rumsfeld JS, et al. Association of admission to Veterans Affairs hospitals vs non-Veterans Affairs hospitals with mortality and readmission rates among older hospitalized with acute myocardial infarction, heart failure, or pneumonia. JAMA. 2016;315(6):582-592. doi: 10.1001/jama.2016.0278. PubMed
15. Solutions VW. Veterans Health Administration - Locations. https://www.va.gov/directory/guide/division.asp?dnum=1. Accessed September 13, 2018.
16. Duan-Porter W (Denise), Martinson BC, Taylor B, et al. Evidence Review: Social Determinants of Health for Veterans. Washington (DC): Department of Veterans Affairs (US); 2017. http://www.ncbi.nlm.nih.gov/books/NBK488134/. Accessed June 13, 2018.
17. Fast Facts on U.S. Hospitals, 2018 | AHA. American Hospital Association. https://www.aha.org/statistics/fast-facts-us-hospitals. Accessed September 5, 2018.
18. Patel J, Sandhu A, Parizo J, Moayedi Y, Fonarow GC, Heidenreich PA. Validity of performance and outcome measures for heart failure. Circ Heart Fail. 2018;11(9):e005035. PubMed
19. Philipps D. Canceled Operations. Unsterile Tools. The V.A. Gave This Hospital 5 Stars. The New York Times. https://www.nytimes.com/2018/11/01/us/veterans-hospitals-rating-system-star.html. Published November 3, 2018. Accessed November 19, 2018.
20. DeVore AD, Hammill BG, Hardy NC, Eapen ZJ, Peterson ED, Hernandez AF. Has public reporting of hospital readmission rates affected patient outcomes?: Analysis of Medicare claims data. J Am Coll Cardiol. 2016;67(8):963-972. doi: 10.1016/j.jacc.2015.12.037. PubMed
21. Wasfy JH, Zigler CM, Choirat C, Wang Y, Dominici F, Yeh RW. Readmission rates after passage of the hospital readmissions reduction program: a pre-post analysis. Ann Intern Med. 2017;166(5):324-331. doi: 10.7326/M16-0185. PubMed
22. Medicare C for, Baltimore MS 7500 SB, Usa M. Hospital Readmission Reduction Program. https://www.cms.gov/Medicare/Quality-Initiatives-Patient-Assessment-Instruments/Value-Based-Programs/HRRP/Hospital-Readmission-Reduction-Program.html. Published March 26, 2018. Accessed July 19, 2018.
23. Radford MJ. Does public reporting improve care? J Am Coll Cardiol. 2016;67(8):973-975. doi: 10.1016/j.jacc.2015.12.038. PubMed
24. Barnett ML, Hsu J, McWilliams JM. Patient characteristics and differences in hospital readmission rates. JAMA Intern Med. 2015;175(11):1803-1812. doi: 10.1001/jamainternmed.2015.4660. PubMed
© 2019 Society of Hospital Medicine
Care Transitions Program for High-Risk Frail Older Adults is Most Beneficial for Patients with Cognitive Impairment
Unplanned hospital admissions and readmissions have become a major focus of efforts to improve the value of healthcare given that these potentially preventable events exert substantial burden on patients, caregivers, health systems, and the economy.1 The percentage of patients who are rehospitalized within 30 days have decreased from 20%-21% at the start of the Accountable Care Act and readmission penalties to approximately 18%.2-5 Rehospitalization rates are 33% at 90 days and approach 40% at six months.6,7 Readmissions cost Medicare more than $26 billion annually,4 with one in five Medicare beneficiaries readmitted within 30 days of hospital discharge.8 Centers for Medicare and Medicaid Services and other payers use condition-specific and all-cause 30-day unplanned readmission rates and potentially preventable admissions among patients with complex or multiple comorbidities for public reporting, value-based purchasing, and performance-based reimbursement.9,10 Consequently, medical groups and hospitals have begun to place an increasing emphasis on improving the transitions of care following hospitalization with the goal of reducing unplanned readmissions.11 Care transitions programs have been shown to decrease readmission rates, mortality, and emergency department (ED) visits.12
Care transitions programs vary greatly in their scope of intervention and target groups, as well as in their efficacy in reducing readmissions.13,14 The Mayo Clinic Care Transition Program, hereafter referred to as CTP, was launched in 2011. This program was modeled after other successful programs and involves home visits by a nurse practitioner (NP) and telephonic support and triage provided by a registered nurse (RN). It is offered to high-risk community-dwelling patients during their hospitalization and begins within a week of hospital discharge.
Although the CTP reduces 30-day readmissions from 20% to 17%,7 it is a highly resource-intensive, multimodal, multidisciplinary program. Moreover, whether some components of the CTP are more critical than others remains unknown. Prior studies that examined the individual components of successful CTPs have suggested that a multipronged approach that includes close patient and caregiver support is most predictive of program efficacy.13 Long-term program sustainability would benefit from optimization of the most critical components of the program while reducing or eliminating resource-intensive factors that have negligible effects on program success. We therefore examined our CTP to identify whether and which program components are most critical for preventing 30-day readmissions and whether any patient characteristics contribute risk within this complex population.
METHODS
Study Design and Setting
This study is a retrospective cohort study of patients who were enrolled in the care transitions program of Mayo Clinic Rochester during the period January 1, 2010 to June 30, 2013. Patient demographic and clinical data were obtained from electronic health records (EHR), and information regarding CTP processes and interventions was obtained from a prospectively maintained program database. The study complied with the principles of the Declaration of Helsinki and was approved by the Mayo Clinic Institutional Review Board.
Objectives
The study aimed to describe the performance and utilization of a multidisciplinary care transitions program that has been successful in reducing readmissions for high-risk patients. The study also sought to identify patient and/or program factors associated with failure to prevent readmission within 30 days of program enrollment.
Population
Patients who were enrolled in the CTP following hospital discharge and seen for a posthospital in-home visit prior to hospital readmission (for those readmitted) were included. Patients discharged to a skilled nursing facility were excluded. Patients were eligible for CTP enrollment if they were hospitalized for any cause, community dwelling (including assisted living) prior to hospitalization, and ≥60 years old with an Elder Risk Assessment (ERA) score ≥16.7 The ERA incorporates information regarding previous hospital days, age, and comorbid health burden and has been shown to predict 30-day readmissions, mortality, and critical illness (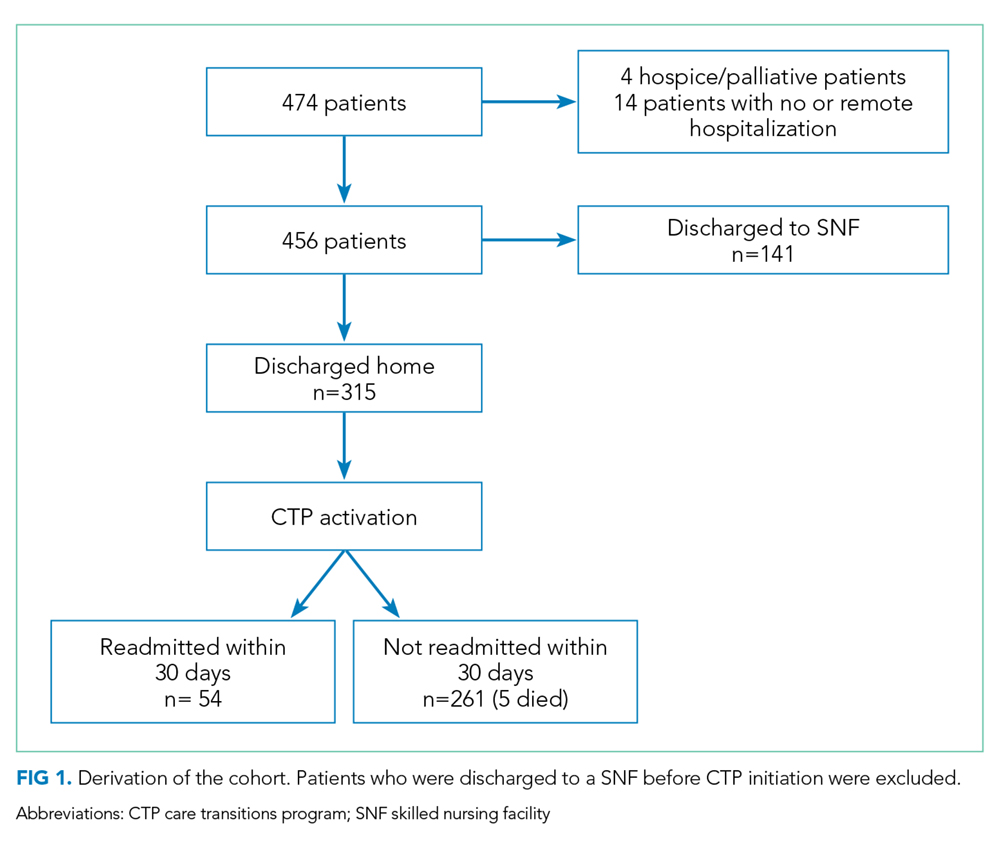
Intervention
Detailed descriptions of the CTP have been previously published.7,17 Patients meeting enrollment criteria are enrolled into the CTP by a RN prior to or immediately after hospital discharge. The patient is then seen at home within one to five business days of discharge and again the following week by a NP who performs medication reconciliation; chronic illness management; and acute illness, mobility, safety, and cognition assessments. The NP also provides patient education on self-care and advance care planning. Patient and caregiver support and liaisons with community resources are provided. Home visits by an NP or MD are continued as needed for at least one month. A RN case manager performs weekly phone calls to assess changes in the patient’s clinical status and is available for phone triage of acute health issues. An interdisciplinary team composed of MDs, NPs, RNs, and pharmacists review patient management at weekly meetings. Although after-hours or weekend coverage for home visits are unavailable, an on-call primary care physician is available by phone at all times.
Primary Outcome
The primary outcome was all-cause hospital readmission within 30 days of the first CTP home visit, indicating successful program enrollment. Hospitalization was determined on the basis of billing codes from Mayo Clinic hospitals; this approach is 99% reliable in detecting readmissions for this population.18
Secondary Outcome Measures
Secondary outcome measures included six-month mortality and hospitalizations, as well as the number of hospital and ICU days and home, ED, primary care, and specialty office visits within 180 days after index hospitalizations as per the EHR. ED visits were counted only when they did not result in a hospital admission.
Independent Variables
Patient characteristics and clinical variables were retrieved from the EHR and included patient age, sex, and marital status. Comorbidities, ERA score,19 and Charlson comorbidity index (CCI)20 within two years of program enrollment were determined by using ICD-9 billing codes. The frequencies of primary care and specialty visits within six months of the index hospitalization were also ascertained using the EHR. Mobility limitations and cognitive impairment were categorized as binary variables (yes/no) and were assessed at the first home visit by the NP. The presence of mobility limitations was defined as a Barthel’s score of <7521,22 or Timed up and Go time of >20 seconds.23 Cognitive impairment was established as Kokmen below the normal cutoff for patient’s age group,24 Mini-Cog ≤2,25or AD8 ≥2.26 If these measures were not specifically documented during the first visit, clinical notes were queried for the description of pertinent cognitive and/or mobility limitations. Dementia diagnosis billing codes (ICD9 Code 290.*) were also included. High medication use was defined as >14 given the reported average medication number ranges from 8-13 in this population.27
As previously published, fidelity measures were abstracted from clinical notes by a trained nurse abstractor within 30 days of program enrollment and prior to a readmission.7 The five program fidelity measures included medication reconciliation, home service evaluation, advanced directives discussion, action plan for acute and chronic disease, safety plan, and discussion of community resources. The presence of advanced care planning was determined on the basis of visit medical notes and/or change of code status within the EHR, the identification or scanning of written advanced directives or “provider order for life-sustaining treatment,” and documentation of the discussion of resuscitation status. It was abstracted in duplicate by a nurse abstractor with physician adjudication for disagreement. Moreover, whether the initial visit met the goal of being within five days of discharge was determined by using billing data.
Analysis
The contribution of each independent variable to 30-day readmission was first directly assessed by using a univariate logistic regression model. Five patients died within 30 days without being admitted. These deaths, however, were not censored given that home death (as opposed to hospital death) was considered a positive outcome of the CTP. Multivariable modeling was performed through log rank test with backwards elimination and included all independent variables with P < .05. Variables with P values between .05 and >.1 were tested for interaction with age and sex. Age was categorized as <80 or ≥80 years. The length of hospital stay was categorized as <3 days (not qualifying for a Medicare skilled nursing facility), 3-13 days, or ≥14 days.
This study had 30% power to detect a reduction of 5% in the rates of hospital admissions; 5% is the median absolute risk reduction reported by previous randomized studies on care transitions programs previously reported.10 All analyses were performed using SAS 6.01 (SAS Inc., Cary, North Carolina).
RESULTS
Study Population
The study cohort included 315 patients who met the inclusion criteria (Fig 1). The demographic and clinical characteristics of the participants were ascertained at the time of CTP enrollment and are shown in Table 1. Patients were, on average, 82.5 (SD, 8.2) years old and had multiple comorbidities with a mean CCI score of 6.2 and ERA score of 18.5. Almost half of the patients (43.2%) exhibited cognitive impairment and more than half (51.7%) had mobility limitations. Among the patients, 42.9% had been hospitalized at least once in the 180 days prior to their CTP-qualifying hospitalization and 14.2% had ≥2 hospitalizations prior to their CTP-qualifying hospitalization. Similarly, 32.4% had at least one emergency department (ED) visit, and 3.5% had ≥3 ED visits. The majority of patients had frequent outpatient visits, with 30.8% having ≥4 office visits in primary care and 32.4% having ≥4 specialty office visits in the preceding six months.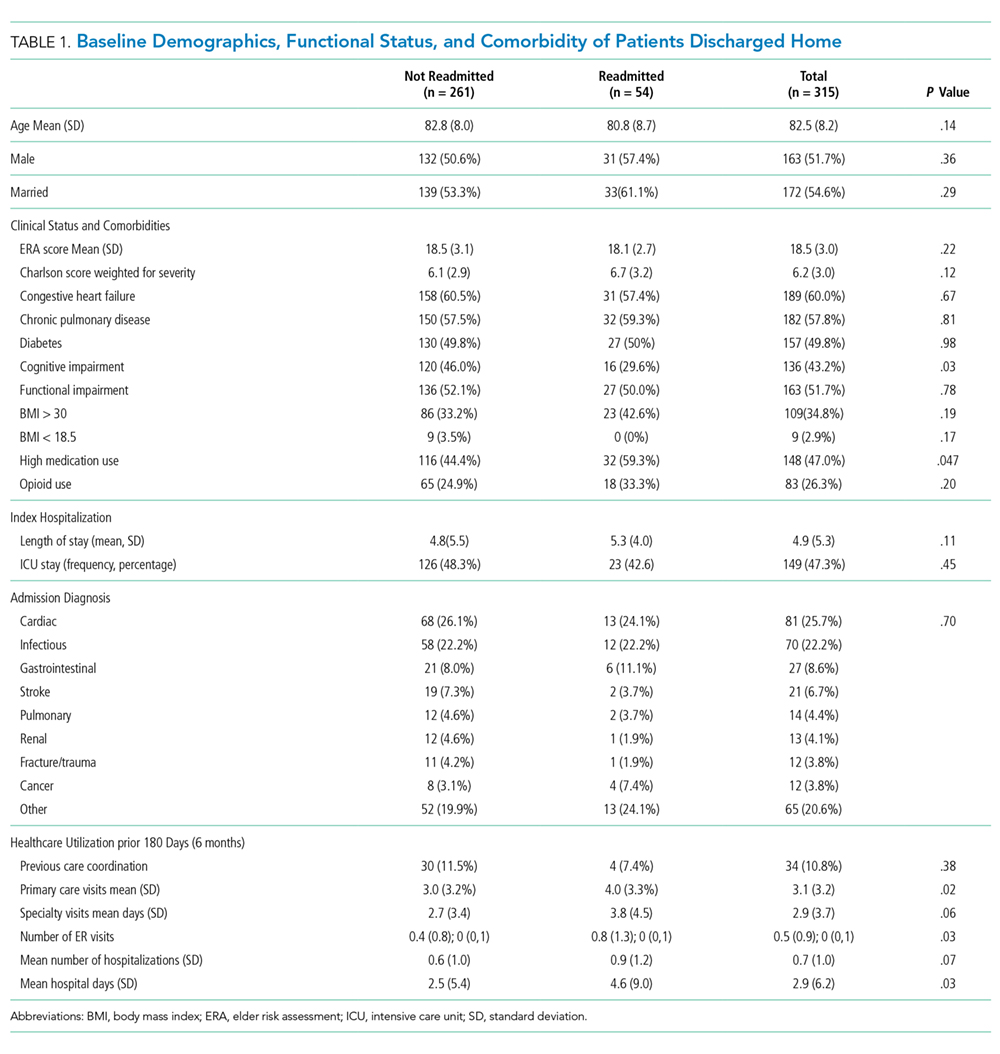
Readmissions, Mortality, ED, and Outpatient Visits
Of the 315 patients, 54 (17.1%) had a readmission within 30 days and seven (2%) had >1 readmission. Among the patients, 126 (40.0%) were readmitted at least once within 180 days with 55 (17.5%) having more than one readmission. A total of 41 patients (13.1%) died during the six-month follow-up period. The need for both office and ED visits was reduced compared to the 180 days prior to admission with the biggest difference in ED visits: 72 (22.9%) of patients needed visits within 180 days of enrollment, as opposed to 102 (32.4%) before enrollment.
Impact of Patient Clinical Variables on Readmission Risk
Readmitted patients were less likely to exhibit cognitive impairment (29.6% vs 46.0%; P = .03) and were more likely to have high medication use (59.3% vs 44.4%; P = .047) than patients without readmission (Table 1). Readmitted patients had a higher frequency of visits to primary care (4.0 vs 3.0; P =.02) in the six months prior to admission and more hospital days in the prior year (4.6 vs 2.5; P = .04) than those without readmission.
Multivariable analysis, which included the cognitive status of the patient; the high use of medication; and the number of ED visits, primary care visits, and hospital days in the previous six months, provided a C statistic of 0.665. After backwards elimination, only the cognitive status of the patient and number of ED visits remained predictive of readmission risk.
Impact of Program Interventions on Readmission Risk
The completion of the CTP fidelity measures drastically varied with completion rates between 29.5% (community resource evaluation) and 87.0% (home visit within five days of hospital discharge; Table 2). Only 12.1% of patients received all components of the CTP at the first home visit. Readmission rates among patients who received all program components (13.2%) were lower than those among patients who did not receive all program components. This difference, however, failed to reach statistical significance. No single program component significantly reduced readmission risk. The completion rate of program fidelity measures increased with time (Figure 2). The present findings did not change even after performing sensitivity analysis that excluded the first program year. The overall agreement between chart abstractors on determining whether advance care planning occurred was 69.5% but the Cohens Kappa was only 18.4. This result was largely ascribed to the following: One abstractor counted the presence of a shorthand template used to document the delivery of an advance care planning document as discussion, whereas the other abstractor required further documentation or corroborating evidence (ie, change of code status). The majority of patients required multiple home visits to address ongoing medical needs (mean 2.7; SD = 1.3) over the first 30 days. Among these patients, only 17.1% received one visit, and 54.6% of patients received ≥3 visits. Eleven (3.5%) patients transitioned to a palliative homebound program that we began offering toward the end of this study to meet patient needs.28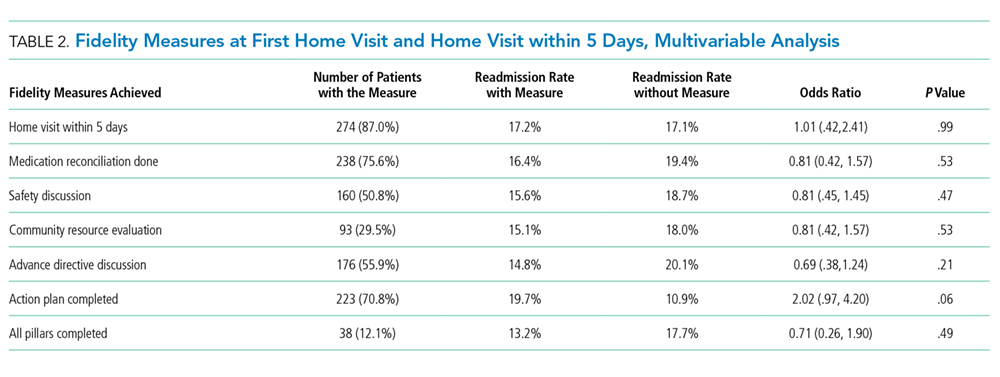
DISCUSSION
The present study met our objective of identifying individual patient factors that are predictive of the success of our CTP. Cognitively impaired patients were less likely to be readmitted than cognitively intact patients. This finding is particularly important because patients with dementia constitute a subgroup that is at an increased risk of readmission after hospitalization29 and often suffer burdensome transitions at the end of life.30,31 High medication use and high number of visits to primary care and number of hospital days in the six months leading up to enrollment increase the likelihood of readmission and are plausible measures of disease severity or multi-morbidity that have been identified in previous studies.32,33 No one program intervention was found to be significantly associated with readmission. This result is consistent with prior works that demonstrated the need for multifaceted and intensive interventions to reduce readmission risk among highly complex and multimorbid patients.13,14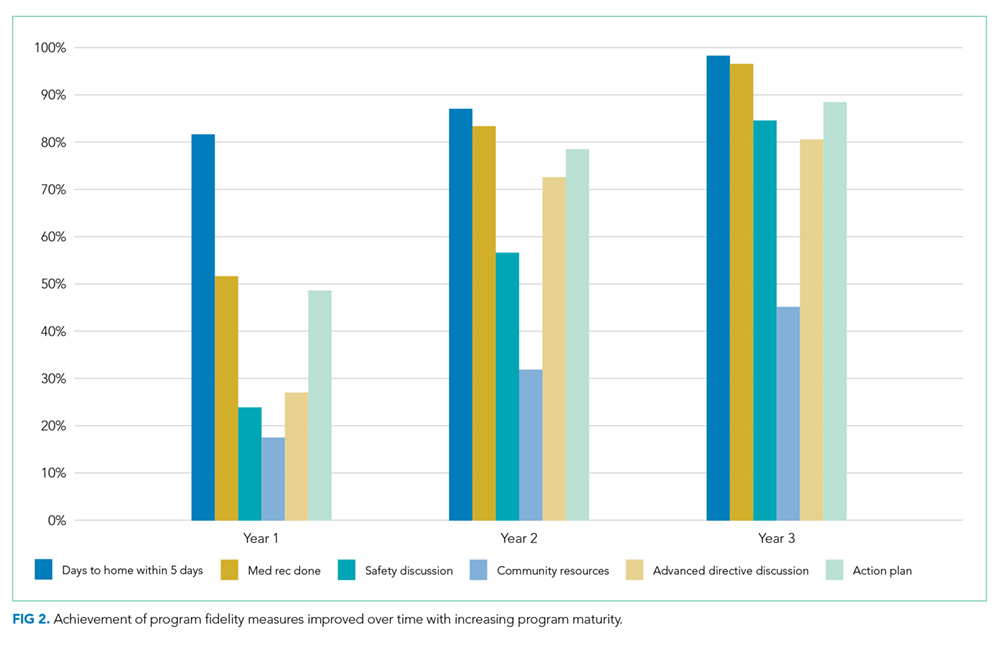
Our findings suggest that the provision of an alternative to stressful hospitalization to cognitively impaired patients and their caregivers may be an important benefit of care transitions programs. Having a trusted team to consult in acute situations may have enabled early intervention and crisis avoidance. Avoiding hospitalizations and ED visits may also have been in line with their goals of care.34,35 Given that program intensity varied on the basis of the discretion of the clinical team, patients with cognitive impairment and their caregivers may also have received more intensive support than cognitively intact patients.
In contrast to recent systematic reviews, our study did not find that advance directive discussion had significant effects on reductions in readmission.36,37 The lack of discussion surrounding the goals of care for patients with serious illnesses was also listed as one of four factors that are strongly associated with preventability in a national cohort of readmitted general medicine patients.38 The lack of power and incomplete documentation may have contributed to our null findings. Trust building must also occur before any meaningful discussion of the goals of care could be achieved, and follow-up time may have to be extended. Toward the end of this study, we developed an extension of our program for patients with limited life expectancy and conservative goals of care. In this extension, reductions in hospitalizations were observed among patients who had multiple goals of care discussions.28
Previous studies have shown that readmissions reduced with timely follow up among patients with heart failure.39 Our results showed no difference in readmission rate based on whether or not our patients were visited within five days from discharge, but we may have been underpowered to detect this difference. In addition, we may have missed readmissions that occurred before the enrollment visit.
The elements of the CTP were evidence based. Fidelity to program goals improved over time and reached high levels with program maturity. Only 12% of the patients received all program components at the first home visit. Patients that had all pillars addressed and documented showed a nonsignificant trend toward reduced readmission rates. NPs were given discretion as to how many visits were required to stabilize a patient and achieve program objectives. Heart failure management was driven by protocol with input from cardiology. Medication reconciliation and clinical assessment with action plan were prioritized at the first visit and thus allowed for the completion of other goals at a subsequent visit if time was insufficient. These decisions were deliberated at weekly physician-led multidisciplinary meetings. This variability allowed the team to meet chronic and urgent needs but further confounded the interpretation of our results. One possible way to interpret the lack of significant predictors of success is that through clinical assessment and flexibility, we were able to tailor our program to meet the needs of this complex multi-morbid population.
This study has important limitations. Given that it is a retrospective cohort study, we were unable to include patients who were enrolled but were either readmitted or dropped out before the first program visit. In addition, because of our study’s limited sample size and readmission rate, we had limited power to detect other potential predictor variables and test for confounding and interaction. While we included numerous variables in our analyses, we lacked information on mental health and the social determinants of health, which are known to influence readmission risk.40,41 Similarly, we lacked patient self-reported measures of health and information regarding caregiver support, which are important.42,43 Several of our predictive measures (cognitive impairment, mobility limitations, and program objective completion) were dependent on supplementing billing codes with heterogeneous data abstracted from usual clinical care as opposed to standardized research protocols. Neither method is completely accurate, nor can the combination of the two be assumed to be without inaccuracies. Failure to adequately document the clinical interventions performed by the clinical team is possibly a major confounder as evidenced by the considerable lack of agreement by our trained abstractors in determining whether advance care planning took place. The generalizability of our results is also a concern because the local population is largely white and highly educated, although our experience tells us that many of our program patients have limited means and thus may more closely resemble the general US population.44 The strength of our study is that it uses real, practice-based data that can be directly translated to practice.
CONCLUSION
This study focused on a successful high-intensity CTP. Results showed that compared with patients without dementia, patients with dementia were more likely to avoid hospitalizations as a result of enrollment in the investigated CTP. This study, however, failed to identify specific programmatic components critical for the success of the CTP. These findings support the current hypothesis that multidisciplinary, multimodal, and highly intensive interventions are necessary to care for complex and multi-morbid patients. They also suggest that compared with cognitively functional patients, cognitively impaired patients with conservative goals of care may be more likely to avoid burdensome hospitalizations when provided with early intervention in their home.
Acknowledgments
B.T. conceived and designed the study, interpreted the data, drafted and provided final revisions to the manuscript. P.Y.T, N.D.S., and J.M.N obtained funding, contributed to the conception and design of the study, analysis, and interpretation of the data, and provided critical revisions to the manuscript. P.A.R., R.G.M, and G.J.H., contributed to the conception and design of the study, analysis, and interpretation of the data, and provided critical revisions to the manuscript. S.M.P. Assisted with data acquisition and interpretation, performed the data analysis, and drafted parts of the manuscript. C.Y.Y.C, L.J.H., A.L, A.C., L.B., and R.H. helped with methodologic questions and data interpretation, and provided critical revisions to the manuscript.
All authors read and approved the final manuscript and the decision to submit the manuscript for publication.
We thank Donna Lawson, RN for her help with data abstraction and Annika Beck and Anna Jones in Mayo Clinic Biomedical Ethics Research Program for her help in preparing this manuscript for publication.
Disclosures
The authors declare no conflicts of interest.
Funding
This publication was supported by the Mayo Clinic, Robert D and Patricia E. Center for the Science of Health Care Delivery (B.T., R.H., R.G.M, L.J.H), by the Extramural Grant Program by Satellite Healthcare, a not-for-profit renal care provider (L.J.H., B.T.), and by the National Institute of Health (NIH) National Institute Of Diabetes And Digestive And Kidney Diseases grant K23 DK109134 (L.J.H.) K23DK114497 (RGM) and National Institute on Aging grant K23 AG051679 (B.T.). Additional support was provided by the National Center for Advancing Translational Sciences grant UL1 TR000135. Study contents are the sole responsibility of the authors and do not necessarily represent the official views of NIH.
The sponsors had no role in the design, execution, or reporting of this study.
Prior Presentations
Part of this data was presented in poster format at the American Geriatrics Society meeting in Washington DC 2015.
1. Joynt KE, Jha AK. A path forward on Medicare readmissions. N Engl J Med. 2013;368(13):1175-1177. doi: 10.1056/NEJMp1300122. PubMed
2. Epstein AM, Jha AK, Orav EJ. The relationship between hospital admission rates and rehospitalizations. N Engl J Med. 2011;365(24):2287-2295. doi: 10.1056/NEJMsa1101942. PubMed
3. Zuckerman RB, Sheingold SH, Orav EJ, Ruhter J, Epstein AM. Readmissions, observation, and the hospital readmissions reduction program. N Engl J Med. 2016;374(16):1543-1551. doi: 10.1056/NEJMsa1513024. PubMed
4. Jencks SF, Williams MV, Coleman EA. Rehospitalizations among patients in the Medicare fee-for-service program. N Engl J Med. 2009;360(14):1418-1428. doi: 10.1056/NEJMsa0803563. PubMed
5. Gerhardt G, Yemane A, Hickman P, Oelschlaeger A, Rollins E, Brennan N. Medicare readmission rates showed meaningful decline in 2012. Medicare Medicaid Res Rev. 2013;3(2). doi: 10.5600/mmrr.003.02.b01. PubMed
6. Naylor MD, Brooten D, Campbell R, et al. Comprehensive discharge planning and home follow-up of hospitalized elders: a randomized clinical trial. JAMA. 1999;281(7):613-620. PubMed
7. Takahashi PY, Naessens JM, Peterson SM, et al. Short-term and long-term effectiveness of a post-hospital care transitions program in an older, medically complex population. Healthcare. 2016;4(1):30-35. doi: 10.1016/j.hjdsi.2015.06.006. PubMed
8. Desai NR, Ross JS, Kwon JY, et al. Association between hospital penalty status under the hospital readmission reduction program and readmission rates for target and nontarget conditions. JAMA. 2016;316(24):2647-2656. doi: 10.1001/jama.2016.18533. PubMed
9. CMS. U.S. Centers for Medicare & Medicaid Services (CMS) measure methodology. https://www.cms.gov/Medicare/Quality-Initiatives-Patient-Assessment-Instruments/HospitalQualityInits/Measure-Methodology.html. Accessed December 1, 2017; 2017.
10. National Committee for Quality Assurance. All-Cause Readmissions: the Number of Acute Inpatient Stays during the Measurement Year That Were Followed by an Acute Readmission for Any Diagnosis within 30 Days and the Predicted Probability of an Acute Readmission, for Patients 18 Years of Age and Older. Accessed May 18, 2017; 2014.
11. Naylor MD, Hirschman KB, Hanlon AL, et al. Comparison of evidence-based interventions on outcomes of hospitalized, cognitively impaired older adults. J Comp Eff Res. 2014;3(3):245-257. doi: 10.2217/cer.14.14. PubMed
12. Le Berre M, Maimon G, Sourial N, Guériton M, Vedel I. Impact of transitional care services for chronically ill older patients: A systematic evidence review. J Am Geriatr Soc. 2017;65(7):1597-1608. doi: 10.1111/jgs.14828. PubMed
13. Leppin AL, Gionfriddo MR, Kessler M, et al. Preevnting 30-day hospital readmissions: A systematic review and meta-analysis of randomized trials. JAMA Intern Med. 2014;174(7):1095-1107. doi: 10.1001/jamainternmed.2014.1608. PubMed
14. Hansen LO, Young RS, Hinami K, Leung A, Williams MV. Interventions to reduce 30-day rehospitalization: a systematic review. Ann Intern Med. 2011;155(8):520-528. doi: 10.7326/0003-4819-155-8-201110180-00008. PubMed
15. Takahashi PY, Tung EE, Crane SJ, Chaudhry R, Cha S, Hanson GJ. Use of the elderly risk assessment (ERA) index to predict 2-year mortality and nursing home placement among community dwelling older adults. Arch Gerontol Geriatr. 2012;54(1):34-38. doi: 10.1016/j.archger.2011.02.012. PubMed
16. Biehl M, Takahashi PY, Cha SS, Chaudhry R, Gajic O, Thorsteinsdottir B. Prediction of critical illness in elderly outpatients using elder risk assessment: a population-based study. Clin Interv Aging. 2016;11:829-834. doi: 10.2147/CIA.S99419. PubMed
17. Takahashi PY, Haas LR, Quigg SM, et al. 30-day hospital readmission of older adults using care transitions after hospitalization: a pilot prospective cohort study. Clin Interv Aging. 2013;8:729-736. doi: 10.2147/CIA.S44390. PubMed
18. Dunlay SM, Pack QR, Thomas RJ, Killian JM, Roger VL. Participation in cardiac rehabilitation, readmissions, and death after acute myocardial infarction. Am J Med. 2014;127(6):538-546. doi: 10.1016/j.amjmed.2014.02.008. PubMed
19. Crane SJ, Tung EE, Hanson GJ, Cha S, Chaudhry R, Takahashi PY. Use of an electronic administrative database to identify older community dwelling adults at high-risk for hospitalization or emergency department visits: the elders risk assessment index. BMC Health Serv Res. 2010;10:338. doi: 10.1186/1472-6963-10-338. PubMed
20. Charlson ME, Pompei P, Ales KL, MacKenzie CR. A new method of classifying prognostic comorbidity in longitudinal studies: development and validation. J Chronic Dis. 1987;40(5):373-383. doi: 10.1016/0021-9681(87)90171-8. PubMed
21. Collin C, Wade DT, Davies S, Horne V. The Barthel ADL Index: a reliability study. Int Disabil Stud. 1988;10(2):61-63. doi: 10.3109/09638288809164103. PubMed
22. Sulter G, Steen C, De Keyser J. Use of the Barthel index and modified Rankin scale in acute stroke trials. Stroke. 1999;30(8):1538-1541. doi: 10.1161/01.STR.30.8.1538. PubMed
23. Bohannon RW. Reference values for the timed up and go test: A descriptive meta-analysis. J Geriatr Phys Ther. 2006;29(2):64-68. doi: 10.1519/00139143-200608000-00004. PubMed
24. Kokmen E, Naessens JM, Offord KP. A short test of mental status: description and preliminary results. Mayo Clin Proc. 1987;62(4):281-288. doi: 10.1016/S0025-6196(12)61905-3. PubMed
25. Folstein MF, Folstein SE, McHugh PR. “Mini-mental state”. A practical method for grading the cognitive state of patients for the clinician. J Psychiatr Res. 1975;12(3):189-198. doi: 10.1016/0022-3956(75)90026-6. PubMed
26. Galvin JE, Roe CM, Powlishta KK, et al. The AD8: A brief informant interview to detect dementia. Neurology. 2005;65(4):559-564. doi: 10.1212/01.wnl.0000172958.95282.2a. PubMed
27. Farrell B, Szeto W, Shamji S. Drug-related problems in the frail elderly. Can Fam Phys. 2011;57(2):168-169. PubMed
28. Chen CY, Thorsteinsdottir B, Cha SS, et al. Health care outcomes and advance care planning in older adults who receive home-based palliative care: a pilot cohort study. J Palliat Med. 2015;18(1):38-44. doi: 10.1089/jpm.2014.0150. PubMed
29. Rao A, Suliman A, Vuik S, Aylin P, Darzi A. Outcomes of dementia: systematic review and meta-analysis of hospital administrative database studies. Arch Gerontol Geriatr. 2016;66(Suppl C):198-204. doi: 10.1016/j.archger.2016.06.008. PubMed
30. Gozalo P, Teno JM, Mitchell SL, et al. End-of-life transitions among nursing home residents with cognitive issues. N Engl J Med. 2011;365(13):1212-1221. doi: 10.1056/NEJMsa1100347. PubMed
31. Wang SY, Aldridge MD, Gross CP, Canavan M, Cherlin E, Bradley E. End-of-life care transition patterns of Medicare beneficiaries. J Am Geriatr Soc. 2017;65(7):1406-1413. doi: 10.1111/jgs.14891. PubMed
32. Pedersen MK, Meyer G, Uhrenfeldt L. Risk factors for acute care hospital readmission in older persons in Western countries: a systematic review. JBI Database System Rev Implement Rep. 2017;15(2):454-485. doi: 10.11124/JBISRIR-2016-003267. PubMed

33. Edwards ST, Saha S, Prentice JC, Pizer SD. Preventing hospitalization with Veterans Affairs home-based primary care: which individuals benefit most? J Am Geriatr Soc. 2017;65(8):1676-1683. doi: 10.1111/jgs.14843. PubMed
34. Mitchell SL, Palmer JA, Volandes AE, Hanson LC, Habtemariam D, Shaffer ML. Level of care preferences Among nursing home residents With advanced dementia. J Pain Symptom Manage. 2017;54(3):340-345. doi: 10.1016/j.jpainsymman.2017.04.020. PubMed
35. D’Avolio DA, Strumpf NE, Feldman J, Mitchell P, Rebholz CM. Barriers to primary care: perceptions of older adults utilizing the ED for nonurgent visits. Clin Nurs Res. 2013;22(4):416-431. doi: 10.1177/1054773813485597. PubMed
36. Brinkman-Stoppelenburg A, Rietjens JA, van der Heide A. The effects of advance care planning on end-of-life care: a systematic review. Palliat Med. 2014;28(8):1000-1025. doi: 10.1177/0269216314526272. PubMed
37. Martin RS, Hayes B, Gregorevic K, Lim WK. The effects of advance care planning interventions on nursing home residents: A systematic review. J Am Med Dir Assoc. 2016;17(4):284-293. doi: 10.1016/j.jamda.2015.12.017. PubMed
38. Auerbach AD, Kripalani S, Vasilevskis EE, et al. Preventability and causes of readmissions in a national cohort of general medicine patients. JAMA Intern Med. 2016;176(4):484-493. doi: 10.1001/jamainternmed.2015.7863. PubMed
39. Parrinello G, Torres D, Paterna S, et al. Early and personalized ambulatory follow-up to tailor furosemide and fluid intake according to congestion in post-discharge heart failure. Intern Emerg Med. 2013;8(3):221-228. doi: 10.1007/s11739-011-0602-y. PubMed
40. Barnett ML, Hsu J, McWilliams JM. Patient characteristics and differences in hospital readmission rates. JAMA Intern Med. 2015;175(11):1803-1812. doi: 10.1001/jamainternmed.2015.4660. PubMed
41. Calvillo–King L, Arnold D, Eubank KJ, et al. Impact of social factors on risk of readmission or mortality in pneumonia and heart failure: systematic review. J Gen Intern Med. 2013;28(2):269-282. doi: 10.1007/s11606-012-2235-x. PubMed
42. Rönneikkö JK, Mäkelä M, Jämsen ER, et al. Predictors for unplanned hospitalization of New Home care clients. J Am Geriatr Soc. 2017;65(2):407-414. doi: 10.1111/jgs.14486. PubMed
43. Hasan O, Meltzer DO, Shaykevich SA, et al. Hospital readmission in general medicine patients: a prediction model. J Gen Intern Med. 2010;25(3):211-219. doi: 10.1007/s11606-009-1196-1. PubMed
44. St Sauver JL, Grossardt BR, Leibson CL, Yawn BP, Melton LJ, 3rd, Rocca WA. Generalizability of epidemiological findings and public health decisions: an illustration from the Rochester Epidemiology Project. Mayo Clin Proc. 2012;87(2):151-160. doi: 10.1016/j.mayocp.2011.11.009. PubMed
Unplanned hospital admissions and readmissions have become a major focus of efforts to improve the value of healthcare given that these potentially preventable events exert substantial burden on patients, caregivers, health systems, and the economy.1 The percentage of patients who are rehospitalized within 30 days have decreased from 20%-21% at the start of the Accountable Care Act and readmission penalties to approximately 18%.2-5 Rehospitalization rates are 33% at 90 days and approach 40% at six months.6,7 Readmissions cost Medicare more than $26 billion annually,4 with one in five Medicare beneficiaries readmitted within 30 days of hospital discharge.8 Centers for Medicare and Medicaid Services and other payers use condition-specific and all-cause 30-day unplanned readmission rates and potentially preventable admissions among patients with complex or multiple comorbidities for public reporting, value-based purchasing, and performance-based reimbursement.9,10 Consequently, medical groups and hospitals have begun to place an increasing emphasis on improving the transitions of care following hospitalization with the goal of reducing unplanned readmissions.11 Care transitions programs have been shown to decrease readmission rates, mortality, and emergency department (ED) visits.12
Care transitions programs vary greatly in their scope of intervention and target groups, as well as in their efficacy in reducing readmissions.13,14 The Mayo Clinic Care Transition Program, hereafter referred to as CTP, was launched in 2011. This program was modeled after other successful programs and involves home visits by a nurse practitioner (NP) and telephonic support and triage provided by a registered nurse (RN). It is offered to high-risk community-dwelling patients during their hospitalization and begins within a week of hospital discharge.
Although the CTP reduces 30-day readmissions from 20% to 17%,7 it is a highly resource-intensive, multimodal, multidisciplinary program. Moreover, whether some components of the CTP are more critical than others remains unknown. Prior studies that examined the individual components of successful CTPs have suggested that a multipronged approach that includes close patient and caregiver support is most predictive of program efficacy.13 Long-term program sustainability would benefit from optimization of the most critical components of the program while reducing or eliminating resource-intensive factors that have negligible effects on program success. We therefore examined our CTP to identify whether and which program components are most critical for preventing 30-day readmissions and whether any patient characteristics contribute risk within this complex population.
METHODS
Study Design and Setting
This study is a retrospective cohort study of patients who were enrolled in the care transitions program of Mayo Clinic Rochester during the period January 1, 2010 to June 30, 2013. Patient demographic and clinical data were obtained from electronic health records (EHR), and information regarding CTP processes and interventions was obtained from a prospectively maintained program database. The study complied with the principles of the Declaration of Helsinki and was approved by the Mayo Clinic Institutional Review Board.
Objectives
The study aimed to describe the performance and utilization of a multidisciplinary care transitions program that has been successful in reducing readmissions for high-risk patients. The study also sought to identify patient and/or program factors associated with failure to prevent readmission within 30 days of program enrollment.
Population
Patients who were enrolled in the CTP following hospital discharge and seen for a posthospital in-home visit prior to hospital readmission (for those readmitted) were included. Patients discharged to a skilled nursing facility were excluded. Patients were eligible for CTP enrollment if they were hospitalized for any cause, community dwelling (including assisted living) prior to hospitalization, and ≥60 years old with an Elder Risk Assessment (ERA) score ≥16.7 The ERA incorporates information regarding previous hospital days, age, and comorbid health burden and has been shown to predict 30-day readmissions, mortality, and critical illness (
Intervention
Detailed descriptions of the CTP have been previously published.7,17 Patients meeting enrollment criteria are enrolled into the CTP by a RN prior to or immediately after hospital discharge. The patient is then seen at home within one to five business days of discharge and again the following week by a NP who performs medication reconciliation; chronic illness management; and acute illness, mobility, safety, and cognition assessments. The NP also provides patient education on self-care and advance care planning. Patient and caregiver support and liaisons with community resources are provided. Home visits by an NP or MD are continued as needed for at least one month. A RN case manager performs weekly phone calls to assess changes in the patient’s clinical status and is available for phone triage of acute health issues. An interdisciplinary team composed of MDs, NPs, RNs, and pharmacists review patient management at weekly meetings. Although after-hours or weekend coverage for home visits are unavailable, an on-call primary care physician is available by phone at all times.
Primary Outcome
The primary outcome was all-cause hospital readmission within 30 days of the first CTP home visit, indicating successful program enrollment. Hospitalization was determined on the basis of billing codes from Mayo Clinic hospitals; this approach is 99% reliable in detecting readmissions for this population.18
Secondary Outcome Measures
Secondary outcome measures included six-month mortality and hospitalizations, as well as the number of hospital and ICU days and home, ED, primary care, and specialty office visits within 180 days after index hospitalizations as per the EHR. ED visits were counted only when they did not result in a hospital admission.
Independent Variables
Patient characteristics and clinical variables were retrieved from the EHR and included patient age, sex, and marital status. Comorbidities, ERA score,19 and Charlson comorbidity index (CCI)20 within two years of program enrollment were determined by using ICD-9 billing codes. The frequencies of primary care and specialty visits within six months of the index hospitalization were also ascertained using the EHR. Mobility limitations and cognitive impairment were categorized as binary variables (yes/no) and were assessed at the first home visit by the NP. The presence of mobility limitations was defined as a Barthel’s score of <7521,22 or Timed up and Go time of >20 seconds.23 Cognitive impairment was established as Kokmen below the normal cutoff for patient’s age group,24 Mini-Cog ≤2,25or AD8 ≥2.26 If these measures were not specifically documented during the first visit, clinical notes were queried for the description of pertinent cognitive and/or mobility limitations. Dementia diagnosis billing codes (ICD9 Code 290.*) were also included. High medication use was defined as >14 given the reported average medication number ranges from 8-13 in this population.27
As previously published, fidelity measures were abstracted from clinical notes by a trained nurse abstractor within 30 days of program enrollment and prior to a readmission.7 The five program fidelity measures included medication reconciliation, home service evaluation, advanced directives discussion, action plan for acute and chronic disease, safety plan, and discussion of community resources. The presence of advanced care planning was determined on the basis of visit medical notes and/or change of code status within the EHR, the identification or scanning of written advanced directives or “provider order for life-sustaining treatment,” and documentation of the discussion of resuscitation status. It was abstracted in duplicate by a nurse abstractor with physician adjudication for disagreement. Moreover, whether the initial visit met the goal of being within five days of discharge was determined by using billing data.
Analysis
The contribution of each independent variable to 30-day readmission was first directly assessed by using a univariate logistic regression model. Five patients died within 30 days without being admitted. These deaths, however, were not censored given that home death (as opposed to hospital death) was considered a positive outcome of the CTP. Multivariable modeling was performed through log rank test with backwards elimination and included all independent variables with P < .05. Variables with P values between .05 and >.1 were tested for interaction with age and sex. Age was categorized as <80 or ≥80 years. The length of hospital stay was categorized as <3 days (not qualifying for a Medicare skilled nursing facility), 3-13 days, or ≥14 days.
This study had 30% power to detect a reduction of 5% in the rates of hospital admissions; 5% is the median absolute risk reduction reported by previous randomized studies on care transitions programs previously reported.10 All analyses were performed using SAS 6.01 (SAS Inc., Cary, North Carolina).
RESULTS
Study Population
The study cohort included 315 patients who met the inclusion criteria (Fig 1). The demographic and clinical characteristics of the participants were ascertained at the time of CTP enrollment and are shown in Table 1. Patients were, on average, 82.5 (SD, 8.2) years old and had multiple comorbidities with a mean CCI score of 6.2 and ERA score of 18.5. Almost half of the patients (43.2%) exhibited cognitive impairment and more than half (51.7%) had mobility limitations. Among the patients, 42.9% had been hospitalized at least once in the 180 days prior to their CTP-qualifying hospitalization and 14.2% had ≥2 hospitalizations prior to their CTP-qualifying hospitalization. Similarly, 32.4% had at least one emergency department (ED) visit, and 3.5% had ≥3 ED visits. The majority of patients had frequent outpatient visits, with 30.8% having ≥4 office visits in primary care and 32.4% having ≥4 specialty office visits in the preceding six months.
Readmissions, Mortality, ED, and Outpatient Visits
Of the 315 patients, 54 (17.1%) had a readmission within 30 days and seven (2%) had >1 readmission. Among the patients, 126 (40.0%) were readmitted at least once within 180 days with 55 (17.5%) having more than one readmission. A total of 41 patients (13.1%) died during the six-month follow-up period. The need for both office and ED visits was reduced compared to the 180 days prior to admission with the biggest difference in ED visits: 72 (22.9%) of patients needed visits within 180 days of enrollment, as opposed to 102 (32.4%) before enrollment.
Impact of Patient Clinical Variables on Readmission Risk
Readmitted patients were less likely to exhibit cognitive impairment (29.6% vs 46.0%; P = .03) and were more likely to have high medication use (59.3% vs 44.4%; P = .047) than patients without readmission (Table 1). Readmitted patients had a higher frequency of visits to primary care (4.0 vs 3.0; P =.02) in the six months prior to admission and more hospital days in the prior year (4.6 vs 2.5; P = .04) than those without readmission.
Multivariable analysis, which included the cognitive status of the patient; the high use of medication; and the number of ED visits, primary care visits, and hospital days in the previous six months, provided a C statistic of 0.665. After backwards elimination, only the cognitive status of the patient and number of ED visits remained predictive of readmission risk.
Impact of Program Interventions on Readmission Risk
The completion of the CTP fidelity measures drastically varied with completion rates between 29.5% (community resource evaluation) and 87.0% (home visit within five days of hospital discharge; Table 2). Only 12.1% of patients received all components of the CTP at the first home visit. Readmission rates among patients who received all program components (13.2%) were lower than those among patients who did not receive all program components. This difference, however, failed to reach statistical significance. No single program component significantly reduced readmission risk. The completion rate of program fidelity measures increased with time (Figure 2). The present findings did not change even after performing sensitivity analysis that excluded the first program year. The overall agreement between chart abstractors on determining whether advance care planning occurred was 69.5% but the Cohens Kappa was only 18.4. This result was largely ascribed to the following: One abstractor counted the presence of a shorthand template used to document the delivery of an advance care planning document as discussion, whereas the other abstractor required further documentation or corroborating evidence (ie, change of code status). The majority of patients required multiple home visits to address ongoing medical needs (mean 2.7; SD = 1.3) over the first 30 days. Among these patients, only 17.1% received one visit, and 54.6% of patients received ≥3 visits. Eleven (3.5%) patients transitioned to a palliative homebound program that we began offering toward the end of this study to meet patient needs.28
DISCUSSION
The present study met our objective of identifying individual patient factors that are predictive of the success of our CTP. Cognitively impaired patients were less likely to be readmitted than cognitively intact patients. This finding is particularly important because patients with dementia constitute a subgroup that is at an increased risk of readmission after hospitalization29 and often suffer burdensome transitions at the end of life.30,31 High medication use and high number of visits to primary care and number of hospital days in the six months leading up to enrollment increase the likelihood of readmission and are plausible measures of disease severity or multi-morbidity that have been identified in previous studies.32,33 No one program intervention was found to be significantly associated with readmission. This result is consistent with prior works that demonstrated the need for multifaceted and intensive interventions to reduce readmission risk among highly complex and multimorbid patients.13,14
Our findings suggest that the provision of an alternative to stressful hospitalization to cognitively impaired patients and their caregivers may be an important benefit of care transitions programs. Having a trusted team to consult in acute situations may have enabled early intervention and crisis avoidance. Avoiding hospitalizations and ED visits may also have been in line with their goals of care.34,35 Given that program intensity varied on the basis of the discretion of the clinical team, patients with cognitive impairment and their caregivers may also have received more intensive support than cognitively intact patients.
In contrast to recent systematic reviews, our study did not find that advance directive discussion had significant effects on reductions in readmission.36,37 The lack of discussion surrounding the goals of care for patients with serious illnesses was also listed as one of four factors that are strongly associated with preventability in a national cohort of readmitted general medicine patients.38 The lack of power and incomplete documentation may have contributed to our null findings. Trust building must also occur before any meaningful discussion of the goals of care could be achieved, and follow-up time may have to be extended. Toward the end of this study, we developed an extension of our program for patients with limited life expectancy and conservative goals of care. In this extension, reductions in hospitalizations were observed among patients who had multiple goals of care discussions.28
Previous studies have shown that readmissions reduced with timely follow up among patients with heart failure.39 Our results showed no difference in readmission rate based on whether or not our patients were visited within five days from discharge, but we may have been underpowered to detect this difference. In addition, we may have missed readmissions that occurred before the enrollment visit.
The elements of the CTP were evidence based. Fidelity to program goals improved over time and reached high levels with program maturity. Only 12% of the patients received all program components at the first home visit. Patients that had all pillars addressed and documented showed a nonsignificant trend toward reduced readmission rates. NPs were given discretion as to how many visits were required to stabilize a patient and achieve program objectives. Heart failure management was driven by protocol with input from cardiology. Medication reconciliation and clinical assessment with action plan were prioritized at the first visit and thus allowed for the completion of other goals at a subsequent visit if time was insufficient. These decisions were deliberated at weekly physician-led multidisciplinary meetings. This variability allowed the team to meet chronic and urgent needs but further confounded the interpretation of our results. One possible way to interpret the lack of significant predictors of success is that through clinical assessment and flexibility, we were able to tailor our program to meet the needs of this complex multi-morbid population.
This study has important limitations. Given that it is a retrospective cohort study, we were unable to include patients who were enrolled but were either readmitted or dropped out before the first program visit. In addition, because of our study’s limited sample size and readmission rate, we had limited power to detect other potential predictor variables and test for confounding and interaction. While we included numerous variables in our analyses, we lacked information on mental health and the social determinants of health, which are known to influence readmission risk.40,41 Similarly, we lacked patient self-reported measures of health and information regarding caregiver support, which are important.42,43 Several of our predictive measures (cognitive impairment, mobility limitations, and program objective completion) were dependent on supplementing billing codes with heterogeneous data abstracted from usual clinical care as opposed to standardized research protocols. Neither method is completely accurate, nor can the combination of the two be assumed to be without inaccuracies. Failure to adequately document the clinical interventions performed by the clinical team is possibly a major confounder as evidenced by the considerable lack of agreement by our trained abstractors in determining whether advance care planning took place. The generalizability of our results is also a concern because the local population is largely white and highly educated, although our experience tells us that many of our program patients have limited means and thus may more closely resemble the general US population.44 The strength of our study is that it uses real, practice-based data that can be directly translated to practice.
CONCLUSION
This study focused on a successful high-intensity CTP. Results showed that compared with patients without dementia, patients with dementia were more likely to avoid hospitalizations as a result of enrollment in the investigated CTP. This study, however, failed to identify specific programmatic components critical for the success of the CTP. These findings support the current hypothesis that multidisciplinary, multimodal, and highly intensive interventions are necessary to care for complex and multi-morbid patients. They also suggest that compared with cognitively functional patients, cognitively impaired patients with conservative goals of care may be more likely to avoid burdensome hospitalizations when provided with early intervention in their home.
Acknowledgments
B.T. conceived and designed the study, interpreted the data, drafted and provided final revisions to the manuscript. P.Y.T, N.D.S., and J.M.N obtained funding, contributed to the conception and design of the study, analysis, and interpretation of the data, and provided critical revisions to the manuscript. P.A.R., R.G.M, and G.J.H., contributed to the conception and design of the study, analysis, and interpretation of the data, and provided critical revisions to the manuscript. S.M.P. Assisted with data acquisition and interpretation, performed the data analysis, and drafted parts of the manuscript. C.Y.Y.C, L.J.H., A.L, A.C., L.B., and R.H. helped with methodologic questions and data interpretation, and provided critical revisions to the manuscript.
All authors read and approved the final manuscript and the decision to submit the manuscript for publication.
We thank Donna Lawson, RN for her help with data abstraction and Annika Beck and Anna Jones in Mayo Clinic Biomedical Ethics Research Program for her help in preparing this manuscript for publication.
Disclosures
The authors declare no conflicts of interest.
Funding
This publication was supported by the Mayo Clinic, Robert D and Patricia E. Center for the Science of Health Care Delivery (B.T., R.H., R.G.M, L.J.H), by the Extramural Grant Program by Satellite Healthcare, a not-for-profit renal care provider (L.J.H., B.T.), and by the National Institute of Health (NIH) National Institute Of Diabetes And Digestive And Kidney Diseases grant K23 DK109134 (L.J.H.) K23DK114497 (RGM) and National Institute on Aging grant K23 AG051679 (B.T.). Additional support was provided by the National Center for Advancing Translational Sciences grant UL1 TR000135. Study contents are the sole responsibility of the authors and do not necessarily represent the official views of NIH.
The sponsors had no role in the design, execution, or reporting of this study.
Prior Presentations
Part of this data was presented in poster format at the American Geriatrics Society meeting in Washington DC 2015.
1. Joynt KE, Jha AK. A path forward on Medicare readmissions. N Engl J Med. 2013;368(13):1175-1177. doi: 10.1056/NEJMp1300122. PubMed
2. Epstein AM, Jha AK, Orav EJ. The relationship between hospital admission rates and rehospitalizations. N Engl J Med. 2011;365(24):2287-2295. doi: 10.1056/NEJMsa1101942. PubMed
3. Zuckerman RB, Sheingold SH, Orav EJ, Ruhter J, Epstein AM. Readmissions, observation, and the hospital readmissions reduction program. N Engl J Med. 2016;374(16):1543-1551. doi: 10.1056/NEJMsa1513024. PubMed
4. Jencks SF, Williams MV, Coleman EA. Rehospitalizations among patients in the Medicare fee-for-service program. N Engl J Med. 2009;360(14):1418-1428. doi: 10.1056/NEJMsa0803563. PubMed
5. Gerhardt G, Yemane A, Hickman P, Oelschlaeger A, Rollins E, Brennan N. Medicare readmission rates showed meaningful decline in 2012. Medicare Medicaid Res Rev. 2013;3(2). doi: 10.5600/mmrr.003.02.b01. PubMed
6. Naylor MD, Brooten D, Campbell R, et al. Comprehensive discharge planning and home follow-up of hospitalized elders: a randomized clinical trial. JAMA. 1999;281(7):613-620. PubMed
7. Takahashi PY, Naessens JM, Peterson SM, et al. Short-term and long-term effectiveness of a post-hospital care transitions program in an older, medically complex population. Healthcare. 2016;4(1):30-35. doi: 10.1016/j.hjdsi.2015.06.006. PubMed
8. Desai NR, Ross JS, Kwon JY, et al. Association between hospital penalty status under the hospital readmission reduction program and readmission rates for target and nontarget conditions. JAMA. 2016;316(24):2647-2656. doi: 10.1001/jama.2016.18533. PubMed
9. CMS. U.S. Centers for Medicare & Medicaid Services (CMS) measure methodology. https://www.cms.gov/Medicare/Quality-Initiatives-Patient-Assessment-Instruments/HospitalQualityInits/Measure-Methodology.html. Accessed December 1, 2017; 2017.
10. National Committee for Quality Assurance. All-Cause Readmissions: the Number of Acute Inpatient Stays during the Measurement Year That Were Followed by an Acute Readmission for Any Diagnosis within 30 Days and the Predicted Probability of an Acute Readmission, for Patients 18 Years of Age and Older. Accessed May 18, 2017; 2014.
11. Naylor MD, Hirschman KB, Hanlon AL, et al. Comparison of evidence-based interventions on outcomes of hospitalized, cognitively impaired older adults. J Comp Eff Res. 2014;3(3):245-257. doi: 10.2217/cer.14.14. PubMed
12. Le Berre M, Maimon G, Sourial N, Guériton M, Vedel I. Impact of transitional care services for chronically ill older patients: A systematic evidence review. J Am Geriatr Soc. 2017;65(7):1597-1608. doi: 10.1111/jgs.14828. PubMed
13. Leppin AL, Gionfriddo MR, Kessler M, et al. Preevnting 30-day hospital readmissions: A systematic review and meta-analysis of randomized trials. JAMA Intern Med. 2014;174(7):1095-1107. doi: 10.1001/jamainternmed.2014.1608. PubMed
14. Hansen LO, Young RS, Hinami K, Leung A, Williams MV. Interventions to reduce 30-day rehospitalization: a systematic review. Ann Intern Med. 2011;155(8):520-528. doi: 10.7326/0003-4819-155-8-201110180-00008. PubMed
15. Takahashi PY, Tung EE, Crane SJ, Chaudhry R, Cha S, Hanson GJ. Use of the elderly risk assessment (ERA) index to predict 2-year mortality and nursing home placement among community dwelling older adults. Arch Gerontol Geriatr. 2012;54(1):34-38. doi: 10.1016/j.archger.2011.02.012. PubMed
16. Biehl M, Takahashi PY, Cha SS, Chaudhry R, Gajic O, Thorsteinsdottir B. Prediction of critical illness in elderly outpatients using elder risk assessment: a population-based study. Clin Interv Aging. 2016;11:829-834. doi: 10.2147/CIA.S99419. PubMed
17. Takahashi PY, Haas LR, Quigg SM, et al. 30-day hospital readmission of older adults using care transitions after hospitalization: a pilot prospective cohort study. Clin Interv Aging. 2013;8:729-736. doi: 10.2147/CIA.S44390. PubMed
18. Dunlay SM, Pack QR, Thomas RJ, Killian JM, Roger VL. Participation in cardiac rehabilitation, readmissions, and death after acute myocardial infarction. Am J Med. 2014;127(6):538-546. doi: 10.1016/j.amjmed.2014.02.008. PubMed
19. Crane SJ, Tung EE, Hanson GJ, Cha S, Chaudhry R, Takahashi PY. Use of an electronic administrative database to identify older community dwelling adults at high-risk for hospitalization or emergency department visits: the elders risk assessment index. BMC Health Serv Res. 2010;10:338. doi: 10.1186/1472-6963-10-338. PubMed
20. Charlson ME, Pompei P, Ales KL, MacKenzie CR. A new method of classifying prognostic comorbidity in longitudinal studies: development and validation. J Chronic Dis. 1987;40(5):373-383. doi: 10.1016/0021-9681(87)90171-8. PubMed
21. Collin C, Wade DT, Davies S, Horne V. The Barthel ADL Index: a reliability study. Int Disabil Stud. 1988;10(2):61-63. doi: 10.3109/09638288809164103. PubMed
22. Sulter G, Steen C, De Keyser J. Use of the Barthel index and modified Rankin scale in acute stroke trials. Stroke. 1999;30(8):1538-1541. doi: 10.1161/01.STR.30.8.1538. PubMed
23. Bohannon RW. Reference values for the timed up and go test: A descriptive meta-analysis. J Geriatr Phys Ther. 2006;29(2):64-68. doi: 10.1519/00139143-200608000-00004. PubMed
24. Kokmen E, Naessens JM, Offord KP. A short test of mental status: description and preliminary results. Mayo Clin Proc. 1987;62(4):281-288. doi: 10.1016/S0025-6196(12)61905-3. PubMed
25. Folstein MF, Folstein SE, McHugh PR. “Mini-mental state”. A practical method for grading the cognitive state of patients for the clinician. J Psychiatr Res. 1975;12(3):189-198. doi: 10.1016/0022-3956(75)90026-6. PubMed
26. Galvin JE, Roe CM, Powlishta KK, et al. The AD8: A brief informant interview to detect dementia. Neurology. 2005;65(4):559-564. doi: 10.1212/01.wnl.0000172958.95282.2a. PubMed
27. Farrell B, Szeto W, Shamji S. Drug-related problems in the frail elderly. Can Fam Phys. 2011;57(2):168-169. PubMed
28. Chen CY, Thorsteinsdottir B, Cha SS, et al. Health care outcomes and advance care planning in older adults who receive home-based palliative care: a pilot cohort study. J Palliat Med. 2015;18(1):38-44. doi: 10.1089/jpm.2014.0150. PubMed
29. Rao A, Suliman A, Vuik S, Aylin P, Darzi A. Outcomes of dementia: systematic review and meta-analysis of hospital administrative database studies. Arch Gerontol Geriatr. 2016;66(Suppl C):198-204. doi: 10.1016/j.archger.2016.06.008. PubMed
30. Gozalo P, Teno JM, Mitchell SL, et al. End-of-life transitions among nursing home residents with cognitive issues. N Engl J Med. 2011;365(13):1212-1221. doi: 10.1056/NEJMsa1100347. PubMed
31. Wang SY, Aldridge MD, Gross CP, Canavan M, Cherlin E, Bradley E. End-of-life care transition patterns of Medicare beneficiaries. J Am Geriatr Soc. 2017;65(7):1406-1413. doi: 10.1111/jgs.14891. PubMed
32. Pedersen MK, Meyer G, Uhrenfeldt L. Risk factors for acute care hospital readmission in older persons in Western countries: a systematic review. JBI Database System Rev Implement Rep. 2017;15(2):454-485. doi: 10.11124/JBISRIR-2016-003267. PubMed
33. Edwards ST, Saha S, Prentice JC, Pizer SD. Preventing hospitalization with Veterans Affairs home-based primary care: which individuals benefit most? J Am Geriatr Soc. 2017;65(8):1676-1683. doi: 10.1111/jgs.14843. PubMed
34. Mitchell SL, Palmer JA, Volandes AE, Hanson LC, Habtemariam D, Shaffer ML. Level of care preferences Among nursing home residents With advanced dementia. J Pain Symptom Manage. 2017;54(3):340-345. doi: 10.1016/j.jpainsymman.2017.04.020. PubMed
35. D’Avolio DA, Strumpf NE, Feldman J, Mitchell P, Rebholz CM. Barriers to primary care: perceptions of older adults utilizing the ED for nonurgent visits. Clin Nurs Res. 2013;22(4):416-431. doi: 10.1177/1054773813485597. PubMed
36. Brinkman-Stoppelenburg A, Rietjens JA, van der Heide A. The effects of advance care planning on end-of-life care: a systematic review. Palliat Med. 2014;28(8):1000-1025. doi: 10.1177/0269216314526272. PubMed
37. Martin RS, Hayes B, Gregorevic K, Lim WK. The effects of advance care planning interventions on nursing home residents: A systematic review. J Am Med Dir Assoc. 2016;17(4):284-293. doi: 10.1016/j.jamda.2015.12.017. PubMed
38. Auerbach AD, Kripalani S, Vasilevskis EE, et al. Preventability and causes of readmissions in a national cohort of general medicine patients. JAMA Intern Med. 2016;176(4):484-493. doi: 10.1001/jamainternmed.2015.7863. PubMed
39. Parrinello G, Torres D, Paterna S, et al. Early and personalized ambulatory follow-up to tailor furosemide and fluid intake according to congestion in post-discharge heart failure. Intern Emerg Med. 2013;8(3):221-228. doi: 10.1007/s11739-011-0602-y. PubMed
40. Barnett ML, Hsu J, McWilliams JM. Patient characteristics and differences in hospital readmission rates. JAMA Intern Med. 2015;175(11):1803-1812. doi: 10.1001/jamainternmed.2015.4660. PubMed
41. Calvillo–King L, Arnold D, Eubank KJ, et al. Impact of social factors on risk of readmission or mortality in pneumonia and heart failure: systematic review. J Gen Intern Med. 2013;28(2):269-282. doi: 10.1007/s11606-012-2235-x. PubMed
42. Rönneikkö JK, Mäkelä M, Jämsen ER, et al. Predictors for unplanned hospitalization of New Home care clients. J Am Geriatr Soc. 2017;65(2):407-414. doi: 10.1111/jgs.14486. PubMed
43. Hasan O, Meltzer DO, Shaykevich SA, et al. Hospital readmission in general medicine patients: a prediction model. J Gen Intern Med. 2010;25(3):211-219. doi: 10.1007/s11606-009-1196-1. PubMed
44. St Sauver JL, Grossardt BR, Leibson CL, Yawn BP, Melton LJ, 3rd, Rocca WA. Generalizability of epidemiological findings and public health decisions: an illustration from the Rochester Epidemiology Project. Mayo Clin Proc. 2012;87(2):151-160. doi: 10.1016/j.mayocp.2011.11.009. PubMed
© 2019 Society of Hospital Medicine
Follow Up of Incidental High-Risk Pulmonary Nodules on Computed Tomography Pulmonary Angiography at Care Transitions
Computed tomography pulmonary angiography (CTPA) is often used in the evaluation of suspected pulmonary embolism (PE). The detection of incidental findings that require follow-up is common; in just over 50% of cases, those incidental findings are pulmonary nodules.1 Although the majority of these nodules are benign, Fleischner Society guidelines2 recommend that patients with nodules at high risk for malignancy should undergo follow-up CT imaging within 3-12 months, with patients who smoke and have large nodules requiring closer follow up.
The failure to follow-up on abnormal test results is known to contribute to diagnostic error and can lead to patient harm.3 We sought to determine the proportion of high-risk pulmonary nodules on CTPA which did not undergo the recommended follow-up imaging.
Study Setting and Design
This retrospective cohort study included all patients who underwent CTPA in the emergency department (ED) and inpatient settings at three academic health centers (Mount Sinai Hospital, Toronto General Hospital, and Toronto Western Hospital) in Toronto, Canada between September 1, 2014, and August 31, 2015.
We examined the proportion of patients with pulmonary nodules requiring follow up who received repeat CT imaging within six weeks of the time frame recommended by the radiologist. Since we were interested in measuring the rate of an important test result that is missed (rather than accuracy of the test itself), we defined “requiring follow up” as the inclusion of explicit recommendations for follow up in the radiology report.
Montage (Philadelphia, Pennsylvania), a natural language processing software, was applied to a linked radiology information system (RIS) to identify all CTPAs that contained pulmonary nodules. We conducted manual chart review to confirm software accuracy. We initially searched the RIS for all CTPAs that were completed within the study period, resulting in the identification of 1932 imaging studies. Following a review of these 1,932 studies, we excluded 22 as they were not CTPAs. We then applied the search term, “nodule-” to 1,910 confirmed CTPAs, resulting in the identification of 836 imaging studies. Following a review of these 836 studies, we excluded 10 as they were duplicate studies. We also excluded 152 studies where the term “nodule-” did not identify a pulmonary nodule but instead referred to a radiologist reporting the absence of pulmonary nodules (eg “there were no pulmonary nodules found”) or the presence of non-lung nodules (eg thyroid nodules). This resulted in the identification of 674 CTPAs containing pulmonary nodules (Figure 1).
Thereafter, we generated a cohort with possible new lung malignancy eligible for follow-up imaging by reviewing available health records and applying the following prespecified exclusion criteria: (1) patients who died, (2) left against medical advice, (3) were critically ill during the follow-up period, (4) lived outside the hospital catchment area (Greater Toronto Area), (5) were seen in the outpatient setting, (6) identified as palliative, (7) had an active malignancy, (8) had nodules that were already being followed, or (9) had nodules with characteristics suggestive of alternate diagnoses to lung malignancy (such as infection or inflammation) with no follow up recommended as reported by the radiologist. For patients with multiple CTPAs, we included only the first study. For each eligible patient, we determined whether follow-up imaging was completed by manually reviewing the linked RIS. We reviewed available health records to determine whether the pulmonary nodule findings had been discussed with the patient and whether the patient had attended an outpatient follow-up visit. In patients for whom recommended follow-up imaging was not confirmed, we notified the ordering physician by e-mail.
Each radiology department followed the same protocol adherent to the 2005 Fleischner guidelines for identifying nodules requiring follow up.2 Virtually all CTPAs at the three study institutions are read and reported within 72 hours. The ordering physician is sometimes called at the discretion of the reading radiologist when the findings are judged to be urgent and time-sensitive in nature. For example, the ordering physician may be contacted if a CTPA is positive for segmental PE but is not typically called for incidental pulmonary nodules. It is not common practice for ordering physicians to be notified of incidental findings above and beyond the radiology report. Primary care physicians are not typically copied on radiology reports and usually do not use the same electronic health record.
Statistical Analysis
We calculated simple descriptive statistics for all results. Mean values were compared using two-tailed t-tests, categorical groups using chi-square tests, and median values using Mann-Whitney U tests. We performed all analyses using Microsoft Excel version 16.14.1 (Redmond, Washington).
Ethics Approval
This study was approved by each institution’s research ethics board.
RESULTS
Follow Up of Incidental High-Risk Pulmonary Nodules
Of the 1910 CTPAs performed over the study period (Figure), 674 (35.3%) contained pulmonary nodules. Of the 259 patients with new pulmonary nodules eligible for follow-up imaging, 194 (74.9%) did not have an explicit suggestion for follow up by the radiologist. Ninety-five percent of radiologists (184 out of 194) provided an explanation for not recommending follow up in the radiology report; the two most common reasons were small nodule size (often described as “tiny”) and no interval change compared with the prior imaging study.2 Of the 65 patients who did receive an explicit suggestion for follow up by radiology, 35 (53.8%) did not receive repeat imaging within the recommended time frame, allowing for a six-week grace period. Of these 35 patients, 10 eventually went on to receive delayed repeat imaging. The median follow-up time for the 30 patients who received timely repeat imaging was four months (IQR 2-6 months); in contrast, the median follow-up time for the 10 patients who received delayed repeat imaging was seven months (IQR 6-8 months), P = .01.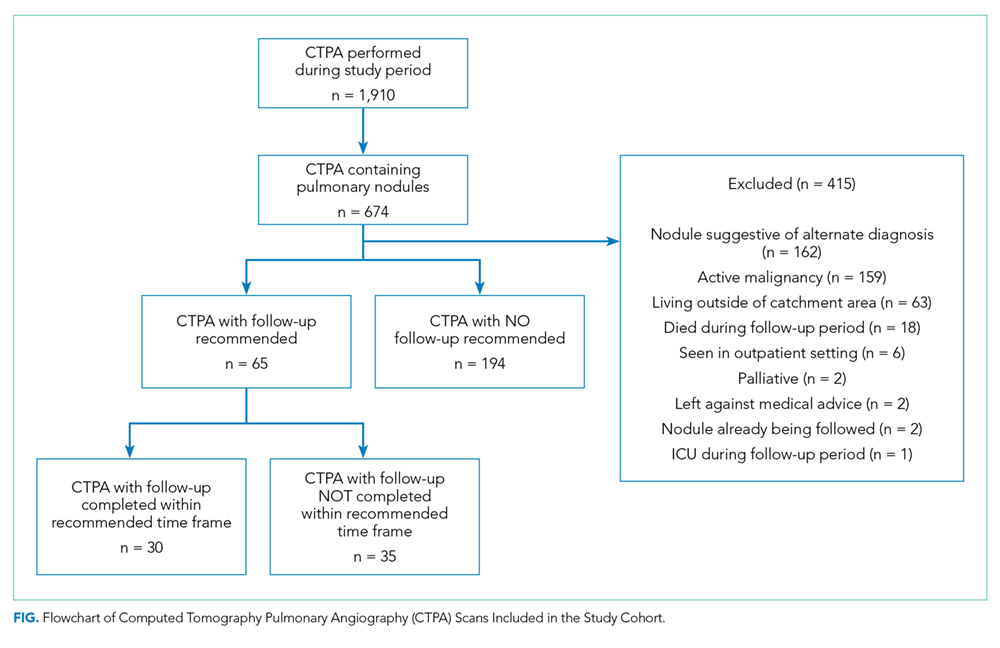
Of the 65 patients for whom follow up was recommended, the medical record showed evidence that there was a discussion between the medical team and the patient regarding patient preference for or against follow up in 55.4% (36 out of 65) of the patients. Notably, all 36 patients showed interest in receiving follow up; no patient indicated a preference for no follow up.
Furthermore, of the 65 patients that had follow up recommended, two patients were eventually diagnosed with lung cancer (one via lung biopsy, the other via positron emission tomography imaging); both patients did not receive timely follow-up imaging. While we did not include nodule size as an exclusion criterion, not one of the 65 patients included in the final cohort had nodules larger than 3 cm.
Physician Notification
In circumstances where we could not confirm that followed up had occurred, we notified the ordering physician by e-mail. Since 10 of the 35 patients who did not receive timely follow-up imaging went on to receive delayed repeat imaging, we notified 25 physicians. Of the 25 physicians that we e-mailed, 24 acknowledged receipt of the information. Of these 24 physicians, 14 reported conducting a detailed review of the chart, from which the following additional information was obtained: one patient expired, and five physicians notified the corresponding primary care physicians (two of whom were unaware of the nodule, and subsequently arranged further follow up with the patient).
Characteristics Associated with Timely Follow Up
Explicit mention that follow up was required in the discharge summary (P = .03), attending an outpatient follow-up visit (P < .001), and younger age (P = .03) were associated with receiving timely follow up; patient sex, smoking history, history of chronic obstructive pulmonary disease, lung nodule count, recommended follow-up time, and hospital department (defined as the discharging service) were not (Table).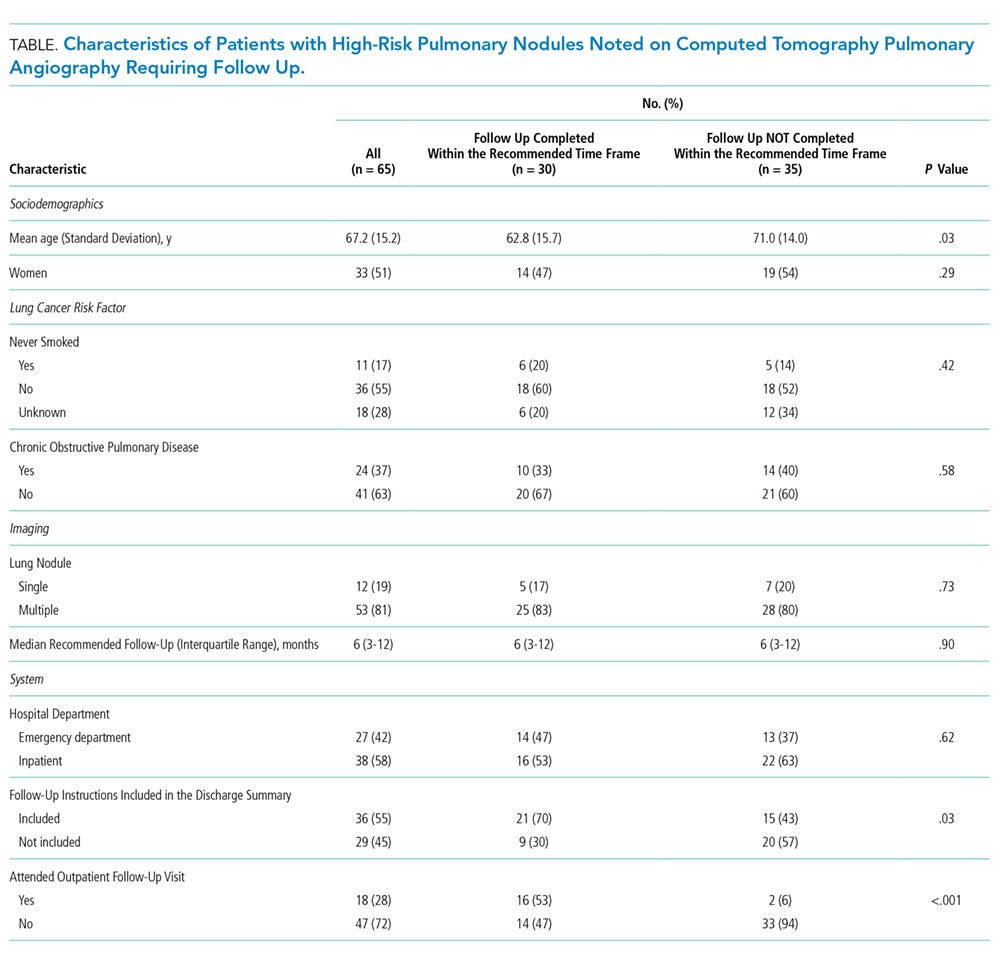
DISCUSSION
In this multicenter cohort study, over 50% of patients with new high-risk pulmonary nodules detected incidentally on CTPA did not receive timely follow-up imaging. Including follow-up recommendations in the discharge summary, attending an outpatient follow-up visit, and younger age were associated with timely follow-up imaging.
Few studies have assessed the follow up of incidental nodules identified on CTPA. In a retrospective cohort study of ED patients in the United States, Blagev et al. found that only 29% received timely follow up.4 Our study contributes to the literature in several ways. First, our study included all hospitalized patients, not only those in the ED. Notably, most of our cohort were inpatients, a group of patients not previously described. Second, we examined factors associated with timely follow up, which may help to inform future quality improvement initiatives and interventions. Third, we included data from three different hospitals, which may improve generalization. Lastly, our study draws on contemporary Canadian data. Most of the studies investigating test result follow up have been conducted in the US5,6 and Europe,7 with few empirical studies describing this phenomenon within the Canadian healthcare setting. We believe that our work contributes to the existing evidence that missed test results occur across diverse healthcare systems and have yet to be solved.5-7
Our study had limitations. First, we defined follow up as repeat imaging and did not include office visits or biopsy in this definition. Second, we may have missed repeat imaging and outpatient follow-up visits that occurred outside the study hospitals. Although we were able to determine if repeat imaging and outpatient follow-up visits (eg, pulmonology or thoracic surgery clinics) had occurred within the study hospitals, we did not have access to follow-up encounters that occurred outside of the study hospitals (eg primary care clinics). We are unaware of any published regional data on the rate of outpatient follow up at the index facility following discharge. However, we know from provincial data of patients discharged from the ED with a new cardiac diagnosis that just under half are seen by a family physician, cardiologist, or internist within seven days, with just under 80% seen within 30 days.8 Third, although we attempted to capture patient preference for or against repeat imaging using chart review, the absence of documentation of patient preference did not confirm that a discussion regarding patient preferences had not occurred. Fourth, while we did exclude patients that had an active malignancy, we did not exclude patients who were younger than 35 years or were immunocompromised, which may have led to an overestimation of the percentage of patients who did not receive follow up.
Incidental findings detected on acute diagnostic tests requiring handoffs for chronic follow up are at risk of falling through the cracks. The inclusion of follow-up recommendations in discharge summaries has been shown to increase the likelihood of follow-up completion.9 Our study provides additional evidence of the urgent need for interventions aimed at closing the loop on test result follow up.5,6
Disclosures
None of the authors have any conflicts of interest to disclose in reference to this study.
Funding
JLK is supported by the Mount Sinai Hospital Department of Medicine Research Fund. PC is supported by a K24 award from the National Institute of Arthritis and Musculoskeletal and Skin Diseases (AR062133).
1. Hall WB, Truitt SG, Scheunemann LP, et al. The prevalence of clinically relevant incidental findings on chest computed tomographic angiograms ordered to diagnose pulmonary embolism. Arch Intern Med 2009;169(21):1961. doi: 10.1001/archinternmed.2009.360. PubMed
2. Macmahon H, Austin JHM, Gamsu G, et al. Guidelines for Management of Small Pulmonary Nodules Detected on CT Scans: A Statement from the Fleischner Society. Radiology 2005;237(2):395-400. doi: 10.1148/radiol.2372041887. PubMed
3. National Academies of Sciences, Engineering, and Medicine. Improving diagnosis in health care. Washington, DC. 2015. PubMed
4. Blagev DP, Lloyd JF, Conner K, et al. Follow-up of incidental pulmonary nodules and the radiology report. J Am Coll Radiol 2014;11(4):378-383. doi: 10.1016/j.jacr.2013.08.003. PubMed
5. Callen J, Georgiou A, Li J, Westbrook JI. The safety implications of missed test results for hospitalized patients: a systematic review. BMJ Quality Safety 2011;20(2):194-199. doi: 10.1136/bmjqs.2010.044339.
6. Callen JL, Westbrook JI, Georgiou A, Li J. Failure to follow-up test results for ambulatory patients: a systematic review. J Gen Intern Med 2011;27(10):1334-1348. doi: 10.1007/s11606-011-1949-5. PubMed
7. Litchfield I, Bentham L, Lilford R, Mcmanus RJ, Hill A, Greenfield S. Test result communication in primary care: a survey of current practice. BMJ Quality Safety 2015;24(11):691-699. doi: 10.1136/bmjqs-2014-003712. PubMed
8. Atzema CL, Yu B, Ivers NM, et al. Predictors of obtaining follow-up care in the province of Ontario, Canada, following a new diagnosis of atrial fibrillation, heart failure, and hypertension in the emergency department. Cjem 2017;20(03):377-391. doi: 10.1017/cem.2017.371. PubMed
9. Moore C, McGinn T, Halm E. Tying up loose ends: Discharging patients with unresolved medical issues. Arch Intern Med 2007;167(12):1305-1311. doi: 10.1001/archinte.167.12.1305 PubMed
Computed tomography pulmonary angiography (CTPA) is often used in the evaluation of suspected pulmonary embolism (PE). The detection of incidental findings that require follow-up is common; in just over 50% of cases, those incidental findings are pulmonary nodules.1 Although the majority of these nodules are benign, Fleischner Society guidelines2 recommend that patients with nodules at high risk for malignancy should undergo follow-up CT imaging within 3-12 months, with patients who smoke and have large nodules requiring closer follow up.
The failure to follow-up on abnormal test results is known to contribute to diagnostic error and can lead to patient harm.3 We sought to determine the proportion of high-risk pulmonary nodules on CTPA which did not undergo the recommended follow-up imaging.
Study Setting and Design
This retrospective cohort study included all patients who underwent CTPA in the emergency department (ED) and inpatient settings at three academic health centers (Mount Sinai Hospital, Toronto General Hospital, and Toronto Western Hospital) in Toronto, Canada between September 1, 2014, and August 31, 2015.
We examined the proportion of patients with pulmonary nodules requiring follow up who received repeat CT imaging within six weeks of the time frame recommended by the radiologist. Since we were interested in measuring the rate of an important test result that is missed (rather than accuracy of the test itself), we defined “requiring follow up” as the inclusion of explicit recommendations for follow up in the radiology report.
Montage (Philadelphia, Pennsylvania), a natural language processing software, was applied to a linked radiology information system (RIS) to identify all CTPAs that contained pulmonary nodules. We conducted manual chart review to confirm software accuracy. We initially searched the RIS for all CTPAs that were completed within the study period, resulting in the identification of 1932 imaging studies. Following a review of these 1,932 studies, we excluded 22 as they were not CTPAs. We then applied the search term, “nodule-” to 1,910 confirmed CTPAs, resulting in the identification of 836 imaging studies. Following a review of these 836 studies, we excluded 10 as they were duplicate studies. We also excluded 152 studies where the term “nodule-” did not identify a pulmonary nodule but instead referred to a radiologist reporting the absence of pulmonary nodules (eg “there were no pulmonary nodules found”) or the presence of non-lung nodules (eg thyroid nodules). This resulted in the identification of 674 CTPAs containing pulmonary nodules (Figure 1).
Thereafter, we generated a cohort with possible new lung malignancy eligible for follow-up imaging by reviewing available health records and applying the following prespecified exclusion criteria: (1) patients who died, (2) left against medical advice, (3) were critically ill during the follow-up period, (4) lived outside the hospital catchment area (Greater Toronto Area), (5) were seen in the outpatient setting, (6) identified as palliative, (7) had an active malignancy, (8) had nodules that were already being followed, or (9) had nodules with characteristics suggestive of alternate diagnoses to lung malignancy (such as infection or inflammation) with no follow up recommended as reported by the radiologist. For patients with multiple CTPAs, we included only the first study. For each eligible patient, we determined whether follow-up imaging was completed by manually reviewing the linked RIS. We reviewed available health records to determine whether the pulmonary nodule findings had been discussed with the patient and whether the patient had attended an outpatient follow-up visit. In patients for whom recommended follow-up imaging was not confirmed, we notified the ordering physician by e-mail.
Each radiology department followed the same protocol adherent to the 2005 Fleischner guidelines for identifying nodules requiring follow up.2 Virtually all CTPAs at the three study institutions are read and reported within 72 hours. The ordering physician is sometimes called at the discretion of the reading radiologist when the findings are judged to be urgent and time-sensitive in nature. For example, the ordering physician may be contacted if a CTPA is positive for segmental PE but is not typically called for incidental pulmonary nodules. It is not common practice for ordering physicians to be notified of incidental findings above and beyond the radiology report. Primary care physicians are not typically copied on radiology reports and usually do not use the same electronic health record.
Statistical Analysis
We calculated simple descriptive statistics for all results. Mean values were compared using two-tailed t-tests, categorical groups using chi-square tests, and median values using Mann-Whitney U tests. We performed all analyses using Microsoft Excel version 16.14.1 (Redmond, Washington).
Ethics Approval
This study was approved by each institution’s research ethics board.
RESULTS
Follow Up of Incidental High-Risk Pulmonary Nodules
Of the 1910 CTPAs performed over the study period (Figure), 674 (35.3%) contained pulmonary nodules. Of the 259 patients with new pulmonary nodules eligible for follow-up imaging, 194 (74.9%) did not have an explicit suggestion for follow up by the radiologist. Ninety-five percent of radiologists (184 out of 194) provided an explanation for not recommending follow up in the radiology report; the two most common reasons were small nodule size (often described as “tiny”) and no interval change compared with the prior imaging study.2 Of the 65 patients who did receive an explicit suggestion for follow up by radiology, 35 (53.8%) did not receive repeat imaging within the recommended time frame, allowing for a six-week grace period. Of these 35 patients, 10 eventually went on to receive delayed repeat imaging. The median follow-up time for the 30 patients who received timely repeat imaging was four months (IQR 2-6 months); in contrast, the median follow-up time for the 10 patients who received delayed repeat imaging was seven months (IQR 6-8 months), P = .01.
Of the 65 patients for whom follow up was recommended, the medical record showed evidence that there was a discussion between the medical team and the patient regarding patient preference for or against follow up in 55.4% (36 out of 65) of the patients. Notably, all 36 patients showed interest in receiving follow up; no patient indicated a preference for no follow up.
Furthermore, of the 65 patients that had follow up recommended, two patients were eventually diagnosed with lung cancer (one via lung biopsy, the other via positron emission tomography imaging); both patients did not receive timely follow-up imaging. While we did not include nodule size as an exclusion criterion, not one of the 65 patients included in the final cohort had nodules larger than 3 cm.
Physician Notification
In circumstances where we could not confirm that followed up had occurred, we notified the ordering physician by e-mail. Since 10 of the 35 patients who did not receive timely follow-up imaging went on to receive delayed repeat imaging, we notified 25 physicians. Of the 25 physicians that we e-mailed, 24 acknowledged receipt of the information. Of these 24 physicians, 14 reported conducting a detailed review of the chart, from which the following additional information was obtained: one patient expired, and five physicians notified the corresponding primary care physicians (two of whom were unaware of the nodule, and subsequently arranged further follow up with the patient).
Characteristics Associated with Timely Follow Up
Explicit mention that follow up was required in the discharge summary (P = .03), attending an outpatient follow-up visit (P < .001), and younger age (P = .03) were associated with receiving timely follow up; patient sex, smoking history, history of chronic obstructive pulmonary disease, lung nodule count, recommended follow-up time, and hospital department (defined as the discharging service) were not (Table).
DISCUSSION
In this multicenter cohort study, over 50% of patients with new high-risk pulmonary nodules detected incidentally on CTPA did not receive timely follow-up imaging. Including follow-up recommendations in the discharge summary, attending an outpatient follow-up visit, and younger age were associated with timely follow-up imaging.
Few studies have assessed the follow up of incidental nodules identified on CTPA. In a retrospective cohort study of ED patients in the United States, Blagev et al. found that only 29% received timely follow up.4 Our study contributes to the literature in several ways. First, our study included all hospitalized patients, not only those in the ED. Notably, most of our cohort were inpatients, a group of patients not previously described. Second, we examined factors associated with timely follow up, which may help to inform future quality improvement initiatives and interventions. Third, we included data from three different hospitals, which may improve generalization. Lastly, our study draws on contemporary Canadian data. Most of the studies investigating test result follow up have been conducted in the US5,6 and Europe,7 with few empirical studies describing this phenomenon within the Canadian healthcare setting. We believe that our work contributes to the existing evidence that missed test results occur across diverse healthcare systems and have yet to be solved.5-7
Our study had limitations. First, we defined follow up as repeat imaging and did not include office visits or biopsy in this definition. Second, we may have missed repeat imaging and outpatient follow-up visits that occurred outside the study hospitals. Although we were able to determine if repeat imaging and outpatient follow-up visits (eg, pulmonology or thoracic surgery clinics) had occurred within the study hospitals, we did not have access to follow-up encounters that occurred outside of the study hospitals (eg primary care clinics). We are unaware of any published regional data on the rate of outpatient follow up at the index facility following discharge. However, we know from provincial data of patients discharged from the ED with a new cardiac diagnosis that just under half are seen by a family physician, cardiologist, or internist within seven days, with just under 80% seen within 30 days.8 Third, although we attempted to capture patient preference for or against repeat imaging using chart review, the absence of documentation of patient preference did not confirm that a discussion regarding patient preferences had not occurred. Fourth, while we did exclude patients that had an active malignancy, we did not exclude patients who were younger than 35 years or were immunocompromised, which may have led to an overestimation of the percentage of patients who did not receive follow up.
Incidental findings detected on acute diagnostic tests requiring handoffs for chronic follow up are at risk of falling through the cracks. The inclusion of follow-up recommendations in discharge summaries has been shown to increase the likelihood of follow-up completion.9 Our study provides additional evidence of the urgent need for interventions aimed at closing the loop on test result follow up.5,6
Disclosures
None of the authors have any conflicts of interest to disclose in reference to this study.
Funding
JLK is supported by the Mount Sinai Hospital Department of Medicine Research Fund. PC is supported by a K24 award from the National Institute of Arthritis and Musculoskeletal and Skin Diseases (AR062133).
1. Hall WB, Truitt SG, Scheunemann LP, et al. The prevalence of clinically relevant incidental findings on chest computed tomographic angiograms ordered to diagnose pulmonary embolism. Arch Intern Med 2009;169(21):1961. doi: 10.1001/archinternmed.2009.360. PubMed
2. Macmahon H, Austin JHM, Gamsu G, et al. Guidelines for Management of Small Pulmonary Nodules Detected on CT Scans: A Statement from the Fleischner Society. Radiology 2005;237(2):395-400. doi: 10.1148/radiol.2372041887. PubMed
3. National Academies of Sciences, Engineering, and Medicine. Improving diagnosis in health care. Washington, DC. 2015. PubMed
4. Blagev DP, Lloyd JF, Conner K, et al. Follow-up of incidental pulmonary nodules and the radiology report. J Am Coll Radiol 2014;11(4):378-383. doi: 10.1016/j.jacr.2013.08.003. PubMed
5. Callen J, Georgiou A, Li J, Westbrook JI. The safety implications of missed test results for hospitalized patients: a systematic review. BMJ Quality Safety 2011;20(2):194-199. doi: 10.1136/bmjqs.2010.044339.
6. Callen JL, Westbrook JI, Georgiou A, Li J. Failure to follow-up test results for ambulatory patients: a systematic review. J Gen Intern Med 2011;27(10):1334-1348. doi: 10.1007/s11606-011-1949-5. PubMed
7. Litchfield I, Bentham L, Lilford R, Mcmanus RJ, Hill A, Greenfield S. Test result communication in primary care: a survey of current practice. BMJ Quality Safety 2015;24(11):691-699. doi: 10.1136/bmjqs-2014-003712. PubMed
8. Atzema CL, Yu B, Ivers NM, et al. Predictors of obtaining follow-up care in the province of Ontario, Canada, following a new diagnosis of atrial fibrillation, heart failure, and hypertension in the emergency department. Cjem 2017;20(03):377-391. doi: 10.1017/cem.2017.371. PubMed
9. Moore C, McGinn T, Halm E. Tying up loose ends: Discharging patients with unresolved medical issues. Arch Intern Med 2007;167(12):1305-1311. doi: 10.1001/archinte.167.12.1305 PubMed
© 2019 Society of Hospital Medicine
VA Forges a Historic Partnership with the National Shooting Sports Foundation and the American Foundation for Suicide Prevention to Prevent Veteran Suicide
As new standards for access dominated recent media coverage of veterans’ health care headlines, the launch of a historically unprecedented collaboration to prevent veterans’ suicide went completely unnoticed.
On January 31, the Department of Veterans Affairs (VA) announced a partnership with the National Shooting Sports Foundation (NSSF), a firearms industry association that works to promote, protect and preserve hunting and shooting sports, and the American Foundation for Suicide Prevention (AFSP), the nation’s largest suicide prevention organization. Together, they are developing a program that empowers communities to engage in safe firearm-storage practices. The program includes information on creating community coalitions that promote and sustain firearm safety, with an emphasis on reaching service members, veterans and their families.
This partnership represents the nation’s biggest advance in forging common ground on an issue where polarization has interfered with lifesaving initiatives. It’s a game changer.
In 2016, about 69% of veteran suicides in the US (71% among male and 41% among female veterans) resulted from a firearm injury. In comparison, the proportion of suicides resulting from a firearm injury among nonveteran adults was 48%.1 The majority of veteran suicides occur with those who do not seek care within the VA healthcare system, which has led the VA to broaden its focus to reach all veterans.
Given the frequency of firearm use as a method of suicide, VA recognizes that suicide prevention efforts must address how veterans store their firearms. The decision to take an action to kill oneself is at times made impulsively—in just a matter of minutes. Securely storing firearms creates precious time and physical space between an individual’s period of risk and the means to act. Studies have demonstrated that delaying access to deadly means can save a life.
VA is striving to be a national leader in suicide prevention, and lethal means safety is an important component of the department’s approach. VA’s lethal means safety initiatives encourage veterans to voluntarily store their firearms safely. Key to this approach is to train mental health and peer providers in veteran-centric counseling methods while promoting resources, including a national consultation call line for both VA and community providers seeking guidance for treatment practices or engaging a veteran in care.
Because many veterans believe that firearms must remain in their homes under all circumstances, in 2018 the VA held the first of its kind open-innovation challenge for safe firearm storage. This challenge led to the creation of numerous lifesaving product designs, which are now under development in the private sector.
The latest partnership further advances VA’s effort to ensure that lethal means safety counseling is culturally relevant, comes from a trusted source and contains no anti-firearm bias. VA respects the important role firearms play in many veterans’ lives and is committed to educating veterans and their families about safe storage of firearms in a way that is consistent with each veteran’s values and priorities.
Nothing will be more effective in diminishing suicide than correcting the false belief among many veterans that the VA wants to take away veterans’ guns. When that misperception is corrected, not only would more at-risk veterans seek out VA mental health care, but it also could become commonplace for veterans, families and friends to speak up because, “Buddies talk to buddies in crisis about safely storing guns.” This is especially important for veterans in rural areas, where the rates of firearm ownership and suicide are the highest. Joining forces with NSSF could spearhead such a shift.
The VA, NSSF and AFSP should be lauded for bridging the divide and driving this far-reaching breakthrough in firearm safety conversations and community alliances. The effort will not only save countless veterans’ lives, but also forge a path to mitigate our national tragedy of suicide.
1. US Department of Veterans Affairs. VA national suicide data report 2005-2016. https://www.mentalhealth.va.gov/docs/data-sheets/OMHSP_National_Suicide_Data_Report_2005-2016_508.pdf. Updated September 2018. Accessed February 15, 2019.
As new standards for access dominated recent media coverage of veterans’ health care headlines, the launch of a historically unprecedented collaboration to prevent veterans’ suicide went completely unnoticed.
On January 31, the Department of Veterans Affairs (VA) announced a partnership with the National Shooting Sports Foundation (NSSF), a firearms industry association that works to promote, protect and preserve hunting and shooting sports, and the American Foundation for Suicide Prevention (AFSP), the nation’s largest suicide prevention organization. Together, they are developing a program that empowers communities to engage in safe firearm-storage practices. The program includes information on creating community coalitions that promote and sustain firearm safety, with an emphasis on reaching service members, veterans and their families.
This partnership represents the nation’s biggest advance in forging common ground on an issue where polarization has interfered with lifesaving initiatives. It’s a game changer.
In 2016, about 69% of veteran suicides in the US (71% among male and 41% among female veterans) resulted from a firearm injury. In comparison, the proportion of suicides resulting from a firearm injury among nonveteran adults was 48%.1 The majority of veteran suicides occur with those who do not seek care within the VA healthcare system, which has led the VA to broaden its focus to reach all veterans.
Given the frequency of firearm use as a method of suicide, VA recognizes that suicide prevention efforts must address how veterans store their firearms. The decision to take an action to kill oneself is at times made impulsively—in just a matter of minutes. Securely storing firearms creates precious time and physical space between an individual’s period of risk and the means to act. Studies have demonstrated that delaying access to deadly means can save a life.
VA is striving to be a national leader in suicide prevention, and lethal means safety is an important component of the department’s approach. VA’s lethal means safety initiatives encourage veterans to voluntarily store their firearms safely. Key to this approach is to train mental health and peer providers in veteran-centric counseling methods while promoting resources, including a national consultation call line for both VA and community providers seeking guidance for treatment practices or engaging a veteran in care.
Because many veterans believe that firearms must remain in their homes under all circumstances, in 2018 the VA held the first of its kind open-innovation challenge for safe firearm storage. This challenge led to the creation of numerous lifesaving product designs, which are now under development in the private sector.
The latest partnership further advances VA’s effort to ensure that lethal means safety counseling is culturally relevant, comes from a trusted source and contains no anti-firearm bias. VA respects the important role firearms play in many veterans’ lives and is committed to educating veterans and their families about safe storage of firearms in a way that is consistent with each veteran’s values and priorities.
Nothing will be more effective in diminishing suicide than correcting the false belief among many veterans that the VA wants to take away veterans’ guns. When that misperception is corrected, not only would more at-risk veterans seek out VA mental health care, but it also could become commonplace for veterans, families and friends to speak up because, “Buddies talk to buddies in crisis about safely storing guns.” This is especially important for veterans in rural areas, where the rates of firearm ownership and suicide are the highest. Joining forces with NSSF could spearhead such a shift.
The VA, NSSF and AFSP should be lauded for bridging the divide and driving this far-reaching breakthrough in firearm safety conversations and community alliances. The effort will not only save countless veterans’ lives, but also forge a path to mitigate our national tragedy of suicide.
1. US Department of Veterans Affairs. VA national suicide data report 2005-2016. https://www.mentalhealth.va.gov/docs/data-sheets/OMHSP_National_Suicide_Data_Report_2005-2016_508.pdf. Updated September 2018. Accessed February 15, 2019.
1. US Department of Veterans Affairs. VA national suicide data report 2005-2016. https://www.mentalhealth.va.gov/docs/data-sheets/OMHSP_National_Suicide_Data_Report_2005-2016_508.pdf. Updated September 2018. Accessed February 15, 2019.
Population Management of Nonalcoholic Fatty Liver Disease
Nonalcoholic fatty liver disease (NAFLD) is an umbrella term that covers a spectrum of phenotypes ranging from nonalcoholic fatty liver or simple hepatic steatosis to nonalcoholic steatohepatitis (NASH) defined by histologic findings of steatosis, lobular inflammation, cytologic ballooning, and some degree of fibrosis.1 While frequently observed in patients with at least 1 risk factor (eg, obesity, diabetes mellitus [DM], dyslipidemia, hypertension), NAFLD also is an independent risk factor for type 2 DM (T2DM), chronic kidney disease, and cardiovascular disease.2 At early disease stages with absence of liver fibrosis, mortality is linked to cardiovascular and not liver disease. However, in the presence of NASH, fibrosis progression to liver cirrhosis, or hepatocellular carcinoma (HCC) represent the most important liver-related outcomes that determine morbidity and mortality.3 Mirroring the obesity and T2DM epidemics, the health care burden is projected to dramatically rise.
In the following article, we will discuss how the Veterans Health Administration (VHA) is well positioned to implement an organizational strategy of comprehensive care for veterans with NAFLD. This comprehensive care strategy should include the development of a NAFLD clinic offering care for comorbid conditions frequently present in these patients, point-of-care testing, access to clinical trials, and outcomes monitoring as a key performance target for providers and the respective facility.
NAFLD disease burden
To fully appreciate the burden of a chronic disease like NAFLD, it is important to assess its long- and short-term consequences in a comprehensive manner with regard to its clinical impact, impact on the patient, and economic impact (Figure 1). 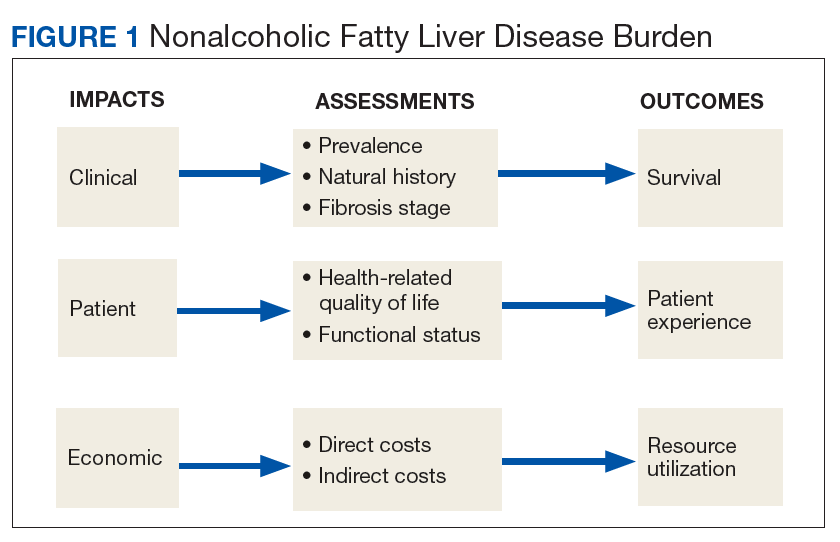
Clinical Impact
Clinical impact is assessed based on the prevalence and natural history of NAFLD and the liver fibrosis stage and determines patient survival. Coinciding with the epidemic of obesity and T2DM, the prevalence of NAFLD in the general population in North America is 24% and even higher with older age and higher body mass index (BMI).4,5 The prevalence for NAFLD is particularly high in patients with T2DM (47%). Of patients with T2DM and NAFLD, 65% have biopsy-proven NASH of which 15% have bridging fibrosis or liver cirrhosis.6
NAFLD is the fastest growing cause of cirrhosis in the US with a forecasted NAFLD population of 101 million by 2030.7 At the same time, the number of patients with NASH will rise to 27 million of which > 7 million will have bridging fibrosis or liver cirrhosis; hepatic decompensation events are estimated to occur in 105,430 patients with liver cirrhosis, posing a major public health threat related to organ availability for liver transplantation.8 Since 2013, NAFLD has been the second leading cause for liver transplantation and the top reason for transplantation in patients aged < 50 years.9,10 As many patients with NAFLD are diagnosed with HCC at stages where liver transplantation is not an option, mortality from HCC in NAFLD patients is higher than with other etiologies as treatment options are restricted.11,12
Compared with that of the general population, veterans seeking care are older and sicker with 43% of veterans taking > 5 prescribed medications.13 Of those receiving VHA care, 6.6 million veterans are either overweight or obese; 165,000 are morbidly obese with a BMI > 40.14 In addition, veterans are 2.5 times more likely to have T2DM compared with that of nonveterans. Because T2DM and obesity are the most common risk factors for NAFLD, it is not surprising that NAFLD prevalence among veterans rose 3-fold from 2003 to 2011.15 It is now estimated that 540,000 veterans will progress to NASH and 108,000 will develop bridging fibrosis or liver cirrhosis by 2030.8 Similar to that of the general population, liver cirrhosis is attributed to NAFLD in 15% of veterans.15,16 NAFLD is the third most common cause of cirrhosis and HCC, occurring at an average age of 66 years and 70 years, respectively.16,17 Shockingly, 20% of HCCs were not linked to liver cirrhosis and escaped recommended HCC screening for patients with cirrhosis.18,19
Patient Impact
Assessment of disease burden should not be restricted to clinical outcomes as patients can experience a range of symptoms that may have significant impact on their health-related quality of life (QOL) and functional status.20 Using general but not disease-specific instruments, NAFLD patients reported outcomes score low regarding fatigue, activity, and emotions.21 More disease-specific questionnaires may provide better and disease-specific insights as how NASH impacts patients’ QOL.22-24
Economic Impact
There is mounting evidence that the clinical implications of NAFLD directly influence the economic burden of NAFLD.25 The annual burden associated with all incident and prevalent NAFLD cases in the US has been estimated at $103 billion, and projections suggest that the expected 10-year burden of NAFLD may increase to $1.005 trillion.26 It is anticipated that increased NAFLD costs will affect the VHA with billions of dollars in annual expenditures in addition to the $1.5 billion already spent annually for T2DM care (4% of the VA pharmacy budget is spent on T2DM treatment).27-29
Current Patient Care
Obesity, DM, and dyslipidemia are common conditions managed by primary care providers (PCPs). Given the close association of these conditions with NAFLD, the PCP is often the first point of medical contact for patients with or at risk for NAFLD.30 For that reason, PCP awareness of NAFLD is critical for effective management of these patients. PCPs should be actively involved in the management of patients with NAFLD with pathways in place for identifying patients at high risk of liver disease for timely referral to a specialist and adequate education on the follow-up and treatment of low-risk patients. Instead, diagnosis of NAFLD is primarily triggered by either abnormal aminotransferases or detection of steatosis on imaging performed for other indications.
Barriers to optimal management of NAFLD by PCPs have been identified and occur at different levels of patient care. In the absence of clinical practice guidelines by the American Association of Family Practice covering NAFLD and a substantial latency period without signs of symptoms, NAFLD may not be perceived as a potentially serious condition by PCPs and their patients; interestingly this holds true even for some medical specialties.31-39 More than half of PCPs do not test their patients at highest risk for NAFLD (eg, patients with obesity or T2DM) and may be unaware of practice guidelines.40-42
Guidelines from Europe and the US are not completely in accordance. The US guidelines are vague regarding screening and are supported by only 1 medical society, due to the lack of NASH-specific drug therapies. The European guidelines are built on the support of 3 different stakeholders covering liver diseases, obesity, and DM and the experience using noninvasive liver fibrosis assessments for patients with NAFLD. To overcome this apparent conflict, a more practical and risk-stratified approach is warranted.41,42
Making the diagnosis can be challenging in cases with competing etiologies, such as T2DM and alcohol misuse. There also is an overreliance on aminotransferase levels to diagnose NAFLD. Significant liver disease can exist in the presence of normal aminotransferases, and this may be attributed to either spontaneous aminotransferase fluctuations or upper limits of normal that have been chosen too high.43-47 Often additional workup by PCPs depends on the magnitude of aminotransferase abnormalities.
Even if NAFLD has been diagnosed by PCPs, identifying those with NASH is hindered by the absence of an accurate noninvasive diagnostic method and the need to perform a liver biopsy. Liver biopsy is often not considered or delayed to monitor patients with serial aminotransferases, regardless of the patient’s metabolic comorbidity profile or baseline aminotransferases.32 As a result, referral to a specialist often depends on the magnitude of the aminotransferase abnormality,30,48 and often occurs when advanced liver disease is already present.49 Finally, providers may not be aware of beneficial effects of lifestyle interventions and certain medications, including statins on NASH and liver fibrosis.50-53 As NAFLD is associated with excess cardiovascular- and cancer-related morbidity and mortality, it is possible that regression of NAFLD may improve associated risk for these outcomes as well.
Framework for Comprehensive NAFLD Care
Chronic liver diseases and associated comorbidities have long been addressed by PCPs and specialty providers working in isolation and within the narrow focus of each discipline. Contrary to working in silos of the past, a coordinated management strategy with other disciplines that cover these comorbidities needs to be established, or alternatively the PCP must be aware of the management of comorbidities to execute them independently. Integration of hepatology-driven NAFLD care with other specialties involves communication, collaboration, and sharing of resources and expertise that will address patient care needs. Obviously, this cannot be undertaken in a single outpatient visit and requires vertical and longitudinal follow-up over time. One important aspect of comprehensive NAFLD care is the targeting of a particular patient population rather than being seen as a panacea for all; cost-utility analysis is hampered by uncertainties around accuracy of noninvasive biomarkers reflecting liver injury and a lack of effectiveness data for treatment. However, it seems reasonable to screen patients at high risk for NASH and adverse clinical outcomes. Such a risk stratification approach should be cost-effective.
A first key step by the PCP is to identify whether a patient is at risk, especially patients with NASH. The majority of patients at risk are already seen by PCPs. While there is no consensus on ideal screening for NAFLD by PCPs, the use of ultrasound in the at-risk population is recommended in Europe.42 Although NASH remains a histopathologic diagnosis, a reasonable approach is to define NASH based on clinical criteria as done similarly in a real-world observational NAFLD cohort study.54 In the absence of chronic alcohol consumption and viral hepatitis and in a real-world scenario, NASH can be defined as steatosis shown on liver imaging or biopsy and alanine aminotransferase (ALT) levels of > 25 U/L. In addition, ≥ 1 of the following criteria must be met: BMI > 30, T2DM, dyslipidemia, or metabolic syndrome (Table 1). 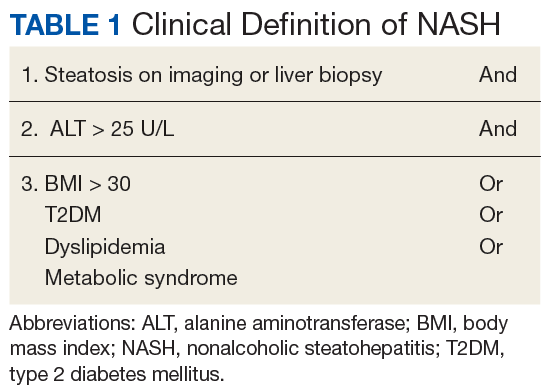
In the absence of easy-to-use validated tests, all patients with NAFLD need to be assessed with simple, noninvasive scores for the presence of clinically relevant liver fibrosis (F2-portal fibrosis with septa; F3-bridging fibrosis; F4-liver cirrhosis); those that meet the fibrosis criteria should receive further assessment usually only offered in a comprehensive NAFLD clinic.1 PCPs should focus on addressing 2 aspects related to NAFLD: (1) Does my patient have NASH based on clinical criteria; and (2) Is my patient at risk for clinically relevant liver fibrosis? PCPs are integral in optimal management of comorbidities and metabolic syndrome abnormalities with lifestyle and exercise interventions.
The care needs of a typical patient with NAFLD can be classified into 3 categories: liver disease (NAFLD) management, addressing NAFLD associated comorbidities, and attending to the personal care needs of the patient. With considerable interactions between these categories, interventions done within the framework of 1 category can influence the needs pertaining to another, requiring closer monitoring of the patient and potentially modifying care. For example, initiating a low carbohydrate diet in a patient with DM and NAFLD who is on antidiabetic medication may require adjusting the medication; disease progression or failure to achieve treatment goals may affect the emotional state of the patient, which can affect adherence.
Referrals to a comprehensive NAFLD clinic need to be standardized. Clearly, the referral process depends in part on local resources, comprehensiveness of available services, and patient characteristics, among others. Most often, PCPs refer patients with suspected diagnosis of NAFLD, with or without abnormal aminotransferases, to a hepatologist to confirm the diagnosis and for disease staging and liver disease management. This may have the advantage of greatest extent of access and should limit the number of patients with advanced liver fibrosis who otherwise may have been missed. On the other hand, different thresholds of PCPs for referrals may delay the patient’s access to comprehensive NAFLD care. Of those referred by primary care, the hepatologist identifies patients with NAFLD who benefit most from a comprehensive care approach. This automated referral process without predefined criteria remains more a vision than reality as it would require an infrastructure and resources that no health care system can provide currently.
The alternative approach of automatic referral may use predefined criteria related to patients’ diagnoses and prognoses (Figure 2). 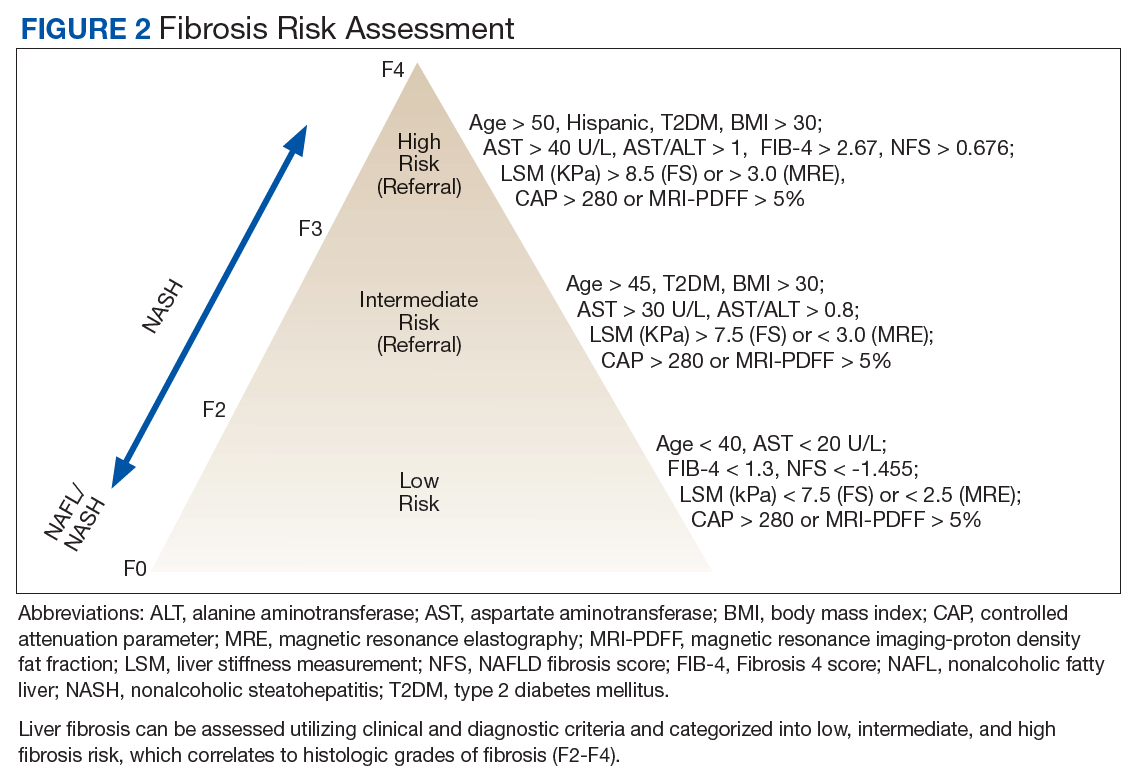
Patient-Centered Care
At present the narrow focus of VHA specialty outpatient clinics associated with time constraints of providers and gaps in NAFLD awareness clearly does not address the complex metabolic needs of veterans with NAFLD. This is in striking contrast to the comprehensive care offered to patients with cancer. To overcome these limitations, new care delivery models need to be explored. At first it seems attractive to embed NAFLD patient care geographically into a hepatology clinic with the potential advantages of improving volume and timeliness of referral and reinforcing communication among specialty providers while maximizing convenience for patients. However, this is resource intensive not only concerning clinic space, but also in terms of staffing clinics with specialty providers.
Patient-centered care for veterans with NAFLD seems to be best organized around a comprehensive NAFLD clinic with access to specialized diagnostics and knowledge in day-to-day NAFLD management. This evolving care concept has been developed already for patients with liver cirrhosis and inflammatory bowel disease and considers NAFLD a chronic disease that cannot be addressed sufficiently by providing episodic care.55,56 The development of comprehensive NAFLD care can build on the great success of the Hepatitis Innovation Team Collaborative that employed lean management strategies with local and regional teams to facilitate efforts to make chronic hepatitis C virus a rare disease in the VHA.57
NAFLD Care Team
Given the central role of the liver and gastrointestinal tract in the field of nutrition, knowledge of the pathophysiology of the liver and digestive tract as well as emerging therapeutic options offered via metabolic endoscopy uniquely positions the hepatologist/gastroenterologist to take the lead in managing NAFLD. Treating NAFLD is best accomplished when the specialist partners with other health care providers who have expertise in the nutritional, behavioral, and physical activity aspects of treatment. The composition of the NAFLD care team and the roles that different providers fulfill can vary depending on the clinical setting; however, the hepatologist/gastroenterologist is best suited to lead the team, or alternatively, this role can be fulfilled by a provider with liver disease expertise.
Based on experiences from the United Kingdom, the minimum staffing of a NAFLD clinic should include a physician and nurse practitioner who has expertise in managing patients with chronic liver disease, a registered nurse, a dietitian, and a clinical pharmacy specialist (CPS).58 With coexistent diseases common and many veterans who have > 5 prescribed medications, risk of polypharmacy and adverse drug reactions are a concern, particularly since adherence in patients with chronic diseases has been reported to be as low as 43%.59-61 Risk of medication errors and serious adverse effects are magnified by difficulties with patient adherence, medication interactions, and potential need for frequent dose adjustments, particularly when on a weight-loss diet.
Without doubt, comprehensive medication management, offered by a highly trained CPS with independent prescriptive authority occurring while the veteran is in the NAFLD clinic, is highly desirable. Establishing a functional statement and care coordination agreement could describe the role of the CPS as a member of the NAFLD provider team. 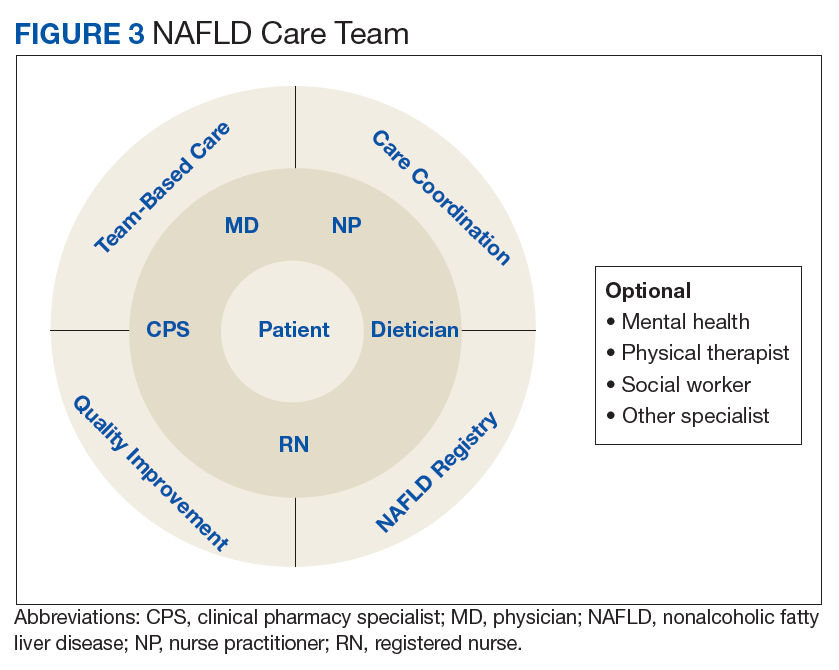
Patient Evaluation
After being referred to the NAFLD clinic, the veteran should have a thorough assessment, including medical, nutritional, physical activity, exercise, and psychosocial evaluations (Figure 4). 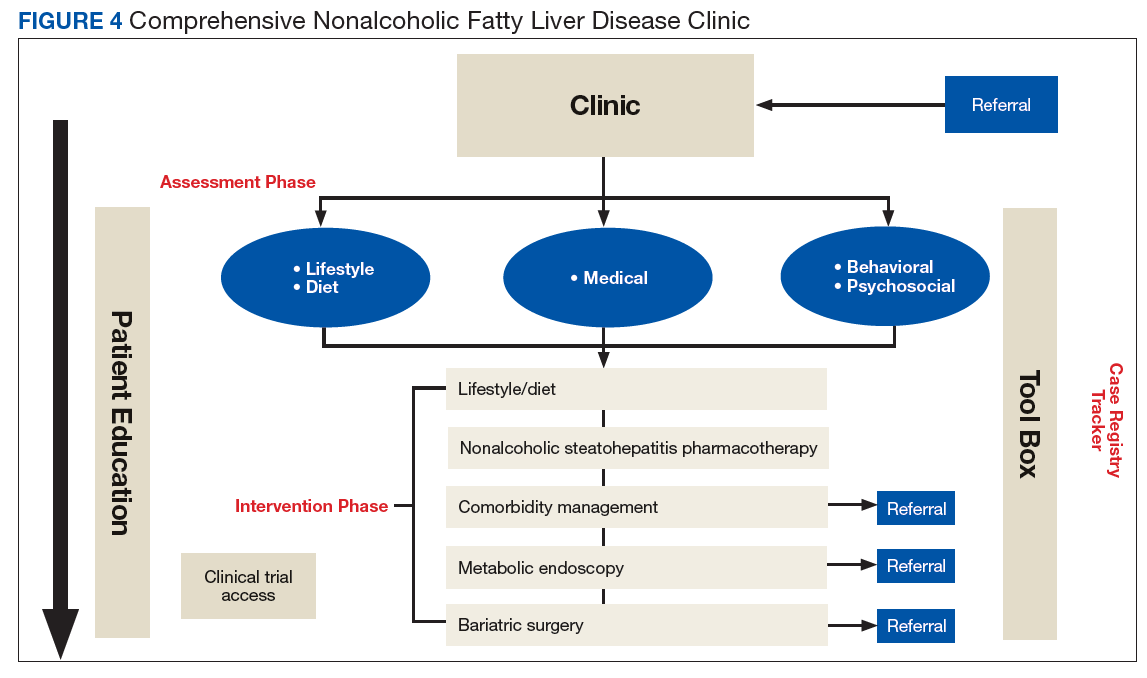
The assessment also should include patient education to ensure that the patient has sufficient knowledge and skills to achieve the treatment goals. Educating on NAFLD is critical as most patients with NAFLD do not think of themselves as sick and have limited readiness for lifestyle changes.63,64 A better understanding of NAFLD combined with a higher self-efficacy seems to be positively linked to better nutritional habits.65
An online patient-reported outcomes measurement information system for a patient with NAFLD (eg, assessmentcenter.net) may be beneficial and can be applied within a routine NAFLD clinic visit because of its multidimensionality and compatibility with other chronic diseases.66-68 Other tools to assess health-related QOL include questionnaires, such as the functional assessment of chronic illness therapy-fatigue, work productivity and activity impairment questionnaire: specific health problem, Short Form-36, and chronic liver disease questionnaire-NAFLD.23,69
The medical evaluation includes assessment of secondary causes of NAFLD and identification of NAFLD-related comorbidities. Weight, height, blood pressure, waist circumference, and BMI should be recorded. The physical exam should focus on signs of chronic liver disease and include inspection for acanthosis nigricans, hirsutism, and large neck circumference, which are associated with insulin resistance, polycystic ovarian syndrome, and obstructive sleep apnea, respectively. NAFLD-associated comorbidities may contribute to frailty or physical limitations that affect treatment with diet and exercise and need to be assessed. A thorough medication reconciliation will reveal whether the patient is prescribed obesogenic medications and whether comorbidities (eg, DM and dyslipidemia) are being treated optimally and according to current society guidelines.
Making the diagnosis of NAFLD requires excluding other (concomitant) chronic liver diseases. While often this is done indirectly using order sets with a panoply of available serologic tests without accounting for risks for rare causes of liver injury, a more focused and cost-effective approach is warranted. As most patients will already have had imaging studies that show fatty liver, assessment of liver fibrosis is an important step for risk stratification. Noninvasive scores (eg, FIB-4) can be used by the PCP to identify high-risk patients requiring further workup and referral.1,70 More sophisticated tools, including transient elastography and/or magnetic resonance elastography are applied for more sophisticated risk stratification and liver disease management (Table 2).71 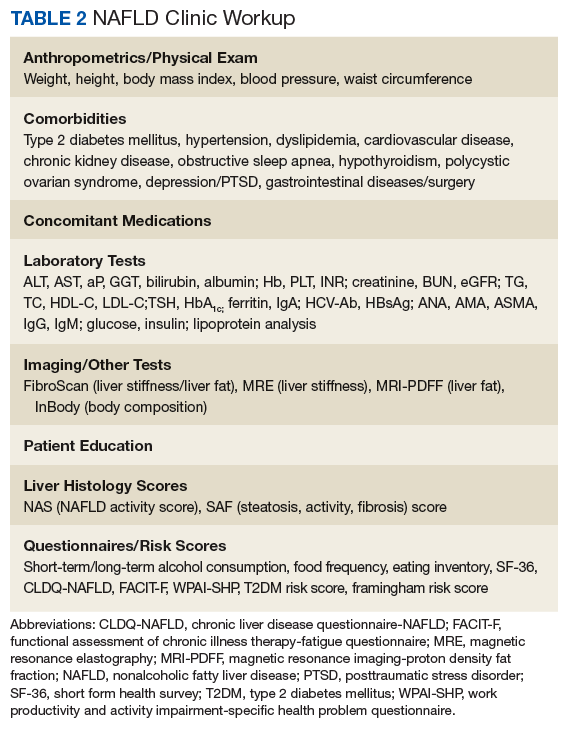
A nutritional evaluation includes information about eating behavior and food choices, body composition analysis, and an assessment of short- and long-term alcohol consumption. Presence of bilateral muscle wasting, subcutaneous fat loss, and signs of micronutrient deficiencies also should be explored. The lifestyle evaluation should include the patient’s typical physical activity and exercise as well as limiting factors.
Finally, and equally important, the patient’s psychosocial situation should be assessed, as motivation and accountability are key to success and may require behavioral modification. Assessing readiness is done best with motivational interviewing, the 5As counseling framework (Ask, Advise, Assess, Assist, Arrange) or using open-ended questions, affirmation, reflections, and summaries.72,73 Even if not personally delivering behavioral treatment, such an approach also can help move patients toward addressing important health-related behaviors.
Personalized Interventions
If available, patients should be offered participation in NAFLD clinical trials. A personalized treatment plan should be developed for each patient with input from all NAFLD care team members. The patient and providers should work together to make important decisions about the treatment plan and goals of care. Making the patient an active participant in their treatment rather than the passive recipient will lead to improvement in adherence and outcomes. Patients will engage when they are comfortable speaking with providers and are sufficiently educated about their disease.
Personalized interventions may be built by combining different strategies, such as lifestyle and dietary interventions, NASH-specific pharmacotherapy, comorbidity management, metabolic endoscopy, and bariatric surgery. Although NASH-specific medications are not currently available, approved medications, including pioglitazone or liraglutide, can be considered for therapy.74,75 Ideally, the NAFLD team CPS would manage comorbidities, such as T2DM and dyslipidemia, but this also can be done by a hepatologist or other specialist. Metabolic endoscopy (eg, intragastric balloons) or bariatric surgery would be done by referral.
Resource-Limited Settings
Although the VHA offers care at > 150 medical centers and > 1,000 outpatient clinics, specialty care such as hepatology and sophisticated and novel testing modalities are not available at many facilities. In 2011 VHA launched the Specialty Care Access Network Extension for Community Healthcare Outcomes to bring hepatitis C therapy and liver transplantation evaluations to rural areas without specialists.76-78 It is logical to explore how telehealth can be used for NAFLD care that requires complex management using new treatments and has a high societal impact, particularly when left untreated.
Telehealth must be easy to use and integrated into everyday routines to be useful for NAFLD management by addressing different aspects of promoting self-management, optimizing therapy, and care coordination. Participation in a structured face-to-face or group-based lifestyle program is often jeopardized by time and job constraints but can be successfully overcome using online approaches.79 The Internet-based VA Video Connect videoconferencing, which incorporates cell phone, laptop, or tablet use could help expand lifestyle interventions to a much larger community of patients with NAFLD and overcome local resource constraints. Finally, e-consultation also can be used in circumstances where synchronous communication with specialists may not be necessary.
Patient Monitoring and Quality Metrics
Monitoring of the patient after initiation of an intervention is variable but occurs more frequently at the beginning. For high-intensity dietary interventions, weekly monitoring for the first several weeks can ensure ongoing motivation, and accountability may increase the patient’s confidence and provide encouragement for further weight loss. It also is an opportunity to reestablish goals with patients with declining motivation. Long-term monitoring of patients may occur in 6- to 12-month intervals to document patient-reported outcomes, liver-related mortality, cardiovascular events, malignancies, and disease progression or regression.
While quality indicators have been proposed for cirrhosis care, such indicators have yet to be defined for NALD care.80 Such quality indicators assessed with validated questionnaires should include knowledge about NAFLD, satisfaction with care, perception of quality of care, and patient-reported outcomes. Other indicators may include use of therapies to treat dyslipidemia and T2DM. Last and likely the most important indicator of improved liver health in NAFLD will be either histologic improvement of NASH or improvement of the fibrosis risk category.
Outlook
With the enormous burden of NAFLD on the rise for many more years to come, quality care delivered to patients with NAFLD warrants resource-adaptive population health management strategies. With a limited number of providers specialized in liver disease, provider education assisted by clinical guidelines and decision support tools, development of referral and access to care mechanisms through integrated care, remote monitoring strategies as well as development of patient self-management and community resources will become more important. We have outlined essential components of an effective population health management strategy for NAFLD and actionable items for the VHA to consider when implementing these strategies. This is the time for the VHA to invest in efforts for NAFLD population care. Clearly, consideration must be given to local needs and resources and integration of technology platforms. Addressing NAFLD at a population level will provide yet another opportunity to demonstrate that VHA performs better on quality when compared with care systems in the private sector.81
1. Hunt CM, Turner MJ, Gifford EJ, Britt RB, Su GL. Identifying and treating nonalcoholic fatty liver disease. Fed Pract. 2019;36(1):20-29.
2. Glass LM, Hunt CM, Fuchs M, Su GL. Comorbidities and non-alcoholic fatty liver disease: the chicken, the egg, or both? Fed Pract. 2019;36(2):64-71.
3. Vilar-Gomez E, Calzadilla-Bertot L, Wai-Sun Wong V, et al. Fibrosis severity as a determinant of cause-specific mortality in patients with advanced nonalcoholic fatty liver disease: a multi-national cohort study. Gastroenterology. 2018;155(2):443-457.e17.
4. Younossi ZM, Koenig AB, Abdelatif D, Fazel Y, Henry L, Wymer M. Global epidemiology of nonalcoholic fatty liver disease—meta-analytic assessment of prevalence, incidence, and outcomes. Hepatology. 2016;64(1):73-84.
5. Yki-Järvinen H. Non-alcoholic fatty liver disease as a cause and a consequence of metabolic syndrome. Lancet Diabetes Endocrinol. 2014;2(11):901-910.
6. Golabi P, Shahab O, Stepanova M, Sayiner M, Clement SC, Younossi ZM. Long-term outcomes of diabetic patients with non-alcoholic fatty liver disease (NAFLD) [abstract]. Hepatology. 2017;66(suppl 1):1142A-1143A.
7. Wong RJ, Cheung R, Ahmed A. Nonalcoholic steatohepatitis is the most rapidly growing indication for liver transplantation in patients with hepatocellular carcinoma in the U.S. Hepatology. 2014;59(6):2188-2195.
8. Estes C, Razavi H, Loomba R, Younossi Z, Sanyal AJ. Modeling the epidemic of nonalcoholic fatty liver disease demonstrates an exponential increase in burden of disease. Hepatology. 2018;67(1):123-133.
9. Wong RJ, Aguilar M, Cheung R, et al. Nonalcoholic steatohepatitis is the second leading etiology of liver disease among adults awaiting liver transplantation in the United States. Gastroenterology. 2015;148(3):547-555.
10. Banini B, Mota M, Behnke M, Sharma A, Sanyal AJ. Nonalcoholic steatohepatitis (NASH) has surpassed hepatitis C as the leading cause for listing for liver transplant: implications for NASH in children and young adults. Presented at the American College of Gastroenterology Annual Scientific Meeting, Las Vegas, NV, October 18, 2016. Abstract 46. https://www.eventscribe.com/2016/ACG/QRcode.asp?Pres=199366. Accessed January 15, 2019.
11. Bruix J, Sherman M; American Association for the Study of Liver Diseases. Management of hepatocellular carcinoma: an update. Hepatology. 2011;53(3):1020-1022.
12. Younossi ZM, Otgonsuren M, Henry L, et al. Association of nonalcoholic fatty liver disease (NAFLD) with hepatocellular carcinoma (HCC) in the United States from 2004-2009. Hepatology. 2015;62(6):1723-1730.
13. Breland JY, Phibbs CS, Hoggatt KJ, et al. The obesity epidemic in the Veterans Health Administration: prevalence among key populations of women and men veterans. J Gen Intern Med. 2017;32(suppl 1):11-17.
14. Gunnar W. Bariatric surgery provided by the Veterans Health Administration: current state and a look to the future. J Gen Intern Med. 2017;32(suppl 1):4-5.
15. Kanwal F, Kramer JR, Duan Z, Yu X, White D, El-Seraq HB. Trends in the burden of nonalcoholic fatty liver disease in a United States cohort of veterans. Clin Gastroenterol Hepatol. 2016;14(2):301-308.e1-2.
16. Goldberg D, Ditah IC, Saeian K, et al. Changes in the prevalence of hepatitis C virus infection, nonalcoholic steatohepatitis, and alcoholic liver disease among patients with cirrhosis or liver failure on the wait list for liver transplantation. Gastroenterology. 2017;152(5):1090-1099.e1.
17. Beste L, Leipertz SL, Green PK, Dominitz JA, Ross D, Ioannou GN. Trends in burden of cirrhosis and hepatocellular carcinoma by underlying liver disease in US veterans, 2001-2013. Gastroenterology. 2015;149(6):1471-1482.e5.
18. Mittal S, El-Seraq HB, Sada YH, et al. Hepatocellular carcinoma in the absence of cirrhosis in United States veterans is associated with nonalcoholic fatty liver disease. Clin Gastroenterol Hepatol. 2016;14(1):124-131.
19. Kanwal F, Kramer JR, Mapakshi S, et al. Risk of hepatocellular cancer in patients with nonalcoholic fatty liver disease. Gastroenterology. 2018;55(6):1828-1837.e2.
20. David K, Kowdley KV, Unalp A, Kanwal F, Brunt EM, Schwimmer JB; NASH CRN Research Group. Quality of life in adults with nonalcoholic fatty liver disease: baseline data from the nonalcoholic steatohepatitis clinical research network. Hepatology. 2009;49(6):1904-1912.
21. Younossi ZM, Stepanova M, Henry L. Performance and validation of Chronic Liver Disease Questionnaire-Hepatitis C Version (CLDQ-HCV) in clinical trials of patients with chronic hepatitis C. Value Health. 2016;19(5):544-551.
22. Younossi ZM, Henry L. Economic and quality-of-life implications of nonalcoholic fatty liver disease. Pharmacoeconomics. 2015;33(12):1245-1253.
23. Younossi ZM, Stepanova M, Henry L, et al. A disease-specific quality of life instrument for nonalcoholic fatty liver disease and non-alcoholic steatohepatitis: CLDQ-NAFLD. Liver Int. 2017;37(8):1209-1218.
24. Chawla KS, Talwalkar JA, Keach JC, Malinchoc M, Lindor KD, Jorgensen R. Reliability and validity of the chronic liver disease questionnaire (CLDQ) in adults with non-alcoholic steatohepatitis (NASH). BMJ Open Gastroenterol. 2016;3(1):e000069.
25. Shetty A, Syn WK. Health, and economic burden of nonalcoholic fatty liver disease in the United States and its impact on Veterans. Fed Pract. 2019;36(1):14-19.
26. Younossi ZM, Blissett D, Blissett R, et al. The economic and clinical burden of nonalcoholic liver disease in the United States and Europe. Hepatology. 2016;64(5):1577-1586.
27. Younossi ZM, Tampi R, Priyadarshini M, Nader F, Younossi IM, Racila A. Burden of illness and economic model for patients with non-alcoholic steatohepatitis (NASH) in the United States. Hepatology. 2018. [Epub ahead of print.]
28. Allen AM, van Houten HK, Sangaralingham LR, Talwalkar JA, McCoy RG. Healthcare cost and utilization in nonalcoholic fatty liver disease: real-world data from a large U.S. claims database. Hepatology. 2018;68(6):2230-2238.
29. Diabetes mellitus. http://www.fedprac-digital.com/federalpractitioner/data_trends_2017?pg=20#pg20. Published July 2017. Accessed January 15, 2019.
30. Grattagliano I, D’Ambrosio G, Palmieri VO, Moschetta A, Palasciano G, Portincasa P; “Steatostop Project” Group. Improving nonalcoholic fatty liver disease management by general practitioners: a critical evaluation and impact of an educational training program. J Gastrointestin Liver Dis. 2008;17(4):389-394.
31. Polanco-Briceno S, Glass D, Stuntz M, Caze A. Awareness of nonalcoholic steatohepatitis and associated practice patterns of primary care physicians and specialists. BMC Res Notes. 2016;9:157.
32. Patel PJ, Banh X, Horsfall LU, et al. Underappreciation of non-alcoholic fatty liver disease by primary care clinicians: limited awareness of surrogate markers of fibrosis. Intern Med. 2018;48(2):144-151.
33. Standing HC, Jarvis H, Orr J, et al. GPs’ experiences and perceptions of early detection of liver disease: a qualitative study in primary care. Br J Gen Pract. 2018;68(676):e743-e749.
34. Wieland AC, Quallick M, Truesdale A, Mettler P, Bambha KM. Identifying practice gaps to optimize medical care for patients with nonalcoholic fatty liver disease. Dig Dis Sci. 2013;58(10):2809-2816.
35. Alexander M, Loomis AK, Fairburn-Beech J, et al. Real-world data reveal a diagnostic gap in non-alcoholic fatty liver disease. BMC Med. 2018;16(1):130.
36. Ratziu V, Cadranel JF, Serfaty L, et al. A survey of patterns of practice and perception of NAFLD in a large sample of practicing gastroenterologists in France. J Hepatol. 2012;57(2):376-383.
37. Blais P, Husain N, Kramer JR, Kowalkowski M, El-Seraq H, Kanwal F. Nonalcoholic fatty liver disease is underrecognized in the primary care setting. Am J Gastroenterol. 2015;110(1):10-14.
38. Bergqvist CJ, Skoien R, Horsfall L, Clouston AD, Jonsson JR, Powell EE. Awareness and opinions of non-alcoholic fatty liver disease by hospital specialists. Intern Med J. 2013;43(3):247-253.
39. Said A, Gagovic V, Malecki K, Givens ML, Nieto FJ. Primary care practitioners survey of non-alcoholic fatty liver disease. Ann Hepatol. 2013;12(5):758-765.
40. Chalasani N, Younossi Z, Lavine JE, et al. The diagnosis and management of nonalcoholic fatty liver disease: practice guidance from the American Association for the Study of Liver Diseases. Hepatology. 2018;67(1):328-357.
41. NICE National Institute for Health and Care Excellence. Non-alcoholic fatty liver disease (NAFLD): assessment and management. https://www.nice.org.uk/guidance/ng49. Published July 2016. Accessed January 15, 2019.
42. European Association for the Study of the Liver (EASL), European Association for the Study of diabetes (EASD), European Association for the study of obesity (EASO). EASL-EASD-EASO Clinical Practice Guidelines for the management of non-alcoholic fatty liver disease. J Hepatol. 2016;64(6):1388-1402.
43. Mofrad P, Contos MJ, Haque M, et al. Clinical and histologic spectrum of nonalcoholic fatty liver disease associated with normal ALT values. Hepatology. 2003;37(6):1286-1292.
44. Koehler EM, Plompen EP, Schouten JN, et al. Presence of diabetes mellitus and steatosis is associated with liver stiffness in a general population: the Rotterdam study. Hepatology. 2016;63(1):138-147.
45. Kwok R, Choi KC, Wong GL, et al. Screening diabetic patients for non-alcoholic fatty liver disease with controlled attenuation parameter and liver stiffness measurements: a prospective cohort study. Gut. 2016;65(8):1359-1368.
46. Harman DJ, Ryder SD, James MW, et al. Obesity and type 2 diabetes are important risk factors underlying previously undiagnosed cirrhosis in general practice: a cross-sectional study using transient elastography. Aliment Pharmacol Ther. 2018;47(4):504-515.
47. Prati D, Taioli E, Zanella A, et al. Updated definitions of healthy ranges for serum alanine aminotransferase levels. Ann Intern Med. 2002;137(1):1-10.
48. Rinella ME, Lominadze Z, Loomba R, et al. Practice pattern in NAFLD and NASH: real life differs from published guidelines. Therap Adv Gastroenterol. 2016;9(1):4-12.
49. El-Atem NA, Wojcik K, Horsfall L, et al. Patterns of service utilization within Australian hepatology clinics: high prevalence of advanced liver disease. Intern Med. 2016;46(4):420-426.
50. Dongiovanni P, Petta S, Mannisto V, et al. Statin use and nonalcoholic steatohepatitis in at risk individuals. J Hepatol. 2015;63(3):705-712.
51. Nascimbeni F, Aron-Wisnewsky J, Pais R, et al; LIDO Study Group. Statins, antidiabetic medications and liver histology in patients with diabetes with non-alcoholic fatty liver disease. BMJ Open Gastroenterol. 2016;3(1):e000075.
52. Romero-Gomez M, Zelber-Sagi S, Trenell M. Treatment of NAFLD with diet, physical activity and exercise. J Hepatol. 2017;67(4):829-846.
53. Vilar-Gomez E, Martinez-Perez Y, Calzadilla-Bertot L, et al. Weight loss through lifestyle modification significantly reduces features of nonalcoholic steatohepatitis. Gastroenterology. 2015;149(2):367-378.
54. Barritt AS 4th, Gitlin N, Klein S, et al. Design and rationale for a real-world observational cohort of patients with nonalcoholic fatty liver disease: The TARGET-NASH study. Contemp Clin Trials. 2017;61:33-38.
55. Meier SK, Shah ND, Talwalkar JA. Adapting the patient-centered specialty practice model for populations with cirrhosis. Clin Gastroenterol Hepatol. 2016;14(4):492-496.
56. Dulai PS, Singh S, Ohno-Machado L, Sandborn WJ. Population health management for inflammatory bowel disease. Gastroenterology. 2018;154(1):37-45.
57. Park A, Gonzalez R, Chartier M, et al. Screening and treating hepatitis C in the VA: achieving excellence using lean and system redesign. Fed Pract. 2018;35(7):24-29.
58. Cobbold JFL, Raveendran S, Peake CM, Anstee QM, Yee MS, Thursz MR. Piloting a multidisciplinary clinic for the management of non-alcoholic fatty liver disease: initial 5-year experience. Frontline Gastroenterol. 2013;4(4):263-269.
59. Osterberg L, Blaschke T. Adherence to medication. N Engl J Med. 2005;353(3):487-497.
60. Harrison SA. NASH, from diagnosis to treatment: where do we stand? Hepatology. 2015;62(6):1652-1655.
61. Patel PJ, Hayward KL, Rudra R, et al. Multimorbidity and polypharmacy in diabetic patients with NAFLD: implications for disease severity and management. Medicine (Baltimore). 2017;96(26):e6761.
62. Kanwal F, Mapashki S, Smith D, et al. Implementation of a population-based cirrhosis identification and management system. Clin Gastroenterol Hepatol. 2018;16(8):1182-1186.e2.
63. Mlynarski L, Schlesinger D, Lotan R, et al. Non-alcoholic fatty liver disease is not associated with a lower health perception. World J Gastroenterol. 2016;22(17):4362-4372.
64. Centis E, Moscatiello S, Bugianesi E, et al. Stage of change and motivation to healthier lifestyle in non-alcoholic fatty liver disease. J Hepatol. 2013;58(4):771-777.
65. Zelber-Sagi S, Bord S, Dror-Lavi G, et al. Role of illness perception and self-efficacy in lifestyle modification among non-alcoholic fatty liver disease patients. World J Gastroenterol. 2017;23(10):1881-1890.
66. Bajaj JS, Thacker LR, Wade JB, et al. PROMIS computerized adaptive tests are dynamic instruments to measure health-related quality of life in patients with cirrhosis. Aliment Pharmacol Ther. 2011;34(9):1123-1132.
67. Verma M, Stites S, Navarro V. Bringing assessment of patient-reported outcomes to hepatology practice. Clin Gastroenterol Hepatol. 2018;16(3):447-448.
68. Ahmed S, Ware P, Gardner W, et al. Montreal Accord on patient-reported outcomes (PROs) use series – paper 8: patient-reported outcomes in electronic health records can inform clinical and policy decisions. J Clin Epidemiol. 2017;89:160-167.
69. Younossi ZM, Stepanova M, Lawitz E, et al. Improvement of hepatic fibrosis and patient-reported outcomes in non-alcoholic steatohepatitis treated with selonsertib. Liver Int. 2018;38(10):1849-1859.
70. Patel YA, Gifford EJ, Glass LM, et al. Identifying nonalcoholic fatty liver disease advanced fibrosis in the Veterans Health Administration. Dig Dis Sci. 2018;63(9):2259-2266.
71. Hsu C, Caussy C, Imajo K, et al. Magnetic resonance vs transient elastography analysis of patients with nonalcoholic fatty liver disease: a systematic review and pooled analysis of individual participants. Clin Gastroenterol Hepatol. 2018;pii:S1542-3565(18)30613-X. [Epub ahead of print.]
72. Searight R. Realistic approaches to counseling in the office setting. Am Fam Physician. 2009;79(4):277-284.
73. Vallis M, Piccinini-Vallis H, Sharma AM, Freedhoff Y. Clinical review: modified 5 As: minimal intervention for obesity counseling in primary care. Can Fam Physician. 2013:59(1):27-31.
74. Cusi K, Orsak B, Bril F, et al. Long-term pioglitazone treatment for patients with nonalcoholic steatohepatitis and prediabetes or type 2 diabetes mellitus: a randomized trial. Ann Intern Med. 2016;165(5):305-315.
75. Armstrong MJ, Gaunt P, Aithal GP, et al. Liraglutide safety and efficacy in patients with non-alcoholic steatohepatitis (LEAN): a multicentre, double-blind, randomised, placebo-controlled phase 2 study. Lancet. 2016;387(10019):679-690.
76. Salgia RJ, Mullan PB, McCurdy H, Sales A, Moseley RH, Su GL. The educational impact of the specialty care access network-extension of community healthcare outcomes program. Telemed J E Health. 2014;20(11):1004-1008.
77. Konjeti VR, Heuman D, Bajaj J, et al. Telehealth-based evaluation identifies patients who are not candidates for liver transplantation. Clin Gastroenterol Hepatol. 2019;17(1):207-209.e1
78. Su GL, Glass L, Tapper EB, Van T, Waljee AK, Sales AE. Virtual consultations through the Veterans Administration SCAN-ECHO project improves survival for veterans with liver disease. Hepatology. 2018;68(6):2317-2324.
79. Mazzotti A, Caletti MT, Brodosi L, et al. An internet-based approach for lifestyle changes in patients with NAFLD: two-year effects on weight loss and surrogate markers. J Hepatol. 2018;69(5):1155-1163.
80. Kanwal F, Kramer J, Asch SM, et al. An explicit quality indicator set for measurement of quality of care in patients with cirrhosis. Clin Gastroenterol Hepatol. 2010,8(8):709-717.
81. Blay E Jr, DeLancey JO, Hewitt DB, Chung JW, Bilimoria KY. Initial public reporting of quality at Veterans Affairs vs Non-Veterans Affairs hospitals. JAMA Intern Med. 2017;177(6):882-885.
Nonalcoholic fatty liver disease (NAFLD) is an umbrella term that covers a spectrum of phenotypes ranging from nonalcoholic fatty liver or simple hepatic steatosis to nonalcoholic steatohepatitis (NASH) defined by histologic findings of steatosis, lobular inflammation, cytologic ballooning, and some degree of fibrosis.1 While frequently observed in patients with at least 1 risk factor (eg, obesity, diabetes mellitus [DM], dyslipidemia, hypertension), NAFLD also is an independent risk factor for type 2 DM (T2DM), chronic kidney disease, and cardiovascular disease.2 At early disease stages with absence of liver fibrosis, mortality is linked to cardiovascular and not liver disease. However, in the presence of NASH, fibrosis progression to liver cirrhosis, or hepatocellular carcinoma (HCC) represent the most important liver-related outcomes that determine morbidity and mortality.3 Mirroring the obesity and T2DM epidemics, the health care burden is projected to dramatically rise.
In the following article, we will discuss how the Veterans Health Administration (VHA) is well positioned to implement an organizational strategy of comprehensive care for veterans with NAFLD. This comprehensive care strategy should include the development of a NAFLD clinic offering care for comorbid conditions frequently present in these patients, point-of-care testing, access to clinical trials, and outcomes monitoring as a key performance target for providers and the respective facility.
NAFLD disease burden
To fully appreciate the burden of a chronic disease like NAFLD, it is important to assess its long- and short-term consequences in a comprehensive manner with regard to its clinical impact, impact on the patient, and economic impact (Figure 1).
Clinical Impact
Clinical impact is assessed based on the prevalence and natural history of NAFLD and the liver fibrosis stage and determines patient survival. Coinciding with the epidemic of obesity and T2DM, the prevalence of NAFLD in the general population in North America is 24% and even higher with older age and higher body mass index (BMI).4,5 The prevalence for NAFLD is particularly high in patients with T2DM (47%). Of patients with T2DM and NAFLD, 65% have biopsy-proven NASH of which 15% have bridging fibrosis or liver cirrhosis.6
NAFLD is the fastest growing cause of cirrhosis in the US with a forecasted NAFLD population of 101 million by 2030.7 At the same time, the number of patients with NASH will rise to 27 million of which > 7 million will have bridging fibrosis or liver cirrhosis; hepatic decompensation events are estimated to occur in 105,430 patients with liver cirrhosis, posing a major public health threat related to organ availability for liver transplantation.8 Since 2013, NAFLD has been the second leading cause for liver transplantation and the top reason for transplantation in patients aged < 50 years.9,10 As many patients with NAFLD are diagnosed with HCC at stages where liver transplantation is not an option, mortality from HCC in NAFLD patients is higher than with other etiologies as treatment options are restricted.11,12
Compared with that of the general population, veterans seeking care are older and sicker with 43% of veterans taking > 5 prescribed medications.13 Of those receiving VHA care, 6.6 million veterans are either overweight or obese; 165,000 are morbidly obese with a BMI > 40.14 In addition, veterans are 2.5 times more likely to have T2DM compared with that of nonveterans. Because T2DM and obesity are the most common risk factors for NAFLD, it is not surprising that NAFLD prevalence among veterans rose 3-fold from 2003 to 2011.15 It is now estimated that 540,000 veterans will progress to NASH and 108,000 will develop bridging fibrosis or liver cirrhosis by 2030.8 Similar to that of the general population, liver cirrhosis is attributed to NAFLD in 15% of veterans.15,16 NAFLD is the third most common cause of cirrhosis and HCC, occurring at an average age of 66 years and 70 years, respectively.16,17 Shockingly, 20% of HCCs were not linked to liver cirrhosis and escaped recommended HCC screening for patients with cirrhosis.18,19
Patient Impact
Assessment of disease burden should not be restricted to clinical outcomes as patients can experience a range of symptoms that may have significant impact on their health-related quality of life (QOL) and functional status.20 Using general but not disease-specific instruments, NAFLD patients reported outcomes score low regarding fatigue, activity, and emotions.21 More disease-specific questionnaires may provide better and disease-specific insights as how NASH impacts patients’ QOL.22-24
Economic Impact
There is mounting evidence that the clinical implications of NAFLD directly influence the economic burden of NAFLD.25 The annual burden associated with all incident and prevalent NAFLD cases in the US has been estimated at $103 billion, and projections suggest that the expected 10-year burden of NAFLD may increase to $1.005 trillion.26 It is anticipated that increased NAFLD costs will affect the VHA with billions of dollars in annual expenditures in addition to the $1.5 billion already spent annually for T2DM care (4% of the VA pharmacy budget is spent on T2DM treatment).27-29
Current Patient Care
Obesity, DM, and dyslipidemia are common conditions managed by primary care providers (PCPs). Given the close association of these conditions with NAFLD, the PCP is often the first point of medical contact for patients with or at risk for NAFLD.30 For that reason, PCP awareness of NAFLD is critical for effective management of these patients. PCPs should be actively involved in the management of patients with NAFLD with pathways in place for identifying patients at high risk of liver disease for timely referral to a specialist and adequate education on the follow-up and treatment of low-risk patients. Instead, diagnosis of NAFLD is primarily triggered by either abnormal aminotransferases or detection of steatosis on imaging performed for other indications.
Barriers to optimal management of NAFLD by PCPs have been identified and occur at different levels of patient care. In the absence of clinical practice guidelines by the American Association of Family Practice covering NAFLD and a substantial latency period without signs of symptoms, NAFLD may not be perceived as a potentially serious condition by PCPs and their patients; interestingly this holds true even for some medical specialties.31-39 More than half of PCPs do not test their patients at highest risk for NAFLD (eg, patients with obesity or T2DM) and may be unaware of practice guidelines.40-42
Guidelines from Europe and the US are not completely in accordance. The US guidelines are vague regarding screening and are supported by only 1 medical society, due to the lack of NASH-specific drug therapies. The European guidelines are built on the support of 3 different stakeholders covering liver diseases, obesity, and DM and the experience using noninvasive liver fibrosis assessments for patients with NAFLD. To overcome this apparent conflict, a more practical and risk-stratified approach is warranted.41,42
Making the diagnosis can be challenging in cases with competing etiologies, such as T2DM and alcohol misuse. There also is an overreliance on aminotransferase levels to diagnose NAFLD. Significant liver disease can exist in the presence of normal aminotransferases, and this may be attributed to either spontaneous aminotransferase fluctuations or upper limits of normal that have been chosen too high.43-47 Often additional workup by PCPs depends on the magnitude of aminotransferase abnormalities.
Even if NAFLD has been diagnosed by PCPs, identifying those with NASH is hindered by the absence of an accurate noninvasive diagnostic method and the need to perform a liver biopsy. Liver biopsy is often not considered or delayed to monitor patients with serial aminotransferases, regardless of the patient’s metabolic comorbidity profile or baseline aminotransferases.32 As a result, referral to a specialist often depends on the magnitude of the aminotransferase abnormality,30,48 and often occurs when advanced liver disease is already present.49 Finally, providers may not be aware of beneficial effects of lifestyle interventions and certain medications, including statins on NASH and liver fibrosis.50-53 As NAFLD is associated with excess cardiovascular- and cancer-related morbidity and mortality, it is possible that regression of NAFLD may improve associated risk for these outcomes as well.
Framework for Comprehensive NAFLD Care
Chronic liver diseases and associated comorbidities have long been addressed by PCPs and specialty providers working in isolation and within the narrow focus of each discipline. Contrary to working in silos of the past, a coordinated management strategy with other disciplines that cover these comorbidities needs to be established, or alternatively the PCP must be aware of the management of comorbidities to execute them independently. Integration of hepatology-driven NAFLD care with other specialties involves communication, collaboration, and sharing of resources and expertise that will address patient care needs. Obviously, this cannot be undertaken in a single outpatient visit and requires vertical and longitudinal follow-up over time. One important aspect of comprehensive NAFLD care is the targeting of a particular patient population rather than being seen as a panacea for all; cost-utility analysis is hampered by uncertainties around accuracy of noninvasive biomarkers reflecting liver injury and a lack of effectiveness data for treatment. However, it seems reasonable to screen patients at high risk for NASH and adverse clinical outcomes. Such a risk stratification approach should be cost-effective.
A first key step by the PCP is to identify whether a patient is at risk, especially patients with NASH. The majority of patients at risk are already seen by PCPs. While there is no consensus on ideal screening for NAFLD by PCPs, the use of ultrasound in the at-risk population is recommended in Europe.42 Although NASH remains a histopathologic diagnosis, a reasonable approach is to define NASH based on clinical criteria as done similarly in a real-world observational NAFLD cohort study.54 In the absence of chronic alcohol consumption and viral hepatitis and in a real-world scenario, NASH can be defined as steatosis shown on liver imaging or biopsy and alanine aminotransferase (ALT) levels of > 25 U/L. In addition, ≥ 1 of the following criteria must be met: BMI > 30, T2DM, dyslipidemia, or metabolic syndrome (Table 1).
In the absence of easy-to-use validated tests, all patients with NAFLD need to be assessed with simple, noninvasive scores for the presence of clinically relevant liver fibrosis (F2-portal fibrosis with septa; F3-bridging fibrosis; F4-liver cirrhosis); those that meet the fibrosis criteria should receive further assessment usually only offered in a comprehensive NAFLD clinic.1 PCPs should focus on addressing 2 aspects related to NAFLD: (1) Does my patient have NASH based on clinical criteria; and (2) Is my patient at risk for clinically relevant liver fibrosis? PCPs are integral in optimal management of comorbidities and metabolic syndrome abnormalities with lifestyle and exercise interventions.
The care needs of a typical patient with NAFLD can be classified into 3 categories: liver disease (NAFLD) management, addressing NAFLD associated comorbidities, and attending to the personal care needs of the patient. With considerable interactions between these categories, interventions done within the framework of 1 category can influence the needs pertaining to another, requiring closer monitoring of the patient and potentially modifying care. For example, initiating a low carbohydrate diet in a patient with DM and NAFLD who is on antidiabetic medication may require adjusting the medication; disease progression or failure to achieve treatment goals may affect the emotional state of the patient, which can affect adherence.
Referrals to a comprehensive NAFLD clinic need to be standardized. Clearly, the referral process depends in part on local resources, comprehensiveness of available services, and patient characteristics, among others. Most often, PCPs refer patients with suspected diagnosis of NAFLD, with or without abnormal aminotransferases, to a hepatologist to confirm the diagnosis and for disease staging and liver disease management. This may have the advantage of greatest extent of access and should limit the number of patients with advanced liver fibrosis who otherwise may have been missed. On the other hand, different thresholds of PCPs for referrals may delay the patient’s access to comprehensive NAFLD care. Of those referred by primary care, the hepatologist identifies patients with NAFLD who benefit most from a comprehensive care approach. This automated referral process without predefined criteria remains more a vision than reality as it would require an infrastructure and resources that no health care system can provide currently.
The alternative approach of automatic referral may use predefined criteria related to patients’ diagnoses and prognoses (Figure 2).
Patient-Centered Care
At present the narrow focus of VHA specialty outpatient clinics associated with time constraints of providers and gaps in NAFLD awareness clearly does not address the complex metabolic needs of veterans with NAFLD. This is in striking contrast to the comprehensive care offered to patients with cancer. To overcome these limitations, new care delivery models need to be explored. At first it seems attractive to embed NAFLD patient care geographically into a hepatology clinic with the potential advantages of improving volume and timeliness of referral and reinforcing communication among specialty providers while maximizing convenience for patients. However, this is resource intensive not only concerning clinic space, but also in terms of staffing clinics with specialty providers.
Patient-centered care for veterans with NAFLD seems to be best organized around a comprehensive NAFLD clinic with access to specialized diagnostics and knowledge in day-to-day NAFLD management. This evolving care concept has been developed already for patients with liver cirrhosis and inflammatory bowel disease and considers NAFLD a chronic disease that cannot be addressed sufficiently by providing episodic care.55,56 The development of comprehensive NAFLD care can build on the great success of the Hepatitis Innovation Team Collaborative that employed lean management strategies with local and regional teams to facilitate efforts to make chronic hepatitis C virus a rare disease in the VHA.57
NAFLD Care Team
Given the central role of the liver and gastrointestinal tract in the field of nutrition, knowledge of the pathophysiology of the liver and digestive tract as well as emerging therapeutic options offered via metabolic endoscopy uniquely positions the hepatologist/gastroenterologist to take the lead in managing NAFLD. Treating NAFLD is best accomplished when the specialist partners with other health care providers who have expertise in the nutritional, behavioral, and physical activity aspects of treatment. The composition of the NAFLD care team and the roles that different providers fulfill can vary depending on the clinical setting; however, the hepatologist/gastroenterologist is best suited to lead the team, or alternatively, this role can be fulfilled by a provider with liver disease expertise.
Based on experiences from the United Kingdom, the minimum staffing of a NAFLD clinic should include a physician and nurse practitioner who has expertise in managing patients with chronic liver disease, a registered nurse, a dietitian, and a clinical pharmacy specialist (CPS).58 With coexistent diseases common and many veterans who have > 5 prescribed medications, risk of polypharmacy and adverse drug reactions are a concern, particularly since adherence in patients with chronic diseases has been reported to be as low as 43%.59-61 Risk of medication errors and serious adverse effects are magnified by difficulties with patient adherence, medication interactions, and potential need for frequent dose adjustments, particularly when on a weight-loss diet.
Without doubt, comprehensive medication management, offered by a highly trained CPS with independent prescriptive authority occurring while the veteran is in the NAFLD clinic, is highly desirable. Establishing a functional statement and care coordination agreement could describe the role of the CPS as a member of the NAFLD provider team.
Patient Evaluation
After being referred to the NAFLD clinic, the veteran should have a thorough assessment, including medical, nutritional, physical activity, exercise, and psychosocial evaluations (Figure 4).
The assessment also should include patient education to ensure that the patient has sufficient knowledge and skills to achieve the treatment goals. Educating on NAFLD is critical as most patients with NAFLD do not think of themselves as sick and have limited readiness for lifestyle changes.63,64 A better understanding of NAFLD combined with a higher self-efficacy seems to be positively linked to better nutritional habits.65
An online patient-reported outcomes measurement information system for a patient with NAFLD (eg, assessmentcenter.net) may be beneficial and can be applied within a routine NAFLD clinic visit because of its multidimensionality and compatibility with other chronic diseases.66-68 Other tools to assess health-related QOL include questionnaires, such as the functional assessment of chronic illness therapy-fatigue, work productivity and activity impairment questionnaire: specific health problem, Short Form-36, and chronic liver disease questionnaire-NAFLD.23,69
The medical evaluation includes assessment of secondary causes of NAFLD and identification of NAFLD-related comorbidities. Weight, height, blood pressure, waist circumference, and BMI should be recorded. The physical exam should focus on signs of chronic liver disease and include inspection for acanthosis nigricans, hirsutism, and large neck circumference, which are associated with insulin resistance, polycystic ovarian syndrome, and obstructive sleep apnea, respectively. NAFLD-associated comorbidities may contribute to frailty or physical limitations that affect treatment with diet and exercise and need to be assessed. A thorough medication reconciliation will reveal whether the patient is prescribed obesogenic medications and whether comorbidities (eg, DM and dyslipidemia) are being treated optimally and according to current society guidelines.
Making the diagnosis of NAFLD requires excluding other (concomitant) chronic liver diseases. While often this is done indirectly using order sets with a panoply of available serologic tests without accounting for risks for rare causes of liver injury, a more focused and cost-effective approach is warranted. As most patients will already have had imaging studies that show fatty liver, assessment of liver fibrosis is an important step for risk stratification. Noninvasive scores (eg, FIB-4) can be used by the PCP to identify high-risk patients requiring further workup and referral.1,70 More sophisticated tools, including transient elastography and/or magnetic resonance elastography are applied for more sophisticated risk stratification and liver disease management (Table 2).71
A nutritional evaluation includes information about eating behavior and food choices, body composition analysis, and an assessment of short- and long-term alcohol consumption. Presence of bilateral muscle wasting, subcutaneous fat loss, and signs of micronutrient deficiencies also should be explored. The lifestyle evaluation should include the patient’s typical physical activity and exercise as well as limiting factors.
Finally, and equally important, the patient’s psychosocial situation should be assessed, as motivation and accountability are key to success and may require behavioral modification. Assessing readiness is done best with motivational interviewing, the 5As counseling framework (Ask, Advise, Assess, Assist, Arrange) or using open-ended questions, affirmation, reflections, and summaries.72,73 Even if not personally delivering behavioral treatment, such an approach also can help move patients toward addressing important health-related behaviors.
Personalized Interventions
If available, patients should be offered participation in NAFLD clinical trials. A personalized treatment plan should be developed for each patient with input from all NAFLD care team members. The patient and providers should work together to make important decisions about the treatment plan and goals of care. Making the patient an active participant in their treatment rather than the passive recipient will lead to improvement in adherence and outcomes. Patients will engage when they are comfortable speaking with providers and are sufficiently educated about their disease.
Personalized interventions may be built by combining different strategies, such as lifestyle and dietary interventions, NASH-specific pharmacotherapy, comorbidity management, metabolic endoscopy, and bariatric surgery. Although NASH-specific medications are not currently available, approved medications, including pioglitazone or liraglutide, can be considered for therapy.74,75 Ideally, the NAFLD team CPS would manage comorbidities, such as T2DM and dyslipidemia, but this also can be done by a hepatologist or other specialist. Metabolic endoscopy (eg, intragastric balloons) or bariatric surgery would be done by referral.
Resource-Limited Settings
Although the VHA offers care at > 150 medical centers and > 1,000 outpatient clinics, specialty care such as hepatology and sophisticated and novel testing modalities are not available at many facilities. In 2011 VHA launched the Specialty Care Access Network Extension for Community Healthcare Outcomes to bring hepatitis C therapy and liver transplantation evaluations to rural areas without specialists.76-78 It is logical to explore how telehealth can be used for NAFLD care that requires complex management using new treatments and has a high societal impact, particularly when left untreated.
Telehealth must be easy to use and integrated into everyday routines to be useful for NAFLD management by addressing different aspects of promoting self-management, optimizing therapy, and care coordination. Participation in a structured face-to-face or group-based lifestyle program is often jeopardized by time and job constraints but can be successfully overcome using online approaches.79 The Internet-based VA Video Connect videoconferencing, which incorporates cell phone, laptop, or tablet use could help expand lifestyle interventions to a much larger community of patients with NAFLD and overcome local resource constraints. Finally, e-consultation also can be used in circumstances where synchronous communication with specialists may not be necessary.
Patient Monitoring and Quality Metrics
Monitoring of the patient after initiation of an intervention is variable but occurs more frequently at the beginning. For high-intensity dietary interventions, weekly monitoring for the first several weeks can ensure ongoing motivation, and accountability may increase the patient’s confidence and provide encouragement for further weight loss. It also is an opportunity to reestablish goals with patients with declining motivation. Long-term monitoring of patients may occur in 6- to 12-month intervals to document patient-reported outcomes, liver-related mortality, cardiovascular events, malignancies, and disease progression or regression.
While quality indicators have been proposed for cirrhosis care, such indicators have yet to be defined for NALD care.80 Such quality indicators assessed with validated questionnaires should include knowledge about NAFLD, satisfaction with care, perception of quality of care, and patient-reported outcomes. Other indicators may include use of therapies to treat dyslipidemia and T2DM. Last and likely the most important indicator of improved liver health in NAFLD will be either histologic improvement of NASH or improvement of the fibrosis risk category.
Outlook
With the enormous burden of NAFLD on the rise for many more years to come, quality care delivered to patients with NAFLD warrants resource-adaptive population health management strategies. With a limited number of providers specialized in liver disease, provider education assisted by clinical guidelines and decision support tools, development of referral and access to care mechanisms through integrated care, remote monitoring strategies as well as development of patient self-management and community resources will become more important. We have outlined essential components of an effective population health management strategy for NAFLD and actionable items for the VHA to consider when implementing these strategies. This is the time for the VHA to invest in efforts for NAFLD population care. Clearly, consideration must be given to local needs and resources and integration of technology platforms. Addressing NAFLD at a population level will provide yet another opportunity to demonstrate that VHA performs better on quality when compared with care systems in the private sector.81
1. Hunt CM, Turner MJ, Gifford EJ, Britt RB, Su GL. Identifying and treating nonalcoholic fatty liver disease. Fed Pract. 2019;36(1):20-29.
2. Glass LM, Hunt CM, Fuchs M, Su GL. Comorbidities and non-alcoholic fatty liver disease: the chicken, the egg, or both? Fed Pract. 2019;36(2):64-71.
3. Vilar-Gomez E, Calzadilla-Bertot L, Wai-Sun Wong V, et al. Fibrosis severity as a determinant of cause-specific mortality in patients with advanced nonalcoholic fatty liver disease: a multi-national cohort study. Gastroenterology. 2018;155(2):443-457.e17.
4. Younossi ZM, Koenig AB, Abdelatif D, Fazel Y, Henry L, Wymer M. Global epidemiology of nonalcoholic fatty liver disease—meta-analytic assessment of prevalence, incidence, and outcomes. Hepatology. 2016;64(1):73-84.
5. Yki-Järvinen H. Non-alcoholic fatty liver disease as a cause and a consequence of metabolic syndrome. Lancet Diabetes Endocrinol. 2014;2(11):901-910.
6. Golabi P, Shahab O, Stepanova M, Sayiner M, Clement SC, Younossi ZM. Long-term outcomes of diabetic patients with non-alcoholic fatty liver disease (NAFLD) [abstract]. Hepatology. 2017;66(suppl 1):1142A-1143A.
7. Wong RJ, Cheung R, Ahmed A. Nonalcoholic steatohepatitis is the most rapidly growing indication for liver transplantation in patients with hepatocellular carcinoma in the U.S. Hepatology. 2014;59(6):2188-2195.
8. Estes C, Razavi H, Loomba R, Younossi Z, Sanyal AJ. Modeling the epidemic of nonalcoholic fatty liver disease demonstrates an exponential increase in burden of disease. Hepatology. 2018;67(1):123-133.
9. Wong RJ, Aguilar M, Cheung R, et al. Nonalcoholic steatohepatitis is the second leading etiology of liver disease among adults awaiting liver transplantation in the United States. Gastroenterology. 2015;148(3):547-555.
10. Banini B, Mota M, Behnke M, Sharma A, Sanyal AJ. Nonalcoholic steatohepatitis (NASH) has surpassed hepatitis C as the leading cause for listing for liver transplant: implications for NASH in children and young adults. Presented at the American College of Gastroenterology Annual Scientific Meeting, Las Vegas, NV, October 18, 2016. Abstract 46. https://www.eventscribe.com/2016/ACG/QRcode.asp?Pres=199366. Accessed January 15, 2019.
11. Bruix J, Sherman M; American Association for the Study of Liver Diseases. Management of hepatocellular carcinoma: an update. Hepatology. 2011;53(3):1020-1022.
12. Younossi ZM, Otgonsuren M, Henry L, et al. Association of nonalcoholic fatty liver disease (NAFLD) with hepatocellular carcinoma (HCC) in the United States from 2004-2009. Hepatology. 2015;62(6):1723-1730.
13. Breland JY, Phibbs CS, Hoggatt KJ, et al. The obesity epidemic in the Veterans Health Administration: prevalence among key populations of women and men veterans. J Gen Intern Med. 2017;32(suppl 1):11-17.
14. Gunnar W. Bariatric surgery provided by the Veterans Health Administration: current state and a look to the future. J Gen Intern Med. 2017;32(suppl 1):4-5.
15. Kanwal F, Kramer JR, Duan Z, Yu X, White D, El-Seraq HB. Trends in the burden of nonalcoholic fatty liver disease in a United States cohort of veterans. Clin Gastroenterol Hepatol. 2016;14(2):301-308.e1-2.
16. Goldberg D, Ditah IC, Saeian K, et al. Changes in the prevalence of hepatitis C virus infection, nonalcoholic steatohepatitis, and alcoholic liver disease among patients with cirrhosis or liver failure on the wait list for liver transplantation. Gastroenterology. 2017;152(5):1090-1099.e1.
17. Beste L, Leipertz SL, Green PK, Dominitz JA, Ross D, Ioannou GN. Trends in burden of cirrhosis and hepatocellular carcinoma by underlying liver disease in US veterans, 2001-2013. Gastroenterology. 2015;149(6):1471-1482.e5.
18. Mittal S, El-Seraq HB, Sada YH, et al. Hepatocellular carcinoma in the absence of cirrhosis in United States veterans is associated with nonalcoholic fatty liver disease. Clin Gastroenterol Hepatol. 2016;14(1):124-131.
19. Kanwal F, Kramer JR, Mapakshi S, et al. Risk of hepatocellular cancer in patients with nonalcoholic fatty liver disease. Gastroenterology. 2018;55(6):1828-1837.e2.
20. David K, Kowdley KV, Unalp A, Kanwal F, Brunt EM, Schwimmer JB; NASH CRN Research Group. Quality of life in adults with nonalcoholic fatty liver disease: baseline data from the nonalcoholic steatohepatitis clinical research network. Hepatology. 2009;49(6):1904-1912.
21. Younossi ZM, Stepanova M, Henry L. Performance and validation of Chronic Liver Disease Questionnaire-Hepatitis C Version (CLDQ-HCV) in clinical trials of patients with chronic hepatitis C. Value Health. 2016;19(5):544-551.
22. Younossi ZM, Henry L. Economic and quality-of-life implications of nonalcoholic fatty liver disease. Pharmacoeconomics. 2015;33(12):1245-1253.
23. Younossi ZM, Stepanova M, Henry L, et al. A disease-specific quality of life instrument for nonalcoholic fatty liver disease and non-alcoholic steatohepatitis: CLDQ-NAFLD. Liver Int. 2017;37(8):1209-1218.
24. Chawla KS, Talwalkar JA, Keach JC, Malinchoc M, Lindor KD, Jorgensen R. Reliability and validity of the chronic liver disease questionnaire (CLDQ) in adults with non-alcoholic steatohepatitis (NASH). BMJ Open Gastroenterol. 2016;3(1):e000069.
25. Shetty A, Syn WK. Health, and economic burden of nonalcoholic fatty liver disease in the United States and its impact on Veterans. Fed Pract. 2019;36(1):14-19.
26. Younossi ZM, Blissett D, Blissett R, et al. The economic and clinical burden of nonalcoholic liver disease in the United States and Europe. Hepatology. 2016;64(5):1577-1586.
27. Younossi ZM, Tampi R, Priyadarshini M, Nader F, Younossi IM, Racila A. Burden of illness and economic model for patients with non-alcoholic steatohepatitis (NASH) in the United States. Hepatology. 2018. [Epub ahead of print.]
28. Allen AM, van Houten HK, Sangaralingham LR, Talwalkar JA, McCoy RG. Healthcare cost and utilization in nonalcoholic fatty liver disease: real-world data from a large U.S. claims database. Hepatology. 2018;68(6):2230-2238.
29. Diabetes mellitus. http://www.fedprac-digital.com/federalpractitioner/data_trends_2017?pg=20#pg20. Published July 2017. Accessed January 15, 2019.
30. Grattagliano I, D’Ambrosio G, Palmieri VO, Moschetta A, Palasciano G, Portincasa P; “Steatostop Project” Group. Improving nonalcoholic fatty liver disease management by general practitioners: a critical evaluation and impact of an educational training program. J Gastrointestin Liver Dis. 2008;17(4):389-394.
31. Polanco-Briceno S, Glass D, Stuntz M, Caze A. Awareness of nonalcoholic steatohepatitis and associated practice patterns of primary care physicians and specialists. BMC Res Notes. 2016;9:157.
32. Patel PJ, Banh X, Horsfall LU, et al. Underappreciation of non-alcoholic fatty liver disease by primary care clinicians: limited awareness of surrogate markers of fibrosis. Intern Med. 2018;48(2):144-151.
33. Standing HC, Jarvis H, Orr J, et al. GPs’ experiences and perceptions of early detection of liver disease: a qualitative study in primary care. Br J Gen Pract. 2018;68(676):e743-e749.
34. Wieland AC, Quallick M, Truesdale A, Mettler P, Bambha KM. Identifying practice gaps to optimize medical care for patients with nonalcoholic fatty liver disease. Dig Dis Sci. 2013;58(10):2809-2816.
35. Alexander M, Loomis AK, Fairburn-Beech J, et al. Real-world data reveal a diagnostic gap in non-alcoholic fatty liver disease. BMC Med. 2018;16(1):130.
36. Ratziu V, Cadranel JF, Serfaty L, et al. A survey of patterns of practice and perception of NAFLD in a large sample of practicing gastroenterologists in France. J Hepatol. 2012;57(2):376-383.
37. Blais P, Husain N, Kramer JR, Kowalkowski M, El-Seraq H, Kanwal F. Nonalcoholic fatty liver disease is underrecognized in the primary care setting. Am J Gastroenterol. 2015;110(1):10-14.
38. Bergqvist CJ, Skoien R, Horsfall L, Clouston AD, Jonsson JR, Powell EE. Awareness and opinions of non-alcoholic fatty liver disease by hospital specialists. Intern Med J. 2013;43(3):247-253.
39. Said A, Gagovic V, Malecki K, Givens ML, Nieto FJ. Primary care practitioners survey of non-alcoholic fatty liver disease. Ann Hepatol. 2013;12(5):758-765.
40. Chalasani N, Younossi Z, Lavine JE, et al. The diagnosis and management of nonalcoholic fatty liver disease: practice guidance from the American Association for the Study of Liver Diseases. Hepatology. 2018;67(1):328-357.
41. NICE National Institute for Health and Care Excellence. Non-alcoholic fatty liver disease (NAFLD): assessment and management. https://www.nice.org.uk/guidance/ng49. Published July 2016. Accessed January 15, 2019.
42. European Association for the Study of the Liver (EASL), European Association for the Study of diabetes (EASD), European Association for the study of obesity (EASO). EASL-EASD-EASO Clinical Practice Guidelines for the management of non-alcoholic fatty liver disease. J Hepatol. 2016;64(6):1388-1402.
43. Mofrad P, Contos MJ, Haque M, et al. Clinical and histologic spectrum of nonalcoholic fatty liver disease associated with normal ALT values. Hepatology. 2003;37(6):1286-1292.
44. Koehler EM, Plompen EP, Schouten JN, et al. Presence of diabetes mellitus and steatosis is associated with liver stiffness in a general population: the Rotterdam study. Hepatology. 2016;63(1):138-147.
45. Kwok R, Choi KC, Wong GL, et al. Screening diabetic patients for non-alcoholic fatty liver disease with controlled attenuation parameter and liver stiffness measurements: a prospective cohort study. Gut. 2016;65(8):1359-1368.
46. Harman DJ, Ryder SD, James MW, et al. Obesity and type 2 diabetes are important risk factors underlying previously undiagnosed cirrhosis in general practice: a cross-sectional study using transient elastography. Aliment Pharmacol Ther. 2018;47(4):504-515.
47. Prati D, Taioli E, Zanella A, et al. Updated definitions of healthy ranges for serum alanine aminotransferase levels. Ann Intern Med. 2002;137(1):1-10.
48. Rinella ME, Lominadze Z, Loomba R, et al. Practice pattern in NAFLD and NASH: real life differs from published guidelines. Therap Adv Gastroenterol. 2016;9(1):4-12.
49. El-Atem NA, Wojcik K, Horsfall L, et al. Patterns of service utilization within Australian hepatology clinics: high prevalence of advanced liver disease. Intern Med. 2016;46(4):420-426.
50. Dongiovanni P, Petta S, Mannisto V, et al. Statin use and nonalcoholic steatohepatitis in at risk individuals. J Hepatol. 2015;63(3):705-712.
51. Nascimbeni F, Aron-Wisnewsky J, Pais R, et al; LIDO Study Group. Statins, antidiabetic medications and liver histology in patients with diabetes with non-alcoholic fatty liver disease. BMJ Open Gastroenterol. 2016;3(1):e000075.
52. Romero-Gomez M, Zelber-Sagi S, Trenell M. Treatment of NAFLD with diet, physical activity and exercise. J Hepatol. 2017;67(4):829-846.
53. Vilar-Gomez E, Martinez-Perez Y, Calzadilla-Bertot L, et al. Weight loss through lifestyle modification significantly reduces features of nonalcoholic steatohepatitis. Gastroenterology. 2015;149(2):367-378.
54. Barritt AS 4th, Gitlin N, Klein S, et al. Design and rationale for a real-world observational cohort of patients with nonalcoholic fatty liver disease: The TARGET-NASH study. Contemp Clin Trials. 2017;61:33-38.
55. Meier SK, Shah ND, Talwalkar JA. Adapting the patient-centered specialty practice model for populations with cirrhosis. Clin Gastroenterol Hepatol. 2016;14(4):492-496.
56. Dulai PS, Singh S, Ohno-Machado L, Sandborn WJ. Population health management for inflammatory bowel disease. Gastroenterology. 2018;154(1):37-45.
57. Park A, Gonzalez R, Chartier M, et al. Screening and treating hepatitis C in the VA: achieving excellence using lean and system redesign. Fed Pract. 2018;35(7):24-29.
58. Cobbold JFL, Raveendran S, Peake CM, Anstee QM, Yee MS, Thursz MR. Piloting a multidisciplinary clinic for the management of non-alcoholic fatty liver disease: initial 5-year experience. Frontline Gastroenterol. 2013;4(4):263-269.
59. Osterberg L, Blaschke T. Adherence to medication. N Engl J Med. 2005;353(3):487-497.
60. Harrison SA. NASH, from diagnosis to treatment: where do we stand? Hepatology. 2015;62(6):1652-1655.
61. Patel PJ, Hayward KL, Rudra R, et al. Multimorbidity and polypharmacy in diabetic patients with NAFLD: implications for disease severity and management. Medicine (Baltimore). 2017;96(26):e6761.
62. Kanwal F, Mapashki S, Smith D, et al. Implementation of a population-based cirrhosis identification and management system. Clin Gastroenterol Hepatol. 2018;16(8):1182-1186.e2.
63. Mlynarski L, Schlesinger D, Lotan R, et al. Non-alcoholic fatty liver disease is not associated with a lower health perception. World J Gastroenterol. 2016;22(17):4362-4372.
64. Centis E, Moscatiello S, Bugianesi E, et al. Stage of change and motivation to healthier lifestyle in non-alcoholic fatty liver disease. J Hepatol. 2013;58(4):771-777.
65. Zelber-Sagi S, Bord S, Dror-Lavi G, et al. Role of illness perception and self-efficacy in lifestyle modification among non-alcoholic fatty liver disease patients. World J Gastroenterol. 2017;23(10):1881-1890.
66. Bajaj JS, Thacker LR, Wade JB, et al. PROMIS computerized adaptive tests are dynamic instruments to measure health-related quality of life in patients with cirrhosis. Aliment Pharmacol Ther. 2011;34(9):1123-1132.
67. Verma M, Stites S, Navarro V. Bringing assessment of patient-reported outcomes to hepatology practice. Clin Gastroenterol Hepatol. 2018;16(3):447-448.
68. Ahmed S, Ware P, Gardner W, et al. Montreal Accord on patient-reported outcomes (PROs) use series – paper 8: patient-reported outcomes in electronic health records can inform clinical and policy decisions. J Clin Epidemiol. 2017;89:160-167.
69. Younossi ZM, Stepanova M, Lawitz E, et al. Improvement of hepatic fibrosis and patient-reported outcomes in non-alcoholic steatohepatitis treated with selonsertib. Liver Int. 2018;38(10):1849-1859.
70. Patel YA, Gifford EJ, Glass LM, et al. Identifying nonalcoholic fatty liver disease advanced fibrosis in the Veterans Health Administration. Dig Dis Sci. 2018;63(9):2259-2266.
71. Hsu C, Caussy C, Imajo K, et al. Magnetic resonance vs transient elastography analysis of patients with nonalcoholic fatty liver disease: a systematic review and pooled analysis of individual participants. Clin Gastroenterol Hepatol. 2018;pii:S1542-3565(18)30613-X. [Epub ahead of print.]
72. Searight R. Realistic approaches to counseling in the office setting. Am Fam Physician. 2009;79(4):277-284.
73. Vallis M, Piccinini-Vallis H, Sharma AM, Freedhoff Y. Clinical review: modified 5 As: minimal intervention for obesity counseling in primary care. Can Fam Physician. 2013:59(1):27-31.
74. Cusi K, Orsak B, Bril F, et al. Long-term pioglitazone treatment for patients with nonalcoholic steatohepatitis and prediabetes or type 2 diabetes mellitus: a randomized trial. Ann Intern Med. 2016;165(5):305-315.
75. Armstrong MJ, Gaunt P, Aithal GP, et al. Liraglutide safety and efficacy in patients with non-alcoholic steatohepatitis (LEAN): a multicentre, double-blind, randomised, placebo-controlled phase 2 study. Lancet. 2016;387(10019):679-690.
76. Salgia RJ, Mullan PB, McCurdy H, Sales A, Moseley RH, Su GL. The educational impact of the specialty care access network-extension of community healthcare outcomes program. Telemed J E Health. 2014;20(11):1004-1008.
77. Konjeti VR, Heuman D, Bajaj J, et al. Telehealth-based evaluation identifies patients who are not candidates for liver transplantation. Clin Gastroenterol Hepatol. 2019;17(1):207-209.e1
78. Su GL, Glass L, Tapper EB, Van T, Waljee AK, Sales AE. Virtual consultations through the Veterans Administration SCAN-ECHO project improves survival for veterans with liver disease. Hepatology. 2018;68(6):2317-2324.
79. Mazzotti A, Caletti MT, Brodosi L, et al. An internet-based approach for lifestyle changes in patients with NAFLD: two-year effects on weight loss and surrogate markers. J Hepatol. 2018;69(5):1155-1163.
80. Kanwal F, Kramer J, Asch SM, et al. An explicit quality indicator set for measurement of quality of care in patients with cirrhosis. Clin Gastroenterol Hepatol. 2010,8(8):709-717.
81. Blay E Jr, DeLancey JO, Hewitt DB, Chung JW, Bilimoria KY. Initial public reporting of quality at Veterans Affairs vs Non-Veterans Affairs hospitals. JAMA Intern Med. 2017;177(6):882-885.
Comorbidities and Nonalcoholic Fatty Liver Disease: The Chicken, the Egg, or Both?
Nonalcoholic fatty liver disease (NALFD) is now the most common chronic liver disease in the developed world and affects about 25% to 30% of adults in the US and 30% of veterans who receive care in the VHA system (Figure 1). 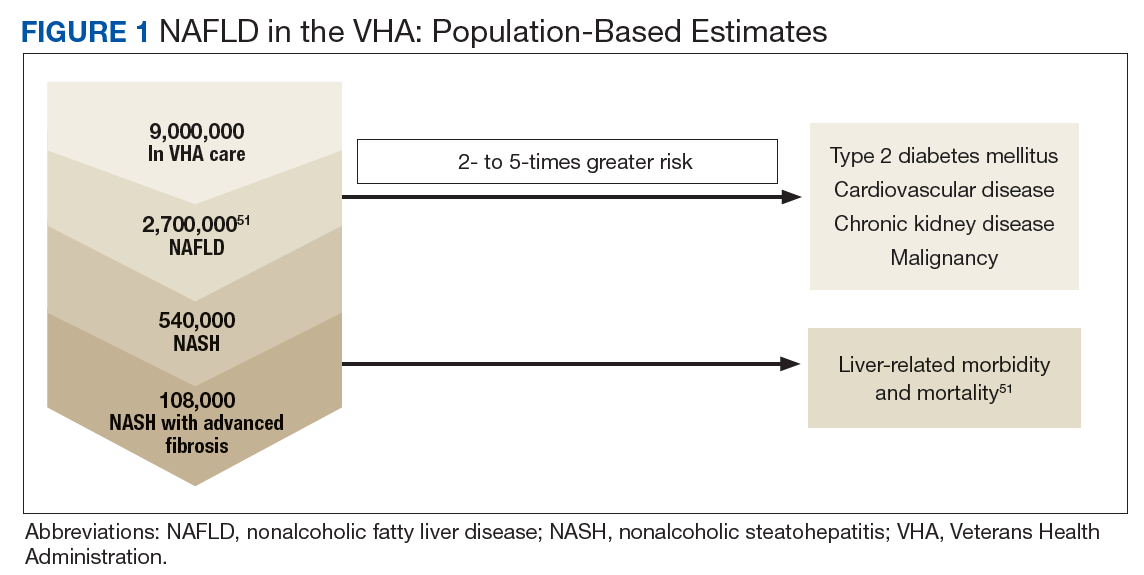
Related:
NAFLD is significantly associated with the presence of MetS, so much so that it has been considered the hepatic manifestation of MetS. NAFLD also is strongly associated with type 2 diabetes mellitus (T2DM), CVD, chronic kidney disease (CKD), and obstructive sleep apnea (OSA) (Figure 2). 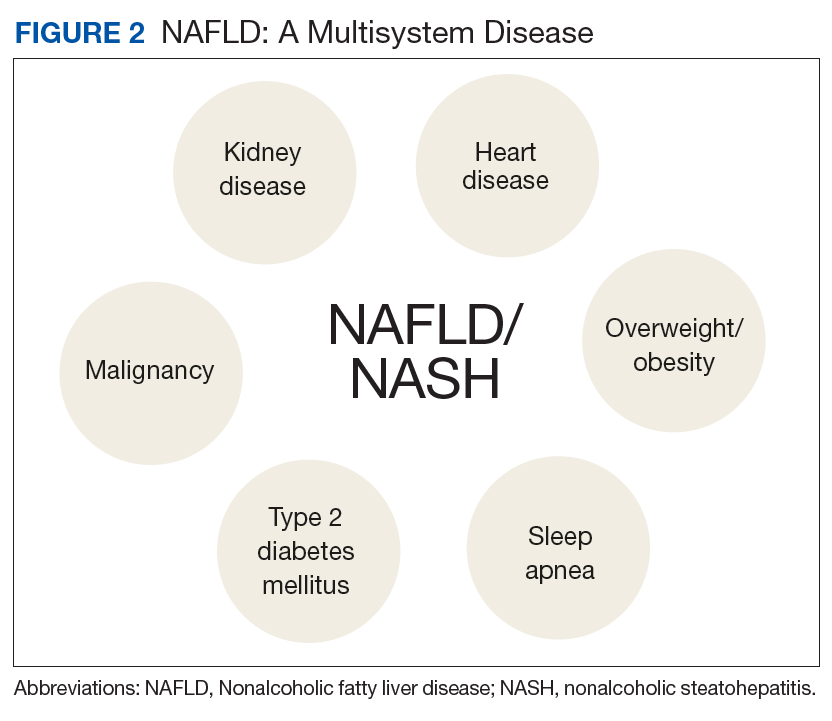
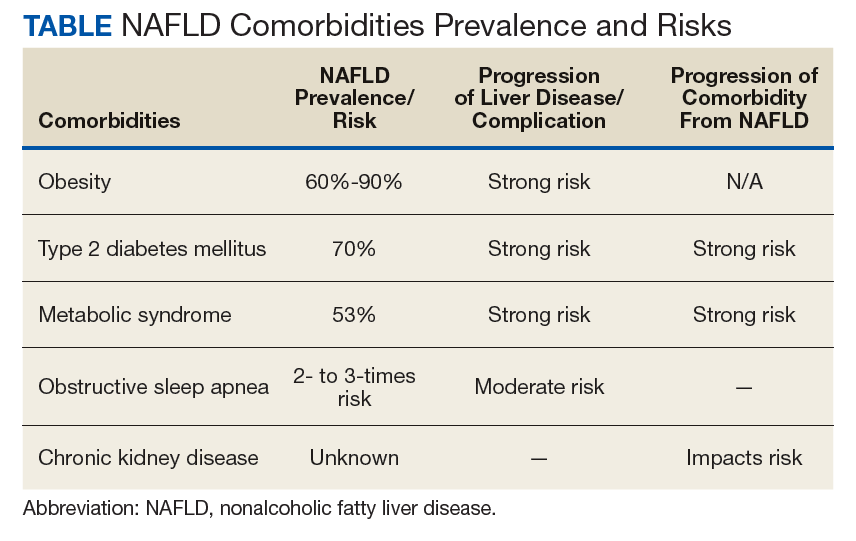
Obesity/Visceral Adiposity
Obesity (body mass index [BMI] > 30) prevalence in the US has almost doubled over the past 30 years and continues to climb.1 Obesity affects 41% of veterans in the Veterans Health Administration and is the most common risk factor for NAFLD.2 NAFLD is 4 times more prevalent in obese patients, thus, it is not surprising that 80% to 90% of patients evaluated in bariatric centers have NAFLD, reported in 2 large series.3,4 Increased BMI and waist circumference predict the presence of NASH and advanced fibrosis.5
While obesity is a hallmark for NAFLD, particularly in the US, it is important to note that up to 20% of Americans with normal BMI have NAFLD, based on findings of steatosis on ultrasound.6 These patients with lean NAFLD are often underdiagnosed. In addition to the patient’s BMI, it is important to recognize that in NAFLD, the distribution and type of fat deposition is more important than just BMI. Visceral fat refers to fat accumulation within the abdominal cavity and is key to the pathogenesis of NAFLD. Visceral fat, compared with subcutaneous fat, is metabolically active and can deliver an overabundance of free fatty acids to the liver as well as secrete proinflammatory mediators in the setting of insulin resistance. Visceral fat stores can predict increased hepatic fat content, inflammation, and fibrosis.5 Thus, it is important to recognize that those patients with relatively more visceral fat are more prone to NAFLD. The best clinical indicator of visceral adiposity is abdominal obesity, indicated by waist circumference > 40 inches in men and > 35 inches in women.
Metabolic Syndrome
Hepatic fat deposition can be associated with or precede MetS. MetS is defined as having at least 3 of the following characteristics: abdominal obesity, elevated triglycerides (TGs) (≥ 150 mg/dL), reduced high-density lipoprotein cholesterol (< 40 mg/dL in men or < 50 mg/dL in women), elevated blood pressure (BP) (systolic BP ≥ 130 mm Hg or diastolic BP ≥ 85 mm Hg), or elevated fasting glucose (≥ 110 mg/dL). Population studies have found that 50% of patients with MetS have NAFLD, and liver fat content is strongly correlated with the number of MetS features present in an individual.5,7 In addition to this association, NAFLD also promotes the development of MetS. Increased energy intake relative to energy expenditure will facilitate ectopic fat accumulation in the liver, which then increases hepatic gluconeogenesis and drives the pathogenesis of insulin resistance.8 Therefore, the presence of NAFLD is both a marker and a promotor of insulin resistance and its complications.
Related:
Type 2 Diabetes Mellitus
At 70% to 75%, the prevalence of NAFLD in patients with T2DM is more than twice as high as that in the general US adult population. Conversely, about 23% of patients with NAFLD also have T2DM.9
Influence of NAFLD on T2DM
Patients with ultrasound-based evidence of NAFLD are 2 to 5 times more likely to develop T2DM after adjusting for lifestyle and metabolic risk factors in multiple epidemiologic studies.10,11 The severity of hepaticfat content measured by ultrasound also is associated with an increasing risk of T2DM incidence over the next 5 years (normal,7%; mild, 9.8%; moderate-severe, 17.8%; P < .001).12 In another study, 58% of patientswith biopsy-proven NAFLD developed T2DM after a mean follow-up of 13.7 years.13 Those who were found to have NASH had a 3-fold higher risk of developing T2DM than did those with simple steatosis. This finding was confirmed in another study where T2DM incidence was 2 times higher in patients predicted to have advanced fibrosis compared with those who did not.14
Because liver steatosis interferes with insulin-induced glycogen production and suppression of gluconeogenesis, hepatic fat content predicts the insulin dose required for adequate glucose control in patients with diabetes mellitus (DM) and NAFLD.15 Higher levels of insulin are required in patients with DM and NAFLD compared with those without NAFLD.5 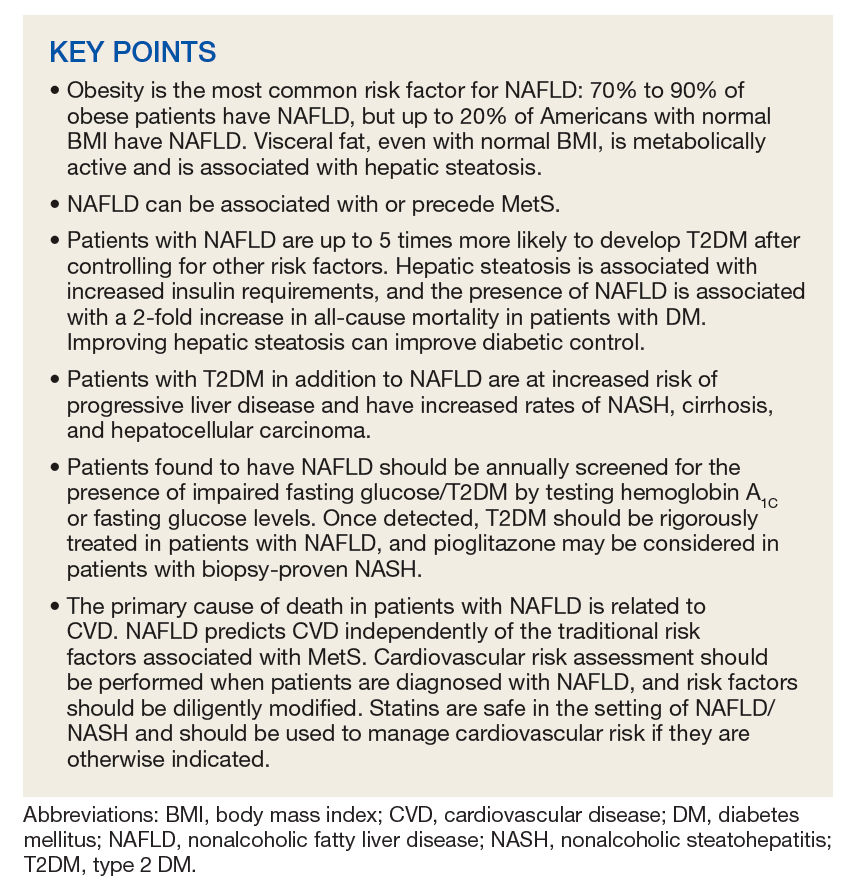
Additionally, a 10-year cohort study found that resolution of ultrasound-based NAFLD in patients without baseline T2DM, was associated with a reduced T2DM incidence (multivariate odds ratio [OR] 0.27, 95% CI, 0.12-0.61) after controlling for factors such as age, BMI, and impaired fasting glucose.11,17
Given this close relationship between T2DM and NAFLD, both the American Association for the Study of Liver Diseases (AASLD) and European Association for the Study of Liver Diseases (EASL) guidelines recommend that patients found to have NAFLD should be screened for the presence of impaired fasting glucose/T2DM by testing hemoglobin A1c or fasting glucose levels.18,19 Recognizing the role that NAFLD can play in patients with DM also is important, as improving hepatic steatosis may also improve DM.
Influence of DM on NAFLD
Patients with T2DM and NAFLD are at increased risk of progressive liver disease and have increased rates of NASH, cirrhosis, and HCC. In a paired-biopsy study, the development of T2DM was the strongest predictor of progression of NASH and hepatic fibrosis.20 This fibrosis progression can easily go undetected, as NASH can be present even with normal aminotransferases. This increased risk of fibrosis progression in the setting of comorbid T2DM is clinically important, as it is the severity of fibrosis that predicts all-cause and liver-related mortality in patients with NAFLD/NASH.21,22 In fact, the prevalence of biopsy-proven NASH in overweight/obese patients with DM with normal liver aminotransferases (defined as aspartate aminotransferase and alanine aminotransferase < 40 U/L) was found to be 58%.23 Because chronic liver disease, including NAFLD, is underrecognized in the “healthy population” used to establish normal aminotransferase levels, more recent AASLD and ACG guidelines now define normal aminotransferase levels as < 35 U/L for males and < 25 U/L for females.24 These stricter cutoffs are based on populations with normal BMI and negative testing for chronic liver diseases.24 The lower cutoffs may improve recognition of progressive liver disease in NAFLD and NASH patients.
Medications used in the treatment of T2DM, such as metformin, pioglitazone, and liraglutide, have been studied in patients with biopsy-proven NASH. The initial data showing histologic improvement in NAFLD patients taking metformin was more likely related to the associated weight loss in the treatment group. In a study by Loomba and colleagues the improvement in the NAFLD activity score was only seen in patients who lost ≥ 5% of their total body weight.25 Pioglitazone is a PPAR-γ agonist that helps regulate glucose and lipid metabolism as well as inflammation. Pioglitazone helps adipose tissue, hepatocytes, and muscle cells restore insulin sensitivity. A recent trial in 100 patients with prediabetes or T2DM as well as NASH showed that 36 weeks of pioglitazone treatment was associated with significant improvements in steatosis, inflammation, and most important, in stage of fibrosis compared with that of placebo.26
Related:
Glucagon-like peptide-1 (GLP-1) receptor agonists, such as liraglutide, have effects on lipid and glucose metabolism as well. They can lower glucose levels by increasing insulin secretion, reducing glucagon concentration, suppressing appetite (resulting in weight loss), and increasing sensitivity to insulin in hepatocytes and adipocytes. Liraglutide has been studied in patients with NASH both with and without DM, and results of the largest study to date show that it is associated with significant improvement in hepatic inflammation compared with that of placebo.27 Additional phase 3 clinical trials are currently underway.
Current AASLD guidelines do not recommend routine screening for NAFLD, even among high-risk patients, such as patients with DM.18 This is due to the widespread prevalence of NAFLD, the unclear utility of diagnostic tests, and limited efficacy of available treatment. Lifestyle modification to achieve weight loss remains the backbone of management, and rates of successful adherence are low.28 Contrary to this, EASL guidelines state that NAFLD screening with ultrasound even in patients with normal liver enzymes should be performed in high-risk patients with T2DM.19
Once detected, T2DM should be diligently treated in patients with NAFLD, and pioglitazone may be considered in patients with biopsy-proven NASH per AASLD guidelines.18 Pioglitazone has been studied in patients with biopsy-proven NASH both with and without DM and has been associated with significant resolution of NASH, as well as improvement in histologic changes of NASH and improvement in fibrosis.29,30 Because of potential medication AEs, including a mean weight gain of 2.5 kg to 4.7 kg in trials of 12- to 36-months’ duration, as well as potential bone loss in women, discussions about the risks and benefits of treatment should occur prior to treatment initiation.18 Additionally, pioglitazone is not safe in the setting of left ventricular heart failure. Future studies may point to the utility of other DM medications, such as GLP-receptor agonists.
Cardiovascular Disease
Given the association between features of MetS and NAFLD, it is not surprising that the primary cause of death in patients with NAFLD is related to CVD.21,22,31 However, it is increasingly recognized that NAFLD predicts CVD independently of the traditional risk factors associated with MetS. The increase in cardiovascular risk in the setting of NAFLD can be partly explained by the increased hepatic de novo lipogenesis that is associated with increased production of highly atherogenic small dense low-density lipoproteins (sd-LDL) independent of BMI and presence of insulin resistance.32 Additionally, increased intracellular free fatty acids can activate proinflammatory cytokine production by hepatocytes in addition to the increase in systemic inflammatory mediators and oxidative stress associated with NASH.
A recent meta-analysis of 27 studies confirmed the association between NAFLD and many subclinical features of CVD, including increases in coronary-artery calcium score, carotid artery intimal media thickness, and arterial wall stiffness, as well as impaired flow-mediated vasodilation after controlling for classic CVD risk factors.33 The risk of subclinical carotid and coronary atherosclerosis progression was higher in NAFLD patients with evidence of advanced fibrosis using noninvasive measures. Additionally, NAFLD was associated with increased severity of coronary artery disease in > 600 patients undergoing cardiac angiograms.34 Conversely, the regression of NAFLD on ultrasound was associated with a decreased risk of carotid atherosclerosis progression.35
Multiple epidemiologic studies have found an increased incidence of clinically overt CVD in patients with NAFLD after controlling for confounders. The largest updated meta-analysis, which included more than 34,000 patients with 2,600 CVD outcomes over a median of 6.9 years found that the presence of NAFLD (based on imaging or biopsy) was associated with an odds ratio (OR) of 1.64 (95% CI, 1.26-2.13) for fatal and nonfatal incident CVD.36 In the same meta-analysis, patients with NASH, with or without fibrosis, were at an even higher risk, with an OR of 2.58 (95% CI, 1.78-3.75).
Initial studies of statin medications for the treatment of NASH using surrogate endpoints like improvement in aminotransferases or imaging, suggested a potential liver-related benefit. However, there was no histologic improvement in the single study comparing 12 months of simvastatin therapy with placebo in patients with NASH.37 Although it is unclear whether statin use will directly improve NAFLD, there is no evidence to suggest that statin use should be avoided in patients with elevated CVD risk.38 Treatment with atorvastatin has been shown to be associated with a greater reduction in cardiovascular events in patients with NAFLD compared with that of patients without NAFLD.39
The strong association between CVD and NAFLD has important clinical implications that may influence the decision to initiate treatment for primary prevention, including lipid-lowering, antihypertensive, or antiplatelet therapies. The clinical algorithms currently used to help risk stratify patients and determine appropriate preventative strategies, the Framingham risk equation or the systemic coronary risk evaluation, do not incorporate NAFLD as a potential risk factor for CVD. Additional studies are needed to determine whether adding NAFLD to the assessment will improve the predictive accuracy of future CVD events. Nevertheless, European clinical guidelines recommend performing a CVD risk assessment for patients with NAFLD.19
Chronic Kidney Disease
The prevalence of CKD, defined as estimated glomerular filtration rate (GFR) < 60 mL/min/1.72 m2, abnormal albuminuria, or proteinuria, is significantly increased in patients with NAFLD. Several epidemiologic studies have shown the prevalence of CKD in NAFLD patients ranges from 20% to 55% compared with 5% to 30% among patients without NAFLD.40 Overall, patients with NAFLD have a 2-fold increased risk of prevalent (OR 2.12; 95% CI, 1.69-2.66) or incident (hazard ratio 1.79; 95% CI, 1.65-1.95) CKD, even after adjusting for T2DM, visceral fat, and insulin resistance.40 There is an additional 2-fold increase in CKD risk in patients with NASH and advanced fibrosis compared with those with NASH and mild/no fibrosis. Additionally, advancing NASH fibrosis stage is independently associated with worsening stage of CKD.41
Data regarding the exact mechanism of kidney pathology in the setting of NAFLD is lacking. The accelerated atherogenesis in NAFLD likely contributes to renal damage. Another potential mechanism to explain the association between NASH and CKD involves the increased activation of the angiotensin-aldosterone system (RAAS) seen in NASH, which leads to increased hepatic fibrogenesis as well as kidney damage.42
Similar to the previously listed comorbidities, there is evidence that improvement in NAFLD can lead to improvements in renal disease. A prospective study of NASH patients undergoing 52 weeks of lifestyle modification found that the patients who had improvements in histologic NASH endpoints also had improvement in renal function.43
There are currently no specific recommendations on screening for CKD in professionalguidelines, but many experts propose monitoring for CKD yearly with serum creatinine and urinalysis and referring to nephrology if needed. Given the association between NASH and activation of the RAAS pathway that is associated with worsening hepatic fibrosis, RAAS-inhibitors should be a first-line agent in the treatment of hypertension in patients with NAFLD.
Obstructive Sleep Apnea
OSA is characterized by repeated pharyngeal collapse during sleep, which leads to chronic intermittent hypoxia and is associated with increased metabolic and cardiovascular morbidity and mortality. The cycle of intermittent hypoxia and reoxygenation in OSA results in inflammation and oxidative stress. Multiple studies have supported a link between NAFLD and OSA.
Hepatic fat content on ultrasound was increased in patients with OSA independent of BMI. There also has been evidence of a positive association between the severity of chronic intermittent hypoxia and increased hepatic fibrosis based on liver elastography.44 A meta-analysis using histologic NAFLD diagnosis showed that the presence of OSA was associated with a higher risk of fibrosis compared with that of patients with NAFLD without OSA (OR 2.6; 95% CI, 1.3-5.2).45
Based on animal models, hypoxia can drive fat accumulation and inflammation in the liver via multiple different pathways. Hypoxia can increase fasting glucose and systemic TG levels and induce hepatic lipogenesis by altering gene expression.45 Hypoxia also can increase oxidative stress and reduce β-oxidation, which leads to the production of lipotoxic lipids. These hypoxia-induced changes are typically more pronounced in subjects with obesity compared with that in subjects without obesity. Despite multiple adverse metabolic effects of OSA-induced hypoxia in the setting of NAFLD, preliminary, short-term studies have failed to find an association with OSA treatment with continuous positive airway pressure and improvement in NAFLD.45 Perhaps larger, long-term prospective trials will clarify this question.
Malignancy
Extrahepatic malignancy (colon, esophagus, stomach, pancreas, kidney, and breast) is the second most common cause of death in patients with NAFLD.21,22 The primary association between NAFLD and malignancy is found in the colon. Most large population-based studies have been performed in East Asia and have found that NAFLD is associated with a 1.5 to 1.7-fold increased risk for colonic adenomas and a 1.9 to 3.1-fold increased risk of colorectal cancer.46-49 Using magnetic resonance spectroscopy and liver biopsy to diagnose NAFLD and NASH, respectively, Wong and colleagues found that NASH, but not simple steatosis, is associated with a higher risk of advanced colorectalneoplasia (OR 5.34; 95% CI, 1.9-14.8), after adjusting for age, gender, BMI, family history, smoking, and T2DM.50
Data showing a definitive causative role of NAFLD in the development of colorectal cancer are lacking, but the presence of increased insulin levels has many potential effects on carcinogenesis in general, including stimulation of cell proliferation and apoptosis. Currently, there are no recommended changes to the standard colorectal cancer screening recommendations specifically for patients with NAFLD.
Conclusion
NAFLD is a multisystem disease that is associated with increased liver-related and all-cause mortality. Data on the close association between NAFLD and several extrahepatic complications, including MetS, T2DM, CVD, CKD, and malignancy are well established. There also is growing evidence of a bidirectional relationship between some of these diagnoses, whereas NAFLD is not only a consequence, but also a cause of MetS, T2DM, and CKD independent of other typical risk factors.
Given the multiple comorbidities associated with NAFLD and its potential to influence the severity of these diagnoses, management of these complex patients requires diligence and a multidisciplinary approach. In order to engage in early recognition and intervention to prevent potential morbidity and mortality, regular screening and surveillance for the development of NAFLD in patients with metabolic risk factors can be considered, and careful screening for metabolic complications in patients with established NAFLD is important.
1. Centers for Disease Control and Prevention. National Center for Health Statistics. National Health and Nutrition Examination Survey. Hyattsville, MD: U.S. Department of Health and Human Services, Centers for Disease Control and Prevention, 2014.
2. Breland JY, Phibbs CS, Hoggatt KJ, et al. The obesity epidemic in the Veterans Health Administration: prevalence among key populations of women and men veterans. J Gen Intern Med. 2017;32(suppl 1):11-17.
3. Machado M, Marques-Vidal P, Cortez-Pinto H. Hepatic histology in obese patients undergoing bariatric surgery. J Hepatol. 2006;45(4):600-606.
4. Subichin M, Clanton J, Makuszewski M, Bohon A, Zografakis JG, Dan A. Liver disease in the morbidly obese: a review of 1000 consecutive patients undergoing weight loss surgery. Surg Obes Relat Dis. 2015;11(1):137-141.
5. Non-alcoholic Fatty Liver Disease Study Group, Lonardo A, Bellentani S, et al. Epidemiological modifiers of non-alcoholic fatty liver disease: focus on high-risk groups. Dig Liver Dis. 2015;47(12):997-1006.
6. Kim D, Kim WR. Nonobese fatty liver disease. Clin Gastroenterol Hepatol. 2017;15(4):474-485.
7. Kotronen A, Westerbacka J, Bergholm R, Pietiläinen KH, Yki-Järvinen H. Liver fat in the metabolic syndrome. J Clin Endocrinol Metab. 2007;92(9):3490-3497.
8. Shulman GI. Ectopic fat in insulin resistance, dyslipidemia, and cardiometabolic disease. N Engl J Med. 2014;371(12):1131-1141.
9. Younossi ZM, Koenig AB, Abdelatif D, Fazel Y, Henry L, Wymer M. Global epidemiology of nonalcoholic fatty liver disease-meta-analytic assessment of prevalence, incidence, and outcomes. Hepatology. 2016;64(1):73-84.
10. Armstrong MJ, Adams LA, Canbay A, et al. Extrahepatic complications of nonalcoholic fatty liver disease. Hepatology. 2014;59(3):1174-1197.
11. Kashanian S, Fuchs M. Non-alcoholic fatty liver disease in patients with diabetes mellitus: a clinician’s perspective. Int J Dig Dis. 2015;1:1.
12. Park SK, Seo MH, Shin HC, Ryoo JH. Clinical availability of nonalcoholic fatty liver disease as an early predictor of type 2 diabetes mellitus in Korean men: 5-year prospective cohort study. Hepatology. 2013;57(4):1378-1383.
13. Ekstedt M, Franzen LE, Mathiesen UL, et al. Long-term follow-up of patients with NAFLD and elevated liver enzymes. Hepatology. 2006;44(4):865-873.
14. Chang Y, Jung HS, Yun KE, Cho J, Cho YK, Ryu S. Cohort study of non-alcoholic fatty liver disease, NAFLD fibrosis score, and the risk of incident diabetes in a Korean population. Am J Gastroenterol. 2013;108(12):1861-1868.
15. Ryysy L, Hakkinen AM, Goto T, et al. Hepatic fat content and insulin action on free fatty acids and glucose metabolism rather than insulin absorption are associated with insulin requirements during insulin therapy in type 2 diabetic patients. Diabetes. 2000;49(5):749-758.
16. Adams LA, Harmsen S, St Sauver JL, et al. Nonalcoholic fatty liver disease increases risk of death among patients with diabetes: a community-based cohort study. Am J Gastroenterol. 2010;105(7):1567-1573.
17. Yamazaki H, Tsuboya T, Tsuji K, Dohke M, Maguchi H. Independent association between improvement in nonalcoholic fatty liver disease and reduced risk of incidence of type 2 diabetes. Diabetes Care. 2015;38(9):1673-1679.
18. Chalasani N, Younossi Z, Lavine JE, et al. The diagnosis and management of nonalcoholic fatty liver disease: practice guidance from the American Association for the Study of Liver Diseases. Hepatology. 2018;67(1):328-357.
19. European Association for the Study of the Liver; European Association for the Study of Diabetes; European Association for the Study of Obesity. EASL-EASD-EASO clinical practice guidelines for the management of nonalcoholic fatty liver disease. J Hepatol. 2016;64(6):1388-1402.
20. McPherson S, Hardy T, Henderson E, Burt AD, Day CP, Anstee QM. Evidence of NAFLD progression from steatosis to fibrosing steatohepatitis using paired biopsies: implications for prognosis and clinical management. J Hepatol. 2015;62(5):1148-1155.
21. Ekstedt M, Hagstrom H, Nasr P, et al. Fibrosis stage is the strongest predictor for disease-specific mortality in NAFLD after up to 33 years of follow-up. Hepatology. 2015;61(5):1547-1554.
22. Angulo P, Kleiner DE, Dam-Larsen S, et al. Liver fibrosis, but no other histologic feature, is associated with long-term outcomes in patients with nonalcoholic fatty liver disease. Gastroenterology. 2015;149(2):389-397.
23. Portillo-Sanchez P, Bril F, Maximos M, et al. High prevalence of nonalcoholic fatty liver disease in patients with type 2 diabetes mellitus and normal aminotransferases. J Clin Endocrinol. Metab. 2015;100(6):2231-2238.
24. Kwo PY, Cohen SM, and Lim JK. ACG clinical guideline: evaluation of abnormal liver chemistries. Am J Gastroenterol. 2017;112(1):18-35.
25. Loomba R, Lutchman G, Kleiner DE, et al. Clinical trial: pilot study of metformin for the treatment of non-alcoholic steatohepatitis. Aliment Pharmacol Ther. 2009;29(2):172-182.
26. Cusi K, Orsak B, Lomonaco R, et al. Extended treatment with pioglitazone improves liver histology in patients with pre-diabetes or type 2 diabetes mellitus and NASH. Hepatology. 2013;58(supp 1):248a.
27. Armstrong MJ, Gaunt P, Aithal GP, et al. Liraglutide safety and efficacy in patients with non-alcoholic steatohepatitis (LEAN): a multicentre, double-blind, randomised, placebo-controlled phase 2 study. Lancet. 2016;387(10019):679-690.
28. Patel YA, Gifford EJ, Glass LM, et al. Risk factors for biopsy-proven advanced non-alcoholic fatty liver disease in the Veterans Health Administration. Aliment Pharmacol Ther. 2018;47(2):268-278.
29. Cusi K, Orsak B, Bril F, et al. Long-term pioglitazone treatment for patients with nonalcoholic steatohepatitis and prediabetes or type diabetes mellitus: a randomized trial. Ann Intern Med. 2016;165(5):305-315.
30. Sanyal AJ, Chalasani N, Kowdley KV, et al; NASH CRN. Pioglitazone, vitamin E, or placebo for nonalcoholic steatohepatitis. N Engl J Med. 2010;362(18):1675-1685.
31. Ekstedt M, Frazen LE, Mathiesen UL, et al. Long-term follow-up of patients with NAFLD and elevated liver enzymes. Hepatology. 2006;44(4):865-873.
32. Vanni E, Marengo A, Mezzabotta L, Bugianesi E. Systemic complications of nonalcoholic fatty liver disease: when the liver is not an innocent bystander. Semin Liver Dis. 2015;35(3): 236-249.
33. Oni ET, Agatston AS, Blaha MJ, et al. A systematic review: burden and severity of subclinical cardiovascular disease among those with nonalcoholic fatty liver: should we care? Atherosclerosis. 2013;230(2):358-367.
34. Wong VW, Wong GL, Yip GW, et al. Coronary artery disease and cardiovascular outcomes in patients with non-alcoholic fatty liver disease. Gut. 2011;60(12):1721-1727.
35. Sinn DH, Cho SJ, Gu S. Persistent nonalcoholic fatty liver disease increased risk for carotid atherosclerosis. Gastroenterology. 2016;151(3):481-488.
36. Targher G, Byrne CD, Lonardo A, Zoppini G, Barbui C. Non-alcoholic fatty liver disease and risk of incident cardiovascular disease: a meta-analysis. J Hepatol. 2016;65(3):589-600.
37. Nelson A, Torres DM, Morgan AE, Fincke C, Harrison SA. A pilot study using simvastatin in the treatment of nonalcoholic steatohepatitis: A randomized, placebo-controlled trial. J Clin Gastroenterol. 2009;43(10):900-904.
38. Lewis JH, Mortensen ME, Zweig S, Fusco MJ, Medoff JR, Belder R; Pravastatin in Chronic Liver Disease Study Investigators. Efficacy and safety of high-dose pravastatin in hypercholesterolemic patients with well-compensated chronic liver disease: results of a prospective, randomized, double-blind, placebo-controlled, multicenter trial. Hepatology. 2007;46(5):1453-1463.
39. Athyros VG, Tziomalos K, Gossios TD, et al; GREACE Study Collaborative Group. Safety and efficacy of long-term statin treatment for cardiovascular events in patients with coronary artery disease and abnormal liver tests in the Greek Atorvastatin and Coronary Heart Disease Evaluation (GREACE) study: a post-hoc analysis. Lancet. 2010;376(9756):1916-1922.
40. Musso G, Gambino R, Tabibian JH, et al. Association with non-alcoholic fatty liver disease with chronic kidney disease: a systematic review and meta-analysis. PLoS Med. 2014;11(7):e1001680.
41. Targher G, Bertolini L, Rodella S, Lippi G, Zoppini G, Chonchol M. Relationship between kidney function and liver histology in subjects with nonalcoholic steatohepatitis. Clin J Am Soc Nephrol. 2010;5(12):2166-2171.
42. Vilar-Gomez E, Galzadilla-Bertot L, Friedman SL, et al. Improvement in liver histology due to lifestyle modification is independently associated with improved kidney function in patients with non-alcoholic steatohepatitis. Aliment Pharmacol Ther. 2017;45(2):332-344
43. Agrawal S, Duseja A, Aggarwal A, et al. Obstructive sleep apnea is an important predictor of hepatic fibrosis in patients with nonalcoholic fatty liver disease in a tertiary care center. Hepatol Int. 2015;9(2):283-291.
44. Sookoian S, Pirola CJ. Obstructive sleep apnea is associated with fatty liver and abnormal liver enzymes: a meta-analysis. Obes Surg. 2013;23(11):1815-1825.
45. Aron-Wisnewsky J, Clement K, Pépin JL. Nonalcoholic fatty liver disease and obstructive sleep apnea. Metabolism. 2016;65(8):1124-1135.
46. Ding W, Fan J, Qin J. Association between nonalcoholic fatty liver disease and colorectal adenoma: a systematic review and meta-analysis. Int J Clin Exp Med. 2015;8(1):322-333.
47. Shen H, Lipka S, Kumar A, Mustacchia P. Association between nonalcoholic fatty liver disease and colorectal adenoma: a systematic review and meta-analysis. J Gastrointest Oncol. 2014:5(6):440-446.
48. Lee YI, Lim YS, Park HS. Colorectal neoplasms in relation to non-alcoholic fatty liver disease in Korean women: a retrospective cohort study. J Gastroenterol Hepatol. 2012;27(1):91-95.
49. Lin XF, Shi KQ, You J, et al. Increased risk of colorectal malignant neoplasm in patients with nonalcoholic fatty liver disease: a large study. Mol Biol Rep. 2014;41(5):2989-2997.
50. Wong VW, Wong GL, Tsang SW, et al. High prevalence of colorectal neoplasm in patients with non-alcoholic steatohepatitis. Gut. 2011;60(6):829-836.
51. Estes C, Razavi H, Loomba R, Younossi Z, Sanyal AJ. Modeling the epidemic of nonalcoholic fatty liver disease demonstrates an exponential increase in burden of disease. Hepatology. 2018;67(1):123-133.
Nonalcoholic fatty liver disease (NALFD) is now the most common chronic liver disease in the developed world and affects about 25% to 30% of adults in the US and 30% of veterans who receive care in the VHA system (Figure 1).
Related:
NAFLD is significantly associated with the presence of MetS, so much so that it has been considered the hepatic manifestation of MetS. NAFLD also is strongly associated with type 2 diabetes mellitus (T2DM), CVD, chronic kidney disease (CKD), and obstructive sleep apnea (OSA) (Figure 2).
Obesity/Visceral Adiposity
Obesity (body mass index [BMI] > 30) prevalence in the US has almost doubled over the past 30 years and continues to climb.1 Obesity affects 41% of veterans in the Veterans Health Administration and is the most common risk factor for NAFLD.2 NAFLD is 4 times more prevalent in obese patients, thus, it is not surprising that 80% to 90% of patients evaluated in bariatric centers have NAFLD, reported in 2 large series.3,4 Increased BMI and waist circumference predict the presence of NASH and advanced fibrosis.5
While obesity is a hallmark for NAFLD, particularly in the US, it is important to note that up to 20% of Americans with normal BMI have NAFLD, based on findings of steatosis on ultrasound.6 These patients with lean NAFLD are often underdiagnosed. In addition to the patient’s BMI, it is important to recognize that in NAFLD, the distribution and type of fat deposition is more important than just BMI. Visceral fat refers to fat accumulation within the abdominal cavity and is key to the pathogenesis of NAFLD. Visceral fat, compared with subcutaneous fat, is metabolically active and can deliver an overabundance of free fatty acids to the liver as well as secrete proinflammatory mediators in the setting of insulin resistance. Visceral fat stores can predict increased hepatic fat content, inflammation, and fibrosis.5 Thus, it is important to recognize that those patients with relatively more visceral fat are more prone to NAFLD. The best clinical indicator of visceral adiposity is abdominal obesity, indicated by waist circumference > 40 inches in men and > 35 inches in women.
Metabolic Syndrome
Hepatic fat deposition can be associated with or precede MetS. MetS is defined as having at least 3 of the following characteristics: abdominal obesity, elevated triglycerides (TGs) (≥ 150 mg/dL), reduced high-density lipoprotein cholesterol (< 40 mg/dL in men or < 50 mg/dL in women), elevated blood pressure (BP) (systolic BP ≥ 130 mm Hg or diastolic BP ≥ 85 mm Hg), or elevated fasting glucose (≥ 110 mg/dL). Population studies have found that 50% of patients with MetS have NAFLD, and liver fat content is strongly correlated with the number of MetS features present in an individual.5,7 In addition to this association, NAFLD also promotes the development of MetS. Increased energy intake relative to energy expenditure will facilitate ectopic fat accumulation in the liver, which then increases hepatic gluconeogenesis and drives the pathogenesis of insulin resistance.8 Therefore, the presence of NAFLD is both a marker and a promotor of insulin resistance and its complications.
Related:
Type 2 Diabetes Mellitus
At 70% to 75%, the prevalence of NAFLD in patients with T2DM is more than twice as high as that in the general US adult population. Conversely, about 23% of patients with NAFLD also have T2DM.9
Influence of NAFLD on T2DM
Patients with ultrasound-based evidence of NAFLD are 2 to 5 times more likely to develop T2DM after adjusting for lifestyle and metabolic risk factors in multiple epidemiologic studies.10,11 The severity of hepaticfat content measured by ultrasound also is associated with an increasing risk of T2DM incidence over the next 5 years (normal,7%; mild, 9.8%; moderate-severe, 17.8%; P < .001).12 In another study, 58% of patientswith biopsy-proven NAFLD developed T2DM after a mean follow-up of 13.7 years.13 Those who were found to have NASH had a 3-fold higher risk of developing T2DM than did those with simple steatosis. This finding was confirmed in another study where T2DM incidence was 2 times higher in patients predicted to have advanced fibrosis compared with those who did not.14
Because liver steatosis interferes with insulin-induced glycogen production and suppression of gluconeogenesis, hepatic fat content predicts the insulin dose required for adequate glucose control in patients with diabetes mellitus (DM) and NAFLD.15 Higher levels of insulin are required in patients with DM and NAFLD compared with those without NAFLD.5
Additionally, a 10-year cohort study found that resolution of ultrasound-based NAFLD in patients without baseline T2DM, was associated with a reduced T2DM incidence (multivariate odds ratio [OR] 0.27, 95% CI, 0.12-0.61) after controlling for factors such as age, BMI, and impaired fasting glucose.11,17
Given this close relationship between T2DM and NAFLD, both the American Association for the Study of Liver Diseases (AASLD) and European Association for the Study of Liver Diseases (EASL) guidelines recommend that patients found to have NAFLD should be screened for the presence of impaired fasting glucose/T2DM by testing hemoglobin A1c or fasting glucose levels.18,19 Recognizing the role that NAFLD can play in patients with DM also is important, as improving hepatic steatosis may also improve DM.
Influence of DM on NAFLD
Patients with T2DM and NAFLD are at increased risk of progressive liver disease and have increased rates of NASH, cirrhosis, and HCC. In a paired-biopsy study, the development of T2DM was the strongest predictor of progression of NASH and hepatic fibrosis.20 This fibrosis progression can easily go undetected, as NASH can be present even with normal aminotransferases. This increased risk of fibrosis progression in the setting of comorbid T2DM is clinically important, as it is the severity of fibrosis that predicts all-cause and liver-related mortality in patients with NAFLD/NASH.21,22 In fact, the prevalence of biopsy-proven NASH in overweight/obese patients with DM with normal liver aminotransferases (defined as aspartate aminotransferase and alanine aminotransferase < 40 U/L) was found to be 58%.23 Because chronic liver disease, including NAFLD, is underrecognized in the “healthy population” used to establish normal aminotransferase levels, more recent AASLD and ACG guidelines now define normal aminotransferase levels as < 35 U/L for males and < 25 U/L for females.24 These stricter cutoffs are based on populations with normal BMI and negative testing for chronic liver diseases.24 The lower cutoffs may improve recognition of progressive liver disease in NAFLD and NASH patients.
Medications used in the treatment of T2DM, such as metformin, pioglitazone, and liraglutide, have been studied in patients with biopsy-proven NASH. The initial data showing histologic improvement in NAFLD patients taking metformin was more likely related to the associated weight loss in the treatment group. In a study by Loomba and colleagues the improvement in the NAFLD activity score was only seen in patients who lost ≥ 5% of their total body weight.25 Pioglitazone is a PPAR-γ agonist that helps regulate glucose and lipid metabolism as well as inflammation. Pioglitazone helps adipose tissue, hepatocytes, and muscle cells restore insulin sensitivity. A recent trial in 100 patients with prediabetes or T2DM as well as NASH showed that 36 weeks of pioglitazone treatment was associated with significant improvements in steatosis, inflammation, and most important, in stage of fibrosis compared with that of placebo.26
Related:
Glucagon-like peptide-1 (GLP-1) receptor agonists, such as liraglutide, have effects on lipid and glucose metabolism as well. They can lower glucose levels by increasing insulin secretion, reducing glucagon concentration, suppressing appetite (resulting in weight loss), and increasing sensitivity to insulin in hepatocytes and adipocytes. Liraglutide has been studied in patients with NASH both with and without DM, and results of the largest study to date show that it is associated with significant improvement in hepatic inflammation compared with that of placebo.27 Additional phase 3 clinical trials are currently underway.
Current AASLD guidelines do not recommend routine screening for NAFLD, even among high-risk patients, such as patients with DM.18 This is due to the widespread prevalence of NAFLD, the unclear utility of diagnostic tests, and limited efficacy of available treatment. Lifestyle modification to achieve weight loss remains the backbone of management, and rates of successful adherence are low.28 Contrary to this, EASL guidelines state that NAFLD screening with ultrasound even in patients with normal liver enzymes should be performed in high-risk patients with T2DM.19
Once detected, T2DM should be diligently treated in patients with NAFLD, and pioglitazone may be considered in patients with biopsy-proven NASH per AASLD guidelines.18 Pioglitazone has been studied in patients with biopsy-proven NASH both with and without DM and has been associated with significant resolution of NASH, as well as improvement in histologic changes of NASH and improvement in fibrosis.29,30 Because of potential medication AEs, including a mean weight gain of 2.5 kg to 4.7 kg in trials of 12- to 36-months’ duration, as well as potential bone loss in women, discussions about the risks and benefits of treatment should occur prior to treatment initiation.18 Additionally, pioglitazone is not safe in the setting of left ventricular heart failure. Future studies may point to the utility of other DM medications, such as GLP-receptor agonists.
Cardiovascular Disease
Given the association between features of MetS and NAFLD, it is not surprising that the primary cause of death in patients with NAFLD is related to CVD.21,22,31 However, it is increasingly recognized that NAFLD predicts CVD independently of the traditional risk factors associated with MetS. The increase in cardiovascular risk in the setting of NAFLD can be partly explained by the increased hepatic de novo lipogenesis that is associated with increased production of highly atherogenic small dense low-density lipoproteins (sd-LDL) independent of BMI and presence of insulin resistance.32 Additionally, increased intracellular free fatty acids can activate proinflammatory cytokine production by hepatocytes in addition to the increase in systemic inflammatory mediators and oxidative stress associated with NASH.
A recent meta-analysis of 27 studies confirmed the association between NAFLD and many subclinical features of CVD, including increases in coronary-artery calcium score, carotid artery intimal media thickness, and arterial wall stiffness, as well as impaired flow-mediated vasodilation after controlling for classic CVD risk factors.33 The risk of subclinical carotid and coronary atherosclerosis progression was higher in NAFLD patients with evidence of advanced fibrosis using noninvasive measures. Additionally, NAFLD was associated with increased severity of coronary artery disease in > 600 patients undergoing cardiac angiograms.34 Conversely, the regression of NAFLD on ultrasound was associated with a decreased risk of carotid atherosclerosis progression.35
Multiple epidemiologic studies have found an increased incidence of clinically overt CVD in patients with NAFLD after controlling for confounders. The largest updated meta-analysis, which included more than 34,000 patients with 2,600 CVD outcomes over a median of 6.9 years found that the presence of NAFLD (based on imaging or biopsy) was associated with an odds ratio (OR) of 1.64 (95% CI, 1.26-2.13) for fatal and nonfatal incident CVD.36 In the same meta-analysis, patients with NASH, with or without fibrosis, were at an even higher risk, with an OR of 2.58 (95% CI, 1.78-3.75).
Initial studies of statin medications for the treatment of NASH using surrogate endpoints like improvement in aminotransferases or imaging, suggested a potential liver-related benefit. However, there was no histologic improvement in the single study comparing 12 months of simvastatin therapy with placebo in patients with NASH.37 Although it is unclear whether statin use will directly improve NAFLD, there is no evidence to suggest that statin use should be avoided in patients with elevated CVD risk.38 Treatment with atorvastatin has been shown to be associated with a greater reduction in cardiovascular events in patients with NAFLD compared with that of patients without NAFLD.39
The strong association between CVD and NAFLD has important clinical implications that may influence the decision to initiate treatment for primary prevention, including lipid-lowering, antihypertensive, or antiplatelet therapies. The clinical algorithms currently used to help risk stratify patients and determine appropriate preventative strategies, the Framingham risk equation or the systemic coronary risk evaluation, do not incorporate NAFLD as a potential risk factor for CVD. Additional studies are needed to determine whether adding NAFLD to the assessment will improve the predictive accuracy of future CVD events. Nevertheless, European clinical guidelines recommend performing a CVD risk assessment for patients with NAFLD.19
Chronic Kidney Disease
The prevalence of CKD, defined as estimated glomerular filtration rate (GFR) < 60 mL/min/1.72 m2, abnormal albuminuria, or proteinuria, is significantly increased in patients with NAFLD. Several epidemiologic studies have shown the prevalence of CKD in NAFLD patients ranges from 20% to 55% compared with 5% to 30% among patients without NAFLD.40 Overall, patients with NAFLD have a 2-fold increased risk of prevalent (OR 2.12; 95% CI, 1.69-2.66) or incident (hazard ratio 1.79; 95% CI, 1.65-1.95) CKD, even after adjusting for T2DM, visceral fat, and insulin resistance.40 There is an additional 2-fold increase in CKD risk in patients with NASH and advanced fibrosis compared with those with NASH and mild/no fibrosis. Additionally, advancing NASH fibrosis stage is independently associated with worsening stage of CKD.41
Data regarding the exact mechanism of kidney pathology in the setting of NAFLD is lacking. The accelerated atherogenesis in NAFLD likely contributes to renal damage. Another potential mechanism to explain the association between NASH and CKD involves the increased activation of the angiotensin-aldosterone system (RAAS) seen in NASH, which leads to increased hepatic fibrogenesis as well as kidney damage.42
Similar to the previously listed comorbidities, there is evidence that improvement in NAFLD can lead to improvements in renal disease. A prospective study of NASH patients undergoing 52 weeks of lifestyle modification found that the patients who had improvements in histologic NASH endpoints also had improvement in renal function.43
There are currently no specific recommendations on screening for CKD in professionalguidelines, but many experts propose monitoring for CKD yearly with serum creatinine and urinalysis and referring to nephrology if needed. Given the association between NASH and activation of the RAAS pathway that is associated with worsening hepatic fibrosis, RAAS-inhibitors should be a first-line agent in the treatment of hypertension in patients with NAFLD.
Obstructive Sleep Apnea
OSA is characterized by repeated pharyngeal collapse during sleep, which leads to chronic intermittent hypoxia and is associated with increased metabolic and cardiovascular morbidity and mortality. The cycle of intermittent hypoxia and reoxygenation in OSA results in inflammation and oxidative stress. Multiple studies have supported a link between NAFLD and OSA.
Hepatic fat content on ultrasound was increased in patients with OSA independent of BMI. There also has been evidence of a positive association between the severity of chronic intermittent hypoxia and increased hepatic fibrosis based on liver elastography.44 A meta-analysis using histologic NAFLD diagnosis showed that the presence of OSA was associated with a higher risk of fibrosis compared with that of patients with NAFLD without OSA (OR 2.6; 95% CI, 1.3-5.2).45
Based on animal models, hypoxia can drive fat accumulation and inflammation in the liver via multiple different pathways. Hypoxia can increase fasting glucose and systemic TG levels and induce hepatic lipogenesis by altering gene expression.45 Hypoxia also can increase oxidative stress and reduce β-oxidation, which leads to the production of lipotoxic lipids. These hypoxia-induced changes are typically more pronounced in subjects with obesity compared with that in subjects without obesity. Despite multiple adverse metabolic effects of OSA-induced hypoxia in the setting of NAFLD, preliminary, short-term studies have failed to find an association with OSA treatment with continuous positive airway pressure and improvement in NAFLD.45 Perhaps larger, long-term prospective trials will clarify this question.
Malignancy
Extrahepatic malignancy (colon, esophagus, stomach, pancreas, kidney, and breast) is the second most common cause of death in patients with NAFLD.21,22 The primary association between NAFLD and malignancy is found in the colon. Most large population-based studies have been performed in East Asia and have found that NAFLD is associated with a 1.5 to 1.7-fold increased risk for colonic adenomas and a 1.9 to 3.1-fold increased risk of colorectal cancer.46-49 Using magnetic resonance spectroscopy and liver biopsy to diagnose NAFLD and NASH, respectively, Wong and colleagues found that NASH, but not simple steatosis, is associated with a higher risk of advanced colorectalneoplasia (OR 5.34; 95% CI, 1.9-14.8), after adjusting for age, gender, BMI, family history, smoking, and T2DM.50
Data showing a definitive causative role of NAFLD in the development of colorectal cancer are lacking, but the presence of increased insulin levels has many potential effects on carcinogenesis in general, including stimulation of cell proliferation and apoptosis. Currently, there are no recommended changes to the standard colorectal cancer screening recommendations specifically for patients with NAFLD.
Conclusion
NAFLD is a multisystem disease that is associated with increased liver-related and all-cause mortality. Data on the close association between NAFLD and several extrahepatic complications, including MetS, T2DM, CVD, CKD, and malignancy are well established. There also is growing evidence of a bidirectional relationship between some of these diagnoses, whereas NAFLD is not only a consequence, but also a cause of MetS, T2DM, and CKD independent of other typical risk factors.
Given the multiple comorbidities associated with NAFLD and its potential to influence the severity of these diagnoses, management of these complex patients requires diligence and a multidisciplinary approach. In order to engage in early recognition and intervention to prevent potential morbidity and mortality, regular screening and surveillance for the development of NAFLD in patients with metabolic risk factors can be considered, and careful screening for metabolic complications in patients with established NAFLD is important.
1. Centers for Disease Control and Prevention. National Center for Health Statistics. National Health and Nutrition Examination Survey. Hyattsville, MD: U.S. Department of Health and Human Services, Centers for Disease Control and Prevention, 2014.
2. Breland JY, Phibbs CS, Hoggatt KJ, et al. The obesity epidemic in the Veterans Health Administration: prevalence among key populations of women and men veterans. J Gen Intern Med. 2017;32(suppl 1):11-17.
3. Machado M, Marques-Vidal P, Cortez-Pinto H. Hepatic histology in obese patients undergoing bariatric surgery. J Hepatol. 2006;45(4):600-606.
4. Subichin M, Clanton J, Makuszewski M, Bohon A, Zografakis JG, Dan A. Liver disease in the morbidly obese: a review of 1000 consecutive patients undergoing weight loss surgery. Surg Obes Relat Dis. 2015;11(1):137-141.
5. Non-alcoholic Fatty Liver Disease Study Group, Lonardo A, Bellentani S, et al. Epidemiological modifiers of non-alcoholic fatty liver disease: focus on high-risk groups. Dig Liver Dis. 2015;47(12):997-1006.
6. Kim D, Kim WR. Nonobese fatty liver disease. Clin Gastroenterol Hepatol. 2017;15(4):474-485.
7. Kotronen A, Westerbacka J, Bergholm R, Pietiläinen KH, Yki-Järvinen H. Liver fat in the metabolic syndrome. J Clin Endocrinol Metab. 2007;92(9):3490-3497.
8. Shulman GI. Ectopic fat in insulin resistance, dyslipidemia, and cardiometabolic disease. N Engl J Med. 2014;371(12):1131-1141.
9. Younossi ZM, Koenig AB, Abdelatif D, Fazel Y, Henry L, Wymer M. Global epidemiology of nonalcoholic fatty liver disease-meta-analytic assessment of prevalence, incidence, and outcomes. Hepatology. 2016;64(1):73-84.
10. Armstrong MJ, Adams LA, Canbay A, et al. Extrahepatic complications of nonalcoholic fatty liver disease. Hepatology. 2014;59(3):1174-1197.
11. Kashanian S, Fuchs M. Non-alcoholic fatty liver disease in patients with diabetes mellitus: a clinician’s perspective. Int J Dig Dis. 2015;1:1.
12. Park SK, Seo MH, Shin HC, Ryoo JH. Clinical availability of nonalcoholic fatty liver disease as an early predictor of type 2 diabetes mellitus in Korean men: 5-year prospective cohort study. Hepatology. 2013;57(4):1378-1383.
13. Ekstedt M, Franzen LE, Mathiesen UL, et al. Long-term follow-up of patients with NAFLD and elevated liver enzymes. Hepatology. 2006;44(4):865-873.
14. Chang Y, Jung HS, Yun KE, Cho J, Cho YK, Ryu S. Cohort study of non-alcoholic fatty liver disease, NAFLD fibrosis score, and the risk of incident diabetes in a Korean population. Am J Gastroenterol. 2013;108(12):1861-1868.
15. Ryysy L, Hakkinen AM, Goto T, et al. Hepatic fat content and insulin action on free fatty acids and glucose metabolism rather than insulin absorption are associated with insulin requirements during insulin therapy in type 2 diabetic patients. Diabetes. 2000;49(5):749-758.
16. Adams LA, Harmsen S, St Sauver JL, et al. Nonalcoholic fatty liver disease increases risk of death among patients with diabetes: a community-based cohort study. Am J Gastroenterol. 2010;105(7):1567-1573.
17. Yamazaki H, Tsuboya T, Tsuji K, Dohke M, Maguchi H. Independent association between improvement in nonalcoholic fatty liver disease and reduced risk of incidence of type 2 diabetes. Diabetes Care. 2015;38(9):1673-1679.
18. Chalasani N, Younossi Z, Lavine JE, et al. The diagnosis and management of nonalcoholic fatty liver disease: practice guidance from the American Association for the Study of Liver Diseases. Hepatology. 2018;67(1):328-357.
19. European Association for the Study of the Liver; European Association for the Study of Diabetes; European Association for the Study of Obesity. EASL-EASD-EASO clinical practice guidelines for the management of nonalcoholic fatty liver disease. J Hepatol. 2016;64(6):1388-1402.
20. McPherson S, Hardy T, Henderson E, Burt AD, Day CP, Anstee QM. Evidence of NAFLD progression from steatosis to fibrosing steatohepatitis using paired biopsies: implications for prognosis and clinical management. J Hepatol. 2015;62(5):1148-1155.
21. Ekstedt M, Hagstrom H, Nasr P, et al. Fibrosis stage is the strongest predictor for disease-specific mortality in NAFLD after up to 33 years of follow-up. Hepatology. 2015;61(5):1547-1554.
22. Angulo P, Kleiner DE, Dam-Larsen S, et al. Liver fibrosis, but no other histologic feature, is associated with long-term outcomes in patients with nonalcoholic fatty liver disease. Gastroenterology. 2015;149(2):389-397.
23. Portillo-Sanchez P, Bril F, Maximos M, et al. High prevalence of nonalcoholic fatty liver disease in patients with type 2 diabetes mellitus and normal aminotransferases. J Clin Endocrinol. Metab. 2015;100(6):2231-2238.
24. Kwo PY, Cohen SM, and Lim JK. ACG clinical guideline: evaluation of abnormal liver chemistries. Am J Gastroenterol. 2017;112(1):18-35.
25. Loomba R, Lutchman G, Kleiner DE, et al. Clinical trial: pilot study of metformin for the treatment of non-alcoholic steatohepatitis. Aliment Pharmacol Ther. 2009;29(2):172-182.
26. Cusi K, Orsak B, Lomonaco R, et al. Extended treatment with pioglitazone improves liver histology in patients with pre-diabetes or type 2 diabetes mellitus and NASH. Hepatology. 2013;58(supp 1):248a.
27. Armstrong MJ, Gaunt P, Aithal GP, et al. Liraglutide safety and efficacy in patients with non-alcoholic steatohepatitis (LEAN): a multicentre, double-blind, randomised, placebo-controlled phase 2 study. Lancet. 2016;387(10019):679-690.
28. Patel YA, Gifford EJ, Glass LM, et al. Risk factors for biopsy-proven advanced non-alcoholic fatty liver disease in the Veterans Health Administration. Aliment Pharmacol Ther. 2018;47(2):268-278.
29. Cusi K, Orsak B, Bril F, et al. Long-term pioglitazone treatment for patients with nonalcoholic steatohepatitis and prediabetes or type diabetes mellitus: a randomized trial. Ann Intern Med. 2016;165(5):305-315.
30. Sanyal AJ, Chalasani N, Kowdley KV, et al; NASH CRN. Pioglitazone, vitamin E, or placebo for nonalcoholic steatohepatitis. N Engl J Med. 2010;362(18):1675-1685.
31. Ekstedt M, Frazen LE, Mathiesen UL, et al. Long-term follow-up of patients with NAFLD and elevated liver enzymes. Hepatology. 2006;44(4):865-873.
32. Vanni E, Marengo A, Mezzabotta L, Bugianesi E. Systemic complications of nonalcoholic fatty liver disease: when the liver is not an innocent bystander. Semin Liver Dis. 2015;35(3): 236-249.
33. Oni ET, Agatston AS, Blaha MJ, et al. A systematic review: burden and severity of subclinical cardiovascular disease among those with nonalcoholic fatty liver: should we care? Atherosclerosis. 2013;230(2):358-367.
34. Wong VW, Wong GL, Yip GW, et al. Coronary artery disease and cardiovascular outcomes in patients with non-alcoholic fatty liver disease. Gut. 2011;60(12):1721-1727.
35. Sinn DH, Cho SJ, Gu S. Persistent nonalcoholic fatty liver disease increased risk for carotid atherosclerosis. Gastroenterology. 2016;151(3):481-488.
36. Targher G, Byrne CD, Lonardo A, Zoppini G, Barbui C. Non-alcoholic fatty liver disease and risk of incident cardiovascular disease: a meta-analysis. J Hepatol. 2016;65(3):589-600.
37. Nelson A, Torres DM, Morgan AE, Fincke C, Harrison SA. A pilot study using simvastatin in the treatment of nonalcoholic steatohepatitis: A randomized, placebo-controlled trial. J Clin Gastroenterol. 2009;43(10):900-904.
38. Lewis JH, Mortensen ME, Zweig S, Fusco MJ, Medoff JR, Belder R; Pravastatin in Chronic Liver Disease Study Investigators. Efficacy and safety of high-dose pravastatin in hypercholesterolemic patients with well-compensated chronic liver disease: results of a prospective, randomized, double-blind, placebo-controlled, multicenter trial. Hepatology. 2007;46(5):1453-1463.
39. Athyros VG, Tziomalos K, Gossios TD, et al; GREACE Study Collaborative Group. Safety and efficacy of long-term statin treatment for cardiovascular events in patients with coronary artery disease and abnormal liver tests in the Greek Atorvastatin and Coronary Heart Disease Evaluation (GREACE) study: a post-hoc analysis. Lancet. 2010;376(9756):1916-1922.
40. Musso G, Gambino R, Tabibian JH, et al. Association with non-alcoholic fatty liver disease with chronic kidney disease: a systematic review and meta-analysis. PLoS Med. 2014;11(7):e1001680.
41. Targher G, Bertolini L, Rodella S, Lippi G, Zoppini G, Chonchol M. Relationship between kidney function and liver histology in subjects with nonalcoholic steatohepatitis. Clin J Am Soc Nephrol. 2010;5(12):2166-2171.
42. Vilar-Gomez E, Galzadilla-Bertot L, Friedman SL, et al. Improvement in liver histology due to lifestyle modification is independently associated with improved kidney function in patients with non-alcoholic steatohepatitis. Aliment Pharmacol Ther. 2017;45(2):332-344
43. Agrawal S, Duseja A, Aggarwal A, et al. Obstructive sleep apnea is an important predictor of hepatic fibrosis in patients with nonalcoholic fatty liver disease in a tertiary care center. Hepatol Int. 2015;9(2):283-291.
44. Sookoian S, Pirola CJ. Obstructive sleep apnea is associated with fatty liver and abnormal liver enzymes: a meta-analysis. Obes Surg. 2013;23(11):1815-1825.
45. Aron-Wisnewsky J, Clement K, Pépin JL. Nonalcoholic fatty liver disease and obstructive sleep apnea. Metabolism. 2016;65(8):1124-1135.
46. Ding W, Fan J, Qin J. Association between nonalcoholic fatty liver disease and colorectal adenoma: a systematic review and meta-analysis. Int J Clin Exp Med. 2015;8(1):322-333.
47. Shen H, Lipka S, Kumar A, Mustacchia P. Association between nonalcoholic fatty liver disease and colorectal adenoma: a systematic review and meta-analysis. J Gastrointest Oncol. 2014:5(6):440-446.
48. Lee YI, Lim YS, Park HS. Colorectal neoplasms in relation to non-alcoholic fatty liver disease in Korean women: a retrospective cohort study. J Gastroenterol Hepatol. 2012;27(1):91-95.
49. Lin XF, Shi KQ, You J, et al. Increased risk of colorectal malignant neoplasm in patients with nonalcoholic fatty liver disease: a large study. Mol Biol Rep. 2014;41(5):2989-2997.
50. Wong VW, Wong GL, Tsang SW, et al. High prevalence of colorectal neoplasm in patients with non-alcoholic steatohepatitis. Gut. 2011;60(6):829-836.
51. Estes C, Razavi H, Loomba R, Younossi Z, Sanyal AJ. Modeling the epidemic of nonalcoholic fatty liver disease demonstrates an exponential increase in burden of disease. Hepatology. 2018;67(1):123-133.