User login
Effect of High-Dose Ergocalciferol on Rate of Falls in a Community-Dwelling, Home-Based Primary Care Veteran Population: A Case-Crossover Study
Annually, about 1 in 4 individuals aged ≥ 65 years will experience at least 1 fall, resulting in nearly 2.8 million cases of emergently treated injuries and more than 800,000 hospitalizations.1-3 Therefore, fall prevention has garnered heightened attention as the population ages. Many factors are at play in fall risk, including vitamin D levels.
Although vitamin D is essential for a multitude of physiologic processes, evidence suggests that serum concentrations of 25-hydroxy vitamin D (25[OH]D) < 30 ng/mL are associated with decreased bone mineral density, muscle weakness, impaired lower extremity function, balance problems, and high fall rates.4-12 Through a meta-analysis published in 2009 that included 8 randomized controlled trials of 2,426 participants aged ≥ 65 years, Bischoff-Ferrari and colleagues found that a dose of 700 to 1,000 IU/d significantly reduced the risk of falling compared with doses of 200 to 600 IU/d.13 A subsequent meta-analysis published in 2012 including 14 randomized trials across 28,135 participants aged ≥ 65 years evaluated the efficacy of supplementation with vitamin D with or without calcium cosupplement on fall prevention.14 Although no difference was found in falls across the total sample, a subgroup analysis exploring the effect in participants with lower vitamin D levels demonstrated a statistically significant benefit of vitamin D supplementation. To decrease the risk of fractures and falls, the American Geriatric Society (AGS) recommends vitamin D supplementation of at least 1,000 IU/d in combination with calcium supplementation in older adults, with a minimum goal 25(OH)D level of 30 ng/mL.15
Alarmingly, Bischoff-Ferrari and colleagues published a double-blind, randomized trial that described an association between higher monthly doses of vitamin D3 (cholecalciferol) and an increased risk of falls compared with 24,000 IU/mo. Particularly at higher achieved levels of 25(OH)D, with no difference in benefit was noted on the primary endpoint of lower extremity function.16
Although there exists limited representation of high-dose vitamin D2 and its resultant effects on falls in those aged ≥ 65 years, once weekly prescribing of vitamin D2 in the form of ergocalciferol 50,000 IU remains a commonly used option for repletion of low 25(OH)D. In this study, the authors evaluated the effect of high-dose ergocalciferol on rate of falls in a community-dwelling veteran population ≥ 65 years with low 25(OH)D.
Methods
Following approval from the Lexington Veteran Affairs Medical Center (Lexington VAMC) Institutional Review Board and Research and Development Committee, a retrospective chart review was conducted. Subjects were identified through use of Microsoft SQL (Redmond, WA). Veterans included were those enrolled in home-based primary care (HBPC), a primary care assignment for those individuals requiring skilled services and case management within the home and for whom falls are documented within the electronic health record (EHR). As fall data in a community-dwelling population are difficult to obtain in a retrospective analysis, the HBPC population offered a viable pool of data for evaluation. Some patients eligible for HBPC at the Lexington VAMC may be more dependent on specialized services offered through HBPC or have a reduced ability to perform activities of daily living (ADLs). Other patients can ambulate but may have difficulty traveling great distances to Lexington VAMC.
In addition to HBPC enrollment, veterans were included in the study if they were aged ≥ 65 years and had a 25(OH)D level < 20 ng/mL with subsequent prescribing of high-dose vitamin D2 for repletion, namely, ergocalciferol 50,000 IU once weekly, between March 1, 2005, and September 30, 2016.
Veterans were excluded if they had been enrolled in HBPC for less than 60 days before ergocalciferol initiation, if they were deceased or had been discharged from HBPC within 60 days of ergocalciferol initiation, if they had comorbid conditions that inherently increase the risk of falls (eg, Lewy body dementia, Parkinson disease, bilateral below-the-hip amputation, and hemi- or quadriplegia), or if they had been dispensed a previous prescription of ergocalciferol in the preceding 9 months.
A case-crossover study design was used, which compared the 60-day period prior to initiation of ergocalciferol supplementation with the 60-day period following initiation of supplementation. A 7-day period between these 2 periods was allotted to allow time for mailing of the new prescription and initiation of the supplement.
Data Collection
Data collected included age, sex, levels of 25(OH)D, ergocalciferol prescription data (dose, administration frequency, quantity, day supply, and fill date), falls documented during the 60 days preceding and during supplementation, and the number of medications that posed an increased risk of falls actively prescribed prior to and during supplementation. Those medications considered to increase risk of falls were determined according to the medications listed in the AGS 2015 Updated Beers Criteria for Potentially Inappropriate Medication Use in Older Adults.17
Endpoints
The primary endpoint assessed was the change in rate of falls between the time preceding and during supplementation. The number of falls during the 60 days preceding ergocalciferol supplementation was standardized to falls per person per 30 days and compared with the same parameter during the 60-day period following initiation of ergocalciferol.
The secondary outcome was the rate of falls according to the level of 25(OH)D achieved as a result of supplementation in those patients who achieved a minimum 25(OH)D level of 30 ng/mL according to AGS recommendations. Those patients who achieved a minimum 25(OH)D concentration of 30 ng/mL were separated into 2 equal groups according to their respective concentration relative to the median.
Statistical Analysis
Numerical variables were compared using a Student t test. For the primary outcome, 64 participants were required in order to achieve 80% power at a significance of .05 for a 2-tailed assessment, each serving as his or her own control in the case-crossover study design. For the secondary outcome of falls according to 25(OH)D level following supplementation in order to achieve 80% power at a significance of 0.05 for a 2-tailed assessment, a total of 128 participants who reach a minimum 25(OH)D level of 30 ng/mL were required.
Results
After screening 187 subjects who met the inclusion criteria, 107 subjects were excluded (Figure ). 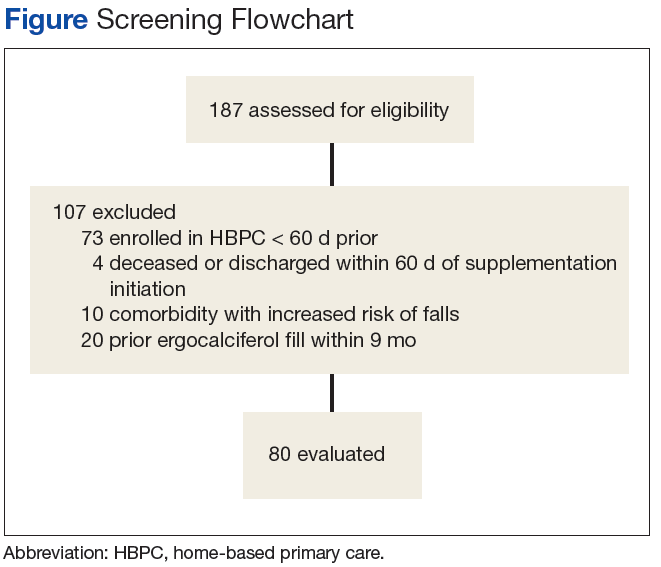
Primary Endpoint
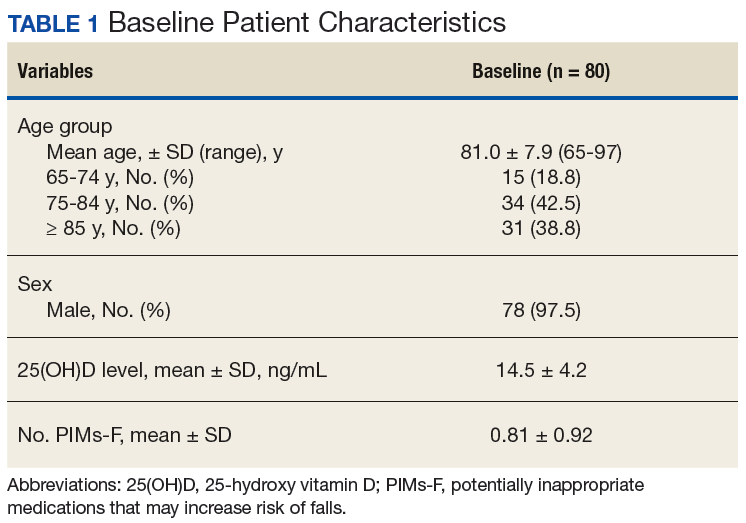
Following once weekly supplementation with ergocalciferol 50,000 IU, 25(OH)D levels increased from 14.5 ng/mL (SD 4.2) to 27.6 (SD 9.6) (P < .01). Of note, the timing of the 25(OH)D level obtained following initiation of supplementation ranged between 8 weeks and 24 weeks. The number of PIMs-F decreased marginally, although to a not statistically significant degree, from 0.81 PIMs-F per person (SD 0.92) to 0.76 PIMs-F per person (SD 0.88). 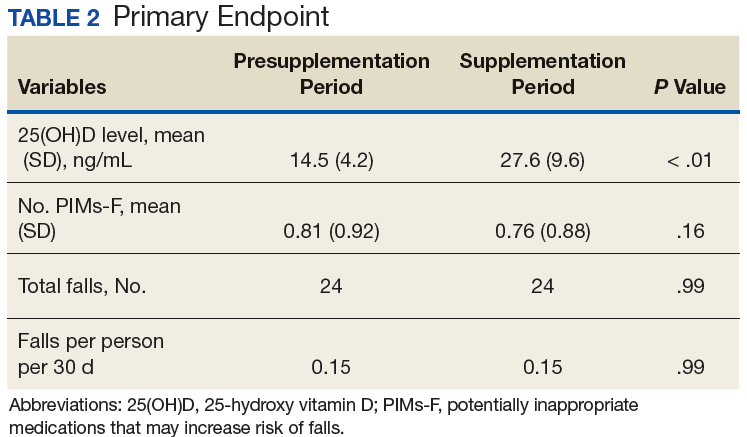
Secondary Endpoint
Although 51 of the subjects (63.8%) failed to achieve the target 25(OH)D level of ≥ 30 ng/mL, 29 were successful (Table 3). 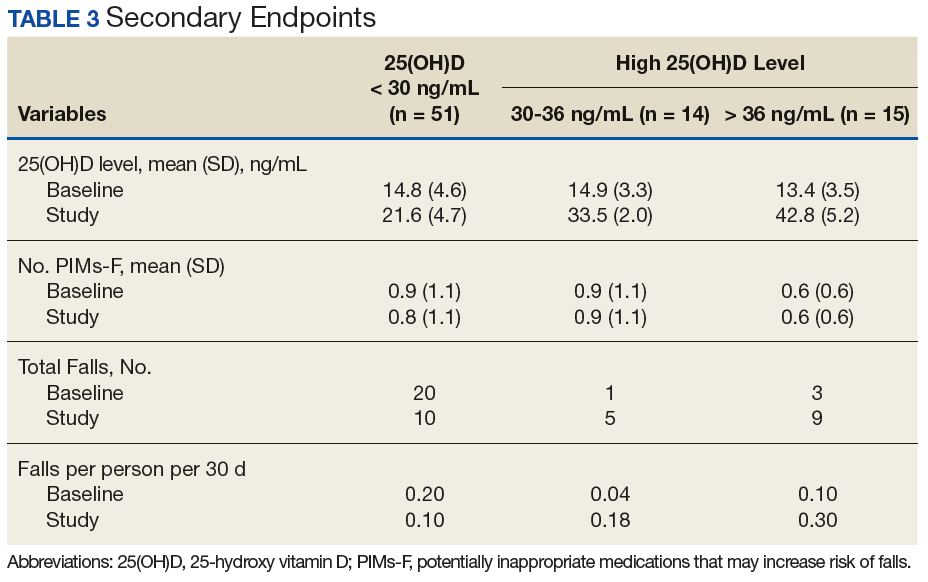
In subjects whose achieved 25(OH)D level was 30 to 36 ng/mL, the rate of falls per person per 30 days increased from 0.036 to 0.18. Similarly, an increase in rate of falls per person per 30 days from 0.1 to 0.3 was noted in subjects whose attained 25(OH)D level was > 36.0 ng/mL. However, study enrollment was underpowered to claim statistical significance in these findings related to the secondary endpoint.
Discussion
In this retrospective chart review, individuals aged ≥ 65 years who were prescribed once weekly ergocalciferol 50,000 IU for increase of 25(OH)D levels < 20 ng/mL experienced no change in rate of falls across the entire study population. In those individuals whose achieved 25(OH)D level met the AGS recommendation of ≥ 30 ng/mL, there was a trend toward an increased rate of falls while the rate of falls decreased for subjects whose achieved 25(OH)D level was < 30 ng/mL.
High-dose vitamin D supplementation, albeit with vitamin D3, and its effect on falls have been evaluated in the geriatric population previously, most notably and recently, by Bischoff-Ferrari and colleagues.16 In a study comparing 24,000 IU vitamin D3 per month vs 60,000 IU vitamin D3 per month vs 24,000 IU vitamin D3 plus calcifediol 300 µg per month, lower extremity function did not differ in the 3 groups. However, an increased number of falls was noted in the second and third arm, respectively. Furthermore, after 12 months of treatment, those individuals who achieved the highest quartile of 25(OH)D level (44.7-98.9 ng/mL) had starkly increased odds of falling and number of falls compared with those achieving the lowest quartile (21.3-30.3 ng/mL).
The results of this study suggest that once-weekly high-dose vitamin D2 may carry a similar risk of increasing falls as found with high-dose vitamin D3, particularly at higher achieved levels of 25(OH)D. A possible explanation for a lower rate of falls in those individuals who did not achieve a 25(OH)D level of at least 30 ng/mL could be that these individuals may not have initiated the medication appropriately or administered it adherently, thereby avoiding a possible deleterious effect that the high-dose preparation may pose in this population.
Given the retrospective nature of the study and the evaluation of the change in the 25(OH)D level following approximately a 90-day supply of ergocalciferol, adherence was not addressed. In this case, although increased 25(OH)D level was the desired outcome of vitamin D supplementation, the increase in rate of falls may be attributable to the high-dose preparation itself. Alternatively, the 25(OH)D target of ≥ 30 ng/mL may be worth reconsidering in favor of a lower target with an upper limit.
The rate of falls in this study was collected over the 60 days following initiation of ergocalciferol. However, the achieved 25(OH)D level was not evaluated until between 8 and 24 weeks following initiation. In this context, it may be more likely that the increased rate of falls could be attributable to the high-dose nature of vitamin D2 supplementation or the rate of 25(OH)D repletion rather than the 25(OH)D level ultimately achieved.
Limitations
Given the study’s retrospective nature, at times there was difficulty in locating information in the EHR, including accurate reports of active medication use during study periods or documentation of all falls that had occurred in the appropriate format. This was further complicated by the reliance on self-reporting of falls, which may potentiate an underestimation of total falls.
The largely homogenous study population may limit extrapolating these results. Additionally, although some diseases and medications with an inherent risk on fall risk were incorporated into the exclusion criteria, on analysis, other diseases and medications were identified that also may pose a similar risk. These include legal blindness and a history of below-the-knee amputation as well as long-term opioid therapy and intensive antihypertensive therapy with multiple agents. Furthermore, other potential risk factors for falls were not addressed, such as functional status, use of assistive devices, or unsafe home environments.
For the secondary endpoint, sample size was not met for statistical significance, which limited the study’s ability to confirm the veracity of the trend of increased falls. Study duration posed an additional limitation. As most veterans enrolled in HBPC have vitamin D supplementation initiated soon after enrollment when the need for vitamin D repletion is routinely assessed, a 2-month duration for evaluation prior to and immediately following initiation of ergocalciferol was necessary to allow for adequate study enrollment for analysis of the primary endpoint. However, this may be resolved through conduction of a prospective study in the future.
Conclusion
There was no difference identified in the rate of falls immediately prior to and following initiation of ergocalciferol 50,000 IU self-administered once weekly. There was a trend of increased rate of falls in subjects with high levels of 25(OH)D achieved. In light of a similar finding of high-dose vitamin D3 associated with an increased rate of falls, particularly with higher achieved levels of 25(OH)D, it may be warranted to consider avoiding high-dose vitamin D2 supplementation. Future research including prospective, randomized clinical studies with a longer duration of follow-up would be recommended to confirm these findings and test the generalizability in the non-HBPC community-dwelling population.
1. Stevens JA, Ballesteros MF, Mack KA, Rudd RA, DeCaro E, Adler G. Gender differences in seeking care for falls in the aged Medicare population. Am J Prev Med. 2012;43(1):59-62.
2. Centers for Disease Control and Prevention, National Center for Injury Prevention and Control. Welcome to WISQARS. https://www.cdc.gov/injury/wisqars/index.html. Updated February 5, 2018. Accessed April 10, 2018.
3. O’Loughlin JL, Robitaille Y, Boivin JF, Suissa S. Incidence of and risk factors for falls and injurious falls among the community-dwelling elderly. Am J Epidemiol. 1993;137(3):342-354.
4. Bischhoff-Ferrari HA, Dawson-Hughes B, Willet WC, et al. Effect of vitamin D on falls: a meta-analysis. JAMA. 2004;291(16):1999-2006.
5. Holick MF. Resurrection of vitamin D deficiency and rickets. J Clin Invest. 2006;116(8):2062-2072.
6. Bischoff-Ferrari HA, Giovannucci E, Willett WC, Dietrich T, Dawson-Hughes B. Estimation of optimal serum concentrations of 25-hydroxyvitamin D for multiple health outcomes. Am J Clin Nutr. 2006;84(1):18-28.
7. Bischoff HA, Stähelin HB, Dick W, et al. Effects of vitamin D and calcium supplementation on falls: a randomized controlled trial. J Bone Miner Res. 2003;18(2):343-351.
8. Bischoff-Ferrari HA, Dietrich T, Orav EJ, et al. Higher 25-OH vitamin D concentrations are associated with better lower-extremity function in both active and inactive persons aged > 60 years. Am J Clin Nutr. 2004;80(3):752-758.
9. Pfeifer M, Begerow B, Minne HW, Abrams C, Nachtigall D, Hansen C. Effects of a short-term vitamin D and calcium supplementation on body sway and secondary hyperparathyroidism in elderly women. J Bone Miner Res. 2000;15(6):1113-1118.
10. Sambrook PN, Chen JS, March LM, et al. Serum parathyroid hormone predicts time to fall independent of vitamin D status in a frail elderly population. J Clin Endocrinol Metab. 2004;89(4):1572-1576.
11. Flicker L, Mead K, MacInnis RJ, et al. Serum vitamin D and falls in older women in residential care in Australia. J Am Geratr Soc. 2003;51(11):1533-1538.
12. Faulkner KA, Cauley JA, Zmuda JM, et al. Higher 1,25-dihydroxyvitamin D3 concentrations associated with lower fall rates in older community-dwelling women. Osteoporos Int. 2006;17(9):1318-1328.
13. Bischoff-Ferrari HA, Dawson-Hughes B, Staehelin HB, et al. Fall prevention with supplemental and active forms of vitamin D: a meta-analysis of randomized controlled trials. BMJ. 2009;339:b3692.
14. Gillespie LD, Robertson MC, Gillespie WJ, et al. Interventions for preventing falls in older people living in the community. Cochrane Database Syst Rev. 2009;(2):CD007146.
15. American Geriatrics Society Workgroup on Vitamin D Supplementation for Older Adults. Recommendations abstracted from the American Geriatrics Society Consensus Statement on vitamin D for the prevention of falls and their consequences. J Am Geriatr Soc. 2014;62(1):147-152.
16. Bischoff-Ferrari HA, Dawson-Hughes B, Orav EJ, et al. Monthly high-dose vitamin D treatment for the prevention of functional decline: a randomized clinical trial. JAMA Intern Med. 2016;176(2):175-183.
17. American Geriatrics Society 2015 Beers Criteria Update Expert Panel. American Geriatrics Society 2015 updated Beers Criteria for potentially inappropriate medication use in older adults. J Am Geriatr Soc. 2015;63(11):2227-2246.
Annually, about 1 in 4 individuals aged ≥ 65 years will experience at least 1 fall, resulting in nearly 2.8 million cases of emergently treated injuries and more than 800,000 hospitalizations.1-3 Therefore, fall prevention has garnered heightened attention as the population ages. Many factors are at play in fall risk, including vitamin D levels.
Although vitamin D is essential for a multitude of physiologic processes, evidence suggests that serum concentrations of 25-hydroxy vitamin D (25[OH]D) < 30 ng/mL are associated with decreased bone mineral density, muscle weakness, impaired lower extremity function, balance problems, and high fall rates.4-12 Through a meta-analysis published in 2009 that included 8 randomized controlled trials of 2,426 participants aged ≥ 65 years, Bischoff-Ferrari and colleagues found that a dose of 700 to 1,000 IU/d significantly reduced the risk of falling compared with doses of 200 to 600 IU/d.13 A subsequent meta-analysis published in 2012 including 14 randomized trials across 28,135 participants aged ≥ 65 years evaluated the efficacy of supplementation with vitamin D with or without calcium cosupplement on fall prevention.14 Although no difference was found in falls across the total sample, a subgroup analysis exploring the effect in participants with lower vitamin D levels demonstrated a statistically significant benefit of vitamin D supplementation. To decrease the risk of fractures and falls, the American Geriatric Society (AGS) recommends vitamin D supplementation of at least 1,000 IU/d in combination with calcium supplementation in older adults, with a minimum goal 25(OH)D level of 30 ng/mL.15
Alarmingly, Bischoff-Ferrari and colleagues published a double-blind, randomized trial that described an association between higher monthly doses of vitamin D3 (cholecalciferol) and an increased risk of falls compared with 24,000 IU/mo. Particularly at higher achieved levels of 25(OH)D, with no difference in benefit was noted on the primary endpoint of lower extremity function.16
Although there exists limited representation of high-dose vitamin D2 and its resultant effects on falls in those aged ≥ 65 years, once weekly prescribing of vitamin D2 in the form of ergocalciferol 50,000 IU remains a commonly used option for repletion of low 25(OH)D. In this study, the authors evaluated the effect of high-dose ergocalciferol on rate of falls in a community-dwelling veteran population ≥ 65 years with low 25(OH)D.
Methods
Following approval from the Lexington Veteran Affairs Medical Center (Lexington VAMC) Institutional Review Board and Research and Development Committee, a retrospective chart review was conducted. Subjects were identified through use of Microsoft SQL (Redmond, WA). Veterans included were those enrolled in home-based primary care (HBPC), a primary care assignment for those individuals requiring skilled services and case management within the home and for whom falls are documented within the electronic health record (EHR). As fall data in a community-dwelling population are difficult to obtain in a retrospective analysis, the HBPC population offered a viable pool of data for evaluation. Some patients eligible for HBPC at the Lexington VAMC may be more dependent on specialized services offered through HBPC or have a reduced ability to perform activities of daily living (ADLs). Other patients can ambulate but may have difficulty traveling great distances to Lexington VAMC.
In addition to HBPC enrollment, veterans were included in the study if they were aged ≥ 65 years and had a 25(OH)D level < 20 ng/mL with subsequent prescribing of high-dose vitamin D2 for repletion, namely, ergocalciferol 50,000 IU once weekly, between March 1, 2005, and September 30, 2016.
Veterans were excluded if they had been enrolled in HBPC for less than 60 days before ergocalciferol initiation, if they were deceased or had been discharged from HBPC within 60 days of ergocalciferol initiation, if they had comorbid conditions that inherently increase the risk of falls (eg, Lewy body dementia, Parkinson disease, bilateral below-the-hip amputation, and hemi- or quadriplegia), or if they had been dispensed a previous prescription of ergocalciferol in the preceding 9 months.
A case-crossover study design was used, which compared the 60-day period prior to initiation of ergocalciferol supplementation with the 60-day period following initiation of supplementation. A 7-day period between these 2 periods was allotted to allow time for mailing of the new prescription and initiation of the supplement.
Data Collection
Data collected included age, sex, levels of 25(OH)D, ergocalciferol prescription data (dose, administration frequency, quantity, day supply, and fill date), falls documented during the 60 days preceding and during supplementation, and the number of medications that posed an increased risk of falls actively prescribed prior to and during supplementation. Those medications considered to increase risk of falls were determined according to the medications listed in the AGS 2015 Updated Beers Criteria for Potentially Inappropriate Medication Use in Older Adults.17
Endpoints
The primary endpoint assessed was the change in rate of falls between the time preceding and during supplementation. The number of falls during the 60 days preceding ergocalciferol supplementation was standardized to falls per person per 30 days and compared with the same parameter during the 60-day period following initiation of ergocalciferol.
The secondary outcome was the rate of falls according to the level of 25(OH)D achieved as a result of supplementation in those patients who achieved a minimum 25(OH)D level of 30 ng/mL according to AGS recommendations. Those patients who achieved a minimum 25(OH)D concentration of 30 ng/mL were separated into 2 equal groups according to their respective concentration relative to the median.
Statistical Analysis
Numerical variables were compared using a Student t test. For the primary outcome, 64 participants were required in order to achieve 80% power at a significance of .05 for a 2-tailed assessment, each serving as his or her own control in the case-crossover study design. For the secondary outcome of falls according to 25(OH)D level following supplementation in order to achieve 80% power at a significance of 0.05 for a 2-tailed assessment, a total of 128 participants who reach a minimum 25(OH)D level of 30 ng/mL were required.
Results
After screening 187 subjects who met the inclusion criteria, 107 subjects were excluded (Figure ).
Primary Endpoint
Following once weekly supplementation with ergocalciferol 50,000 IU, 25(OH)D levels increased from 14.5 ng/mL (SD 4.2) to 27.6 (SD 9.6) (P < .01). Of note, the timing of the 25(OH)D level obtained following initiation of supplementation ranged between 8 weeks and 24 weeks. The number of PIMs-F decreased marginally, although to a not statistically significant degree, from 0.81 PIMs-F per person (SD 0.92) to 0.76 PIMs-F per person (SD 0.88).
Secondary Endpoint
Although 51 of the subjects (63.8%) failed to achieve the target 25(OH)D level of ≥ 30 ng/mL, 29 were successful (Table 3).
In subjects whose achieved 25(OH)D level was 30 to 36 ng/mL, the rate of falls per person per 30 days increased from 0.036 to 0.18. Similarly, an increase in rate of falls per person per 30 days from 0.1 to 0.3 was noted in subjects whose attained 25(OH)D level was > 36.0 ng/mL. However, study enrollment was underpowered to claim statistical significance in these findings related to the secondary endpoint.
Discussion
In this retrospective chart review, individuals aged ≥ 65 years who were prescribed once weekly ergocalciferol 50,000 IU for increase of 25(OH)D levels < 20 ng/mL experienced no change in rate of falls across the entire study population. In those individuals whose achieved 25(OH)D level met the AGS recommendation of ≥ 30 ng/mL, there was a trend toward an increased rate of falls while the rate of falls decreased for subjects whose achieved 25(OH)D level was < 30 ng/mL.
High-dose vitamin D supplementation, albeit with vitamin D3, and its effect on falls have been evaluated in the geriatric population previously, most notably and recently, by Bischoff-Ferrari and colleagues.16 In a study comparing 24,000 IU vitamin D3 per month vs 60,000 IU vitamin D3 per month vs 24,000 IU vitamin D3 plus calcifediol 300 µg per month, lower extremity function did not differ in the 3 groups. However, an increased number of falls was noted in the second and third arm, respectively. Furthermore, after 12 months of treatment, those individuals who achieved the highest quartile of 25(OH)D level (44.7-98.9 ng/mL) had starkly increased odds of falling and number of falls compared with those achieving the lowest quartile (21.3-30.3 ng/mL).
The results of this study suggest that once-weekly high-dose vitamin D2 may carry a similar risk of increasing falls as found with high-dose vitamin D3, particularly at higher achieved levels of 25(OH)D. A possible explanation for a lower rate of falls in those individuals who did not achieve a 25(OH)D level of at least 30 ng/mL could be that these individuals may not have initiated the medication appropriately or administered it adherently, thereby avoiding a possible deleterious effect that the high-dose preparation may pose in this population.
Given the retrospective nature of the study and the evaluation of the change in the 25(OH)D level following approximately a 90-day supply of ergocalciferol, adherence was not addressed. In this case, although increased 25(OH)D level was the desired outcome of vitamin D supplementation, the increase in rate of falls may be attributable to the high-dose preparation itself. Alternatively, the 25(OH)D target of ≥ 30 ng/mL may be worth reconsidering in favor of a lower target with an upper limit.
The rate of falls in this study was collected over the 60 days following initiation of ergocalciferol. However, the achieved 25(OH)D level was not evaluated until between 8 and 24 weeks following initiation. In this context, it may be more likely that the increased rate of falls could be attributable to the high-dose nature of vitamin D2 supplementation or the rate of 25(OH)D repletion rather than the 25(OH)D level ultimately achieved.
Limitations
Given the study’s retrospective nature, at times there was difficulty in locating information in the EHR, including accurate reports of active medication use during study periods or documentation of all falls that had occurred in the appropriate format. This was further complicated by the reliance on self-reporting of falls, which may potentiate an underestimation of total falls.
The largely homogenous study population may limit extrapolating these results. Additionally, although some diseases and medications with an inherent risk on fall risk were incorporated into the exclusion criteria, on analysis, other diseases and medications were identified that also may pose a similar risk. These include legal blindness and a history of below-the-knee amputation as well as long-term opioid therapy and intensive antihypertensive therapy with multiple agents. Furthermore, other potential risk factors for falls were not addressed, such as functional status, use of assistive devices, or unsafe home environments.
For the secondary endpoint, sample size was not met for statistical significance, which limited the study’s ability to confirm the veracity of the trend of increased falls. Study duration posed an additional limitation. As most veterans enrolled in HBPC have vitamin D supplementation initiated soon after enrollment when the need for vitamin D repletion is routinely assessed, a 2-month duration for evaluation prior to and immediately following initiation of ergocalciferol was necessary to allow for adequate study enrollment for analysis of the primary endpoint. However, this may be resolved through conduction of a prospective study in the future.
Conclusion
There was no difference identified in the rate of falls immediately prior to and following initiation of ergocalciferol 50,000 IU self-administered once weekly. There was a trend of increased rate of falls in subjects with high levels of 25(OH)D achieved. In light of a similar finding of high-dose vitamin D3 associated with an increased rate of falls, particularly with higher achieved levels of 25(OH)D, it may be warranted to consider avoiding high-dose vitamin D2 supplementation. Future research including prospective, randomized clinical studies with a longer duration of follow-up would be recommended to confirm these findings and test the generalizability in the non-HBPC community-dwelling population.
1. Stevens JA, Ballesteros MF, Mack KA, Rudd RA, DeCaro E, Adler G. Gender differences in seeking care for falls in the aged Medicare population. Am J Prev Med. 2012;43(1):59-62.
2. Centers for Disease Control and Prevention, National Center for Injury Prevention and Control. Welcome to WISQARS. https://www.cdc.gov/injury/wisqars/index.html. Updated February 5, 2018. Accessed April 10, 2018.
3. O’Loughlin JL, Robitaille Y, Boivin JF, Suissa S. Incidence of and risk factors for falls and injurious falls among the community-dwelling elderly. Am J Epidemiol. 1993;137(3):342-354.
4. Bischhoff-Ferrari HA, Dawson-Hughes B, Willet WC, et al. Effect of vitamin D on falls: a meta-analysis. JAMA. 2004;291(16):1999-2006.
5. Holick MF. Resurrection of vitamin D deficiency and rickets. J Clin Invest. 2006;116(8):2062-2072.
6. Bischoff-Ferrari HA, Giovannucci E, Willett WC, Dietrich T, Dawson-Hughes B. Estimation of optimal serum concentrations of 25-hydroxyvitamin D for multiple health outcomes. Am J Clin Nutr. 2006;84(1):18-28.
7. Bischoff HA, Stähelin HB, Dick W, et al. Effects of vitamin D and calcium supplementation on falls: a randomized controlled trial. J Bone Miner Res. 2003;18(2):343-351.
8. Bischoff-Ferrari HA, Dietrich T, Orav EJ, et al. Higher 25-OH vitamin D concentrations are associated with better lower-extremity function in both active and inactive persons aged > 60 years. Am J Clin Nutr. 2004;80(3):752-758.
9. Pfeifer M, Begerow B, Minne HW, Abrams C, Nachtigall D, Hansen C. Effects of a short-term vitamin D and calcium supplementation on body sway and secondary hyperparathyroidism in elderly women. J Bone Miner Res. 2000;15(6):1113-1118.
10. Sambrook PN, Chen JS, March LM, et al. Serum parathyroid hormone predicts time to fall independent of vitamin D status in a frail elderly population. J Clin Endocrinol Metab. 2004;89(4):1572-1576.
11. Flicker L, Mead K, MacInnis RJ, et al. Serum vitamin D and falls in older women in residential care in Australia. J Am Geratr Soc. 2003;51(11):1533-1538.
12. Faulkner KA, Cauley JA, Zmuda JM, et al. Higher 1,25-dihydroxyvitamin D3 concentrations associated with lower fall rates in older community-dwelling women. Osteoporos Int. 2006;17(9):1318-1328.
13. Bischoff-Ferrari HA, Dawson-Hughes B, Staehelin HB, et al. Fall prevention with supplemental and active forms of vitamin D: a meta-analysis of randomized controlled trials. BMJ. 2009;339:b3692.
14. Gillespie LD, Robertson MC, Gillespie WJ, et al. Interventions for preventing falls in older people living in the community. Cochrane Database Syst Rev. 2009;(2):CD007146.
15. American Geriatrics Society Workgroup on Vitamin D Supplementation for Older Adults. Recommendations abstracted from the American Geriatrics Society Consensus Statement on vitamin D for the prevention of falls and their consequences. J Am Geriatr Soc. 2014;62(1):147-152.
16. Bischoff-Ferrari HA, Dawson-Hughes B, Orav EJ, et al. Monthly high-dose vitamin D treatment for the prevention of functional decline: a randomized clinical trial. JAMA Intern Med. 2016;176(2):175-183.
17. American Geriatrics Society 2015 Beers Criteria Update Expert Panel. American Geriatrics Society 2015 updated Beers Criteria for potentially inappropriate medication use in older adults. J Am Geriatr Soc. 2015;63(11):2227-2246.
Accuracy of Distal Femoral Valgus Deformity Correction: Fixator-Assisted Nailing vs Fixator-Assisted Locked Plating
ABSTRACT
Fixator-assisted nailing (FAN) and fixator-assisted locked plating (FALP) are 2 techniques that can be used to correct distal femoral valgus deformities. The fixator aids in achieving an accurate adjustable initial reduction, which is then made permanent with either nail or plate insertion. FALP can be performed with the knee held in a neutral extended position, whereas FAN requires 30° to 90° of knee flexion to insert the nail, which may cause some alignment loss. We hypothesized that FAN may yield less accurate correction than FALP. Prospectively collected data of a consecutive cohort of patients who underwent valgus deformity femoral correction with FAN or FALP at a single institution over an 8-year period were retrospectively evaluated. Twenty extremities (18 patients) were treated using FAN (median follow-up, 5 years; range, 1-10 years), and 7 extremities (6 patients) were treated with FALP (median follow-up, 5 years; range, 1-8 years). In the FAN cohort, the mean preoperative and postoperative mechanical lateral distal femoral angles (mLDFAs) were 81° (range, 67°-86°) and 89° (range, 80°-100°), respectively (P = .009). In the FALP cohort, the mean preoperative and postoperative mLDFAs were 80° (range, 71°-87°) and 88° (range, 81°-94°), respectively (P < .001). Although the average mechanical axis deviation correction for the FALP group was greater than for the FAN group (32 mm and 27 mm, respectively), the difference was not significant (P = .66). Both methods of femoral deformity correction can be considered safe and effective. On the basis of our results, FAN and FALP are comparable in accuracy for deformity correction in the distal femur.
Multiple etiologies for distal femoral valgus deformity have been described in the literature.1-3 These can be congenital, developmental, secondary to lateral compartmental arthritis, or posttraumatic.4 If not corrected, femoral deformities alter the axial alignment and orientation of the joints, and may lead to early degenerative joint disease and abnormal leg kinematics.3,5 After correcting these deformities, the goal of treatment is to obtain anatomic distal femoral angles and neutral mechanical axis deviation (MAD), but without overcorrecting into varus. Numerous techniques to fix these deformities, such as progressive correction with external fixation or acute correction open reduction with internal fixation (ORIF), have been described.6 Modern external fixation allows for a gradual, adjustable, and more accurate correction but may produce discomfort and complications for patients.7-10 In contrast, ORIF may be more tolerable for the patient, but to achieve a precise correction, considerable technical skills and expertise are required.1,11-14
Two techniques used to correct these valgus femoral deformities in adults are fixator-assisted nailing (FAN) and fixator-assisted locked plating (FALP).1 FAN and FALP combine the advantage of external fixation (accuracy, adjustability) with the benefits of internal fixation (patient comfort), because the osteotomy and correction are performed with the guidance of a temporary external fixator and then permanently fixated by an intramedullary (IM) nail or a locking plate.1,8,11-13,15-18 Both techniques have the possibility to correct varus and valgus deformities, but whenever correcting sagittal plane angulation, the FAN technique may be more challenging. The paucity of studies available involving FAN and FALP do not lead to a conclusive preference of one technique over the other relative to the accuracy and success of correction.15,19,20
Continue to: In both FAN and FALP
In both FAN and FALP, the external fixator is applied and adjusted after the osteotomy for accurate alignment. In FALP, the plate is added without moving the leg from its straight position. However, in FAN, the knee must be flexed to 30° to 90° for insertion of the retrograde knee nail, and the alignment may be lost if the external fixation is not fully stable. Therefore, we hypothesized that FAN would be less accurate than FALP. Hence, the purposes of this study is to compare the correction achieved with FAN and FALP in patients with distal femoral valgus deformities and to describe the intraoperative complications associated with both techniques.
MATERIALS AND METHODS
After proper Institutional Review Board approval was obtained, a consecutive cohort of 35 patients who underwent femoral deformity correction with either FAN or FALP during an 8-year period (January 2002 to December 2010) was retrospectively reviewed. Eleven patients had to be excluded because of inadequate follow-up (<12 months) or because additional procedures were simultaneously performed. A total of 24 patients (27 femora) who had a mean age of 26 years (range, 14-68 years) were included in the final study cohort. Specifically, 20 femora (18 patients) were corrected using the FAN technique (7 males and 11 females; mean age, 36 years; range, 14-68 years), and 7 femora (6 patients) were fixed using the FALP technique (2 males and 4 females; mean age, 16 years; range, 15-19 years). The median follow-up in the FAN cohort was 5 years (range, 1-10 years), and the median follow-up in the FALP cohort was 5 years (range, 1-8 years) (Table 1).
| Table 1. Study Details and Demographic Characteristics | |||
| Detail | Overall | FAN | FALP |
| Number of patients | 24 | 18 | 6 |
| Number of femurs | 27 | 20 | 7 |
| Age in years (range) | 26 (14 to 68) | 36 (14 to 68) | 16 (15 to 19) |
| Male:Female | 9:15 | 7:11 | 2:4 |
| Median follow-up in years (range) | 5 (1 to 10) | 5 (1 to 10) | 5 (1 to 8) |
Abbreviations: FALP, fixator assisted locked plating; FAN, fixator assisted nailing
The specific measurements performed in all patients were MAD, mechanical lateral distal femoral angle (mLDFA), and medial proximal tibia angle (MPTA). These were measured from standing anteroposterior radiographs of the knee that included the femur.21 All outcome data were collected from the medical charts, operative reports, and radiographic evaluations. To ensure accuracy, all measurements were performed by 2 authors blinded to each other’s measurements. If a variation of <5% was obtained, the results were averaged and used for further analysis. Whenever a difference of >5% was obtained, the measurement was repeated by both authors for confirmation.
SURGICAL FAN TECHNIQUE
After measuring the deformity (Figure 1A) with the patient under general anesthesia on a radiolucent table, the involved lower limb is prepared and draped. Two half-pins are inserted medially, 1 proximal and 1 distal to the planned osteotomy site (Figure 1B), and then connected loosely with a monolateral external fixator. Special care is taken while placing the half-pins, not to interfere with the insertion path of the IM rod. When performing the preoperative planning, the level of osteotomy is chosen to enable the placement of at least 2 interlocking screws distal to the osteotomy. Then, a percutaneous osteotomy is performed from a lateral approach, and the bone ends are manipulated (translation and then angulation) to achieve the desired deformity correction. The external fixator is then stabilized and locked in the exact position (Figure 1C). Subsequently, retrograde reaming, nail insertion, and placement of proximal and distal locking screws are performed (Figure 1D). Blocking screws may give additional stability. The removal of the external fixator is the final step (Figure 1E).20 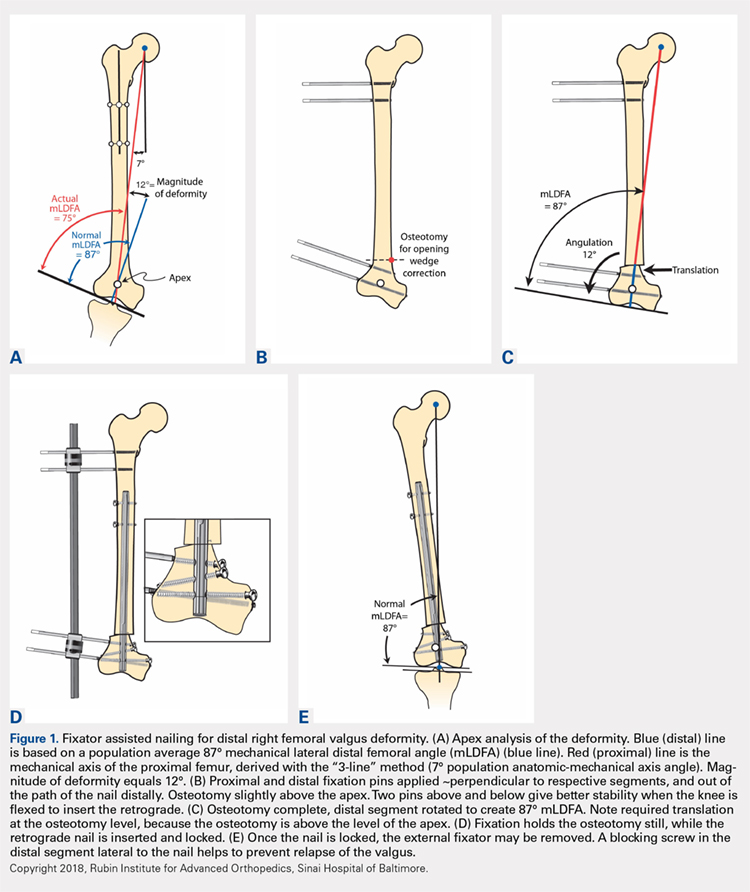
Continue to: When using the FAN technique...
When using the FAN technique, special attention is paid to reducing the risk of fat embolism. This can be reduced but not totally eradicated with the use of reaming irrigation devices.22-24 In our technique of FAN, the bone is cut and displaced prior to reaming so that the pressure of reaming is vented out through the osteotomy, along with the reaming contents, which theoretically can then act as a “prepositioned bone graft” that may speed healing.
SURGICAL FALP TECHNIQUE
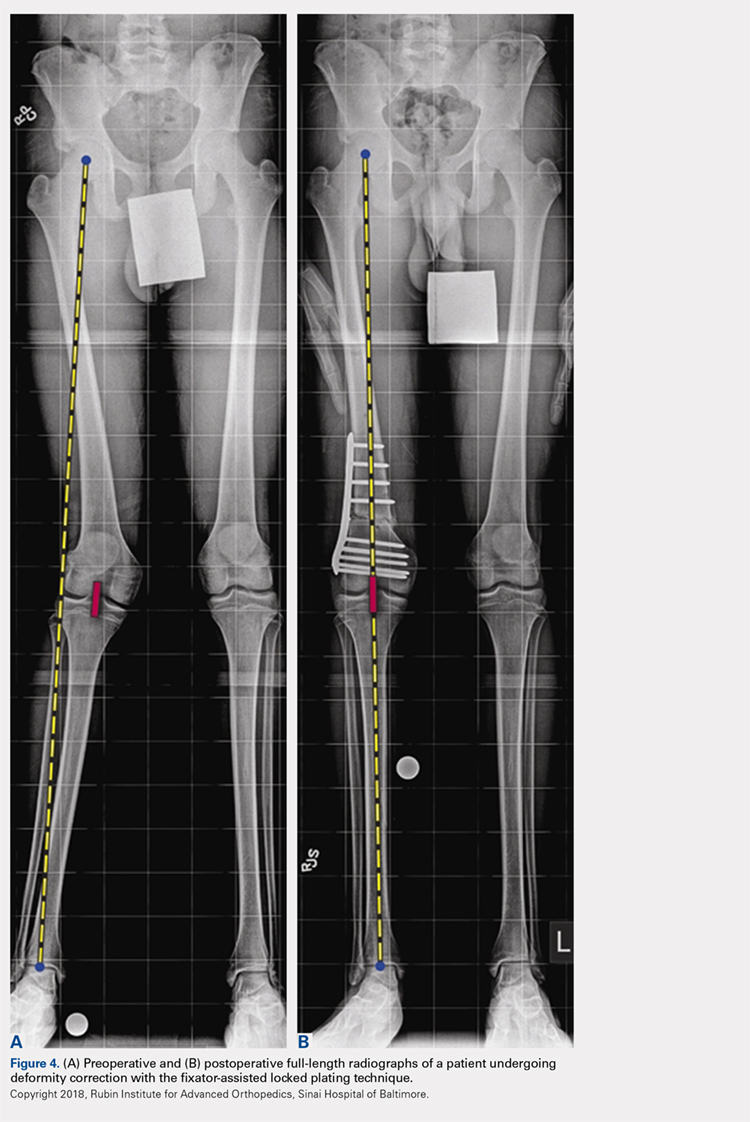
Preoperatively, a decision concerning the planned osteotomy and the correct locking plate size is made. In addition, the outline of the plate is marked on the skin. Under general anesthesia, the patients are prepared and draped. A tourniquet is elevated around the upper thigh. Then, 2 half-pins are medially inserted, 1 proximal and 1 distal to the planned osteotomy site, and are then connected loosely with a monolateral external fixator (Figure 2A). A lateral approach to the distal femur is done, preserving the periosteum, except at the level of the osteotomy. After the osteotomy is performed (through an open lateral incision), both segments are translated (Figure 2B) and then the distal segment is angulated to achieve the desired deformity correction, and the desired position is then stabilized by tightening the external fixator connectors (Figure 2C). Subsequently, a locking plate is inserted in the submuscular-extraperiostal plane. The plate does not require being in full contact (flush) with the bone. At least 3 screws are placed on both sides of the osteotomy through a long lateral incision (Figure 2D). Bone graft may be added to the osteotomy site to encourage healing. Then, the external fixator is removed, and all incisions are closed (Figure 2E).15,19 
During each of the procedures, we aimed at having “perfect alignment” with a MAD of 0 mm, in which a Bovie cord is used and passed through the center of the femoral head, knee, and ankle. However, to confirm that the surgery was successful, the actual measurements were performed on standing long-leg films. These films were obtained preoperatively and at latest follow-up. They were performed with the patella aiming forward, the toes straight ahead, feet separated enough for good balance, knees fully extended, and weight equally distributed on the feet. Postoperatively, in both cohorts, partial weight-bearing was encouraged immediately with crutches; physical therapy was instituted daily for knee range of motion. Radiographs were scheduled every 4 weeks to monitor callus formation. Full weight-bearing was allowed when at least 3 cortices were consolidated.1,15,19,20,25,26
All statistical analyses were performed with the aid of the SPSS statistical software package (SPSS). Average values and standard error of the mean were assigned to each variable. A nonparametric Mann-Whitney U test was used, and a 2-tailed P < .05 was considered significant. Correlation of continuous variables was determined by Spearman’s correlation coefficient. Also, multivariate Cox regression analyses after adjustment for age, sex, and deformity correction were used to detect associations within the study population. To evaluate whether our data were normally distributed, Shapiro-Wilk tests were performed.
Continue to: Results...
RESULTS
The mLDFA significantly improved in the FAN cohort from a mean of 81° to a mean of 89° (ranges, 67°-86° and 80°-100°; respectively; P = .001) (Figures 3A, 3B). 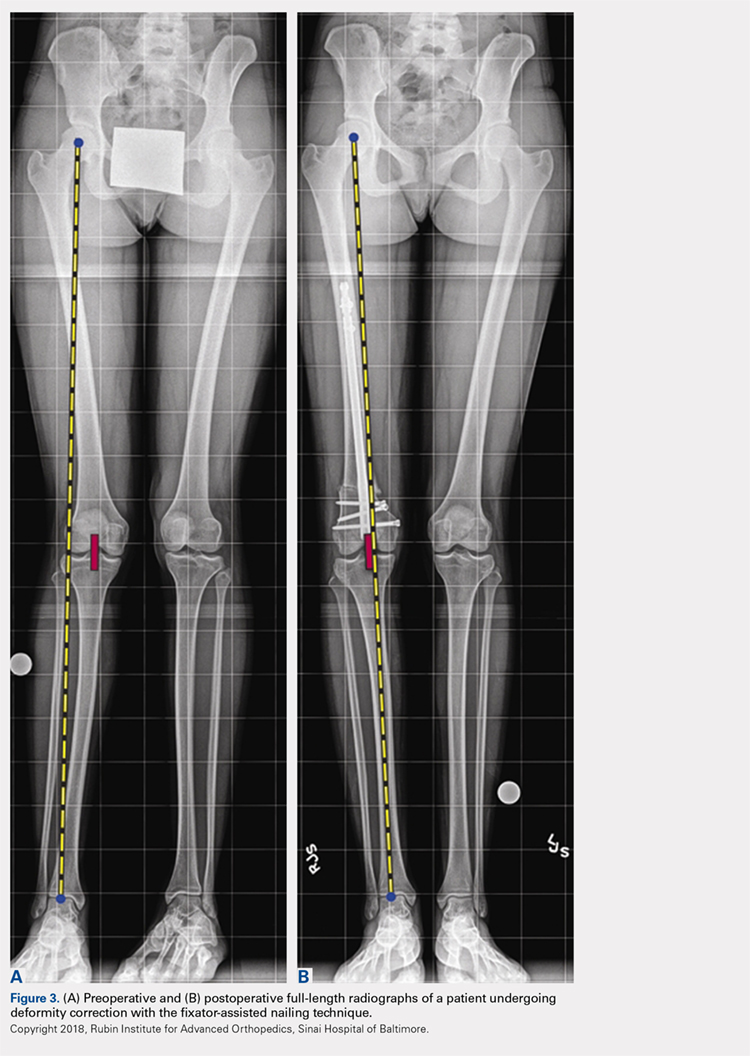
| Table 2. Deformity Correction | ||||
| Measurement | Cohort | Preoperative | Postoperative | P Value |
| mLDFA in degrees (range) | FAN | 81 (67 to 86) | 89 (80 to 100) | 0.001 |
| FALP | 80 (71 to 87) | 90 (88 to 94) | <0.001 | |
| Mechanical axis deviation in mm (range) | FAN | 32 (6 to 64) | 10 (0 to 22) | 0.001 |
| FALP | 34 (17 to 62) | 4 (0 to 11) | 0.002 | |
Abbreviations: FALP, fixator assisted locked plating; FAN, fixator assisted nailing; mLDFA, mechanical lateral distal femoral angle
After evaluating the MPTA, in the FAN cohort, we found that the mean pre- and postoperative MPTAs were not modified. These patients had a mean preoperative angle of 88° (range, 62°-100°), which was kept postoperatively to a mean of 88° (range, 78°-96°). In the FALP cohort, a slight change from 90° to 88° was observed (ranges, 82°-97° and 83°-94°, respectively). None of these changes in MPTA were significant (P > .05).
When evaluating correction of the MAD, we observed that the FAN cohort changed from a preoperative MAD of 32 mm (range, 6-64 mm) to a postoperative mean of 10 mm (range, 0-22 mm), and this correction was statistically significant. (P = .001). The FALP cohort changed from a mean of 34 mm (range, 17-62 mm) preoperatively to 4 mm (range, 0-11 mm) postoperatively, and this was also statistically significant (P = .002). The mean MAD correction for the FAN group vs FALP group was 27 mm vs 32 mm, respectively (Table 2).
In patients with valgus femoral deformity, the MAD is usually lateralized; however, in the FAN cohort, we included 3 patients with medial MADs (10 mm, 13 mm, and 40 mm). This is justified in these patients because a complex deformity of the distal femur and the proximal tibia was present. In the extreme case of a 40-mm medial MAD, the presurgery mLDFA was 76°, and the presurgery MPTA was 62°. The amount of deformity correction in this patient was 16°.
During the follow-up period, 2 complications occurred in the FAN group. One patient developed gait disturbance that resolved with physical therapy. Another had an infection at the osteotomy site. This was addressed with intravenous antibiotic therapy, surgical irrigation and débridement, hardware removal, and antegrade insertion of an antibiotic-coated nail. In the FALP group, 1 patient developed a persistent incomplete peroneal nerve palsy attributed to a 17° correction from valgus to varus, despite prophylactic peroneal nerve decompression. Nonetheless, the patient was satisfied with the result, recovered partial nerve function, and returned for correction of the contralateral leg deformity. When comparing the complications between both cohorts, no significant differences were found: 2 of 18 cases (11%) in the FAN group vs 1 of 6 cases (17%) in the FALP group (P = .78).
Continue to: The goal of this study...
DISCUSSION
The goal of this study was to compare the accuracy of deformity corrections achieved with either FAN or FALP. A number of authors have described results after deformity correction with several plating and nailing techniques; however, the information derived from comparing these 2 techniques is limited. We hypothesized that FALP would be more accurate, because less mobilization during fixation is required. However, we found no significant differences between these 2 techniques.
This study has several limitations. First, the small size of our cohort had to be further reduced owing to limited data; nevertheless, this pathology and the treatment methods used are not commonly performed, which make this cohort 1 of the largest of its type described in the literature. Also, the procedures were performed by multiple surgeons in a population with a wide age range, creating multiple additional variables that complicate the comparison of the sole differences between FAN and FALP. However, owing to these variables, the generalizability of this study may be increased, and similar outcomes can potentially be obtained by other institutions/surgeons. In addition, the variability of our follow-up period is another limitation; however, these patients were all assessed until bony union after skeletal maturity was achieved. Hence, the development of additional deformity is not expected. The lack of clinical outcome with a standardized questionnaire may also be seen as a limitation. However, because the purpose of our study was to assess both surgeries in terms of their ability to achieve angular correction, the addition of patient-reported outcomes may have increased the variability of our data.
The foremost objective in valgus deformity correction is to establish joint orientation angles within anatomic range to prevent overloading of the lateral joint and thereby prevent lateral compartmental osteoarthritis.2,20,27-29 There are 2 categories of fixation: internal and external. With FAN and FALP, we strive to have the adjustability and accuracy of external fixation with the comfort (for the patient) of internal fixation. Accurate osteotomy correction requires an accurate preoperative analysis and osteotomy close to the apex of the deformity.16,21,30-33 The most commonly used osteotomy techniques are drill-hole,31 focal dome,34 rotation, and open- or closed-wedge osteotomies.35,36 After the osteotomy, the resultant correction has to be stabilized. In recent years, the popularity of plates instead of an IM nail for internal fixation has been driven by the rapid development of low contact locking plates.16,19,26,30,37-40
There are certain advantages of using FAN over FALP. In older patients who may require a subsequent total knee arthroplasty (TKA), the midline incision used for retrograde FAN technique is identical to that made for TKA. In contrast, in a younger and more active population, with a longer life expectancy, the extra-articular FALP approach has the advantage of not violating the knee joint. In addition, locking plates may achieve a more rigid fixation than IM nails; however, the stability of IM nails can be augmented with blocking screws.
Continue to: In 20 patients, including children...
In 20 patients, including children and young adults, with frontal and sagittal plane deformities, Marangoz and colleagues7 reported on correction of valgus, varus, and procurvatum deformities using a Taylor Spatial Frame (TSF). Successful correction of severe deformities was achieved gradually with the TSF, resulting in a postoperative deformity (valgus group) of mLDFA 88.9° (range, 85°-95°).7 In a more recent study, Bar-On and colleagues15 described a series of 11 patients (18 segments) with corrective lower limb osteotomies in which all were corrected to within 2° of the planned range. Similarly, Gugenheim and Brinker20 described the use of the FAN technique to correct distal varus and valgus deformities in 14 femora. The final mean mLDFA and MAD in the valgus group were 89° (range, 88°-90°) and 5 mm (range, 0-14 mm medial), respectively.
In their comparative study, Seah and colleagues11 described monolateral frame vs FALP deformity correction in a series of 34 extremities (26 patients) that required distal femoral osteotomy. No differences related to knee range of motion or the ability to correct the deformity between internal and external fixation were reported (P > .05). Similarly, Eidelman and colleagues1 evaluated the outcomes of 6 patients (7 procedures) who underwent surgery performed with the FALP technique for distal femoral valgus deformity. They concluded that this technique is minimally invasive and can provide a precise deformity correction with minimal morbidity.
Other methods of fixation while performing FAN have been described by Jasiewicz and colleagues,22 who evaluated possible differences between the classic Ilizarov device and monolateral fixators in 19 femoral lengthening procedures. The authors concluded that there is no difference between concerning complication rate and treatment time. The use of FAN has also been described in patients with metabolic disease who required deformity correction. In this regard, Kocaoglu and colleagues12 described the use of a monolateral external fixator in combination with an IM nail in a series of 17 patients with metabolic bone disease. The authors concluded that the use of the IM nail prevented recurrence of deformity and refracture.12 Kocaoglu and colleagues14 also published a series of 25 patients treated with the FAN and LON (lengthening over a nail) technique for lengthening and deformity correction. The mean MAD improved from 33.9 mm to11.3 mm (range, 0-30 mm). In contrast, Erlap and colleagues13 compared FAN with circular external fixator for bone realignment of the lower extremity for deformities in patients with rickets. Although no significant difference was found between both groups, FAN was shown to be accurate and to provide great comfort to patients, and it also shortened the total treatment time.13 Finally, the advent of newer technologies could also provide alternatives for correcting valgus deformities. For example, Saragaglia and Chedal-Bornu6 performed 29 computer-assisted valgus knees osteotomies (27 patients) and reported that the goal hip-knee angle was achieved in 86% of patients and that the goal MPTA was achieved in 100% of patients.6
CONCLUSION
Both the FALP and FAN methods of femoral deformity correction are safe and effective surgical techniques. In our opinion, the advantages of the FALP technique result from the easy lateral surgical approach under medial external fixation and stabilization of the osteotomy without bending the knee. Ultimately, the decision to use FAN may be influenced by the surgeon’s perception of the potential need for future TKA. In such cases, a midline anterior approach with nailing is very compatible with subsequent TKA. The surgeon’s experience and preference, while keeping in mind the patient’s predilection, will play an important role in the decision-making process. Larger prospective clinical trials with larger cohorts have to be conducted to confirm our findings.
1. Eidelman M, Keren Y, Norman D. Correction of distal femoral valgus deformities in adolescents and young adults using minimally invasive fixator-assisted locking plating (FALP). J Pediatr Orthop B. 2012;21(6):558-562. doi:10.1097/BPB.0b013e328358f884.
2. Pelletier JP, Raynauld JP, Berthiaume MJ, et al. Risk factors associated with the loss of cartilage volume on weight-bearing areas in knee osteoarthritis patients assessed by quantitative magnetic resonance imaging: a longitudinal study. Arthritis Res Ther. 2007;9(4):R74. doi:10.1186/ar2272.
3. Solomin LN, Paley D, Shchepkina EA, Vilensky VA, Skomoroshko PV. A comparative study of the correction of femoral deformity between the Ilizarov apparatus and ortho-SUV Frame. Int Orthop. 2014;38(4):865-872. doi:10.1007/s00264-013-2247-0.
4. Meric G, Gracitelli GC, Aram LJ, Swank ML, Bugbee WD. Variability in distal femoral anatomy in patients undergoing total knee arthroplasty: measurements on 13,546 computed tomography scans. J Arthroplasty. 2015;30(10):1835-1838. doi:10.1016/j.arth.2015.04.024.
5. Cameron JI, McCauley JC, Kermanshahi AY, Bugbee WD. Lateral opening-wedge distal femoral osteotomy: pain relief, functional improvement, and survivorship at 5 years. Clin Orthop Relat Res. 2015;473(6):2009-2015. doi:10.1007/s11999-014-4106-8.
6. Saragaglia D, Chedal-Bornu B. Computer-assisted osteotomy for valgus knees: medium-term results of 29 cases. Orthop Traumatol Surg Res. 2014;100(5):527-530. doi:10.1016/j.otsr.2014.04.002.
7. Marangoz S, Feldman DS, Sala DA, Hyman JE, Vitale MG. Femoral deformity correction in children and young adults using Taylor Spatial Frame. Clin Orthop Relat Res. 2008;466(12):3018-3024. doi:10.1007/s11999-008-0490-2.
8. Rogers MJ, McFadyen I, Livingstone JA, Monsell F, Jackson M, Atkins RM. Computer hexapod assisted orthopaedic surgery (CHAOS) in the correction of long bone fracture and deformity. J Orthop Trauma. 2007;21(5):337-342. doi:10.1097/BOT.0b013e3180463103.
9. Feldman DS, Madan SS, Ruchelsman DE, Sala DA, Lehman WB. Accuracy of correction of tibia vara: acute versus gradual correction. J Pediatr Orthop. 2006;26(6):794-798. doi:10.1097/01.bpo.0000242375.64854.3d.
10. Manner HM, Huebl M, Radler C, Ganger R, Petje G, Grill F. Accuracy of complex lower-limb deformity correction with external fixation: a comparison of the Taylor Spatial Frame with the Ilizarov ring fixator. J Child Orthop. 2007;1(1):55-61. doi:10.1007/s11832-006-0005-1.
11. Seah KT, Shafi R, Fragomen AT, Rozbruch SR. Distal femoral osteotomy: is internal fixation better than external? Clin Orthop Relat Res. 2011;469(7):2003-2011. doi:10.1007/s11999-010-1755-0.
12. Kocaoglu M, Bilen FE, Sen C, Eralp L, Balci HI. Combined technique for the correction of lower-limb deformities resulting from metabolic bone disease. J Bone Joint Surg Br. 2011;93(1):52-56. doi:10.1302/0301-620X.93B1.24788.
13. Eralp L, Kocaoglu M, Toker B, Balcı HI, Awad A. Comparison of fixator-assisted nailing versus circular external fixator for bone realignment of lower extremity angular deformities in rickets disease. Arch Orthop Trauma Surg. 2011;131(5):581-589. doi:10.1007/s00402-010-1162-8.
14. Kocaoglu M, Eralp L, Bilen FE, Balci HI. Fixator-assisted acute femoral deformity correction and consecutive lengthening over an intramedullary nail. J Bone Joint Surg Am. 2009;91(1):152-159. doi:10.2106/JBJS.H.00114.
15. Bar-On E, Becker T, Katz K, Velkes S, Salai M, Weigl DM. Corrective lower limb osteotomies in children using temporary external fixation and percutaneous locking plates. J Child Orthop. 2009;3(2):137-143. doi:10.1007/s11832-009-0165-x.
16. Herzenberg JE, Kovar FM. External fixation assisted nailing (EFAN) and external fixation assisted plating (EFAP) for deformity correction. In: Solomin LN, ed. The Basic Principles of External Fixation Using the Ilizarov and Other Devices. 2nd ed. Italy: Springer-Verlag; 2012:1363-1378.
17. Eralp L, Kocaoglu M, Cakmak M, Ozden VE. A correction of windswept deformity by fixator assisted nailing. A report of two cases. J Bone Joint Surg Br. 2004;86(7):1065-1068.
18. Eralp L, Kocaoglu M. Distal tibial reconstruction with use of a circular external fixator and an intramedullary nail. Surgical technique. J Bone Joint Surg Am. 2008;90(suppl 2 Pt 2):181-194. doi:10.2106/JBJS.H.00467.
19. Gautier E, Sommer C. Guidelines for the clinical application of the LCP. Injury. 2003;34(Suppl 2):B63-B76. doi:10.1016/j.injury.2003.09.026.
20. Gugenheim JJ Jr, Brinker MR. Bone realignment with use of temporary external fixation for distal femoral valgus and varus deformities. J Bone Joint Surg Am. 2003;85–A(7):1229-1237. doi:10.2106/00004623-200307000-00008.
21. Paley D, Herzenberg JE, Tetsworth K, McKie J, Bhave A. Deformity planning for frontal and sagittal plane corrective osteotomies. Orthop Clin North Am. 1994;25(3):425-465.
22. Jasiewicz B, Kacki W, Tesiorowski M, Potaczek T. Results of femoral lengthening over an intramedullary nail and external fixator. Chir Narzadow Ruchu Ortop Pol. 2008;73(3):177-183.
23. Pape HC, Giannoudis P. The biological and physiological effects of intramedullary reaming. J Bone Joint Surg Br. 2007;89(11):1421-1426. doi:10.1302/0301-620X.89B11.19570.
24. Wozasek GE, Simon P, Redl H, Schlag G. Intramedullary pressure changes and fat intravasation during intramedullary nailing: an experimental study in sheep. J Trauma. 1994;36(2):202-207. doi:10.1097/00005373-199402000-00010.
25. Gordon JE, Goldfarb CA, Luhmann SJ, Lyons D, Schoenecker PL. Femoral lengthening over a humeral intramedullary nail in preadolescent children. J Bone Joint Surg Am. 2002;84–A(6):930-937. doi:10.2106/00004623-200206000-00006.
26. Oh CW, Song HR, Kim JW, et al. Deformity correction with submuscular plating technique in children. J Pediatr Orthop B. 2010;19(1):47-54. doi:10.1097/BPB.0b013e32832f5b06.
27. Guettler J, Glisson R, Stubbs A, Jurist K, Higgins L. The triad of varus malalignment, meniscectomy, and chondral damage: a biomechanical explanation for joint degeneration. Orthopedics. 2007;30(7):558-566.
28. Sharma L, Eckstein F, Song J, et al. Relationship of meniscal damage, meniscal extrusion, malalignment, and joint laxity to subsequent cartilage loss in osteoarthritic knees. Arthritis Rheum. 2008;58(6):1716-1726. doi:10.1002/art.23462.
29. Tanamas S, Hanna FS, Cicuttini FM, Wluka AE, Berry P, Urquhart DM. Does knee malalignment increase the risk of development and progression of knee osteoarthritis? A systematic review. Arthritis Rheum. 2009;61(4):459-467. doi:10.1002/art.24336.
30. Paley D, HJ, Bor N. Fixator-assisted nailing of femoral and tibial deformities. Tech Orthop. 1997;12(4):260-275.
31. Eralp L, Kocaoğlu M, Ozkan K, Türker M. A comparison of two osteotomy techniques for tibial lengthening. Arch Orthop Trauma Surg. 2004;124(5):298-300. doi:10.1007/s00402-004-0646-9.
32. Strecker W, Kinzl L, Keppler P. Corrective osteotomies of the distal femur with retrograde intramedullary nail. Unfallchirurg. 2001;104(10):973-983. doi:10.1007/s001130170040.
33. Watanabe K, Tsuchiya H, Sakurakichi K, Matsubara H, Tomita K. Acute correction using focal dome osteotomy for deformity about knee joint. Arch Orthop Trauma Surg. 2008;128(12):1373-1378. doi:10.1007/s00402-008-0574-1.
34. Hankemeier S, Paley D, Pape HC, Zeichen J, Gosling T, Krettek C. Knee para-articular focal dome osteotomy. Orthopade. 2004;33(2):170-177. doi:10.1007/s00132-003-0588-x.
35. Brinkman JM, Luites JW, Wymenga AB, van Heerwaarden RJ. Early full weight bearing is safe in open-wedge high tibial osteotomy. Acta Orthop. 2010;81(2):193-198. doi:10.3109/17453671003619003.
36. Hankemeier S, Mommsen P, Krettek C, et al. Accuracy of high tibial osteotomy: comparison between open- and closed-wedge technique. Knee Surg Sports Traumatol Arthrosc. 2010;18(10):1328-1333. doi:10.1007/s00167-009-1020-9.
37. Hedequist D, Bishop J, Hresko T. Locking plate fixation for pediatric femur fractures. J Pediatr Orthop. 2008;28(1):6-9. doi:10.1097/bpo.0b013e31815ff301.
38. Iobst CA, Dahl MT. Limb lengthening with submuscular plate stabilization: a case series and description of the technique. J Pediatr Orthop. 2007;27(5):504-509. doi:10.1097/01.bpb.0000279020.96375.88.
39. Uysal M, Akpinar S, Cesur N, Hersekli MA, Tandoğan RN. Plating after lengthening (PAL): technical notes and preliminary clinical experiences. Arch Orthop Trauma Surg. 2007;127(10):889-893. doi:10.1007/s00402-007-0442-4.
40. Smith WR, Ziran BH, Anglen JO, Stahel PF. Locking plates: tips and tricks. Instr Course Lect. 2008;57:25-36.
ABSTRACT
Fixator-assisted nailing (FAN) and fixator-assisted locked plating (FALP) are 2 techniques that can be used to correct distal femoral valgus deformities. The fixator aids in achieving an accurate adjustable initial reduction, which is then made permanent with either nail or plate insertion. FALP can be performed with the knee held in a neutral extended position, whereas FAN requires 30° to 90° of knee flexion to insert the nail, which may cause some alignment loss. We hypothesized that FAN may yield less accurate correction than FALP. Prospectively collected data of a consecutive cohort of patients who underwent valgus deformity femoral correction with FAN or FALP at a single institution over an 8-year period were retrospectively evaluated. Twenty extremities (18 patients) were treated using FAN (median follow-up, 5 years; range, 1-10 years), and 7 extremities (6 patients) were treated with FALP (median follow-up, 5 years; range, 1-8 years). In the FAN cohort, the mean preoperative and postoperative mechanical lateral distal femoral angles (mLDFAs) were 81° (range, 67°-86°) and 89° (range, 80°-100°), respectively (P = .009). In the FALP cohort, the mean preoperative and postoperative mLDFAs were 80° (range, 71°-87°) and 88° (range, 81°-94°), respectively (P < .001). Although the average mechanical axis deviation correction for the FALP group was greater than for the FAN group (32 mm and 27 mm, respectively), the difference was not significant (P = .66). Both methods of femoral deformity correction can be considered safe and effective. On the basis of our results, FAN and FALP are comparable in accuracy for deformity correction in the distal femur.
Multiple etiologies for distal femoral valgus deformity have been described in the literature.1-3 These can be congenital, developmental, secondary to lateral compartmental arthritis, or posttraumatic.4 If not corrected, femoral deformities alter the axial alignment and orientation of the joints, and may lead to early degenerative joint disease and abnormal leg kinematics.3,5 After correcting these deformities, the goal of treatment is to obtain anatomic distal femoral angles and neutral mechanical axis deviation (MAD), but without overcorrecting into varus. Numerous techniques to fix these deformities, such as progressive correction with external fixation or acute correction open reduction with internal fixation (ORIF), have been described.6 Modern external fixation allows for a gradual, adjustable, and more accurate correction but may produce discomfort and complications for patients.7-10 In contrast, ORIF may be more tolerable for the patient, but to achieve a precise correction, considerable technical skills and expertise are required.1,11-14
Two techniques used to correct these valgus femoral deformities in adults are fixator-assisted nailing (FAN) and fixator-assisted locked plating (FALP).1 FAN and FALP combine the advantage of external fixation (accuracy, adjustability) with the benefits of internal fixation (patient comfort), because the osteotomy and correction are performed with the guidance of a temporary external fixator and then permanently fixated by an intramedullary (IM) nail or a locking plate.1,8,11-13,15-18 Both techniques have the possibility to correct varus and valgus deformities, but whenever correcting sagittal plane angulation, the FAN technique may be more challenging. The paucity of studies available involving FAN and FALP do not lead to a conclusive preference of one technique over the other relative to the accuracy and success of correction.15,19,20
Continue to: In both FAN and FALP
In both FAN and FALP, the external fixator is applied and adjusted after the osteotomy for accurate alignment. In FALP, the plate is added without moving the leg from its straight position. However, in FAN, the knee must be flexed to 30° to 90° for insertion of the retrograde knee nail, and the alignment may be lost if the external fixation is not fully stable. Therefore, we hypothesized that FAN would be less accurate than FALP. Hence, the purposes of this study is to compare the correction achieved with FAN and FALP in patients with distal femoral valgus deformities and to describe the intraoperative complications associated with both techniques.
MATERIALS AND METHODS
After proper Institutional Review Board approval was obtained, a consecutive cohort of 35 patients who underwent femoral deformity correction with either FAN or FALP during an 8-year period (January 2002 to December 2010) was retrospectively reviewed. Eleven patients had to be excluded because of inadequate follow-up (<12 months) or because additional procedures were simultaneously performed. A total of 24 patients (27 femora) who had a mean age of 26 years (range, 14-68 years) were included in the final study cohort. Specifically, 20 femora (18 patients) were corrected using the FAN technique (7 males and 11 females; mean age, 36 years; range, 14-68 years), and 7 femora (6 patients) were fixed using the FALP technique (2 males and 4 females; mean age, 16 years; range, 15-19 years). The median follow-up in the FAN cohort was 5 years (range, 1-10 years), and the median follow-up in the FALP cohort was 5 years (range, 1-8 years) (Table 1).
| Table 1. Study Details and Demographic Characteristics | |||
| Detail | Overall | FAN | FALP |
| Number of patients | 24 | 18 | 6 |
| Number of femurs | 27 | 20 | 7 |
| Age in years (range) | 26 (14 to 68) | 36 (14 to 68) | 16 (15 to 19) |
| Male:Female | 9:15 | 7:11 | 2:4 |
| Median follow-up in years (range) | 5 (1 to 10) | 5 (1 to 10) | 5 (1 to 8) |
Abbreviations: FALP, fixator assisted locked plating; FAN, fixator assisted nailing
The specific measurements performed in all patients were MAD, mechanical lateral distal femoral angle (mLDFA), and medial proximal tibia angle (MPTA). These were measured from standing anteroposterior radiographs of the knee that included the femur.21 All outcome data were collected from the medical charts, operative reports, and radiographic evaluations. To ensure accuracy, all measurements were performed by 2 authors blinded to each other’s measurements. If a variation of <5% was obtained, the results were averaged and used for further analysis. Whenever a difference of >5% was obtained, the measurement was repeated by both authors for confirmation.
SURGICAL FAN TECHNIQUE
After measuring the deformity (Figure 1A) with the patient under general anesthesia on a radiolucent table, the involved lower limb is prepared and draped. Two half-pins are inserted medially, 1 proximal and 1 distal to the planned osteotomy site (Figure 1B), and then connected loosely with a monolateral external fixator. Special care is taken while placing the half-pins, not to interfere with the insertion path of the IM rod. When performing the preoperative planning, the level of osteotomy is chosen to enable the placement of at least 2 interlocking screws distal to the osteotomy. Then, a percutaneous osteotomy is performed from a lateral approach, and the bone ends are manipulated (translation and then angulation) to achieve the desired deformity correction. The external fixator is then stabilized and locked in the exact position (Figure 1C). Subsequently, retrograde reaming, nail insertion, and placement of proximal and distal locking screws are performed (Figure 1D). Blocking screws may give additional stability. The removal of the external fixator is the final step (Figure 1E).20
Continue to: When using the FAN technique...
When using the FAN technique, special attention is paid to reducing the risk of fat embolism. This can be reduced but not totally eradicated with the use of reaming irrigation devices.22-24 In our technique of FAN, the bone is cut and displaced prior to reaming so that the pressure of reaming is vented out through the osteotomy, along with the reaming contents, which theoretically can then act as a “prepositioned bone graft” that may speed healing.
SURGICAL FALP TECHNIQUE
Preoperatively, a decision concerning the planned osteotomy and the correct locking plate size is made. In addition, the outline of the plate is marked on the skin. Under general anesthesia, the patients are prepared and draped. A tourniquet is elevated around the upper thigh. Then, 2 half-pins are medially inserted, 1 proximal and 1 distal to the planned osteotomy site, and are then connected loosely with a monolateral external fixator (Figure 2A). A lateral approach to the distal femur is done, preserving the periosteum, except at the level of the osteotomy. After the osteotomy is performed (through an open lateral incision), both segments are translated (Figure 2B) and then the distal segment is angulated to achieve the desired deformity correction, and the desired position is then stabilized by tightening the external fixator connectors (Figure 2C). Subsequently, a locking plate is inserted in the submuscular-extraperiostal plane. The plate does not require being in full contact (flush) with the bone. At least 3 screws are placed on both sides of the osteotomy through a long lateral incision (Figure 2D). Bone graft may be added to the osteotomy site to encourage healing. Then, the external fixator is removed, and all incisions are closed (Figure 2E).15,19
During each of the procedures, we aimed at having “perfect alignment” with a MAD of 0 mm, in which a Bovie cord is used and passed through the center of the femoral head, knee, and ankle. However, to confirm that the surgery was successful, the actual measurements were performed on standing long-leg films. These films were obtained preoperatively and at latest follow-up. They were performed with the patella aiming forward, the toes straight ahead, feet separated enough for good balance, knees fully extended, and weight equally distributed on the feet. Postoperatively, in both cohorts, partial weight-bearing was encouraged immediately with crutches; physical therapy was instituted daily for knee range of motion. Radiographs were scheduled every 4 weeks to monitor callus formation. Full weight-bearing was allowed when at least 3 cortices were consolidated.1,15,19,20,25,26
All statistical analyses were performed with the aid of the SPSS statistical software package (SPSS). Average values and standard error of the mean were assigned to each variable. A nonparametric Mann-Whitney U test was used, and a 2-tailed P < .05 was considered significant. Correlation of continuous variables was determined by Spearman’s correlation coefficient. Also, multivariate Cox regression analyses after adjustment for age, sex, and deformity correction were used to detect associations within the study population. To evaluate whether our data were normally distributed, Shapiro-Wilk tests were performed.
Continue to: Results...
RESULTS
The mLDFA significantly improved in the FAN cohort from a mean of 81° to a mean of 89° (ranges, 67°-86° and 80°-100°; respectively; P = .001) (Figures 3A, 3B).
| Table 2. Deformity Correction | ||||
| Measurement | Cohort | Preoperative | Postoperative | P Value |
| mLDFA in degrees (range) | FAN | 81 (67 to 86) | 89 (80 to 100) | 0.001 |
| FALP | 80 (71 to 87) | 90 (88 to 94) | <0.001 | |
| Mechanical axis deviation in mm (range) | FAN | 32 (6 to 64) | 10 (0 to 22) | 0.001 |
| FALP | 34 (17 to 62) | 4 (0 to 11) | 0.002 | |
Abbreviations: FALP, fixator assisted locked plating; FAN, fixator assisted nailing; mLDFA, mechanical lateral distal femoral angle
After evaluating the MPTA, in the FAN cohort, we found that the mean pre- and postoperative MPTAs were not modified. These patients had a mean preoperative angle of 88° (range, 62°-100°), which was kept postoperatively to a mean of 88° (range, 78°-96°). In the FALP cohort, a slight change from 90° to 88° was observed (ranges, 82°-97° and 83°-94°, respectively). None of these changes in MPTA were significant (P > .05).
When evaluating correction of the MAD, we observed that the FAN cohort changed from a preoperative MAD of 32 mm (range, 6-64 mm) to a postoperative mean of 10 mm (range, 0-22 mm), and this correction was statistically significant. (P = .001). The FALP cohort changed from a mean of 34 mm (range, 17-62 mm) preoperatively to 4 mm (range, 0-11 mm) postoperatively, and this was also statistically significant (P = .002). The mean MAD correction for the FAN group vs FALP group was 27 mm vs 32 mm, respectively (Table 2).
In patients with valgus femoral deformity, the MAD is usually lateralized; however, in the FAN cohort, we included 3 patients with medial MADs (10 mm, 13 mm, and 40 mm). This is justified in these patients because a complex deformity of the distal femur and the proximal tibia was present. In the extreme case of a 40-mm medial MAD, the presurgery mLDFA was 76°, and the presurgery MPTA was 62°. The amount of deformity correction in this patient was 16°.
During the follow-up period, 2 complications occurred in the FAN group. One patient developed gait disturbance that resolved with physical therapy. Another had an infection at the osteotomy site. This was addressed with intravenous antibiotic therapy, surgical irrigation and débridement, hardware removal, and antegrade insertion of an antibiotic-coated nail. In the FALP group, 1 patient developed a persistent incomplete peroneal nerve palsy attributed to a 17° correction from valgus to varus, despite prophylactic peroneal nerve decompression. Nonetheless, the patient was satisfied with the result, recovered partial nerve function, and returned for correction of the contralateral leg deformity. When comparing the complications between both cohorts, no significant differences were found: 2 of 18 cases (11%) in the FAN group vs 1 of 6 cases (17%) in the FALP group (P = .78).
Continue to: The goal of this study...
DISCUSSION
The goal of this study was to compare the accuracy of deformity corrections achieved with either FAN or FALP. A number of authors have described results after deformity correction with several plating and nailing techniques; however, the information derived from comparing these 2 techniques is limited. We hypothesized that FALP would be more accurate, because less mobilization during fixation is required. However, we found no significant differences between these 2 techniques.
This study has several limitations. First, the small size of our cohort had to be further reduced owing to limited data; nevertheless, this pathology and the treatment methods used are not commonly performed, which make this cohort 1 of the largest of its type described in the literature. Also, the procedures were performed by multiple surgeons in a population with a wide age range, creating multiple additional variables that complicate the comparison of the sole differences between FAN and FALP. However, owing to these variables, the generalizability of this study may be increased, and similar outcomes can potentially be obtained by other institutions/surgeons. In addition, the variability of our follow-up period is another limitation; however, these patients were all assessed until bony union after skeletal maturity was achieved. Hence, the development of additional deformity is not expected. The lack of clinical outcome with a standardized questionnaire may also be seen as a limitation. However, because the purpose of our study was to assess both surgeries in terms of their ability to achieve angular correction, the addition of patient-reported outcomes may have increased the variability of our data.
The foremost objective in valgus deformity correction is to establish joint orientation angles within anatomic range to prevent overloading of the lateral joint and thereby prevent lateral compartmental osteoarthritis.2,20,27-29 There are 2 categories of fixation: internal and external. With FAN and FALP, we strive to have the adjustability and accuracy of external fixation with the comfort (for the patient) of internal fixation. Accurate osteotomy correction requires an accurate preoperative analysis and osteotomy close to the apex of the deformity.16,21,30-33 The most commonly used osteotomy techniques are drill-hole,31 focal dome,34 rotation, and open- or closed-wedge osteotomies.35,36 After the osteotomy, the resultant correction has to be stabilized. In recent years, the popularity of plates instead of an IM nail for internal fixation has been driven by the rapid development of low contact locking plates.16,19,26,30,37-40
There are certain advantages of using FAN over FALP. In older patients who may require a subsequent total knee arthroplasty (TKA), the midline incision used for retrograde FAN technique is identical to that made for TKA. In contrast, in a younger and more active population, with a longer life expectancy, the extra-articular FALP approach has the advantage of not violating the knee joint. In addition, locking plates may achieve a more rigid fixation than IM nails; however, the stability of IM nails can be augmented with blocking screws.
Continue to: In 20 patients, including children...
In 20 patients, including children and young adults, with frontal and sagittal plane deformities, Marangoz and colleagues7 reported on correction of valgus, varus, and procurvatum deformities using a Taylor Spatial Frame (TSF). Successful correction of severe deformities was achieved gradually with the TSF, resulting in a postoperative deformity (valgus group) of mLDFA 88.9° (range, 85°-95°).7 In a more recent study, Bar-On and colleagues15 described a series of 11 patients (18 segments) with corrective lower limb osteotomies in which all were corrected to within 2° of the planned range. Similarly, Gugenheim and Brinker20 described the use of the FAN technique to correct distal varus and valgus deformities in 14 femora. The final mean mLDFA and MAD in the valgus group were 89° (range, 88°-90°) and 5 mm (range, 0-14 mm medial), respectively.
In their comparative study, Seah and colleagues11 described monolateral frame vs FALP deformity correction in a series of 34 extremities (26 patients) that required distal femoral osteotomy. No differences related to knee range of motion or the ability to correct the deformity between internal and external fixation were reported (P > .05). Similarly, Eidelman and colleagues1 evaluated the outcomes of 6 patients (7 procedures) who underwent surgery performed with the FALP technique for distal femoral valgus deformity. They concluded that this technique is minimally invasive and can provide a precise deformity correction with minimal morbidity.
Other methods of fixation while performing FAN have been described by Jasiewicz and colleagues,22 who evaluated possible differences between the classic Ilizarov device and monolateral fixators in 19 femoral lengthening procedures. The authors concluded that there is no difference between concerning complication rate and treatment time. The use of FAN has also been described in patients with metabolic disease who required deformity correction. In this regard, Kocaoglu and colleagues12 described the use of a monolateral external fixator in combination with an IM nail in a series of 17 patients with metabolic bone disease. The authors concluded that the use of the IM nail prevented recurrence of deformity and refracture.12 Kocaoglu and colleagues14 also published a series of 25 patients treated with the FAN and LON (lengthening over a nail) technique for lengthening and deformity correction. The mean MAD improved from 33.9 mm to11.3 mm (range, 0-30 mm). In contrast, Erlap and colleagues13 compared FAN with circular external fixator for bone realignment of the lower extremity for deformities in patients with rickets. Although no significant difference was found between both groups, FAN was shown to be accurate and to provide great comfort to patients, and it also shortened the total treatment time.13 Finally, the advent of newer technologies could also provide alternatives for correcting valgus deformities. For example, Saragaglia and Chedal-Bornu6 performed 29 computer-assisted valgus knees osteotomies (27 patients) and reported that the goal hip-knee angle was achieved in 86% of patients and that the goal MPTA was achieved in 100% of patients.6
CONCLUSION
Both the FALP and FAN methods of femoral deformity correction are safe and effective surgical techniques. In our opinion, the advantages of the FALP technique result from the easy lateral surgical approach under medial external fixation and stabilization of the osteotomy without bending the knee. Ultimately, the decision to use FAN may be influenced by the surgeon’s perception of the potential need for future TKA. In such cases, a midline anterior approach with nailing is very compatible with subsequent TKA. The surgeon’s experience and preference, while keeping in mind the patient’s predilection, will play an important role in the decision-making process. Larger prospective clinical trials with larger cohorts have to be conducted to confirm our findings.
1. Eidelman M, Keren Y, Norman D. Correction of distal femoral valgus deformities in adolescents and young adults using minimally invasive fixator-assisted locking plating (FALP). J Pediatr Orthop B. 2012;21(6):558-562. doi:10.1097/BPB.0b013e328358f884.
2. Pelletier JP, Raynauld JP, Berthiaume MJ, et al. Risk factors associated with the loss of cartilage volume on weight-bearing areas in knee osteoarthritis patients assessed by quantitative magnetic resonance imaging: a longitudinal study. Arthritis Res Ther. 2007;9(4):R74. doi:10.1186/ar2272.
3. Solomin LN, Paley D, Shchepkina EA, Vilensky VA, Skomoroshko PV. A comparative study of the correction of femoral deformity between the Ilizarov apparatus and ortho-SUV Frame. Int Orthop. 2014;38(4):865-872. doi:10.1007/s00264-013-2247-0.
4. Meric G, Gracitelli GC, Aram LJ, Swank ML, Bugbee WD. Variability in distal femoral anatomy in patients undergoing total knee arthroplasty: measurements on 13,546 computed tomography scans. J Arthroplasty. 2015;30(10):1835-1838. doi:10.1016/j.arth.2015.04.024.
5. Cameron JI, McCauley JC, Kermanshahi AY, Bugbee WD. Lateral opening-wedge distal femoral osteotomy: pain relief, functional improvement, and survivorship at 5 years. Clin Orthop Relat Res. 2015;473(6):2009-2015. doi:10.1007/s11999-014-4106-8.
6. Saragaglia D, Chedal-Bornu B. Computer-assisted osteotomy for valgus knees: medium-term results of 29 cases. Orthop Traumatol Surg Res. 2014;100(5):527-530. doi:10.1016/j.otsr.2014.04.002.
7. Marangoz S, Feldman DS, Sala DA, Hyman JE, Vitale MG. Femoral deformity correction in children and young adults using Taylor Spatial Frame. Clin Orthop Relat Res. 2008;466(12):3018-3024. doi:10.1007/s11999-008-0490-2.
8. Rogers MJ, McFadyen I, Livingstone JA, Monsell F, Jackson M, Atkins RM. Computer hexapod assisted orthopaedic surgery (CHAOS) in the correction of long bone fracture and deformity. J Orthop Trauma. 2007;21(5):337-342. doi:10.1097/BOT.0b013e3180463103.
9. Feldman DS, Madan SS, Ruchelsman DE, Sala DA, Lehman WB. Accuracy of correction of tibia vara: acute versus gradual correction. J Pediatr Orthop. 2006;26(6):794-798. doi:10.1097/01.bpo.0000242375.64854.3d.
10. Manner HM, Huebl M, Radler C, Ganger R, Petje G, Grill F. Accuracy of complex lower-limb deformity correction with external fixation: a comparison of the Taylor Spatial Frame with the Ilizarov ring fixator. J Child Orthop. 2007;1(1):55-61. doi:10.1007/s11832-006-0005-1.
11. Seah KT, Shafi R, Fragomen AT, Rozbruch SR. Distal femoral osteotomy: is internal fixation better than external? Clin Orthop Relat Res. 2011;469(7):2003-2011. doi:10.1007/s11999-010-1755-0.
12. Kocaoglu M, Bilen FE, Sen C, Eralp L, Balci HI. Combined technique for the correction of lower-limb deformities resulting from metabolic bone disease. J Bone Joint Surg Br. 2011;93(1):52-56. doi:10.1302/0301-620X.93B1.24788.
13. Eralp L, Kocaoglu M, Toker B, Balcı HI, Awad A. Comparison of fixator-assisted nailing versus circular external fixator for bone realignment of lower extremity angular deformities in rickets disease. Arch Orthop Trauma Surg. 2011;131(5):581-589. doi:10.1007/s00402-010-1162-8.
14. Kocaoglu M, Eralp L, Bilen FE, Balci HI. Fixator-assisted acute femoral deformity correction and consecutive lengthening over an intramedullary nail. J Bone Joint Surg Am. 2009;91(1):152-159. doi:10.2106/JBJS.H.00114.
15. Bar-On E, Becker T, Katz K, Velkes S, Salai M, Weigl DM. Corrective lower limb osteotomies in children using temporary external fixation and percutaneous locking plates. J Child Orthop. 2009;3(2):137-143. doi:10.1007/s11832-009-0165-x.
16. Herzenberg JE, Kovar FM. External fixation assisted nailing (EFAN) and external fixation assisted plating (EFAP) for deformity correction. In: Solomin LN, ed. The Basic Principles of External Fixation Using the Ilizarov and Other Devices. 2nd ed. Italy: Springer-Verlag; 2012:1363-1378.
17. Eralp L, Kocaoglu M, Cakmak M, Ozden VE. A correction of windswept deformity by fixator assisted nailing. A report of two cases. J Bone Joint Surg Br. 2004;86(7):1065-1068.
18. Eralp L, Kocaoglu M. Distal tibial reconstruction with use of a circular external fixator and an intramedullary nail. Surgical technique. J Bone Joint Surg Am. 2008;90(suppl 2 Pt 2):181-194. doi:10.2106/JBJS.H.00467.
19. Gautier E, Sommer C. Guidelines for the clinical application of the LCP. Injury. 2003;34(Suppl 2):B63-B76. doi:10.1016/j.injury.2003.09.026.
20. Gugenheim JJ Jr, Brinker MR. Bone realignment with use of temporary external fixation for distal femoral valgus and varus deformities. J Bone Joint Surg Am. 2003;85–A(7):1229-1237. doi:10.2106/00004623-200307000-00008.
21. Paley D, Herzenberg JE, Tetsworth K, McKie J, Bhave A. Deformity planning for frontal and sagittal plane corrective osteotomies. Orthop Clin North Am. 1994;25(3):425-465.
22. Jasiewicz B, Kacki W, Tesiorowski M, Potaczek T. Results of femoral lengthening over an intramedullary nail and external fixator. Chir Narzadow Ruchu Ortop Pol. 2008;73(3):177-183.
23. Pape HC, Giannoudis P. The biological and physiological effects of intramedullary reaming. J Bone Joint Surg Br. 2007;89(11):1421-1426. doi:10.1302/0301-620X.89B11.19570.
24. Wozasek GE, Simon P, Redl H, Schlag G. Intramedullary pressure changes and fat intravasation during intramedullary nailing: an experimental study in sheep. J Trauma. 1994;36(2):202-207. doi:10.1097/00005373-199402000-00010.
25. Gordon JE, Goldfarb CA, Luhmann SJ, Lyons D, Schoenecker PL. Femoral lengthening over a humeral intramedullary nail in preadolescent children. J Bone Joint Surg Am. 2002;84–A(6):930-937. doi:10.2106/00004623-200206000-00006.
26. Oh CW, Song HR, Kim JW, et al. Deformity correction with submuscular plating technique in children. J Pediatr Orthop B. 2010;19(1):47-54. doi:10.1097/BPB.0b013e32832f5b06.
27. Guettler J, Glisson R, Stubbs A, Jurist K, Higgins L. The triad of varus malalignment, meniscectomy, and chondral damage: a biomechanical explanation for joint degeneration. Orthopedics. 2007;30(7):558-566.
28. Sharma L, Eckstein F, Song J, et al. Relationship of meniscal damage, meniscal extrusion, malalignment, and joint laxity to subsequent cartilage loss in osteoarthritic knees. Arthritis Rheum. 2008;58(6):1716-1726. doi:10.1002/art.23462.
29. Tanamas S, Hanna FS, Cicuttini FM, Wluka AE, Berry P, Urquhart DM. Does knee malalignment increase the risk of development and progression of knee osteoarthritis? A systematic review. Arthritis Rheum. 2009;61(4):459-467. doi:10.1002/art.24336.
30. Paley D, HJ, Bor N. Fixator-assisted nailing of femoral and tibial deformities. Tech Orthop. 1997;12(4):260-275.
31. Eralp L, Kocaoğlu M, Ozkan K, Türker M. A comparison of two osteotomy techniques for tibial lengthening. Arch Orthop Trauma Surg. 2004;124(5):298-300. doi:10.1007/s00402-004-0646-9.
32. Strecker W, Kinzl L, Keppler P. Corrective osteotomies of the distal femur with retrograde intramedullary nail. Unfallchirurg. 2001;104(10):973-983. doi:10.1007/s001130170040.
33. Watanabe K, Tsuchiya H, Sakurakichi K, Matsubara H, Tomita K. Acute correction using focal dome osteotomy for deformity about knee joint. Arch Orthop Trauma Surg. 2008;128(12):1373-1378. doi:10.1007/s00402-008-0574-1.
34. Hankemeier S, Paley D, Pape HC, Zeichen J, Gosling T, Krettek C. Knee para-articular focal dome osteotomy. Orthopade. 2004;33(2):170-177. doi:10.1007/s00132-003-0588-x.
35. Brinkman JM, Luites JW, Wymenga AB, van Heerwaarden RJ. Early full weight bearing is safe in open-wedge high tibial osteotomy. Acta Orthop. 2010;81(2):193-198. doi:10.3109/17453671003619003.
36. Hankemeier S, Mommsen P, Krettek C, et al. Accuracy of high tibial osteotomy: comparison between open- and closed-wedge technique. Knee Surg Sports Traumatol Arthrosc. 2010;18(10):1328-1333. doi:10.1007/s00167-009-1020-9.
37. Hedequist D, Bishop J, Hresko T. Locking plate fixation for pediatric femur fractures. J Pediatr Orthop. 2008;28(1):6-9. doi:10.1097/bpo.0b013e31815ff301.
38. Iobst CA, Dahl MT. Limb lengthening with submuscular plate stabilization: a case series and description of the technique. J Pediatr Orthop. 2007;27(5):504-509. doi:10.1097/01.bpb.0000279020.96375.88.
39. Uysal M, Akpinar S, Cesur N, Hersekli MA, Tandoğan RN. Plating after lengthening (PAL): technical notes and preliminary clinical experiences. Arch Orthop Trauma Surg. 2007;127(10):889-893. doi:10.1007/s00402-007-0442-4.
40. Smith WR, Ziran BH, Anglen JO, Stahel PF. Locking plates: tips and tricks. Instr Course Lect. 2008;57:25-36.
TAKE-HOME POINTS
- FAN and FALP are methods to improve the accuracy of long bone deformity correction.
- Both methods include temporary stabilization of the osteotomy with an external fixator.
- FALP is technically easier, since the external fixation pins do not have to be positioned out of the path of the nail, as in FAN.
- Acute corrections in the distal femur from valgus to varus can stretch the peroneal nerve.
- FAN and FALP are equivalent techniques for improving accuracy of deformity correction.
Multi-Modal Pain Control in Ambulatory Hand Surgery
ABSTRACT
We evaluated postoperative pain control and narcotic usage after thumb carpometacarpal (CMC) arthroplasty or open reduction and internal fixation (ORIF) of the distal radius in patients given opiates with or without other non-opiate medication using a specific dosing regimen. A prospective, randomized study of 79 patients undergoing elective CMC arthroplasty or ORIF of the distal radius evaluated postoperative pain in the first 5 postoperative days. Patients were divided into 4 groups: Group 1, oxycodone and acetaminophen PRN; Group 2, oxycodone and acetaminophen with specific dosing; Group 3, oxycodone, acetaminophen, and OxyContin with specific dosing; and Group 4, oxycodone, acetaminophen, and ketorolac with specific dosing. During the first 5 postoperative days, we recorded pain levels according to a numeric pain scale, opioid usage, and complications. Although differences in our data did not reach statistical significance, overall pain scores, opioid usage, and complication rates were less prevalent in the oxycodone, acetaminophen, and ketorolac group. Postoperative pain following ambulatory hand and wrist surgery under regional anesthesia was more effectively controlled with fewer complications using a combination of oxycodone, acetaminophen, and ketorolac with a specific dosing regimen.
Continue to: Regional anesthesia...
Regional anesthesia is a safe and effective modality of perioperative pain control in patients undergoing ambulatory hand procedures.1-10 Often, as the regional block wears off, patients experience a rebound pain effect that can be challenging to manage.
We sought to determine if an organized, multimodal approach in patients undergoing thumb carpometacarpal (CMC) arthroplasty or open reduction and internal fixation (ORIF) of distal radius fractures would provide better postoperative pain control. We hypothesized that this approach would significantly reduce postoperative pain and the need for narcotic pain medication compared with PRN dosing of oxycodone/acetaminophen alone.11-14
MATERIALS AND METHODS
Our study was approved by our Institutional Review Board. Informed consent was obtained from each patient. Patients presenting for elective thumb CMC arthroplasty or ORIF of the distal radius were screened for inclusion in a prospective, randomized study. Inclusion criteria included patients aged 18 to 65 years who could provide informed consent. Patients with chronic pain syndromes, long-term narcotic usage, chronic medical conditions precluding the use of opiates or nonsteroidal anti-inflammatory drugs (NSAIDs), and those who did not have a complete sensory and motor block postoperatively were excluded.
Patients were randomly divided into 1 of 4 study arms. Randomization was performed via sealed envelopes, which were opened in the recovery area when postoperative prescriptions were written. The group distribution was as follows: Group 1, Percocet 5 mg/325 mg alone (control); Group 2, oxycodone 5 mg, acetaminophen 325 mg administered separately; Group 3, oxycodone 5 mg, acetaminophen 325 mg, and oxycodone SR (OxyContin) 10 mg; and Group 4, oxycodone 5 mg, acetaminophen 325 mg, and ketorolac (Toradol) 10 mg (Table 1). Patients in the control group were instructed to take 1 or 2 tablets every 4 to 6 hours as needed for pain. Patients in the 3 experimental groups were given detailed instructions regarding when and how to take their medications. All patients were instructed to take 650 mg of acetaminophen every 6 hours. Patients were provided a sliding scale to assist in dosing their opioid medications according to their numeric pain score (NPS) (Table 2). Group 2 patients were given oxycodone 10 mg in the postanesthesia care unit (PACU) and instructed to take oxycodone 10 mg with acetaminophen 650 mg every 6 hours on a scheduled basis until their block wore off, then dose themselves using the NPS.
Table 1. Patient Groups
Group | Anesthesia | Pain Medications |
1 (standard treatment) | Brachial plexus block | Percocet (oxycodone and acetaminophen) 5-10 mg every 4-6 hours as needed for pain. |
2 | Brachial plexus block | 1. Oxycodone 0-15 mg every 4-6 hours as needed for pain based on pain scale score. 2. Tylenol (Acetaminophen) 650 mg every 6 hours, scheduled. |
3 | Brachial plexus block | 1. Oxycodone 0-15 mg every 4-6 hours as needed for pain based on numeric pain scale. 2. Tylenol (Acetaminophen) 650 mg every 6 hours, scheduled. 3. OxyContin (oxycodone sustained release) 10 mg twice a day, scheduled. |
4 | Brachial plexus block | 1. Oxycodone 0-15 mg every 4-6 hours as needed for pain based on pain scale score. 2. Tylenol (Acetaminophen) 650 mg every 6 hours, scheduled. 3. Toradol (Ketorolac) 10mg every 6 hours, scheduled. |
Table 2. Sliding Scale for Pain Control in the Experimental Groups
Pain Score | Oxycodone Dose |
0-3 | 5 mg (1 tablet) |
4-7 | 10 mg (2 tablets) |
8-10 | 15 mg (3 tablets) |
Group 3 patients were given oxycodone 10 mg in the PACU and instructed to take oxycodone 10 mg with acetaminophen 650 mg every 6 hours and OxyContin 10 mg every 12 hours on a scheduled basis until their block wore off, then dose themselves using NPS. Group 4 patients were given oxycodone 10 mg postoperatively and ketorolac 30 mg intravenously in the PACU and instructed to take oxycodone 10 mg, acetaminophen 650 mg, and ketorolac 10 mg every 6 hours on a scheduled basis until their block wore off, then dose themselves using the NPS.
Patients were provided with a journal and asked to record their medication usage, NPS, and any adverse effects (nausea, vomiting, and uncontrolled pain were specifically mentioned) or complications for 5 days after their procedure. We also attempted to contact patients by telephone on each of the 5 days after their procedure to remind them to complete their logs. They were asked specifically if they were having difficulty with their medications. They were also asked specifically about nausea, vomiting, and over-sedation. If patients requested additional medication to help treat their pain, they were instructed to add an over-the-counter NSAID of their choice based on the label’s suggested dosing.
Continue to: All patients received a supraclavicular...
All patients received a supraclavicular brachial plexus block using 0.75% ropivacaine under the supervision of an attending anesthesiologist experienced in regional anesthesia. Patients underwent thumb CMC arthroplasty utilizing complete resection of the trapezium followed by abductor pollicis longus suspensionplasty under the supervision of 1 of 3 fellowship-trained hand surgeons. ORIF of the distal radius was completed utilizing a volar approach and distal radius locking plate under the supervision of 1 of 3 fellowship-trained hand surgeons.
Primary outcome measures were the total number of oxycodone tablets taken daily and the average daily NPS. Secondary outcomes measured included adverse effects as noted above and the need for a trip to the emergency department for unrelieved pain.
A power analysis was completed prior to the beginning of the study. To detect a difference of at least 1 on the NPS, we determined that 18 patients per group would provide 80% power. This was based on literature utilizing the visual analog scale (VAS), a 100-mm line on which patients can place a mark to describe the intensity of their pain. The standard deviation on the VAS is approximately 15 mm. To account for potential dropout, we elected to recruit 20 patients per group. Non-paired t tests were used to compare groups.
RESULTS
One hundred and eighteen patients enrolled in the study. Of those, 79 patients completed and returned their summary logs (by group: 18 control, 20 oxycodone, 17 OxyContin, and 24 ketorolac). The remaining patients were excluded from the final analysis because they did not return their summary logs. Only 1 patient was excluded from the analysis because he did not have adequate regional anesthesia. Demographic data were analyzed and showed no significant differences between groups at the P < .05 level of significance. Surgical procedures were completed by 3 fellowship-trained hand surgeons. Distal radius fractures were performed using a volar approach. CMC arthroplasty was performed using a procedure that was standardized across surgeons. There were no between-surgeon differences in outcomes.
Average daily NPS (Figure 1) and the total number of oxycodone tablets taken (Figure 2) over the 5-day study period were recorded. Patients in the ketorolac group used fewer oxycodone tablets (19.3) than patients in the other 3 groups (24.4), P =.11, but the difference was not statistically significant. The maximum number of oxycodone tablets used was 71 in the Percocet group, 57 in the oxycodone and ketorolac groups, and 73 in the OxyContin group. The average daily NPS was lower in the ketorolac group during the period of medication use. This value only reached statistical significance on postoperative day 0 when the ketorolac group was compared with the OxyContin group (P = .01) and on postoperative day 1 when the ketorolac group was compared with the oxycodone group (P = .04). Complications (Figure 3) were greater in the non-ketorolac groups. One patient each in the oxycodone and OxyContin groups required a trip to the emergency department for pain control after their block wore off. Nausea and vomiting were present in each of the 4 groups but to a much greater degree in the Percocet and OxyContin groups; however, these results did not reach statistical significance (P = .129). Eleven of the 18 patients in the Percocet group required an additional NSAID (naproxen) and still did not achieve pain control similar to the other groups. This may explain why the average daily pain score in the Percocet group was lower than that in the oxycodone group, in which only 4 of the 20 patients supplemented with naproxen. Patients did, however, require many more oxycodone tablets to achieve pain control in the Percocet group. Over-sedation was reported in 3 patients in the oxycodone group and in 1 patient in the OxyContin group. No patients were found to have bleeding, renal, or other systemic complications.
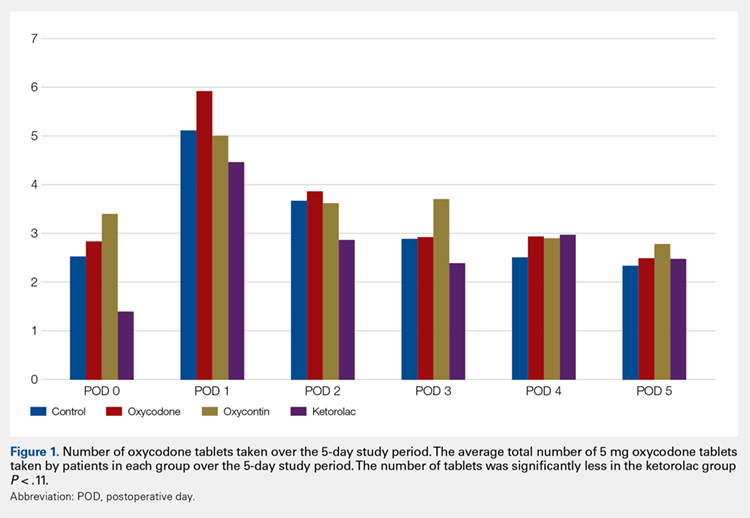
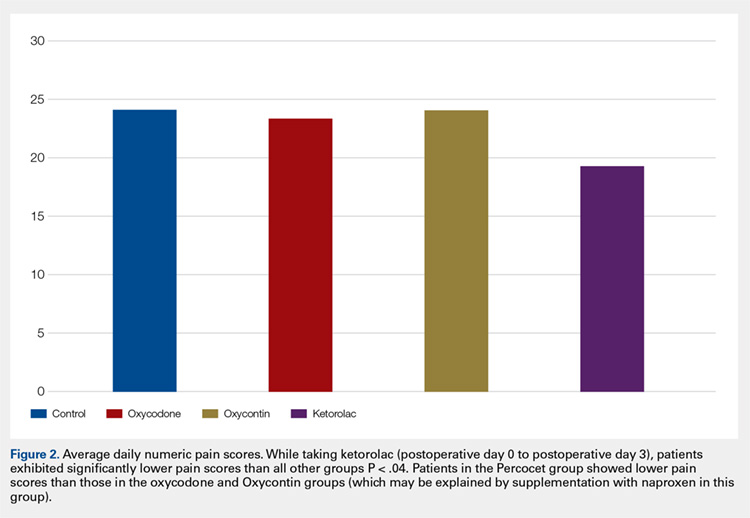
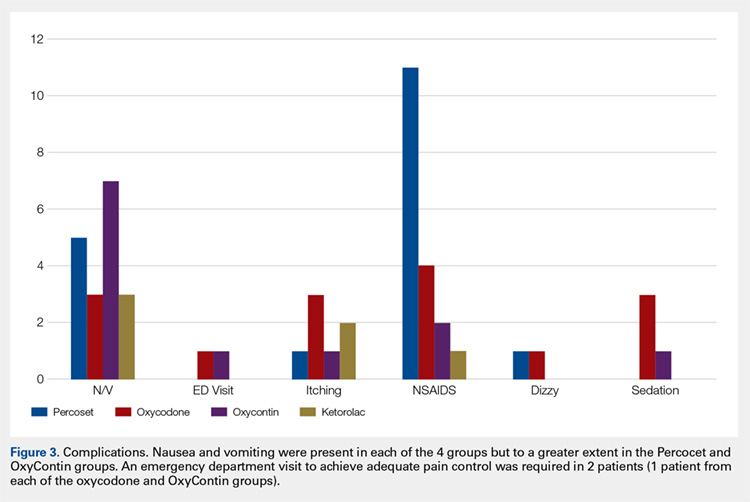
Continue to: Discussion...
DISCUSSION
In this prospective, randomized study, we sought to determine whether a more organized approach to treating postoperative pain using a specific dosing regimen or opiates in conjunction with non-opiate medications would lead to improved pain control and a decreased need for opiates. We found that adding ketorolac to the postoperative pain regimen and outlining a more detailed set of instructions could lower narcotic usage in the first 4 postoperative days. In addition, adding ketorolac decreased other complications commonly seen with narcotic usage and was shown to be safe in our patient population.
Ketorolac has been shown to decrease narcotic pain medication usage in several surgical settings and across different surgical specialties. It is hypothesized that ketorolac potentiates the effects of narcotics.11 Ketorolac given alone has a potent analgesic effect by acting as a strong non-selective cyclooxygenase inhibitor. The major drawback to ketorolac use has been its well-known side-effect profile. Ketorolac is renally excreted, and as such, should not be used in patients with renal insufficiency. In addition, ketorolac has been shown to cause increased gastrointestinal bleeding when used for >5 days.15 Caution should be taken when combining ketorolac with thromboprophylactic medications, especially in older patients.
Many surgeons use NSAIDs along with narcotics as part of a postoperative pain regimen. While this is often adequate for some procedures, when the surgery involves manipulating fractures, internal fixation, or resection arthroplasty, the variation in individual patient pain may call for a more robust protocol. Additionally, as surgeons expand to more complex procedures performed in the outpatient setting, evaluating different combinations of analgesics taken in a more structured manner may provide for improved pain control.
A major component of patient satisfaction is postoperative pain control.3-8,12,16,17 Regional anesthesia is an important tool that allows patients to undergo a surgical procedure with a greatly reduced amount of opioid pain medications. In addition, regional anesthesia can provide significant pain control after the patient has left the ambulatory surgery center, but this relief is short-lived because the medication is designed to lose effectiveness over time. As the effects of regional anesthesia wear off, patients can experience “rebound pain” with severe levels of pain that, on occasion, cannot be controlled with oral analgesics alone. The addition of ketorolac provided improved pain control when compared with the other regimens during this transition period when the regional anesthesia was becoming ineffective. In addition, because patients taking ketorolac used less narcotic medication, they experienced less nausea, vomiting, and over-sedation.
Additionally, patients were instructed to record their medication usage and pain scores on a prospective basis, with the hope of eliminating recall bias. A potential weakness is the inability to show significance for pain relief and reduced narcotic usage with the addition of ketorolac, although there was a trend toward significance. Many of the patients who enrolled in the trial did not return their medication logs. While these patients had to be excluded from data analysis, we continued enrollment until we obtained an adequate number of patients in each group. In addition, in the OxyContin group (Group 3), we could only recruit 17 participants, instead of the 18 needed based on our power study. Although this has a potential to alter the significance of our results, we do not feel this had a substantial impact on our results.
Many patients in the non-ketorolac groups supplemented their medication regimens with NSAIDs, which may have falsely lowered pain scores and narcotic usage. While this confounds our study results, we do not believe that it invalidates the conclusion that ketorolac can be an effective adjunct pain medication for use in patients undergoing ambulatory hand surgery.
The study examined postoperative pain control for only 2 procedures, thumb basal joint arthroplasty and distal radius fracture fixation, both commonly performed in the outpatient setting under regional anesthesia and both typically requiring narcotic pain medication. Perhaps the utilization of these medication regimens with different surgical procedures would have differing results.
We conclude that ketorolac potentially provides patients with improved pain control over the use of narcotic pain medications alone in the setting of ambulatory hand surgery.
This paper will be judged for the Resident Writer’s Award.
- Boezaart AP, Davis G, Le-Wendling L. Recovery after orthopedic surgery: techniques to increase duration of pain control. Curr Opin Anaesthesiol. 2012;25(6):665-672. doi:10.1097/ACO.0b013e328359ab5a.
- Buvanendran A, Kroin JS. Useful adjuvants for postoperative pain management. Best Pract Res Clin Anaesthesiol. 2007;21(1):31-49. doi:10.1016/j.bpa.2006.12.003.
- Coluzzi F, Bragazzi L, Di Bussolo E, Pizza G, Mattia C. Determinants of patient satisfaction in postoperative pain management following hand ambulatory day-surgery. Minerva Med. 2011;102(3):177-186.
- Elvir-Lazo OL, White PF. Postoperative pain management after ambulatory surgery: role of multimodal analgesia. Anesthesiol Clin. 2010;28(2):217-224. doi: 10.1016/j.anclin.2010.02.011.
- Kopp SL, Horlocker TT. Regional anaesthesia in day-stay and short-stay surgery. Anaesthesia. 2010;65(Suppl 1):84-96. doi:10.1111/j.1365-2044.2009.06204.x.
- Rawal N. Postoperative pain treatment for ambulatory surgery. Best Pract Res Clin Anaesthesiol. 2007;21(1):129-148. doi:10.1016/j.bpa.2006.11.005.
- Schug SA, Chong C. Pain management after ambulatory surgery. Curr Opin Anaesthesiol. 2009;22(6):738-743. doi:10.1097/ACO.0b013e32833020f4.
- Sripada R, Bowens C Jr. Regional anesthesia procedures for shoulder and upper arm surgery upper extremity update--2005 to present. Int Anesthesiol Clin. 2012;50(1):26-46. doi:10.1097/AIA.0b013e31821a0284.
- Trompeter A, Camilleri G, Narang K, Hauf W, Venn R. Analgesia requirements after interscalene block for shoulder arthroscopy: the 5 days following surgery. Arch Orthop Trauma Surg. 2010;130(3):417-421. doi:10.1007/s00402-009-0959-9.
- Dufeu N, Marchand-Maillet F, Atchabahian A, et al. Efficacy and safety of ultrasound-guided distal blocks for analgesia without motor blockade after ambulatory hand surgery. J Hand Surg Am. 2014;39(4):737-743. doi:10.1016/j.jhsa.2014.01.011.
- Gutta R, Koehn CR, James LE. Does ketorolac have a preemptive analgesic effect? A randomized, double-blind, control study. J Oral Maxillofac Surg. 2013;71(12):2029-2034. doi:10.1016/j.joms.2013.06.220.
- Nossaman VE, Ramadhyani U, Kadowitz PJ, Nossaman BD. Advances in perioperative pain management: use of medications with dual analgesic mechanisms, tramadol & tapentadol. Anesthesiol Clin. 2010;28(4):647-666. doi:10.1016/j.anclin.2010.08.009.
- Warren-Stomberg M, Brattwall M, Jakobsson JG. Non-opioid analgesics for pain management following ambulatory surgery: a review. Minerva Anestesiol. 2013;79(9):1077-1087.
- Wickerts L, Warrén Stomberg M, Brattwall M, Jakobsson JJ. Coxibs: is there a benefit when compared to traditional non-selective NSAIDs in postoperative pain management? Minerva Anestesiol. 2011;77(11):1084-1098.
- Strom BL, Berlin JA, Kinman JL, et al. Parenteral ketorolac and risk of gastrointestinal and operative site bleeding. A postmarketing surveillance study. JAMA. 1996;275(5):376-382. doi:10.1001/jama.275.5.376.
- Hegarty M, Calder A, Davies K, et al. Does take-home analgesia improve postoperative pain after elective day case surgery? A comparison of hospital vs parent-supplied analgesia. Paediatr Anaesth. 2013;23(5):385-389. doi:10.1111/pan.12077.
- Weber SC, Jain R, Parise C. Pain scores in the management of postoperative pain in shoulder surgery. Arthroscopy. 2007;23(1):65-72. doi:10.1016/j.arthro.2006.11.002.
ABSTRACT
We evaluated postoperative pain control and narcotic usage after thumb carpometacarpal (CMC) arthroplasty or open reduction and internal fixation (ORIF) of the distal radius in patients given opiates with or without other non-opiate medication using a specific dosing regimen. A prospective, randomized study of 79 patients undergoing elective CMC arthroplasty or ORIF of the distal radius evaluated postoperative pain in the first 5 postoperative days. Patients were divided into 4 groups: Group 1, oxycodone and acetaminophen PRN; Group 2, oxycodone and acetaminophen with specific dosing; Group 3, oxycodone, acetaminophen, and OxyContin with specific dosing; and Group 4, oxycodone, acetaminophen, and ketorolac with specific dosing. During the first 5 postoperative days, we recorded pain levels according to a numeric pain scale, opioid usage, and complications. Although differences in our data did not reach statistical significance, overall pain scores, opioid usage, and complication rates were less prevalent in the oxycodone, acetaminophen, and ketorolac group. Postoperative pain following ambulatory hand and wrist surgery under regional anesthesia was more effectively controlled with fewer complications using a combination of oxycodone, acetaminophen, and ketorolac with a specific dosing regimen.
Continue to: Regional anesthesia...
Regional anesthesia is a safe and effective modality of perioperative pain control in patients undergoing ambulatory hand procedures.1-10 Often, as the regional block wears off, patients experience a rebound pain effect that can be challenging to manage.
We sought to determine if an organized, multimodal approach in patients undergoing thumb carpometacarpal (CMC) arthroplasty or open reduction and internal fixation (ORIF) of distal radius fractures would provide better postoperative pain control. We hypothesized that this approach would significantly reduce postoperative pain and the need for narcotic pain medication compared with PRN dosing of oxycodone/acetaminophen alone.11-14
MATERIALS AND METHODS
Our study was approved by our Institutional Review Board. Informed consent was obtained from each patient. Patients presenting for elective thumb CMC arthroplasty or ORIF of the distal radius were screened for inclusion in a prospective, randomized study. Inclusion criteria included patients aged 18 to 65 years who could provide informed consent. Patients with chronic pain syndromes, long-term narcotic usage, chronic medical conditions precluding the use of opiates or nonsteroidal anti-inflammatory drugs (NSAIDs), and those who did not have a complete sensory and motor block postoperatively were excluded.
Patients were randomly divided into 1 of 4 study arms. Randomization was performed via sealed envelopes, which were opened in the recovery area when postoperative prescriptions were written. The group distribution was as follows: Group 1, Percocet 5 mg/325 mg alone (control); Group 2, oxycodone 5 mg, acetaminophen 325 mg administered separately; Group 3, oxycodone 5 mg, acetaminophen 325 mg, and oxycodone SR (OxyContin) 10 mg; and Group 4, oxycodone 5 mg, acetaminophen 325 mg, and ketorolac (Toradol) 10 mg (Table 1). Patients in the control group were instructed to take 1 or 2 tablets every 4 to 6 hours as needed for pain. Patients in the 3 experimental groups were given detailed instructions regarding when and how to take their medications. All patients were instructed to take 650 mg of acetaminophen every 6 hours. Patients were provided a sliding scale to assist in dosing their opioid medications according to their numeric pain score (NPS) (Table 2). Group 2 patients were given oxycodone 10 mg in the postanesthesia care unit (PACU) and instructed to take oxycodone 10 mg with acetaminophen 650 mg every 6 hours on a scheduled basis until their block wore off, then dose themselves using the NPS.
Table 1. Patient Groups
Group | Anesthesia | Pain Medications |
1 (standard treatment) | Brachial plexus block | Percocet (oxycodone and acetaminophen) 5-10 mg every 4-6 hours as needed for pain. |
2 | Brachial plexus block | 1. Oxycodone 0-15 mg every 4-6 hours as needed for pain based on pain scale score. 2. Tylenol (Acetaminophen) 650 mg every 6 hours, scheduled. |
3 | Brachial plexus block | 1. Oxycodone 0-15 mg every 4-6 hours as needed for pain based on numeric pain scale. 2. Tylenol (Acetaminophen) 650 mg every 6 hours, scheduled. 3. OxyContin (oxycodone sustained release) 10 mg twice a day, scheduled. |
4 | Brachial plexus block | 1. Oxycodone 0-15 mg every 4-6 hours as needed for pain based on pain scale score. 2. Tylenol (Acetaminophen) 650 mg every 6 hours, scheduled. 3. Toradol (Ketorolac) 10mg every 6 hours, scheduled. |
Table 2. Sliding Scale for Pain Control in the Experimental Groups
Pain Score | Oxycodone Dose |
0-3 | 5 mg (1 tablet) |
4-7 | 10 mg (2 tablets) |
8-10 | 15 mg (3 tablets) |
Group 3 patients were given oxycodone 10 mg in the PACU and instructed to take oxycodone 10 mg with acetaminophen 650 mg every 6 hours and OxyContin 10 mg every 12 hours on a scheduled basis until their block wore off, then dose themselves using NPS. Group 4 patients were given oxycodone 10 mg postoperatively and ketorolac 30 mg intravenously in the PACU and instructed to take oxycodone 10 mg, acetaminophen 650 mg, and ketorolac 10 mg every 6 hours on a scheduled basis until their block wore off, then dose themselves using the NPS.
Patients were provided with a journal and asked to record their medication usage, NPS, and any adverse effects (nausea, vomiting, and uncontrolled pain were specifically mentioned) or complications for 5 days after their procedure. We also attempted to contact patients by telephone on each of the 5 days after their procedure to remind them to complete their logs. They were asked specifically if they were having difficulty with their medications. They were also asked specifically about nausea, vomiting, and over-sedation. If patients requested additional medication to help treat their pain, they were instructed to add an over-the-counter NSAID of their choice based on the label’s suggested dosing.
Continue to: All patients received a supraclavicular...
All patients received a supraclavicular brachial plexus block using 0.75% ropivacaine under the supervision of an attending anesthesiologist experienced in regional anesthesia. Patients underwent thumb CMC arthroplasty utilizing complete resection of the trapezium followed by abductor pollicis longus suspensionplasty under the supervision of 1 of 3 fellowship-trained hand surgeons. ORIF of the distal radius was completed utilizing a volar approach and distal radius locking plate under the supervision of 1 of 3 fellowship-trained hand surgeons.
Primary outcome measures were the total number of oxycodone tablets taken daily and the average daily NPS. Secondary outcomes measured included adverse effects as noted above and the need for a trip to the emergency department for unrelieved pain.
A power analysis was completed prior to the beginning of the study. To detect a difference of at least 1 on the NPS, we determined that 18 patients per group would provide 80% power. This was based on literature utilizing the visual analog scale (VAS), a 100-mm line on which patients can place a mark to describe the intensity of their pain. The standard deviation on the VAS is approximately 15 mm. To account for potential dropout, we elected to recruit 20 patients per group. Non-paired t tests were used to compare groups.
RESULTS
One hundred and eighteen patients enrolled in the study. Of those, 79 patients completed and returned their summary logs (by group: 18 control, 20 oxycodone, 17 OxyContin, and 24 ketorolac). The remaining patients were excluded from the final analysis because they did not return their summary logs. Only 1 patient was excluded from the analysis because he did not have adequate regional anesthesia. Demographic data were analyzed and showed no significant differences between groups at the P < .05 level of significance. Surgical procedures were completed by 3 fellowship-trained hand surgeons. Distal radius fractures were performed using a volar approach. CMC arthroplasty was performed using a procedure that was standardized across surgeons. There were no between-surgeon differences in outcomes.
Average daily NPS (Figure 1) and the total number of oxycodone tablets taken (Figure 2) over the 5-day study period were recorded. Patients in the ketorolac group used fewer oxycodone tablets (19.3) than patients in the other 3 groups (24.4), P =.11, but the difference was not statistically significant. The maximum number of oxycodone tablets used was 71 in the Percocet group, 57 in the oxycodone and ketorolac groups, and 73 in the OxyContin group. The average daily NPS was lower in the ketorolac group during the period of medication use. This value only reached statistical significance on postoperative day 0 when the ketorolac group was compared with the OxyContin group (P = .01) and on postoperative day 1 when the ketorolac group was compared with the oxycodone group (P = .04). Complications (Figure 3) were greater in the non-ketorolac groups. One patient each in the oxycodone and OxyContin groups required a trip to the emergency department for pain control after their block wore off. Nausea and vomiting were present in each of the 4 groups but to a much greater degree in the Percocet and OxyContin groups; however, these results did not reach statistical significance (P = .129). Eleven of the 18 patients in the Percocet group required an additional NSAID (naproxen) and still did not achieve pain control similar to the other groups. This may explain why the average daily pain score in the Percocet group was lower than that in the oxycodone group, in which only 4 of the 20 patients supplemented with naproxen. Patients did, however, require many more oxycodone tablets to achieve pain control in the Percocet group. Over-sedation was reported in 3 patients in the oxycodone group and in 1 patient in the OxyContin group. No patients were found to have bleeding, renal, or other systemic complications.
Continue to: Discussion...
DISCUSSION
In this prospective, randomized study, we sought to determine whether a more organized approach to treating postoperative pain using a specific dosing regimen or opiates in conjunction with non-opiate medications would lead to improved pain control and a decreased need for opiates. We found that adding ketorolac to the postoperative pain regimen and outlining a more detailed set of instructions could lower narcotic usage in the first 4 postoperative days. In addition, adding ketorolac decreased other complications commonly seen with narcotic usage and was shown to be safe in our patient population.
Ketorolac has been shown to decrease narcotic pain medication usage in several surgical settings and across different surgical specialties. It is hypothesized that ketorolac potentiates the effects of narcotics.11 Ketorolac given alone has a potent analgesic effect by acting as a strong non-selective cyclooxygenase inhibitor. The major drawback to ketorolac use has been its well-known side-effect profile. Ketorolac is renally excreted, and as such, should not be used in patients with renal insufficiency. In addition, ketorolac has been shown to cause increased gastrointestinal bleeding when used for >5 days.15 Caution should be taken when combining ketorolac with thromboprophylactic medications, especially in older patients.
Many surgeons use NSAIDs along with narcotics as part of a postoperative pain regimen. While this is often adequate for some procedures, when the surgery involves manipulating fractures, internal fixation, or resection arthroplasty, the variation in individual patient pain may call for a more robust protocol. Additionally, as surgeons expand to more complex procedures performed in the outpatient setting, evaluating different combinations of analgesics taken in a more structured manner may provide for improved pain control.
A major component of patient satisfaction is postoperative pain control.3-8,12,16,17 Regional anesthesia is an important tool that allows patients to undergo a surgical procedure with a greatly reduced amount of opioid pain medications. In addition, regional anesthesia can provide significant pain control after the patient has left the ambulatory surgery center, but this relief is short-lived because the medication is designed to lose effectiveness over time. As the effects of regional anesthesia wear off, patients can experience “rebound pain” with severe levels of pain that, on occasion, cannot be controlled with oral analgesics alone. The addition of ketorolac provided improved pain control when compared with the other regimens during this transition period when the regional anesthesia was becoming ineffective. In addition, because patients taking ketorolac used less narcotic medication, they experienced less nausea, vomiting, and over-sedation.
Additionally, patients were instructed to record their medication usage and pain scores on a prospective basis, with the hope of eliminating recall bias. A potential weakness is the inability to show significance for pain relief and reduced narcotic usage with the addition of ketorolac, although there was a trend toward significance. Many of the patients who enrolled in the trial did not return their medication logs. While these patients had to be excluded from data analysis, we continued enrollment until we obtained an adequate number of patients in each group. In addition, in the OxyContin group (Group 3), we could only recruit 17 participants, instead of the 18 needed based on our power study. Although this has a potential to alter the significance of our results, we do not feel this had a substantial impact on our results.
Many patients in the non-ketorolac groups supplemented their medication regimens with NSAIDs, which may have falsely lowered pain scores and narcotic usage. While this confounds our study results, we do not believe that it invalidates the conclusion that ketorolac can be an effective adjunct pain medication for use in patients undergoing ambulatory hand surgery.
The study examined postoperative pain control for only 2 procedures, thumb basal joint arthroplasty and distal radius fracture fixation, both commonly performed in the outpatient setting under regional anesthesia and both typically requiring narcotic pain medication. Perhaps the utilization of these medication regimens with different surgical procedures would have differing results.
We conclude that ketorolac potentially provides patients with improved pain control over the use of narcotic pain medications alone in the setting of ambulatory hand surgery.
This paper will be judged for the Resident Writer’s Award.
- Boezaart AP, Davis G, Le-Wendling L. Recovery after orthopedic surgery: techniques to increase duration of pain control. Curr Opin Anaesthesiol. 2012;25(6):665-672. doi:10.1097/ACO.0b013e328359ab5a.
- Buvanendran A, Kroin JS. Useful adjuvants for postoperative pain management. Best Pract Res Clin Anaesthesiol. 2007;21(1):31-49. doi:10.1016/j.bpa.2006.12.003.
- Coluzzi F, Bragazzi L, Di Bussolo E, Pizza G, Mattia C. Determinants of patient satisfaction in postoperative pain management following hand ambulatory day-surgery. Minerva Med. 2011;102(3):177-186.
- Elvir-Lazo OL, White PF. Postoperative pain management after ambulatory surgery: role of multimodal analgesia. Anesthesiol Clin. 2010;28(2):217-224. doi: 10.1016/j.anclin.2010.02.011.
- Kopp SL, Horlocker TT. Regional anaesthesia in day-stay and short-stay surgery. Anaesthesia. 2010;65(Suppl 1):84-96. doi:10.1111/j.1365-2044.2009.06204.x.
- Rawal N. Postoperative pain treatment for ambulatory surgery. Best Pract Res Clin Anaesthesiol. 2007;21(1):129-148. doi:10.1016/j.bpa.2006.11.005.
- Schug SA, Chong C. Pain management after ambulatory surgery. Curr Opin Anaesthesiol. 2009;22(6):738-743. doi:10.1097/ACO.0b013e32833020f4.
- Sripada R, Bowens C Jr. Regional anesthesia procedures for shoulder and upper arm surgery upper extremity update--2005 to present. Int Anesthesiol Clin. 2012;50(1):26-46. doi:10.1097/AIA.0b013e31821a0284.
- Trompeter A, Camilleri G, Narang K, Hauf W, Venn R. Analgesia requirements after interscalene block for shoulder arthroscopy: the 5 days following surgery. Arch Orthop Trauma Surg. 2010;130(3):417-421. doi:10.1007/s00402-009-0959-9.
- Dufeu N, Marchand-Maillet F, Atchabahian A, et al. Efficacy and safety of ultrasound-guided distal blocks for analgesia without motor blockade after ambulatory hand surgery. J Hand Surg Am. 2014;39(4):737-743. doi:10.1016/j.jhsa.2014.01.011.
- Gutta R, Koehn CR, James LE. Does ketorolac have a preemptive analgesic effect? A randomized, double-blind, control study. J Oral Maxillofac Surg. 2013;71(12):2029-2034. doi:10.1016/j.joms.2013.06.220.
- Nossaman VE, Ramadhyani U, Kadowitz PJ, Nossaman BD. Advances in perioperative pain management: use of medications with dual analgesic mechanisms, tramadol & tapentadol. Anesthesiol Clin. 2010;28(4):647-666. doi:10.1016/j.anclin.2010.08.009.
- Warren-Stomberg M, Brattwall M, Jakobsson JG. Non-opioid analgesics for pain management following ambulatory surgery: a review. Minerva Anestesiol. 2013;79(9):1077-1087.
- Wickerts L, Warrén Stomberg M, Brattwall M, Jakobsson JJ. Coxibs: is there a benefit when compared to traditional non-selective NSAIDs in postoperative pain management? Minerva Anestesiol. 2011;77(11):1084-1098.
- Strom BL, Berlin JA, Kinman JL, et al. Parenteral ketorolac and risk of gastrointestinal and operative site bleeding. A postmarketing surveillance study. JAMA. 1996;275(5):376-382. doi:10.1001/jama.275.5.376.
- Hegarty M, Calder A, Davies K, et al. Does take-home analgesia improve postoperative pain after elective day case surgery? A comparison of hospital vs parent-supplied analgesia. Paediatr Anaesth. 2013;23(5):385-389. doi:10.1111/pan.12077.
- Weber SC, Jain R, Parise C. Pain scores in the management of postoperative pain in shoulder surgery. Arthroscopy. 2007;23(1):65-72. doi:10.1016/j.arthro.2006.11.002.
TAKE-HOME POINTS
- While regional anesthesia is safe and effective for patients who undergo ambulatory hand surgery, patients often experience rebound pain as it wears off.
- We tested a multimodal approach for patients who underwent thumb CMC arthroplasty or ORIF of distal radius fracture.
- Patients were provided with a journal and asked to record medication usage, a NPS, and adverse effects. Seventy-nine patients completed the study.
- We found that adding ketorolac to the postoperative pain protocol, with detailed instructions, lowered narcotic usage in the first 4 postoperative days.
- Ketorolac potentially provides patients with improved pain control over the use of narcotic pain medication alone in an ambulatory hand surgery setting.
MRSA in Dermatology Inpatients With a Vesiculobullous Disorder
Methicillin, cloxacillin, flucloxacillin, and cefoxitin are stable, penicillinase-producing β-lactam antibiotics; Staphylococcus aureus strains resistant to these agents are designated as methicillin-resistant S aureus (MRSA). Based on genotypic and phenotypic differences there are 2 strains of MRSA: hospital acquired and community acquired.
The potential for nosocomial transmission and the limited number of antibiotics available to treat MRSA are problematic. Moreover, MRSA has emerged worldwide as a major nosocomial pathogen that contributes to morbidity and mortality. Methicillin-resistant S aureus infection in vesiculobullous disorders such as pemphigus vulgaris (PV) and toxic epidermal necrolysis (TEN) is known to contribute to mortality.1
The reported prevalence of MRSA in India ranges from 12% to 38.44%.2-4 We frequently encounter MRSA in dermatology inpatients, especially those with a vesiculobullous disorder. The primary objective of this study was to determine the prevalence of MRSA in dermatology inpatients with a vesiculobullous disorder; the secondary objective was to determine if MRSA contributes to mortality.
Materials and Methods
A 1-year prospective, cross-sectional, descriptive study was conducted in a tertiary-care center. The study population included all dermatology inpatients with a vesiculobullous disorder. Patients with a vesiculobullous disorder secondary to a primary viral or bacterial disorder were excluded. Permission to conduct the study was granted by the institution’s Human Ethics Committee.
All patients underwent a detailed history and clinical examination. Routine hematology testing, urinalysis, measurement of the blood glucose level, and other investigations relevant to the vesiculobullous disorder were performed. Special investigations were Gram staining, culture, and susceptibility testing of material from a nasal swab and a swab of a representative skin lesion.
Detection of MRSA
Skin lesions were thoroughly cleaned with sterile normal saline. Specimens of pus were drawn with a sterile swab for Gram staining, culture, and susceptibility testing and were analyzed in the institution’s microbiology department. A direct colony suspension (equivalent to McFarland Standard No. 0.5) was inoculated on a Mueller-Hinton agar plate, incorporating cefoxitin, linezolid, vancomycin, amikacin, and rifampicin supplemented with sodium chloride 2% and incubated at 37°C for 24 hours. Staphylococcus aureus colonies were identified by their smooth, convex, shiny, and opaque appearance with a golden yellow pigment, as well as by coagulase positivity, mannitol fermentation, and production of phosphatase.
Methicillin-resistant S aureus was defined as an isolate having a minimum inhibitory concentration of more than 2 μg/mL of cefoxitin; a methicillin-sensitive S aureus isolate was defined as having a minimum inhibitory concentration of less than or equal to 2 μg/mL of cefoxitin. Specimens showing moderate to heavy growth of MRSA were included in the study. For specimens showing mild growth, testing was repeated; if no growth was seen on repeat testing, results were interpreted as negative.
Data were collected and analyzed for frequency and percentage; P<.05 was considered significant.
Results
The number of patients analyzed in the study period was 43. Table 1 shows their salient demographic characteristics, clinical features, and findings of the investigation. The youngest patient was aged 13 years; the oldest was aged 80 years. The male to female ratio was 0.65 to 1. The most common primary lesion was a combined vesicle and bulla (34 patients [79.1%]); the most common secondary lesion was a combination of erosion with crusting (22 patients [51.2%]).
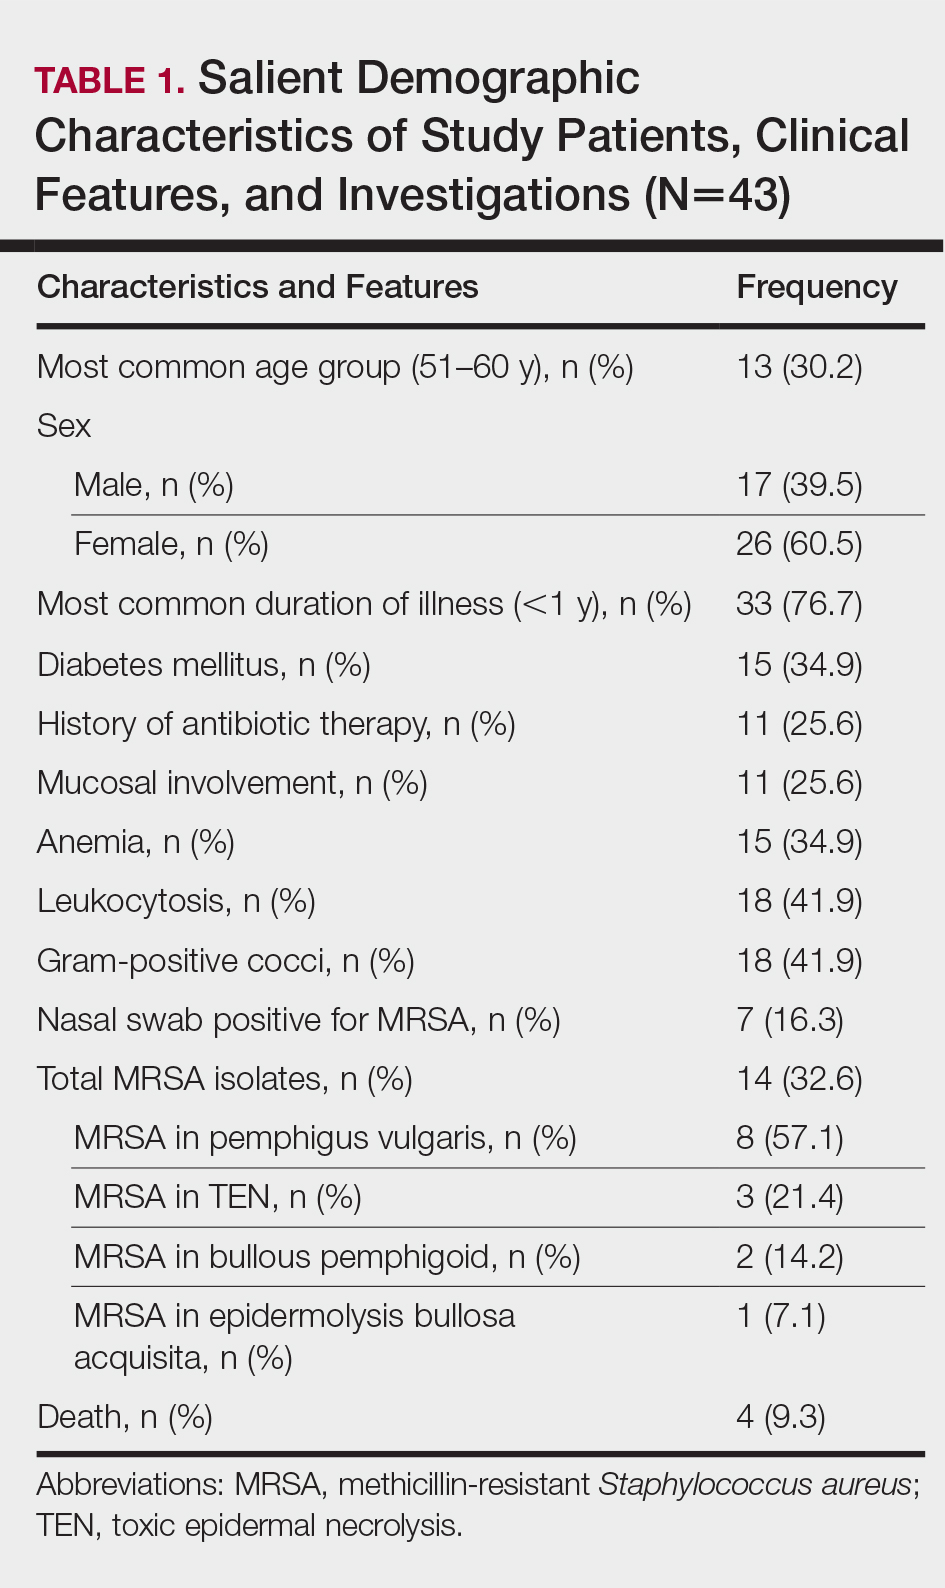
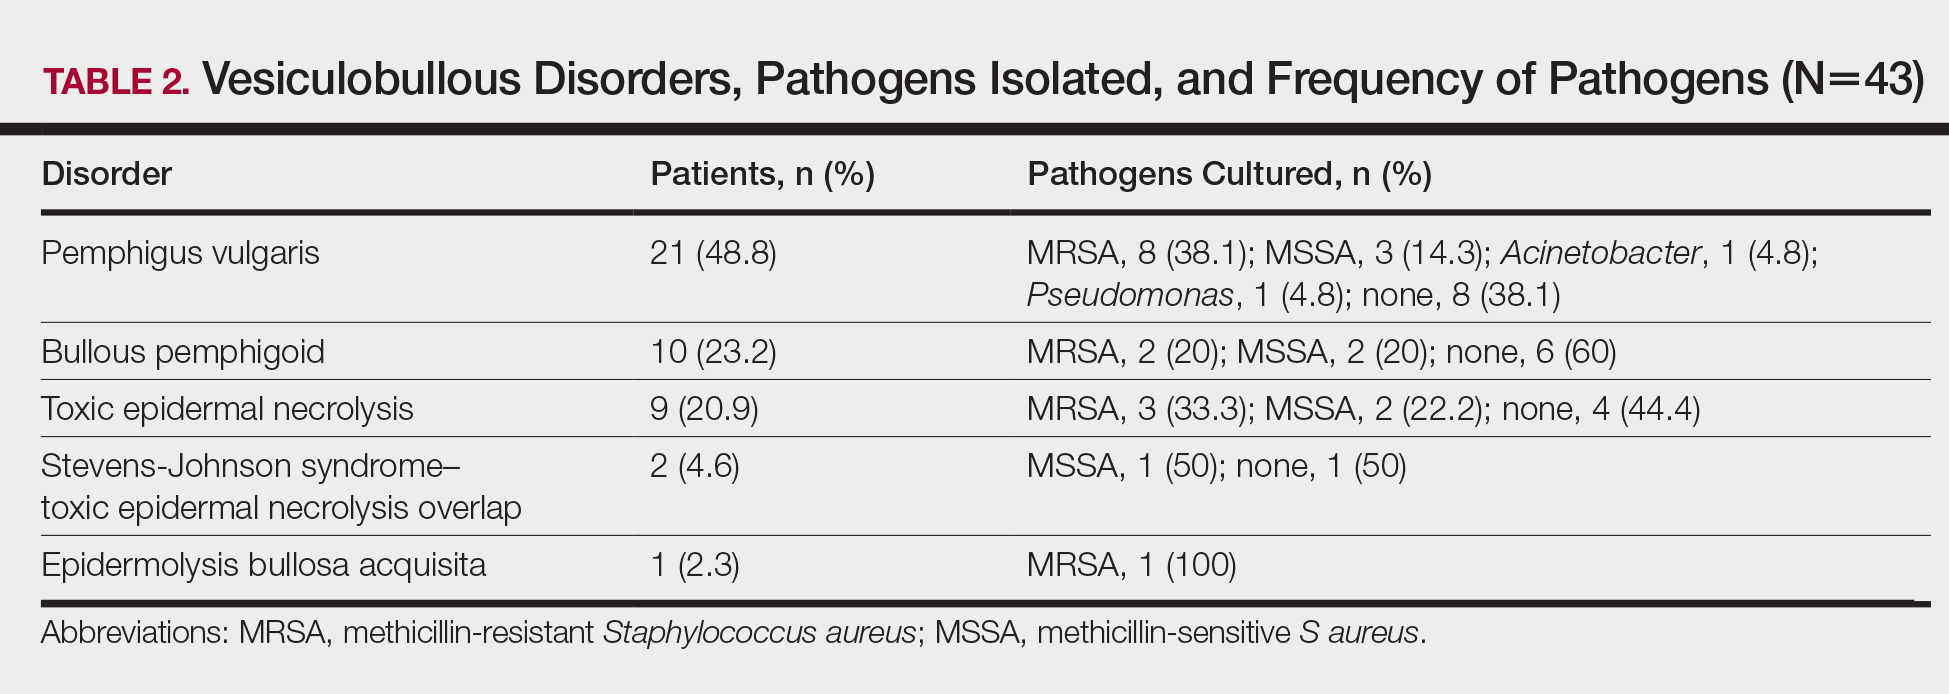
Table 2 lists the types of vesiculobullous disorders seen in this study. Pemphigus vulgaris was the most common (21 patients [48.8%])(Figure 1). Drug-induced vesiculobullous disorders (eg, TEN) were noted in 11 patients (25.6%)(Figure 2).


Table 2 also lists pathogens cultured in the study group. There were 24 bacterial isolates, of which S aureus accounted for 22 (91.7%). Methicillin-resistant S aureus was cultured in 14 patients (32.6%); culture was sterile in 19 patients (44.2%).
Among the 22 cultured staphylococcal species, MRSA accounted for 14 (63.6%) and constituted 58.3% (14/24) of all bacterial isolates. The nasal swab for MRSA was positive in 4 PV patients (9.3%), 2 TEN patients (4.6%), and 1 bullous pemphigoid patient (2.3%). Methicillin-resistant S aureus was most commonly cultured in PV patients (8/14 [57.1%]).
All MRSA strains (100%) were sensitive to vancomycin and linezolid; 34 (79.1%) were sensitive to amikacin. Additionally, 100% of MRSA strains were resistant to oxacillin, cloxacillin, and cefoxitin.
Three patients with PV (7.0%) and 1 patient with TEN (2.3%) died during the course of the study; only 1 death (2.3%) occurred in a patient who had a positive MRSA culture.
Comment
In this 1-year study, we tested and followed 43 patients with autoimmune and drug-induced vesiculobullous disorders. Vesiculobullous disorders in dermatology inpatients are a cause of great concern. When lesions rupture, they leave behind a large area of erosion that forms a nidus of bacterial colonization; often, these bacteria cause severe infection, including septicemia, and result in death.5 Moreover, autoimmune bullous disorders usually require a prolonged hospital stay and powerful immunosuppressive drugs, which contributes to bacterial infection, especially MRSA.6
The age of patients in this study ranged from 13 to 80 years; most patients were in the 6th decade, a pattern seen in studies worldwide.5 In a study by Kanwar and De,7 however, most cases were aged 20 to 40 years.7 In our study, there was a female preponderance (male to female ratio of 0.65 to 1).
Studies have shown that the duration of illness in vesiculobullous disorder is directly associated with MRSA infection. However, in our study with MRSA detected in 14 patients, most patients had a duration of illness less than 1 year (statistically insignificant [P>.05]), a finding similar to Shafi et al.8
The symptomatic nature of these diseases, their unsightly appearance, and mucous-membrane involvement of vesiculobullous disorders prompts these patients to present to the hospital early. However, a prolonged hospital stay by patients with an autoimmune vesiculobullous disorders sets the stage for MRSA colonization.
In this study, diabetes mellitus (DM) was seen in 15 patients (34.9%); 5 of them had MRSA infection (statistically insignificant [P>.05]). Diabetes mellitus contributing to sepsis and MRSA infection, which in turn contributes to morbidity and mortality, has been well-documented.2,4,9
Methicillin-resistant S aureus in this study was isolated most often from blisters and erosions. Vesiculobullous disorders and drug reactions (eg, Stevens-Johnson syndrome, TEN) are characterized by blisters that rupture to form erosions and crusting, which form fissures in the epidermal barrier function that are nidi for colonization by microbes, especially S aureus and MRSA in particular; later, these bacteria can enter dermal vessels and then the bloodstream, leading to septicemia.10
The prevalence of MRSA in this study was 32.6% (14/43), which is high compared to other studies.2-4 Pemphigus vulgaris was the most common disorder infected by MRSA in this study (57.1% [8/14] of MRSA isolates)(Table 1), a finding that reveals that the incidence of MRSA is high among staphylococcal isolates in vesiculobullous disorders. However, the high incidence of MRSA in this study could be a reflection of the number of patients with a severe and chronic vesiculobullous disorder, such as PV, and serious drug reactions such as TEN referred to our tertiary-care center, where we get a large number of patients affected by autoimmune and drug-induced vesiculobullous disorders. Similar findings have been reported by Stryjewski et al.11
A high prevalence of MRSA in a dermatology unit has grave consequences, contributing to morbidity and mortality in particular among patients with a vesiculobullous disorder. Immunosuppressive therapy and comorbidities such as DM contribute to MRSA colonization in vesiculobullous disorders.12 Overcrowding and poor sterilization techniques in public hospitals in India may contribute to the high prevalence of MRSA seen in hospital units.
Patients with a vesiculobullous disorder who are chronic nasal carriers of MRSA are at risk for cutaneous MRSA infection, which in turn can lead to MRSA septicemia and an elevated risk of death. In this study, however, a nasal swab was positive for MRSA in only 7 patients. One patient with MRSA colonization died, which was statistically insignificant (P=1).
In this study, all MRSA strains (100%) were resistant to first-line antibiotics, such as oxacillin, cloxacillin, and cefoxitin; all strains were susceptible to vancomycin and linezolid.
Conclusion
Our study shows that MRSA is becoming the prominent pathogen in nosocomial infections, especially in bedridden patients, which has grave implications. The use of a prophylactic S aureus conjugate vaccine in patients with a chronic vesiculobullous disorder might be justified in the future.15 We found a high prevalence (32.6%) of MRSA in vesiculobullous disorders, no relationship between DM and MRSA colonization, PV was the most common disorder complicated by MRSA, no relationship between nasal colonization and MRSA infection, no relationship between death during the study period and MRSA infection, 100% of MRSA strains were susceptible to vancomycin and linezolid, and 79.1% of MRSA strains were susceptible to amikacin.
- Nair SP. A retrospective study of mortality of pemphigus patients in a tertiary care hospital. Indian J Dermatol Venereol Leprol. 2013;79:706-709.
- Sachdev D, Amladi S, Natarj G, et al. An outbreak of methicillin-resistant Staphylococcus aureus (MRSA) infection in dermatology inpatients. Indian J Dermatol Venereol Leprol. 2003;69:377-380.
- Vijayamohan N, Nair SP. A study of the prevalence of methicillin-resistant Staphylococcus aureus in dermatology inpatients. Indian Dermatol Online J. 2014;5:441-445.
- Malhotra SK, Malhotra S, Dhaliwal GS, et al. Bacterial study of pyodermas in a tertiary care dermatological center. Indian J Dermatol. 2012;57:358-361.
- Valencia IC, Kirsner RS, Kerdel FA. Microbiological evaluation of skin wounds: alarming trends towards antibiotic resistance in an inpatient dermatology service during a 10-year period. J Am Acad Dermatol. 2004;50:845-849.
- Lehman JS, Murell DF, Camilleri MJ, et al. Infection and infection prevention in patients treated with immunosuppressive medications for autoimmune bullous disorders. Dermatol Clin. 2011;29:591-598.
- Kanwar AJ, De D. Pemphigus in India. Indian J Dermatol Venereol Leprol. 2011;77:439-449.
- Shafi M, Khatri ML, Mashima M, et al. Pemphigus: a clinical study of 109 cases from Tripoli, Libya. Indian J Dermatol Venereol Leprol. 1994;60:140-143.
- Torres K, Sampathkumar P. Predictors of methicillin-resistant Staphylococcus aureus colonization at hospital admission. Am J Infect Control. 2013;41:1043-1047.
- Miller LG, Quan C, Shay A, et al. A prospective investigation of outcomes after hospital discharge for endemic, community-acquired methicillin-resistant Staphylococcus aureus skin infection. Clin Infect Dis. 2007;44:483-492.
- Stryjewski M, Chambers HF. Skin and soft-tissue infections caused by community-acquired methicillin-resistant Staphylococcus aureus. Clin Infect Dis. 2008;46(suppl 5):S368-S377.
- Mutasim DF. Management of autoimmune bullous diseases: pharmacology and therapeutics. J Am Acad Dermatol. 2004;51:859-877.
- Cohen PR. Community-acquired methicillin-resistant Staphylococcus aureus skin infections: a review of epidemiology, clinical features, management, and prevention. Int J Dermatol. 2007;46:1-11.
- Elston DM. Methicillin-sensitive and methicillin-resistant Staphylococcus aureus: management principles and selection of antibiotic therapy. Dermatol Clin. 2007;25:157-164.
- Shinefield H, Black S, Fattom A, et al. Use of a Staphylococcus aureus conjugate vaccine in patients receiving hemodialysis. N Engl J Med. 2001;346:491-496.
Methicillin, cloxacillin, flucloxacillin, and cefoxitin are stable, penicillinase-producing β-lactam antibiotics; Staphylococcus aureus strains resistant to these agents are designated as methicillin-resistant S aureus (MRSA). Based on genotypic and phenotypic differences there are 2 strains of MRSA: hospital acquired and community acquired.
The potential for nosocomial transmission and the limited number of antibiotics available to treat MRSA are problematic. Moreover, MRSA has emerged worldwide as a major nosocomial pathogen that contributes to morbidity and mortality. Methicillin-resistant S aureus infection in vesiculobullous disorders such as pemphigus vulgaris (PV) and toxic epidermal necrolysis (TEN) is known to contribute to mortality.1
The reported prevalence of MRSA in India ranges from 12% to 38.44%.2-4 We frequently encounter MRSA in dermatology inpatients, especially those with a vesiculobullous disorder. The primary objective of this study was to determine the prevalence of MRSA in dermatology inpatients with a vesiculobullous disorder; the secondary objective was to determine if MRSA contributes to mortality.
Materials and Methods
A 1-year prospective, cross-sectional, descriptive study was conducted in a tertiary-care center. The study population included all dermatology inpatients with a vesiculobullous disorder. Patients with a vesiculobullous disorder secondary to a primary viral or bacterial disorder were excluded. Permission to conduct the study was granted by the institution’s Human Ethics Committee.
All patients underwent a detailed history and clinical examination. Routine hematology testing, urinalysis, measurement of the blood glucose level, and other investigations relevant to the vesiculobullous disorder were performed. Special investigations were Gram staining, culture, and susceptibility testing of material from a nasal swab and a swab of a representative skin lesion.
Detection of MRSA
Skin lesions were thoroughly cleaned with sterile normal saline. Specimens of pus were drawn with a sterile swab for Gram staining, culture, and susceptibility testing and were analyzed in the institution’s microbiology department. A direct colony suspension (equivalent to McFarland Standard No. 0.5) was inoculated on a Mueller-Hinton agar plate, incorporating cefoxitin, linezolid, vancomycin, amikacin, and rifampicin supplemented with sodium chloride 2% and incubated at 37°C for 24 hours. Staphylococcus aureus colonies were identified by their smooth, convex, shiny, and opaque appearance with a golden yellow pigment, as well as by coagulase positivity, mannitol fermentation, and production of phosphatase.
Methicillin-resistant S aureus was defined as an isolate having a minimum inhibitory concentration of more than 2 μg/mL of cefoxitin; a methicillin-sensitive S aureus isolate was defined as having a minimum inhibitory concentration of less than or equal to 2 μg/mL of cefoxitin. Specimens showing moderate to heavy growth of MRSA were included in the study. For specimens showing mild growth, testing was repeated; if no growth was seen on repeat testing, results were interpreted as negative.
Data were collected and analyzed for frequency and percentage; P<.05 was considered significant.
Results
The number of patients analyzed in the study period was 43. Table 1 shows their salient demographic characteristics, clinical features, and findings of the investigation. The youngest patient was aged 13 years; the oldest was aged 80 years. The male to female ratio was 0.65 to 1. The most common primary lesion was a combined vesicle and bulla (34 patients [79.1%]); the most common secondary lesion was a combination of erosion with crusting (22 patients [51.2%]).
Table 2 lists the types of vesiculobullous disorders seen in this study. Pemphigus vulgaris was the most common (21 patients [48.8%])(Figure 1). Drug-induced vesiculobullous disorders (eg, TEN) were noted in 11 patients (25.6%)(Figure 2).
Table 2 also lists pathogens cultured in the study group. There were 24 bacterial isolates, of which S aureus accounted for 22 (91.7%). Methicillin-resistant S aureus was cultured in 14 patients (32.6%); culture was sterile in 19 patients (44.2%).
Among the 22 cultured staphylococcal species, MRSA accounted for 14 (63.6%) and constituted 58.3% (14/24) of all bacterial isolates. The nasal swab for MRSA was positive in 4 PV patients (9.3%), 2 TEN patients (4.6%), and 1 bullous pemphigoid patient (2.3%). Methicillin-resistant S aureus was most commonly cultured in PV patients (8/14 [57.1%]).
All MRSA strains (100%) were sensitive to vancomycin and linezolid; 34 (79.1%) were sensitive to amikacin. Additionally, 100% of MRSA strains were resistant to oxacillin, cloxacillin, and cefoxitin.
Three patients with PV (7.0%) and 1 patient with TEN (2.3%) died during the course of the study; only 1 death (2.3%) occurred in a patient who had a positive MRSA culture.
Comment
In this 1-year study, we tested and followed 43 patients with autoimmune and drug-induced vesiculobullous disorders. Vesiculobullous disorders in dermatology inpatients are a cause of great concern. When lesions rupture, they leave behind a large area of erosion that forms a nidus of bacterial colonization; often, these bacteria cause severe infection, including septicemia, and result in death.5 Moreover, autoimmune bullous disorders usually require a prolonged hospital stay and powerful immunosuppressive drugs, which contributes to bacterial infection, especially MRSA.6
The age of patients in this study ranged from 13 to 80 years; most patients were in the 6th decade, a pattern seen in studies worldwide.5 In a study by Kanwar and De,7 however, most cases were aged 20 to 40 years.7 In our study, there was a female preponderance (male to female ratio of 0.65 to 1).
Studies have shown that the duration of illness in vesiculobullous disorder is directly associated with MRSA infection. However, in our study with MRSA detected in 14 patients, most patients had a duration of illness less than 1 year (statistically insignificant [P>.05]), a finding similar to Shafi et al.8
The symptomatic nature of these diseases, their unsightly appearance, and mucous-membrane involvement of vesiculobullous disorders prompts these patients to present to the hospital early. However, a prolonged hospital stay by patients with an autoimmune vesiculobullous disorders sets the stage for MRSA colonization.
In this study, diabetes mellitus (DM) was seen in 15 patients (34.9%); 5 of them had MRSA infection (statistically insignificant [P>.05]). Diabetes mellitus contributing to sepsis and MRSA infection, which in turn contributes to morbidity and mortality, has been well-documented.2,4,9
Methicillin-resistant S aureus in this study was isolated most often from blisters and erosions. Vesiculobullous disorders and drug reactions (eg, Stevens-Johnson syndrome, TEN) are characterized by blisters that rupture to form erosions and crusting, which form fissures in the epidermal barrier function that are nidi for colonization by microbes, especially S aureus and MRSA in particular; later, these bacteria can enter dermal vessels and then the bloodstream, leading to septicemia.10
The prevalence of MRSA in this study was 32.6% (14/43), which is high compared to other studies.2-4 Pemphigus vulgaris was the most common disorder infected by MRSA in this study (57.1% [8/14] of MRSA isolates)(Table 1), a finding that reveals that the incidence of MRSA is high among staphylococcal isolates in vesiculobullous disorders. However, the high incidence of MRSA in this study could be a reflection of the number of patients with a severe and chronic vesiculobullous disorder, such as PV, and serious drug reactions such as TEN referred to our tertiary-care center, where we get a large number of patients affected by autoimmune and drug-induced vesiculobullous disorders. Similar findings have been reported by Stryjewski et al.11
A high prevalence of MRSA in a dermatology unit has grave consequences, contributing to morbidity and mortality in particular among patients with a vesiculobullous disorder. Immunosuppressive therapy and comorbidities such as DM contribute to MRSA colonization in vesiculobullous disorders.12 Overcrowding and poor sterilization techniques in public hospitals in India may contribute to the high prevalence of MRSA seen in hospital units.
Patients with a vesiculobullous disorder who are chronic nasal carriers of MRSA are at risk for cutaneous MRSA infection, which in turn can lead to MRSA septicemia and an elevated risk of death. In this study, however, a nasal swab was positive for MRSA in only 7 patients. One patient with MRSA colonization died, which was statistically insignificant (P=1).
In this study, all MRSA strains (100%) were resistant to first-line antibiotics, such as oxacillin, cloxacillin, and cefoxitin; all strains were susceptible to vancomycin and linezolid.
Conclusion
Our study shows that MRSA is becoming the prominent pathogen in nosocomial infections, especially in bedridden patients, which has grave implications. The use of a prophylactic S aureus conjugate vaccine in patients with a chronic vesiculobullous disorder might be justified in the future.15 We found a high prevalence (32.6%) of MRSA in vesiculobullous disorders, no relationship between DM and MRSA colonization, PV was the most common disorder complicated by MRSA, no relationship between nasal colonization and MRSA infection, no relationship between death during the study period and MRSA infection, 100% of MRSA strains were susceptible to vancomycin and linezolid, and 79.1% of MRSA strains were susceptible to amikacin.
- Nair SP. A retrospective study of mortality of pemphigus patients in a tertiary care hospital. Indian J Dermatol Venereol Leprol. 2013;79:706-709.
- Sachdev D, Amladi S, Natarj G, et al. An outbreak of methicillin-resistant Staphylococcus aureus (MRSA) infection in dermatology inpatients. Indian J Dermatol Venereol Leprol. 2003;69:377-380.
- Vijayamohan N, Nair SP. A study of the prevalence of methicillin-resistant Staphylococcus aureus in dermatology inpatients. Indian Dermatol Online J. 2014;5:441-445.
- Malhotra SK, Malhotra S, Dhaliwal GS, et al. Bacterial study of pyodermas in a tertiary care dermatological center. Indian J Dermatol. 2012;57:358-361.
- Valencia IC, Kirsner RS, Kerdel FA. Microbiological evaluation of skin wounds: alarming trends towards antibiotic resistance in an inpatient dermatology service during a 10-year period. J Am Acad Dermatol. 2004;50:845-849.
- Lehman JS, Murell DF, Camilleri MJ, et al. Infection and infection prevention in patients treated with immunosuppressive medications for autoimmune bullous disorders. Dermatol Clin. 2011;29:591-598.
- Kanwar AJ, De D. Pemphigus in India. Indian J Dermatol Venereol Leprol. 2011;77:439-449.
- Shafi M, Khatri ML, Mashima M, et al. Pemphigus: a clinical study of 109 cases from Tripoli, Libya. Indian J Dermatol Venereol Leprol. 1994;60:140-143.
- Torres K, Sampathkumar P. Predictors of methicillin-resistant Staphylococcus aureus colonization at hospital admission. Am J Infect Control. 2013;41:1043-1047.
- Miller LG, Quan C, Shay A, et al. A prospective investigation of outcomes after hospital discharge for endemic, community-acquired methicillin-resistant Staphylococcus aureus skin infection. Clin Infect Dis. 2007;44:483-492.
- Stryjewski M, Chambers HF. Skin and soft-tissue infections caused by community-acquired methicillin-resistant Staphylococcus aureus. Clin Infect Dis. 2008;46(suppl 5):S368-S377.
- Mutasim DF. Management of autoimmune bullous diseases: pharmacology and therapeutics. J Am Acad Dermatol. 2004;51:859-877.
- Cohen PR. Community-acquired methicillin-resistant Staphylococcus aureus skin infections: a review of epidemiology, clinical features, management, and prevention. Int J Dermatol. 2007;46:1-11.
- Elston DM. Methicillin-sensitive and methicillin-resistant Staphylococcus aureus: management principles and selection of antibiotic therapy. Dermatol Clin. 2007;25:157-164.
- Shinefield H, Black S, Fattom A, et al. Use of a Staphylococcus aureus conjugate vaccine in patients receiving hemodialysis. N Engl J Med. 2001;346:491-496.
Practice Points
- Methicillin-resistant Staphylococcus aureus (MRSA) infection in vesiculobullous disorders such as pemphigus vulgaris and toxic epidermal necrolysis is known to contribute to an increase in disease-related mortality.
- Methicillin-resistant S aureus is becoming the prominent pathogen in nosocomial infections, especially in bedridden patients.
- The prevalence of MRSA in vesiculobullous disorders is high; pemphigus vulgaris is the most common vesiculobullous disorder complicated by MRSA.
- Early diagnosis of MRSA helps reduce morbidity and mortality and improves the patient’s prognosis.
Impact of Sagittal Rotation on Axial Glenoid Width Measurement in the Setting of Glenoid Bone Loss
ABSTRACT
Standard 2-dimensional (2-D) computed tomography (CT) scans of the shoulder are often aligned to the plane of the body as opposed to the plane of the scapula, which may challenge the ability to accurately measure glenoid width and glenoid bone loss (GBL). The purpose of this study is to determine the effect of sagittal rotation of the glenoid on axial anterior-posterior (AP) glenoid width measurements in the setting of anterior GBL.
Forty-three CT scans from consecutive patients with anterior GBL (minimum 10%) were reformatted utilizing open-source DICOM software (OsiriX MD). Patients were grouped according to extent of GBL: I, 10% to 14.9% (N = 12); II, 15% to 19.9% (N = 16); and III, >20% (N = 15). The uncorrected (UNCORR) and corrected (CORR) images were assessed in the axial plane at 5 standardized cuts and measured for AP glenoid width.
For groups I and III, UNCORR scans underestimated axial AP width (and thus overestimated anterior GBL) in cuts 1 and 2, while in cuts 3 to 5, the axial AP width was overestimated (GBL was underestimated). In Group II, axial AP width was underestimated (GBL was overestimated), while in cuts 2 to 5, the axial AP width was overestimated (GBL was underestimated). Overall, AP glenoid width was consistently underestimated in cut 1, the most caudal cut; while AP glenoid width was consistently overestimated in cuts 3 to 5, the more cephalad cuts.
UNCORR 2-D CT scans inaccurately estimated glenoid width and the degree of anterior GBL. This data suggests that corrected 2D CT scans or a 3-dimensional (3-D) reconstruction can help in accurately defining the anterior GBL in patients with shoulder instability.
The treatment of glenohumeral instability has substantially evolved over the past several decades. The understanding of glenoid bone loss (GBL), in particular, has advanced to such a level that we utilize the quantification of GBL for surgical decision-making. Unrecognized and/or untreated GBL is associated with recurrent instability, pain, and disability. Controversy exists, however, regarding the precise amount of anterior GBL that is significant enough to warrant surgical treatment. While historically, 25%1,2 of anterior GBL was thought to be the critical number required to warrant osseous augmentation, studies that are more recent have highlighted the need to perform osseous glenoid reconstruction with lesser degrees of GBL, particularly in the contact athlete.3-9 As small differences in the amount of GBL can change surgical decision-making from an all-soft tissue repair to an osseous reconstruction, it is paramount that we have accurate, valid, and reproducible methods for calculating GBL.
Continue to: Historically, plain radiographs...
Historically, plain radiographs have been the mainstay for evaluating the glenohumeral joint, including Grashey and axillary views, allowing clinicians to evaluate the congruency of the glenohumeral joint and to assess bone loss on both the glenoid and humeral head.1,10 While large, acute fractures of the glenoid are fairly evident on radiographs, including the Grashey view,11 shoulders with chronic and/or attritional anterior GBL are more difficult to evaluate, and often do not provide the information necessary to guide surgical decision-making.
Computed tomography (CT) of the shoulder has become the most commonly utilized imaging modality in the evaluation of patients with shoulder instability associated with GBL. Standard 2-dimensional (2-D) CT scans of the shoulder are often aligned to the plane of the body as opposed to the plane of the scapula/glenoid, as standard protocols often fail to account for the anterior sagittal rotation of the scapula/glenoid, similar to the disadvantage of standard radiographs. While 3-dimensional (3-D) CT reconstructions eliminate the effect of gantry angles, and thus allow for an en face view of the glenoid, 3-D reconstructions are not always available, and cannot always be measured.12-14 Thus, improved methodology for utilizing standard 2D scans is warranted, as the ability to correctly align the axial CT scan to the axis of the glenoid may allow for more accurate GBL measurements, which will ultimately impact surgical decision-making. Recently, Gross and colleagues15 reported the effect of sagittal rotation of the glenoid on axial measurements of anterior-posterior (AP) glenoid width and glenoid version in normal glenoids, without bone loss, and found that the mean angle of correction needed to align the sagittal plane was 20.1° ± 1.2° of rotation. To the authors’ knowledge, this same methodology has not been applied to patients with clinically meaningful anterior GBL. Given that the average glenoid width in human shoulders is 24.4 mm ± 2.9 mm,16 1 mm of glenoid bone loss (GBL) corresponds to approximately 4% of the glenoid width, and thus even subtle differences in the interpretation of GBL may have substantial clinical implications. Therefore, the purpose of this study is to determine the effect of sagittal rotation of the glenoid on axial AP glenoid width measurements in the setting of clinically significant anterior GBL.
METHODS
This study was approved by Massachusetts General Hospital Institutional Review Board. A retrospective review of consecutive patients with a diagnosis of anterior shoulder instability between 2009 and 2013 was conducted. Inclusion criteria comprised patients with a minimum of 10% anterior GBL, an available CT scan of the affected shoulder, and no history of prior ipsilateral surgeries. Exclusion criteria comprised evidence of degenerative changes to the glenoid and/or humeral head, as well as prior ipsilateral shoulder surgery. Sixty consecutive patients were originally identified as having anterior shoulder instability, and 17 were excluded based on the inclusion/exclusion criteria, leaving 43 patients (43 shoulders) available for inclusion. Shoulder CT scans from all 43 patients were reformatted utilizing open-source DICOM software (OsiriX MD, version 2.5.1 65-bit) multi-planar reconstruction (MPR).
CT PROTOCOL
All patients underwent a standard glenohumeral CT scan using a Siemens Sensation 64 Scanner (Siemens), a 64-detector scanner. Scans were acquired with 0.6 mm of collimation, 140 kV, and 300 mA-seconds. Slice thickness was set to 2 mm. All patient information was de-identified for analysis.
The uncorrected (UNCORR) scans were defined as the default orientation on the scanner. In the UNCORR scans, the axial, coronal, and sagittal views were oriented relative to the scanner gantry table, as opposed to the anatomy of the glenoid. The corrected (CORR) CT scans were aligned in all 3 planes relative to the glenoid face, and thus the cuts were perpendicular to the long axis of the glenoid.15 This resulted in sagittal cuts perpendicular to the 12-o’clock to 6-o’clock axis in the sagittal plane (Figure 1). 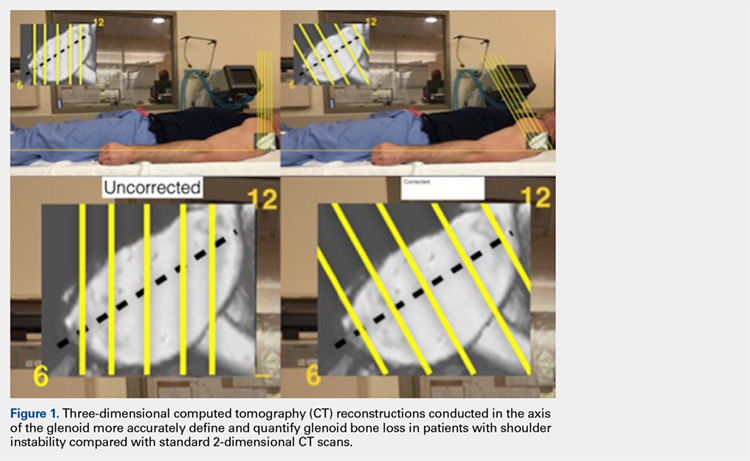
Continue to: In a de-identified fashion...
IMAGE ANALYSIS AND REFORMATTING
In a de-identified fashion, all CT scans were imported and analyzed using open-source Digital Imaging and Communications in Medicine (DICOM) software (OsiriX MD, version 2.5.1 64-bit). By following a previously developed method, CT scans were reformatted using OsiriX MPR. The OsiriX software has an MPR function that allows simultaneous manipulation of 2-D CT scans in 3 orthogonal planes: axial, sagittal, and coronal. In the MPR mode, the alternation of 1 plane directly affects the orientation of the remaining 2 planes. Thus, by using an MPR, one can analyze the impact that a default CT scan performed relative to the gantry of the table, UNCORR, has on the axial images.
First, the en face view was obtained via a 2-step process: alignment of the axial plane to account for the scapular angle, followed by alignment of the coronal plane to adjust for the glenoid inclination.15 These 2 adjustments provided a true en face sagittal glenoid view. The final adjustment step was a sagittal en face rotation of the glenoid such that the superior and inferior glenoid tubercles were placed on the 12-o’clock to 6-o’clock axis (CORR scan). Previous studies have identified a central longitudinal axis that was used in this method to align the supraglenoid tubercle with the 12-o’clock to 6-o’clock axis on the glenoid face.15,17,18 The standard error of mean was 1.21°. This new CORR view resulted in axial cuts through the glenoid that were oriented perpendicular to the 12-o’clock to 6-o’clock axis. The UNCORR and CORR images were assessed in the axial plane at 5 standardized cuts and measured for AP glenoid width by 2 independent observers in a blinded, randomized fashion. When the measured AP width of the UNCORR scan was less than that measured on the CORR scan, the AP width of the glenoid was considered underestimated, and the degree of GBL was considered overestimated (Figure 2). 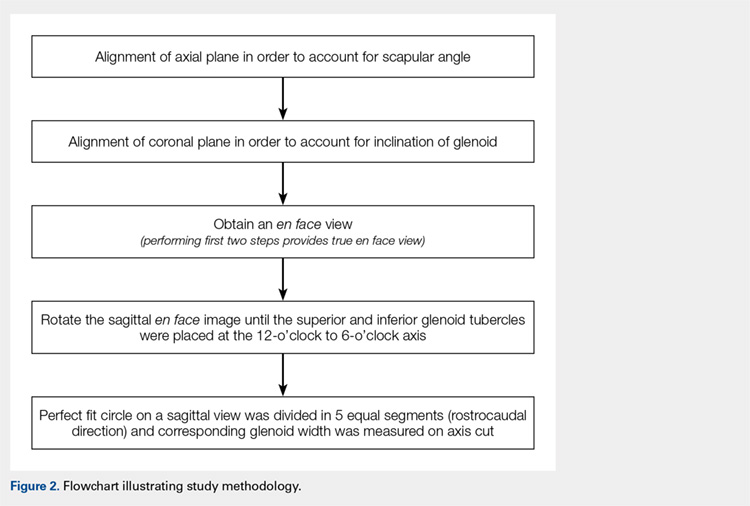
SCAPULAR ANGLE
Scapular angle measurements were performed on the axial view as the angle between a line through the long axis of the body of the scapula, and a line parallel to the CT gantry table.15,19 Subsequently, the axial plane was aligned to the glenoid surface.
CORONAL INCLINATION
Coronal inclination measurements were performed on the sagittal view as the angle between a line tangential to the face of the glenoid and a line perpendicular to the CT gantry table. Positive values represented superior inclination, while negative values represented inferior glenoid inclination.15
SAGITTAL ROTATION
Sagittal rotation measurements were performed using the built-in angle measurement tool in OsiriX in the sagittal plane since the degree of rotation required aligning the long axis of the glenoid to the 12-o’clock to 6-o’clock axis. The amount of rotation was defined as the rotation angle.15
Continue to: Similarly, as described by Gross...
GLENOID WIDTH
Similarly, as described by Gross and colleagues,15 the sagittal en face view was divided via 5 cuts, throughout a superimposed best-fit circle that closely represents the glenoid.9,15,20 For both the UNCORR and CORR, glenoid width (AP distance) was measured on the axial image at the widest point from AP cortex across the glenoid face.
PATIENT GROUPS
Utilizing the en face 3-D CT reconstruction view of the glenoid as the gold standard, patients were placed into 1 of 3 groups according to the degree of anterior GBL measured via the surface method.9,20 The groups were as follows:
I. 10% to 14.9% (N = 12)
II. 15% to 19.9% (N = 16)
III. >20% (N = 15)
STATISTICAL METHODS
Paired t-tests were used to compare all measurements between CORR and UNCORR scans for each of the 5 cuts. A P-value of .05 was used as the threshold for statistical significance in 2-tailed comparisons. Mean and standard errors are presented with standard deviations throughout the study. For interobserver reliability, the measurements between the observers, the intraclass correlation coefficient was calculated. All statistics were performed with SPSS (Version 22).
RESULTS
The study cohort was comprised of 19 left shoulders (44%) and 24 right shoulders (56%), including 36 male patients (84%) and 7 female patients (16%). The average age was 27.8 years (range, 21-40 years). The variability in measured difference, with respect to AP width, was 1.05 mm. The UNCORR CT scans required a mean correction for coronal inclination of 7.0° ± 5.8° (range, -8°-6°). The UNCORR CT scans required a mean correction for scapular angle of 30.2° ± 8.0° (range, 15°-49°). The mean angle of sagittal rotation required to align the glenoid face with the 12-o’clock to 6-o’clock axis was 24.2° ± 5.1 ° (range, 13°-30°). These results are summarized in Table 1.
Table 1. Mean Correction Values Required to Correct the Uncorrected Images to the Corrected Images | |||
Anatomic alignment | Mean (degrees) | Range (degrees) | SD (degrees) |
Scapular angle | 30.2 | 15-49 | 8.0 |
Coronal Inclination | 7.0 | -8-6 | 5.8 |
Sagittal rotation | 24.2 | 13-30 | 5.1 |
For all measurements, the intraclass correlation coefficient for independent observers for all cuts within the 3 groups was r >.900 in all cases.
On an optimized CT scan, over 5 standardized cuts across a best-fit circle of the inferior glenoid, there was a statistically significant absolute mean difference of 12.6% in axial AP glenoid width (2.86 mm ± 2.00 mm, P =.016) when compared with the UNCORR scan. This corresponds to a 3% to 21% error in measurement of the AP width of the glenoid.
Continue to: For the entire cohort...
For the entire cohort of 43 patients, the UNCORR scans underestimated the axial AP width (and thus overestimated GBL) in cut 1 (P =.003), and overestimated the axial AP width (and thus underestimated GBL) in cuts 3 to 5 (P < .001 for all) compared with that of the CORR scans. There was no significant difference between the UNCORR and CORR scans in cut 2 (P = .331).
For groups I (10%-14.9% GBL) and III (>20% GBL), the UNCORR scans underestimated the axial AP width (and thus overestimated anterior GBL) in cuts 1 and 2, while in cuts 3 to 5, the axial AP width was overestimated (GBL was underestimated) (Tables 2, 3). In Group II (15%-19.9% GBL), the axial AP width was underestimated (GBL was overestimated), while in cuts 2 to 5, the axial AP width was overestimated (GBL was underestimated). Overall, AP glenoid width was consistently underestimated in cut 1, the most caudal cut, while AP glenoid width was consistently overestimated in cuts 3 to 5, the more cephalad cuts.
Table 2. Absolute Mean Difference in Axial AP Width (mm) Between Corrected and Uncorrected Images (% difference) | |||||
Cut 1 (Caudal) | Cut 2 | Cut 3 (Center) | Cut 4 | Cut 5 (Cephalad) | |
Group I: 10%-14.9% GBL | 2.4 mm (15.3%) | 1.8 mm (9.0%) | 1.8 mm (7.7%) | 3.0 mm (11.7%) | 4.0 mm (16.8%) |
Group II: 15%-19.9% GBL | 1.8 mm (13.1%) | 1.7 mm (7.9%) | 2.8 mm (10.6%) | 4.1 mm (14.4%) | 4.8 mm (16.9%) |
Group III: >20% | 2.8 mm (16.1%) | 1.9 mm (8.0%) | 2.3 mm (10.3) | 4.4 mm (16.6%) | 5.2 mm (17.0%) |
Abbreviations: AP, anterior-posterior; GBL, glenoid bone loss.
Table 3. Mean AP Glenoid Width Based on CORR and UNCORR Images for the Entire Cohort of 43 Patients | |||||
Axial cut | Mean AP width (mm) | Mean AP width (mm) | Absolute mean AP width difference (mm) | Absolute mean AP width difference (%) | P value |
(Caudal) 1 | 16.6208 | 18.4958 | -1.875 | 14.7768 | .0029565 |
2 | 20.6558 | 21.3166 | -0.661 | 3.6137 | .3310965 |
3 | 24.2583 | 22.3125 | 1.946 | 7.8042 | <.0001 |
4 | 26.1291 | 21.8916 | 4.238 | 15.8449 | <.0001 |
(Rostral) 5 | 26.0875 | 20.4875 | 5.6 | 20.9717 | <.0001 |
Abbreviations: AP, anterior-posterior; CORR, corrected; UNCORR, uncorrected.
DISCUSSION
The principle findings of this study demonstrate that UNCORR conventional 2-D CT scans inaccurately estimate glenoid width as well as inaccurately quantify the degree of anterior GBL. Underestimations of GBL may lead to insufficient treatment of clinically meaningful GBL, thereby increasing the risk of instability recurrence; whereas overestimations of GBL may lead to unnecessary treatment, subjecting patients to increased surgical morbidity. Therefore, the authors recommend correcting the orientation of the scapula in cases wherein clinical decisions are entirely based on 2-D CT, or using alternative methods for quantifying GBL, specifically in the form of 3-D reconstructions.
The use of axial imaging, with CT scans and/or magnetic resonance imaging, is growing in popularity for evaluation of both glenoid anatomy and GBL. Nevertheless, despite our improved ability to critically evaluate the glenoid using these advanced imaging modalities, the images themselves require scrutiny by clinicians to determine if the images accurately depict the true anatomy of the glenoid. As demonstrated by Gross and colleagues,15 conventional 2D CT scan protocols are not optimized to the anatomy of the glenohumeral joint, even in patients without GBL. Due to the alignment of the image relative to the plane of the scapula as opposed to the plane of the glenoid, UNCORR scans result in significantly different measurements of glenoid version (2.0° ± 0.1°) and AP glenoid width (1.2 mm ± 0.42 mm) compared with corrected scans, requiring an average 20.1° ± 1.2° of correction to align the sagittal plane. In the present study involving the patients with GBL, we also found that conventional, UNCORR 2-D CT scan protocols inaccurately estimate glenoid width and the degree of anterior GBL. In particular, AP glenoid width was consistently underestimated in the more caudal cuts, while AP glenoid width was consistently overestimated in the more cephalad cuts. Thus, anterior GBL was overestimated (AP glenoid width was underestimated) in the more caudal cuts, whereas anterior GBL was underestimated in the more cranial cuts (AP glenoid width was overestimated). Given that approximately 1 mm of glenoid bone corresponds to approximately 4% of glenoid width,16 even subtle differences in the interpretation of GBL may lead to gross overestimation/underestimation of bone loss, with significant clinical implications.
In the anterior instability patient population, clinical decision-making is often based on the degree of GBL as determined by advanced imaging modalities. In addition to other patient-specific factors, including age, gender, activity level, type of sport, and number of prior dislocations and/or prior surgeries, the quantity of GBL will often determine which surgical procedure needs to be performed. Typically, patients with >20% to 25% anterior GBL are indicated for a glenoid reconstruction procedure, most commonly via the Latarjet procedure (coracoid transfer).21-27 The Latarjet procedure remains an excellent technique for appropriately indicated patients, with historically good clinical outcomes and low recurrence rates. Complications associated with the Latarjet procedure, however, are not uncommon, including devastating neuropraxia of the axillary and musculocutaneous nerves, and occasionally permanent neurologic deficits.28 Thus, it is critical to avoid overtreating patients with recurrent instability and GBL. As demonstrated by this study, depending on the cranial-to-caudal location on the glenoid, current 2-D CT techniques may underestimate AP glenoid width, resulting in an overestimation of GBL, potentially leading to the decision to proceed with glenoid bone reconstruction when such a procedure is not required. On the contrary, overestimation of AP glenoid width, which occurs in the more cephalad cuts of the glenoid, is perhaps more worrisome, as the resulting underestimation of GBL may lead to inadequate treatment of patients with recurrent instability. Certainly, one of the main risk factors for failed soft tissue shoulder stabilization is a failure to address GBL. If clinical decisions are made based on UNCORR 2-D CT scans, which are often inaccurate with respect to AP glenoid width by an average 2.86 mm ± 2.00 mm (equivalent to 12.6% ± 6.9% GBL) as determined in this study, patients who truly require osseous glenoid reconstructions may be indicated for only soft tissue stabilization, based on the underestimation of GBL.
Continue to: The current gold standard...
The current gold standard for GBL measurement is a perfect-fit circle performed on a 3-D CT scan.22 To that end, it would have been useful to measure the glenoids from this study on 3-D CT scans and compare the data with both UNCORR and CORR measurements. This would have provided a better understanding to what extent the CORR measurements on 2-D scans are relatable with the gold standard. As 3-D CT scans provide a better en face view of the glenoid, more accurate GBL measurements, and ease of 3-D manipulation, they have become more widely used across the country.29,30 Nevertheless, in situations where 3-D imaging is more challenging to obtain because of technology or cost limitations, having a strategy for ensuring proper orientation of 2-D scans would have a substantial impact on clinical decision-making. If such corrections are not made, the inaccuracy of current 2-D scanning protocols justifies the cost 3-D reconstruction protocols. The difference in GBL measurements are critical in cases of increasingly large degrees of GBL, as in these instances, the inferior glenoid becomes more of an inverted-pear shape as opposed to a perfect circle, and differences in CORR and UNCORR images are likely to be more profound.
LIMITATIONS
This study has limitations, such as the relatively small sample size and the selection bias by the reviewers with potential differences in interobserver reliability. Further, minor modifications during the reformatting process may be found with each attempt to manipulate the images and may result in minor, insignificant differences in AP width measurements. Performing 1 or more additional CT scans on the same cohort of patients would have been helpful; however, due to the increased risk of radiation exposure, this was not performed. Performing CT scans on cadaveric specimens with GBL and applying the study methodology would also have been helpful to provide independent verification of our clinical findings; however, specimens were not available for this study. Another limitation of this study is that we did not compare our findings with the findings of glenoid width, and bone loss, as determined using the circle method, which is commonly utilized when 3-D reconstructions are available. In this study, the purpose was to utilize only the 2-D reformatted images, with the assumption that 3-D reconstructions are not always available, and cannot always be measured. To minimize selection bias, the investigators measured the correction effects within groups of patients with similar degrees of GBL (10%-14.9%, 15%-19.9%, and >20%). In addition, not all the selected patients showed degenerative glenoid changes or irregular glenoid shape indicating previous bone augmentation.
CONCLUSIONS
UNCORR 2D CT scans inaccurately estimate glenoid width and the degree of anterior GBL. The clinical implications of these findings are profound and suggest corrected 2D CT scans or 3D reconstruction allow measurements to be taken in the axis of the glenoid to accurately define the anatomy and quantity of anterior GBL in patients with shoulder instability.
1. Cerciello S, Edwards TB, Walch G. Chronic anterior glenohumeral instability in soccer players: results for a series of 28 shoulders treated with the Latarjet procedure. J Orthop Traumatol. 2012;13(4):197-202. doi:10.1007/s10195-012-0201-3.
2. Itoi E, Lee SB, Berglund LJ, Berge LL, An KN. The effect of a glenoid defect on anteroinferior stability of the shoulder after Bankart repair: a cadaveric study. J Bone Joint Surg Am. 2000;82(1):35-46.
3. Bhatia S, Ghodadra NS, Romeo AA, et al. The importance of the recognition and treatment of glenoid bone loss in an athletic population. Sports Health. 2011;3(5):435-440. doi:10.1177/1941738111414126.
4. Lo IK, Parten PM, Burkhart SS. The inverted pear glenoid: an indicator of significant glenoid bone loss. Arthroscopy. 2004;20(2):169-174. doi:10.1016/j.arthro.2003.11.036.
5. Mologne TS, Provencher MT, Menzel KA, Vachon TA, Dewing CB. Arthroscopic stabilization in patients with an inverted pear glenoid: results in patients with bone loss of the anterior glenoid. Am J Sports Med. 2007;35(8):1276-1283. doi:10.1177/0363546507300262.
6. Piasecki DP, Verma NN, Romeo AA, Levine WN, Bach BR Jr, Provencher MT. Glenoid bone deficiency in recurrent anterior shoulder instability: diagnosis and management. J Am Acad Orthop Surg. 2009;17(8):482-493.
7. Provencher MT, Bhatia S, Ghodadra NS, et al. Recurrent shoulder instability: current concepts for evaluation and management of glenoid bone loss. J Bone Joint Surg Am. 2010;92(suppl 2):133-151. doi:10.2106/JBJS.J.00906.
8. Rowe CR, Zarins B, Ciullo JV. Recurrent anterior dislocation of the shoulder after surgical repair. Apparent causes of failure and treatment. J Bone Joint Surg Am. 1984;66(2):159-168.
9. Sugaya H, Moriishi J, Dohi M, Kon Y, Tsuchiya A. Glenoid rim morphology in recurrent anterior glenohumeral instability. J Bone Joint Surg Am. 2003;85-A(5):878-884.
10. Edwards TB, Boulahia A, Walch G. Radiographic analysis of bone defects in chronic anterior shoulder instability. Arthroscopy. 2003;19(7):732-739.
11. Jankauskas L, Rudiger HA, Pfirrmann CW, Jost B, Gerber C. Loss of the sclerotic line of the glenoid on anteroposterior radiographs of the shoulder: a diagnostic sign for an osseous defect of the anterior glenoid rim. J Shoulder Elbow Surg. 2010;19(1):151-156. doi:10.1016/j.jse.2009.04.013.
12. Altan E, Ozbaydar MU, Tonbul M, Yalcin L. Comparison of two different measurement methods to determine glenoid bone defects: area or width? J Shoulder Elbow Surg. 2014;23(8):1215-1222. doi:10.1016/j.jse.2013.11.029.
13. Bishop JY, Jones GL, Rerko MA, Donaldson C, Group MS. 3-D CT is the most reliable imaging modality when quantifying glenoid bone loss. Clin Orthop Relat Res. 2013;471(4):1251-1256. doi:10.1007/s11999-012-2607-x.
14. Chuang TY, Adams CR, Burkhart SS. Use of preoperative three-dimensional computed tomography to quantify glenoid bone loss in shoulder instability. Arthroscopy. 2008; 24(4):376-382. doi:10.1016/j.arthro.2007.10.008.
15. Gross DJ, Golijanin P, Dumont GD, et al. The effect of sagittal rotation of the glenoid on axial glenoid width and glenoid version in computed tomography scan imaging. J Shoulder Elbow Surg. 2016;25(1):61-68. doi:10.1016/j.jse.2015.06.017.
16. Lenart BA, Freedman R, Van Thiel GS, et al. Magnetic resonance imaging evaluation of normal glenoid length and width: an anatomic study. Arthroscopy. 2014;30(8):915-920. doi:10.1016/j.arthro.2014.03.006.
17. Bois AJ, Fening SD, Polster J, Jones MH, Miniaci A. Quantifying glenoid bone loss in anterior shoulder instability: reliability and accuracy of 2-dimensional and 3-dimensional computed tomography measurement techniques. Am J Sports Med. 2012;40(11):2569-2577. doi:10.1177/0363546512458247.
18. Griffith JF, Antonio GE, Tong CW, Ming CK. Anterior shoulder dislocation: quantification of glenoid bone loss with CT. AJR Am J Roentgenol. 2003;180(5):1423-1430. doi:10.2214/ajr.180.5.1801423.
19. Hoenecke HR Jr, Hermida JC, Flores-Hernandez C, D'Lima DD. Accuracy of CT-based measurements of glenoid version for total shoulder arthroplasty. J Shoulder Elbow Surg. 2010;19(2):166-171. doi:10.1016/j.jse.2009.08.009.
20. Huijsmans PE, de Witte PB, de Villiers RV, et al. Recurrent anterior shoulder instability: accuracy of estimations of glenoid bone loss with computed tomography is insufficient for therapeutic decision-making. Skeletal Radiol. 2011;40(10):1329-1334. doi:10.1007/s00256-011-1184-5.
21. Bhatia S, Frank RM, Ghodadra NS, et al. The outcomes and surgical techniques of the latarjet procedure. Arthroscopy. 2014;30(2):227-235. doi:10.1016/j.arthro.2013.10.013.
22. Cunningham G, Benchouk S, Kherad O, Ladermann A. Comparison of arthroscopic and open Latarjet with a learning curve analysis. Knee Surg Sports Traumatol Arthrosc. 2015;24(2):540-545. doi:10.1007/s00167-015-3910-3.
23. Fedorka CJ, Mulcahey MK. Recurrent anterior shoulder instability: a review of the Latarjet procedure and its postoperative rehabilitation. Phys Sportsmed. 2015;43(1):73-79. doi:10.1080/00913847.2015.1005543.
24. Flinkkila T, Sirniö K. Open Latarjet procedure for failed arthroscopic Bankart repair. Orthop Traumatol Surg Res. 2015;101(1):35-38. doi:10.1016/j.otsr.2014.11.005.
25. Hovelius L, Sandström B, Saebö M. One hundred eighteen Bristow-Latarjet repairs for recurrent anterior dislocation of the shoulder prospectively followed for fifteen years: study II-the evolution of dislocation arthropathy. J Shoulder Elbow Surg. 2006;15(3):279-289. doi:10.1016/j.jse.2005.09.014.
26. Hovelius L, Sandström B, Sundgren K, Saebö M. One hundred eighteen Bristow-Latarjet repairs for recurrent anterior dislocation of the shoulder prospectively followed for fifteen years: study I--clinical results. J Shoulder Elbow Surg. 2004;13(5):509-516. doi:10.1016/S1058274604000916.
27. Hovelius L, Vikerfors O, Olofsson A, Svensson O, Rahme H. Bristow-Latarjet and Bankart: a comparative study of shoulder stabilization in 185 shoulders during a seventeen-year follow-up. J Shoulder Elbow Surg. 2011;20(7):1095-1101. doi:10.1016/j.jse.2011.02.005.
28. Gupta A, Delaney R, Petkin K, Lafosse L. Complications of the Latarjet procedure. Curr Rev Musculoskelet Med. 2015;8(1):59-66. doi:10.1007/s12178-015-9258-y.
29. Kwon YW, Powell KA, Yum JK, Brems JJ, Iannotti JP. Use of three-dimensional computed tomography for the analysis of the glenoid anatomy. J Shoulder Elbow Surg. 2005;14(1):85-90. doi:10.1016/j.jse.2004.04.011.
30. Saito H, Itoi E, Sugaya H, Minagawa H, Yamamoto N, Tuoheti Y. Location of the glenoid defect in shoulders with recurrent anterior dislocation. Am J Sports Med. 2005;33(6):889-893. doi:10.1177/0363546504271521.
ABSTRACT
Standard 2-dimensional (2-D) computed tomography (CT) scans of the shoulder are often aligned to the plane of the body as opposed to the plane of the scapula, which may challenge the ability to accurately measure glenoid width and glenoid bone loss (GBL). The purpose of this study is to determine the effect of sagittal rotation of the glenoid on axial anterior-posterior (AP) glenoid width measurements in the setting of anterior GBL.
Forty-three CT scans from consecutive patients with anterior GBL (minimum 10%) were reformatted utilizing open-source DICOM software (OsiriX MD). Patients were grouped according to extent of GBL: I, 10% to 14.9% (N = 12); II, 15% to 19.9% (N = 16); and III, >20% (N = 15). The uncorrected (UNCORR) and corrected (CORR) images were assessed in the axial plane at 5 standardized cuts and measured for AP glenoid width.
For groups I and III, UNCORR scans underestimated axial AP width (and thus overestimated anterior GBL) in cuts 1 and 2, while in cuts 3 to 5, the axial AP width was overestimated (GBL was underestimated). In Group II, axial AP width was underestimated (GBL was overestimated), while in cuts 2 to 5, the axial AP width was overestimated (GBL was underestimated). Overall, AP glenoid width was consistently underestimated in cut 1, the most caudal cut; while AP glenoid width was consistently overestimated in cuts 3 to 5, the more cephalad cuts.
UNCORR 2-D CT scans inaccurately estimated glenoid width and the degree of anterior GBL. This data suggests that corrected 2D CT scans or a 3-dimensional (3-D) reconstruction can help in accurately defining the anterior GBL in patients with shoulder instability.
The treatment of glenohumeral instability has substantially evolved over the past several decades. The understanding of glenoid bone loss (GBL), in particular, has advanced to such a level that we utilize the quantification of GBL for surgical decision-making. Unrecognized and/or untreated GBL is associated with recurrent instability, pain, and disability. Controversy exists, however, regarding the precise amount of anterior GBL that is significant enough to warrant surgical treatment. While historically, 25%1,2 of anterior GBL was thought to be the critical number required to warrant osseous augmentation, studies that are more recent have highlighted the need to perform osseous glenoid reconstruction with lesser degrees of GBL, particularly in the contact athlete.3-9 As small differences in the amount of GBL can change surgical decision-making from an all-soft tissue repair to an osseous reconstruction, it is paramount that we have accurate, valid, and reproducible methods for calculating GBL.
Continue to: Historically, plain radiographs...
Historically, plain radiographs have been the mainstay for evaluating the glenohumeral joint, including Grashey and axillary views, allowing clinicians to evaluate the congruency of the glenohumeral joint and to assess bone loss on both the glenoid and humeral head.1,10 While large, acute fractures of the glenoid are fairly evident on radiographs, including the Grashey view,11 shoulders with chronic and/or attritional anterior GBL are more difficult to evaluate, and often do not provide the information necessary to guide surgical decision-making.
Computed tomography (CT) of the shoulder has become the most commonly utilized imaging modality in the evaluation of patients with shoulder instability associated with GBL. Standard 2-dimensional (2-D) CT scans of the shoulder are often aligned to the plane of the body as opposed to the plane of the scapula/glenoid, as standard protocols often fail to account for the anterior sagittal rotation of the scapula/glenoid, similar to the disadvantage of standard radiographs. While 3-dimensional (3-D) CT reconstructions eliminate the effect of gantry angles, and thus allow for an en face view of the glenoid, 3-D reconstructions are not always available, and cannot always be measured.12-14 Thus, improved methodology for utilizing standard 2D scans is warranted, as the ability to correctly align the axial CT scan to the axis of the glenoid may allow for more accurate GBL measurements, which will ultimately impact surgical decision-making. Recently, Gross and colleagues15 reported the effect of sagittal rotation of the glenoid on axial measurements of anterior-posterior (AP) glenoid width and glenoid version in normal glenoids, without bone loss, and found that the mean angle of correction needed to align the sagittal plane was 20.1° ± 1.2° of rotation. To the authors’ knowledge, this same methodology has not been applied to patients with clinically meaningful anterior GBL. Given that the average glenoid width in human shoulders is 24.4 mm ± 2.9 mm,16 1 mm of glenoid bone loss (GBL) corresponds to approximately 4% of the glenoid width, and thus even subtle differences in the interpretation of GBL may have substantial clinical implications. Therefore, the purpose of this study is to determine the effect of sagittal rotation of the glenoid on axial AP glenoid width measurements in the setting of clinically significant anterior GBL.
METHODS
This study was approved by Massachusetts General Hospital Institutional Review Board. A retrospective review of consecutive patients with a diagnosis of anterior shoulder instability between 2009 and 2013 was conducted. Inclusion criteria comprised patients with a minimum of 10% anterior GBL, an available CT scan of the affected shoulder, and no history of prior ipsilateral surgeries. Exclusion criteria comprised evidence of degenerative changes to the glenoid and/or humeral head, as well as prior ipsilateral shoulder surgery. Sixty consecutive patients were originally identified as having anterior shoulder instability, and 17 were excluded based on the inclusion/exclusion criteria, leaving 43 patients (43 shoulders) available for inclusion. Shoulder CT scans from all 43 patients were reformatted utilizing open-source DICOM software (OsiriX MD, version 2.5.1 65-bit) multi-planar reconstruction (MPR).
CT PROTOCOL
All patients underwent a standard glenohumeral CT scan using a Siemens Sensation 64 Scanner (Siemens), a 64-detector scanner. Scans were acquired with 0.6 mm of collimation, 140 kV, and 300 mA-seconds. Slice thickness was set to 2 mm. All patient information was de-identified for analysis.
The uncorrected (UNCORR) scans were defined as the default orientation on the scanner. In the UNCORR scans, the axial, coronal, and sagittal views were oriented relative to the scanner gantry table, as opposed to the anatomy of the glenoid. The corrected (CORR) CT scans were aligned in all 3 planes relative to the glenoid face, and thus the cuts were perpendicular to the long axis of the glenoid.15 This resulted in sagittal cuts perpendicular to the 12-o’clock to 6-o’clock axis in the sagittal plane (Figure 1).
Continue to: In a de-identified fashion...
IMAGE ANALYSIS AND REFORMATTING
In a de-identified fashion, all CT scans were imported and analyzed using open-source Digital Imaging and Communications in Medicine (DICOM) software (OsiriX MD, version 2.5.1 64-bit). By following a previously developed method, CT scans were reformatted using OsiriX MPR. The OsiriX software has an MPR function that allows simultaneous manipulation of 2-D CT scans in 3 orthogonal planes: axial, sagittal, and coronal. In the MPR mode, the alternation of 1 plane directly affects the orientation of the remaining 2 planes. Thus, by using an MPR, one can analyze the impact that a default CT scan performed relative to the gantry of the table, UNCORR, has on the axial images.
First, the en face view was obtained via a 2-step process: alignment of the axial plane to account for the scapular angle, followed by alignment of the coronal plane to adjust for the glenoid inclination.15 These 2 adjustments provided a true en face sagittal glenoid view. The final adjustment step was a sagittal en face rotation of the glenoid such that the superior and inferior glenoid tubercles were placed on the 12-o’clock to 6-o’clock axis (CORR scan). Previous studies have identified a central longitudinal axis that was used in this method to align the supraglenoid tubercle with the 12-o’clock to 6-o’clock axis on the glenoid face.15,17,18 The standard error of mean was 1.21°. This new CORR view resulted in axial cuts through the glenoid that were oriented perpendicular to the 12-o’clock to 6-o’clock axis. The UNCORR and CORR images were assessed in the axial plane at 5 standardized cuts and measured for AP glenoid width by 2 independent observers in a blinded, randomized fashion. When the measured AP width of the UNCORR scan was less than that measured on the CORR scan, the AP width of the glenoid was considered underestimated, and the degree of GBL was considered overestimated (Figure 2).
SCAPULAR ANGLE
Scapular angle measurements were performed on the axial view as the angle between a line through the long axis of the body of the scapula, and a line parallel to the CT gantry table.15,19 Subsequently, the axial plane was aligned to the glenoid surface.
CORONAL INCLINATION
Coronal inclination measurements were performed on the sagittal view as the angle between a line tangential to the face of the glenoid and a line perpendicular to the CT gantry table. Positive values represented superior inclination, while negative values represented inferior glenoid inclination.15
SAGITTAL ROTATION
Sagittal rotation measurements were performed using the built-in angle measurement tool in OsiriX in the sagittal plane since the degree of rotation required aligning the long axis of the glenoid to the 12-o’clock to 6-o’clock axis. The amount of rotation was defined as the rotation angle.15
Continue to: Similarly, as described by Gross...
GLENOID WIDTH
Similarly, as described by Gross and colleagues,15 the sagittal en face view was divided via 5 cuts, throughout a superimposed best-fit circle that closely represents the glenoid.9,15,20 For both the UNCORR and CORR, glenoid width (AP distance) was measured on the axial image at the widest point from AP cortex across the glenoid face.
PATIENT GROUPS
Utilizing the en face 3-D CT reconstruction view of the glenoid as the gold standard, patients were placed into 1 of 3 groups according to the degree of anterior GBL measured via the surface method.9,20 The groups were as follows:
I. 10% to 14.9% (N = 12)
II. 15% to 19.9% (N = 16)
III. >20% (N = 15)
STATISTICAL METHODS
Paired t-tests were used to compare all measurements between CORR and UNCORR scans for each of the 5 cuts. A P-value of .05 was used as the threshold for statistical significance in 2-tailed comparisons. Mean and standard errors are presented with standard deviations throughout the study. For interobserver reliability, the measurements between the observers, the intraclass correlation coefficient was calculated. All statistics were performed with SPSS (Version 22).
RESULTS
The study cohort was comprised of 19 left shoulders (44%) and 24 right shoulders (56%), including 36 male patients (84%) and 7 female patients (16%). The average age was 27.8 years (range, 21-40 years). The variability in measured difference, with respect to AP width, was 1.05 mm. The UNCORR CT scans required a mean correction for coronal inclination of 7.0° ± 5.8° (range, -8°-6°). The UNCORR CT scans required a mean correction for scapular angle of 30.2° ± 8.0° (range, 15°-49°). The mean angle of sagittal rotation required to align the glenoid face with the 12-o’clock to 6-o’clock axis was 24.2° ± 5.1 ° (range, 13°-30°). These results are summarized in Table 1.
Table 1. Mean Correction Values Required to Correct the Uncorrected Images to the Corrected Images | |||
Anatomic alignment | Mean (degrees) | Range (degrees) | SD (degrees) |
Scapular angle | 30.2 | 15-49 | 8.0 |
Coronal Inclination | 7.0 | -8-6 | 5.8 |
Sagittal rotation | 24.2 | 13-30 | 5.1 |
For all measurements, the intraclass correlation coefficient for independent observers for all cuts within the 3 groups was r >.900 in all cases.
On an optimized CT scan, over 5 standardized cuts across a best-fit circle of the inferior glenoid, there was a statistically significant absolute mean difference of 12.6% in axial AP glenoid width (2.86 mm ± 2.00 mm, P =.016) when compared with the UNCORR scan. This corresponds to a 3% to 21% error in measurement of the AP width of the glenoid.
Continue to: For the entire cohort...
For the entire cohort of 43 patients, the UNCORR scans underestimated the axial AP width (and thus overestimated GBL) in cut 1 (P =.003), and overestimated the axial AP width (and thus underestimated GBL) in cuts 3 to 5 (P < .001 for all) compared with that of the CORR scans. There was no significant difference between the UNCORR and CORR scans in cut 2 (P = .331).
For groups I (10%-14.9% GBL) and III (>20% GBL), the UNCORR scans underestimated the axial AP width (and thus overestimated anterior GBL) in cuts 1 and 2, while in cuts 3 to 5, the axial AP width was overestimated (GBL was underestimated) (Tables 2, 3). In Group II (15%-19.9% GBL), the axial AP width was underestimated (GBL was overestimated), while in cuts 2 to 5, the axial AP width was overestimated (GBL was underestimated). Overall, AP glenoid width was consistently underestimated in cut 1, the most caudal cut, while AP glenoid width was consistently overestimated in cuts 3 to 5, the more cephalad cuts.
Table 2. Absolute Mean Difference in Axial AP Width (mm) Between Corrected and Uncorrected Images (% difference) | |||||
Cut 1 (Caudal) | Cut 2 | Cut 3 (Center) | Cut 4 | Cut 5 (Cephalad) | |
Group I: 10%-14.9% GBL | 2.4 mm (15.3%) | 1.8 mm (9.0%) | 1.8 mm (7.7%) | 3.0 mm (11.7%) | 4.0 mm (16.8%) |
Group II: 15%-19.9% GBL | 1.8 mm (13.1%) | 1.7 mm (7.9%) | 2.8 mm (10.6%) | 4.1 mm (14.4%) | 4.8 mm (16.9%) |
Group III: >20% | 2.8 mm (16.1%) | 1.9 mm (8.0%) | 2.3 mm (10.3) | 4.4 mm (16.6%) | 5.2 mm (17.0%) |
Abbreviations: AP, anterior-posterior; GBL, glenoid bone loss.
Table 3. Mean AP Glenoid Width Based on CORR and UNCORR Images for the Entire Cohort of 43 Patients | |||||
Axial cut | Mean AP width (mm) | Mean AP width (mm) | Absolute mean AP width difference (mm) | Absolute mean AP width difference (%) | P value |
(Caudal) 1 | 16.6208 | 18.4958 | -1.875 | 14.7768 | .0029565 |
2 | 20.6558 | 21.3166 | -0.661 | 3.6137 | .3310965 |
3 | 24.2583 | 22.3125 | 1.946 | 7.8042 | <.0001 |
4 | 26.1291 | 21.8916 | 4.238 | 15.8449 | <.0001 |
(Rostral) 5 | 26.0875 | 20.4875 | 5.6 | 20.9717 | <.0001 |
Abbreviations: AP, anterior-posterior; CORR, corrected; UNCORR, uncorrected.
DISCUSSION
The principle findings of this study demonstrate that UNCORR conventional 2-D CT scans inaccurately estimate glenoid width as well as inaccurately quantify the degree of anterior GBL. Underestimations of GBL may lead to insufficient treatment of clinically meaningful GBL, thereby increasing the risk of instability recurrence; whereas overestimations of GBL may lead to unnecessary treatment, subjecting patients to increased surgical morbidity. Therefore, the authors recommend correcting the orientation of the scapula in cases wherein clinical decisions are entirely based on 2-D CT, or using alternative methods for quantifying GBL, specifically in the form of 3-D reconstructions.
The use of axial imaging, with CT scans and/or magnetic resonance imaging, is growing in popularity for evaluation of both glenoid anatomy and GBL. Nevertheless, despite our improved ability to critically evaluate the glenoid using these advanced imaging modalities, the images themselves require scrutiny by clinicians to determine if the images accurately depict the true anatomy of the glenoid. As demonstrated by Gross and colleagues,15 conventional 2D CT scan protocols are not optimized to the anatomy of the glenohumeral joint, even in patients without GBL. Due to the alignment of the image relative to the plane of the scapula as opposed to the plane of the glenoid, UNCORR scans result in significantly different measurements of glenoid version (2.0° ± 0.1°) and AP glenoid width (1.2 mm ± 0.42 mm) compared with corrected scans, requiring an average 20.1° ± 1.2° of correction to align the sagittal plane. In the present study involving the patients with GBL, we also found that conventional, UNCORR 2-D CT scan protocols inaccurately estimate glenoid width and the degree of anterior GBL. In particular, AP glenoid width was consistently underestimated in the more caudal cuts, while AP glenoid width was consistently overestimated in the more cephalad cuts. Thus, anterior GBL was overestimated (AP glenoid width was underestimated) in the more caudal cuts, whereas anterior GBL was underestimated in the more cranial cuts (AP glenoid width was overestimated). Given that approximately 1 mm of glenoid bone corresponds to approximately 4% of glenoid width,16 even subtle differences in the interpretation of GBL may lead to gross overestimation/underestimation of bone loss, with significant clinical implications.
In the anterior instability patient population, clinical decision-making is often based on the degree of GBL as determined by advanced imaging modalities. In addition to other patient-specific factors, including age, gender, activity level, type of sport, and number of prior dislocations and/or prior surgeries, the quantity of GBL will often determine which surgical procedure needs to be performed. Typically, patients with >20% to 25% anterior GBL are indicated for a glenoid reconstruction procedure, most commonly via the Latarjet procedure (coracoid transfer).21-27 The Latarjet procedure remains an excellent technique for appropriately indicated patients, with historically good clinical outcomes and low recurrence rates. Complications associated with the Latarjet procedure, however, are not uncommon, including devastating neuropraxia of the axillary and musculocutaneous nerves, and occasionally permanent neurologic deficits.28 Thus, it is critical to avoid overtreating patients with recurrent instability and GBL. As demonstrated by this study, depending on the cranial-to-caudal location on the glenoid, current 2-D CT techniques may underestimate AP glenoid width, resulting in an overestimation of GBL, potentially leading to the decision to proceed with glenoid bone reconstruction when such a procedure is not required. On the contrary, overestimation of AP glenoid width, which occurs in the more cephalad cuts of the glenoid, is perhaps more worrisome, as the resulting underestimation of GBL may lead to inadequate treatment of patients with recurrent instability. Certainly, one of the main risk factors for failed soft tissue shoulder stabilization is a failure to address GBL. If clinical decisions are made based on UNCORR 2-D CT scans, which are often inaccurate with respect to AP glenoid width by an average 2.86 mm ± 2.00 mm (equivalent to 12.6% ± 6.9% GBL) as determined in this study, patients who truly require osseous glenoid reconstructions may be indicated for only soft tissue stabilization, based on the underestimation of GBL.
Continue to: The current gold standard...
The current gold standard for GBL measurement is a perfect-fit circle performed on a 3-D CT scan.22 To that end, it would have been useful to measure the glenoids from this study on 3-D CT scans and compare the data with both UNCORR and CORR measurements. This would have provided a better understanding to what extent the CORR measurements on 2-D scans are relatable with the gold standard. As 3-D CT scans provide a better en face view of the glenoid, more accurate GBL measurements, and ease of 3-D manipulation, they have become more widely used across the country.29,30 Nevertheless, in situations where 3-D imaging is more challenging to obtain because of technology or cost limitations, having a strategy for ensuring proper orientation of 2-D scans would have a substantial impact on clinical decision-making. If such corrections are not made, the inaccuracy of current 2-D scanning protocols justifies the cost 3-D reconstruction protocols. The difference in GBL measurements are critical in cases of increasingly large degrees of GBL, as in these instances, the inferior glenoid becomes more of an inverted-pear shape as opposed to a perfect circle, and differences in CORR and UNCORR images are likely to be more profound.
LIMITATIONS
This study has limitations, such as the relatively small sample size and the selection bias by the reviewers with potential differences in interobserver reliability. Further, minor modifications during the reformatting process may be found with each attempt to manipulate the images and may result in minor, insignificant differences in AP width measurements. Performing 1 or more additional CT scans on the same cohort of patients would have been helpful; however, due to the increased risk of radiation exposure, this was not performed. Performing CT scans on cadaveric specimens with GBL and applying the study methodology would also have been helpful to provide independent verification of our clinical findings; however, specimens were not available for this study. Another limitation of this study is that we did not compare our findings with the findings of glenoid width, and bone loss, as determined using the circle method, which is commonly utilized when 3-D reconstructions are available. In this study, the purpose was to utilize only the 2-D reformatted images, with the assumption that 3-D reconstructions are not always available, and cannot always be measured. To minimize selection bias, the investigators measured the correction effects within groups of patients with similar degrees of GBL (10%-14.9%, 15%-19.9%, and >20%). In addition, not all the selected patients showed degenerative glenoid changes or irregular glenoid shape indicating previous bone augmentation.
CONCLUSIONS
UNCORR 2D CT scans inaccurately estimate glenoid width and the degree of anterior GBL. The clinical implications of these findings are profound and suggest corrected 2D CT scans or 3D reconstruction allow measurements to be taken in the axis of the glenoid to accurately define the anatomy and quantity of anterior GBL in patients with shoulder instability.
1. Cerciello S, Edwards TB, Walch G. Chronic anterior glenohumeral instability in soccer players: results for a series of 28 shoulders treated with the Latarjet procedure. J Orthop Traumatol. 2012;13(4):197-202. doi:10.1007/s10195-012-0201-3.
2. Itoi E, Lee SB, Berglund LJ, Berge LL, An KN. The effect of a glenoid defect on anteroinferior stability of the shoulder after Bankart repair: a cadaveric study. J Bone Joint Surg Am. 2000;82(1):35-46.
3. Bhatia S, Ghodadra NS, Romeo AA, et al. The importance of the recognition and treatment of glenoid bone loss in an athletic population. Sports Health. 2011;3(5):435-440. doi:10.1177/1941738111414126.
4. Lo IK, Parten PM, Burkhart SS. The inverted pear glenoid: an indicator of significant glenoid bone loss. Arthroscopy. 2004;20(2):169-174. doi:10.1016/j.arthro.2003.11.036.
5. Mologne TS, Provencher MT, Menzel KA, Vachon TA, Dewing CB. Arthroscopic stabilization in patients with an inverted pear glenoid: results in patients with bone loss of the anterior glenoid. Am J Sports Med. 2007;35(8):1276-1283. doi:10.1177/0363546507300262.
6. Piasecki DP, Verma NN, Romeo AA, Levine WN, Bach BR Jr, Provencher MT. Glenoid bone deficiency in recurrent anterior shoulder instability: diagnosis and management. J Am Acad Orthop Surg. 2009;17(8):482-493.
7. Provencher MT, Bhatia S, Ghodadra NS, et al. Recurrent shoulder instability: current concepts for evaluation and management of glenoid bone loss. J Bone Joint Surg Am. 2010;92(suppl 2):133-151. doi:10.2106/JBJS.J.00906.
8. Rowe CR, Zarins B, Ciullo JV. Recurrent anterior dislocation of the shoulder after surgical repair. Apparent causes of failure and treatment. J Bone Joint Surg Am. 1984;66(2):159-168.
9. Sugaya H, Moriishi J, Dohi M, Kon Y, Tsuchiya A. Glenoid rim morphology in recurrent anterior glenohumeral instability. J Bone Joint Surg Am. 2003;85-A(5):878-884.
10. Edwards TB, Boulahia A, Walch G. Radiographic analysis of bone defects in chronic anterior shoulder instability. Arthroscopy. 2003;19(7):732-739.
11. Jankauskas L, Rudiger HA, Pfirrmann CW, Jost B, Gerber C. Loss of the sclerotic line of the glenoid on anteroposterior radiographs of the shoulder: a diagnostic sign for an osseous defect of the anterior glenoid rim. J Shoulder Elbow Surg. 2010;19(1):151-156. doi:10.1016/j.jse.2009.04.013.
12. Altan E, Ozbaydar MU, Tonbul M, Yalcin L. Comparison of two different measurement methods to determine glenoid bone defects: area or width? J Shoulder Elbow Surg. 2014;23(8):1215-1222. doi:10.1016/j.jse.2013.11.029.
13. Bishop JY, Jones GL, Rerko MA, Donaldson C, Group MS. 3-D CT is the most reliable imaging modality when quantifying glenoid bone loss. Clin Orthop Relat Res. 2013;471(4):1251-1256. doi:10.1007/s11999-012-2607-x.
14. Chuang TY, Adams CR, Burkhart SS. Use of preoperative three-dimensional computed tomography to quantify glenoid bone loss in shoulder instability. Arthroscopy. 2008; 24(4):376-382. doi:10.1016/j.arthro.2007.10.008.
15. Gross DJ, Golijanin P, Dumont GD, et al. The effect of sagittal rotation of the glenoid on axial glenoid width and glenoid version in computed tomography scan imaging. J Shoulder Elbow Surg. 2016;25(1):61-68. doi:10.1016/j.jse.2015.06.017.
16. Lenart BA, Freedman R, Van Thiel GS, et al. Magnetic resonance imaging evaluation of normal glenoid length and width: an anatomic study. Arthroscopy. 2014;30(8):915-920. doi:10.1016/j.arthro.2014.03.006.
17. Bois AJ, Fening SD, Polster J, Jones MH, Miniaci A. Quantifying glenoid bone loss in anterior shoulder instability: reliability and accuracy of 2-dimensional and 3-dimensional computed tomography measurement techniques. Am J Sports Med. 2012;40(11):2569-2577. doi:10.1177/0363546512458247.
18. Griffith JF, Antonio GE, Tong CW, Ming CK. Anterior shoulder dislocation: quantification of glenoid bone loss with CT. AJR Am J Roentgenol. 2003;180(5):1423-1430. doi:10.2214/ajr.180.5.1801423.
19. Hoenecke HR Jr, Hermida JC, Flores-Hernandez C, D'Lima DD. Accuracy of CT-based measurements of glenoid version for total shoulder arthroplasty. J Shoulder Elbow Surg. 2010;19(2):166-171. doi:10.1016/j.jse.2009.08.009.
20. Huijsmans PE, de Witte PB, de Villiers RV, et al. Recurrent anterior shoulder instability: accuracy of estimations of glenoid bone loss with computed tomography is insufficient for therapeutic decision-making. Skeletal Radiol. 2011;40(10):1329-1334. doi:10.1007/s00256-011-1184-5.
21. Bhatia S, Frank RM, Ghodadra NS, et al. The outcomes and surgical techniques of the latarjet procedure. Arthroscopy. 2014;30(2):227-235. doi:10.1016/j.arthro.2013.10.013.
22. Cunningham G, Benchouk S, Kherad O, Ladermann A. Comparison of arthroscopic and open Latarjet with a learning curve analysis. Knee Surg Sports Traumatol Arthrosc. 2015;24(2):540-545. doi:10.1007/s00167-015-3910-3.
23. Fedorka CJ, Mulcahey MK. Recurrent anterior shoulder instability: a review of the Latarjet procedure and its postoperative rehabilitation. Phys Sportsmed. 2015;43(1):73-79. doi:10.1080/00913847.2015.1005543.
24. Flinkkila T, Sirniö K. Open Latarjet procedure for failed arthroscopic Bankart repair. Orthop Traumatol Surg Res. 2015;101(1):35-38. doi:10.1016/j.otsr.2014.11.005.
25. Hovelius L, Sandström B, Saebö M. One hundred eighteen Bristow-Latarjet repairs for recurrent anterior dislocation of the shoulder prospectively followed for fifteen years: study II-the evolution of dislocation arthropathy. J Shoulder Elbow Surg. 2006;15(3):279-289. doi:10.1016/j.jse.2005.09.014.
26. Hovelius L, Sandström B, Sundgren K, Saebö M. One hundred eighteen Bristow-Latarjet repairs for recurrent anterior dislocation of the shoulder prospectively followed for fifteen years: study I--clinical results. J Shoulder Elbow Surg. 2004;13(5):509-516. doi:10.1016/S1058274604000916.
27. Hovelius L, Vikerfors O, Olofsson A, Svensson O, Rahme H. Bristow-Latarjet and Bankart: a comparative study of shoulder stabilization in 185 shoulders during a seventeen-year follow-up. J Shoulder Elbow Surg. 2011;20(7):1095-1101. doi:10.1016/j.jse.2011.02.005.
28. Gupta A, Delaney R, Petkin K, Lafosse L. Complications of the Latarjet procedure. Curr Rev Musculoskelet Med. 2015;8(1):59-66. doi:10.1007/s12178-015-9258-y.
29. Kwon YW, Powell KA, Yum JK, Brems JJ, Iannotti JP. Use of three-dimensional computed tomography for the analysis of the glenoid anatomy. J Shoulder Elbow Surg. 2005;14(1):85-90. doi:10.1016/j.jse.2004.04.011.
30. Saito H, Itoi E, Sugaya H, Minagawa H, Yamamoto N, Tuoheti Y. Location of the glenoid defect in shoulders with recurrent anterior dislocation. Am J Sports Med. 2005;33(6):889-893. doi:10.1177/0363546504271521.
TAKE-HOME POINTS
- Standard 2-D CT scans of the shoulder are often aligned to the plane of the body as opposed to the plane of the scapula, which may challenge the ability to accurately measure glenoid width and GBL.
- Underestimations of GBL may lead to insufficient treatment of clinically meaningful GBL, thereby increasing the risk of instability recurrence; whereas overestimations of GBL may lead to unnecessary treatment, subjecting patients to increased surgical morbidity.
- AP glenoid width was consistently underestimated in uncorrected axial cut 1, the most caudal cut.
- AP glenoid width was consistently overestimated in uncorrected axial cuts 3 to 5, the more cephalad cuts.
- CORR 2-D CT scans or a 3-D reconstruction can help in accurately defining the anterior GBL in patients with shoulder instability.
When Would a Metal-Backed Component Become Cost-Effective Over an All-Polyethylene Tibia in Total Knee Arthroplasty?
ABSTRACT
The importance of cost control in total knee arthroplasty is increasing in the United States secondary to both changing economic realities of healthcare and the increasing prevalence of joint replacement.
Surgeons play a critical role in cost containment and may soon be incentivized to make cost-effective decisions under proposed gainsharing programs. The purpose of this study is to examine the cost-effectiveness of all-polyethylene tibial (APT) components and determine what difference in revision rate would make modular metal-backed tibial (MBT) implants a more cost-effective intervention.
Markov models were constructed using variable implant failure rates and previously published probabilities. Cost data were obtained from both our institution and published United States implant list prices, and modeled with a 3.0% discount rate. The decision tree was continued over a 20-year timeframe.
Using our institutional cost data and model assumptions with a 1.0% annual failure rate for MBT components, an annual failure rate of 1.6% for APT components would be required to achieve equivalency in cost. Over a 20-year period, a failure rate of >27% for the APT component would be necessary to achieve equivalent cost compared with the proposed failure rate of 18% with MBT components. A sensitivity analysis was performed with different assumptions for MBT annual failure rates.
Given our assumptions, the APT component is cost-saving if the excess cumulative revision rate increases by <9% in 20 years compared with that of the MBT implant. Surgeons, payers, and hospitals should consider this approach when evaluating implants. Consideration should also be given to the decreased utility associated with revision surgery.
Continue to: All-polythylene tibial implants...
All-polyethylene tibial (APT) implants have been available for use in total knee arthroplasty (TKA) for decades. Except for one particular implant design, APT implants have shown equivalent functional outcome and survivorship to metal-backed tibial (MBT) components.1 Two recent systematic reviews have demonstrated no difference in durability or functional outcome between APT and MBT components.1,2 Despite this data, APT components continue to be used uncommonly in the United States. Improved technical ease and the theoretical advantages of modularity are likely responsible for the continued popularity of MBT implants despite the fact that APT implants cost considerably less than their MBT counterparts.
The importance of cost control in TKA is increasing secondary to changing economic realities of healthcare and increasing prevalence of joint replacement. Payers are seeking ways to ensure quality care at more affordable reimbursement rates. Surgeons play a critical role in cost containment and may soon be incentivized to make cost-effective decisions under proposed gainsharing programs. Implants account for a substantial portion of hospital costs for knee replacement and have been suggested as an essential part of cost control.3 As such, surgeons in the United States will probably need to factor in value when selecting implants and be required to justify the additional cost of “premium” implants.
Given recent systemic reviews concluding both equivalent effectiveness and survivorship, the APT component would appear to be inherently cost-effective when compared with an MBT design. However, the degree to which this implant is cost-effective has been difficult to quantify. The purpose of this study is to take a novel approach to examine the cost-effectiveness of APT components by determining what theoretical difference in revision rate would make modular MBT implants a more cost-effective intervention using our institutional cost data.
MATERIALS AND METHODS
A Markov decision model was used to evaluate the cost-effectiveness of APT components.4 A Markov decision model is a mathematical framework for modeling decision making in situations where outcomes are partly random and partly under the control of a decision maker. They are powerful tools for determining the best solution from all feasible solutions to a given problem. A decision model was constructed (Figure 1) to depict patients with arthritis of the knee being treated with either APT or MBT implants in a fashion similar to previously published models.5 At each point of a patient’s health status in the 20 years following surgery, they are either considered well after total knee replacement, well after revision surgery, or dead. Patients transition through the decision tree and pass through different states according to the probability of each event occurring, a process that is discussed further below. A utility value, measured in quality-adjusted life years (QALYs), and a cost are assigned to every health state and both primary and revision procedures within the model. The model is designed to determine the maximum failure rate for which the APT is the more cost-effective option.
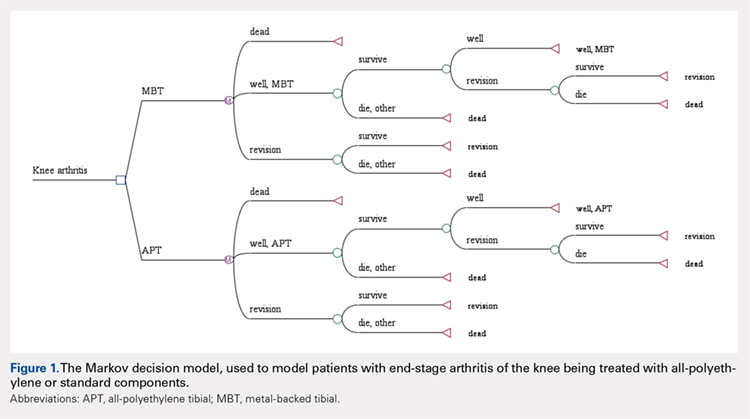
The model probabilities used for survival and mortality following TKA were adapted from those published previously in the literature.5 A utility value was assigned to each health state. The utility after initial surgery was set to 0.83 and utility after revision was set to 0.6.5 These values were obtained from the Swedish Registry and Tufts Cost-Effectiveness Registry, respectively. We also included a disutility of -0.1 for the first year after surgery and -0.2 for the first year after revision, to account for the disutility of undergoing surgery and the post-surgery recovery. Disutilities represent the negative preference patients have for a particular health state or outcome, such as primary or revision knee arthroplasty.5 It is assumed that there is a higher morbidity associated with revision arthroplasty vs primary arthroplasty and, thus, has a higher disutility value assigned to it.
We assumed the age at the initial surgery to be 65 years. Age-specific mortality rates were taken from the 2007 United States Life Tables published by the Centers for Disease Control and Prevention.6 An additional probability of .007 of dying during the surgery or postoperative from the initial surgery and a probability of .011 from the revision was included.
Costs for the surgery were obtained from the University of Virginia’s billing department. We obtained the average cost for the diagnosis-related group in 2012. The cost of primary knee replacement was $17,578.06 with MBT implants. We subtracted institutional cost savings for the APT that could be achieved to obtain a cost of $16,272.10 for the APT. The cost of revision was $21,650.34 and assumed to be the same regardless of the type of initial surgery. A 3% discount rate was used.
The costs, QALYs, and probabilities were then used to compute cost-effectiveness ratios, or the cost per additional QALY, of the 2 options. Unlike previous models published in the orthopedic literature, we assumed a constant probability of revision for the MBT. We initially assumed a 1.0% probability of failure per year for the MBT implant. We then determined what revision rate for the APT would be necessary to be cost equivalent with the MBT. A sensitivity analysis was performed to examine the impact of varying assumptions regarding the rate of revision.
Continue to: Results...
RESULTS
Under our institutional cost data and model assumptions with a 1% annual failure rate for MBT implants, an annual failure rate of 1.6% for APT components would be required to achieve equivalency in cost. Over a 20-year period, a failure rate of >27% for the APT component would be necessary to achieve equivalent cost compared with the proposed failure rate of 18% with MBT components.
A two-way sensitivity analysis for probabilities of failure was performed to compare revision probabilities of the APT with those of MBT components. The preferred strategy graph is included in Figure 2. This graph shows how varying annual revision rates for both the APT and MBT would impact which option would be preferable. For example, on the graph, an annual failure rate of 1.6% for APT implants would be cost equivalent to a 0.1% annual failure rate for MBT implants at 20 years. A 2.0% annual failure rate for the APT would be equivalent to a 1.4% annual failure rate for the MBT, and a 2.5% failure rate for the APT would be equivalent to a 1.8% MBT failure rate. Holding the APT failure rate constant at 2.5%, any MBT failure rate <1.8% would make the MBT the more cost-effective option, whereas a failure rate >1.8% would make the MBT less cost-effective than the APT. For probability combinations that fall in the lower right area of Figure 2, the APT is preferable, and for probability combinations that fall in the upper left area, the MBT is preferable. The line separating the 2 areas is where 1 would be indifferent, such that the cost per additional QALY is the same for both procedures.
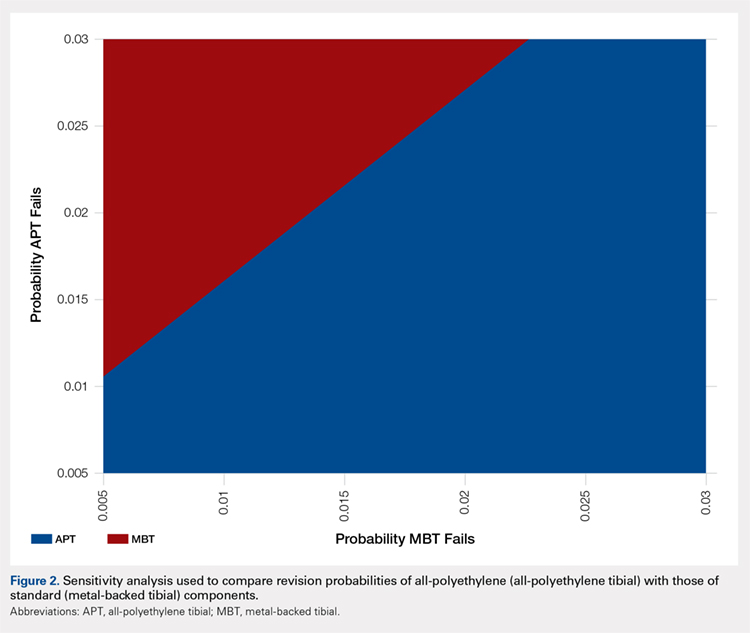
DISCUSSION
In light of the current economic climate and push for cost savings in the United States healthcare system, orthopedic surgeons must increasingly understand the realities of cost and the role it plays in the assessment of new technology. This concept is especially true of TKA as it becomes an increasingly common operative intervention. Utilizing cost savings techniques while ensuring quality outcomes is something that needs to be championed by healthcare providers.
Ideally, the introduction of a new medical technology that is more expensive than preexisting technology should lead to improved outcomes. Multiple randomized radiostereometric and clinical outcome studies looking at failure rates of APT compared with MBT have consistently suggested equivalence or superiority of the APT design when modern round-on-round implant designs are utilized.7-17 Two recent systematic reviews demonstrated that APT components were equivalent to MBT components regarding both revision rates and clinical scores.1,18 Given these results, it seems that the increased use of the APT design could save the healthcare system substantial amounts of money without compromising outcomes. For example, in 2006 Muller and colleagues19. proposed a possible cost savings of approximately 39 million dollars per year across England and Wales, if just 50% of the 70,000 TKAs performed annually used APTs. Our study, which helps quantify the potential cost-effectiveness of the APT design in terms of revision rates, should help further support this debate and provide a framework for the evaluation of new technology.
It should be noted that the results of this current study are based on both assumptions and generalizations. Institutional cost data is known to vary widely among institutions and our conclusions regarding comparable revision rates would change with different cost inputs. We are also unable to take into account individual patients, surgeons, or specific implant factors. It is very difficult to place a price on quality-adjusted life years and negative repercussions with revision surgery. Furthermore, speaking specifically about surgical technique, each surgeon has his/her own preference when performing TKA. There is a lack of intraoperative flexibility when using monoblock tibial components that many surgeons may find undesirable. A surgeon is unable to adjust the thickness of the polyethylene insert after cementation of metal implants. Finally, we are aware that cost-effectiveness analyses cannot take the place of rational clinical decision making when evaluating an individual patient for TKA. Patient age, body mass index, and deformity are all factors that may dictate the use of MBTs in an attempt to improve outcomes.
The results of this analysis help quantify the cost-effectiveness of the APT. Given the additional cost, the MBT design would have to lower revision rates substantially when compared with the APT design to be considered cost-effective. Multiple clinical studies have not shown this to be the case. Further studies are required to help guide clinical decision making and define the role of APT components in TKA.
- Voigt J, Mosier M. Cemented all-polyethylene and metal-backed polyethylene tibial components used for primary total knee arthroplasty: a systematic review of the literature and meta-analysis of randomized controlled trials involving 1798 primary total knee implants. J Bone Joint Surg Am. 2011;93(19):1790-1798. doi:10.2106/JBJS.J.01303.
- Klaas AN, Wiebe CV, Bart GP, Jan WS, Rob GHHN. All-polyethylene tibial components are equal to metal-backed components: systematic review and meta-regression. Clin Orthop Relat Res. 2012;470(12):3549-3559. doi:10.1007/s11999-012-2582-2.
- Healy WL, Iorio R. Implant selection and cost for total joint arthroplasty: conflict between surgeons and hospitals. Clin Orthop Relat Res. 2007;457:57-63. doi:10.1097/BLO.0b013e31803372e0.
- Hunink MGM, Glasziou PP, Siegel JE, et al. Decision Making in Health and Medicine. Cambridge, UK: Cambridge University Press; 2001.
- Slover JD. Cost effectiveness analysis of custom TK cutting blocks. J Arthroplasty. 2012;27(2):180-185. doi:10.1016/j.arth.2011.04.023.
- Revised United States life tables, 2001-2011. Centers for Disease Control and Prevention Web site. https://www.cdc.gov/nchs/nvss/mortality/lewk3.htm. Accessed January 22, 2013.
- Adalberth G, Nilsson KG, Byström S, Kolstad K, Milbrink J. Low-conforming all-polyethylene tibial component not inferior to metal-backed component in cemented total knee arthroplasty: Prospective, randomized radiostereometric analysis study of the AGC total knee prosthesis. J Arthroplasty. 2000;15(6):783-792.
- Adalberth G, Nilsson KG, Byström S, Kolstad K, Milbrink J. All-polyethylene versus metal-backed and stemmed tibial components in cemented total knee arthroplasty: A prospective, randomized RSA study. J Bone Joint Surg Br. 2001;83(6):825-831. doi:10.1302/0301-620X.83B6.0830825
- Gioe TJ, Bowman KR. A randomized comparison of all-polyethylene and metal-backed tibial components. Clin Orthop Relat Res. 2000;380:108-115.
- Hyldahl H, Regnér L, Carlsson L, Kärrholm J, Weidenhielm L. All-polyethylene vs. metal-backed tibial component in total knee arthroplasty: a randomized RSA study comparing early fixation of horizontally and completely cemented tibial components. Part 2: completely cemented components. MB not superior to AP components. Acta Orthop. 2005;76(6):778-784. doi:10.1080/17453670510045363
- Hyldahl H, Regnér L, Carlsson L, Kärrholm J, Weidenhielm L. All polyethylene vs. metal-backed tibial component in total knee arthroplasty: a randomized RSA study comparing early fixation of horizontally and completely cemented tibial components. Part 1: horizontally cemented components. AP better fixated than MB. Acta Orthop. 2005;76(6):769-777.
- Norgren B, Dalén T, Nilsson KG. All poly tibial component better than metal backed: a randomized RSA study. Knee. 2004;11(3):189-196. doi:10.1016/S0968-0160(03)00071-1
- Rodriguez JA, Baez N, Rasquinha V, Ranawat CS. Metal-backed and all-polyethylene tibial components in total knee replacement. Clin Orthop Relat Res. 2001;392:174-183. doi:10.1097/00003086-200111000-00021.
- Gioe TJ, Sinner P, Mehle S, Ma W, Killeen KK. Excellent survival of all polyethylene tibial components in a community joint registry. Clin Orthop Relat Res. 2007;464:88-92. doi:10.1097/BLO.0b013e31812f7879.
- Gioe TJ, Stroemer ES, Santos ER. All-polyethylene and metal-backed tibias have similar outcomes at 10 years: A randomized level I [corrected] evidence study. Clin Orthop Relat Res. 2007;455:212-218. doi:10.1097/01.blo.0000238863.69486.97.
- Gioe TJ, Glynn J, Sembrano J, Suthers K, Santos ER, Singh J. Mobile and fixed bearing (all-polyethylene tibial component) total knee arthroplasty designs: a prospective randomized trial. J Bone Joint Surg Am. 2009;91(9):2104-2112. doi:10.2106/JBJS.H.01442.
- Bettinson KA, Pinder IM, Moran CG, Weir DJ, Lingard EA. All-polyethylene compared with metal-backed tibial components in total knee arthroplasty at ten years: A prospective, randomized controlled trial. J Bone Joint Surg Am. 2009;91(7):1587-1594. doi:10.2106/JBJS.G.01427.
- Nouta KA, Verra WC, Pijls BG, Schoones JW, Nelissen RG. All-polyethylene tibial components are equal to metal-backed components: systematic review and meta-regression. Clin Orthop Relat Res. 2012;470(12):3549-3559. doi:10.1007/s11999-012-2582-2.
- Muller SD, Deehan DJ, Holland JP, et al. Should we reconsider all-polyethylene tibial implants in total knee replacement? J Bone Joint Surg Br. 2006;88(12):1596-1602. doi:10.1302/0301-620X.88B12.17695.
ABSTRACT
The importance of cost control in total knee arthroplasty is increasing in the United States secondary to both changing economic realities of healthcare and the increasing prevalence of joint replacement.
Surgeons play a critical role in cost containment and may soon be incentivized to make cost-effective decisions under proposed gainsharing programs. The purpose of this study is to examine the cost-effectiveness of all-polyethylene tibial (APT) components and determine what difference in revision rate would make modular metal-backed tibial (MBT) implants a more cost-effective intervention.
Markov models were constructed using variable implant failure rates and previously published probabilities. Cost data were obtained from both our institution and published United States implant list prices, and modeled with a 3.0% discount rate. The decision tree was continued over a 20-year timeframe.
Using our institutional cost data and model assumptions with a 1.0% annual failure rate for MBT components, an annual failure rate of 1.6% for APT components would be required to achieve equivalency in cost. Over a 20-year period, a failure rate of >27% for the APT component would be necessary to achieve equivalent cost compared with the proposed failure rate of 18% with MBT components. A sensitivity analysis was performed with different assumptions for MBT annual failure rates.
Given our assumptions, the APT component is cost-saving if the excess cumulative revision rate increases by <9% in 20 years compared with that of the MBT implant. Surgeons, payers, and hospitals should consider this approach when evaluating implants. Consideration should also be given to the decreased utility associated with revision surgery.
Continue to: All-polythylene tibial implants...
All-polyethylene tibial (APT) implants have been available for use in total knee arthroplasty (TKA) for decades. Except for one particular implant design, APT implants have shown equivalent functional outcome and survivorship to metal-backed tibial (MBT) components.1 Two recent systematic reviews have demonstrated no difference in durability or functional outcome between APT and MBT components.1,2 Despite this data, APT components continue to be used uncommonly in the United States. Improved technical ease and the theoretical advantages of modularity are likely responsible for the continued popularity of MBT implants despite the fact that APT implants cost considerably less than their MBT counterparts.
The importance of cost control in TKA is increasing secondary to changing economic realities of healthcare and increasing prevalence of joint replacement. Payers are seeking ways to ensure quality care at more affordable reimbursement rates. Surgeons play a critical role in cost containment and may soon be incentivized to make cost-effective decisions under proposed gainsharing programs. Implants account for a substantial portion of hospital costs for knee replacement and have been suggested as an essential part of cost control.3 As such, surgeons in the United States will probably need to factor in value when selecting implants and be required to justify the additional cost of “premium” implants.
Given recent systemic reviews concluding both equivalent effectiveness and survivorship, the APT component would appear to be inherently cost-effective when compared with an MBT design. However, the degree to which this implant is cost-effective has been difficult to quantify. The purpose of this study is to take a novel approach to examine the cost-effectiveness of APT components by determining what theoretical difference in revision rate would make modular MBT implants a more cost-effective intervention using our institutional cost data.
MATERIALS AND METHODS
A Markov decision model was used to evaluate the cost-effectiveness of APT components.4 A Markov decision model is a mathematical framework for modeling decision making in situations where outcomes are partly random and partly under the control of a decision maker. They are powerful tools for determining the best solution from all feasible solutions to a given problem. A decision model was constructed (Figure 1) to depict patients with arthritis of the knee being treated with either APT or MBT implants in a fashion similar to previously published models.5 At each point of a patient’s health status in the 20 years following surgery, they are either considered well after total knee replacement, well after revision surgery, or dead. Patients transition through the decision tree and pass through different states according to the probability of each event occurring, a process that is discussed further below. A utility value, measured in quality-adjusted life years (QALYs), and a cost are assigned to every health state and both primary and revision procedures within the model. The model is designed to determine the maximum failure rate for which the APT is the more cost-effective option.
The model probabilities used for survival and mortality following TKA were adapted from those published previously in the literature.5 A utility value was assigned to each health state. The utility after initial surgery was set to 0.83 and utility after revision was set to 0.6.5 These values were obtained from the Swedish Registry and Tufts Cost-Effectiveness Registry, respectively. We also included a disutility of -0.1 for the first year after surgery and -0.2 for the first year after revision, to account for the disutility of undergoing surgery and the post-surgery recovery. Disutilities represent the negative preference patients have for a particular health state or outcome, such as primary or revision knee arthroplasty.5 It is assumed that there is a higher morbidity associated with revision arthroplasty vs primary arthroplasty and, thus, has a higher disutility value assigned to it.
We assumed the age at the initial surgery to be 65 years. Age-specific mortality rates were taken from the 2007 United States Life Tables published by the Centers for Disease Control and Prevention.6 An additional probability of .007 of dying during the surgery or postoperative from the initial surgery and a probability of .011 from the revision was included.
Costs for the surgery were obtained from the University of Virginia’s billing department. We obtained the average cost for the diagnosis-related group in 2012. The cost of primary knee replacement was $17,578.06 with MBT implants. We subtracted institutional cost savings for the APT that could be achieved to obtain a cost of $16,272.10 for the APT. The cost of revision was $21,650.34 and assumed to be the same regardless of the type of initial surgery. A 3% discount rate was used.
The costs, QALYs, and probabilities were then used to compute cost-effectiveness ratios, or the cost per additional QALY, of the 2 options. Unlike previous models published in the orthopedic literature, we assumed a constant probability of revision for the MBT. We initially assumed a 1.0% probability of failure per year for the MBT implant. We then determined what revision rate for the APT would be necessary to be cost equivalent with the MBT. A sensitivity analysis was performed to examine the impact of varying assumptions regarding the rate of revision.
Continue to: Results...
RESULTS
Under our institutional cost data and model assumptions with a 1% annual failure rate for MBT implants, an annual failure rate of 1.6% for APT components would be required to achieve equivalency in cost. Over a 20-year period, a failure rate of >27% for the APT component would be necessary to achieve equivalent cost compared with the proposed failure rate of 18% with MBT components.
A two-way sensitivity analysis for probabilities of failure was performed to compare revision probabilities of the APT with those of MBT components. The preferred strategy graph is included in Figure 2. This graph shows how varying annual revision rates for both the APT and MBT would impact which option would be preferable. For example, on the graph, an annual failure rate of 1.6% for APT implants would be cost equivalent to a 0.1% annual failure rate for MBT implants at 20 years. A 2.0% annual failure rate for the APT would be equivalent to a 1.4% annual failure rate for the MBT, and a 2.5% failure rate for the APT would be equivalent to a 1.8% MBT failure rate. Holding the APT failure rate constant at 2.5%, any MBT failure rate <1.8% would make the MBT the more cost-effective option, whereas a failure rate >1.8% would make the MBT less cost-effective than the APT. For probability combinations that fall in the lower right area of Figure 2, the APT is preferable, and for probability combinations that fall in the upper left area, the MBT is preferable. The line separating the 2 areas is where 1 would be indifferent, such that the cost per additional QALY is the same for both procedures.
DISCUSSION
In light of the current economic climate and push for cost savings in the United States healthcare system, orthopedic surgeons must increasingly understand the realities of cost and the role it plays in the assessment of new technology. This concept is especially true of TKA as it becomes an increasingly common operative intervention. Utilizing cost savings techniques while ensuring quality outcomes is something that needs to be championed by healthcare providers.
Ideally, the introduction of a new medical technology that is more expensive than preexisting technology should lead to improved outcomes. Multiple randomized radiostereometric and clinical outcome studies looking at failure rates of APT compared with MBT have consistently suggested equivalence or superiority of the APT design when modern round-on-round implant designs are utilized.7-17 Two recent systematic reviews demonstrated that APT components were equivalent to MBT components regarding both revision rates and clinical scores.1,18 Given these results, it seems that the increased use of the APT design could save the healthcare system substantial amounts of money without compromising outcomes. For example, in 2006 Muller and colleagues19. proposed a possible cost savings of approximately 39 million dollars per year across England and Wales, if just 50% of the 70,000 TKAs performed annually used APTs. Our study, which helps quantify the potential cost-effectiveness of the APT design in terms of revision rates, should help further support this debate and provide a framework for the evaluation of new technology.
It should be noted that the results of this current study are based on both assumptions and generalizations. Institutional cost data is known to vary widely among institutions and our conclusions regarding comparable revision rates would change with different cost inputs. We are also unable to take into account individual patients, surgeons, or specific implant factors. It is very difficult to place a price on quality-adjusted life years and negative repercussions with revision surgery. Furthermore, speaking specifically about surgical technique, each surgeon has his/her own preference when performing TKA. There is a lack of intraoperative flexibility when using monoblock tibial components that many surgeons may find undesirable. A surgeon is unable to adjust the thickness of the polyethylene insert after cementation of metal implants. Finally, we are aware that cost-effectiveness analyses cannot take the place of rational clinical decision making when evaluating an individual patient for TKA. Patient age, body mass index, and deformity are all factors that may dictate the use of MBTs in an attempt to improve outcomes.
The results of this analysis help quantify the cost-effectiveness of the APT. Given the additional cost, the MBT design would have to lower revision rates substantially when compared with the APT design to be considered cost-effective. Multiple clinical studies have not shown this to be the case. Further studies are required to help guide clinical decision making and define the role of APT components in TKA.
- Voigt J, Mosier M. Cemented all-polyethylene and metal-backed polyethylene tibial components used for primary total knee arthroplasty: a systematic review of the literature and meta-analysis of randomized controlled trials involving 1798 primary total knee implants. J Bone Joint Surg Am. 2011;93(19):1790-1798. doi:10.2106/JBJS.J.01303.
- Klaas AN, Wiebe CV, Bart GP, Jan WS, Rob GHHN. All-polyethylene tibial components are equal to metal-backed components: systematic review and meta-regression. Clin Orthop Relat Res. 2012;470(12):3549-3559. doi:10.1007/s11999-012-2582-2.
- Healy WL, Iorio R. Implant selection and cost for total joint arthroplasty: conflict between surgeons and hospitals. Clin Orthop Relat Res. 2007;457:57-63. doi:10.1097/BLO.0b013e31803372e0.
- Hunink MGM, Glasziou PP, Siegel JE, et al. Decision Making in Health and Medicine. Cambridge, UK: Cambridge University Press; 2001.
- Slover JD. Cost effectiveness analysis of custom TK cutting blocks. J Arthroplasty. 2012;27(2):180-185. doi:10.1016/j.arth.2011.04.023.
- Revised United States life tables, 2001-2011. Centers for Disease Control and Prevention Web site. https://www.cdc.gov/nchs/nvss/mortality/lewk3.htm. Accessed January 22, 2013.
- Adalberth G, Nilsson KG, Byström S, Kolstad K, Milbrink J. Low-conforming all-polyethylene tibial component not inferior to metal-backed component in cemented total knee arthroplasty: Prospective, randomized radiostereometric analysis study of the AGC total knee prosthesis. J Arthroplasty. 2000;15(6):783-792.
- Adalberth G, Nilsson KG, Byström S, Kolstad K, Milbrink J. All-polyethylene versus metal-backed and stemmed tibial components in cemented total knee arthroplasty: A prospective, randomized RSA study. J Bone Joint Surg Br. 2001;83(6):825-831. doi:10.1302/0301-620X.83B6.0830825
- Gioe TJ, Bowman KR. A randomized comparison of all-polyethylene and metal-backed tibial components. Clin Orthop Relat Res. 2000;380:108-115.
- Hyldahl H, Regnér L, Carlsson L, Kärrholm J, Weidenhielm L. All-polyethylene vs. metal-backed tibial component in total knee arthroplasty: a randomized RSA study comparing early fixation of horizontally and completely cemented tibial components. Part 2: completely cemented components. MB not superior to AP components. Acta Orthop. 2005;76(6):778-784. doi:10.1080/17453670510045363
- Hyldahl H, Regnér L, Carlsson L, Kärrholm J, Weidenhielm L. All polyethylene vs. metal-backed tibial component in total knee arthroplasty: a randomized RSA study comparing early fixation of horizontally and completely cemented tibial components. Part 1: horizontally cemented components. AP better fixated than MB. Acta Orthop. 2005;76(6):769-777.
- Norgren B, Dalén T, Nilsson KG. All poly tibial component better than metal backed: a randomized RSA study. Knee. 2004;11(3):189-196. doi:10.1016/S0968-0160(03)00071-1
- Rodriguez JA, Baez N, Rasquinha V, Ranawat CS. Metal-backed and all-polyethylene tibial components in total knee replacement. Clin Orthop Relat Res. 2001;392:174-183. doi:10.1097/00003086-200111000-00021.
- Gioe TJ, Sinner P, Mehle S, Ma W, Killeen KK. Excellent survival of all polyethylene tibial components in a community joint registry. Clin Orthop Relat Res. 2007;464:88-92. doi:10.1097/BLO.0b013e31812f7879.
- Gioe TJ, Stroemer ES, Santos ER. All-polyethylene and metal-backed tibias have similar outcomes at 10 years: A randomized level I [corrected] evidence study. Clin Orthop Relat Res. 2007;455:212-218. doi:10.1097/01.blo.0000238863.69486.97.
- Gioe TJ, Glynn J, Sembrano J, Suthers K, Santos ER, Singh J. Mobile and fixed bearing (all-polyethylene tibial component) total knee arthroplasty designs: a prospective randomized trial. J Bone Joint Surg Am. 2009;91(9):2104-2112. doi:10.2106/JBJS.H.01442.
- Bettinson KA, Pinder IM, Moran CG, Weir DJ, Lingard EA. All-polyethylene compared with metal-backed tibial components in total knee arthroplasty at ten years: A prospective, randomized controlled trial. J Bone Joint Surg Am. 2009;91(7):1587-1594. doi:10.2106/JBJS.G.01427.
- Nouta KA, Verra WC, Pijls BG, Schoones JW, Nelissen RG. All-polyethylene tibial components are equal to metal-backed components: systematic review and meta-regression. Clin Orthop Relat Res. 2012;470(12):3549-3559. doi:10.1007/s11999-012-2582-2.
- Muller SD, Deehan DJ, Holland JP, et al. Should we reconsider all-polyethylene tibial implants in total knee replacement? J Bone Joint Surg Br. 2006;88(12):1596-1602. doi:10.1302/0301-620X.88B12.17695.
TAKE-HOME POINTS
- APT components have been shown to be cost-effective when compared to MBT designs in TKA.
- Revision rates would have to be substantially lower in MBT to afford a cost advantage over APT components.
- Given that only a small percentage of surgeons routinely use APT components, factors other than cost-effectiveness must influence the choice of implant.
- Surgeons may find that APT components are more technically demanding to use and they do not allow for modular stems or augmentations.
- Institutional cost data is known to vary widely among institutions, and our conclusions regarding comparable revision rates would change with different cost inputs.

Reoperation Rates After Cartilage Restoration Procedures in the Knee: Analysis of a Large US Commercial Database
ABSTRACT
The purpose of this study is to describe the rate of return to the operating room (OR) following microfracture (MFX), autologous chondrocyte implantation (ACI), osteochondral autograft transplantation (OATS), and osteochondral allograft (OCA) procedures at 90 days, 1 year, and 2 years. Current Procedural Terminology codes for all patients undergoing MFX, ACI, OATS, and OCA were used to search a prospectively collected, commercially available private payer insurance company database from 2007 to 2011. Within 90 days, 1 year, and 2 years after surgery, the database was searched for the occurrence of these same patients undergoing knee diagnostic arthroscopy with biopsy, lysis of adhesions, synovectomy, arthroscopy for infection or lavage, arthroscopy for removal of loose bodies, chondroplasty, MFX, ACI, OATS, OCA, and/or knee arthroplasty. Descriptive statistical analysis and contingency table analysis were performed. A total of 47,207 cartilage procedures were performed from 2007 to 2011, including 43,576 MFX, 640 ACI, 386 open OATS, 997 arthroscopic OATS, 714 open OCA, and 894 arthroscopic OCA procedures. The weighted average reoperation rates for all procedures were 5.87% at 90 days, 11.94% at 1 year, and 14.90% at 2 years following the index cartilage surgery. At 2 years, patients who underwent MFX, ACI, OATS, OCA had reoperation rates of 14.65%, 29.69%, 8.82%, and 12.22%, respectively. There was a statistically significantly increased risk for ACI return to OR within all intervals (P < .0001); however, MFX had a greater risk factor (P < .0001) for conversion to arthroplasty. There was no difference in failure/revision rates between the restorative treatment options. With a large US commercial insurance database from 2007 to 2011, reparative procedures were favored for chondral injuries, but yielded an increased risk for conversion to arthroplasty. There was no difference in failure/revision rates between the restorative approaches, yet cell-based approaches yielded a significantly increased risk for a return to the OR.
Continue to: Symptomatic, full-thickness articular cartilage
Symptomatic, full-thickness articular cartilage defects in the knee are difficult to manage, particularly in the young, athletic patient population. Fortunately, a variety of cartilage repair (direct repair of the cartilage or those procedures which attempt to generate fibrocartilage) and restoration (those aimed at restoring hyaline cartilage) procedures are available, with encouraging short- and long-term clinical outcomes. After failure of nonoperative management, several surgical options are available for treating symptomatic focal chondral defects, including microfracture (MFX), autologous chondrocyte implantation (ACI), osteochondral autograft transplantation (OATS), and open and arthroscopic osteochondral allograft (OCA) transplantation procedures.1,2 When appropriately indicated, each of these techniques has demonstrated good to excellent clinical outcomes with respect to reducing pain and improving function.3-5
While major complications following cartilage surgery are uncommon, the need for reoperation following an index articular cartilage operation is poorly understood. Recently, McCormick and colleagues6 found that reoperation within the first 2 years following meniscus allograft transplantation (MAT) is associated with an increased likelihood of revision MAT or future arthroplasty. Given the association between early reoperation following meniscus restoration surgery and subsequent failure, an improved understanding of the epidemiology and implications of reoperations following cartilage restoration surgery is warranted. Further, in deciding which treatment option is best suited to a particular patient, the rate of return to the operating room (OR) should be taken into consideration, as this could potentially influence surgical decision-making as to which procedure to perform, especially in value-based care decision-making environments.
The purpose of this study is to describe the rate of return to the OR for knee procedures following cartilage restoration at intervals of 90 days, 1 year, and 2 years across a large-scale US patient database. The authors hypothesize that the rate of return to the OR following knee cartilage repair or restoration procedures will be under 20% during the first post-operative year, with increasing reoperation rates over time. A secondary hypothesis is that there will be no difference in reoperation rates according to sex, but that younger patients (those younger than 40 years) will have higher reoperation rates than older patients.
METHODS
We performed a retrospective analysis of a prospectively collected, large-scale, and commercially available private payer insurance company database (PearlDiver) from 2007 to 2011. The PearlDiver database is a Health Insurance Portability and Accountability Act (HIPAA) compliant, publicly available national database consisting of a collection of private payer records, with United Health Group representing the contributing health plan. The database has more than 30 million patient records and contains Current Procedural Terminology (CPT) and International Classification of Diseases, Ninth Revision (ICD-9) codes related to orthopedic procedures. From 2007 to 2011, the private payer database captured between 5.9 million and 6.2 million patients per year.
Our search was based on the CPT codes for MFX (29879), ACI (27412), OATS (29866, 29867), and OCA (27415, 27416). Return to the OR for revision surgery for the above-mentioned procedures was classified as patients with a diagnosis of diagnostic arthroscopy with biopsy (CPT 29870), lysis of adhesions (CPT 29884), synovectomy (29875, 29876), arthroscopy for infection or lavage (CPT 29871), arthroscopy for removal of loose bodies (29874), chondroplasty (29877), unicompartmental knee arthroplasty (27446), total knee arthroplasty (27447), and/or patellar arthroplasty (27438). Patient records were followed for reoperations occurring within 90 days, 1 year, and 2 years after the index cartilage procedure. All data were compared based on patient age and sex.
Table 1. Breakdown of MFX, ACI, OATS, and OCA Procedures by Sex | ||||||
MFX | ACI | Open OATS | Arthroscopic OATS | Open OCA | Arthroscopic OCA | |
Females | 20,589 | 276 | 167 | 401 | 275 | 350 |
Males | 22,987 | 364 | 219 | 596 | 439 | 544 |
Total | 43,576 | 640 | 386 | 997 | 714 | 894 |
Abbreviations: ACI, autologous chondrocyte implantation; MFX, microfracture; OCA, osteochondral allograft; OATS, osteochondral autograft transplantation.
Continue to: Statistical analysis...
STATISTICAL ANALYSIS
Statistical analysis of this study was primarily descriptive to demonstrate the incidence for each code at each time interval. One-way analysis of variance, Chi-square analysis, and contingency tables were used to compare the incidence of each type of procedure throughout the various time intervals. A P-value of < 0.05 was considered statistically significant. Statistical analysis was performed using SPSS v.20 (International Business Machines).
RESULTS
A total of 47,207 cartilage procedures were performed from 2007 to 2011, including 43,576 MFX (92.3%) 640 ACI (1.4%), 386 open OATS (0.82%), 997 arthroscopic OATS (2.11%), 714 open OCA (1.51%), and 894 arthroscopic OCA (1.89%) procedures. A summary of the procedures performed, broken down by age and sex, is provided in Tables 1 and 2. A total of 25,149 male patients (53.3%) underwent surgical procedures compared to 22,058 female patients (46.7%). For each category of procedure (MFX, ACI, OATS, OCA), there was a significantly higher proportion of males than females undergoing surgery (P < .0001 for all). Surgical treatment with MFX was consistently the most frequently performed surgery across all age groups (92.31%), while cell-based therapy with ACI was the least frequently performed procedure across all age ranges (1.36%). Restorative OATS and OCA techniques were performed with the greatest frequency in the 15-year-old to 19-year-old age group, but were not utilized in patients over 64 years of age (Table 2).
Table 2. Breakdown of MFX, ACI, OATS, and OCA Procedures by Age | ||||
Age (y) | MFX | ACI | OATS | OCA |
10 to 14 | 572 | 22 | 74 | 47 |
15 to 19 | 1984 | 83 | 254 | 235 |
20 to 24 | 1468 | 54 | 140 | 144 |
25 to 29 | 1787 | 74 | 152 | 176 |
30 to 34 | 2824 | 114 | 152 | 204 |
35 to 39 | 4237 | 96 | 153 | 210 |
40 to 44 | 5441 | 103 | 166 | 217 |
45 to 49 | 7126 | 57 | 149 | 180 |
50 to 54 | 7004 | 25 | 83 | 140 |
55 to 59 | 6410 | 12 | 40 | 40 |
60 to 64 | 4409 | 0 | 20 | 15 |
65 to 69 | 269 | 0 | 0 | 0 |
70 to 74 | 45 | 0 | 0 | 0 |
Total | 43,576 | 640 | 1383 | 1608 |
Abbreviations: ACI, autologous chondrocyte implantation; MFX, microfracture; OCA, osteochondral allograft; OATS, osteochondral autograft transplantation.
A summary of all reoperation data is provided in Tables 3 to 7 and Figures 1 and 2. The weighted average reoperation rates for all procedures were 5.87% at 90 days, 11.94% at 1 year, and 14.90% at 2 years following the index cartilage surgery. Patients who underwent MFX had reoperation rates of 6.05% at 90 days, 11.80% at 1 year, and 14.65% at 2 years. Patients who underwent ACI had reoperation rates of 4.53% at 90 days, 23.28% at 1 year, and 29.69% at 2 years. Patients who had open and arthroscopic OATS had reoperation rates of 3.122% and 5.12% at 90 days, 6.74% and 8.53% at 1 year, and 7.51% and 10.13% at 2 years, respectively. Patients who underwent open and arthroscopic OCA had reoperation rates of 2.52% and 3.91% at 90 days, 7.14% and 6.60% at 1 year, and 13.59% and 10.85% at 2 years (Table 3). There was a statistically significantly increased risk for reoperation following ACI within all intervals compared to all other surgical techniques (P < .0001); however, MFX had a greater risk factor (P < .0001) for conversion to arthroplasty at 6.70%. There was no significant difference between failure rates (revision OATS/OCA or conversion to arthroplasty) between the restorative treatment options, with 14 failures for OATS (9.52% of reoperations at 2 years) compared to 22 failures for OCA (12.7% of reoperations at 2 years, P = .358). Among the entire cohort of cartilage surgery patients, arthroscopic chondroplasty was the most frequent procedure performed at the time of reoperation at all time points assessed, notably accounting for 33.08% of reoperations 2 years following microfracture, 51.58% of reoperations at 2 years following ACI, 53.06% of reoperations at 2 years following OATS, and 54.07% of reoperations at 2 years following OCA (Figure 3, Tables 4–7).
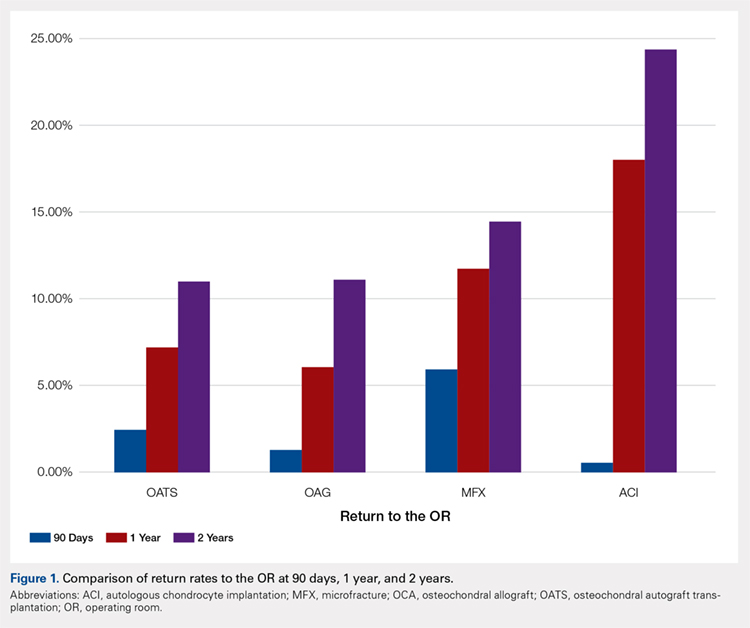
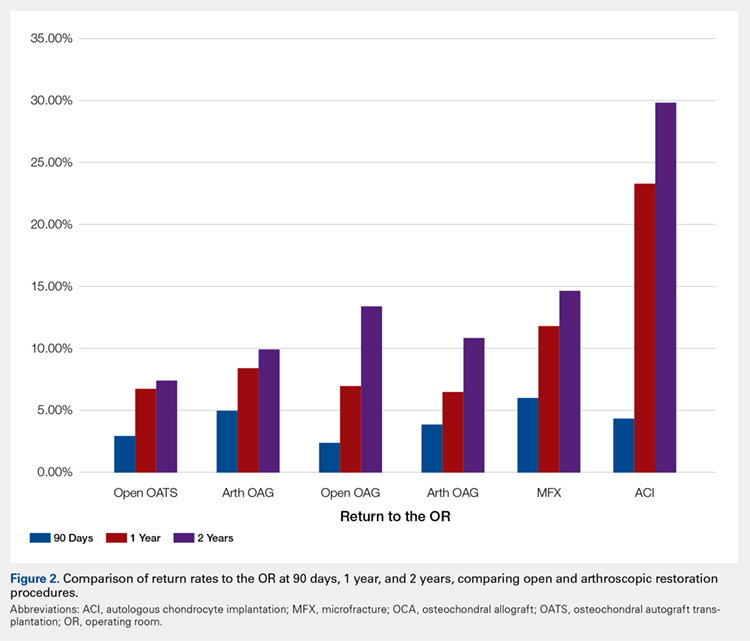
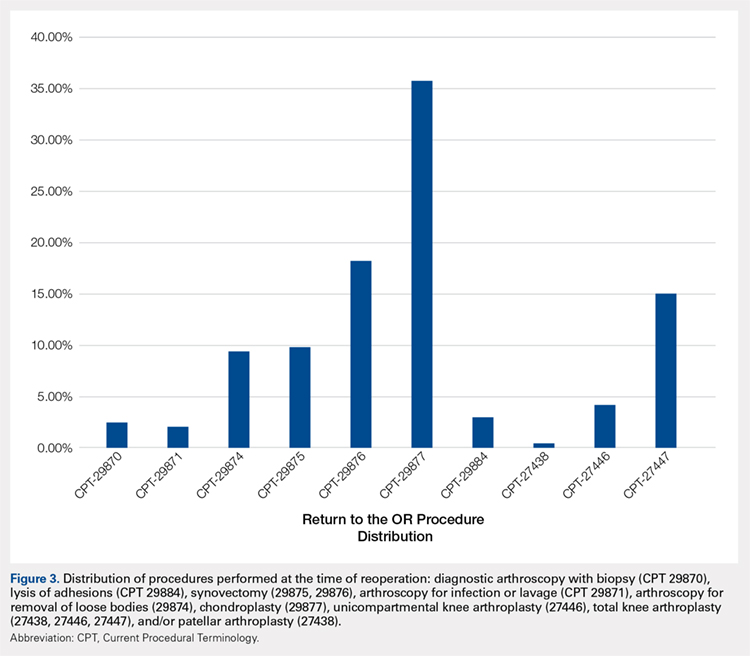
Table 3. Comparison of Return to OR Following MFX, ACI, OCA, and OATS | |||||||
Procedure | Total No. of Cases in Study Period | No. of Reoperations at 90 Days | Return to OR Rate at 90 Days | No. of Reoperations at 1 Year | Return to OR Rate at 1 Year | No. of Reoperations at 2 Years | Return to OR Rate at 2 Years |
MFX | 43,576 | 2636 | 6.05% | 5142 | 11.80% | 6385 | 14.65% |
ACI | 640 | 29 | 4.53% | 149 | 23.28% | 190 | 29.69% |
Open OATS | 386 | 12 | 3.12% | 26 | 6.74% | 29 | 7.51% |
Arthroscopic OATS | 997 | 51 | 5.12% | 85 | 8.53% | 101 | 10.13% |
Open OCA | 714 | 18 | 2.52% | 51 | 7.14% | 97 | 13.59% |
Arthroscopic OCA | 894 | 161 | 3.91% | 59 | 6.60% | 97 | 10.85% |
Weighted average for all procedures |
| 5.87% |
| 11.94% |
| 14.90% | |
Abbreviations: ACI, autologous chondrocyte implantation; MFX, microfracture; OCA, osteochondral allograft; OATS, osteochondral autograft transplantation; OR, operating room.
Table 4. Rate of Return to OR Following MFX (n = 43,574) | ||||
Procedure | CPT Code | 90 Days | 1 Year | 2 Years |
Knee arthroscopy | 29870 | 54 | 122 | 162 |
Knee arthroscopic drainage and lavage | 29871 | 84 | 102 | 104 |
Arthroscopic adhesions débridement | 29874 | 300 | 468 | 549 |
Arthroscopic synovectomy | 29875 | 324 | 528 | 611 |
Major arthroscopic synovectomy | 29876 | 557 | 926 | 1087 |
Knee arthroscopic chondroplasty | 29877 | 1063 | 1722 | 2112 |
Arthroscopic lysis of adhesions | 29884 | 61 | 129 | 171 |
Patellar arthroplasty | 27438 | 0 | 38 | 49 |
Medial or lateral knee arthroplasty | 27446 | 51 | 242 | 328 |
Medial and lateral knee arthroplasty | 27447 | 142 | 865 | 1212 |
Total | 2636 | 5142 | 6385 | |
Return to OR | 6.05% | 11.80% | 14.65% | |
Abbreviations: CPT, Current Procedural Terminology; MFX, microfracture; OR, operating room.
Table 5. Rate of Return to OR Following ACI (n = 640) | ||||
Procedure | CPT Code | 90 Daysa | 1 Yeara | 2 Yearsa |
Revision ACI | 27412 | 29 | 33 | 35 |
Knee arthroscopy | 29870 | -1 | -1 | -1 |
Knee arthroscopic drainage and lavage | 29871 | -1 | -1 | -1 |
Arthroscopic adhesions débridement | 29874 | 0 | -1 | -1 |
Arthroscopic synovectomy | 29875 | -1 | -1 | -1 |
Major arthroscopic synovectomy | 29876 | -1 | 12 | 20 |
Knee arthroscopic chondroplasty | 29877 | -1 | 71 | 98 |
Arthroscopic lysis of adhesions | 29884 | -1 | 33 | 37 |
Patellar arthroplasty | 27438 | 0 | 0 | 0 |
Medial or lateral knee arthroplasty | 27446 | 0 | -1 | -1 |
Medial and lateral knee arthroplasty | 27447 | 0 | -1 | -1 |
Total | 29 | 149 | 190 | |
Return to OR | 4.53% | 23.28% | 29.69% | |
aA -1 denotes No. <11 within the PearlDiver database, and exact numbers are not reported due to patient privacy considerations.
Abbreviations: ACI, autologous chondrocyte implantation; CPT, Current Procedural Terminology; OR, operating room.
Table 6. Rate of Return to OR Following OATS (n = 1320) | ||||
Procedure | CPT Code | 90 Days | 1 Year | 2 Years |
Knee arthroscopy | 29870 | 0 | 0 | 0 |
Knee arthroscopic drainage and lavage | 29871 | 0 | 0 | 0 |
Arthroscopic adhesions débridement | 29874 | 0 | 12 | 13 |
Arthroscopic synovectomy | 29875 | 0 | 0 | 14 |
Major arthroscopic synovectomy | 29876 | 16 | 25 | 28 |
Knee arthroscopic chondroplasty | 29877 | 17 | 58 | 78 |
Arthroscopic lysis of adhesions | 29884 | 0 | 0 | 0 |
Patellar arthroplasty | 27438 | 0 | 0 | 0 |
Medial or lateral knee arthroplasty | 27446 | 0 | 0 | 0 |
Medial and lateral knee arthroplasty | 27447 | 0 | 0 | 14 |
Total | 33 | 95 | 147 | |
Return to OR | 2.50% | 7.20% | 11.14% | |
Abbreviations: CPT, Current Procedural Terminology; OATS, osteochondral autograft transplantation; OR, operating room.
Table 7. Rate of Return to OR Following OCA Transplantation (n = 1531) | ||||
Procedure | CPT Code | 90 Days | 1 Year | 2 Year |
Knee arthroscopy | 29870 | 0 | 0 | 0 |
Knee arthroscopic drainage and lavage | 29871 | 0 | 0 | 0 |
Arthroscopic adhesions débridement | 29874 | 0 | 15 | 19 |
Arthroscopic synovectomy | 29875 | 0 | 0 | 0 |
Major arthroscopic synovectomy | 29876 | 0 | 20 | 38 |
Knee arthroscopic chondroplasty | 29877 | 22 | 59 | 93 |
Arthroscopic lysis of adhesions | 29884 | 0 | 0 | 0 |
Patellar arthroplasty | 27438 | 0 | 0 | 0 |
Medial or lateral knee arthroplasty | 27446 | 0 | 0 | 0 |
Medial and lateral knee arthroplasty | 27447 | 0 | 0 | 22 |
Total | 22 | 94 | 172 | |
Return to OR | 1.44% | 6.14% | 11.23% | |
Abbreviations: CPT, Current Procedural Terminology; OCA, osteochondral allograft; OR, operating room.
Continue to: Discussion...
DISCUSSION
The principle findings of this study demonstrate that there is an overall reoperation rate of 14.90% at 2 years following cartilage repair/restoration surgery, with the highest reoperation rates following MFX at 90 days, and ACI at both 1 year and 2 years following the index procedure. Also, patients undergoing index MFX as the index procedure have the highest risk for conversion to arthroplasty, reoperation rates for all cartilage surgeries increase over time, and arthroscopic chondroplasty is the most frequent procedure performed at the time of reoperation.
The management of symptomatic articular cartilage knee pathology is extremely challenging. With improvements in surgical technique, instrumentation, and clinical decision-making, indications are constantly evolving. Techniques that may work for “small” defects, though there is some debate as to what constitutes a “small” defect, are not necessarily going to be successful for larger defects, and this certainly varies depending on where the defect is located within the knee joint (distal femur vs patella vs trochlea, etc.). Recently, in a 2015 analysis of 3 level I or II studies, Miller and colleagues7 demonstrated both MFX and OATS to be viable, cost-effective, first-line treatment options for articular cartilage injuries, with similar clinical outcomes at 8.7 years. The authors noted cumulative reoperation rates of 29% among patients undergoing MFX compared to 13% among patients undergoing OATS. While ACI and OCA procedures were not included in their study, the reported reoperation rates of 29% following MFX and 13% following OATS at nearly 10 years suggest a possible increased need for reoperation following MFX over time (approximately 15% at 2 years in our study) and a stable rate of reoperation following OATS (approximately 11% at 2 years in our study). This finding is significant, as one of the goals with these procedures is to deliver effective, long-lasting pain relief and restoration of function. Interestingly, in this study, restorative OATS and OCA techniques were performed with the greatest frequency in the 15-year-old to 19-year-old age group, but were not performed in patients older than 64 years. This may be explained by the higher prevalence of acute traumatic injuries and osteochondritis dissecans diagnoses in younger patients compared with older patients, as these diagnoses are more often indicated to undergo restorative procedures as opposed to marrow stimulation.
In a 2016 systematic review of 20 studies incorporating 1117 patients, Campbell and colleagues8 assessed return-to-play rates following MFX, ACI, OATS, and OCA. The authors noted that return to sport (RTS) rates were greatest following OATS (89%), followed by OCA (88%), ACI (84%), and MFX (75%). Positive prognostic factors for RTS included younger age, shorter duration of preoperative symptoms, no history of prior ipsilateral knee surgery, and smaller chondral defects. Reoperation rates between the 4 techniques were not statistically compared in their study. Interestingly, in 2013, Chalmers and colleagues9 conducted a separate systematic review of 20 studies comprising 1375 patients undergoing MFX, ACI, or OATS. In their study, the authors found significant advantages following ACI and OATS compared to MFX with respect to patient-reported outcome scores but noted significantly faster RTS rates with MFX. Reoperation rates were noted to be similar between the 3 procedures (25% for ACI, 21% for MFX, and 28% for OATS) at an average 3.7 years following the index procedure. When considering these 2 systematic reviews together, despite a faster RTS rate following MFX, a greater proportion of patients seem to be able to RTS over time following other procedures such as OATS, OCA, and ACI. Unfortunately, these reviews do not provide insight as to the role, if any, of reoperation on return to play rates nor on overall clinical outcome scores on patients undergoing articular cartilage surgery. However, this information is valuable when counseling athletes who are in season and would like to RTS as soon as possible as opposed to those who do not have tight time constraints for when they need to RTS.
Regardless of the cartilage technique chosen, the goals of surgery remain similar—to reduce pain and improve function. For athletes, the ultimate goal is to return to the same level of play that the athlete was able to achieve prior to injury. Certainly, the need for reoperation following a cartilage surgery has implications on pain, function, and ability to RTS. Our review of nearly 50,000 cartilage surgeries demonstrates that reoperations following cartilage repair surgery are not uncommon, with a rate of 14.90% at 2 years, and that while reoperation rates are the highest following ACI, the rate of conversion to knee arthroplasty is highest following MFX. Due to the limitations of the PearlDiver database, it is not possible to determine the clinical outcomes of patients undergoing reoperation following cartilage surgery, but certainly, given these data, reoperation is clearly not necessarily indicative of clinical failure. This is highlighted by the fact that the most common procedure performed at the time of reoperation is arthroscopic chondroplasty, which, despite being an additional surgical procedure, may be acceptable for patients who wish to RTS, particularly in the setting of an index ACI in which there may be graft hypertrophy. Ideally, additional studies incorporating a cost-effectiveness analysis of each of the procedures, incorporating reoperation rates as well as patient-reported clinical outcomes, would be helpful to truly determine the patient and societal implications of reoperation following cartilage repair/restoration.
Many of the advantages and disadvantages of the described cartilage repair/restoration procedures have been well described.10-17 Microfracture is the most commonly utilized first-line repair/restoration option for small articular cartilage lesions, mainly due to its low cost, low morbidity, and relatively low level of difficulty.18 Despite these advantages, MFX is not without limitations, and the need for revision cartilage restoration and/or conversion to arthroplasty is concerning. In 2013, Salzmann and colleagues19 evaluated a cohort of 454 patients undergoing MFX for a symptomatic knee defect and noted a reoperation rate of 26.9% (n = 123) within 2 years of the index surgery, with risk factors for reoperation noted to include an increased number of pre-MFX ipsilateral knee surgeries, patellofemoral lesions, smoking, and lower preoperative numeric analog scale scores. The definition of reoperation in their study is unfortunately not described, and thus the extent of reoperation (arthroscopy to arthroplasty) is unclear. In a 2009 systematic review of 3122 patients (28 studies) undergoing MFX conducted by Mithoefer and colleagues,20 revision rates were noted to range from 2% to 31% depending on the study analyzed, with increasing revision rates after 2 years. Unfortunately, the heterogeneity of the included studies makes it difficult to determine which patients tend to fail over time.
Continue to: OATS...
OATS is a promising cartilage restoration technique indicated for treatment of patients with large, uncontained chondral lesions, and/or lesions with both bone and cartilage loss.1 OCA is similar to OATS but uses allograft tissue instead of autograft tissue and is typically considered a viable treatment option in larger lesions (>2 cm2).21 Cell-based ACI therapy has evolved substantially over the past decade and is now available as a third-generation model utilizing biodegradable 3-dimensional scaffolds seeded with chondrocytes. Reoperation rates following ACI can often be higher than those following other cartilage treatments, particularly given the known complication of graft hypertrophy and/or delamination. Harris and colleagues22 conducted a systematic review of 5276 subjects undergoing ACI (all generations), noting an overall reoperation rate of 33%, but a failure rate of 5.8% at an average of 22 months following ACI. Risk factors for reoperation included periosteal-based ACI as well as open (vs arthroscopic) ACI. In this study, we found a modestly lower return to OR rate of 29.69% at 2 years.
When the outcomes of patients undergoing OATS or OCA are compared to those of patients undergoing MFX or ACI, it can be difficult to interpret the results, as the indications for performing these procedures tend to be very different. Further, the reasons for reoperation, as well as the procedures performed at the time of reoperation, are often poorly described, making it difficult to truly quantify the risk of reoperation and the implications of reoperation for patients undergoing any of these index cartilage procedures.
Overall, in this database, the return to the OR rate approaches 15% at 2 years following cartilage surgery, with cell-based therapy demonstrating higher reoperation rates at 2 years, without the risk of conversion to arthroplasty. Reoperation rates appear to stabilize at 1 year following surgery and consist mostly of minor arthroscopic procedures. These findings can help surgeons counsel patients as to the rate and type of reoperations that can be expected following cartilage surgery. Additional research incorporating patient-reported outcomes and patient-specific risk factors are needed to complement these data as to the impact of reoperations on overall clinical outcomes. Further, studies incorporating 90-day, 1-year, and 2-year costs associated with cartilage surgery will help to determine which index procedure is the most cost effective over the short- and long-term.
LIMITATIONS
This study is not without limitations. The PearlDiver database is reliant upon accurate CPT and ICD-9 coding, which creates a potential for a reporting bias. The overall reliability of the analyses is dependent on the quality of the available data, which, as noted in previous PearlDiver studies,18,23-28 may include inaccurate billing codes, miscoding, and/or non-coding by physicians as potential sources of error. At the time of this study, the PearlDiver database did not provide consistent data points on laterality, and thus it is possible that the reported rates of reoperation overestimate the true reoperation rate following a given procedure. Fortunately, the reoperation rates for each procedure analyzed in this database study are consistent with those previously presented in the literature. In addition, it is not uncommon for patients receiving one of these procedures to have previously been treated with one of the others. Due to the inherent limitations of the PearlDiver database, this study did not investigate concomitant procedures performed along with the index procedure, nor did it investigate confounding factors such as comorbidities. The PearlDiver database does not provide data on defect size, location within the knee, concomitant pathologies (eg, meniscus tear), prior surgeries, or patient comorbidities, and while important, these factors cannot be accounted for in our analysis. The inability to account for these important factors, particularly concomitant diagnoses, procedures, and lesion size/location, represents an important limitation of this study, as this is a source of selection bias and may influence the need for reoperation in a given patient. Despite these limitations, the results of this study are supported by previous and current literature. In addition, the PearlDiver database, as a HIPAA-compliant database, does not report exact numbers when the value of the outcome of interest is between 0 and 10, which prohibits analysis of any cartilage procedure performed in a cohort of patients greater than 1 and less than 11. Finally, while not necessarily a limitation, it should be noted that CPT 29879 is not specific for microfracture, as the code also includes abrasion arthroplasty and drilling. Due to the limitations of the methodology of searching the database for this code, it is unclear as to how many patients underwent actual microfracture vs abrasion arthroplasty.
CONCLUSION
Within a large US commercial insurance database from 2007 to 2011, reparative procedures were favored for chondral injuries, but yielded an increased risk for conversion to arthroplasty. There was no difference between failure/revision rates among the restorative approaches, yet cell-based approaches yielded a significantly increased risk for a return to the OR.
- Farr J, Cole B, Dhawan A, Kercher J, Sherman S. Clinical cartilage restoration: evolution and overview. Clin Orthop Relat Res. 2011;469(10):2696-2705. doi:10.1007/s11999-010-1764-z.
- Alford JW, Cole BJ. Cartilage restoration, part 1: basic science, historical perspective, patient evaluation, and treatment options. Am J Sports Med. 2005;33(2):295-306. doi:10.1177/03635465004273510.
- Alford JW, Cole BJ. Cartilage restoration, part 2: techniques, outcomes, and future directions. Am J Sports Med. 2005;33(3):443-460. doi:10.1177/0363546505274578.
- Gudas R, Gudaitė A, Pocius A, et al. Ten-year follow-up of a prospective, randomized clinical study of mosaic osteochondral autologous transplantation versus microfracture for the treatment of osteochondral defects in the knee joint of athletes. Am J Sports Med. 2012;40(11):2499-2508. doi:10.1177/0363546512458763.
- Saris DBF, Vanlauwe J, Victor J, et al. Treatment of symptomatic cartilage defects of the knee: characterized chondrocyte implantation results in better clinical outcome at 36 months in a randomized trial compared to microfracture. Am J Sports Med. 2009;37(suppl 1):10-19. doi:10.1177/0363546509350694.
- McCormick F, Harris JD, Abrams GD, et al. Survival and reoperation rates after meniscal allograft transplantation: analysis of failures for 172 consecutive transplants at a minimum 2-year follow-up. Am J Sports Med. 2014;42(4):892-897. doi:10.1177/0363546513520115.
- Miller DJ, Smith MV, Matava MJ, Wright RW, Brophy RH. Microfracture and osteochondral autograft transplantation are cost-effective treatments for articular cartilage lesions of the distal femur. Am J Sports Med. 2015;43(9):2175-2181. doi:10.1177/0363546515591261.
- Campbell AB, Pineda M, Harris JD, Flanigan DC. Return to sport after articular cartilage repair in athletes' knees: a systematic review. Arthroscopy. 2016;32(4):651-668.
- Chalmers PN, Vigneswaran H, Harris JD, Cole BJ. Activity-related outcomes of articular cartilage surgery: a systematic review. Cartilage. 2013;4(3):193-203.
- Bentley G, Biant LC, Vijayan S, Macmull S, Skinner JA, Carrington RW. Minimum ten-year results of a prospective randomised study of autologous chondrocyte implantation versus mosaicplasty for symptomatic articular cartilage lesions of the knee. JBone Joint Surg Br. 2012;94(4):504-509. doi:10.1177/1947603513481603.
- Beris AE, Lykissas MG, Kostas-Agnantis I, Manoudis GN. Treatment of full-thickness chondral defects of the knee with autologous chondrocyte implantation: a functional evaluation with long-term follow-up. Am J Sports Med. 2012;40(3):562-567.
- Chahal J, Gross AE, Gross C, et al. Outcomes of osteochondral allograft transplantation in the knee. Arthroscopy. 2013;29(3):575-588. doi:10.1177/0363546511428778.
- Emmerson BC, Görtz S, Jamali AA, Chung C, Amiel D, Bugbee WD. Fresh osteochondral allografting in the treatment of osteochondritis dissecans of the femoral condyle. Am J Sports Med. 2007;35(6):907-914. doi:10.1177/0363546507299932.
- Gudas R, Stankevičius E, Monastyreckienė E, Pranys D, Kalesinskas R. Osteochondral autologous transplantation versus microfracture for the treatment of articular cartilage defects in the knee joint in athletes. Knee Surg Sports Traumatol Arthrosc. 2006;14(9):834-842. doi:10.1007/s00167-006-0067-0.
- Lynch TS, Patel RM, Benedick A, Amin NH, Jones MH, Miniaci A. Systematic review of autogenous osteochondral transplant outcomes. Arthroscopy. 2015;31(4):746-754. doi:10.1016/j.arthro.2014.11.018.
- Niemeyer P, Porichis S, Steinwachs M, et al. Long-term outcomes after first-generation autologous chondrocyte implantation for cartilage defects of the knee. Am J Sports Med. 2014;42(1):150-157. doi:10.1177/0363546513506593.
- Ulstein S, Årøen A, Røtterud J, Løken S, Engebretsen L, Heir S. Microfracture technique versus osteochondral autologous transplantation mosaicplasty in patients with articular chondral lesions of the knee: a prospective randomized trial with long-term follow-up. Knee Surg Sports Traumatol Arthrosc. 2014;22(6):1207-1215. doi:10.1007/s00167-014-2843-6.
- Montgomery S, Foster B, Ngo S, et al. Trends in the surgical treatment of articular cartilage defects of the knee in the United States. Knee Surg Sports Traumatol Arthrosc. 2014;22(9):2070-2075. doi:10.1007/s00167-013-2614-9.
- Salzmann GM, Sah B, Südkamp NP, Niemeyer P. Reoperative characteristics after microfracture of knee cartilage lesions in 454 patients. Knee Surg Sports Traumatol Arthrosc. 2013;21(2):365-371. doi:10.1007/s00167-012-1973-y.
- Mithoefer K, McAdams T, Williams RJ, Kreuz PC, Mandelbaum BR. Clinical efficacy of the microfracture technique for articular cartilage repair in the knee: an evidence-based systematic analysis. Am J Sports Med. 2009;37(10):2053-2063. doi:10.1177/0363546508328414.
- Wajsfisz A, Makridis KG, Djian P. Arthroscopic retrograde osteochondral autograft transplantation for cartilage lesions of the tibial plateau: a prospective study. Am J Sports Med. 2013;41(2):411-415. doi:10.1177/0363546512469091.
- Harris JD, Siston RA, Brophy RH, Lattermann C, Carey JL, Flanigan DC. Failures, re-operations, and complications after autologous chondrocyte implantation–a systematic review. Osteoarthritis Cartilage. 2011;19(7):779-791. doi:10.1016/j.joca.2011.02.010.
- Abrams GD, Frank RM, Gupta AK, Harris JD, McCormick FM, Cole BJ. Trends in meniscus repair and meniscectomy in the United States, 2005-2011. Am J Sports Med. 2013;41(10):2333-2339. doi:10.1177/0363546513495641.
- Montgomery SR, Ngo SS, Hobson T, et al. Trends and demographics in hip arthroscopy in the United States. Arthroscopy. 2013;29(4):661-665. doi:10.1016/j.arthro.2012.11.005.
- Yeranosian MG, Arshi A, Terrell RD, Wang JC, McAllister DR, Petrigliano FA. Incidence of acute postoperative infections requiring reoperation after arthroscopic shoulder surgery. Am J Sports Med. 2014;42(2):437-441. doi:10.1177/0363546513510686.
- Zhang AL, Montgomery SR, Ngo SS, Hame SL, Wang JC, Gamradt SC. Arthroscopic versus open shoulder stabilization: current practice patterns in the United States. Arthroscopy. 2014;30(4):436-443. doi:10.1016/j.arthro.2013.12.013.
- Werner BC, Carr JB, Wiggins JC, Gwathmey FW, Browne JA. Manipulation under anesthesia after total knee arthroplasty is associated with an increased incidence of subsequent revision surgery. J Arthroplasty. 2015;30(suppl 9):72-75. doi:10.1016/j.arth.2015.01.061.
- Carr JB 2nd, Werner BC, Browne JA. Trends and outcomes in the treatment of failed septic total knee arthroplasty: comparing arthrodesis and above-knee amputation. J Arthroplasty. 2016;31(7):1574-1577. doi:10.1016/j.arth.2016.01.010.
ABSTRACT
The purpose of this study is to describe the rate of return to the operating room (OR) following microfracture (MFX), autologous chondrocyte implantation (ACI), osteochondral autograft transplantation (OATS), and osteochondral allograft (OCA) procedures at 90 days, 1 year, and 2 years. Current Procedural Terminology codes for all patients undergoing MFX, ACI, OATS, and OCA were used to search a prospectively collected, commercially available private payer insurance company database from 2007 to 2011. Within 90 days, 1 year, and 2 years after surgery, the database was searched for the occurrence of these same patients undergoing knee diagnostic arthroscopy with biopsy, lysis of adhesions, synovectomy, arthroscopy for infection or lavage, arthroscopy for removal of loose bodies, chondroplasty, MFX, ACI, OATS, OCA, and/or knee arthroplasty. Descriptive statistical analysis and contingency table analysis were performed. A total of 47,207 cartilage procedures were performed from 2007 to 2011, including 43,576 MFX, 640 ACI, 386 open OATS, 997 arthroscopic OATS, 714 open OCA, and 894 arthroscopic OCA procedures. The weighted average reoperation rates for all procedures were 5.87% at 90 days, 11.94% at 1 year, and 14.90% at 2 years following the index cartilage surgery. At 2 years, patients who underwent MFX, ACI, OATS, OCA had reoperation rates of 14.65%, 29.69%, 8.82%, and 12.22%, respectively. There was a statistically significantly increased risk for ACI return to OR within all intervals (P < .0001); however, MFX had a greater risk factor (P < .0001) for conversion to arthroplasty. There was no difference in failure/revision rates between the restorative treatment options. With a large US commercial insurance database from 2007 to 2011, reparative procedures were favored for chondral injuries, but yielded an increased risk for conversion to arthroplasty. There was no difference in failure/revision rates between the restorative approaches, yet cell-based approaches yielded a significantly increased risk for a return to the OR.
Continue to: Symptomatic, full-thickness articular cartilage
Symptomatic, full-thickness articular cartilage defects in the knee are difficult to manage, particularly in the young, athletic patient population. Fortunately, a variety of cartilage repair (direct repair of the cartilage or those procedures which attempt to generate fibrocartilage) and restoration (those aimed at restoring hyaline cartilage) procedures are available, with encouraging short- and long-term clinical outcomes. After failure of nonoperative management, several surgical options are available for treating symptomatic focal chondral defects, including microfracture (MFX), autologous chondrocyte implantation (ACI), osteochondral autograft transplantation (OATS), and open and arthroscopic osteochondral allograft (OCA) transplantation procedures.1,2 When appropriately indicated, each of these techniques has demonstrated good to excellent clinical outcomes with respect to reducing pain and improving function.3-5
While major complications following cartilage surgery are uncommon, the need for reoperation following an index articular cartilage operation is poorly understood. Recently, McCormick and colleagues6 found that reoperation within the first 2 years following meniscus allograft transplantation (MAT) is associated with an increased likelihood of revision MAT or future arthroplasty. Given the association between early reoperation following meniscus restoration surgery and subsequent failure, an improved understanding of the epidemiology and implications of reoperations following cartilage restoration surgery is warranted. Further, in deciding which treatment option is best suited to a particular patient, the rate of return to the operating room (OR) should be taken into consideration, as this could potentially influence surgical decision-making as to which procedure to perform, especially in value-based care decision-making environments.
The purpose of this study is to describe the rate of return to the OR for knee procedures following cartilage restoration at intervals of 90 days, 1 year, and 2 years across a large-scale US patient database. The authors hypothesize that the rate of return to the OR following knee cartilage repair or restoration procedures will be under 20% during the first post-operative year, with increasing reoperation rates over time. A secondary hypothesis is that there will be no difference in reoperation rates according to sex, but that younger patients (those younger than 40 years) will have higher reoperation rates than older patients.
METHODS
We performed a retrospective analysis of a prospectively collected, large-scale, and commercially available private payer insurance company database (PearlDiver) from 2007 to 2011. The PearlDiver database is a Health Insurance Portability and Accountability Act (HIPAA) compliant, publicly available national database consisting of a collection of private payer records, with United Health Group representing the contributing health plan. The database has more than 30 million patient records and contains Current Procedural Terminology (CPT) and International Classification of Diseases, Ninth Revision (ICD-9) codes related to orthopedic procedures. From 2007 to 2011, the private payer database captured between 5.9 million and 6.2 million patients per year.
Our search was based on the CPT codes for MFX (29879), ACI (27412), OATS (29866, 29867), and OCA (27415, 27416). Return to the OR for revision surgery for the above-mentioned procedures was classified as patients with a diagnosis of diagnostic arthroscopy with biopsy (CPT 29870), lysis of adhesions (CPT 29884), synovectomy (29875, 29876), arthroscopy for infection or lavage (CPT 29871), arthroscopy for removal of loose bodies (29874), chondroplasty (29877), unicompartmental knee arthroplasty (27446), total knee arthroplasty (27447), and/or patellar arthroplasty (27438). Patient records were followed for reoperations occurring within 90 days, 1 year, and 2 years after the index cartilage procedure. All data were compared based on patient age and sex.
Table 1. Breakdown of MFX, ACI, OATS, and OCA Procedures by Sex | ||||||
MFX | ACI | Open OATS | Arthroscopic OATS | Open OCA | Arthroscopic OCA | |
Females | 20,589 | 276 | 167 | 401 | 275 | 350 |
Males | 22,987 | 364 | 219 | 596 | 439 | 544 |
Total | 43,576 | 640 | 386 | 997 | 714 | 894 |
Abbreviations: ACI, autologous chondrocyte implantation; MFX, microfracture; OCA, osteochondral allograft; OATS, osteochondral autograft transplantation.
Continue to: Statistical analysis...
STATISTICAL ANALYSIS
Statistical analysis of this study was primarily descriptive to demonstrate the incidence for each code at each time interval. One-way analysis of variance, Chi-square analysis, and contingency tables were used to compare the incidence of each type of procedure throughout the various time intervals. A P-value of < 0.05 was considered statistically significant. Statistical analysis was performed using SPSS v.20 (International Business Machines).
RESULTS
A total of 47,207 cartilage procedures were performed from 2007 to 2011, including 43,576 MFX (92.3%) 640 ACI (1.4%), 386 open OATS (0.82%), 997 arthroscopic OATS (2.11%), 714 open OCA (1.51%), and 894 arthroscopic OCA (1.89%) procedures. A summary of the procedures performed, broken down by age and sex, is provided in Tables 1 and 2. A total of 25,149 male patients (53.3%) underwent surgical procedures compared to 22,058 female patients (46.7%). For each category of procedure (MFX, ACI, OATS, OCA), there was a significantly higher proportion of males than females undergoing surgery (P < .0001 for all). Surgical treatment with MFX was consistently the most frequently performed surgery across all age groups (92.31%), while cell-based therapy with ACI was the least frequently performed procedure across all age ranges (1.36%). Restorative OATS and OCA techniques were performed with the greatest frequency in the 15-year-old to 19-year-old age group, but were not utilized in patients over 64 years of age (Table 2).
Table 2. Breakdown of MFX, ACI, OATS, and OCA Procedures by Age | ||||
Age (y) | MFX | ACI | OATS | OCA |
10 to 14 | 572 | 22 | 74 | 47 |
15 to 19 | 1984 | 83 | 254 | 235 |
20 to 24 | 1468 | 54 | 140 | 144 |
25 to 29 | 1787 | 74 | 152 | 176 |
30 to 34 | 2824 | 114 | 152 | 204 |
35 to 39 | 4237 | 96 | 153 | 210 |
40 to 44 | 5441 | 103 | 166 | 217 |
45 to 49 | 7126 | 57 | 149 | 180 |
50 to 54 | 7004 | 25 | 83 | 140 |
55 to 59 | 6410 | 12 | 40 | 40 |
60 to 64 | 4409 | 0 | 20 | 15 |
65 to 69 | 269 | 0 | 0 | 0 |
70 to 74 | 45 | 0 | 0 | 0 |
Total | 43,576 | 640 | 1383 | 1608 |
Abbreviations: ACI, autologous chondrocyte implantation; MFX, microfracture; OCA, osteochondral allograft; OATS, osteochondral autograft transplantation.
A summary of all reoperation data is provided in Tables 3 to 7 and Figures 1 and 2. The weighted average reoperation rates for all procedures were 5.87% at 90 days, 11.94% at 1 year, and 14.90% at 2 years following the index cartilage surgery. Patients who underwent MFX had reoperation rates of 6.05% at 90 days, 11.80% at 1 year, and 14.65% at 2 years. Patients who underwent ACI had reoperation rates of 4.53% at 90 days, 23.28% at 1 year, and 29.69% at 2 years. Patients who had open and arthroscopic OATS had reoperation rates of 3.122% and 5.12% at 90 days, 6.74% and 8.53% at 1 year, and 7.51% and 10.13% at 2 years, respectively. Patients who underwent open and arthroscopic OCA had reoperation rates of 2.52% and 3.91% at 90 days, 7.14% and 6.60% at 1 year, and 13.59% and 10.85% at 2 years (Table 3). There was a statistically significantly increased risk for reoperation following ACI within all intervals compared to all other surgical techniques (P < .0001); however, MFX had a greater risk factor (P < .0001) for conversion to arthroplasty at 6.70%. There was no significant difference between failure rates (revision OATS/OCA or conversion to arthroplasty) between the restorative treatment options, with 14 failures for OATS (9.52% of reoperations at 2 years) compared to 22 failures for OCA (12.7% of reoperations at 2 years, P = .358). Among the entire cohort of cartilage surgery patients, arthroscopic chondroplasty was the most frequent procedure performed at the time of reoperation at all time points assessed, notably accounting for 33.08% of reoperations 2 years following microfracture, 51.58% of reoperations at 2 years following ACI, 53.06% of reoperations at 2 years following OATS, and 54.07% of reoperations at 2 years following OCA (Figure 3, Tables 4–7).
Table 3. Comparison of Return to OR Following MFX, ACI, OCA, and OATS | |||||||
Procedure | Total No. of Cases in Study Period | No. of Reoperations at 90 Days | Return to OR Rate at 90 Days | No. of Reoperations at 1 Year | Return to OR Rate at 1 Year | No. of Reoperations at 2 Years | Return to OR Rate at 2 Years |
MFX | 43,576 | 2636 | 6.05% | 5142 | 11.80% | 6385 | 14.65% |
ACI | 640 | 29 | 4.53% | 149 | 23.28% | 190 | 29.69% |
Open OATS | 386 | 12 | 3.12% | 26 | 6.74% | 29 | 7.51% |
Arthroscopic OATS | 997 | 51 | 5.12% | 85 | 8.53% | 101 | 10.13% |
Open OCA | 714 | 18 | 2.52% | 51 | 7.14% | 97 | 13.59% |
Arthroscopic OCA | 894 | 161 | 3.91% | 59 | 6.60% | 97 | 10.85% |
Weighted average for all procedures |
| 5.87% |
| 11.94% |
| 14.90% | |
Abbreviations: ACI, autologous chondrocyte implantation; MFX, microfracture; OCA, osteochondral allograft; OATS, osteochondral autograft transplantation; OR, operating room.
Table 4. Rate of Return to OR Following MFX (n = 43,574) | ||||
Procedure | CPT Code | 90 Days | 1 Year | 2 Years |
Knee arthroscopy | 29870 | 54 | 122 | 162 |
Knee arthroscopic drainage and lavage | 29871 | 84 | 102 | 104 |
Arthroscopic adhesions débridement | 29874 | 300 | 468 | 549 |
Arthroscopic synovectomy | 29875 | 324 | 528 | 611 |
Major arthroscopic synovectomy | 29876 | 557 | 926 | 1087 |
Knee arthroscopic chondroplasty | 29877 | 1063 | 1722 | 2112 |
Arthroscopic lysis of adhesions | 29884 | 61 | 129 | 171 |
Patellar arthroplasty | 27438 | 0 | 38 | 49 |
Medial or lateral knee arthroplasty | 27446 | 51 | 242 | 328 |
Medial and lateral knee arthroplasty | 27447 | 142 | 865 | 1212 |
Total | 2636 | 5142 | 6385 | |
Return to OR | 6.05% | 11.80% | 14.65% | |
Abbreviations: CPT, Current Procedural Terminology; MFX, microfracture; OR, operating room.
Table 5. Rate of Return to OR Following ACI (n = 640) | ||||
Procedure | CPT Code | 90 Daysa | 1 Yeara | 2 Yearsa |
Revision ACI | 27412 | 29 | 33 | 35 |
Knee arthroscopy | 29870 | -1 | -1 | -1 |
Knee arthroscopic drainage and lavage | 29871 | -1 | -1 | -1 |
Arthroscopic adhesions débridement | 29874 | 0 | -1 | -1 |
Arthroscopic synovectomy | 29875 | -1 | -1 | -1 |
Major arthroscopic synovectomy | 29876 | -1 | 12 | 20 |
Knee arthroscopic chondroplasty | 29877 | -1 | 71 | 98 |
Arthroscopic lysis of adhesions | 29884 | -1 | 33 | 37 |
Patellar arthroplasty | 27438 | 0 | 0 | 0 |
Medial or lateral knee arthroplasty | 27446 | 0 | -1 | -1 |
Medial and lateral knee arthroplasty | 27447 | 0 | -1 | -1 |
Total | 29 | 149 | 190 | |
Return to OR | 4.53% | 23.28% | 29.69% | |
aA -1 denotes No. <11 within the PearlDiver database, and exact numbers are not reported due to patient privacy considerations.
Abbreviations: ACI, autologous chondrocyte implantation; CPT, Current Procedural Terminology; OR, operating room.
Table 6. Rate of Return to OR Following OATS (n = 1320) | ||||
Procedure | CPT Code | 90 Days | 1 Year | 2 Years |
Knee arthroscopy | 29870 | 0 | 0 | 0 |
Knee arthroscopic drainage and lavage | 29871 | 0 | 0 | 0 |
Arthroscopic adhesions débridement | 29874 | 0 | 12 | 13 |
Arthroscopic synovectomy | 29875 | 0 | 0 | 14 |
Major arthroscopic synovectomy | 29876 | 16 | 25 | 28 |
Knee arthroscopic chondroplasty | 29877 | 17 | 58 | 78 |
Arthroscopic lysis of adhesions | 29884 | 0 | 0 | 0 |
Patellar arthroplasty | 27438 | 0 | 0 | 0 |
Medial or lateral knee arthroplasty | 27446 | 0 | 0 | 0 |
Medial and lateral knee arthroplasty | 27447 | 0 | 0 | 14 |
Total | 33 | 95 | 147 | |
Return to OR | 2.50% | 7.20% | 11.14% | |
Abbreviations: CPT, Current Procedural Terminology; OATS, osteochondral autograft transplantation; OR, operating room.
Table 7. Rate of Return to OR Following OCA Transplantation (n = 1531) | ||||
Procedure | CPT Code | 90 Days | 1 Year | 2 Year |
Knee arthroscopy | 29870 | 0 | 0 | 0 |
Knee arthroscopic drainage and lavage | 29871 | 0 | 0 | 0 |
Arthroscopic adhesions débridement | 29874 | 0 | 15 | 19 |
Arthroscopic synovectomy | 29875 | 0 | 0 | 0 |
Major arthroscopic synovectomy | 29876 | 0 | 20 | 38 |
Knee arthroscopic chondroplasty | 29877 | 22 | 59 | 93 |
Arthroscopic lysis of adhesions | 29884 | 0 | 0 | 0 |
Patellar arthroplasty | 27438 | 0 | 0 | 0 |
Medial or lateral knee arthroplasty | 27446 | 0 | 0 | 0 |
Medial and lateral knee arthroplasty | 27447 | 0 | 0 | 22 |
Total | 22 | 94 | 172 | |
Return to OR | 1.44% | 6.14% | 11.23% | |
Abbreviations: CPT, Current Procedural Terminology; OCA, osteochondral allograft; OR, operating room.
Continue to: Discussion...
DISCUSSION
The principle findings of this study demonstrate that there is an overall reoperation rate of 14.90% at 2 years following cartilage repair/restoration surgery, with the highest reoperation rates following MFX at 90 days, and ACI at both 1 year and 2 years following the index procedure. Also, patients undergoing index MFX as the index procedure have the highest risk for conversion to arthroplasty, reoperation rates for all cartilage surgeries increase over time, and arthroscopic chondroplasty is the most frequent procedure performed at the time of reoperation.
The management of symptomatic articular cartilage knee pathology is extremely challenging. With improvements in surgical technique, instrumentation, and clinical decision-making, indications are constantly evolving. Techniques that may work for “small” defects, though there is some debate as to what constitutes a “small” defect, are not necessarily going to be successful for larger defects, and this certainly varies depending on where the defect is located within the knee joint (distal femur vs patella vs trochlea, etc.). Recently, in a 2015 analysis of 3 level I or II studies, Miller and colleagues7 demonstrated both MFX and OATS to be viable, cost-effective, first-line treatment options for articular cartilage injuries, with similar clinical outcomes at 8.7 years. The authors noted cumulative reoperation rates of 29% among patients undergoing MFX compared to 13% among patients undergoing OATS. While ACI and OCA procedures were not included in their study, the reported reoperation rates of 29% following MFX and 13% following OATS at nearly 10 years suggest a possible increased need for reoperation following MFX over time (approximately 15% at 2 years in our study) and a stable rate of reoperation following OATS (approximately 11% at 2 years in our study). This finding is significant, as one of the goals with these procedures is to deliver effective, long-lasting pain relief and restoration of function. Interestingly, in this study, restorative OATS and OCA techniques were performed with the greatest frequency in the 15-year-old to 19-year-old age group, but were not performed in patients older than 64 years. This may be explained by the higher prevalence of acute traumatic injuries and osteochondritis dissecans diagnoses in younger patients compared with older patients, as these diagnoses are more often indicated to undergo restorative procedures as opposed to marrow stimulation.
In a 2016 systematic review of 20 studies incorporating 1117 patients, Campbell and colleagues8 assessed return-to-play rates following MFX, ACI, OATS, and OCA. The authors noted that return to sport (RTS) rates were greatest following OATS (89%), followed by OCA (88%), ACI (84%), and MFX (75%). Positive prognostic factors for RTS included younger age, shorter duration of preoperative symptoms, no history of prior ipsilateral knee surgery, and smaller chondral defects. Reoperation rates between the 4 techniques were not statistically compared in their study. Interestingly, in 2013, Chalmers and colleagues9 conducted a separate systematic review of 20 studies comprising 1375 patients undergoing MFX, ACI, or OATS. In their study, the authors found significant advantages following ACI and OATS compared to MFX with respect to patient-reported outcome scores but noted significantly faster RTS rates with MFX. Reoperation rates were noted to be similar between the 3 procedures (25% for ACI, 21% for MFX, and 28% for OATS) at an average 3.7 years following the index procedure. When considering these 2 systematic reviews together, despite a faster RTS rate following MFX, a greater proportion of patients seem to be able to RTS over time following other procedures such as OATS, OCA, and ACI. Unfortunately, these reviews do not provide insight as to the role, if any, of reoperation on return to play rates nor on overall clinical outcome scores on patients undergoing articular cartilage surgery. However, this information is valuable when counseling athletes who are in season and would like to RTS as soon as possible as opposed to those who do not have tight time constraints for when they need to RTS.
Regardless of the cartilage technique chosen, the goals of surgery remain similar—to reduce pain and improve function. For athletes, the ultimate goal is to return to the same level of play that the athlete was able to achieve prior to injury. Certainly, the need for reoperation following a cartilage surgery has implications on pain, function, and ability to RTS. Our review of nearly 50,000 cartilage surgeries demonstrates that reoperations following cartilage repair surgery are not uncommon, with a rate of 14.90% at 2 years, and that while reoperation rates are the highest following ACI, the rate of conversion to knee arthroplasty is highest following MFX. Due to the limitations of the PearlDiver database, it is not possible to determine the clinical outcomes of patients undergoing reoperation following cartilage surgery, but certainly, given these data, reoperation is clearly not necessarily indicative of clinical failure. This is highlighted by the fact that the most common procedure performed at the time of reoperation is arthroscopic chondroplasty, which, despite being an additional surgical procedure, may be acceptable for patients who wish to RTS, particularly in the setting of an index ACI in which there may be graft hypertrophy. Ideally, additional studies incorporating a cost-effectiveness analysis of each of the procedures, incorporating reoperation rates as well as patient-reported clinical outcomes, would be helpful to truly determine the patient and societal implications of reoperation following cartilage repair/restoration.
Many of the advantages and disadvantages of the described cartilage repair/restoration procedures have been well described.10-17 Microfracture is the most commonly utilized first-line repair/restoration option for small articular cartilage lesions, mainly due to its low cost, low morbidity, and relatively low level of difficulty.18 Despite these advantages, MFX is not without limitations, and the need for revision cartilage restoration and/or conversion to arthroplasty is concerning. In 2013, Salzmann and colleagues19 evaluated a cohort of 454 patients undergoing MFX for a symptomatic knee defect and noted a reoperation rate of 26.9% (n = 123) within 2 years of the index surgery, with risk factors for reoperation noted to include an increased number of pre-MFX ipsilateral knee surgeries, patellofemoral lesions, smoking, and lower preoperative numeric analog scale scores. The definition of reoperation in their study is unfortunately not described, and thus the extent of reoperation (arthroscopy to arthroplasty) is unclear. In a 2009 systematic review of 3122 patients (28 studies) undergoing MFX conducted by Mithoefer and colleagues,20 revision rates were noted to range from 2% to 31% depending on the study analyzed, with increasing revision rates after 2 years. Unfortunately, the heterogeneity of the included studies makes it difficult to determine which patients tend to fail over time.
Continue to: OATS...
OATS is a promising cartilage restoration technique indicated for treatment of patients with large, uncontained chondral lesions, and/or lesions with both bone and cartilage loss.1 OCA is similar to OATS but uses allograft tissue instead of autograft tissue and is typically considered a viable treatment option in larger lesions (>2 cm2).21 Cell-based ACI therapy has evolved substantially over the past decade and is now available as a third-generation model utilizing biodegradable 3-dimensional scaffolds seeded with chondrocytes. Reoperation rates following ACI can often be higher than those following other cartilage treatments, particularly given the known complication of graft hypertrophy and/or delamination. Harris and colleagues22 conducted a systematic review of 5276 subjects undergoing ACI (all generations), noting an overall reoperation rate of 33%, but a failure rate of 5.8% at an average of 22 months following ACI. Risk factors for reoperation included periosteal-based ACI as well as open (vs arthroscopic) ACI. In this study, we found a modestly lower return to OR rate of 29.69% at 2 years.
When the outcomes of patients undergoing OATS or OCA are compared to those of patients undergoing MFX or ACI, it can be difficult to interpret the results, as the indications for performing these procedures tend to be very different. Further, the reasons for reoperation, as well as the procedures performed at the time of reoperation, are often poorly described, making it difficult to truly quantify the risk of reoperation and the implications of reoperation for patients undergoing any of these index cartilage procedures.
Overall, in this database, the return to the OR rate approaches 15% at 2 years following cartilage surgery, with cell-based therapy demonstrating higher reoperation rates at 2 years, without the risk of conversion to arthroplasty. Reoperation rates appear to stabilize at 1 year following surgery and consist mostly of minor arthroscopic procedures. These findings can help surgeons counsel patients as to the rate and type of reoperations that can be expected following cartilage surgery. Additional research incorporating patient-reported outcomes and patient-specific risk factors are needed to complement these data as to the impact of reoperations on overall clinical outcomes. Further, studies incorporating 90-day, 1-year, and 2-year costs associated with cartilage surgery will help to determine which index procedure is the most cost effective over the short- and long-term.
LIMITATIONS
This study is not without limitations. The PearlDiver database is reliant upon accurate CPT and ICD-9 coding, which creates a potential for a reporting bias. The overall reliability of the analyses is dependent on the quality of the available data, which, as noted in previous PearlDiver studies,18,23-28 may include inaccurate billing codes, miscoding, and/or non-coding by physicians as potential sources of error. At the time of this study, the PearlDiver database did not provide consistent data points on laterality, and thus it is possible that the reported rates of reoperation overestimate the true reoperation rate following a given procedure. Fortunately, the reoperation rates for each procedure analyzed in this database study are consistent with those previously presented in the literature. In addition, it is not uncommon for patients receiving one of these procedures to have previously been treated with one of the others. Due to the inherent limitations of the PearlDiver database, this study did not investigate concomitant procedures performed along with the index procedure, nor did it investigate confounding factors such as comorbidities. The PearlDiver database does not provide data on defect size, location within the knee, concomitant pathologies (eg, meniscus tear), prior surgeries, or patient comorbidities, and while important, these factors cannot be accounted for in our analysis. The inability to account for these important factors, particularly concomitant diagnoses, procedures, and lesion size/location, represents an important limitation of this study, as this is a source of selection bias and may influence the need for reoperation in a given patient. Despite these limitations, the results of this study are supported by previous and current literature. In addition, the PearlDiver database, as a HIPAA-compliant database, does not report exact numbers when the value of the outcome of interest is between 0 and 10, which prohibits analysis of any cartilage procedure performed in a cohort of patients greater than 1 and less than 11. Finally, while not necessarily a limitation, it should be noted that CPT 29879 is not specific for microfracture, as the code also includes abrasion arthroplasty and drilling. Due to the limitations of the methodology of searching the database for this code, it is unclear as to how many patients underwent actual microfracture vs abrasion arthroplasty.
CONCLUSION
Within a large US commercial insurance database from 2007 to 2011, reparative procedures were favored for chondral injuries, but yielded an increased risk for conversion to arthroplasty. There was no difference between failure/revision rates among the restorative approaches, yet cell-based approaches yielded a significantly increased risk for a return to the OR.
- Farr J, Cole B, Dhawan A, Kercher J, Sherman S. Clinical cartilage restoration: evolution and overview. Clin Orthop Relat Res. 2011;469(10):2696-2705. doi:10.1007/s11999-010-1764-z.
- Alford JW, Cole BJ. Cartilage restoration, part 1: basic science, historical perspective, patient evaluation, and treatment options. Am J Sports Med. 2005;33(2):295-306. doi:10.1177/03635465004273510.
- Alford JW, Cole BJ. Cartilage restoration, part 2: techniques, outcomes, and future directions. Am J Sports Med. 2005;33(3):443-460. doi:10.1177/0363546505274578.
- Gudas R, Gudaitė A, Pocius A, et al. Ten-year follow-up of a prospective, randomized clinical study of mosaic osteochondral autologous transplantation versus microfracture for the treatment of osteochondral defects in the knee joint of athletes. Am J Sports Med. 2012;40(11):2499-2508. doi:10.1177/0363546512458763.
- Saris DBF, Vanlauwe J, Victor J, et al. Treatment of symptomatic cartilage defects of the knee: characterized chondrocyte implantation results in better clinical outcome at 36 months in a randomized trial compared to microfracture. Am J Sports Med. 2009;37(suppl 1):10-19. doi:10.1177/0363546509350694.
- McCormick F, Harris JD, Abrams GD, et al. Survival and reoperation rates after meniscal allograft transplantation: analysis of failures for 172 consecutive transplants at a minimum 2-year follow-up. Am J Sports Med. 2014;42(4):892-897. doi:10.1177/0363546513520115.
- Miller DJ, Smith MV, Matava MJ, Wright RW, Brophy RH. Microfracture and osteochondral autograft transplantation are cost-effective treatments for articular cartilage lesions of the distal femur. Am J Sports Med. 2015;43(9):2175-2181. doi:10.1177/0363546515591261.
- Campbell AB, Pineda M, Harris JD, Flanigan DC. Return to sport after articular cartilage repair in athletes' knees: a systematic review. Arthroscopy. 2016;32(4):651-668.
- Chalmers PN, Vigneswaran H, Harris JD, Cole BJ. Activity-related outcomes of articular cartilage surgery: a systematic review. Cartilage. 2013;4(3):193-203.
- Bentley G, Biant LC, Vijayan S, Macmull S, Skinner JA, Carrington RW. Minimum ten-year results of a prospective randomised study of autologous chondrocyte implantation versus mosaicplasty for symptomatic articular cartilage lesions of the knee. JBone Joint Surg Br. 2012;94(4):504-509. doi:10.1177/1947603513481603.
- Beris AE, Lykissas MG, Kostas-Agnantis I, Manoudis GN. Treatment of full-thickness chondral defects of the knee with autologous chondrocyte implantation: a functional evaluation with long-term follow-up. Am J Sports Med. 2012;40(3):562-567.
- Chahal J, Gross AE, Gross C, et al. Outcomes of osteochondral allograft transplantation in the knee. Arthroscopy. 2013;29(3):575-588. doi:10.1177/0363546511428778.
- Emmerson BC, Görtz S, Jamali AA, Chung C, Amiel D, Bugbee WD. Fresh osteochondral allografting in the treatment of osteochondritis dissecans of the femoral condyle. Am J Sports Med. 2007;35(6):907-914. doi:10.1177/0363546507299932.
- Gudas R, Stankevičius E, Monastyreckienė E, Pranys D, Kalesinskas R. Osteochondral autologous transplantation versus microfracture for the treatment of articular cartilage defects in the knee joint in athletes. Knee Surg Sports Traumatol Arthrosc. 2006;14(9):834-842. doi:10.1007/s00167-006-0067-0.
- Lynch TS, Patel RM, Benedick A, Amin NH, Jones MH, Miniaci A. Systematic review of autogenous osteochondral transplant outcomes. Arthroscopy. 2015;31(4):746-754. doi:10.1016/j.arthro.2014.11.018.
- Niemeyer P, Porichis S, Steinwachs M, et al. Long-term outcomes after first-generation autologous chondrocyte implantation for cartilage defects of the knee. Am J Sports Med. 2014;42(1):150-157. doi:10.1177/0363546513506593.
- Ulstein S, Årøen A, Røtterud J, Løken S, Engebretsen L, Heir S. Microfracture technique versus osteochondral autologous transplantation mosaicplasty in patients with articular chondral lesions of the knee: a prospective randomized trial with long-term follow-up. Knee Surg Sports Traumatol Arthrosc. 2014;22(6):1207-1215. doi:10.1007/s00167-014-2843-6.
- Montgomery S, Foster B, Ngo S, et al. Trends in the surgical treatment of articular cartilage defects of the knee in the United States. Knee Surg Sports Traumatol Arthrosc. 2014;22(9):2070-2075. doi:10.1007/s00167-013-2614-9.
- Salzmann GM, Sah B, Südkamp NP, Niemeyer P. Reoperative characteristics after microfracture of knee cartilage lesions in 454 patients. Knee Surg Sports Traumatol Arthrosc. 2013;21(2):365-371. doi:10.1007/s00167-012-1973-y.
- Mithoefer K, McAdams T, Williams RJ, Kreuz PC, Mandelbaum BR. Clinical efficacy of the microfracture technique for articular cartilage repair in the knee: an evidence-based systematic analysis. Am J Sports Med. 2009;37(10):2053-2063. doi:10.1177/0363546508328414.
- Wajsfisz A, Makridis KG, Djian P. Arthroscopic retrograde osteochondral autograft transplantation for cartilage lesions of the tibial plateau: a prospective study. Am J Sports Med. 2013;41(2):411-415. doi:10.1177/0363546512469091.
- Harris JD, Siston RA, Brophy RH, Lattermann C, Carey JL, Flanigan DC. Failures, re-operations, and complications after autologous chondrocyte implantation–a systematic review. Osteoarthritis Cartilage. 2011;19(7):779-791. doi:10.1016/j.joca.2011.02.010.
- Abrams GD, Frank RM, Gupta AK, Harris JD, McCormick FM, Cole BJ. Trends in meniscus repair and meniscectomy in the United States, 2005-2011. Am J Sports Med. 2013;41(10):2333-2339. doi:10.1177/0363546513495641.
- Montgomery SR, Ngo SS, Hobson T, et al. Trends and demographics in hip arthroscopy in the United States. Arthroscopy. 2013;29(4):661-665. doi:10.1016/j.arthro.2012.11.005.
- Yeranosian MG, Arshi A, Terrell RD, Wang JC, McAllister DR, Petrigliano FA. Incidence of acute postoperative infections requiring reoperation after arthroscopic shoulder surgery. Am J Sports Med. 2014;42(2):437-441. doi:10.1177/0363546513510686.
- Zhang AL, Montgomery SR, Ngo SS, Hame SL, Wang JC, Gamradt SC. Arthroscopic versus open shoulder stabilization: current practice patterns in the United States. Arthroscopy. 2014;30(4):436-443. doi:10.1016/j.arthro.2013.12.013.
- Werner BC, Carr JB, Wiggins JC, Gwathmey FW, Browne JA. Manipulation under anesthesia after total knee arthroplasty is associated with an increased incidence of subsequent revision surgery. J Arthroplasty. 2015;30(suppl 9):72-75. doi:10.1016/j.arth.2015.01.061.
- Carr JB 2nd, Werner BC, Browne JA. Trends and outcomes in the treatment of failed septic total knee arthroplasty: comparing arthrodesis and above-knee amputation. J Arthroplasty. 2016;31(7):1574-1577. doi:10.1016/j.arth.2016.01.010.
TAKE-HOME POINTS
- With a large US commercial insurance database analyzing techniques for cartilage restoration, reparative procedures were favored for chondral injuries compared to restorative approaches.
- Among patients undergoing microfracture, autologous chondrocyte implantation, osteochondral autograft transfer, and osteochondral allograft transplantation, the average 90-day reoperation rate is 6%.
- Among patients undergoing microfracture, autologous chondrocyte implantation, osteochondral autograft transfer, and osteochondral allograft transplantation, the average 2-year reoperation rate is 15%.
- Patients undergoing autologous chondrocyte implantation are more likely to experience reoperation at 90 days, 1 year, and 2 years compared to other cartilage restoration techniques including microfracture, osteochondral autograft transfer, and osteochondral allograft transplantation.
- Patients undergoing microfracture are more likely to experience an ultimate conversion to arthroplasty compared to other cartilage restoration techniques including autologous chondrocyte implantation, osteochondral autograft transfer, and osteochondral allograft transplantation.
Setting and Method of Measurement Affect Blood Pressure Readings in Older Veterans
Seventy-five percent of adults aged >75 years have hypertension.1-3 According to the Joint National Commission 8 (JNC 8), the recommended target blood pressure (BP) is < 150/80 mm Hg for adults aged > 60 years.4 In 2016 the Systolic Blood Pressure Intervention Trial (SPRINT) suggested that more aggressive BP control with a goal of < 120/80 mm Hg reduced rates of cardiovascular disease and lowered the risk of death in adults aged > 50 years with hypertension.5 It is anticipated that as a result of the landmark SPRINT results, clinicians may attempt to treat hypertension more intensely in older patients with an increased risk of adverse consequences if BPs are not appropriately measured.
There is a standardized protocol for BP measurement, but these recommendations typically are not followed in routine office visits.6,7 Some studies have noted that home BP measurement may be more accurate than office measurement.8 However, clinicians may not always trust the accuracy of home BP readings, and many patients are not adherent with home measurement. As a result, physicians usually manage hypertension in older patients based on office readings, though it is likely that most office measurements do not follow protocol on proper measurement. Office measurements have been noted to be inaccurate with high likelihood of overestimating or underestimating BP control.9
Office BP measurements demonstrate poor correlation with home measurements and have not been shown to be as good of a predictor for target organ damage or long-term cardiovascular outcomes compared with that of home measurements.10,11 Although there have been studies comparing home and office BP measurements and comparing office and ambulatory BP measurement, no literature has been found that reports on the difference between routine office and standardized measurement of BP.9,12-14
This study seeks to identify the magnitude of difference among BP measured according to a standardized protocol, routine clinical, and home BP. The authors hypothesized that there would be a significant, clinically relevant difference among the 3 BP measurement methods, especially between the routine office and standardized office measurements. This study has implications for implementing intensive treatment of hypertension based on office measurements.
Methods
Participants included 30 male veterans aged > 65 years who were actively participating in the Gerofit program at the VA Greater Los Angeles Healthcare System (VAGLAHS). The Gerofit program is a model clinical demonstration exercise and health promotion program targeting older and veterans at risk for falls or institutionalization. Gerofit was established in 1987 at the Durham VA Health System and successfully implemented in 2014 at VAGLAHS. Supervised exercise is offered 3 times per week and consists of individually tailored exercises aimed at reducing functional deficits that are identified and monitored by an initial and quarterly functional assessment. Blood pressures are checked routinely once a week as a part of the program. Gerofit was reviewed and approved by the institutional review board at VAGLAHS as a quality improvement/quality assurance project.
Data
Routine office and standardized protocol measurements were obtained by a single CasMED 740 (Branford, CT) automated BP machine and were conducted separately on different days. The CasMED 740 machine was not otherwise calibrated; however, a one-time correlation was performed between the CasMED 740 and the home BP monitor for each participant, when it was brought to VAGLAHS. Two measurements were made with the CasMed 740 automated BP machine on the arm that gave the higher BP reading throughout the standardized and routine protocol. Two subsequent measurements were made with the participant’s home automated BP cuff. Averages for the CasMED 740 and the home BP monitoring device were compared and assessed for significance by paired t test. No rest was scheduled prior to the first measurement, but there was a 1-minute rest after each subsequent measurement.
Mean values (SD) were used for participant characteristics and mean values (standard error [SE]) were used for BP measurements. Data were analyzed using Microsoft Excel (Redmond, WA) and GraphPad Prism version 7.03 (San Diego, CA). T tests were used for analysis of home BP measurements due to low sample size. Values of P < .05 were considered to be statistically significant.
Routine office protocol. Automated BP was measured to mimic routine office visits. Upon arrival, participants sat down, and the BP cuff was placed around their arm. Any rest before a measurement was incidental and not intentionally structured. Appropriate cuff size was determined by visual estimation of arm circumference. Only 1 measurement was made unless BP was > 150/90 mm Hg, in which case a repeat measurement was made after 2 to 4 minutes of rest. The BP was then determined based on the average of 2 or more readings. The BPs were recorded by hand in a weekly log. Participants had at least 12 weeks of BP readings measured by the routine method, and these BPs were averaged over 12 weeks to yield their average routine measured BP.
Standardized protocol. Automated BP was measured according to the 2015 USPSTF Guidelines and Look AHEAD trial protocol.7,15 A participant’s arm circumference was measured, and appropriate cuff size was determined. The participant rested quietly in a chair for at least 5 minutes with feet flat on the floor and back supported. The cuff was snugly placed 2 to 3 cm above the antecubital fossa, and the arm was supported at the level of the right atrium during the measurement. Blood pressure was determined using the mean of 4 automated cuff readings, 2 on each arm, taken 1 minute apart. Participants did not necessarily have their BP measured by the standardized method immediately following the routine method but all measurements were performed during the same 12-week time period.
Home blood pressure protocol. Participants were given instructions according to the American Heart Association (AHA) recommendations for measuring home BP. Patients were instructed to use a calibrated, automated arm BP cuff. Home BP machines were not provided in advance, and each individual’s BP machine was not calibrated. They also were instructed to rest at least 5 minutes before measuring their BP. The mean home BP was determined by the cumulative average of 3 readings in the morning and evening, taken 1 minute between each reading, for a total of 6 readings/d. Participants recorded home BPs for 2 weeks before submitting their readings. Each participant affirmed clear understanding of how to measure BP by correctly demonstrating placement of the cuff 1 time under supervision.
Results
Thirty veterans aged > 65 years participated in the study. The average age (SD) was 82.7 (9.3) years. The average BMI (SD) was overweight at 29.7 kg/m2 (5.7). Most (87.6%) of the study participants had been diagnosed with hypertension prior to the study, and no new diagnoses were made as a result of the study. 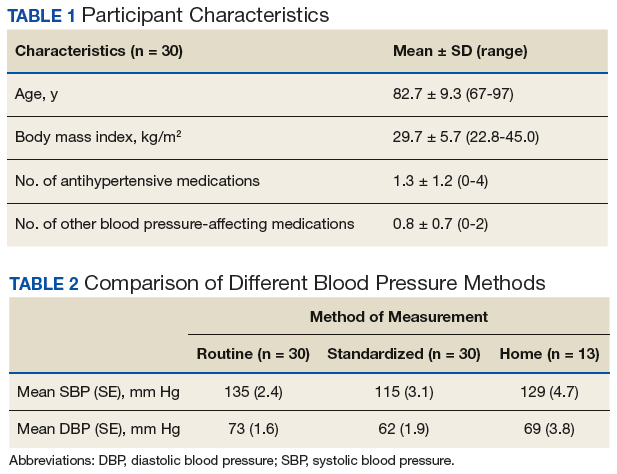
Both systolic BP (SBP) and diastolic BPs (DBP) measured by the standardized method were significantly lower than those by the routine method (P < .01 and P < .01, respectively) (Figure 1). 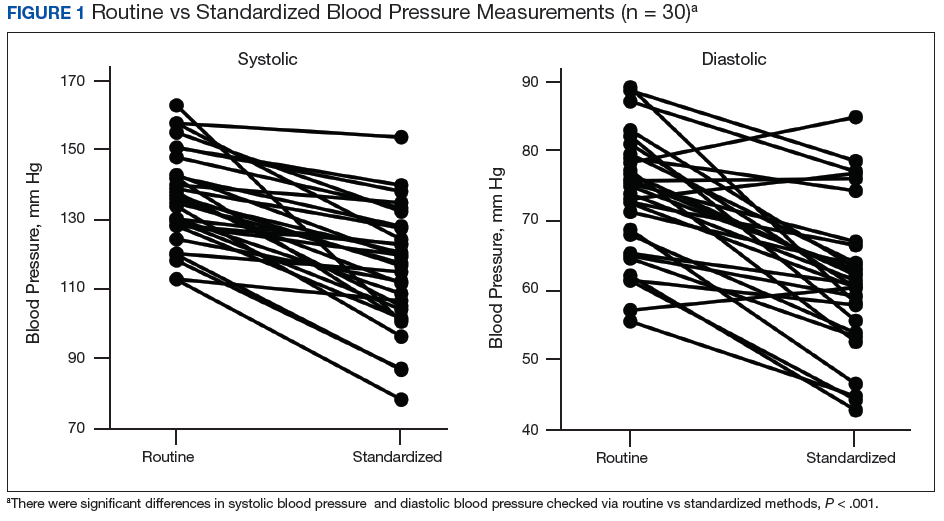
To determine the accuracy of the home BP monitors, the average routine VAGLAHS BP measure was compared with home BP results. For SBPs, there was a significant correlation coefficient of 0.91 (P < .01). 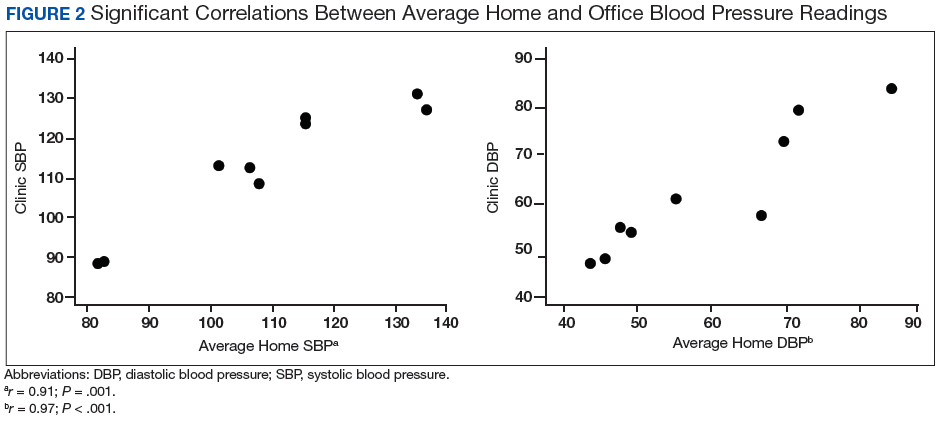
Discussion
The present study demonstrated that standardized measurements of BP were lower than that of the routine method used in most office settings. These results suggest that there could be a risk of overtreatment for some patients those of whose results are higher than the SPRINT BP target of < 120/80 mm Hg. Clinicians might be treating BPs that are elevated due to improper measurement, which can lead to deleterious consequences in older adults, such as syncope and falls.16
Each participant exhibited a significantly lower BP reading with the standardized method than the routine method. The 20-point decrease in SBP and 10-point decrease in DBP are clinically significant. The routine method of measurement was intended to simulate BP measurement in outpatient settings. There is usually little time structured for rest, and because the protocol established by the AHA and other professional organizations is time consuming, it usually is not strictly followed. With guidelines proposed by JNC 8 and new findings from SPRINT, the method of BP readings should be reviewed in all clinical settings.
While changes in BP management are not necessarily immediate, the differences in recommendations proposed by SPRINT and JNC 8 can lead to confusion regarding how intensely to treat BP. These recommendations guide clinical practice, but clinicians’ best judgment ultimately determines BP management. Physicians who utilize routine office measurements likely rely on BP readings that are higher on average than are readings done under proper conditions. This leads to the prospect of overtreatment, where physicians attempt to control hypertension too aggressively, potentially leading to orthostatic hypotension, syncope, and increased risk for falls.16 With findings from SPRINT recommending even lower BPs than that by JNC 8, overtreatment risk becomes especially relevant. While BP protocol was strictly followed in SPRINT, some clinicians may not necessarily follow the same fastidious protocol.
The average differences between the home and standardized BPs were not statistically significant possibly due to the small sample size in the home BP measurements; however, the difference might represent some clinical relevance. There was a 15-point difference in SBP results between home (129 mm Hg) and standardized (115 mm Hg) measures. There also was a difference in DBP between home (69 mm Hg) and standardized (62 mm Hg) results. The close correlation between both home and BPs measured in VAGLAHS demonstrated that any difference was not due to variability in the measurement devices. Previous studies have demonstrated that home BPs are better indicators of cardiovascular risk than office BP.8
Despite lack of statistical significance, home BPs were lower than routine, which suggests that they still may be more reliable than routine office measurements. Definitive conclusions regarding the accuracy of the home BPs in the present study cannot be drawn due to the small sample size (n = 13). Further exploration with comparisons to ambulatory BP monitoring could yield more information on accuracy of home BP monitoring.
In this study’s cohort of older veterans, the average BMI was between 25 and 30 (overweight), which is a risk factor for hypertension.17 Every participant with hypertension was taking at least 1 antihypertensive medication and being actively managed. In this study, the authors accounted for other medications that may affect BP, such as α blockers used in patients with benign prostatic hyperplasia.18 These could have potential elevating or lowering effects on BP measurements.
An issue in this study was the lack of adherence to home BP monitoring. Many patients forgot to bring in their records or to measure their BPs at home. The difficulties highlight real-life issues. Clinicians often request that patients monitor their BP at home, but few may actually remember, let alone keep diligent records. There are many barriers between measuring and reporting home BPs, which may prevent the usefulness of monitoring BP at home.
Limitations
There were several limitations to the study. There was no specific protocol for the routine method of BP measurement, as it was intended to simulate the haphazard nature of office measurements. However, this approach limits its reproducibility. For home BP monitoring, it would have been ideal to provide the same calibrated, automated BP device to each participant. This study of older veterans may not be applicable to the general population. Finally, the relatively small number of participants in the study (n = 30) may have limited power in drawing definitive conclusions.
Future Directions
For future studies, comparing the standardized method to ambulatory BP monitoring would provide more information on accuracy. In addition, the authors would like to evaluate the effect of exercise on BP measurements in the different settings: home, standardized, and routine methods.
1. Mozaffarian D, Benjamin EJ, Go AS, et al; American Heart Association Statistics Committee and Stroke Statistics Subcommittee. Heart disease and stroke statistics—2015 update: a report from the American Heart Association. Circulation. 2015;131(4):e29-e322.
2. Benjamin EJ, Blaha MJ, Chiuve SE, et al; American Heart Association Statistics Committee and Stroke Statistics Subcommittee. Heart disease and stroke statistics—2017 update: a report from the American Heart Association. Circulation. 2017;135(10):e146-e603.
3. Nwankwo T, Yoon SS, Burt V, Gu Q. Hypertension among adults in the United States: National Health and Nutrition Examination Survey, 2011-2012. NCHS Data Brief. 2013;(133):1-8.
4. James PA, Oparil S, Carter BL, et al. 2014 evidence-based guideline for the management of high blood pressure in adults: report from the panel members appointed to the Eighth Joint National Committee (JNC 8). JAMA. 2014;311(5):507-520.
5. Williamson JD, Supiano MA, Applegate WB, et al; SPRINT Research Group. Intensive vs standard blood pressure control and cardiovascular disease outcomes in adults aged ≥ 75 years: a randomized clinical trial. JAMA. 2016;315(24):2673-2682.
6. Pickering TG, Hall JE, Appel LJ, et al; Council on High Blood Pressure Research Professional and Public Education Subcommittee, American Heart Association. Recommendations for blood pressure measurement in humans: an AHA scientific statement from the Council on High Blood Pressure Research Professional and Public Education Subcommittee. J Clin Hypertens (Greenwich). 2005;7(2):102-109.
7. Siu AL; U.S. Preventive Services Task Force. Screening for high blood pressure in adults: U.S. Preventive Services Task Force recommendation statement. Ann Intern Med. 2015;163(10):778-786.
8. Niiranen TJ, Hänninen MR, Johansson J, Reunanen A, Jula AM. Home-measured blood pressure is a stronger predictor of cardiovascular risk than office blood pressure: the Finn-Home study. Hypertension. 2010;55(6):1346-1351.
9. Reino-Gonzalez S, Pita-Fernández S, Seoane-Pillado T, López-Calviño B, Pértega Díaz S. How in-office and ambulatory BP monitoring compare: a systematic review and meta-analysis. J Fam Pract. 2017;66(1):E5-E12.
10. Cohen JB, Cohen DL. Integrating out-of-office blood pressure in the diagnosis and management of hypertension. Curr Cardiol Rep. 2016;18(11):112.
11. Fuchs SC, Mello RB, Fuchs FC. Home blood pressure monitoring is better predictor of cardiovascular disease and target organ damage than office blood pressure: a systematic review and meta-analysis. Curr Cardiol Rep. 2013;15(11):413.
12. Imai Y, Obara T, Asamaya K, Ohkubo T. The reason why home blood pressure measurements are preferred over clinic or ambulatory blood pressure in Japan. Hypertens Res. 2013;36(8):661-672.
13. Bliziotis IA, Destounis A, Stergiou GS. Home versus ambulatory and office blood pressure in predicting target organ damage in hypertension: a systematic review and meta-analysis. J Hypertens. 2012;30(7):1289-1299.
14. Yang Y, Xu JZ, Wang Y, Gao PJ. Ambulatory versus clinic blood pressure in predicting overall subclinical target organ damage progression in essential hypertensive patients: a 3-year follow-up study. Blood Press Monit. 2016;21(6):319-326.
15. Espeland MA, Probstfield J, Hire D, et al; Look AHEAD Research Group; ACCORD Study Group. Systolic blood pressure control among individuals with type 2 diabetes: a comparative effectiveness analysis of three interventions. Am J Hypertens. 2015;28(8):995-1009.
16. Weiss J, Freeman M, Low A, et al. Benefits and harms of intensive blood pressure treatment in adults aged 60 years or older: a systematic review and meta-analysis. Ann Intern Med. 2017;166(6):419-429.
17. Nagai M, Ohkubo T, Murakami Y, et al; NIPPON DATA80/90/2010 Research Group. Secular trends of the impact of overweight and obesity on hypertension in Japan, 1980-2010. Hypertens Res. 2015;38(11):790-795.
18. Press Y, Punchik B, Freud T. Orthostatic hypotension and drug therapy in patients at an outpatient comprehensive geriatric assessment unit. J Hypertens. 2016;34(2):351-358.
Seventy-five percent of adults aged >75 years have hypertension.1-3 According to the Joint National Commission 8 (JNC 8), the recommended target blood pressure (BP) is < 150/80 mm Hg for adults aged > 60 years.4 In 2016 the Systolic Blood Pressure Intervention Trial (SPRINT) suggested that more aggressive BP control with a goal of < 120/80 mm Hg reduced rates of cardiovascular disease and lowered the risk of death in adults aged > 50 years with hypertension.5 It is anticipated that as a result of the landmark SPRINT results, clinicians may attempt to treat hypertension more intensely in older patients with an increased risk of adverse consequences if BPs are not appropriately measured.
There is a standardized protocol for BP measurement, but these recommendations typically are not followed in routine office visits.6,7 Some studies have noted that home BP measurement may be more accurate than office measurement.8 However, clinicians may not always trust the accuracy of home BP readings, and many patients are not adherent with home measurement. As a result, physicians usually manage hypertension in older patients based on office readings, though it is likely that most office measurements do not follow protocol on proper measurement. Office measurements have been noted to be inaccurate with high likelihood of overestimating or underestimating BP control.9
Office BP measurements demonstrate poor correlation with home measurements and have not been shown to be as good of a predictor for target organ damage or long-term cardiovascular outcomes compared with that of home measurements.10,11 Although there have been studies comparing home and office BP measurements and comparing office and ambulatory BP measurement, no literature has been found that reports on the difference between routine office and standardized measurement of BP.9,12-14
This study seeks to identify the magnitude of difference among BP measured according to a standardized protocol, routine clinical, and home BP. The authors hypothesized that there would be a significant, clinically relevant difference among the 3 BP measurement methods, especially between the routine office and standardized office measurements. This study has implications for implementing intensive treatment of hypertension based on office measurements.
Methods
Participants included 30 male veterans aged > 65 years who were actively participating in the Gerofit program at the VA Greater Los Angeles Healthcare System (VAGLAHS). The Gerofit program is a model clinical demonstration exercise and health promotion program targeting older and veterans at risk for falls or institutionalization. Gerofit was established in 1987 at the Durham VA Health System and successfully implemented in 2014 at VAGLAHS. Supervised exercise is offered 3 times per week and consists of individually tailored exercises aimed at reducing functional deficits that are identified and monitored by an initial and quarterly functional assessment. Blood pressures are checked routinely once a week as a part of the program. Gerofit was reviewed and approved by the institutional review board at VAGLAHS as a quality improvement/quality assurance project.
Data
Routine office and standardized protocol measurements were obtained by a single CasMED 740 (Branford, CT) automated BP machine and were conducted separately on different days. The CasMED 740 machine was not otherwise calibrated; however, a one-time correlation was performed between the CasMED 740 and the home BP monitor for each participant, when it was brought to VAGLAHS. Two measurements were made with the CasMed 740 automated BP machine on the arm that gave the higher BP reading throughout the standardized and routine protocol. Two subsequent measurements were made with the participant’s home automated BP cuff. Averages for the CasMED 740 and the home BP monitoring device were compared and assessed for significance by paired t test. No rest was scheduled prior to the first measurement, but there was a 1-minute rest after each subsequent measurement.
Mean values (SD) were used for participant characteristics and mean values (standard error [SE]) were used for BP measurements. Data were analyzed using Microsoft Excel (Redmond, WA) and GraphPad Prism version 7.03 (San Diego, CA). T tests were used for analysis of home BP measurements due to low sample size. Values of P < .05 were considered to be statistically significant.
Routine office protocol. Automated BP was measured to mimic routine office visits. Upon arrival, participants sat down, and the BP cuff was placed around their arm. Any rest before a measurement was incidental and not intentionally structured. Appropriate cuff size was determined by visual estimation of arm circumference. Only 1 measurement was made unless BP was > 150/90 mm Hg, in which case a repeat measurement was made after 2 to 4 minutes of rest. The BP was then determined based on the average of 2 or more readings. The BPs were recorded by hand in a weekly log. Participants had at least 12 weeks of BP readings measured by the routine method, and these BPs were averaged over 12 weeks to yield their average routine measured BP.
Standardized protocol. Automated BP was measured according to the 2015 USPSTF Guidelines and Look AHEAD trial protocol.7,15 A participant’s arm circumference was measured, and appropriate cuff size was determined. The participant rested quietly in a chair for at least 5 minutes with feet flat on the floor and back supported. The cuff was snugly placed 2 to 3 cm above the antecubital fossa, and the arm was supported at the level of the right atrium during the measurement. Blood pressure was determined using the mean of 4 automated cuff readings, 2 on each arm, taken 1 minute apart. Participants did not necessarily have their BP measured by the standardized method immediately following the routine method but all measurements were performed during the same 12-week time period.
Home blood pressure protocol. Participants were given instructions according to the American Heart Association (AHA) recommendations for measuring home BP. Patients were instructed to use a calibrated, automated arm BP cuff. Home BP machines were not provided in advance, and each individual’s BP machine was not calibrated. They also were instructed to rest at least 5 minutes before measuring their BP. The mean home BP was determined by the cumulative average of 3 readings in the morning and evening, taken 1 minute between each reading, for a total of 6 readings/d. Participants recorded home BPs for 2 weeks before submitting their readings. Each participant affirmed clear understanding of how to measure BP by correctly demonstrating placement of the cuff 1 time under supervision.
Results
Thirty veterans aged > 65 years participated in the study. The average age (SD) was 82.7 (9.3) years. The average BMI (SD) was overweight at 29.7 kg/m2 (5.7). Most (87.6%) of the study participants had been diagnosed with hypertension prior to the study, and no new diagnoses were made as a result of the study.
Both systolic BP (SBP) and diastolic BPs (DBP) measured by the standardized method were significantly lower than those by the routine method (P < .01 and P < .01, respectively) (Figure 1).
To determine the accuracy of the home BP monitors, the average routine VAGLAHS BP measure was compared with home BP results. For SBPs, there was a significant correlation coefficient of 0.91 (P < .01).
Discussion
The present study demonstrated that standardized measurements of BP were lower than that of the routine method used in most office settings. These results suggest that there could be a risk of overtreatment for some patients those of whose results are higher than the SPRINT BP target of < 120/80 mm Hg. Clinicians might be treating BPs that are elevated due to improper measurement, which can lead to deleterious consequences in older adults, such as syncope and falls.16
Each participant exhibited a significantly lower BP reading with the standardized method than the routine method. The 20-point decrease in SBP and 10-point decrease in DBP are clinically significant. The routine method of measurement was intended to simulate BP measurement in outpatient settings. There is usually little time structured for rest, and because the protocol established by the AHA and other professional organizations is time consuming, it usually is not strictly followed. With guidelines proposed by JNC 8 and new findings from SPRINT, the method of BP readings should be reviewed in all clinical settings.
While changes in BP management are not necessarily immediate, the differences in recommendations proposed by SPRINT and JNC 8 can lead to confusion regarding how intensely to treat BP. These recommendations guide clinical practice, but clinicians’ best judgment ultimately determines BP management. Physicians who utilize routine office measurements likely rely on BP readings that are higher on average than are readings done under proper conditions. This leads to the prospect of overtreatment, where physicians attempt to control hypertension too aggressively, potentially leading to orthostatic hypotension, syncope, and increased risk for falls.16 With findings from SPRINT recommending even lower BPs than that by JNC 8, overtreatment risk becomes especially relevant. While BP protocol was strictly followed in SPRINT, some clinicians may not necessarily follow the same fastidious protocol.
The average differences between the home and standardized BPs were not statistically significant possibly due to the small sample size in the home BP measurements; however, the difference might represent some clinical relevance. There was a 15-point difference in SBP results between home (129 mm Hg) and standardized (115 mm Hg) measures. There also was a difference in DBP between home (69 mm Hg) and standardized (62 mm Hg) results. The close correlation between both home and BPs measured in VAGLAHS demonstrated that any difference was not due to variability in the measurement devices. Previous studies have demonstrated that home BPs are better indicators of cardiovascular risk than office BP.8
Despite lack of statistical significance, home BPs were lower than routine, which suggests that they still may be more reliable than routine office measurements. Definitive conclusions regarding the accuracy of the home BPs in the present study cannot be drawn due to the small sample size (n = 13). Further exploration with comparisons to ambulatory BP monitoring could yield more information on accuracy of home BP monitoring.
In this study’s cohort of older veterans, the average BMI was between 25 and 30 (overweight), which is a risk factor for hypertension.17 Every participant with hypertension was taking at least 1 antihypertensive medication and being actively managed. In this study, the authors accounted for other medications that may affect BP, such as α blockers used in patients with benign prostatic hyperplasia.18 These could have potential elevating or lowering effects on BP measurements.
An issue in this study was the lack of adherence to home BP monitoring. Many patients forgot to bring in their records or to measure their BPs at home. The difficulties highlight real-life issues. Clinicians often request that patients monitor their BP at home, but few may actually remember, let alone keep diligent records. There are many barriers between measuring and reporting home BPs, which may prevent the usefulness of monitoring BP at home.
Limitations
There were several limitations to the study. There was no specific protocol for the routine method of BP measurement, as it was intended to simulate the haphazard nature of office measurements. However, this approach limits its reproducibility. For home BP monitoring, it would have been ideal to provide the same calibrated, automated BP device to each participant. This study of older veterans may not be applicable to the general population. Finally, the relatively small number of participants in the study (n = 30) may have limited power in drawing definitive conclusions.
Future Directions
For future studies, comparing the standardized method to ambulatory BP monitoring would provide more information on accuracy. In addition, the authors would like to evaluate the effect of exercise on BP measurements in the different settings: home, standardized, and routine methods.
1. Mozaffarian D, Benjamin EJ, Go AS, et al; American Heart Association Statistics Committee and Stroke Statistics Subcommittee. Heart disease and stroke statistics—2015 update: a report from the American Heart Association. Circulation. 2015;131(4):e29-e322.
2. Benjamin EJ, Blaha MJ, Chiuve SE, et al; American Heart Association Statistics Committee and Stroke Statistics Subcommittee. Heart disease and stroke statistics—2017 update: a report from the American Heart Association. Circulation. 2017;135(10):e146-e603.
3. Nwankwo T, Yoon SS, Burt V, Gu Q. Hypertension among adults in the United States: National Health and Nutrition Examination Survey, 2011-2012. NCHS Data Brief. 2013;(133):1-8.
4. James PA, Oparil S, Carter BL, et al. 2014 evidence-based guideline for the management of high blood pressure in adults: report from the panel members appointed to the Eighth Joint National Committee (JNC 8). JAMA. 2014;311(5):507-520.
5. Williamson JD, Supiano MA, Applegate WB, et al; SPRINT Research Group. Intensive vs standard blood pressure control and cardiovascular disease outcomes in adults aged ≥ 75 years: a randomized clinical trial. JAMA. 2016;315(24):2673-2682.
6. Pickering TG, Hall JE, Appel LJ, et al; Council on High Blood Pressure Research Professional and Public Education Subcommittee, American Heart Association. Recommendations for blood pressure measurement in humans: an AHA scientific statement from the Council on High Blood Pressure Research Professional and Public Education Subcommittee. J Clin Hypertens (Greenwich). 2005;7(2):102-109.
7. Siu AL; U.S. Preventive Services Task Force. Screening for high blood pressure in adults: U.S. Preventive Services Task Force recommendation statement. Ann Intern Med. 2015;163(10):778-786.
8. Niiranen TJ, Hänninen MR, Johansson J, Reunanen A, Jula AM. Home-measured blood pressure is a stronger predictor of cardiovascular risk than office blood pressure: the Finn-Home study. Hypertension. 2010;55(6):1346-1351.
9. Reino-Gonzalez S, Pita-Fernández S, Seoane-Pillado T, López-Calviño B, Pértega Díaz S. How in-office and ambulatory BP monitoring compare: a systematic review and meta-analysis. J Fam Pract. 2017;66(1):E5-E12.
10. Cohen JB, Cohen DL. Integrating out-of-office blood pressure in the diagnosis and management of hypertension. Curr Cardiol Rep. 2016;18(11):112.
11. Fuchs SC, Mello RB, Fuchs FC. Home blood pressure monitoring is better predictor of cardiovascular disease and target organ damage than office blood pressure: a systematic review and meta-analysis. Curr Cardiol Rep. 2013;15(11):413.
12. Imai Y, Obara T, Asamaya K, Ohkubo T. The reason why home blood pressure measurements are preferred over clinic or ambulatory blood pressure in Japan. Hypertens Res. 2013;36(8):661-672.
13. Bliziotis IA, Destounis A, Stergiou GS. Home versus ambulatory and office blood pressure in predicting target organ damage in hypertension: a systematic review and meta-analysis. J Hypertens. 2012;30(7):1289-1299.
14. Yang Y, Xu JZ, Wang Y, Gao PJ. Ambulatory versus clinic blood pressure in predicting overall subclinical target organ damage progression in essential hypertensive patients: a 3-year follow-up study. Blood Press Monit. 2016;21(6):319-326.
15. Espeland MA, Probstfield J, Hire D, et al; Look AHEAD Research Group; ACCORD Study Group. Systolic blood pressure control among individuals with type 2 diabetes: a comparative effectiveness analysis of three interventions. Am J Hypertens. 2015;28(8):995-1009.
16. Weiss J, Freeman M, Low A, et al. Benefits and harms of intensive blood pressure treatment in adults aged 60 years or older: a systematic review and meta-analysis. Ann Intern Med. 2017;166(6):419-429.
17. Nagai M, Ohkubo T, Murakami Y, et al; NIPPON DATA80/90/2010 Research Group. Secular trends of the impact of overweight and obesity on hypertension in Japan, 1980-2010. Hypertens Res. 2015;38(11):790-795.
18. Press Y, Punchik B, Freud T. Orthostatic hypotension and drug therapy in patients at an outpatient comprehensive geriatric assessment unit. J Hypertens. 2016;34(2):351-358.
An MRI Analysis of the Pelvis to Determine the Ideal Method for Ultrasound-Guided Bone Marrow Aspiration from the Iliac Crest
ABSTRACT
Use of mesenchymal stem cells from bone marrow has gained significant popularity. The iliac crest has been determined to be an effective site for harvesting mesenchymal stem cells. Review of the literature reveals that multiple techniques are used to harvest bone marrow aspirate from the iliac crest, but the descriptions are based on the experience of various authors as opposed to studied anatomy. A safe, reliable, and reproducible method for aspiration has yet to be studied and described. We hypothesized that there would be an ideal angle and distance for aspiration that would be the safest, most consistent, and most reliable. Using magnetic resonance imaging (MRI), we reviewed 26 total lumbar spine MRI scans (13 males, 13 females) and found that an angle of 24° should be used when entering the most medial aspect of the posterior superior iliac spine (PSIS) and that this angle did not differ between the sexes. The distance that the trocar can advance after entry before hitting the anterior ilium wall varied significantly between males and females, being 7.53 cm in males and 6.74 cm in females. In addition, the size of the PSIS table was significantly different between males and females (1.20 cm and 0.96 cm, respectively). No other significant differences in the measurements gathered were found. Using the data gleaned from this study, we developed an aspiration technique. This method uses ultrasound to determine the location of the PSIS and the entry point on the PSIS. This contrasts with most techniques that use landmark palpation, which is known to be unreliable and inaccurate. The described technique for aspiration from the PSIS is safe, reliable, reproducible, and substantiated by data.
The iliac crest is an effective site for harvesting bone marrow stem cells. It allows for easy access and is superficial in most individuals, allowing for a relatively quick and simple procedure. Use of mesenchymal stem cells (MSCs) for treatment of orthopedic injuries has grown recently. Whereas overall use has increased, review of the literature reveals very few techniques for iliac crest aspiration,1 but these are not based on anatomic relationships or studies. Hernigou and colleagues2,3 attempted to quantitatively evaluate potential “sectors” allowing for safe aspiration using cadaver and computed tomographic reconstruction imaging. We used magnetic resonance imaging (MRI) to analyze aspiration parameters. Owing to the ilium’s anatomy, improper positioning or aspiration technique during aspiration can result in serious injury.2,4-6 We hypothesized that there is an ideal angle and positioning for bone marrow aspiration from the posterior superior iliac spine (PSIS) that is safe, consistent, and reproducible. Although most aspiration techniques use landmark palpation, this is unreliable and inaccurate, especially when compared with ultrasound-guided injections7-16 and procedures.9,12,17-19 We describe our technique using ultrasound to visualize patient anatomy and accurately determine anatomic entry with the trocar.
METHODS
MRI scans of 26 patients (13 males, 13 females) were reviewed to determine average angles and distances. Axial T2-weighted views of the lumbar spine were used in all analyses. The sacroiliac (SI) joint angle was defined as the angle formed between the vector through the midline of the pelvis and the vector that is parallel to the SI joint. The approach angle was defined as the angle formed between the vector of the most medial aspect of the PSIS through the ilium to the anterior wall and the vector through the midline of the pelvis (Figure 1). 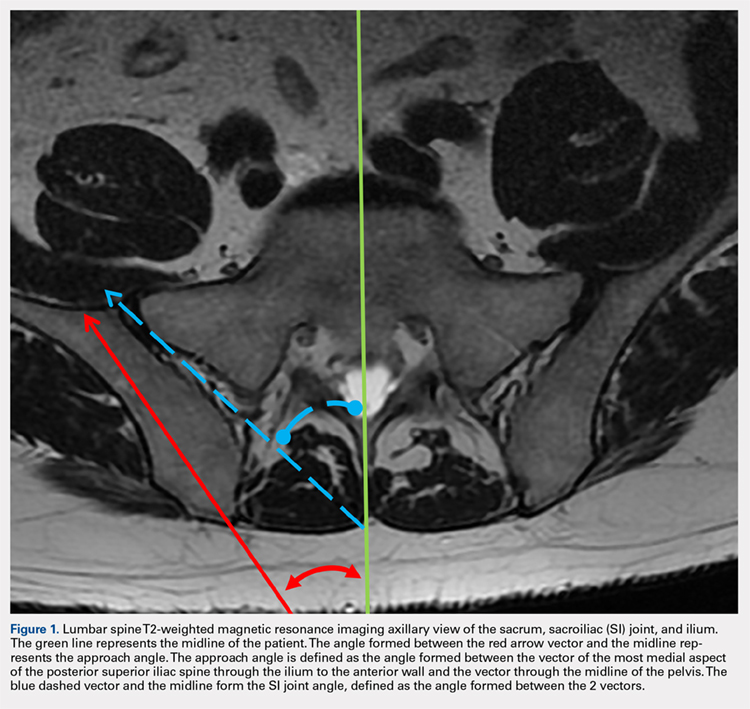
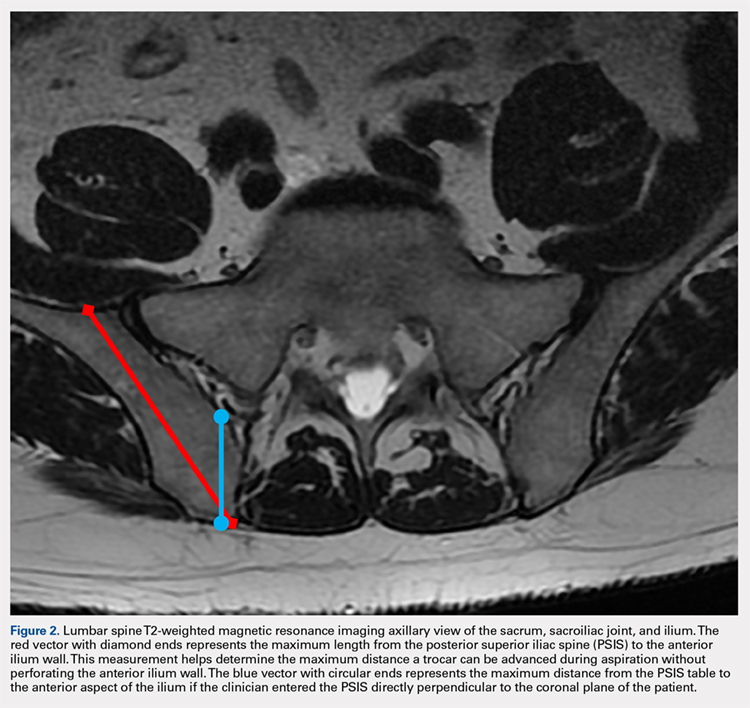
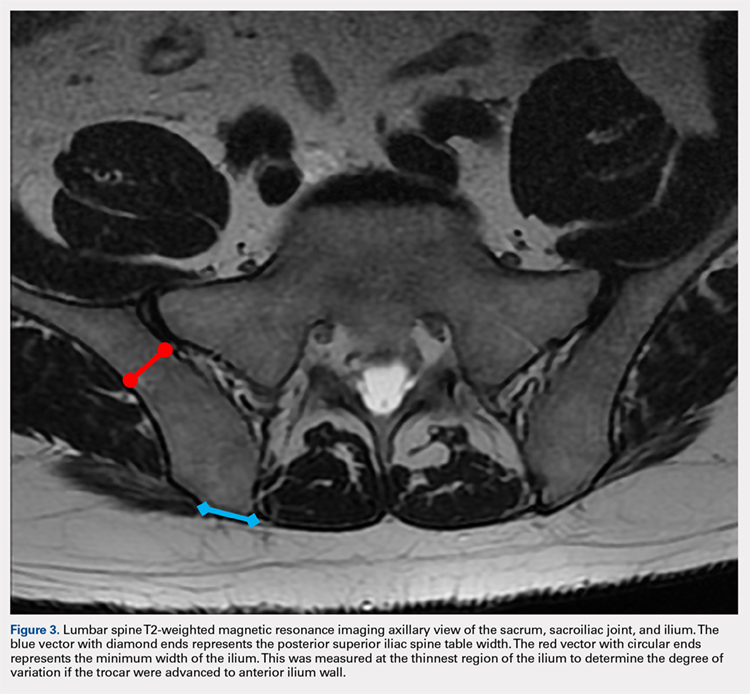
Continue to: For the 13 males, the mean SI joint...
RESULTS
The results are reported in the Table.
Table. Measurements of Patients Taken on Axial T2-Weighted Views of Lumbosacral MRI Scansa
Patient | SI Joint Angle (°) | Approach Angle (°) | PSIS Table Width (cm) | PSIS to Anterior Ilium Wall (cm) | Perpendicular Distance PSIS to Anterior Joint (cm) | Post Ilium Wall to SI Joint Width (cm) |
Males | ||||||
1 | 28.80 | 19.50 | 1.24 | 8.80 | 4.16 | 1.52 |
2 | 31.80 | 27.60 | 1.70 | 7.89 | 3.49 | 1.02 |
3 | 33.70 | 27.70 | 1.12 | 8.14 | 3.15 | 1.28 |
4 | 23.70 | 26.40 | 0.95 | 6.66 | 3.22 | 0.65 |
5 | 35.90 | 28.40 | 0.84 | 7.60 | 2.57 | 0.95 |
6 | 33.80 | 29.30 | 1.20 | 7.73 | 2.34 | 0.90 |
7 | 30.30 | 21.20 | 1.36 | 8.44 | 3.95 | 1.18 |
8 | 34.50 | 20.40 | 1.53 | 7.08 | 3.98 | 1.56 |
9 | 28.70 | 24.00 | 1.34 | 8.19 | 3.51 | 1.31 |
10 | 22.40 | 20.10 | 1.37 | 7.30 | 3.87 | 1.28 |
11 | 33.60 | 20.80 | 0.88 | 6.43 | 3.26 | 0.94 |
12 | 48.50 | 31.00 | 1.15 | 6.69 | 2.97 | 1.38 |
13 | 20.20 | 20.90 | 0.94 | 6.95 | 3.79 | 1.05 |
Averages | 31.22 | 24.41 | 1.20 | 7.53 | 3.40 | 1.16 |
Standard Deviation | 7.18 | 4.11 | 0.26 | 0.75 | 0.56 | 0.26 |
Females | ||||||
14 | 22.80 | 23.20 | 1.54 | 7.21 | 3.45 | 1.39 |
15 | 33.30 | 21.40 | 1.09 | 7.26 | 3.57 | 0.98 |
16 | 19.70 | 15.60 | 0.78 | 8.32 | 3.76 | 0.86 |
17 | 17.50 | 15.60 | 0.61 | 7.57 | 3.37 | 1.03 |
18 | 48.20 | 26.60 | 0.94 | 6.62 | 3.16 | 0.71 |
19 | 38.20 | 28.30 | 0.90 | 6.32 | 2.23 | 0.91 |
20 | 44.50 | 31.70 | 0.99 | 6.19 | 3.06 | 0.76 |
21 | 24.10 | 18.00 | 0.92 | 6.99 | 3.23 | 0.71 |
22 | 17.20 | 14.80 | 0.81 | 6.00 | 2.81 | 1.13 |
23 | 42.00 | 38.50 | 1.00 | 5.33 | 2.47 | 1.42 |
24 | 32.00 | 25.50 | 0.98 | 6.01 | 2.79 | 1.21 |
25 | 24.70 | 24.80 | 0.87 | 6.09 | 2.79 | 1.02 |
26 | 19.80 | 22.30 | 1.04 | 7.71 | 2.37 | 1.36 |
Averages | 29.54 | 23.56 | 0.96 | 6.74 | 3.00 | 1.04 |
Standard Deviation | 10.84 | 6.88 | 0.21 | 0.85 | 0.48 | 0.25 |
All patients Averages | 30.38 | 23.98 | 1.08 | 7.14 | 3.20 | 1.10 |
Standard Deviation | 9.05 | 5.57 | 0.26 | 0.88 | 0.55 | 0.26 |
aStatistical significance is denoted as P < .02.
Abbreviations: MRI, magnetic resonance imaging; PSIS, posterior iliac spine; SI, sacroiliac.
For the 13 males, the mean SI joint angle was 31.22° ± 7.18° (range, 20.20° to 48.50°). The mean approach angle was 24.41° ± 4.11° (range, 19.50° to 31.00°). The mean PSIS table width was 1.20 cm ± 0.26 cm (range, 0.84 cm to 1.70 cm). The mean distance from the PSIS to the anterior ilium wall was 7.53 cm ± 0.75 cm (range, 6.43 cm to 8.80 cm). The mean perpendicular distance from the PSIS table to the anterior ilium was 3.40 cm ± 0.56 cm (range, 2.34 cm to 4.16 cm). The mean minimum width of the ilium to the SI joint was 1.16 cm ± 0.26 cm (range, 0.65 cm to 1.56 cm).
For the 13 females, the mean SI joint angle was 29.54° ± 10.84° (range, 17.20° to 48.20°). The mean approach angle was 23.56° ± 6.88° (range, 14.80° to 38.50°). The mean PSIS table width was 0.96 cm ± 0.21 cm (range, 0.61 cm to 1.54 cm). The mean distance from the PSIS to the anterior ilium wall was 6.74 cm ± 0.85 cm (range, 5.33 cm to 8.32 cm). The mean perpendicular distance from the PSIS table to the anterior ilium was 3.00 cm ± 0.48 cm (range, 2.23 cm to 3.76 cm). The mean minimum width of the ilium to the SI joint was 1.04 cm ± 0.25 cm (range, 0.71 cm to 1.42 cm).
For the 26 total patients, the mean SI joint angle was 30.38° ± 9.05° (range, 17.20° to 48.50°). The mean approach angle was 23.98° ± 5.57° (range, 14.80° to 38.50°). The mean PSIS table width was 1.08 cm ± 0.26 cm (range, 0.61 cm to 1.70 cm). The mean distance from the PSIS to the anterior ilium wall was 7.14 cm ± 0.88 cm (range, 5.33 cm to 8.80 cm). The mean perpendicular distance from the PSIS table to the anterior ilium was 3.20 cm ± 0.55 cm (range, 2.23 cm to 4.16 cm). The mean minimum width of the ilium to the SI joint was 1.10 cm ± 0.26 cm (range, 0.65 cm to 1.56 cm).
There was a statistically significant difference between the male and female groups for the maximum distance the trocar can be advanced from the PSIS to the anterior ilium wall (P < .02), and a statistically significant difference for the PSIS table width (P < .02). There were no significant differences between the male and female groups for the approach angle, the SI joint angle, the perpendicular distance from the PSIS to the anterior ilium, and the minimum width of the ilium to the SI joint.
Continue to: The patient is brought to the procedure...
TECHNIQUE: ILIAC CREST (PSIS) BONE MARROW ASPIRATION
The patient is brought to the procedure room and placed in a prone position. The donor site is prepared and draped in the usual sterile manner. Ultrasound is used to identify the median sacral crest in a short-axis view. The probe is then moved laterally to identify the PSIS (Figures 4A, 4B). 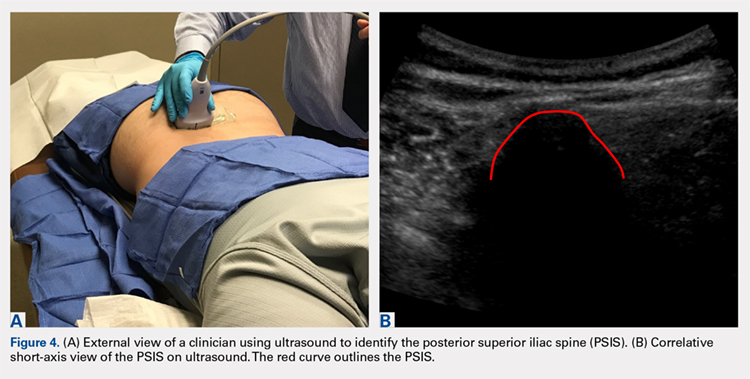
The crosshairs on the ultrasound probe are used to mark the center lines of each plane. The central point marks the location of the PSIS. Alternatively, an in-plane technique can be used to place a spinal needle on the exact entry point on the PSIS. Once the PSIS and entry point are identified, the site is blocked with 10 mL of 0.5% ropivacaine.
Prior to introduction of the trocar, all instrumentation is primed with heparin and syringes are prepped with anticoagulant citrate dextrose solution, solution A. A stab incision is made at the site. The trocar is placed at the entry point, which should be centered in a superior-inferior plane and at the most medial point of the PSIS. Starting with the trocar vertical, the trocar is angled laterally 24° by dropping the hand medially toward the midline. No angulation cephalad or caudad is necessary, but cephalad must be avoided so as not to skive superiorly. This angle, which is recommended for both males and females, allows for the greatest distance the trocar can travel in bone before hitting the anterior ilium wall. A standard deviation of 5.57° is present, which should be considered. Steady pressure should be applied with a slight twisting motion on the PSIS. If advancement of the trocar is too difficult, a mallet or drill can be used to assist in penetration.
With the trocar advanced into the bone 1 cm, the trocar needle is removed while the cannula remains in place. The syringe is attached to the top of the cannula. The syringe plunger is pulled back to aspirate 20 mL of bone marrow. The cannula and syringe assembly are advanced 2 cm farther into the bone to allow for aspiration of a new location within the bone marrow cavity, and 20 mL of bone marrow are again aspirated. This is done a final time, advancing the trocar another 2 cm and aspirating a final 20 mL of bone marrow. The entire process should yield roughly 60 mL of bone marrow from one side. If desired, the same process can be repeated for the contralateral PSIS to yield a total of 120 mL of bone marrow from the 2 sites.
Based on our data, the average distance to the anterior ilium wall was 7 cm, but the shortest distance noted in this study was 5 cm. On the basis of the data presented, this technique allows for safe advancement based on even the shortest measured distance, without fear of puncturing the anterior ilium wall. Perforation could damage the femoral nerve and the internal or external iliac artery or vein that lie anterior to the ilium.
Continue to: We hypothesized that there...
DISCUSSION
We hypothesized that there would be an optimal angle of entry and maximal safe distance the trocar could advance through the ilium when aspirating. Because male and female pelvic anatomy differs, we also hypothesized that there would be differences in distance and size measurements for males and females. Our results supported our hypothesis that there is an ideal approach angle. The results also showed that the maximum distance the trocar can advance and the width of the PSIS table differ significantly between males and females.
Although pelvic anatomy differs between males and females, there should be an ideal entry angle that would allow maximum advancement into the ilium without perforating the anterior wall, which we defined as the approach angle. In our comparison of 26 MRI scans, we found that the approach angle did not differ significantly between the 2 groups (13 males, 13 females). This allows clinicians to enter the PSIS at roughly 24° medial to the parasagittal line, maximizing the space before puncturing into the anterior pelvis in either males or females.
If clinicians were to enter perpendicular to the patient’s PSIS, they would, on average, be able to advance only 3.20 cm before encountering the SI joint. When entering at 24° as we recommend, the average distance increases to 7.14 cm. Although the angle did not differ significantly, there was a significant difference between males and females in the length from the PSIS to the anterior wall, with males having 7.53 cm distance and females 6.74 cm. This is an important measurement because if the anterior ilium wall is punctured, the femoral nerve and the common, internal and external iliac arteries and veins could be damaged, resulting in retroperitoneal hemorrhage.
A fatality in 2001 in the United Kingdom led to a national audit of bone marrow aspiration and biopsies.4-6 Although these procedures were done primarily for patients with cancer, hemorrhagic events were the most frequent and serious events. This audit led to the identification of many risk factors. Bain4-6 conducted reviews of bone marrow aspirations and biopsies in the United Kingdom from 2002 to 2004. Of a total of 53,088 procedures conducted during that time frame, 48 (0.09%) adverse events occurred, with 29 (0.05%) being hemorrhagic events. Although infrequent, hemorrhagic adverse events represent significant morbidity. Reviews such as those conducted by Bain4-6 highlight the importance of a study that helps determine the optimal parameters for aspiration to ensure safety and reliability.
Hernigou and colleagues2,3 conducted studies analyzing different “sectors” in an attempt to develop a safe aspiration technique. They found that obese patients were at higher risk, and some sites of aspiration (sectors 1, 4, 5) had increased risk for perforation and damage to surrounding structures. Their sector 6, which incorporated the entirety of the PSIS table, was considered the safest, most reliable site for trocar introduction.2,3 Hernigou and colleagues,2 in comparing the bone mass of the sectors, also noted that sector 6 has the greatest bone thickness close to the entry point, making it the most favorable site. The PSIS is not just a point; it is more a “table.” The PSIS can be palpated posteriorly, but this is inaccurate and unreliable, particularly in larger individuals. The PSIS table can be identified on ultrasound before introducing the trocar, which is a more reliable method of landmark identification than palpation guidance, just as in ultrasound-guided injections7-16 and procedures.9,12,17-19
Continue to: If the PSIS is not accurately...
If the PSIS is not accurately identified, penetration laterally will result in entering the ilium wing, where it is quite narrow. We found the distance between the posterior ilium wall and the SI joint to be only 1.10 cm wide (Figure 3); we defined this area as the narrow corridor. Superior and lateral entry could damage the superior cluneal nerves coming over the iliac crest, which are located 6 cm lateral to the SI joint. Inferior and lateral entry 6 cm below the PSIS could reach the greater sciatic foramen, damaging the sacral plexus and superior gluteal artery and vein. If the entry slips above the PSIS over the pelvis, the trocar could enter the retroperitoneal space and damage the femoral nerve and common iliac artery and vein, leading to a retroperitoneal hemorrhage.4-6,20
MSCs are found as perivascular cells and lie in the cortices of bones.21 Following the approach angle and directed line from the PSIS to the anterior ilium wall described in this study (Figures 1 and 2), the trocar would pass through the narrow corridor as it advances farther into the ilium. The minimum width of this corridor was measured in this study and, on average, was 1.10 cm wide from cortex to cortex (Figure 3). As the bone marrow is aspirated from this narrow corridor, the clinician is gathering MSCs from both the lateral and medial cortices of the ilium. By aspirating from a greater surface area of the cortices, it is believed that this will increase the total collection of MSCs.
CONCLUSION
Although there are reports in the literature that describe techniques for bone marrow aspiration from the iliac crest, the techniques are very general and vague regarding the ideal angles and methods. Studies have attempted to quantify the safest entry sites for aspiration but have not detailed ideal parameters for collection. Blind aspiration from the iliac crest can have serious implications if adverse events occur, and thus there is a need for a safe and reliable method of aspiration from the iliac crest. Ultrasound guidance to identify anatomy, as opposed to palpation guidance, ensures anatomic placement of the trocar while minimizing the risk of aspiration. Based on the measurements gathered in this study, an optimal angle of entry and safe distance of penetration have been identified. Using our data and relevant literature, we developed a technique for a safe, consistent, and reliable method of bone marrow aspiration out of the iliac crest.
1. Chahla J, Mannava S, Cinque ME, Geeslin AG, Codina D, LaPrade RF. Bone marrow aspirate concentrate harvesting and processing technique. Arthrosc Tech. 2017;6(2):e441-e445. doi:10.1016/j.eats.2016.10.024.
2. Hernigou J, Alves A, Homma Y, Guissou I, Hernigou P. Anatomy of the ilium for bone marrow aspiration: map of sectors and implication for safe trocar placement. Int Orthop. 2014;38(12):2585-2590. doi:10.1007/s00264-014-2353-7.
3. Hernigou J, Picard L, Alves A, Silvera J, Homma Y, Hernigou P. Understanding bone safety zones during bone marrow aspiration from the iliac crest: the sector rule. Int Orthop. 2014;38(11):2377-2384. doi:10.1007/s00264-014-2343-9.
4. Bain BJ. Bone marrow biopsy morbidity: review of 2003. J Clin Pathol. 2005;58(4):406-408. doi:10.1136/jcp.2004.022178.
5. Bain BJ. Bone marrow biopsy morbidity and mortality: 2002 data. Clin Lab Haematol. 2004;26(5):315-318. doi:10.1111/j.1365-2257.2004.00630.x.
6. Bain BJ. Morbidity associated with bone marrow aspiration and trephine biopsy - a review of UK data for 2004. Haematologica. 2006;91(9):1293-1294.
7. Berkoff DJ, Miller LE, Block JE. Clinical utility of ultrasound guidance for intra-articular knee injections: a review. Clin Interv Aging. 2012;7:89-95. doi:10.2147/CIA.S29265.
8. Henkus HE, Cobben LP, Coerkamp EG, Nelissen RG, van Arkel ER. The accuracy of subacromial injections: a prospective randomized magnetic resonance imaging study. Arthroscopy. 2006;22(3):277-282. doi:10.1016/j.arthro.2005.12.019.
9. Hirahara AM, Panero AJ. A guide to ultrasound of the shoulder, part 3: interventional and procedural uses. Am J Orthop. 2016;45(7):440-445.
10. Jackson DW, Evans NA, Thomas BM. Accuracy of needle placement into the intra-articular space of the knee. J Bone Joint Surg Am. 2002;84-A(9):1522-1527.
11. Naredo E, Cabero F, Beneyto P, et al. A randomized comparative study of short term response to blind versus sonographic-guided injection of local corticosteroids in patients with painful shoulder. J Rheumatol. 2004;31(2):308-314.
12. Panero AJ, Hirahara AM. A guide to ultrasound of the shoulder, part 2: the diagnostic evaluation. Am J Orthop. 2016;45(4):233-238.
13. Sethi PM, El Attrache N. Accuracy of intra-articular injection of the glenohumeral joint: a cadaveric study. Orthopedics. 2006;29(2):149-152.
14. Sibbit WL Jr, Peisajovich A, Michael AA, et al. Does sonographic needle guidance affect the clinical outcome of intraarticular injections? J Rheumatol. 2009;36(9):1892-1902. doi:10.3899/jrheum.090013.
15. Smith J, Brault JS, Rizzo M, Sayeed YA, Finnoff JT. Accuracy of sonographically guided and palpation guided scaphotrapeziotrapezoid joint injections. J Ultrasound Med. 2011;30(11):1509-1515. doi:10.7863/jum.2011.30.11.1509.
16. Yamakado K. The targeting accuracy of subacromial injection to the shoulder: an arthrographic evaluation. Arthroscopy. 2002;18(8):887-891.
17. Hirahara AM, Andersen WJ. Ultrasound-guided percutaneous reconstruction of the anterolateral ligament: surgical technique and case report. Am J Orthop. 2016;45(7):418-422, 460.
18. Hirahara AM, Andersen WJ. Ultrasound-guided percutaneous repair of medial patellofemoral ligament: surgical technique and outcomes. Am J Orthop. 2017;46(3):152-157.
19. Hirahara AM, Mackay G, Andersen WJ. Ultrasound-guided InternalBrace of the medial collateral ligament. Arthrosc Tech. Submitted.
20. Jamaludin WFW, Mukari SAM, Wahid SFA. Retroperitoneal hemorrhage associated with bone marrow trephine biopsy. Am J Case Rep. 2013;14:489-493. doi:10.12659/AJCR.889274.
21. Bianco P, Cao X, Frenette PS, et al. The meaning, the sense and the significance: translating the science of mesenchymal stem cells into medicine. Nat Med. 2013;19(1):35-42. doi:10.1038/nm.3028.
ABSTRACT
Use of mesenchymal stem cells from bone marrow has gained significant popularity. The iliac crest has been determined to be an effective site for harvesting mesenchymal stem cells. Review of the literature reveals that multiple techniques are used to harvest bone marrow aspirate from the iliac crest, but the descriptions are based on the experience of various authors as opposed to studied anatomy. A safe, reliable, and reproducible method for aspiration has yet to be studied and described. We hypothesized that there would be an ideal angle and distance for aspiration that would be the safest, most consistent, and most reliable. Using magnetic resonance imaging (MRI), we reviewed 26 total lumbar spine MRI scans (13 males, 13 females) and found that an angle of 24° should be used when entering the most medial aspect of the posterior superior iliac spine (PSIS) and that this angle did not differ between the sexes. The distance that the trocar can advance after entry before hitting the anterior ilium wall varied significantly between males and females, being 7.53 cm in males and 6.74 cm in females. In addition, the size of the PSIS table was significantly different between males and females (1.20 cm and 0.96 cm, respectively). No other significant differences in the measurements gathered were found. Using the data gleaned from this study, we developed an aspiration technique. This method uses ultrasound to determine the location of the PSIS and the entry point on the PSIS. This contrasts with most techniques that use landmark palpation, which is known to be unreliable and inaccurate. The described technique for aspiration from the PSIS is safe, reliable, reproducible, and substantiated by data.
The iliac crest is an effective site for harvesting bone marrow stem cells. It allows for easy access and is superficial in most individuals, allowing for a relatively quick and simple procedure. Use of mesenchymal stem cells (MSCs) for treatment of orthopedic injuries has grown recently. Whereas overall use has increased, review of the literature reveals very few techniques for iliac crest aspiration,1 but these are not based on anatomic relationships or studies. Hernigou and colleagues2,3 attempted to quantitatively evaluate potential “sectors” allowing for safe aspiration using cadaver and computed tomographic reconstruction imaging. We used magnetic resonance imaging (MRI) to analyze aspiration parameters. Owing to the ilium’s anatomy, improper positioning or aspiration technique during aspiration can result in serious injury.2,4-6 We hypothesized that there is an ideal angle and positioning for bone marrow aspiration from the posterior superior iliac spine (PSIS) that is safe, consistent, and reproducible. Although most aspiration techniques use landmark palpation, this is unreliable and inaccurate, especially when compared with ultrasound-guided injections7-16 and procedures.9,12,17-19 We describe our technique using ultrasound to visualize patient anatomy and accurately determine anatomic entry with the trocar.
METHODS
MRI scans of 26 patients (13 males, 13 females) were reviewed to determine average angles and distances. Axial T2-weighted views of the lumbar spine were used in all analyses. The sacroiliac (SI) joint angle was defined as the angle formed between the vector through the midline of the pelvis and the vector that is parallel to the SI joint. The approach angle was defined as the angle formed between the vector of the most medial aspect of the PSIS through the ilium to the anterior wall and the vector through the midline of the pelvis (Figure 1).
Continue to: For the 13 males, the mean SI joint...
RESULTS
The results are reported in the Table.
Table. Measurements of Patients Taken on Axial T2-Weighted Views of Lumbosacral MRI Scansa
Patient | SI Joint Angle (°) | Approach Angle (°) | PSIS Table Width (cm) | PSIS to Anterior Ilium Wall (cm) | Perpendicular Distance PSIS to Anterior Joint (cm) | Post Ilium Wall to SI Joint Width (cm) |
Males | ||||||
1 | 28.80 | 19.50 | 1.24 | 8.80 | 4.16 | 1.52 |
2 | 31.80 | 27.60 | 1.70 | 7.89 | 3.49 | 1.02 |
3 | 33.70 | 27.70 | 1.12 | 8.14 | 3.15 | 1.28 |
4 | 23.70 | 26.40 | 0.95 | 6.66 | 3.22 | 0.65 |
5 | 35.90 | 28.40 | 0.84 | 7.60 | 2.57 | 0.95 |
6 | 33.80 | 29.30 | 1.20 | 7.73 | 2.34 | 0.90 |
7 | 30.30 | 21.20 | 1.36 | 8.44 | 3.95 | 1.18 |
8 | 34.50 | 20.40 | 1.53 | 7.08 | 3.98 | 1.56 |
9 | 28.70 | 24.00 | 1.34 | 8.19 | 3.51 | 1.31 |
10 | 22.40 | 20.10 | 1.37 | 7.30 | 3.87 | 1.28 |
11 | 33.60 | 20.80 | 0.88 | 6.43 | 3.26 | 0.94 |
12 | 48.50 | 31.00 | 1.15 | 6.69 | 2.97 | 1.38 |
13 | 20.20 | 20.90 | 0.94 | 6.95 | 3.79 | 1.05 |
Averages | 31.22 | 24.41 | 1.20 | 7.53 | 3.40 | 1.16 |
Standard Deviation | 7.18 | 4.11 | 0.26 | 0.75 | 0.56 | 0.26 |
Females | ||||||
14 | 22.80 | 23.20 | 1.54 | 7.21 | 3.45 | 1.39 |
15 | 33.30 | 21.40 | 1.09 | 7.26 | 3.57 | 0.98 |
16 | 19.70 | 15.60 | 0.78 | 8.32 | 3.76 | 0.86 |
17 | 17.50 | 15.60 | 0.61 | 7.57 | 3.37 | 1.03 |
18 | 48.20 | 26.60 | 0.94 | 6.62 | 3.16 | 0.71 |
19 | 38.20 | 28.30 | 0.90 | 6.32 | 2.23 | 0.91 |
20 | 44.50 | 31.70 | 0.99 | 6.19 | 3.06 | 0.76 |
21 | 24.10 | 18.00 | 0.92 | 6.99 | 3.23 | 0.71 |
22 | 17.20 | 14.80 | 0.81 | 6.00 | 2.81 | 1.13 |
23 | 42.00 | 38.50 | 1.00 | 5.33 | 2.47 | 1.42 |
24 | 32.00 | 25.50 | 0.98 | 6.01 | 2.79 | 1.21 |
25 | 24.70 | 24.80 | 0.87 | 6.09 | 2.79 | 1.02 |
26 | 19.80 | 22.30 | 1.04 | 7.71 | 2.37 | 1.36 |
Averages | 29.54 | 23.56 | 0.96 | 6.74 | 3.00 | 1.04 |
Standard Deviation | 10.84 | 6.88 | 0.21 | 0.85 | 0.48 | 0.25 |
All patients Averages | 30.38 | 23.98 | 1.08 | 7.14 | 3.20 | 1.10 |
Standard Deviation | 9.05 | 5.57 | 0.26 | 0.88 | 0.55 | 0.26 |
aStatistical significance is denoted as P < .02.
Abbreviations: MRI, magnetic resonance imaging; PSIS, posterior iliac spine; SI, sacroiliac.
For the 13 males, the mean SI joint angle was 31.22° ± 7.18° (range, 20.20° to 48.50°). The mean approach angle was 24.41° ± 4.11° (range, 19.50° to 31.00°). The mean PSIS table width was 1.20 cm ± 0.26 cm (range, 0.84 cm to 1.70 cm). The mean distance from the PSIS to the anterior ilium wall was 7.53 cm ± 0.75 cm (range, 6.43 cm to 8.80 cm). The mean perpendicular distance from the PSIS table to the anterior ilium was 3.40 cm ± 0.56 cm (range, 2.34 cm to 4.16 cm). The mean minimum width of the ilium to the SI joint was 1.16 cm ± 0.26 cm (range, 0.65 cm to 1.56 cm).
For the 13 females, the mean SI joint angle was 29.54° ± 10.84° (range, 17.20° to 48.20°). The mean approach angle was 23.56° ± 6.88° (range, 14.80° to 38.50°). The mean PSIS table width was 0.96 cm ± 0.21 cm (range, 0.61 cm to 1.54 cm). The mean distance from the PSIS to the anterior ilium wall was 6.74 cm ± 0.85 cm (range, 5.33 cm to 8.32 cm). The mean perpendicular distance from the PSIS table to the anterior ilium was 3.00 cm ± 0.48 cm (range, 2.23 cm to 3.76 cm). The mean minimum width of the ilium to the SI joint was 1.04 cm ± 0.25 cm (range, 0.71 cm to 1.42 cm).
For the 26 total patients, the mean SI joint angle was 30.38° ± 9.05° (range, 17.20° to 48.50°). The mean approach angle was 23.98° ± 5.57° (range, 14.80° to 38.50°). The mean PSIS table width was 1.08 cm ± 0.26 cm (range, 0.61 cm to 1.70 cm). The mean distance from the PSIS to the anterior ilium wall was 7.14 cm ± 0.88 cm (range, 5.33 cm to 8.80 cm). The mean perpendicular distance from the PSIS table to the anterior ilium was 3.20 cm ± 0.55 cm (range, 2.23 cm to 4.16 cm). The mean minimum width of the ilium to the SI joint was 1.10 cm ± 0.26 cm (range, 0.65 cm to 1.56 cm).
There was a statistically significant difference between the male and female groups for the maximum distance the trocar can be advanced from the PSIS to the anterior ilium wall (P < .02), and a statistically significant difference for the PSIS table width (P < .02). There were no significant differences between the male and female groups for the approach angle, the SI joint angle, the perpendicular distance from the PSIS to the anterior ilium, and the minimum width of the ilium to the SI joint.
Continue to: The patient is brought to the procedure...
TECHNIQUE: ILIAC CREST (PSIS) BONE MARROW ASPIRATION
The patient is brought to the procedure room and placed in a prone position. The donor site is prepared and draped in the usual sterile manner. Ultrasound is used to identify the median sacral crest in a short-axis view. The probe is then moved laterally to identify the PSIS (Figures 4A, 4B).
The crosshairs on the ultrasound probe are used to mark the center lines of each plane. The central point marks the location of the PSIS. Alternatively, an in-plane technique can be used to place a spinal needle on the exact entry point on the PSIS. Once the PSIS and entry point are identified, the site is blocked with 10 mL of 0.5% ropivacaine.
Prior to introduction of the trocar, all instrumentation is primed with heparin and syringes are prepped with anticoagulant citrate dextrose solution, solution A. A stab incision is made at the site. The trocar is placed at the entry point, which should be centered in a superior-inferior plane and at the most medial point of the PSIS. Starting with the trocar vertical, the trocar is angled laterally 24° by dropping the hand medially toward the midline. No angulation cephalad or caudad is necessary, but cephalad must be avoided so as not to skive superiorly. This angle, which is recommended for both males and females, allows for the greatest distance the trocar can travel in bone before hitting the anterior ilium wall. A standard deviation of 5.57° is present, which should be considered. Steady pressure should be applied with a slight twisting motion on the PSIS. If advancement of the trocar is too difficult, a mallet or drill can be used to assist in penetration.
With the trocar advanced into the bone 1 cm, the trocar needle is removed while the cannula remains in place. The syringe is attached to the top of the cannula. The syringe plunger is pulled back to aspirate 20 mL of bone marrow. The cannula and syringe assembly are advanced 2 cm farther into the bone to allow for aspiration of a new location within the bone marrow cavity, and 20 mL of bone marrow are again aspirated. This is done a final time, advancing the trocar another 2 cm and aspirating a final 20 mL of bone marrow. The entire process should yield roughly 60 mL of bone marrow from one side. If desired, the same process can be repeated for the contralateral PSIS to yield a total of 120 mL of bone marrow from the 2 sites.
Based on our data, the average distance to the anterior ilium wall was 7 cm, but the shortest distance noted in this study was 5 cm. On the basis of the data presented, this technique allows for safe advancement based on even the shortest measured distance, without fear of puncturing the anterior ilium wall. Perforation could damage the femoral nerve and the internal or external iliac artery or vein that lie anterior to the ilium.
Continue to: We hypothesized that there...
DISCUSSION
We hypothesized that there would be an optimal angle of entry and maximal safe distance the trocar could advance through the ilium when aspirating. Because male and female pelvic anatomy differs, we also hypothesized that there would be differences in distance and size measurements for males and females. Our results supported our hypothesis that there is an ideal approach angle. The results also showed that the maximum distance the trocar can advance and the width of the PSIS table differ significantly between males and females.
Although pelvic anatomy differs between males and females, there should be an ideal entry angle that would allow maximum advancement into the ilium without perforating the anterior wall, which we defined as the approach angle. In our comparison of 26 MRI scans, we found that the approach angle did not differ significantly between the 2 groups (13 males, 13 females). This allows clinicians to enter the PSIS at roughly 24° medial to the parasagittal line, maximizing the space before puncturing into the anterior pelvis in either males or females.
If clinicians were to enter perpendicular to the patient’s PSIS, they would, on average, be able to advance only 3.20 cm before encountering the SI joint. When entering at 24° as we recommend, the average distance increases to 7.14 cm. Although the angle did not differ significantly, there was a significant difference between males and females in the length from the PSIS to the anterior wall, with males having 7.53 cm distance and females 6.74 cm. This is an important measurement because if the anterior ilium wall is punctured, the femoral nerve and the common, internal and external iliac arteries and veins could be damaged, resulting in retroperitoneal hemorrhage.
A fatality in 2001 in the United Kingdom led to a national audit of bone marrow aspiration and biopsies.4-6 Although these procedures were done primarily for patients with cancer, hemorrhagic events were the most frequent and serious events. This audit led to the identification of many risk factors. Bain4-6 conducted reviews of bone marrow aspirations and biopsies in the United Kingdom from 2002 to 2004. Of a total of 53,088 procedures conducted during that time frame, 48 (0.09%) adverse events occurred, with 29 (0.05%) being hemorrhagic events. Although infrequent, hemorrhagic adverse events represent significant morbidity. Reviews such as those conducted by Bain4-6 highlight the importance of a study that helps determine the optimal parameters for aspiration to ensure safety and reliability.
Hernigou and colleagues2,3 conducted studies analyzing different “sectors” in an attempt to develop a safe aspiration technique. They found that obese patients were at higher risk, and some sites of aspiration (sectors 1, 4, 5) had increased risk for perforation and damage to surrounding structures. Their sector 6, which incorporated the entirety of the PSIS table, was considered the safest, most reliable site for trocar introduction.2,3 Hernigou and colleagues,2 in comparing the bone mass of the sectors, also noted that sector 6 has the greatest bone thickness close to the entry point, making it the most favorable site. The PSIS is not just a point; it is more a “table.” The PSIS can be palpated posteriorly, but this is inaccurate and unreliable, particularly in larger individuals. The PSIS table can be identified on ultrasound before introducing the trocar, which is a more reliable method of landmark identification than palpation guidance, just as in ultrasound-guided injections7-16 and procedures.9,12,17-19
Continue to: If the PSIS is not accurately...
If the PSIS is not accurately identified, penetration laterally will result in entering the ilium wing, where it is quite narrow. We found the distance between the posterior ilium wall and the SI joint to be only 1.10 cm wide (Figure 3); we defined this area as the narrow corridor. Superior and lateral entry could damage the superior cluneal nerves coming over the iliac crest, which are located 6 cm lateral to the SI joint. Inferior and lateral entry 6 cm below the PSIS could reach the greater sciatic foramen, damaging the sacral plexus and superior gluteal artery and vein. If the entry slips above the PSIS over the pelvis, the trocar could enter the retroperitoneal space and damage the femoral nerve and common iliac artery and vein, leading to a retroperitoneal hemorrhage.4-6,20
MSCs are found as perivascular cells and lie in the cortices of bones.21 Following the approach angle and directed line from the PSIS to the anterior ilium wall described in this study (Figures 1 and 2), the trocar would pass through the narrow corridor as it advances farther into the ilium. The minimum width of this corridor was measured in this study and, on average, was 1.10 cm wide from cortex to cortex (Figure 3). As the bone marrow is aspirated from this narrow corridor, the clinician is gathering MSCs from both the lateral and medial cortices of the ilium. By aspirating from a greater surface area of the cortices, it is believed that this will increase the total collection of MSCs.
CONCLUSION
Although there are reports in the literature that describe techniques for bone marrow aspiration from the iliac crest, the techniques are very general and vague regarding the ideal angles and methods. Studies have attempted to quantify the safest entry sites for aspiration but have not detailed ideal parameters for collection. Blind aspiration from the iliac crest can have serious implications if adverse events occur, and thus there is a need for a safe and reliable method of aspiration from the iliac crest. Ultrasound guidance to identify anatomy, as opposed to palpation guidance, ensures anatomic placement of the trocar while minimizing the risk of aspiration. Based on the measurements gathered in this study, an optimal angle of entry and safe distance of penetration have been identified. Using our data and relevant literature, we developed a technique for a safe, consistent, and reliable method of bone marrow aspiration out of the iliac crest.
1. Chahla J, Mannava S, Cinque ME, Geeslin AG, Codina D, LaPrade RF. Bone marrow aspirate concentrate harvesting and processing technique. Arthrosc Tech. 2017;6(2):e441-e445. doi:10.1016/j.eats.2016.10.024.
2. Hernigou J, Alves A, Homma Y, Guissou I, Hernigou P. Anatomy of the ilium for bone marrow aspiration: map of sectors and implication for safe trocar placement. Int Orthop. 2014;38(12):2585-2590. doi:10.1007/s00264-014-2353-7.
3. Hernigou J, Picard L, Alves A, Silvera J, Homma Y, Hernigou P. Understanding bone safety zones during bone marrow aspiration from the iliac crest: the sector rule. Int Orthop. 2014;38(11):2377-2384. doi:10.1007/s00264-014-2343-9.
4. Bain BJ. Bone marrow biopsy morbidity: review of 2003. J Clin Pathol. 2005;58(4):406-408. doi:10.1136/jcp.2004.022178.
5. Bain BJ. Bone marrow biopsy morbidity and mortality: 2002 data. Clin Lab Haematol. 2004;26(5):315-318. doi:10.1111/j.1365-2257.2004.00630.x.
6. Bain BJ. Morbidity associated with bone marrow aspiration and trephine biopsy - a review of UK data for 2004. Haematologica. 2006;91(9):1293-1294.
7. Berkoff DJ, Miller LE, Block JE. Clinical utility of ultrasound guidance for intra-articular knee injections: a review. Clin Interv Aging. 2012;7:89-95. doi:10.2147/CIA.S29265.
8. Henkus HE, Cobben LP, Coerkamp EG, Nelissen RG, van Arkel ER. The accuracy of subacromial injections: a prospective randomized magnetic resonance imaging study. Arthroscopy. 2006;22(3):277-282. doi:10.1016/j.arthro.2005.12.019.
9. Hirahara AM, Panero AJ. A guide to ultrasound of the shoulder, part 3: interventional and procedural uses. Am J Orthop. 2016;45(7):440-445.
10. Jackson DW, Evans NA, Thomas BM. Accuracy of needle placement into the intra-articular space of the knee. J Bone Joint Surg Am. 2002;84-A(9):1522-1527.
11. Naredo E, Cabero F, Beneyto P, et al. A randomized comparative study of short term response to blind versus sonographic-guided injection of local corticosteroids in patients with painful shoulder. J Rheumatol. 2004;31(2):308-314.
12. Panero AJ, Hirahara AM. A guide to ultrasound of the shoulder, part 2: the diagnostic evaluation. Am J Orthop. 2016;45(4):233-238.
13. Sethi PM, El Attrache N. Accuracy of intra-articular injection of the glenohumeral joint: a cadaveric study. Orthopedics. 2006;29(2):149-152.
14. Sibbit WL Jr, Peisajovich A, Michael AA, et al. Does sonographic needle guidance affect the clinical outcome of intraarticular injections? J Rheumatol. 2009;36(9):1892-1902. doi:10.3899/jrheum.090013.
15. Smith J, Brault JS, Rizzo M, Sayeed YA, Finnoff JT. Accuracy of sonographically guided and palpation guided scaphotrapeziotrapezoid joint injections. J Ultrasound Med. 2011;30(11):1509-1515. doi:10.7863/jum.2011.30.11.1509.
16. Yamakado K. The targeting accuracy of subacromial injection to the shoulder: an arthrographic evaluation. Arthroscopy. 2002;18(8):887-891.
17. Hirahara AM, Andersen WJ. Ultrasound-guided percutaneous reconstruction of the anterolateral ligament: surgical technique and case report. Am J Orthop. 2016;45(7):418-422, 460.
18. Hirahara AM, Andersen WJ. Ultrasound-guided percutaneous repair of medial patellofemoral ligament: surgical technique and outcomes. Am J Orthop. 2017;46(3):152-157.
19. Hirahara AM, Mackay G, Andersen WJ. Ultrasound-guided InternalBrace of the medial collateral ligament. Arthrosc Tech. Submitted.
20. Jamaludin WFW, Mukari SAM, Wahid SFA. Retroperitoneal hemorrhage associated with bone marrow trephine biopsy. Am J Case Rep. 2013;14:489-493. doi:10.12659/AJCR.889274.
21. Bianco P, Cao X, Frenette PS, et al. The meaning, the sense and the significance: translating the science of mesenchymal stem cells into medicine. Nat Med. 2013;19(1):35-42. doi:10.1038/nm.3028.
TAKE-HOME POINTS
- There is an ideal angle and distance for optimization of a bone marrow harvest from the iliac crest.
- Ultrasound is a reliable technology that allows clinicians to accurately and consistently identify the PSIS and avoid neurovascular structures.
- This safe, reliable bone marrow aspiration technique can lower the risk of serious potential complications.
- The ideal angle does not differ significantly between sexes, but the safe distance a clinician can advance does.
- The PSIS should be considered a “table” as opposed to a protuberance.
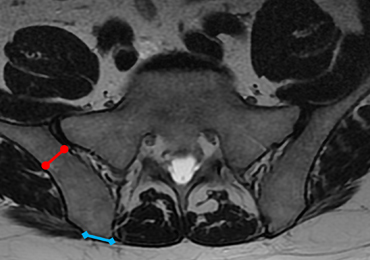
Use of Short Peripheral Intravenous Catheters: Characteristics, Management, and Outcomes Worldwide
The majority of hospitalized patients worldwide have at least one peripheral intravenous catheter (PIVC),1 making PIVC insertion one of the most common clinical procedures. In the United States, physicians, advanced practitioners, and nurses insert over 300 million of these devices in hospitalized patients annually.2 Despite their prevalence, PIVCs are associated with high rates of complications, including insertion difficulty, phlebitis, infiltration, occlusion, dislodgment, and catheter-associated bloodstream infection (CABSI), known to increase morbidity and mortality risk.2-9 Up to 90% of PIVCs are prematurely removed owing to failure before planned replacement or before intravenous (IV) therapy completion.3-6,10-12
PIVC complication and failure commonly triggers insertion of a replacement device and can entail significant costs.2-4 One example is PIVC-related CABSI, where treatment costs have been estimated to be between US$35,000 and US$56,000 per patient.6,13 Another important consideration is the pain and anxiety experienced by patients who need a replacement device, particularly those with difficult vascular access, who may require multiple cannulation attempts to replace a PIVC.12,14-16 In developing nations, serious adverse events related to PIVCs are even more concerning, because hospital acquired infection rates and associated mortality are nearly 20 times greater than in developed nations.17
A number of evidence-based interventions have been suggested to reduce PIVC failure rates. In addition to optimal hand hygiene when inserting or accessing a PIVC to prevent infection,18 recommended interventions include placement of the PIVC in an area of non-flexion such as the forearm to provide stability for the device and to reduce patient discomfort, securing the PIVC to reduce movement of the catheter at the insertion site and within the blood vessel, and use of occlusive dressings that reduce the risk of external contamination of the PIVC site.11,19,20 Best practice guidelines also recommend the prompt removal of devices that are symptomatic (when phlebitis or other complications are suspected) and when the catheter is no longer required.21,22
Recent evidence has demonstrated that catheter size can have an impact on device survival rates. In adults, large-bore catheters of 18 gauge (G) or higher were found to have an increased rate of thrombosis, and smaller-bore catheters of 22G or lower (in adults) were found to have higher rates of dislodgment and occlusion/infiltration. The catheter size recommended for adults based on the latest evidence for most clinical applications is 20G.3,20,23,24 In addition, the documentation of insertion, maintenance, and removal of PIVCs in the medical record is a requirement in most healthcare facilities worldwide and is recommended by best practice guidelines; however, adherence remains a challenge.1,19
The concerning prevalence of PIVC-related complications and the lack of comparative data internationally on organizational compliance with best practice guidelines formed the rationale for this study. Our study aim was to describe the insertion characteristics, management practices, and outcomes of PIVCs internationally and to compare these variables to recommended best practice.
MATERIALS AND METHODS
Study Design and Participants
In this international cross-sectional study, we recruited hospitals through professional networks, including vascular access, infection prevention, safety and quality, nursing, and hospital associations (Appendix 2). Healthcare organizations, government health departments, and intravascular device suppliers were informed of the study and requested to further disseminate information through their networks. A study website was developed,25 and social media outlets, including Twitter®, LinkedIn®, and Facebook®, were used to promote the study.
Approval was granted by the Griffith University Human Research Ethics Committee in Australia (reference number NRS/34/13/HREC). In addition, evidence of study site and local institutional review board/ethics committee approval was required prior to study commencement. Each participating site agreed to follow the study protocol and signed an authorship agreement form. No financial support was provided to any site.
Hospitalized adult and pediatric patients with a PIVC in situ on the day of the study were eligible for inclusion. Sample size was determined by local capacity. Hospitals were encouraged to audit their entire institution if possible; however, data were accepted from as little as one ward. Data collectors comprised nurses and doctors with experience in PIVC assessment. They were briefed on the study protocol and data collection forms by the local site coordinator, and they were supported by an overall global coordinator. Clinicians assessed the PIVC insertion site and accessed hospital records to collect data related to PIVC insertion, concurrent medications, and IV fluid orders. Further clarification of data was obtained if necessary by the clinicians from the patients and treating staff. No identifiable patient information was collected.
Data Collection
To assess whether clinical facilities were following best practice recommendations, the study team developed three data collection forms to collect information regarding site characteristics (site questionnaire), track participant recruitment (screening log), and collect data regarding PIVC characteristics and management practices (case report form [CRF]). All forms were internally and externally validated following a pilot study involving 14 sites in 13 countries.1
The CRF included variables used to assess best practice interventions, such as catheter insertion characteristics (date and time, reason, location, profession of inserter, anatomical site of placement), catheter type (gauge, brand, and product), insertion site assessment (adverse symptoms, dressing type and integrity), and information related to the IV therapy (types of IV fluids and medications, flushing solutions). Idle PIVCs were defined as not being used for blood sampling or IV therapy in the preceding 24 h.
Data collection forms were translated into 15 languages by professional translators and back-translated for validity. Translation of some languages included additional rigor. For example, Spanish-speaking members from the Spanish mainland as well as from South America were employed so that appropriate synonyms were used to capture local terms and practice. Three options were provided for data entry: directly into a purpose-developed electronic database (Lime Survey® Project, Hamburg, Germany); on paper, then transcribed into the survey database at a later time by the hospital site; or paper entry then sent (via email or post) to the coordinating center for data entry. Once cleaned and collated, all data were provided to each participating hospital to confirm accuracy and for site use in local quality improvement processes. Data were collected between June 1, 2014 and July 31, 2015.
Statistical Analysis
All data management was undertaken using SAS statistical software (SAS Institute Inc., Cary NC, USA). Results are presented for eight geographical regions using descriptive statistics (frequencies, percentages, and 95% CIs) for the variables of interest. To assess trends in catheter dwell time and rates of phlebitis, Poisson regression was used. All analyses were undertaken using the R language for statistical analysis (R Core Team, Vienna, Austria). The (STROBE (Strengthening the Reporting of Observational Studies in Epidemiology statement) guidelines for cross-sectional studies were followed, and results are presented according to these recommendations.26
RESULTS
Of the 415 hospitals that participated in this study, 406 had patients with PIVCs on the day of the study (the others being small rural centers). Thus, a total of 40,620 PIVCs in 38,161 patients from 406 hospitals in 51 countries were assessed, with no more than 5% missing data for any CRF question. There were 2459 patients (6.1%) with two or more PIVCs concurrently in situ. The median patient age was 59 y (interquartile range [IQR], 37–74 y), and just over half were male (n = 20,550, 51%). Hospital size ranged from fewer than 10 beds to over 1,000 beds, and hospitals were located in rural, regional, and metropolitan districts. The majority of countries (n = 31, 61%) contributed multiple sites, the highest being Australia with 79 hospitals. Countries with the most PIVCs studied were Spain (n = 5,553, 14%) and the United States (n = 5,048, 12%).
General surgical (n = 15,616, 39%) and medical (n = 15,448, 38%) patients represented most of the population observed. PIVCs were inserted primarily in general wards or clinics (n = 22,167, 55%) or in emergency departments (n = 7,388, 18%; Table) and for the administration of IV medication (n = 28,571, 70%) and IV fluids (n = 7,093, 18%; Table).
Globally, nurses were the primary PIVC inserters (n = 28,575, 71%); however, Australia/New Zealand had only 26% (n = 1,518) of PIVCs inserted by this group (Table). Only about one-third of PIVCs were placed in an area of non-flexion (forearm, n = 12,675, 31%, Table) the majority (n = 27,856, 69%) were placed in non-recommended anatomical sites (Figure 1). Most PIVCs were placed in the hand (n = 13,265, 32.7%) followed by the antecubital veins (n = 6176, 15.2%) and the wrist (n = 5,465, 13.5%). Site selection varied widely across the regions; 29% (n = 1686) of PIVCs in Australia/New Zealand were inserted into the antecubital veins, twice the study group average. Over half of the PIVCs inserted in the Middle East were placed in the hand (n = 295, 56%). This region also had the highest prevalence of devices placed in nonrecommended sites (n = 416, 79%; Figure 1).
The majority of PIVCs (n = 27,192, 67%; Table) were of recommended size (20–22G); however, some devices were observed to be large (14–18G; n = 6,802, 17%) or small (24-26g; n = 4,869, 12%) in adults. In Asia, 41% (n = 2,617) of devices inserted were 24-26G, more than three times the global rate. Half of all devices in Asia (n = 3,077, 48%) and the South Pacific (n = 67, 52%) were of a size not recommended for routine IV therapy (Figure 2).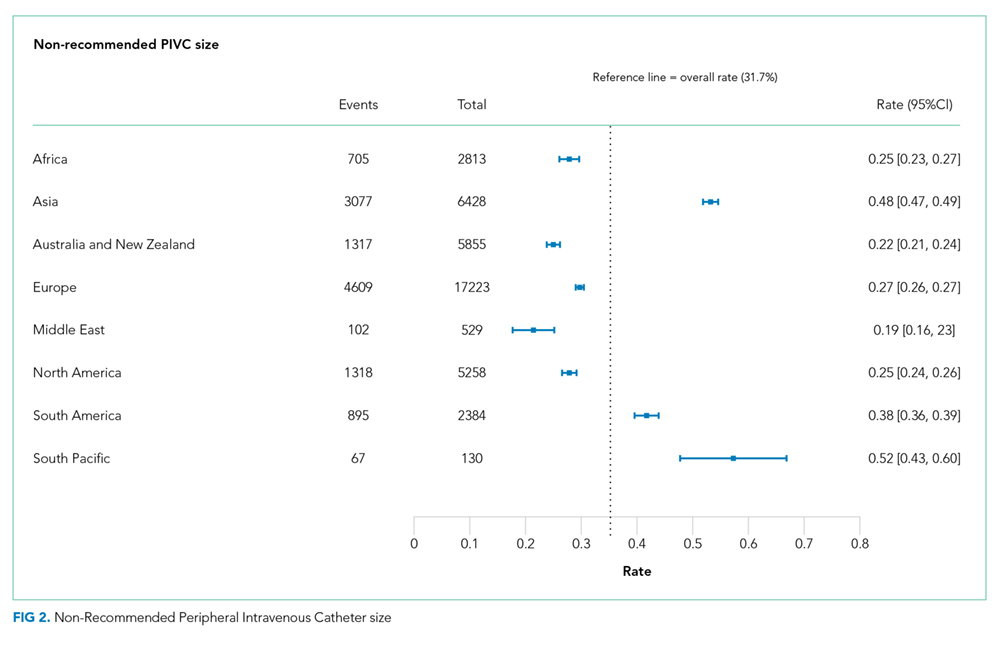
The primary dressing material used was a transparent dressing (n = 31,596, 77.8%; Table); however, nearly 1 in 5 dressings used had either nonsterile tape alone (n = 5,169, 13%; Appendix 4), or a sterile gauze and tape (n = 2,592, 6%; Appendix 4.1). We found a wide variation in the use of nonsterile tape, including 1 in every 3 devices in South America dressed with nonsterile tape (n = 714, 30%) and a larger proportion in Africa (n = 543, 19%) and Europe (n = 3,056, 18%). Nonsterile tape was rarely used in North America and Australia/New Zealand. Although most PIVC dressings were clean, dry, and intact (n = 31,786, 79%; Table), one-fifth overall were compromised (moist, soiled, and/or lifting off the skin). Compromised dressings (Appendix 4.2) were more prevalent in Australia/New Zealand (n = 1,448; 25%) and in Africa (n = 707, 25%) than elsewhere.
Ten percent of PIVCs (n = 4,204) had signs and/or symptoms suggestive of phlebitis (characterized by pain, redness and/or swelling at the insertion site; Appendix 4.3). The highest prevalence of phlebitis occurred in Asia (n = 1,021, 16%), Africa (n = 360, 13%), and South America (n = 284, 12%). Pain and/or redness were the most common phlebitis symptoms. We found no association between dwell time of PIVCs and phlebitis rates (P = .085). Phlebitis rates were 12% (Days 1-3; n = 15,625), 16% (Days 4-7; n = 3,348), 10% (Days 8-21; n = 457), and 13% (Day21+; n = 174). Nearly 10% (n = 3,879) of catheters were observed to have signs of malfunction such as blood in the infusion tubing, leaking at the insertion site, or dislodgment (Appendix 4.4).
We observed 14% (n = 5,796) of PIVCs to be idle (Appendix 4.5), defined as not used in the preceding 24 h. Nearly one-fourth of all devices in North America (n = 1,230, 23%) and Australia/New Zealand (n = 1,335, 23%) were idle. PIVC documentation in hospital records was also poor, nearly half of all PIVCs (n = 19,768, 49%) had no documented date and time of insertion. The poorest compliance was in Australia/New Zealand (n = 3,428, 59%; Appendix 4.6). We also observed that 1 in 10 PIVCs had no documentation regarding who inserted the PIVC (n = 3,905). Thirty-six percent of PIVCs (n = 14,787) had no documented assessment of the PIVC site on the day of review (Appendix 4.7), including over half of all PIVCs in Asia (n = 3,364, 52%). Overall, the median dwell at the time of assessment for PIVCs with insertion date/time documented was 1.5 d (IQR, 1.0–2.5 d).
DISCUSSION
This international assessment of more than 40,000 PIVCs in 51 countries provides great insight into device characteristics and variation in management practices. Predominantly, PIVCs were inserted by nurses in the general ward environment for IV medication. One in ten PIVCs had at least one symptom of phlebitis, one in ten were dysfunctional, one in five PIVC dressings were compromised, and one in six PIVCs had not been used in the preceding 24 h. Nearly half of the PIVCs audited had the insertion date and time missing.
Regional variation was found in the professions inserting PIVCs, as well as in anatomical placement. In Australia/New Zealand, the proportion of nurses inserting PIVCs was much lower than the study group average (26% vs 71%). Because these countries contributed a substantial number of hospitals to the study, this seems a representative finding and suggests a need for education targeted at nurses for PIVC insertion in this region. The veins in the forearm are recommended as optimal for PIVC insertion in adults, rather than areas of high flexion, because the forearm provides a wide surface area to secure and dress PIVCs. Forearm placement can reduce pain during catheter dwell as well as decrease the risk of accidental removal or occlusion.3,19,27 We found only one-third of PIVCs were placed in the forearm, with most placed in the hand, antecubital veins, or wrist. This highlights an inconsistency with published recommendations and suggests that additional training and technology are required so that staff can better identify and insert PIVCs in the forearm for other than very short-term (procedural) PIVCp;s.19
Phlebitis triggering PIVC failure remains a global clinical challenge with numerous phlebitis definitions and varied assessment techniques.10 The prevalence of phlebitis has been difficult to approximate with varying estimates and definitions in the literature; however, it remains a key predictor of PIVC failure.6,10 Identification of this complication and prompt removal of the device is critical for patient comfort and reducing CABSI risk.5,28 The overall prevalence of phlebitis signs or symptoms (defined in this study as having one or more signs of redness, swelling, or pain surrounding the insertion site) was just over 10%, with pain and/or redness being most prevalent. These compromised PIVCs had not been removed as is recommended for such complications.19,28 Considering that our study was a snapshot at only one time point, the per-catheter incidence of phlebitis would be even higher; interestingly, among PIVCs with a documented insertion date and time, we observed that dwell time did not influence phlebitis rates.
Another concern is that nearly 10% (n = 3,879) of PIVCs were malfunctioning (eg, leaking) but were still in place. To bring these problems into context, around 2 billion PIVCs are used annually worldwide; as a consequence, millions of patients suffer from painful or malfunctioning PIVCs staff had not responded.1,29 The placement of large-bore catheters, and smaller-gauge ones in adults, is known to increase the incidence of malfunction that leads to failure. There are a number of sound clinical reasons for the use of large-bore (eg, resuscitation and rapid fluid replacement) or small-bore (eg, difficult venous access with small superficial veins only visible and palpable) catheters. However, it would be expected that only a small proportion of patients would require these devices, and not one in three devices as we identified. This finding suggests that some PIVCs were inappropriate in size for general IV therapy and may reflect antiquated hospital policies for some clinical cohorts.30,31
Overall, transparent dressings were used to cover the PIVC, but a number of patients were observed to have a sterile gauze and tape dressing (n = 2,592, 6%). Although the latter is less common, both dressing approaches are recommended in clinical practice guidelines because there is a lack of high-quality evidence regarding which is superior.21,22,32 Of concern was the use of nonsterile tape to dress the PIVC (n = 5,169, 12.7%). We found the prevalence of nonsterile tape use to be higher in lower-resourced countries in South America (n = 714, 30%), Africa (n = 543, 19%) and Europe (n = 3,056, 18%) and this was likely related to institutional cost reduction practices.
This finding illustrates an important issue regarding proper PIVC care and management practices in developing nations. It is widely known that access to safe health care in lower-resourced nations is challenging and that rates of mortality related to healthcare-associated infections are much higher. Thus, the differences we found in PIVC management practices in these countries are not surprising.33,34 International health networks such as the Infection Control Africa Network, the International Federation of Infection Control, and the Centers for Disease Control and Prevention can have great influence on ministries of health and clinicians in these countries to develop coordinated efforts for safe and sustainable IV practices to reduce the burden of hospital-acquired infections and related morbidity and mortality.
We found that 14% of all PIVCs had no documented IV medication or IV fluid administered in the previous 24 h, strongly indicating that they were no longer needed. Australia/New Zealand, Europe, and North America were observed to have a higher prevalence of idle catheters than the remaining regions. This suggests that an opportunity exists to develop surveillance systems that better identify idle devices for prompt removal to reduce infection risk and patient discomfort. Several randomized controlled trials, a Cochrane review, and clinical practice guidelines recommend prompt removal of PIVCs when not required, if there are any complications, or if the PIVC was inserted urgently without an aseptic insertion technique.21,28,35,36 Idle PIVCs have been implicated in adverse patient outcomes, including phlebitis and CABSI.13,27
The substantial proportion of patients with a PIVC in this study who had no clinical indication for a PIVC, a symptomatic insertion site, malfunctioning catheter, and suboptimal dressing quality suggests the need for physicians, advanced practitioners, and nurses to adopt evidence-based PIVC insertion and maintenance bundles and supporting checklists to reduce the prevalence of PIVC complications.19,21,38-40 Recommended strategies for inclusion in PIVC maintenance bundles are prompt removal of symptomatic and/or idle catheters, hand hygiene prior to accessing the catheter, regular assessment of the device, and replacement of suboptimal dressings.41,42 This approach should be implemented across all clinical specialties involved in PIVC insertion and care.
Our study findings need to be considered within the context of some limitations. The cross-sectional design prevented follow-up of PIVCs until removal to collect outcomes, including subsequent PIVC complications and/or failure, following the study observation. Ideally, data collection could have included patient-level preferences for PIVC insertion, history of PIVC use and/or failure, the number of PIVC insertion attempts, and the number of PIVCs used during that hospitalization. However, a cohort study of this magnitude was not feasible, particularly because all sites contributed staff time to complete the data collection. Only half of all initially registered sites eventually participated in the study; reasons for not participating were cited as local workload constraints and/or difficulties in applying for local approvals. Although efforts to enroll hospitals worldwide were exhaustive, our sample was not randomly selected but relied on self-selection and so is not representative, particularly for countries that contributed only one hospital site. Caution is also required when comparing inter regional differences, particularly developing regions, because better-resourced/academic sites were possibly over represented in the sample. Nevertheless, PIVC variables differed significantly between participating hospitals, suggesting that the data represent a reasonable reflection of hospital variability.
CONCLUSIONS
On the basis of this international investigation, we report variations in the characteristics, management practices, and outcomes of PIVCs inserted in hospital patients from 51 countries. Many PIVCs were idle, symptomatic, had substandard dressings, and were inserted in suboptimal anatomical sites. Despite international best practice guidelines, a large number of patients had PIVCs that were already failing or at risk of complications, including infection. A stronger focus is needed on compliance with PIVC insertion and management guidelines; better surveillance of PIVC sites; and improved assessment, decision-making, and documentation.
Acknowledgements
We are extremely grateful to colleagues from across the globe who committed their time and effort to this study (for full details of countries and team members see Appendix 1).
1. Alexandrou E, Ray-Barruel G, Carr PJ, et al. International prevalence of the use of peripheral intravenous catheters. J Hosp Med. 2015;10(8):530-533. https:/doi.org/10.1002/jhm.2389
2. Zingg W, Pittet D. Peripheral venous catheters: an under-evaluated problem. Int J Antimicrob Agents. 2009;34(suppl 4):S38-S42. https:/ doi.org/10.1016/S0924-8579(09)70565-5
3. Wallis MC, McGrail MR, Webster J, Gowardman JR, Playford G, Rickard CM. Risk factors for PIV catheter failure: a multivariate analysis from a randomized control trial. Infect. Control Hosp Epidemiol. 2014;35(1):63-68. https:/doi.org/10.1086/674398.
4. Pujol M, Hornero A, Saballs M, et al. Clinical epidemiology and outcomes of peripheral venous catheter-related bloodstream infections at a university-affiliated hospital. J Hosp Infect. 2007;67(1):22-29.
5. Fakih MG, Jones K, Rey JE, et al. Sustained improvements in peripheral venous catheter care in non–intensive care units: a quasi-experimental controlled study of education and feedback. Infect. Control Hosp Epidemiol. 2012;33(5):449-455. https:/doi.org/10.1086/665322.
6. Helm RE, Klausner JD, Klemperer JD, Flint LM, Huang E. Accepted but unacceptable: peripheral IV catheter failure. J Infus Nurs. 2015;38(3):189-203. https:/ doi.org/10.1097/NAN.0000000000000100.
7. Austin ED, Sullivan SB, Whittier S, Lowy FD, Uhlemann AC. Peripheral intravenous catheter placement is an underrecognized source of Staphylococcus aureus bloodstream infection. Open Forum Infect Dis. 2016;3(2):ofw072. https:/ doi.org/10.1093/ofid/ofw072.
8. Stuart RL, Cameron D, Scott C, et al. Peripheral intravenous catheter-associated Staphylococcus aureus bacteraemia: more than 5 years of prospective data from two tertiary health services. Med J Aust. 2013;198(10):551-553.
9. Trinh TT, Chan PA, Edwards O, et al. Peripheral venous catheter-related Staphylococcus aureus bacteremia. Infect Control Hosp Epidemiol. 2011;32(6):579-583. https:/doi.org/10.1086/660099.
10. Ray Barruel G, Polit DF, Murfield JE, Rickard CM. Infusion phlebitis assessment measures: a systematic review. J Eval Clin Pract. 2014;20(2):191-202. https:/ doi.org/ 10.1111/jep.12107
11. Marsh N, Webster J, Flynn J, et al. Securement methods for peripheral venous catheters to prevent failure: a randomised controlled pilot trial. J Vasc Access. 2015;16(3):237-244. https:/doi.org /10.5301/jva.5000348.
12. Carr PJ, Higgins NS, Cooke ML, Rippey J, Rickard CM. Tools, clinical prediction rules, and algorithms for the insertion of peripheral intravenous catheters in adult hospitalized patients: a systematic scoping review of literature. J Hosp Med. 2017;12(10):851-858. https:/doi.org/ 10.12788/jhm.2836
13. Becerra MB, Shirley D, Safdar N. Prevalence, risk factors, and outcomes of idle intravenous catheters: An integrative review. Am J Infect Control. 2016;44(10):e167-e172. https:/ doi.org/10.1016/j.ajic.2016.03.073.
14. Robinson-Reilly M, Paliadelis P, Cruickshank M. Venous access: the patient experience. Support Care Cancer. 2016;24(3):1181-1187. https:/ doi.org/10.1007/s00520-015-2900-9.
15. Petroski A, Frisch A, Joseph N, Carlson JN. Predictors of difficult pediatric intravenous access in a community Emergency Department. J Vasc Access. 2015;16(6):521-526. https:/doi.org/10.5301/jva.5000411
16. Sou V, McManus C, Mifflin N, Frost SA, Ale J, Alexandrou E. A clinical pathway for the management of difficult venous access. BMC Nurs. 2017;16(1):64. https:/ doi.org/10.1186/s12912-017-0261-z
17. World Health Organization. Report on the burden of endemic health care-associated infection worldwide. Geneva2011. 9241501502.
18. Hirschmann H, Fux L, Podusel J, et al. The influence of hand hygiene prior to insertion of peripheral venous catheters on the frequency of complications. J Hosp Infect. 2001;49(3):199-203. https:/doi.org/10.1053/jhin.2001.1077
19. Gorski L, Hadaway L, Hagle M, McGoldrick M, Orr M, Doellman D. Infusion therapy standards of practice. J Infus Nurs. 2016;39(suppl 1):S1-S159.
20. Abolfotouh MA, Salam M, Bani-Mustafa Aa, White D, Balkhy HH. Prospective study of incidence and predictors of peripheral intravenous catheter-induced complications. Ther Clin Risk Manag. 2014;10:993. https://doi.org/10.2147/TCRM.S74685.
21. Loveday H, Wilson J, Pratt R, et al. epic3: national evidence-based guidelines for preventing healthcare-associated infections in NHS hospitals in England. J Hosp Infect. 2014;86(suppl 1):S1-S70. https:/doi.org/10.1016/S0195-6701(13)60012-2.
22. O’Grady NP, Alexander M, Burns LA, et al. Guidelines for the prevention of intravascular catheter-related infections. Clin Infect Dis. 2011;52(9):e162-e193. https:/doi.org/10.1093/cid/cir257
23. Cicolini G, Bonghi AP, Di Labio L, Di Mascio R. Position of peripheral venous cannulae and the incidence of thrombophlebitis: an observational study. J Adv Nurs. 2009;65(6):1268-1273. https:/doi.org/10.1111/j.1365-2648.2009.04980.x.
24. Marsh N, Webster J, Larson E, Cooke M, Mihala G, Rickard C. Observational study of peripheral intravenous catheter outcomes in adult hospitalized patients: a multivariable analysis of peripheral intravenous catheter failure. J Hosp Med. 2018;13(2):83-89. https:/doi.org/10.12788/jhm.2867.
25. One Million Global Catheters PIVC Worldwide Prevalence study. OMG study website http://www.omgpivc.org/. Accessed 23 March, 2017.
26. Von Elm E, Altman DG, Egger M, et al. The Strengthening the Reporting of Observational Studies in Epidemiology (STROBE) Statement: guidelines for reporting observational studies. Int J Surg. 2014;12(12):1495-1499. https:/doi.org/ 10.1136/bmj.39335.541782.AD
27. Fields JM, Dean AJ, Todman RW, et al. The effect of vessel depth, diameter, and location on ultrasound-guided peripheral intravenous catheter longevity. Am J Emerg Med. 2012;30(7):1134-1140. https:/doi.org/10.1016/j.ajem.2011.07.027.
28. Patel SA, Alebich MM, Feldman LS. Choosing wisely: things we do for no reason. Routine replacement of peripheral intravenous catheters. J Hosp Med. 2017;12(1):42-45.
29. Newswire. Global Peripheral I.V. Catheter Market 2014 - 2018. New York, PR Newswire Assoc; 2014.
30. Webster J, Larsen E, Booker C, Laws J, Marsh N. Prophylactic insertion of large bore peripheral intravenous catheters in maternity patients for postpartum haemorrhage: A cohort study. Aust N Z J Obstet Gynaecol. 2017.https:/doi.org/10.1111/ajo.12759.
31. Rivera A, Strauss K, van Zundert A, Mortier E. Matching the peripheral intravenous catheter to the individual patient. Acta Anaesthesiol Belg. 2006;58(1):19.
32. Webster J, Gillies D, O’Riordan E, Sherriff KL, Rickard CM. Gauze and tape and transparent polyurethane dressings for central venous catheters. Cochrane Database Syst Rev. 2011;11:CD003827. https:/doi.org/10.1002/14651858.CD003827.pub2
33. Dieleman JL, Templin T, Sadat N, et al. National spending on health by source for 184 countries between 2013 and 2040. Lancet. 2016;387(10037):2521-2535. https:/ doi.org/10.1016/S0140-6736(16)30167-2.
34. Allegranzi B, Nejad SB, Combescure C, et al. Burden of endemic health-care-associated infection in developing countries: systematic review and meta-analysis. Lancet. 2011;377(9761):228-241. https:/ doi.org/10.1016/S0140-6736(10)61458-4.
35. Rickard CM, Webster J, Wallis MC, et al. Routine versus clinically indicated replacement of peripheral intravenous catheters: a randomised controlled equivalence trial. Lancet. 2012;380(9847):1066-1074. https:/doi.org/10.1016/S0140-6736(12)61082-4.
36. Webster J, Osborne S, Rickard CM, New K. Clinically indicated replacement versus routine replacement of peripheral venous catheters. Cochrane Database Syst Rev. 2015;8:CD007798. https://doi.org/10.1002/14651858.CD007798.pub4.
37. Yagnik L, Graves A, Thong K. Plastic in patient study: Prospective audit of adherence to peripheral intravenous cannula monitoring and documentation guidelines, with the aim of reducing future rates of intravenous cannula-related complications. Am J Infect Control. 2017;45(1):34-38. https:/doi.org/10.1016/j.ajic.2016.09.008.
38. Boyd S, Aggarwal I, Davey P, Logan M, Nathwani D. Peripheral intravenous catheters: the road to quality improvement and safer patient care. J Hosp Infect. 2011;77(1):37-41. https:/doi.org/10.1016/j.jhin.2010.09.011.
39. DeVries M, Valentine M, Mancos P. Protected clinical indication of peripheral intravenous lines: successful implementation. J Assoc Vasc Access. 2016;21(2):89-92. https://doi.org/10.1016/j.java.2016.03.001.
40. Rhodes D, Cheng A, McLellan S, et al. Reducing Staphylococcus aureus bloodstream infections associated with peripheral intravenous cannulae: successful implementation of a care bundle at a large Australian health service. J Hosp Infect. 2016;94(1):86-91. https:/doi.org/10.1016/j.jhin.2016.05.020.
41. Rinke ML, Chen AR, Bundy DG, et al. Implementation of a central line maintenance care bundle in hospitalized pediatric oncology patients. Pediatr. 2012;130(4):e996-e1004. https:/doi.org/10.1542/peds.2012-0295.
42. Marshall J, Mermel L, Fakih M, Hadaway L, Kallen A, O’Grady N. Strategies to prevent central line–associated bloodstream infections in acute care hospitals: 2014 update. Infect. Control Hosp Epidemiol. 2014;35(suppl 2):S89-107. https:/doi.org/10.1086/676533.
The majority of hospitalized patients worldwide have at least one peripheral intravenous catheter (PIVC),1 making PIVC insertion one of the most common clinical procedures. In the United States, physicians, advanced practitioners, and nurses insert over 300 million of these devices in hospitalized patients annually.2 Despite their prevalence, PIVCs are associated with high rates of complications, including insertion difficulty, phlebitis, infiltration, occlusion, dislodgment, and catheter-associated bloodstream infection (CABSI), known to increase morbidity and mortality risk.2-9 Up to 90% of PIVCs are prematurely removed owing to failure before planned replacement or before intravenous (IV) therapy completion.3-6,10-12
PIVC complication and failure commonly triggers insertion of a replacement device and can entail significant costs.2-4 One example is PIVC-related CABSI, where treatment costs have been estimated to be between US$35,000 and US$56,000 per patient.6,13 Another important consideration is the pain and anxiety experienced by patients who need a replacement device, particularly those with difficult vascular access, who may require multiple cannulation attempts to replace a PIVC.12,14-16 In developing nations, serious adverse events related to PIVCs are even more concerning, because hospital acquired infection rates and associated mortality are nearly 20 times greater than in developed nations.17
A number of evidence-based interventions have been suggested to reduce PIVC failure rates. In addition to optimal hand hygiene when inserting or accessing a PIVC to prevent infection,18 recommended interventions include placement of the PIVC in an area of non-flexion such as the forearm to provide stability for the device and to reduce patient discomfort, securing the PIVC to reduce movement of the catheter at the insertion site and within the blood vessel, and use of occlusive dressings that reduce the risk of external contamination of the PIVC site.11,19,20 Best practice guidelines also recommend the prompt removal of devices that are symptomatic (when phlebitis or other complications are suspected) and when the catheter is no longer required.21,22
Recent evidence has demonstrated that catheter size can have an impact on device survival rates. In adults, large-bore catheters of 18 gauge (G) or higher were found to have an increased rate of thrombosis, and smaller-bore catheters of 22G or lower (in adults) were found to have higher rates of dislodgment and occlusion/infiltration. The catheter size recommended for adults based on the latest evidence for most clinical applications is 20G.3,20,23,24 In addition, the documentation of insertion, maintenance, and removal of PIVCs in the medical record is a requirement in most healthcare facilities worldwide and is recommended by best practice guidelines; however, adherence remains a challenge.1,19
The concerning prevalence of PIVC-related complications and the lack of comparative data internationally on organizational compliance with best practice guidelines formed the rationale for this study. Our study aim was to describe the insertion characteristics, management practices, and outcomes of PIVCs internationally and to compare these variables to recommended best practice.
MATERIALS AND METHODS
Study Design and Participants
In this international cross-sectional study, we recruited hospitals through professional networks, including vascular access, infection prevention, safety and quality, nursing, and hospital associations (Appendix 2). Healthcare organizations, government health departments, and intravascular device suppliers were informed of the study and requested to further disseminate information through their networks. A study website was developed,25 and social media outlets, including Twitter®, LinkedIn®, and Facebook®, were used to promote the study.
Approval was granted by the Griffith University Human Research Ethics Committee in Australia (reference number NRS/34/13/HREC). In addition, evidence of study site and local institutional review board/ethics committee approval was required prior to study commencement. Each participating site agreed to follow the study protocol and signed an authorship agreement form. No financial support was provided to any site.
Hospitalized adult and pediatric patients with a PIVC in situ on the day of the study were eligible for inclusion. Sample size was determined by local capacity. Hospitals were encouraged to audit their entire institution if possible; however, data were accepted from as little as one ward. Data collectors comprised nurses and doctors with experience in PIVC assessment. They were briefed on the study protocol and data collection forms by the local site coordinator, and they were supported by an overall global coordinator. Clinicians assessed the PIVC insertion site and accessed hospital records to collect data related to PIVC insertion, concurrent medications, and IV fluid orders. Further clarification of data was obtained if necessary by the clinicians from the patients and treating staff. No identifiable patient information was collected.
Data Collection
To assess whether clinical facilities were following best practice recommendations, the study team developed three data collection forms to collect information regarding site characteristics (site questionnaire), track participant recruitment (screening log), and collect data regarding PIVC characteristics and management practices (case report form [CRF]). All forms were internally and externally validated following a pilot study involving 14 sites in 13 countries.1
The CRF included variables used to assess best practice interventions, such as catheter insertion characteristics (date and time, reason, location, profession of inserter, anatomical site of placement), catheter type (gauge, brand, and product), insertion site assessment (adverse symptoms, dressing type and integrity), and information related to the IV therapy (types of IV fluids and medications, flushing solutions). Idle PIVCs were defined as not being used for blood sampling or IV therapy in the preceding 24 h.
Data collection forms were translated into 15 languages by professional translators and back-translated for validity. Translation of some languages included additional rigor. For example, Spanish-speaking members from the Spanish mainland as well as from South America were employed so that appropriate synonyms were used to capture local terms and practice. Three options were provided for data entry: directly into a purpose-developed electronic database (Lime Survey® Project, Hamburg, Germany); on paper, then transcribed into the survey database at a later time by the hospital site; or paper entry then sent (via email or post) to the coordinating center for data entry. Once cleaned and collated, all data were provided to each participating hospital to confirm accuracy and for site use in local quality improvement processes. Data were collected between June 1, 2014 and July 31, 2015.
Statistical Analysis
All data management was undertaken using SAS statistical software (SAS Institute Inc., Cary NC, USA). Results are presented for eight geographical regions using descriptive statistics (frequencies, percentages, and 95% CIs) for the variables of interest. To assess trends in catheter dwell time and rates of phlebitis, Poisson regression was used. All analyses were undertaken using the R language for statistical analysis (R Core Team, Vienna, Austria). The (STROBE (Strengthening the Reporting of Observational Studies in Epidemiology statement) guidelines for cross-sectional studies were followed, and results are presented according to these recommendations.26
RESULTS
Of the 415 hospitals that participated in this study, 406 had patients with PIVCs on the day of the study (the others being small rural centers). Thus, a total of 40,620 PIVCs in 38,161 patients from 406 hospitals in 51 countries were assessed, with no more than 5% missing data for any CRF question. There were 2459 patients (6.1%) with two or more PIVCs concurrently in situ. The median patient age was 59 y (interquartile range [IQR], 37–74 y), and just over half were male (n = 20,550, 51%). Hospital size ranged from fewer than 10 beds to over 1,000 beds, and hospitals were located in rural, regional, and metropolitan districts. The majority of countries (n = 31, 61%) contributed multiple sites, the highest being Australia with 79 hospitals. Countries with the most PIVCs studied were Spain (n = 5,553, 14%) and the United States (n = 5,048, 12%).
General surgical (n = 15,616, 39%) and medical (n = 15,448, 38%) patients represented most of the population observed. PIVCs were inserted primarily in general wards or clinics (n = 22,167, 55%) or in emergency departments (n = 7,388, 18%; Table) and for the administration of IV medication (n = 28,571, 70%) and IV fluids (n = 7,093, 18%; Table).
Globally, nurses were the primary PIVC inserters (n = 28,575, 71%); however, Australia/New Zealand had only 26% (n = 1,518) of PIVCs inserted by this group (Table). Only about one-third of PIVCs were placed in an area of non-flexion (forearm, n = 12,675, 31%, Table) the majority (n = 27,856, 69%) were placed in non-recommended anatomical sites (Figure 1). Most PIVCs were placed in the hand (n = 13,265, 32.7%) followed by the antecubital veins (n = 6176, 15.2%) and the wrist (n = 5,465, 13.5%). Site selection varied widely across the regions; 29% (n = 1686) of PIVCs in Australia/New Zealand were inserted into the antecubital veins, twice the study group average. Over half of the PIVCs inserted in the Middle East were placed in the hand (n = 295, 56%). This region also had the highest prevalence of devices placed in nonrecommended sites (n = 416, 79%; Figure 1).
The majority of PIVCs (n = 27,192, 67%; Table) were of recommended size (20–22G); however, some devices were observed to be large (14–18G; n = 6,802, 17%) or small (24-26g; n = 4,869, 12%) in adults. In Asia, 41% (n = 2,617) of devices inserted were 24-26G, more than three times the global rate. Half of all devices in Asia (n = 3,077, 48%) and the South Pacific (n = 67, 52%) were of a size not recommended for routine IV therapy (Figure 2).
The primary dressing material used was a transparent dressing (n = 31,596, 77.8%; Table); however, nearly 1 in 5 dressings used had either nonsterile tape alone (n = 5,169, 13%; Appendix 4), or a sterile gauze and tape (n = 2,592, 6%; Appendix 4.1). We found a wide variation in the use of nonsterile tape, including 1 in every 3 devices in South America dressed with nonsterile tape (n = 714, 30%) and a larger proportion in Africa (n = 543, 19%) and Europe (n = 3,056, 18%). Nonsterile tape was rarely used in North America and Australia/New Zealand. Although most PIVC dressings were clean, dry, and intact (n = 31,786, 79%; Table), one-fifth overall were compromised (moist, soiled, and/or lifting off the skin). Compromised dressings (Appendix 4.2) were more prevalent in Australia/New Zealand (n = 1,448; 25%) and in Africa (n = 707, 25%) than elsewhere.
Ten percent of PIVCs (n = 4,204) had signs and/or symptoms suggestive of phlebitis (characterized by pain, redness and/or swelling at the insertion site; Appendix 4.3). The highest prevalence of phlebitis occurred in Asia (n = 1,021, 16%), Africa (n = 360, 13%), and South America (n = 284, 12%). Pain and/or redness were the most common phlebitis symptoms. We found no association between dwell time of PIVCs and phlebitis rates (P = .085). Phlebitis rates were 12% (Days 1-3; n = 15,625), 16% (Days 4-7; n = 3,348), 10% (Days 8-21; n = 457), and 13% (Day21+; n = 174). Nearly 10% (n = 3,879) of catheters were observed to have signs of malfunction such as blood in the infusion tubing, leaking at the insertion site, or dislodgment (Appendix 4.4).
We observed 14% (n = 5,796) of PIVCs to be idle (Appendix 4.5), defined as not used in the preceding 24 h. Nearly one-fourth of all devices in North America (n = 1,230, 23%) and Australia/New Zealand (n = 1,335, 23%) were idle. PIVC documentation in hospital records was also poor, nearly half of all PIVCs (n = 19,768, 49%) had no documented date and time of insertion. The poorest compliance was in Australia/New Zealand (n = 3,428, 59%; Appendix 4.6). We also observed that 1 in 10 PIVCs had no documentation regarding who inserted the PIVC (n = 3,905). Thirty-six percent of PIVCs (n = 14,787) had no documented assessment of the PIVC site on the day of review (Appendix 4.7), including over half of all PIVCs in Asia (n = 3,364, 52%). Overall, the median dwell at the time of assessment for PIVCs with insertion date/time documented was 1.5 d (IQR, 1.0–2.5 d).
DISCUSSION
This international assessment of more than 40,000 PIVCs in 51 countries provides great insight into device characteristics and variation in management practices. Predominantly, PIVCs were inserted by nurses in the general ward environment for IV medication. One in ten PIVCs had at least one symptom of phlebitis, one in ten were dysfunctional, one in five PIVC dressings were compromised, and one in six PIVCs had not been used in the preceding 24 h. Nearly half of the PIVCs audited had the insertion date and time missing.
Regional variation was found in the professions inserting PIVCs, as well as in anatomical placement. In Australia/New Zealand, the proportion of nurses inserting PIVCs was much lower than the study group average (26% vs 71%). Because these countries contributed a substantial number of hospitals to the study, this seems a representative finding and suggests a need for education targeted at nurses for PIVC insertion in this region. The veins in the forearm are recommended as optimal for PIVC insertion in adults, rather than areas of high flexion, because the forearm provides a wide surface area to secure and dress PIVCs. Forearm placement can reduce pain during catheter dwell as well as decrease the risk of accidental removal or occlusion.3,19,27 We found only one-third of PIVCs were placed in the forearm, with most placed in the hand, antecubital veins, or wrist. This highlights an inconsistency with published recommendations and suggests that additional training and technology are required so that staff can better identify and insert PIVCs in the forearm for other than very short-term (procedural) PIVCp;s.19
Phlebitis triggering PIVC failure remains a global clinical challenge with numerous phlebitis definitions and varied assessment techniques.10 The prevalence of phlebitis has been difficult to approximate with varying estimates and definitions in the literature; however, it remains a key predictor of PIVC failure.6,10 Identification of this complication and prompt removal of the device is critical for patient comfort and reducing CABSI risk.5,28 The overall prevalence of phlebitis signs or symptoms (defined in this study as having one or more signs of redness, swelling, or pain surrounding the insertion site) was just over 10%, with pain and/or redness being most prevalent. These compromised PIVCs had not been removed as is recommended for such complications.19,28 Considering that our study was a snapshot at only one time point, the per-catheter incidence of phlebitis would be even higher; interestingly, among PIVCs with a documented insertion date and time, we observed that dwell time did not influence phlebitis rates.
Another concern is that nearly 10% (n = 3,879) of PIVCs were malfunctioning (eg, leaking) but were still in place. To bring these problems into context, around 2 billion PIVCs are used annually worldwide; as a consequence, millions of patients suffer from painful or malfunctioning PIVCs staff had not responded.1,29 The placement of large-bore catheters, and smaller-gauge ones in adults, is known to increase the incidence of malfunction that leads to failure. There are a number of sound clinical reasons for the use of large-bore (eg, resuscitation and rapid fluid replacement) or small-bore (eg, difficult venous access with small superficial veins only visible and palpable) catheters. However, it would be expected that only a small proportion of patients would require these devices, and not one in three devices as we identified. This finding suggests that some PIVCs were inappropriate in size for general IV therapy and may reflect antiquated hospital policies for some clinical cohorts.30,31
Overall, transparent dressings were used to cover the PIVC, but a number of patients were observed to have a sterile gauze and tape dressing (n = 2,592, 6%). Although the latter is less common, both dressing approaches are recommended in clinical practice guidelines because there is a lack of high-quality evidence regarding which is superior.21,22,32 Of concern was the use of nonsterile tape to dress the PIVC (n = 5,169, 12.7%). We found the prevalence of nonsterile tape use to be higher in lower-resourced countries in South America (n = 714, 30%), Africa (n = 543, 19%) and Europe (n = 3,056, 18%) and this was likely related to institutional cost reduction practices.
This finding illustrates an important issue regarding proper PIVC care and management practices in developing nations. It is widely known that access to safe health care in lower-resourced nations is challenging and that rates of mortality related to healthcare-associated infections are much higher. Thus, the differences we found in PIVC management practices in these countries are not surprising.33,34 International health networks such as the Infection Control Africa Network, the International Federation of Infection Control, and the Centers for Disease Control and Prevention can have great influence on ministries of health and clinicians in these countries to develop coordinated efforts for safe and sustainable IV practices to reduce the burden of hospital-acquired infections and related morbidity and mortality.
We found that 14% of all PIVCs had no documented IV medication or IV fluid administered in the previous 24 h, strongly indicating that they were no longer needed. Australia/New Zealand, Europe, and North America were observed to have a higher prevalence of idle catheters than the remaining regions. This suggests that an opportunity exists to develop surveillance systems that better identify idle devices for prompt removal to reduce infection risk and patient discomfort. Several randomized controlled trials, a Cochrane review, and clinical practice guidelines recommend prompt removal of PIVCs when not required, if there are any complications, or if the PIVC was inserted urgently without an aseptic insertion technique.21,28,35,36 Idle PIVCs have been implicated in adverse patient outcomes, including phlebitis and CABSI.13,27
The substantial proportion of patients with a PIVC in this study who had no clinical indication for a PIVC, a symptomatic insertion site, malfunctioning catheter, and suboptimal dressing quality suggests the need for physicians, advanced practitioners, and nurses to adopt evidence-based PIVC insertion and maintenance bundles and supporting checklists to reduce the prevalence of PIVC complications.19,21,38-40 Recommended strategies for inclusion in PIVC maintenance bundles are prompt removal of symptomatic and/or idle catheters, hand hygiene prior to accessing the catheter, regular assessment of the device, and replacement of suboptimal dressings.41,42 This approach should be implemented across all clinical specialties involved in PIVC insertion and care.
Our study findings need to be considered within the context of some limitations. The cross-sectional design prevented follow-up of PIVCs until removal to collect outcomes, including subsequent PIVC complications and/or failure, following the study observation. Ideally, data collection could have included patient-level preferences for PIVC insertion, history of PIVC use and/or failure, the number of PIVC insertion attempts, and the number of PIVCs used during that hospitalization. However, a cohort study of this magnitude was not feasible, particularly because all sites contributed staff time to complete the data collection. Only half of all initially registered sites eventually participated in the study; reasons for not participating were cited as local workload constraints and/or difficulties in applying for local approvals. Although efforts to enroll hospitals worldwide were exhaustive, our sample was not randomly selected but relied on self-selection and so is not representative, particularly for countries that contributed only one hospital site. Caution is also required when comparing inter regional differences, particularly developing regions, because better-resourced/academic sites were possibly over represented in the sample. Nevertheless, PIVC variables differed significantly between participating hospitals, suggesting that the data represent a reasonable reflection of hospital variability.
CONCLUSIONS
On the basis of this international investigation, we report variations in the characteristics, management practices, and outcomes of PIVCs inserted in hospital patients from 51 countries. Many PIVCs were idle, symptomatic, had substandard dressings, and were inserted in suboptimal anatomical sites. Despite international best practice guidelines, a large number of patients had PIVCs that were already failing or at risk of complications, including infection. A stronger focus is needed on compliance with PIVC insertion and management guidelines; better surveillance of PIVC sites; and improved assessment, decision-making, and documentation.
Acknowledgements
We are extremely grateful to colleagues from across the globe who committed their time and effort to this study (for full details of countries and team members see Appendix 1).
1. Alexandrou E, Ray-Barruel G, Carr PJ, et al. International prevalence of the use of peripheral intravenous catheters. J Hosp Med. 2015;10(8):530-533. https:/doi.org/10.1002/jhm.2389
2. Zingg W, Pittet D. Peripheral venous catheters: an under-evaluated problem. Int J Antimicrob Agents. 2009;34(suppl 4):S38-S42. https:/ doi.org/10.1016/S0924-8579(09)70565-5
3. Wallis MC, McGrail MR, Webster J, Gowardman JR, Playford G, Rickard CM. Risk factors for PIV catheter failure: a multivariate analysis from a randomized control trial. Infect. Control Hosp Epidemiol. 2014;35(1):63-68. https:/doi.org/10.1086/674398.
4. Pujol M, Hornero A, Saballs M, et al. Clinical epidemiology and outcomes of peripheral venous catheter-related bloodstream infections at a university-affiliated hospital. J Hosp Infect. 2007;67(1):22-29.
5. Fakih MG, Jones K, Rey JE, et al. Sustained improvements in peripheral venous catheter care in non–intensive care units: a quasi-experimental controlled study of education and feedback. Infect. Control Hosp Epidemiol. 2012;33(5):449-455. https:/doi.org/10.1086/665322.
6. Helm RE, Klausner JD, Klemperer JD, Flint LM, Huang E. Accepted but unacceptable: peripheral IV catheter failure. J Infus Nurs. 2015;38(3):189-203. https:/ doi.org/10.1097/NAN.0000000000000100.
7. Austin ED, Sullivan SB, Whittier S, Lowy FD, Uhlemann AC. Peripheral intravenous catheter placement is an underrecognized source of Staphylococcus aureus bloodstream infection. Open Forum Infect Dis. 2016;3(2):ofw072. https:/ doi.org/10.1093/ofid/ofw072.
8. Stuart RL, Cameron D, Scott C, et al. Peripheral intravenous catheter-associated Staphylococcus aureus bacteraemia: more than 5 years of prospective data from two tertiary health services. Med J Aust. 2013;198(10):551-553.
9. Trinh TT, Chan PA, Edwards O, et al. Peripheral venous catheter-related Staphylococcus aureus bacteremia. Infect Control Hosp Epidemiol. 2011;32(6):579-583. https:/doi.org/10.1086/660099.
10. Ray Barruel G, Polit DF, Murfield JE, Rickard CM. Infusion phlebitis assessment measures: a systematic review. J Eval Clin Pract. 2014;20(2):191-202. https:/ doi.org/ 10.1111/jep.12107
11. Marsh N, Webster J, Flynn J, et al. Securement methods for peripheral venous catheters to prevent failure: a randomised controlled pilot trial. J Vasc Access. 2015;16(3):237-244. https:/doi.org /10.5301/jva.5000348.
12. Carr PJ, Higgins NS, Cooke ML, Rippey J, Rickard CM. Tools, clinical prediction rules, and algorithms for the insertion of peripheral intravenous catheters in adult hospitalized patients: a systematic scoping review of literature. J Hosp Med. 2017;12(10):851-858. https:/doi.org/ 10.12788/jhm.2836
13. Becerra MB, Shirley D, Safdar N. Prevalence, risk factors, and outcomes of idle intravenous catheters: An integrative review. Am J Infect Control. 2016;44(10):e167-e172. https:/ doi.org/10.1016/j.ajic.2016.03.073.
14. Robinson-Reilly M, Paliadelis P, Cruickshank M. Venous access: the patient experience. Support Care Cancer. 2016;24(3):1181-1187. https:/ doi.org/10.1007/s00520-015-2900-9.
15. Petroski A, Frisch A, Joseph N, Carlson JN. Predictors of difficult pediatric intravenous access in a community Emergency Department. J Vasc Access. 2015;16(6):521-526. https:/doi.org/10.5301/jva.5000411
16. Sou V, McManus C, Mifflin N, Frost SA, Ale J, Alexandrou E. A clinical pathway for the management of difficult venous access. BMC Nurs. 2017;16(1):64. https:/ doi.org/10.1186/s12912-017-0261-z
17. World Health Organization. Report on the burden of endemic health care-associated infection worldwide. Geneva2011. 9241501502.
18. Hirschmann H, Fux L, Podusel J, et al. The influence of hand hygiene prior to insertion of peripheral venous catheters on the frequency of complications. J Hosp Infect. 2001;49(3):199-203. https:/doi.org/10.1053/jhin.2001.1077
19. Gorski L, Hadaway L, Hagle M, McGoldrick M, Orr M, Doellman D. Infusion therapy standards of practice. J Infus Nurs. 2016;39(suppl 1):S1-S159.
20. Abolfotouh MA, Salam M, Bani-Mustafa Aa, White D, Balkhy HH. Prospective study of incidence and predictors of peripheral intravenous catheter-induced complications. Ther Clin Risk Manag. 2014;10:993. https://doi.org/10.2147/TCRM.S74685.
21. Loveday H, Wilson J, Pratt R, et al. epic3: national evidence-based guidelines for preventing healthcare-associated infections in NHS hospitals in England. J Hosp Infect. 2014;86(suppl 1):S1-S70. https:/doi.org/10.1016/S0195-6701(13)60012-2.
22. O’Grady NP, Alexander M, Burns LA, et al. Guidelines for the prevention of intravascular catheter-related infections. Clin Infect Dis. 2011;52(9):e162-e193. https:/doi.org/10.1093/cid/cir257
23. Cicolini G, Bonghi AP, Di Labio L, Di Mascio R. Position of peripheral venous cannulae and the incidence of thrombophlebitis: an observational study. J Adv Nurs. 2009;65(6):1268-1273. https:/doi.org/10.1111/j.1365-2648.2009.04980.x.
24. Marsh N, Webster J, Larson E, Cooke M, Mihala G, Rickard C. Observational study of peripheral intravenous catheter outcomes in adult hospitalized patients: a multivariable analysis of peripheral intravenous catheter failure. J Hosp Med. 2018;13(2):83-89. https:/doi.org/10.12788/jhm.2867.
25. One Million Global Catheters PIVC Worldwide Prevalence study. OMG study website http://www.omgpivc.org/. Accessed 23 March, 2017.
26. Von Elm E, Altman DG, Egger M, et al. The Strengthening the Reporting of Observational Studies in Epidemiology (STROBE) Statement: guidelines for reporting observational studies. Int J Surg. 2014;12(12):1495-1499. https:/doi.org/ 10.1136/bmj.39335.541782.AD
27. Fields JM, Dean AJ, Todman RW, et al. The effect of vessel depth, diameter, and location on ultrasound-guided peripheral intravenous catheter longevity. Am J Emerg Med. 2012;30(7):1134-1140. https:/doi.org/10.1016/j.ajem.2011.07.027.
28. Patel SA, Alebich MM, Feldman LS. Choosing wisely: things we do for no reason. Routine replacement of peripheral intravenous catheters. J Hosp Med. 2017;12(1):42-45.
29. Newswire. Global Peripheral I.V. Catheter Market 2014 - 2018. New York, PR Newswire Assoc; 2014.
30. Webster J, Larsen E, Booker C, Laws J, Marsh N. Prophylactic insertion of large bore peripheral intravenous catheters in maternity patients for postpartum haemorrhage: A cohort study. Aust N Z J Obstet Gynaecol. 2017.https:/doi.org/10.1111/ajo.12759.
31. Rivera A, Strauss K, van Zundert A, Mortier E. Matching the peripheral intravenous catheter to the individual patient. Acta Anaesthesiol Belg. 2006;58(1):19.
32. Webster J, Gillies D, O’Riordan E, Sherriff KL, Rickard CM. Gauze and tape and transparent polyurethane dressings for central venous catheters. Cochrane Database Syst Rev. 2011;11:CD003827. https:/doi.org/10.1002/14651858.CD003827.pub2
33. Dieleman JL, Templin T, Sadat N, et al. National spending on health by source for 184 countries between 2013 and 2040. Lancet. 2016;387(10037):2521-2535. https:/ doi.org/10.1016/S0140-6736(16)30167-2.
34. Allegranzi B, Nejad SB, Combescure C, et al. Burden of endemic health-care-associated infection in developing countries: systematic review and meta-analysis. Lancet. 2011;377(9761):228-241. https:/ doi.org/10.1016/S0140-6736(10)61458-4.
35. Rickard CM, Webster J, Wallis MC, et al. Routine versus clinically indicated replacement of peripheral intravenous catheters: a randomised controlled equivalence trial. Lancet. 2012;380(9847):1066-1074. https:/doi.org/10.1016/S0140-6736(12)61082-4.
36. Webster J, Osborne S, Rickard CM, New K. Clinically indicated replacement versus routine replacement of peripheral venous catheters. Cochrane Database Syst Rev. 2015;8:CD007798. https://doi.org/10.1002/14651858.CD007798.pub4.
37. Yagnik L, Graves A, Thong K. Plastic in patient study: Prospective audit of adherence to peripheral intravenous cannula monitoring and documentation guidelines, with the aim of reducing future rates of intravenous cannula-related complications. Am J Infect Control. 2017;45(1):34-38. https:/doi.org/10.1016/j.ajic.2016.09.008.
38. Boyd S, Aggarwal I, Davey P, Logan M, Nathwani D. Peripheral intravenous catheters: the road to quality improvement and safer patient care. J Hosp Infect. 2011;77(1):37-41. https:/doi.org/10.1016/j.jhin.2010.09.011.
39. DeVries M, Valentine M, Mancos P. Protected clinical indication of peripheral intravenous lines: successful implementation. J Assoc Vasc Access. 2016;21(2):89-92. https://doi.org/10.1016/j.java.2016.03.001.
40. Rhodes D, Cheng A, McLellan S, et al. Reducing Staphylococcus aureus bloodstream infections associated with peripheral intravenous cannulae: successful implementation of a care bundle at a large Australian health service. J Hosp Infect. 2016;94(1):86-91. https:/doi.org/10.1016/j.jhin.2016.05.020.
41. Rinke ML, Chen AR, Bundy DG, et al. Implementation of a central line maintenance care bundle in hospitalized pediatric oncology patients. Pediatr. 2012;130(4):e996-e1004. https:/doi.org/10.1542/peds.2012-0295.
42. Marshall J, Mermel L, Fakih M, Hadaway L, Kallen A, O’Grady N. Strategies to prevent central line–associated bloodstream infections in acute care hospitals: 2014 update. Infect. Control Hosp Epidemiol. 2014;35(suppl 2):S89-107. https:/doi.org/10.1086/676533.
© 2018 Society of Hospital Medicine
New South Wales 2751, Australia; Telephone: + 612 9685 9506; Fax: + 612 9685 9023; E-mail: E.Alexandrou@westernsydney.edu.au