User login
Treatment Trends and Outcomes in Healthcare-Associated Pneumonia
Bacterial pneumonia remains an important cause of morbidity and mortality in the United States, and is the 8th leading cause of death with 55,227 deaths among adults annually.1 In 2005, the American Thoracic Society (ATS) and the Infectious Diseases Society of America (IDSA) collaborated to update guidelines for hospital-acquired pneumonia (HAP), ventilator-associated pneumonia, and healthcare-associated pneumonia (HCAP).2 This broad document outlines an evidence-based approach to diagnostic testing and antibiotic management based on the epidemiology and risk factors for these conditions. The guideline specifies the following criteria for HCAP: hospitalization in the past 90 days, residence in a skilled nursing facility (SNF), home infusion therapy, hemodialysis, home wound care, family members with multidrug resistant organisms (MDRO), and immunosuppressive diseases or medications, with the presumption that these patients are more likely to be harboring MDRO and should thus be treated empirically with broad-spectrum antibiotic therapy. Prior studies have shown that patients with HCAP have a more severe illness, are more likely to have MDRO, are more likely to be inadequately treated, and are at a higher risk for mortality than patients with community-acquired pneumonia (CAP).3,4
These guidelines are controversial, especially in regard to the recommendations to empirically treat broadly with 2 antibiotics targeting Pseudomonas species, whether patients with HCAP merit broader spectrum coverage than patients with CAP, and whether the criteria for defining HCAP are adequate to predict which patients are harboring MDRO. It has subsequently been proposed that HCAP is more related to CAP than to HAP, and a recent update to the guideline removed recommendations for treatment of HCAP and will be placing HCAP into the guidelines for CAP instead.5 We sought to investigate the degree of uptake of the ATS and IDSA guideline recommendations by physicians over time, and whether this led to a change in outcomes among patients who met the criteria for HCAP.
METHODS
Setting and Patients
We identified patients discharged between July 1, 2007, and November 30, 2011, from 488 US hospitals that participated in the Premier database (Premier Inc., Charlotte, North Carolina), an inpatient database developed for measuring quality and healthcare utilization. The database is frequently used for healthcare research and has been described previously.6 Member hospitals are in all regions of the US and are generally reflective of US hospitals. This database contains multiple data elements, including sociodemographic information, International Classification of Diseases, 9th Revision-Clinical Modification (ICD-9-CM) diagnosis and procedure codes, hospital and physician information, source of admission, and discharge status. It also includes a date-stamped log of all billed items and services, including diagnostic tests, medications, and other treatments. Because the data do not contain identifiable information, the institutional review board at our medical center determined that this study did not constitute human subjects research.
We included all patients aged ≥18 years with a principal diagnosis of pneumonia or with a secondary diagnosis of pneumonia paired with a principal diagnosis of respiratory failure, acute respiratory distress syndrome, respiratory arrest, sepsis, or influenza. Patients were excluded if they were transferred to or from another acute care institution, had a length of stay of 1 day or less, had cystic fibrosis, did not have a chest radiograph, or did not receive antibiotics within 48 hours of admission.
For each patient, we extracted age, gender, principal diagnosis, comorbidities, and the specialty of the attending physician. Comorbidities were identified from ICD-9-CM secondary diagnosis codes and Diagnosis Related Groups by using Healthcare Cost and Utilization Project Comorbidity Software, version 3.1, based on the work of Elixhauser (Agency for Healthcare Research and Quality, Rockville, Maryland).7 In order to ensure that patients had HCAP, we required the presence of ≥1 HCAP criteria, including hospitalization in the past 90 days, hemodialysis, admission from an SNF, or immune suppression (which was derived from either a secondary diagnosis for neutropenia, hematological malignancy, organ transplant, acquired immunodeficiency virus, or receiving immunosuppressant drugs or corticosteroids [equivalent to ≥20 mg/day of prednisone]).
Definitions of Guideline-Concordant and Discordant Antibiotic Therapy
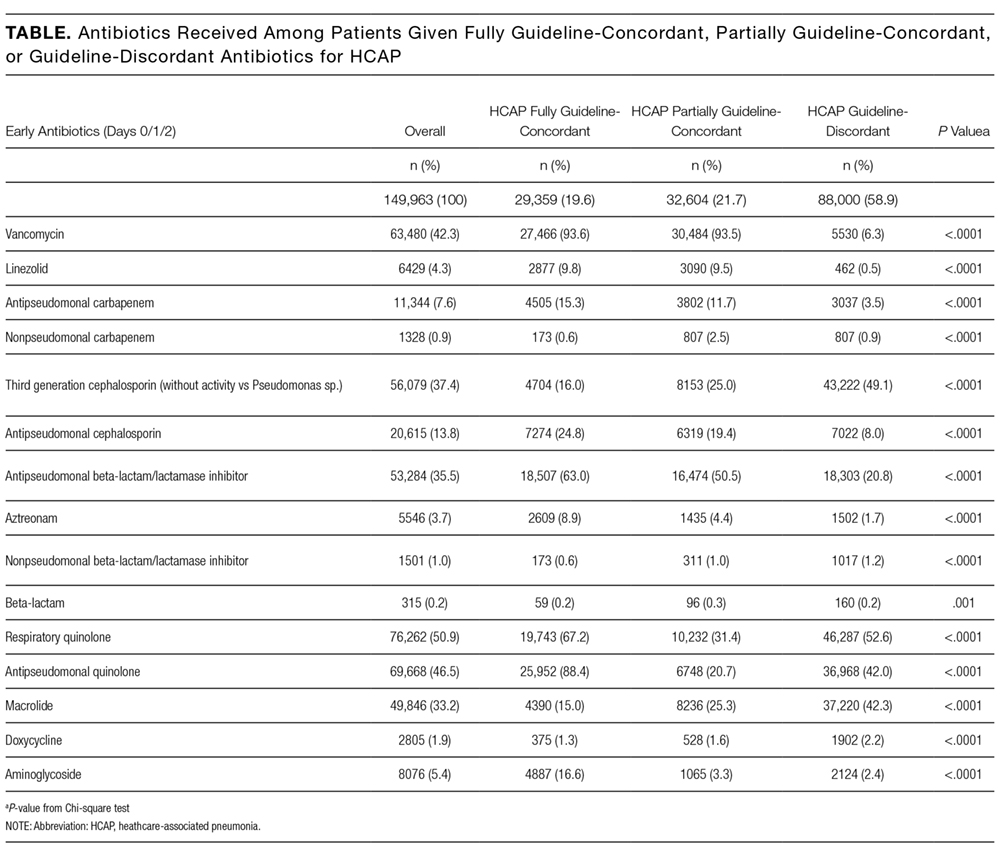
The ATS and IDSA guidelines recommended the following antibiotic combinations for HCAP: an antipseudomonal cephalosporin or carbapenem or a beta-lactam/lactamase inhibitor, plus an antipseudomonal quinolone or aminoglycoside, plus an antibiotic with activity versus methicillin resistant Staphylococcus aureus (MRSA), such as vancomycin or linezolid. Based on these guidelines, we defined the receipt of fully guideline-concordant antibiotics as 2 recommended antibiotics for Pseudomonas species plus 1 for MRSA administered by the second day of admission. Partially guideline-concordant antibiotics were defined as 1 recommended antibiotic for Pseudomonas species plus 1 for MRSA by the second day of hospitalization. Guideline-discordant antibiotics were defined as all other combinations.
Statistical Analysis
Descriptive statistics on patient characteristics are presented as frequency, proportions for categorical factors, and median with interquartile range (IQR) for continuous variables for the full cohort and by treatment group, defined as fully or partially guideline-concordant antibiotic therapy or discordant therapy. Hospital rates of fully guideline-concordant treatment are presented overall and by hospital characteristics. The association of hospital characteristics with rates of fully guideline-concordant therapy were assessed by using 1-way analysis of variance tests.
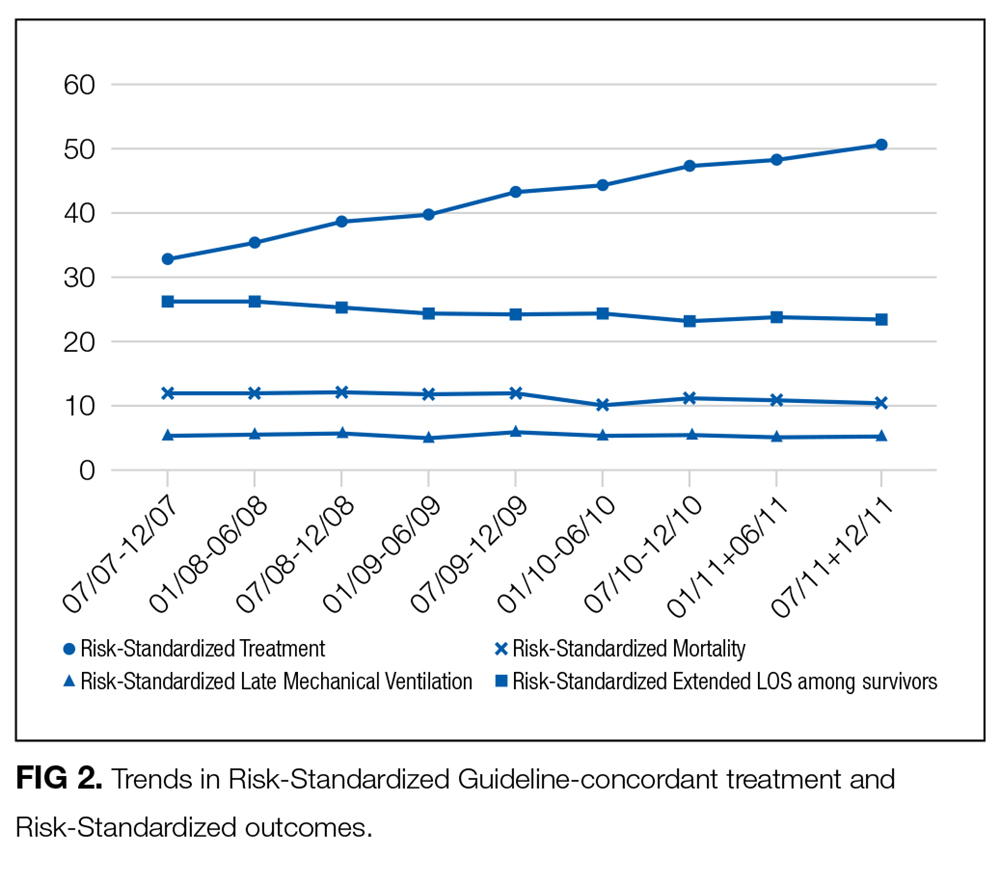
To assess trends across hospitals for the association between the use of guideline-concordant therapy and mortality, progression to respiratory failure as measured by the late initiation of invasive mechanical ventilation (day 3 or later), and the length of stay among survivors, we divided the 4.5-year study period into 9 intervals of 6 months each; 292 hospitals that submitted data for all 9 time points were examined in this analysis. Based on the distribution of length of stay in the first time period, we created an indicator variable for extended length of stay with length of stay at or above the 75th percentile, defined as extended. For each hospital at each 6-month interval, we then computed risk-standardized guideline-concordant treatment (RS-treatment) rates and risk-standardized in-hospital outcome rates similar to methods used by the Centers for Medicare and Medicaid Services for public reporting.8 For each hospital at each time interval, we estimated a predicted rate of guideline-concordant treatment as the sum of predicted probabilities of guideline-concordant treatment from patient factors and the random intercept for the hospital in which they were admitted. We then calculated the expected rate of guideline-concordant treatment as the sum of expected probabilities of treatment received from patient factors only. RS-treatment was then calculated as the ratio of predicted to expected rates multiplied by the overall unadjusted mean treatment rate from all patients.9 We repeated the same modeling strategy to calculate risk-standardized outcome (RS-outcome) rates for each hospital across all time points. All models were adjusted for patient demographics and comorbidities. Similar models using administrative data have moderate discrimination for mortality.10
We then fit mixed-effects linear models with random hospital intercept and slope across time for the RS-treatment and outcome rates, respectively. From these models, we estimated the mean slope for RS-treatment and for RS-outcome over time. In addition, we estimated a slope or trend over time for each hospital for treatment and for outcome and evaluated the correlation between the treatment and outcome trends.
All analyses were performed using the Statistical Analysis System version 9.4 (SAS Institute Inc., Cary, NC) and STATA release 13 (StataCorp, LLC, College Station, Texas).
RESULTS

DISCUSSION
In this large, retrospective cohort study, we found that there was a substantial gap between the empiric antibiotics recommended by the ATS and IDSA guidelines and the empiric antibiotics that patients actually received. Over the study period, we saw an increased adherence to guidelines, in spite of growing evidence that HCAP risk factors do not adequately predict which patients are at risk for infection with an MDRO.11 We used this change in antibiotic prescribing behavior over time to determine if there was a clinical impact on patient outcomes and found that at the hospital level, there were no improvements in mortality, excess length of stay, or progression to respiratory failure despite a doubling in guideline-concordant antibiotic use.
At least 2 other large studies have assessed the association between guideline-concordant therapy and outcomes in HCAP.12,13 Both found that guideline-concordant therapy was associated with increased mortality, despite propensity matching. Both were conducted at the individual patient level by using administrative data, and results were likely affected by unmeasured clinical confounders, with sicker patients being more likely to receive guideline-concordant therapy. Our focus on the outcomes at the hospital level avoids this selection bias because the overall severity of illness of patients at any given hospital would not be expected to change over the study period, while physician uptake of antibiotic prescribing guidelines would be expected to increase over time. Determining the correlation between increases in guideline adherence and changes in patient outcome may offer a better assessment of the impact of guideline adherence. In this regard, our results are similar to those achieved by 1 quality improvement collaborative that was aimed at increasing guideline concordant therapy in ICUs. Despite an increase in guideline concordance from 33% to 47% of patients, they found no change in overall mortality.14
There were several limitations to our study. We did not have access to microbiologic data, so we were unable to determine which patients had MDRO infection or determine antibiotic-pathogen matching. However, the treating physicians in our study population presumably did not have access to this data at the time of treatment either because the time period we examined was within the first 48 hours of hospitalization, the interval during which cultures are incubating and the patients are being treated empirically. In addition, there may have been HCAP patients that we failed to identify, such as patients who were admitted in the past 90 days to a hospital that does not submit data to Premier. However, it is unlikely that prescribing for such patients should differ systematically from what we observed. While the database draws from 488 hospitals nationwide, it is possible that practices may be different at facilities that are not contained within the Premier database, such as Veterans Administration Hospitals. Similarly, we did not have readings for chest x-rays; hence, there could be some patients in the dataset who did not have pneumonia. However, we tried to overcome this by including only those patients with a principal diagnosis of pneumonia or sepsis with a secondary pneumonia diagnosis, a chest x-ray, and antibiotics administered within the first 48 hours of admission.
There are likely several reasons why so few HCAP patients in our study received guideline-concordant antibiotics. A lack of knowledge about the ATS and IDSA guidelines may have impacted the physicians in our study population. El-Solh et al.15 surveyed physicians about the ATS-IDSA guidelines 4 years after publication and found that only 45% were familiar with the document. We found that the rate of prescribing at least partially guideline-concordant antibiotics rose steadily over time, supporting the idea that the newness of the guidelines was 1 barrier. Additionally, prior studies have shown that many physicians may not agree with or choose to follow guidelines, with only 20% of physicians indicating that guidelines have a major impact on their clinical decision making,16 and the majority do not choose HCAP guideline-concordant antibiotics when tested.17 Alternatively, clinicians may not follow the guidelines because of a belief that the HCAP criteria do not adequately indicate patients who are at risk for MDRO. Previous studies have demonstrated the relative inability of HCAP risk factors to predict patients who harbor MDRO18 and suggest that better tools such as clinical scoring systems, which include not only the traditional HCAP risk factors but also prior exposure to antibiotics, prior culture data, and a cumulative assessment of both intrinsic and extrinsic factors, could more accurately predict MDRO and lead to a more judicious use of broad-spectrum antimicrobial agents.19-25 Indeed, these collective findings have led the authors of the recently updated guidelines to remove HCAP as a clinical entity from the hospital-acquired or ventilator-associated pneumonia guidelines and place them instead in the upcoming updated guidelines on the management of CAP.5 Of these 3 explanations, the lack of familiarity fits best with our observation that guideline-concordant therapy increased steadily over time with no evidence of reaching a plateau. Ironically, as consensus was building that HCAP is a poor marker for MDROs, routine empiric treatment with vancomycin and piperacillin-tazobactam (“vanco and zosyn”) have become routine in many hospitals. Additional studies are needed to know if this trend has stabilized or reversed.
CONCLUSIONS
In conclusion, clinicians in our large, nationally representative sample treated the majority of HCAP patients as though they had CAP. Although there was an increase in the administration of guideline-concordant therapy over time, this increase was not associated with improved outcomes. This study supports the growing consensus that HCAP criteria do not accurately predict which patients benefit from broad-spectrum antibiotics for pneumonia, and most patients fare well with antibiotics targeting common community-acquired organisms.
Disclosure
This work was supported by grant # R01HS018723 from the Agency for Healthcare Research and Quality. Dr. Lagu is also supported by the National Heart, Lung, and Blood Institute of the National Institutes of Health under award number K01HL114745. Dr. Lindenauer is supported by grant K24HL132008 from the National Heart, Lung, and Blood Institute. The funding agency had no role in the data acquisition, analysis, or manuscript preparation for this study. Drs. Haessler and Rothberg had full access to all the data in the study and take responsibility for the integrity of the data and the accuracy of the data analysis. Drs. Haessler, Lagu, Lindenauer, Skiest, Zilberberg, Higgins, and Rothberg conceived of the study and analyzed and interpreted the data. Dr. Lindenauer acquired the data. Dr. Pekow and Ms. Priya carried out the statistical analyses. Dr. Haessler drafted the manuscript. All authors critically reviewed the manuscript for accuracy and integrity. All authors certify no potential conflicts of interest. Preliminary results from this study were presented in oral and poster format at IDWeek in 2012 and 2013.
1. Kochanek KD, Murphy SL, Xu JQ, Tejada-Vera B. Deaths: Final data for 2014. National vital statistics reports; vol 65 no 4. Hyattsville, MD: National Center for Health Statistics. 2016. PubMed
2. American Thoracic Society, Infectious Diseases Society of America. Guidelines for the Management of Adults with Hospital-acquired, Ventilator-associated, and Healthcare-associated Pneumonia. Am J Respir Crit Care Med. 2005;171(4):388-416. PubMed
3. Zilberberg MD, Shorr A. Healthcare-associated pneumonia: the state of the evidence to date. Curr Opin Pulm Med. 2011;17(3):142-147. PubMed
4. Kollef MK, Shorr A, Tabak YP, Gupta V, Liu LZ, Johannes RS. Epidemiology and Outcomes of Health-care-associated pneumonia. Chest. 2005;128(6):3854-3862. PubMed
5. Kalil AC, Metersky ML, Klompas M, et al. Management of Adults With Hospital-acquired and Ventilator-associated Pneumonia: 2016 Clinical Practice Guidelines by the Infectious Diseases Society of America and the American Thoracic Society. Clin Infect Dis. 2016;63(5):575-582. PubMed
6. Lindenauer PK, Pekow PS, Lahti MC, Lee Y, Benjamin EM, Rothberg MB. Association of corticosteroid dose and route of administration with risk of treatment failure in acute exacerbation of chronic obstructive pulmonary disease. JAMA. 2010;303(23):2359-2367. PubMed
7. Elixhauser A, Steiner C, Harris DR, Coffey RM. Comorbidity measures for use with administrative data. Med Care. 1998;36(1):8-27. PubMed
8. Centers for Medicare & Medicaid Services. Frequently asked questions (FAQs): Implementation and maintenance of CMS mortality measures for AMI & HF. 2007. https://www.cms.gov/Medicare/Quality-Initiatives-Patient-Assessment-Instruments/HospitalQualityInits/downloads/HospitalMortalityAboutAMI_HF.pdf. Accessed November 1, 2016.
9. Normand SL, Shahian DM. Statistical and Clinical Aspects of Hospital Outcomes Profiling. Stat Sci. 2007;22(2):206-226.
10. Rothberg MB, Pekow PS, Priya A, et al. Using highly detailed administrative data to predict pneumonia mortality. PLoS One. 2014;9(1):e87382. PubMed
11. Jones BE, Jones MM, Huttner B, et al. Trends in antibiotic use and nosocomial pathogens in hospitalized veterans with pneumonia at 128 medical centers, 2006-2010. Clin Infect Dis. 2015;61(9):1403-1410. PubMed
12. Attridge RT, Frei CR, Restrepo MI, et al. Guideline-concordant therapy and outcomes in healthcare-associated pneumonia. Eur Respir J. 2011;38(4):878-887. PubMed
13. Rothberg MB, Zilberberg MD, Pekow PS, et al. Association of Guideline-based Antimicrobial Therapy and Outcomes in Healthcare-Associated Pneumonia. J Antimicrob Chemother. 2015;70(5):1573-1579. PubMed
14. Kett DH, Cano E, Quartin AA, et al. Improving Medicine through Pathway Assessment of Critical Therapy of Hospital-Acquired Pneumonia (IMPACT-HAP) Investigators. Implementation of guidelines for management of possible multidrug-resistant pneumonia in intensive care: an observational, multicentre cohort study. Lancet Infect Dis. 2011;11(3):181-189. PubMed
15. El-Solh AA, Alhajhusain A, Saliba RG, Drinka P. Physicians’ Attitudes Toward Guidelines for the Treatment of Hospitalized Nursing-Home -Acquired Pneumonia. J Am Med Dir Assoc. 2011;12(4):270-276. PubMed
16. Tunis S, Hayward R, Wilson M, et al. Internists’ Attitudes about Clinical Practice Guidelines. Ann Intern Med. 1994;120(11):956-963. PubMed
17. Seymann GB, Di Francesco L, Sharpe B, et al. The HCAP Gap: Differences between Self-Reported Practice Patterns and Published Guidelines for Health Care-Associated Pneumonia. Clin Infect Dis. 2009;49(12):1868-1874. PubMed
18. Chalmers JD, Rother C, Salih W, Ewig S. Healthcare associated pneumonia does not accurately identify potentially resistant pathogens: a systematic review and meta-analysis. Clin Infect Dis. 2014;58(3):330-339. PubMed
19. Shorr A, Zilberberg MD, Reichley R, et al. Validation of a Clinical Score for Assessing the Risk of Resistant Pathogens in Patients with Pneumonia Presenting to the Emergency Department. Clin Infect Dis. 2012;54(2):193-198. PubMed
20. Aliberti S, Pasquale MD, Zanaboni AM, et al. Stratifying Risk Factors for Multidrug-Resistant Pathogens in Hospitalized Patients Coming from the Community with Pneumonia. Clin Infect Dis. 2012;54(4):470-478. PubMed
21. Schreiber MP, Chan CM, Shorr AF. Resistant Pathogens in Nonnosocomial Pneumonia and Respiratory Failure: Is it Time to Refine the Definition of Health-care-Associated Pneumonia? Chest. 2010;137(6):1283-1288. PubMed
22. Madaras-Kelly KJ, Remington RE, Fan VS, Sloan KL. Predicting antibiotic resistance to community-acquired pneumonia antibiotics in culture-positive patients with healthcare-associated pneumonia. J Hosp Med. 2012;7(3):195-202. PubMed
23. Shindo Y, Ito R, Kobayashi D, et al. Risk factors for drug-resistant pathogens in community-acquired and healthcare-associated pneumonia. Am J Respir Crit Care Med. 2013;188(8):985-995. PubMed
24. Metersky ML, Frei CR, Mortensen EM. Predictors of Pseudomonas and methicillin-resistant Staphylococcus aureus in hospitalized patients with healthcare-associated pneumonia. Respirology. 2016;21(1):157-163. PubMed
25. Webb BJ, Dascomb K, Stenehjem E, Dean N. Predicting risk of drug-resistant organisms in pneumonia: moving beyond the HCAP model. Respir Med. 2015;109(1):1-10. PubMed
Bacterial pneumonia remains an important cause of morbidity and mortality in the United States, and is the 8th leading cause of death with 55,227 deaths among adults annually.1 In 2005, the American Thoracic Society (ATS) and the Infectious Diseases Society of America (IDSA) collaborated to update guidelines for hospital-acquired pneumonia (HAP), ventilator-associated pneumonia, and healthcare-associated pneumonia (HCAP).2 This broad document outlines an evidence-based approach to diagnostic testing and antibiotic management based on the epidemiology and risk factors for these conditions. The guideline specifies the following criteria for HCAP: hospitalization in the past 90 days, residence in a skilled nursing facility (SNF), home infusion therapy, hemodialysis, home wound care, family members with multidrug resistant organisms (MDRO), and immunosuppressive diseases or medications, with the presumption that these patients are more likely to be harboring MDRO and should thus be treated empirically with broad-spectrum antibiotic therapy. Prior studies have shown that patients with HCAP have a more severe illness, are more likely to have MDRO, are more likely to be inadequately treated, and are at a higher risk for mortality than patients with community-acquired pneumonia (CAP).3,4
These guidelines are controversial, especially in regard to the recommendations to empirically treat broadly with 2 antibiotics targeting Pseudomonas species, whether patients with HCAP merit broader spectrum coverage than patients with CAP, and whether the criteria for defining HCAP are adequate to predict which patients are harboring MDRO. It has subsequently been proposed that HCAP is more related to CAP than to HAP, and a recent update to the guideline removed recommendations for treatment of HCAP and will be placing HCAP into the guidelines for CAP instead.5 We sought to investigate the degree of uptake of the ATS and IDSA guideline recommendations by physicians over time, and whether this led to a change in outcomes among patients who met the criteria for HCAP.
METHODS
Setting and Patients
We identified patients discharged between July 1, 2007, and November 30, 2011, from 488 US hospitals that participated in the Premier database (Premier Inc., Charlotte, North Carolina), an inpatient database developed for measuring quality and healthcare utilization. The database is frequently used for healthcare research and has been described previously.6 Member hospitals are in all regions of the US and are generally reflective of US hospitals. This database contains multiple data elements, including sociodemographic information, International Classification of Diseases, 9th Revision-Clinical Modification (ICD-9-CM) diagnosis and procedure codes, hospital and physician information, source of admission, and discharge status. It also includes a date-stamped log of all billed items and services, including diagnostic tests, medications, and other treatments. Because the data do not contain identifiable information, the institutional review board at our medical center determined that this study did not constitute human subjects research.
We included all patients aged ≥18 years with a principal diagnosis of pneumonia or with a secondary diagnosis of pneumonia paired with a principal diagnosis of respiratory failure, acute respiratory distress syndrome, respiratory arrest, sepsis, or influenza. Patients were excluded if they were transferred to or from another acute care institution, had a length of stay of 1 day or less, had cystic fibrosis, did not have a chest radiograph, or did not receive antibiotics within 48 hours of admission.
For each patient, we extracted age, gender, principal diagnosis, comorbidities, and the specialty of the attending physician. Comorbidities were identified from ICD-9-CM secondary diagnosis codes and Diagnosis Related Groups by using Healthcare Cost and Utilization Project Comorbidity Software, version 3.1, based on the work of Elixhauser (Agency for Healthcare Research and Quality, Rockville, Maryland).7 In order to ensure that patients had HCAP, we required the presence of ≥1 HCAP criteria, including hospitalization in the past 90 days, hemodialysis, admission from an SNF, or immune suppression (which was derived from either a secondary diagnosis for neutropenia, hematological malignancy, organ transplant, acquired immunodeficiency virus, or receiving immunosuppressant drugs or corticosteroids [equivalent to ≥20 mg/day of prednisone]).
Definitions of Guideline-Concordant and Discordant Antibiotic Therapy
The ATS and IDSA guidelines recommended the following antibiotic combinations for HCAP: an antipseudomonal cephalosporin or carbapenem or a beta-lactam/lactamase inhibitor, plus an antipseudomonal quinolone or aminoglycoside, plus an antibiotic with activity versus methicillin resistant Staphylococcus aureus (MRSA), such as vancomycin or linezolid. Based on these guidelines, we defined the receipt of fully guideline-concordant antibiotics as 2 recommended antibiotics for Pseudomonas species plus 1 for MRSA administered by the second day of admission. Partially guideline-concordant antibiotics were defined as 1 recommended antibiotic for Pseudomonas species plus 1 for MRSA by the second day of hospitalization. Guideline-discordant antibiotics were defined as all other combinations.
Statistical Analysis
Descriptive statistics on patient characteristics are presented as frequency, proportions for categorical factors, and median with interquartile range (IQR) for continuous variables for the full cohort and by treatment group, defined as fully or partially guideline-concordant antibiotic therapy or discordant therapy. Hospital rates of fully guideline-concordant treatment are presented overall and by hospital characteristics. The association of hospital characteristics with rates of fully guideline-concordant therapy were assessed by using 1-way analysis of variance tests.
To assess trends across hospitals for the association between the use of guideline-concordant therapy and mortality, progression to respiratory failure as measured by the late initiation of invasive mechanical ventilation (day 3 or later), and the length of stay among survivors, we divided the 4.5-year study period into 9 intervals of 6 months each; 292 hospitals that submitted data for all 9 time points were examined in this analysis. Based on the distribution of length of stay in the first time period, we created an indicator variable for extended length of stay with length of stay at or above the 75th percentile, defined as extended. For each hospital at each 6-month interval, we then computed risk-standardized guideline-concordant treatment (RS-treatment) rates and risk-standardized in-hospital outcome rates similar to methods used by the Centers for Medicare and Medicaid Services for public reporting.8 For each hospital at each time interval, we estimated a predicted rate of guideline-concordant treatment as the sum of predicted probabilities of guideline-concordant treatment from patient factors and the random intercept for the hospital in which they were admitted. We then calculated the expected rate of guideline-concordant treatment as the sum of expected probabilities of treatment received from patient factors only. RS-treatment was then calculated as the ratio of predicted to expected rates multiplied by the overall unadjusted mean treatment rate from all patients.9 We repeated the same modeling strategy to calculate risk-standardized outcome (RS-outcome) rates for each hospital across all time points. All models were adjusted for patient demographics and comorbidities. Similar models using administrative data have moderate discrimination for mortality.10
We then fit mixed-effects linear models with random hospital intercept and slope across time for the RS-treatment and outcome rates, respectively. From these models, we estimated the mean slope for RS-treatment and for RS-outcome over time. In addition, we estimated a slope or trend over time for each hospital for treatment and for outcome and evaluated the correlation between the treatment and outcome trends.
All analyses were performed using the Statistical Analysis System version 9.4 (SAS Institute Inc., Cary, NC) and STATA release 13 (StataCorp, LLC, College Station, Texas).
RESULTS
DISCUSSION
In this large, retrospective cohort study, we found that there was a substantial gap between the empiric antibiotics recommended by the ATS and IDSA guidelines and the empiric antibiotics that patients actually received. Over the study period, we saw an increased adherence to guidelines, in spite of growing evidence that HCAP risk factors do not adequately predict which patients are at risk for infection with an MDRO.11 We used this change in antibiotic prescribing behavior over time to determine if there was a clinical impact on patient outcomes and found that at the hospital level, there were no improvements in mortality, excess length of stay, or progression to respiratory failure despite a doubling in guideline-concordant antibiotic use.
At least 2 other large studies have assessed the association between guideline-concordant therapy and outcomes in HCAP.12,13 Both found that guideline-concordant therapy was associated with increased mortality, despite propensity matching. Both were conducted at the individual patient level by using administrative data, and results were likely affected by unmeasured clinical confounders, with sicker patients being more likely to receive guideline-concordant therapy. Our focus on the outcomes at the hospital level avoids this selection bias because the overall severity of illness of patients at any given hospital would not be expected to change over the study period, while physician uptake of antibiotic prescribing guidelines would be expected to increase over time. Determining the correlation between increases in guideline adherence and changes in patient outcome may offer a better assessment of the impact of guideline adherence. In this regard, our results are similar to those achieved by 1 quality improvement collaborative that was aimed at increasing guideline concordant therapy in ICUs. Despite an increase in guideline concordance from 33% to 47% of patients, they found no change in overall mortality.14
There were several limitations to our study. We did not have access to microbiologic data, so we were unable to determine which patients had MDRO infection or determine antibiotic-pathogen matching. However, the treating physicians in our study population presumably did not have access to this data at the time of treatment either because the time period we examined was within the first 48 hours of hospitalization, the interval during which cultures are incubating and the patients are being treated empirically. In addition, there may have been HCAP patients that we failed to identify, such as patients who were admitted in the past 90 days to a hospital that does not submit data to Premier. However, it is unlikely that prescribing for such patients should differ systematically from what we observed. While the database draws from 488 hospitals nationwide, it is possible that practices may be different at facilities that are not contained within the Premier database, such as Veterans Administration Hospitals. Similarly, we did not have readings for chest x-rays; hence, there could be some patients in the dataset who did not have pneumonia. However, we tried to overcome this by including only those patients with a principal diagnosis of pneumonia or sepsis with a secondary pneumonia diagnosis, a chest x-ray, and antibiotics administered within the first 48 hours of admission.
There are likely several reasons why so few HCAP patients in our study received guideline-concordant antibiotics. A lack of knowledge about the ATS and IDSA guidelines may have impacted the physicians in our study population. El-Solh et al.15 surveyed physicians about the ATS-IDSA guidelines 4 years after publication and found that only 45% were familiar with the document. We found that the rate of prescribing at least partially guideline-concordant antibiotics rose steadily over time, supporting the idea that the newness of the guidelines was 1 barrier. Additionally, prior studies have shown that many physicians may not agree with or choose to follow guidelines, with only 20% of physicians indicating that guidelines have a major impact on their clinical decision making,16 and the majority do not choose HCAP guideline-concordant antibiotics when tested.17 Alternatively, clinicians may not follow the guidelines because of a belief that the HCAP criteria do not adequately indicate patients who are at risk for MDRO. Previous studies have demonstrated the relative inability of HCAP risk factors to predict patients who harbor MDRO18 and suggest that better tools such as clinical scoring systems, which include not only the traditional HCAP risk factors but also prior exposure to antibiotics, prior culture data, and a cumulative assessment of both intrinsic and extrinsic factors, could more accurately predict MDRO and lead to a more judicious use of broad-spectrum antimicrobial agents.19-25 Indeed, these collective findings have led the authors of the recently updated guidelines to remove HCAP as a clinical entity from the hospital-acquired or ventilator-associated pneumonia guidelines and place them instead in the upcoming updated guidelines on the management of CAP.5 Of these 3 explanations, the lack of familiarity fits best with our observation that guideline-concordant therapy increased steadily over time with no evidence of reaching a plateau. Ironically, as consensus was building that HCAP is a poor marker for MDROs, routine empiric treatment with vancomycin and piperacillin-tazobactam (“vanco and zosyn”) have become routine in many hospitals. Additional studies are needed to know if this trend has stabilized or reversed.
CONCLUSIONS
In conclusion, clinicians in our large, nationally representative sample treated the majority of HCAP patients as though they had CAP. Although there was an increase in the administration of guideline-concordant therapy over time, this increase was not associated with improved outcomes. This study supports the growing consensus that HCAP criteria do not accurately predict which patients benefit from broad-spectrum antibiotics for pneumonia, and most patients fare well with antibiotics targeting common community-acquired organisms.
Disclosure
This work was supported by grant # R01HS018723 from the Agency for Healthcare Research and Quality. Dr. Lagu is also supported by the National Heart, Lung, and Blood Institute of the National Institutes of Health under award number K01HL114745. Dr. Lindenauer is supported by grant K24HL132008 from the National Heart, Lung, and Blood Institute. The funding agency had no role in the data acquisition, analysis, or manuscript preparation for this study. Drs. Haessler and Rothberg had full access to all the data in the study and take responsibility for the integrity of the data and the accuracy of the data analysis. Drs. Haessler, Lagu, Lindenauer, Skiest, Zilberberg, Higgins, and Rothberg conceived of the study and analyzed and interpreted the data. Dr. Lindenauer acquired the data. Dr. Pekow and Ms. Priya carried out the statistical analyses. Dr. Haessler drafted the manuscript. All authors critically reviewed the manuscript for accuracy and integrity. All authors certify no potential conflicts of interest. Preliminary results from this study were presented in oral and poster format at IDWeek in 2012 and 2013.
1. Kochanek KD, Murphy SL, Xu JQ, Tejada-Vera B. Deaths: Final data for 2014. National vital statistics reports; vol 65 no 4. Hyattsville, MD: National Center for Health Statistics. 2016. PubMed
2. American Thoracic Society, Infectious Diseases Society of America. Guidelines for the Management of Adults with Hospital-acquired, Ventilator-associated, and Healthcare-associated Pneumonia. Am J Respir Crit Care Med. 2005;171(4):388-416. PubMed
3. Zilberberg MD, Shorr A. Healthcare-associated pneumonia: the state of the evidence to date. Curr Opin Pulm Med. 2011;17(3):142-147. PubMed
4. Kollef MK, Shorr A, Tabak YP, Gupta V, Liu LZ, Johannes RS. Epidemiology and Outcomes of Health-care-associated pneumonia. Chest. 2005;128(6):3854-3862. PubMed
5. Kalil AC, Metersky ML, Klompas M, et al. Management of Adults With Hospital-acquired and Ventilator-associated Pneumonia: 2016 Clinical Practice Guidelines by the Infectious Diseases Society of America and the American Thoracic Society. Clin Infect Dis. 2016;63(5):575-582. PubMed
6. Lindenauer PK, Pekow PS, Lahti MC, Lee Y, Benjamin EM, Rothberg MB. Association of corticosteroid dose and route of administration with risk of treatment failure in acute exacerbation of chronic obstructive pulmonary disease. JAMA. 2010;303(23):2359-2367. PubMed
7. Elixhauser A, Steiner C, Harris DR, Coffey RM. Comorbidity measures for use with administrative data. Med Care. 1998;36(1):8-27. PubMed
8. Centers for Medicare & Medicaid Services. Frequently asked questions (FAQs): Implementation and maintenance of CMS mortality measures for AMI & HF. 2007. https://www.cms.gov/Medicare/Quality-Initiatives-Patient-Assessment-Instruments/HospitalQualityInits/downloads/HospitalMortalityAboutAMI_HF.pdf. Accessed November 1, 2016.
9. Normand SL, Shahian DM. Statistical and Clinical Aspects of Hospital Outcomes Profiling. Stat Sci. 2007;22(2):206-226.
10. Rothberg MB, Pekow PS, Priya A, et al. Using highly detailed administrative data to predict pneumonia mortality. PLoS One. 2014;9(1):e87382. PubMed
11. Jones BE, Jones MM, Huttner B, et al. Trends in antibiotic use and nosocomial pathogens in hospitalized veterans with pneumonia at 128 medical centers, 2006-2010. Clin Infect Dis. 2015;61(9):1403-1410. PubMed
12. Attridge RT, Frei CR, Restrepo MI, et al. Guideline-concordant therapy and outcomes in healthcare-associated pneumonia. Eur Respir J. 2011;38(4):878-887. PubMed
13. Rothberg MB, Zilberberg MD, Pekow PS, et al. Association of Guideline-based Antimicrobial Therapy and Outcomes in Healthcare-Associated Pneumonia. J Antimicrob Chemother. 2015;70(5):1573-1579. PubMed
14. Kett DH, Cano E, Quartin AA, et al. Improving Medicine through Pathway Assessment of Critical Therapy of Hospital-Acquired Pneumonia (IMPACT-HAP) Investigators. Implementation of guidelines for management of possible multidrug-resistant pneumonia in intensive care: an observational, multicentre cohort study. Lancet Infect Dis. 2011;11(3):181-189. PubMed
15. El-Solh AA, Alhajhusain A, Saliba RG, Drinka P. Physicians’ Attitudes Toward Guidelines for the Treatment of Hospitalized Nursing-Home -Acquired Pneumonia. J Am Med Dir Assoc. 2011;12(4):270-276. PubMed
16. Tunis S, Hayward R, Wilson M, et al. Internists’ Attitudes about Clinical Practice Guidelines. Ann Intern Med. 1994;120(11):956-963. PubMed
17. Seymann GB, Di Francesco L, Sharpe B, et al. The HCAP Gap: Differences between Self-Reported Practice Patterns and Published Guidelines for Health Care-Associated Pneumonia. Clin Infect Dis. 2009;49(12):1868-1874. PubMed
18. Chalmers JD, Rother C, Salih W, Ewig S. Healthcare associated pneumonia does not accurately identify potentially resistant pathogens: a systematic review and meta-analysis. Clin Infect Dis. 2014;58(3):330-339. PubMed
19. Shorr A, Zilberberg MD, Reichley R, et al. Validation of a Clinical Score for Assessing the Risk of Resistant Pathogens in Patients with Pneumonia Presenting to the Emergency Department. Clin Infect Dis. 2012;54(2):193-198. PubMed
20. Aliberti S, Pasquale MD, Zanaboni AM, et al. Stratifying Risk Factors for Multidrug-Resistant Pathogens in Hospitalized Patients Coming from the Community with Pneumonia. Clin Infect Dis. 2012;54(4):470-478. PubMed
21. Schreiber MP, Chan CM, Shorr AF. Resistant Pathogens in Nonnosocomial Pneumonia and Respiratory Failure: Is it Time to Refine the Definition of Health-care-Associated Pneumonia? Chest. 2010;137(6):1283-1288. PubMed
22. Madaras-Kelly KJ, Remington RE, Fan VS, Sloan KL. Predicting antibiotic resistance to community-acquired pneumonia antibiotics in culture-positive patients with healthcare-associated pneumonia. J Hosp Med. 2012;7(3):195-202. PubMed
23. Shindo Y, Ito R, Kobayashi D, et al. Risk factors for drug-resistant pathogens in community-acquired and healthcare-associated pneumonia. Am J Respir Crit Care Med. 2013;188(8):985-995. PubMed
24. Metersky ML, Frei CR, Mortensen EM. Predictors of Pseudomonas and methicillin-resistant Staphylococcus aureus in hospitalized patients with healthcare-associated pneumonia. Respirology. 2016;21(1):157-163. PubMed
25. Webb BJ, Dascomb K, Stenehjem E, Dean N. Predicting risk of drug-resistant organisms in pneumonia: moving beyond the HCAP model. Respir Med. 2015;109(1):1-10. PubMed
© 2017 Society of Hospital Medicine
Observational Study of Peripheral Intravenous Catheter Outcomes in Adult Hospitalized Patients: A Multivariable Analysis of Peripheral Intravenous Catheter Failure
INTRODUCTION
Peripheral intravenous catheter (PIV) insertion is the fastest, simplest, and most cost-effective method to gain vascular access, and it is used for short-term intravenous (IV) fluids, medications, blood products, and contrast media.1 It is the most common invasive device in hospitalized patients,2 with up to 70% of hospital patients receiving a PIV.3 Unacceptable PIV failure rates have been reported as high as 69%.4-7 Failure is most frequently due to phlebitis (vein wall irritation/inflammation), occlusion (blockage), infiltration or extravasation (IV fluids/vesicant therapy entering surrounding tissue), partial dislodgement or accidental removal, leakage, and infection.4,6,8 These failures have important implications for patients, who endure the discomfort of PIV complications and catheter replacements, and healthcare staff and budgets.
To reduce the incidence of catheter failure and avoid preventable PIV replacements, a clear understanding of why catheters fail is required. Previous research has identified that catheter gauge,9-11 insertion site,12-14 and inserter skill10,15 have an impact on PIV failure. Limitations of existing research are small study sizes,16-18 retrospective design,19 or secondary analysis of an existing data set; all potentially introduce sampling bias.10,20
To overcome these potential biases, we developed a data collection instrument based on the catheter-associated risk factors described in the literature,9-11,13 and other potential insertion and maintenance risks for PIV failure (eg, multiple insertion attempts, medications administered), with data collected prospectively. The study aim was to improve patient outcomes by identifying PIV insertion and maintenance risk factors amenable to modification through education or alternative clinical interventions, such as catheter gauge selection or insertion site.
METHODS
Study Design and Participants
We conducted this prospective cohort study in a large tertiary hospital in Queensland, Australia. Ethics committee approval was obtained from the hospital (HREC/14/QRBW/76) and Griffith University (NRS/26/14/HREC). The study was registered with the Australian New Zealand Clinical Trials Registry (ACTRN12615000738527). Patients in medical and surgical wards were screened Monday, Wednesday, and Friday between October 2014 and December 2015. Patients over 18 years with a PIV (BD InsyteTM AutoguardTM BC; Becton Dickinson, Franklin Lakes, NJ) inserted within 24 hours, and who were able to provide written informed consent, were eligible and recruited sequentially. Patients classified as palliative by the treating clinical team were excluded.
Sample Size Calculation
The “10 events per variable” rule was used to determine the sample size required to study 50 potential risk factors.21,22 This determined that 1000 patients, with an average of 1.5 PIVs each and an expected PIV failure of 30% (500 events), were required.
Data Collection
At recruitment, baseline patient information was collected by a research nurse (ReNs) (demographics, admitting diagnosis, comorbidities, skin type,23 and vein condition) and entered into an electronic data platform supported by Research Electronic Data Capture (REDCap).24 Baseline data also included catheter variables (eg, gauge, insertion site, catheterized vein) and insertion details (eg, department of insertion, inserting clinician, number of insertion attempts). We included every PIV the participant had during their admission until hospital discharge or insertion of a central venous access device. PIV sites were reviewed Monday, Wednesday, and Friday by ReNs for site complications (eg, redness, pain, swelling, palpable cord). Potential risk factors for failure were also recorded (eg, infusates and additives, antibiotic type and dosage, flushing regimen, number of times the PIV was accessed each day for administration of IV medications or fluids, dressing type and condition, securement method for the catheter and tubing, presence of extension tubing or 3-way taps, patient mobility status, and delirium). A project manager trained and supervised ReNs for protocol compliance and audited study data quality. We considered PIV failure to have occurred if the catheter had complications at removal identified by the ReNs assessment, from medical charts, or by speaking to the patient and beside nurse. We grouped the failures in 1 of 3 types: (1) occlusion or infiltration, defined as blockage, IV fluids moving into surrounding tissue, induration, or swelling greater than 1 cm from the insertion site at or within 24 hours of removal; (2) phlebitis, defined as per clinicians’ definitions or one or more of the following signs and symptoms: pain or tenderness scored at 2 or more on a 1 to 10 increasing severity pain scale, or redness or a palpable cord (either extending greater than 1 cm from the insertion site) at or within 24 hours of PIV removal; and (3) dislodgement (partial or complete). If multiple complications were present, all were recorded.
Statistical Analysis
Data were downloaded from REDcap to Stata 14.2 (StataCorp., College Station, TX) for data management and analysis. Missing data were not imputed. Nominal data observations were collapsed into a single observation per device. Patient and device variables were described as frequencies and proportions, means and standard deviations, or medians and interquartile ranges. Failure incidence rates were calculated, and a Kaplan-Meier survival curve was plotted. In general, Cox proportional hazards models were fitted (Efron method) to handle tied failures (clustering by patient). Variables significant at P < 0.20 on univariable analyses were subjected to multivariable regression. Generally, the largest category was set as referent. Correlations between variables were checked (Spearman’s rank for binary variables, R-squared value of linear regressions for continuous/categorical or continuous/continuous variables). Correlations were considered significant if r > 0.5 and the lower bound of the 95% confidence interval (CI) was >0.5 (where calculated). Covariate interactions were explored, and effects at P < 0.05 noted. The 4 steps of multivariable model building were (1) baseline covariates only with manual stepwise removal of covariates at P ≥ 0.05, (2) treatment covariates only with manual stepwise removal of covariates at P ≥ 0.05, (3) a combination of the derived models from (1) and (2) and manual stepwise removal of covariates at P ≥ 0.05, and (4) manual stepwise addition and removal (at P ≥ 0.05) of variables dropped during the previous steps and interaction testing. Final models were checked as follows: global proportional-hazards assumption test, concordance probability (that predictions and outcomes were in agreement), and Nelson-Aalen cumulative hazard function plotted against the Cox-Snell residuals.
RESULTS
Patient Characteristics
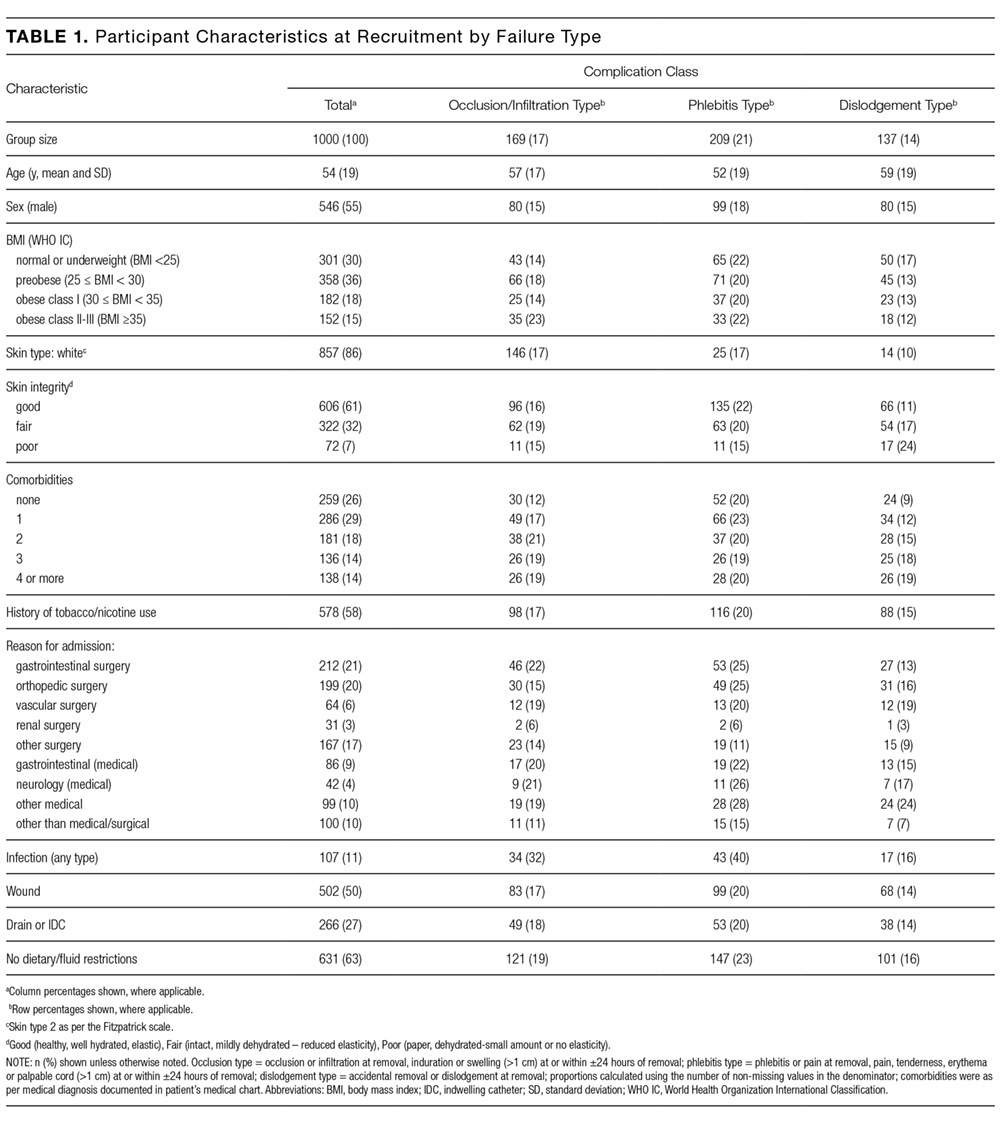
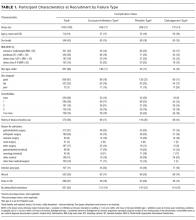
In total, 1000 patients with 1578 PIVs were recruited. The average age was 54 years and the majority were surgical patients (673; 67%). Almost half of patients (455; 46%) had 2 or more comorbidities, and 334 (33%) were obese (body mass index greater than 30). Sample characteristics are shown by the type of catheter failure in Table 1.
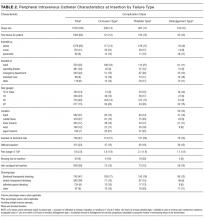
PIV Characteristics
All 1578 PIVs were followed until removal, with only 7 PIVs (0.44%) having missing data for the 3 outcomes of interest (these were coded as nonfailures for analysis). Sixty percent of participants had more than 1 PIV followed in the study. Doctors and physicians inserted 1278 (83%) catheters. A total of 550 (35%) were placed in the ward, with 428 (28%) inserted in the emergency department or ambulance. A third of the catheters (540; 34%) were 18-gauge or larger in diameter, and 1000 (64%) were located in the cubital fossa or hand. Multiple insertion attempts were required to place 315 (23%) PIVs. No PIVs were inserted with ultrasound, as this is rarely used in this hospital. The flushing policy was for the administration of 9% sodium chloride every 8 hours if no IV medications or fluids were ordered. Table 2 contains further details of device-related characteristics. Although the hospital policy was for catheter removal by 72 hours, dwell time ranged from <1 to 14 days, with an average of 2.4 days.
PIV Complications
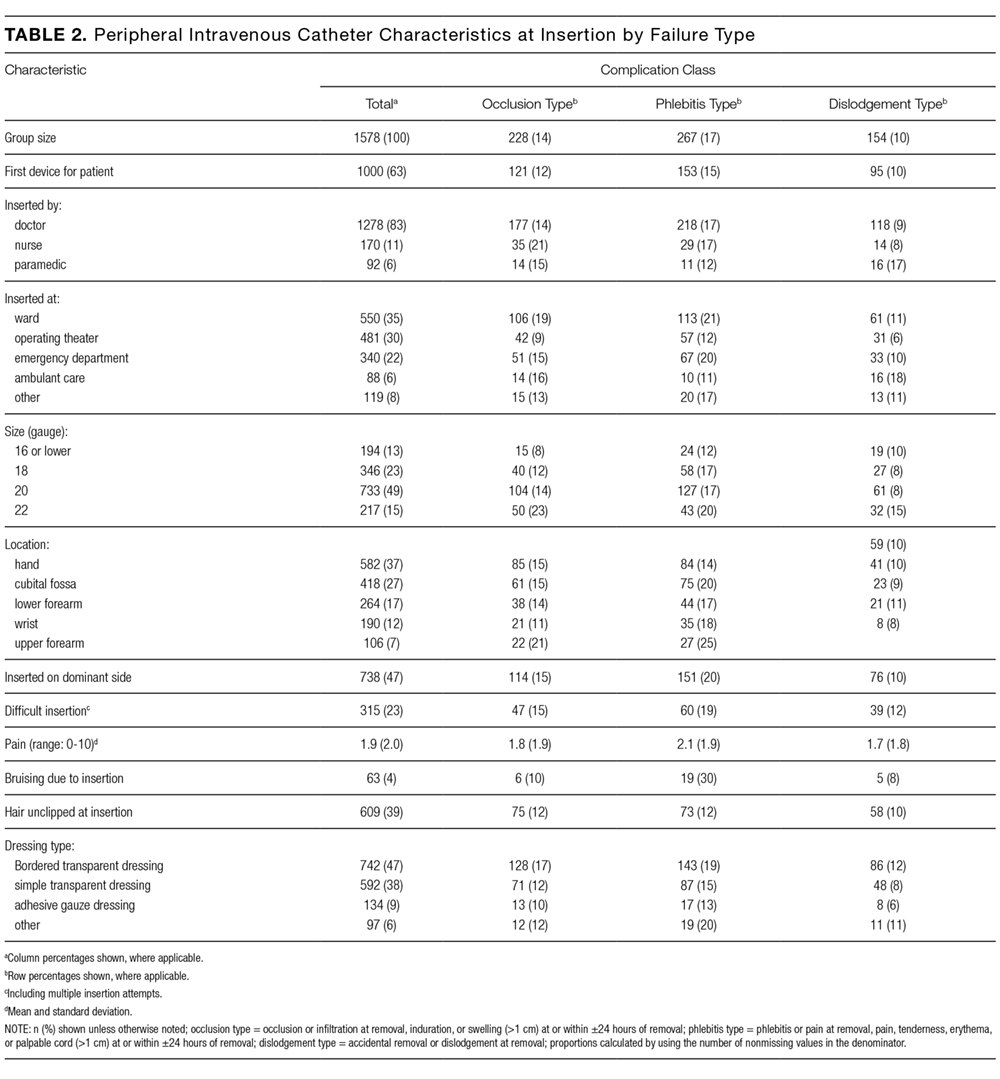
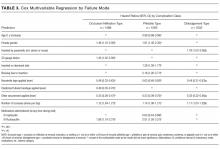
Catheter failure (any cause) occurred in 512 (32%) catheters, which is a failure rate of 136 per 1000 catheter days (95% CI, 125-148). A total of 346 patients out of 1000 (35%) had at least 1 failed PIV during the study. Failures were 267 phlebitis (17%), 228 occlusion/infiltration (14%), and/or 154 dislodgement (10%; Figure), with some PIVs exhibiting multiple concurrent complications (Table 2).
Multivariable AnalysisOcclusion/Infiltration
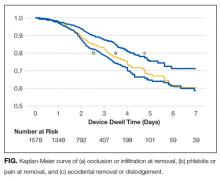
The multivariable analysis (Table 3) showed occlusion or infiltration was statistically significantly associated with female patients (hazard ratio [HR], 1.48; 95% CI, 1.10-2.00), with a 22-gauge catheter (HR, 1.43; 95% CI, 1.02-2.00), IV flucloxacillin (HR, 1.98; 95% CI, 1.19-3.31), and with frequent PIV access (HR, 1.12; 95% CI, 1.04-1.21; ie, with each increase of 1 in the mean medications/fluids administrations per day, relative PIV failure increased 112%). Less occlusion and infiltration were statistically significantly associated with securement by using additional nonsterile tape (HR, 0.46; 95% CI, 0.33-0.63), elasticized tubular bandages (HR, 0.49; 95% CI, 0.35-0.70 ), or other types of additional securement for the PIV (HR, 0.35; 95% CI, 0.26-0.47).
Phlebitis

Phlebitis was statistically significantly associated with female patients (HR, 1.81; 95% CI, 1.40-2.35), bruising at the insertion site (HR, 2.16; 95% CI, 1.26-3.71), insertion in patients’ dominant side (HR, 1.39; 95% CI, 1.09-1.77), IV flucloxicillin (HR, 2.01; 95% CI, 1.26-3.21), or with frequent PIV access (HR, 1.14; 95% CI, 1.08-1.21). Older age, (HR, 0.99; 95% CI, 0.98-0.99; ie, each year older was associated with 1% less phlebitis), securement with additional nonsterile tape (HR, 0.63; 95% CI, 0.48-0.82) or with any other additional securement (HR, 0.53; 95% CI, 0.39-0.70), or the administration of IV cephazolin (HR, 0.63; 95% CI, 0.44-0.89) were associated with lower phlebitis risk.
Dislodgement
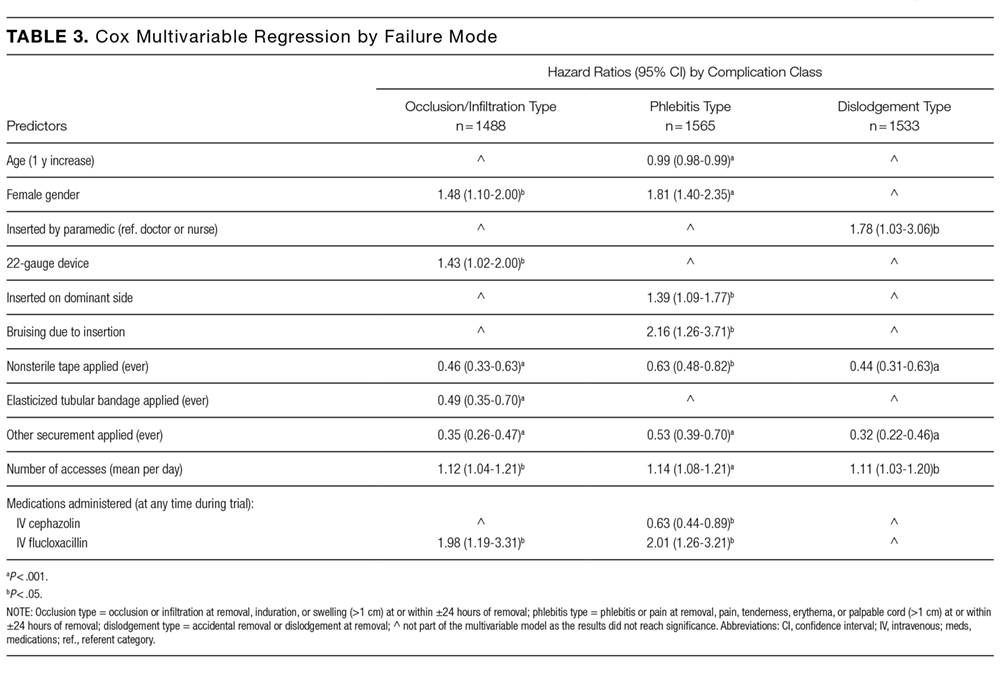
Statistically significant predictors associated with an increased risk of PIV dislodgement included paramedic insertion (HR, 1.78; 95% CI, 1.03-3.06) and frequent PIV access (HR, 1.11; 95% CI, 1.03-1.20). A decreased risk was associated with the additional securement of the PIV, including nonsterile tape (HR, 0.44; 95% CI, 0.31-0.63) or other forms of additional securement (HR, 0.32; 95% CI, 0.22-0.46).
DISCUSSION
One in 3 PIVs failed in this study, with phlebitis as the most common cause of PIV failure. The 17% phlebitis rate reflected clinician-reported phlebitis or phlebitis observed by research staff using a 1-criteria definition because any sign or symptom can trigger PIV removal (eg, pain), even if other signs or symptoms are not present. Reported phlebitis rates are lower if definitions require 2 signs or symptoms.4,6 With over 71 different phlebitis assessment scales in use, and none well validated, the best method for diagnosing phlebitis remains unclear and explains the variation in reported rates.25 Occlusion/infiltration and dislodgement were also highly prevalent forms of PIV failure at 14% and 10%, respectively. Occlusion and infiltration were combined because clinical staff use these terms interchangeably, and differential diagnostic tools are not used in practice. Both result in the same outcome (therapy interruption and PIV removal), and this combination of outcomes has been used previously.23 No PIV-associated bloodstream infections occurred, despite the heightened awareness of these infections in the literature.3
Females had significantly more occlusion/infiltration and phlebitis than males, in keeping with previous studies.7,9,10 This could be because of females’ smaller vein caliber, although the effect remained after adjustment for PIV gauge.7,26 The effect of aging on vascular endothelium and structural integrity may explain the observed decrease in phlebitis of 1% with each older year of age.27 However, gender and age effects could be explained by psychosocial factors (eg, older people may be less likely to admit pain, or we may question them less sympathetically), but, regardless, women and younger patients should be monitored more closely.
We found 22-gauge catheters were more likely to fail from occlusion/infiltration than other sizes. This confirms similar findings from Abolfotouh et al.9 PIV gauge selection for this study was made at the inserter’s discretion and may be confounded by smaller vein size, which was not measured. In addition, risk may be because of smaller gauge alone or also more influenced by the shorter length of the studied 22-gauge (25 mm) than the <20-gauge catheters (30 mm). These results question international guidelines, which currently recommend the smallest gauge peripheral catheter possible,28,29 and randomized trials are needed. Although practice varies between inserters, some preferentially cannulate the nondominant limb. We are not aware of previous studies on this practice; however, our results support this approach.
Flucloxacillin was associated with a 2-fold increase in occlusion/infiltration and phlebitis. Although multiple studies have reported IV medications9,11 and IV antibiotics10,30,31 as risk factors for PIV failure, none have identified flucloxacillin as an independent risk factor. IV flucloxacillin is recommended for reconstitution as 1 g in 15 mL to 20 mL of sterile water, and injection over 3 to 4 minutes, although this may not be adhered to in practice. Alternative administration regimes or improved adherence to current policy may be needed. An exception to the relationship between IV antibiotics and catheter failure was IV cephazolin, associated with 40% relatively less phlebitis. This may be a spurious finding because the administration, pH, and osmolality of cephazolin are similar to other IV antibiotics.
The more PIVs that were accessed per day, whether for infusions or medications, the more failure occurred from occlusion/infiltration, phlebitis, and dislodgement. This suggests that peripheral veins are easily damaged and/or inflamed by the influx of fluids or medications. Lower injection pressures or the timely transfer to oral medications may limit this problem. Flushing regimens may also assist because practice varies greatly, and questions on whether slow continuous flush infusion or intermittent manual flushing are more vein-protective, and the optimal flush volume, frequency, and technique (eg, pulsatile) remain.32,33 Manual handling for frequent access may loosen dressings and securement, thus explaining the observed association between frequent access and catheter dislodgement. Finally, the association between use and failure may indicate that many of these patients were not suitable for a PIV, and different approaches (eg, ultrasound-guided insertion) or a midline may have been a superior option. There is growing emphasis on the need for better preinsertion assessment and selection of the most appropriate device for the patient and the IV treatment required.34
Suboptimal dressings or securements are not unusual in hospitals.35 Despite our policy of PIV securement with bordered transparent dressings, we found 4 dressing types in use. In addition, we found almost 50% of PIVs had an additional (secondary) securement, and this was associated with significantly less PIV failure of all 3 types. This suggests that 1 or more of nonsterile tape, elasticized tubular bandages, or other securement (eg, bandage or second transparent dressing) can reduce PIV failure, although a randomized trial is lacking.36 Whether the dressing was failing and required reinforcement or hospital staff lacked confidence in the dressing and placed additional securement preventatively is unclear. Both PIV failure and PIV dressing failure are common, and further research into superior PIV products and practices is urgently needed. Paramedic insertions had a higher risk of dislodgement, suggesting that the increased emphasis on securement should start in the prehospital setting.
While multiple or difficult insertion attempts were not associated with PIV failure, insertions were not directly observed, and clinicians may have underreported attempts. In contrast, insertion-related bruising (a surrogate for difficult insertion) was associated with more than double the incidence of phlebitis. The long-term implications of multiple insertion attempts on patient’s vasculature are unclear, but we believe first time PIV insertion is important to patients and of interest to clinicians. A recent systematic review of strategies associated with first attempt PIV insertion success in an emergency department found little evidence for effective strategies and recommended further research.37
The overall PIV failure rate in our study was 32%, lower than the 35% to 40% failure observed in our previous randomized controlled trials, which had more stringent inclusion and exclusion criteria (eg, longer predicted duration of therapy).6,38 The implications for patients and costs to the organization of frequent catheter replacement demonstrate urgent need for further research in this area of practice.39 A strength of this study is that all PIVs, regardless of the expected length of dwell time or reason for insertion, were eligible for inclusion, providing more generalizable results. The PIV failure rate of 32% is concerning because these failures trigger treatment delays and replacement insertions, with significant increased labor and equipment costs. The mean cost of PIV replacement has been costed at AUD $69.30 or US $51.92 (as per 2010 $ value) per episode of IV treatment.40 For our hospital, which uses 200,000 PIVs per year, the current level of PIV failure suggests almost AU $5.5 (US $4.1) million in waste annually at this site alone.
The additional strengths of this study include the extensive information collected prospectively about PIV insertion and maintenance, including information on who inserted the PIV, IV medications administered, and PIV dressings used. Limitations were the population of surgical and medical patients in 1 tertiary hospital, which may not be generalizable to other settings.
CONCLUSION
Our study confirms the high rate of catheter failure in acute care hospitals, validates existing evidence related to PIV failure, and identifies new, potentially modifiable risk factors to improve PIV insertion and management. Implications for future research were also identified.
Acknowledgments
The researchers acknowledge and thank the nurses and patients involved in this study. The authors would also like to acknowledge Becton Dickinson for partly funding this study in the form of an unrestricted grant-in-aid paid to Griffith University. Becton Dickinson did not design the study protocol, collect or analyze data, and did not prepare or review the manuscript.
Disclosure
On behalf of NM and CMR, Griffith University has received unrestricted educational and research grants and consultancy payment for lectures from 3M and Becton Dickinson. On behalf of NM, MC, and CMR, Griffith University has received unrestricted investigator-initiated research grants from Centurion Medical Products and Entrotech Lifesciences (manufacturers of PIV dressings) and Becton Dickinson (manufacturer of PIVs). On behalf of MC, Griffith University has received a consultancy payment to develop education material from Baxter. On behalf of CMR, Griffith University has received unrestricted donations or investigator initiated research grants unrelated to this research from Adhezion, Angiodynamics, Baxter, Carefusion, Cook Medical, Hospira, Mayo, Smiths Medical, and Vygon. On behalf of CMR, Griffith University has received consultancy payments for educational lectures or professional opinion from B. Braun, Bard, Carefusion, Mayo, ResQDevices, and Smiths Medical. On behalf of EL, Griffith University has received consultancy payments for educational lecture from 3M. On behalf of MC, Griffith University has received a consultancy payment to develop education material from Baxter. As this was an observational study, no products were trialed in this study. JW and GM have no conflicts of interest.
1
2
3
4
5
6
7
8
9
1
1
1
1
1
1
1
1
1
1
2
2
2
2
2
2
2
2
2
2
3
3
3
33. Schreiber S, Zanchi C, Ronfani L, et al. Normal saline flushes performed once
daily maintain peripheral intravenous catheter patency: a randomised controlled
trial. Arch Dis Child. 2015;100(7):700-703. PubMed
34. Chopra V, Flanders SA, Saint S, et al. The Michigan Appropriateness Guide
for Intravenous Catheters (MAGIC): results from a multispecialty panel using
the RAND/UCLA appropriateness method. Ann Intern Med. 2015;163(6 Suppl):
S1-S40. PubMed
35. New KA, Webster J, Marsh NM, Hewer B. Intravascular device use, management,
documentation and complications: a point prevalence survey. Aust Health Rev.
2014;38(3):345-349. PubMed
36. Marsh N, Webster J, Mihala G, Rickard C. Devices and dressings to secure peripheral
venous catheters to prevent complications. Cochrane Database Syst Rev.
2015(6):CD11070. PubMed
37. Parker SI, Benzies KM, Hayden KA, Lang ES. Effectiveness of interventions for
adult peripheral intravenous catheterization: A systematic review and meta-analysis
of randomized controlled trials. Int Emerg Nurs. 2016;31:15-21. PubMed
38. Webster J, Lloyd S, Hopkins T, Osborne S, Yaxley M. Developing a Research base
for Intravenous Peripheral cannula re-sites (DRIP trial). A randomised controlled
trial of hospital in-patients. Int J Nurs Stud. 2007;44(5):664-671. PubMed
39. Helm RE, Klausner JD, Klemperer JD, Flint LM, Huang E. Accepted but unacceptable:
peripheral IV catheter failure. J Infus Nurs. 2015;38(3):189-203. PubMed
40. Tuffaha HW, Rickard CM, Webster J, et al. Cost-effectiveness analysis of clinically
indicated versus routine replacement of peripheral intravenous catheters. Appl
Health Econ Health Policy. 2014;12(1):51-58. PubMed
INTRODUCTION
Peripheral intravenous catheter (PIV) insertion is the fastest, simplest, and most cost-effective method to gain vascular access, and it is used for short-term intravenous (IV) fluids, medications, blood products, and contrast media.1 It is the most common invasive device in hospitalized patients,2 with up to 70% of hospital patients receiving a PIV.3 Unacceptable PIV failure rates have been reported as high as 69%.4-7 Failure is most frequently due to phlebitis (vein wall irritation/inflammation), occlusion (blockage), infiltration or extravasation (IV fluids/vesicant therapy entering surrounding tissue), partial dislodgement or accidental removal, leakage, and infection.4,6,8 These failures have important implications for patients, who endure the discomfort of PIV complications and catheter replacements, and healthcare staff and budgets.
To reduce the incidence of catheter failure and avoid preventable PIV replacements, a clear understanding of why catheters fail is required. Previous research has identified that catheter gauge,9-11 insertion site,12-14 and inserter skill10,15 have an impact on PIV failure. Limitations of existing research are small study sizes,16-18 retrospective design,19 or secondary analysis of an existing data set; all potentially introduce sampling bias.10,20
To overcome these potential biases, we developed a data collection instrument based on the catheter-associated risk factors described in the literature,9-11,13 and other potential insertion and maintenance risks for PIV failure (eg, multiple insertion attempts, medications administered), with data collected prospectively. The study aim was to improve patient outcomes by identifying PIV insertion and maintenance risk factors amenable to modification through education or alternative clinical interventions, such as catheter gauge selection or insertion site.
METHODS
Study Design and Participants
We conducted this prospective cohort study in a large tertiary hospital in Queensland, Australia. Ethics committee approval was obtained from the hospital (HREC/14/QRBW/76) and Griffith University (NRS/26/14/HREC). The study was registered with the Australian New Zealand Clinical Trials Registry (ACTRN12615000738527). Patients in medical and surgical wards were screened Monday, Wednesday, and Friday between October 2014 and December 2015. Patients over 18 years with a PIV (BD InsyteTM AutoguardTM BC; Becton Dickinson, Franklin Lakes, NJ) inserted within 24 hours, and who were able to provide written informed consent, were eligible and recruited sequentially. Patients classified as palliative by the treating clinical team were excluded.
Sample Size Calculation
The “10 events per variable” rule was used to determine the sample size required to study 50 potential risk factors.21,22 This determined that 1000 patients, with an average of 1.5 PIVs each and an expected PIV failure of 30% (500 events), were required.
Data Collection
At recruitment, baseline patient information was collected by a research nurse (ReNs) (demographics, admitting diagnosis, comorbidities, skin type,23 and vein condition) and entered into an electronic data platform supported by Research Electronic Data Capture (REDCap).24 Baseline data also included catheter variables (eg, gauge, insertion site, catheterized vein) and insertion details (eg, department of insertion, inserting clinician, number of insertion attempts). We included every PIV the participant had during their admission until hospital discharge or insertion of a central venous access device. PIV sites were reviewed Monday, Wednesday, and Friday by ReNs for site complications (eg, redness, pain, swelling, palpable cord). Potential risk factors for failure were also recorded (eg, infusates and additives, antibiotic type and dosage, flushing regimen, number of times the PIV was accessed each day for administration of IV medications or fluids, dressing type and condition, securement method for the catheter and tubing, presence of extension tubing or 3-way taps, patient mobility status, and delirium). A project manager trained and supervised ReNs for protocol compliance and audited study data quality. We considered PIV failure to have occurred if the catheter had complications at removal identified by the ReNs assessment, from medical charts, or by speaking to the patient and beside nurse. We grouped the failures in 1 of 3 types: (1) occlusion or infiltration, defined as blockage, IV fluids moving into surrounding tissue, induration, or swelling greater than 1 cm from the insertion site at or within 24 hours of removal; (2) phlebitis, defined as per clinicians’ definitions or one or more of the following signs and symptoms: pain or tenderness scored at 2 or more on a 1 to 10 increasing severity pain scale, or redness or a palpable cord (either extending greater than 1 cm from the insertion site) at or within 24 hours of PIV removal; and (3) dislodgement (partial or complete). If multiple complications were present, all were recorded.
Statistical Analysis
Data were downloaded from REDcap to Stata 14.2 (StataCorp., College Station, TX) for data management and analysis. Missing data were not imputed. Nominal data observations were collapsed into a single observation per device. Patient and device variables were described as frequencies and proportions, means and standard deviations, or medians and interquartile ranges. Failure incidence rates were calculated, and a Kaplan-Meier survival curve was plotted. In general, Cox proportional hazards models were fitted (Efron method) to handle tied failures (clustering by patient). Variables significant at P < 0.20 on univariable analyses were subjected to multivariable regression. Generally, the largest category was set as referent. Correlations between variables were checked (Spearman’s rank for binary variables, R-squared value of linear regressions for continuous/categorical or continuous/continuous variables). Correlations were considered significant if r > 0.5 and the lower bound of the 95% confidence interval (CI) was >0.5 (where calculated). Covariate interactions were explored, and effects at P < 0.05 noted. The 4 steps of multivariable model building were (1) baseline covariates only with manual stepwise removal of covariates at P ≥ 0.05, (2) treatment covariates only with manual stepwise removal of covariates at P ≥ 0.05, (3) a combination of the derived models from (1) and (2) and manual stepwise removal of covariates at P ≥ 0.05, and (4) manual stepwise addition and removal (at P ≥ 0.05) of variables dropped during the previous steps and interaction testing. Final models were checked as follows: global proportional-hazards assumption test, concordance probability (that predictions and outcomes were in agreement), and Nelson-Aalen cumulative hazard function plotted against the Cox-Snell residuals.
RESULTS
Patient Characteristics
In total, 1000 patients with 1578 PIVs were recruited. The average age was 54 years and the majority were surgical patients (673; 67%). Almost half of patients (455; 46%) had 2 or more comorbidities, and 334 (33%) were obese (body mass index greater than 30). Sample characteristics are shown by the type of catheter failure in Table 1.
PIV Characteristics
All 1578 PIVs were followed until removal, with only 7 PIVs (0.44%) having missing data for the 3 outcomes of interest (these were coded as nonfailures for analysis). Sixty percent of participants had more than 1 PIV followed in the study. Doctors and physicians inserted 1278 (83%) catheters. A total of 550 (35%) were placed in the ward, with 428 (28%) inserted in the emergency department or ambulance. A third of the catheters (540; 34%) were 18-gauge or larger in diameter, and 1000 (64%) were located in the cubital fossa or hand. Multiple insertion attempts were required to place 315 (23%) PIVs. No PIVs were inserted with ultrasound, as this is rarely used in this hospital. The flushing policy was for the administration of 9% sodium chloride every 8 hours if no IV medications or fluids were ordered. Table 2 contains further details of device-related characteristics. Although the hospital policy was for catheter removal by 72 hours, dwell time ranged from <1 to 14 days, with an average of 2.4 days.
PIV Complications
Catheter failure (any cause) occurred in 512 (32%) catheters, which is a failure rate of 136 per 1000 catheter days (95% CI, 125-148). A total of 346 patients out of 1000 (35%) had at least 1 failed PIV during the study. Failures were 267 phlebitis (17%), 228 occlusion/infiltration (14%), and/or 154 dislodgement (10%; Figure), with some PIVs exhibiting multiple concurrent complications (Table 2).
Multivariable AnalysisOcclusion/Infiltration
The multivariable analysis (Table 3) showed occlusion or infiltration was statistically significantly associated with female patients (hazard ratio [HR], 1.48; 95% CI, 1.10-2.00), with a 22-gauge catheter (HR, 1.43; 95% CI, 1.02-2.00), IV flucloxacillin (HR, 1.98; 95% CI, 1.19-3.31), and with frequent PIV access (HR, 1.12; 95% CI, 1.04-1.21; ie, with each increase of 1 in the mean medications/fluids administrations per day, relative PIV failure increased 112%). Less occlusion and infiltration were statistically significantly associated with securement by using additional nonsterile tape (HR, 0.46; 95% CI, 0.33-0.63), elasticized tubular bandages (HR, 0.49; 95% CI, 0.35-0.70 ), or other types of additional securement for the PIV (HR, 0.35; 95% CI, 0.26-0.47).
Phlebitis
Phlebitis was statistically significantly associated with female patients (HR, 1.81; 95% CI, 1.40-2.35), bruising at the insertion site (HR, 2.16; 95% CI, 1.26-3.71), insertion in patients’ dominant side (HR, 1.39; 95% CI, 1.09-1.77), IV flucloxicillin (HR, 2.01; 95% CI, 1.26-3.21), or with frequent PIV access (HR, 1.14; 95% CI, 1.08-1.21). Older age, (HR, 0.99; 95% CI, 0.98-0.99; ie, each year older was associated with 1% less phlebitis), securement with additional nonsterile tape (HR, 0.63; 95% CI, 0.48-0.82) or with any other additional securement (HR, 0.53; 95% CI, 0.39-0.70), or the administration of IV cephazolin (HR, 0.63; 95% CI, 0.44-0.89) were associated with lower phlebitis risk.
Dislodgement
Statistically significant predictors associated with an increased risk of PIV dislodgement included paramedic insertion (HR, 1.78; 95% CI, 1.03-3.06) and frequent PIV access (HR, 1.11; 95% CI, 1.03-1.20). A decreased risk was associated with the additional securement of the PIV, including nonsterile tape (HR, 0.44; 95% CI, 0.31-0.63) or other forms of additional securement (HR, 0.32; 95% CI, 0.22-0.46).
DISCUSSION
One in 3 PIVs failed in this study, with phlebitis as the most common cause of PIV failure. The 17% phlebitis rate reflected clinician-reported phlebitis or phlebitis observed by research staff using a 1-criteria definition because any sign or symptom can trigger PIV removal (eg, pain), even if other signs or symptoms are not present. Reported phlebitis rates are lower if definitions require 2 signs or symptoms.4,6 With over 71 different phlebitis assessment scales in use, and none well validated, the best method for diagnosing phlebitis remains unclear and explains the variation in reported rates.25 Occlusion/infiltration and dislodgement were also highly prevalent forms of PIV failure at 14% and 10%, respectively. Occlusion and infiltration were combined because clinical staff use these terms interchangeably, and differential diagnostic tools are not used in practice. Both result in the same outcome (therapy interruption and PIV removal), and this combination of outcomes has been used previously.23 No PIV-associated bloodstream infections occurred, despite the heightened awareness of these infections in the literature.3
Females had significantly more occlusion/infiltration and phlebitis than males, in keeping with previous studies.7,9,10 This could be because of females’ smaller vein caliber, although the effect remained after adjustment for PIV gauge.7,26 The effect of aging on vascular endothelium and structural integrity may explain the observed decrease in phlebitis of 1% with each older year of age.27 However, gender and age effects could be explained by psychosocial factors (eg, older people may be less likely to admit pain, or we may question them less sympathetically), but, regardless, women and younger patients should be monitored more closely.
We found 22-gauge catheters were more likely to fail from occlusion/infiltration than other sizes. This confirms similar findings from Abolfotouh et al.9 PIV gauge selection for this study was made at the inserter’s discretion and may be confounded by smaller vein size, which was not measured. In addition, risk may be because of smaller gauge alone or also more influenced by the shorter length of the studied 22-gauge (25 mm) than the <20-gauge catheters (30 mm). These results question international guidelines, which currently recommend the smallest gauge peripheral catheter possible,28,29 and randomized trials are needed. Although practice varies between inserters, some preferentially cannulate the nondominant limb. We are not aware of previous studies on this practice; however, our results support this approach.
Flucloxacillin was associated with a 2-fold increase in occlusion/infiltration and phlebitis. Although multiple studies have reported IV medications9,11 and IV antibiotics10,30,31 as risk factors for PIV failure, none have identified flucloxacillin as an independent risk factor. IV flucloxacillin is recommended for reconstitution as 1 g in 15 mL to 20 mL of sterile water, and injection over 3 to 4 minutes, although this may not be adhered to in practice. Alternative administration regimes or improved adherence to current policy may be needed. An exception to the relationship between IV antibiotics and catheter failure was IV cephazolin, associated with 40% relatively less phlebitis. This may be a spurious finding because the administration, pH, and osmolality of cephazolin are similar to other IV antibiotics.
The more PIVs that were accessed per day, whether for infusions or medications, the more failure occurred from occlusion/infiltration, phlebitis, and dislodgement. This suggests that peripheral veins are easily damaged and/or inflamed by the influx of fluids or medications. Lower injection pressures or the timely transfer to oral medications may limit this problem. Flushing regimens may also assist because practice varies greatly, and questions on whether slow continuous flush infusion or intermittent manual flushing are more vein-protective, and the optimal flush volume, frequency, and technique (eg, pulsatile) remain.32,33 Manual handling for frequent access may loosen dressings and securement, thus explaining the observed association between frequent access and catheter dislodgement. Finally, the association between use and failure may indicate that many of these patients were not suitable for a PIV, and different approaches (eg, ultrasound-guided insertion) or a midline may have been a superior option. There is growing emphasis on the need for better preinsertion assessment and selection of the most appropriate device for the patient and the IV treatment required.34
Suboptimal dressings or securements are not unusual in hospitals.35 Despite our policy of PIV securement with bordered transparent dressings, we found 4 dressing types in use. In addition, we found almost 50% of PIVs had an additional (secondary) securement, and this was associated with significantly less PIV failure of all 3 types. This suggests that 1 or more of nonsterile tape, elasticized tubular bandages, or other securement (eg, bandage or second transparent dressing) can reduce PIV failure, although a randomized trial is lacking.36 Whether the dressing was failing and required reinforcement or hospital staff lacked confidence in the dressing and placed additional securement preventatively is unclear. Both PIV failure and PIV dressing failure are common, and further research into superior PIV products and practices is urgently needed. Paramedic insertions had a higher risk of dislodgement, suggesting that the increased emphasis on securement should start in the prehospital setting.
While multiple or difficult insertion attempts were not associated with PIV failure, insertions were not directly observed, and clinicians may have underreported attempts. In contrast, insertion-related bruising (a surrogate for difficult insertion) was associated with more than double the incidence of phlebitis. The long-term implications of multiple insertion attempts on patient’s vasculature are unclear, but we believe first time PIV insertion is important to patients and of interest to clinicians. A recent systematic review of strategies associated with first attempt PIV insertion success in an emergency department found little evidence for effective strategies and recommended further research.37
The overall PIV failure rate in our study was 32%, lower than the 35% to 40% failure observed in our previous randomized controlled trials, which had more stringent inclusion and exclusion criteria (eg, longer predicted duration of therapy).6,38 The implications for patients and costs to the organization of frequent catheter replacement demonstrate urgent need for further research in this area of practice.39 A strength of this study is that all PIVs, regardless of the expected length of dwell time or reason for insertion, were eligible for inclusion, providing more generalizable results. The PIV failure rate of 32% is concerning because these failures trigger treatment delays and replacement insertions, with significant increased labor and equipment costs. The mean cost of PIV replacement has been costed at AUD $69.30 or US $51.92 (as per 2010 $ value) per episode of IV treatment.40 For our hospital, which uses 200,000 PIVs per year, the current level of PIV failure suggests almost AU $5.5 (US $4.1) million in waste annually at this site alone.
The additional strengths of this study include the extensive information collected prospectively about PIV insertion and maintenance, including information on who inserted the PIV, IV medications administered, and PIV dressings used. Limitations were the population of surgical and medical patients in 1 tertiary hospital, which may not be generalizable to other settings.
CONCLUSION
Our study confirms the high rate of catheter failure in acute care hospitals, validates existing evidence related to PIV failure, and identifies new, potentially modifiable risk factors to improve PIV insertion and management. Implications for future research were also identified.
Acknowledgments
The researchers acknowledge and thank the nurses and patients involved in this study. The authors would also like to acknowledge Becton Dickinson for partly funding this study in the form of an unrestricted grant-in-aid paid to Griffith University. Becton Dickinson did not design the study protocol, collect or analyze data, and did not prepare or review the manuscript.
Disclosure
On behalf of NM and CMR, Griffith University has received unrestricted educational and research grants and consultancy payment for lectures from 3M and Becton Dickinson. On behalf of NM, MC, and CMR, Griffith University has received unrestricted investigator-initiated research grants from Centurion Medical Products and Entrotech Lifesciences (manufacturers of PIV dressings) and Becton Dickinson (manufacturer of PIVs). On behalf of MC, Griffith University has received a consultancy payment to develop education material from Baxter. On behalf of CMR, Griffith University has received unrestricted donations or investigator initiated research grants unrelated to this research from Adhezion, Angiodynamics, Baxter, Carefusion, Cook Medical, Hospira, Mayo, Smiths Medical, and Vygon. On behalf of CMR, Griffith University has received consultancy payments for educational lectures or professional opinion from B. Braun, Bard, Carefusion, Mayo, ResQDevices, and Smiths Medical. On behalf of EL, Griffith University has received consultancy payments for educational lecture from 3M. On behalf of MC, Griffith University has received a consultancy payment to develop education material from Baxter. As this was an observational study, no products were trialed in this study. JW and GM have no conflicts of interest.
1
2
3
4
5
6
7
8
9
1
1
1
1
1
1
1
1
1
1
2
2
2
2
2
2
2
2
2
2
3
3
3
33. Schreiber S, Zanchi C, Ronfani L, et al. Normal saline flushes performed once
daily maintain peripheral intravenous catheter patency: a randomised controlled
trial. Arch Dis Child. 2015;100(7):700-703. PubMed
34. Chopra V, Flanders SA, Saint S, et al. The Michigan Appropriateness Guide
for Intravenous Catheters (MAGIC): results from a multispecialty panel using
the RAND/UCLA appropriateness method. Ann Intern Med. 2015;163(6 Suppl):
S1-S40. PubMed
35. New KA, Webster J, Marsh NM, Hewer B. Intravascular device use, management,
documentation and complications: a point prevalence survey. Aust Health Rev.
2014;38(3):345-349. PubMed
36. Marsh N, Webster J, Mihala G, Rickard C. Devices and dressings to secure peripheral
venous catheters to prevent complications. Cochrane Database Syst Rev.
2015(6):CD11070. PubMed
37. Parker SI, Benzies KM, Hayden KA, Lang ES. Effectiveness of interventions for
adult peripheral intravenous catheterization: A systematic review and meta-analysis
of randomized controlled trials. Int Emerg Nurs. 2016;31:15-21. PubMed
38. Webster J, Lloyd S, Hopkins T, Osborne S, Yaxley M. Developing a Research base
for Intravenous Peripheral cannula re-sites (DRIP trial). A randomised controlled
trial of hospital in-patients. Int J Nurs Stud. 2007;44(5):664-671. PubMed
39. Helm RE, Klausner JD, Klemperer JD, Flint LM, Huang E. Accepted but unacceptable:
peripheral IV catheter failure. J Infus Nurs. 2015;38(3):189-203. PubMed
40. Tuffaha HW, Rickard CM, Webster J, et al. Cost-effectiveness analysis of clinically
indicated versus routine replacement of peripheral intravenous catheters. Appl
Health Econ Health Policy. 2014;12(1):51-58. PubMed
1
2
3
4
5
6
7
8
9
1
1
1
1
1
1
1
1
1
1
2
2
2
2
2
2
2
2
2
2
3
3
3
33. Schreiber S, Zanchi C, Ronfani L, et al. Normal saline flushes performed once
daily maintain peripheral intravenous catheter patency: a randomised controlled
trial. Arch Dis Child. 2015;100(7):700-703. PubMed
34. Chopra V, Flanders SA, Saint S, et al. The Michigan Appropriateness Guide
for Intravenous Catheters (MAGIC): results from a multispecialty panel using
the RAND/UCLA appropriateness method. Ann Intern Med. 2015;163(6 Suppl):
S1-S40. PubMed
35. New KA, Webster J, Marsh NM, Hewer B. Intravascular device use, management,
documentation and complications: a point prevalence survey. Aust Health Rev.
2014;38(3):345-349. PubMed
36. Marsh N, Webster J, Mihala G, Rickard C. Devices and dressings to secure peripheral
venous catheters to prevent complications. Cochrane Database Syst Rev.
2015(6):CD11070. PubMed
37. Parker SI, Benzies KM, Hayden KA, Lang ES. Effectiveness of interventions for
adult peripheral intravenous catheterization: A systematic review and meta-analysis
of randomized controlled trials. Int Emerg Nurs. 2016;31:15-21. PubMed
38. Webster J, Lloyd S, Hopkins T, Osborne S, Yaxley M. Developing a Research base
for Intravenous Peripheral cannula re-sites (DRIP trial). A randomised controlled
trial of hospital in-patients. Int J Nurs Stud. 2007;44(5):664-671. PubMed
39. Helm RE, Klausner JD, Klemperer JD, Flint LM, Huang E. Accepted but unacceptable:
peripheral IV catheter failure. J Infus Nurs. 2015;38(3):189-203. PubMed
40. Tuffaha HW, Rickard CM, Webster J, et al. Cost-effectiveness analysis of clinically
indicated versus routine replacement of peripheral intravenous catheters. Appl
Health Econ Health Policy. 2014;12(1):51-58. PubMed
© 2017 Society of Hospital Medicine
Derivation of a Clinical Model to Predict Unchanged Inpatient Echocardiograms
Transthoracic echocardiography (TTE) is one of the most commonly ordered diagnostic tests in healthcare. Studies of Medicare beneficiaries, for example, have shown that each year, approximately 20% undergo at least 1 TTE, including 4% who have 2 or more.1 TTE utilization rates increased dramatically in the 1990s and early 2000s. Between 1999 and 2008, for example, the rate of use of TTE per Medicare beneficiary nearly doubled.2 In 2014, echocardiography accounted for 10% of all Medicare spending for imaging services, or approximately $930 million.3 In response to concerns about the possible unnecessary use of TTE, the American Heart Association and American Society of Echocardiography developed Appropriate Use Criteria (AUC) in 2007 and 2011, which describe appropriate versus inappropriate indications for TTE.4 Subsequent studies have shown that rather than rooting out inappropriate studies, the vast majority of ordered studies appear to be appropriate according to the AUC criteria.5 The AUC criteria have also been criticized for being based on expert opinion rather than clinical evidence.6 Repeat TTE, defined as TTE done within 1 year of a prior TTE, represents 24% to 42% of all studies,7-9 and 31% of all Medicare beneficiaries who have a TTE get a repeat TTE within 1 year.10 In the present study, we reviewed all inpatient TTE performed over 1 year and described the group that have had a prior TTE within the past year (“repeat TTE”). We then derived a clinical prediction model to predict unchanged repeat TTE, with the goal of defining a subset of studies that are potentially unnecessary.
METHODS
The West Haven Connecticut Veteran’s Administration Hospital (WHVA), located outside New Haven, Connecticut, is a 228-bed tertiary care center affiliated with Yale University School of Medicine. Potential subjects were identified from review of the electronic medical records of all inpatients who had an inpatient echocardiogram between October 1, 2013, and September 30, 2014. Patient’s records were reviewed by using a standardized data extraction form for demographics, comorbidity, cardiovascular risk factors, service ordering the TTE, intensive care unit (ICU) location, prior TTE abnormalities, TTE indication, AUC category, time between TTEs, technical quality of TTE, electrocardiogram (ECG) abnormalities, history of intervening acute coronary syndrome, cardiac surgery, and revascularization. Candidate predictors included any variables suspected by the authors as being potentially associated with the primary outcome of changed repeat TTE. All patients who had an inpatient TTE and a prior TTE within the Veterans Affairs (VA) system within the past year were included in the study. Repeat studies from the same admission were only counted as 1 TTE and patients had to have had a prior TTE from a different admission or a prior outpatient TTE to be included. Patients who did not have a prior TTE within the past year or who had only a transesophageal echocardiogram or stress echocardiography were excluded. Suboptimal studies were included but noted as limited quality. The study was approved by the WHVA Institutional Review Board. The Transparent Reporting of a Multivariable Prediction Model for Individual Prognosis or Diagnosis statement was used in planning and reporting this study.11
TTEs were classified as normal, mildly abnormal, or with a major abnormality based on previously published definitions.12-14 Any abnormality was defined as any left ventricle (LV) dysfunction (left ventricular ejection fraction [LVEF] <55%), any aortic or mitral valve stenosis, any regional wall motion abnormality, any right ventricular dysfunction, any pulmonary hypertension, mild or greater valvular regurgitation, any diastolic dysfunction, moderate or greater pericardial effusion, any ventricular hypertrophy, or any other significant abnormality including thrombus, vegetation, or tamponade. Major abnormality was defined as moderate or greater LV dysfunction (LVEF <45%), moderate or greater valvular regurgitation, moderate or greater valvular stenosis (aortic or mitral valve area <1.5 cm²), any regional wall motion abnormality, right ventricular dysfunction, moderate or greater pulmonary hypertension, moderate or greater diastolic dysfunction, moderate or greater pericardial effusion, or any other major abnormality including thrombus, vegetation, tumor, or tamponade. Repeat TTEs were classified as changed or unchanged. Changed TTEs were divided into any new abnormality or improvement or a new major abnormality or improvement. Any new abnormality or improvement was defined as any new TTE abnormality that had not previously been described or in which there was a change of at least 1 severity grade from a prior TTE, including improvement by 1 grade. A new major TTE abnormality or improvement was defined as any new major TTE abnormality that had previously been normal, or if there had been a prior abnormality, a change in at least 1 severity grade for LVEF or 2 severity grades for abnormal valvular, pericardial, or prior pulmonary hypertension, including improvement by 2 severity grades. A change from mild to moderate mitral regurgitation therefore was classified as a nonmajor change, whereas a change from mild to severe was classified as major. All TTE classifications were based on the electronic TTE reports and were reviewed by 2 independent investigators (CG and JC) blinded to the patients’ other clinical characteristics. For TTE studies in which the investigators agreed, that determination was the final classification. Disagreements were reviewed and the final classification was determined by consensus.
In an analogous manner, ECGs were classified as normal, mildly abnormal, or with a major abnormality based on previous definitions in the literature.15 Major abnormality was defined as atrial fibrillation or flutter, high-degree atrioventricular blocks, left bundle-branch block, right bundle-branch block, indeterminate conduction delay, q-wave myocardial infarction, isolated ischemic abnormalities, left ventricular hypertrophy with ST-T abnormalities, other arrhythmias including supraventricular tachycardia (SVT) or ventricular tachycardia (VT), low voltage (peak-to-peak QRS amplitude of <5 mm in the limb leads and/or <10 mm in the precordial leads), paced rhythm, sinus tachycardia (heart rate [HR] >100) or bradycardia (HR <50). Mild ECG abnormality was defined as low-grade atrioventricular blocks, borderline prolonged ventricular excitation, prolonged ventricular repolarization, isolated minor Q and ST-T abnormalities, left ventricular hypertrophy without ST-T abnormalities, left atrial enlargement, atrial or ventricular premature beats, or fascicular blocks. New major ECG abnormalities were any of the listed major ECG abnormalities that were not present on ECGs prior to the admission during which the repeat TTE was performed.
Other study definitions included intervening acute myocardial infarction (AMI), which was defined by any intervening history of elevated troponins, regardless of symptoms or ECG changes and including demand ischemia. Chronic kidney disease (CKD) was defined as an abnormal serum creatinine on 2 or more occasions 3 months apart. Active cancer was defined as receiving chemotherapy or palliative care for advanced cancer. Valvular heart disease was defined as prior moderate or severe valvular stenosis or regurgitation.
For analysis, we first compared patients with repeat TTE with major changes with those without major changes. For comparison of dichotomous variables, χ2 or Fisher exact tests were used. For continuous variables, Student t test or the Mann-Whitney U test were performed. Because many of the frequencies of individual AUC criteria were small, related AUC criteria were grouped for analysis as grouped by the tables of the American College of Cardiology Foundation Appropriate Use Criteria Task Force, American Society of Echocardiography, American Heart Association, American Society of Nuclear Cardiology, Heart Failure Society of America, Heart Rhythm Society, Society for Cardiovascular Angiography and Interventions, Society of Critical Care Medicine, Society of Cardiovascular Computed Tomography, and Society for Cardiovascular Magnetic Resonance (ACCF/ASE/AHA) Guideline.4 Criteria groupings that were significantly less likely to have major TTE changes on analysis were classified as low risk and criteria that were significantly more likely were classified as high risk. Criteria groupings that were not significantly associated with TTE change were classified as average risk. All variables with P values less than 0.05 on bivariate analysis were then entered into a multivariate logistic regression analysis with major TTE change as the dependent variable, using backward stepwise variable selection with entry and exit criteria of P < 0.05 and P > 0.10, respectively. Scores were derived by converting the regression coefficients of independently predictive variables in the logistic regression model into corresponding integers. A total score was calculated for each patient by summing up the points for each independently significant variable. Model performance was described by calculating a C statistic by creation of a receiver operating characteristic curve to assess discrimination, and by performing the Hosmer and Lemeshow test to assess calibration. Internal validation was assessed by calculating the C statistic using the statistical method of bootstrapping in which the data were resampled multiple times (n = 200) and the average resultant C statistic reported. The bootstrap analysis was performed using R version 3.1 (R Foundation for Statistical Computing, Vienna, Austria). All other analyses were performed using SPSS version 21.0 (IBM, Armonk, New York). P values <0.05 were considered significant.
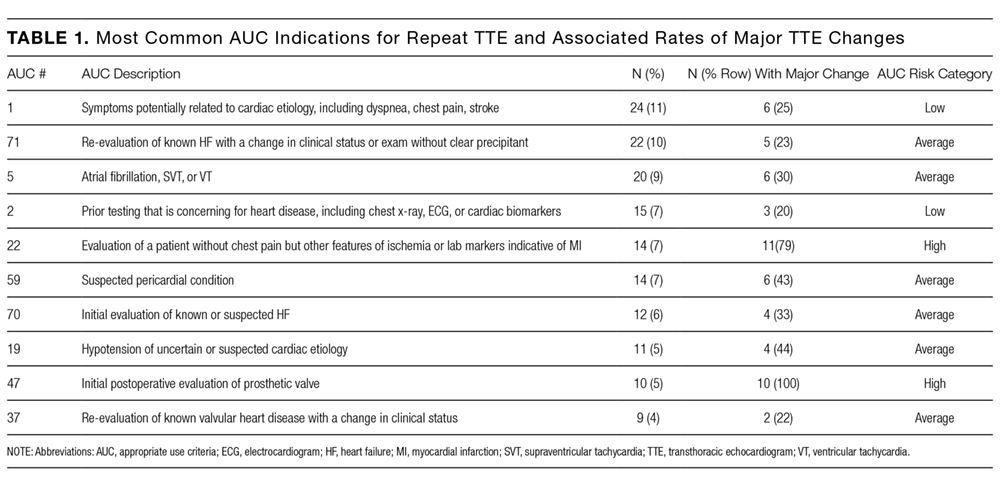
RESULTS
During the 1-year study period, there were 3944 medical/surgical admissions for 3266 patients and 845 inpatient TTEs obtained on 601 patients. Of all patients who were admitted, 601/3266 (18.4%) had at least 1 inpatient TTE. Of these 601 TTEs, 211 (35%) had a TTE within the VA system during the prior year. Of the 211 repeat TTEs, 67 (32%) were unchanged, 66 (31%) had minor changes, and 78 (37%) had major changes. The kappa statistic for agreement between extractors for “major TTE change” was 0.91, P < 0.001. The 10 most common AUC indications for TTE, which accounted for 72% of all studies, are listed in Table 1. The initial AUCs assigned by reviewers were the same in 187 of 211 TTEs (kappa 0.86, P < 0.001). Most indications were not associated with TTE outcome, although studies ordered for AUC indications 1 and 2 were less likely be associated with major changes and AUC indications 22 and 47 were more likely to be associated with major changes. Table 2 shows the comparison of the 78 patients that had repeat TTE with major changes compared with the 133 patients that did not. Nine variables were significantly different between the 2 groups; repeat TTEs with major changes were more likely to have dementia, be ordered by the surgery service, be located in an ICU, have major new ECG changes, have had prior valvular heart disease, have had an intervening AMI or cardiac surgery, or be in a high-risk AUC category. Patients with CKD were less likely to have major changes. Table 3 shows the results of the multivariate analysis; CKD, intervening AMI, prior valvular heart disease, major new ECG changes, and intervening cardiac surgery all independently predicted major changes on repeat TTE. Based on the β-coefficient for each variable, a point system was assigned to each variable and a total score calculated for each patient. Most variables had β-coefficients close to 1 and were therefore assigned a score of 1. CKD was associated with a lower risk of major TTE abnormality and was assigned a negative score. Intervening AMI was associated with a β-coefficient of 2.2 and was assigned a score of 2. Based on the points assigned to each variable and its presence or absence for each patient, a total score, which we named the CAVES score, was calculated. The acronym CAVES stands for CKD, AMI, valvular disease, ECG changes, and surgery (cardiac). Table 4 shows the frequencies of each score for each patient, ranging from patients with CKD and no other risk factors who scored −1 to patients without CKD who had all 4 of the other variables who scored 5. The prevalence of major TTE change for the full cohort was 37%. For the group with a CAVES score of −1, the probability was only 5.6%; for the group with a score of 0, the probability was 17.7%; and for the group with a score ≥1, the probability was 55.3%.
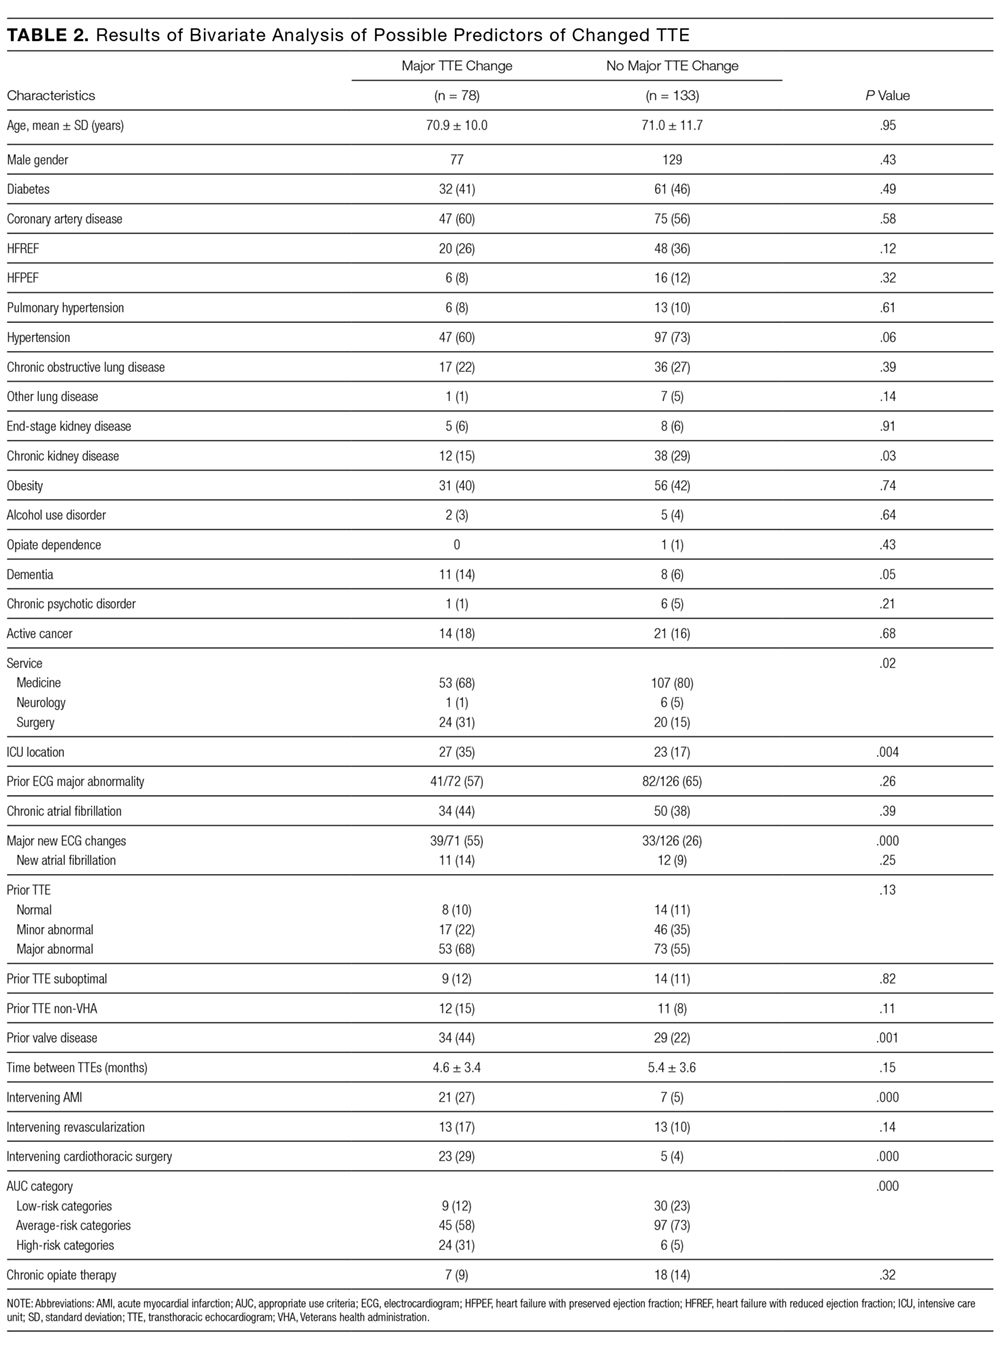
The bootstrap corrected C statistic for the model was 0.78 (95% confidence interval, 0.72-0.85), indicating good discrimination. The Hosmer and Lemeshow test showed nonsignificance, indicating good calibration (χ2 = 5.20, df = 6, P = 0.52).
DISCUSSION
In this retrospective study, we found that approximately 18% of all patients admitted to the hospital had an inpatient TTE performed, and that approximately 35% of this group had a prior TTE within the past year. Of the group with prior TTEs within the past year, 37% had a major new change and 63% had either minor or no changes. Prior studies have reported similar high rates of repeat TTE7-9 and of major changes on repeat TTE.8,14,16 On multivariate analysis, we found that 5 variables were independent predictors of new changes on TTE—absence of CKD, intervening AMI, intervening cardiac surgery, history of valvular heart disease, and major new ECG changes. We developed and internally validated a risk score based on these 5 variables, which was found to have good overall accuracy as measured by the bootstrap corrected C statistic. The simplified version of the score divides patients into low, intermediate, and high risk for major changes on TTE. The low-risk group, defined as the group with no risk factors, had an approximately 6% risk of a major TTE change; the intermediate risk group, defined as a score of 0, had an 18% risk of major TTE change; and the high-risk group, defined as a score of 1 or greater, had a 55% chance of major TTE change. We believe that this risk score, if further validated, will potentially allow hospital-based clinicians to estimate the chance of a major change on TTE prior to ordering the study. For the low-risk group, this may indicate that the study is unnecessary. Conversely, for patients at high risk, this may offer further evidence that it will be useful to obtain a repeat TTE.
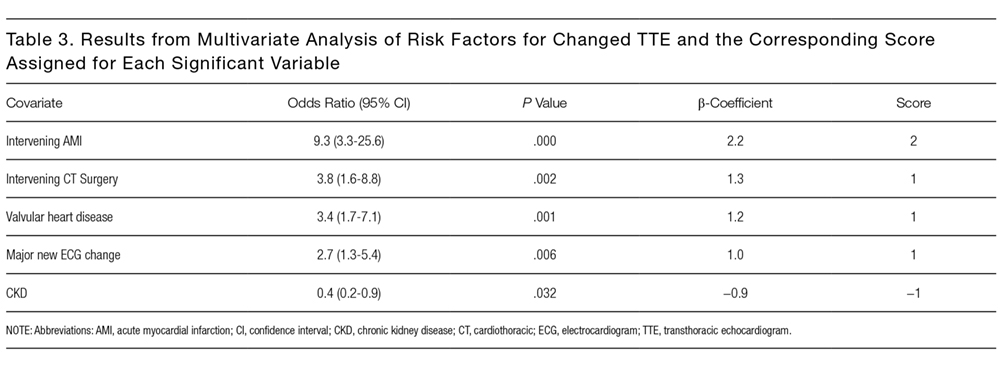
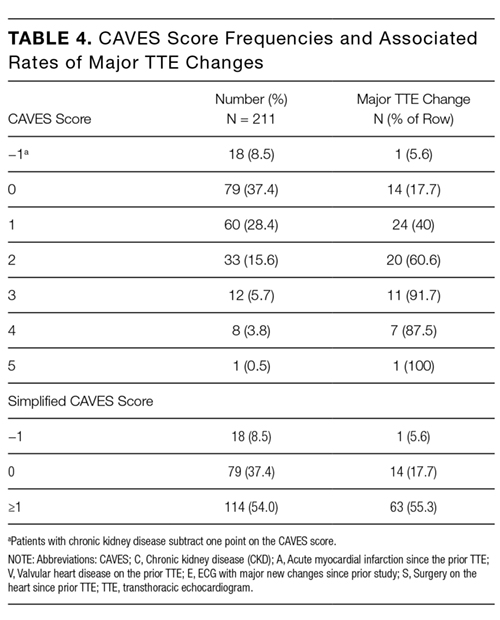
In summary, we have developed a simple score to predict the likelihood of major changes on repeat TTEs for hospitalized patients. The CAVES score identified 8.5% of patients as being low risk for changed repeat TTE, 37% at intermediate risk, and 54% at high risk for major changes. We believe that the CAVES score, if further validated, may be used to risk stratify patients for ordering TTE and to potentially avoid unnecessary repeat studies.
Disclosure
The authors indicated no conflicts of interest.
1. Virnig BA, Shippee SN, O’Donnell B, Zeglin J, Parashuram S. Data point 20: echocardiography trends. In Trends in the Use of Echocardiography, 2007 to 2011. Rockville, MD: Agency for Healthcare Research and Quality; 2014. p 1-21. PubMed
2. Andrus BW, Welch HG. Medicare services provided by cardiologists in the United States: 1999-2008. Circ Cardiovasc Qual Outcomes. 2012;5(1):31-36. PubMed
3. Report to the Congress: Medicare Payment Policy. 2016; 105. http://www.medpac.gov/docs/default-source/data-book/june-2016-data-book-section-7-ambulatory-care.pdf?sfvrsn=0. Accessed on August 14, 2017.
4. American College of Cardiology Foundation Appropriate Use Criteria Task Force, American Society of Echocardiography, American Heart Association, et al. ACCF/ASE/AHA/ASNC/HFSA/HRS/SCAI/SCCM/SCCT/SCMR 2011 Appropriate use criteria for echocardiography. A report of the American College of Cardiology Foundation Appropriate Use Criteria Task Force, American Society of Echocardiography, American Heart Association, American Society of Nuclear Cardiology, Heart Failure Society of America, Heart Rhythm Society, Society for Cardiovascular Angiography and Interventions, Society of Critical Care Medicine, Society of Cardiovascular Computed Tomography, and Society for Cardiovascular Magnetic Resonance Endorsed by the American College of Chest Physicians. J Am Coll Cardiol. 2011;57(9):1126-1166. PubMed
5. Matulevicius SA, Rohatgi A, Das SR, Price AL, DeLuna A, Reimold SC. Appropriate use and clinical impact of transthoracic echocardiography. JAMA Intern Med. 2013;173(17):1600-1607. PubMed
6. Ioannidis JP. Appropriate vs clinically useful diagnostic tests. JAMA Intern Med. 2013;173(17):1607-1609. PubMed
7. Ghatak A, Pullatt R, Vyse S, Silverman DI. Appropriateness criteria are an imprecise measure for repeat echocardiograms. Echocardiography. 2011;28(2):131-135. PubMed
8. Koshy TP, Rohatgi A, Das SR, et al. The association of abnormal findings on transthoracic echocardiography with 2011 Appropriate Use Criteria and clinical impact. Int J Cardiovasc Imaging. 2015;31(3):521-528. PubMed
9. Bhatia RS, Carne DM, Picard MH, Weiner RB. Comparison of the 2007 and 2011 appropriate use criteria for transesophageal echocardiography. J Am Soc Echocardiogr. 2012;25(11):1170-1175. PubMed
10. Welch HG, Hayes KJ, Frost C. Repeat testing among Medicare beneficiaries. Arch Intern Med. 2012;172(22):1745-1751. PubMed
11. Collins GS, Reitsma JB, Altman DG, Moons KG. Transparent Reporting of a multivariable prediction model for Individual Prognosis Or Diagnosis (TRIPOD). Ann Intern Med. 2015;162(10):735-736. PubMed
12. Ward RP, Mansour IN, Lemieux N, Gera N, Mehta R, Lang RM. Prospective evaluation of the clinical application of the American College of Cardiology Foundation/American Society of Echocardiography Appropriateness Criteria for transthoracic echocardiography. JACC Cardiovasc Imaging. 2008;1(5):663-671. PubMed
13. Bhatia RS, Carne DM, Picard MH, Weiner RB. Comparison of the 2007 and 2011 appropriate use criteria for transthoracic echocardiography in various clinical settings. J Am Soc Echocardiogr. 2012;25(11):1162-1169. PubMed
14. Mansour IN, Razi RR, Bhave NM, Ward RP. Comparison of the updated 2011 appropriate use criteria for echocardiography to the original criteria for transthoracic, transesophageal, and stress echocardiography. J Am Soc Echocardiogr. 2012;25(11):1153-1161. PubMed
15. Denes P, Larson JC, Lloyd-Jones DM, Prineas RJ, Greenland P. Major and minor ECG abnormalities in asymptomatic women and risk of cardiovascular events and mortality. JAMA. 2007;297(9):978-985. PubMed
16. Kirkpatrick JN, Ky B, Rahmouni HW, et al. Application of appropriateness criteria in outpatient transthoracic echocardiography. J Am Soc Echocardiogr. 2009;22(1):53-59. PubMed
Transthoracic echocardiography (TTE) is one of the most commonly ordered diagnostic tests in healthcare. Studies of Medicare beneficiaries, for example, have shown that each year, approximately 20% undergo at least 1 TTE, including 4% who have 2 or more.1 TTE utilization rates increased dramatically in the 1990s and early 2000s. Between 1999 and 2008, for example, the rate of use of TTE per Medicare beneficiary nearly doubled.2 In 2014, echocardiography accounted for 10% of all Medicare spending for imaging services, or approximately $930 million.3 In response to concerns about the possible unnecessary use of TTE, the American Heart Association and American Society of Echocardiography developed Appropriate Use Criteria (AUC) in 2007 and 2011, which describe appropriate versus inappropriate indications for TTE.4 Subsequent studies have shown that rather than rooting out inappropriate studies, the vast majority of ordered studies appear to be appropriate according to the AUC criteria.5 The AUC criteria have also been criticized for being based on expert opinion rather than clinical evidence.6 Repeat TTE, defined as TTE done within 1 year of a prior TTE, represents 24% to 42% of all studies,7-9 and 31% of all Medicare beneficiaries who have a TTE get a repeat TTE within 1 year.10 In the present study, we reviewed all inpatient TTE performed over 1 year and described the group that have had a prior TTE within the past year (“repeat TTE”). We then derived a clinical prediction model to predict unchanged repeat TTE, with the goal of defining a subset of studies that are potentially unnecessary.
METHODS
The West Haven Connecticut Veteran’s Administration Hospital (WHVA), located outside New Haven, Connecticut, is a 228-bed tertiary care center affiliated with Yale University School of Medicine. Potential subjects were identified from review of the electronic medical records of all inpatients who had an inpatient echocardiogram between October 1, 2013, and September 30, 2014. Patient’s records were reviewed by using a standardized data extraction form for demographics, comorbidity, cardiovascular risk factors, service ordering the TTE, intensive care unit (ICU) location, prior TTE abnormalities, TTE indication, AUC category, time between TTEs, technical quality of TTE, electrocardiogram (ECG) abnormalities, history of intervening acute coronary syndrome, cardiac surgery, and revascularization. Candidate predictors included any variables suspected by the authors as being potentially associated with the primary outcome of changed repeat TTE. All patients who had an inpatient TTE and a prior TTE within the Veterans Affairs (VA) system within the past year were included in the study. Repeat studies from the same admission were only counted as 1 TTE and patients had to have had a prior TTE from a different admission or a prior outpatient TTE to be included. Patients who did not have a prior TTE within the past year or who had only a transesophageal echocardiogram or stress echocardiography were excluded. Suboptimal studies were included but noted as limited quality. The study was approved by the WHVA Institutional Review Board. The Transparent Reporting of a Multivariable Prediction Model for Individual Prognosis or Diagnosis statement was used in planning and reporting this study.11
TTEs were classified as normal, mildly abnormal, or with a major abnormality based on previously published definitions.12-14 Any abnormality was defined as any left ventricle (LV) dysfunction (left ventricular ejection fraction [LVEF] <55%), any aortic or mitral valve stenosis, any regional wall motion abnormality, any right ventricular dysfunction, any pulmonary hypertension, mild or greater valvular regurgitation, any diastolic dysfunction, moderate or greater pericardial effusion, any ventricular hypertrophy, or any other significant abnormality including thrombus, vegetation, or tamponade. Major abnormality was defined as moderate or greater LV dysfunction (LVEF <45%), moderate or greater valvular regurgitation, moderate or greater valvular stenosis (aortic or mitral valve area <1.5 cm²), any regional wall motion abnormality, right ventricular dysfunction, moderate or greater pulmonary hypertension, moderate or greater diastolic dysfunction, moderate or greater pericardial effusion, or any other major abnormality including thrombus, vegetation, tumor, or tamponade. Repeat TTEs were classified as changed or unchanged. Changed TTEs were divided into any new abnormality or improvement or a new major abnormality or improvement. Any new abnormality or improvement was defined as any new TTE abnormality that had not previously been described or in which there was a change of at least 1 severity grade from a prior TTE, including improvement by 1 grade. A new major TTE abnormality or improvement was defined as any new major TTE abnormality that had previously been normal, or if there had been a prior abnormality, a change in at least 1 severity grade for LVEF or 2 severity grades for abnormal valvular, pericardial, or prior pulmonary hypertension, including improvement by 2 severity grades. A change from mild to moderate mitral regurgitation therefore was classified as a nonmajor change, whereas a change from mild to severe was classified as major. All TTE classifications were based on the electronic TTE reports and were reviewed by 2 independent investigators (CG and JC) blinded to the patients’ other clinical characteristics. For TTE studies in which the investigators agreed, that determination was the final classification. Disagreements were reviewed and the final classification was determined by consensus.
In an analogous manner, ECGs were classified as normal, mildly abnormal, or with a major abnormality based on previous definitions in the literature.15 Major abnormality was defined as atrial fibrillation or flutter, high-degree atrioventricular blocks, left bundle-branch block, right bundle-branch block, indeterminate conduction delay, q-wave myocardial infarction, isolated ischemic abnormalities, left ventricular hypertrophy with ST-T abnormalities, other arrhythmias including supraventricular tachycardia (SVT) or ventricular tachycardia (VT), low voltage (peak-to-peak QRS amplitude of <5 mm in the limb leads and/or <10 mm in the precordial leads), paced rhythm, sinus tachycardia (heart rate [HR] >100) or bradycardia (HR <50). Mild ECG abnormality was defined as low-grade atrioventricular blocks, borderline prolonged ventricular excitation, prolonged ventricular repolarization, isolated minor Q and ST-T abnormalities, left ventricular hypertrophy without ST-T abnormalities, left atrial enlargement, atrial or ventricular premature beats, or fascicular blocks. New major ECG abnormalities were any of the listed major ECG abnormalities that were not present on ECGs prior to the admission during which the repeat TTE was performed.
Other study definitions included intervening acute myocardial infarction (AMI), which was defined by any intervening history of elevated troponins, regardless of symptoms or ECG changes and including demand ischemia. Chronic kidney disease (CKD) was defined as an abnormal serum creatinine on 2 or more occasions 3 months apart. Active cancer was defined as receiving chemotherapy or palliative care for advanced cancer. Valvular heart disease was defined as prior moderate or severe valvular stenosis or regurgitation.
For analysis, we first compared patients with repeat TTE with major changes with those without major changes. For comparison of dichotomous variables, χ2 or Fisher exact tests were used. For continuous variables, Student t test or the Mann-Whitney U test were performed. Because many of the frequencies of individual AUC criteria were small, related AUC criteria were grouped for analysis as grouped by the tables of the American College of Cardiology Foundation Appropriate Use Criteria Task Force, American Society of Echocardiography, American Heart Association, American Society of Nuclear Cardiology, Heart Failure Society of America, Heart Rhythm Society, Society for Cardiovascular Angiography and Interventions, Society of Critical Care Medicine, Society of Cardiovascular Computed Tomography, and Society for Cardiovascular Magnetic Resonance (ACCF/ASE/AHA) Guideline.4 Criteria groupings that were significantly less likely to have major TTE changes on analysis were classified as low risk and criteria that were significantly more likely were classified as high risk. Criteria groupings that were not significantly associated with TTE change were classified as average risk. All variables with P values less than 0.05 on bivariate analysis were then entered into a multivariate logistic regression analysis with major TTE change as the dependent variable, using backward stepwise variable selection with entry and exit criteria of P < 0.05 and P > 0.10, respectively. Scores were derived by converting the regression coefficients of independently predictive variables in the logistic regression model into corresponding integers. A total score was calculated for each patient by summing up the points for each independently significant variable. Model performance was described by calculating a C statistic by creation of a receiver operating characteristic curve to assess discrimination, and by performing the Hosmer and Lemeshow test to assess calibration. Internal validation was assessed by calculating the C statistic using the statistical method of bootstrapping in which the data were resampled multiple times (n = 200) and the average resultant C statistic reported. The bootstrap analysis was performed using R version 3.1 (R Foundation for Statistical Computing, Vienna, Austria). All other analyses were performed using SPSS version 21.0 (IBM, Armonk, New York). P values <0.05 were considered significant.
RESULTS
During the 1-year study period, there were 3944 medical/surgical admissions for 3266 patients and 845 inpatient TTEs obtained on 601 patients. Of all patients who were admitted, 601/3266 (18.4%) had at least 1 inpatient TTE. Of these 601 TTEs, 211 (35%) had a TTE within the VA system during the prior year. Of the 211 repeat TTEs, 67 (32%) were unchanged, 66 (31%) had minor changes, and 78 (37%) had major changes. The kappa statistic for agreement between extractors for “major TTE change” was 0.91, P < 0.001. The 10 most common AUC indications for TTE, which accounted for 72% of all studies, are listed in Table 1. The initial AUCs assigned by reviewers were the same in 187 of 211 TTEs (kappa 0.86, P < 0.001). Most indications were not associated with TTE outcome, although studies ordered for AUC indications 1 and 2 were less likely be associated with major changes and AUC indications 22 and 47 were more likely to be associated with major changes. Table 2 shows the comparison of the 78 patients that had repeat TTE with major changes compared with the 133 patients that did not. Nine variables were significantly different between the 2 groups; repeat TTEs with major changes were more likely to have dementia, be ordered by the surgery service, be located in an ICU, have major new ECG changes, have had prior valvular heart disease, have had an intervening AMI or cardiac surgery, or be in a high-risk AUC category. Patients with CKD were less likely to have major changes. Table 3 shows the results of the multivariate analysis; CKD, intervening AMI, prior valvular heart disease, major new ECG changes, and intervening cardiac surgery all independently predicted major changes on repeat TTE. Based on the β-coefficient for each variable, a point system was assigned to each variable and a total score calculated for each patient. Most variables had β-coefficients close to 1 and were therefore assigned a score of 1. CKD was associated with a lower risk of major TTE abnormality and was assigned a negative score. Intervening AMI was associated with a β-coefficient of 2.2 and was assigned a score of 2. Based on the points assigned to each variable and its presence or absence for each patient, a total score, which we named the CAVES score, was calculated. The acronym CAVES stands for CKD, AMI, valvular disease, ECG changes, and surgery (cardiac). Table 4 shows the frequencies of each score for each patient, ranging from patients with CKD and no other risk factors who scored −1 to patients without CKD who had all 4 of the other variables who scored 5. The prevalence of major TTE change for the full cohort was 37%. For the group with a CAVES score of −1, the probability was only 5.6%; for the group with a score of 0, the probability was 17.7%; and for the group with a score ≥1, the probability was 55.3%.
The bootstrap corrected C statistic for the model was 0.78 (95% confidence interval, 0.72-0.85), indicating good discrimination. The Hosmer and Lemeshow test showed nonsignificance, indicating good calibration (χ2 = 5.20, df = 6, P = 0.52).
DISCUSSION
In this retrospective study, we found that approximately 18% of all patients admitted to the hospital had an inpatient TTE performed, and that approximately 35% of this group had a prior TTE within the past year. Of the group with prior TTEs within the past year, 37% had a major new change and 63% had either minor or no changes. Prior studies have reported similar high rates of repeat TTE7-9 and of major changes on repeat TTE.8,14,16 On multivariate analysis, we found that 5 variables were independent predictors of new changes on TTE—absence of CKD, intervening AMI, intervening cardiac surgery, history of valvular heart disease, and major new ECG changes. We developed and internally validated a risk score based on these 5 variables, which was found to have good overall accuracy as measured by the bootstrap corrected C statistic. The simplified version of the score divides patients into low, intermediate, and high risk for major changes on TTE. The low-risk group, defined as the group with no risk factors, had an approximately 6% risk of a major TTE change; the intermediate risk group, defined as a score of 0, had an 18% risk of major TTE change; and the high-risk group, defined as a score of 1 or greater, had a 55% chance of major TTE change. We believe that this risk score, if further validated, will potentially allow hospital-based clinicians to estimate the chance of a major change on TTE prior to ordering the study. For the low-risk group, this may indicate that the study is unnecessary. Conversely, for patients at high risk, this may offer further evidence that it will be useful to obtain a repeat TTE.
In summary, we have developed a simple score to predict the likelihood of major changes on repeat TTEs for hospitalized patients. The CAVES score identified 8.5% of patients as being low risk for changed repeat TTE, 37% at intermediate risk, and 54% at high risk for major changes. We believe that the CAVES score, if further validated, may be used to risk stratify patients for ordering TTE and to potentially avoid unnecessary repeat studies.
Disclosure
The authors indicated no conflicts of interest.
1. Virnig BA, Shippee SN, O’Donnell B, Zeglin J, Parashuram S. Data point 20: echocardiography trends. In Trends in the Use of Echocardiography, 2007 to 2011. Rockville, MD: Agency for Healthcare Research and Quality; 2014. p 1-21. PubMed
2. Andrus BW, Welch HG. Medicare services provided by cardiologists in the United States: 1999-2008. Circ Cardiovasc Qual Outcomes. 2012;5(1):31-36. PubMed
3. Report to the Congress: Medicare Payment Policy. 2016; 105. http://www.medpac.gov/docs/default-source/data-book/june-2016-data-book-section-7-ambulatory-care.pdf?sfvrsn=0. Accessed on August 14, 2017.
4. American College of Cardiology Foundation Appropriate Use Criteria Task Force, American Society of Echocardiography, American Heart Association, et al. ACCF/ASE/AHA/ASNC/HFSA/HRS/SCAI/SCCM/SCCT/SCMR 2011 Appropriate use criteria for echocardiography. A report of the American College of Cardiology Foundation Appropriate Use Criteria Task Force, American Society of Echocardiography, American Heart Association, American Society of Nuclear Cardiology, Heart Failure Society of America, Heart Rhythm Society, Society for Cardiovascular Angiography and Interventions, Society of Critical Care Medicine, Society of Cardiovascular Computed Tomography, and Society for Cardiovascular Magnetic Resonance Endorsed by the American College of Chest Physicians. J Am Coll Cardiol. 2011;57(9):1126-1166. PubMed
5. Matulevicius SA, Rohatgi A, Das SR, Price AL, DeLuna A, Reimold SC. Appropriate use and clinical impact of transthoracic echocardiography. JAMA Intern Med. 2013;173(17):1600-1607. PubMed
6. Ioannidis JP. Appropriate vs clinically useful diagnostic tests. JAMA Intern Med. 2013;173(17):1607-1609. PubMed
7. Ghatak A, Pullatt R, Vyse S, Silverman DI. Appropriateness criteria are an imprecise measure for repeat echocardiograms. Echocardiography. 2011;28(2):131-135. PubMed
8. Koshy TP, Rohatgi A, Das SR, et al. The association of abnormal findings on transthoracic echocardiography with 2011 Appropriate Use Criteria and clinical impact. Int J Cardiovasc Imaging. 2015;31(3):521-528. PubMed
9. Bhatia RS, Carne DM, Picard MH, Weiner RB. Comparison of the 2007 and 2011 appropriate use criteria for transesophageal echocardiography. J Am Soc Echocardiogr. 2012;25(11):1170-1175. PubMed
10. Welch HG, Hayes KJ, Frost C. Repeat testing among Medicare beneficiaries. Arch Intern Med. 2012;172(22):1745-1751. PubMed
11. Collins GS, Reitsma JB, Altman DG, Moons KG. Transparent Reporting of a multivariable prediction model for Individual Prognosis Or Diagnosis (TRIPOD). Ann Intern Med. 2015;162(10):735-736. PubMed
12. Ward RP, Mansour IN, Lemieux N, Gera N, Mehta R, Lang RM. Prospective evaluation of the clinical application of the American College of Cardiology Foundation/American Society of Echocardiography Appropriateness Criteria for transthoracic echocardiography. JACC Cardiovasc Imaging. 2008;1(5):663-671. PubMed
13. Bhatia RS, Carne DM, Picard MH, Weiner RB. Comparison of the 2007 and 2011 appropriate use criteria for transthoracic echocardiography in various clinical settings. J Am Soc Echocardiogr. 2012;25(11):1162-1169. PubMed
14. Mansour IN, Razi RR, Bhave NM, Ward RP. Comparison of the updated 2011 appropriate use criteria for echocardiography to the original criteria for transthoracic, transesophageal, and stress echocardiography. J Am Soc Echocardiogr. 2012;25(11):1153-1161. PubMed
15. Denes P, Larson JC, Lloyd-Jones DM, Prineas RJ, Greenland P. Major and minor ECG abnormalities in asymptomatic women and risk of cardiovascular events and mortality. JAMA. 2007;297(9):978-985. PubMed
16. Kirkpatrick JN, Ky B, Rahmouni HW, et al. Application of appropriateness criteria in outpatient transthoracic echocardiography. J Am Soc Echocardiogr. 2009;22(1):53-59. PubMed
© 2018 Society of Hospital Medicine
Information on Orthopedic Trauma Fellowships: Online Accessibility and Content
Take-Home Points
- The Internet is a popular resource for orthopedic fellowship applicants.
- 86% of OTF websites are accessible from Google and FREIDA.
- Accessible websites feature only 40% of fellowship applicant content.
- Accessibility and content of OTF websites are highly variable and largely deficient.
- Improvement of the accessibility and content of website information should be a future focus of OTF programs.
The Orthopaedic Trauma Fellowship Match facilitates the matching process for orthopedic residency graduates pursuing a career as orthopedic traumatologists. This match is supported by the Orthopaedic Trauma Association (OTA) and the San Francisco Matching Program (SFMP). Orthopedic trauma fellowship (OTF) programs are accredited by the OTA and may receive oversight by the American Council for Graduate Medical Education (ACGME), which defines uniform standards for fellowship training.1
Studies have found that the internet is an important and popular resource for applicants researching residency and fellowship programs.2-5 For many applicants, the internet is their initial and main source of information.5 Unfortunately, training programs do not have standardized website accessibility and content.
Few studies have addressed online content on orthopedic fellowship programs,4,6,7 and to our knowledge no one has studied online content on OTF programs. We conducted a study to assess the accessibility and ease of navigation of OTF websites and to evaluate the content on these sites. We wanted to identify content that applicants may reliably expect on OTF sites. Any deficits identified may be useful to fellowship programs and program directors interested in improving website quality. We hypothesized that the accessibility and content of online OTF content would be highly variable and largely deficient.
Methods
This study was conducted at New York University Hospital for Joint Diseases. On February 5, 2015, both the OTA database8 and the Fellowship and Residency Electronic Interactive Database (FREIDA)9 were accessed in order to create a comprehensive list of OTF programs. FREIDA, a catalog of all ACGME-accredited graduate medical education programs in the United States, is supported by the American Medical Association and provides cursory program information, including training program duration and number of positions per year.
The databases were reviewed for links to OTF program websites. An independent Google search for program websites was also initiated on February 5, 2015. The Google search was performed in the format “program name + orthopaedic trauma fellowship” to assess how accessible the program sites are from outside the 2 databases (OTA, FREIDA). Google was used because it is the most commonly used search engine.10 The first 25 search results were reviewed for links to OTF websites. Programs without accessible links to OTF websites—from the OTA database, from FREIDA, or from the Google search—were excluded from content assessment.
Accessible websites were electronically captured to ensure consistency of content during assessment. OTF site content was evaluated using methods described in similar investigations.4,5,11,12 In our dichotomous assessment of fellow education content, we awarded 1 point per content item on the website. The 10 education content items evaluated were call responsibilities, didactic instruction, journal club, research requirements, evaluation criteria, rotation schedule, operative experience, office/clinic experience, meetings attended, and courses attended. We also performed a dichotomous assessment of fellow recruitment content. The 10 recruitment content items evaluated were program description, application requirements, selection criteria, OTA link, SFMP link, location description, program contact information, fellow listing, faculty listing, and salary. Content items were chosen for evaluation on the basis of published OTF applicant experience.13 Percentages of education content, recruitment content, and total content were compared by program location, number of fellows, ACGME accreditation status,14 affiliation with a top 20 orthopedic hospital,15 and affiliation with a top 20 medical school,16 as in similar studies.7,17
Chi-square tests were used to compare content by fellowship location, number of fellows, ACGME accreditation status, affiliation with a top 20 orthopedic hospital, and affiliation with a top 20 medical school. For all tests, the significance level was set at P < .05.
Results
Of the 49 OTF programs identified with database queries, 9 appeared in both the OTA database and FREIDA, 39 appeared only in the OTA database, and 1 appeared only in FREIDA. There were 48 programs total in the OTA database and 10 total in FREIDA.
The OTA database had no OTF website links. Of the 10 OTF links in FREIDA, 3 (6%) were nonfunctioning, 6 (12%) had multiple steps for accessing program information, and 1 (2%) connected directly to program information. Therefore, FREIDA had a total of 7 accessible OTF links (14%). The independent Google search yielded website links for 42 (86%) of the 49 OTF programs. Five links (10%, 5/49) had multiple steps for accessing program information, and 37 links (76%, 37/49) connected directly to program information. The 7 OTF links accessible through FREIDA were accessible through Google as well. Table 1 summarizes the accessibility data.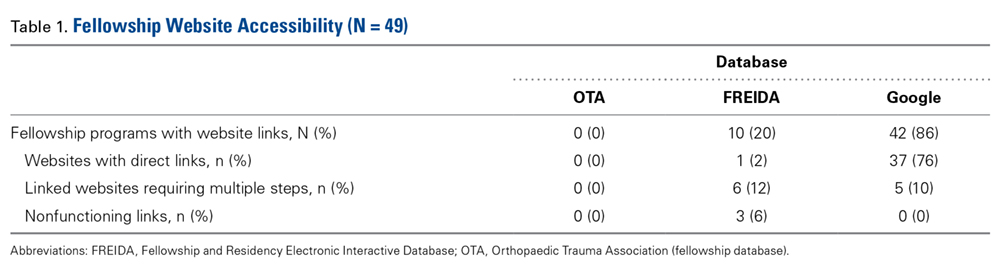
All 42 accessible OTF websites were assessed for content. On average, these sites had 40% (range, 0%-75%) of the total assessed content. Mean (SD) education content score was 3.6 (2.2) out of 10. Operative experience (88%) and research requirements (81%) were the most consistently presented education items. Didactic learning (45%) and description of common office/clinic cases (43%) were next. Less than 5% of the sites had content on the training courses (eg, sponsored fracture courses) attended by fellows. Figure 1 summarizes the education items on the OTF websites.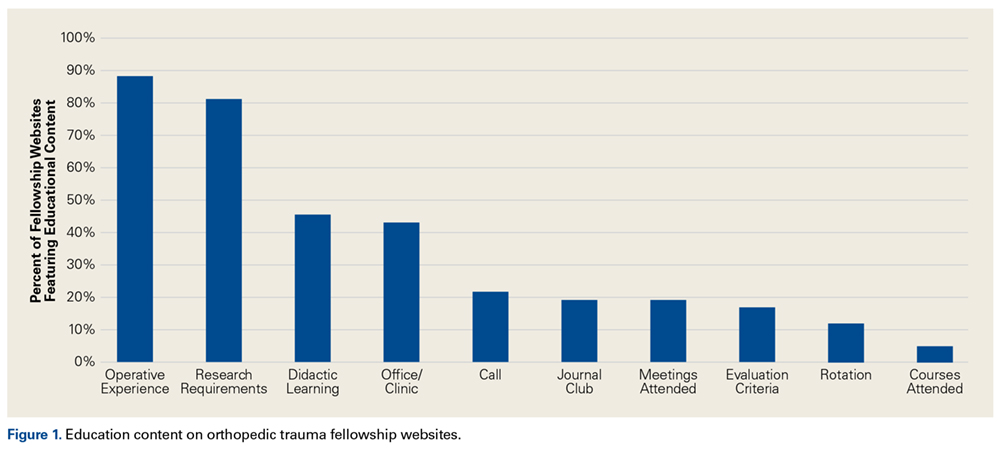
Mean (SD) recruitment content score was 4.4 (2.2) out of 10. Program description (93%) and program contact information (88%) were the most consistently presented recruitment items. Clinical faculty (52%) and current and/or prior fellows (36%) were next. Fellow selection criteria appeared least often (12%). Figure 2 summarizes the recruitment items on the OTF websites.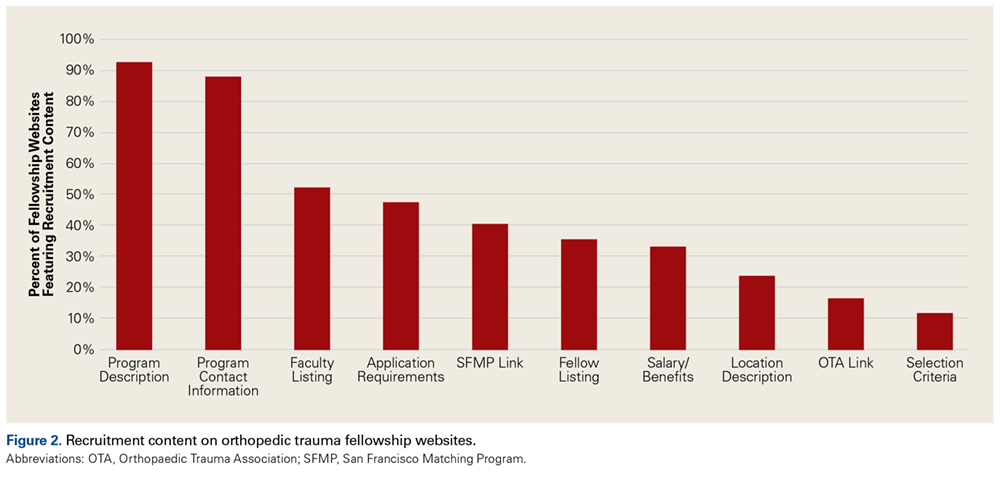
Thirty-six percent of OTF programs with accessible websites were in the southern United States. However, there were no significant differences in online content between OTF program locations. Websites of programs with >1 fellow had significantly more education content (48% vs 33%; P = .043) and total content (46% vs 37%; P = .01) than websites of programs with 1 fellow. ACGME accreditation status, affiliation with a top 20 orthopedic hospital, and affiliation with a top 20 medical school did not have a significant effect on OTF website content. Table 2 summarizes OTF website content by location, number of fellows, top 20 orthopedic hospital affiliation, and top 20 medical school affiliation.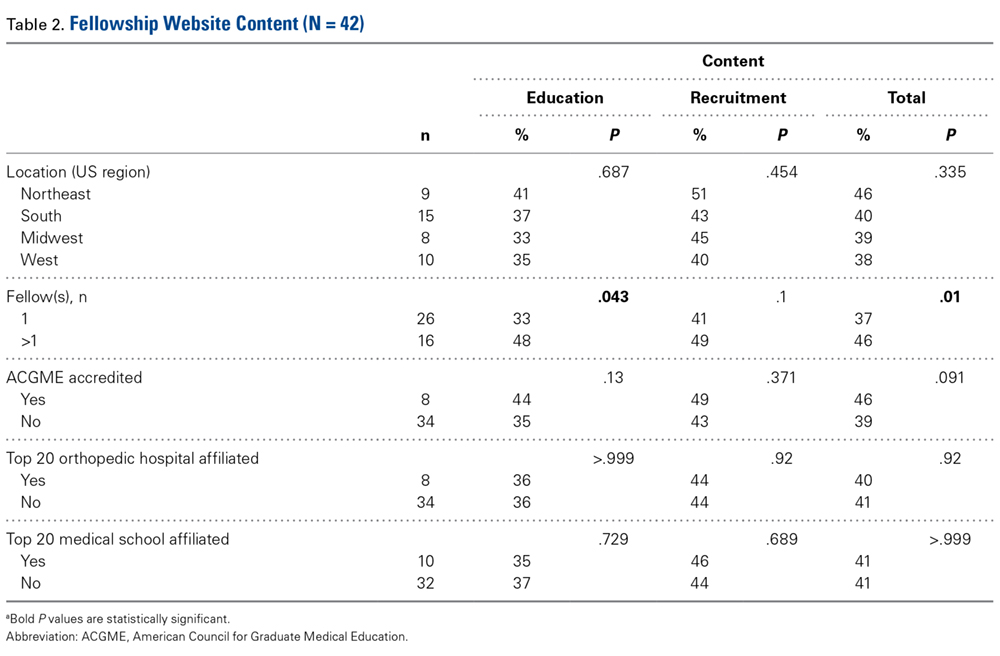
Discussion
We conducted this study to assess the accessibility of OTF program websites and to evaluate the content of the sites. Our hypothesis, that the accessibility and content of online OTF content would be highly variable and largely deficient, was supported by our findings. We found that the OTA database had no OTF website links and that FREIDA links connected directly to only 2% of OTF sites. The majority of OTF sites were accessed from the Google search, which had direct links to 76% of the OTF programs.
Other studies have had similar findings regarding the accessibility of fellowship websites. Mulcahey and colleagues6 evaluated sports medicine fellowship websites for accessibility and content, and found that the website of the American Orthopaedic Society for Sports Medicine directly linked to fellowship information for only 3% of programs; a Google search yielded direct links to 71% of program websites. Davidson and colleagues4 examined the quality and accessibility of online information on pediatric orthopedic fellowships and found no program links on the website of the Pediatric Orthopaedic Society of North America; a Google search yielded direct links to 68% of programs. Silvestre and colleagues7 assessed spine fellowship information on the Internet. The North American Spine Society website had working links to only 3% of fellowship sites, and FREIDA connected to only 6% of sites.
Content scores in our study were highly variable. Mean education and recruitment content scores were 3.6 (range, 0-9) and 4.4 (range, 0-10), respectively. Operative experience (88%) and program description (93%) were the most frequently presented education and recruitment items, respectively. Consistency in presenting program descriptions on OTF websites was slightly poorer than that in other orthopedic specialties. Sports medicine, pediatric orthopedic, and spine fellowship websites provided program descriptions for fellowship recruitment.4,6,7 Nevertheless, overall content scores in our study and in the aforementioned studies were similarly poor.
In our study, OTF websites showed no significant differences in content scores for program location, ACGME accreditation status, affiliation with a top 20 orthopedic hospital, or affiliation with a top 20 medical school. Lack of a significant effect of medical school or orthopedic hospital affiliation suggests academic prestige does not play a large role in attempts by OTF websites to attract applicants. However, programs with >1 fellow had significantly more education and total content than programs with 1 fellow. Results from a comparable study support this finding. Silvestre and colleagues18 assessed the accessibility of online plastic surgery residency content. Programs with 3 or 4 residents had significantly more online education content than programs with 1 resident. This finding may relate to the cost efficiency of developing low-cost websites to attract applicants to multiple positions.7
Despite lacking links to OTF websites, the OTA database had a large amount of content on 98% (48/49) of OTFs. In addition to presenting the content that we assessed in this study, the OTA database provided the number of inpatient beds at the primary teaching hospital, the annual number of emergency department visits, the annual number of trauma admissions, and the annual number of orthopedic trauma procedures. This standardized information may be very helpful to fellowship applicants and may be an important adjunct to fellowship websites.
FREIDA provided similar content, but accessible links were found for only 14% of the assessed programs. Although the deficiency in accessible OTF links in the OTA database and FREIDA is not well understood, it is important. The results of our study and of similar studies suggest that the listing of active fellowship program links on society websites would benefit orthopedic fellowship applicants, likely fostering a better understanding and a more efficient review of available programs. In addition, links on society websites afford fellowship directors the means to efficiently publicize their programs to large numbers of potential applicants, who likely use society websites as an initial informational resource.
Our study had limitations. First, its findings are subject to the dynamism of the internet, and OTF information may have been updated after this investigation was conducted. Second, our study did not rank-order accessible links, which may have provided more information on the efficiency of using Internet search engines in a review of OTF programs. In addition, our study involved dichotomous assessment of OTF content. Multichotomous evaluation may have further elucidated the quality of website information. Last, our study evaluated websites only for US-based OTF programs. Inclusion of international OTF programs, though outside the scope of this study, may have yielded different findings.
Conclusion
Our results highlight the difficulties that OTF applicants may experience in gathering fellowship information online. OTF website accessibility and content were found to be highly variable and largely deficient. Comparing our findings with those of similar studies revealed that fellowship websites generally provided little information that orthopedic specialty applicants could use. OTF programs should focus on improving their website accessibility and content.
1. Daniels AH, Grabel Z, DiGiovanni CW. ACGME accreditation of orthopaedic surgery subspecialty fellowship training programs. J Bone Joint Surg Am. 2014;96(11):e94.
2. Reilly EF, Leibrandt TJ, Zonno AJ, Simpson MC, Morris JB. General surgery residency program websites: usefulness and usability for resident applicants. Curr Surg. 2004;61(2):236-240.
3. Perron AD, Brady WJ. Sources of information on emergency medicine residency programs. Acad Emerg Med. 2002;9(12):1462-1463.
4. Davidson AR, Murphy RF, Spence DD, Kelly DM, Warner WC Jr, Sawyer JR. Accessibility and quality of online information for pediatric orthopaedic surgery fellowships. J Pediatr Orthop. 2014;34(8):831-834.
5. Rozental TD, Lonner JH, Parekh SG. The internet as a communication tool for academic orthopaedic surgery departments in the United States. J Bone Joint Surg Am. 2001;83(7):987-991.
6. Mulcahey MK, Gosselin MM, Fadale PD. Evaluation of the content and accessibility of web sites for accredited orthopaedic sports medicine fellowships. J Bone Joint Surg Am. 2013;95(12):e85.
7. Silvestre J, Guzman JZ, Skovrlj B, et al. The internet as a communication tool for orthopedic spine fellowships in the United States. Spine J. 2015;15(4):655-661.
8. Orthopaedic Trauma Association. Orthopaedic trauma fellowship directory. http://spec.ota.org/education/fellowshipcenter/fellowship_dir/dir_summary.cfm. Accessed February 5, 2015.
9. Fellowship and Residency Electronic Interactive Database. Orthopaedic trauma fellowship programs. https://freida.ama-assn.org/Freida/user/search/programSearch.do. Accessed February 5, 2015.
10. Experian Hitwise. Search engine analysis. http://www.experian.com/marketing-services/online-trends-search-engine.html. Accessed February 5, 2015.
11. Hinds RM, Klifto CS, Naik AA, Sapienza A, Capo JT. Hand society and matching program web sites provide poor access to information regarding hand surgery fellowship. J Hand Microsurg. 2016;8(2):91-95.
12. Hinds RM, Danna NR, Capo JT, Mroczek KJ. Foot and ankle fellowship websites: An assessment of accessibility and quality. Foot Ankle Spec. 2017;10(4):302-307.
13. Griffin SM, Stoneback JW. Navigating the Orthopaedic Trauma Fellowship Match from a candidate’s perspective. J Orthop Trauma. 2011;25(suppl 3):S101-S103.
14. American Council for Graduate Medical Education. Accredited orthopaedic trauma fellowship programs. https://www.acgme.org/ads/Public/Programs/Search?specialtyId=49&orgCode=&city=. Accessed February 5, 2015.
15. US News & World Report. Best hospitals for orthopedics. http://health.usnews.com/best-hospitals/rankings/orthopedics. Accessed February 5, 2015.
16. US News & World Report. Best medical schools: research. http://grad-schools.usnews.rankingsandreviews.com/best-graduate-schools/top-medical-schools/research-rankings?int=98fd08. Accessed February 5, 2015.
17. Silvestre J, Guzman JZ, Abbatematteo JM, Chang B, Levin LS. Evaluation of content and accessibility of hand fellowship websites. Hand (NY). 2015;10(3):516-521.
18. Silvestre J, Tomlinson-Hansen S, Fosnot J, Taylor JA. Plastic surgery residency websites: a critical analysis of accessibility and content. Ann Plast Surg. 2014;72(3):265-269.
Take-Home Points
- The Internet is a popular resource for orthopedic fellowship applicants.
- 86% of OTF websites are accessible from Google and FREIDA.
- Accessible websites feature only 40% of fellowship applicant content.
- Accessibility and content of OTF websites are highly variable and largely deficient.
- Improvement of the accessibility and content of website information should be a future focus of OTF programs.
The Orthopaedic Trauma Fellowship Match facilitates the matching process for orthopedic residency graduates pursuing a career as orthopedic traumatologists. This match is supported by the Orthopaedic Trauma Association (OTA) and the San Francisco Matching Program (SFMP). Orthopedic trauma fellowship (OTF) programs are accredited by the OTA and may receive oversight by the American Council for Graduate Medical Education (ACGME), which defines uniform standards for fellowship training.1
Studies have found that the internet is an important and popular resource for applicants researching residency and fellowship programs.2-5 For many applicants, the internet is their initial and main source of information.5 Unfortunately, training programs do not have standardized website accessibility and content.
Few studies have addressed online content on orthopedic fellowship programs,4,6,7 and to our knowledge no one has studied online content on OTF programs. We conducted a study to assess the accessibility and ease of navigation of OTF websites and to evaluate the content on these sites. We wanted to identify content that applicants may reliably expect on OTF sites. Any deficits identified may be useful to fellowship programs and program directors interested in improving website quality. We hypothesized that the accessibility and content of online OTF content would be highly variable and largely deficient.
Methods
This study was conducted at New York University Hospital for Joint Diseases. On February 5, 2015, both the OTA database8 and the Fellowship and Residency Electronic Interactive Database (FREIDA)9 were accessed in order to create a comprehensive list of OTF programs. FREIDA, a catalog of all ACGME-accredited graduate medical education programs in the United States, is supported by the American Medical Association and provides cursory program information, including training program duration and number of positions per year.
The databases were reviewed for links to OTF program websites. An independent Google search for program websites was also initiated on February 5, 2015. The Google search was performed in the format “program name + orthopaedic trauma fellowship” to assess how accessible the program sites are from outside the 2 databases (OTA, FREIDA). Google was used because it is the most commonly used search engine.10 The first 25 search results were reviewed for links to OTF websites. Programs without accessible links to OTF websites—from the OTA database, from FREIDA, or from the Google search—were excluded from content assessment.
Accessible websites were electronically captured to ensure consistency of content during assessment. OTF site content was evaluated using methods described in similar investigations.4,5,11,12 In our dichotomous assessment of fellow education content, we awarded 1 point per content item on the website. The 10 education content items evaluated were call responsibilities, didactic instruction, journal club, research requirements, evaluation criteria, rotation schedule, operative experience, office/clinic experience, meetings attended, and courses attended. We also performed a dichotomous assessment of fellow recruitment content. The 10 recruitment content items evaluated were program description, application requirements, selection criteria, OTA link, SFMP link, location description, program contact information, fellow listing, faculty listing, and salary. Content items were chosen for evaluation on the basis of published OTF applicant experience.13 Percentages of education content, recruitment content, and total content were compared by program location, number of fellows, ACGME accreditation status,14 affiliation with a top 20 orthopedic hospital,15 and affiliation with a top 20 medical school,16 as in similar studies.7,17
Chi-square tests were used to compare content by fellowship location, number of fellows, ACGME accreditation status, affiliation with a top 20 orthopedic hospital, and affiliation with a top 20 medical school. For all tests, the significance level was set at P < .05.
Results
Of the 49 OTF programs identified with database queries, 9 appeared in both the OTA database and FREIDA, 39 appeared only in the OTA database, and 1 appeared only in FREIDA. There were 48 programs total in the OTA database and 10 total in FREIDA.
The OTA database had no OTF website links. Of the 10 OTF links in FREIDA, 3 (6%) were nonfunctioning, 6 (12%) had multiple steps for accessing program information, and 1 (2%) connected directly to program information. Therefore, FREIDA had a total of 7 accessible OTF links (14%). The independent Google search yielded website links for 42 (86%) of the 49 OTF programs. Five links (10%, 5/49) had multiple steps for accessing program information, and 37 links (76%, 37/49) connected directly to program information. The 7 OTF links accessible through FREIDA were accessible through Google as well. Table 1 summarizes the accessibility data.
All 42 accessible OTF websites were assessed for content. On average, these sites had 40% (range, 0%-75%) of the total assessed content. Mean (SD) education content score was 3.6 (2.2) out of 10. Operative experience (88%) and research requirements (81%) were the most consistently presented education items. Didactic learning (45%) and description of common office/clinic cases (43%) were next. Less than 5% of the sites had content on the training courses (eg, sponsored fracture courses) attended by fellows. Figure 1 summarizes the education items on the OTF websites.
Mean (SD) recruitment content score was 4.4 (2.2) out of 10. Program description (93%) and program contact information (88%) were the most consistently presented recruitment items. Clinical faculty (52%) and current and/or prior fellows (36%) were next. Fellow selection criteria appeared least often (12%). Figure 2 summarizes the recruitment items on the OTF websites.
Thirty-six percent of OTF programs with accessible websites were in the southern United States. However, there were no significant differences in online content between OTF program locations. Websites of programs with >1 fellow had significantly more education content (48% vs 33%; P = .043) and total content (46% vs 37%; P = .01) than websites of programs with 1 fellow. ACGME accreditation status, affiliation with a top 20 orthopedic hospital, and affiliation with a top 20 medical school did not have a significant effect on OTF website content. Table 2 summarizes OTF website content by location, number of fellows, top 20 orthopedic hospital affiliation, and top 20 medical school affiliation.
Discussion
We conducted this study to assess the accessibility of OTF program websites and to evaluate the content of the sites. Our hypothesis, that the accessibility and content of online OTF content would be highly variable and largely deficient, was supported by our findings. We found that the OTA database had no OTF website links and that FREIDA links connected directly to only 2% of OTF sites. The majority of OTF sites were accessed from the Google search, which had direct links to 76% of the OTF programs.
Other studies have had similar findings regarding the accessibility of fellowship websites. Mulcahey and colleagues6 evaluated sports medicine fellowship websites for accessibility and content, and found that the website of the American Orthopaedic Society for Sports Medicine directly linked to fellowship information for only 3% of programs; a Google search yielded direct links to 71% of program websites. Davidson and colleagues4 examined the quality and accessibility of online information on pediatric orthopedic fellowships and found no program links on the website of the Pediatric Orthopaedic Society of North America; a Google search yielded direct links to 68% of programs. Silvestre and colleagues7 assessed spine fellowship information on the Internet. The North American Spine Society website had working links to only 3% of fellowship sites, and FREIDA connected to only 6% of sites.
Content scores in our study were highly variable. Mean education and recruitment content scores were 3.6 (range, 0-9) and 4.4 (range, 0-10), respectively. Operative experience (88%) and program description (93%) were the most frequently presented education and recruitment items, respectively. Consistency in presenting program descriptions on OTF websites was slightly poorer than that in other orthopedic specialties. Sports medicine, pediatric orthopedic, and spine fellowship websites provided program descriptions for fellowship recruitment.4,6,7 Nevertheless, overall content scores in our study and in the aforementioned studies were similarly poor.
In our study, OTF websites showed no significant differences in content scores for program location, ACGME accreditation status, affiliation with a top 20 orthopedic hospital, or affiliation with a top 20 medical school. Lack of a significant effect of medical school or orthopedic hospital affiliation suggests academic prestige does not play a large role in attempts by OTF websites to attract applicants. However, programs with >1 fellow had significantly more education and total content than programs with 1 fellow. Results from a comparable study support this finding. Silvestre and colleagues18 assessed the accessibility of online plastic surgery residency content. Programs with 3 or 4 residents had significantly more online education content than programs with 1 resident. This finding may relate to the cost efficiency of developing low-cost websites to attract applicants to multiple positions.7
Despite lacking links to OTF websites, the OTA database had a large amount of content on 98% (48/49) of OTFs. In addition to presenting the content that we assessed in this study, the OTA database provided the number of inpatient beds at the primary teaching hospital, the annual number of emergency department visits, the annual number of trauma admissions, and the annual number of orthopedic trauma procedures. This standardized information may be very helpful to fellowship applicants and may be an important adjunct to fellowship websites.
FREIDA provided similar content, but accessible links were found for only 14% of the assessed programs. Although the deficiency in accessible OTF links in the OTA database and FREIDA is not well understood, it is important. The results of our study and of similar studies suggest that the listing of active fellowship program links on society websites would benefit orthopedic fellowship applicants, likely fostering a better understanding and a more efficient review of available programs. In addition, links on society websites afford fellowship directors the means to efficiently publicize their programs to large numbers of potential applicants, who likely use society websites as an initial informational resource.
Our study had limitations. First, its findings are subject to the dynamism of the internet, and OTF information may have been updated after this investigation was conducted. Second, our study did not rank-order accessible links, which may have provided more information on the efficiency of using Internet search engines in a review of OTF programs. In addition, our study involved dichotomous assessment of OTF content. Multichotomous evaluation may have further elucidated the quality of website information. Last, our study evaluated websites only for US-based OTF programs. Inclusion of international OTF programs, though outside the scope of this study, may have yielded different findings.
Conclusion
Our results highlight the difficulties that OTF applicants may experience in gathering fellowship information online. OTF website accessibility and content were found to be highly variable and largely deficient. Comparing our findings with those of similar studies revealed that fellowship websites generally provided little information that orthopedic specialty applicants could use. OTF programs should focus on improving their website accessibility and content.
1. Daniels AH, Grabel Z, DiGiovanni CW. ACGME accreditation of orthopaedic surgery subspecialty fellowship training programs. J Bone Joint Surg Am. 2014;96(11):e94.
2. Reilly EF, Leibrandt TJ, Zonno AJ, Simpson MC, Morris JB. General surgery residency program websites: usefulness and usability for resident applicants. Curr Surg. 2004;61(2):236-240.
3. Perron AD, Brady WJ. Sources of information on emergency medicine residency programs. Acad Emerg Med. 2002;9(12):1462-1463.
4. Davidson AR, Murphy RF, Spence DD, Kelly DM, Warner WC Jr, Sawyer JR. Accessibility and quality of online information for pediatric orthopaedic surgery fellowships. J Pediatr Orthop. 2014;34(8):831-834.
5. Rozental TD, Lonner JH, Parekh SG. The internet as a communication tool for academic orthopaedic surgery departments in the United States. J Bone Joint Surg Am. 2001;83(7):987-991.
6. Mulcahey MK, Gosselin MM, Fadale PD. Evaluation of the content and accessibility of web sites for accredited orthopaedic sports medicine fellowships. J Bone Joint Surg Am. 2013;95(12):e85.
7. Silvestre J, Guzman JZ, Skovrlj B, et al. The internet as a communication tool for orthopedic spine fellowships in the United States. Spine J. 2015;15(4):655-661.
8. Orthopaedic Trauma Association. Orthopaedic trauma fellowship directory. http://spec.ota.org/education/fellowshipcenter/fellowship_dir/dir_summary.cfm. Accessed February 5, 2015.
9. Fellowship and Residency Electronic Interactive Database. Orthopaedic trauma fellowship programs. https://freida.ama-assn.org/Freida/user/search/programSearch.do. Accessed February 5, 2015.
10. Experian Hitwise. Search engine analysis. http://www.experian.com/marketing-services/online-trends-search-engine.html. Accessed February 5, 2015.
11. Hinds RM, Klifto CS, Naik AA, Sapienza A, Capo JT. Hand society and matching program web sites provide poor access to information regarding hand surgery fellowship. J Hand Microsurg. 2016;8(2):91-95.
12. Hinds RM, Danna NR, Capo JT, Mroczek KJ. Foot and ankle fellowship websites: An assessment of accessibility and quality. Foot Ankle Spec. 2017;10(4):302-307.
13. Griffin SM, Stoneback JW. Navigating the Orthopaedic Trauma Fellowship Match from a candidate’s perspective. J Orthop Trauma. 2011;25(suppl 3):S101-S103.
14. American Council for Graduate Medical Education. Accredited orthopaedic trauma fellowship programs. https://www.acgme.org/ads/Public/Programs/Search?specialtyId=49&orgCode=&city=. Accessed February 5, 2015.
15. US News & World Report. Best hospitals for orthopedics. http://health.usnews.com/best-hospitals/rankings/orthopedics. Accessed February 5, 2015.
16. US News & World Report. Best medical schools: research. http://grad-schools.usnews.rankingsandreviews.com/best-graduate-schools/top-medical-schools/research-rankings?int=98fd08. Accessed February 5, 2015.
17. Silvestre J, Guzman JZ, Abbatematteo JM, Chang B, Levin LS. Evaluation of content and accessibility of hand fellowship websites. Hand (NY). 2015;10(3):516-521.
18. Silvestre J, Tomlinson-Hansen S, Fosnot J, Taylor JA. Plastic surgery residency websites: a critical analysis of accessibility and content. Ann Plast Surg. 2014;72(3):265-269.
Use of Intravenous Tranexamic Acid Improves Early Ambulation After Total Knee Arthroplasty and Anterior and Posterior Total Hip Arthroplasty
Take-Home Points
- IV-TXA significantly reduces intraoperative blood loss following TJA.
- Early mobilization correlates with reduced incidence of postoperative complications.
- IV-TXA minimizes postoperative anemia, facilitating improved early ambulation following TJA.
- IV-TXA significantly reduces the need for postoperative transfusions.
- IV-TXA is safe to use with no adverse events noted.
By the year 2020, use of primary total knee arthroplasty (TKA) in the United States will increase an estimated 110%, to 1.375 million procedures annually, and use of primary total hip arthroplasty (THA) will increase an estimated 75%, to more than 500,000 procedures.1 Minimizing perioperative blood loss and improving early postoperative ambulation both correlate with reduced postoperative morbidity, allowing patients to return to their daily lives expeditiously.
Tranexamic acid (TXA), a fibrinolytic inhibitor, competitively blocks lysine receptor binding sites of plasminogen, sustaining and stabilizing the fibrin architecture.2 TXA must be present to occupy binding sites before plasminogen binds to fibrin, validating the need for preoperative administration so the drug is available early in the fibrinolytic cascade.3 Intravenous (IV) TXA diffuses rapidly into joint fluid and the synovial membrane.4 Drug concentration and elimination half-life in joint fluid are equivalent to those in serum. Elimination of TXA occurs by glomerular filtration, with about 30% of a 10-mg/kg dose removed in 1 hour, 55% over the first 3 hours, and 90% within 24 hours of IV administration.5
The efficacy of IV-TXA in minimizing total joint arthroplasty (TJA) perioperative blood loss has been proved in small studies and meta-analyses.6-9 TXA-induced blood conservation decreases or eliminates the need for postoperative transfusion, which can impede valuable, early ambulation.10 In addition, the positive clinical safety profile of TXA supports routine use of TXA in TJA.6,11-15
The benefits of early ambulation after TJA are well established. Getting patients to walk on the day of surgery is a key part of effective and rapid postoperative rehabilitation. Early mobilization correlates with reduced incidence of venous thrombosis and postoperative complications.16 In contrast to bed rest, sitting and standing promotes oxygen saturation, which improves tissue healing and minimizes adverse pulmonary events. Oxygen saturation also preserves muscle strength and blood flow, reducing the risk of venous thromboembolism and ulcers. Muscle strength must be maintained so normal gait can be regained.17 Compared with rehabilitation initiated 48 to 72 hours after TKA, rehabilitation initiated within 24 hours reduced the number of sessions needed to achieve independence and normal gait; in addition, early mobilization improved patient reports of pain after surgery.18 An evaluation of Denmark registry data revealed that mobilization to walking and use of crutches or canes was achieved earlier when ambulation was initiated on day of surgery.19 Finally, mobilization on day of surgery and during the immediate postoperative period improved long-term quality of life after TJA.20
We conducted a retrospective cohort study to determine if use of IV-TXA improves early ambulation and reduces blood loss after TKA and anterior and posterior THA. We hypothesized that IV-TXA use would reduce postoperative anemia and improve early ambulation and outcomes without producing adverse events during the immediate postoperative period. TXA reduces bleeding, and reduced incidence of hemarthrosis, wound swelling, and anemia could facilitate ambulation, reduce complications, and shorten recovery in patients who undergo TJA.
Patients and Methods
In February 2014, this retrospective cohort study received Institutional Review Board approval to compare the safety and efficacy of IV-TXA (vs no TXA) in patients who underwent TKA, anterior THA, and posterior THA.
In March 2012, multidisciplinary protocols were standardized to ensure a uniform hospital course for patients at our institution. All patients underwent preoperative testing and evaluation by a nurse practitioner and an anesthesiologist. In March 2013, IV-TXA became our standard of care. TXA use was contraindicated in patients with thromboembolic disease or with hypersensitivity to TXA. Patients without a contraindication were given two 10-mg/kg IV-TXA doses, each administered over 15 to 30 minutes; the first dose was administered before incision, and the second was infused at case close and/or at least 60 minutes after the first dose. Most TKA patients received regional (femoral) anesthesia and analgesia, and most THA patients received spinal or epidural anesthesia and analgesia. In a small percentage of cases, IV analgesia was patient-controlled, as determined by the pain service. There were no significant differences in anesthesia/analgesia modality between the 2 study groups—patients who received TXA and those who did not. Patients were then transitioned to oral opioids for pain management, unless otherwise contraindicated, and were ambulated 4 hours after end of surgery, unless medically unstable. Hematology and chemistry laboratory values were monitored daily during admission.
Patients underwent physical therapy (PT) after surgery and until hospital discharge. Physical therapists blinded to patients’ intraoperative use or no use of TXA measured ambulation. After initial evaluation on postoperative day 0 (POD-0), patients were ambulated twice daily. The daily ambulation distance used for the study was the larger of the 2 daily PT distances (occasionally, patients were unable to participate fully in both sessions). Patients received either enoxaparin or rivaroxaban for postoperative thromboprophylaxis (the anticoagulant used was based on surgeon preference). Enoxaparin was subcutaneously administered at 30 mg every 12 hours for TKA, 40 mg once daily for THA, 30 mg once daily for calculated creatinine clearance under 30 mL/min, or 40 mg every 12 hours for body mass index (BMI) 40 or above. With enoxaparin, therapy duration was 14 days. Oral rivaroxaban was administered at 10 mg once daily for 12 days for TKA and 35 days for THA unless contraindicated.
The primary outcome variables were ambulation measured on POD-1 and POD-2 and intraoperative blood loss. In addition, hemoglobin and hematocrit were measured on POD-0, POD-1, and POD-2. Ambulation was defined as number of feet walked during postoperative hospitalization. To calculate intraoperative blood loss, the anesthesiologist subtracted any saline irrigation volume from the total volume in the suction canister. Also noted were postoperative transfusions and any diagnosis of postoperative venous thromboembolism—specifically, deep vein thrombosis (DVT) or pulmonary embolism (PE).
Demographic and clinical characteristics of the TXA and no-TXA groups were compared using either 2-sample t test (for continuous variables) or χ2 test (for categorical variables).
The ambulation outcome was log-transformed to meet standard assumptions of Gaussian residuals and equality of variance. Means and 95% confidence intervals (CIs) were calculated on the log scale and were anti-logged so the results could be presented in their original units.
A linear mixed model was used to model intraoperative blood loss as a function of group (TXA, no TXA), procedure (TKA, anterior THA, posterior THA), and potential confounders (age, sex, BMI, operative time).
Linear mixed models for repeated measures were used to compare outcomes (hemoglobin, hematocrit) between groups (TXA, no TXA) and procedures (TKA, anterior THA, posterior THA) and to compare changes in outcomes over time. Group, procedure, and operative time interactions were explored. Potential confounders (age, sex, BMI, operative time) were included in the model as well.
A χ2 test was used to compare the groups (TXA, no TXA) on postoperative blood transfusion (yes, no). Given the smaller number of events, a more complex model accounting for clustered data and potential confounders was not used. Need for transfusion was clinically assessed case by case. Symptomatic anemia (dyspnea on exertion, headaches, tachycardia) was used as the primary indication for transfusion once hemoglobin fell below 8 g/dL or hematocrit below 24%. Number of patients with a postoperative thrombus formation was minimal. Therefore, this outcome was described with summary statistics and was not formally analyzed.
Results
Of the 477 patients who underwent TJAs (275 TKAs, 98 anterior THAs, 104 posterior THAs; all unilateral), 111 did not receive TXA (June 2012-February 2013), and 366 received TXA (March 2013-January 2014). Other than for the addition of IV-TXA, the same standardized protocols instituted in March 2012 continued throughout the study period. The difference in sample size between the TXA and no-TXA groups was not statistically significant and did not influence the outcome measures. 
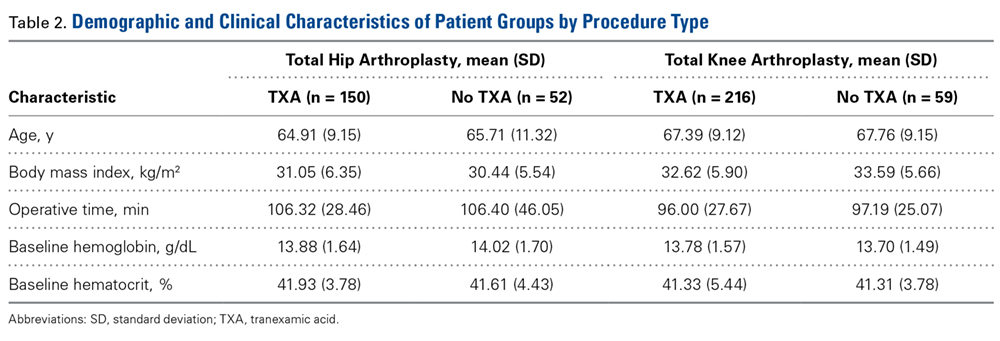
Ambulation
There was a significant (P = .0066) 3-way interaction of TXA, procedure, and operative time after adjusting for age (P < .0001), sex (P < .0001), BMI (P < .0001), and operative time (P = .8308). Regarding TKA, mean ambulation was higher for the TXA group than for the no-TXA group at POD-1 (8.36 vs 3.40 feet; P < .0001) and POD-2 (25.81 vs 18.75 feet; P = .0054). The same was true for anterior THA at POD-1 (10.86 vs 3.33 feet; P < .0001) and POD-2 (27.24 vs 13.19 feet; P < .0001) and posterior THA at POD-1 (10.64 vs 3.37 feet; P < .0001) and POD-2 (24.68 vs 12.93 feet; P = .0002). See Table 3.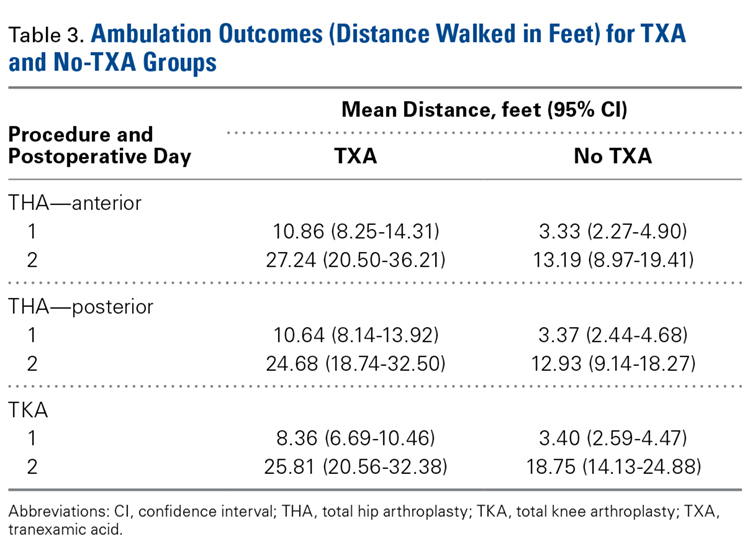
Intraoperative Blood Loss
There was a significant 3-way interaction of TXA, procedure (P < .0053), and operative time (P < .0001) after adjusting for age (P < .6136), sex (P = .1147), and BMI (P = .6180). Regarding TKA, mean intraoperative blood loss was significantly lower for the TXA group than for the no-TXA group (241.58 vs 287.81 mL; P = .0004). The same was true for anterior THA (352.91 vs 533.79 mL; P < .0001). Regarding posterior THA, there was no significant difference between the TXA and no-TXA groups (326.00 vs 350.16 mL; P = .3246). See Table 4. 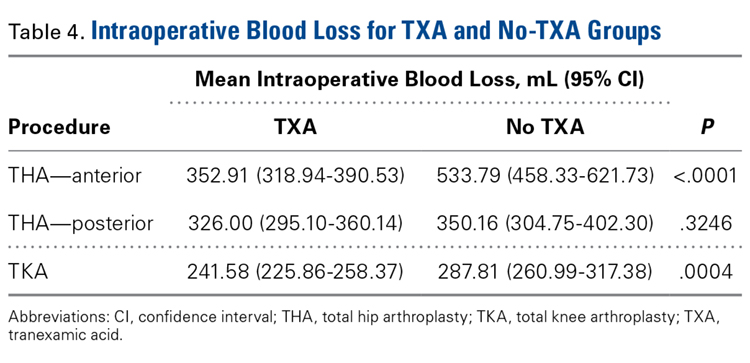
Hemoglobin
There was a significant (P = .0008) 3-way interaction of TXA, procedure, and operative time after adjusting for age (P = .0174), sex (P < .0001), BMI (P = .0007), and operative time (P = .0002). Regarding TKA, postoperative hemoglobin levels were higher for the TXA group than for the no-TXA group at POD-0 (12.10 vs 11.68 g/dL; P = .0135), POD-1 (11.62 vs 10.67 g/dL; P < .0001), and POD-2 (11.02 vs 10.11 g/dL; P < .0001). The same was true for anterior THA at POD-1 (11.03 vs 10.19 g/dL; P = .0034) and POD-2 (10.57 vs 9.64 g/dL; P = .0009) and posterior THA at POD-2 (11.04 vs 10.16 g/dL; P = .0003). See Table 5.
Hematocrit
There was a significant (P < .0006) 3-way interaction of TXA, procedure, and operative time after adjusting for age (P = .1597), sex (P < .0001), BMI (P < .0001), and operative time (P = .0003). Regarding TKA, postoperative hematocrit levels were higher for the TXA group than for the no-TXA group at POD-0 (36.52% vs 34.65%; P < .0001), POD-1 (34.62% vs 31.83%; P < .0001), and POD-2 (33.01% vs 30.20%; P < .0001). The same was true for anterior THA at POD-1 (32.82% vs 30.59%; P = .0037) and POD-2 (31.58% vs 28.61%; P = .0004) and posterior THA at POD-2 (32.93% vs 30.17%; P < .0001). See Table 6.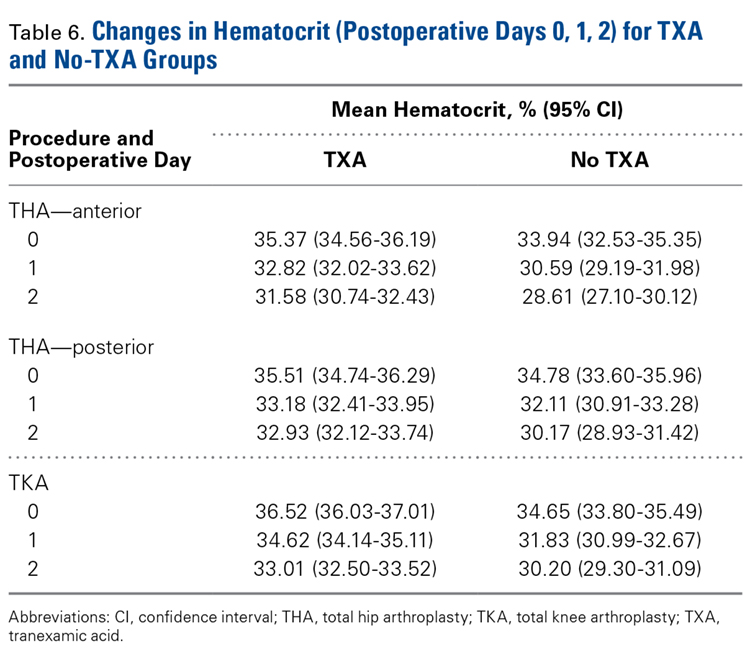
Postoperative Transfusions
Of the 477 patients, 25 (5.24%) required a postoperative transfusion. Postoperative transfusions were less likely (P < .0001) required in the TXA group (1.64%, 6/366) than in the no-TXA group (17.12%, 19/111). Given the smaller number of events, a more complex model accounting for clustered data and potential confounders was not used, and the different procedures were not evaluated separately.
Deep Vein Thrombosis and Pulmonary Embolism
Of the 477 patients, 2 developed a DVT, and 5 developed a PE. Both DVTs occurred in the TXA group (2/366, 0.55%; 95% CI, 0.07%-1.96%). Of the 5 PEs, 4 occurred in the TXA group (4/366, 1.09%; 95% CI, 0.30%-2.77%), and 1 occurred in the no-TXA group (1/111, 0.90%; 95% CI, 0.02%-4.92%). Given the exceedingly small number of events, no statistical significance was noted between groups.
Discussion
Orthopedic surgeons carefully balance patient expectations, societal needs, and regulatory mandates while providing excellent care and working under payers’ financial restrictions. The Centers for Medicare & Medicaid Services announced that, starting in 2016, TJAs will be reimbursed in total as a single bundled payment, adding to the need to provide optimal care in a fiscally responsible manner.21 Standardized protocols implementing multimodal therapies are pivotal in achieving favorable postoperative outcomes.
Our study results showed that IV-TXA use minimized hemoglobin and hematocrit reductions after TKA, anterior THA, and posterior THA. Postoperative anemia correlates with decreased ambulation ability and performance during the early postoperative period. In general, higher postoperative hemoglobin and hematocrit levels result in improved motor performance and shorter recovery.22 In addition, early ambulation is a validated predictor of favorable TJA outcomes. In our study, for TKA, anterior THA, and posterior THA, ambulation on POD-1 and POD-2 was significantly better for patients who received TXA than for patients who did not.
Transfusion rates were markedly lower for our TXA group than for our no-TXA group (1.64% vs 17.12%), confirming the findings of numerous other studies on outcomes of TJA with TXA.2,3,6-12,14,15 Transfusions impede physical therapy and affect hospitalization costs.
Although potential thrombosis-related adverse events remain an endpoint in studies involving TXA, we found a comparably low incidence of postoperative venous thrombosis in our TXA and no-TXA groups (1.09% and 0.90%, respectively). In addition, no patient in either group developed a postoperative arterial thrombosis.
This is the largest single-center study of TXA use in TKA, anterior THA, and posterior THA. The effect of TXA use on postoperative ambulation was not previously found with TJA.
This study had its limitations. First, it was not prospective, randomized, or double-blinded. However, the physical therapists who mobilized patients and recorded ambulation data were blinded to the study and its hypothesis and followed a standardized protocol for all patients. In addition, intraoperative blood loss was recorded by an anesthesiologist using a standardized protocol, and patients received TXA per orthopedic protocol and surgeon preference, without selection bias. Another limitation was that ambulation data were captured only for POD-1 and POD-2 (most patients were discharged by POD-3). However, a goal of the study was to capture immediate postoperative data in order to determine the efficacy of intraoperative TXA. Subsequent studies can determine if this early benefit leads to long-term clinical outcome improvements.
In reducing blood loss and transfusion rates, intra-articular TXA is as efficacious as IV-TXA.23-25 We anticipate that the improved clinical outcomes found with IV-TXA in our study will be similar with intra-articular TXA, but more study is needed to confirm this hypothesis.
Conclusion
This retrospective cohort study found that use of IV-TXA in TJA improved early ambulation and clinical outcomes (reduced anemia, fewer transfusions) in the initial postoperative period, without producing adverse events.
1. Kurtz SM, Ong KL, Lau E, Bozic KJ. Impact of the economic downturn on total joint replacement demand in the United States: updated projections to 2021. J Bone Joint Surg Am. 2014;96(8):624-630.
2. Jansen AJ, Andreica S, Claeys M, D’Haese J, Camu F, Jochmans K. Use of tranexamic acid for an effective blood conservation strategy after total knee arthroplasty. Br J Anaesth. 1999;83(4):596-601.
3. Benoni G, Fredin H, Knebel R, Nilsson P. Blood conservation with tranexamic acid in total hip arthroplasty. Acta Orthop Scand. 2001;72(5):442-448.
4. Tanaka N, Sakahashi, H, Sato E, Hirose K, Ishima T, Ishii S. Timing of the administration of tranexamic acid for maximum reduction in blood loss in arthroplasty of the knee. J Bone Joint Surg Br. 2001;83(5):702-705.
5. Nilsson IM. Clinical pharmacology of aminocaproic and tranexamic acids. J Clin Pathol Suppl (R Coll Pathol). 1980;14:41-47.
6. George DA, Sarraf KM, Nwaboku H. Single perioperative dose of tranexamic acid in primary hip and knee arthroplasty. Eur J Orthop Surg Traumatol. 2015;25(1):129-133.
7. Vigna-Taglianti F, Basso L, Rolfo P, et al. Tranexamic acid for reducing blood transfusions in arthroplasty interventions: a cost-effective practice. Eur J Orthop Surg Traumatol. 2014;24(4):545-551.
8. Ho KM, Ismail H. Use of intravenous tranexamic acid to reduce allogeneic blood transfusion in total hip and knee arthroplasty: a meta-analysis. Anaesth Intensive Care. 2003;31(5):529-537.
9. Poeran J, Rasul R, Suzuki S, et al. Tranexamic acid use and postoperative outcomes in patients undergoing total hip or knee arthroplasty in the United States: retrospective analysis of effectiveness and safety. BMJ. 2014;349:g4829.
10. Sculco PK, Pagnano MW. Perioperative solutions for rapid recovery joint arthroplasty: get ahead and stay ahead. J Arthroplasty. 2015;30(4):518-520.
11. Lozano M, Basora M, Peidro L, et al. Effectiveness and safety of tranexamic acid administration during total knee arthroplasty. Vox Sang. 2008;95(1):39-44.
12. Rajesparan K, Biant LC, Ahmad M, Field RE. The effect of an intravenous bolus of tranexamic acid on blood loss in total hip replacement. J Bone Joint Surg Br. 2009;91(6):776-783.
13. Alshryda S, Sarda P, Sukeik M, Nargol A, Blenkinsopp J, Mason JM. Tranexamic acid in total knee replacement. A systematic review and meta-analysis. J Bone Joint Surg Br. 2011;93(12):1577-1585.
14. Charoencholvanich K, Siriwattanasakul P. Tranexamic acid reduces blood loss and blood transfusion after TKA. Clin Orthop Relat Res. 2011;469(10):2874-2880.
15. Sukeik M, Alshryda S, Haddad FS, Mason JM. Systematic review and meta-analysis of the use of tranexamic acid in total hip replacement. J Bone Joint Surg Br. 2011;93(1):39-46.
16. Stowers M, Lemanu DP, Coleman B, Hill AG, Munro JT. Review article: perioperative care in enhanced recovery for total hip and knee arthroplasty. J Orthop Surg (Hong Kong). 2014;22(3):383-392.
17. Larsen K, Hansen TB, Søballe K. Hip arthroplasty patients benefit from accelerated perioperative care and rehabilitation. Acta Orthop. 2008;79(5):624-630.
18. Labraca NS, Castro-Sánchez AM, Matarán-Peñarrocha GA, Arroyo-Morales M, Sánchez-Joya Mdel M, Moreno-Lorenzo C. Benefits of starting rehabilitation within 24 hours of primary total knee arthroplasty: randomized clinical trial. Clin Rehabil. 2011;25(6):557-566.
19. Husted H, Hansen HC, Holm G, et al. What determines length of stay after total hip and knee arthroplasty? A nationwide study in Denmark. Arch Orthop Trauma Surg. 2010;130(2):263-268.
20. Husted H. Fast-track hip and knee arthroplasty: clinical and organizational aspects. Acta Orthop Suppl. 2012;83(346):1-39.
21. Comprehensive Care for Joint Replacement Model. CMS.gov. https://innovation.cms.gov/initiatives/cjr. Updated October 5, 2017.
22. Wang X, Rintala DH, Garber SL, Henson H. Association of hemoglobin levels, acute hemoglobin decrease, age, and co-morbidities with rehabilitation outcomes after total knee replacement. Am J Phys Med Rehabil. 2005;84(6):451-456.
23. Gomez-Barrena E, Ortega-Andreu M, Padilla-Eguiluz NG, Pérez-Chrzanowska H, Figueredo-Zalve R. Topical intra-articular compared with intravenous tranexamic acid to reduce blood loss in primary total knee replacement: a double-blind, randomized, controlled, noninferiority clinical trial. J Bone Joint Surg Am. 2014;96(23):1937-1944.
24. Martin JG, Cassatt KB, Kincaid-Cinnamon KA, Westendorf DS, Garton AS, Lemke JH. Topical administration of tranexamic acid in primary total hip and total knee arthroplasty. J Arthroplasty. 2014;29(5):889-894.
25. Alshryda S, Mason J, Sarda P, et al. Topical (intra-articular) tranexamic acid reduces blood loss and transfusion rates following total hip replacement: a randomized controlled trial (TRANX-H). J Bone Joint Surg Am. 2013;95(21):1969-1974.
Take-Home Points
- IV-TXA significantly reduces intraoperative blood loss following TJA.
- Early mobilization correlates with reduced incidence of postoperative complications.
- IV-TXA minimizes postoperative anemia, facilitating improved early ambulation following TJA.
- IV-TXA significantly reduces the need for postoperative transfusions.
- IV-TXA is safe to use with no adverse events noted.
By the year 2020, use of primary total knee arthroplasty (TKA) in the United States will increase an estimated 110%, to 1.375 million procedures annually, and use of primary total hip arthroplasty (THA) will increase an estimated 75%, to more than 500,000 procedures.1 Minimizing perioperative blood loss and improving early postoperative ambulation both correlate with reduced postoperative morbidity, allowing patients to return to their daily lives expeditiously.
Tranexamic acid (TXA), a fibrinolytic inhibitor, competitively blocks lysine receptor binding sites of plasminogen, sustaining and stabilizing the fibrin architecture.2 TXA must be present to occupy binding sites before plasminogen binds to fibrin, validating the need for preoperative administration so the drug is available early in the fibrinolytic cascade.3 Intravenous (IV) TXA diffuses rapidly into joint fluid and the synovial membrane.4 Drug concentration and elimination half-life in joint fluid are equivalent to those in serum. Elimination of TXA occurs by glomerular filtration, with about 30% of a 10-mg/kg dose removed in 1 hour, 55% over the first 3 hours, and 90% within 24 hours of IV administration.5
The efficacy of IV-TXA in minimizing total joint arthroplasty (TJA) perioperative blood loss has been proved in small studies and meta-analyses.6-9 TXA-induced blood conservation decreases or eliminates the need for postoperative transfusion, which can impede valuable, early ambulation.10 In addition, the positive clinical safety profile of TXA supports routine use of TXA in TJA.6,11-15
The benefits of early ambulation after TJA are well established. Getting patients to walk on the day of surgery is a key part of effective and rapid postoperative rehabilitation. Early mobilization correlates with reduced incidence of venous thrombosis and postoperative complications.16 In contrast to bed rest, sitting and standing promotes oxygen saturation, which improves tissue healing and minimizes adverse pulmonary events. Oxygen saturation also preserves muscle strength and blood flow, reducing the risk of venous thromboembolism and ulcers. Muscle strength must be maintained so normal gait can be regained.17 Compared with rehabilitation initiated 48 to 72 hours after TKA, rehabilitation initiated within 24 hours reduced the number of sessions needed to achieve independence and normal gait; in addition, early mobilization improved patient reports of pain after surgery.18 An evaluation of Denmark registry data revealed that mobilization to walking and use of crutches or canes was achieved earlier when ambulation was initiated on day of surgery.19 Finally, mobilization on day of surgery and during the immediate postoperative period improved long-term quality of life after TJA.20
We conducted a retrospective cohort study to determine if use of IV-TXA improves early ambulation and reduces blood loss after TKA and anterior and posterior THA. We hypothesized that IV-TXA use would reduce postoperative anemia and improve early ambulation and outcomes without producing adverse events during the immediate postoperative period. TXA reduces bleeding, and reduced incidence of hemarthrosis, wound swelling, and anemia could facilitate ambulation, reduce complications, and shorten recovery in patients who undergo TJA.
Patients and Methods
In February 2014, this retrospective cohort study received Institutional Review Board approval to compare the safety and efficacy of IV-TXA (vs no TXA) in patients who underwent TKA, anterior THA, and posterior THA.
In March 2012, multidisciplinary protocols were standardized to ensure a uniform hospital course for patients at our institution. All patients underwent preoperative testing and evaluation by a nurse practitioner and an anesthesiologist. In March 2013, IV-TXA became our standard of care. TXA use was contraindicated in patients with thromboembolic disease or with hypersensitivity to TXA. Patients without a contraindication were given two 10-mg/kg IV-TXA doses, each administered over 15 to 30 minutes; the first dose was administered before incision, and the second was infused at case close and/or at least 60 minutes after the first dose. Most TKA patients received regional (femoral) anesthesia and analgesia, and most THA patients received spinal or epidural anesthesia and analgesia. In a small percentage of cases, IV analgesia was patient-controlled, as determined by the pain service. There were no significant differences in anesthesia/analgesia modality between the 2 study groups—patients who received TXA and those who did not. Patients were then transitioned to oral opioids for pain management, unless otherwise contraindicated, and were ambulated 4 hours after end of surgery, unless medically unstable. Hematology and chemistry laboratory values were monitored daily during admission.
Patients underwent physical therapy (PT) after surgery and until hospital discharge. Physical therapists blinded to patients’ intraoperative use or no use of TXA measured ambulation. After initial evaluation on postoperative day 0 (POD-0), patients were ambulated twice daily. The daily ambulation distance used for the study was the larger of the 2 daily PT distances (occasionally, patients were unable to participate fully in both sessions). Patients received either enoxaparin or rivaroxaban for postoperative thromboprophylaxis (the anticoagulant used was based on surgeon preference). Enoxaparin was subcutaneously administered at 30 mg every 12 hours for TKA, 40 mg once daily for THA, 30 mg once daily for calculated creatinine clearance under 30 mL/min, or 40 mg every 12 hours for body mass index (BMI) 40 or above. With enoxaparin, therapy duration was 14 days. Oral rivaroxaban was administered at 10 mg once daily for 12 days for TKA and 35 days for THA unless contraindicated.
The primary outcome variables were ambulation measured on POD-1 and POD-2 and intraoperative blood loss. In addition, hemoglobin and hematocrit were measured on POD-0, POD-1, and POD-2. Ambulation was defined as number of feet walked during postoperative hospitalization. To calculate intraoperative blood loss, the anesthesiologist subtracted any saline irrigation volume from the total volume in the suction canister. Also noted were postoperative transfusions and any diagnosis of postoperative venous thromboembolism—specifically, deep vein thrombosis (DVT) or pulmonary embolism (PE).
Demographic and clinical characteristics of the TXA and no-TXA groups were compared using either 2-sample t test (for continuous variables) or χ2 test (for categorical variables).
The ambulation outcome was log-transformed to meet standard assumptions of Gaussian residuals and equality of variance. Means and 95% confidence intervals (CIs) were calculated on the log scale and were anti-logged so the results could be presented in their original units.
A linear mixed model was used to model intraoperative blood loss as a function of group (TXA, no TXA), procedure (TKA, anterior THA, posterior THA), and potential confounders (age, sex, BMI, operative time).
Linear mixed models for repeated measures were used to compare outcomes (hemoglobin, hematocrit) between groups (TXA, no TXA) and procedures (TKA, anterior THA, posterior THA) and to compare changes in outcomes over time. Group, procedure, and operative time interactions were explored. Potential confounders (age, sex, BMI, operative time) were included in the model as well.
A χ2 test was used to compare the groups (TXA, no TXA) on postoperative blood transfusion (yes, no). Given the smaller number of events, a more complex model accounting for clustered data and potential confounders was not used. Need for transfusion was clinically assessed case by case. Symptomatic anemia (dyspnea on exertion, headaches, tachycardia) was used as the primary indication for transfusion once hemoglobin fell below 8 g/dL or hematocrit below 24%. Number of patients with a postoperative thrombus formation was minimal. Therefore, this outcome was described with summary statistics and was not formally analyzed.
Results
Of the 477 patients who underwent TJAs (275 TKAs, 98 anterior THAs, 104 posterior THAs; all unilateral), 111 did not receive TXA (June 2012-February 2013), and 366 received TXA (March 2013-January 2014). Other than for the addition of IV-TXA, the same standardized protocols instituted in March 2012 continued throughout the study period. The difference in sample size between the TXA and no-TXA groups was not statistically significant and did not influence the outcome measures.
Ambulation
There was a significant (P = .0066) 3-way interaction of TXA, procedure, and operative time after adjusting for age (P < .0001), sex (P < .0001), BMI (P < .0001), and operative time (P = .8308). Regarding TKA, mean ambulation was higher for the TXA group than for the no-TXA group at POD-1 (8.36 vs 3.40 feet; P < .0001) and POD-2 (25.81 vs 18.75 feet; P = .0054). The same was true for anterior THA at POD-1 (10.86 vs 3.33 feet; P < .0001) and POD-2 (27.24 vs 13.19 feet; P < .0001) and posterior THA at POD-1 (10.64 vs 3.37 feet; P < .0001) and POD-2 (24.68 vs 12.93 feet; P = .0002). See Table 3.
Intraoperative Blood Loss
There was a significant 3-way interaction of TXA, procedure (P < .0053), and operative time (P < .0001) after adjusting for age (P < .6136), sex (P = .1147), and BMI (P = .6180). Regarding TKA, mean intraoperative blood loss was significantly lower for the TXA group than for the no-TXA group (241.58 vs 287.81 mL; P = .0004). The same was true for anterior THA (352.91 vs 533.79 mL; P < .0001). Regarding posterior THA, there was no significant difference between the TXA and no-TXA groups (326.00 vs 350.16 mL; P = .3246). See Table 4.
Hemoglobin
There was a significant (P = .0008) 3-way interaction of TXA, procedure, and operative time after adjusting for age (P = .0174), sex (P < .0001), BMI (P = .0007), and operative time (P = .0002). Regarding TKA, postoperative hemoglobin levels were higher for the TXA group than for the no-TXA group at POD-0 (12.10 vs 11.68 g/dL; P = .0135), POD-1 (11.62 vs 10.67 g/dL; P < .0001), and POD-2 (11.02 vs 10.11 g/dL; P < .0001). The same was true for anterior THA at POD-1 (11.03 vs 10.19 g/dL; P = .0034) and POD-2 (10.57 vs 9.64 g/dL; P = .0009) and posterior THA at POD-2 (11.04 vs 10.16 g/dL; P = .0003). See Table 5.
Hematocrit
There was a significant (P < .0006) 3-way interaction of TXA, procedure, and operative time after adjusting for age (P = .1597), sex (P < .0001), BMI (P < .0001), and operative time (P = .0003). Regarding TKA, postoperative hematocrit levels were higher for the TXA group than for the no-TXA group at POD-0 (36.52% vs 34.65%; P < .0001), POD-1 (34.62% vs 31.83%; P < .0001), and POD-2 (33.01% vs 30.20%; P < .0001). The same was true for anterior THA at POD-1 (32.82% vs 30.59%; P = .0037) and POD-2 (31.58% vs 28.61%; P = .0004) and posterior THA at POD-2 (32.93% vs 30.17%; P < .0001). See Table 6.
Postoperative Transfusions
Of the 477 patients, 25 (5.24%) required a postoperative transfusion. Postoperative transfusions were less likely (P < .0001) required in the TXA group (1.64%, 6/366) than in the no-TXA group (17.12%, 19/111). Given the smaller number of events, a more complex model accounting for clustered data and potential confounders was not used, and the different procedures were not evaluated separately.
Deep Vein Thrombosis and Pulmonary Embolism
Of the 477 patients, 2 developed a DVT, and 5 developed a PE. Both DVTs occurred in the TXA group (2/366, 0.55%; 95% CI, 0.07%-1.96%). Of the 5 PEs, 4 occurred in the TXA group (4/366, 1.09%; 95% CI, 0.30%-2.77%), and 1 occurred in the no-TXA group (1/111, 0.90%; 95% CI, 0.02%-4.92%). Given the exceedingly small number of events, no statistical significance was noted between groups.
Discussion
Orthopedic surgeons carefully balance patient expectations, societal needs, and regulatory mandates while providing excellent care and working under payers’ financial restrictions. The Centers for Medicare & Medicaid Services announced that, starting in 2016, TJAs will be reimbursed in total as a single bundled payment, adding to the need to provide optimal care in a fiscally responsible manner.21 Standardized protocols implementing multimodal therapies are pivotal in achieving favorable postoperative outcomes.
Our study results showed that IV-TXA use minimized hemoglobin and hematocrit reductions after TKA, anterior THA, and posterior THA. Postoperative anemia correlates with decreased ambulation ability and performance during the early postoperative period. In general, higher postoperative hemoglobin and hematocrit levels result in improved motor performance and shorter recovery.22 In addition, early ambulation is a validated predictor of favorable TJA outcomes. In our study, for TKA, anterior THA, and posterior THA, ambulation on POD-1 and POD-2 was significantly better for patients who received TXA than for patients who did not.
Transfusion rates were markedly lower for our TXA group than for our no-TXA group (1.64% vs 17.12%), confirming the findings of numerous other studies on outcomes of TJA with TXA.2,3,6-12,14,15 Transfusions impede physical therapy and affect hospitalization costs.
Although potential thrombosis-related adverse events remain an endpoint in studies involving TXA, we found a comparably low incidence of postoperative venous thrombosis in our TXA and no-TXA groups (1.09% and 0.90%, respectively). In addition, no patient in either group developed a postoperative arterial thrombosis.
This is the largest single-center study of TXA use in TKA, anterior THA, and posterior THA. The effect of TXA use on postoperative ambulation was not previously found with TJA.
This study had its limitations. First, it was not prospective, randomized, or double-blinded. However, the physical therapists who mobilized patients and recorded ambulation data were blinded to the study and its hypothesis and followed a standardized protocol for all patients. In addition, intraoperative blood loss was recorded by an anesthesiologist using a standardized protocol, and patients received TXA per orthopedic protocol and surgeon preference, without selection bias. Another limitation was that ambulation data were captured only for POD-1 and POD-2 (most patients were discharged by POD-3). However, a goal of the study was to capture immediate postoperative data in order to determine the efficacy of intraoperative TXA. Subsequent studies can determine if this early benefit leads to long-term clinical outcome improvements.
In reducing blood loss and transfusion rates, intra-articular TXA is as efficacious as IV-TXA.23-25 We anticipate that the improved clinical outcomes found with IV-TXA in our study will be similar with intra-articular TXA, but more study is needed to confirm this hypothesis.
Conclusion
This retrospective cohort study found that use of IV-TXA in TJA improved early ambulation and clinical outcomes (reduced anemia, fewer transfusions) in the initial postoperative period, without producing adverse events.
1. Kurtz SM, Ong KL, Lau E, Bozic KJ. Impact of the economic downturn on total joint replacement demand in the United States: updated projections to 2021. J Bone Joint Surg Am. 2014;96(8):624-630.
2. Jansen AJ, Andreica S, Claeys M, D’Haese J, Camu F, Jochmans K. Use of tranexamic acid for an effective blood conservation strategy after total knee arthroplasty. Br J Anaesth. 1999;83(4):596-601.
3. Benoni G, Fredin H, Knebel R, Nilsson P. Blood conservation with tranexamic acid in total hip arthroplasty. Acta Orthop Scand. 2001;72(5):442-448.
4. Tanaka N, Sakahashi, H, Sato E, Hirose K, Ishima T, Ishii S. Timing of the administration of tranexamic acid for maximum reduction in blood loss in arthroplasty of the knee. J Bone Joint Surg Br. 2001;83(5):702-705.
5. Nilsson IM. Clinical pharmacology of aminocaproic and tranexamic acids. J Clin Pathol Suppl (R Coll Pathol). 1980;14:41-47.
6. George DA, Sarraf KM, Nwaboku H. Single perioperative dose of tranexamic acid in primary hip and knee arthroplasty. Eur J Orthop Surg Traumatol. 2015;25(1):129-133.
7. Vigna-Taglianti F, Basso L, Rolfo P, et al. Tranexamic acid for reducing blood transfusions in arthroplasty interventions: a cost-effective practice. Eur J Orthop Surg Traumatol. 2014;24(4):545-551.
8. Ho KM, Ismail H. Use of intravenous tranexamic acid to reduce allogeneic blood transfusion in total hip and knee arthroplasty: a meta-analysis. Anaesth Intensive Care. 2003;31(5):529-537.
9. Poeran J, Rasul R, Suzuki S, et al. Tranexamic acid use and postoperative outcomes in patients undergoing total hip or knee arthroplasty in the United States: retrospective analysis of effectiveness and safety. BMJ. 2014;349:g4829.
10. Sculco PK, Pagnano MW. Perioperative solutions for rapid recovery joint arthroplasty: get ahead and stay ahead. J Arthroplasty. 2015;30(4):518-520.
11. Lozano M, Basora M, Peidro L, et al. Effectiveness and safety of tranexamic acid administration during total knee arthroplasty. Vox Sang. 2008;95(1):39-44.
12. Rajesparan K, Biant LC, Ahmad M, Field RE. The effect of an intravenous bolus of tranexamic acid on blood loss in total hip replacement. J Bone Joint Surg Br. 2009;91(6):776-783.
13. Alshryda S, Sarda P, Sukeik M, Nargol A, Blenkinsopp J, Mason JM. Tranexamic acid in total knee replacement. A systematic review and meta-analysis. J Bone Joint Surg Br. 2011;93(12):1577-1585.
14. Charoencholvanich K, Siriwattanasakul P. Tranexamic acid reduces blood loss and blood transfusion after TKA. Clin Orthop Relat Res. 2011;469(10):2874-2880.
15. Sukeik M, Alshryda S, Haddad FS, Mason JM. Systematic review and meta-analysis of the use of tranexamic acid in total hip replacement. J Bone Joint Surg Br. 2011;93(1):39-46.
16. Stowers M, Lemanu DP, Coleman B, Hill AG, Munro JT. Review article: perioperative care in enhanced recovery for total hip and knee arthroplasty. J Orthop Surg (Hong Kong). 2014;22(3):383-392.
17. Larsen K, Hansen TB, Søballe K. Hip arthroplasty patients benefit from accelerated perioperative care and rehabilitation. Acta Orthop. 2008;79(5):624-630.
18. Labraca NS, Castro-Sánchez AM, Matarán-Peñarrocha GA, Arroyo-Morales M, Sánchez-Joya Mdel M, Moreno-Lorenzo C. Benefits of starting rehabilitation within 24 hours of primary total knee arthroplasty: randomized clinical trial. Clin Rehabil. 2011;25(6):557-566.
19. Husted H, Hansen HC, Holm G, et al. What determines length of stay after total hip and knee arthroplasty? A nationwide study in Denmark. Arch Orthop Trauma Surg. 2010;130(2):263-268.
20. Husted H. Fast-track hip and knee arthroplasty: clinical and organizational aspects. Acta Orthop Suppl. 2012;83(346):1-39.
21. Comprehensive Care for Joint Replacement Model. CMS.gov. https://innovation.cms.gov/initiatives/cjr. Updated October 5, 2017.
22. Wang X, Rintala DH, Garber SL, Henson H. Association of hemoglobin levels, acute hemoglobin decrease, age, and co-morbidities with rehabilitation outcomes after total knee replacement. Am J Phys Med Rehabil. 2005;84(6):451-456.
23. Gomez-Barrena E, Ortega-Andreu M, Padilla-Eguiluz NG, Pérez-Chrzanowska H, Figueredo-Zalve R. Topical intra-articular compared with intravenous tranexamic acid to reduce blood loss in primary total knee replacement: a double-blind, randomized, controlled, noninferiority clinical trial. J Bone Joint Surg Am. 2014;96(23):1937-1944.
24. Martin JG, Cassatt KB, Kincaid-Cinnamon KA, Westendorf DS, Garton AS, Lemke JH. Topical administration of tranexamic acid in primary total hip and total knee arthroplasty. J Arthroplasty. 2014;29(5):889-894.
25. Alshryda S, Mason J, Sarda P, et al. Topical (intra-articular) tranexamic acid reduces blood loss and transfusion rates following total hip replacement: a randomized controlled trial (TRANX-H). J Bone Joint Surg Am. 2013;95(21):1969-1974.
Trends in Hysterectomy Rates and Approaches in the VA
The VA operates the largest integrated health care system in the country, consisting of 144 hospitals and 1,221 outpatient clinics. This system provides medical care for about 22 million veterans. In 2015, women accounted for nearly 10% of the veteran population and are expected to increase to about 16% by 2040.1 With an expected population increase of 18,000 per year over the next 10 years, women are the fastest growing group of veterans.
The VA acknowledges that women are an integral part of the veteran community and that a paradigm shift must occur to meet their unique health needs. Although clinical services specific to women veterans’ health needs have been introduced within the VA, gynecologic surgical services must be addressed in order to improve access and provide comprehensive women’s health care within the VA system.
About 600,000 hysterectomies are performed annually in the U.S., making this procedure one of the most commonly performed in women.2 Over the past 30 years, technologic advances have allowed surgeons to perform more hysterectomies via minimally invasive methods. Both the American Congress of Obstetricians and Gynecologists and American Association of Gynecologic Laparoscopists have published consensus statements that minimally invasive hysterectomy should be the standard of care.3,4 Studies in non-VA facilities have shown that practice patterns in the route of hysterectomy have evolved with the advancement of surgical equipment and techniques.
It is uncertain, however, whether these changes in practice patterns exist in the VA, because there are limited published data. Given the frequency of hysterectomies in the U.S., the rate and route of this procedure are easily identifiable measures that can be evaluated and utilized as a comparison model for health care received within the VA vs the civilian sector.
The aim of this study was to assess the changes in rate and surgical approach to benign hysterectomy for women veterans at VAMCs and referrals to non-VA facilities over a 10-year period. The authors’ hypothesis was that a minimally invasive approach would be more common in recent years. This study also compares published national data to evaluate whether the VA is offering comparable surgical services to the civilian sector.
Methods
The institutional review boards of Indiana University and the Richard L. Roudebush VAMC in Indianapolis, Indiana, approved this retrospective cross-sectional study. The VHA Support Service Center (VSSC) authorized access to VA database information.
All women veterans who underwent hysterectomy for benign indications from fiscal years (FY) 2005 to 2014 were included. In order to identify this group, the authors queried the VA Corporate Data Warehouse (CDW) and the Non-VA Care Cube for all hysterectomy current procedural terminology (CPT) codes typically performed for benign indications, including 58150, 58152, 58180, 58260, 58262, 58263, 58267, 58270, 58290, 58291, 58292, 58293, 58294, 58541, 58542, 58543, 58544, 58550, 58552, 58553, 58554, 58570, 58571, 58572, and 58573. For each patient identified, the following variables were collected: date of the procedure, facility location, primary CPT code, primary ICD-9 code, and patient age. Patients whose primary ICD-9 code was for a malignancy of gynecologic origin were excluded from the study.
The CDW is a national database collected by the VA Office of Information and Technology to provide clinical data for VA analytical purposes. The Non-VA Care Cube identifies services purchased for veterans with non-VA care dollars and, therefore, captures women veterans who were referred outside the VA for a hysterectomy. Additional data collected include age, gender, hospital complexity, place of care, payment location, primary CPT, primary ICD-9, and several other parameters. The annual number of women veterans accessing VA health care was extracted from the VSSC Unique Patients Cube.
Laparoscopic hysterectomy was defined as total laparoscopic hysterectomy, laparoscopic-assisted vaginal hysterectomy, laparoscopic-supracervical hysterectomy, and robotic-assisted laparoscopic hysterectomy. Minimally invasive hysterectomy was defined as all laparoscopic and vaginal hysterectomies.
Frequency distributions between categoric variables were compared using chi-squared tests. The population-adjusted hysterectomy rates were estimated by dividing the total number of hysterectomies by the number of women veterans accessing VA medical care. Hysterectomy rates are reported as rate per 1,000 women per year. A time trend analysis was performed with linear regression to evaluate the slopes of trends for each route of hysterectomy, using Microsoft Excel 2010 (Redmond, WA). The authors analyzed the relationship between route of hysterectomy and fiscal year, using a multivariable logistic regression that was adjusted for age, district, and surgical diagnosis. The adjusted relative risk (RR) for each type of hysterectomy was reported with 95% confidence intervals (CI). All statistical analyses were performed using SPSS 12.0 (Chicago, IL) with P < .05 defined as being statistically significant.To ensure the accuracy of the CDW data, the documented CPT and ICD-9 codes were compared between the CDW and the VA electronic medical records (EMR) for 400 charts selected at random. This cohort represents about 5% of the total charts and was felt to be an adequate measure of the entire sample since the CPT and ICD-9 codes were verified and matched 100% of the time. Demographic and descriptive data regarding body mass index, level of education, race, smoking status, medical comorbidities, and surgical history were excluded from the study because it was either not available or not consistently reported within the CDW.
Results
A retrospective query of the CDW identified 8,327 hysterectomies performed at the VA for benign indications from fiscal year (FY) 2005 to FY 2014. The total number of annual hysterectomies at the VA increased 30.7% from 710 in FY 2004 to 1,025 in FY 2014. The annual number of women veterans who accessed VA health care increased 30.8% from 412,271 to 596,011 during the same time frame. Thus, the population adjusted hysterectomy rate remained stable at 1.72 (Figure 1).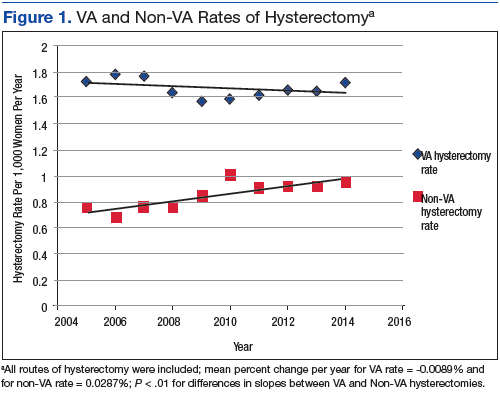
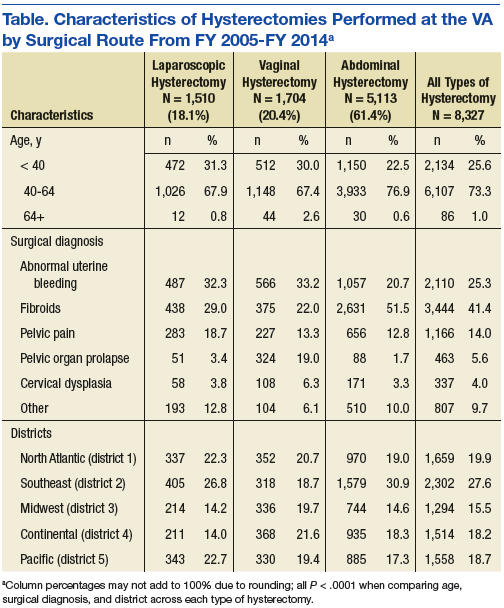
The authors also analyzed the VA data by district and decided to highlight the most recent data trends, as this is most applicable to how the VA currently operates. During FY 2014, the VA hysterectomy rates were as follows: district 1 (North Atlantic) 1.52; district 2 (Southeast) 2.21; district 3 (Midwest) 1.47; district 4 (Continental) 1.43; and district 5 (Pacific) 1.64 (Figure 2)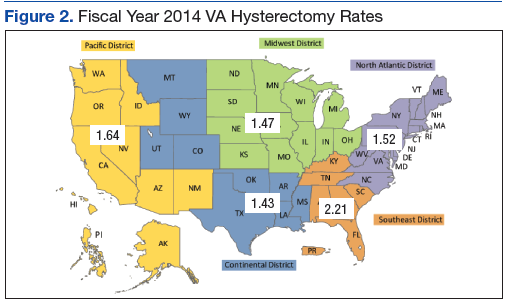
During the study period, calculated hysterectomy rates based on route at the VA showed that the laparoscopic hysterectomy rate increased from 0.11 to 0.53, the vaginal hysterectomy rate remained relatively stable at 0.34 to 0.37, and the abdominal hysterectomy rate declined from 1.28 to 0.8 (Figure 3).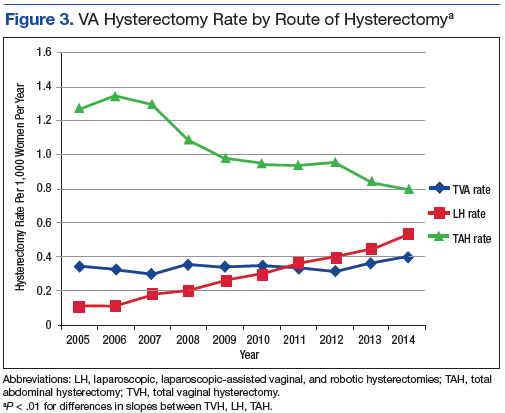
Discussion
Although the total hysterectomy rate within the VA remained stable during the study period, the minimally invasive hysterectomy rate increased significantly. In FY 2014, the majority of hysterectomies at the VA were performed via a minimally invasive approach. Minimally invasive hysterectomy has many recognized advantages over abdominal hysterectomy as it offers a significant reduction in postoperative pain, narcotic use, length of stay, intraoperative blood loss, fever, deep venous thrombosis, and a faster recovery with return to baseline functioning thus improving overall quality of life.5-7 Previous literature of VA hysterectomy data from 1991 to 1997 reported an abdominal hysterectomy percentage of 74%, vaginal hysterectomy percentage of 22%, and laparoscopic assisted vaginal hysterectomy percentage of 4%.8
Additionally, previous literature of the civilian sector reported a national laparoscopic hysterectomy percentage of 32.4% in 2012, which is comparable to the laparoscopic hysterectomy percentage found in this study.9,10 These data highlight the growth of laparoscopic hysterectomy at the VA, which is comparable to that of the civilian sector.The Nationwide Inpatient Sample reported an abdominal hysterectomy percentage of 66.1% in 2003 and 52.8% in 2012.9,10 The authors observed a similar decline in the abdominal hysterectomy rate at the VA over the period studied. Although many factors may have contributed to this decline, the growth of laparoscopic hysterectomy was a possible contributing factor since the vaginal hysterectomy rate remained stable over the study period. Future studies are needed to evaluate surgical complications and readmission rates in order to more accurately assess the quality of gynecologic surgical care provided by the VA compared with the civilian sector.
Strengths and Limitations
This study has several important strengths. First, the large sample size from VA nationwide databases included information from all VAMC performing hysterectomies. Second, this study included 10 years of data, with the latest data from 2014, allowing for depiction of both long-term and recent trends.
Potential issues with large databases such as the CDW and the Non-VA Care Cube included inaccurate coding of procedures and diagnoses as well as missing data. This possible limitation was addressed by randomly selecting 400 patients in the database to verify the database information against the patient’s EMR, which matched 100% of the time. In addition, the authors calculated the hysterectomy rates using a denominator based on all women veterans accessing VA health care, which included women who had previously had a hysterectomy. Therefore, the true hysterectomy rate may have been underestimated.
Conclusion
The VA operates the largest health care system in the U.S. with more than 500,000 women veterans currently utilizing VA health care.11 The VA provides services to women veterans living in urban, suburban, and rural areas. The breadth of geographic locations, the declining number of VA facilities offering gynecologic surgical services, and the growing population of female veterans present unique challenges to providing accessible and comparable health care to these female patients.
VA district 4 (Continental) has the lowest population density as well as the lowest VA hysterectomy rate in FY 2014, which may be attributable to the aforementioned challenges. As a result of these challenges, an increasing number of gynecologic surgical referrals to non-VA facilities was observed during the study period. The VA has made considerable progress in supporting and promoting health care for women by strategically enhancing services and access for women veterans. Although the number of hysterectomies has increased across VA facilities offering gynecologic surgical services, about 1 in 3 women veterans are referred to non-VA facilities for their gynecologic surgical needs. The VA has a challenging opportunity to expand gynecologic surgical services and improve access for the growing population of women veterans. To accommodate this growth, the VA may consider strategically increasing the number of facilities providing gynecologic surgical services or expanding established gynecologic surgical departments.
1. U.S. Department of Veterans Affairs, National Center for Veterans Analysis and Statistics. Unique veteran users profile FY 2015. https://www.va.gov/vetdata/docs/SpecialReports/Profile_of_Unique_Veteran_Users_2015.pdf. Published December 2016. Accessed August 24, 2017.
2. Centers for Disease Control and Prevention. Hysterectomy surveillance - United States, 1994-1999. Malaria surveillance - United States, 2000. MMWR Morb Mortal Wkly Rep; 2002;55(SS-5):1-28. https://stacks.cdc.gov/view/cdc/13513/Share. Published July 12, 2002. Accessed August 24, 2017.
3. AAGL Advancing Minimally Invasive Gynecology Worldwide. AAGL position statement: route of hysterectomy to treat benign uterine disease. J Minim Invasive Gynecol. 2011;18(1):1-3.
4. [No authors listed]. ACOG Committee Opinion No. 444: choosing the route of hysterectomy for benign disease. Obstet Gynecol. 2009;114(5):1156-1158.
5. Garry R, Fountain J, Mason S, et al. The eVALuate study: two parallel randomised trials, one comparing laparoscopic with abdominal hysterectomy, the other comparing laparoscopic with vaginal hysterectomy. BMJ. 2004;328:129.
6. Marana R, Busacca M, Zupi E, Garcea N, Paparella P, Catalano GF. Laparoscopically assisted vaginal hysterectomy versus total abdominal hysterectomy: a prospective, randomized, multicenter study. Am J Obstet Gynecol. 1999;180(2, pt 1):270-275.
7. Aarts JW, Nieboer TE, Johnson N, et al. Surgical approach to hysterectomy for benign gynaecological disease. Cochrane Database Syst Rev. 2015(8):CD003677.
8. Weaver F, Hynes D, Goldberg JM, Khuri S, Daley J, Henderson W. Hysterectomy in Veterans Affairs medical centers. Obstet Gynecol. 2001;97(6):88-94.
9. Desai VB, Xu X. An update on inpatient hysterectomy routes in the United States. Am J Obstet Gynecol. 2015;213(5):742-743.
10. Wu JM, Wechter ME, Geller EJ, Nguyen TV, Visco AG. Hysterectomy rates in the United States, 2003. Obstet Gynecol. 2007;110(5):1091-1095.
11. U.S. Department of Veterans Affairs. Study of barriers for women veterans to VA health care. Final report 2015. http://www.womenshealth.va.gov/WOMENSHEALTH/docs/Womens%20Health%20Services_Barriers%20to%20Care%20Final%20Report_April2015.pdf. Published April 2015. Accessed August 24, 2017
The VA operates the largest integrated health care system in the country, consisting of 144 hospitals and 1,221 outpatient clinics. This system provides medical care for about 22 million veterans. In 2015, women accounted for nearly 10% of the veteran population and are expected to increase to about 16% by 2040.1 With an expected population increase of 18,000 per year over the next 10 years, women are the fastest growing group of veterans.
The VA acknowledges that women are an integral part of the veteran community and that a paradigm shift must occur to meet their unique health needs. Although clinical services specific to women veterans’ health needs have been introduced within the VA, gynecologic surgical services must be addressed in order to improve access and provide comprehensive women’s health care within the VA system.
About 600,000 hysterectomies are performed annually in the U.S., making this procedure one of the most commonly performed in women.2 Over the past 30 years, technologic advances have allowed surgeons to perform more hysterectomies via minimally invasive methods. Both the American Congress of Obstetricians and Gynecologists and American Association of Gynecologic Laparoscopists have published consensus statements that minimally invasive hysterectomy should be the standard of care.3,4 Studies in non-VA facilities have shown that practice patterns in the route of hysterectomy have evolved with the advancement of surgical equipment and techniques.
It is uncertain, however, whether these changes in practice patterns exist in the VA, because there are limited published data. Given the frequency of hysterectomies in the U.S., the rate and route of this procedure are easily identifiable measures that can be evaluated and utilized as a comparison model for health care received within the VA vs the civilian sector.
The aim of this study was to assess the changes in rate and surgical approach to benign hysterectomy for women veterans at VAMCs and referrals to non-VA facilities over a 10-year period. The authors’ hypothesis was that a minimally invasive approach would be more common in recent years. This study also compares published national data to evaluate whether the VA is offering comparable surgical services to the civilian sector.
Methods
The institutional review boards of Indiana University and the Richard L. Roudebush VAMC in Indianapolis, Indiana, approved this retrospective cross-sectional study. The VHA Support Service Center (VSSC) authorized access to VA database information.
All women veterans who underwent hysterectomy for benign indications from fiscal years (FY) 2005 to 2014 were included. In order to identify this group, the authors queried the VA Corporate Data Warehouse (CDW) and the Non-VA Care Cube for all hysterectomy current procedural terminology (CPT) codes typically performed for benign indications, including 58150, 58152, 58180, 58260, 58262, 58263, 58267, 58270, 58290, 58291, 58292, 58293, 58294, 58541, 58542, 58543, 58544, 58550, 58552, 58553, 58554, 58570, 58571, 58572, and 58573. For each patient identified, the following variables were collected: date of the procedure, facility location, primary CPT code, primary ICD-9 code, and patient age. Patients whose primary ICD-9 code was for a malignancy of gynecologic origin were excluded from the study.
The CDW is a national database collected by the VA Office of Information and Technology to provide clinical data for VA analytical purposes. The Non-VA Care Cube identifies services purchased for veterans with non-VA care dollars and, therefore, captures women veterans who were referred outside the VA for a hysterectomy. Additional data collected include age, gender, hospital complexity, place of care, payment location, primary CPT, primary ICD-9, and several other parameters. The annual number of women veterans accessing VA health care was extracted from the VSSC Unique Patients Cube.
Laparoscopic hysterectomy was defined as total laparoscopic hysterectomy, laparoscopic-assisted vaginal hysterectomy, laparoscopic-supracervical hysterectomy, and robotic-assisted laparoscopic hysterectomy. Minimally invasive hysterectomy was defined as all laparoscopic and vaginal hysterectomies.
Frequency distributions between categoric variables were compared using chi-squared tests. The population-adjusted hysterectomy rates were estimated by dividing the total number of hysterectomies by the number of women veterans accessing VA medical care. Hysterectomy rates are reported as rate per 1,000 women per year. A time trend analysis was performed with linear regression to evaluate the slopes of trends for each route of hysterectomy, using Microsoft Excel 2010 (Redmond, WA). The authors analyzed the relationship between route of hysterectomy and fiscal year, using a multivariable logistic regression that was adjusted for age, district, and surgical diagnosis. The adjusted relative risk (RR) for each type of hysterectomy was reported with 95% confidence intervals (CI). All statistical analyses were performed using SPSS 12.0 (Chicago, IL) with P < .05 defined as being statistically significant.To ensure the accuracy of the CDW data, the documented CPT and ICD-9 codes were compared between the CDW and the VA electronic medical records (EMR) for 400 charts selected at random. This cohort represents about 5% of the total charts and was felt to be an adequate measure of the entire sample since the CPT and ICD-9 codes were verified and matched 100% of the time. Demographic and descriptive data regarding body mass index, level of education, race, smoking status, medical comorbidities, and surgical history were excluded from the study because it was either not available or not consistently reported within the CDW.
Results
A retrospective query of the CDW identified 8,327 hysterectomies performed at the VA for benign indications from fiscal year (FY) 2005 to FY 2014. The total number of annual hysterectomies at the VA increased 30.7% from 710 in FY 2004 to 1,025 in FY 2014. The annual number of women veterans who accessed VA health care increased 30.8% from 412,271 to 596,011 during the same time frame. Thus, the population adjusted hysterectomy rate remained stable at 1.72 (Figure 1).
The authors also analyzed the VA data by district and decided to highlight the most recent data trends, as this is most applicable to how the VA currently operates. During FY 2014, the VA hysterectomy rates were as follows: district 1 (North Atlantic) 1.52; district 2 (Southeast) 2.21; district 3 (Midwest) 1.47; district 4 (Continental) 1.43; and district 5 (Pacific) 1.64 (Figure 2)
During the study period, calculated hysterectomy rates based on route at the VA showed that the laparoscopic hysterectomy rate increased from 0.11 to 0.53, the vaginal hysterectomy rate remained relatively stable at 0.34 to 0.37, and the abdominal hysterectomy rate declined from 1.28 to 0.8 (Figure 3).
Discussion
Although the total hysterectomy rate within the VA remained stable during the study period, the minimally invasive hysterectomy rate increased significantly. In FY 2014, the majority of hysterectomies at the VA were performed via a minimally invasive approach. Minimally invasive hysterectomy has many recognized advantages over abdominal hysterectomy as it offers a significant reduction in postoperative pain, narcotic use, length of stay, intraoperative blood loss, fever, deep venous thrombosis, and a faster recovery with return to baseline functioning thus improving overall quality of life.5-7 Previous literature of VA hysterectomy data from 1991 to 1997 reported an abdominal hysterectomy percentage of 74%, vaginal hysterectomy percentage of 22%, and laparoscopic assisted vaginal hysterectomy percentage of 4%.8
Additionally, previous literature of the civilian sector reported a national laparoscopic hysterectomy percentage of 32.4% in 2012, which is comparable to the laparoscopic hysterectomy percentage found in this study.9,10 These data highlight the growth of laparoscopic hysterectomy at the VA, which is comparable to that of the civilian sector.The Nationwide Inpatient Sample reported an abdominal hysterectomy percentage of 66.1% in 2003 and 52.8% in 2012.9,10 The authors observed a similar decline in the abdominal hysterectomy rate at the VA over the period studied. Although many factors may have contributed to this decline, the growth of laparoscopic hysterectomy was a possible contributing factor since the vaginal hysterectomy rate remained stable over the study period. Future studies are needed to evaluate surgical complications and readmission rates in order to more accurately assess the quality of gynecologic surgical care provided by the VA compared with the civilian sector.
Strengths and Limitations
This study has several important strengths. First, the large sample size from VA nationwide databases included information from all VAMC performing hysterectomies. Second, this study included 10 years of data, with the latest data from 2014, allowing for depiction of both long-term and recent trends.
Potential issues with large databases such as the CDW and the Non-VA Care Cube included inaccurate coding of procedures and diagnoses as well as missing data. This possible limitation was addressed by randomly selecting 400 patients in the database to verify the database information against the patient’s EMR, which matched 100% of the time. In addition, the authors calculated the hysterectomy rates using a denominator based on all women veterans accessing VA health care, which included women who had previously had a hysterectomy. Therefore, the true hysterectomy rate may have been underestimated.
Conclusion
The VA operates the largest health care system in the U.S. with more than 500,000 women veterans currently utilizing VA health care.11 The VA provides services to women veterans living in urban, suburban, and rural areas. The breadth of geographic locations, the declining number of VA facilities offering gynecologic surgical services, and the growing population of female veterans present unique challenges to providing accessible and comparable health care to these female patients.
VA district 4 (Continental) has the lowest population density as well as the lowest VA hysterectomy rate in FY 2014, which may be attributable to the aforementioned challenges. As a result of these challenges, an increasing number of gynecologic surgical referrals to non-VA facilities was observed during the study period. The VA has made considerable progress in supporting and promoting health care for women by strategically enhancing services and access for women veterans. Although the number of hysterectomies has increased across VA facilities offering gynecologic surgical services, about 1 in 3 women veterans are referred to non-VA facilities for their gynecologic surgical needs. The VA has a challenging opportunity to expand gynecologic surgical services and improve access for the growing population of women veterans. To accommodate this growth, the VA may consider strategically increasing the number of facilities providing gynecologic surgical services or expanding established gynecologic surgical departments.
1. U.S. Department of Veterans Affairs, National Center for Veterans Analysis and Statistics. Unique veteran users profile FY 2015. https://www.va.gov/vetdata/docs/SpecialReports/Profile_of_Unique_Veteran_Users_2015.pdf. Published December 2016. Accessed August 24, 2017.
2. Centers for Disease Control and Prevention. Hysterectomy surveillance - United States, 1994-1999. Malaria surveillance - United States, 2000. MMWR Morb Mortal Wkly Rep; 2002;55(SS-5):1-28. https://stacks.cdc.gov/view/cdc/13513/Share. Published July 12, 2002. Accessed August 24, 2017.
3. AAGL Advancing Minimally Invasive Gynecology Worldwide. AAGL position statement: route of hysterectomy to treat benign uterine disease. J Minim Invasive Gynecol. 2011;18(1):1-3.
4. [No authors listed]. ACOG Committee Opinion No. 444: choosing the route of hysterectomy for benign disease. Obstet Gynecol. 2009;114(5):1156-1158.
5. Garry R, Fountain J, Mason S, et al. The eVALuate study: two parallel randomised trials, one comparing laparoscopic with abdominal hysterectomy, the other comparing laparoscopic with vaginal hysterectomy. BMJ. 2004;328:129.
6. Marana R, Busacca M, Zupi E, Garcea N, Paparella P, Catalano GF. Laparoscopically assisted vaginal hysterectomy versus total abdominal hysterectomy: a prospective, randomized, multicenter study. Am J Obstet Gynecol. 1999;180(2, pt 1):270-275.
7. Aarts JW, Nieboer TE, Johnson N, et al. Surgical approach to hysterectomy for benign gynaecological disease. Cochrane Database Syst Rev. 2015(8):CD003677.
8. Weaver F, Hynes D, Goldberg JM, Khuri S, Daley J, Henderson W. Hysterectomy in Veterans Affairs medical centers. Obstet Gynecol. 2001;97(6):88-94.
9. Desai VB, Xu X. An update on inpatient hysterectomy routes in the United States. Am J Obstet Gynecol. 2015;213(5):742-743.
10. Wu JM, Wechter ME, Geller EJ, Nguyen TV, Visco AG. Hysterectomy rates in the United States, 2003. Obstet Gynecol. 2007;110(5):1091-1095.
11. U.S. Department of Veterans Affairs. Study of barriers for women veterans to VA health care. Final report 2015. http://www.womenshealth.va.gov/WOMENSHEALTH/docs/Womens%20Health%20Services_Barriers%20to%20Care%20Final%20Report_April2015.pdf. Published April 2015. Accessed August 24, 2017

Clinical Trial Designs for Topical Antifungal Treatments of Onychomycosis and Implications on Clinical Practice
Onychomycosis is a fungal nail infection primarily caused by dermatophytes.1 If left untreated, the infection can cause nail destruction and deformities,1 resulting in pain and discomfort,2 impaired foot mobility,3 and an overall reduced quality of life.1 Onychomycosis is a chronic condition that requires long treatment periods due to the slow growth rates of toenails.1 To successfully cure the condition, fungal eradication must be achieved.
Prior to the US Food and Drug Administration (FDA) approval of tavaborole and efinaconazole, ciclopirox was the only approved topical treatment for onychomycosis.4 The recent approval of tavaborole and efinaconazole has increased treatment options available to patients and has started to pave the way for future topical treatments. This article discusses the 3 approved topical treatments for onychomycosis and focuses on the design of the phase 3 clinical trials that led to their approval.
Topical Agents Used to Treat Onychomycosis
Tavaborole, efinaconazole, and ciclopirox have undergone extensive clinical investigation to receive FDA approval. Results from pivotal phase 3 studies establishing the efficacy and safety of each agent formed the basis for regulatory submission. Although it may seem intuitive to compare the relative performance of these agents based on their respective phase 3 clinical trial data, there are important differences in study methodology, conduct, and populations that prevent direct comparisons. The FDA provides limited guidance to the pharmaceutical industry on how to conduct clinical trials for potential onychomycosis treatments. Comparative efficacy and safety claims are limited based on cross-study comparisons. The details of the phase 3 trial designs are summarized in the Table.
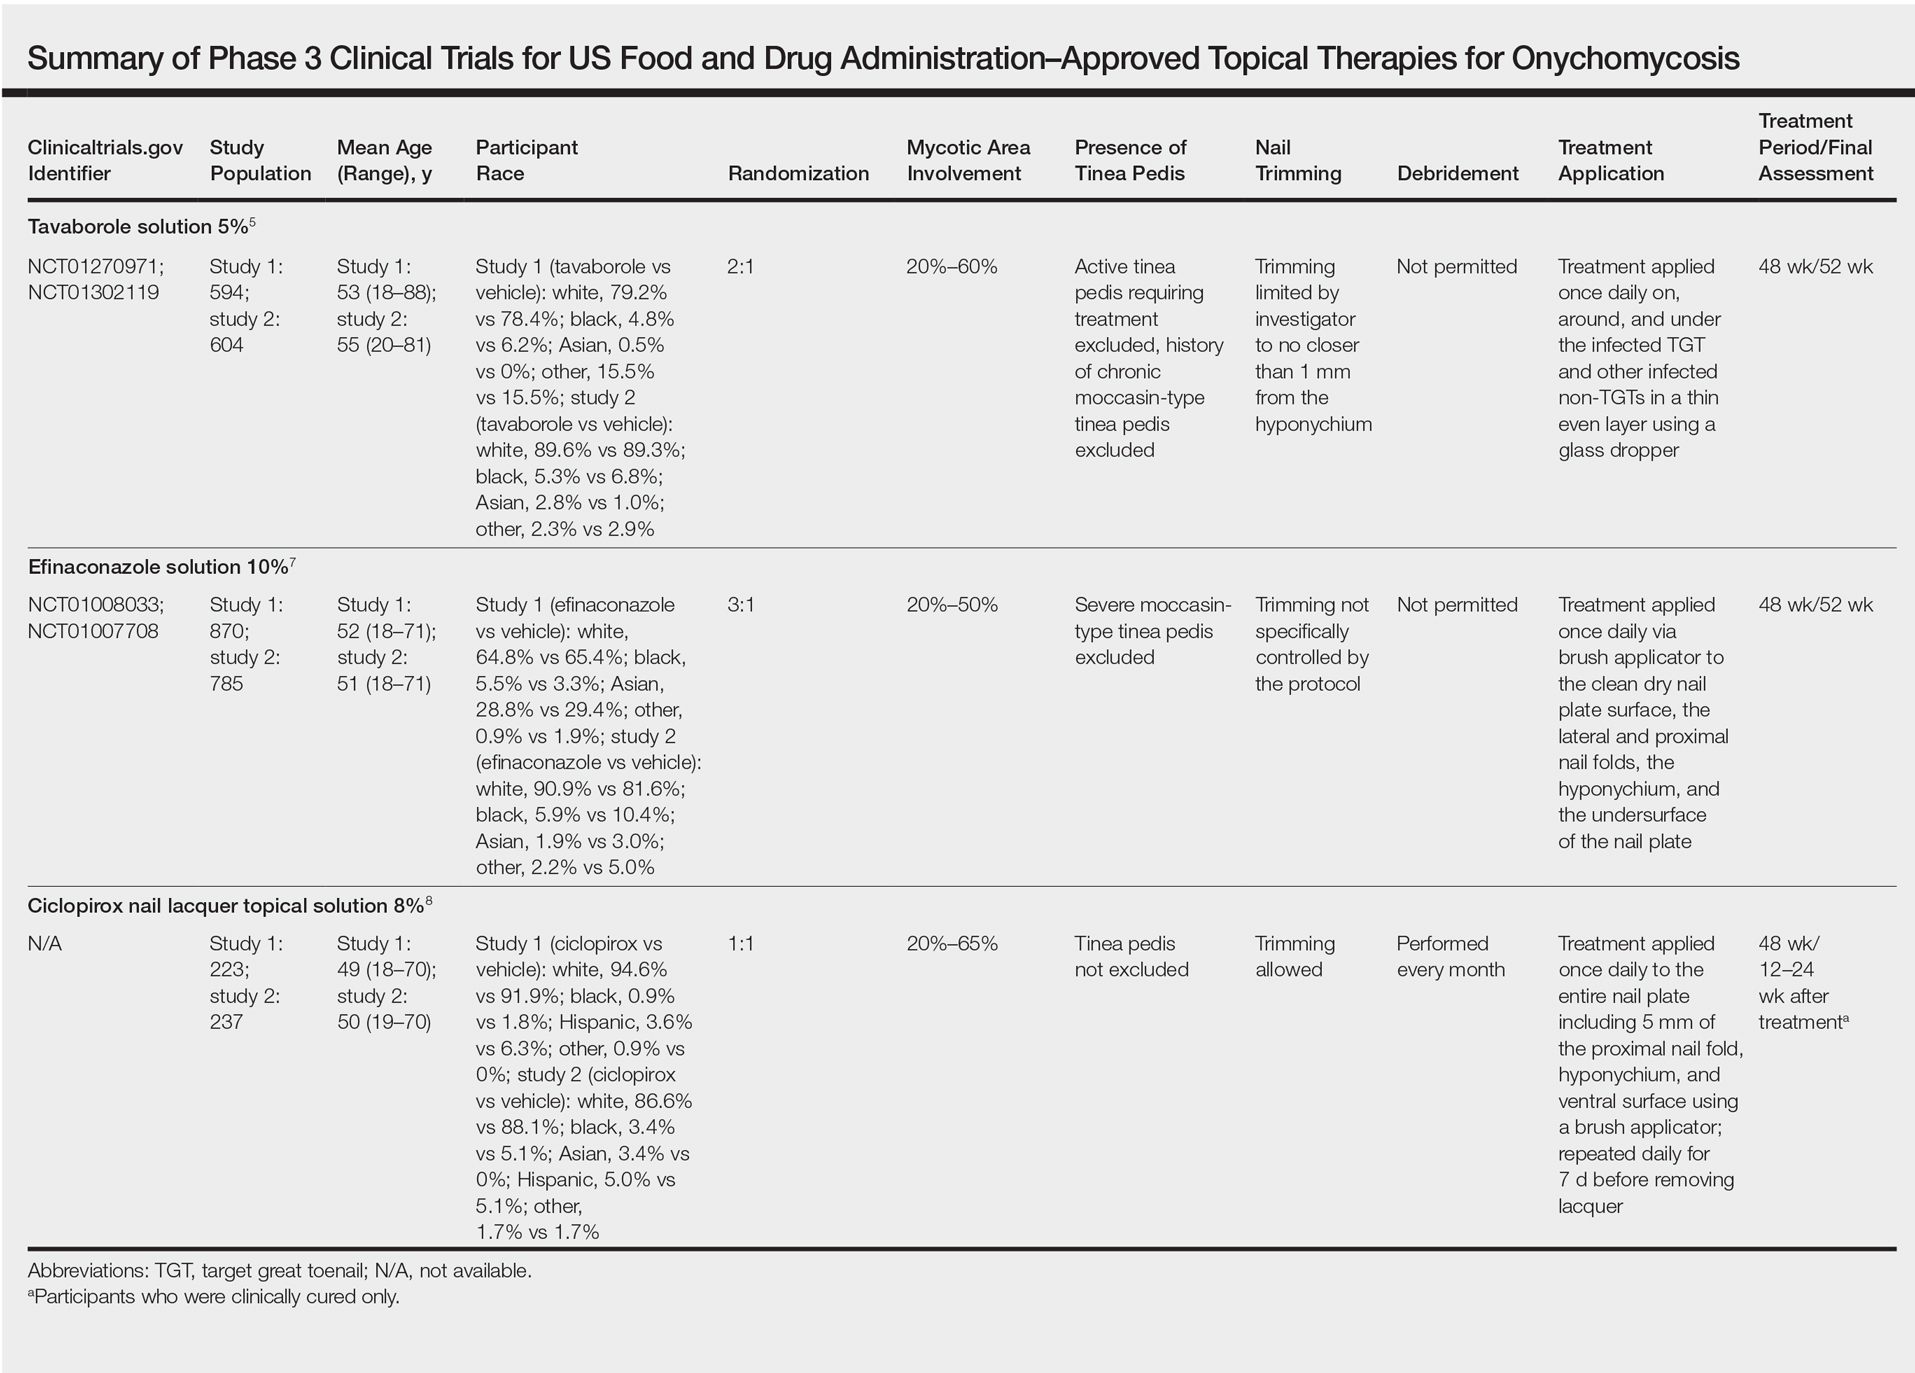
Tavaborole
Tavaborole is a boron-based treatment with a novel mechanism of action.5 Tavaborole binds to the editing domain of leucyl–transfer ribonucleic acid synthetase via an integrated boron atom and inhibits fungal protein synthesis.6 Two identical randomized, double-blind, vehicle-controlled, parallel-group, phase 3 clinical trials evaluating tavaborole were performed.5 The first study (registered at www.clinicaltrials.gov with the identifier NCT01270971) included 594 participants from27 sites in the United States and Mexico and was conducted between December 2010 and November 2012. The second study (NCT01302119) included 604 participants from 32 sites in the United States and Canada and was conducted between February 2011 and January 2013.
Eligible participants 18 years and older had distal subungual onychomycosis (DSO) of the toenails affecting 20% to 60% of 1 or more target great toenails (TGTs), tested positive for fungus using potassium hydroxide (KOH) wet mounts and positive for Trichophyton rubrum and Trichophyton mentagrophytes on fungal culture diagnostic tests, had distal TGT thickness of 3 mm or less, and had 3 mm or more of clear nail between the proximal nail fold and the most proximal visible mycotic border.5 Those with active tinea pedis requiring treatment or with a history of chronic moccasin-type tinea pedis were excluded. Participants were randomized to receive either tavaborole or vehicle (2:1). Treatments were applied once daily to all infected toenails for a total of 48 weeks, and nail debridement (defined as partial or complete removal of the toenail) was not permitted. Notably, controlled trimming of the nail was allowed to 1 mm of the leading nail edge. Regular assessments of each toenail for disease involvement, onycholysis, and subungual hyperkeratosis were made at screening, baseline, week 2, week 6, and every 6 weeks thereafter until week 52. Subungual TGT samples were taken at screening and every 12 weeks during the study for examination at a mycology laboratory, which performed KOH and fungal culture tests. A follow-up assessment was made at week 52.5
The primary end point was complete cure of the TGT at week 52, with secondary end points of completely or almost clear TGT nail (≤10% dystrophic nail), completely or almost clear TGT nail (≤10% dystrophic nail) plus negative mycology, and negative mycology of TGT.5 Examples of TGTs in participants who achieved complete cure and almost clear nails with negative mycology before and after treatment with tavaborole are shown in Figure 1. An example of a patient considered to have treatment failure is shown in Figure 2. This patient showed marked improvement in nail appearance and had a negative culture result but had a positive KOH test, which demonstrates the stringency in which topical agents are judged in onychomycosis trials.5
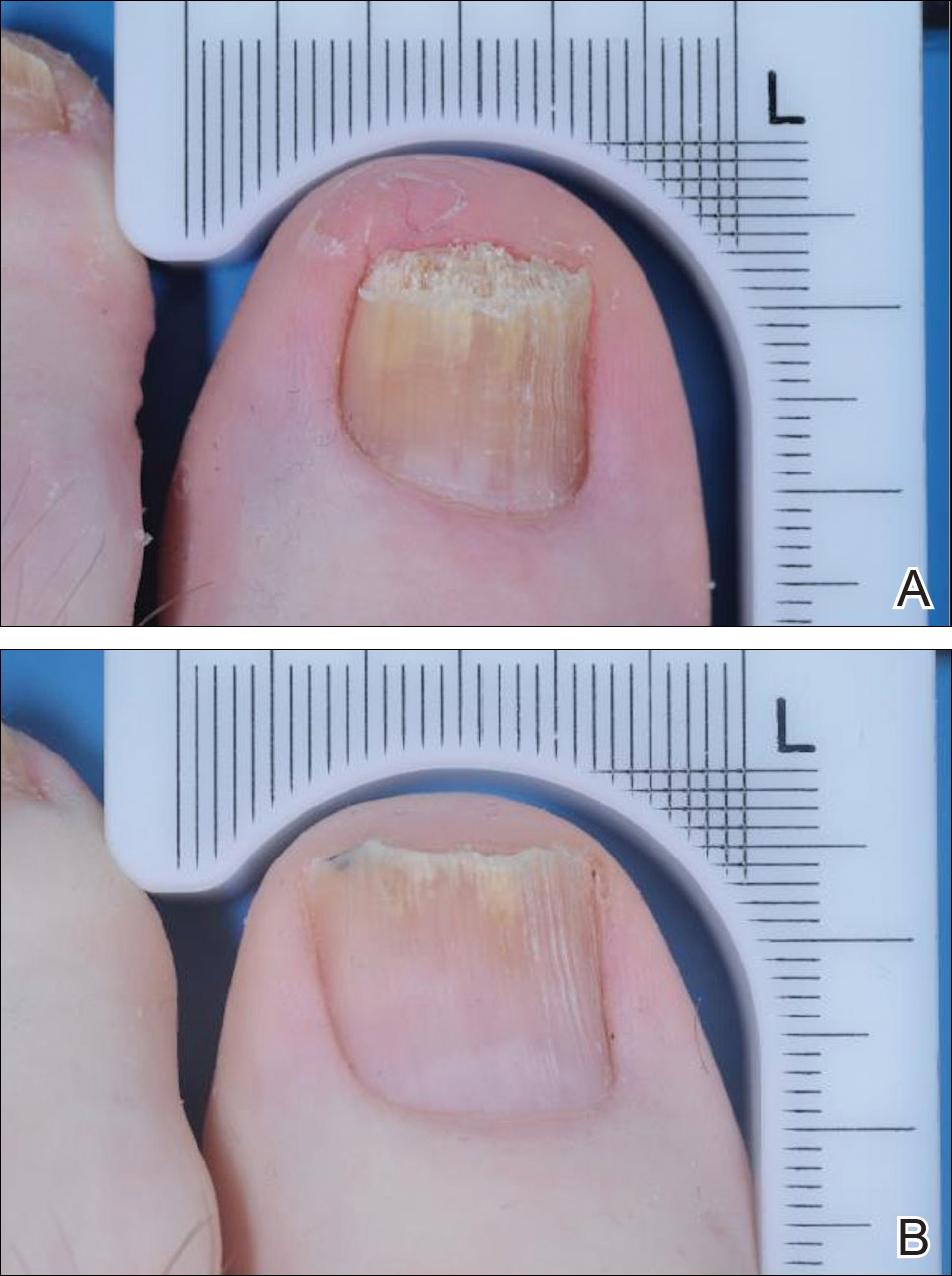
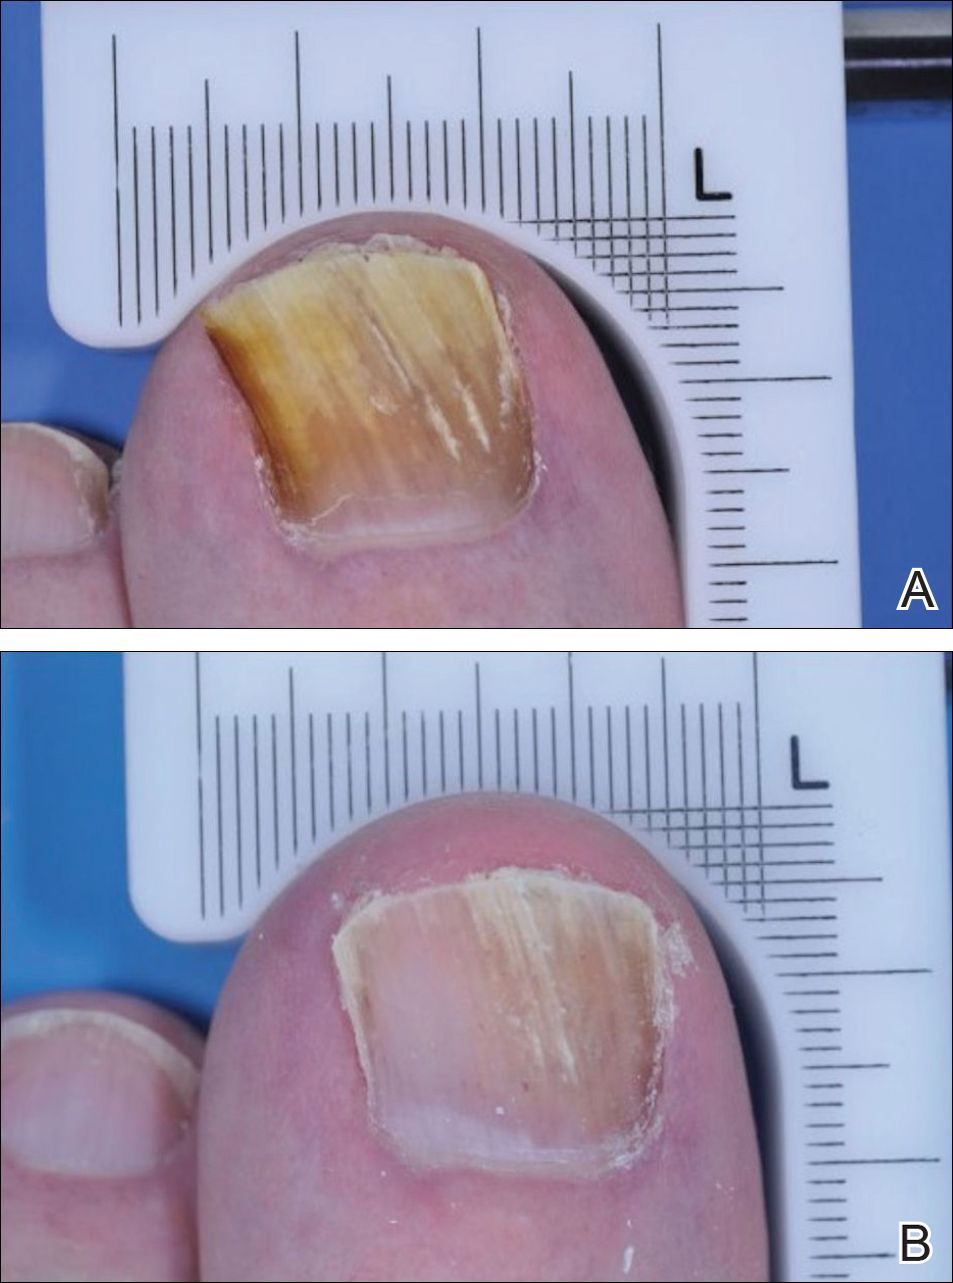
Efinaconazole
Efinaconazole is a topical triazole antifungal specifically indicated to treat onychomycosis. Two identical randomized, vehicle-controlled, double-blind, multicenter trials were performed to assess the safety and efficacy of efinaconazole solution 10%.7 The first study (NCT01008033) involved 870 participants and was conducted at a total of 74 sites in Japan (33 sites), Canada (7 sites), and the United States (34 sites) between December 2009 and September 2011. The second study (NCT01007708) had 785 participants and was conducted at 44 sites in Canada (8 sites) and the United States (36 sites) between December 2009 and October 2011.
Participants aged 18 to 70 years with a clinical diagnosis of DSO affecting 1 or more TGT were eligible to participate.7 Other eligibility criteria included an uninfected toenail length 3 mm or more from the proximal nail fold, a maximum toenail thickness of 3 mm, positive KOH wet mounts, and positive dermatophyte or mixed dermatophyte/candida cultures. Dermatophytes included T rubrum and T mentagrophytes. Those with severe moccasin-type tinea pedis were excluded. Participants were randomized to receive efinaconazole or vehicle (3:1). Once-daily treatments were self-applied to nails for 48 weeks. Clinical assessments were made at baseline and every 12 weeks until week 48, with a follow-up assessment at week 52. No nail trimming protocol was provided.7
The primary end point of the efinaconazole phase 3 trials was complete cure at week 52, with secondary end points including mycologic cure, treatment success (≤5% mycotic nail), and complete or almost complete cure (negative culture and KOH, ≤5% mycotic nail). An example of a complete cure from baseline to week 52 is shown in Figure 3.7
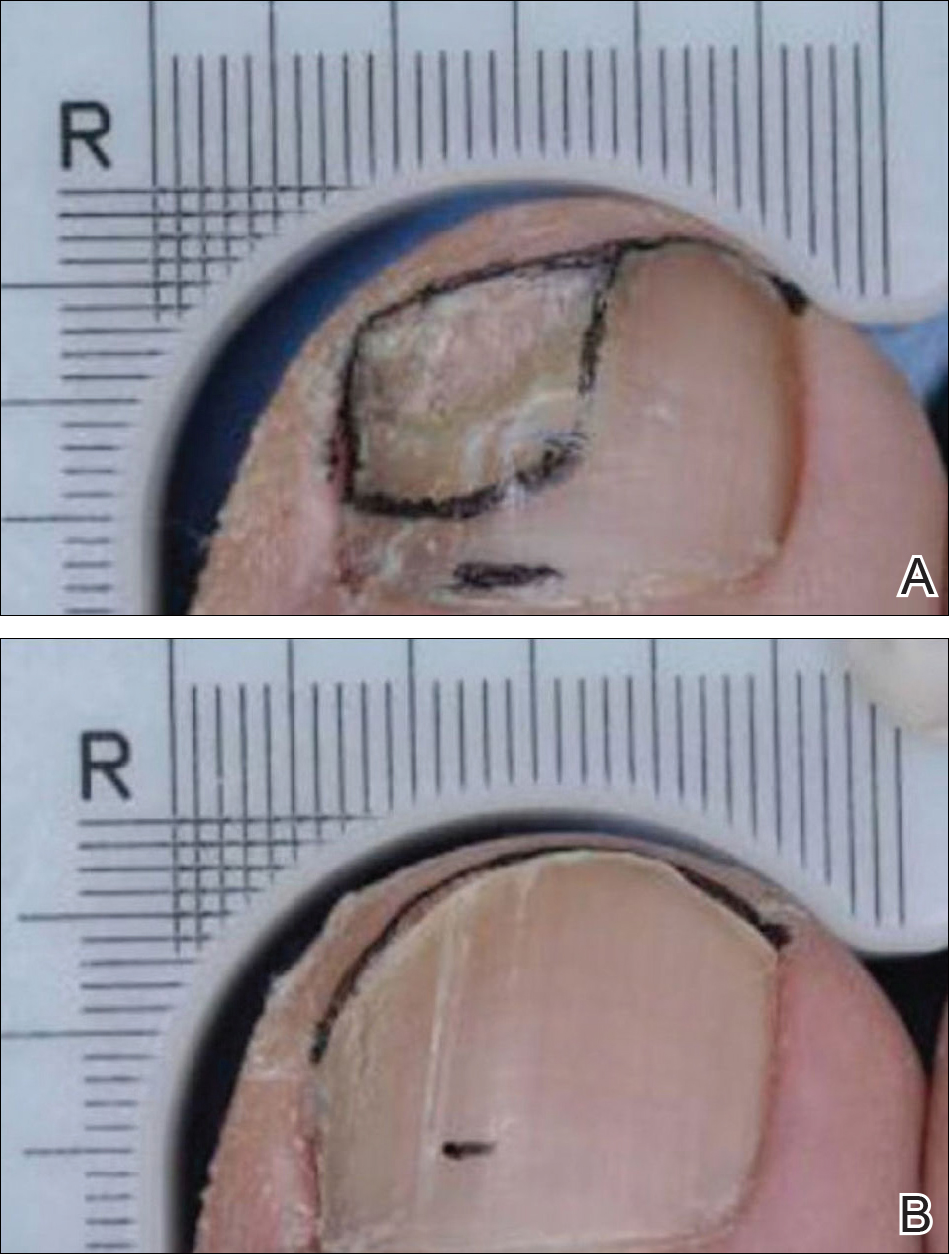
Ciclopirox
Ciclopirox was the first topical therapy to be approved for the treatment of onychomycosis. Ciclopirox is a broad-spectrum antifungal agent that inhibits metal-dependent enzymes, which are responsible for the degradation of toxic peroxides in fungal cells. The safety and efficacy of ciclopirox nail lacquer topical solution 8% also was investigated in 2 identical phase 3 clinical trials.8 The first study was conducted at 9 sites in the United States between June 1994 and June 1996 and included 223 participants. The second study was conducted at 9 sites in the United States between July 1994 and April 1996 and included 237 participants.
Eligible participants were required to have DSO in at least one TGT, positive KOH wet mount with positive dermatophyte culture, and 20% to 65% nail involvement.8 Those with tinea pedis were not excluded. Participants were randomized to receive once-daily treatment with ciclopirox or vehicle (1:1)(applied to all toenails and affected fingernails) for 48 weeks. The product was to be removed by the patient with alcohol on a weekly basis. Trimming was allowed as necessary, and mechanical debridement by the physician could be performed monthly. Assessments were made every 4 weeks, and mycologic examinations were performed every 12 weeks. Participants who were clinically cured were assessed further in a 12- to 24-week posttreatment follow-up period.8
The primary end point of complete cure and secondary end points of treatment success (negative culture and KOH, ≤10% mycotic nail), mycologic cure, and negative mycologic culture were assessed at week 48.8
Phase 3 Clinical Trial Similarities and Differences
The phase 3 clinical trials used to investigate the safety and efficacy of tavaborole,5 efinaconazole,7 and ciclopirox8 were similar in their overall design. All trials were randomized, double-blind, vehicle-controlled studies in patients with DSO. Each agent was assessed using a once-daily application for a treatment period of 48 weeks.
Primary differences among study designs included the age range of participants, the range of mycotic nail involvement, the presence/absence of tinea pedis, and the nail trimming/debridement protocols used. Differences were observed in the patient eligibility criteria of these trials. Both mycotic area and participant age range were inconsistent for each agent (eTable). Participants with larger mycotic areas usually have a poorer prognosis, as they tend to have a greater fungal load.9 A baseline mycotic area of 20% to 60%,5 20% to 50%,7 and 20% to 65%8 at baseline was required for the tavaborole, efinaconazole, and ciclopirox trials, respectively. Variations in mycotic area between trials can affect treatment efficacy, as clinical cures can be reached quicker by patients with smaller areas of infection. Of note, the average mycotic area of involvement was not reported in the tavaborole studies but was 36% and 40% for the efinaconazole and ciclopirox studies, respectively.5,8 It also is more difficult to achieve complete cure in older patients, as they have poor circulation and reduced nail growth rates.1,10 The participant age range was 18 to 88 years in the tavaborole trials, with 8% of the participants older than 70 years,5 compared to 18 to 71 years in both the efinaconazole and ciclopirox trials.7,8 The average age of participants in each study was approximately 54, 51, and 50 years for tavaborole, efinaconazole, and ciclopirox, respectively. Because factors impacting treatment failure can increase with age, efficacy results can be confounded by differing age distributions across different studies.
Another important feature that differed between the clinical trials was the approach to nail trimming—defined as shortening of the free edge of the nail distal to the hyponychium—which varies from debridement in that the nail plate is removed or reduced in thickness proximal to the hyponychium. In the tavaborole trials, trimming was controlled to within 1 mm of the free edge of the nail,5 whereas the protocol used for the ciclopirox trials allowed nail trimming as necessary as well as moderate debridement before treatment application and on a monthly basis.8 Debridement is an important component in all ciclopirox trials, as it is used to reduce fungal load.11 No trimming control was provided during the efinaconazole trials; however, debridement was prohibited.7 These differences can dramatically affect the study results, as residual fungal elements and portions of infected nails are removed during the trimming process in an uncontrolled manner, which can affect mycologic testing results as well as the clinical efficacy results determined through investigator evaluation. Discrepancies regarding nail trimming approach inevitably makes the trial results difficult to compare, as mycologic cure is not translatable between studies.
Furthermore, somewhat unusually, complete cure rate variations were observed between different study centers in the efinaconazole trials. Japanese centers in the first efinaconazole study (NCT01008033) had higher complete cure rates in both the efinaconazole and vehicle treatment arms, which is notable because approximately 29% of participants in this study were Asian, mostly hailing from 33 Japanese centers. The reason for these confounding results is unknown and requires further analysis.
Lastly, the presence or absence of tinea pedis can affect the response to onychomycosis treatment. In the tavaborole trials, patients with active interdigital tinea pedis or exclusively plantar tinea pedis or chronic moccasin-type tinea pedis requiring treatment were excluded from the studies.5 In contrast, only patients with severe moccasin-type tinea pedis were excluded in efinaconazole trials.7 The ciclopirox studies had no exclusions based on presence of tinea pedis.8 These differences are noteworthy, as tinea pedis can serve as a reservoir for fungal infection if not treated and can lead to recurrence of onychomycosis.12
Conclusion
In recent years, disappointing efficacy has resulted in the failure of several topical agents for onychomycosis during their development; however, there are several aspects to consider when examining efficacy data in onychomycosis studies. Obtaining a complete cure in onychomycosis is difficult. Because patients applying treatments at home are unlikely to undergo mycologic testing to confirm complete cure, visual inspections are helpful to determine treatment efficacy.
Despite similar overall designs, notable differences in the study designs of the phase 3 clinical trials investigating tavaborole, efinaconazole, and ciclopirox are likely to have had an effect on the reported results, making the efficacy of the agents difficult to compare. It is particularly tempting to compare the primary end point results of each trial, especially considering tavaborole and efinaconazole had primary end points with the same parameters; however, there are several other factors (eg, age range of study population, extent of infection, nail trimming, patient demographics) that may have affected the outcomes of the studies and precluded a direct comparison of any end points. Without head-to-head investigations, there is room for prescribing clinicians to interpret results differently.
Acknowledgment
Writing and editorial assistance was provided by ApotheCom Associates, LLC, Yardley, Pennsylvania, and was supported by Sandoz, a Novartis division.
- Elewski BE. Onychomycosis: pathogenesis, diagnosis, and management. Clin Microbiol Rev. 1998;11:415-429.
- Thomas J, Jacobson GA, Narkowicz CK, et al. Toenail onychomycosis: an important global disease burden. J Clin Pharm Ther. 2010;35:497-519.
- Scher RK. Onychomycosis: a significant medical disorder. J Am Acad Dermatol. 1996;35(3, pt 2):S2-S5.
- Del Rosso JQ. The role of topical antifungal therapy for onychomycosis and the emergence of newer agents. J Clin Aesthet Dermatol. 2014;7:10-18.
- Elewski BE, Aly R, Baldwin SL, et al. Efficacy and safety of tavaborole topical solution, 5%, a novel boron-based antifungal agent, for the treatment of toenail onychomycosis: results from 2 randomized phase-III studies. J Am Acad Dermatol. 2015;73:62-69.
- Rock FL, Mao W, Yaremchuk A, et al. An antifungal agent inhibits an aminoacyl-tRNA synthetase by trapping tRNA in the editing site. Science. 2007;316:1759-1761.
- Elewski BE, Rich P, Pollak R, et al. Efinaconazole 10% solution in the treatment of toenail onychomycosis: two phase III multicenter, randomized, double-blind studies. J Am Acad Dermatol. 2013;68:600-608.
- Gupta AK, Joseph WS. Ciclopirox 8% nail lacquer in the treatment of onychomycosis of the toenails in the United States. J Am Pod Med Assoc. 2000;90:495-501.
- Carney C, Tosti A, Daniel R, et al. A new classification system for grading the severity of onychomycosis: Onychomycosis Severity Index. Arch Dermatol. 2011;147:1277-1282.
- Gupta AK. Onychomycosis in the elderly. Drugs Aging. 2000;16:397-407.
- Gupta AK, Malkin KF. Ciclopirox nail lacquer and podiatric practice. J Am Podiatr Med Assoc. 2000;90:502-507.
- Scher RK, Baran R. Onychomycosis in clinical practice: factors contributing to recurrence. Br J Dermatol. 2003;149(suppl 65):5-9.
Onychomycosis is a fungal nail infection primarily caused by dermatophytes.1 If left untreated, the infection can cause nail destruction and deformities,1 resulting in pain and discomfort,2 impaired foot mobility,3 and an overall reduced quality of life.1 Onychomycosis is a chronic condition that requires long treatment periods due to the slow growth rates of toenails.1 To successfully cure the condition, fungal eradication must be achieved.
Prior to the US Food and Drug Administration (FDA) approval of tavaborole and efinaconazole, ciclopirox was the only approved topical treatment for onychomycosis.4 The recent approval of tavaborole and efinaconazole has increased treatment options available to patients and has started to pave the way for future topical treatments. This article discusses the 3 approved topical treatments for onychomycosis and focuses on the design of the phase 3 clinical trials that led to their approval.
Topical Agents Used to Treat Onychomycosis
Tavaborole, efinaconazole, and ciclopirox have undergone extensive clinical investigation to receive FDA approval. Results from pivotal phase 3 studies establishing the efficacy and safety of each agent formed the basis for regulatory submission. Although it may seem intuitive to compare the relative performance of these agents based on their respective phase 3 clinical trial data, there are important differences in study methodology, conduct, and populations that prevent direct comparisons. The FDA provides limited guidance to the pharmaceutical industry on how to conduct clinical trials for potential onychomycosis treatments. Comparative efficacy and safety claims are limited based on cross-study comparisons. The details of the phase 3 trial designs are summarized in the Table.
Tavaborole
Tavaborole is a boron-based treatment with a novel mechanism of action.5 Tavaborole binds to the editing domain of leucyl–transfer ribonucleic acid synthetase via an integrated boron atom and inhibits fungal protein synthesis.6 Two identical randomized, double-blind, vehicle-controlled, parallel-group, phase 3 clinical trials evaluating tavaborole were performed.5 The first study (registered at www.clinicaltrials.gov with the identifier NCT01270971) included 594 participants from27 sites in the United States and Mexico and was conducted between December 2010 and November 2012. The second study (NCT01302119) included 604 participants from 32 sites in the United States and Canada and was conducted between February 2011 and January 2013.
Eligible participants 18 years and older had distal subungual onychomycosis (DSO) of the toenails affecting 20% to 60% of 1 or more target great toenails (TGTs), tested positive for fungus using potassium hydroxide (KOH) wet mounts and positive for Trichophyton rubrum and Trichophyton mentagrophytes on fungal culture diagnostic tests, had distal TGT thickness of 3 mm or less, and had 3 mm or more of clear nail between the proximal nail fold and the most proximal visible mycotic border.5 Those with active tinea pedis requiring treatment or with a history of chronic moccasin-type tinea pedis were excluded. Participants were randomized to receive either tavaborole or vehicle (2:1). Treatments were applied once daily to all infected toenails for a total of 48 weeks, and nail debridement (defined as partial or complete removal of the toenail) was not permitted. Notably, controlled trimming of the nail was allowed to 1 mm of the leading nail edge. Regular assessments of each toenail for disease involvement, onycholysis, and subungual hyperkeratosis were made at screening, baseline, week 2, week 6, and every 6 weeks thereafter until week 52. Subungual TGT samples were taken at screening and every 12 weeks during the study for examination at a mycology laboratory, which performed KOH and fungal culture tests. A follow-up assessment was made at week 52.5
The primary end point was complete cure of the TGT at week 52, with secondary end points of completely or almost clear TGT nail (≤10% dystrophic nail), completely or almost clear TGT nail (≤10% dystrophic nail) plus negative mycology, and negative mycology of TGT.5 Examples of TGTs in participants who achieved complete cure and almost clear nails with negative mycology before and after treatment with tavaborole are shown in Figure 1. An example of a patient considered to have treatment failure is shown in Figure 2. This patient showed marked improvement in nail appearance and had a negative culture result but had a positive KOH test, which demonstrates the stringency in which topical agents are judged in onychomycosis trials.5
Efinaconazole
Efinaconazole is a topical triazole antifungal specifically indicated to treat onychomycosis. Two identical randomized, vehicle-controlled, double-blind, multicenter trials were performed to assess the safety and efficacy of efinaconazole solution 10%.7 The first study (NCT01008033) involved 870 participants and was conducted at a total of 74 sites in Japan (33 sites), Canada (7 sites), and the United States (34 sites) between December 2009 and September 2011. The second study (NCT01007708) had 785 participants and was conducted at 44 sites in Canada (8 sites) and the United States (36 sites) between December 2009 and October 2011.
Participants aged 18 to 70 years with a clinical diagnosis of DSO affecting 1 or more TGT were eligible to participate.7 Other eligibility criteria included an uninfected toenail length 3 mm or more from the proximal nail fold, a maximum toenail thickness of 3 mm, positive KOH wet mounts, and positive dermatophyte or mixed dermatophyte/candida cultures. Dermatophytes included T rubrum and T mentagrophytes. Those with severe moccasin-type tinea pedis were excluded. Participants were randomized to receive efinaconazole or vehicle (3:1). Once-daily treatments were self-applied to nails for 48 weeks. Clinical assessments were made at baseline and every 12 weeks until week 48, with a follow-up assessment at week 52. No nail trimming protocol was provided.7
The primary end point of the efinaconazole phase 3 trials was complete cure at week 52, with secondary end points including mycologic cure, treatment success (≤5% mycotic nail), and complete or almost complete cure (negative culture and KOH, ≤5% mycotic nail). An example of a complete cure from baseline to week 52 is shown in Figure 3.7
Ciclopirox
Ciclopirox was the first topical therapy to be approved for the treatment of onychomycosis. Ciclopirox is a broad-spectrum antifungal agent that inhibits metal-dependent enzymes, which are responsible for the degradation of toxic peroxides in fungal cells. The safety and efficacy of ciclopirox nail lacquer topical solution 8% also was investigated in 2 identical phase 3 clinical trials.8 The first study was conducted at 9 sites in the United States between June 1994 and June 1996 and included 223 participants. The second study was conducted at 9 sites in the United States between July 1994 and April 1996 and included 237 participants.
Eligible participants were required to have DSO in at least one TGT, positive KOH wet mount with positive dermatophyte culture, and 20% to 65% nail involvement.8 Those with tinea pedis were not excluded. Participants were randomized to receive once-daily treatment with ciclopirox or vehicle (1:1)(applied to all toenails and affected fingernails) for 48 weeks. The product was to be removed by the patient with alcohol on a weekly basis. Trimming was allowed as necessary, and mechanical debridement by the physician could be performed monthly. Assessments were made every 4 weeks, and mycologic examinations were performed every 12 weeks. Participants who were clinically cured were assessed further in a 12- to 24-week posttreatment follow-up period.8
The primary end point of complete cure and secondary end points of treatment success (negative culture and KOH, ≤10% mycotic nail), mycologic cure, and negative mycologic culture were assessed at week 48.8
Phase 3 Clinical Trial Similarities and Differences
The phase 3 clinical trials used to investigate the safety and efficacy of tavaborole,5 efinaconazole,7 and ciclopirox8 were similar in their overall design. All trials were randomized, double-blind, vehicle-controlled studies in patients with DSO. Each agent was assessed using a once-daily application for a treatment period of 48 weeks.
Primary differences among study designs included the age range of participants, the range of mycotic nail involvement, the presence/absence of tinea pedis, and the nail trimming/debridement protocols used. Differences were observed in the patient eligibility criteria of these trials. Both mycotic area and participant age range were inconsistent for each agent (eTable). Participants with larger mycotic areas usually have a poorer prognosis, as they tend to have a greater fungal load.9 A baseline mycotic area of 20% to 60%,5 20% to 50%,7 and 20% to 65%8 at baseline was required for the tavaborole, efinaconazole, and ciclopirox trials, respectively. Variations in mycotic area between trials can affect treatment efficacy, as clinical cures can be reached quicker by patients with smaller areas of infection. Of note, the average mycotic area of involvement was not reported in the tavaborole studies but was 36% and 40% for the efinaconazole and ciclopirox studies, respectively.5,8 It also is more difficult to achieve complete cure in older patients, as they have poor circulation and reduced nail growth rates.1,10 The participant age range was 18 to 88 years in the tavaborole trials, with 8% of the participants older than 70 years,5 compared to 18 to 71 years in both the efinaconazole and ciclopirox trials.7,8 The average age of participants in each study was approximately 54, 51, and 50 years for tavaborole, efinaconazole, and ciclopirox, respectively. Because factors impacting treatment failure can increase with age, efficacy results can be confounded by differing age distributions across different studies.
Another important feature that differed between the clinical trials was the approach to nail trimming—defined as shortening of the free edge of the nail distal to the hyponychium—which varies from debridement in that the nail plate is removed or reduced in thickness proximal to the hyponychium. In the tavaborole trials, trimming was controlled to within 1 mm of the free edge of the nail,5 whereas the protocol used for the ciclopirox trials allowed nail trimming as necessary as well as moderate debridement before treatment application and on a monthly basis.8 Debridement is an important component in all ciclopirox trials, as it is used to reduce fungal load.11 No trimming control was provided during the efinaconazole trials; however, debridement was prohibited.7 These differences can dramatically affect the study results, as residual fungal elements and portions of infected nails are removed during the trimming process in an uncontrolled manner, which can affect mycologic testing results as well as the clinical efficacy results determined through investigator evaluation. Discrepancies regarding nail trimming approach inevitably makes the trial results difficult to compare, as mycologic cure is not translatable between studies.
Furthermore, somewhat unusually, complete cure rate variations were observed between different study centers in the efinaconazole trials. Japanese centers in the first efinaconazole study (NCT01008033) had higher complete cure rates in both the efinaconazole and vehicle treatment arms, which is notable because approximately 29% of participants in this study were Asian, mostly hailing from 33 Japanese centers. The reason for these confounding results is unknown and requires further analysis.
Lastly, the presence or absence of tinea pedis can affect the response to onychomycosis treatment. In the tavaborole trials, patients with active interdigital tinea pedis or exclusively plantar tinea pedis or chronic moccasin-type tinea pedis requiring treatment were excluded from the studies.5 In contrast, only patients with severe moccasin-type tinea pedis were excluded in efinaconazole trials.7 The ciclopirox studies had no exclusions based on presence of tinea pedis.8 These differences are noteworthy, as tinea pedis can serve as a reservoir for fungal infection if not treated and can lead to recurrence of onychomycosis.12
Conclusion
In recent years, disappointing efficacy has resulted in the failure of several topical agents for onychomycosis during their development; however, there are several aspects to consider when examining efficacy data in onychomycosis studies. Obtaining a complete cure in onychomycosis is difficult. Because patients applying treatments at home are unlikely to undergo mycologic testing to confirm complete cure, visual inspections are helpful to determine treatment efficacy.
Despite similar overall designs, notable differences in the study designs of the phase 3 clinical trials investigating tavaborole, efinaconazole, and ciclopirox are likely to have had an effect on the reported results, making the efficacy of the agents difficult to compare. It is particularly tempting to compare the primary end point results of each trial, especially considering tavaborole and efinaconazole had primary end points with the same parameters; however, there are several other factors (eg, age range of study population, extent of infection, nail trimming, patient demographics) that may have affected the outcomes of the studies and precluded a direct comparison of any end points. Without head-to-head investigations, there is room for prescribing clinicians to interpret results differently.
Acknowledgment
Writing and editorial assistance was provided by ApotheCom Associates, LLC, Yardley, Pennsylvania, and was supported by Sandoz, a Novartis division.
- Elewski BE. Onychomycosis: pathogenesis, diagnosis, and management. Clin Microbiol Rev. 1998;11:415-429.
- Thomas J, Jacobson GA, Narkowicz CK, et al. Toenail onychomycosis: an important global disease burden. J Clin Pharm Ther. 2010;35:497-519.
- Scher RK. Onychomycosis: a significant medical disorder. J Am Acad Dermatol. 1996;35(3, pt 2):S2-S5.
- Del Rosso JQ. The role of topical antifungal therapy for onychomycosis and the emergence of newer agents. J Clin Aesthet Dermatol. 2014;7:10-18.
- Elewski BE, Aly R, Baldwin SL, et al. Efficacy and safety of tavaborole topical solution, 5%, a novel boron-based antifungal agent, for the treatment of toenail onychomycosis: results from 2 randomized phase-III studies. J Am Acad Dermatol. 2015;73:62-69.
- Rock FL, Mao W, Yaremchuk A, et al. An antifungal agent inhibits an aminoacyl-tRNA synthetase by trapping tRNA in the editing site. Science. 2007;316:1759-1761.
- Elewski BE, Rich P, Pollak R, et al. Efinaconazole 10% solution in the treatment of toenail onychomycosis: two phase III multicenter, randomized, double-blind studies. J Am Acad Dermatol. 2013;68:600-608.
- Gupta AK, Joseph WS. Ciclopirox 8% nail lacquer in the treatment of onychomycosis of the toenails in the United States. J Am Pod Med Assoc. 2000;90:495-501.
- Carney C, Tosti A, Daniel R, et al. A new classification system for grading the severity of onychomycosis: Onychomycosis Severity Index. Arch Dermatol. 2011;147:1277-1282.
- Gupta AK. Onychomycosis in the elderly. Drugs Aging. 2000;16:397-407.
- Gupta AK, Malkin KF. Ciclopirox nail lacquer and podiatric practice. J Am Podiatr Med Assoc. 2000;90:502-507.
- Scher RK, Baran R. Onychomycosis in clinical practice: factors contributing to recurrence. Br J Dermatol. 2003;149(suppl 65):5-9.
Practice Points
- Despite similar overall designs, notable differences in the study designs of phase 3 clinical trials investigating tavaborole, efinaconazole, and ciclopirox for the treatment of onychomycosis are likely to have had an effect on the reported results, making the efficacy of these agents difficult to compare.
- The primary difference between studies for tavaborole, efinaconazole, and ciclopirox include the age range of participants, the range of mycotic nail involvement, the presence/absence of tinea pedis, and the nail trimming/debridement protocols used.
- Without head-to-head investigations, there is room for prescribing clinicians to interpret study results for these agents differently.
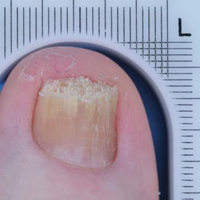
The Pipeline From Abstract Presentation to Publication in Pediatric Hospital Medicine
Pediatric hospital medicine (PHM) is one of the most rapidly growing disciplines in pediatrics,1 with 8% of pediatric residency graduates each year entering the field.2 Research plays an important role in advancing care in the field and is a critical component for board certification and fellowship accreditation.3-6 The annual PHM conference, which has been jointly sponsored by the Academic Pediatric Association, the American Academy of Pediatrics, and the Society of Hospital Medicine, is an important venue for the dissemination of research findings. Abstract selection is determined by peer review; however, reviewers are provided with only a brief snapshot of the research, which may not contain sufficient information to fully evaluate the methodological quality of the work.7-10 Additionally, while instructions are provided, reviewers often lack formal training in abstract review. Consequently, scores may vary.9
Publication in a peer-reviewed journal is considered a measure of research success because it requires more rigorous peer review than the abstract selection process at scientific meetings.11-16 Rates of subsequent journal publication differ based on specialty and meeting, and they have been reported at 23% to 78%.10,12,14-18 In pediatrics, publication rates after presentation at scientific meetings range from 36% to 63%, with mean time to publication ranging from 20 to 26 months following the meeting.11,19,20 No studies have reviewed abstract submissions to the annual PHM meeting to determine if selection or presentation format is associated with subsequent publication in a peer-reviewed journal.
We sought to identify the publication rate of abstracts submitted to the 2014 PHM conference and determine whether presentation format was associated with the likelihood of subsequent journal publication or time to publication.
METHODS
Study Design
Data for this retrospective cohort study were obtained from a database of all abstracts submitted for presentation at the 2014 PHM conference in Lake Buena Vista, Florida.
Main Exposures
The main exposure was presentation format, which was categorized as not presented (ie, rejected), poster presentation, or oral presentation. PHM has a blinded abstract peer-review process; in 2014, an average of 10 reviewers scored each abstract. Reviewers graded abstracts on a scale of 1 (best in category) to 7 (unacceptable for presentation) according to the following criteria: originality, scientific importance, methodological rigor, and quality of presentation. Abstracts with the lowest average scores in each content area, usually less than or equal to 3, were accepted as oral presentations while most abstracts with scores greater than 5 were rejected. For this study, information collected from each abstract included authors, if the primary author was a trainee, title, content area, and presentation format. Content areas included clinical research, educational research, health services research (HSR) and/or epidemiology, practice management research, and quality improvement. Abstracts were then grouped by presentation format and content area for analysis. The Pediatric Academic Societies (PAS) annual meeting, another common venue for the presentation of pediatric research, precedes the PHM conference. Because acceptance for PAS presentation may represent more strongly developed abstract submissions for PHM, we identified which abstracts had also been presented at the PAS conference that same year by cross-referencing authors and abstract titles with the PAS 2014 program.
Main Outcome Measures
All submissions were assessed for subsequent publication in peer-reviewed journals through January 2017 (30 months following the July 2014 PHM conference). To identify abstracts that went on to full publication, 2 authors (JC and LEH) independently searched for the lead author’s name and the presentation title in PubMed, Google Scholar, and MedEdPORTAL in January 2017. PubMed was searched using both the general search box and an advanced search for author and title. Google Scholar was added to capture manuscripts that may not have been indexed in PubMed at the time of our search. MedEdPORTAL, a common venue for the publication of educational initiatives that are not currently indexed in PubMed, was searched by lead author name via the general search box. If a full manuscript was published discussing similar outcomes or results and was written by the same authors who had submitted a PHM conference abstract, it was considered to have been published. The journal, month, and year of publication were recorded. For journals published every 2 months, the date of publication was recorded as falling between the 2 months. For those journals with biannual publication in the spring and fall, the months of March and October were used, respectively. The impact factor of the publication journal was also recorded for the year preceding publication. A journal’s impact factor is frequently used as a quantitative measure of journal quality and reflects the frequency with which a journal’s articles are cited in the scientific literature.21 Journals without an impact factor (eg, newer journals) were assigned a 0.
Data Analysis
All abstracts submitted to the PHM conference were analyzed based on content area and presentation format. The proportion of all abstracts subsequently published was determined for each format type and content area, and the odds ratio (OR) for publication after abstract submission was calculated using logistic regression. We calculated an adjusted OR for subsequent publication controlling for PAS presentation and the trainee status of the primary author. The journals most frequently publishing abstracts submitted to the PHM conference were identified. Median time to publication was calculated using the number of months elapsed between the PHM conference and publication date and compared across all abstract formats using Cox proportional hazards models adjusted for PAS presentation and trainee status. Kaplan-Meier survival curves were also generated for each of the 3 formats and compared using log-rank tests. The median impact factor was determined for each abstract format and compared using Wilcoxon rank-sum tests. Median impact factor by content area was compared using a Kruskal-Wallis test. All statistical analyses were performed using SAS version 9.2 (SAS Institute, Cary, NC). P values < 0.05 were considered statistically significant. In accordance with the Common Rule22 and the policies of the Cincinnati Children’s Hospital Medical Center Institutional Review Board, this research was not considered human subjects research.

RESULTS
For the 2014 PHM meeting, 226 abstracts were submitted, of which 183 (81.0%) were selected for presentation, including 154 (68.0%) as poster presentations and 29 (12.8%) as oral presentations. Of all submitted abstracts, 82 (36.3%) were published within 30 months following the meeting. Eighty-one of these (98.8%) were identified via PubMed, and 1 was found only in MedEdPORTAL. No additional publications were found via Google Scholar. The presenting author for the PHM abstract was the first author for 87.8% (n = 72) of the publications. A trainee was the presenting author for only 2 of these abstracts. For the publications in which the first author was not the presenting author, the presenting author was the senior author in 2 of the publications and the second or third author on the remaining 8. Of the abstracts accepted for presentation, 70 (38.3%) were subsequently published. Abstracts accepted for oral presentation had almost 7-fold greater odds of subsequent publication than those that were rejected (Table 1; OR 6.8; 95% confidence interval [CI], 2.4-19.4). Differences in the odds of publication for rejected abstracts compared with those accepted for poster presentation were not statistically significant (OR 1.2; 95% CI, 0.5-2.5).
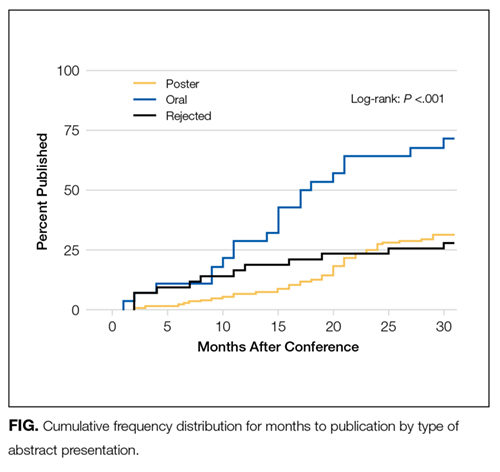
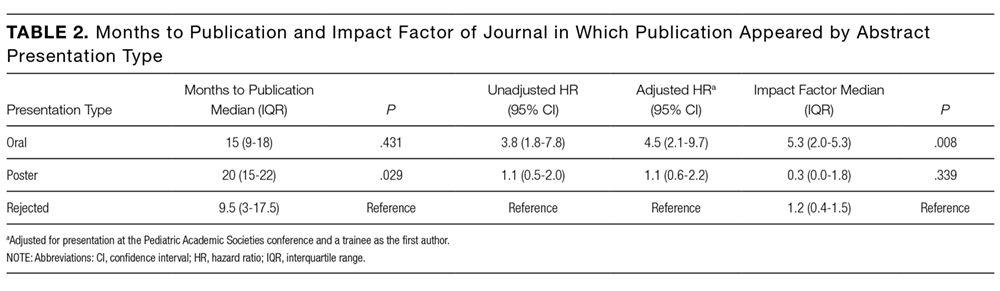
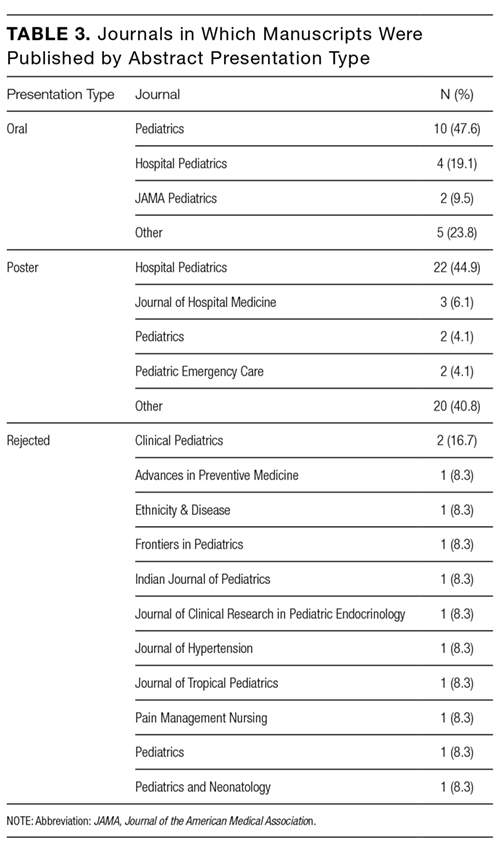
DISCUSSION
About one-third of abstracts submitted to the 2014 PHM conference were subsequently published in peer-reviewed journals within 30 months of the conference. Compared with rejected abstracts, the rate of publication was significantly higher for abstracts selected for oral presentation but not for those selected for poster presentation. For abstracts ultimately published in journals, selection for oral presentation was significantly associated with both a shorter time to publication and a higher median journal impact factor compared with rejected abstracts. Time to publication and median journal impact factor were similar between rejected abstracts and those accepted for poster presentation. Our findings suggest that abstract reviewers may be able to identify which abstracts will ultimately withstand more stringent peer review in the publication process when accepting abstracts for oral presentation. However, the selection for poster presentation versus rejection may not be indicative of future publication or the impact factor of the subsequent publication journal.
Previous studies have reviewed publication rates after meetings of the European Society for Pediatric Urology (publication rate of 47%),11 the Ambulatory Pediatric Association (now the Academic Pediatric Association; publication rate of 47%), the American Pediatric Society/Society for Pediatric Research (publication rate of 54%), and the PAS (publication rate of 45%).19,20 Our lower publication rate of 36.3% may be attributed to the shorter follow-up time in our study (30 months from the PHM conference), whereas prior studies monitored for publication up to 60 months after the PAS conference.20 Factors associated with subsequent publication include statistically significant results, a large sample size, and a randomized controlled trial study design.15,16 The primary reason for nonpublication for up to 80% of abstracts is failure to submit a manuscript for publication.23 A lack of time and fear of rejection after peer review are commonly cited explanations.18,23,24 Individuals may view acceptance for an oral presentation as positive reinforcement and be more motivated to pursue subsequent manuscript publication than individuals whose abstracts are offered poster presentations or are rejected. Trainees frequently present abstracts at scientific meetings, representing 40.3% of primary authors submitting abstracts to PHM in 2014, but may not have sufficient time or mentorship to develop a complete manuscript.18 To our knowledge, there have been no publications that assess the impact of trainee status on subsequent publication after conference submission.
Our study demonstrated that selection for oral presentation was associated with subsequent publication, shorter time to publication, and publication in journals with higher impact factors. A 2005 Cochrane review also demonstrated that selection for oral presentation was associated with subsequent journal publication.16 Abstracts accepted for oral publication may represent work further along in the research process, with more developed methodology and results. The shorter time to publication for abstracts accepted for oral presentation could also reflect feedback provided by conference attendees after the presentation, whereas poster sessions frequently lack a formalized process for critique.
Carroll et al. found no difference in time to publication between abstracts accepted for presentation at the PAS and rejected abstracts.20 Previous studies demonstrate that most abstracts presented at scientific meetings that are subsequently accepted for publication are published within 2 to 3 years of the meeting,12 with publication rates as high as 98% within 3 years of presentation.17 In contrast to Carroll et al., we found that abstracts accepted for oral presentation had a 4-fold greater likelihood of publication at each month than rejected abstracts. However, abstracts accepted for poster presentation did not have a significant difference in the proportional hazard ratio models for publication compared with rejected abstracts. Because space considerations limit the number of abstracts that can be accepted for presentation at a conference, some abstracts that are suitable for future publication may have been rejected due to a lack of space. Because researchers often use scientific meetings as a forum to receive peer feedback,12 authors who present at conferences may take more time to write a manuscript in order to incorporate this feedback.
The most common journal in which submitted abstracts were subsequently published was Hospital Pediatrics, representing twice as many published manuscripts as the second most frequent journal, Pediatrics. Hospital Pediatrics, which was first published in 2011, did not have an impact factor assigned during the study period. Yet, as a peer-reviewed journal dedicated to the field of PHM, it is well aligned with the research presented at the PHM meeting. It is unclear if Hospital Pediatrics is a journal to which pediatric hospitalists tend to submit manuscripts initially or if manuscripts are frequently submitted elsewhere prior to their publication in Hospital Pediatrics. Submission to other journals first likely extends the time to publication, especially for abstracts accepted for poster presentation, which may describe studies with less developed methods or results.
This study has several limitations. Previous studies have demonstrated mean time to publication of 12 to 32 months following abstract presentation with a median time of 19.6 months.16 Because we only have a 30-month follow-up, there may be abstracts still in the review process that are yet to be published, especially because the length of the review process varies by journal. We based our literature search on the first author of each PHM conference abstract submission, assuming that this presenting author would be one of the publishing authors even if not remaining first author; if this was not the case, we may have missed some abstracts that were subsequently published in full. Likewise, if a presenting author’s last name changed prior to the publication of a manuscript, a publication may have been missed. This limitation would cause us to underestimate the overall publication rate. It is not clear whether this would differentially affect the method of presentation. However, in this study, there was concordance between the presenting author and the publication’s first author in 87.8% of the abstracts subsequently published in full. Presenting authors who did not remain the first author on the published manuscript maintained authorship as either the senior author or second or third author, which may represent changes in the degree of involvement or a division of responsibilities for individuals working on a project together. While our search methods were comprehensive, there is a possibility that abstracts may have been published in a venue that was not searched. Additionally, we only reviewed abstracts submitted to PHM for 1 year. As the field matures and the number of fellowship programs increases, the quality of submitted abstracts may increase, leading to higher publication rates or shorter times to publication. It is also possible that the publication rate may not be reflective of PHM as a field because hospitalists may submit their work to conferences other than the PHM. Lastly, it may be more challenging to interpret any differences in impact factor because some journals, including Hospital Pediatrics (which represented a plurality of poster presentation abstracts that were subsequently published and is a relatively new journal), did not have an impact factor assigned during the study period. Assigning a 0 to journals without an impact factor may artificially lower the average impact factor reported. Furthermore, an impact factor, which is based on the frequency with which an individual journal’s articles are cited in scientific or medical publications, may not necessarily reflect a journal’s quality.
CONCLUSIONS
Of the 226 abstracts submitted to the 2014 PHM conference, approximately one-third were published in peer-reviewed journals within 30 months of the conference. Selection for oral presentation was found to be associated with subsequent publication as well as publication in journals with higher impact factors. The overall low publication rate may indicate a need for increased mentorship and resources for research development in this growing specialty. Improved mechanisms for author feedback at poster sessions may provide constructive suggestions for further development of these projects into full manuscripts or opportunities for trainees and early-career hospitalists to network with more experienced researchers in the field.
Disclosure
Drs. Herrmann, Hall, Kyler, Andrews, Williams, and Shah and Mr. Cochran have nothing to disclose. Dr. Wilson reports personal fees from the American Academy of Pediatrics during the conduct of the study. The authors have no financial relationships relevant to this article to disclose.
1. Stucky ER, Ottolini MC, Maniscalco J. Pediatric hospital medicine core competencies: development and methodology. J Hosp Med. 2010;5(6):339-343. PubMed
2. Freed GL, McGuinness GA, Althouse LA, Moran LM, Spera L. Long-term plans for those selecting hospital medicine as an initial career choice. Hosp Pediatr. 2015;5(4):169-174. PubMed
3. Rauch D. Pediatric Hospital Medicine Subspecialty. 2016; https://www.aap.org/en-us/about-the-aap/Committees-Councils-Sections/Section-on-Hospital-Medicine/Pages/Pediatric-Hospital-Medicine-Subspecialty.aspx. Accessed November 28, 2016.
4. Bekmezian A, Teufel RJ, Wilson KM. Research needs of pediatric hospitalists. Hosp Pediatr. 2011;1(1):38-44. PubMed
5. Teufel RJ, Bekmezian A, Wilson K. Pediatric hospitalist research productivity: predictors of success at presenting abstracts and publishing peer-reviewed manuscripts among pediatric hospitalists. Hosp Pediatr. 2012;2(3):149-160. PubMed
6. Wilson KM, Shah SS, Simon TD, Srivastava R, Tieder JS. The challenge of pediatric hospital medicine research. Hosp Pediatr. 2012;2(1):8-9. PubMed
7. Froom P, Froom J. Presentation Deficiencies in structured medical abstracts. J Clin Epidemiol. 1993;46(7):591-594. PubMed
8. Relman AS. News reports of medical meetings: how reliable are abstracts? N Engl J Med. 1980;303(5):277-278. PubMed
9. Soffer A. Beware the 200-word abstract! Arch Intern Med. 1976;136(11):1232-1233. PubMed
10. Bhandari M, Devereaux P, Guyatt GH, et al. An observational study of orthopaedic abstracts and subsequent full-text publications. J Bone Joint Surg Am. 2002;84(4):615-621. PubMed
11. Castagnetti M, Subramaniam R, El-Ghoneimi A. Abstracts presented at the European Society for Pediatric Urology (ESPU) meetings (2003–2010): Characteristics and outcome. J Pediatr Urol. 2014;10(2):355-360. PubMed
12. Halikman R, Scolnik D, Rimon A, Glatstein MM. Peer-Reviewed Journal Publication of Abstracts Presented at an International Emergency Medicine Scientific Meeting: Outcomes and Comparison With the Previous Meeting. Pediatr Emerg Care. 2016. PubMed
13. Relman AS. Peer review in scientific journals--what good is it? West J Med. 1990;153(5):520. PubMed
14. Riordan F. Do presenters to paediatric meetings get their work published? Arch Dis Child. 2000;83(6):524-526. PubMed
15. Scherer RW, Dickersin K, Langenberg P. Full publication of results initially presented in abstracts: a meta-analysis. JAMA. 1994;272(2):158-162. PubMed
16. Scherer RW, Langenberg P, Elm E. Full publication of results initially presented in abstracts. Cochrane Database Syst Rev. 2005. PubMed
17. Marx WF, Cloft HJ, Do HM, Kallmes DF. The fate of neuroradiologic abstracts presented at national meetings in 1993: rate of subsequent publication in peer-reviewed, indexed journals. Am J Neuroradiol. 1999;20(6):1173-1177. PubMed
18. Roy D, Sankar V, Hughes J, Jones A, Fenton J. Publication rates of scientific papers presented at the Otorhinolarygological Research Society meetings. Clin Otolaryngol Allied Sci. 2001;26(3):253-256. PubMed
19. McCormick MC, Holmes JH. Publication of research presented at the pediatric meetings: change in selection. Am J Dis Child. 1985;139(2):122-126. PubMed
20. Carroll AE, Sox CM, Tarini BA, Ringold S, Christakis DA. Does presentation format at the Pediatric Academic Societies’ annual meeting predict subsequent publication? Pediatrics. 2003;112(6):1238-1241. PubMed
21. Saha S, Saint S, Christakis DA. Impact factor: a valid measure of journal quality? J Med Libr Assoc. 2003;91(1):42. PubMed
22. Office for Human Research Protections. Code of Federal Regulations, Title 45 Public Welfare: Part 46, Protection of Human Subjects, §46.102(f ). http://www.hhs.gov/ohrp/regulations-and-policy/regulations/45-cfr-46/index.html#46.102. Accessed October 21, 2016.
23. Weber EJ, Callaham ML, Wears RL, Barton C, Young G. Unpublished research from a medical specialty meeting: why investigators fail to publish. JAMA. 1998;280(3):257-259. PubMed
24. Timmer A, Hilsden RJ, Cole J, Hailey D, Sutherland LR. Publication bias in gastroenterological research–a retrospective cohort study based on abstracts submitted to a scientific meeting. BMC Med Res Methodol. 2002;2(1):1. PubMed
Pediatric hospital medicine (PHM) is one of the most rapidly growing disciplines in pediatrics,1 with 8% of pediatric residency graduates each year entering the field.2 Research plays an important role in advancing care in the field and is a critical component for board certification and fellowship accreditation.3-6 The annual PHM conference, which has been jointly sponsored by the Academic Pediatric Association, the American Academy of Pediatrics, and the Society of Hospital Medicine, is an important venue for the dissemination of research findings. Abstract selection is determined by peer review; however, reviewers are provided with only a brief snapshot of the research, which may not contain sufficient information to fully evaluate the methodological quality of the work.7-10 Additionally, while instructions are provided, reviewers often lack formal training in abstract review. Consequently, scores may vary.9
Publication in a peer-reviewed journal is considered a measure of research success because it requires more rigorous peer review than the abstract selection process at scientific meetings.11-16 Rates of subsequent journal publication differ based on specialty and meeting, and they have been reported at 23% to 78%.10,12,14-18 In pediatrics, publication rates after presentation at scientific meetings range from 36% to 63%, with mean time to publication ranging from 20 to 26 months following the meeting.11,19,20 No studies have reviewed abstract submissions to the annual PHM meeting to determine if selection or presentation format is associated with subsequent publication in a peer-reviewed journal.
We sought to identify the publication rate of abstracts submitted to the 2014 PHM conference and determine whether presentation format was associated with the likelihood of subsequent journal publication or time to publication.
METHODS
Study Design
Data for this retrospective cohort study were obtained from a database of all abstracts submitted for presentation at the 2014 PHM conference in Lake Buena Vista, Florida.
Main Exposures
The main exposure was presentation format, which was categorized as not presented (ie, rejected), poster presentation, or oral presentation. PHM has a blinded abstract peer-review process; in 2014, an average of 10 reviewers scored each abstract. Reviewers graded abstracts on a scale of 1 (best in category) to 7 (unacceptable for presentation) according to the following criteria: originality, scientific importance, methodological rigor, and quality of presentation. Abstracts with the lowest average scores in each content area, usually less than or equal to 3, were accepted as oral presentations while most abstracts with scores greater than 5 were rejected. For this study, information collected from each abstract included authors, if the primary author was a trainee, title, content area, and presentation format. Content areas included clinical research, educational research, health services research (HSR) and/or epidemiology, practice management research, and quality improvement. Abstracts were then grouped by presentation format and content area for analysis. The Pediatric Academic Societies (PAS) annual meeting, another common venue for the presentation of pediatric research, precedes the PHM conference. Because acceptance for PAS presentation may represent more strongly developed abstract submissions for PHM, we identified which abstracts had also been presented at the PAS conference that same year by cross-referencing authors and abstract titles with the PAS 2014 program.
Main Outcome Measures
All submissions were assessed for subsequent publication in peer-reviewed journals through January 2017 (30 months following the July 2014 PHM conference). To identify abstracts that went on to full publication, 2 authors (JC and LEH) independently searched for the lead author’s name and the presentation title in PubMed, Google Scholar, and MedEdPORTAL in January 2017. PubMed was searched using both the general search box and an advanced search for author and title. Google Scholar was added to capture manuscripts that may not have been indexed in PubMed at the time of our search. MedEdPORTAL, a common venue for the publication of educational initiatives that are not currently indexed in PubMed, was searched by lead author name via the general search box. If a full manuscript was published discussing similar outcomes or results and was written by the same authors who had submitted a PHM conference abstract, it was considered to have been published. The journal, month, and year of publication were recorded. For journals published every 2 months, the date of publication was recorded as falling between the 2 months. For those journals with biannual publication in the spring and fall, the months of March and October were used, respectively. The impact factor of the publication journal was also recorded for the year preceding publication. A journal’s impact factor is frequently used as a quantitative measure of journal quality and reflects the frequency with which a journal’s articles are cited in the scientific literature.21 Journals without an impact factor (eg, newer journals) were assigned a 0.
Data Analysis
All abstracts submitted to the PHM conference were analyzed based on content area and presentation format. The proportion of all abstracts subsequently published was determined for each format type and content area, and the odds ratio (OR) for publication after abstract submission was calculated using logistic regression. We calculated an adjusted OR for subsequent publication controlling for PAS presentation and the trainee status of the primary author. The journals most frequently publishing abstracts submitted to the PHM conference were identified. Median time to publication was calculated using the number of months elapsed between the PHM conference and publication date and compared across all abstract formats using Cox proportional hazards models adjusted for PAS presentation and trainee status. Kaplan-Meier survival curves were also generated for each of the 3 formats and compared using log-rank tests. The median impact factor was determined for each abstract format and compared using Wilcoxon rank-sum tests. Median impact factor by content area was compared using a Kruskal-Wallis test. All statistical analyses were performed using SAS version 9.2 (SAS Institute, Cary, NC). P values < 0.05 were considered statistically significant. In accordance with the Common Rule22 and the policies of the Cincinnati Children’s Hospital Medical Center Institutional Review Board, this research was not considered human subjects research.
RESULTS
For the 2014 PHM meeting, 226 abstracts were submitted, of which 183 (81.0%) were selected for presentation, including 154 (68.0%) as poster presentations and 29 (12.8%) as oral presentations. Of all submitted abstracts, 82 (36.3%) were published within 30 months following the meeting. Eighty-one of these (98.8%) were identified via PubMed, and 1 was found only in MedEdPORTAL. No additional publications were found via Google Scholar. The presenting author for the PHM abstract was the first author for 87.8% (n = 72) of the publications. A trainee was the presenting author for only 2 of these abstracts. For the publications in which the first author was not the presenting author, the presenting author was the senior author in 2 of the publications and the second or third author on the remaining 8. Of the abstracts accepted for presentation, 70 (38.3%) were subsequently published. Abstracts accepted for oral presentation had almost 7-fold greater odds of subsequent publication than those that were rejected (Table 1; OR 6.8; 95% confidence interval [CI], 2.4-19.4). Differences in the odds of publication for rejected abstracts compared with those accepted for poster presentation were not statistically significant (OR 1.2; 95% CI, 0.5-2.5).
DISCUSSION
About one-third of abstracts submitted to the 2014 PHM conference were subsequently published in peer-reviewed journals within 30 months of the conference. Compared with rejected abstracts, the rate of publication was significantly higher for abstracts selected for oral presentation but not for those selected for poster presentation. For abstracts ultimately published in journals, selection for oral presentation was significantly associated with both a shorter time to publication and a higher median journal impact factor compared with rejected abstracts. Time to publication and median journal impact factor were similar between rejected abstracts and those accepted for poster presentation. Our findings suggest that abstract reviewers may be able to identify which abstracts will ultimately withstand more stringent peer review in the publication process when accepting abstracts for oral presentation. However, the selection for poster presentation versus rejection may not be indicative of future publication or the impact factor of the subsequent publication journal.
Previous studies have reviewed publication rates after meetings of the European Society for Pediatric Urology (publication rate of 47%),11 the Ambulatory Pediatric Association (now the Academic Pediatric Association; publication rate of 47%), the American Pediatric Society/Society for Pediatric Research (publication rate of 54%), and the PAS (publication rate of 45%).19,20 Our lower publication rate of 36.3% may be attributed to the shorter follow-up time in our study (30 months from the PHM conference), whereas prior studies monitored for publication up to 60 months after the PAS conference.20 Factors associated with subsequent publication include statistically significant results, a large sample size, and a randomized controlled trial study design.15,16 The primary reason for nonpublication for up to 80% of abstracts is failure to submit a manuscript for publication.23 A lack of time and fear of rejection after peer review are commonly cited explanations.18,23,24 Individuals may view acceptance for an oral presentation as positive reinforcement and be more motivated to pursue subsequent manuscript publication than individuals whose abstracts are offered poster presentations or are rejected. Trainees frequently present abstracts at scientific meetings, representing 40.3% of primary authors submitting abstracts to PHM in 2014, but may not have sufficient time or mentorship to develop a complete manuscript.18 To our knowledge, there have been no publications that assess the impact of trainee status on subsequent publication after conference submission.
Our study demonstrated that selection for oral presentation was associated with subsequent publication, shorter time to publication, and publication in journals with higher impact factors. A 2005 Cochrane review also demonstrated that selection for oral presentation was associated with subsequent journal publication.16 Abstracts accepted for oral publication may represent work further along in the research process, with more developed methodology and results. The shorter time to publication for abstracts accepted for oral presentation could also reflect feedback provided by conference attendees after the presentation, whereas poster sessions frequently lack a formalized process for critique.
Carroll et al. found no difference in time to publication between abstracts accepted for presentation at the PAS and rejected abstracts.20 Previous studies demonstrate that most abstracts presented at scientific meetings that are subsequently accepted for publication are published within 2 to 3 years of the meeting,12 with publication rates as high as 98% within 3 years of presentation.17 In contrast to Carroll et al., we found that abstracts accepted for oral presentation had a 4-fold greater likelihood of publication at each month than rejected abstracts. However, abstracts accepted for poster presentation did not have a significant difference in the proportional hazard ratio models for publication compared with rejected abstracts. Because space considerations limit the number of abstracts that can be accepted for presentation at a conference, some abstracts that are suitable for future publication may have been rejected due to a lack of space. Because researchers often use scientific meetings as a forum to receive peer feedback,12 authors who present at conferences may take more time to write a manuscript in order to incorporate this feedback.
The most common journal in which submitted abstracts were subsequently published was Hospital Pediatrics, representing twice as many published manuscripts as the second most frequent journal, Pediatrics. Hospital Pediatrics, which was first published in 2011, did not have an impact factor assigned during the study period. Yet, as a peer-reviewed journal dedicated to the field of PHM, it is well aligned with the research presented at the PHM meeting. It is unclear if Hospital Pediatrics is a journal to which pediatric hospitalists tend to submit manuscripts initially or if manuscripts are frequently submitted elsewhere prior to their publication in Hospital Pediatrics. Submission to other journals first likely extends the time to publication, especially for abstracts accepted for poster presentation, which may describe studies with less developed methods or results.
This study has several limitations. Previous studies have demonstrated mean time to publication of 12 to 32 months following abstract presentation with a median time of 19.6 months.16 Because we only have a 30-month follow-up, there may be abstracts still in the review process that are yet to be published, especially because the length of the review process varies by journal. We based our literature search on the first author of each PHM conference abstract submission, assuming that this presenting author would be one of the publishing authors even if not remaining first author; if this was not the case, we may have missed some abstracts that were subsequently published in full. Likewise, if a presenting author’s last name changed prior to the publication of a manuscript, a publication may have been missed. This limitation would cause us to underestimate the overall publication rate. It is not clear whether this would differentially affect the method of presentation. However, in this study, there was concordance between the presenting author and the publication’s first author in 87.8% of the abstracts subsequently published in full. Presenting authors who did not remain the first author on the published manuscript maintained authorship as either the senior author or second or third author, which may represent changes in the degree of involvement or a division of responsibilities for individuals working on a project together. While our search methods were comprehensive, there is a possibility that abstracts may have been published in a venue that was not searched. Additionally, we only reviewed abstracts submitted to PHM for 1 year. As the field matures and the number of fellowship programs increases, the quality of submitted abstracts may increase, leading to higher publication rates or shorter times to publication. It is also possible that the publication rate may not be reflective of PHM as a field because hospitalists may submit their work to conferences other than the PHM. Lastly, it may be more challenging to interpret any differences in impact factor because some journals, including Hospital Pediatrics (which represented a plurality of poster presentation abstracts that were subsequently published and is a relatively new journal), did not have an impact factor assigned during the study period. Assigning a 0 to journals without an impact factor may artificially lower the average impact factor reported. Furthermore, an impact factor, which is based on the frequency with which an individual journal’s articles are cited in scientific or medical publications, may not necessarily reflect a journal’s quality.
CONCLUSIONS
Of the 226 abstracts submitted to the 2014 PHM conference, approximately one-third were published in peer-reviewed journals within 30 months of the conference. Selection for oral presentation was found to be associated with subsequent publication as well as publication in journals with higher impact factors. The overall low publication rate may indicate a need for increased mentorship and resources for research development in this growing specialty. Improved mechanisms for author feedback at poster sessions may provide constructive suggestions for further development of these projects into full manuscripts or opportunities for trainees and early-career hospitalists to network with more experienced researchers in the field.
Disclosure
Drs. Herrmann, Hall, Kyler, Andrews, Williams, and Shah and Mr. Cochran have nothing to disclose. Dr. Wilson reports personal fees from the American Academy of Pediatrics during the conduct of the study. The authors have no financial relationships relevant to this article to disclose.
1. Stucky ER, Ottolini MC, Maniscalco J. Pediatric hospital medicine core competencies: development and methodology. J Hosp Med. 2010;5(6):339-343. PubMed
2. Freed GL, McGuinness GA, Althouse LA, Moran LM, Spera L. Long-term plans for those selecting hospital medicine as an initial career choice. Hosp Pediatr. 2015;5(4):169-174. PubMed
3. Rauch D. Pediatric Hospital Medicine Subspecialty. 2016; https://www.aap.org/en-us/about-the-aap/Committees-Councils-Sections/Section-on-Hospital-Medicine/Pages/Pediatric-Hospital-Medicine-Subspecialty.aspx. Accessed November 28, 2016.
4. Bekmezian A, Teufel RJ, Wilson KM. Research needs of pediatric hospitalists. Hosp Pediatr. 2011;1(1):38-44. PubMed
5. Teufel RJ, Bekmezian A, Wilson K. Pediatric hospitalist research productivity: predictors of success at presenting abstracts and publishing peer-reviewed manuscripts among pediatric hospitalists. Hosp Pediatr. 2012;2(3):149-160. PubMed
6. Wilson KM, Shah SS, Simon TD, Srivastava R, Tieder JS. The challenge of pediatric hospital medicine research. Hosp Pediatr. 2012;2(1):8-9. PubMed
7. Froom P, Froom J. Presentation Deficiencies in structured medical abstracts. J Clin Epidemiol. 1993;46(7):591-594. PubMed
8. Relman AS. News reports of medical meetings: how reliable are abstracts? N Engl J Med. 1980;303(5):277-278. PubMed
9. Soffer A. Beware the 200-word abstract! Arch Intern Med. 1976;136(11):1232-1233. PubMed
10. Bhandari M, Devereaux P, Guyatt GH, et al. An observational study of orthopaedic abstracts and subsequent full-text publications. J Bone Joint Surg Am. 2002;84(4):615-621. PubMed
11. Castagnetti M, Subramaniam R, El-Ghoneimi A. Abstracts presented at the European Society for Pediatric Urology (ESPU) meetings (2003–2010): Characteristics and outcome. J Pediatr Urol. 2014;10(2):355-360. PubMed
12. Halikman R, Scolnik D, Rimon A, Glatstein MM. Peer-Reviewed Journal Publication of Abstracts Presented at an International Emergency Medicine Scientific Meeting: Outcomes and Comparison With the Previous Meeting. Pediatr Emerg Care. 2016. PubMed
13. Relman AS. Peer review in scientific journals--what good is it? West J Med. 1990;153(5):520. PubMed
14. Riordan F. Do presenters to paediatric meetings get their work published? Arch Dis Child. 2000;83(6):524-526. PubMed
15. Scherer RW, Dickersin K, Langenberg P. Full publication of results initially presented in abstracts: a meta-analysis. JAMA. 1994;272(2):158-162. PubMed
16. Scherer RW, Langenberg P, Elm E. Full publication of results initially presented in abstracts. Cochrane Database Syst Rev. 2005. PubMed
17. Marx WF, Cloft HJ, Do HM, Kallmes DF. The fate of neuroradiologic abstracts presented at national meetings in 1993: rate of subsequent publication in peer-reviewed, indexed journals. Am J Neuroradiol. 1999;20(6):1173-1177. PubMed
18. Roy D, Sankar V, Hughes J, Jones A, Fenton J. Publication rates of scientific papers presented at the Otorhinolarygological Research Society meetings. Clin Otolaryngol Allied Sci. 2001;26(3):253-256. PubMed
19. McCormick MC, Holmes JH. Publication of research presented at the pediatric meetings: change in selection. Am J Dis Child. 1985;139(2):122-126. PubMed
20. Carroll AE, Sox CM, Tarini BA, Ringold S, Christakis DA. Does presentation format at the Pediatric Academic Societies’ annual meeting predict subsequent publication? Pediatrics. 2003;112(6):1238-1241. PubMed
21. Saha S, Saint S, Christakis DA. Impact factor: a valid measure of journal quality? J Med Libr Assoc. 2003;91(1):42. PubMed
22. Office for Human Research Protections. Code of Federal Regulations, Title 45 Public Welfare: Part 46, Protection of Human Subjects, §46.102(f ). http://www.hhs.gov/ohrp/regulations-and-policy/regulations/45-cfr-46/index.html#46.102. Accessed October 21, 2016.
23. Weber EJ, Callaham ML, Wears RL, Barton C, Young G. Unpublished research from a medical specialty meeting: why investigators fail to publish. JAMA. 1998;280(3):257-259. PubMed
24. Timmer A, Hilsden RJ, Cole J, Hailey D, Sutherland LR. Publication bias in gastroenterological research–a retrospective cohort study based on abstracts submitted to a scientific meeting. BMC Med Res Methodol. 2002;2(1):1. PubMed
© 2018 Society of Hospital Medicine
Do Combined Pharmacist and Prescriber Efforts on Medication Reconciliation Reduce Postdischarge Patient Emergency Department Visits and Hospital Readmissions?
Healthcare systems are targeting effective strategies to improve patient safety and reduce hospital readmissions. Hospital readmissions can be detrimental to patients’ health, a source of avoidable healthcare costs, and are frequently a reflection of the quality of patient care during transitions of care. Medication reconciliation (Med Rec) was identified as 1 of 12 interventions that may reduce 30-day readmissions; however, rigorously designed studies are scarce.1,2 Published systematic reviews and meta-analyses have produced mixed conclusions regarding the impact of Med Rec on unplanned 30-day readmissions.2-4
In several studies, researchers have established the positive impact of Med Rec on reducing patient medication discrepancies and potential adverse drug events.4-8 Pharmacy-led Med Rec interventions have been shown to easily identify more clinically relevant and higher impact medication discrepancies when compared to usual care.8 In a systematic review, Mueller et al.2 suggest that there are several interrelated elements that determine if a Med Rec intervention will influence hospital readmissions. These elements form a multicomponent “bundle” of interventions, including a systematic medication history process, admission reconciliation, patient education on discharge, discharge reconciliation, and communication to outpatient providers.9 Several prospective randomized controlled studies have demonstrated lower readmission rates and fewer visits to the emergency department (ED) after implementing a comprehensive, interprofessional, bundled intervention (including Med Rec) from admission to discharge.10-13 A 2016 systematic review and meta-analysis specifically evaluated pharmacy-led Med Rec programs (the majority of which included interventions involving multicomponent bundles) and demonstrated a significant reduction in posthospital healthcare utilization.14
Although comprehensive, interprofessional, bundled interventions have been shown to reduce readmission rates and ED visits in randomized controlled trials (RCTs), limited resources often prevent hospitals from consistently implementing all aspects of these multicomponent interventions. In practice, clinicians may provide varying components of the bundle, such as the combination of admission medication history by the pharmacist and discharge Med Rec completed by the physician alone. The unique impact of combined pharmacist and prescriber Med Rec interventions from admission to discharge on readmissions remains inconclusive. Further, it is unclear which high-risk patient groups will benefit the most from these interventions. We set out to evaluate the impact of an enhanced, interprofessional Med Rec process from admission to discharge (characterized within the context of a novel taxonomy continuum that specifies clinician involvement and intensity of services) on readmissions to hospital and ED visits within 30 days of discharge.
METHODS
We conducted a retrospective, observational, analytical cohort study using QuadraMed’s Computerized Patient Record and the EMITT (Electronic Medication Information Transfer Tool)15 to collect data from 2007 to 2011.
Setting
The study was conducted at a 417-bed tertiary care teaching hospital in Toronto, Ontario, Canada.
Med Rec Process and Description of Exposure (Intervention)
The targeted clinical areas had sustained interprofessional models of patient care in place from admission to discharge. They also were actively using an in-house EMITT to facilitate the documentation and tracking of Med Rec efforts throughout patient admission, transfer, and discharge.15 On admission, the pharmacist conducted a best possible medication history (BPMH). A BPMH provides the cornerstone for Med Rec. It differs from a routine medication history in that it involves (1) a systematic process for interviewing the patient (or family) and (2) a review of at least one other reliable source of information (eg, a provincial medication database, an inspection of medication vials, or contact with the community pharmacy) to obtain and verify patient medications (prescribed and nonprescribed). The pharmacist recorded the BPMH in the electronic patient record. The application supported admission and discharge Med Rec. On discharge, there were 2 options: (1) the prescriber alone would review and complete the discharge Med Rec and generate electronic prescriptions (Table 1, Silver level care) or (2) the pharmacist would collaborate with the prescriber to complete the discharge reconciliation and the prescriber would electronically generate prescriptions (Table 1, Gold level care). All clinical areas had a combined pharmacist and prescriber Med Rec model in place at admission, but the proportion of patients receiving discharge reconciliation completed by pharmacist and prescriber versus the prescriber-alone varied based on the individual clinician’s practices.
Patient Selection
All consecutive hospitalized patients admitted and discharged by the general internal medicine [GIM] service from March 2007 to December 2011 were included. The GIM service was chosen for the main analysis because they had been performing the intervention for the longest period of time and had the largest population of patients. Patients were identified via their hospital-specific medical record identification number and specific hospital-visit number. Patients were excluded if any of the following occurred: (1) the length of stay of their index admission was less than 24 hours; (2) they died during the visit; (3) they were transferred to a separate acute care inpatient facility; or (4) they left hospital against medical advice. Patient visits were excluded as index cases from the analysis if they were returning within 90 days of a previous discharge.
Outcomes
The primary study outcome was the occurrence of an inpatient readmission or ED visit within 30 days of discharge. In our secondary analyses, we examined the impact of the intervention on high-risk patient populations, such as those ≥65 years of age, with a length of stay, acuity of admission, Charlson comorbidity index, and emergency department visits in past 6 months (LACE) index score ≥10 (see supplementary Appendix 1 for LACE score description), on high-alert medications (1 or more of warfarin, insulin, digoxin, and opioids), and on ≥10 medications.
Data Collection

Identification of Exposure of Interest
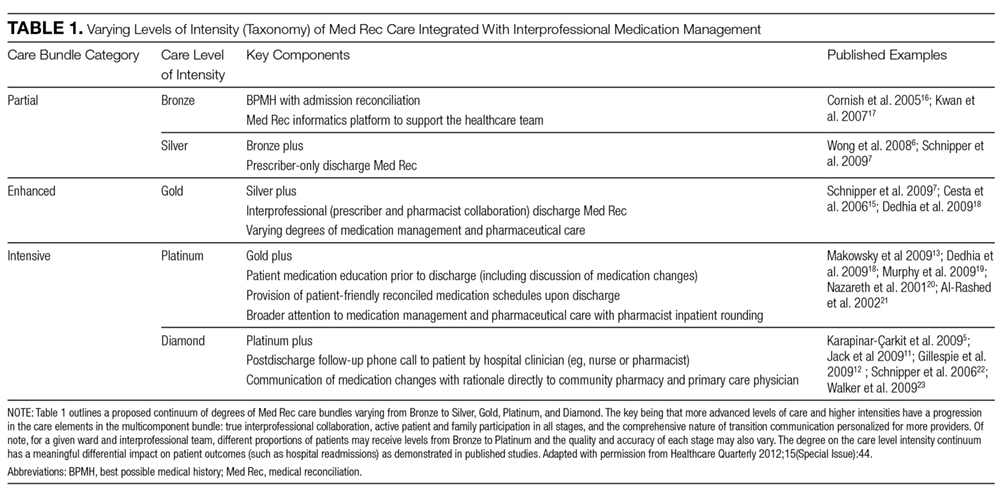
We used the electronic database to capture all patients who received pharmacist and prescriber supported admission-to-discharge reconciliation. We explicitly defined increasing intensity of Med Rec care in categories of Bronze, Silver, and Gold care levels (Table 1). The exposed (intervention) group received an enhanced Med Rec bundle (patients receiving Gold level care). The control group was made of patients receiving a partial Med Rec Bundle (patients receiving Silver or Bronze level of care or below).
Determination of Hospital Visits
A search of administrative databases was used to determine if patients admitted to the targeted services had an ED visit or urgent inpatient admission to the study hospital within 30 days.
Statistical Analysis
A logistic regression for outcomes was performed. This yielded an adjusted odds ratio with a 95% confidence interval (CI) between the intervention and control groups. Statistical significance was determined with a 2-sided α level of 0.05. In the analysis, we used Statistical Analysis Software version 9.2.
In our multivariate logistic regression model, we adjusted for confounding factors that might influence the patients’ risk of readmission or the type of Med Rec they received upon discharge. By using administrative databases, patient level demographics, and the Charlson comorbidity index, the most responsible diagnosis and disease burden were collected. Medication-related factors collected included the number of medications on discharge and the presence of predefined high-alert medications. The number of medications on the medication discharge list was determined by using the electronic database. The final adjustment model included age, gender, the number of medications on discharge, and the LACE index score (supplementary Appendix 1). The LACE index score has been validated in Ontario, Canada, populations to quantify the risk of death or unplanned readmission within 30 days of discharge.24
Propensity Score Adjustment
Propensity scoring (probability of treatment assignment conditional on observed baseline characteristics) was planned a priori to account for possible factors that would impact whether a patient received the intervention or control care levels. The propensity score for receiving Med Rec was computed from a logistic model using Med Rec as the outcome. A structured iterative approach was used to refine this model to achieve covariate balance within the matched pairs. Covariate balance was measured by the standardized difference, in which an absolute standardized difference >10% represents meaningful imbalance.25 From the original cohort, we attempted to match patients who had the intervention to patients from the control by means of a matching algorithm using the logit of the propensity score for receiving the intervention.26
Subgroup Analysis
We also examined the impact of the intervention on high-risk patient populations such as those ≥65 years of age, with a LACE index score ≥10, on high-alert medications, and on ≥10 medications. A univariate analysis was conducted to identify patient-related risk predictors that may be independently correlated with a higher risk of hospital visits.
RESULTS
Baseline Characteristics
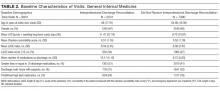
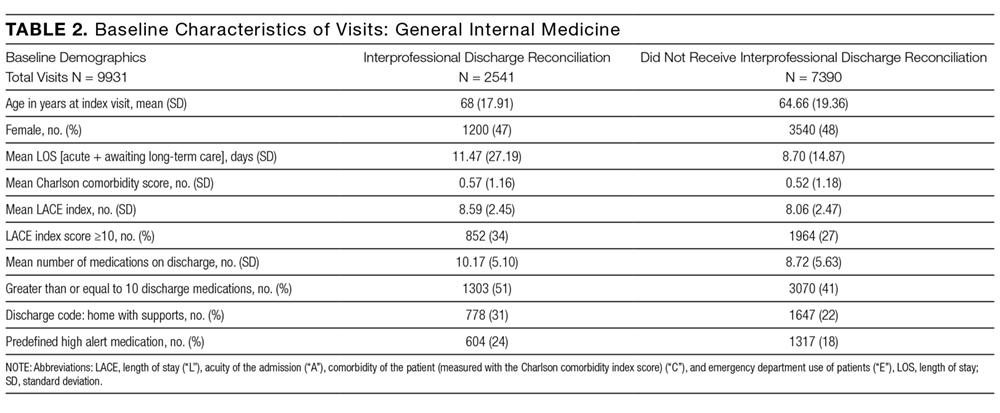
A total of 8678 patients representing 9931 unique visits met the inclusion criteria for analysis. There were 2541 unique visits (approximately 26% of visits) in the intervention group that received Gold level care and 7390 unique visits in the control group. The patients in the control group were largely patients who received the original standard of care at the institution, Silver level care (67% of the control group). Patients who received Bronze level care or less comprised 33% of the control group.
Patients in the intervention group were significantly older (average of 68 years old versus 64 years old) and on more medications. They also notably had a longer duration of stay in hospital, an increased percentage of visits with a LACE index score ≥10, and were more likely to be discharged home on a high-alert medication and with supports (Table 2).
Main Analysis
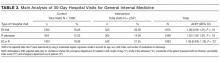

The main unadjusted analysis of GIM patients (n = 9931 visits) did not detect a difference in 30-day ED visits and readmissions between the intervention group (540 out of 2541; 21.2%) and control (1423 out of 7390; 19.3%; Table 3). By using a multivariate logistic regression model to account for age, sex, LACE index, and number of medications on discharge, the adjusted odds ratio was 1.06 (95% CI, 0.95-1.19; P = 0.33). After propensity score adjustment, the relative risk of readmission was 0.88 (16.7% vs 18.9%; 95% CI, 0.59-1.32; P = 0.54).
Secondary Analyses
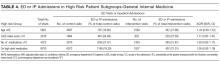
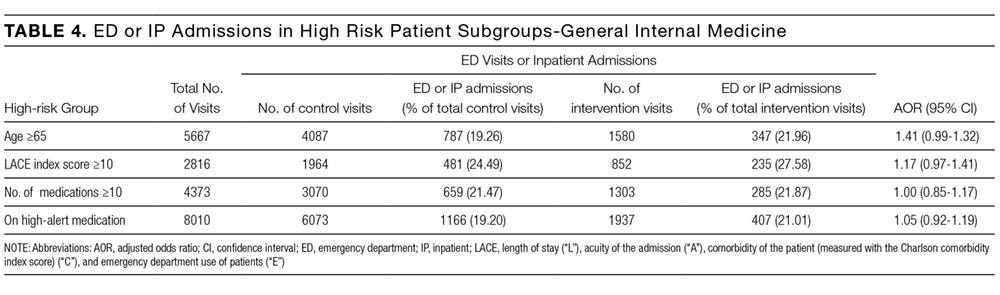
In each predefined high-risk patient subgroup (age ≥65, LACE index score ≥10, number of discharge medications ≥10, and the presence of high-alert medications), analyses of our primary endpoint did not detect significant adjusted odds ratios (Table 4). In our univariate analysis, increasing number of medications, LACE index score, and male gender were independently correlated with a higher risk of hospital visits (supplementary Appendix 2).
DISCUSSION
Med Rec is widely recommended as a patient safety strategy to prevent clinically significant medication discrepancies at transitions in care.4-9 However, Med Rec varies widely in terms of what it entails and who delivers it, with the preponderance of evidence suggesting an impact on clinically significant medication discrepancies only when interprofessional care delivered includes a central role for pharmacists.27 Furthermore, Med Rec appears to impact short term readmissions only when embedded in a broader, multifaceted, bundled intervention in which pharmacists or other team members educate patients about their medications and deliver postdischarge follow-up phone calls.10-13
As very few hospitals have the resources to sustainably deliver intensive care bundles that are represented in RCTs (characterized by Platinum and Diamond levels of care in Table 1), in our observational study, we sought to explore whether a resource-attainable, enhanced Med Rec care bundle (Gold level) had an impact on hospital utilization compared to partial Med Rec care bundles (Bronze and Silver levels). In our findings, we did not detect a significant difference on ED visits and readmissions within 30 days between enhanced and partial care bundles. In a secondary analysis of the influence of the intervention on prespecified high-risk patient subgroups, we also did not detect a difference.
As far as we are aware, our long-term, observational study is the largest to date to explore a real-life, enhanced Med Rec intervention and examine its impact on meaningful patient outcomes. We extrapolated that our intervention group received several critical attributes of a successful bundle as discussed by Mueller in a systematic review.2 Our intervention included the following: (1) a systematic BPMH process on admission; (2) integrated admission-to-discharge reconciliation processes; (3) discharge delineation of medication changes since admission; (4) pharmacist involvement in reconciliation from admission to discharge; (5) an electronic platform; and (6) formal discharge reconciliation with interprofessional collaboration. Additional components in the bundle described by Mueller included the following: patient education at discharge, postdischarge communication with the patient, and communication with outpatient providers and medication management.
In our results, we did not find a difference in outcomes between the intervention and control groups. Therefore, it is possible that the enhanced bundle’s focus on interprofessional involvement in discharge reconciliation (Gold care level) has no impact on hospital utilization compared to partial care bundles (Silver and Bronze levels). Kwan et al.3 describe similar findings in their systematic review, in which they evaluated the effects of hospital-based Med Rec on unintentional discrepancies with nontrivial risks for harm to patients on 30-day postdischarge hospital visits. Kwan et al.3 concluded that larger well-designed studies are required to further evaluate this outcome, but authors of current published studies suggest that Med Rec alone probably does not reduce postdischarge hospital utilization within 30 days. Med Rec may have a more significant impact on utilization when bundled with other interventions that improve discharge coordination.3
There may be several reasons why we were unable to detect a significant difference between the intervention and control groups. One limitation is that our nonrandomized, retrospective design may have led to unmeasured confounders that impacted allocation into the intervention group versus the control group. It was notable that patients in the intervention group had an increased age, longer duration of hospital stay, more medications, and high-alert medications on discharge compared to the control group and that may have biased our results towards the null hypothesis. Although the propensity score analysis attempted to adjust for this, it also did not detect a significant difference between groups.
In addition, the existing standard of care during the study period allowed for patients in the control group to receive varying levels of Med Rec. Ideally, we would have compared the intervention to a placebo group that did not receive any Med Rec-related care elements. However, as this was a real-life observational study, the majority of patients received some Med Rec services as a part of the standard of care. As a result, 67% of patients in the control group received Silver level Med Rec with a BPMH, admission reconciliation, and prescriber-only discharge reconciliation. This may have made it more difficult to show an incremental benefit on readmissions between the intervention and control.
Also, our primary outcome of all-cause ED or hospital readmissions within 30 days may not have been sensitive enough to detect the effect of Med Rec interventions alone. Only a small proportion of readmissions within 30 days of discharge are preventable and many patient and community level factors responsible for readmissions cannot be controlled by the hospital’s actions.28 Comprehensive pharmacy interventions have demonstrated decreased hospitalizations and emergency visits at 12 months; however, the largest impact was seen on the more specific outcome of medication-related hospitalizations (80% reduction).29 Lastly, another limitation was that we were unable to capture hospital visits to other centres. However, in our region, almost 75% of readmissions are to the same site as the initial hospitalization.30
Overall, our findings in this study and novel characterization of Med Rec services are relevant to many hospital sites that are striving to implement integrated Med Rec with limited healthcare resources. Although interprofessional Med Rec likely reduces clinically significant medication discrepancies, enhanced interprofessional Med Rec on discharge (Gold Med Rec) alone may not be enough to impact hospital utilization compared to partial Med Rec services (Silver and Bronze Med Rec). Further research into practical, targeted Med Rec bundles on more specific outcomes (such as preventable postdischarge adverse events, “avoidable” hospital readmissions, and medication-related readmissions) may detect a significant benefit.
CONCLUSION
A long-term observational evaluation of interprofessional Med Rec did not detect a difference in 30-day postdischarge patient hospital visits between patients who received enhanced versus partial Med Rec patient care bundles. Researchers of future prospective studies could focus on evaluating high-risk populations or specific elements of Med Rec services on avoidable medication-related hospital admissions and postdischarge adverse drug events.
Acknowledgments
The authors thank Nita Dhir, MBA.
Presented as a poster and oral presentation at the 2012 American College of Clinical Pharmacy Annual Meeting, Hollywood, Florida, October 21-24, 2012, and as an encore poster presentation at the Canadian Society of Hospital Pharmacists Professional Practice Conference, Toronto, Canada, Feb 3, 2013.
Disclosure
The authors declare no conflicts of interest related to the manuscript submitted. All monies used for the research came from the University Health Network Department of Pharmacy Budget, including the pharmacy residency program.
1. Hansen LO, Young RS, Hinami K, Leung A, Williams MV. Interventions to reduce 30-day rehospitalization: a systematic review. Ann Intern Med. 2011;155:520-528. PubMed
2. Mueller SK, Sponsler KC, Kripalani S, Schnipper JL. Hospital-based medication reconciliation practices: a systematic review. Arch Intern Med. 2012;172(14):1057-1069. PubMed
3. Kwan JL, Lo L, Sampson M, Shojania KG. Medication reconciliation during transitions of care as a patient safety strategy: a systematic review. Ann Intern Med. 2013;158:397-403. PubMed
4. Safer Health Care Now. Medication Reconciliation in Home Care Getting Started Kit. March 2015. www.ismp-canada.org/download/MedRec/Medrec_HC_English_GSK_v2.pdf. Accessed August 22, 2017.
5. Karapinar-Çarkit F, Borgsteede SD, Zoer J, Smit HJ, Egberts AC, van den Bemt PM. Effect of medication reconciliation with and without patient counseling on the number of pharmaceutical interventions among patients discharged from the hospital. Ann Pharmacother. 2009;43(6):1001-1010. PubMed
6. Wong JD, Bajcar JM, Wong GG, et al. Medication reconciliation at hospital discharge: evaluating discrepancies. Ann Pharmacother. 2008;42(10):1373-1379. PubMed
7. Schnipper JL, Hamann C, Ndumele CD, et al. Effect of an electronic medication reconciliation application and process redesign on potential adverse drug events: a cluster-randomized trial. Arch Intern Med. 2009;169(8):771-780. PubMed
8. Mekonnen AB, McLachlan AJ, Brien JA. Pharmacy-led medication reconciliation programmes at hospital transitions: a systematic review and meta-analysis. J Clin Pharm Ther. 2016;41(2):128-144. PubMed
9. Kaboli PJ, Fernandes O. Medication reconciliation: moving forward. Arch Intern Med. 2012;172(14):1069-1070. PubMed
10. Koehler BE, Richter KM, Youngblood L, et al. Reduction of 30-day postdischarge hospital readmission or emergency department (ED) visit rates in high-risk elderly medical patients through delivery of a targeted care bundle. J Hosp Med. 2009;4:211-218. PubMed
11. Jack BW, Chetty VK, Anthony D, et al. A reengineered hospital discharge program to decrease rehospitalization: a randomized trial. Ann Intern Med. 2009;150:178-187. PubMed
12. Gillespie U, Alassaad A, Henrohn D, et al. A comprehensive pharmacist intervention to reduce morbidity in patients 80 years or older. Arch Intern Med. 2009:169(9):894-900. PubMed
13. Makowsky MJ, Koshman SL, Midodzi WK, Tsuyuki RT. Capturing outcomes of clinical activities performed by a rounding pharmacist practicing in a team environment: the COLLABORATE study [NCT00351676]. Med Care. 2009;47(6):642-650. PubMed
14. Mekonnen AB, McLachlan AJ, Brien JA. Effectiveness of pharmacist-led medication reconciliation programmes on clinical outcomes at hospital transitions: a systematic review and meta-analysis. BMJ Open. 2016;6(2):e010003. PubMed
15. Cesta A, Bajcar JM, Ong SW, Fernandes OA. The EMITT study: development and evaluation of a medication information transfer tool. Ann Pharmacother. 2006:40(6):1074-1081 PubMed
16. Cornish P, et al. Unintended medication discrepancies at the time of hospital admission. Arch Internal Medicine, 2005, Feb: 165: 424-29. PubMed
17. Kwan Y, Fernandes OA, Nagge JJ, et al. Pharmacist medication assessments in a surgical preadmission clinic. Arch Intern Med. 2007;167(10):1034-1040 PubMed
18. Dedhia P, Kravet S, Bulger J, et al. A quality improvement intervention to facilitate the transition of older adults from three hospitals back to their homes. J Am Geriatr Soc. 2009;57:1540–1546. PubMed
19. Murphy EM, Oxencis CJ, Klauck JA, et al. Medication reconciliation at an academic medical center: implementation of a comprehensive program from admission to discharge. Am J Health Syst Pharm. 2009;66:2126–31 PubMed
20. , , , , , . A pharmacy discharge plan for hospitalized elderly patients - a randomized controlled trial. Age and Ageing. 2001;30(1):33-40. PubMed
21. Al-Rashed SA, Wright DJ, Roebuck N, et al. The value of inpatient pharmaceutical counselling to elderly patients prior to discharge. Br J Clin Pharmacol. 2002 Dec;54(6):657–64. PubMed
22. Schnipper JL, Kirwin JL, Cotugno MC, et al. Role of pharmacist counseling in preventing adverse drug events after hospitalization. Arch Intern Med. 2006 Mar 13;166(5):565–71. PubMed
23. Walker PC, Bernstein SJ, Jones JN, et al. Impact of a pharmacist-facilitated hospital discharge program: a quasi-experimental study. Arch Intern Med. 2009 Nov 23;169(21):2003–10. PubMed
24. van Walraven C, Dhalla IA, Bell C, et al. Derivation and validation of an index to predict early death or unplanned readmission after discharge from hospital to the community. CMAJ. 2010;182(6):551-557. PubMed
25. Normand ST, Landrum MB, Guadagnoli E, et al. Validating recommendations for coronary angiography following an acute myocardial infarction in the elderly: a matched analysis using propensity scores. J Clin Epidemiol. 2001;54(4):387-398. PubMed
26. Rosenbaum PR., Donald BR. Constructing a control group using multivariate matched sampling methods that incorporate the propensity score. Am Stat. 1985;39(1):33-38.
27. Fernandes O, Shojania KG. Medication reconciliation in the hospital: what, why, where, when, who and how? Healthc Q. 2012;15(Special Issue):42-49. PubMed
28. Joynt KE, Jha AK. Thirty-day readmissions—truth and consequences. N Engl J Med. 2012;366(15):1366-1369. PubMed
29. Zed PJ, Abu-Laban RB, Balen RM, et al. Incidence, severity and preventability of medication-related visits to the emergency department: a prospective study. CMAJ. 2008;178(12):1563-1569. PubMed
30. Gruneir A, Dhalla IA, van Walraven C, et al. Unplanned readmissions after hospital discharge among patients identified as being at high risk for readmission using a validated predictive algorithm. Open Med. 2011;5(2):e104-e111. PubMed
Healthcare systems are targeting effective strategies to improve patient safety and reduce hospital readmissions. Hospital readmissions can be detrimental to patients’ health, a source of avoidable healthcare costs, and are frequently a reflection of the quality of patient care during transitions of care. Medication reconciliation (Med Rec) was identified as 1 of 12 interventions that may reduce 30-day readmissions; however, rigorously designed studies are scarce.1,2 Published systematic reviews and meta-analyses have produced mixed conclusions regarding the impact of Med Rec on unplanned 30-day readmissions.2-4
In several studies, researchers have established the positive impact of Med Rec on reducing patient medication discrepancies and potential adverse drug events.4-8 Pharmacy-led Med Rec interventions have been shown to easily identify more clinically relevant and higher impact medication discrepancies when compared to usual care.8 In a systematic review, Mueller et al.2 suggest that there are several interrelated elements that determine if a Med Rec intervention will influence hospital readmissions. These elements form a multicomponent “bundle” of interventions, including a systematic medication history process, admission reconciliation, patient education on discharge, discharge reconciliation, and communication to outpatient providers.9 Several prospective randomized controlled studies have demonstrated lower readmission rates and fewer visits to the emergency department (ED) after implementing a comprehensive, interprofessional, bundled intervention (including Med Rec) from admission to discharge.10-13 A 2016 systematic review and meta-analysis specifically evaluated pharmacy-led Med Rec programs (the majority of which included interventions involving multicomponent bundles) and demonstrated a significant reduction in posthospital healthcare utilization.14
Although comprehensive, interprofessional, bundled interventions have been shown to reduce readmission rates and ED visits in randomized controlled trials (RCTs), limited resources often prevent hospitals from consistently implementing all aspects of these multicomponent interventions. In practice, clinicians may provide varying components of the bundle, such as the combination of admission medication history by the pharmacist and discharge Med Rec completed by the physician alone. The unique impact of combined pharmacist and prescriber Med Rec interventions from admission to discharge on readmissions remains inconclusive. Further, it is unclear which high-risk patient groups will benefit the most from these interventions. We set out to evaluate the impact of an enhanced, interprofessional Med Rec process from admission to discharge (characterized within the context of a novel taxonomy continuum that specifies clinician involvement and intensity of services) on readmissions to hospital and ED visits within 30 days of discharge.
METHODS
We conducted a retrospective, observational, analytical cohort study using QuadraMed’s Computerized Patient Record and the EMITT (Electronic Medication Information Transfer Tool)15 to collect data from 2007 to 2011.
Setting
The study was conducted at a 417-bed tertiary care teaching hospital in Toronto, Ontario, Canada.
Med Rec Process and Description of Exposure (Intervention)
The targeted clinical areas had sustained interprofessional models of patient care in place from admission to discharge. They also were actively using an in-house EMITT to facilitate the documentation and tracking of Med Rec efforts throughout patient admission, transfer, and discharge.15 On admission, the pharmacist conducted a best possible medication history (BPMH). A BPMH provides the cornerstone for Med Rec. It differs from a routine medication history in that it involves (1) a systematic process for interviewing the patient (or family) and (2) a review of at least one other reliable source of information (eg, a provincial medication database, an inspection of medication vials, or contact with the community pharmacy) to obtain and verify patient medications (prescribed and nonprescribed). The pharmacist recorded the BPMH in the electronic patient record. The application supported admission and discharge Med Rec. On discharge, there were 2 options: (1) the prescriber alone would review and complete the discharge Med Rec and generate electronic prescriptions (Table 1, Silver level care) or (2) the pharmacist would collaborate with the prescriber to complete the discharge reconciliation and the prescriber would electronically generate prescriptions (Table 1, Gold level care). All clinical areas had a combined pharmacist and prescriber Med Rec model in place at admission, but the proportion of patients receiving discharge reconciliation completed by pharmacist and prescriber versus the prescriber-alone varied based on the individual clinician’s practices.
Patient Selection
All consecutive hospitalized patients admitted and discharged by the general internal medicine [GIM] service from March 2007 to December 2011 were included. The GIM service was chosen for the main analysis because they had been performing the intervention for the longest period of time and had the largest population of patients. Patients were identified via their hospital-specific medical record identification number and specific hospital-visit number. Patients were excluded if any of the following occurred: (1) the length of stay of their index admission was less than 24 hours; (2) they died during the visit; (3) they were transferred to a separate acute care inpatient facility; or (4) they left hospital against medical advice. Patient visits were excluded as index cases from the analysis if they were returning within 90 days of a previous discharge.
Outcomes
The primary study outcome was the occurrence of an inpatient readmission or ED visit within 30 days of discharge. In our secondary analyses, we examined the impact of the intervention on high-risk patient populations, such as those ≥65 years of age, with a length of stay, acuity of admission, Charlson comorbidity index, and emergency department visits in past 6 months (LACE) index score ≥10 (see supplementary Appendix 1 for LACE score description), on high-alert medications (1 or more of warfarin, insulin, digoxin, and opioids), and on ≥10 medications.
Data Collection
Identification of Exposure of Interest
We used the electronic database to capture all patients who received pharmacist and prescriber supported admission-to-discharge reconciliation. We explicitly defined increasing intensity of Med Rec care in categories of Bronze, Silver, and Gold care levels (Table 1). The exposed (intervention) group received an enhanced Med Rec bundle (patients receiving Gold level care). The control group was made of patients receiving a partial Med Rec Bundle (patients receiving Silver or Bronze level of care or below).
Determination of Hospital Visits
A search of administrative databases was used to determine if patients admitted to the targeted services had an ED visit or urgent inpatient admission to the study hospital within 30 days.
Statistical Analysis
A logistic regression for outcomes was performed. This yielded an adjusted odds ratio with a 95% confidence interval (CI) between the intervention and control groups. Statistical significance was determined with a 2-sided α level of 0.05. In the analysis, we used Statistical Analysis Software version 9.2.
In our multivariate logistic regression model, we adjusted for confounding factors that might influence the patients’ risk of readmission or the type of Med Rec they received upon discharge. By using administrative databases, patient level demographics, and the Charlson comorbidity index, the most responsible diagnosis and disease burden were collected. Medication-related factors collected included the number of medications on discharge and the presence of predefined high-alert medications. The number of medications on the medication discharge list was determined by using the electronic database. The final adjustment model included age, gender, the number of medications on discharge, and the LACE index score (supplementary Appendix 1). The LACE index score has been validated in Ontario, Canada, populations to quantify the risk of death or unplanned readmission within 30 days of discharge.24
Propensity Score Adjustment
Propensity scoring (probability of treatment assignment conditional on observed baseline characteristics) was planned a priori to account for possible factors that would impact whether a patient received the intervention or control care levels. The propensity score for receiving Med Rec was computed from a logistic model using Med Rec as the outcome. A structured iterative approach was used to refine this model to achieve covariate balance within the matched pairs. Covariate balance was measured by the standardized difference, in which an absolute standardized difference >10% represents meaningful imbalance.25 From the original cohort, we attempted to match patients who had the intervention to patients from the control by means of a matching algorithm using the logit of the propensity score for receiving the intervention.26
Subgroup Analysis
We also examined the impact of the intervention on high-risk patient populations such as those ≥65 years of age, with a LACE index score ≥10, on high-alert medications, and on ≥10 medications. A univariate analysis was conducted to identify patient-related risk predictors that may be independently correlated with a higher risk of hospital visits.
RESULTS
Baseline Characteristics
A total of 8678 patients representing 9931 unique visits met the inclusion criteria for analysis. There were 2541 unique visits (approximately 26% of visits) in the intervention group that received Gold level care and 7390 unique visits in the control group. The patients in the control group were largely patients who received the original standard of care at the institution, Silver level care (67% of the control group). Patients who received Bronze level care or less comprised 33% of the control group.
Patients in the intervention group were significantly older (average of 68 years old versus 64 years old) and on more medications. They also notably had a longer duration of stay in hospital, an increased percentage of visits with a LACE index score ≥10, and were more likely to be discharged home on a high-alert medication and with supports (Table 2).
Main Analysis
The main unadjusted analysis of GIM patients (n = 9931 visits) did not detect a difference in 30-day ED visits and readmissions between the intervention group (540 out of 2541; 21.2%) and control (1423 out of 7390; 19.3%; Table 3). By using a multivariate logistic regression model to account for age, sex, LACE index, and number of medications on discharge, the adjusted odds ratio was 1.06 (95% CI, 0.95-1.19; P = 0.33). After propensity score adjustment, the relative risk of readmission was 0.88 (16.7% vs 18.9%; 95% CI, 0.59-1.32; P = 0.54).
Secondary Analyses
In each predefined high-risk patient subgroup (age ≥65, LACE index score ≥10, number of discharge medications ≥10, and the presence of high-alert medications), analyses of our primary endpoint did not detect significant adjusted odds ratios (Table 4). In our univariate analysis, increasing number of medications, LACE index score, and male gender were independently correlated with a higher risk of hospital visits (supplementary Appendix 2).
DISCUSSION
Med Rec is widely recommended as a patient safety strategy to prevent clinically significant medication discrepancies at transitions in care.4-9 However, Med Rec varies widely in terms of what it entails and who delivers it, with the preponderance of evidence suggesting an impact on clinically significant medication discrepancies only when interprofessional care delivered includes a central role for pharmacists.27 Furthermore, Med Rec appears to impact short term readmissions only when embedded in a broader, multifaceted, bundled intervention in which pharmacists or other team members educate patients about their medications and deliver postdischarge follow-up phone calls.10-13
As very few hospitals have the resources to sustainably deliver intensive care bundles that are represented in RCTs (characterized by Platinum and Diamond levels of care in Table 1), in our observational study, we sought to explore whether a resource-attainable, enhanced Med Rec care bundle (Gold level) had an impact on hospital utilization compared to partial Med Rec care bundles (Bronze and Silver levels). In our findings, we did not detect a significant difference on ED visits and readmissions within 30 days between enhanced and partial care bundles. In a secondary analysis of the influence of the intervention on prespecified high-risk patient subgroups, we also did not detect a difference.
As far as we are aware, our long-term, observational study is the largest to date to explore a real-life, enhanced Med Rec intervention and examine its impact on meaningful patient outcomes. We extrapolated that our intervention group received several critical attributes of a successful bundle as discussed by Mueller in a systematic review.2 Our intervention included the following: (1) a systematic BPMH process on admission; (2) integrated admission-to-discharge reconciliation processes; (3) discharge delineation of medication changes since admission; (4) pharmacist involvement in reconciliation from admission to discharge; (5) an electronic platform; and (6) formal discharge reconciliation with interprofessional collaboration. Additional components in the bundle described by Mueller included the following: patient education at discharge, postdischarge communication with the patient, and communication with outpatient providers and medication management.
In our results, we did not find a difference in outcomes between the intervention and control groups. Therefore, it is possible that the enhanced bundle’s focus on interprofessional involvement in discharge reconciliation (Gold care level) has no impact on hospital utilization compared to partial care bundles (Silver and Bronze levels). Kwan et al.3 describe similar findings in their systematic review, in which they evaluated the effects of hospital-based Med Rec on unintentional discrepancies with nontrivial risks for harm to patients on 30-day postdischarge hospital visits. Kwan et al.3 concluded that larger well-designed studies are required to further evaluate this outcome, but authors of current published studies suggest that Med Rec alone probably does not reduce postdischarge hospital utilization within 30 days. Med Rec may have a more significant impact on utilization when bundled with other interventions that improve discharge coordination.3
There may be several reasons why we were unable to detect a significant difference between the intervention and control groups. One limitation is that our nonrandomized, retrospective design may have led to unmeasured confounders that impacted allocation into the intervention group versus the control group. It was notable that patients in the intervention group had an increased age, longer duration of hospital stay, more medications, and high-alert medications on discharge compared to the control group and that may have biased our results towards the null hypothesis. Although the propensity score analysis attempted to adjust for this, it also did not detect a significant difference between groups.
In addition, the existing standard of care during the study period allowed for patients in the control group to receive varying levels of Med Rec. Ideally, we would have compared the intervention to a placebo group that did not receive any Med Rec-related care elements. However, as this was a real-life observational study, the majority of patients received some Med Rec services as a part of the standard of care. As a result, 67% of patients in the control group received Silver level Med Rec with a BPMH, admission reconciliation, and prescriber-only discharge reconciliation. This may have made it more difficult to show an incremental benefit on readmissions between the intervention and control.
Also, our primary outcome of all-cause ED or hospital readmissions within 30 days may not have been sensitive enough to detect the effect of Med Rec interventions alone. Only a small proportion of readmissions within 30 days of discharge are preventable and many patient and community level factors responsible for readmissions cannot be controlled by the hospital’s actions.28 Comprehensive pharmacy interventions have demonstrated decreased hospitalizations and emergency visits at 12 months; however, the largest impact was seen on the more specific outcome of medication-related hospitalizations (80% reduction).29 Lastly, another limitation was that we were unable to capture hospital visits to other centres. However, in our region, almost 75% of readmissions are to the same site as the initial hospitalization.30
Overall, our findings in this study and novel characterization of Med Rec services are relevant to many hospital sites that are striving to implement integrated Med Rec with limited healthcare resources. Although interprofessional Med Rec likely reduces clinically significant medication discrepancies, enhanced interprofessional Med Rec on discharge (Gold Med Rec) alone may not be enough to impact hospital utilization compared to partial Med Rec services (Silver and Bronze Med Rec). Further research into practical, targeted Med Rec bundles on more specific outcomes (such as preventable postdischarge adverse events, “avoidable” hospital readmissions, and medication-related readmissions) may detect a significant benefit.
CONCLUSION
A long-term observational evaluation of interprofessional Med Rec did not detect a difference in 30-day postdischarge patient hospital visits between patients who received enhanced versus partial Med Rec patient care bundles. Researchers of future prospective studies could focus on evaluating high-risk populations or specific elements of Med Rec services on avoidable medication-related hospital admissions and postdischarge adverse drug events.
Acknowledgments
The authors thank Nita Dhir, MBA.
Presented as a poster and oral presentation at the 2012 American College of Clinical Pharmacy Annual Meeting, Hollywood, Florida, October 21-24, 2012, and as an encore poster presentation at the Canadian Society of Hospital Pharmacists Professional Practice Conference, Toronto, Canada, Feb 3, 2013.
Disclosure
The authors declare no conflicts of interest related to the manuscript submitted. All monies used for the research came from the University Health Network Department of Pharmacy Budget, including the pharmacy residency program.
1. Hansen LO, Young RS, Hinami K, Leung A, Williams MV. Interventions to reduce 30-day rehospitalization: a systematic review. Ann Intern Med. 2011;155:520-528. PubMed
2. Mueller SK, Sponsler KC, Kripalani S, Schnipper JL. Hospital-based medication reconciliation practices: a systematic review. Arch Intern Med. 2012;172(14):1057-1069. PubMed
3. Kwan JL, Lo L, Sampson M, Shojania KG. Medication reconciliation during transitions of care as a patient safety strategy: a systematic review. Ann Intern Med. 2013;158:397-403. PubMed
4. Safer Health Care Now. Medication Reconciliation in Home Care Getting Started Kit. March 2015. www.ismp-canada.org/download/MedRec/Medrec_HC_English_GSK_v2.pdf. Accessed August 22, 2017.
5. Karapinar-Çarkit F, Borgsteede SD, Zoer J, Smit HJ, Egberts AC, van den Bemt PM. Effect of medication reconciliation with and without patient counseling on the number of pharmaceutical interventions among patients discharged from the hospital. Ann Pharmacother. 2009;43(6):1001-1010. PubMed
6. Wong JD, Bajcar JM, Wong GG, et al. Medication reconciliation at hospital discharge: evaluating discrepancies. Ann Pharmacother. 2008;42(10):1373-1379. PubMed
7. Schnipper JL, Hamann C, Ndumele CD, et al. Effect of an electronic medication reconciliation application and process redesign on potential adverse drug events: a cluster-randomized trial. Arch Intern Med. 2009;169(8):771-780. PubMed
8. Mekonnen AB, McLachlan AJ, Brien JA. Pharmacy-led medication reconciliation programmes at hospital transitions: a systematic review and meta-analysis. J Clin Pharm Ther. 2016;41(2):128-144. PubMed
9. Kaboli PJ, Fernandes O. Medication reconciliation: moving forward. Arch Intern Med. 2012;172(14):1069-1070. PubMed
10. Koehler BE, Richter KM, Youngblood L, et al. Reduction of 30-day postdischarge hospital readmission or emergency department (ED) visit rates in high-risk elderly medical patients through delivery of a targeted care bundle. J Hosp Med. 2009;4:211-218. PubMed
11. Jack BW, Chetty VK, Anthony D, et al. A reengineered hospital discharge program to decrease rehospitalization: a randomized trial. Ann Intern Med. 2009;150:178-187. PubMed
12. Gillespie U, Alassaad A, Henrohn D, et al. A comprehensive pharmacist intervention to reduce morbidity in patients 80 years or older. Arch Intern Med. 2009:169(9):894-900. PubMed
13. Makowsky MJ, Koshman SL, Midodzi WK, Tsuyuki RT. Capturing outcomes of clinical activities performed by a rounding pharmacist practicing in a team environment: the COLLABORATE study [NCT00351676]. Med Care. 2009;47(6):642-650. PubMed
14. Mekonnen AB, McLachlan AJ, Brien JA. Effectiveness of pharmacist-led medication reconciliation programmes on clinical outcomes at hospital transitions: a systematic review and meta-analysis. BMJ Open. 2016;6(2):e010003. PubMed
15. Cesta A, Bajcar JM, Ong SW, Fernandes OA. The EMITT study: development and evaluation of a medication information transfer tool. Ann Pharmacother. 2006:40(6):1074-1081 PubMed
16. Cornish P, et al. Unintended medication discrepancies at the time of hospital admission. Arch Internal Medicine, 2005, Feb: 165: 424-29. PubMed
17. Kwan Y, Fernandes OA, Nagge JJ, et al. Pharmacist medication assessments in a surgical preadmission clinic. Arch Intern Med. 2007;167(10):1034-1040 PubMed
18. Dedhia P, Kravet S, Bulger J, et al. A quality improvement intervention to facilitate the transition of older adults from three hospitals back to their homes. J Am Geriatr Soc. 2009;57:1540–1546. PubMed
19. Murphy EM, Oxencis CJ, Klauck JA, et al. Medication reconciliation at an academic medical center: implementation of a comprehensive program from admission to discharge. Am J Health Syst Pharm. 2009;66:2126–31 PubMed
20. , , , , , . A pharmacy discharge plan for hospitalized elderly patients - a randomized controlled trial. Age and Ageing. 2001;30(1):33-40. PubMed
21. Al-Rashed SA, Wright DJ, Roebuck N, et al. The value of inpatient pharmaceutical counselling to elderly patients prior to discharge. Br J Clin Pharmacol. 2002 Dec;54(6):657–64. PubMed
22. Schnipper JL, Kirwin JL, Cotugno MC, et al. Role of pharmacist counseling in preventing adverse drug events after hospitalization. Arch Intern Med. 2006 Mar 13;166(5):565–71. PubMed
23. Walker PC, Bernstein SJ, Jones JN, et al. Impact of a pharmacist-facilitated hospital discharge program: a quasi-experimental study. Arch Intern Med. 2009 Nov 23;169(21):2003–10. PubMed
24. van Walraven C, Dhalla IA, Bell C, et al. Derivation and validation of an index to predict early death or unplanned readmission after discharge from hospital to the community. CMAJ. 2010;182(6):551-557. PubMed
25. Normand ST, Landrum MB, Guadagnoli E, et al. Validating recommendations for coronary angiography following an acute myocardial infarction in the elderly: a matched analysis using propensity scores. J Clin Epidemiol. 2001;54(4):387-398. PubMed
26. Rosenbaum PR., Donald BR. Constructing a control group using multivariate matched sampling methods that incorporate the propensity score. Am Stat. 1985;39(1):33-38.
27. Fernandes O, Shojania KG. Medication reconciliation in the hospital: what, why, where, when, who and how? Healthc Q. 2012;15(Special Issue):42-49. PubMed
28. Joynt KE, Jha AK. Thirty-day readmissions—truth and consequences. N Engl J Med. 2012;366(15):1366-1369. PubMed
29. Zed PJ, Abu-Laban RB, Balen RM, et al. Incidence, severity and preventability of medication-related visits to the emergency department: a prospective study. CMAJ. 2008;178(12):1563-1569. PubMed
30. Gruneir A, Dhalla IA, van Walraven C, et al. Unplanned readmissions after hospital discharge among patients identified as being at high risk for readmission using a validated predictive algorithm. Open Med. 2011;5(2):e104-e111. PubMed
© 2018 Society of Hospital Medicine
The Enhanced Care Program: Impact of a Care Transition Program on 30-Day Hospital Readmissions for Patients Discharged From an Acute Care Facility to Skilled Nursing Facilities
Public reporting of readmission rates on the Nursing Home Compare website is mandated to begin on October 1, 2017, with skilled nursing facilities (SNFs) set to receive a Medicare bonus or penalty beginning a year later.1 The Centers for Medicare & Medicaid Services (CMS) began public reporting of hospitals’ 30-day readmission rates for selected conditions in 2009, and the Patient Protection and Affordable Care Act of 2010 mandated financial penalties for excess readmissions through the Hospital Readmission Reduction Program.2 In response, most hospitals have focused on patients who return home following discharge. Innovative interventions have proven successful, such as the Transitional Care model developed by Naylor and Coleman’s Care Transitions Intervention.3-5 Approximately 20% of Medicare beneficiaries are discharged from hospitals to SNFs, and these patients have higher readmission rates than those discharged home. CMS reported that in 2010, 23.3% of those with an SNF stay were readmitted within 30 days, compared with 18.8% for those with other discharge dispositions.6
Some work has been undertaken in this arena. In 2012, the Center for Medicare and Medicaid Innovation (CMMI) and the Medicare-Medicaid Coordination Office jointly launched the Initiative to Reduce Avoidable Hospitalizations among Nursing Facility Residents.7 This partnership established 7 Enhanced Care and Coordination Provider organizations and was designed to improve care by reducing hospitalizations among long-stay, dual-eligible nursing facility residents at 143 nursing homes in 7 states.8 At the time of the most recent project report, there were mixed results regarding program effects on hospitalizations and spending, with 2 states showing strongly positive patterns, 3 states with reductions that were consistent though not statistically strong, and mixed results in the remaining states. Quality measures did not show any pattern suggesting a program effect.9 Interventions to Reduce Acute Care Transfers (INTERACT) II was a 6-month, collaborative, quality-improvement project implemented in 2009 at 30 nursing homes in 3 states.10 The project evaluation found a statistically significant, 17% decrease in self-reported hospital admissions among the 25 SNFs that completed the intervention, compared with the same 6 months in the prior year. The Cleveland Clinic recently reported favorable results implementing its Connected Care model, which relied on staff physicians and advanced practice professionals to visit patients 4 to 5 times per week and be on call 24/7 at 7 intervention SNFs.11 Through this intervention, it successfully reduced its 30-day hospital readmission rate from SNFs from 28.1% to 21.7% (P < 0.001), and the authors posed the question as to whether its model and results were reproducible in other healthcare systems.
Herein, we report on the results of a collaborative initiative named the Enhanced Care Program (ECP), which offers the services of clinical providers and administrative staff to assist with the care of patients at 8 partner SNFs. The 3 components of ECP (described below) were specifically designed to address commonly recognized gaps and opportunities in routine SNF care. In contrast to the Cleveland Clinic’s Connected Care model (which involved hospital-employed physicians serving as the SNF attendings and excluded patients followed by their own physicians), ECP was designed to integrate into a pluralistic, community model whereby independent physicians continued to follow their own patients at the SNFs. The Connected Care analysis compared participating versus nonparticipating SNFs; both the Connected Care model and the INTERACT II evaluation relied on pre–post comparisons; the CMMI evaluation used a difference-in-differences model to compare the outcomes of the program SNFs with those of a matched comparison group of nonparticipating SNFs. The evaluation of ECP differs from these other initiatives, using a concurrent comparison group of patients discharged to the same SNFs but who were not enrolled in ECP.
METHODS
Setting
Cedars-Sinai Medical Center (CSMC) is an 850-bed, acute care facility located in an urban area of Los Angeles. Eight SNFs, ranging in size from 49 to 150 beds and located between 0.6 and 2.2 miles from CSMC, were invited to partner with the ECP. The physician community encompasses more than 2000 physicians on the medical staff, including private practitioners, nonteaching hospitalists, full-time faculty hospitalists, and faculty specialists.
Study Design and Patients
This was an observational, retrospective cohort analysis of 30-day same-hospital readmissions among 3951 patients discharged from CSMC to 8 SNFs between January 1, 2014, and June 30, 2015. A total of 2394 patients were enrolled in the ECP, and 1557 patients were not enrolled.
ECP Enrollment Protocol
Every patient discharged from CSMC to 1 of the 8 partner SNFs was eligible to participate in the program. To respect the autonomy of the SNF attending physicians and to facilitate a collaborative relationship, the decision to enroll a patient in the ECP rested with the SNF attending physician. The ECP team maintained a database that tracked whether each SNF attending physician (1) opted to automatically enroll all his or her patients in the ECP, (2) opted to enroll patients on a case-by-case basis (in which case an ECP nurse practitioner [N
Program Description
Patients enrolled in the ECP experienced the standard care provided by the SNF staff and attending physicians plus a clinical care program delivered by 9 full-time NPs, 1 full-time pharmacist, 1 pharmacy technician, 1 full-time nurse educator, a program administrator, and a medical director.
The program included the following 3 major components:
1. Direct patient care and 24/7 NP availability: Program enrollment began with an on-site, bedside evaluation by an ECP NP at the SNF within 24 hours of arrival and continued with weekly NP rounding (or more frequently, if clinically indicated) on the patient. Each encounter included a review of the medical record; a dialogue with the patient’s SNF attending physician to formulate treatment plans and place orders; discussions with nurses, family members, and other caregivers; and documentation in the medical record. The ECP team was on-site at the SNFs 7 days a week and on call 24/7 to address questions and concerns. Patients remained enrolled in the ECP from SNF admission to discharge even if their stay extended beyond 30 days.
2. Medication reconciliation: The ECP pharmacy team completed a review of a patient’s SNF medication administration record (MAR) within 72 hours of SNF admission. This process involved the pharmacy technician gathering medication lists from the SNFs and CSMC and providing this information to the pharmacist for a medication reconciliation and clinical evaluation. Discrepancies and pharmacist recommendations were communicated to the ECP NPs, and all identified issues were resolved.
3. Educational in-services: Building upon the INTERACT II model, the ECP team identified high-yield, clinically relevant topics, which the ECP nurse educator turned into monthly educational sessions for the SNF nursing staff at each of the participating SNFs.10
Primary Outcome Measure
An inpatient readmission to CSMC within 30 days of the hospital discharge date was counted as a readmission, whether the patient returned directly from an SNF or was readmitted from home after an SNF discharge.
Data
ECP patients were identified using a log maintained by the ECP program manager. Non-ECP patients discharged to the same SNFs during the study period were identified from CSMC’s electronic registry of SNF discharges. Covariates known to be associated with increased risk of 30-day readmission were obtained from CSMC’s electronic data warehouse, including demographic information, length of stay (LOS) of index hospitalization, and payer.12 Eleven clinical service lines represented patients’ clinical conditions based on Medicare-Severity Diagnosis-Related groupings. The discharge severity of illness score was calculated using 3M All Patients Refined Diagnosis Related Group software, version 33.13
Analysis
Characteristics of the ECP and non-ECP patients were compared using the χ2 test. A multivariable logistic regression model with fixed effects for SNF was created to determine the program’s impact on 30-day hospital readmission, adjusting for patient characteristics. The Pearson χ2 goodness-of-fit test and the link test for model specification were used to evaluate model specification. The sensitivity of the results to differences in patient characteristics was assessed in 2 ways. First, the ECP and non-ECP populations were stratified based on race and/or ethnicity and payer, and the multivariable regression model was run within the strata associated with the highest readmission rates. Second, a propensity analysis using inverse probability of treatment weighting (IPTW) was performed to control for group differences. Results of all comparisons were considered statistically significant when P < 0.05. Stata version 13 was used to perform the main analyses.14 The propensity analysis was conducted using R version 3.2.3. The CSMC Institutional Review Board (IRB) determined that this study qualified as a quality-improvement activity and did not require IRB approval or exemption.
RESULTS
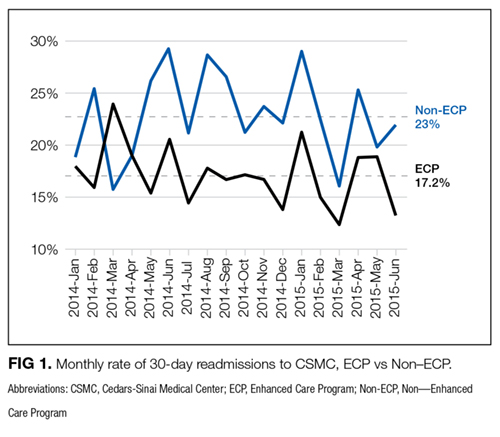
The average unadjusted 30-day readmission rate for ECP patients over the 18-month study period was 17.2%, compared to 23.0% for patients not enrolled in ECP (P < 0.001) (Figure 1). After adjusting for patient characteristics, ECP patients had 29% lower odds (95% confidence interval [CI], 0.60-0.85) of being readmitted to the medical center within 30 days than non-ECP patients at the same SNFs. The characteristics of the ECP and comparison patient cohorts are shown in Table 1. There were significant differences in sociodemographic characteristics: The ECP group had a higher proportion of non-Hispanic white patients, while the comparison group had a higher proportion of patients who were African American or Hispanic. ECP patients were more likely to prefer speaking English, while Russian, Farsi, and Spanish were preferred more frequently in the comparison group. There were also differences in payer mix, with the ECP group including proportionately more Medicare fee-for-service (52.9% vs 35.0%, P < 0.001), while the comparison group had a correspondingly larger proportion of dual-eligible (Medicare and Medicaid) patients (55.0% vs 35.1%, P < 0.001).
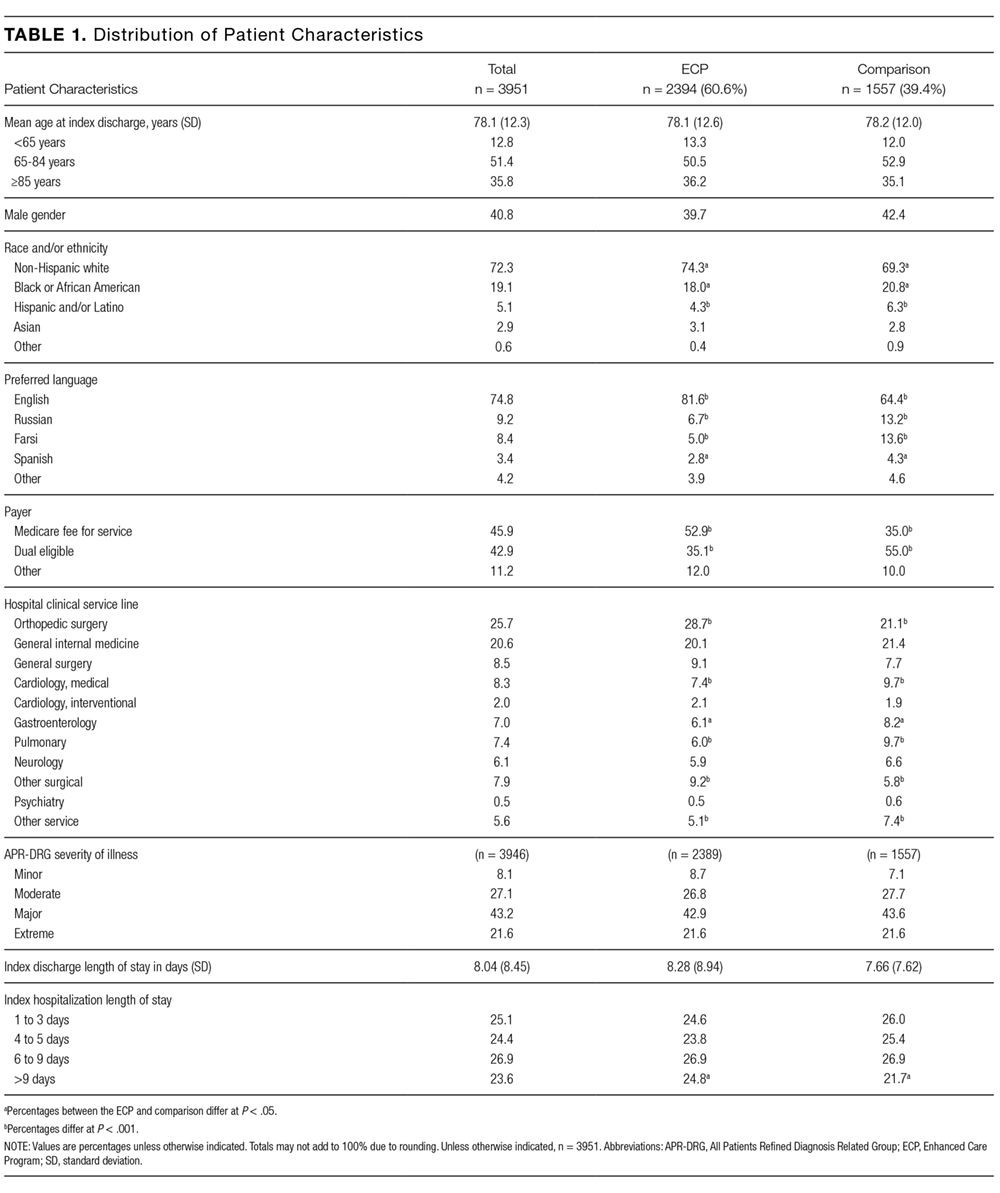
The largest clinical differences observed between the ECP and non-ECP groups were the proportions of patients in the clinical service lines of orthopedic surgery (28.7% vs 21.1%, P < 0.001), medical cardiology (7.4% vs 9.7%, P < 0.001), and surgery other than general surgery (5.8% vs 9.2%, P < 0.001). Despite these differences in case mix, no differences were seen between the 2 groups in discharge severity of illness or LOS of the index hospitalization. The distribution of index hospital LOS by quartile was the same, with the exception that the ECP group had a higher proportion of patients with longer LOS.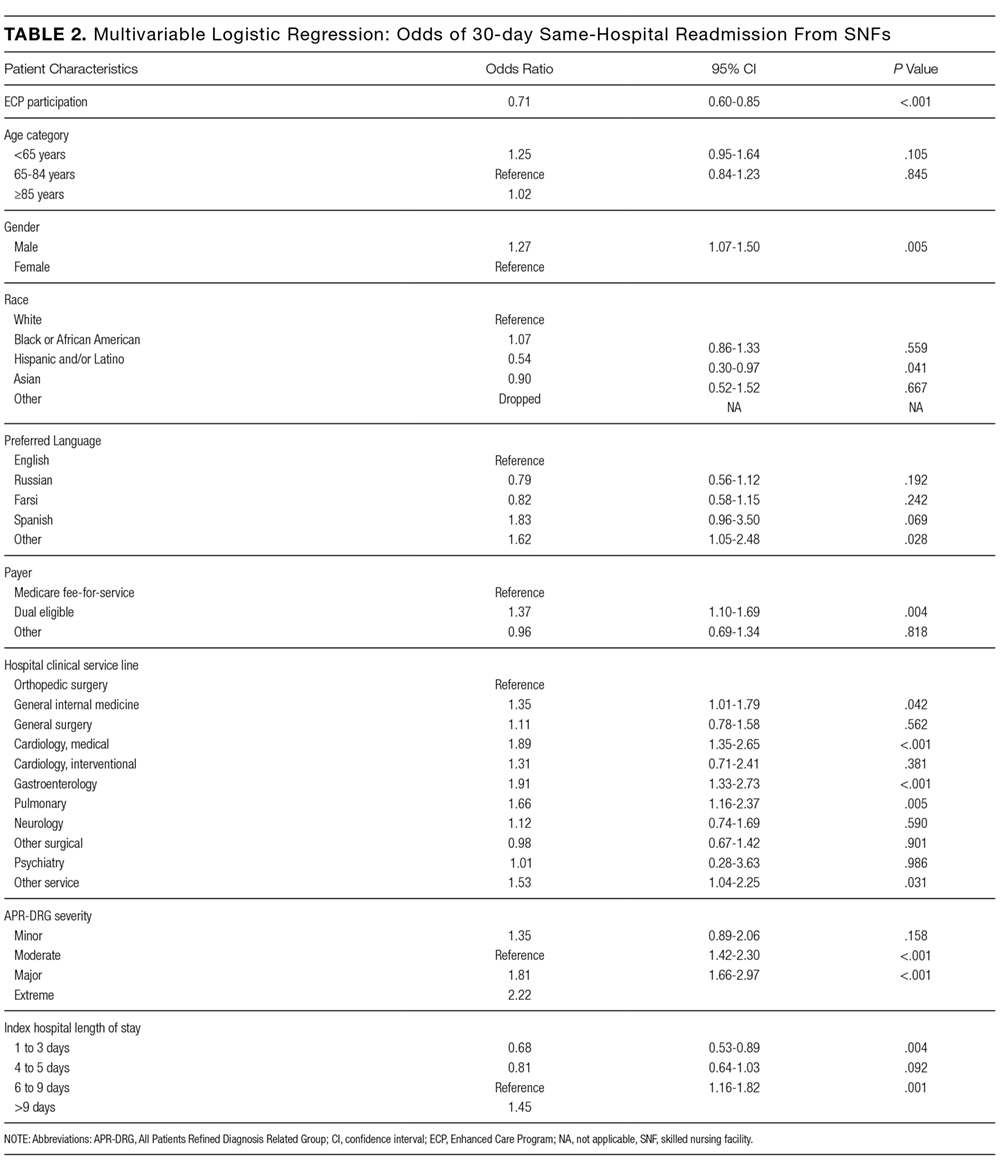
Sensitivity Analyses
The results were robust when tested within strata of the study population, including analyses limited to dual-eligible patients, African American patients, patients admitted to all except the highest volume facility, and patients admitted to any service line other than orthopedic surgery. Similar results were obtained when the study population was restricted to patients living within the medical center’s primary service area and to patients living in zip codes in which the proportion of adults living in households with income below 100% of the poverty level was 15% or greater (see Supplementary Material for results).
The effect of the program on readmission was also consistent when the full logistic regression model was run with IPTW using the propensity score. The evaluation of standardized cluster differences between the ECP and non-ECP groups before and after IPTW showed that the differences were reduced to <10% for being African American; speaking Russian or Farsi; having dual-eligible insurance coverage; having orthopedic surgery; being discharged from the clinical service lines of gastroenterology, pulmonary, other surgery, and other services; and having an index hospital LOS of 4 to 5 days or 10 or more days (results are provided in the Supplementary Material).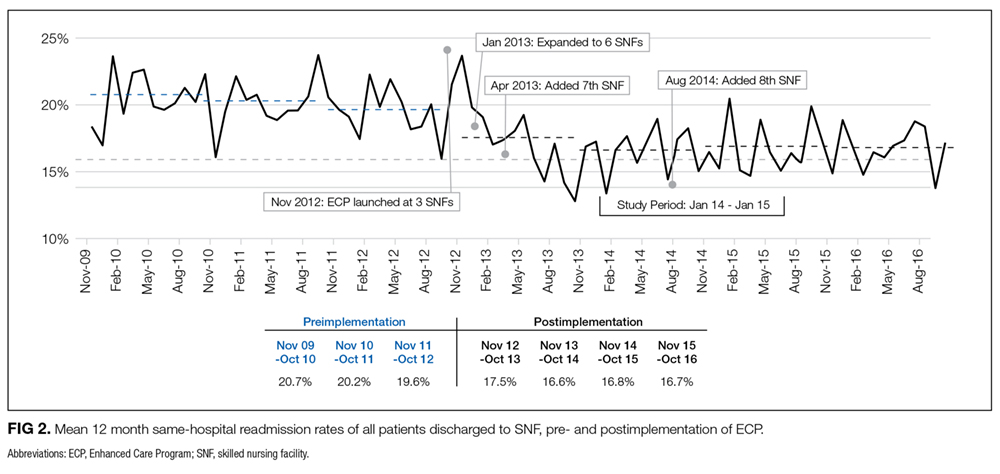
DISCUSSION
Hospitals continue to experience significant pressure to manage LOS, and SNFs and hospitals are being held accountable for readmission rates. The setting of this study is representative of many large, urban hospitals in the United States whose communities include a heterogeneous mix of hospitalists, primary care physicians who follow their patients in SNFs, and independent SNFs.15 The current regulations have not kept up with the increasing acuity and complexity of SNF patients. Specifically, Medicare guidelines allow the SNF attending physician up to 72 hours to complete a history and physical (or 7 days if he or she was the hospital attending physician for the index hospitalization) and only require monthly follow-up visits. It is the opinion of the ECP designers that these relatively lax requirements present unnecessary risk for vulnerable patients. While the INTERACT II model was focused largely on educational initiatives (with an advanced practice nurse available in a consultative role, as needed), the central tenet of ECP was similar to the Connected Care model in that the focus was on adding an extra layer of direct clinical support. Protocols that provided timely initial assessments by an NP (within 24 hours), weekly NP rounding (at a minimum), and 24/7 on-call availability all contributed to helping patients stay on track. Although the ECP had patients visited less frequently than the Connected Care model, and the Cleveland Clinic started with a higher baseline 30-day readmission rate from SNFs, similar overall reductions in 30-day readmissions were observed. The key point from both initiatives is that an increase in clinical touchpoints and ease of access to clinicians generates myriad opportunities to identify and address small issues before they become clinical emergencies requiring hospital transfers and readmissions.
Correcting medication discrepancies between hospital discharge summaries and SNF admission orders through a systematic medication reconciliation using a clinical pharmacist has previously been shown to improve outcomes.16-18 The ECP pharmacy technician and ECP clinical pharmacist discovered and corrected errors on a daily basis that ranged from incidental to potentially life-threatening. If the SNF staff does not provide the patient’s MAR within 48 hours of arrival, the pharmacy technician contacts the facility to obtain the information. As a result, all patients enrolled in the ECP during the study period received this intervention (unless they were rehospitalized or left the SNF before the process was completed), and 54% of ECP patients required some form of intervention after medication reconciliation was completed (data not shown).
This type of program requires hospital leadership and SNF administrators to be fully committed to developing strong working relationships, and in fact, there is evidence that SNF baseline readmission rates have a greater influence on patients’ risk of rehospitalization than the discharging hospital itself.19-21 Monthly educational in-services are delivered at the partner SNFs to enhance SNF nursing staff knowledge and clinical acumen. High-impact topics identified by the ECP team include the following: fall prevention, hand hygiene, venous thromboembolism, cardiovascular health, how to report change in condition, and advanced care planning, among others. While no formal pre–post assessments of the SNF nurses’ knowledge were conducted, a log of in-services was kept, subjective feedback was collected for performance improvement purposes, and continuing educational units were provided to the SNF nurses who attended.
This study has limitations. As a single-hospital study, generalizability may be limited. While adherence to the program components was closely monitored daily, service gaps may have occurred that were not captured. The program design makes it difficult to quantify the relative impact of the 3 program components on the outcome. Furthermore, the study was observational, so the differences in readmission rates may have been due to unmeasured variables. The decision to enroll patients in the ECP was made by each patient’s SNF attending physician, and those who chose to (or not to) participate in the program may manifest other, unmeasured practice patterns that made readmissions more or less likely. Participating physicians also had the option to enroll their patients on a case-by-case basis, introducing further potential bias in patient selection; however, <5% of physicians exercised this option. Patients may have also been readmitted to hospitals other than CSMC, producing an observed readmission rate for 1 or both groups that underrepresents the true outcome. On this point, while we did not systematically track these other-hospital readmissions for both groups, there is no reason to believe that this occurred preferentially for ECP or non-ECP patients.
Multiple sensitivity analyses were performed to address the observed differences between ECP and non-ECP patients. These included stratified examinations of variables differing between populations, examination of clustering effects between SNFs, and an analysis adjusted for the propensity to be included in the ECP. The calculated effect of the intervention on readmission remained robust, although we acknowledge that differences in the populations may persist and have influenced the outcomes even after controlling for multiple variables.22-25
In conclusion, the results of this intervention are compelling and add to the growing body of literature suggesting that a comprehensive, multipronged effort to enhance clinical oversight and coordination of care for SNF patients can improve outcomes. Given CMS’s plans to report SNF readmission rates in 2017 followed by the application of financial incentives in 2018, a favorable climate currently exists for greater coordination between hospitals and SNFs.26 We are currently undertaking an economic evaluation of the program.
Acknowledgments
The authors would like to thank the following people for their contributions: Mae Saunders, Rita Shane, Dr. Jon Kea, Miranda Li, the ECP NPs, the ECP pharmacy team, CSMC’s performance improvement team, and Alan Matus.
Disclosure
No conflicts of interest or disclosures.
1. Centers for Medicare & Medicaid Services (CMS), HHS. Medicare Program; Prospective Payment System and Consolidated Billing for Skilled Nursing Facilities (SNFs) for FY 2016, SNF Value-Based Purchasing Program, SNF Quality Reporting Program, and Staffing Data Collection. Final Rule. Fed Regist. 2015;80(149):46389-46477. PubMed
2. “Readmissions Reduction Program,” Centers for Medicare & Medicaid Services. http://www.cms.gov/Medicare/Medicare-Fee-for-Service-Payment/AcuteInpatientPPS/Readmissions-Reduction-Program.html. Accessed November 5, 2015.
3. Naylor MD, Brooten D, Campbell R, et al. Comprehensive discharge planning and home follow-up of hospitalized elders: a randomized clinical trial. JAMA. 1999;281:613-620. PubMed
4. Naylor MD, Brooten DA, Campbell RL, Maislin G, McCauley KM, Schwartz JS. Transitional care of older adults hospitalized with heart failure: a randomized, controlled trial. J Am Geriatr Soc. 2004;52:675-684. PubMed
5. Coleman EA, Parry C, Chalmers S, Min SJ. The care transitions intervention: results of a randomized controlled trial. Arch Intern Med. 2006;166:1822-1828. PubMed
6. CMS Office of Information Products and Data Analytics. National Medicare Readmission Findings: Recent Data and Trends. 2012. http://www.academyhealth.org/files/2012/sunday/brennan.pdf. Accessed on September 21, 2015.
7. Centers for Medicare & Medicaid Services, CMS Innovation Center. Initiative to Reduce Avoidable Hospitalizations among Nursing Facility Residents. https://innovation.cms.gov/initiatives/rahnfr/. Accessed on November 5, 2015.
8. Unroe KT, Nazir A, Holtz LR, et al. The Optimizing Patient Transfers, Impacting Medical Quality and Improving Symptoms: Transforming Institutional Care Approach: Preliminary data from the implementation of a Centers for Medicare and Medicaid Services nursing facility demonstration project. J Am Geriatr Soc. 2015;65:165-169. PubMed
9. Ingber MJ, Feng Z, Khatstsky G, et al. Evaluation of the Initiative to Reduce Avoidable Hospitalizations among Nursing Facility Residents: Final Annual Report Project Year 3. Waltham, MA: RTI International, RTI Project Number 0212790.006, January 2016.
10. Ouslander JG, Lamb G, Tappen R, et al. Interventions to reduce hospitalizations from nursing homes: Evaluation of the INTERACT II collaborative quality improvement project. J Am Geriatr Soc. 2011:59:745-753. PubMed
11. Kim L, Kou L, Hu B, Gorodeski EZ, Rothberg M. Impact of a Connected Care Model on 30-Day Readmission Rates from Skilled Nursing Facilities. J Hosp Med. 2017;12:238-244. PubMed
12. Kansagara D, Englander H, Salanitro A, et al. Risk Prediction Models for Hospital Readmission: A Systematic Review. JAMA. 2011;306(15):1688-1698. PubMed
13. Averill RF, Goldfield N, Hughes JS, et al. All Patient Refined Diagnosis Related Groups (APR-DRGs): Methodology Overview. 3M Health Information Systems Document GRP-041 (2003). https://www.hcup-us.ahrq.gov/db/nation/nis/APR-DRGsV20MethodologyOverviewandBibliography.pdf. Accessed on November 5, 2015.
14. StataCorp. 2013. Stata Statistical Software: Release 13. College Station, TX: StataCorp LP.
15. Cebul RD, Rebitzer JB, Taylor LJ, Votruba ME. Organizational fragmentation and care quality in the U.S. healthcare system. J Econ Perspect. 2008;22(4):93-113. PubMed
16. Tjia J, Bonner A, Briesacher BA, McGee S, Terrill E, Miller K. Medication discrepancies upon hospital to skilled nursing facility transitions. J Gen Intern Med. 2009;24:630-635. PubMed
17. Desai R, Williams CE, Greene SB, Pierson S, Hansen RA. Medication errors during patient transitions into nursing homes: characteristics and association with patient harm. Am J Geriatr Pharmacother. 2011;9:413-422. PubMed
18. Chhabra PT, Rattinger GB, Dutcher SK, Hare ME, Parsons KL, Zuckerman IH. Medication reconciliation during the transition to and from long-term care settings: a systematic review. Res Social Adm Pharm. 2012;8(1):60-75. PubMed
19. Rahman M, Foster AD, Grabowski DC, Zinn JS, Mor V. Effect of hospital-SNF referral linkages on rehospitalization. Health Serv Res. 2013;48(6, pt 1):1898-1919. PubMed
20. Schoenfeld AJ, Zhang X, Grabowski DC, Mor V, Weissman JS, Rahman M. Hospital-skilled nursing facility referral linkage reduces readmission rates among Medicare patients receiving major surgery. Surgery. 2016;159(5):1461-1468. PubMed
21. Rahman M, McHugh J, Gozalo P, Ackerly DC, Mor V. The Contribution of Skilled Nursing Facilities to Hospitals’ Readmission Rate. HSR: Health Services Research. 2017;52(2):656-675. PubMed
22. Jencks SF, Williams MV, Coleman EA. Rehospitalizations among patients in the Medicare fee-for-service program. New Engl J Med. 2009;360(14):1418-1428. PubMed
23. Hasan O, Meltzer DO, Shaykevich SA, et al. Hospital readmission in general medicine patients: a prediction model. J Hosp Med. 2010;25(3)211-219. PubMed
24. Allaudeen N, Vidyarhi A, Masella J, Auerbach A. Redefining readmission risk factors for general medicine patients. J Hosp Med. 2011;6(2):54-60. PubMed
25. Van Walraven C, Wong J, Forster AJ. LACE+ index: extension of a validated index to predict early death or urgent readmission after discharge using administrative data. Open Med. 2012;6(3):e80-e90. PubMed
26. Protecting Access to Medicare Act of 2014, Pub. L. No. 113-93, 128 Stat. 1040 (April 1, 2014). https://www.congress.gov/113/plaws/publ93/PLAW-113publ93.pdf. Accessed on October 3, 2015.
Public reporting of readmission rates on the Nursing Home Compare website is mandated to begin on October 1, 2017, with skilled nursing facilities (SNFs) set to receive a Medicare bonus or penalty beginning a year later.1 The Centers for Medicare & Medicaid Services (CMS) began public reporting of hospitals’ 30-day readmission rates for selected conditions in 2009, and the Patient Protection and Affordable Care Act of 2010 mandated financial penalties for excess readmissions through the Hospital Readmission Reduction Program.2 In response, most hospitals have focused on patients who return home following discharge. Innovative interventions have proven successful, such as the Transitional Care model developed by Naylor and Coleman’s Care Transitions Intervention.3-5 Approximately 20% of Medicare beneficiaries are discharged from hospitals to SNFs, and these patients have higher readmission rates than those discharged home. CMS reported that in 2010, 23.3% of those with an SNF stay were readmitted within 30 days, compared with 18.8% for those with other discharge dispositions.6
Some work has been undertaken in this arena. In 2012, the Center for Medicare and Medicaid Innovation (CMMI) and the Medicare-Medicaid Coordination Office jointly launched the Initiative to Reduce Avoidable Hospitalizations among Nursing Facility Residents.7 This partnership established 7 Enhanced Care and Coordination Provider organizations and was designed to improve care by reducing hospitalizations among long-stay, dual-eligible nursing facility residents at 143 nursing homes in 7 states.8 At the time of the most recent project report, there were mixed results regarding program effects on hospitalizations and spending, with 2 states showing strongly positive patterns, 3 states with reductions that were consistent though not statistically strong, and mixed results in the remaining states. Quality measures did not show any pattern suggesting a program effect.9 Interventions to Reduce Acute Care Transfers (INTERACT) II was a 6-month, collaborative, quality-improvement project implemented in 2009 at 30 nursing homes in 3 states.10 The project evaluation found a statistically significant, 17% decrease in self-reported hospital admissions among the 25 SNFs that completed the intervention, compared with the same 6 months in the prior year. The Cleveland Clinic recently reported favorable results implementing its Connected Care model, which relied on staff physicians and advanced practice professionals to visit patients 4 to 5 times per week and be on call 24/7 at 7 intervention SNFs.11 Through this intervention, it successfully reduced its 30-day hospital readmission rate from SNFs from 28.1% to 21.7% (P < 0.001), and the authors posed the question as to whether its model and results were reproducible in other healthcare systems.
Herein, we report on the results of a collaborative initiative named the Enhanced Care Program (ECP), which offers the services of clinical providers and administrative staff to assist with the care of patients at 8 partner SNFs. The 3 components of ECP (described below) were specifically designed to address commonly recognized gaps and opportunities in routine SNF care. In contrast to the Cleveland Clinic’s Connected Care model (which involved hospital-employed physicians serving as the SNF attendings and excluded patients followed by their own physicians), ECP was designed to integrate into a pluralistic, community model whereby independent physicians continued to follow their own patients at the SNFs. The Connected Care analysis compared participating versus nonparticipating SNFs; both the Connected Care model and the INTERACT II evaluation relied on pre–post comparisons; the CMMI evaluation used a difference-in-differences model to compare the outcomes of the program SNFs with those of a matched comparison group of nonparticipating SNFs. The evaluation of ECP differs from these other initiatives, using a concurrent comparison group of patients discharged to the same SNFs but who were not enrolled in ECP.
METHODS
Setting
Cedars-Sinai Medical Center (CSMC) is an 850-bed, acute care facility located in an urban area of Los Angeles. Eight SNFs, ranging in size from 49 to 150 beds and located between 0.6 and 2.2 miles from CSMC, were invited to partner with the ECP. The physician community encompasses more than 2000 physicians on the medical staff, including private practitioners, nonteaching hospitalists, full-time faculty hospitalists, and faculty specialists.
Study Design and Patients
This was an observational, retrospective cohort analysis of 30-day same-hospital readmissions among 3951 patients discharged from CSMC to 8 SNFs between January 1, 2014, and June 30, 2015. A total of 2394 patients were enrolled in the ECP, and 1557 patients were not enrolled.
ECP Enrollment Protocol
Every patient discharged from CSMC to 1 of the 8 partner SNFs was eligible to participate in the program. To respect the autonomy of the SNF attending physicians and to facilitate a collaborative relationship, the decision to enroll a patient in the ECP rested with the SNF attending physician. The ECP team maintained a database that tracked whether each SNF attending physician (1) opted to automatically enroll all his or her patients in the ECP, (2) opted to enroll patients on a case-by-case basis (in which case an ECP nurse practitioner [N
Program Description
Patients enrolled in the ECP experienced the standard care provided by the SNF staff and attending physicians plus a clinical care program delivered by 9 full-time NPs, 1 full-time pharmacist, 1 pharmacy technician, 1 full-time nurse educator, a program administrator, and a medical director.
The program included the following 3 major components:
1. Direct patient care and 24/7 NP availability: Program enrollment began with an on-site, bedside evaluation by an ECP NP at the SNF within 24 hours of arrival and continued with weekly NP rounding (or more frequently, if clinically indicated) on the patient. Each encounter included a review of the medical record; a dialogue with the patient’s SNF attending physician to formulate treatment plans and place orders; discussions with nurses, family members, and other caregivers; and documentation in the medical record. The ECP team was on-site at the SNFs 7 days a week and on call 24/7 to address questions and concerns. Patients remained enrolled in the ECP from SNF admission to discharge even if their stay extended beyond 30 days.
2. Medication reconciliation: The ECP pharmacy team completed a review of a patient’s SNF medication administration record (MAR) within 72 hours of SNF admission. This process involved the pharmacy technician gathering medication lists from the SNFs and CSMC and providing this information to the pharmacist for a medication reconciliation and clinical evaluation. Discrepancies and pharmacist recommendations were communicated to the ECP NPs, and all identified issues were resolved.
3. Educational in-services: Building upon the INTERACT II model, the ECP team identified high-yield, clinically relevant topics, which the ECP nurse educator turned into monthly educational sessions for the SNF nursing staff at each of the participating SNFs.10
Primary Outcome Measure
An inpatient readmission to CSMC within 30 days of the hospital discharge date was counted as a readmission, whether the patient returned directly from an SNF or was readmitted from home after an SNF discharge.
Data
ECP patients were identified using a log maintained by the ECP program manager. Non-ECP patients discharged to the same SNFs during the study period were identified from CSMC’s electronic registry of SNF discharges. Covariates known to be associated with increased risk of 30-day readmission were obtained from CSMC’s electronic data warehouse, including demographic information, length of stay (LOS) of index hospitalization, and payer.12 Eleven clinical service lines represented patients’ clinical conditions based on Medicare-Severity Diagnosis-Related groupings. The discharge severity of illness score was calculated using 3M All Patients Refined Diagnosis Related Group software, version 33.13
Analysis
Characteristics of the ECP and non-ECP patients were compared using the χ2 test. A multivariable logistic regression model with fixed effects for SNF was created to determine the program’s impact on 30-day hospital readmission, adjusting for patient characteristics. The Pearson χ2 goodness-of-fit test and the link test for model specification were used to evaluate model specification. The sensitivity of the results to differences in patient characteristics was assessed in 2 ways. First, the ECP and non-ECP populations were stratified based on race and/or ethnicity and payer, and the multivariable regression model was run within the strata associated with the highest readmission rates. Second, a propensity analysis using inverse probability of treatment weighting (IPTW) was performed to control for group differences. Results of all comparisons were considered statistically significant when P < 0.05. Stata version 13 was used to perform the main analyses.14 The propensity analysis was conducted using R version 3.2.3. The CSMC Institutional Review Board (IRB) determined that this study qualified as a quality-improvement activity and did not require IRB approval or exemption.
RESULTS
The average unadjusted 30-day readmission rate for ECP patients over the 18-month study period was 17.2%, compared to 23.0% for patients not enrolled in ECP (P < 0.001) (Figure 1). After adjusting for patient characteristics, ECP patients had 29% lower odds (95% confidence interval [CI], 0.60-0.85) of being readmitted to the medical center within 30 days than non-ECP patients at the same SNFs. The characteristics of the ECP and comparison patient cohorts are shown in Table 1. There were significant differences in sociodemographic characteristics: The ECP group had a higher proportion of non-Hispanic white patients, while the comparison group had a higher proportion of patients who were African American or Hispanic. ECP patients were more likely to prefer speaking English, while Russian, Farsi, and Spanish were preferred more frequently in the comparison group. There were also differences in payer mix, with the ECP group including proportionately more Medicare fee-for-service (52.9% vs 35.0%, P < 0.001), while the comparison group had a correspondingly larger proportion of dual-eligible (Medicare and Medicaid) patients (55.0% vs 35.1%, P < 0.001).
The largest clinical differences observed between the ECP and non-ECP groups were the proportions of patients in the clinical service lines of orthopedic surgery (28.7% vs 21.1%, P < 0.001), medical cardiology (7.4% vs 9.7%, P < 0.001), and surgery other than general surgery (5.8% vs 9.2%, P < 0.001). Despite these differences in case mix, no differences were seen between the 2 groups in discharge severity of illness or LOS of the index hospitalization. The distribution of index hospital LOS by quartile was the same, with the exception that the ECP group had a higher proportion of patients with longer LOS.
Sensitivity Analyses
The results were robust when tested within strata of the study population, including analyses limited to dual-eligible patients, African American patients, patients admitted to all except the highest volume facility, and patients admitted to any service line other than orthopedic surgery. Similar results were obtained when the study population was restricted to patients living within the medical center’s primary service area and to patients living in zip codes in which the proportion of adults living in households with income below 100% of the poverty level was 15% or greater (see Supplementary Material for results).
The effect of the program on readmission was also consistent when the full logistic regression model was run with IPTW using the propensity score. The evaluation of standardized cluster differences between the ECP and non-ECP groups before and after IPTW showed that the differences were reduced to <10% for being African American; speaking Russian or Farsi; having dual-eligible insurance coverage; having orthopedic surgery; being discharged from the clinical service lines of gastroenterology, pulmonary, other surgery, and other services; and having an index hospital LOS of 4 to 5 days or 10 or more days (results are provided in the Supplementary Material).
DISCUSSION
Hospitals continue to experience significant pressure to manage LOS, and SNFs and hospitals are being held accountable for readmission rates. The setting of this study is representative of many large, urban hospitals in the United States whose communities include a heterogeneous mix of hospitalists, primary care physicians who follow their patients in SNFs, and independent SNFs.15 The current regulations have not kept up with the increasing acuity and complexity of SNF patients. Specifically, Medicare guidelines allow the SNF attending physician up to 72 hours to complete a history and physical (or 7 days if he or she was the hospital attending physician for the index hospitalization) and only require monthly follow-up visits. It is the opinion of the ECP designers that these relatively lax requirements present unnecessary risk for vulnerable patients. While the INTERACT II model was focused largely on educational initiatives (with an advanced practice nurse available in a consultative role, as needed), the central tenet of ECP was similar to the Connected Care model in that the focus was on adding an extra layer of direct clinical support. Protocols that provided timely initial assessments by an NP (within 24 hours), weekly NP rounding (at a minimum), and 24/7 on-call availability all contributed to helping patients stay on track. Although the ECP had patients visited less frequently than the Connected Care model, and the Cleveland Clinic started with a higher baseline 30-day readmission rate from SNFs, similar overall reductions in 30-day readmissions were observed. The key point from both initiatives is that an increase in clinical touchpoints and ease of access to clinicians generates myriad opportunities to identify and address small issues before they become clinical emergencies requiring hospital transfers and readmissions.
Correcting medication discrepancies between hospital discharge summaries and SNF admission orders through a systematic medication reconciliation using a clinical pharmacist has previously been shown to improve outcomes.16-18 The ECP pharmacy technician and ECP clinical pharmacist discovered and corrected errors on a daily basis that ranged from incidental to potentially life-threatening. If the SNF staff does not provide the patient’s MAR within 48 hours of arrival, the pharmacy technician contacts the facility to obtain the information. As a result, all patients enrolled in the ECP during the study period received this intervention (unless they were rehospitalized or left the SNF before the process was completed), and 54% of ECP patients required some form of intervention after medication reconciliation was completed (data not shown).
This type of program requires hospital leadership and SNF administrators to be fully committed to developing strong working relationships, and in fact, there is evidence that SNF baseline readmission rates have a greater influence on patients’ risk of rehospitalization than the discharging hospital itself.19-21 Monthly educational in-services are delivered at the partner SNFs to enhance SNF nursing staff knowledge and clinical acumen. High-impact topics identified by the ECP team include the following: fall prevention, hand hygiene, venous thromboembolism, cardiovascular health, how to report change in condition, and advanced care planning, among others. While no formal pre–post assessments of the SNF nurses’ knowledge were conducted, a log of in-services was kept, subjective feedback was collected for performance improvement purposes, and continuing educational units were provided to the SNF nurses who attended.
This study has limitations. As a single-hospital study, generalizability may be limited. While adherence to the program components was closely monitored daily, service gaps may have occurred that were not captured. The program design makes it difficult to quantify the relative impact of the 3 program components on the outcome. Furthermore, the study was observational, so the differences in readmission rates may have been due to unmeasured variables. The decision to enroll patients in the ECP was made by each patient’s SNF attending physician, and those who chose to (or not to) participate in the program may manifest other, unmeasured practice patterns that made readmissions more or less likely. Participating physicians also had the option to enroll their patients on a case-by-case basis, introducing further potential bias in patient selection; however, <5% of physicians exercised this option. Patients may have also been readmitted to hospitals other than CSMC, producing an observed readmission rate for 1 or both groups that underrepresents the true outcome. On this point, while we did not systematically track these other-hospital readmissions for both groups, there is no reason to believe that this occurred preferentially for ECP or non-ECP patients.
Multiple sensitivity analyses were performed to address the observed differences between ECP and non-ECP patients. These included stratified examinations of variables differing between populations, examination of clustering effects between SNFs, and an analysis adjusted for the propensity to be included in the ECP. The calculated effect of the intervention on readmission remained robust, although we acknowledge that differences in the populations may persist and have influenced the outcomes even after controlling for multiple variables.22-25
In conclusion, the results of this intervention are compelling and add to the growing body of literature suggesting that a comprehensive, multipronged effort to enhance clinical oversight and coordination of care for SNF patients can improve outcomes. Given CMS’s plans to report SNF readmission rates in 2017 followed by the application of financial incentives in 2018, a favorable climate currently exists for greater coordination between hospitals and SNFs.26 We are currently undertaking an economic evaluation of the program.
Acknowledgments
The authors would like to thank the following people for their contributions: Mae Saunders, Rita Shane, Dr. Jon Kea, Miranda Li, the ECP NPs, the ECP pharmacy team, CSMC’s performance improvement team, and Alan Matus.
Disclosure
No conflicts of interest or disclosures.
1. Centers for Medicare & Medicaid Services (CMS), HHS. Medicare Program; Prospective Payment System and Consolidated Billing for Skilled Nursing Facilities (SNFs) for FY 2016, SNF Value-Based Purchasing Program, SNF Quality Reporting Program, and Staffing Data Collection. Final Rule. Fed Regist. 2015;80(149):46389-46477. PubMed
2. “Readmissions Reduction Program,” Centers for Medicare & Medicaid Services. http://www.cms.gov/Medicare/Medicare-Fee-for-Service-Payment/AcuteInpatientPPS/Readmissions-Reduction-Program.html. Accessed November 5, 2015.
3. Naylor MD, Brooten D, Campbell R, et al. Comprehensive discharge planning and home follow-up of hospitalized elders: a randomized clinical trial. JAMA. 1999;281:613-620. PubMed
4. Naylor MD, Brooten DA, Campbell RL, Maislin G, McCauley KM, Schwartz JS. Transitional care of older adults hospitalized with heart failure: a randomized, controlled trial. J Am Geriatr Soc. 2004;52:675-684. PubMed
5. Coleman EA, Parry C, Chalmers S, Min SJ. The care transitions intervention: results of a randomized controlled trial. Arch Intern Med. 2006;166:1822-1828. PubMed
6. CMS Office of Information Products and Data Analytics. National Medicare Readmission Findings: Recent Data and Trends. 2012. http://www.academyhealth.org/files/2012/sunday/brennan.pdf. Accessed on September 21, 2015.
7. Centers for Medicare & Medicaid Services, CMS Innovation Center. Initiative to Reduce Avoidable Hospitalizations among Nursing Facility Residents. https://innovation.cms.gov/initiatives/rahnfr/. Accessed on November 5, 2015.
8. Unroe KT, Nazir A, Holtz LR, et al. The Optimizing Patient Transfers, Impacting Medical Quality and Improving Symptoms: Transforming Institutional Care Approach: Preliminary data from the implementation of a Centers for Medicare and Medicaid Services nursing facility demonstration project. J Am Geriatr Soc. 2015;65:165-169. PubMed
9. Ingber MJ, Feng Z, Khatstsky G, et al. Evaluation of the Initiative to Reduce Avoidable Hospitalizations among Nursing Facility Residents: Final Annual Report Project Year 3. Waltham, MA: RTI International, RTI Project Number 0212790.006, January 2016.
10. Ouslander JG, Lamb G, Tappen R, et al. Interventions to reduce hospitalizations from nursing homes: Evaluation of the INTERACT II collaborative quality improvement project. J Am Geriatr Soc. 2011:59:745-753. PubMed
11. Kim L, Kou L, Hu B, Gorodeski EZ, Rothberg M. Impact of a Connected Care Model on 30-Day Readmission Rates from Skilled Nursing Facilities. J Hosp Med. 2017;12:238-244. PubMed
12. Kansagara D, Englander H, Salanitro A, et al. Risk Prediction Models for Hospital Readmission: A Systematic Review. JAMA. 2011;306(15):1688-1698. PubMed
13. Averill RF, Goldfield N, Hughes JS, et al. All Patient Refined Diagnosis Related Groups (APR-DRGs): Methodology Overview. 3M Health Information Systems Document GRP-041 (2003). https://www.hcup-us.ahrq.gov/db/nation/nis/APR-DRGsV20MethodologyOverviewandBibliography.pdf. Accessed on November 5, 2015.
14. StataCorp. 2013. Stata Statistical Software: Release 13. College Station, TX: StataCorp LP.
15. Cebul RD, Rebitzer JB, Taylor LJ, Votruba ME. Organizational fragmentation and care quality in the U.S. healthcare system. J Econ Perspect. 2008;22(4):93-113. PubMed
16. Tjia J, Bonner A, Briesacher BA, McGee S, Terrill E, Miller K. Medication discrepancies upon hospital to skilled nursing facility transitions. J Gen Intern Med. 2009;24:630-635. PubMed
17. Desai R, Williams CE, Greene SB, Pierson S, Hansen RA. Medication errors during patient transitions into nursing homes: characteristics and association with patient harm. Am J Geriatr Pharmacother. 2011;9:413-422. PubMed
18. Chhabra PT, Rattinger GB, Dutcher SK, Hare ME, Parsons KL, Zuckerman IH. Medication reconciliation during the transition to and from long-term care settings: a systematic review. Res Social Adm Pharm. 2012;8(1):60-75. PubMed
19. Rahman M, Foster AD, Grabowski DC, Zinn JS, Mor V. Effect of hospital-SNF referral linkages on rehospitalization. Health Serv Res. 2013;48(6, pt 1):1898-1919. PubMed
20. Schoenfeld AJ, Zhang X, Grabowski DC, Mor V, Weissman JS, Rahman M. Hospital-skilled nursing facility referral linkage reduces readmission rates among Medicare patients receiving major surgery. Surgery. 2016;159(5):1461-1468. PubMed
21. Rahman M, McHugh J, Gozalo P, Ackerly DC, Mor V. The Contribution of Skilled Nursing Facilities to Hospitals’ Readmission Rate. HSR: Health Services Research. 2017;52(2):656-675. PubMed
22. Jencks SF, Williams MV, Coleman EA. Rehospitalizations among patients in the Medicare fee-for-service program. New Engl J Med. 2009;360(14):1418-1428. PubMed
23. Hasan O, Meltzer DO, Shaykevich SA, et al. Hospital readmission in general medicine patients: a prediction model. J Hosp Med. 2010;25(3)211-219. PubMed
24. Allaudeen N, Vidyarhi A, Masella J, Auerbach A. Redefining readmission risk factors for general medicine patients. J Hosp Med. 2011;6(2):54-60. PubMed
25. Van Walraven C, Wong J, Forster AJ. LACE+ index: extension of a validated index to predict early death or urgent readmission after discharge using administrative data. Open Med. 2012;6(3):e80-e90. PubMed
26. Protecting Access to Medicare Act of 2014, Pub. L. No. 113-93, 128 Stat. 1040 (April 1, 2014). https://www.congress.gov/113/plaws/publ93/PLAW-113publ93.pdf. Accessed on October 3, 2015.
© 2018 Society of Hospital Medicine