User login
The Enhanced Care Program: Impact of a Care Transition Program on 30-Day Hospital Readmissions for Patients Discharged From an Acute Care Facility to Skilled Nursing Facilities
Public reporting of readmission rates on the Nursing Home Compare website is mandated to begin on October 1, 2017, with skilled nursing facilities (SNFs) set to receive a Medicare bonus or penalty beginning a year later.1 The Centers for Medicare & Medicaid Services (CMS) began public reporting of hospitals’ 30-day readmission rates for selected conditions in 2009, and the Patient Protection and Affordable Care Act of 2010 mandated financial penalties for excess readmissions through the Hospital Readmission Reduction Program.2 In response, most hospitals have focused on patients who return home following discharge. Innovative interventions have proven successful, such as the Transitional Care model developed by Naylor and Coleman’s Care Transitions Intervention.3-5 Approximately 20% of Medicare beneficiaries are discharged from hospitals to SNFs, and these patients have higher readmission rates than those discharged home. CMS reported that in 2010, 23.3% of those with an SNF stay were readmitted within 30 days, compared with 18.8% for those with other discharge dispositions.6
Some work has been undertaken in this arena. In 2012, the Center for Medicare and Medicaid Innovation (CMMI) and the Medicare-Medicaid Coordination Office jointly launched the Initiative to Reduce Avoidable Hospitalizations among Nursing Facility Residents.7 This partnership established 7 Enhanced Care and Coordination Provider organizations and was designed to improve care by reducing hospitalizations among long-stay, dual-eligible nursing facility residents at 143 nursing homes in 7 states.8 At the time of the most recent project report, there were mixed results regarding program effects on hospitalizations and spending, with 2 states showing strongly positive patterns, 3 states with reductions that were consistent though not statistically strong, and mixed results in the remaining states. Quality measures did not show any pattern suggesting a program effect.9 Interventions to Reduce Acute Care Transfers (INTERACT) II was a 6-month, collaborative, quality-improvement project implemented in 2009 at 30 nursing homes in 3 states.10 The project evaluation found a statistically significant, 17% decrease in self-reported hospital admissions among the 25 SNFs that completed the intervention, compared with the same 6 months in the prior year. The Cleveland Clinic recently reported favorable results implementing its Connected Care model, which relied on staff physicians and advanced practice professionals to visit patients 4 to 5 times per week and be on call 24/7 at 7 intervention SNFs.11 Through this intervention, it successfully reduced its 30-day hospital readmission rate from SNFs from 28.1% to 21.7% (P < 0.001), and the authors posed the question as to whether its model and results were reproducible in other healthcare systems.
Herein, we report on the results of a collaborative initiative named the Enhanced Care Program (ECP), which offers the services of clinical providers and administrative staff to assist with the care of patients at 8 partner SNFs. The 3 components of ECP (described below) were specifically designed to address commonly recognized gaps and opportunities in routine SNF care. In contrast to the Cleveland Clinic’s Connected Care model (which involved hospital-employed physicians serving as the SNF attendings and excluded patients followed by their own physicians), ECP was designed to integrate into a pluralistic, community model whereby independent physicians continued to follow their own patients at the SNFs. The Connected Care analysis compared participating versus nonparticipating SNFs; both the Connected Care model and the INTERACT II evaluation relied on pre–post comparisons; the CMMI evaluation used a difference-in-differences model to compare the outcomes of the program SNFs with those of a matched comparison group of nonparticipating SNFs. The evaluation of ECP differs from these other initiatives, using a concurrent comparison group of patients discharged to the same SNFs but who were not enrolled in ECP.
METHODS
Setting
Cedars-Sinai Medical Center (CSMC) is an 850-bed, acute care facility located in an urban area of Los Angeles. Eight SNFs, ranging in size from 49 to 150 beds and located between 0.6 and 2.2 miles from CSMC, were invited to partner with the ECP. The physician community encompasses more than 2000 physicians on the medical staff, including private practitioners, nonteaching hospitalists, full-time faculty hospitalists, and faculty specialists.
Study Design and Patients
This was an observational, retrospective cohort analysis of 30-day same-hospital readmissions among 3951 patients discharged from CSMC to 8 SNFs between January 1, 2014, and June 30, 2015. A total of 2394 patients were enrolled in the ECP, and 1557 patients were not enrolled.
ECP Enrollment Protocol
Every patient discharged from CSMC to 1 of the 8 partner SNFs was eligible to participate in the program. To respect the autonomy of the SNF attending physicians and to facilitate a collaborative relationship, the decision to enroll a patient in the ECP rested with the SNF attending physician. The ECP team maintained a database that tracked whether each SNF attending physician (1) opted to automatically enroll all his or her patients in the ECP, (2) opted to enroll patients on a case-by-case basis (in which case an ECP nurse practitioner [N
Program Description
Patients enrolled in the ECP experienced the standard care provided by the SNF staff and attending physicians plus a clinical care program delivered by 9 full-time NPs, 1 full-time pharmacist, 1 pharmacy technician, 1 full-time nurse educator, a program administrator, and a medical director.
The program included the following 3 major components:
1. Direct patient care and 24/7 NP availability: Program enrollment began with an on-site, bedside evaluation by an ECP NP at the SNF within 24 hours of arrival and continued with weekly NP rounding (or more frequently, if clinically indicated) on the patient. Each encounter included a review of the medical record; a dialogue with the patient’s SNF attending physician to formulate treatment plans and place orders; discussions with nurses, family members, and other caregivers; and documentation in the medical record. The ECP team was on-site at the SNFs 7 days a week and on call 24/7 to address questions and concerns. Patients remained enrolled in the ECP from SNF admission to discharge even if their stay extended beyond 30 days.
2. Medication reconciliation: The ECP pharmacy team completed a review of a patient’s SNF medication administration record (MAR) within 72 hours of SNF admission. This process involved the pharmacy technician gathering medication lists from the SNFs and CSMC and providing this information to the pharmacist for a medication reconciliation and clinical evaluation. Discrepancies and pharmacist recommendations were communicated to the ECP NPs, and all identified issues were resolved.
3. Educational in-services: Building upon the INTERACT II model, the ECP team identified high-yield, clinically relevant topics, which the ECP nurse educator turned into monthly educational sessions for the SNF nursing staff at each of the participating SNFs.10
Primary Outcome Measure
An inpatient readmission to CSMC within 30 days of the hospital discharge date was counted as a readmission, whether the patient returned directly from an SNF or was readmitted from home after an SNF discharge.
Data
ECP patients were identified using a log maintained by the ECP program manager. Non-ECP patients discharged to the same SNFs during the study period were identified from CSMC’s electronic registry of SNF discharges. Covariates known to be associated with increased risk of 30-day readmission were obtained from CSMC’s electronic data warehouse, including demographic information, length of stay (LOS) of index hospitalization, and payer.12 Eleven clinical service lines represented patients’ clinical conditions based on Medicare-Severity Diagnosis-Related groupings. The discharge severity of illness score was calculated using 3M All Patients Refined Diagnosis Related Group software, version 33.13
Analysis
Characteristics of the ECP and non-ECP patients were compared using the χ2 test. A multivariable logistic regression model with fixed effects for SNF was created to determine the program’s impact on 30-day hospital readmission, adjusting for patient characteristics. The Pearson χ2 goodness-of-fit test and the link test for model specification were used to evaluate model specification. The sensitivity of the results to differences in patient characteristics was assessed in 2 ways. First, the ECP and non-ECP populations were stratified based on race and/or ethnicity and payer, and the multivariable regression model was run within the strata associated with the highest readmission rates. Second, a propensity analysis using inverse probability of treatment weighting (IPTW) was performed to control for group differences. Results of all comparisons were considered statistically significant when P < 0.05. Stata version 13 was used to perform the main analyses.14 The propensity analysis was conducted using R version 3.2.3. The CSMC Institutional Review Board (IRB) determined that this study qualified as a quality-improvement activity and did not require IRB approval or exemption.
RESULTS
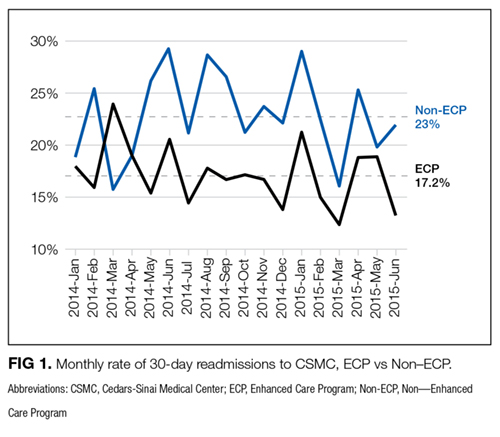
The average unadjusted 30-day readmission rate for ECP patients over the 18-month study period was 17.2%, compared to 23.0% for patients not enrolled in ECP (P < 0.001) (Figure 1). After adjusting for patient characteristics, ECP patients had 29% lower odds (95% confidence interval [CI], 0.60-0.85) of being readmitted to the medical center within 30 days than non-ECP patients at the same SNFs. The characteristics of the ECP and comparison patient cohorts are shown in Table 1. There were significant differences in sociodemographic characteristics: The ECP group had a higher proportion of non-Hispanic white patients, while the comparison group had a higher proportion of patients who were African American or Hispanic. ECP patients were more likely to prefer speaking English, while Russian, Farsi, and Spanish were preferred more frequently in the comparison group. There were also differences in payer mix, with the ECP group including proportionately more Medicare fee-for-service (52.9% vs 35.0%, P < 0.001), while the comparison group had a correspondingly larger proportion of dual-eligible (Medicare and Medicaid) patients (55.0% vs 35.1%, P < 0.001).
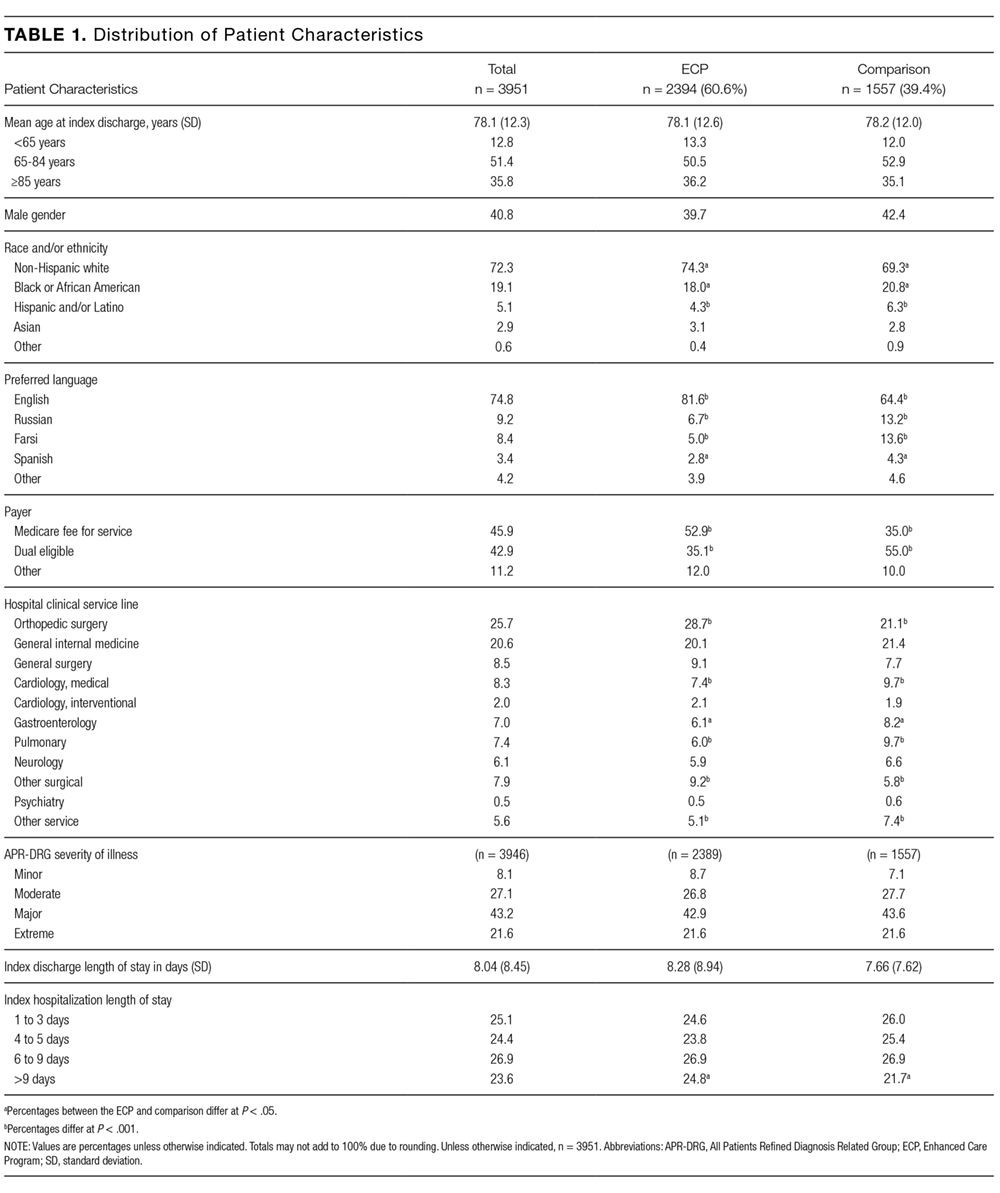
The largest clinical differences observed between the ECP and non-ECP groups were the proportions of patients in the clinical service lines of orthopedic surgery (28.7% vs 21.1%, P < 0.001), medical cardiology (7.4% vs 9.7%, P < 0.001), and surgery other than general surgery (5.8% vs 9.2%, P < 0.001). Despite these differences in case mix, no differences were seen between the 2 groups in discharge severity of illness or LOS of the index hospitalization. The distribution of index hospital LOS by quartile was the same, with the exception that the ECP group had a higher proportion of patients with longer LOS.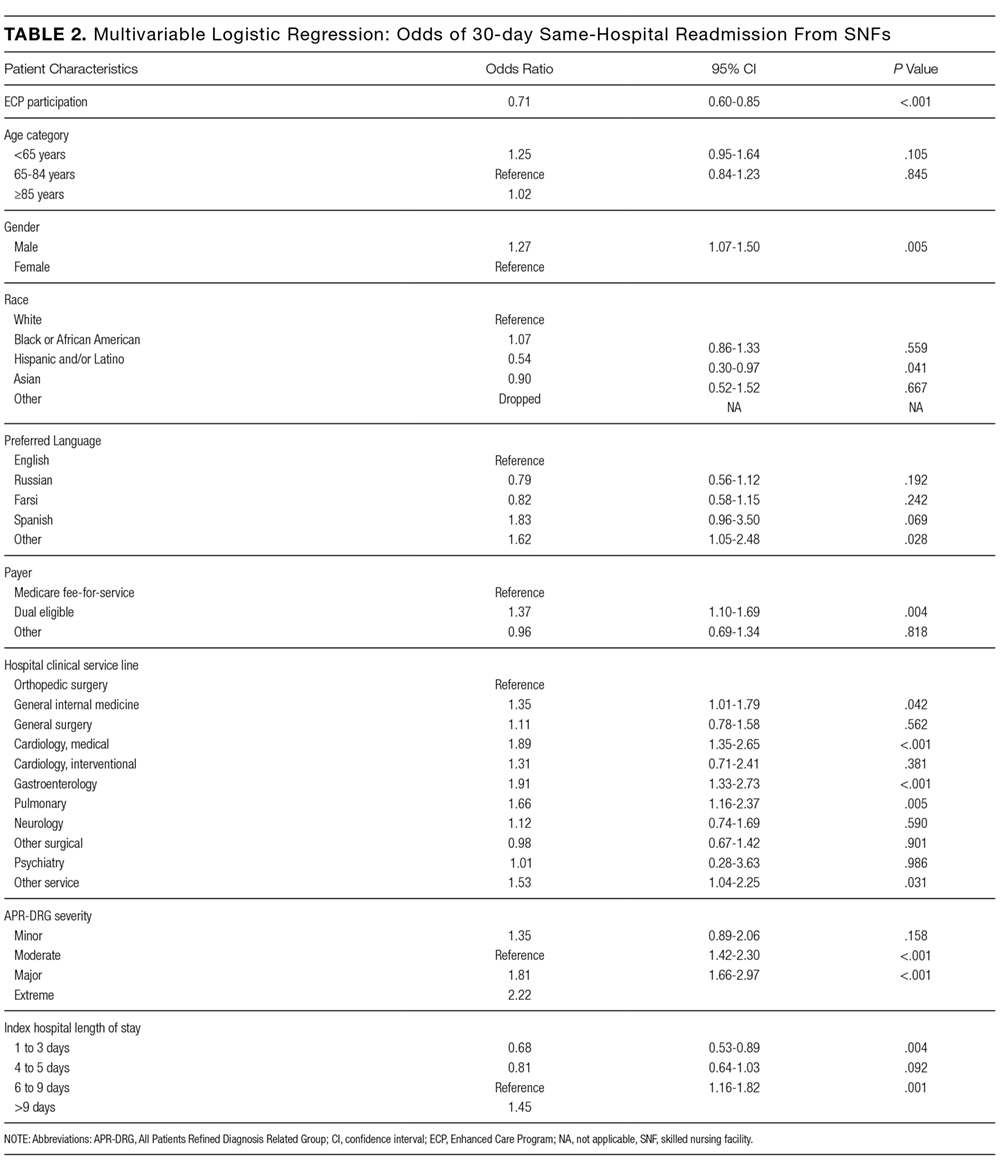
Sensitivity Analyses
The results were robust when tested within strata of the study population, including analyses limited to dual-eligible patients, African American patients, patients admitted to all except the highest volume facility, and patients admitted to any service line other than orthopedic surgery. Similar results were obtained when the study population was restricted to patients living within the medical center’s primary service area and to patients living in zip codes in which the proportion of adults living in households with income below 100% of the poverty level was 15% or greater (see Supplementary Material for results).
The effect of the program on readmission was also consistent when the full logistic regression model was run with IPTW using the propensity score. The evaluation of standardized cluster differences between the ECP and non-ECP groups before and after IPTW showed that the differences were reduced to <10% for being African American; speaking Russian or Farsi; having dual-eligible insurance coverage; having orthopedic surgery; being discharged from the clinical service lines of gastroenterology, pulmonary, other surgery, and other services; and having an index hospital LOS of 4 to 5 days or 10 or more days (results are provided in the Supplementary Material).
DISCUSSION
Hospitals continue to experience significant pressure to manage LOS, and SNFs and hospitals are being held accountable for readmission rates. The setting of this study is representative of many large, urban hospitals in the United States whose communities include a heterogeneous mix of hospitalists, primary care physicians who follow their patients in SNFs, and independent SNFs.15 The current regulations have not kept up with the increasing acuity and complexity of SNF patients. Specifically, Medicare guidelines allow the SNF attending physician up to 72 hours to complete a history and physical (or 7 days if he or she was the hospital attending physician for the index hospitalization) and only require monthly follow-up visits. It is the opinion of the ECP designers that these relatively lax requirements present unnecessary risk for vulnerable patients. While the INTERACT II model was focused largely on educational initiatives (with an advanced practice nurse available in a consultative role, as needed), the central tenet of ECP was similar to the Connected Care model in that the focus was on adding an extra layer of direct clinical support. Protocols that provided timely initial assessments by an NP (within 24 hours), weekly NP rounding (at a minimum), and 24/7 on-call availability all contributed to helping patients stay on track. Although the ECP had patients visited less frequently than the Connected Care model, and the Cleveland Clinic started with a higher baseline 30-day readmission rate from SNFs, similar overall reductions in 30-day readmissions were observed. The key point from both initiatives is that an increase in clinical touchpoints and ease of access to clinicians generates myriad opportunities to identify and address small issues before they become clinical emergencies requiring hospital transfers and readmissions.
Correcting medication discrepancies between hospital discharge summaries and SNF admission orders through a systematic medication reconciliation using a clinical pharmacist has previously been shown to improve outcomes.16-18 The ECP pharmacy technician and ECP clinical pharmacist discovered and corrected errors on a daily basis that ranged from incidental to potentially life-threatening. If the SNF staff does not provide the patient’s MAR within 48 hours of arrival, the pharmacy technician contacts the facility to obtain the information. As a result, all patients enrolled in the ECP during the study period received this intervention (unless they were rehospitalized or left the SNF before the process was completed), and 54% of ECP patients required some form of intervention after medication reconciliation was completed (data not shown).
This type of program requires hospital leadership and SNF administrators to be fully committed to developing strong working relationships, and in fact, there is evidence that SNF baseline readmission rates have a greater influence on patients’ risk of rehospitalization than the discharging hospital itself.19-21 Monthly educational in-services are delivered at the partner SNFs to enhance SNF nursing staff knowledge and clinical acumen. High-impact topics identified by the ECP team include the following: fall prevention, hand hygiene, venous thromboembolism, cardiovascular health, how to report change in condition, and advanced care planning, among others. While no formal pre–post assessments of the SNF nurses’ knowledge were conducted, a log of in-services was kept, subjective feedback was collected for performance improvement purposes, and continuing educational units were provided to the SNF nurses who attended.
This study has limitations. As a single-hospital study, generalizability may be limited. While adherence to the program components was closely monitored daily, service gaps may have occurred that were not captured. The program design makes it difficult to quantify the relative impact of the 3 program components on the outcome. Furthermore, the study was observational, so the differences in readmission rates may have been due to unmeasured variables. The decision to enroll patients in the ECP was made by each patient’s SNF attending physician, and those who chose to (or not to) participate in the program may manifest other, unmeasured practice patterns that made readmissions more or less likely. Participating physicians also had the option to enroll their patients on a case-by-case basis, introducing further potential bias in patient selection; however, <5% of physicians exercised this option. Patients may have also been readmitted to hospitals other than CSMC, producing an observed readmission rate for 1 or both groups that underrepresents the true outcome. On this point, while we did not systematically track these other-hospital readmissions for both groups, there is no reason to believe that this occurred preferentially for ECP or non-ECP patients.
Multiple sensitivity analyses were performed to address the observed differences between ECP and non-ECP patients. These included stratified examinations of variables differing between populations, examination of clustering effects between SNFs, and an analysis adjusted for the propensity to be included in the ECP. The calculated effect of the intervention on readmission remained robust, although we acknowledge that differences in the populations may persist and have influenced the outcomes even after controlling for multiple variables.22-25
In conclusion, the results of this intervention are compelling and add to the growing body of literature suggesting that a comprehensive, multipronged effort to enhance clinical oversight and coordination of care for SNF patients can improve outcomes. Given CMS’s plans to report SNF readmission rates in 2017 followed by the application of financial incentives in 2018, a favorable climate currently exists for greater coordination between hospitals and SNFs.26 We are currently undertaking an economic evaluation of the program.
Acknowledgments
The authors would like to thank the following people for their contributions: Mae Saunders, Rita Shane, Dr. Jon Kea, Miranda Li, the ECP NPs, the ECP pharmacy team, CSMC’s performance improvement team, and Alan Matus.
Disclosure
No conflicts of interest or disclosures.
1. Centers for Medicare & Medicaid Services (CMS), HHS. Medicare Program; Prospective Payment System and Consolidated Billing for Skilled Nursing Facilities (SNFs) for FY 2016, SNF Value-Based Purchasing Program, SNF Quality Reporting Program, and Staffing Data Collection. Final Rule. Fed Regist. 2015;80(149):46389-46477. PubMed
2. “Readmissions Reduction Program,” Centers for Medicare & Medicaid Services. http://www.cms.gov/Medicare/Medicare-Fee-for-Service-Payment/AcuteInpatientPPS/Readmissions-Reduction-Program.html. Accessed November 5, 2015.
3. Naylor MD, Brooten D, Campbell R, et al. Comprehensive discharge planning and home follow-up of hospitalized elders: a randomized clinical trial. JAMA. 1999;281:613-620. PubMed
4. Naylor MD, Brooten DA, Campbell RL, Maislin G, McCauley KM, Schwartz JS. Transitional care of older adults hospitalized with heart failure: a randomized, controlled trial. J Am Geriatr Soc. 2004;52:675-684. PubMed
5. Coleman EA, Parry C, Chalmers S, Min SJ. The care transitions intervention: results of a randomized controlled trial. Arch Intern Med. 2006;166:1822-1828. PubMed
6. CMS Office of Information Products and Data Analytics. National Medicare Readmission Findings: Recent Data and Trends. 2012. http://www.academyhealth.org/files/2012/sunday/brennan.pdf. Accessed on September 21, 2015.
7. Centers for Medicare & Medicaid Services, CMS Innovation Center. Initiative to Reduce Avoidable Hospitalizations among Nursing Facility Residents. https://innovation.cms.gov/initiatives/rahnfr/. Accessed on November 5, 2015.
8. Unroe KT, Nazir A, Holtz LR, et al. The Optimizing Patient Transfers, Impacting Medical Quality and Improving Symptoms: Transforming Institutional Care Approach: Preliminary data from the implementation of a Centers for Medicare and Medicaid Services nursing facility demonstration project. J Am Geriatr Soc. 2015;65:165-169. PubMed
9. Ingber MJ, Feng Z, Khatstsky G, et al. Evaluation of the Initiative to Reduce Avoidable Hospitalizations among Nursing Facility Residents: Final Annual Report Project Year 3. Waltham, MA: RTI International, RTI Project Number 0212790.006, January 2016.
10. Ouslander JG, Lamb G, Tappen R, et al. Interventions to reduce hospitalizations from nursing homes: Evaluation of the INTERACT II collaborative quality improvement project. J Am Geriatr Soc. 2011:59:745-753. PubMed
11. Kim L, Kou L, Hu B, Gorodeski EZ, Rothberg M. Impact of a Connected Care Model on 30-Day Readmission Rates from Skilled Nursing Facilities. J Hosp Med. 2017;12:238-244. PubMed
12. Kansagara D, Englander H, Salanitro A, et al. Risk Prediction Models for Hospital Readmission: A Systematic Review. JAMA. 2011;306(15):1688-1698. PubMed
13. Averill RF, Goldfield N, Hughes JS, et al. All Patient Refined Diagnosis Related Groups (APR-DRGs): Methodology Overview. 3M Health Information Systems Document GRP-041 (2003). https://www.hcup-us.ahrq.gov/db/nation/nis/APR-DRGsV20MethodologyOverviewandBibliography.pdf. Accessed on November 5, 2015.
14. StataCorp. 2013. Stata Statistical Software: Release 13. College Station, TX: StataCorp LP.
15. Cebul RD, Rebitzer JB, Taylor LJ, Votruba ME. Organizational fragmentation and care quality in the U.S. healthcare system. J Econ Perspect. 2008;22(4):93-113. PubMed
16. Tjia J, Bonner A, Briesacher BA, McGee S, Terrill E, Miller K. Medication discrepancies upon hospital to skilled nursing facility transitions. J Gen Intern Med. 2009;24:630-635. PubMed
17. Desai R, Williams CE, Greene SB, Pierson S, Hansen RA. Medication errors during patient transitions into nursing homes: characteristics and association with patient harm. Am J Geriatr Pharmacother. 2011;9:413-422. PubMed
18. Chhabra PT, Rattinger GB, Dutcher SK, Hare ME, Parsons KL, Zuckerman IH. Medication reconciliation during the transition to and from long-term care settings: a systematic review. Res Social Adm Pharm. 2012;8(1):60-75. PubMed
19. Rahman M, Foster AD, Grabowski DC, Zinn JS, Mor V. Effect of hospital-SNF referral linkages on rehospitalization. Health Serv Res. 2013;48(6, pt 1):1898-1919. PubMed
20. Schoenfeld AJ, Zhang X, Grabowski DC, Mor V, Weissman JS, Rahman M. Hospital-skilled nursing facility referral linkage reduces readmission rates among Medicare patients receiving major surgery. Surgery. 2016;159(5):1461-1468. PubMed
21. Rahman M, McHugh J, Gozalo P, Ackerly DC, Mor V. The Contribution of Skilled Nursing Facilities to Hospitals’ Readmission Rate. HSR: Health Services Research. 2017;52(2):656-675. PubMed
22. Jencks SF, Williams MV, Coleman EA. Rehospitalizations among patients in the Medicare fee-for-service program. New Engl J Med. 2009;360(14):1418-1428. PubMed
23. Hasan O, Meltzer DO, Shaykevich SA, et al. Hospital readmission in general medicine patients: a prediction model. J Hosp Med. 2010;25(3)211-219. PubMed
24. Allaudeen N, Vidyarhi A, Masella J, Auerbach A. Redefining readmission risk factors for general medicine patients. J Hosp Med. 2011;6(2):54-60. PubMed
25. Van Walraven C, Wong J, Forster AJ. LACE+ index: extension of a validated index to predict early death or urgent readmission after discharge using administrative data. Open Med. 2012;6(3):e80-e90. PubMed
26. Protecting Access to Medicare Act of 2014, Pub. L. No. 113-93, 128 Stat. 1040 (April 1, 2014). https://www.congress.gov/113/plaws/publ93/PLAW-113publ93.pdf. Accessed on October 3, 2015.
Public reporting of readmission rates on the Nursing Home Compare website is mandated to begin on October 1, 2017, with skilled nursing facilities (SNFs) set to receive a Medicare bonus or penalty beginning a year later.1 The Centers for Medicare & Medicaid Services (CMS) began public reporting of hospitals’ 30-day readmission rates for selected conditions in 2009, and the Patient Protection and Affordable Care Act of 2010 mandated financial penalties for excess readmissions through the Hospital Readmission Reduction Program.2 In response, most hospitals have focused on patients who return home following discharge. Innovative interventions have proven successful, such as the Transitional Care model developed by Naylor and Coleman’s Care Transitions Intervention.3-5 Approximately 20% of Medicare beneficiaries are discharged from hospitals to SNFs, and these patients have higher readmission rates than those discharged home. CMS reported that in 2010, 23.3% of those with an SNF stay were readmitted within 30 days, compared with 18.8% for those with other discharge dispositions.6
Some work has been undertaken in this arena. In 2012, the Center for Medicare and Medicaid Innovation (CMMI) and the Medicare-Medicaid Coordination Office jointly launched the Initiative to Reduce Avoidable Hospitalizations among Nursing Facility Residents.7 This partnership established 7 Enhanced Care and Coordination Provider organizations and was designed to improve care by reducing hospitalizations among long-stay, dual-eligible nursing facility residents at 143 nursing homes in 7 states.8 At the time of the most recent project report, there were mixed results regarding program effects on hospitalizations and spending, with 2 states showing strongly positive patterns, 3 states with reductions that were consistent though not statistically strong, and mixed results in the remaining states. Quality measures did not show any pattern suggesting a program effect.9 Interventions to Reduce Acute Care Transfers (INTERACT) II was a 6-month, collaborative, quality-improvement project implemented in 2009 at 30 nursing homes in 3 states.10 The project evaluation found a statistically significant, 17% decrease in self-reported hospital admissions among the 25 SNFs that completed the intervention, compared with the same 6 months in the prior year. The Cleveland Clinic recently reported favorable results implementing its Connected Care model, which relied on staff physicians and advanced practice professionals to visit patients 4 to 5 times per week and be on call 24/7 at 7 intervention SNFs.11 Through this intervention, it successfully reduced its 30-day hospital readmission rate from SNFs from 28.1% to 21.7% (P < 0.001), and the authors posed the question as to whether its model and results were reproducible in other healthcare systems.
Herein, we report on the results of a collaborative initiative named the Enhanced Care Program (ECP), which offers the services of clinical providers and administrative staff to assist with the care of patients at 8 partner SNFs. The 3 components of ECP (described below) were specifically designed to address commonly recognized gaps and opportunities in routine SNF care. In contrast to the Cleveland Clinic’s Connected Care model (which involved hospital-employed physicians serving as the SNF attendings and excluded patients followed by their own physicians), ECP was designed to integrate into a pluralistic, community model whereby independent physicians continued to follow their own patients at the SNFs. The Connected Care analysis compared participating versus nonparticipating SNFs; both the Connected Care model and the INTERACT II evaluation relied on pre–post comparisons; the CMMI evaluation used a difference-in-differences model to compare the outcomes of the program SNFs with those of a matched comparison group of nonparticipating SNFs. The evaluation of ECP differs from these other initiatives, using a concurrent comparison group of patients discharged to the same SNFs but who were not enrolled in ECP.
METHODS
Setting
Cedars-Sinai Medical Center (CSMC) is an 850-bed, acute care facility located in an urban area of Los Angeles. Eight SNFs, ranging in size from 49 to 150 beds and located between 0.6 and 2.2 miles from CSMC, were invited to partner with the ECP. The physician community encompasses more than 2000 physicians on the medical staff, including private practitioners, nonteaching hospitalists, full-time faculty hospitalists, and faculty specialists.
Study Design and Patients
This was an observational, retrospective cohort analysis of 30-day same-hospital readmissions among 3951 patients discharged from CSMC to 8 SNFs between January 1, 2014, and June 30, 2015. A total of 2394 patients were enrolled in the ECP, and 1557 patients were not enrolled.
ECP Enrollment Protocol
Every patient discharged from CSMC to 1 of the 8 partner SNFs was eligible to participate in the program. To respect the autonomy of the SNF attending physicians and to facilitate a collaborative relationship, the decision to enroll a patient in the ECP rested with the SNF attending physician. The ECP team maintained a database that tracked whether each SNF attending physician (1) opted to automatically enroll all his or her patients in the ECP, (2) opted to enroll patients on a case-by-case basis (in which case an ECP nurse practitioner [N
Program Description
Patients enrolled in the ECP experienced the standard care provided by the SNF staff and attending physicians plus a clinical care program delivered by 9 full-time NPs, 1 full-time pharmacist, 1 pharmacy technician, 1 full-time nurse educator, a program administrator, and a medical director.
The program included the following 3 major components:
1. Direct patient care and 24/7 NP availability: Program enrollment began with an on-site, bedside evaluation by an ECP NP at the SNF within 24 hours of arrival and continued with weekly NP rounding (or more frequently, if clinically indicated) on the patient. Each encounter included a review of the medical record; a dialogue with the patient’s SNF attending physician to formulate treatment plans and place orders; discussions with nurses, family members, and other caregivers; and documentation in the medical record. The ECP team was on-site at the SNFs 7 days a week and on call 24/7 to address questions and concerns. Patients remained enrolled in the ECP from SNF admission to discharge even if their stay extended beyond 30 days.
2. Medication reconciliation: The ECP pharmacy team completed a review of a patient’s SNF medication administration record (MAR) within 72 hours of SNF admission. This process involved the pharmacy technician gathering medication lists from the SNFs and CSMC and providing this information to the pharmacist for a medication reconciliation and clinical evaluation. Discrepancies and pharmacist recommendations were communicated to the ECP NPs, and all identified issues were resolved.
3. Educational in-services: Building upon the INTERACT II model, the ECP team identified high-yield, clinically relevant topics, which the ECP nurse educator turned into monthly educational sessions for the SNF nursing staff at each of the participating SNFs.10
Primary Outcome Measure
An inpatient readmission to CSMC within 30 days of the hospital discharge date was counted as a readmission, whether the patient returned directly from an SNF or was readmitted from home after an SNF discharge.
Data
ECP patients were identified using a log maintained by the ECP program manager. Non-ECP patients discharged to the same SNFs during the study period were identified from CSMC’s electronic registry of SNF discharges. Covariates known to be associated with increased risk of 30-day readmission were obtained from CSMC’s electronic data warehouse, including demographic information, length of stay (LOS) of index hospitalization, and payer.12 Eleven clinical service lines represented patients’ clinical conditions based on Medicare-Severity Diagnosis-Related groupings. The discharge severity of illness score was calculated using 3M All Patients Refined Diagnosis Related Group software, version 33.13
Analysis
Characteristics of the ECP and non-ECP patients were compared using the χ2 test. A multivariable logistic regression model with fixed effects for SNF was created to determine the program’s impact on 30-day hospital readmission, adjusting for patient characteristics. The Pearson χ2 goodness-of-fit test and the link test for model specification were used to evaluate model specification. The sensitivity of the results to differences in patient characteristics was assessed in 2 ways. First, the ECP and non-ECP populations were stratified based on race and/or ethnicity and payer, and the multivariable regression model was run within the strata associated with the highest readmission rates. Second, a propensity analysis using inverse probability of treatment weighting (IPTW) was performed to control for group differences. Results of all comparisons were considered statistically significant when P < 0.05. Stata version 13 was used to perform the main analyses.14 The propensity analysis was conducted using R version 3.2.3. The CSMC Institutional Review Board (IRB) determined that this study qualified as a quality-improvement activity and did not require IRB approval or exemption.
RESULTS
The average unadjusted 30-day readmission rate for ECP patients over the 18-month study period was 17.2%, compared to 23.0% for patients not enrolled in ECP (P < 0.001) (Figure 1). After adjusting for patient characteristics, ECP patients had 29% lower odds (95% confidence interval [CI], 0.60-0.85) of being readmitted to the medical center within 30 days than non-ECP patients at the same SNFs. The characteristics of the ECP and comparison patient cohorts are shown in Table 1. There were significant differences in sociodemographic characteristics: The ECP group had a higher proportion of non-Hispanic white patients, while the comparison group had a higher proportion of patients who were African American or Hispanic. ECP patients were more likely to prefer speaking English, while Russian, Farsi, and Spanish were preferred more frequently in the comparison group. There were also differences in payer mix, with the ECP group including proportionately more Medicare fee-for-service (52.9% vs 35.0%, P < 0.001), while the comparison group had a correspondingly larger proportion of dual-eligible (Medicare and Medicaid) patients (55.0% vs 35.1%, P < 0.001).
The largest clinical differences observed between the ECP and non-ECP groups were the proportions of patients in the clinical service lines of orthopedic surgery (28.7% vs 21.1%, P < 0.001), medical cardiology (7.4% vs 9.7%, P < 0.001), and surgery other than general surgery (5.8% vs 9.2%, P < 0.001). Despite these differences in case mix, no differences were seen between the 2 groups in discharge severity of illness or LOS of the index hospitalization. The distribution of index hospital LOS by quartile was the same, with the exception that the ECP group had a higher proportion of patients with longer LOS.
Sensitivity Analyses
The results were robust when tested within strata of the study population, including analyses limited to dual-eligible patients, African American patients, patients admitted to all except the highest volume facility, and patients admitted to any service line other than orthopedic surgery. Similar results were obtained when the study population was restricted to patients living within the medical center’s primary service area and to patients living in zip codes in which the proportion of adults living in households with income below 100% of the poverty level was 15% or greater (see Supplementary Material for results).
The effect of the program on readmission was also consistent when the full logistic regression model was run with IPTW using the propensity score. The evaluation of standardized cluster differences between the ECP and non-ECP groups before and after IPTW showed that the differences were reduced to <10% for being African American; speaking Russian or Farsi; having dual-eligible insurance coverage; having orthopedic surgery; being discharged from the clinical service lines of gastroenterology, pulmonary, other surgery, and other services; and having an index hospital LOS of 4 to 5 days or 10 or more days (results are provided in the Supplementary Material).
DISCUSSION
Hospitals continue to experience significant pressure to manage LOS, and SNFs and hospitals are being held accountable for readmission rates. The setting of this study is representative of many large, urban hospitals in the United States whose communities include a heterogeneous mix of hospitalists, primary care physicians who follow their patients in SNFs, and independent SNFs.15 The current regulations have not kept up with the increasing acuity and complexity of SNF patients. Specifically, Medicare guidelines allow the SNF attending physician up to 72 hours to complete a history and physical (or 7 days if he or she was the hospital attending physician for the index hospitalization) and only require monthly follow-up visits. It is the opinion of the ECP designers that these relatively lax requirements present unnecessary risk for vulnerable patients. While the INTERACT II model was focused largely on educational initiatives (with an advanced practice nurse available in a consultative role, as needed), the central tenet of ECP was similar to the Connected Care model in that the focus was on adding an extra layer of direct clinical support. Protocols that provided timely initial assessments by an NP (within 24 hours), weekly NP rounding (at a minimum), and 24/7 on-call availability all contributed to helping patients stay on track. Although the ECP had patients visited less frequently than the Connected Care model, and the Cleveland Clinic started with a higher baseline 30-day readmission rate from SNFs, similar overall reductions in 30-day readmissions were observed. The key point from both initiatives is that an increase in clinical touchpoints and ease of access to clinicians generates myriad opportunities to identify and address small issues before they become clinical emergencies requiring hospital transfers and readmissions.
Correcting medication discrepancies between hospital discharge summaries and SNF admission orders through a systematic medication reconciliation using a clinical pharmacist has previously been shown to improve outcomes.16-18 The ECP pharmacy technician and ECP clinical pharmacist discovered and corrected errors on a daily basis that ranged from incidental to potentially life-threatening. If the SNF staff does not provide the patient’s MAR within 48 hours of arrival, the pharmacy technician contacts the facility to obtain the information. As a result, all patients enrolled in the ECP during the study period received this intervention (unless they were rehospitalized or left the SNF before the process was completed), and 54% of ECP patients required some form of intervention after medication reconciliation was completed (data not shown).
This type of program requires hospital leadership and SNF administrators to be fully committed to developing strong working relationships, and in fact, there is evidence that SNF baseline readmission rates have a greater influence on patients’ risk of rehospitalization than the discharging hospital itself.19-21 Monthly educational in-services are delivered at the partner SNFs to enhance SNF nursing staff knowledge and clinical acumen. High-impact topics identified by the ECP team include the following: fall prevention, hand hygiene, venous thromboembolism, cardiovascular health, how to report change in condition, and advanced care planning, among others. While no formal pre–post assessments of the SNF nurses’ knowledge were conducted, a log of in-services was kept, subjective feedback was collected for performance improvement purposes, and continuing educational units were provided to the SNF nurses who attended.
This study has limitations. As a single-hospital study, generalizability may be limited. While adherence to the program components was closely monitored daily, service gaps may have occurred that were not captured. The program design makes it difficult to quantify the relative impact of the 3 program components on the outcome. Furthermore, the study was observational, so the differences in readmission rates may have been due to unmeasured variables. The decision to enroll patients in the ECP was made by each patient’s SNF attending physician, and those who chose to (or not to) participate in the program may manifest other, unmeasured practice patterns that made readmissions more or less likely. Participating physicians also had the option to enroll their patients on a case-by-case basis, introducing further potential bias in patient selection; however, <5% of physicians exercised this option. Patients may have also been readmitted to hospitals other than CSMC, producing an observed readmission rate for 1 or both groups that underrepresents the true outcome. On this point, while we did not systematically track these other-hospital readmissions for both groups, there is no reason to believe that this occurred preferentially for ECP or non-ECP patients.
Multiple sensitivity analyses were performed to address the observed differences between ECP and non-ECP patients. These included stratified examinations of variables differing between populations, examination of clustering effects between SNFs, and an analysis adjusted for the propensity to be included in the ECP. The calculated effect of the intervention on readmission remained robust, although we acknowledge that differences in the populations may persist and have influenced the outcomes even after controlling for multiple variables.22-25
In conclusion, the results of this intervention are compelling and add to the growing body of literature suggesting that a comprehensive, multipronged effort to enhance clinical oversight and coordination of care for SNF patients can improve outcomes. Given CMS’s plans to report SNF readmission rates in 2017 followed by the application of financial incentives in 2018, a favorable climate currently exists for greater coordination between hospitals and SNFs.26 We are currently undertaking an economic evaluation of the program.
Acknowledgments
The authors would like to thank the following people for their contributions: Mae Saunders, Rita Shane, Dr. Jon Kea, Miranda Li, the ECP NPs, the ECP pharmacy team, CSMC’s performance improvement team, and Alan Matus.
Disclosure
No conflicts of interest or disclosures.
1. Centers for Medicare & Medicaid Services (CMS), HHS. Medicare Program; Prospective Payment System and Consolidated Billing for Skilled Nursing Facilities (SNFs) for FY 2016, SNF Value-Based Purchasing Program, SNF Quality Reporting Program, and Staffing Data Collection. Final Rule. Fed Regist. 2015;80(149):46389-46477. PubMed
2. “Readmissions Reduction Program,” Centers for Medicare & Medicaid Services. http://www.cms.gov/Medicare/Medicare-Fee-for-Service-Payment/AcuteInpatientPPS/Readmissions-Reduction-Program.html. Accessed November 5, 2015.
3. Naylor MD, Brooten D, Campbell R, et al. Comprehensive discharge planning and home follow-up of hospitalized elders: a randomized clinical trial. JAMA. 1999;281:613-620. PubMed
4. Naylor MD, Brooten DA, Campbell RL, Maislin G, McCauley KM, Schwartz JS. Transitional care of older adults hospitalized with heart failure: a randomized, controlled trial. J Am Geriatr Soc. 2004;52:675-684. PubMed
5. Coleman EA, Parry C, Chalmers S, Min SJ. The care transitions intervention: results of a randomized controlled trial. Arch Intern Med. 2006;166:1822-1828. PubMed
6. CMS Office of Information Products and Data Analytics. National Medicare Readmission Findings: Recent Data and Trends. 2012. http://www.academyhealth.org/files/2012/sunday/brennan.pdf. Accessed on September 21, 2015.
7. Centers for Medicare & Medicaid Services, CMS Innovation Center. Initiative to Reduce Avoidable Hospitalizations among Nursing Facility Residents. https://innovation.cms.gov/initiatives/rahnfr/. Accessed on November 5, 2015.
8. Unroe KT, Nazir A, Holtz LR, et al. The Optimizing Patient Transfers, Impacting Medical Quality and Improving Symptoms: Transforming Institutional Care Approach: Preliminary data from the implementation of a Centers for Medicare and Medicaid Services nursing facility demonstration project. J Am Geriatr Soc. 2015;65:165-169. PubMed
9. Ingber MJ, Feng Z, Khatstsky G, et al. Evaluation of the Initiative to Reduce Avoidable Hospitalizations among Nursing Facility Residents: Final Annual Report Project Year 3. Waltham, MA: RTI International, RTI Project Number 0212790.006, January 2016.
10. Ouslander JG, Lamb G, Tappen R, et al. Interventions to reduce hospitalizations from nursing homes: Evaluation of the INTERACT II collaborative quality improvement project. J Am Geriatr Soc. 2011:59:745-753. PubMed
11. Kim L, Kou L, Hu B, Gorodeski EZ, Rothberg M. Impact of a Connected Care Model on 30-Day Readmission Rates from Skilled Nursing Facilities. J Hosp Med. 2017;12:238-244. PubMed
12. Kansagara D, Englander H, Salanitro A, et al. Risk Prediction Models for Hospital Readmission: A Systematic Review. JAMA. 2011;306(15):1688-1698. PubMed
13. Averill RF, Goldfield N, Hughes JS, et al. All Patient Refined Diagnosis Related Groups (APR-DRGs): Methodology Overview. 3M Health Information Systems Document GRP-041 (2003). https://www.hcup-us.ahrq.gov/db/nation/nis/APR-DRGsV20MethodologyOverviewandBibliography.pdf. Accessed on November 5, 2015.
14. StataCorp. 2013. Stata Statistical Software: Release 13. College Station, TX: StataCorp LP.
15. Cebul RD, Rebitzer JB, Taylor LJ, Votruba ME. Organizational fragmentation and care quality in the U.S. healthcare system. J Econ Perspect. 2008;22(4):93-113. PubMed
16. Tjia J, Bonner A, Briesacher BA, McGee S, Terrill E, Miller K. Medication discrepancies upon hospital to skilled nursing facility transitions. J Gen Intern Med. 2009;24:630-635. PubMed
17. Desai R, Williams CE, Greene SB, Pierson S, Hansen RA. Medication errors during patient transitions into nursing homes: characteristics and association with patient harm. Am J Geriatr Pharmacother. 2011;9:413-422. PubMed
18. Chhabra PT, Rattinger GB, Dutcher SK, Hare ME, Parsons KL, Zuckerman IH. Medication reconciliation during the transition to and from long-term care settings: a systematic review. Res Social Adm Pharm. 2012;8(1):60-75. PubMed
19. Rahman M, Foster AD, Grabowski DC, Zinn JS, Mor V. Effect of hospital-SNF referral linkages on rehospitalization. Health Serv Res. 2013;48(6, pt 1):1898-1919. PubMed
20. Schoenfeld AJ, Zhang X, Grabowski DC, Mor V, Weissman JS, Rahman M. Hospital-skilled nursing facility referral linkage reduces readmission rates among Medicare patients receiving major surgery. Surgery. 2016;159(5):1461-1468. PubMed
21. Rahman M, McHugh J, Gozalo P, Ackerly DC, Mor V. The Contribution of Skilled Nursing Facilities to Hospitals’ Readmission Rate. HSR: Health Services Research. 2017;52(2):656-675. PubMed
22. Jencks SF, Williams MV, Coleman EA. Rehospitalizations among patients in the Medicare fee-for-service program. New Engl J Med. 2009;360(14):1418-1428. PubMed
23. Hasan O, Meltzer DO, Shaykevich SA, et al. Hospital readmission in general medicine patients: a prediction model. J Hosp Med. 2010;25(3)211-219. PubMed
24. Allaudeen N, Vidyarhi A, Masella J, Auerbach A. Redefining readmission risk factors for general medicine patients. J Hosp Med. 2011;6(2):54-60. PubMed
25. Van Walraven C, Wong J, Forster AJ. LACE+ index: extension of a validated index to predict early death or urgent readmission after discharge using administrative data. Open Med. 2012;6(3):e80-e90. PubMed
26. Protecting Access to Medicare Act of 2014, Pub. L. No. 113-93, 128 Stat. 1040 (April 1, 2014). https://www.congress.gov/113/plaws/publ93/PLAW-113publ93.pdf. Accessed on October 3, 2015.
© 2018 Society of Hospital Medicine
Risk of Osteoporotic Fracture After Steroid Injections in Patients With Medicare
Take-Home Points
Analysis of patients in the Medicare database showed that each successive ESI decreased the risk of an osteoporotic spine fracture by 2%, and that each successive LJSI decreases it by 4%.
Although statistically significant, this may not be clinically relevant.
Successive ESI did not influence the risk of developing an osteoporotic hip or wrist fracture, but that each additional LJSI reduced the risk.
Prolonged steroid exposure was found to increase the risk of spine fracture for ESI and LJSI patients.
Acute exposure to exogenous steroids via the epidural space, transforaminal space, or large joints does not seem to increase the risk of an osteoporotic fracture of the spine, hip, or wrist.
Epidural steroid injections (ESIs) are widely used in the nonoperative treatment of low back pain, radicular leg pain, and spinal stenosis. The treatment rationale is that locally injected anti-inflammatory drugs, such as steroids, reduce inflammation by inhibiting formation and release of inflammatory cytokines, leading to pain reduction.1,2 According to 4 systematic reviews, the best available evidence of the efficacy of ESIs is less than robust.3-6 These reviews were limited by the heterogeneity of patient selection, delivery mode, type and dose of steroid used, number and frequency of ESIs, and outcome measures.
The association of chronic oral steroid use and the development of osteoporosis was previously established.7,8 One concern is that acute exposure to steroids in the form of lumbar ESIs may also lead to osteoporosis and then a pathologic fracture of the vertebra. Several studies have found no association between bone mineral density and cumulative steroid dose,9,10 mean number of ESIs, or duration of ESIs,10 though other studies have found lower bone mineral density in postmenopausal women treated with ESIs.11-13
In a study of 3000 ESI patients propensity-matched to a non-ESI cohort, Mandel and colleagues14 found that each successive ESI increased the risk of osteoporotic spine fracture by 21%. This clinically relevant 21% increased risk might lead physicians to stop prescribing or using this intervention. However, the association between osteoporotic fractures and other types of steroid injections remains poorly understood and underinvestigated.
To further evaluate the relationship between steroid injections and osteoporotic fracture risk, we analyzed Medicare administrative claims data on both large-joint steroid injections (LJSIs) into knee and hip and transforaminal steroid injections (TSIs), as well as osteoporotic hip and wrist fractures. Our hypothesis was that a systemic effect of steroid injections would increase fracture risk in all skeletal locations regardless of injection site, whereas a local effect would produce a disproportionate increased risk of spine fracture with spine injection.
Materials and Methods
Medicare is a publicly funded US health insurance program for people 65 years old or older, people under age 65 years with certain disabilities, and people (any age) with end-stage renal disease or amyotrophic lateral sclerosis. The 5% Medicare Part B (physician, carrier) dataset contains individual claims records for a random sample of Medicare beneficiaries (~2.4 million enrollees). Patients who received steroid injections were identified from 5% Medicare claims made between January 1, 2004 and December 31, 2011. LJSIs were identified by Current Procedural Terminology (CPT) code 20610 and any of 16 other CPT codes: J0702, J1020, J1030, J1040, J1094, J1100, J1700, J1710, J1720, J2650, J2920, J2930, J3300, J3301, J3302, and J3303. ESIs were identified by CPT code 62310, 62311, 62318, or 62319, and TSIs by CPT code 64479, 64480, 64483, or 64484. Patients were followed in their initial injection cohort. For example, a patient who received an ESI initially and later received an LJSI remained in the ESI cohort.
Several groups of patients were excluded from the study: those who received Medicare coverage because of their age (under 65 years) and disabilities; those who received Medicare health benefits through health maintenance organizations (healthcare expenses were not submitted to the Centers for Medicare & Medicaid Services for payment, and therefore claims were not in the database or were incomplete); those with a prior claim history of <12 months (incomplete comorbidity history); and those who received a diagnosis of osteoporotic fracture (International Classification of Diseases, Ninth Revision, Clinical Modification [ICD-9-CM] code 733.1x) before the initial steroid injection.
We determined the incidence of osteoporotic wrist, hip, and spine fractures within 1, 2, and 8 years after LJSI, ESI, and TSI. Wrist, hip, and spine fractures were identified by ICD-9-CM diagnosis codes 733.12, 733.13, and 733.14, respectively. We also determined the number of steroid injections given before wrist, hip, or spine fracture or, if no fracture occurred, before death or the end of the data period.
Statistical Analysis
Multivariate Cox regression analysis was performed to evaluate the risk factors for wrist, spine, and hip fractures. The covariates in this model included age, sex, race, census region, Medicare buy-in status, Charlson Comorbidity Index (CCI),15 year, and number of steroid injections before fracture, death, or end of data period. Medicare buy-in status, which indicates whether the beneficiary received financial assistance in paying insurance premiums, was used as a proxy for socioeconomic status. CCI is used as a composite score of a patient’s general health status in terms of comorbidities.15,16 Four previously established categories17 were used to group CCIs in this study: 0 (none), 1 to 2 (low), 3 to 4 (moderate), and 5 or more (high). In addition, several diagnoses made within the 12 months before initial steroid injection were considered: osteoporosis (ICD-9-CM codes 733.0x, V82.81), Cushing syndrome (ICD-9-CM code 255.0), long-term (current) use of bisphosphonates (ICD-9-CM code V58.68), asymptomatic postmenopausal status (ICD-9-CM code V49.81), postmenopausal hormone replacement therapy (ICD-9-CM code V07.4), and long-term (current) use of steroids (ICD-9-CM code V58.65). The comparison of relative risk between any groups was reported as the adjusted hazard ratio (AHR), which is the ratio of the hazard rates of that particular outcome, taking into account inherent patient characteristics such as age, sex, and race as covariates. AHR of 1 corresponds to equivalent risk, AHR of >1 to elevated risk, and AHR of <1 to reduced risk.
Results
Using the 5% Medicare data for 2004 to 2011, we identified 275,999 Medicare beneficiaries who underwent LJSI, 93,943 who underwent ESI, and 32,311 who underwent TSI. During this period, TSI use increased, ESI use decreased, and LJSI use was relatively stable (Figure). 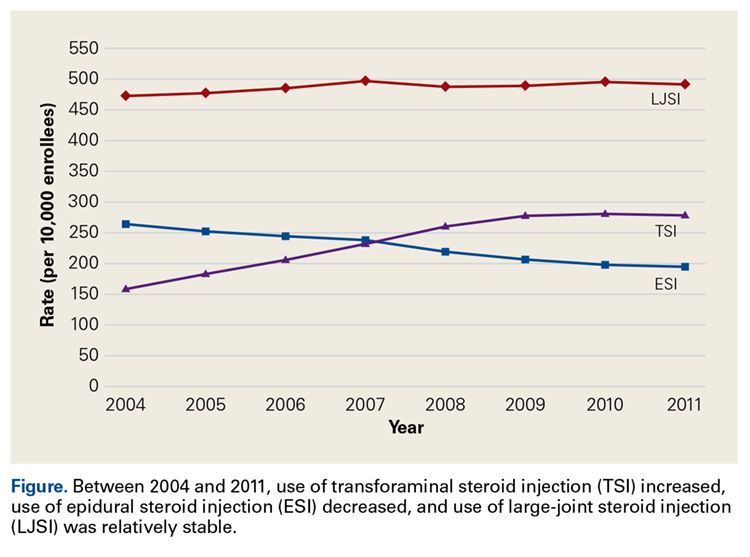
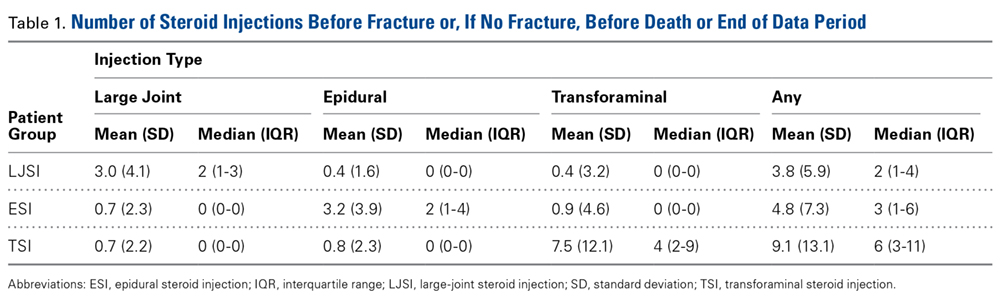
The risk for osteoporotic spine fracture 1, 2, and 8 years after ESI, TSI, or LJSI was affected by age, race, sex, and CCI (P < .001 for all; Tables 2-4). 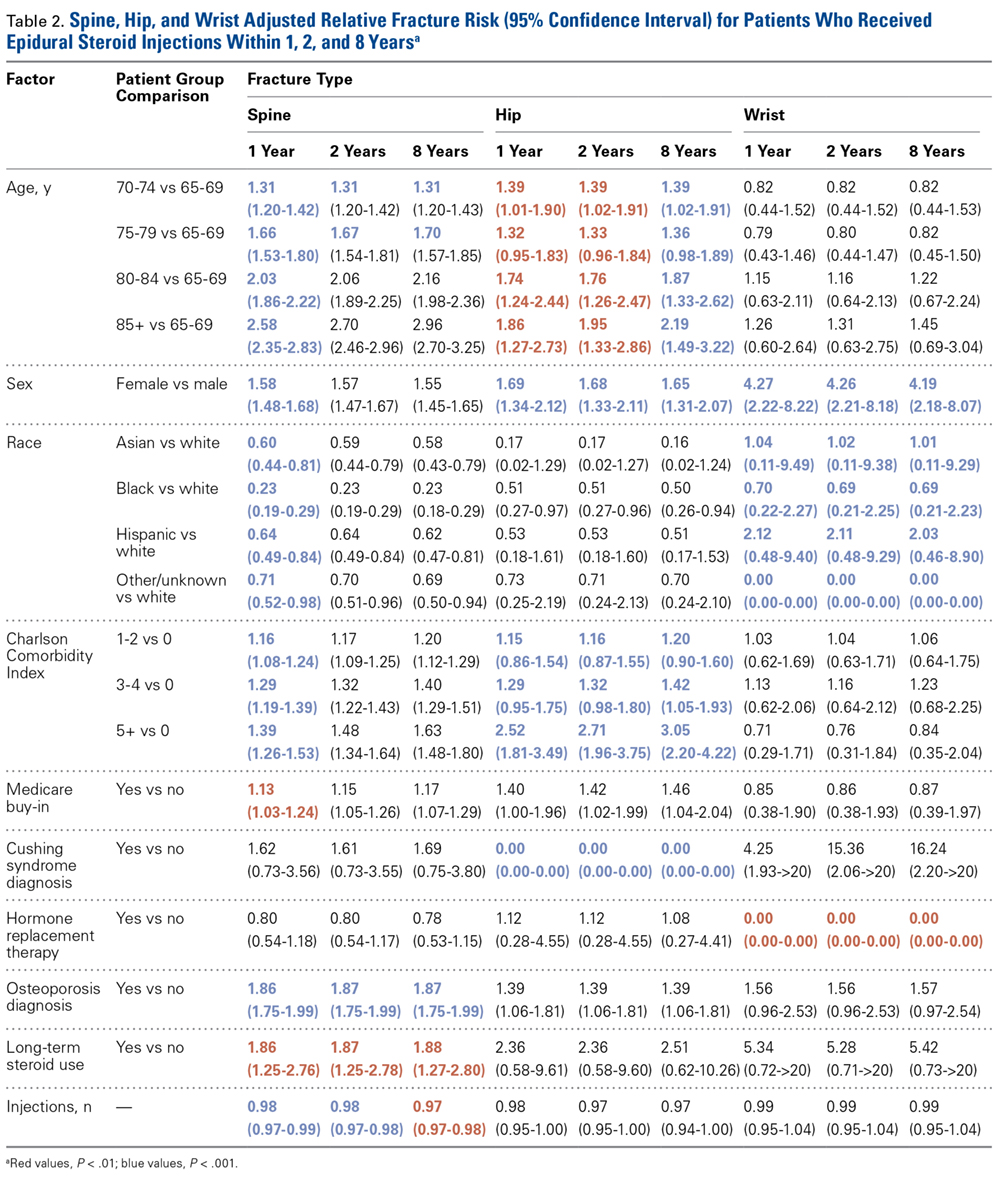
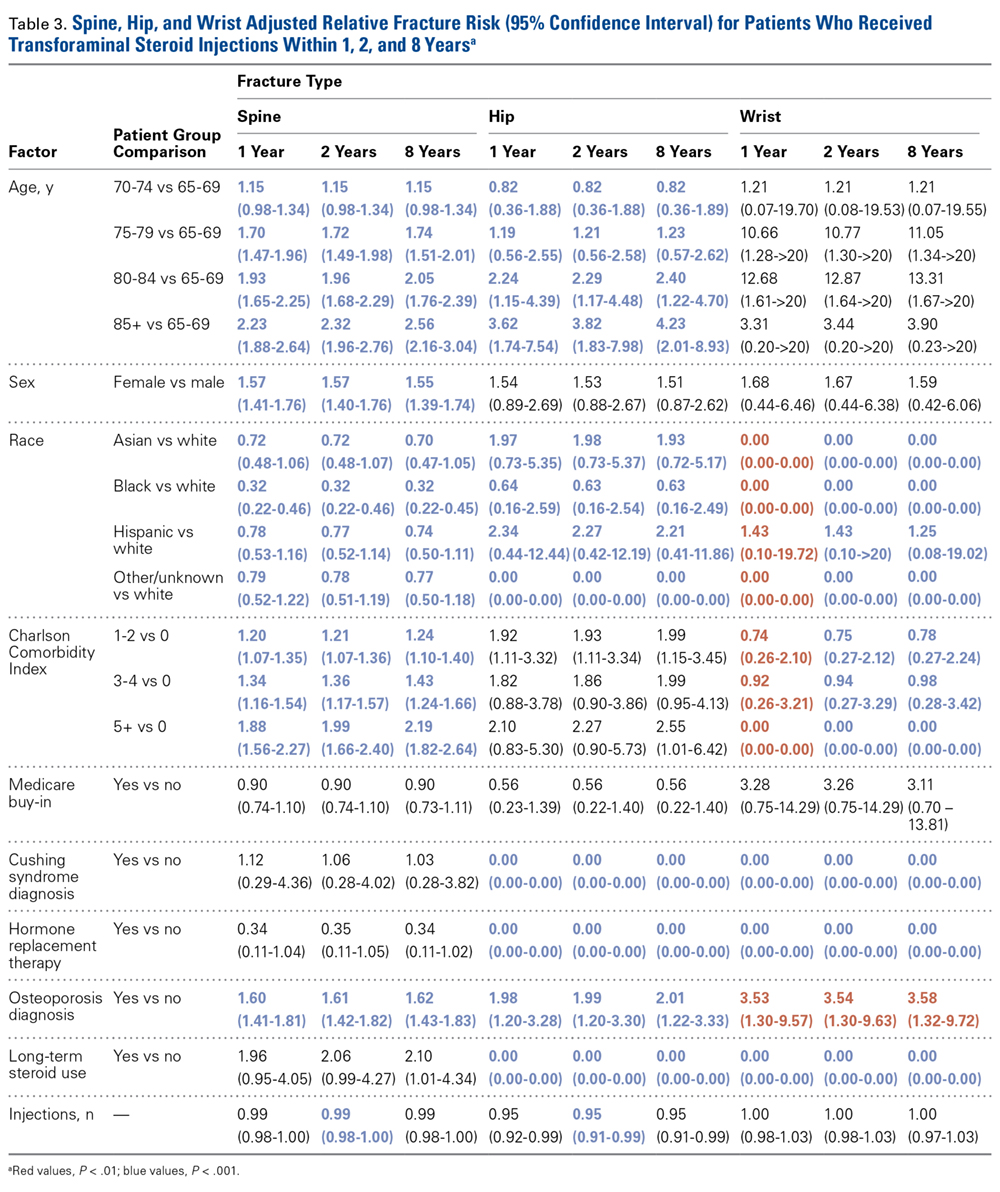
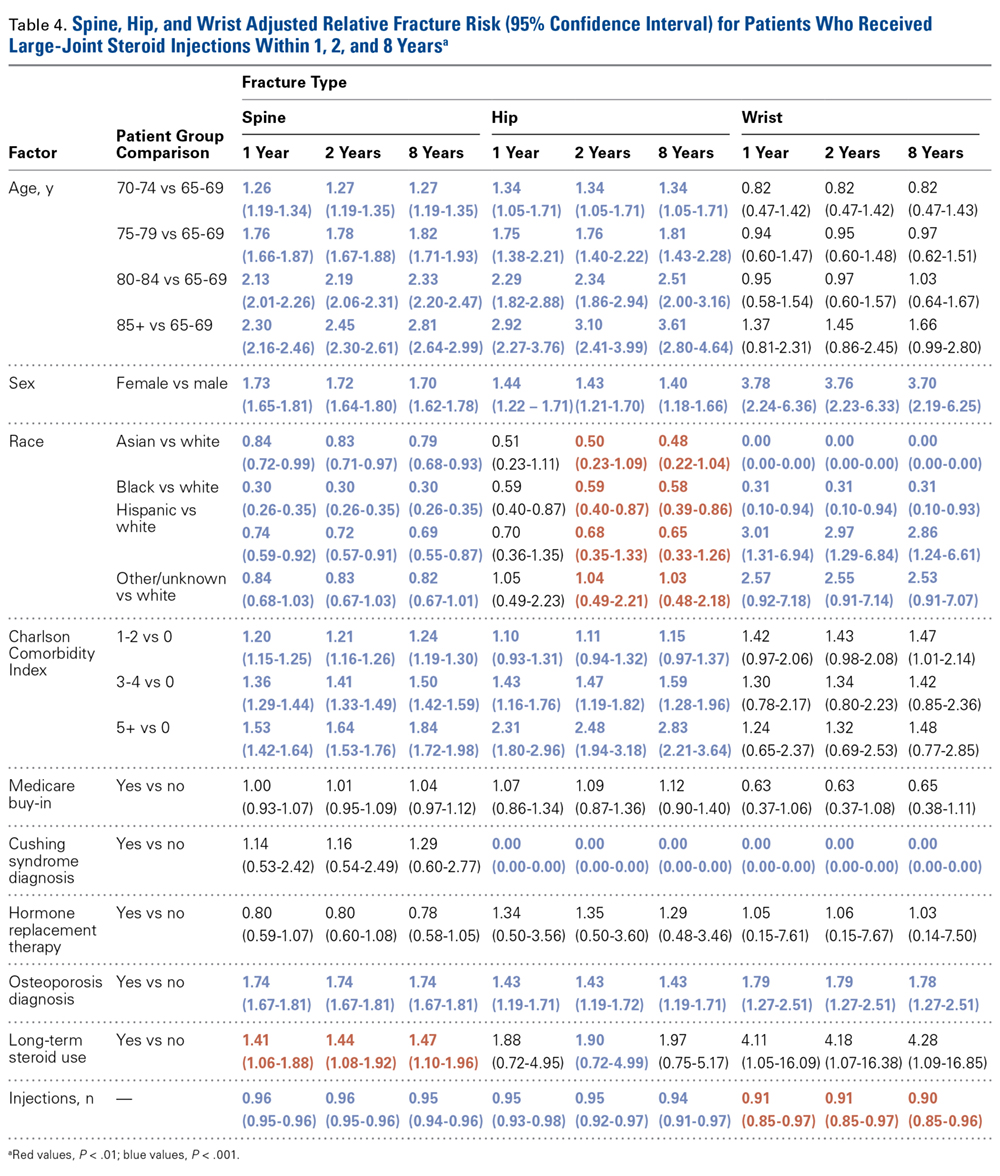
The risk for osteoporotic hip fracture after 1 and 2 years was affected by age and number of LJSIs and TSIs but not by number of ESIs. Sex and CCI were also risk factors for hip fracture at 1 and 2 years for ESI and LJSI patients, as was race for LJSI patients. Risk for osteoporotic wrist fracture at 1 and 2 years was affected by sex and race for ESI and LJSI patients; age, race, CCI, and long-term steroid use were risk factors for TSI patients at all time points. Higher number of LJSIs, but not ESIs or TSIs, was associated with lower wrist fracture risk.
Discussion
ESIs continue to be used in the nonoperative treatment of low back pain, radicular leg pain, and spinal stenosis. Although the present study found ESI use increased in the Medicare population between 1994 and 2001,18 the trend is reversing, decreasing by 25%, with rates of 264 per 10,000 Medicare enrollees in 2004 and 194 per 10,000 enrollees in 2011. ESI use may have changed after systematic reviews revealed there was no clear evidence of the efficacy of ESIs in managing low back pain and radicular leg pain3,5,6 or spinal stenosis.4
Nevertheless, ESIs are widely used because of the perceived benefit balanced against the perceived rarity of adverse events.6 Even if patients recognize a low likelihood of significant benefit, they may accept ESI as preferable to surgery. In addition, most private payers require extensive nonoperative treatment before they will approve surgery as a treatment option.
In a study by Mandel and colleagues,14 ESI increased the risk of vertebral compression fractures by 21%, which in turn increased the risk of death.19 If accurate, these findings obviously would challenge the perception that ESI is a low-risk intervention. In contrast to the Mandel study,14 the present analysis of the Medicare population revealed no clinically relevant change in risk of osteoporotic spine fracture with each successive ESI after the initial injection. After the initial injection, each successive ESI decreased the relative risk of osteoporotic spine fracture by 2%, and each successive LJSI decreased it by 4%. Although statistically significant, the small change in relative risk may not be clinically relevant. However, taken cumulatively over a number of successive injections, these effects may be clinically relevant.
The data also showed that, after the initial injection, each successive ESI had no effect on risk of osteoporotic hip or wrist fracture, and each successive LJSI reduced the risk. Similar to earlier findings,20,21 long-term steroid use increased the risk of spine fracture in ESI and LJSI patients. Prolonged exposure to steroids may be necessary to reduce bone formation and increase bone breakdown.12
Although the study by Mandel and colleagues14 and our study both used administrative databases and survival analysis methods, conclusions differed. First, Mandel and colleagues14 used a study inclusion criterion of spine-related steroid injections, whereas we used a criterion of any steroid injection. Second, they used 50 years as the lower age for study inclusion, and we used 65 years. Third, to control for patients who had osteoporosis before study entry, they excluded those who had a fracture in an adjacent vertebra after kyphoplasty and vertebroplasty. It is unclear if patients who had osteoporotic fractures at other sites were excluded as well. Thus, the 2 cohorts may not be directly comparable.
Whereas Mandel and colleagues14 based their definition of osteoporotic spine fracture on a keyword search of a radiology database, we used a specific reportable ICD-9-CM diagnosis code. As a result, they may have overreported osteoporotic spine fractures, and we may have underreported. Finally, our sample was much larger than theirs. Given the relative rarity of osteoporotic fractures, a study with a larger sample may have more power to detect differences. In addition, unlike Mandel and colleagues,14 we focused on an injection cohort. We did not include or make comparisons with a no-injection cohort because our study hypothesis involved the potential systemic effects of steroid injections based on injection site. Although chronic steroid use was found to have a significant effect in our study, it is unclear to what extent the diagnosis code was used, during the comorbidity assessment or only in the event of steroid-related complications.
Our study also found that, after the initial injection, each successive LJSI decreased the risk of osteoporotic wrist fracture by 10%, and each successive TSI decreased the risk of osteoporotic hip fracture by 5%. It is plausible these injections allowed improved mobility, mitigating the effects of osteoporosis induced by inactivity and lack of resistance training. It is also possible that improved mobility limited falls.
In summary, this analysis of the Medicare claims database revealed that ESI, TSI, and LJSI decreased osteoporotic spine fracture risk. However, the effect was small and may not be clinically meaningful. After the initial injection, successive ESIs had no effect on the risk of osteoporotic hip or wrist fracture, and successive LJSIs reduced the risk of osteoporotic wrist fracture, perhaps because of improved mobility. Prolonged oral steroid use increased spine fracture risk in ESI and LJSI patients. More studies are needed to evaluate the risk-benefit profile of steroid injections.
1. Pethö G, Reeh PW. Sensory and signaling mechanisms of bradykinin, eicosanoids, platelet-activating factor, and nitric oxide in peripheral nociceptors. Physiol Rev. 2012;92(4):1699-1775.
2. Saal J. The role of inflammation in lumbar pain. Spine. 1995;20(16):1821-1827.
3. Choi HJ, Hahn S, Kim CH, et al. Epidural steroid injection therapy for low back pain: a meta-analysis. Int J Technol Assess Health Care. 2013;29(3):244-253.
4. Chou R, Loeser JD, Owens DK, et al; American Pain Society Low Back Pain Guideline Panel. Interventional therapies, surgery, and interdisciplinary rehabilitation for low back pain: an evidence-based clinical practice guideline from the American Pain Society. Spine. 2009;34(10):1066-1077.
5. Savigny P, Watson P, Underwood M; Guideline Development Group. Early management of persistent non-specific low back pain: summary of NICE guidance. BMJ. 2009;338:b1805.
6. Staal JB, de Bie RA, de Vet HC, Hildebrandt J, Nelemans P. Injection therapy for subacute and chronic low back pain: an updated Cochrane review. Spine. 2009;34(1):49-59.
7. Angeli A, Guglielmi G, Dovio A, et al. High prevalence of asymptomatic vertebral fractures in post-menopausal women receiving chronic glucocorticoid therapy: a cross-sectional outpatient study. Bone. 2006;39(2):253-259.
8. Donnan PT, Libby G, Boyter AC, Thompson P. The population risk of fractures attributable to oral corticosteroids. Pharmacoepidemiol Drug Saf. 2005;14(3):177-186.
9. Dubois EF, Wagemans MF, Verdouw BC, et al. Lack of relationships between cumulative methylprednisolone dose and bone mineral density in healthy men and postmenopausal women with chronic low back pain. Clin Rheumatol. 2003;22(1):12-17.
10. Yi Y, Hwang B, Son H, Cheong I. Low bone mineral density, but not epidural steroid injection, is associated with fracture in postmenopausal women with low back pain. Pain Physician. 2012;15(6):441-449.
11. Al-Shoha A, Rao DS, Schilling J, Peterson E, Mandel S. Effect of epidural steroid injection on bone mineral density and markers of bone turnover in postmenopausal women. Spine. 2012;37(25):E1567-E1571.
12. Kang SS, Hwang BM, Son H, Cheong IY, Lee SJ, Chung TY. Changes in bone mineral density in postmenopausal women treated with epidural steroid injections for lower back pain. Pain Physician. 2012;15(3):229-236.
13. Kim S, Hwang B. Relationship between bone mineral density and the frequent administration of epidural steroid injections in postmenopausal women with low back pain. Pain Res Manag. 2014;19(1):30-34.
14. Mandel S, Schilling J, Peterson E, Rao DS, Sanders W. A retrospective analysis of vertebral body fractures following epidural steroid injections. J Bone Joint Surg Am. 2013;95(11):961-964.
15. Charlson ME, Pompei P, Ales KL, MacKenzie CR. A new method of classifying prognostic comorbidity in longitudinal studies: development and validation. J Chronic Dis. 1987;40(5):373-383.
16. Deyo RA, Cherkin DC, Ciol MA. Adapting a clinical comorbidity index for use with ICD-9-CM administrative databases. J Clin Epidemiol. 1992;45(6):613-619.
17. Murray SB, Bates DW, Ngo L, Ufberg JW, Shapiro NI. Charlson index is associated with one-year mortality in emergency department patients with suspected infection. Acad Emerg Med. 2006;13(5):530-536.
18. Friedly J, Chan L, Deyo R. Increases in lumbosacral injections in the Medicare population: 1994 to 2001. Spine. 2007;32(16):1754-1760.
19. Puisto V, Rissanen H, Heliövaara M, et al. Vertebral fracture and cause-specific mortality: a prospective population study of 3,210 men and 3,730 women with 30 years of follow-up. Eur Spine J. 2011;20(12):2181-2186.
20. Lee YH, Woo JH, Choi SJ, Ji JD, Song GG. Effects of low-dose corticosteroids on the bone mineral density of patients with rheumatoid arthritis: a meta-analysis. J Investig Med. 2008;56(8):1011-1018.
21. Lukert BP, Raisz LG. Glucocorticoid-induced osteoporosis. Rheum Dis Clin North Am. 1994;20(3):629-650.
Take-Home Points
Analysis of patients in the Medicare database showed that each successive ESI decreased the risk of an osteoporotic spine fracture by 2%, and that each successive LJSI decreases it by 4%.
Although statistically significant, this may not be clinically relevant.
Successive ESI did not influence the risk of developing an osteoporotic hip or wrist fracture, but that each additional LJSI reduced the risk.
Prolonged steroid exposure was found to increase the risk of spine fracture for ESI and LJSI patients.
Acute exposure to exogenous steroids via the epidural space, transforaminal space, or large joints does not seem to increase the risk of an osteoporotic fracture of the spine, hip, or wrist.
Epidural steroid injections (ESIs) are widely used in the nonoperative treatment of low back pain, radicular leg pain, and spinal stenosis. The treatment rationale is that locally injected anti-inflammatory drugs, such as steroids, reduce inflammation by inhibiting formation and release of inflammatory cytokines, leading to pain reduction.1,2 According to 4 systematic reviews, the best available evidence of the efficacy of ESIs is less than robust.3-6 These reviews were limited by the heterogeneity of patient selection, delivery mode, type and dose of steroid used, number and frequency of ESIs, and outcome measures.
The association of chronic oral steroid use and the development of osteoporosis was previously established.7,8 One concern is that acute exposure to steroids in the form of lumbar ESIs may also lead to osteoporosis and then a pathologic fracture of the vertebra. Several studies have found no association between bone mineral density and cumulative steroid dose,9,10 mean number of ESIs, or duration of ESIs,10 though other studies have found lower bone mineral density in postmenopausal women treated with ESIs.11-13
In a study of 3000 ESI patients propensity-matched to a non-ESI cohort, Mandel and colleagues14 found that each successive ESI increased the risk of osteoporotic spine fracture by 21%. This clinically relevant 21% increased risk might lead physicians to stop prescribing or using this intervention. However, the association between osteoporotic fractures and other types of steroid injections remains poorly understood and underinvestigated.
To further evaluate the relationship between steroid injections and osteoporotic fracture risk, we analyzed Medicare administrative claims data on both large-joint steroid injections (LJSIs) into knee and hip and transforaminal steroid injections (TSIs), as well as osteoporotic hip and wrist fractures. Our hypothesis was that a systemic effect of steroid injections would increase fracture risk in all skeletal locations regardless of injection site, whereas a local effect would produce a disproportionate increased risk of spine fracture with spine injection.
Materials and Methods
Medicare is a publicly funded US health insurance program for people 65 years old or older, people under age 65 years with certain disabilities, and people (any age) with end-stage renal disease or amyotrophic lateral sclerosis. The 5% Medicare Part B (physician, carrier) dataset contains individual claims records for a random sample of Medicare beneficiaries (~2.4 million enrollees). Patients who received steroid injections were identified from 5% Medicare claims made between January 1, 2004 and December 31, 2011. LJSIs were identified by Current Procedural Terminology (CPT) code 20610 and any of 16 other CPT codes: J0702, J1020, J1030, J1040, J1094, J1100, J1700, J1710, J1720, J2650, J2920, J2930, J3300, J3301, J3302, and J3303. ESIs were identified by CPT code 62310, 62311, 62318, or 62319, and TSIs by CPT code 64479, 64480, 64483, or 64484. Patients were followed in their initial injection cohort. For example, a patient who received an ESI initially and later received an LJSI remained in the ESI cohort.
Several groups of patients were excluded from the study: those who received Medicare coverage because of their age (under 65 years) and disabilities; those who received Medicare health benefits through health maintenance organizations (healthcare expenses were not submitted to the Centers for Medicare & Medicaid Services for payment, and therefore claims were not in the database or were incomplete); those with a prior claim history of <12 months (incomplete comorbidity history); and those who received a diagnosis of osteoporotic fracture (International Classification of Diseases, Ninth Revision, Clinical Modification [ICD-9-CM] code 733.1x) before the initial steroid injection.
We determined the incidence of osteoporotic wrist, hip, and spine fractures within 1, 2, and 8 years after LJSI, ESI, and TSI. Wrist, hip, and spine fractures were identified by ICD-9-CM diagnosis codes 733.12, 733.13, and 733.14, respectively. We also determined the number of steroid injections given before wrist, hip, or spine fracture or, if no fracture occurred, before death or the end of the data period.
Statistical Analysis
Multivariate Cox regression analysis was performed to evaluate the risk factors for wrist, spine, and hip fractures. The covariates in this model included age, sex, race, census region, Medicare buy-in status, Charlson Comorbidity Index (CCI),15 year, and number of steroid injections before fracture, death, or end of data period. Medicare buy-in status, which indicates whether the beneficiary received financial assistance in paying insurance premiums, was used as a proxy for socioeconomic status. CCI is used as a composite score of a patient’s general health status in terms of comorbidities.15,16 Four previously established categories17 were used to group CCIs in this study: 0 (none), 1 to 2 (low), 3 to 4 (moderate), and 5 or more (high). In addition, several diagnoses made within the 12 months before initial steroid injection were considered: osteoporosis (ICD-9-CM codes 733.0x, V82.81), Cushing syndrome (ICD-9-CM code 255.0), long-term (current) use of bisphosphonates (ICD-9-CM code V58.68), asymptomatic postmenopausal status (ICD-9-CM code V49.81), postmenopausal hormone replacement therapy (ICD-9-CM code V07.4), and long-term (current) use of steroids (ICD-9-CM code V58.65). The comparison of relative risk between any groups was reported as the adjusted hazard ratio (AHR), which is the ratio of the hazard rates of that particular outcome, taking into account inherent patient characteristics such as age, sex, and race as covariates. AHR of 1 corresponds to equivalent risk, AHR of >1 to elevated risk, and AHR of <1 to reduced risk.
Results
Using the 5% Medicare data for 2004 to 2011, we identified 275,999 Medicare beneficiaries who underwent LJSI, 93,943 who underwent ESI, and 32,311 who underwent TSI. During this period, TSI use increased, ESI use decreased, and LJSI use was relatively stable (Figure).
The risk for osteoporotic spine fracture 1, 2, and 8 years after ESI, TSI, or LJSI was affected by age, race, sex, and CCI (P < .001 for all; Tables 2-4).
The risk for osteoporotic hip fracture after 1 and 2 years was affected by age and number of LJSIs and TSIs but not by number of ESIs. Sex and CCI were also risk factors for hip fracture at 1 and 2 years for ESI and LJSI patients, as was race for LJSI patients. Risk for osteoporotic wrist fracture at 1 and 2 years was affected by sex and race for ESI and LJSI patients; age, race, CCI, and long-term steroid use were risk factors for TSI patients at all time points. Higher number of LJSIs, but not ESIs or TSIs, was associated with lower wrist fracture risk.
Discussion
ESIs continue to be used in the nonoperative treatment of low back pain, radicular leg pain, and spinal stenosis. Although the present study found ESI use increased in the Medicare population between 1994 and 2001,18 the trend is reversing, decreasing by 25%, with rates of 264 per 10,000 Medicare enrollees in 2004 and 194 per 10,000 enrollees in 2011. ESI use may have changed after systematic reviews revealed there was no clear evidence of the efficacy of ESIs in managing low back pain and radicular leg pain3,5,6 or spinal stenosis.4
Nevertheless, ESIs are widely used because of the perceived benefit balanced against the perceived rarity of adverse events.6 Even if patients recognize a low likelihood of significant benefit, they may accept ESI as preferable to surgery. In addition, most private payers require extensive nonoperative treatment before they will approve surgery as a treatment option.
In a study by Mandel and colleagues,14 ESI increased the risk of vertebral compression fractures by 21%, which in turn increased the risk of death.19 If accurate, these findings obviously would challenge the perception that ESI is a low-risk intervention. In contrast to the Mandel study,14 the present analysis of the Medicare population revealed no clinically relevant change in risk of osteoporotic spine fracture with each successive ESI after the initial injection. After the initial injection, each successive ESI decreased the relative risk of osteoporotic spine fracture by 2%, and each successive LJSI decreased it by 4%. Although statistically significant, the small change in relative risk may not be clinically relevant. However, taken cumulatively over a number of successive injections, these effects may be clinically relevant.
The data also showed that, after the initial injection, each successive ESI had no effect on risk of osteoporotic hip or wrist fracture, and each successive LJSI reduced the risk. Similar to earlier findings,20,21 long-term steroid use increased the risk of spine fracture in ESI and LJSI patients. Prolonged exposure to steroids may be necessary to reduce bone formation and increase bone breakdown.12
Although the study by Mandel and colleagues14 and our study both used administrative databases and survival analysis methods, conclusions differed. First, Mandel and colleagues14 used a study inclusion criterion of spine-related steroid injections, whereas we used a criterion of any steroid injection. Second, they used 50 years as the lower age for study inclusion, and we used 65 years. Third, to control for patients who had osteoporosis before study entry, they excluded those who had a fracture in an adjacent vertebra after kyphoplasty and vertebroplasty. It is unclear if patients who had osteoporotic fractures at other sites were excluded as well. Thus, the 2 cohorts may not be directly comparable.
Whereas Mandel and colleagues14 based their definition of osteoporotic spine fracture on a keyword search of a radiology database, we used a specific reportable ICD-9-CM diagnosis code. As a result, they may have overreported osteoporotic spine fractures, and we may have underreported. Finally, our sample was much larger than theirs. Given the relative rarity of osteoporotic fractures, a study with a larger sample may have more power to detect differences. In addition, unlike Mandel and colleagues,14 we focused on an injection cohort. We did not include or make comparisons with a no-injection cohort because our study hypothesis involved the potential systemic effects of steroid injections based on injection site. Although chronic steroid use was found to have a significant effect in our study, it is unclear to what extent the diagnosis code was used, during the comorbidity assessment or only in the event of steroid-related complications.
Our study also found that, after the initial injection, each successive LJSI decreased the risk of osteoporotic wrist fracture by 10%, and each successive TSI decreased the risk of osteoporotic hip fracture by 5%. It is plausible these injections allowed improved mobility, mitigating the effects of osteoporosis induced by inactivity and lack of resistance training. It is also possible that improved mobility limited falls.
In summary, this analysis of the Medicare claims database revealed that ESI, TSI, and LJSI decreased osteoporotic spine fracture risk. However, the effect was small and may not be clinically meaningful. After the initial injection, successive ESIs had no effect on the risk of osteoporotic hip or wrist fracture, and successive LJSIs reduced the risk of osteoporotic wrist fracture, perhaps because of improved mobility. Prolonged oral steroid use increased spine fracture risk in ESI and LJSI patients. More studies are needed to evaluate the risk-benefit profile of steroid injections.
1. Pethö G, Reeh PW. Sensory and signaling mechanisms of bradykinin, eicosanoids, platelet-activating factor, and nitric oxide in peripheral nociceptors. Physiol Rev. 2012;92(4):1699-1775.
2. Saal J. The role of inflammation in lumbar pain. Spine. 1995;20(16):1821-1827.
3. Choi HJ, Hahn S, Kim CH, et al. Epidural steroid injection therapy for low back pain: a meta-analysis. Int J Technol Assess Health Care. 2013;29(3):244-253.
4. Chou R, Loeser JD, Owens DK, et al; American Pain Society Low Back Pain Guideline Panel. Interventional therapies, surgery, and interdisciplinary rehabilitation for low back pain: an evidence-based clinical practice guideline from the American Pain Society. Spine. 2009;34(10):1066-1077.
5. Savigny P, Watson P, Underwood M; Guideline Development Group. Early management of persistent non-specific low back pain: summary of NICE guidance. BMJ. 2009;338:b1805.
6. Staal JB, de Bie RA, de Vet HC, Hildebrandt J, Nelemans P. Injection therapy for subacute and chronic low back pain: an updated Cochrane review. Spine. 2009;34(1):49-59.
7. Angeli A, Guglielmi G, Dovio A, et al. High prevalence of asymptomatic vertebral fractures in post-menopausal women receiving chronic glucocorticoid therapy: a cross-sectional outpatient study. Bone. 2006;39(2):253-259.
8. Donnan PT, Libby G, Boyter AC, Thompson P. The population risk of fractures attributable to oral corticosteroids. Pharmacoepidemiol Drug Saf. 2005;14(3):177-186.
9. Dubois EF, Wagemans MF, Verdouw BC, et al. Lack of relationships between cumulative methylprednisolone dose and bone mineral density in healthy men and postmenopausal women with chronic low back pain. Clin Rheumatol. 2003;22(1):12-17.
10. Yi Y, Hwang B, Son H, Cheong I. Low bone mineral density, but not epidural steroid injection, is associated with fracture in postmenopausal women with low back pain. Pain Physician. 2012;15(6):441-449.
11. Al-Shoha A, Rao DS, Schilling J, Peterson E, Mandel S. Effect of epidural steroid injection on bone mineral density and markers of bone turnover in postmenopausal women. Spine. 2012;37(25):E1567-E1571.
12. Kang SS, Hwang BM, Son H, Cheong IY, Lee SJ, Chung TY. Changes in bone mineral density in postmenopausal women treated with epidural steroid injections for lower back pain. Pain Physician. 2012;15(3):229-236.
13. Kim S, Hwang B. Relationship between bone mineral density and the frequent administration of epidural steroid injections in postmenopausal women with low back pain. Pain Res Manag. 2014;19(1):30-34.
14. Mandel S, Schilling J, Peterson E, Rao DS, Sanders W. A retrospective analysis of vertebral body fractures following epidural steroid injections. J Bone Joint Surg Am. 2013;95(11):961-964.
15. Charlson ME, Pompei P, Ales KL, MacKenzie CR. A new method of classifying prognostic comorbidity in longitudinal studies: development and validation. J Chronic Dis. 1987;40(5):373-383.
16. Deyo RA, Cherkin DC, Ciol MA. Adapting a clinical comorbidity index for use with ICD-9-CM administrative databases. J Clin Epidemiol. 1992;45(6):613-619.
17. Murray SB, Bates DW, Ngo L, Ufberg JW, Shapiro NI. Charlson index is associated with one-year mortality in emergency department patients with suspected infection. Acad Emerg Med. 2006;13(5):530-536.
18. Friedly J, Chan L, Deyo R. Increases in lumbosacral injections in the Medicare population: 1994 to 2001. Spine. 2007;32(16):1754-1760.
19. Puisto V, Rissanen H, Heliövaara M, et al. Vertebral fracture and cause-specific mortality: a prospective population study of 3,210 men and 3,730 women with 30 years of follow-up. Eur Spine J. 2011;20(12):2181-2186.
20. Lee YH, Woo JH, Choi SJ, Ji JD, Song GG. Effects of low-dose corticosteroids on the bone mineral density of patients with rheumatoid arthritis: a meta-analysis. J Investig Med. 2008;56(8):1011-1018.
21. Lukert BP, Raisz LG. Glucocorticoid-induced osteoporosis. Rheum Dis Clin North Am. 1994;20(3):629-650.
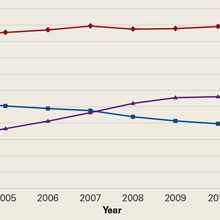
Outpatient Treatment of Deep Vein Thrombosis in the United States: The Reasons for Geographic and Racial Differences in Stroke Study
Venous thromboembolism (VTE) is a common medical condition comprising deep vein thrombosis (DVT) and pulmonary embolism (PE). Estimates of the incidence of DVT in the United States vary between 0.5 and 1.5 cases per 1000 person-years.1 Left untreated, roughly 50% of DVT patients progress to a PE, of whom 10% to 25% die within 3 months.2
Since the 1990s, multiple randomized controlled studies3-5 demonstrated the safety and efficacy of outpatient treatment for selected DVT patients with low molecular weight heparin and warfarin. The United States Food and Drug Administration approved enoxaparin, a low molecular weight heparin for outpatient use in 1998,6 and by the end of the decade, multiple treatment guidelines for VTE acknowledged the safety of outpatient treatment of DVT with low molecular weight heparin in selected patients.7-9 Recently, the approval of direct oral anticoagulants (DOACs) by the Food and Drug Administration allows an all-oral treatment regimen for VTE, which could further facilitate outpatient treatment of DVT.
Costs associated with treatment of VTE are enormous. For outpatient treatment, researchers differ on individual estimates of cost savings associated with outpatient DVT management, but most report a cost savings of several thousand dollars per patient treated as an outpatient compared with as an inpatient.6,10 Given the incidence of DVT, reducing costs while maintaining a high quality of care in even a small percentage of DVT patients would result in significant healthcare cost savings as well as increased convenience for patients.
Despite high-quality evidence supporting the efficacy and safety of outpatient DVT treatment, little is known about the adoption of outpatient DVT treatment in the United States. Several studies that have been published were limited to single hospitals and were small in size11,12 or limited to a cohort of patients already diagnosed with DVT.13
The purpose of this study was to report the frequency of outpatient treatment of DVT in the United States and describe patient characteristics associated with outpatient treatment. Information was gathered from The Reasons for Geographic and Racial Differences in Stroke (REGARDS) study, a contemporary cohort study of more than 30,000 patients residing in the contiguous United States with racial and geographic diversity. We hypothesized that an individual’s age, sex, race, region of residence, urban or rural residence, education level, and personal income would be associated with outpatient treatment. Results would allow the implementation of interventions to promote the appropriate use of outpatient treatment in order to reduce healthcare costs and increase patient convenience without compromising safety or efficacy of care.
METHODS
Cohort Characteristics
VTE events were ascertained in the REGARDS cohort, a prospective, longitudinal cohort study investigating the causes of racial and geographic disparities in stroke and cognitive decline.14 Between 2003 and 2007, there were 30,239 participants in the contiguous United States ≥45 years old enrolled in REGARDS. By design, 55% were female, 41% were black, the mean age was 65 years, and 56% lived in the southeastern United States. Participants were recruited from a commercial list by mail and telephone contact followed by verbal consent. A telephone interview was followed by an in-home examination, including obtaining written informed consent. On study entry, many participants had comorbid conditions, including 8% with reported atrial fibrillation, 56% receiving treatment for hypertension, 22% receiving treatment for diabetes, 3.7% taking warfarin, and 14% who were actively smoking.15,16 Participants were only excluded if they had active cancer, stated a self-reported race other than white or black, were unable to converse in English, had cognitive impairment as judged by the telephone interviewer, or were residing in or on the waiting list for a nursing home. Study methods were reviewed and approved by the institutional review boards at each study institution and have been published elsewhere.14
Event Ascertainment and Definitions
DVT event ascertainment is complete through 2011, with identification by telephone interview, review of reported hospitalizations, and review of deaths.17 Questionnaires in similar epidemiological studies have 98% specificity and >70% sensitivity for ascertaining VTE events.18 A research nurse reviewed the text and recorded each reported hospitalization through 2011. Any report of a blood clot in the legs, arms, or lungs was a potential case for physician review. Medical records were retrieved for up to 1 year before and 1 year after potential events. Retrieved records were used to help guide further record retrieval if they did not contain the primary VTE event. Primary inpatient and outpatient records including history and physical examinations, discharge summaries, imaging reports (to include limb ultrasounds, computed tomography scans, and magnetic resonance imaging), autopsies, and outpatient notes were retrieved using up to 3 attempts.19 Using all available information, characteristics of the VTE event and treatment were systematically recorded. For each potential VTE case, two of three physician reviewers abstracted medical records to validate and classify the event. If the physician reviewers disagreed, the third physician would review the case, and if VTE status remained uncertain, cases were discussed and resolved. Race was determined by participant self-report as black or white. Location of residence was defined by geocoding the addresses, and urban or rural status was defined by United States census tract data using rural-urban commuting area codes (RUCA; with rural areas being RUCA codes 4–10).20 Other risk factors were obtained through surveys, telephone interviews, or in-home visits.14
Outpatient treatment was defined as receiving a DVT diagnosis in an emergency department or ambulatory clinic but not receiving an overnight hospitalization. Inpatient treatment was defined as at least 1 overnight stay in a hospital (but not in an emergency department). Only participants admitted with a primary diagnosis of DVT were included in the analysis. If someone was noted to have DVT but was admitted to the hospital for another cause, he or she was not included in the analysis and classified as a hospital-associated DVT. A provoked DVT was defined as occurring within 90 days of a major trauma, surgery, or marked immobility or was associated with active cancer or treatment for cancer (ie, chemotherapy, radiotherapy, or surgical therapy), while an unprovoked DVT was defined as having none of the above provoking factors. A distal DVT was defined as a DVT occurring in the posterior tibial, anterior tibial, peroneal, or soleus sinuses. The primary outcome was DVT treated as an outpatient only without concurrent diagnosis of PE or VTE as a complication of hospitalization (as these individuals were not eligible for outpatient treatment at the time).
Statistical Analysis
Age, sex, race, region of residence (inside or outside the southeastern United States), education, income (determined as greater or less than $20,000 per year), and urban or rural status of residence were compared between DVT patients treated as outpatients and inpatients using χ2 analysis by inpatient or outpatient treatment. Univariable and multivariable logistic regression was then used to determine the odds ratio (OR) of receiving outpatient DVT treatment by the same variables with age per 10-year increment. ORs were adjusted for age, sex, race, year of DVT diagnosis, and region of residence as appropriate. Statistical significance was defined as P < 0.05. All statistical analyses were performed by N.A.Z. and conducted with SAS version 9.3 (SAS Institute, Cary, NC). All authors had access to the primary clinical data.
RESULTS
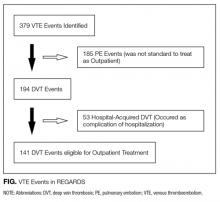
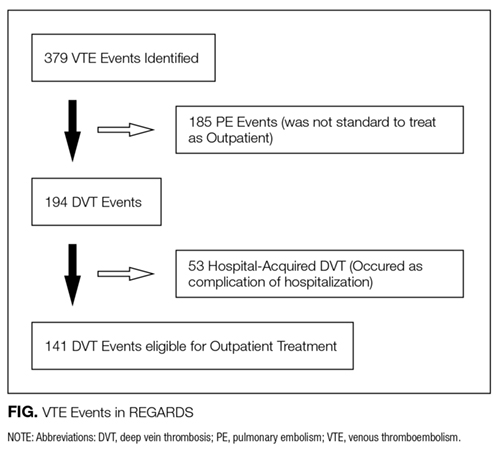
Over a mean of 4.7 years follow-up, 379 VTE events occurred (incident and recurrent); 185 were diagnosed with a PE, and 53 occurred as a complication of hospitalization (and were not eligible for outpatient treatment), leaving 141 DVT events potentially eligible for outpatient treatment out of a population of 29,556 participants with available records and follow-up in the cohort (Figure).
Of 141 DVT events, 39 (28%) were treated as outpatients. Table 1 presents the characteristics of participants treated as inpatients and as outpatients. Factors significantly associated with outpatient DVT treatment were younger age, female sex, white race, residing in an urban area, having a distal DVT only, and having a higher income. In the study, DVT events were recorded between 2003 and 2011; the median year of a diagnosed DVT and treated as an outpatient was 2009, while the median year of inpatient treatment was 2008. Living in the Southeast versus the rest of the country (P = 0.13) and having a high school education or greater (P = 0.07) were marginally associated with receiving outpatient treatment. In absolute terms, 11% of people living in rural areas and 19% of black patients had outpatient DVT treatment while 33% of the urban dwellers and 32% of white patients received outpatient treatment (Table 1). At the time of cohort enrollment, 92% of participants claimed to have insurance; however, this did not differentiate between Medicare, Medicaid, and private insurance. Only 1 participant diagnosed with DVT had an estimated glomerular filtration rate <30, and this individual was admitted for treatment.
Table 2 reports the multivariable adjusted OR for outpatient treatment of DVT adjusted for age, sex, race, region, and year of DVT diagnosis. Outpatient treatment of VTE was associated with younger age (OR 1.90; 95% confidence interval [CI], 1.19-3.02 for every 10 years younger in age), female sex (OR 2.41; 95% CI, 1.06-5.47), and white race (OR 3.29; 95% CI, 1.30-8.30). For each progressive calendar year in which the diagnosis was made, individuals had a 1.35-fold increase in their odds (95% CI, 1.03-1.77) of receiving outpatient treatment. Individuals living in urban areas were 4.16 (95% CI, 1.25-13.79) times more likely to receive outpatient treatment than those in rural areas. Living outside of the southeastern United States and having an income of more than $20,000 per year had increased, but nonsignificant, odds of being treated as outpatient (Table 2).
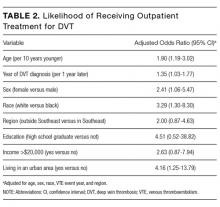
DISCUSSION

In this national, prospective, observational cohort study, only 28% of participants diagnosed with DVT were treated as outpatients versus being hospitalized. Urban area of residence, white race, female sex, and younger age were significantly associated with an increased odds of outpatient treatment. Groups that had particularly low outpatient treatment rates were rural dwellers and black participants, who had outpatient treatment rates of 11% and 19%, respectively. The odds of receiving outpatient treatment did improve over the course of the study, but in the last year of VTE assessment, outpatient treatment remained at 40%, but this was quite variable over the study years (being 8% two years prior).
The feasibility of outpatient treatment of DVTs requires a coordinated healthcare system and patient support to ensure education and appropriate anticoagulation monitoring. While not all DVTs should be treated as outpatients, differences in treatment location by sex, race, and residence point to potential healthcare disparities that increase the burden on patients and increase healthcare costs. Other studies have documented low outpatient treatment rates of DVTs (20% in 1 United States multicenter DVT registry) but have not discussed the associations of outpatient versus inpatient treatment.13 Outpatient treatment also appears to be underutilized in other developed countries; in the European Computerized Registry of Patients with Venous Thromboembolism, only 31% of DVT patients were treated on an outpatient basis between 2001 and 2011.21 To our knowledge, this is the first study to document the uptake of outpatient DVT treatment in the United States across multiple states, regions, and health systems well after the safety and efficacy of outpatient treatment of DVT was established by randomized controlled trials.3-5
The strengths of this study are that these data are derived from a contemporary cohort with a large geographic and racial distribution in the United States and are well characterized with a mean of 4.6 years follow-up.19 We are limited by a relatively small number of DVT events that were eligible for outpatient treatment (n = 141) and so may miss modest associations. Further, while the geographic scope of the cohort is a tremendous strength of our study, we may have missed some events and did not have complete record retrieval of reported events and could not assess access to healthcare in detail. These data were recorded before the use of DOACs became common. DOACs are an effective and safe alternative to conventional anticoagulation treatment for acute DVT.22 Their use might result in increased outpatient treatment, as they are not parenteral; however, cost considerations (~$400.00 per month), especially with high-deductible insurance plans, may limit their impact on VTE treatment location.23 This study cannot account for why the racial, sex, and urban–rural differences exist, and by extension if hospitalization rates differ due to associated comorbidities or if this represents a healthcare disparity. While it is reasonable from a healthcare perspective that younger individuals would more likely be treated as outpatients, there is no data to suggest that differences in DVT by sex, race, and residential location support decreased outpatient treatment. Due to the age of the cohort, most individuals had some form of insurance and a primary care provider. However, we were unable to assess the quality of insurance and the ease of access to their primary care providers. More research is needed to determine whether patients were hospitalized on medical grounds or because of a lack of coordinated healthcare systems to care for them as outpatients.
In conclusion, only a minority of patients who were potentially eligible for outpatient DVT treatment (28%) were treated as outpatients in this study, and there were significant racial and socioeconomic differences in who received inpatient and outpatient treatment. While outpatient treatment rates were below 40% in all groups, we identified groups with especially low likelihoods of receiving outpatient treatment. While all eligible individuals should be offered outpatient DVT treatment, these data highlight the need for specific efforts to overcome barriers to outpatient treatment in the elderly, rural areas, black patients, and men. Even modest increases in the rate of outpatient DVT treatment could result in substantial cost savings and increased patient convenience without compromising the efficacy or safety of medical care.
Acknowledgements
The authors thank the staff and participants of REGARDS for their important contributions. The executive committee of REGARDS reviewed and approved this manuscript for publication. This research project is supported by cooperative agreement U01 NS041588 from the National Institute of Neurological Disorders and Stroke, National Institutes of Health, Department of Health and Human Services. The content is solely the responsibility of the authors and does not necessarily represent the official views of the National Institute of Neurological Disorders and Stroke or the National Institutes of Health. Representatives of the funding agency have been involved in the review of the manuscript but not directly involved in the collection, management, analysis, or interpretation of the data. The authors thank the other investigators, the staff, and the participants of the REGARDS study for their valuable contributions. A full list of participating REGARDS investigators and institutions can be found at http://www.regardsstudy.org. Additional funding was provided by an investigator-initiated grant in aid from the American Recovery and Reinvestment Act grant RC1HL099460 from the National Heart, Lung, and Blood Institute. Work for the manuscript was supported in part by the Lake Champlain Cancer Research Organization (Burlington, Vermont).
Disclosure
The authors have no conflicts of interest to report.
1. Raskob GE, Angchaisuksiri P, Blanco A N, et al. Thrombosis: A major contributor to global disease burden. Thromb Res. 2014;134(5):931-938. doi:10.1016/j.thromres.2014.08.014. PubMed
2. Kearon C. Natural history of venous thromboembolism. Circulation. 2003;107(SUPPL. 23):22-31. doi:10.1161/01.CIR.0000078464.82671.78. PubMed
3. Koopman MM, Prandoni P, Piovella F, et al. Treatment of venous thrombosis with intravenous unfractionated heparin administered in the hospital as compared with subcutaneous low-molecular-weight heparin administered at home. The Tasman Study Group. N Engl J Med. 1996;334(11):682-687. doi:10.1056/NEJM199603143341102. PubMed
4. Prandoni P, Lensing AW, Büller HR, et al. Comparison of subcutaneous low-molecular-weight heparin with intravenous standard heparin in proximal deep-vein thrombosis. Lancet. 1992;339(8791):441-445. doi:10.1016/S0196-0644(05)81047-9. PubMed
5. Levine M, Gent M, Hirsh J, et al. A comparison of low-molecular-weight heparin administered primarily at home with unfractionated heparin administered in the hospital for proximal deep-vein thrombosis. N Engl J Med. 1996;334(11):677-681. doi:10.1056/NEJM199603143341101. PubMed
6. Segal JB, Bolger DT, Jenckes MW, et al. Outpatient therapy with low molecular weight heparin for the treatment of venous thromboembolism: a review of efficacy, safety, and costs. Am J Med. 2003;115(4):298-308. doi:10.1016/S0002-9343(03)00326-7. PubMed
7. Hyers TM, Agnelli G, Hull RD, et al. Antithrombotic therapy for venous thromboembolic disease. Chest. 2001;119(1 Suppl):176S-193S. PubMed
8. Hirsh J, Hoak J. Management of deep vein thrombosis and pulmonary embolism. A statement for healthcare professionals. Council on Thrombosis (in consultation with the Council on Cardiovascular Radiology), American Heart Association. Circulation. 1996;93(12):2212-2245. PubMed
9. Dunn AS, Coller B. Outpatient treatment of deep vein thrombosis: translating clinical trials into practice. Am J Med. 1999;106(6):660-669. PubMed
10. Spyropoulos AC, Lin J. Direct medical costs of venous thromboembolism and subsequent hospital readmission rates: an administrative claims analysis from 30 managed care organizations. J Manag Care Pharm. 2007;13(6):475-486. doi:2007(13)6: 475-486 [pii]. PubMed
11. Lee M, Pao D, Hsu T, Sonderskov A. Cost savings and effectiveness of outpatient treatment with low molecular weight heparin of deep vein thrombosis in a community hospital. Can J Clin Pharmacol. 2004;11(1):e17-e27. PubMed
12. Pearson SD, Blair R, Halpert A, Eddy E, Mckean S. An outpatient program to treat deep venous thrombosis with low-molecular-weight heparin. Eff Clin Pract. 1999;2(5):210-217. PubMed
13. Goldhaber SZ, Tapson VF. A prospective registry of 5,451 patients with ultrasound-confirmed deep vein thrombosis. Am J Cardiol. 2004;93(2):259-262. doi:10.1016/j.amjcard.2003.09.057. PubMed
14. Howard VJ, Cushman M, Pulley L, et al. The reasons for geographic and racial differences in stroke study: Objectives and design. Neuroepidemiology. 2005;25(3):135-143. doi:10.1159/000086678. PubMed
15. Meschia JF, Merrill P, Soliman EZ, et al. Racial disparities in awareness and treatment of atrial fibrillation: the REasons for Geographic and Racial Differences in Stroke (REGARDS) study. Stroke. 2010;41(4):581-587. doi:10.1161/STROKEAHA.109.573907. PubMed
16. Cushman M, Cantrell RA, McClure LA, et al. Estimated 10-year stroke risk by region and race in the United States: geographic and racial differences in stroke risk. Ann Neurol. 2008;64(5):507-513. doi:10.1002/ana.21493. PubMed
17. Wojcik NC, Huebner WW, Jorgensen G. Strategies for using the National Death Index and the Social Security Administration for death ascertainment in large occupational cohort mortality studies. Am J Epidemiol. 2010;172(4):469-477. doi:10.1093/aje/kwq130. PubMed
18. Frezzato M, Tosetto A, Rodeghiero F. Validated questionnaire for the identification of previous personal or familial venous thromboembolism. Am J Epidemiol. 1996;143(12):1257-1265. PubMed
19. Zakai NA, McClure LA, Judd SE, et al. Racial and regional differences in venous thromboembolism in the United States in 3 cohorts. Circulation. 2014;129(14):1502-1509. doi:10.1161/CIRCULATIONAHA.113.006472. PubMed
20. Morrill R, Cromartie J, Hart G. Metropolitan, Urban, and Rural Commuting Areas: Toward a Better Depiction of the United States Settlement System. Urban Geogr. 1999;20(8):727-748. doi:10.2747/0272-3638.20.8.727.
21. Lozano F, Trujillo-Santos J, Barrón M, et al. Home versus in-hospital treatment of outpatients with acute deep venous thrombosis of the lower limbs. J Vasc Surg. 2014;59(5):1362-1367.e1. doi:10.1016/j.jvs.2013.11.091. PubMed
22. Robertson L, Kesteven P, McCaslin JE. Oral direct thrombin inhibitors or oral factor Xa inhibitors for the treatment of deep vein thrombosis. Cochrane Database Syst Rev. 2015;6:CD010956. doi:10.1002/14651858.CD010956.pub2. PubMed
23. Cushman M. Treating Acute Venous Thromboembolism — Shift with Care A New Era in the Treatment of Amyloidosis ? N Engl J Med. 2013:29-30. doi:10.1056/NEJMe1307413.
Venous thromboembolism (VTE) is a common medical condition comprising deep vein thrombosis (DVT) and pulmonary embolism (PE). Estimates of the incidence of DVT in the United States vary between 0.5 and 1.5 cases per 1000 person-years.1 Left untreated, roughly 50% of DVT patients progress to a PE, of whom 10% to 25% die within 3 months.2
Since the 1990s, multiple randomized controlled studies3-5 demonstrated the safety and efficacy of outpatient treatment for selected DVT patients with low molecular weight heparin and warfarin. The United States Food and Drug Administration approved enoxaparin, a low molecular weight heparin for outpatient use in 1998,6 and by the end of the decade, multiple treatment guidelines for VTE acknowledged the safety of outpatient treatment of DVT with low molecular weight heparin in selected patients.7-9 Recently, the approval of direct oral anticoagulants (DOACs) by the Food and Drug Administration allows an all-oral treatment regimen for VTE, which could further facilitate outpatient treatment of DVT.
Costs associated with treatment of VTE are enormous. For outpatient treatment, researchers differ on individual estimates of cost savings associated with outpatient DVT management, but most report a cost savings of several thousand dollars per patient treated as an outpatient compared with as an inpatient.6,10 Given the incidence of DVT, reducing costs while maintaining a high quality of care in even a small percentage of DVT patients would result in significant healthcare cost savings as well as increased convenience for patients.
Despite high-quality evidence supporting the efficacy and safety of outpatient DVT treatment, little is known about the adoption of outpatient DVT treatment in the United States. Several studies that have been published were limited to single hospitals and were small in size11,12 or limited to a cohort of patients already diagnosed with DVT.13
The purpose of this study was to report the frequency of outpatient treatment of DVT in the United States and describe patient characteristics associated with outpatient treatment. Information was gathered from The Reasons for Geographic and Racial Differences in Stroke (REGARDS) study, a contemporary cohort study of more than 30,000 patients residing in the contiguous United States with racial and geographic diversity. We hypothesized that an individual’s age, sex, race, region of residence, urban or rural residence, education level, and personal income would be associated with outpatient treatment. Results would allow the implementation of interventions to promote the appropriate use of outpatient treatment in order to reduce healthcare costs and increase patient convenience without compromising safety or efficacy of care.
METHODS
Cohort Characteristics
VTE events were ascertained in the REGARDS cohort, a prospective, longitudinal cohort study investigating the causes of racial and geographic disparities in stroke and cognitive decline.14 Between 2003 and 2007, there were 30,239 participants in the contiguous United States ≥45 years old enrolled in REGARDS. By design, 55% were female, 41% were black, the mean age was 65 years, and 56% lived in the southeastern United States. Participants were recruited from a commercial list by mail and telephone contact followed by verbal consent. A telephone interview was followed by an in-home examination, including obtaining written informed consent. On study entry, many participants had comorbid conditions, including 8% with reported atrial fibrillation, 56% receiving treatment for hypertension, 22% receiving treatment for diabetes, 3.7% taking warfarin, and 14% who were actively smoking.15,16 Participants were only excluded if they had active cancer, stated a self-reported race other than white or black, were unable to converse in English, had cognitive impairment as judged by the telephone interviewer, or were residing in or on the waiting list for a nursing home. Study methods were reviewed and approved by the institutional review boards at each study institution and have been published elsewhere.14
Event Ascertainment and Definitions
DVT event ascertainment is complete through 2011, with identification by telephone interview, review of reported hospitalizations, and review of deaths.17 Questionnaires in similar epidemiological studies have 98% specificity and >70% sensitivity for ascertaining VTE events.18 A research nurse reviewed the text and recorded each reported hospitalization through 2011. Any report of a blood clot in the legs, arms, or lungs was a potential case for physician review. Medical records were retrieved for up to 1 year before and 1 year after potential events. Retrieved records were used to help guide further record retrieval if they did not contain the primary VTE event. Primary inpatient and outpatient records including history and physical examinations, discharge summaries, imaging reports (to include limb ultrasounds, computed tomography scans, and magnetic resonance imaging), autopsies, and outpatient notes were retrieved using up to 3 attempts.19 Using all available information, characteristics of the VTE event and treatment were systematically recorded. For each potential VTE case, two of three physician reviewers abstracted medical records to validate and classify the event. If the physician reviewers disagreed, the third physician would review the case, and if VTE status remained uncertain, cases were discussed and resolved. Race was determined by participant self-report as black or white. Location of residence was defined by geocoding the addresses, and urban or rural status was defined by United States census tract data using rural-urban commuting area codes (RUCA; with rural areas being RUCA codes 4–10).20 Other risk factors were obtained through surveys, telephone interviews, or in-home visits.14
Outpatient treatment was defined as receiving a DVT diagnosis in an emergency department or ambulatory clinic but not receiving an overnight hospitalization. Inpatient treatment was defined as at least 1 overnight stay in a hospital (but not in an emergency department). Only participants admitted with a primary diagnosis of DVT were included in the analysis. If someone was noted to have DVT but was admitted to the hospital for another cause, he or she was not included in the analysis and classified as a hospital-associated DVT. A provoked DVT was defined as occurring within 90 days of a major trauma, surgery, or marked immobility or was associated with active cancer or treatment for cancer (ie, chemotherapy, radiotherapy, or surgical therapy), while an unprovoked DVT was defined as having none of the above provoking factors. A distal DVT was defined as a DVT occurring in the posterior tibial, anterior tibial, peroneal, or soleus sinuses. The primary outcome was DVT treated as an outpatient only without concurrent diagnosis of PE or VTE as a complication of hospitalization (as these individuals were not eligible for outpatient treatment at the time).
Statistical Analysis
Age, sex, race, region of residence (inside or outside the southeastern United States), education, income (determined as greater or less than $20,000 per year), and urban or rural status of residence were compared between DVT patients treated as outpatients and inpatients using χ2 analysis by inpatient or outpatient treatment. Univariable and multivariable logistic regression was then used to determine the odds ratio (OR) of receiving outpatient DVT treatment by the same variables with age per 10-year increment. ORs were adjusted for age, sex, race, year of DVT diagnosis, and region of residence as appropriate. Statistical significance was defined as P < 0.05. All statistical analyses were performed by N.A.Z. and conducted with SAS version 9.3 (SAS Institute, Cary, NC). All authors had access to the primary clinical data.
RESULTS
Over a mean of 4.7 years follow-up, 379 VTE events occurred (incident and recurrent); 185 were diagnosed with a PE, and 53 occurred as a complication of hospitalization (and were not eligible for outpatient treatment), leaving 141 DVT events potentially eligible for outpatient treatment out of a population of 29,556 participants with available records and follow-up in the cohort (Figure).
Of 141 DVT events, 39 (28%) were treated as outpatients. Table 1 presents the characteristics of participants treated as inpatients and as outpatients. Factors significantly associated with outpatient DVT treatment were younger age, female sex, white race, residing in an urban area, having a distal DVT only, and having a higher income. In the study, DVT events were recorded between 2003 and 2011; the median year of a diagnosed DVT and treated as an outpatient was 2009, while the median year of inpatient treatment was 2008. Living in the Southeast versus the rest of the country (P = 0.13) and having a high school education or greater (P = 0.07) were marginally associated with receiving outpatient treatment. In absolute terms, 11% of people living in rural areas and 19% of black patients had outpatient DVT treatment while 33% of the urban dwellers and 32% of white patients received outpatient treatment (Table 1). At the time of cohort enrollment, 92% of participants claimed to have insurance; however, this did not differentiate between Medicare, Medicaid, and private insurance. Only 1 participant diagnosed with DVT had an estimated glomerular filtration rate <30, and this individual was admitted for treatment.
Table 2 reports the multivariable adjusted OR for outpatient treatment of DVT adjusted for age, sex, race, region, and year of DVT diagnosis. Outpatient treatment of VTE was associated with younger age (OR 1.90; 95% confidence interval [CI], 1.19-3.02 for every 10 years younger in age), female sex (OR 2.41; 95% CI, 1.06-5.47), and white race (OR 3.29; 95% CI, 1.30-8.30). For each progressive calendar year in which the diagnosis was made, individuals had a 1.35-fold increase in their odds (95% CI, 1.03-1.77) of receiving outpatient treatment. Individuals living in urban areas were 4.16 (95% CI, 1.25-13.79) times more likely to receive outpatient treatment than those in rural areas. Living outside of the southeastern United States and having an income of more than $20,000 per year had increased, but nonsignificant, odds of being treated as outpatient (Table 2).
DISCUSSION
In this national, prospective, observational cohort study, only 28% of participants diagnosed with DVT were treated as outpatients versus being hospitalized. Urban area of residence, white race, female sex, and younger age were significantly associated with an increased odds of outpatient treatment. Groups that had particularly low outpatient treatment rates were rural dwellers and black participants, who had outpatient treatment rates of 11% and 19%, respectively. The odds of receiving outpatient treatment did improve over the course of the study, but in the last year of VTE assessment, outpatient treatment remained at 40%, but this was quite variable over the study years (being 8% two years prior).
The feasibility of outpatient treatment of DVTs requires a coordinated healthcare system and patient support to ensure education and appropriate anticoagulation monitoring. While not all DVTs should be treated as outpatients, differences in treatment location by sex, race, and residence point to potential healthcare disparities that increase the burden on patients and increase healthcare costs. Other studies have documented low outpatient treatment rates of DVTs (20% in 1 United States multicenter DVT registry) but have not discussed the associations of outpatient versus inpatient treatment.13 Outpatient treatment also appears to be underutilized in other developed countries; in the European Computerized Registry of Patients with Venous Thromboembolism, only 31% of DVT patients were treated on an outpatient basis between 2001 and 2011.21 To our knowledge, this is the first study to document the uptake of outpatient DVT treatment in the United States across multiple states, regions, and health systems well after the safety and efficacy of outpatient treatment of DVT was established by randomized controlled trials.3-5
The strengths of this study are that these data are derived from a contemporary cohort with a large geographic and racial distribution in the United States and are well characterized with a mean of 4.6 years follow-up.19 We are limited by a relatively small number of DVT events that were eligible for outpatient treatment (n = 141) and so may miss modest associations. Further, while the geographic scope of the cohort is a tremendous strength of our study, we may have missed some events and did not have complete record retrieval of reported events and could not assess access to healthcare in detail. These data were recorded before the use of DOACs became common. DOACs are an effective and safe alternative to conventional anticoagulation treatment for acute DVT.22 Their use might result in increased outpatient treatment, as they are not parenteral; however, cost considerations (~$400.00 per month), especially with high-deductible insurance plans, may limit their impact on VTE treatment location.23 This study cannot account for why the racial, sex, and urban–rural differences exist, and by extension if hospitalization rates differ due to associated comorbidities or if this represents a healthcare disparity. While it is reasonable from a healthcare perspective that younger individuals would more likely be treated as outpatients, there is no data to suggest that differences in DVT by sex, race, and residential location support decreased outpatient treatment. Due to the age of the cohort, most individuals had some form of insurance and a primary care provider. However, we were unable to assess the quality of insurance and the ease of access to their primary care providers. More research is needed to determine whether patients were hospitalized on medical grounds or because of a lack of coordinated healthcare systems to care for them as outpatients.
In conclusion, only a minority of patients who were potentially eligible for outpatient DVT treatment (28%) were treated as outpatients in this study, and there were significant racial and socioeconomic differences in who received inpatient and outpatient treatment. While outpatient treatment rates were below 40% in all groups, we identified groups with especially low likelihoods of receiving outpatient treatment. While all eligible individuals should be offered outpatient DVT treatment, these data highlight the need for specific efforts to overcome barriers to outpatient treatment in the elderly, rural areas, black patients, and men. Even modest increases in the rate of outpatient DVT treatment could result in substantial cost savings and increased patient convenience without compromising the efficacy or safety of medical care.
Acknowledgements
The authors thank the staff and participants of REGARDS for their important contributions. The executive committee of REGARDS reviewed and approved this manuscript for publication. This research project is supported by cooperative agreement U01 NS041588 from the National Institute of Neurological Disorders and Stroke, National Institutes of Health, Department of Health and Human Services. The content is solely the responsibility of the authors and does not necessarily represent the official views of the National Institute of Neurological Disorders and Stroke or the National Institutes of Health. Representatives of the funding agency have been involved in the review of the manuscript but not directly involved in the collection, management, analysis, or interpretation of the data. The authors thank the other investigators, the staff, and the participants of the REGARDS study for their valuable contributions. A full list of participating REGARDS investigators and institutions can be found at http://www.regardsstudy.org. Additional funding was provided by an investigator-initiated grant in aid from the American Recovery and Reinvestment Act grant RC1HL099460 from the National Heart, Lung, and Blood Institute. Work for the manuscript was supported in part by the Lake Champlain Cancer Research Organization (Burlington, Vermont).
Disclosure
The authors have no conflicts of interest to report.
1. Raskob GE, Angchaisuksiri P, Blanco A N, et al. Thrombosis: A major contributor to global disease burden. Thromb Res. 2014;134(5):931-938. doi:10.1016/j.thromres.2014.08.014. PubMed
2. Kearon C. Natural history of venous thromboembolism. Circulation. 2003;107(SUPPL. 23):22-31. doi:10.1161/01.CIR.0000078464.82671.78. PubMed
3. Koopman MM, Prandoni P, Piovella F, et al. Treatment of venous thrombosis with intravenous unfractionated heparin administered in the hospital as compared with subcutaneous low-molecular-weight heparin administered at home. The Tasman Study Group. N Engl J Med. 1996;334(11):682-687. doi:10.1056/NEJM199603143341102. PubMed
4. Prandoni P, Lensing AW, Büller HR, et al. Comparison of subcutaneous low-molecular-weight heparin with intravenous standard heparin in proximal deep-vein thrombosis. Lancet. 1992;339(8791):441-445. doi:10.1016/S0196-0644(05)81047-9. PubMed
5. Levine M, Gent M, Hirsh J, et al. A comparison of low-molecular-weight heparin administered primarily at home with unfractionated heparin administered in the hospital for proximal deep-vein thrombosis. N Engl J Med. 1996;334(11):677-681. doi:10.1056/NEJM199603143341101. PubMed
6. Segal JB, Bolger DT, Jenckes MW, et al. Outpatient therapy with low molecular weight heparin for the treatment of venous thromboembolism: a review of efficacy, safety, and costs. Am J Med. 2003;115(4):298-308. doi:10.1016/S0002-9343(03)00326-7. PubMed
7. Hyers TM, Agnelli G, Hull RD, et al. Antithrombotic therapy for venous thromboembolic disease. Chest. 2001;119(1 Suppl):176S-193S. PubMed
8. Hirsh J, Hoak J. Management of deep vein thrombosis and pulmonary embolism. A statement for healthcare professionals. Council on Thrombosis (in consultation with the Council on Cardiovascular Radiology), American Heart Association. Circulation. 1996;93(12):2212-2245. PubMed
9. Dunn AS, Coller B. Outpatient treatment of deep vein thrombosis: translating clinical trials into practice. Am J Med. 1999;106(6):660-669. PubMed
10. Spyropoulos AC, Lin J. Direct medical costs of venous thromboembolism and subsequent hospital readmission rates: an administrative claims analysis from 30 managed care organizations. J Manag Care Pharm. 2007;13(6):475-486. doi:2007(13)6: 475-486 [pii]. PubMed
11. Lee M, Pao D, Hsu T, Sonderskov A. Cost savings and effectiveness of outpatient treatment with low molecular weight heparin of deep vein thrombosis in a community hospital. Can J Clin Pharmacol. 2004;11(1):e17-e27. PubMed
12. Pearson SD, Blair R, Halpert A, Eddy E, Mckean S. An outpatient program to treat deep venous thrombosis with low-molecular-weight heparin. Eff Clin Pract. 1999;2(5):210-217. PubMed
13. Goldhaber SZ, Tapson VF. A prospective registry of 5,451 patients with ultrasound-confirmed deep vein thrombosis. Am J Cardiol. 2004;93(2):259-262. doi:10.1016/j.amjcard.2003.09.057. PubMed
14. Howard VJ, Cushman M, Pulley L, et al. The reasons for geographic and racial differences in stroke study: Objectives and design. Neuroepidemiology. 2005;25(3):135-143. doi:10.1159/000086678. PubMed
15. Meschia JF, Merrill P, Soliman EZ, et al. Racial disparities in awareness and treatment of atrial fibrillation: the REasons for Geographic and Racial Differences in Stroke (REGARDS) study. Stroke. 2010;41(4):581-587. doi:10.1161/STROKEAHA.109.573907. PubMed
16. Cushman M, Cantrell RA, McClure LA, et al. Estimated 10-year stroke risk by region and race in the United States: geographic and racial differences in stroke risk. Ann Neurol. 2008;64(5):507-513. doi:10.1002/ana.21493. PubMed
17. Wojcik NC, Huebner WW, Jorgensen G. Strategies for using the National Death Index and the Social Security Administration for death ascertainment in large occupational cohort mortality studies. Am J Epidemiol. 2010;172(4):469-477. doi:10.1093/aje/kwq130. PubMed
18. Frezzato M, Tosetto A, Rodeghiero F. Validated questionnaire for the identification of previous personal or familial venous thromboembolism. Am J Epidemiol. 1996;143(12):1257-1265. PubMed
19. Zakai NA, McClure LA, Judd SE, et al. Racial and regional differences in venous thromboembolism in the United States in 3 cohorts. Circulation. 2014;129(14):1502-1509. doi:10.1161/CIRCULATIONAHA.113.006472. PubMed
20. Morrill R, Cromartie J, Hart G. Metropolitan, Urban, and Rural Commuting Areas: Toward a Better Depiction of the United States Settlement System. Urban Geogr. 1999;20(8):727-748. doi:10.2747/0272-3638.20.8.727.
21. Lozano F, Trujillo-Santos J, Barrón M, et al. Home versus in-hospital treatment of outpatients with acute deep venous thrombosis of the lower limbs. J Vasc Surg. 2014;59(5):1362-1367.e1. doi:10.1016/j.jvs.2013.11.091. PubMed
22. Robertson L, Kesteven P, McCaslin JE. Oral direct thrombin inhibitors or oral factor Xa inhibitors for the treatment of deep vein thrombosis. Cochrane Database Syst Rev. 2015;6:CD010956. doi:10.1002/14651858.CD010956.pub2. PubMed
23. Cushman M. Treating Acute Venous Thromboembolism — Shift with Care A New Era in the Treatment of Amyloidosis ? N Engl J Med. 2013:29-30. doi:10.1056/NEJMe1307413.
© 2017 Society of Hospital Medicine
Regional Variation in Standardized Costs of Care at Children’s Hospitals
With some areas of the country spending close to 3 times more on healthcare than others, regional variation in healthcare spending has been the focus of national attention.1-7 Since 1973, the Dartmouth Institute has studied regional variation in healthcare utilization and spending and concluded that variation is “unwarranted” because it is driven by providers’ practice patterns rather than differences in medical need, patient preferences, or evidence-based medicine.8-11 However, critics of the Dartmouth Institute’s findings argue that their approach does not adequately adjust for community-level income, and that higher costs in some areas reflect greater patient needs that are not reflected in illness acuity alone.12-14
While Medicare data have made it possible to study variations in spending for the senior population, fragmentation of insurance coverage and nonstandardized data structures make studying the pediatric population more difficult. However, the Children’s Hospital Association’s (CHA) Pediatric Health Information System (PHIS) has made large-scale comparisons more feasible. To overcome challenges associated with using charges and nonuniform cost data, PHIS-derived standardized costs provide new opportunities for comparisons.15,16 Initial analyses using PHIS data showed significant interhospital variations in costs of care,15 but they did not adjust for differences in populations and assess the drivers of variation. A more recent study that controlled for payer status, comorbidities, and illness severity found that intensive care unit (ICU) utilization varied significantly for children hospitalized for asthma, suggesting that hospital practice patterns drive differences in cost.17
This study uses PHIS data to analyze regional variations in standardized costs of care for 3 conditions for which children are hospitalized. To assess potential drivers of variation, the study investigates the effects of patient-level demographic and illness-severity variables as well as encounter-level variables on costs of care. It also estimates cost savings from reducing variation.
METHODS
Data Source
This retrospective cohort study uses the PHIS database (CHA, Overland Park, KS), which includes 48 freestanding children’s hospitals located in noncompeting markets across the United States and accounts for approximately 20% of pediatric hospitalizations. PHIS includes patient demographics, International Classification of Diseases, 9th Revision (ICD-9) diagnosis and procedure codes, as well as hospital charges. In addition to total charges, PHIS reports imaging, laboratory, pharmacy, and “other” charges. The “other” category aggregates clinical, supply, room, and nursing charges (including facility fees and ancillary staff services).
Inclusion Criteria
Inpatient- and observation-status hospitalizations for asthma, diabetic ketoacidosis (DKA), and acute gastroenteritis (AGE) at 46 PHIS hospitals from October 2014 to September 2015 were included. Two hospitals were excluded because of missing data. Hospitalizations for patients >18 years were excluded.
Hospitalizations were categorized by using All Patient Refined-Diagnosis Related Groups (APR-DRGs) version 24 (3M Health Information Systems, St. Paul, MN)18 based on the ICD-9 diagnosis and procedure codes assigned during the episode of care. Analyses included APR-DRG 141 (asthma), primary diagnosis ICD-9 codes 250.11 and 250.13 (DKA), and APR-DRG 249 (AGE). ICD-9 codes were used for DKA for increased specificity.19 These conditions were chosen to represent 3 clinical scenarios: (1) a diagnosis for which hospitals differ on whether certain aspects of care are provided in the ICU (asthma), (2) a diagnosis that frequently includes care in an ICU (DKA), and (3) a diagnosis that typically does not include ICU care (AGE).19
Study Design
To focus the analysis on variation in resource utilization across hospitals rather than variations in hospital item charges, each billed resource was assigned a standardized cost.15,16 For each clinical transaction code (CTC), the median unit cost was calculated for each hospital. The median of the hospital medians was defined as the standardized unit cost for that CTC.
The primary outcome variable was the total standardized cost for the hospitalization adjusted for patient-level demographic and illness-severity variables. Patient demographic and illness-severity covariates included age, race, gender, ZIP code-based median annual household income (HHI), rural-urban location, distance from home ZIP code to the hospital, chronic condition indicator (CCI), and severity-of-illness (SOI). When assessing drivers of variation, encounter-level covariates were added, including length of stay (LOS) in hours, ICU utilization, and 7-day readmission (an imprecise measure to account for quality of care during the index visit). The contribution of imaging, laboratory, pharmacy, and “other” costs was also considered.
Median annual HHI for patients’ home ZIP code was obtained from 2010 US Census data. Community-level HHI, a proxy for socioeconomic status (SES),20,21 was classified into categories based on the 2015 US federal poverty level (FPL) for a family of 422: HHI-1 = ≤ 1.5 × FPL; HHI-2 = 1.5 to 2 × FPL; HHI-3 = 2 to 3 × FPL; HHI-4 = ≥ 3 × FPL. Rural-urban commuting area (RUCA) codes were used to determine the rural-urban classification of the patient’s home.23 The distance from home ZIP code to the hospital was included as an additional control for illness severity because patients traveling longer distances are often more sick and require more resources.24
The Agency for Healthcare Research and Quality CCI classification system was used to identify the presence of a chronic condition.25 For asthma, CCI was flagged if the patient had a chronic condition other than asthma; for DKA, CCI was flagged if the patient had a chronic condition other than DKA; and for AGE, CCI was flagged if the patient had any chronic condition.
The APR-DRG system provides a 4-level SOI score with each APR-DRG category. Patient factors, such as comorbid diagnoses, are considered in severity scores generated through 3M’s proprietary algorithms.18
For the first analysis, the 46 hospitals were categorized into 7 geographic regions based on 2010 US Census Divisions.26 To overcome small hospital sample sizes, Mountain and Pacific were combined into West, and Middle Atlantic and New England were combined into North East. Because PHIS hospitals are located in noncompeting geographic regions, for the second analysis, we examined hospital-level variation (considering each hospital as its own region).
Data Analysis
To focus the analysis on “typical” patients and produce more robust estimates of central tendencies, the top and bottom 5% of hospitalizations with the most extreme standardized costs by condition were trimmed.27 Standardized costs were log-transformed because of their nonnormal distribution and analyzed by using linear mixed models. Covariates were added stepwise to assess the proportion of the variance explained by each predictor. Post-hoc tests with conservative single-step stepwise mutation model corrections for multiple testing were used to compare adjusted costs. Statistical analyses were performed using SAS version 9.3 (SAS Institute, Cary, NC). P values < 0.05 were considered significant. The Children’s Hospital of Philadelphia Institutional Review Board did not classify this study as human subjects research.
RESULTS
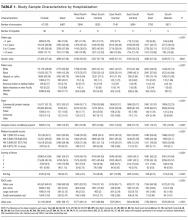

During the study period, there were 26,430 hospitalizations for asthma, 5056 for DKA, and 16,274 for AGE (Table 1).
Variation Across Census Regions
After adjusting for patient-level demographic and illness-severity variables, differences in adjusted total standardized costs remained between regions (P < 0.001). Although no region was an outlier compared to the overall mean for any of the conditions, regions were statistically different in pairwise comparison. The East North Central, South Atlantic, and West South Central regions had the highest adjusted total standardized costs for each of the conditions. The East South Central and West North Central regions had the lowest costs for each of the conditions. Adjusted total standardized costs were 120% higher for asthma ($1920 vs $4227), 46% higher for DKA ($7429 vs $10,881), and 150% higher for AGE ($3316 vs $8292) in the highest-cost region compared with the lowest-cost region (Table 2A).
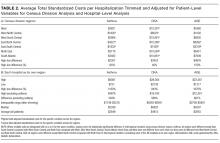
Variation Within Census Regions

After controlling for patient-level demographic and illness-severity variables, standardized costs were different across hospitals in the same region (P < 0.001; panel A in Figure). This was true for all conditions in each region. Differences between the lowest- and highest-cost hospitals within the same region ranged from 111% to 420% for asthma, 101% to 398% for DKA, and 166% to 787% for AGE (Table 3).
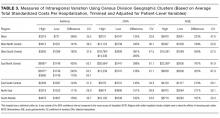
Variation Across Hospitals (Each Hospital as Its Own Region)
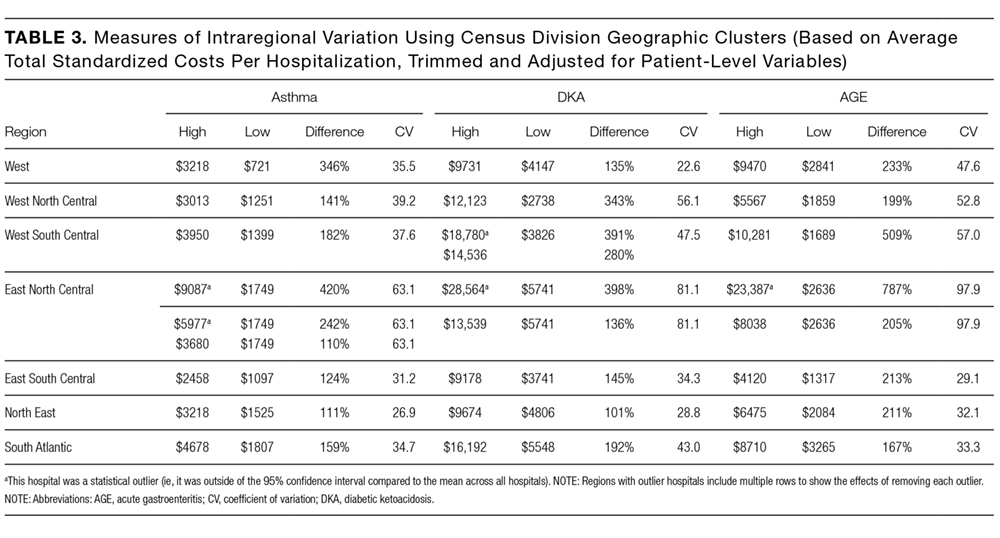
One hospital had the highest adjusted standardized costs for all 3 conditions ($9087 for asthma, $28,564 for DKA, and $23,387 for AGE) and was outside of the 95% confidence interval compared with the overall means. The second highest-cost hospitals for asthma ($5977) and AGE ($18,780) were also outside of the 95% confidence interval. After removing these outliers, the difference between the highest- and lowest-cost hospitals was 549% for asthma ($721 vs $4678), 491% for DKA ($2738 vs $16,192), and 681% for AGE ($1317 vs $10,281; Table 2B).
Drivers of Variation Across Census Regions
Patient-level demographic and illness-severity variables explained very little of the variation in standardized costs across regions. For each of the conditions, age, race, gender, community-level HHI, RUCA, and distance from home to the hospital each accounted for <1.5% of variation, while SOI and CCI each accounted for <5%. Overall, patient-level variables explained 5.5%, 3.7%, and 6.7% of variation for asthma, DKA, and AGE.
Encounter-level variables explained a much larger percentage of the variation in costs. LOS accounted for 17.8% of the variation for asthma, 9.8% for DKA, and 8.7% for AGE. ICU utilization explained 6.9% of the variation for asthma and 12.5% for DKA; ICU use was not a major driver for AGE. Seven-day readmissions accounted for <0.5% for each of the conditions. The combination of patient-level and encounter-level variables explained 27%, 24%, and 15% of the variation for asthma, DKA, and AGE.
Drivers of Variation Across Hospitals
For each of the conditions, patient-level demographic variables each accounted for <2% of variation in costs between hospitals. SOI accounted for 4.5% of the variation for asthma and CCI accounted for 5.2% for AGE. Overall, patient-level variables explained 6.9%, 5.3%, and 7.3% of variation for asthma, DKA, and AGE.
Encounter-level variables accounted for a much larger percentage of the variation in cost. LOS explained 25.4% for asthma, 13.3% for DKA, and 14.2% for AGE. ICU utilization accounted for 13.4% for asthma and 21.9% for DKA; ICU use was not a major driver for AGE. Seven-day readmissions accounted for <0.5% for each of the conditions. Together, patient-level and encounter-level variables explained 40%, 36%, and 22% of variation for asthma, DKA, and AGE.
Imaging, Laboratory, Pharmacy, and “Other” Costs
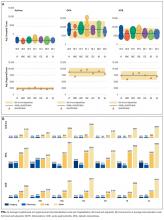
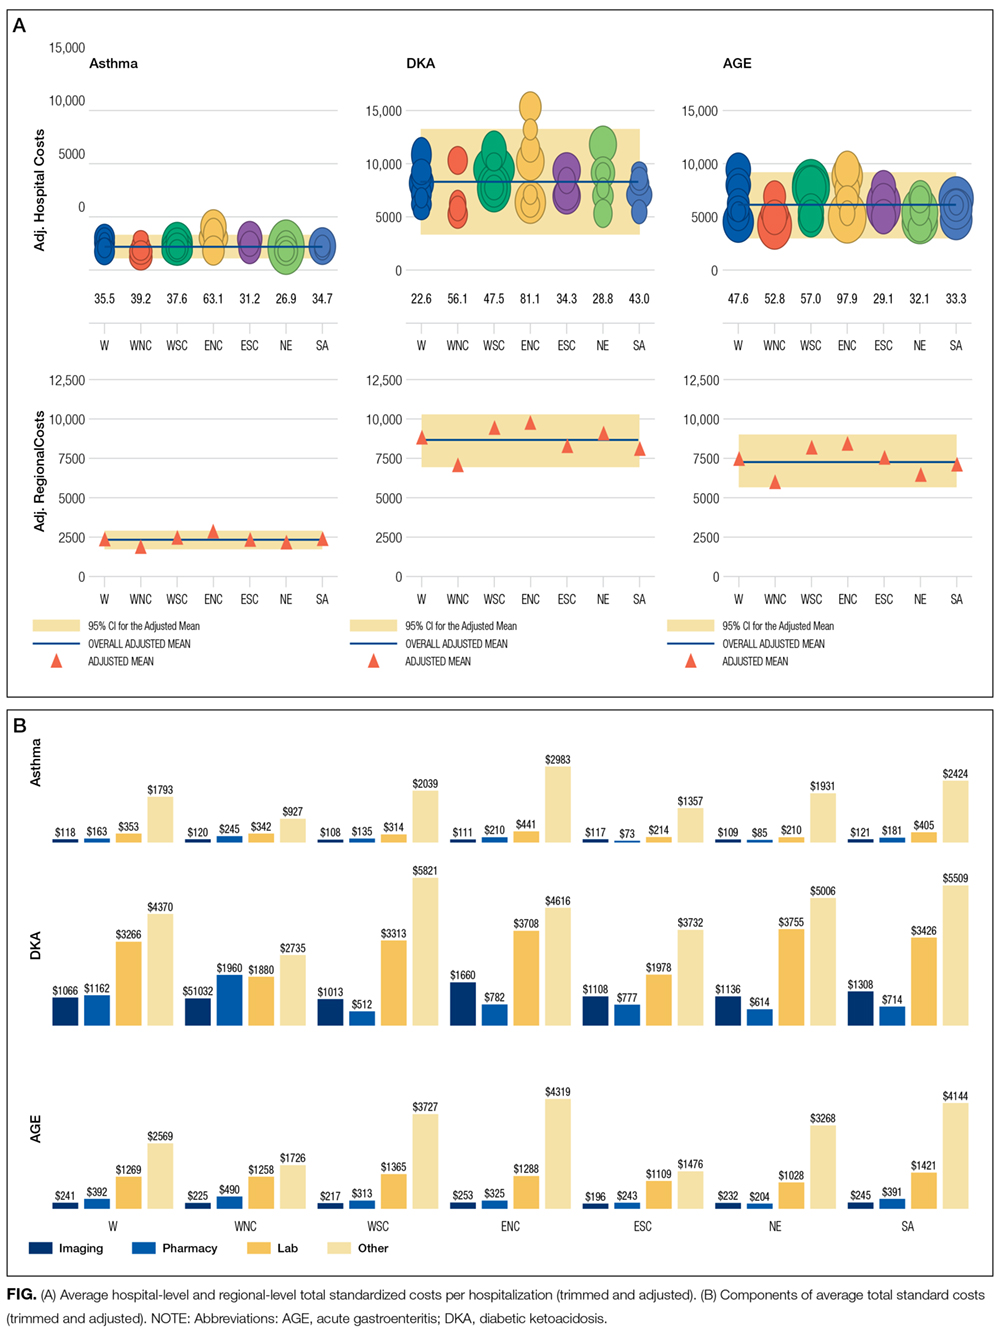
The largest contributor to total costs adjusted for patient-level factors for all conditions was “other,” which aggregates room, nursing, clinical, and supply charges (panel B in Figure). When considering drivers of variation, this category explained >50% for each of the conditions. The next largest contributor to total costs was laboratory charges, which accounted for 15% of the variation across regions for asthma and 11% for DKA. Differences in imaging accounted for 18% of the variation for DKA and 15% for AGE. Differences in pharmacy charges accounted for <4% of the variation for each of the conditions. Adding the 4 cost components to the other patient- and encounter-level covariates, the model explained 81%, 78%, and 72% of the variation across census regions for asthma, DKA, and AGE.
For the hospital-level analysis, differences in “other” remained the largest driver of cost variation. For asthma, “other” explained 61% of variation, while pharmacy, laboratory, and imaging each accounted for <8%. For DKA, differences in imaging accounted for 18% of the variation and laboratory charges accounted for 12%. For AGE, imaging accounted for 15% of the variation. Adding the 4 cost components to the other patient- and encounter-level covariates, the model explained 81%, 72%, and 67% of the variation for asthma, DKA, and AGE.
Cost Savings
If all hospitals in this cohort with adjusted standardized costs above the national PHIS average achieved costs equal to the national PHIS average, estimated annual savings in adjusted standardized costs for these 3 conditions would be $69.1 million. If each hospital with adjusted costs above the average within its census region achieved costs equal to its regional average, estimated annual savings in adjusted standardized costs for these conditions would be $25.2 million.
DISCUSSION
This study reported on the regional variation in costs of care for 3 conditions treated at 46 children’s hospitals across 7 geographic regions, and it demonstrated that variations in costs of care exist in pediatrics. This study used standardized costs to compare utilization patterns across hospitals and adjusted for several patient-level demographic and illness-severity factors, and it found that differences in costs of care for children hospitalized with asthma, DKA, and AGE remained both between and within regions.
These variations are noteworthy, as hospitals strive to improve the value of healthcare. If the higher-cost hospitals in this cohort could achieve costs equal to the national PHIS averages, estimated annual savings in adjusted standardized costs for these conditions alone would equal $69.1 million. If higher-cost hospitals relative to the average in their own region reduced costs to their regional averages, annual standardized cost savings could equal $25.2 million for these conditions.
The differences observed are also significant in that they provide a foundation for exploring whether lower-cost regions or lower-cost hospitals achieve comparable quality outcomes.28 If so, studying what those hospitals do to achieve outcomes more efficiently can serve as the basis for the establishment of best practices.29 Standardizing best practices through protocols, pathways, and care-model redesign can reduce potentially unnecessary spending.30
Our findings showed that patient-level demographic and illness-severity covariates, including community-level HHI and SOI, did not consistently explain cost differences. Instead, LOS and ICU utilization were associated with higher costs.17,19 When considering the effect of the 4 cost components on the variation in total standardized costs between regions and between hospitals, the fact that the “other” category accounted for the largest percent of the variation is not surprising, because the cost of room occupancy and nursing services increases with longer LOS and more time in the ICU. Other individual cost components that were major drivers of variation were laboratory utilization for asthma and imaging for DKA and AGE31 (though they accounted for a much smaller proportion of total adjusted costs).19
To determine if these factors are modifiable, more information is needed to explain why practices differ. Many factors may contribute to varying utilization patterns, including differences in capabilities and resources (in the hospital and in the community) and patient volumes. For example, some hospitals provide continuous albuterol for status asthmaticus only in ICUs, while others provide it on regular units.32 But if certain hospitals do not have adequate resources or volumes to effectively care for certain populations outside of the ICU, their higher-value approach (considering quality and cost) may be to utilize ICU beds, even if some other hospitals care for those patients on non-ICU floors. Another possibility is that family preferences about care delivery (such as how long children stay in the hospital) may vary across regions.33
Other evidence suggests that physician practice and spending patterns are strongly influenced by the practices of the region where they trained.34 Because physicians often practice close to where they trained,35,36 this may partially explain how regional patterns are reinforced.
Even considering all mentioned covariates, our model did not fully explain variation in standardized costs. After adding the cost components as covariates, between one-third and one-fifth of the variation remained unexplained. It is possible that this unexplained variation stemmed from unmeasured patient-level factors.
In addition, while proxies for SES, including community-level HHI, did not significantly predict differences in costs across regions, it is possible that SES affected LOS differently in different regions. Previous studies have suggested that lower SES is associated with longer LOS.37 If this effect is more pronounced in certain regions (potentially because of differences in social service infrastructures), SES may be contributing to variations in cost through LOS.
Our findings were subject to limitations. First, this study only examined 3 diagnoses and did not include surgical or less common conditions. Second, while PHIS includes tertiary care, academic, and freestanding children’s hospitals, it does not include general hospitals, which is where most pediatric patients receive care.38 Third, we used ZIP code-based median annual HHI to account for SES, and we used ZIP codes to determine the distance to the hospital and rural-urban location of patients’ homes. These approximations lack precision because SES and distances vary within ZIP codes.39 Fourth, while adjusted standardized costs allow for comparisons between hospitals, they do not represent actual costs to patients or individual hospitals. Additionally, when determining whether variation remained after controlling for patient-level variables, we included SOI as a reflection of illness-severity at presentation. However, in practice, SOI scores may be assigned partially based on factors determined during the hospitalization.18 Finally, the use of other regional boundaries or the selection of different hospitals may yield different results.
CONCLUSION
This study reveals regional variations in costs of care for 3 inpatient pediatric conditions. Future studies should explore whether lower-cost regions or lower-cost hospitals achieve comparable quality outcomes. To the extent that variation is driven by modifiable factors and lower spending does not compromise outcomes, these data may prompt reviews of care models to reduce unwarranted variation and improve the value of care delivery at local, regional, and national levels.
Disclosure
Internal funds from the CHA and The Children’s Hospital of Philadelphia supported the conduct of this work. The authors have no financial interests, relationships, or affiliations relevant to the subject matter or materials discussed in the manuscript to disclose. The authors have no potential conflicts of interest relevant to the subject matter or materials discussed in the manuscript to disclose
1. Fisher E, Skinner J. Making Sense of Geographic Variations in Health Care: The New IOM Report. 2013; http://healthaffairs.org/blog/2013/07/24/making-sense-of-geographic-variations-in-health-care-the-new-iom-report/. Accessed on April 11, 2014.
With some areas of the country spending close to 3 times more on healthcare than others, regional variation in healthcare spending has been the focus of national attention.1-7 Since 1973, the Dartmouth Institute has studied regional variation in healthcare utilization and spending and concluded that variation is “unwarranted” because it is driven by providers’ practice patterns rather than differences in medical need, patient preferences, or evidence-based medicine.8-11 However, critics of the Dartmouth Institute’s findings argue that their approach does not adequately adjust for community-level income, and that higher costs in some areas reflect greater patient needs that are not reflected in illness acuity alone.12-14
While Medicare data have made it possible to study variations in spending for the senior population, fragmentation of insurance coverage and nonstandardized data structures make studying the pediatric population more difficult. However, the Children’s Hospital Association’s (CHA) Pediatric Health Information System (PHIS) has made large-scale comparisons more feasible. To overcome challenges associated with using charges and nonuniform cost data, PHIS-derived standardized costs provide new opportunities for comparisons.15,16 Initial analyses using PHIS data showed significant interhospital variations in costs of care,15 but they did not adjust for differences in populations and assess the drivers of variation. A more recent study that controlled for payer status, comorbidities, and illness severity found that intensive care unit (ICU) utilization varied significantly for children hospitalized for asthma, suggesting that hospital practice patterns drive differences in cost.17
This study uses PHIS data to analyze regional variations in standardized costs of care for 3 conditions for which children are hospitalized. To assess potential drivers of variation, the study investigates the effects of patient-level demographic and illness-severity variables as well as encounter-level variables on costs of care. It also estimates cost savings from reducing variation.
METHODS
Data Source
This retrospective cohort study uses the PHIS database (CHA, Overland Park, KS), which includes 48 freestanding children’s hospitals located in noncompeting markets across the United States and accounts for approximately 20% of pediatric hospitalizations. PHIS includes patient demographics, International Classification of Diseases, 9th Revision (ICD-9) diagnosis and procedure codes, as well as hospital charges. In addition to total charges, PHIS reports imaging, laboratory, pharmacy, and “other” charges. The “other” category aggregates clinical, supply, room, and nursing charges (including facility fees and ancillary staff services).
Inclusion Criteria
Inpatient- and observation-status hospitalizations for asthma, diabetic ketoacidosis (DKA), and acute gastroenteritis (AGE) at 46 PHIS hospitals from October 2014 to September 2015 were included. Two hospitals were excluded because of missing data. Hospitalizations for patients >18 years were excluded.
Hospitalizations were categorized by using All Patient Refined-Diagnosis Related Groups (APR-DRGs) version 24 (3M Health Information Systems, St. Paul, MN)18 based on the ICD-9 diagnosis and procedure codes assigned during the episode of care. Analyses included APR-DRG 141 (asthma), primary diagnosis ICD-9 codes 250.11 and 250.13 (DKA), and APR-DRG 249 (AGE). ICD-9 codes were used for DKA for increased specificity.19 These conditions were chosen to represent 3 clinical scenarios: (1) a diagnosis for which hospitals differ on whether certain aspects of care are provided in the ICU (asthma), (2) a diagnosis that frequently includes care in an ICU (DKA), and (3) a diagnosis that typically does not include ICU care (AGE).19
Study Design
To focus the analysis on variation in resource utilization across hospitals rather than variations in hospital item charges, each billed resource was assigned a standardized cost.15,16 For each clinical transaction code (CTC), the median unit cost was calculated for each hospital. The median of the hospital medians was defined as the standardized unit cost for that CTC.
The primary outcome variable was the total standardized cost for the hospitalization adjusted for patient-level demographic and illness-severity variables. Patient demographic and illness-severity covariates included age, race, gender, ZIP code-based median annual household income (HHI), rural-urban location, distance from home ZIP code to the hospital, chronic condition indicator (CCI), and severity-of-illness (SOI). When assessing drivers of variation, encounter-level covariates were added, including length of stay (LOS) in hours, ICU utilization, and 7-day readmission (an imprecise measure to account for quality of care during the index visit). The contribution of imaging, laboratory, pharmacy, and “other” costs was also considered.
Median annual HHI for patients’ home ZIP code was obtained from 2010 US Census data. Community-level HHI, a proxy for socioeconomic status (SES),20,21 was classified into categories based on the 2015 US federal poverty level (FPL) for a family of 422: HHI-1 = ≤ 1.5 × FPL; HHI-2 = 1.5 to 2 × FPL; HHI-3 = 2 to 3 × FPL; HHI-4 = ≥ 3 × FPL. Rural-urban commuting area (RUCA) codes were used to determine the rural-urban classification of the patient’s home.23 The distance from home ZIP code to the hospital was included as an additional control for illness severity because patients traveling longer distances are often more sick and require more resources.24
The Agency for Healthcare Research and Quality CCI classification system was used to identify the presence of a chronic condition.25 For asthma, CCI was flagged if the patient had a chronic condition other than asthma; for DKA, CCI was flagged if the patient had a chronic condition other than DKA; and for AGE, CCI was flagged if the patient had any chronic condition.
The APR-DRG system provides a 4-level SOI score with each APR-DRG category. Patient factors, such as comorbid diagnoses, are considered in severity scores generated through 3M’s proprietary algorithms.18
For the first analysis, the 46 hospitals were categorized into 7 geographic regions based on 2010 US Census Divisions.26 To overcome small hospital sample sizes, Mountain and Pacific were combined into West, and Middle Atlantic and New England were combined into North East. Because PHIS hospitals are located in noncompeting geographic regions, for the second analysis, we examined hospital-level variation (considering each hospital as its own region).
Data Analysis
To focus the analysis on “typical” patients and produce more robust estimates of central tendencies, the top and bottom 5% of hospitalizations with the most extreme standardized costs by condition were trimmed.27 Standardized costs were log-transformed because of their nonnormal distribution and analyzed by using linear mixed models. Covariates were added stepwise to assess the proportion of the variance explained by each predictor. Post-hoc tests with conservative single-step stepwise mutation model corrections for multiple testing were used to compare adjusted costs. Statistical analyses were performed using SAS version 9.3 (SAS Institute, Cary, NC). P values < 0.05 were considered significant. The Children’s Hospital of Philadelphia Institutional Review Board did not classify this study as human subjects research.
RESULTS
During the study period, there were 26,430 hospitalizations for asthma, 5056 for DKA, and 16,274 for AGE (Table 1).
Variation Across Census Regions
After adjusting for patient-level demographic and illness-severity variables, differences in adjusted total standardized costs remained between regions (P < 0.001). Although no region was an outlier compared to the overall mean for any of the conditions, regions were statistically different in pairwise comparison. The East North Central, South Atlantic, and West South Central regions had the highest adjusted total standardized costs for each of the conditions. The East South Central and West North Central regions had the lowest costs for each of the conditions. Adjusted total standardized costs were 120% higher for asthma ($1920 vs $4227), 46% higher for DKA ($7429 vs $10,881), and 150% higher for AGE ($3316 vs $8292) in the highest-cost region compared with the lowest-cost region (Table 2A).
Variation Within Census Regions
After controlling for patient-level demographic and illness-severity variables, standardized costs were different across hospitals in the same region (P < 0.001; panel A in Figure). This was true for all conditions in each region. Differences between the lowest- and highest-cost hospitals within the same region ranged from 111% to 420% for asthma, 101% to 398% for DKA, and 166% to 787% for AGE (Table 3).
Variation Across Hospitals (Each Hospital as Its Own Region)
One hospital had the highest adjusted standardized costs for all 3 conditions ($9087 for asthma, $28,564 for DKA, and $23,387 for AGE) and was outside of the 95% confidence interval compared with the overall means. The second highest-cost hospitals for asthma ($5977) and AGE ($18,780) were also outside of the 95% confidence interval. After removing these outliers, the difference between the highest- and lowest-cost hospitals was 549% for asthma ($721 vs $4678), 491% for DKA ($2738 vs $16,192), and 681% for AGE ($1317 vs $10,281; Table 2B).
Drivers of Variation Across Census Regions
Patient-level demographic and illness-severity variables explained very little of the variation in standardized costs across regions. For each of the conditions, age, race, gender, community-level HHI, RUCA, and distance from home to the hospital each accounted for <1.5% of variation, while SOI and CCI each accounted for <5%. Overall, patient-level variables explained 5.5%, 3.7%, and 6.7% of variation for asthma, DKA, and AGE.
Encounter-level variables explained a much larger percentage of the variation in costs. LOS accounted for 17.8% of the variation for asthma, 9.8% for DKA, and 8.7% for AGE. ICU utilization explained 6.9% of the variation for asthma and 12.5% for DKA; ICU use was not a major driver for AGE. Seven-day readmissions accounted for <0.5% for each of the conditions. The combination of patient-level and encounter-level variables explained 27%, 24%, and 15% of the variation for asthma, DKA, and AGE.
Drivers of Variation Across Hospitals
For each of the conditions, patient-level demographic variables each accounted for <2% of variation in costs between hospitals. SOI accounted for 4.5% of the variation for asthma and CCI accounted for 5.2% for AGE. Overall, patient-level variables explained 6.9%, 5.3%, and 7.3% of variation for asthma, DKA, and AGE.
Encounter-level variables accounted for a much larger percentage of the variation in cost. LOS explained 25.4% for asthma, 13.3% for DKA, and 14.2% for AGE. ICU utilization accounted for 13.4% for asthma and 21.9% for DKA; ICU use was not a major driver for AGE. Seven-day readmissions accounted for <0.5% for each of the conditions. Together, patient-level and encounter-level variables explained 40%, 36%, and 22% of variation for asthma, DKA, and AGE.
Imaging, Laboratory, Pharmacy, and “Other” Costs
The largest contributor to total costs adjusted for patient-level factors for all conditions was “other,” which aggregates room, nursing, clinical, and supply charges (panel B in Figure). When considering drivers of variation, this category explained >50% for each of the conditions. The next largest contributor to total costs was laboratory charges, which accounted for 15% of the variation across regions for asthma and 11% for DKA. Differences in imaging accounted for 18% of the variation for DKA and 15% for AGE. Differences in pharmacy charges accounted for <4% of the variation for each of the conditions. Adding the 4 cost components to the other patient- and encounter-level covariates, the model explained 81%, 78%, and 72% of the variation across census regions for asthma, DKA, and AGE.
For the hospital-level analysis, differences in “other” remained the largest driver of cost variation. For asthma, “other” explained 61% of variation, while pharmacy, laboratory, and imaging each accounted for <8%. For DKA, differences in imaging accounted for 18% of the variation and laboratory charges accounted for 12%. For AGE, imaging accounted for 15% of the variation. Adding the 4 cost components to the other patient- and encounter-level covariates, the model explained 81%, 72%, and 67% of the variation for asthma, DKA, and AGE.
Cost Savings
If all hospitals in this cohort with adjusted standardized costs above the national PHIS average achieved costs equal to the national PHIS average, estimated annual savings in adjusted standardized costs for these 3 conditions would be $69.1 million. If each hospital with adjusted costs above the average within its census region achieved costs equal to its regional average, estimated annual savings in adjusted standardized costs for these conditions would be $25.2 million.
DISCUSSION
This study reported on the regional variation in costs of care for 3 conditions treated at 46 children’s hospitals across 7 geographic regions, and it demonstrated that variations in costs of care exist in pediatrics. This study used standardized costs to compare utilization patterns across hospitals and adjusted for several patient-level demographic and illness-severity factors, and it found that differences in costs of care for children hospitalized with asthma, DKA, and AGE remained both between and within regions.
These variations are noteworthy, as hospitals strive to improve the value of healthcare. If the higher-cost hospitals in this cohort could achieve costs equal to the national PHIS averages, estimated annual savings in adjusted standardized costs for these conditions alone would equal $69.1 million. If higher-cost hospitals relative to the average in their own region reduced costs to their regional averages, annual standardized cost savings could equal $25.2 million for these conditions.
The differences observed are also significant in that they provide a foundation for exploring whether lower-cost regions or lower-cost hospitals achieve comparable quality outcomes.28 If so, studying what those hospitals do to achieve outcomes more efficiently can serve as the basis for the establishment of best practices.29 Standardizing best practices through protocols, pathways, and care-model redesign can reduce potentially unnecessary spending.30
Our findings showed that patient-level demographic and illness-severity covariates, including community-level HHI and SOI, did not consistently explain cost differences. Instead, LOS and ICU utilization were associated with higher costs.17,19 When considering the effect of the 4 cost components on the variation in total standardized costs between regions and between hospitals, the fact that the “other” category accounted for the largest percent of the variation is not surprising, because the cost of room occupancy and nursing services increases with longer LOS and more time in the ICU. Other individual cost components that were major drivers of variation were laboratory utilization for asthma and imaging for DKA and AGE31 (though they accounted for a much smaller proportion of total adjusted costs).19
To determine if these factors are modifiable, more information is needed to explain why practices differ. Many factors may contribute to varying utilization patterns, including differences in capabilities and resources (in the hospital and in the community) and patient volumes. For example, some hospitals provide continuous albuterol for status asthmaticus only in ICUs, while others provide it on regular units.32 But if certain hospitals do not have adequate resources or volumes to effectively care for certain populations outside of the ICU, their higher-value approach (considering quality and cost) may be to utilize ICU beds, even if some other hospitals care for those patients on non-ICU floors. Another possibility is that family preferences about care delivery (such as how long children stay in the hospital) may vary across regions.33
Other evidence suggests that physician practice and spending patterns are strongly influenced by the practices of the region where they trained.34 Because physicians often practice close to where they trained,35,36 this may partially explain how regional patterns are reinforced.
Even considering all mentioned covariates, our model did not fully explain variation in standardized costs. After adding the cost components as covariates, between one-third and one-fifth of the variation remained unexplained. It is possible that this unexplained variation stemmed from unmeasured patient-level factors.
In addition, while proxies for SES, including community-level HHI, did not significantly predict differences in costs across regions, it is possible that SES affected LOS differently in different regions. Previous studies have suggested that lower SES is associated with longer LOS.37 If this effect is more pronounced in certain regions (potentially because of differences in social service infrastructures), SES may be contributing to variations in cost through LOS.
Our findings were subject to limitations. First, this study only examined 3 diagnoses and did not include surgical or less common conditions. Second, while PHIS includes tertiary care, academic, and freestanding children’s hospitals, it does not include general hospitals, which is where most pediatric patients receive care.38 Third, we used ZIP code-based median annual HHI to account for SES, and we used ZIP codes to determine the distance to the hospital and rural-urban location of patients’ homes. These approximations lack precision because SES and distances vary within ZIP codes.39 Fourth, while adjusted standardized costs allow for comparisons between hospitals, they do not represent actual costs to patients or individual hospitals. Additionally, when determining whether variation remained after controlling for patient-level variables, we included SOI as a reflection of illness-severity at presentation. However, in practice, SOI scores may be assigned partially based on factors determined during the hospitalization.18 Finally, the use of other regional boundaries or the selection of different hospitals may yield different results.
CONCLUSION
This study reveals regional variations in costs of care for 3 inpatient pediatric conditions. Future studies should explore whether lower-cost regions or lower-cost hospitals achieve comparable quality outcomes. To the extent that variation is driven by modifiable factors and lower spending does not compromise outcomes, these data may prompt reviews of care models to reduce unwarranted variation and improve the value of care delivery at local, regional, and national levels.
Disclosure
Internal funds from the CHA and The Children’s Hospital of Philadelphia supported the conduct of this work. The authors have no financial interests, relationships, or affiliations relevant to the subject matter or materials discussed in the manuscript to disclose. The authors have no potential conflicts of interest relevant to the subject matter or materials discussed in the manuscript to disclose
1. Fisher E, Skinner J. Making Sense of Geographic Variations in Health Care: The New IOM Report. 2013; http://healthaffairs.org/blog/2013/07/24/making-sense-of-geographic-variations-in-health-care-the-new-iom-report/. Accessed on April 11, 2014.
1. Fisher E, Skinner J. Making Sense of Geographic Variations in Health Care: The New IOM Report. 2013; http://healthaffairs.org/blog/2013/07/24/making-sense-of-geographic-variations-in-health-care-the-new-iom-report/. Accessed on April 11, 2014.
© 2017 Society of Hospital Medicine
A Concise Tool for Measuring Care Coordination from the Provider’s Perspective in the Hospital Setting
Care Coordination has been defined as “…the deliberate organization of patient care activities between two or more participants (including the patient) involved in a patient’s care to facilitate the appropriate delivery of healthcare services.”1 The Institute of Medicine identified care coordination as a key strategy to improve the American healthcare system,2 and evidence has been building that well-coordinated care improves patient outcomes and reduces healthcare costs associated with chronic conditions.3-5 In 2012, Johns Hopkins Medicine was awarded a Healthcare Innovation Award by the Centers for Medicare & Medicaid Services to improve coordination of care across the continuum of care for adult patients admitted to Johns Hopkins Hospital (JHH) and Johns Hopkins Bayview Medical Center (JHBMC), and for high-risk low-income Medicare and Medicaid beneficiaries receiving ambulatory care in targeted zip codes. The purpose of this project, known as the Johns Hopkins Community Health Partnership (J-CHiP), was to improve health and healthcare and to reduce healthcare costs. The acute care component of the program consisted of a bundle of interventions focused on improving coordination of care for all patients, including a “bridge to home” discharge process, as they transitioned back to the community from inpatient admission. The bundle included the following: early screening for discharge planning to predict needed postdischarge services; discussion in daily multidisciplinary rounds about goals and priorities of the hospitalization and potential postdischarge needs; patient and family self-care management; education enhanced medication management, including the option of “medications in hand” at the time of discharge; postdischarge telephone follow-up by nurses; and, for patients identified as high-risk, a “transition guide” (a nurse who works with the patient via home visits and by phone to optimize compliance with care for 30 days postdischarge).6 While the primary endpoints of the J-CHiP program were to improve clinical outcomes and reduce healthcare costs, we were also interested in the impact of the program on care coordination processes in the acute care setting. This created the need for an instrument to measure healthcare professionals’ views of care coordination in their immediate work environments.
We began our search for existing measures by reviewing the Coordination Measures Atlas published in 2014.7 Although this report evaluates over 80 different measures of care coordination, most of them focus on the perspective of the patient and/or family members, on specific conditions, and on primary care or outpatient settings.7,8 We were unable to identify an existing measure from the provider perspective, designed for the inpatient setting, that was both brief but comprehensive enough to cover a range of care coordination domains.8
Consequently, our first aim was to develop a brief, comprehensive tool to measure care coordination from the perspective of hospital inpatient staff that could be used to compare different units or types of providers, or to conduct longitudinal assessment. The second aim was to conduct a preliminary evaluation of the tool in our healthcare setting, including to assess its psychometric properties, to describe provider perceptions of care coordination after the implementation of J-CHiP, and to explore potential differences among departments, types of professionals, and between the 2 hospitals.
METHODS
Development of the Care Coordination Questionnaire
The survey was developed in collaboration with leaders of the J-CHiP Acute Care Team. We met at the outset and on multiple subsequent occasions to align survey domains with the main components of the J-CHiP acute care intervention and to assure that the survey would be relevant and understandable to a variety of multidisciplinary professionals, including physicians, nurses, social workers, physical therapists, and other health professionals. Care was taken to avoid redundancy with existing evaluation efforts and to minimize respondent burden. This process helped to ensure the content validity of the items, the usefulness of the results, and the future usability of the tool.
We modeled the Care Coordination Questionnaire (CCQ) after the Safety Attitudes Questionnaire (SAQ),9 a widely used survey that is deployed approximately annually at JHH and JHBMC. While the SAQ focuses on healthcare provider attitudes about issues relevant to patient safety (often referred to as safety climate or safety culture), this new tool was designed to focus on healthcare professionals’ attitudes about care coordination. Similar to the way that the SAQ “elicits a snapshot of the safety climate through surveys of frontline worker perceptions,” we sought to elicit a picture of our care coordination climate through a survey of frontline hospital staff.
The CCQ was built upon the domains and approaches to care coordination described in the Agency for Healthcare Research and Quality Care Coordination Atlas.3 This report identifies 9 mechanisms for achieving care coordination, including the following: Establish Accountability or Negotiate Responsibility; Communicate; Facilitate Transitions; Assess Needs and Goals; Create a Proactive Plan of Care; Monitor, Follow Up, and Respond to Change; Support Self-Management Goals; Link to Community Resources; and Align Resources with Patient and Population Needs; as well as 5 broad approaches commonly used to improve the delivery of healthcare, including Teamwork Focused on Coordination, Healthcare Home, Care Management, Medication Management, and Health IT-Enabled Coordination.7 We generated at least 1 item to represent 8 of the 9 domains, as well as the broad approach described as Teamwork Focused on Coordination. After developing an initial set of items, we sought input from 3 senior leaders of the J-CHiP Acute Care Team to determine if the items covered the care coordination domains of interest, and to provide feedback on content validity. To test the interpretability of survey items and consistency across professional groups, we sent an initial version of the survey questions to at least 1 person from each of the following professional groups: hospitalist, social worker, case manager, clinical pharmacist, and nurse. We asked them to review all of our survey questions and to provide us with feedback on all aspects of the questions, such as whether they believed the questions were relevant and understandable to the members of their professional discipline, the appropriateness of the wording of the questions, and other comments. Modifications were made to the content and wording of the questions based on the feedback received. The final draft of the questionnaire was reviewed by the leadership team of the J-CHiP Acute Care Team to ensure its usefulness in providing actionable information.
The resulting 12-item questionnaire used a 5-point Likert response scale ranging from 1 = “disagree strongly” to 5 = “agree strongly,” and an additional option of “not applicable (N/A).” To help assess construct validity, a global question was added at the end of the questionnaire asking, “Overall, how would you rate the care coordination at the hospital of your primary work setting?” The response was measured on a 10-point Likert-type scale ranging from 1 = “totally uncoordinated care” to 10 = “perfectly coordinated care” (see Appendix). In addition, the questionnaire requested information about the respondents’ gender, position, and their primary unit, department, and hospital affiliation.
Data Collection Procedures
An invitation to complete an anonymous questionnaire was sent to the following inpatient care professionals: all nursing staff working on care coordination units in the departments of medicine, surgery, and neurology/neurosurgery, as well as physicians, pharmacists, acute care therapists (eg, occupational and physical therapists), and other frontline staff. All healthcare staff fitting these criteria was sent an e-mail with a request to fill out the survey online using QualtricsTM (Qualtrics Labs Inc., Provo, UT), as well as multiple follow-up reminders. The participants worked either at the JHH (a 1194-bed tertiary academic medical center in Baltimore, MD) or the JHBMC (a 440-bed academic community hospital located nearby). Data were collected from October 2015 through January 2016.
Analysis
Means and standard deviations were calculated by treating the responses as continuous variables. We tried 3 different methods to handle missing data: (1) without imputation, (2) imputing the mean value of each item, and (3) substituting a neutral score. Because all 3 methods produced very similar results, we treated the N/A responses as missing values without imputation for simplicity of analysis. We used STATA 13.1 (Stata Corporation, College Station, Texas) to analyze the data.
To identify subscales, we performed exploratory factor analysis on responses to the 12 specific items. Promax rotation was selected based on the simple structure. Subscale scores for each respondent were generated by computing the mean of responses to the items in the subscale. Internal consistency reliability of the subscales was estimated using Cronbach’s alpha. We calculated Pearson correlation coefficients for the items in each subscale, and examined Cronbach’s alpha deleting each item in turn. For each of the subscales identified and the global scale, we calculated the mean, standard deviation, median and interquartile range. Although distributions of scores tended to be non-normal, this was done to increase interpretability. We also calculated percent scoring at the ceiling (highest possible score).
We analyzed the data with 3 research questions in mind: Was there a difference in perceptions of care coordination between (1) staff affiliated with the 2 different hospitals, (2) staff affiliated with different clinical departments, or (3) staff with different professional roles? For comparisons based on hospital and department, and type of professional, nonparametric tests (Wilcoxon rank-sum and Kruskal-Wallis test) were used with a level of statistical significance set at 0.05. The comparison between hospitals and departments was made only among nurses to minimize the confounding effect of different distribution of professionals. We tested the distribution of “years in specialty” between hospitals and departments for this comparison using Pearson’s χ2 test. The difference was not statistically significant (P = 0.167 for hospitals, and P = 0.518 for departments), so we assumed that the potential confounding effect of this variable was negligible in this analysis. The comparison of scores within each professional group used the Friedman test. Pearson’s χ2 test was used to compare the baseline characteristics between 2 hospitals.
RESULTS
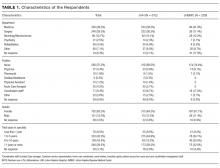
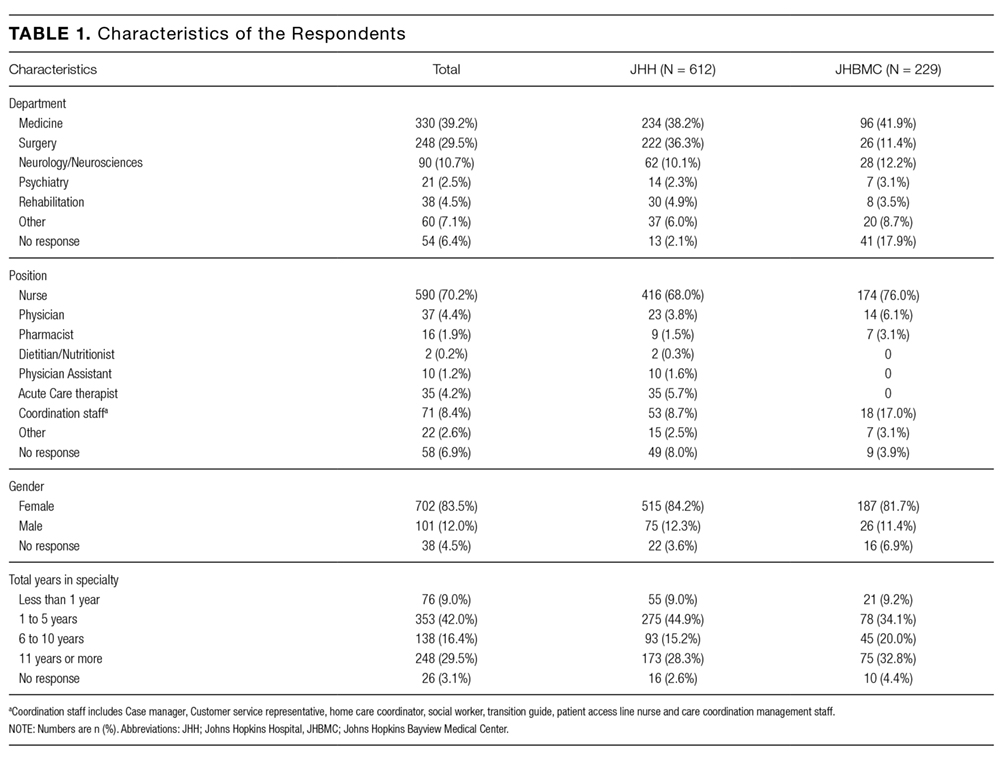
Among the 1486 acute care professionals asked to participate in the survey, 841 completed the questionnaire (response rate 56.6%). Table 1 shows the characteristics of the participants from each hospital. Table 2 summarizes the item response rates, proportion scoring at the ceiling, and weighting from the factor analysis. All items had completion rates of 99.2% or higher, with N/A responses ranging from 0% (item 2) to 3.1% (item 7). The percent scoring at the ceiling was 1.7% for the global item and ranged from 18.3% up to 63.3% for other individual items.
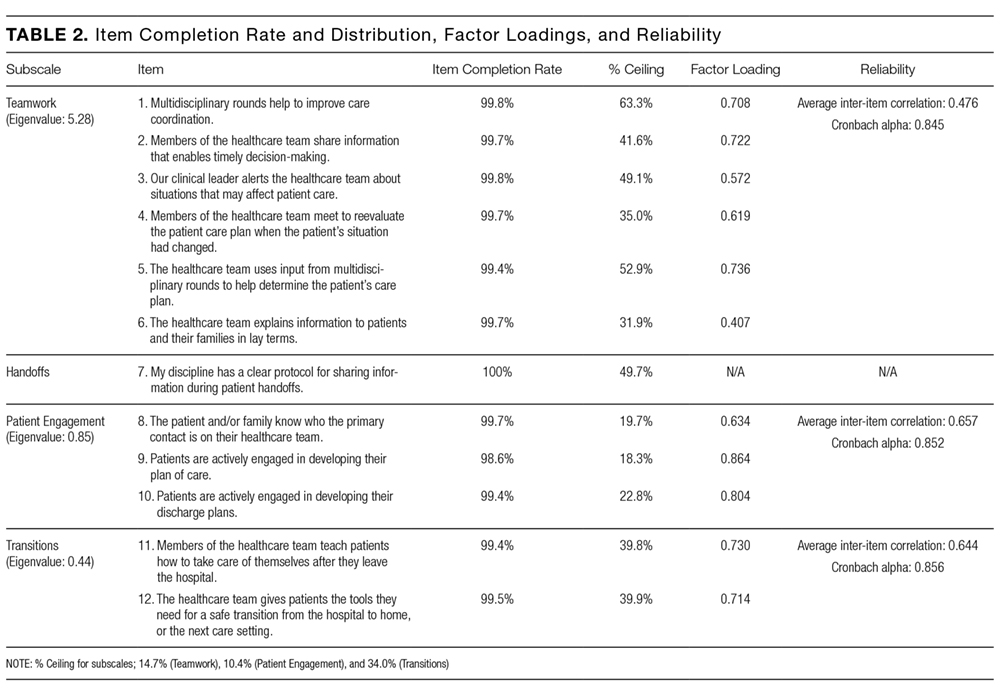
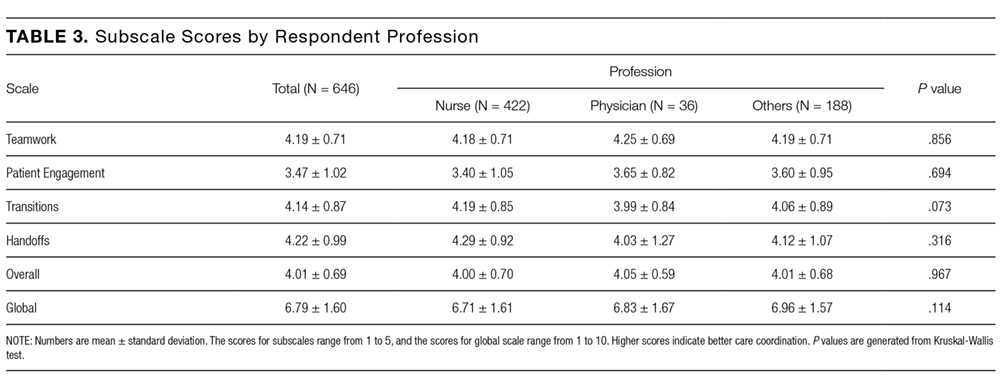

We also examined differences in perceptions of care coordination among nursing units to illustrate the tool’s ability to detect variation in Patient Engagement subscale scores for JHH nurses (see Appendix).
DISCUSSION
This study resulted in one of the first measurement tools to succinctly measure multiple aspects of care coordination in the hospital from the perspective of healthcare professionals. Given the hectic work environment of healthcare professionals, and the increasing emphasis on collecting data for evaluation and improvement, it is important to minimize respondent burden. This effort was catalyzed by a multifaceted initiative to redesign acute care delivery and promote seamless transitions of care, supported by the Center for Medicare & Medicaid Innovation. In initial testing, this questionnaire has evidence for reliability and validity. It was encouraging to find that the preliminary psychometric performance of the measure was very similar in 2 different settings of a tertiary academic hospital and a community hospital.
Our analysis of the survey data explored potential differences between the 2 hospitals, among different types of healthcare professionals and across different departments. Although we expected differences, we had no specific hypotheses about what those differences might be, and, in fact, did not observe any substantial differences. This could be taken to indicate that the intervention was uniformly and successfully implemented in both hospitals, and engaged various professionals in different departments. The ability to detect differences in care coordination at the nursing unit level could also prove to be beneficial for more precisely targeting where process improvement is needed. Further data collection and analyses should be conducted to more systematically compare units and to help identify those where practice is most advanced and those where improvements may be needed. It would also be informative to link differences in care coordination scores with patient outcomes. In addition, differences identified on specific domains between professional groups could be helpful to identify where greater efforts are needed to improve interdisciplinary practice. Sampling strategies stratified by provider type would need to be targeted to make this kind of analysis informative.
The consistently lower scores observed for patient engagement, from the perspective of care professionals in all groups, suggest that this is an area where improvement is needed. These findings are consistent with published reports on the common failure by hospitals to include patients as a member of their own care team. In addition to measuring care processes from the perspective of frontline healthcare workers, future evaluations within the healthcare system would also benefit from including data collected from the perspective of the patient and family.
This study had some limitations. First, there may be more than 4 domains of care coordination that are important and can be measured in the acute care setting from provider perspective. However, the addition of more domains should be balanced against practicality and respondent burden. It may be possible to further clarify priority domains in hospital settings as opposed to the primary care setting. Future research should be directed to find these areas and to develop a more comprehensive, yet still concise measurement instrument. Second, the tool was developed to measure the impact of a large-scale intervention, and to fit into the specific context of 2 hospitals. Therefore, it should be tested in different settings of hospital care to see how it performs. However, virtually all hospitals in the United States today are adapting to changes in both financing and healthcare delivery. A tool such as the one described in this paper could be helpful to many organizations. Third, the scoring system for the overall scale score is not weighted and therefore reflects teamwork more than other components of care coordination, which are represented by fewer items. In general, we believe that use of the subscale scores may be more informative. Alternative scoring systems might also be proposed, including item weighting based on factor scores.
For the purposes of evaluation in this specific instance, we only collected data at a single point in time, after the intervention had been deployed. Thus, we were not able to evaluate the effectiveness of the J-CHiP intervention. We also did not intend to focus too much on the differences between units, given the limited number of respondents from individual units. It would be useful to collect more data at future time points, both to test the responsiveness of the scales and to evaluate the impact of future interventions at both the hospital and unit level.
The preliminary data from this study have generated insights about gaps in current practice, such as in engaging patients in the inpatient care process. It has also increased awareness by hospital leaders about the need to achieve high reliability in the adoption of new procedures and interdisciplinary practice. This tool might be used to find areas in need of improvement, to evaluate the effect of initiatives to improve care coordination, to monitor the change over time in the perception of care coordination among healthcare professionals, and to develop better intervention strategies for coordination activities in acute care settings. Additional research is needed to provide further evidence for the reliability and validity of this measure in diverse settings.
Disclosure
The project described was supported by Grant Number 1C1CMS331053-01-00 from the US Department of Health and Human Services, Centers for Medicare & Medicaid Services. The contents of this publication are solely the responsibility of the authors and do not necessarily represent the official views of the US Department of Health and Human Services or any of its agencies. The research presented was conducted by the awardee. Results may or may not be consistent with or confirmed by the findings of the independent evaluation contractor.
The authors have no other disclosures.
1. McDonald KM, Sundaram V, Bravata DM, et al. Closing the Quality Gap: A Critical Analysis of Quality Improvement Strategies (Vol. 7: Care Coordination). Technical Reviews, No. 9.7. Rockville (MD): Agency for Healthcare Research and Quality (US); 2007. PubMed
2. Adams K, Corrigan J. Priority areas for national action: transforming health care quality. Washington, DC: National Academies Press; 2003. PubMed
3. Renders CM, Valk GD, Griffin S, Wagner EH, Eijk JT, Assendelft WJ. Interventions to improve the management of diabetes mellitus in primary care, outpatient and community settings. Cochrane Database Syst Rev. 2001(1):CD001481. PubMed
4. McAlister FA, Lawson FM, Teo KK, Armstrong PW. A systematic review of randomized trials of disease management programs in heart failure. Am J Med. 2001;110(5):378-384. PubMed
5. Bruce ML, Raue PJ, Reilly CF, et al. Clinical effectiveness of integrating depression care management into medicare home health: the Depression CAREPATH Randomized trial. JAMA Intern Med. 2015;175(1):55-64. PubMed
6. Berkowitz SA, Brown P, Brotman DJ, et al. Case Study: Johns Hopkins Community Health Partnership: A model for transformation. Healthc (Amst). 2016;4(4):264-270. PubMed
7. McDonald. KM, Schultz. E, Albin. L, et al. Care Coordination Measures Atlas Version 4. Rockville, MD: Agency for Healthcare Research and Quality; 2014.
8 Schultz EM, Pineda N, Lonhart J, Davies SM, McDonald KM. A systematic review of the care coordination measurement landscape. BMC Health Serv Res. 2013;13:119. PubMed
9. Sexton JB, Helmreich RL, Neilands TB, et al. The Safety Attitudes Questionnaire: psychometric properties, benchmarking data, and emerging research. BMC Health Serv Res. 2006;6:44. PubMed
Care Coordination has been defined as “…the deliberate organization of patient care activities between two or more participants (including the patient) involved in a patient’s care to facilitate the appropriate delivery of healthcare services.”1 The Institute of Medicine identified care coordination as a key strategy to improve the American healthcare system,2 and evidence has been building that well-coordinated care improves patient outcomes and reduces healthcare costs associated with chronic conditions.3-5 In 2012, Johns Hopkins Medicine was awarded a Healthcare Innovation Award by the Centers for Medicare & Medicaid Services to improve coordination of care across the continuum of care for adult patients admitted to Johns Hopkins Hospital (JHH) and Johns Hopkins Bayview Medical Center (JHBMC), and for high-risk low-income Medicare and Medicaid beneficiaries receiving ambulatory care in targeted zip codes. The purpose of this project, known as the Johns Hopkins Community Health Partnership (J-CHiP), was to improve health and healthcare and to reduce healthcare costs. The acute care component of the program consisted of a bundle of interventions focused on improving coordination of care for all patients, including a “bridge to home” discharge process, as they transitioned back to the community from inpatient admission. The bundle included the following: early screening for discharge planning to predict needed postdischarge services; discussion in daily multidisciplinary rounds about goals and priorities of the hospitalization and potential postdischarge needs; patient and family self-care management; education enhanced medication management, including the option of “medications in hand” at the time of discharge; postdischarge telephone follow-up by nurses; and, for patients identified as high-risk, a “transition guide” (a nurse who works with the patient via home visits and by phone to optimize compliance with care for 30 days postdischarge).6 While the primary endpoints of the J-CHiP program were to improve clinical outcomes and reduce healthcare costs, we were also interested in the impact of the program on care coordination processes in the acute care setting. This created the need for an instrument to measure healthcare professionals’ views of care coordination in their immediate work environments.
We began our search for existing measures by reviewing the Coordination Measures Atlas published in 2014.7 Although this report evaluates over 80 different measures of care coordination, most of them focus on the perspective of the patient and/or family members, on specific conditions, and on primary care or outpatient settings.7,8 We were unable to identify an existing measure from the provider perspective, designed for the inpatient setting, that was both brief but comprehensive enough to cover a range of care coordination domains.8
Consequently, our first aim was to develop a brief, comprehensive tool to measure care coordination from the perspective of hospital inpatient staff that could be used to compare different units or types of providers, or to conduct longitudinal assessment. The second aim was to conduct a preliminary evaluation of the tool in our healthcare setting, including to assess its psychometric properties, to describe provider perceptions of care coordination after the implementation of J-CHiP, and to explore potential differences among departments, types of professionals, and between the 2 hospitals.
METHODS
Development of the Care Coordination Questionnaire
The survey was developed in collaboration with leaders of the J-CHiP Acute Care Team. We met at the outset and on multiple subsequent occasions to align survey domains with the main components of the J-CHiP acute care intervention and to assure that the survey would be relevant and understandable to a variety of multidisciplinary professionals, including physicians, nurses, social workers, physical therapists, and other health professionals. Care was taken to avoid redundancy with existing evaluation efforts and to minimize respondent burden. This process helped to ensure the content validity of the items, the usefulness of the results, and the future usability of the tool.
We modeled the Care Coordination Questionnaire (CCQ) after the Safety Attitudes Questionnaire (SAQ),9 a widely used survey that is deployed approximately annually at JHH and JHBMC. While the SAQ focuses on healthcare provider attitudes about issues relevant to patient safety (often referred to as safety climate or safety culture), this new tool was designed to focus on healthcare professionals’ attitudes about care coordination. Similar to the way that the SAQ “elicits a snapshot of the safety climate through surveys of frontline worker perceptions,” we sought to elicit a picture of our care coordination climate through a survey of frontline hospital staff.
The CCQ was built upon the domains and approaches to care coordination described in the Agency for Healthcare Research and Quality Care Coordination Atlas.3 This report identifies 9 mechanisms for achieving care coordination, including the following: Establish Accountability or Negotiate Responsibility; Communicate; Facilitate Transitions; Assess Needs and Goals; Create a Proactive Plan of Care; Monitor, Follow Up, and Respond to Change; Support Self-Management Goals; Link to Community Resources; and Align Resources with Patient and Population Needs; as well as 5 broad approaches commonly used to improve the delivery of healthcare, including Teamwork Focused on Coordination, Healthcare Home, Care Management, Medication Management, and Health IT-Enabled Coordination.7 We generated at least 1 item to represent 8 of the 9 domains, as well as the broad approach described as Teamwork Focused on Coordination. After developing an initial set of items, we sought input from 3 senior leaders of the J-CHiP Acute Care Team to determine if the items covered the care coordination domains of interest, and to provide feedback on content validity. To test the interpretability of survey items and consistency across professional groups, we sent an initial version of the survey questions to at least 1 person from each of the following professional groups: hospitalist, social worker, case manager, clinical pharmacist, and nurse. We asked them to review all of our survey questions and to provide us with feedback on all aspects of the questions, such as whether they believed the questions were relevant and understandable to the members of their professional discipline, the appropriateness of the wording of the questions, and other comments. Modifications were made to the content and wording of the questions based on the feedback received. The final draft of the questionnaire was reviewed by the leadership team of the J-CHiP Acute Care Team to ensure its usefulness in providing actionable information.
The resulting 12-item questionnaire used a 5-point Likert response scale ranging from 1 = “disagree strongly” to 5 = “agree strongly,” and an additional option of “not applicable (N/A).” To help assess construct validity, a global question was added at the end of the questionnaire asking, “Overall, how would you rate the care coordination at the hospital of your primary work setting?” The response was measured on a 10-point Likert-type scale ranging from 1 = “totally uncoordinated care” to 10 = “perfectly coordinated care” (see Appendix). In addition, the questionnaire requested information about the respondents’ gender, position, and their primary unit, department, and hospital affiliation.
Data Collection Procedures
An invitation to complete an anonymous questionnaire was sent to the following inpatient care professionals: all nursing staff working on care coordination units in the departments of medicine, surgery, and neurology/neurosurgery, as well as physicians, pharmacists, acute care therapists (eg, occupational and physical therapists), and other frontline staff. All healthcare staff fitting these criteria was sent an e-mail with a request to fill out the survey online using QualtricsTM (Qualtrics Labs Inc., Provo, UT), as well as multiple follow-up reminders. The participants worked either at the JHH (a 1194-bed tertiary academic medical center in Baltimore, MD) or the JHBMC (a 440-bed academic community hospital located nearby). Data were collected from October 2015 through January 2016.
Analysis
Means and standard deviations were calculated by treating the responses as continuous variables. We tried 3 different methods to handle missing data: (1) without imputation, (2) imputing the mean value of each item, and (3) substituting a neutral score. Because all 3 methods produced very similar results, we treated the N/A responses as missing values without imputation for simplicity of analysis. We used STATA 13.1 (Stata Corporation, College Station, Texas) to analyze the data.
To identify subscales, we performed exploratory factor analysis on responses to the 12 specific items. Promax rotation was selected based on the simple structure. Subscale scores for each respondent were generated by computing the mean of responses to the items in the subscale. Internal consistency reliability of the subscales was estimated using Cronbach’s alpha. We calculated Pearson correlation coefficients for the items in each subscale, and examined Cronbach’s alpha deleting each item in turn. For each of the subscales identified and the global scale, we calculated the mean, standard deviation, median and interquartile range. Although distributions of scores tended to be non-normal, this was done to increase interpretability. We also calculated percent scoring at the ceiling (highest possible score).
We analyzed the data with 3 research questions in mind: Was there a difference in perceptions of care coordination between (1) staff affiliated with the 2 different hospitals, (2) staff affiliated with different clinical departments, or (3) staff with different professional roles? For comparisons based on hospital and department, and type of professional, nonparametric tests (Wilcoxon rank-sum and Kruskal-Wallis test) were used with a level of statistical significance set at 0.05. The comparison between hospitals and departments was made only among nurses to minimize the confounding effect of different distribution of professionals. We tested the distribution of “years in specialty” between hospitals and departments for this comparison using Pearson’s χ2 test. The difference was not statistically significant (P = 0.167 for hospitals, and P = 0.518 for departments), so we assumed that the potential confounding effect of this variable was negligible in this analysis. The comparison of scores within each professional group used the Friedman test. Pearson’s χ2 test was used to compare the baseline characteristics between 2 hospitals.
RESULTS
Among the 1486 acute care professionals asked to participate in the survey, 841 completed the questionnaire (response rate 56.6%). Table 1 shows the characteristics of the participants from each hospital. Table 2 summarizes the item response rates, proportion scoring at the ceiling, and weighting from the factor analysis. All items had completion rates of 99.2% or higher, with N/A responses ranging from 0% (item 2) to 3.1% (item 7). The percent scoring at the ceiling was 1.7% for the global item and ranged from 18.3% up to 63.3% for other individual items.
We also examined differences in perceptions of care coordination among nursing units to illustrate the tool’s ability to detect variation in Patient Engagement subscale scores for JHH nurses (see Appendix).
DISCUSSION
This study resulted in one of the first measurement tools to succinctly measure multiple aspects of care coordination in the hospital from the perspective of healthcare professionals. Given the hectic work environment of healthcare professionals, and the increasing emphasis on collecting data for evaluation and improvement, it is important to minimize respondent burden. This effort was catalyzed by a multifaceted initiative to redesign acute care delivery and promote seamless transitions of care, supported by the Center for Medicare & Medicaid Innovation. In initial testing, this questionnaire has evidence for reliability and validity. It was encouraging to find that the preliminary psychometric performance of the measure was very similar in 2 different settings of a tertiary academic hospital and a community hospital.
Our analysis of the survey data explored potential differences between the 2 hospitals, among different types of healthcare professionals and across different departments. Although we expected differences, we had no specific hypotheses about what those differences might be, and, in fact, did not observe any substantial differences. This could be taken to indicate that the intervention was uniformly and successfully implemented in both hospitals, and engaged various professionals in different departments. The ability to detect differences in care coordination at the nursing unit level could also prove to be beneficial for more precisely targeting where process improvement is needed. Further data collection and analyses should be conducted to more systematically compare units and to help identify those where practice is most advanced and those where improvements may be needed. It would also be informative to link differences in care coordination scores with patient outcomes. In addition, differences identified on specific domains between professional groups could be helpful to identify where greater efforts are needed to improve interdisciplinary practice. Sampling strategies stratified by provider type would need to be targeted to make this kind of analysis informative.
The consistently lower scores observed for patient engagement, from the perspective of care professionals in all groups, suggest that this is an area where improvement is needed. These findings are consistent with published reports on the common failure by hospitals to include patients as a member of their own care team. In addition to measuring care processes from the perspective of frontline healthcare workers, future evaluations within the healthcare system would also benefit from including data collected from the perspective of the patient and family.
This study had some limitations. First, there may be more than 4 domains of care coordination that are important and can be measured in the acute care setting from provider perspective. However, the addition of more domains should be balanced against practicality and respondent burden. It may be possible to further clarify priority domains in hospital settings as opposed to the primary care setting. Future research should be directed to find these areas and to develop a more comprehensive, yet still concise measurement instrument. Second, the tool was developed to measure the impact of a large-scale intervention, and to fit into the specific context of 2 hospitals. Therefore, it should be tested in different settings of hospital care to see how it performs. However, virtually all hospitals in the United States today are adapting to changes in both financing and healthcare delivery. A tool such as the one described in this paper could be helpful to many organizations. Third, the scoring system for the overall scale score is not weighted and therefore reflects teamwork more than other components of care coordination, which are represented by fewer items. In general, we believe that use of the subscale scores may be more informative. Alternative scoring systems might also be proposed, including item weighting based on factor scores.
For the purposes of evaluation in this specific instance, we only collected data at a single point in time, after the intervention had been deployed. Thus, we were not able to evaluate the effectiveness of the J-CHiP intervention. We also did not intend to focus too much on the differences between units, given the limited number of respondents from individual units. It would be useful to collect more data at future time points, both to test the responsiveness of the scales and to evaluate the impact of future interventions at both the hospital and unit level.
The preliminary data from this study have generated insights about gaps in current practice, such as in engaging patients in the inpatient care process. It has also increased awareness by hospital leaders about the need to achieve high reliability in the adoption of new procedures and interdisciplinary practice. This tool might be used to find areas in need of improvement, to evaluate the effect of initiatives to improve care coordination, to monitor the change over time in the perception of care coordination among healthcare professionals, and to develop better intervention strategies for coordination activities in acute care settings. Additional research is needed to provide further evidence for the reliability and validity of this measure in diverse settings.
Disclosure
The project described was supported by Grant Number 1C1CMS331053-01-00 from the US Department of Health and Human Services, Centers for Medicare & Medicaid Services. The contents of this publication are solely the responsibility of the authors and do not necessarily represent the official views of the US Department of Health and Human Services or any of its agencies. The research presented was conducted by the awardee. Results may or may not be consistent with or confirmed by the findings of the independent evaluation contractor.
The authors have no other disclosures.
1. McDonald KM, Sundaram V, Bravata DM, et al. Closing the Quality Gap: A Critical Analysis of Quality Improvement Strategies (Vol. 7: Care Coordination). Technical Reviews, No. 9.7. Rockville (MD): Agency for Healthcare Research and Quality (US); 2007. PubMed
2. Adams K, Corrigan J. Priority areas for national action: transforming health care quality. Washington, DC: National Academies Press; 2003. PubMed
3. Renders CM, Valk GD, Griffin S, Wagner EH, Eijk JT, Assendelft WJ. Interventions to improve the management of diabetes mellitus in primary care, outpatient and community settings. Cochrane Database Syst Rev. 2001(1):CD001481. PubMed
4. McAlister FA, Lawson FM, Teo KK, Armstrong PW. A systematic review of randomized trials of disease management programs in heart failure. Am J Med. 2001;110(5):378-384. PubMed
5. Bruce ML, Raue PJ, Reilly CF, et al. Clinical effectiveness of integrating depression care management into medicare home health: the Depression CAREPATH Randomized trial. JAMA Intern Med. 2015;175(1):55-64. PubMed
6. Berkowitz SA, Brown P, Brotman DJ, et al. Case Study: Johns Hopkins Community Health Partnership: A model for transformation. Healthc (Amst). 2016;4(4):264-270. PubMed
7. McDonald. KM, Schultz. E, Albin. L, et al. Care Coordination Measures Atlas Version 4. Rockville, MD: Agency for Healthcare Research and Quality; 2014.
8 Schultz EM, Pineda N, Lonhart J, Davies SM, McDonald KM. A systematic review of the care coordination measurement landscape. BMC Health Serv Res. 2013;13:119. PubMed
9. Sexton JB, Helmreich RL, Neilands TB, et al. The Safety Attitudes Questionnaire: psychometric properties, benchmarking data, and emerging research. BMC Health Serv Res. 2006;6:44. PubMed
© 2017 Society of Hospital Medicine
Associations of Physician Empathy with Patient Anxiety and Ratings of Communication in Hospital Admission Encounters
Admission to a hospital can be a stressful event,1,2 and patients report having many concerns at the time of hospital admission.3 Over the last 20 years, the United States has widely adopted the hospitalist model of inpatient care. Although this model has clear benefits, it also has the potential to contribute to patient stress, as hospitalized patients generally lack preexisting relationships with their inpatient physicians.4,5 In this changing hospital environment, defining and promoting effective medical communication has become an essential goal of both individual practitioners and medical centers.
Successful communication and strong therapeutic relationships with physicians support patients’ coping with illness-associated stress6,7 as well as promote adherence to medical treatment plans.8 Empathy serves as an important building block of patient-centered communication and encourages a strong therapeutic alliance.9 Studies from primary care, oncology, and intensive care unit (ICU) settings indicate that physician empathy is associated with decreased emotional distress,10,11 improved ratings of communication,12 and even better medical outcomes.13
Prior work has shown that hospitalists, like other clinicians, underutilize empathy as a tool in their daily interactions with patients.14-16 Our prior qualitative analysis of audio-recorded hospitalist-patient admission encounters indicated that how hospitalists respond to patient expressions of negative emotion influences relationships with patients and alignment around care plans.17 To determine whether empathic communication is associated with patient-reported outcomes in the hospitalist model, we quantitatively analyzed coded admission encounters and survey data to examine the association between hospitalists’ responses to patient expressions of negative emotion (anxiety, sadness, and anger) and patient anxiety and ratings of communication. Given the often-limited time hospitalists have to complete admission encounters, we also examined the association between response to emotion and encounter length.
METHODS
We analyzed data collected as part of an observational study of hospitalist-patient communication during hospital admission encounters14 to assess the association between the way physicians responded to patient expressions of negative emotion and patient anxiety, ratings of communication in the encounter, and encounter length. We collected data between August 2008 and March 2009 on the general medical service at 2 urban hospitals that are part of an academic medical center. Participants were attending hospitalists (not physician trainees), and patients admitted under participating hospitalists’ care who were able to communicate verbally in English and provide informed consent for the study. The institutional review board at the University of California, San Francisco approved the study; physician and patient participants provided written informed consent.
Enrollment and data collection has been described previously.17 Our cohort for this analysis included 76 patients of 27 physicians who completed encounter audio recordings and pre- and postencounter surveys. Following enrollment, patients completed a preencounter survey to collect demographic information and to measure their baseline anxiety via the State Anxiety Scale (STAI-S), which assesses transient anxious mood using 20 items answered on a 4-point scale for a final score range of 20 to 80.10,18,19 We timed and audio-recorded admission encounters. Encounter recordings were obtained solely from patient interactions with attending hospitalists and did not take into account the time patients may have spent with other physicians, including trainees. After the encounter, patients completed postencounter surveys, which included the STAI-S and patients’ ratings of communication during the encounter. To rate communication, patients responded to 7 items on a 0- to 10-point scale that were derived from previous work (Table 1)12,20,21; the anchors were “not at all” and “completely.” To identify patients with serious illness, which we used as a covariate in regression models, we asked physicians on a postencounter survey whether or not they “would be surprised by this patient’s death or admission to the ICU in the next year.”22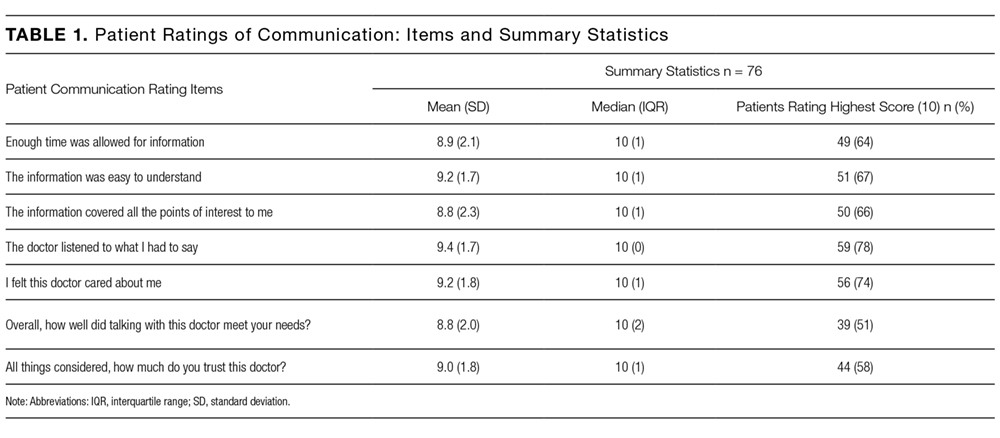
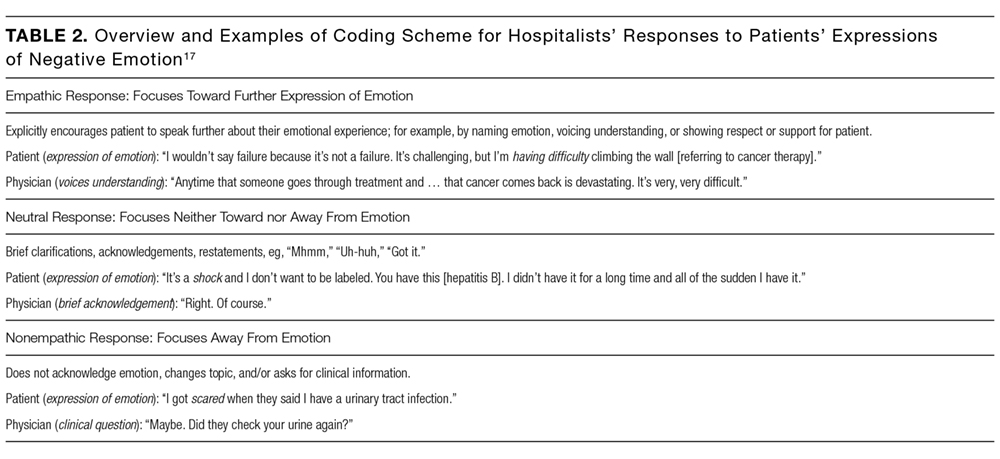
We considered physician as a clustering variable in the calculation of robust standard errors for all models. In addition, we included in each model covariates that were associated with the outcome at P ≤ 0.10, including patient gender, patient age, serious illness,22 preencounter anxiety, encounter length, and hospital. We considered P values < 0.05 to be statistically significant. We used Stata SE 13 (StataCorp LLC, College Station, TX) for all statistical analyses.
RESULTS

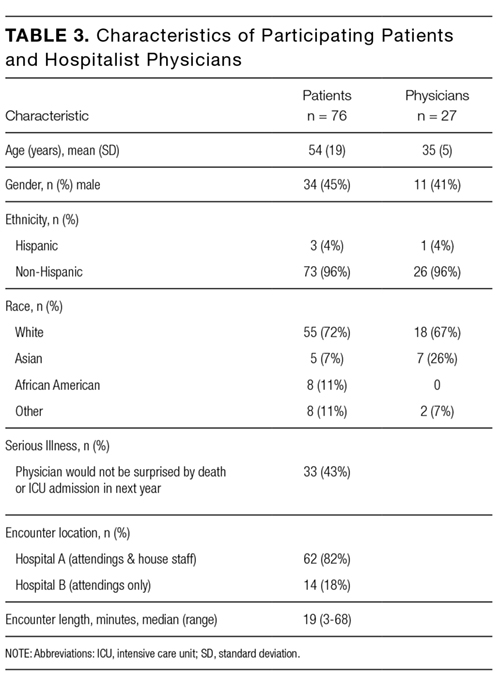
We analyzed data from admission encounters with 76 patients (consent rate 63%) and 27 hospitalists (consent rate 91%). Their characteristics are shown in Table 3. Median encounter length was 19 minutes (mean 21 minutes, range 3-68). Patients expressed negative emotion in 190 instances across all encounters; median number of expressions per encounter was 1 (range 0-14). Hospitalists responded empathically to 32% (n = 61) of the patient expressions, neutrally to 43% (n = 81), and nonempathically to 25% (n = 48).
The STAI-S was normally distributed. The mean preencounter STAI-S score was 39 (standard deviation [SD] 8.9). Mean postencounter STAI-S score was 38 (SD 10.7). Mean change in anxiety over the course of the encounter, calculated as the postencounter minus preencounter mean was −1.2 (SD 7.6). Table 1 shows summary statistics for the patient ratings of communication items. All items were rated highly. Across the items, between 51% and 78% of patients rated the highest score of 10.
Across the range of frequencies of emotional expressions per encounter in our data set (0-14 expressions), each additional empathic hospitalist response was associated with a 1.65-point decrease in the STAI-S (95% confidence interval [CI], 0.48-2.82). We did not find significant associations between changes in the STAI-S and the number of neutral hospitalist responses (−0.65 per response; 95% CI, −1.67-0.37) or nonempathic hospitalist responses (0.61 per response; 95% CI, −0.88-2.10).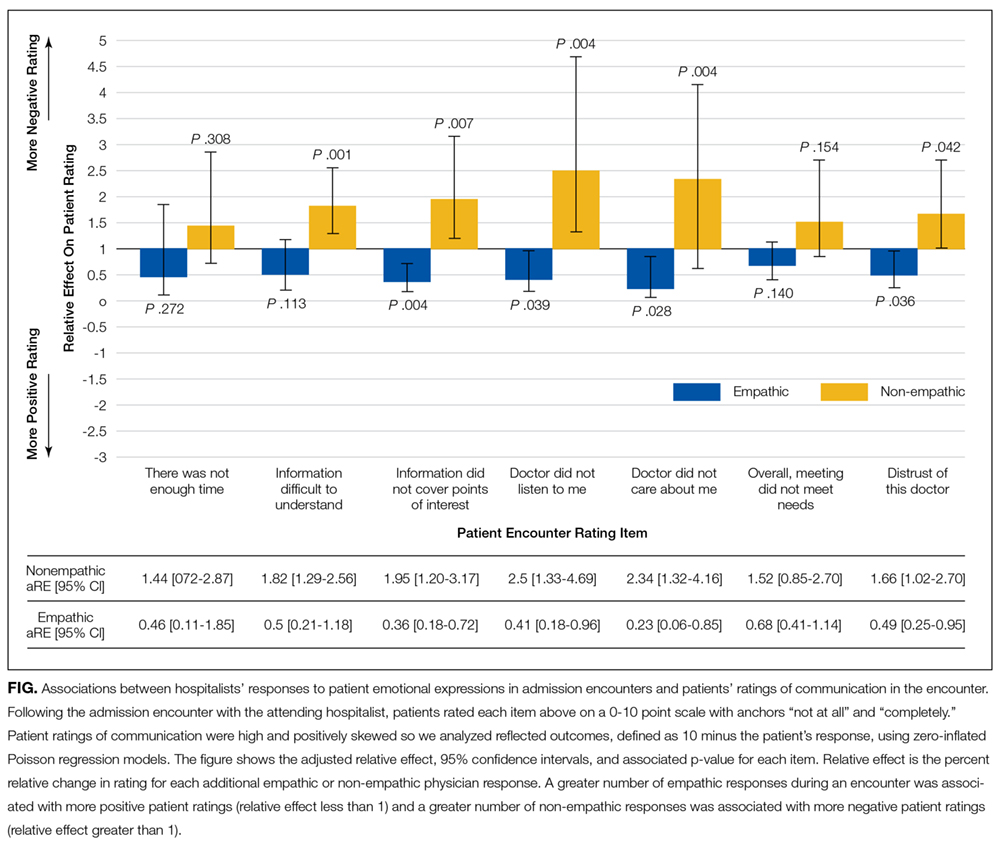
In addition, nonempathic responses were associated with more negative ratings of communication for 5 of the 7 items: ease of understanding information, covering points of interest, the doctor listening, the doctor caring, and trusting the doctor. For example, for the item “I felt this doctor cared about me,” each nonempathic hospitalist response was associated with a more than doubling of negative patient ratings (aRE: 2.3; 95% CI, 1.32-4.16). Neutral physician responses to patient expressions of negative emotion were associated with less negative patient ratings for 2 of the items: covering points of interest (aRE 0.68; 95% CI, 0.51-0.90) and trusting the doctor (aRE: 0.86; 95% CI, 0.75-0.99).
We did not find a statistical association between encounter length and the number of empathic hospitalist responses in the encounter (percent change in encounter length per response [PC]: 1%; 95% CI, −8%-10%) or the number of nonempathic responses (PC: 18%; 95% CI, −2%-42%). We did find a statistically significant association between the number of neutral responses and encounter length (PC: 13%; 95% CI, 3%-24%), corresponding to 2.5 minutes of additional encounter time per neutral response for the median encounter length of 19 minutes.
DISCUSSION
Our study set out to measure how hospitalists responded to expressions of negative emotion during admission encounters with patients and how those responses correlated with patient anxiety, ratings of communication, and encounter length. We found that empathic responses were associated with diminishing patient anxiety after the visit, as well as with better ratings of several domains of hospitalist communication. Moreover, nonempathic responses to negative emotion were associated with more strongly negative ratings of hospitalist communication. Finally, while clinicians may worry that encouraging patients to speak further about emotion will result in excessive visit lengths, we did not find a statistical association between empathic responses and encounter duration. To our knowledge, this is the first study to indicate an association between empathy and patient anxiety and communication ratings within the hospitalist model, which is rapidly becoming the predominant model for providing inpatient care in the United States.4,5
As in oncologic care, anxiety is an emotion commonly confronted by clinicians meeting admitted medical patients for the first time. Studies show that not only do patient anxiety levels remain high throughout a hospital course, patients who experience higher levels of anxiety tend to stay longer in the hospital.1,2,27-30 But unlike oncologic care or other therapy provided in an outpatient setting, the hospitalist model does not facilitate “continuity” of care, or the ability to care for the same patients over a long period of time. This reality of inpatient care makes rapid, effective rapport-building critical to establishing strong physician-patient relationships. In this setting, a simple communication tool that is potentially able to reduce inpatients’ anxiety could have a meaningful impact on hospitalist-provided care and patient outcomes.
In terms of the magnitude of the effect of empathic responses, the clinical significance of a 1.65-point decrease in the STAI-S anxiety score is not precisely clear. A prior study that examined the effect of music therapy on anxiety levels in patients with cancer found an average anxiety reduction of approximately 9.5 units on the STAIS-S scale after sensitivity analysis, suggesting a rather large meaningful effect size.31 Given we found a reduction of 1.65 points for each empathic response, however, with a range of 0-14 negative emotions expressed over a median 19-minute encounter, there is opportunity for hospitalists to achieve a clinically significant decrease in patient anxiety during an admission encounter. The potential to reduce anxiety is extended further when we consider that the impact of an empathic response may apply not just to the admission encounter alone but also to numerous other patient-clinician interactions over the course of a hospitalization.
A healthy body of communication research supports the associations we found in our study between empathy and patient ratings of communication and physicians. Families in ICU conferences rate communication more positively when physicians express empathy,12 and a number of studies indicate an association between empathy and patient satisfaction in outpatient settings.8 Given the associations we found with negative ratings on the items in our study, promoting empathic responses to expressions of emotion and, more importantly, stressing avoidance of nonempathic responses may be relevant efforts in working to improve patient satisfaction scores on surveys reporting “top box” percentages, such as Hospital Consumer Assessment of Healthcare Providers and Systems (HCAHPS). More notably, evidence indicates that empathy has positive impacts beyond satisfaction surveys, such as adherence, better diagnostic and clinical outcomes, and strengthening of patient enablement.8Not all hospitalist responses to emotion were associated with patient ratings across the 7 communication items we assessed. For example, we did not find an association between how physicians responded to patient expressions of negative emotion and patient perception that enough time was spent in the visit or the degree to which talking with the doctor met a patient’s overall needs. It follows logically, and other research supports, that empathy would influence patient ratings of physician caring and trust,32 whereas other communication factors we were unable to measure (eg, physician body language, tone, and use of jargon and patient health literacy and primary language) may have a more significant association with patient ratings of the other items we assessed.
In considering the clinical application of our results, it is important to note that communication skills, including responding empathically to patient expressions of negative emotion, can be imparted through training in the same way as abdominal examination or electrocardiogram interpretation skills.33-35 However, training of hospitalists in communication skills requires time and some financial investment on the part of the physician, their hospital or group, or, ideally, both. Effective training methods, like those for other skill acquisition, involve learner-centered teaching and practicing skills with role-play and feedback.36 Given the importance of a learner-centered approach, learning would likely be better received and more effective if it was tailored to the specific needs and patient scenarios commonly encountered by hospitalist physicians. As these programs are developed, it will be important to assess the impact of any training on the patient-reported outcomes we assessed in this observational study, along with clinical outcomes.
Our study has several limitations. First, we were only able to evaluate whether hospitalists verbally responded to patient emotion and were thus not able to account for nonverbal empathy such as facial expressions, body language, or voice tone. Second, given our patient consent rate of 63%, patients who agreed to participate in the study may have had different opinions than those who declined to participate. Also, hospitalists and patients may have behaved differently as a result of being audio recorded. We only included patients who spoke English, and our patient population was predominately non-Hispanic white. Patients who spoke other languages or came from other cultural backgrounds may have had different responses. Third, we did not use a single validated scale for patient ratings of communication, and multiple analyses increase our risk of finding statistically significant associations by chance. The skewing of the communication rating items toward high scores may also have led to our results being driven by outliers, although the model we chose for analysis does penalize for this. Furthermore, our sample size was small, leading to wide CIs and potential for lack of statistical associations due to insufficient power. Our findings warrant replication in larger studies. Fourth, the setting of our study in an academic center may affect generalizability. Finally, the age of our data (collected between 2008 and 2009) is also a limitation. Given a recent focus on communication and patient experience since the initiation of HCAHPS feedback, a similar analysis of empathy and communication methods now may result in different outcomes.
In conclusion, our results suggest that enhancing hospitalists’ empathic responses to patient expressions of negative emotion could decrease patient anxiety and improve patients’ perceptions of (and thus possibly their relationships with) hospitalists, without sacrificing efficiency. Future work should focus on tailoring and implementing communication skills training programs for hospitalists and evaluating the impact of training on patient outcomes.
Acknowledgments
The authors extend their sincere thanks to the patients and physicians who participated in this study. Dr. Anderson was funded by the National Palliative Care Research Center and the University of California, San Francisco Clinical and Translational Science Institute Career Development Program, National Institutes of Health (NIH) grant number 5 KL2 RR024130-04. Project costs were funded by a grant from the University of California, San Francisco Academic Senate.
Disclosure
All coauthors have seen and agree with the contents of this manuscript. This submission is not under review by any other publication. Wendy Anderson received funding for this project from the National Palliative Care Research Center, University of California San Francisco Clinical and Translational Science Institute (NIH grant number 5KL2RR024130-04), and the University of San Francisco Academic Senate [From Section 2 of Author Disclosure Form]. Andy Auerbach has a Patient-Centered Outcomes Research Institute research grant in development [From Section 3 of the Author Disclosure Form].
1. Walker FB, Novack DH, Kaiser DL, Knight A, Oblinger P. Anxiety and depression among medical and surgical patients nearing hospital discharge. J Gen Intern Med. 1987;2(2):99-101. PubMed
2. Castillo MI, Cooke M, Macfarlane B, Aitken LM. Factors associated with anxiety in critically ill patients: A prospective observational cohort study. Int J Nurs Stud. 2016;60:225-233. PubMed
3. Anderson WG, Winters K, Auerbach AD. Patient concerns at hospital admission. Arch Intern Med. 2011;171(15):1399-1400. PubMed
4. Kuo Y-F, Sharma G, Freeman JL, Goodwin JS. Growth in the care of older patients by hospitalists in the United States. N Engl J Med. 2009;360(11):1102-1112. PubMed
5. Wachter RM, Goldman L. Zero to 50,000 - The 20th Anniversary of the Hospitalist. N Engl J Med. 2016;375(11):1009-1011. PubMed
6. Mack JW, Block SD, Nilsson M, et al. Measuring therapeutic alliance between oncologists and patients with advanced cancer: the Human Connection Scale. Cancer. 2009;115(14):3302-3311. PubMed
7. Huff NG, Nadig N, Ford DW, Cox CE. Therapeutic Alliance between the Caregivers of Critical Illness Survivors and Intensive Care Unit Clinicians. [published correction appears in Ann Am Thorac Soc. 2016;13(4):576]. Ann Am Thorac Soc. 2015;12(11):1646-1653. PubMed
8. Derksen F, Bensing J, Lagro-Janssen A. Effectiveness of empathy in general practice: a systematic review. Br J Gen Pract. 2013;63(606):e76-e84. PubMed
9. Dwamena F, Holmes-Rovner M, Gaulden CM, et al. Interventions for providers to promote a patient-centred approach in clinical consultations. Cochrane Database Syst Rev. 2012;12:CD003267. PubMed
10. Fogarty LA, Curbow BA, Wingard JR, McDonnell K, Somerfield MR. Can 40 seconds of compassion reduce patient anxiety? J Clin Oncol. 1999;17(1):371-379. PubMed
11. Roter DL, Hall JA, Kern DE, Barker LR, Cole KA, Roca RP. Improving physicians’ interviewing skills and reducing patients’ emotional distress. A randomized clinical trial. Arch Intern Med. 1995;155(17):1877-1884. PubMed
12. Stapleton RD, Engelberg RA, Wenrich MD, Goss CH, Curtis JR. Clinician statements and family satisfaction with family conferences in the intensive care unit. Crit Care Med. 2006;34(6):1679-1685. PubMed
13. Hojat M, Louis DZ, Markham FW, Wender R, Rabinowitz C, Gonnella JS. Physicians’ empathy and clinical outcomes for diabetic patients. Acad Med. 2011;86(3):359-364. PubMed
14. Anderson WG, Winters K, Arnold RM, Puntillo KA, White DB, Auerbach AD. Studying physician-patient communication in the acute care setting: the hospitalist rapport study. Patient Educ Couns. 2011;82(2):275-279. PubMed
15. Pollak KI, Arnold RM, Jeffreys AS, et al. Oncologist communication about emotion during visits with patients with advanced cancer. J Clin Oncol. 2007;25(36):5748-5752. PubMed
16. Suchman AL, Markakis K, Beckman HB, Frankel R. A model of empathic communication in the medical interview. JAMA. 1997;277(8):678-682. PubMed
17. Adams K, Cimino JEW, Arnold RM, Anderson WG. Why should I talk about emotion? Communication patterns associated with physician discussion of patient expressions of negative emotion in hospital admission encounters. Patient Educ Couns. 2012;89(1):44-50. PubMed
18. Julian LJ. Measures of anxiety: State-Trait Anxiety Inventory (STAI), Beck Anxiety Inventory (BAI), and Hospital Anxiety and Depression Scale-Anxiety (HADS-A). Arthritis Care Res (Hoboken). 2011;63 Suppl 11:S467-S472. PubMed
19. Speilberger C, Ritterband L, Sydeman S, Reheiser E, Unger K. Assessment of emotional states and personality traits: measuring psychological vital signs. In: Butcher J, editor. Clinical personality assessment: practical approaches. New York: Oxford University Press; 1995.
20. Safran DG, Kosinski M, Tarlov AR, et al. The Primary Care Assessment Survey: tests of data quality and measurement performance. Med Care. 1998;36(5):728-739. PubMed
21. Azoulay E, Pochard F, Kentish-Barnes N, et al. Risk of post-traumatic stress symptoms in family members of intensive care unit patients. Am J Respir Crit Care Med. 2005;171(9):987-994. PubMed
22. Lynn J. Perspectives on care at the close of life. Serving patients who may die soon and their families: the role of hospice and other services. JAMA. 2001;285(7):925-932. PubMed
23. Kennifer SL, Alexander SC, Pollak KI, et al. Negative emotions in cancer care: do oncologists’ responses depend on severity and type of emotion? Patient Educ Couns. 2009;76(1):51-56. PubMed
24. Butow PN, Brown RF, Cogar S, Tattersall MHN, Dunn SM. Oncologists’ reactions to cancer patients’ verbal cues. Psychooncology. 2002;11(1):47-58. PubMed
25. Levinson W, Gorawara-Bhat R, Lamb J. A study of patient clues and physician responses in primary care and surgical settings. JAMA. 2000;284(8):1021-1027. PubMed
26. Cohen J. A coefficient of agreement for nominal scales. Educ Psychol Meas. 1960;20(1):37-46.
27. Fulop G. Anxiety disorders in the general hospital setting. Psychiatr Med. 1990;8(3):187-195. PubMed
28. Gerson S, Mistry R, Bastani R, et al. Symptoms of depression and anxiety (MHI) following acute medical/surgical hospitalization and post-discharge psychiatric diagnoses (DSM) in 839 geriatric US veterans. Int J Geriatr Psychiatry. 2004;19(12):1155-1167. PubMed
29. Kathol RG, Wenzel RP. Natural history of symptoms of depression and anxiety during inpatient treatment on general medicine wards. J Gen Intern Med. 1992;7(3):287-293. PubMed
30. Unsal A, Unaldi C, Baytemir C. Anxiety and depression levels of inpatients in the city centre of Kirşehir in Turkey. Int J Nurs Pract. 2011;17(4):411-418. PubMed
31. Bradt J, Dileo C, Grocke D, Magill L. Music interventions for improving psychological and physical outcomes in cancer patients. [Update appears in Cochrane Database Syst Rev. 2016;(8):CD006911] Cochrane Database Syst Rev. 2011;(8):CD006911. PubMed
32. Kim SS, Kaplowitz S, Johnston MV. The effects of physician empathy on patient satisfaction and compliance. Eval Health Prof. 2004;27(3):237-251. PubMed
33. Tulsky JA, Arnold RM, Alexander SC, et al. Enhancing communication between oncologists and patients with a computer-based training program: a randomized trial. Ann Intern Med. 2011;155(9):593-601. PubMed
34. Bays AM, Engelberg RA, Back AL, et al. Interprofessional communication skills training for serious illness: evaluation of a small-group, simulated patient intervention. J Palliat Med. 2014;17(2):159-166. PubMed
35. Epstein RM, Duberstein PR, Fenton JJ, et al. Effect of a Patient-Centered Communication Intervention on Oncologist-Patient Communication, Quality of Life, and Health Care Utilization in Advanced Cancer: The VOICE Randomized Clinical Trial. JAMA Oncol. 2017;3(1):92-100. PubMed
36. Berkhof M, van Rijssen HJ, Schellart AJM, Anema JR, van der Beek AJ. Effective training strategies for teaching communication skills to physicians: an overview of systematic reviews. Patient Educ Couns. 2011;84(2):152-162. PubMed
Admission to a hospital can be a stressful event,1,2 and patients report having many concerns at the time of hospital admission.3 Over the last 20 years, the United States has widely adopted the hospitalist model of inpatient care. Although this model has clear benefits, it also has the potential to contribute to patient stress, as hospitalized patients generally lack preexisting relationships with their inpatient physicians.4,5 In this changing hospital environment, defining and promoting effective medical communication has become an essential goal of both individual practitioners and medical centers.
Successful communication and strong therapeutic relationships with physicians support patients’ coping with illness-associated stress6,7 as well as promote adherence to medical treatment plans.8 Empathy serves as an important building block of patient-centered communication and encourages a strong therapeutic alliance.9 Studies from primary care, oncology, and intensive care unit (ICU) settings indicate that physician empathy is associated with decreased emotional distress,10,11 improved ratings of communication,12 and even better medical outcomes.13
Prior work has shown that hospitalists, like other clinicians, underutilize empathy as a tool in their daily interactions with patients.14-16 Our prior qualitative analysis of audio-recorded hospitalist-patient admission encounters indicated that how hospitalists respond to patient expressions of negative emotion influences relationships with patients and alignment around care plans.17 To determine whether empathic communication is associated with patient-reported outcomes in the hospitalist model, we quantitatively analyzed coded admission encounters and survey data to examine the association between hospitalists’ responses to patient expressions of negative emotion (anxiety, sadness, and anger) and patient anxiety and ratings of communication. Given the often-limited time hospitalists have to complete admission encounters, we also examined the association between response to emotion and encounter length.
METHODS
We analyzed data collected as part of an observational study of hospitalist-patient communication during hospital admission encounters14 to assess the association between the way physicians responded to patient expressions of negative emotion and patient anxiety, ratings of communication in the encounter, and encounter length. We collected data between August 2008 and March 2009 on the general medical service at 2 urban hospitals that are part of an academic medical center. Participants were attending hospitalists (not physician trainees), and patients admitted under participating hospitalists’ care who were able to communicate verbally in English and provide informed consent for the study. The institutional review board at the University of California, San Francisco approved the study; physician and patient participants provided written informed consent.
Enrollment and data collection has been described previously.17 Our cohort for this analysis included 76 patients of 27 physicians who completed encounter audio recordings and pre- and postencounter surveys. Following enrollment, patients completed a preencounter survey to collect demographic information and to measure their baseline anxiety via the State Anxiety Scale (STAI-S), which assesses transient anxious mood using 20 items answered on a 4-point scale for a final score range of 20 to 80.10,18,19 We timed and audio-recorded admission encounters. Encounter recordings were obtained solely from patient interactions with attending hospitalists and did not take into account the time patients may have spent with other physicians, including trainees. After the encounter, patients completed postencounter surveys, which included the STAI-S and patients’ ratings of communication during the encounter. To rate communication, patients responded to 7 items on a 0- to 10-point scale that were derived from previous work (Table 1)12,20,21; the anchors were “not at all” and “completely.” To identify patients with serious illness, which we used as a covariate in regression models, we asked physicians on a postencounter survey whether or not they “would be surprised by this patient’s death or admission to the ICU in the next year.”22
We considered physician as a clustering variable in the calculation of robust standard errors for all models. In addition, we included in each model covariates that were associated with the outcome at P ≤ 0.10, including patient gender, patient age, serious illness,22 preencounter anxiety, encounter length, and hospital. We considered P values < 0.05 to be statistically significant. We used Stata SE 13 (StataCorp LLC, College Station, TX) for all statistical analyses.
RESULTS
We analyzed data from admission encounters with 76 patients (consent rate 63%) and 27 hospitalists (consent rate 91%). Their characteristics are shown in Table 3. Median encounter length was 19 minutes (mean 21 minutes, range 3-68). Patients expressed negative emotion in 190 instances across all encounters; median number of expressions per encounter was 1 (range 0-14). Hospitalists responded empathically to 32% (n = 61) of the patient expressions, neutrally to 43% (n = 81), and nonempathically to 25% (n = 48).
The STAI-S was normally distributed. The mean preencounter STAI-S score was 39 (standard deviation [SD] 8.9). Mean postencounter STAI-S score was 38 (SD 10.7). Mean change in anxiety over the course of the encounter, calculated as the postencounter minus preencounter mean was −1.2 (SD 7.6). Table 1 shows summary statistics for the patient ratings of communication items. All items were rated highly. Across the items, between 51% and 78% of patients rated the highest score of 10.
Across the range of frequencies of emotional expressions per encounter in our data set (0-14 expressions), each additional empathic hospitalist response was associated with a 1.65-point decrease in the STAI-S (95% confidence interval [CI], 0.48-2.82). We did not find significant associations between changes in the STAI-S and the number of neutral hospitalist responses (−0.65 per response; 95% CI, −1.67-0.37) or nonempathic hospitalist responses (0.61 per response; 95% CI, −0.88-2.10).
In addition, nonempathic responses were associated with more negative ratings of communication for 5 of the 7 items: ease of understanding information, covering points of interest, the doctor listening, the doctor caring, and trusting the doctor. For example, for the item “I felt this doctor cared about me,” each nonempathic hospitalist response was associated with a more than doubling of negative patient ratings (aRE: 2.3; 95% CI, 1.32-4.16). Neutral physician responses to patient expressions of negative emotion were associated with less negative patient ratings for 2 of the items: covering points of interest (aRE 0.68; 95% CI, 0.51-0.90) and trusting the doctor (aRE: 0.86; 95% CI, 0.75-0.99).
We did not find a statistical association between encounter length and the number of empathic hospitalist responses in the encounter (percent change in encounter length per response [PC]: 1%; 95% CI, −8%-10%) or the number of nonempathic responses (PC: 18%; 95% CI, −2%-42%). We did find a statistically significant association between the number of neutral responses and encounter length (PC: 13%; 95% CI, 3%-24%), corresponding to 2.5 minutes of additional encounter time per neutral response for the median encounter length of 19 minutes.
DISCUSSION
Our study set out to measure how hospitalists responded to expressions of negative emotion during admission encounters with patients and how those responses correlated with patient anxiety, ratings of communication, and encounter length. We found that empathic responses were associated with diminishing patient anxiety after the visit, as well as with better ratings of several domains of hospitalist communication. Moreover, nonempathic responses to negative emotion were associated with more strongly negative ratings of hospitalist communication. Finally, while clinicians may worry that encouraging patients to speak further about emotion will result in excessive visit lengths, we did not find a statistical association between empathic responses and encounter duration. To our knowledge, this is the first study to indicate an association between empathy and patient anxiety and communication ratings within the hospitalist model, which is rapidly becoming the predominant model for providing inpatient care in the United States.4,5
As in oncologic care, anxiety is an emotion commonly confronted by clinicians meeting admitted medical patients for the first time. Studies show that not only do patient anxiety levels remain high throughout a hospital course, patients who experience higher levels of anxiety tend to stay longer in the hospital.1,2,27-30 But unlike oncologic care or other therapy provided in an outpatient setting, the hospitalist model does not facilitate “continuity” of care, or the ability to care for the same patients over a long period of time. This reality of inpatient care makes rapid, effective rapport-building critical to establishing strong physician-patient relationships. In this setting, a simple communication tool that is potentially able to reduce inpatients’ anxiety could have a meaningful impact on hospitalist-provided care and patient outcomes.
In terms of the magnitude of the effect of empathic responses, the clinical significance of a 1.65-point decrease in the STAI-S anxiety score is not precisely clear. A prior study that examined the effect of music therapy on anxiety levels in patients with cancer found an average anxiety reduction of approximately 9.5 units on the STAIS-S scale after sensitivity analysis, suggesting a rather large meaningful effect size.31 Given we found a reduction of 1.65 points for each empathic response, however, with a range of 0-14 negative emotions expressed over a median 19-minute encounter, there is opportunity for hospitalists to achieve a clinically significant decrease in patient anxiety during an admission encounter. The potential to reduce anxiety is extended further when we consider that the impact of an empathic response may apply not just to the admission encounter alone but also to numerous other patient-clinician interactions over the course of a hospitalization.
A healthy body of communication research supports the associations we found in our study between empathy and patient ratings of communication and physicians. Families in ICU conferences rate communication more positively when physicians express empathy,12 and a number of studies indicate an association between empathy and patient satisfaction in outpatient settings.8 Given the associations we found with negative ratings on the items in our study, promoting empathic responses to expressions of emotion and, more importantly, stressing avoidance of nonempathic responses may be relevant efforts in working to improve patient satisfaction scores on surveys reporting “top box” percentages, such as Hospital Consumer Assessment of Healthcare Providers and Systems (HCAHPS). More notably, evidence indicates that empathy has positive impacts beyond satisfaction surveys, such as adherence, better diagnostic and clinical outcomes, and strengthening of patient enablement.8Not all hospitalist responses to emotion were associated with patient ratings across the 7 communication items we assessed. For example, we did not find an association between how physicians responded to patient expressions of negative emotion and patient perception that enough time was spent in the visit or the degree to which talking with the doctor met a patient’s overall needs. It follows logically, and other research supports, that empathy would influence patient ratings of physician caring and trust,32 whereas other communication factors we were unable to measure (eg, physician body language, tone, and use of jargon and patient health literacy and primary language) may have a more significant association with patient ratings of the other items we assessed.
In considering the clinical application of our results, it is important to note that communication skills, including responding empathically to patient expressions of negative emotion, can be imparted through training in the same way as abdominal examination or electrocardiogram interpretation skills.33-35 However, training of hospitalists in communication skills requires time and some financial investment on the part of the physician, their hospital or group, or, ideally, both. Effective training methods, like those for other skill acquisition, involve learner-centered teaching and practicing skills with role-play and feedback.36 Given the importance of a learner-centered approach, learning would likely be better received and more effective if it was tailored to the specific needs and patient scenarios commonly encountered by hospitalist physicians. As these programs are developed, it will be important to assess the impact of any training on the patient-reported outcomes we assessed in this observational study, along with clinical outcomes.
Our study has several limitations. First, we were only able to evaluate whether hospitalists verbally responded to patient emotion and were thus not able to account for nonverbal empathy such as facial expressions, body language, or voice tone. Second, given our patient consent rate of 63%, patients who agreed to participate in the study may have had different opinions than those who declined to participate. Also, hospitalists and patients may have behaved differently as a result of being audio recorded. We only included patients who spoke English, and our patient population was predominately non-Hispanic white. Patients who spoke other languages or came from other cultural backgrounds may have had different responses. Third, we did not use a single validated scale for patient ratings of communication, and multiple analyses increase our risk of finding statistically significant associations by chance. The skewing of the communication rating items toward high scores may also have led to our results being driven by outliers, although the model we chose for analysis does penalize for this. Furthermore, our sample size was small, leading to wide CIs and potential for lack of statistical associations due to insufficient power. Our findings warrant replication in larger studies. Fourth, the setting of our study in an academic center may affect generalizability. Finally, the age of our data (collected between 2008 and 2009) is also a limitation. Given a recent focus on communication and patient experience since the initiation of HCAHPS feedback, a similar analysis of empathy and communication methods now may result in different outcomes.
In conclusion, our results suggest that enhancing hospitalists’ empathic responses to patient expressions of negative emotion could decrease patient anxiety and improve patients’ perceptions of (and thus possibly their relationships with) hospitalists, without sacrificing efficiency. Future work should focus on tailoring and implementing communication skills training programs for hospitalists and evaluating the impact of training on patient outcomes.
Acknowledgments
The authors extend their sincere thanks to the patients and physicians who participated in this study. Dr. Anderson was funded by the National Palliative Care Research Center and the University of California, San Francisco Clinical and Translational Science Institute Career Development Program, National Institutes of Health (NIH) grant number 5 KL2 RR024130-04. Project costs were funded by a grant from the University of California, San Francisco Academic Senate.
Disclosure
All coauthors have seen and agree with the contents of this manuscript. This submission is not under review by any other publication. Wendy Anderson received funding for this project from the National Palliative Care Research Center, University of California San Francisco Clinical and Translational Science Institute (NIH grant number 5KL2RR024130-04), and the University of San Francisco Academic Senate [From Section 2 of Author Disclosure Form]. Andy Auerbach has a Patient-Centered Outcomes Research Institute research grant in development [From Section 3 of the Author Disclosure Form].
1. Walker FB, Novack DH, Kaiser DL, Knight A, Oblinger P. Anxiety and depression among medical and surgical patients nearing hospital discharge. J Gen Intern Med. 1987;2(2):99-101. PubMed
2. Castillo MI, Cooke M, Macfarlane B, Aitken LM. Factors associated with anxiety in critically ill patients: A prospective observational cohort study. Int J Nurs Stud. 2016;60:225-233. PubMed
3. Anderson WG, Winters K, Auerbach AD. Patient concerns at hospital admission. Arch Intern Med. 2011;171(15):1399-1400. PubMed
4. Kuo Y-F, Sharma G, Freeman JL, Goodwin JS. Growth in the care of older patients by hospitalists in the United States. N Engl J Med. 2009;360(11):1102-1112. PubMed
5. Wachter RM, Goldman L. Zero to 50,000 - The 20th Anniversary of the Hospitalist. N Engl J Med. 2016;375(11):1009-1011. PubMed
6. Mack JW, Block SD, Nilsson M, et al. Measuring therapeutic alliance between oncologists and patients with advanced cancer: the Human Connection Scale. Cancer. 2009;115(14):3302-3311. PubMed
7. Huff NG, Nadig N, Ford DW, Cox CE. Therapeutic Alliance between the Caregivers of Critical Illness Survivors and Intensive Care Unit Clinicians. [published correction appears in Ann Am Thorac Soc. 2016;13(4):576]. Ann Am Thorac Soc. 2015;12(11):1646-1653. PubMed
8. Derksen F, Bensing J, Lagro-Janssen A. Effectiveness of empathy in general practice: a systematic review. Br J Gen Pract. 2013;63(606):e76-e84. PubMed
9. Dwamena F, Holmes-Rovner M, Gaulden CM, et al. Interventions for providers to promote a patient-centred approach in clinical consultations. Cochrane Database Syst Rev. 2012;12:CD003267. PubMed
10. Fogarty LA, Curbow BA, Wingard JR, McDonnell K, Somerfield MR. Can 40 seconds of compassion reduce patient anxiety? J Clin Oncol. 1999;17(1):371-379. PubMed
11. Roter DL, Hall JA, Kern DE, Barker LR, Cole KA, Roca RP. Improving physicians’ interviewing skills and reducing patients’ emotional distress. A randomized clinical trial. Arch Intern Med. 1995;155(17):1877-1884. PubMed
12. Stapleton RD, Engelberg RA, Wenrich MD, Goss CH, Curtis JR. Clinician statements and family satisfaction with family conferences in the intensive care unit. Crit Care Med. 2006;34(6):1679-1685. PubMed
13. Hojat M, Louis DZ, Markham FW, Wender R, Rabinowitz C, Gonnella JS. Physicians’ empathy and clinical outcomes for diabetic patients. Acad Med. 2011;86(3):359-364. PubMed
14. Anderson WG, Winters K, Arnold RM, Puntillo KA, White DB, Auerbach AD. Studying physician-patient communication in the acute care setting: the hospitalist rapport study. Patient Educ Couns. 2011;82(2):275-279. PubMed
15. Pollak KI, Arnold RM, Jeffreys AS, et al. Oncologist communication about emotion during visits with patients with advanced cancer. J Clin Oncol. 2007;25(36):5748-5752. PubMed
16. Suchman AL, Markakis K, Beckman HB, Frankel R. A model of empathic communication in the medical interview. JAMA. 1997;277(8):678-682. PubMed
17. Adams K, Cimino JEW, Arnold RM, Anderson WG. Why should I talk about emotion? Communication patterns associated with physician discussion of patient expressions of negative emotion in hospital admission encounters. Patient Educ Couns. 2012;89(1):44-50. PubMed
18. Julian LJ. Measures of anxiety: State-Trait Anxiety Inventory (STAI), Beck Anxiety Inventory (BAI), and Hospital Anxiety and Depression Scale-Anxiety (HADS-A). Arthritis Care Res (Hoboken). 2011;63 Suppl 11:S467-S472. PubMed
19. Speilberger C, Ritterband L, Sydeman S, Reheiser E, Unger K. Assessment of emotional states and personality traits: measuring psychological vital signs. In: Butcher J, editor. Clinical personality assessment: practical approaches. New York: Oxford University Press; 1995.
20. Safran DG, Kosinski M, Tarlov AR, et al. The Primary Care Assessment Survey: tests of data quality and measurement performance. Med Care. 1998;36(5):728-739. PubMed
21. Azoulay E, Pochard F, Kentish-Barnes N, et al. Risk of post-traumatic stress symptoms in family members of intensive care unit patients. Am J Respir Crit Care Med. 2005;171(9):987-994. PubMed
22. Lynn J. Perspectives on care at the close of life. Serving patients who may die soon and their families: the role of hospice and other services. JAMA. 2001;285(7):925-932. PubMed
23. Kennifer SL, Alexander SC, Pollak KI, et al. Negative emotions in cancer care: do oncologists’ responses depend on severity and type of emotion? Patient Educ Couns. 2009;76(1):51-56. PubMed
24. Butow PN, Brown RF, Cogar S, Tattersall MHN, Dunn SM. Oncologists’ reactions to cancer patients’ verbal cues. Psychooncology. 2002;11(1):47-58. PubMed
25. Levinson W, Gorawara-Bhat R, Lamb J. A study of patient clues and physician responses in primary care and surgical settings. JAMA. 2000;284(8):1021-1027. PubMed
26. Cohen J. A coefficient of agreement for nominal scales. Educ Psychol Meas. 1960;20(1):37-46.
27. Fulop G. Anxiety disorders in the general hospital setting. Psychiatr Med. 1990;8(3):187-195. PubMed
28. Gerson S, Mistry R, Bastani R, et al. Symptoms of depression and anxiety (MHI) following acute medical/surgical hospitalization and post-discharge psychiatric diagnoses (DSM) in 839 geriatric US veterans. Int J Geriatr Psychiatry. 2004;19(12):1155-1167. PubMed
29. Kathol RG, Wenzel RP. Natural history of symptoms of depression and anxiety during inpatient treatment on general medicine wards. J Gen Intern Med. 1992;7(3):287-293. PubMed
30. Unsal A, Unaldi C, Baytemir C. Anxiety and depression levels of inpatients in the city centre of Kirşehir in Turkey. Int J Nurs Pract. 2011;17(4):411-418. PubMed
31. Bradt J, Dileo C, Grocke D, Magill L. Music interventions for improving psychological and physical outcomes in cancer patients. [Update appears in Cochrane Database Syst Rev. 2016;(8):CD006911] Cochrane Database Syst Rev. 2011;(8):CD006911. PubMed
32. Kim SS, Kaplowitz S, Johnston MV. The effects of physician empathy on patient satisfaction and compliance. Eval Health Prof. 2004;27(3):237-251. PubMed
33. Tulsky JA, Arnold RM, Alexander SC, et al. Enhancing communication between oncologists and patients with a computer-based training program: a randomized trial. Ann Intern Med. 2011;155(9):593-601. PubMed
34. Bays AM, Engelberg RA, Back AL, et al. Interprofessional communication skills training for serious illness: evaluation of a small-group, simulated patient intervention. J Palliat Med. 2014;17(2):159-166. PubMed
35. Epstein RM, Duberstein PR, Fenton JJ, et al. Effect of a Patient-Centered Communication Intervention on Oncologist-Patient Communication, Quality of Life, and Health Care Utilization in Advanced Cancer: The VOICE Randomized Clinical Trial. JAMA Oncol. 2017;3(1):92-100. PubMed
36. Berkhof M, van Rijssen HJ, Schellart AJM, Anema JR, van der Beek AJ. Effective training strategies for teaching communication skills to physicians: an overview of systematic reviews. Patient Educ Couns. 2011;84(2):152-162. PubMed
© 2017 Society of Hospital Medicine
Sound and Light Levels Are Similarly Disruptive in ICU and non-ICU Wards
The hospital environment fails to promote adequate sleep for acutely or critically ill patients. Intensive care units (ICUs) have received the most scrutiny, because critically ill patients suffer from severely fragmented sleep as well as a lack of deeper, more restorative sleep.1-4 ICU survivors frequently cite sleep deprivation, contributed to by ambient noise, as a major stressor while receiving care.5,6 Importantly, efforts to modify the ICU environment to promote sleep have been associated with reductions in delirium.7,8 However, sleep deprivation and delirium in the hospital are not limited to ICU patients.
Sleep in the non-ICU setting is also notoriously poor, with 50%-80% of patients reporting sleep as “unsound” or otherwise subjectively poor.9-11 Additionally, patients frequently ask for and/or receive pharmacological sleeping aids12 despite little evidence of efficacy13 and increasing evidence of harm.14 Here too, efforts to improve sleep seems to attenuate risk of delirium,15 which remains a substantial problem on general wards, with incidence reported as high as 20%-30%. The reasons for poor sleep in the hospital are multifactorial, but data suggest that the inpatient environment, including noise and light levels, which are measurable and modifiable entities, contribute significantly to the problem.16
The World Health Organization (WHO) recommends that nighttime baseline noise levels do not exceed 30 decibels (dB) and that nighttime noise peaks (ie, loud noises) do not exceed 40 dB17; most studies suggest that ICU and general ward rooms are above this range on average.10,18 Others have also demonstrated an association between loud noises and patients’ subjective perception of poor sleep.10,19 However, when considering clinically important noise, peak and average noise levels may not be the key factor in causing arousals from sleep. Buxton and colleagues20 found that noise quality affects arousal probability; for example, electronic alarms and conversational noise are more likely to cause awakenings compared with the opening or closing of doors and ice machines. Importantly, peak and average noise levels may also matter less for sleep than do sound level changes (SLCs), which are defined as the difference between background/baseline noise and peak noise. Using healthy subjects exposed to simulated ICU noise, Stanchina et al.21 found that SLCs >17.5 dB were more likely to cause polysomnographic arousals from sleep regardless of peak noise level. This sound pressure change of approximately 20 dB would be perceived as 4 times louder, or, as an example, would be the difference between normal conversation between 2 people (~40 dB) that is then interrupted by the start of a vacuum cleaner (~60 dB). To our knowledge, no other studies have closely examined SLCs in different hospital environments.
Ambient light also likely affects sleep quality in the hospital. The circadian rhythm system, which controls the human sleep–wake cycle as well as multiple other physiologic functions, depends on ambient light as the primary external factor for regulating the internal clock.22,23 Insufficient and inappropriately timed light exposure can desynchronize the biological clock, thereby negatively affecting sleep quality.24,25 Conversely, patients exposed to early-morning bright light may sleep better while in the hospital.16 In addition to sleep patterns, ambient light affects other aspects of patient care; for example, lower light levels in the hospital have recently been associated with higher levels of fatigue and mood disturbance.26A growing body of data has investigated the ambient environment in the ICU, but fewer studies have focused on sound and light analysis in other inpatient areas such as the general ward and telemetry floors. We examined sound and light levels in the ICU and non-ICU environment, hypothesizing that average sound levels would be higher in the ICU than on non-ICU floors but that the number of SLCs >17.5 dB would be similar. Additionally, we expected that average light levels would be higher in the ICU than on non-ICU floors.
METHODS
This was an observational study of the sound and light environment in the inpatient setting. Per our Institutional Review Board, no consent was required. Battery-operated sound-level (SDL600, Extech Instruments, Nashua, NH) and light-level (SDL400, Extech Instruments, Nashua, NH) meters were placed in 24 patient rooms in our tertiary-care adult hospital in La Jolla, CA. Recordings were obtained in randomly selected, single-patient occupied rooms that were from 3 different hospital units and included 8 general ward rooms, 8 telemetry floor rooms, and 8 ICU rooms. We recorded for approximately 24-72 hours. Depending on the geographic layout of the room, meters were placed as close to the head of the patient’s bed as possible and were generally not placed farther than 2 meters away from the patient’s head of bed; all rooms contained a window.
Sound Measurements
Sound meters measured ambient noise in dB every 2 seconds and were set for A-weighted frequency measurements. We averaged individual data points to obtain hourly averages for ICU and non-ICU rooms. For hourly sound averages, we further separated the data to compare the general ward telemetry floors (both non-ICU), the latter of which has more patient monitoring and a lower nurse-to-patient ratio compared with the general ward floor.
Data from ICU versus non-ICU rooms were analyzed for the number of sound peaks throughout the 24-hour day and for sound peak over the nighttime, defined as the number of times sound levels exceeded 65 dB, 70 dB, or 80 dB, which were averaged over 24 hours and over the nighttime (10 PM to 6 AM). We also calculated the number of average SLCs ≥17.5 dB observed over 24 hours and over the nighttime.
Light Measurements
Light meters measured luminescence in lux at a frequency of 120 seconds. We averaged individual data points to obtain hourly averages for ICU and non-ICU rooms. In addition to hourly averages, light-level data were analyzed for maximum levels throughout the day and night.
Statistical Analysis
Hourly sound-level averages between the 3 floors were evaluated using a 1-way analysis of variance (ANOVA); sound averages from the general ward and telemetry floor were also compared at each hour using a Student t test. Light-level data, sound-level peak data, as well as SLC data were also evaluated using a Student t test.
RESULTS
Sound Measurements
Examples of the raw data distribution for individual sound recordings in an ICU and non-ICU room are shown in Figure 1A and 1B. Sound-level analysis with specific average values and significance levels between ICU and non-ICU rooms (with non-ICU rooms further divided between telemetry and general ward floors for purposes of hourly averages) are shown in Table 1. The average hourly values in all 3 locations were always above the 30-35 dB level (nighttime and daytime, respectively) recommended by the WHO (Figure 1C). A 1-way ANOVA analysis revealed significant differences between the 3 floors at all time points except for 10 AM. An analysis of the means at each time point between the telemetry floor and the general ward floor showed that the telemetry floor had significantly higher sound averages compared with the general ward floor at 10 PM, 11 PM, and 12 AM. Sound levels dropped during the nighttime on both non-ICU wards but remained fairly constant throughout the day and night in the ICU.
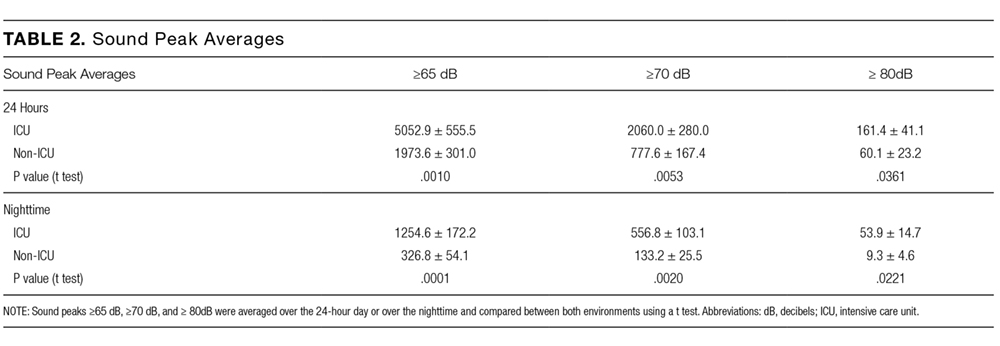
Importantly, despite average and peak sound levels showing that the ICU environment is louder overall, there were an equivalent number of SLCs ≥ 17.5 dB in the ICU and on non-ICU floors. The number of SLCs ≥ 17.5 dB is not statistically different when comparing ICU and non-ICU rooms either averaged over 24 hours or averaged over the nighttime (Figure 1E).
Light Measurements
Examples of light levels over a 24-hour period in an ICU and non-ICU room are shown in Figure 2A and 2B, respectively. Maximum average light levels (reported here as average value ± standard deviation to demonstrate variability within the data) in the ICU were 169.7 ± 127.1 lux and occurred at 1 PM, while maximum average light levels in the non-ICU rooms were 213.5 ± 341.6 lux and occurred at 5 PM (Figure 2C). Average light levels in the morning hours remained low and ranged from 15.9 ± 12.7 lux to 38.9 ± 43.4 lux in the ICU and from 22.3 ± 17.5 lux to 100.7 ± 92.0 lux on the non-ICU floors. The maximum measured level from any of the recordings was 2530 lux and occurred in a general ward room in the 5 PM hour. Overall, light averages remained low, but this particular room had light levels that were significantly higher than the others. A t test analysis of the hourly averages revealed only 1 time point of significant difference between the 2 floors; at 7 AM, the general ward floor had a higher lux level of 49.9 ± 27.5 versus 19.2 ± 10.7 in the ICU (P = 0.038). Otherwise, there were no differences between light levels in ICU rooms versus non-ICU rooms. Evaluation of the data revealed a substantial amount of variability in light levels throughout the daytime hours. Light levels during the nighttime remained low and were not significantly different between the 2 groups.
DISCUSSION
To our knowledge, this is the first study to directly compare the ICU and non-ICU environment for its potential impact on sleep and circadian alignment. Our study adds to the literature with several novel findings. First, average sound levels on non-ICU wards are lower than in the ICU. Second, although quieter on average, SLCs >17.5 dB occurred an equivalent number of times for both the ICU and non-ICU wards. Third, average daytime light levels in both the ICU and non-ICU environment are low. Lastly, peak light levels for both ICU and non-ICU wards occur later in the day instead of in the morning. All of the above have potential impact for optimizing the ward environment to better aid in sleep for patients.
Sound-Level Findings
Data on sound levels for non-ICU floors are limited but mostly consistent with our finding
Average and peak sound levels contribute to the ambient noise experienced by patients but may not be the source of sleep disruptions. Using polysomnography in healthy subjects exposed to recordings of ICU noise, Stanchina et al.21 showed that SLCs from baseline and not peak sound levels determined whether a subject was aroused from sleep by sound. Accordingly, they also found that increasing baseline sound levels by using white noise reduced the number of arousals that subjects experienced. To our knowledge, other studies have not quantified and compared SLCs in the ICU and non-ICU environments. Our data show that patients on non-ICU floors experience at least the same number of SLCs, and thereby the same potential for arousals from sleep, when compared with ICU patients. The higher baseline level of noise in the ICU likely explains the relatively lower number of SLCs when compared with the non-ICU floors. Although decreasing overall noise to promote sleep in the hospital seems like the obvious solution, the treatment for noise pollution in the hospital may actually be more background noise, not less.
Recent studies support the clinical implications of our findings. First, decreasing overall noise levels is difficult to accomplish.29 Second, recent studies utilized white noise in different hospital settings with some success in improving patients’ subjective sleep quality, although more studies using objective data measurements are needed to further understand the impact of white noise on sleep in hospitalized patients.30,31 Third, efforts at reducing interruptions—which likely will decrease the number of SLCs—such as clustering nursing care or reducing intermittent alarms may be more beneficial in improving sleep than efforts at decreasing average sound levels. For example, Bartick et al. reduced the number of patient interruptions at night by eliminating routine vital signs and clustering medication administration. Although they included other interventions as well, we note that this approach likely reduced SLCs and was associated with a reduction in the use of sedative medications.32 Ultimately, our data show that a focus on reducing SLCs will be one necessary component of a multipronged solution to improving inpatient sleep.33
Light-Level Findings
Because of its effect on circadian rhythms, the daily light-dark cycle has a powerful impact on human physiology and behavior, which includes sleep.34 Little is understood about how light affects sleep and other circadian-related functions in general ward patients, as it is not commonly measured. Our findings suggest that patients admitted to the hospital are exposed to light levels and patterns that may not optimally promote wake and sleep. Encouragingly, we did not find excessive average light levels during the nighttime in either ICU or non-ICU environment of our hospital, although others have described intrusive nighttime light in the hospital setting.35,36 Even short bursts of low or moderate light during the nighttime can cause circadian phase delay,37 and efforts to maintain darkness in patient rooms at night should continue.
Our measurements show that average daytime light levels did not exceed 250 lux, which corresponds to low, office-level lighting, while the brightest average light levels occurred in the afternoon for both environments. These levels are consistent with other reports26,35,36 as is the light-level variability noted throughout the day (which is not unexpected given room positioning, patient preference, curtains, etc). The level and amount of daytime light needed to maintain circadian rhythms in humans is still unknown.38 Brighter light is generally more effective at influencing the circadian pacemaker in a dose-dependent manner.39 Although entrainment (synchronization of the body’s biological rhythm with environmental cues such as ambient light) of the human circadian rhythm has been shown with low light levels (eg, <100 lux), these studies included healthy volunteers in a carefully controlled, constant, routine environment.23 How these data apply to acutely ill subjects in the hospital environment is not clear. We note that low to moderate levels of light (50-1000 lux) are less effective for entrainment of the circadian rhythm in older people (age >65 years, the majority of our admissions) compared with younger people. Thus, older, hospitalized patients may require greater light levels for regulation of the sleep-wake cycle.40 These data are important when designing interventions to improve light for and maintain circadian rhythms in hospitalized patients. For example, Simons et al. found that dynamic light-application therapy, which achieved a maximum average lux level of <800 lux, did not reduce rates of delirium in critically ill patients (mean age ~65). One interpretation of these results, though there are many others, is that the light levels achieved were not high enough to influence circadian timing in hospitalized, mostly elderly patients. The physiological impact of light on the circadian rhythm in hospitalized patients still remains to be measured.
LIMITATIONS
Our study does have a few limitations. We did not assess sound quality, which is another determinant of arousal potential.20 Also, a shorter measurement interval might be useful in determining sharper sound increases. It may also be important to consider A- versus C-weighted measurements of sound levels, as A-weighted measurements usually reflect higher-frequency sound while C-weighted measurements usually reflect low-frequency noise18; we obtained only A-weighted measurements in our study. However, A-weighted measurements are generally considered more reflective of what the human ear considers noise and are used more standardly than C-weighted measurements.
Regarding light measurements, we recorded from rooms facing different cardinal directions and during different times of the year, which likely contributed to some of the variability in the daytime light levels on both floors. Additionally, light levels were not measured directly at the patient’s eye level. However, given that overhead fluorescent lighting was the primary source of lighting, it is doubtful that we substantially underestimated optic-nerve light levels. In the future, it may also be important to measure the different wavelengths of lights, as blue light may have a greater impact on sleep than other wavelengths.41 Although our findings align with others’, we note that this was a single-center study, which could limit the generalizability of our findings given inter-hospital variations in patient volume, interior layout and structure, and geographic location.
CONCLUSIONS
Overall, our study suggests that the light and sound environment for sleep in the inpatient setting, including both the ICU and non-ICU wards, has multiple areas for improvement. Our data also suggest specific directions for future clinical efforts at improvement. For example, efforts to decrease average sound levels may worsen sleep fragmentation. Similarly, more light during the day may be more helpful than further attempts to limit light during the night.
Disclosure
This research was funded in part by a NIH/NCATS flagship Clinical and Translational Science Award Grant (5KL2TR001112). None of the authors report any conflict of interest, financial or otherwise, in the preparation of this article.
1. Freedman NS, Gazendam J, Levan L, Pack AI, Schwab RJ. Abnormal sleep/wake
cycles and the effect of environmental noise on sleep disruption in the intensive
care unit. Am J Respir Crit Care Med. 2001;163(2):451-457. PubMed
2. Watson PL, Pandharipande P, Gehlbach BK, et al. Atypical sleep in ventilated
patients: empirical electroencephalography findings and the path toward revised ICU sleep scoring criteria. Crit Care Med. 2013;41(8):1958-1967. PubMed
3. Gehlbach BK, Chapotot F, Leproult R, et al. Temporal disorganization of circadian rhythmicity and sleep-wake regulation in mechanically ventilated patients receiving continuous intravenous sedation. Sleep. 2012;35(8):1105-1114. PubMed
4. Elliott R, McKinley S, Cistulli P, Fien M. Characterisation of sleep in intensive care using 24-hour polysomnography: an observational study. Crit Care. 2013;17(2):R46. PubMed
5. Novaes MA, Aronovich A, Ferraz MB, Knobel E. Stressors in ICU: patients’ evaluation. Intensive Care Med. 1997;23(12):1282-1285. PubMed
6. Tembo AC, Parker V, Higgins I. The experience of sleep deprivation in intensive care patients: findings from a larger hermeneutic phenomenological study. Intensive Crit Care Nurs. 2013;29(6):310-316. PubMed
7. Kamdar BB, Yang J, King LM, et al. Developing, implementing, and evaluating a multifaceted quality improvement intervention to promote sleep in an ICU. Am J Med Qual. 2014;29(6):546-554. PubMed
8. Patel J, Baldwin J, Bunting P, Laha S. The effect of a multicomponent multidisciplinary bundle of interventions on sleep and delirium in medical and surgical intensive care patients. Anaesthesia. 2014;69(6):540-549. PubMed
9. Manian FA, Manian CJ. Sleep quality in adult hospitalized patients with infection: an observational study. Am J Med Sci. 2015;349(1):56-60. PubMed
10. Park MJ, Yoo JH, Cho BW, Kim KT, Jeong WC, Ha M. Noise in hospital rooms and sleep disturbance in hospitalized medical patients. Environ Health Toxicol. 2014;29:e2014006. PubMed
11. Dobing S, Frolova N, McAlister F, Ringrose J. Sleep quality and factors influencing self-reported sleep duration and quality in the general internal medicine inpatient population. PLoS One. 2016;11(6):e0156735. PubMed
12. Gillis CM, Poyant JO, Degrado JR, Ye L, Anger KE, Owens RL. Inpatient pharmacological
sleep aid utilization is common at a tertiary medical center. J Hosp Med. 2014;9(10):652-657. PubMed
13. Krenk L, Jennum P, Kehlet H. Postoperative sleep disturbances after zolpidem treatment in fast-track hip and knee replacement. J Clin Sleep Med. 2014;10(3):321-326. PubMed
14. Kolla BP, Lovely JK, Mansukhani MP, Morgenthaler TI. Zolpidem is independently
associated with increased risk of inpatient falls. J Hosp Med. 2013;8(1):1-6. PubMed
15. Inouye SK, Bogardus ST Jr, Charpentier PA, et al. A multicomponent intervention to prevent delirium in hospitalized older patients. N Engl J Med. 1999;340(9):669-676. PubMed
16. Bano M, Chiaromanni F, Corrias M, et al. The influence of environmental factors on sleep quality in hospitalized medical patients. Front Neurol. 2014;5:267. PubMed
17. Berglund BLTSD. Guidelines for Community Noise. World Health Organization. 1999.
18. Knauert M, Jeon S, Murphy TE, Yaggi HK, Pisani MA, Redeker NS. Comparing average levels and peak occurrence of overnight sound in the medical intensive care unit on A-weighted and C-weighted decibel scales. J Crit Care. 2016;36:1-7. PubMed
19. Yoder JC, Staisiunas PG, Meltzer DO, Knutson KL, Arora VM. Noise and sleep among adult medical inpatients: far from a quiet night. Arch Intern Med. 2012;172(1):68-70. PubMed
20. Buxton OM, Ellenbogen JM, Wang W, et al. Sleep disruption due to hospital noises: a prospective evaluation. Ann Intern Med. 2012;157(3):170-179. PubMed
21. Stanchina ML, Abu-Hijleh M, Chaudhry BK, Carlisle CC, Millman RP. The influence of white noise on sleep in subjects exposed to ICU noise. Sleep Med. 2005;6(5):423-428. PubMed
22. Czeisler CA, Allan JS, Strogatz SH, et al. Bright light resets the human circadian pacemaker independent of the timing of the sleep-wake cycle. Science. 1986;233(4764):667-671. PubMed
23. Duffy JF, Czeisler CA. Effect of light on human circadian physiology. Sleep Med Clin. 2009;4(2):165-177. PubMed
24. Lewy AJ, Wehr TA, Goodwin FK, Newsome DA, Markey SP. Light suppresses melatonin secretion in humans. Science. 1980;210(4475):1267-1269. PubMed
25. Zeitzer JM, Dijk DJ, Kronauer R, Brown E, Czeisler C. Sensitivity of the human circadian pacemaker to nocturnal light: melatonin phase resetting and suppression. J Physiol. 2000;526:695-702. PubMed
26. Bernhofer EI, Higgins PA, Daly BJ, Burant CJ, Hornick TR. Hospital lighting and its association with sleep, mood and pain in medical inpatients. J Adv Nurs. 2014;70(5):1164-1173. PubMed
27. Darbyshire JL, Young JD. An investigation of sound levels on intensive care units with reference to the WHO guidelines. Crit Care. 2013;17(5):R187. PubMed
28. Gillis S. Pharmacologic treatment of depression during pregnancy. J Midwifery Womens Health. 2000;45(4):357-359. PubMed
29. Tainter CR, Levine AR, Quraishi SA, et al. Noise levels in surgical ICUs are consistently above recommended standards. Crit Care Med. 2016;44(1):147-152. PubMed
30. Farrehi PM, Clore KR, Scott JR, Vanini G, Clauw DJ. Efficacy of Sleep Tool Education During Hospitalization: A Randomized Controlled Trial. Am J Med. 2016;129(12):1329.e9-1329.e17. PubMed
31. Farokhnezhad Afshar P, Bahramnezhad F, Asgari P, Shiri M. Effect of white noise on sleep in patients admitted to a coronary care. J Caring Sci. 2016;5(2):103-109. PubMed
32. Bartick MC, Thai X, Schmidt T, Altaye A, Solet JM. Decrease in as-needed sedative use by limiting nighttime sleep disruptions from hospital staff. J Hosp Med. 2010;5(3):E20-E24. PubMed
33. Tamrat R, Huynh-Le MP, Goyal M. Non-pharmacologic interventions to improve the sleep of hospitalized patients: a systematic review. J Gen Intern Med. 2014;29(5):788-795. PubMed
34. Dijk DJ, Archer SN. Light, sleep, and circadian rhythms: together again. PLoS Biol. 2009;7(6):e1000145. PubMed
35. Verceles AC, Liu X, Terrin ML, et al. Ambient light levels and critical care outcomes. J Crit Care. 2013;28(1):110.e1-110.e8. PubMed
36. Hu RF, Hegadoren KM, Wang XY, Jiang XY. An investigation of light and sound levels on intensive care units in China. Aust Crit Care. 2016;29(2):62-67. PubMed
37. Zeitzer JM, Ruby NF, Fisicaro RA, Heller HC. Response of the human circadian system to millisecond flashes of light. PLoS One. 2011;6(7):e22078. PubMed
38. Duffy JF, Wright KP, Jr. Entrainment of the human circadian system by light. J Biol Rhythms. 2005;20(4):326-338. PubMed
39. Wright KP Jr, Gronfier C, Duffy JF, Czeisler CA. Intrinsic period and light intensity determine the phase relationship between melatonin and sleep in humans. J Biol Rhythms. 2005;20(2):168-177. PubMed
40. Duffy JF, Zeitzer JM, Czeisler CA. Decreased sensitivity to phase-delaying effects of moderate intensity light in older subjects. Neurobiol Aging. 2007;28(5):799-807. PubMed
41. Figueiro MG, Plitnick BA, Lok A, et al. Tailored lighting intervention improves measures of sleep, depression, and agitation in persons with Alzheimer’s disease and related dementia living in long-term care facilities. Clin Interv Aging. 2014;9:1527-1537. PubMed
The hospital environment fails to promote adequate sleep for acutely or critically ill patients. Intensive care units (ICUs) have received the most scrutiny, because critically ill patients suffer from severely fragmented sleep as well as a lack of deeper, more restorative sleep.1-4 ICU survivors frequently cite sleep deprivation, contributed to by ambient noise, as a major stressor while receiving care.5,6 Importantly, efforts to modify the ICU environment to promote sleep have been associated with reductions in delirium.7,8 However, sleep deprivation and delirium in the hospital are not limited to ICU patients.
Sleep in the non-ICU setting is also notoriously poor, with 50%-80% of patients reporting sleep as “unsound” or otherwise subjectively poor.9-11 Additionally, patients frequently ask for and/or receive pharmacological sleeping aids12 despite little evidence of efficacy13 and increasing evidence of harm.14 Here too, efforts to improve sleep seems to attenuate risk of delirium,15 which remains a substantial problem on general wards, with incidence reported as high as 20%-30%. The reasons for poor sleep in the hospital are multifactorial, but data suggest that the inpatient environment, including noise and light levels, which are measurable and modifiable entities, contribute significantly to the problem.16
The World Health Organization (WHO) recommends that nighttime baseline noise levels do not exceed 30 decibels (dB) and that nighttime noise peaks (ie, loud noises) do not exceed 40 dB17; most studies suggest that ICU and general ward rooms are above this range on average.10,18 Others have also demonstrated an association between loud noises and patients’ subjective perception of poor sleep.10,19 However, when considering clinically important noise, peak and average noise levels may not be the key factor in causing arousals from sleep. Buxton and colleagues20 found that noise quality affects arousal probability; for example, electronic alarms and conversational noise are more likely to cause awakenings compared with the opening or closing of doors and ice machines. Importantly, peak and average noise levels may also matter less for sleep than do sound level changes (SLCs), which are defined as the difference between background/baseline noise and peak noise. Using healthy subjects exposed to simulated ICU noise, Stanchina et al.21 found that SLCs >17.5 dB were more likely to cause polysomnographic arousals from sleep regardless of peak noise level. This sound pressure change of approximately 20 dB would be perceived as 4 times louder, or, as an example, would be the difference between normal conversation between 2 people (~40 dB) that is then interrupted by the start of a vacuum cleaner (~60 dB). To our knowledge, no other studies have closely examined SLCs in different hospital environments.
Ambient light also likely affects sleep quality in the hospital. The circadian rhythm system, which controls the human sleep–wake cycle as well as multiple other physiologic functions, depends on ambient light as the primary external factor for regulating the internal clock.22,23 Insufficient and inappropriately timed light exposure can desynchronize the biological clock, thereby negatively affecting sleep quality.24,25 Conversely, patients exposed to early-morning bright light may sleep better while in the hospital.16 In addition to sleep patterns, ambient light affects other aspects of patient care; for example, lower light levels in the hospital have recently been associated with higher levels of fatigue and mood disturbance.26A growing body of data has investigated the ambient environment in the ICU, but fewer studies have focused on sound and light analysis in other inpatient areas such as the general ward and telemetry floors. We examined sound and light levels in the ICU and non-ICU environment, hypothesizing that average sound levels would be higher in the ICU than on non-ICU floors but that the number of SLCs >17.5 dB would be similar. Additionally, we expected that average light levels would be higher in the ICU than on non-ICU floors.
METHODS
This was an observational study of the sound and light environment in the inpatient setting. Per our Institutional Review Board, no consent was required. Battery-operated sound-level (SDL600, Extech Instruments, Nashua, NH) and light-level (SDL400, Extech Instruments, Nashua, NH) meters were placed in 24 patient rooms in our tertiary-care adult hospital in La Jolla, CA. Recordings were obtained in randomly selected, single-patient occupied rooms that were from 3 different hospital units and included 8 general ward rooms, 8 telemetry floor rooms, and 8 ICU rooms. We recorded for approximately 24-72 hours. Depending on the geographic layout of the room, meters were placed as close to the head of the patient’s bed as possible and were generally not placed farther than 2 meters away from the patient’s head of bed; all rooms contained a window.
Sound Measurements
Sound meters measured ambient noise in dB every 2 seconds and were set for A-weighted frequency measurements. We averaged individual data points to obtain hourly averages for ICU and non-ICU rooms. For hourly sound averages, we further separated the data to compare the general ward telemetry floors (both non-ICU), the latter of which has more patient monitoring and a lower nurse-to-patient ratio compared with the general ward floor.
Data from ICU versus non-ICU rooms were analyzed for the number of sound peaks throughout the 24-hour day and for sound peak over the nighttime, defined as the number of times sound levels exceeded 65 dB, 70 dB, or 80 dB, which were averaged over 24 hours and over the nighttime (10 PM to 6 AM). We also calculated the number of average SLCs ≥17.5 dB observed over 24 hours and over the nighttime.
Light Measurements
Light meters measured luminescence in lux at a frequency of 120 seconds. We averaged individual data points to obtain hourly averages for ICU and non-ICU rooms. In addition to hourly averages, light-level data were analyzed for maximum levels throughout the day and night.
Statistical Analysis
Hourly sound-level averages between the 3 floors were evaluated using a 1-way analysis of variance (ANOVA); sound averages from the general ward and telemetry floor were also compared at each hour using a Student t test. Light-level data, sound-level peak data, as well as SLC data were also evaluated using a Student t test.
RESULTS
Sound Measurements
Examples of the raw data distribution for individual sound recordings in an ICU and non-ICU room are shown in Figure 1A and 1B. Sound-level analysis with specific average values and significance levels between ICU and non-ICU rooms (with non-ICU rooms further divided between telemetry and general ward floors for purposes of hourly averages) are shown in Table 1. The average hourly values in all 3 locations were always above the 30-35 dB level (nighttime and daytime, respectively) recommended by the WHO (Figure 1C). A 1-way ANOVA analysis revealed significant differences between the 3 floors at all time points except for 10 AM. An analysis of the means at each time point between the telemetry floor and the general ward floor showed that the telemetry floor had significantly higher sound averages compared with the general ward floor at 10 PM, 11 PM, and 12 AM. Sound levels dropped during the nighttime on both non-ICU wards but remained fairly constant throughout the day and night in the ICU.
Importantly, despite average and peak sound levels showing that the ICU environment is louder overall, there were an equivalent number of SLCs ≥ 17.5 dB in the ICU and on non-ICU floors. The number of SLCs ≥ 17.5 dB is not statistically different when comparing ICU and non-ICU rooms either averaged over 24 hours or averaged over the nighttime (Figure 1E).
Light Measurements
Examples of light levels over a 24-hour period in an ICU and non-ICU room are shown in Figure 2A and 2B, respectively. Maximum average light levels (reported here as average value ± standard deviation to demonstrate variability within the data) in the ICU were 169.7 ± 127.1 lux and occurred at 1 PM, while maximum average light levels in the non-ICU rooms were 213.5 ± 341.6 lux and occurred at 5 PM (Figure 2C). Average light levels in the morning hours remained low and ranged from 15.9 ± 12.7 lux to 38.9 ± 43.4 lux in the ICU and from 22.3 ± 17.5 lux to 100.7 ± 92.0 lux on the non-ICU floors. The maximum measured level from any of the recordings was 2530 lux and occurred in a general ward room in the 5 PM hour. Overall, light averages remained low, but this particular room had light levels that were significantly higher than the others. A t test analysis of the hourly averages revealed only 1 time point of significant difference between the 2 floors; at 7 AM, the general ward floor had a higher lux level of 49.9 ± 27.5 versus 19.2 ± 10.7 in the ICU (P = 0.038). Otherwise, there were no differences between light levels in ICU rooms versus non-ICU rooms. Evaluation of the data revealed a substantial amount of variability in light levels throughout the daytime hours. Light levels during the nighttime remained low and were not significantly different between the 2 groups.
DISCUSSION
To our knowledge, this is the first study to directly compare the ICU and non-ICU environment for its potential impact on sleep and circadian alignment. Our study adds to the literature with several novel findings. First, average sound levels on non-ICU wards are lower than in the ICU. Second, although quieter on average, SLCs >17.5 dB occurred an equivalent number of times for both the ICU and non-ICU wards. Third, average daytime light levels in both the ICU and non-ICU environment are low. Lastly, peak light levels for both ICU and non-ICU wards occur later in the day instead of in the morning. All of the above have potential impact for optimizing the ward environment to better aid in sleep for patients.
Sound-Level Findings
Data on sound levels for non-ICU floors are limited but mostly consistent with our finding
Average and peak sound levels contribute to the ambient noise experienced by patients but may not be the source of sleep disruptions. Using polysomnography in healthy subjects exposed to recordings of ICU noise, Stanchina et al.21 showed that SLCs from baseline and not peak sound levels determined whether a subject was aroused from sleep by sound. Accordingly, they also found that increasing baseline sound levels by using white noise reduced the number of arousals that subjects experienced. To our knowledge, other studies have not quantified and compared SLCs in the ICU and non-ICU environments. Our data show that patients on non-ICU floors experience at least the same number of SLCs, and thereby the same potential for arousals from sleep, when compared with ICU patients. The higher baseline level of noise in the ICU likely explains the relatively lower number of SLCs when compared with the non-ICU floors. Although decreasing overall noise to promote sleep in the hospital seems like the obvious solution, the treatment for noise pollution in the hospital may actually be more background noise, not less.
Recent studies support the clinical implications of our findings. First, decreasing overall noise levels is difficult to accomplish.29 Second, recent studies utilized white noise in different hospital settings with some success in improving patients’ subjective sleep quality, although more studies using objective data measurements are needed to further understand the impact of white noise on sleep in hospitalized patients.30,31 Third, efforts at reducing interruptions—which likely will decrease the number of SLCs—such as clustering nursing care or reducing intermittent alarms may be more beneficial in improving sleep than efforts at decreasing average sound levels. For example, Bartick et al. reduced the number of patient interruptions at night by eliminating routine vital signs and clustering medication administration. Although they included other interventions as well, we note that this approach likely reduced SLCs and was associated with a reduction in the use of sedative medications.32 Ultimately, our data show that a focus on reducing SLCs will be one necessary component of a multipronged solution to improving inpatient sleep.33
Light-Level Findings
Because of its effect on circadian rhythms, the daily light-dark cycle has a powerful impact on human physiology and behavior, which includes sleep.34 Little is understood about how light affects sleep and other circadian-related functions in general ward patients, as it is not commonly measured. Our findings suggest that patients admitted to the hospital are exposed to light levels and patterns that may not optimally promote wake and sleep. Encouragingly, we did not find excessive average light levels during the nighttime in either ICU or non-ICU environment of our hospital, although others have described intrusive nighttime light in the hospital setting.35,36 Even short bursts of low or moderate light during the nighttime can cause circadian phase delay,37 and efforts to maintain darkness in patient rooms at night should continue.
Our measurements show that average daytime light levels did not exceed 250 lux, which corresponds to low, office-level lighting, while the brightest average light levels occurred in the afternoon for both environments. These levels are consistent with other reports26,35,36 as is the light-level variability noted throughout the day (which is not unexpected given room positioning, patient preference, curtains, etc). The level and amount of daytime light needed to maintain circadian rhythms in humans is still unknown.38 Brighter light is generally more effective at influencing the circadian pacemaker in a dose-dependent manner.39 Although entrainment (synchronization of the body’s biological rhythm with environmental cues such as ambient light) of the human circadian rhythm has been shown with low light levels (eg, <100 lux), these studies included healthy volunteers in a carefully controlled, constant, routine environment.23 How these data apply to acutely ill subjects in the hospital environment is not clear. We note that low to moderate levels of light (50-1000 lux) are less effective for entrainment of the circadian rhythm in older people (age >65 years, the majority of our admissions) compared with younger people. Thus, older, hospitalized patients may require greater light levels for regulation of the sleep-wake cycle.40 These data are important when designing interventions to improve light for and maintain circadian rhythms in hospitalized patients. For example, Simons et al. found that dynamic light-application therapy, which achieved a maximum average lux level of <800 lux, did not reduce rates of delirium in critically ill patients (mean age ~65). One interpretation of these results, though there are many others, is that the light levels achieved were not high enough to influence circadian timing in hospitalized, mostly elderly patients. The physiological impact of light on the circadian rhythm in hospitalized patients still remains to be measured.
LIMITATIONS
Our study does have a few limitations. We did not assess sound quality, which is another determinant of arousal potential.20 Also, a shorter measurement interval might be useful in determining sharper sound increases. It may also be important to consider A- versus C-weighted measurements of sound levels, as A-weighted measurements usually reflect higher-frequency sound while C-weighted measurements usually reflect low-frequency noise18; we obtained only A-weighted measurements in our study. However, A-weighted measurements are generally considered more reflective of what the human ear considers noise and are used more standardly than C-weighted measurements.
Regarding light measurements, we recorded from rooms facing different cardinal directions and during different times of the year, which likely contributed to some of the variability in the daytime light levels on both floors. Additionally, light levels were not measured directly at the patient’s eye level. However, given that overhead fluorescent lighting was the primary source of lighting, it is doubtful that we substantially underestimated optic-nerve light levels. In the future, it may also be important to measure the different wavelengths of lights, as blue light may have a greater impact on sleep than other wavelengths.41 Although our findings align with others’, we note that this was a single-center study, which could limit the generalizability of our findings given inter-hospital variations in patient volume, interior layout and structure, and geographic location.
CONCLUSIONS
Overall, our study suggests that the light and sound environment for sleep in the inpatient setting, including both the ICU and non-ICU wards, has multiple areas for improvement. Our data also suggest specific directions for future clinical efforts at improvement. For example, efforts to decrease average sound levels may worsen sleep fragmentation. Similarly, more light during the day may be more helpful than further attempts to limit light during the night.
Disclosure
This research was funded in part by a NIH/NCATS flagship Clinical and Translational Science Award Grant (5KL2TR001112). None of the authors report any conflict of interest, financial or otherwise, in the preparation of this article.
1. Freedman NS, Gazendam J, Levan L, Pack AI, Schwab RJ. Abnormal sleep/wake
cycles and the effect of environmental noise on sleep disruption in the intensive
care unit. Am J Respir Crit Care Med. 2001;163(2):451-457. PubMed
2. Watson PL, Pandharipande P, Gehlbach BK, et al. Atypical sleep in ventilated
patients: empirical electroencephalography findings and the path toward revised ICU sleep scoring criteria. Crit Care Med. 2013;41(8):1958-1967. PubMed
3. Gehlbach BK, Chapotot F, Leproult R, et al. Temporal disorganization of circadian rhythmicity and sleep-wake regulation in mechanically ventilated patients receiving continuous intravenous sedation. Sleep. 2012;35(8):1105-1114. PubMed
4. Elliott R, McKinley S, Cistulli P, Fien M. Characterisation of sleep in intensive care using 24-hour polysomnography: an observational study. Crit Care. 2013;17(2):R46. PubMed
5. Novaes MA, Aronovich A, Ferraz MB, Knobel E. Stressors in ICU: patients’ evaluation. Intensive Care Med. 1997;23(12):1282-1285. PubMed
6. Tembo AC, Parker V, Higgins I. The experience of sleep deprivation in intensive care patients: findings from a larger hermeneutic phenomenological study. Intensive Crit Care Nurs. 2013;29(6):310-316. PubMed
7. Kamdar BB, Yang J, King LM, et al. Developing, implementing, and evaluating a multifaceted quality improvement intervention to promote sleep in an ICU. Am J Med Qual. 2014;29(6):546-554. PubMed
8. Patel J, Baldwin J, Bunting P, Laha S. The effect of a multicomponent multidisciplinary bundle of interventions on sleep and delirium in medical and surgical intensive care patients. Anaesthesia. 2014;69(6):540-549. PubMed
9. Manian FA, Manian CJ. Sleep quality in adult hospitalized patients with infection: an observational study. Am J Med Sci. 2015;349(1):56-60. PubMed
10. Park MJ, Yoo JH, Cho BW, Kim KT, Jeong WC, Ha M. Noise in hospital rooms and sleep disturbance in hospitalized medical patients. Environ Health Toxicol. 2014;29:e2014006. PubMed
11. Dobing S, Frolova N, McAlister F, Ringrose J. Sleep quality and factors influencing self-reported sleep duration and quality in the general internal medicine inpatient population. PLoS One. 2016;11(6):e0156735. PubMed
12. Gillis CM, Poyant JO, Degrado JR, Ye L, Anger KE, Owens RL. Inpatient pharmacological
sleep aid utilization is common at a tertiary medical center. J Hosp Med. 2014;9(10):652-657. PubMed
13. Krenk L, Jennum P, Kehlet H. Postoperative sleep disturbances after zolpidem treatment in fast-track hip and knee replacement. J Clin Sleep Med. 2014;10(3):321-326. PubMed
14. Kolla BP, Lovely JK, Mansukhani MP, Morgenthaler TI. Zolpidem is independently
associated with increased risk of inpatient falls. J Hosp Med. 2013;8(1):1-6. PubMed
15. Inouye SK, Bogardus ST Jr, Charpentier PA, et al. A multicomponent intervention to prevent delirium in hospitalized older patients. N Engl J Med. 1999;340(9):669-676. PubMed
16. Bano M, Chiaromanni F, Corrias M, et al. The influence of environmental factors on sleep quality in hospitalized medical patients. Front Neurol. 2014;5:267. PubMed
17. Berglund BLTSD. Guidelines for Community Noise. World Health Organization. 1999.
18. Knauert M, Jeon S, Murphy TE, Yaggi HK, Pisani MA, Redeker NS. Comparing average levels and peak occurrence of overnight sound in the medical intensive care unit on A-weighted and C-weighted decibel scales. J Crit Care. 2016;36:1-7. PubMed
19. Yoder JC, Staisiunas PG, Meltzer DO, Knutson KL, Arora VM. Noise and sleep among adult medical inpatients: far from a quiet night. Arch Intern Med. 2012;172(1):68-70. PubMed
20. Buxton OM, Ellenbogen JM, Wang W, et al. Sleep disruption due to hospital noises: a prospective evaluation. Ann Intern Med. 2012;157(3):170-179. PubMed
21. Stanchina ML, Abu-Hijleh M, Chaudhry BK, Carlisle CC, Millman RP. The influence of white noise on sleep in subjects exposed to ICU noise. Sleep Med. 2005;6(5):423-428. PubMed
22. Czeisler CA, Allan JS, Strogatz SH, et al. Bright light resets the human circadian pacemaker independent of the timing of the sleep-wake cycle. Science. 1986;233(4764):667-671. PubMed
23. Duffy JF, Czeisler CA. Effect of light on human circadian physiology. Sleep Med Clin. 2009;4(2):165-177. PubMed
24. Lewy AJ, Wehr TA, Goodwin FK, Newsome DA, Markey SP. Light suppresses melatonin secretion in humans. Science. 1980;210(4475):1267-1269. PubMed
25. Zeitzer JM, Dijk DJ, Kronauer R, Brown E, Czeisler C. Sensitivity of the human circadian pacemaker to nocturnal light: melatonin phase resetting and suppression. J Physiol. 2000;526:695-702. PubMed
26. Bernhofer EI, Higgins PA, Daly BJ, Burant CJ, Hornick TR. Hospital lighting and its association with sleep, mood and pain in medical inpatients. J Adv Nurs. 2014;70(5):1164-1173. PubMed
27. Darbyshire JL, Young JD. An investigation of sound levels on intensive care units with reference to the WHO guidelines. Crit Care. 2013;17(5):R187. PubMed
28. Gillis S. Pharmacologic treatment of depression during pregnancy. J Midwifery Womens Health. 2000;45(4):357-359. PubMed
29. Tainter CR, Levine AR, Quraishi SA, et al. Noise levels in surgical ICUs are consistently above recommended standards. Crit Care Med. 2016;44(1):147-152. PubMed
30. Farrehi PM, Clore KR, Scott JR, Vanini G, Clauw DJ. Efficacy of Sleep Tool Education During Hospitalization: A Randomized Controlled Trial. Am J Med. 2016;129(12):1329.e9-1329.e17. PubMed
31. Farokhnezhad Afshar P, Bahramnezhad F, Asgari P, Shiri M. Effect of white noise on sleep in patients admitted to a coronary care. J Caring Sci. 2016;5(2):103-109. PubMed
32. Bartick MC, Thai X, Schmidt T, Altaye A, Solet JM. Decrease in as-needed sedative use by limiting nighttime sleep disruptions from hospital staff. J Hosp Med. 2010;5(3):E20-E24. PubMed
33. Tamrat R, Huynh-Le MP, Goyal M. Non-pharmacologic interventions to improve the sleep of hospitalized patients: a systematic review. J Gen Intern Med. 2014;29(5):788-795. PubMed
34. Dijk DJ, Archer SN. Light, sleep, and circadian rhythms: together again. PLoS Biol. 2009;7(6):e1000145. PubMed
35. Verceles AC, Liu X, Terrin ML, et al. Ambient light levels and critical care outcomes. J Crit Care. 2013;28(1):110.e1-110.e8. PubMed
36. Hu RF, Hegadoren KM, Wang XY, Jiang XY. An investigation of light and sound levels on intensive care units in China. Aust Crit Care. 2016;29(2):62-67. PubMed
37. Zeitzer JM, Ruby NF, Fisicaro RA, Heller HC. Response of the human circadian system to millisecond flashes of light. PLoS One. 2011;6(7):e22078. PubMed
38. Duffy JF, Wright KP, Jr. Entrainment of the human circadian system by light. J Biol Rhythms. 2005;20(4):326-338. PubMed
39. Wright KP Jr, Gronfier C, Duffy JF, Czeisler CA. Intrinsic period and light intensity determine the phase relationship between melatonin and sleep in humans. J Biol Rhythms. 2005;20(2):168-177. PubMed
40. Duffy JF, Zeitzer JM, Czeisler CA. Decreased sensitivity to phase-delaying effects of moderate intensity light in older subjects. Neurobiol Aging. 2007;28(5):799-807. PubMed
41. Figueiro MG, Plitnick BA, Lok A, et al. Tailored lighting intervention improves measures of sleep, depression, and agitation in persons with Alzheimer’s disease and related dementia living in long-term care facilities. Clin Interv Aging. 2014;9:1527-1537. PubMed
© 2017 Society of Hospital Medicine
Reliability of 3-Dimensional Glenoid Component Templating and Correlation to Intraoperative Component Selection
Take-Home Points
- Guidelines regarding glenoid component size selection for primary TSA are lacking.
- Intraoperative in situ glenoid sizing may not be ideal.
- 3-D digital models may be utilized for preoperative templating of glenoid component size in primary TSA.
- 3-D templating that allows for superior-inferior, anterior-posterior, and rotational translation can lead to consistent and reproducible templating of glenoid component size.
- 3-D templating may reduce the risks of implant overhang, peg penetration, and decreased stability ratio.
In 1974, Neer1 introduced the shoulder prosthesis. In 1982, Neer and colleagues2 found significant improvement in shoulder pain and function in patients with glenohumeral osteoarthritis treated with the Neer prosthesis. Since then, use of total shoulder arthroplasty (TSA) has increased. Between 1993 and 2007, TSA use increased 319% in the United States.3 Long-term outcomes studies have found implant survivorship ranging from 87% to 93% at 10 to 15 years.4
Although TSA is a successful procedure, glenoid component failure is the most common complication.5-10 Outcomes of revision surgery for glenoid instability are inferior to those of primary TSA.11 Recent research findings highlight the effect of glenoid size on TSA complications.12 A larger glenoid component increases the stability ratio (peak subluxation force divided by compression load).12 However, insufficient glenoid bone stock, small glenoid diameter, and inability to fit a properly sized reamer owing to soft-tissue constraints may lead surgeons to choose a smaller glenoid component in order to avoid peg penetration, overhang, and soft-tissue damage, respectively. Therefore, preoperative templating of glenoid size is a potential strategy for minimizing complications.
Templating is performed for proximal humeral components, but glenoid sizing typically is deferred to intraoperative in situ sizing with implant-specific targeting guides. This glenoid sizing practice arose out of a lack of standard digital glenoid templates and difficulty in selecting glenoid size based on plain radiographs and/or 2-dimensional (2-D) computed tomography (CT) scans. However, targeting devices are sporadically used during surgery, and intraoperative glenoid vault dimension estimates derived from visualization and palpation are often inaccurate. Often, rather than directly assess glenoid morphology, surgeons infer glenoid size from the size and sex of patients.13
Three-dimensional (3-D) CT can be used to accurately assess glenoid version, bone loss, and implant fit.14-19 We conducted a study to determine if 3-D digital imaging can be consistently and reproducibly used for preoperative templating of glenoid component size and to determine if glenoid sizes derived from templating correlate with the sizes of subsequently implanted glenoids.
Materials and Methods
This retrospective study was conducted at the Center for Shoulder, Elbow, and Sports Medicine at Columbia University Medical Center in New York City and was approved by our Institutional Review Board. Included in the study were all patients who underwent primary TSA for primary glenohumeral osteoarthritis over a 12-month period. Patients were required to have preoperative CT performed according to our study protocol. The CT protocol consisted of 0.5-mm axial cuts of the entire scapula and 3-D reconstruction of the scapula, glenoid, glenohumeral articulation, and proximal humerus. Patients were excluded from the study for primary TSA for a secondary cause of glenohumeral osteoarthritis, inflammatory arthritis, connective tissue disease, prior contralateral TSA, and prior ipsilateral scapula, glenoid, and proximal humerus surgery. Ultimately, 24 patients were included in the study.
CT data were formatted for preoperative templating. The CT images of each patient’s scapula were uploaded into Materialise Interactive Medical Image Control System (Mimics) software. Mimics allows 3-D image rendering and editing from various imaging modalities and formats. The software was used to create the 3-D scapula models for templating. Prior studies have validated the anatomical precision of 3-D models created with Mimics.20
Mimics was also used to digitize in 3-D the glenoid components from the Bigliani-Flatow Shoulder System (Zimmer Biomet). Glenoid components of 3 different sizes (40 mm, 46 mm, 52 mm) were used. (The Bigliani glenoid component was digitized, as this implant system was used for primary TSA in all 24 patients.) Each glenoid component was traced in 3-D with a Gage 2000 coordinate-measuring machine (Brown & Sharpe) and was processed with custom software. The custom software, cited in previous work by our group,17 created the same coordinate system for each scapula based on anatomical reference points. These digitized 3-D images of glenoid components were uploaded with the digitized 3-D scapulae derived from patients’ CT scans to the Magics software. Magics allows for manipulation and interaction of multiple 3-D models by creating electronic stereolithography files that provide 3-D surface geometry.
Three fellowship-trained shoulder surgeons and 4 shoulder fellows templated the most appropriately sized glenoid component for each of the 24 patients. At the time of templating, the surgeon was blinded to the size of the glenoid implant used in the surgery. In Magics, each scapula was positioned in 3-D similar to how it would appear with the patient in the beach-chair position during surgery. In both study arms, surgeons selected the largest component that maximized the area of contact while avoiding peg penetration of the glenoid vault or component overhang. In addition, surgeons were instructed to correct glenoid version to as near neutral as possible with component positioning but were not permitted to remove glenoid bone stock to correct deformity. All surgeons based placement of the glenoid component on the patient’s actual bone stock and not on osteophytes, which are readily appreciable on 3-D CT.
In study arm 1, the 3-D view of the glenoid was restricted to the initial view in the beach-chair position. The surgeon then manipulated the 3-D glenoid component template across a single 2-D plane, either the superior-inferior plane or the anterior-posterior plane, over the surface of the 3-D glenoid (Figure 1). 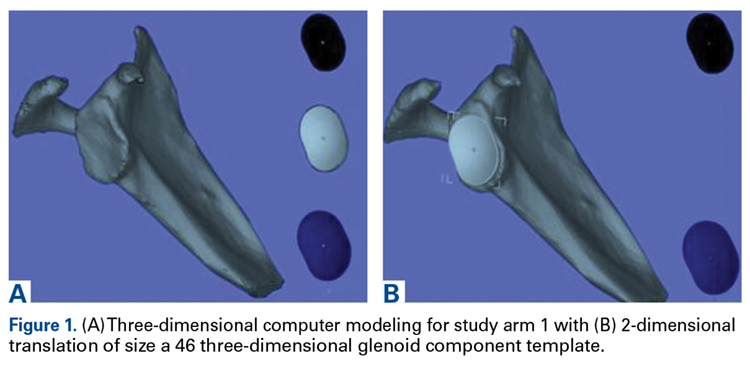
In study arm 2, surgeons were permitted to rotate the 3-D glenoid template and scapula in any manner (Figure 2). 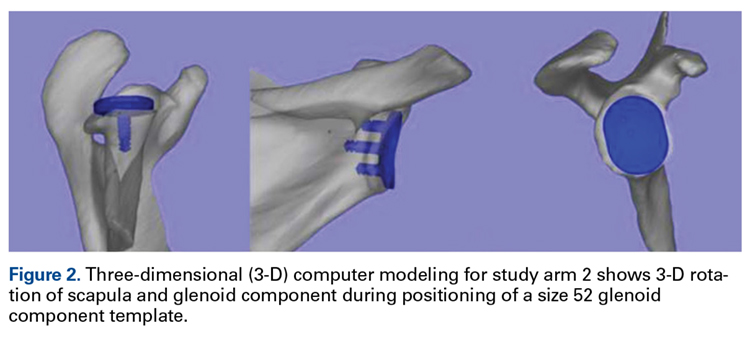
Interobserver agreement was determined by comparing prosthetic glenoid component size selection among all study surgeons, and intraobserver agreement was determined by comparing glenoid size selection during 2 sessions separated by at least 3 weeks.
After each trial, the order of patients’ scapula images was randomly rearranged to reduce recall bias. Kappa (κ) coefficients were calculated for interobserver and intraobserver agreement. Kappas ranged from −1.0 (least agreement) to +1.0 (complete agreement). A κ of 0 indicated an observer selection was equivalent to random chance. The level of agreement was categorized according to κ using a system described by Landis and Koch21 (Table 1). 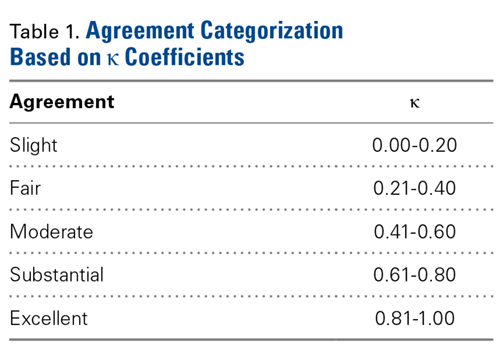
Results
The group of 24 patients consisted of 15 men and 9 women. Mean age was 70.3 years (range, 56-88 years). Primary TSA was performed in 14 right shoulders and 10 left shoulders. Of the 24 patients, 20 (83%) had a 46-mm glenoid component implanted, 3 male patients had a 52-mm glenoid component implanted, and 1 female patient had a 40-mm glenoid component implanted.
Study Arm 1: Glenoid Templating Based on 2 df
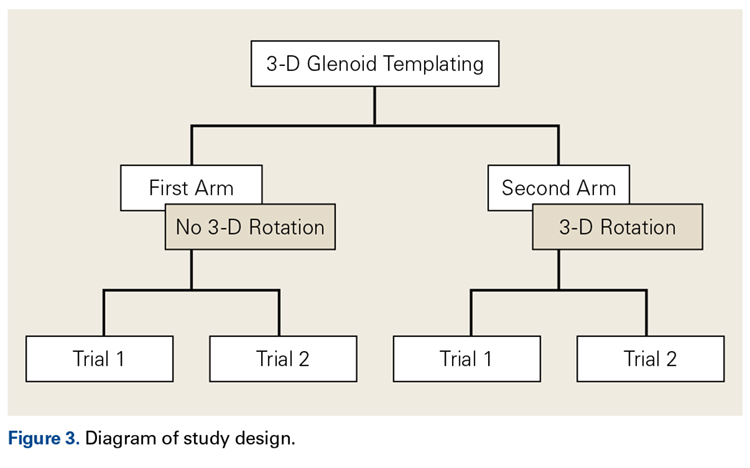
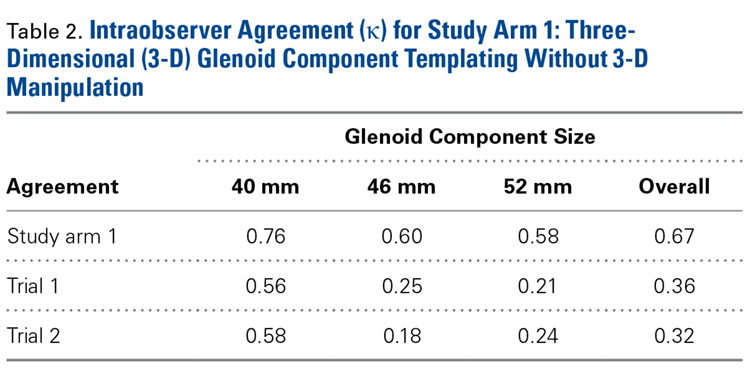
In study arm 1, overall intraobserver agreement was substantial, as defined in the statistical literature.21 Among all surgeons who participated, intraobserver agreeement was 0.76 (substantial), 0.60 (substantial), and 0.58 (moderate) for the 40-mm, 46-mm, and 52-mm glenoid components, respectively (overall κ = 0.67, substantial agreement). Trial 1 interobserver agreement was 0.56 (moderate) (P < .001), 0.25 (fair) (P < .001), and 0.21 (fair) (P < .001) for the 40-mm, 46-mm, and 52-mm glenoid components, respectively (overall κ = 0.36, fair agreement) (P < .001), and trial 2 interobserver agreement was 0.58 (moderate) (P < .001), 0.18 (poor) (P = .003), and 0.24 (fair) (P <.001) for the 40-mm, 46-mm, and 52-mm glenoid components, respectively (overall κ = 0.32, fair agreement) (P < .001). In study arm 1, therefore, trials 1 and 2 both showed fair interobserver agreement.
Study Arm 2: Glenoid Templating Based on 6 df
In study arm 2, a mean correlation of 0.42 (moderate agreement) was found between glenoid component size in 3-D templating and the glenoid component size ultimately selected during surgery (Table 3). 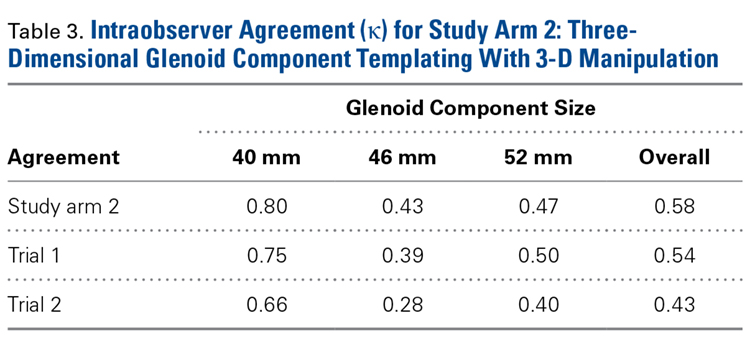
In study arm 2, overall intraobserver agreement was moderate. Among all surgeons who participated, intraobserver agreement was 0.80 (excellent), 0.43 (moderate), and 0.47 (moderate) for the 40-mm, 46-mm, and 52-mm glenoid components, respectively (overall κ = 0.58, moderate agreement). Trial 1 interobserver agreement was 0.75 (substantial) (P < .001), 0.39 (fair) (P < .001), and 0.50 (moderate) (P < .001) for the 40-mm, 46-mm, and 52-mm glenoid components, respectively (overall κ = 0.54, moderate agreement) (P < .001), and trial 2 interobserver agreement was 0.66 (substantial) (P < .001), 0.28 (fair) (P = .003), and 0.40 (moderate) (P < .001) for the 40-mm, 46-mm, and 52-mm glenoid components, respectively (overall κ = 0.43, moderate agreement) (P < .001).
Discussion
Our results showed that 3-D glenoid templating had reproducible intraobserver and interobserver agreement. Overall intraobserver agreement was substantial (κ = 0.67) for study arm 1 and moderate (κ = 0.58) for study arm 2. Interobserver agreement was fair for trials 1 and 2 (κ = 0.36 and 0.32) in arm 1 and moderate for trials 1 and 2 (κ = 0.54 and 0.43) in arm 2.
Intraobserver and interobserver agreement values, particularly in study arm 2, which incorporated rotation (6 df), are consistent with values in commonly used classification systems, such as the Neer system for proximal humerus fractures, the Frykman system for distal radius fractures, and the King system for adolescent idiopathic scoliosis.22-30 Sidor and colleagues27 found overall interobserver agreement of 0.50 and overall intraobserver agreement of 0.66 for the Neer system, and Illarramendi and colleagues24 found overall interobserver agreement of 0.43 and overall intraobserver agreement of 0.61 for the Frykman system.
In study arm 2, overall interobserver and intraobserver agreement was moderate. A higher level of surgeon agreement is unlikely given the lack of well-defined parameters for determining glenoid component size. Therefore, glenoid size selection is largely a matter of surgeon preference. More research is needed to establish concrete guidelines for glenoid component size selection. Once guidelines are adopted, interobserver agreement in templating may increase.
In both study arms, the component that surgeons selected during templating tended to be smaller than the component they selected during surgery. In study arm 1, 32% of patients had a smaller component selected based on computer modeling, and 7% had a larger component selected. In study arm 2, the difference was narrower: 27% of patients had a smaller component selected during templating, and 16% had a larger component selected. A statistically significant difference (P < .001) in templated and implanted component sizes was found between men and women: Templated glenoid components were smaller than implanted components in 53% of women and larger than implanted components in 33% of men. Differences between templated and implanted components may be attributable to visualization differences. During templating, the entire glenoid can be visualized and the slightest peg penetration or component overhang detected; in contrast, during surgery, anatomical constraints preclude such a comprehensive assessment.
Differences in agreement between templated and implanted glenoid components suggest that the size of implanted components may not be ideal. In this study, the distribution of the templated glenoid sizes was much wider than that of the implanted glenoid sizes. During templating, each glenoid component can be definitively visualized and assessed for possible peg penetration and overhang. Visualization allows surgeons to base glenoid size selection solely on glenoid morphology, as opposed to factors such as patient sex and height. In addition, interobserver and intraobserver agreement values for the 40-mm glenoid component were considerably higher than those for components of other sizes, indicating that the 40-mm component was consistently and reproducibly selected for the same patients. Hence, templating may particularly help prevent peg penetration and component overhang for patients with a smaller diameter glenoid.
More research on 3-D templating is warranted given the results of this study and other studies.12,17,31 Scalise and colleagues31 found that, in TSA planning, surgeons’ use of 2-D (vs 3-D) imaging led them to overestimate glenoid component sizes (P = .006). In our study, the glenoid size selected during 3-D templating was, in many cases, smaller than the size selected during surgery. In order to avoid peg penetration and glenoid overhang, anecdotal guidelines commonly used in glenoid size selection, likely was the driving force in selecting smaller glenoid components during templating. Although anterior, superior, and inferior glenoid overhang typically can be assessed during surgery, posterior overhang is more difficult to evaluate. Three-dimensional modeling allows surgeons to determine optimal glenoid component size and position. In addition, intraoperative evaluation of glenoid component peg penetration is challenging, and peg penetration becomes evident only after it has occurred. During templating, however, surgeons were able to easily assess for peg penetration, and smaller glenoid components were selected.
A limitation of this study is that intraoperative glenoid version correction or peg containment was not quantified. More research is needed on the relationship between glenoid size selection and component overhang and peg penetration. Another limitation was use of only 1 TSA system (with 3 glenoid sizes, all with inline pegs); reliability of 3-D templating was not evaluated across different component designs. Last, given the absence of guidelines for glenoid component size selection, there was surgeon bias in preoperative templating and in intraoperative selection of glenoid size. Surgeons had differing opinions on the importance of maximizing the contact area of the component and correcting glenoid deformity and version.
Our study results showed that preoperative 3-D templating that allows for superior-inferior, anterior-posterior, and rotational translation was consistent and reproducible in determining glenoid component size, and use of this templating may reduce the risks of implant overhang, peg penetration, and decreased stability ratio. These results highlight the possibility that glenoid component sizes selected during surgery may not be ideal. More research is needed to determine if intraoperative glenoid size selection leads to adequate version correction and peg containment. The present study supports use of 3-D templating in primary TSA planning.
1. Neer CS 2nd. Replacement arthroplasty for glenohumeral osteoarthritis. J Bone Joint Surg Am. 1974;56(1):1-13.
2. Neer CS 2nd, Watson KC, Stanton FJ. Recent experience in total shoulder replacement. J Bone Joint Surg Am. 1982;64(3):319-337.
3. Day JS, Lau E, Ong KL, Williams GR, Ramsey ML, Kurtz SM. Prevalence and projections of total shoulder and elbow arthroplasty in the United States to 2015. J Shoulder Elbow Surg. 2010;19(8):1115-1120.
4. Torchia ME, Cofield RH, Settergren CR. Total shoulder arthroplasty with the Neer prosthesis: long-term results. J Shoulder Elbow Surg. 1997;6(6):495-505.
5. Barrett WP, Franklin JL, Jackins SE, Wyss CR, Matsen FA 3rd. Total shoulder arthroplasty. J Bone Joint Surg Am. 1987;69(6):865-872.
6. Bohsali KI, Wirth MA, Rockwood CA Jr. Complications of total shoulder arthroplasty. J Bone Joint Surg Am. 2006;88(10):2279-2292.
7. Matsen FA 3rd, Bicknell RT, Lippitt SB. Shoulder arthroplasty: the socket perspective. J Shoulder Elbow Surg. 2007;16(5 suppl):S241-S247.
8. Matsen FA 3rd, Clinton J, Lynch J, Bertelsen A, Richardson ML. Glenoid component failure in total shoulder arthroplasty. J Bone Joint Surg Am. 2008;90(4):885-896.
9. Pearl ML, Romeo AA, Wirth MA, Yamaguchi K, Nicholson GP, Creighton RA. Decision making in contemporary shoulder arthroplasty. Instr Course Lect. 2005;54:69-85.
10. Wirth MA, Rockwood CA Jr. Complications of total shoulder-replacement arthroplasty. J Bone Joint Surg Am. 1996;78(4):603-616.
11. Sanchez-Sotelo J, Sperling JW, Rowland CM, Cofield RH. Instability after shoulder arthroplasty: results of surgical treatment. J Bone Joint Surg Am. 2003;85(4):622-631.
12. Tammachote N, Sperling JW, Berglund LJ, Steinmann SP, Cofield RH, An KN. The effect of glenoid component size on the stability of total shoulder arthroplasty. J Shoulder Elbow Surg. 2007;16(3 suppl):S102-S106.
13. Iannotti JP, Greeson C, Downing D, Sabesan V, Bryan JA. Effect of glenoid deformity on glenoid component placement in primary shoulder arthroplasty. J Shoulder Elbow Surg. 2012;21(1):48-55.
14. Briem D, Ruecker AH, Neumann J, et al. 3D fluoroscopic navigated reaming of the glenoid for total shoulder arthroplasty (TSA). Comput Aided Surg. 2011;16(2):93-99.
15. Budge MD, Lewis GS, Schaefer E, Coquia S, Flemming DJ, Armstrong AD. Comparison of standard two-dimensional and three-dimensional corrected glenoid version measurements. J Shoulder Elbow Surg. 2011;20(4):577-583.
16. Chuang TY, Adams CR, Burkhart SS. Use of preoperative three-dimensional computed tomography to quantify glenoid bone loss in shoulder instability. Arthroscopy. 2008;24(4):376-382.
17. Nowak DD, Bahu MJ, Gardner TR, et al. Simulation of surgical glenoid resurfacing using three-dimensional computed tomography of the arthritic glenohumeral joint: the amount of glenoid retroversion that can be corrected. J Shoulder Elbow Surg. 2009;18(5):680-688.
18. Scalise JJ, Bryan J, Polster J, Brems JJ, Iannotti JP. Quantitative analysis of glenoid bone loss in osteoarthritis using three-dimensional computed tomography scans. J Shoulder Elbow Surg. 2008;17(2):328-335.
19. Scalise JJ, Codsi MJ, Bryan J, Iannotti JP. The three-dimensional glenoid vault model can estimate normal glenoid version in osteoarthritis. J Shoulder Elbow Surg. 2008;17(3):487-491.
20. Bryce CD, Pennypacker JL, Kulkarni N, et al. Validation of three-dimensional models of in situ scapulae. J Shoulder Elbow Surg. 2008;17(5):825-832.
21. Landis JR, Koch GG. The measurement of observer agreement for categorical data. Biometrics. 1977;33(1):159-174.
22. Cummings RJ, Loveless EA, Campbell J, Samelson S, Mazur JM. Interobserver reliability and intraobserver reproducibility of the system of King et al. for the classification of adolescent idiopathic scoliosis. J Bone Joint Surg Am. 1998;80(8):1107-1111.
23. Humphrey CA, Dirschl DR, Ellis TJ. Interobserver reliability of a CT-based fracture classification system. J Orthop Trauma. 2005;19(9):616-622.
24. Illarramendi A, González Della Valle A, Segal E, De Carli P, Maignon G, Gallucci G. Evaluation of simplified Frykman and AO classifications of fractures of the distal radius. Assessment of interobserver and intraobserver agreement. Int Orthop. 1998;22(2):111-115.
25. Lenke LG, Betz RR, Bridwell KH, et al. Intraobserver and interobserver reliability of the classification of thoracic adolescent idiopathic scoliosis. J Bone Joint Surg Am. 1998;80(8):1097-1106.
26. Ploegmakers JJ, Mader K, Pennig D, Verheyen CC. Four distal radial fracture classification systems tested amongst a large panel of Dutch trauma surgeons. Injury. 2007;38(11):1268-1272.
27. Sidor ML, Zuckerman JD, Lyon T, Koval K, Cuomo F, Schoenberg N. The Neer classification system for proximal humeral fractures. An assessment of interobserver reliability and intraobserver reproducibility. J Bone Joint Surg Am. 1993;75(12):1745-1750.
28. Siebenrock KA, Gerber C. The reproducibility of classification of fractures of the proximal end of the humerus. J Bone Joint Surg Am. 1993;75(12):1751-1755.
29. Thomsen NO, Overgaard S, Olsen LH, Hansen H, Nielsen ST. Observer variation in the radiographic classification of ankle fractures. J Bone Joint Surg Br. 1991;73(4):676-678.
30. Ward WT, Vogt M, Grudziak JS, Tümer Y, Cook PC, Fitch RD. Severin classification system for evaluation of the results of operative treatment of congenital dislocation of the hip. A study of intraobserver and interobserver reliability. J Bone Joint Surg Am. 1997;79(5):656-663.
31. Scalise JJ, Codsi MJ, Bryan J, Brems JJ, Iannotti JP. The influence of three-dimensional computed tomography images of the shoulder in preoperative planning for total shoulder arthroplasty. J Bone Joint Surg Am. 2008;90(11):2438-2445.
Take-Home Points
- Guidelines regarding glenoid component size selection for primary TSA are lacking.
- Intraoperative in situ glenoid sizing may not be ideal.
- 3-D digital models may be utilized for preoperative templating of glenoid component size in primary TSA.
- 3-D templating that allows for superior-inferior, anterior-posterior, and rotational translation can lead to consistent and reproducible templating of glenoid component size.
- 3-D templating may reduce the risks of implant overhang, peg penetration, and decreased stability ratio.
In 1974, Neer1 introduced the shoulder prosthesis. In 1982, Neer and colleagues2 found significant improvement in shoulder pain and function in patients with glenohumeral osteoarthritis treated with the Neer prosthesis. Since then, use of total shoulder arthroplasty (TSA) has increased. Between 1993 and 2007, TSA use increased 319% in the United States.3 Long-term outcomes studies have found implant survivorship ranging from 87% to 93% at 10 to 15 years.4
Although TSA is a successful procedure, glenoid component failure is the most common complication.5-10 Outcomes of revision surgery for glenoid instability are inferior to those of primary TSA.11 Recent research findings highlight the effect of glenoid size on TSA complications.12 A larger glenoid component increases the stability ratio (peak subluxation force divided by compression load).12 However, insufficient glenoid bone stock, small glenoid diameter, and inability to fit a properly sized reamer owing to soft-tissue constraints may lead surgeons to choose a smaller glenoid component in order to avoid peg penetration, overhang, and soft-tissue damage, respectively. Therefore, preoperative templating of glenoid size is a potential strategy for minimizing complications.
Templating is performed for proximal humeral components, but glenoid sizing typically is deferred to intraoperative in situ sizing with implant-specific targeting guides. This glenoid sizing practice arose out of a lack of standard digital glenoid templates and difficulty in selecting glenoid size based on plain radiographs and/or 2-dimensional (2-D) computed tomography (CT) scans. However, targeting devices are sporadically used during surgery, and intraoperative glenoid vault dimension estimates derived from visualization and palpation are often inaccurate. Often, rather than directly assess glenoid morphology, surgeons infer glenoid size from the size and sex of patients.13
Three-dimensional (3-D) CT can be used to accurately assess glenoid version, bone loss, and implant fit.14-19 We conducted a study to determine if 3-D digital imaging can be consistently and reproducibly used for preoperative templating of glenoid component size and to determine if glenoid sizes derived from templating correlate with the sizes of subsequently implanted glenoids.
Materials and Methods
This retrospective study was conducted at the Center for Shoulder, Elbow, and Sports Medicine at Columbia University Medical Center in New York City and was approved by our Institutional Review Board. Included in the study were all patients who underwent primary TSA for primary glenohumeral osteoarthritis over a 12-month period. Patients were required to have preoperative CT performed according to our study protocol. The CT protocol consisted of 0.5-mm axial cuts of the entire scapula and 3-D reconstruction of the scapula, glenoid, glenohumeral articulation, and proximal humerus. Patients were excluded from the study for primary TSA for a secondary cause of glenohumeral osteoarthritis, inflammatory arthritis, connective tissue disease, prior contralateral TSA, and prior ipsilateral scapula, glenoid, and proximal humerus surgery. Ultimately, 24 patients were included in the study.
CT data were formatted for preoperative templating. The CT images of each patient’s scapula were uploaded into Materialise Interactive Medical Image Control System (Mimics) software. Mimics allows 3-D image rendering and editing from various imaging modalities and formats. The software was used to create the 3-D scapula models for templating. Prior studies have validated the anatomical precision of 3-D models created with Mimics.20
Mimics was also used to digitize in 3-D the glenoid components from the Bigliani-Flatow Shoulder System (Zimmer Biomet). Glenoid components of 3 different sizes (40 mm, 46 mm, 52 mm) were used. (The Bigliani glenoid component was digitized, as this implant system was used for primary TSA in all 24 patients.) Each glenoid component was traced in 3-D with a Gage 2000 coordinate-measuring machine (Brown & Sharpe) and was processed with custom software. The custom software, cited in previous work by our group,17 created the same coordinate system for each scapula based on anatomical reference points. These digitized 3-D images of glenoid components were uploaded with the digitized 3-D scapulae derived from patients’ CT scans to the Magics software. Magics allows for manipulation and interaction of multiple 3-D models by creating electronic stereolithography files that provide 3-D surface geometry.
Three fellowship-trained shoulder surgeons and 4 shoulder fellows templated the most appropriately sized glenoid component for each of the 24 patients. At the time of templating, the surgeon was blinded to the size of the glenoid implant used in the surgery. In Magics, each scapula was positioned in 3-D similar to how it would appear with the patient in the beach-chair position during surgery. In both study arms, surgeons selected the largest component that maximized the area of contact while avoiding peg penetration of the glenoid vault or component overhang. In addition, surgeons were instructed to correct glenoid version to as near neutral as possible with component positioning but were not permitted to remove glenoid bone stock to correct deformity. All surgeons based placement of the glenoid component on the patient’s actual bone stock and not on osteophytes, which are readily appreciable on 3-D CT.
In study arm 1, the 3-D view of the glenoid was restricted to the initial view in the beach-chair position. The surgeon then manipulated the 3-D glenoid component template across a single 2-D plane, either the superior-inferior plane or the anterior-posterior plane, over the surface of the 3-D glenoid (Figure 1).
In study arm 2, surgeons were permitted to rotate the 3-D glenoid template and scapula in any manner (Figure 2).
Interobserver agreement was determined by comparing prosthetic glenoid component size selection among all study surgeons, and intraobserver agreement was determined by comparing glenoid size selection during 2 sessions separated by at least 3 weeks.
After each trial, the order of patients’ scapula images was randomly rearranged to reduce recall bias. Kappa (κ) coefficients were calculated for interobserver and intraobserver agreement. Kappas ranged from −1.0 (least agreement) to +1.0 (complete agreement). A κ of 0 indicated an observer selection was equivalent to random chance. The level of agreement was categorized according to κ using a system described by Landis and Koch21 (Table 1).
Results
The group of 24 patients consisted of 15 men and 9 women. Mean age was 70.3 years (range, 56-88 years). Primary TSA was performed in 14 right shoulders and 10 left shoulders. Of the 24 patients, 20 (83%) had a 46-mm glenoid component implanted, 3 male patients had a 52-mm glenoid component implanted, and 1 female patient had a 40-mm glenoid component implanted.
Study Arm 1: Glenoid Templating Based on 2 df
In study arm 1, overall intraobserver agreement was substantial, as defined in the statistical literature.21 Among all surgeons who participated, intraobserver agreeement was 0.76 (substantial), 0.60 (substantial), and 0.58 (moderate) for the 40-mm, 46-mm, and 52-mm glenoid components, respectively (overall κ = 0.67, substantial agreement). Trial 1 interobserver agreement was 0.56 (moderate) (P < .001), 0.25 (fair) (P < .001), and 0.21 (fair) (P < .001) for the 40-mm, 46-mm, and 52-mm glenoid components, respectively (overall κ = 0.36, fair agreement) (P < .001), and trial 2 interobserver agreement was 0.58 (moderate) (P < .001), 0.18 (poor) (P = .003), and 0.24 (fair) (P <.001) for the 40-mm, 46-mm, and 52-mm glenoid components, respectively (overall κ = 0.32, fair agreement) (P < .001). In study arm 1, therefore, trials 1 and 2 both showed fair interobserver agreement.
Study Arm 2: Glenoid Templating Based on 6 df
In study arm 2, a mean correlation of 0.42 (moderate agreement) was found between glenoid component size in 3-D templating and the glenoid component size ultimately selected during surgery (Table 3).
In study arm 2, overall intraobserver agreement was moderate. Among all surgeons who participated, intraobserver agreement was 0.80 (excellent), 0.43 (moderate), and 0.47 (moderate) for the 40-mm, 46-mm, and 52-mm glenoid components, respectively (overall κ = 0.58, moderate agreement). Trial 1 interobserver agreement was 0.75 (substantial) (P < .001), 0.39 (fair) (P < .001), and 0.50 (moderate) (P < .001) for the 40-mm, 46-mm, and 52-mm glenoid components, respectively (overall κ = 0.54, moderate agreement) (P < .001), and trial 2 interobserver agreement was 0.66 (substantial) (P < .001), 0.28 (fair) (P = .003), and 0.40 (moderate) (P < .001) for the 40-mm, 46-mm, and 52-mm glenoid components, respectively (overall κ = 0.43, moderate agreement) (P < .001).
Discussion
Our results showed that 3-D glenoid templating had reproducible intraobserver and interobserver agreement. Overall intraobserver agreement was substantial (κ = 0.67) for study arm 1 and moderate (κ = 0.58) for study arm 2. Interobserver agreement was fair for trials 1 and 2 (κ = 0.36 and 0.32) in arm 1 and moderate for trials 1 and 2 (κ = 0.54 and 0.43) in arm 2.
Intraobserver and interobserver agreement values, particularly in study arm 2, which incorporated rotation (6 df), are consistent with values in commonly used classification systems, such as the Neer system for proximal humerus fractures, the Frykman system for distal radius fractures, and the King system for adolescent idiopathic scoliosis.22-30 Sidor and colleagues27 found overall interobserver agreement of 0.50 and overall intraobserver agreement of 0.66 for the Neer system, and Illarramendi and colleagues24 found overall interobserver agreement of 0.43 and overall intraobserver agreement of 0.61 for the Frykman system.
In study arm 2, overall interobserver and intraobserver agreement was moderate. A higher level of surgeon agreement is unlikely given the lack of well-defined parameters for determining glenoid component size. Therefore, glenoid size selection is largely a matter of surgeon preference. More research is needed to establish concrete guidelines for glenoid component size selection. Once guidelines are adopted, interobserver agreement in templating may increase.
In both study arms, the component that surgeons selected during templating tended to be smaller than the component they selected during surgery. In study arm 1, 32% of patients had a smaller component selected based on computer modeling, and 7% had a larger component selected. In study arm 2, the difference was narrower: 27% of patients had a smaller component selected during templating, and 16% had a larger component selected. A statistically significant difference (P < .001) in templated and implanted component sizes was found between men and women: Templated glenoid components were smaller than implanted components in 53% of women and larger than implanted components in 33% of men. Differences between templated and implanted components may be attributable to visualization differences. During templating, the entire glenoid can be visualized and the slightest peg penetration or component overhang detected; in contrast, during surgery, anatomical constraints preclude such a comprehensive assessment.
Differences in agreement between templated and implanted glenoid components suggest that the size of implanted components may not be ideal. In this study, the distribution of the templated glenoid sizes was much wider than that of the implanted glenoid sizes. During templating, each glenoid component can be definitively visualized and assessed for possible peg penetration and overhang. Visualization allows surgeons to base glenoid size selection solely on glenoid morphology, as opposed to factors such as patient sex and height. In addition, interobserver and intraobserver agreement values for the 40-mm glenoid component were considerably higher than those for components of other sizes, indicating that the 40-mm component was consistently and reproducibly selected for the same patients. Hence, templating may particularly help prevent peg penetration and component overhang for patients with a smaller diameter glenoid.
More research on 3-D templating is warranted given the results of this study and other studies.12,17,31 Scalise and colleagues31 found that, in TSA planning, surgeons’ use of 2-D (vs 3-D) imaging led them to overestimate glenoid component sizes (P = .006). In our study, the glenoid size selected during 3-D templating was, in many cases, smaller than the size selected during surgery. In order to avoid peg penetration and glenoid overhang, anecdotal guidelines commonly used in glenoid size selection, likely was the driving force in selecting smaller glenoid components during templating. Although anterior, superior, and inferior glenoid overhang typically can be assessed during surgery, posterior overhang is more difficult to evaluate. Three-dimensional modeling allows surgeons to determine optimal glenoid component size and position. In addition, intraoperative evaluation of glenoid component peg penetration is challenging, and peg penetration becomes evident only after it has occurred. During templating, however, surgeons were able to easily assess for peg penetration, and smaller glenoid components were selected.
A limitation of this study is that intraoperative glenoid version correction or peg containment was not quantified. More research is needed on the relationship between glenoid size selection and component overhang and peg penetration. Another limitation was use of only 1 TSA system (with 3 glenoid sizes, all with inline pegs); reliability of 3-D templating was not evaluated across different component designs. Last, given the absence of guidelines for glenoid component size selection, there was surgeon bias in preoperative templating and in intraoperative selection of glenoid size. Surgeons had differing opinions on the importance of maximizing the contact area of the component and correcting glenoid deformity and version.
Our study results showed that preoperative 3-D templating that allows for superior-inferior, anterior-posterior, and rotational translation was consistent and reproducible in determining glenoid component size, and use of this templating may reduce the risks of implant overhang, peg penetration, and decreased stability ratio. These results highlight the possibility that glenoid component sizes selected during surgery may not be ideal. More research is needed to determine if intraoperative glenoid size selection leads to adequate version correction and peg containment. The present study supports use of 3-D templating in primary TSA planning.
1. Neer CS 2nd. Replacement arthroplasty for glenohumeral osteoarthritis. J Bone Joint Surg Am. 1974;56(1):1-13.
2. Neer CS 2nd, Watson KC, Stanton FJ. Recent experience in total shoulder replacement. J Bone Joint Surg Am. 1982;64(3):319-337.
3. Day JS, Lau E, Ong KL, Williams GR, Ramsey ML, Kurtz SM. Prevalence and projections of total shoulder and elbow arthroplasty in the United States to 2015. J Shoulder Elbow Surg. 2010;19(8):1115-1120.
4. Torchia ME, Cofield RH, Settergren CR. Total shoulder arthroplasty with the Neer prosthesis: long-term results. J Shoulder Elbow Surg. 1997;6(6):495-505.
5. Barrett WP, Franklin JL, Jackins SE, Wyss CR, Matsen FA 3rd. Total shoulder arthroplasty. J Bone Joint Surg Am. 1987;69(6):865-872.
6. Bohsali KI, Wirth MA, Rockwood CA Jr. Complications of total shoulder arthroplasty. J Bone Joint Surg Am. 2006;88(10):2279-2292.
7. Matsen FA 3rd, Bicknell RT, Lippitt SB. Shoulder arthroplasty: the socket perspective. J Shoulder Elbow Surg. 2007;16(5 suppl):S241-S247.
8. Matsen FA 3rd, Clinton J, Lynch J, Bertelsen A, Richardson ML. Glenoid component failure in total shoulder arthroplasty. J Bone Joint Surg Am. 2008;90(4):885-896.
9. Pearl ML, Romeo AA, Wirth MA, Yamaguchi K, Nicholson GP, Creighton RA. Decision making in contemporary shoulder arthroplasty. Instr Course Lect. 2005;54:69-85.
10. Wirth MA, Rockwood CA Jr. Complications of total shoulder-replacement arthroplasty. J Bone Joint Surg Am. 1996;78(4):603-616.
11. Sanchez-Sotelo J, Sperling JW, Rowland CM, Cofield RH. Instability after shoulder arthroplasty: results of surgical treatment. J Bone Joint Surg Am. 2003;85(4):622-631.
12. Tammachote N, Sperling JW, Berglund LJ, Steinmann SP, Cofield RH, An KN. The effect of glenoid component size on the stability of total shoulder arthroplasty. J Shoulder Elbow Surg. 2007;16(3 suppl):S102-S106.
13. Iannotti JP, Greeson C, Downing D, Sabesan V, Bryan JA. Effect of glenoid deformity on glenoid component placement in primary shoulder arthroplasty. J Shoulder Elbow Surg. 2012;21(1):48-55.
14. Briem D, Ruecker AH, Neumann J, et al. 3D fluoroscopic navigated reaming of the glenoid for total shoulder arthroplasty (TSA). Comput Aided Surg. 2011;16(2):93-99.
15. Budge MD, Lewis GS, Schaefer E, Coquia S, Flemming DJ, Armstrong AD. Comparison of standard two-dimensional and three-dimensional corrected glenoid version measurements. J Shoulder Elbow Surg. 2011;20(4):577-583.
16. Chuang TY, Adams CR, Burkhart SS. Use of preoperative three-dimensional computed tomography to quantify glenoid bone loss in shoulder instability. Arthroscopy. 2008;24(4):376-382.
17. Nowak DD, Bahu MJ, Gardner TR, et al. Simulation of surgical glenoid resurfacing using three-dimensional computed tomography of the arthritic glenohumeral joint: the amount of glenoid retroversion that can be corrected. J Shoulder Elbow Surg. 2009;18(5):680-688.
18. Scalise JJ, Bryan J, Polster J, Brems JJ, Iannotti JP. Quantitative analysis of glenoid bone loss in osteoarthritis using three-dimensional computed tomography scans. J Shoulder Elbow Surg. 2008;17(2):328-335.
19. Scalise JJ, Codsi MJ, Bryan J, Iannotti JP. The three-dimensional glenoid vault model can estimate normal glenoid version in osteoarthritis. J Shoulder Elbow Surg. 2008;17(3):487-491.
20. Bryce CD, Pennypacker JL, Kulkarni N, et al. Validation of three-dimensional models of in situ scapulae. J Shoulder Elbow Surg. 2008;17(5):825-832.
21. Landis JR, Koch GG. The measurement of observer agreement for categorical data. Biometrics. 1977;33(1):159-174.
22. Cummings RJ, Loveless EA, Campbell J, Samelson S, Mazur JM. Interobserver reliability and intraobserver reproducibility of the system of King et al. for the classification of adolescent idiopathic scoliosis. J Bone Joint Surg Am. 1998;80(8):1107-1111.
23. Humphrey CA, Dirschl DR, Ellis TJ. Interobserver reliability of a CT-based fracture classification system. J Orthop Trauma. 2005;19(9):616-622.
24. Illarramendi A, González Della Valle A, Segal E, De Carli P, Maignon G, Gallucci G. Evaluation of simplified Frykman and AO classifications of fractures of the distal radius. Assessment of interobserver and intraobserver agreement. Int Orthop. 1998;22(2):111-115.
25. Lenke LG, Betz RR, Bridwell KH, et al. Intraobserver and interobserver reliability of the classification of thoracic adolescent idiopathic scoliosis. J Bone Joint Surg Am. 1998;80(8):1097-1106.
26. Ploegmakers JJ, Mader K, Pennig D, Verheyen CC. Four distal radial fracture classification systems tested amongst a large panel of Dutch trauma surgeons. Injury. 2007;38(11):1268-1272.
27. Sidor ML, Zuckerman JD, Lyon T, Koval K, Cuomo F, Schoenberg N. The Neer classification system for proximal humeral fractures. An assessment of interobserver reliability and intraobserver reproducibility. J Bone Joint Surg Am. 1993;75(12):1745-1750.
28. Siebenrock KA, Gerber C. The reproducibility of classification of fractures of the proximal end of the humerus. J Bone Joint Surg Am. 1993;75(12):1751-1755.
29. Thomsen NO, Overgaard S, Olsen LH, Hansen H, Nielsen ST. Observer variation in the radiographic classification of ankle fractures. J Bone Joint Surg Br. 1991;73(4):676-678.
30. Ward WT, Vogt M, Grudziak JS, Tümer Y, Cook PC, Fitch RD. Severin classification system for evaluation of the results of operative treatment of congenital dislocation of the hip. A study of intraobserver and interobserver reliability. J Bone Joint Surg Am. 1997;79(5):656-663.
31. Scalise JJ, Codsi MJ, Bryan J, Brems JJ, Iannotti JP. The influence of three-dimensional computed tomography images of the shoulder in preoperative planning for total shoulder arthroplasty. J Bone Joint Surg Am. 2008;90(11):2438-2445.
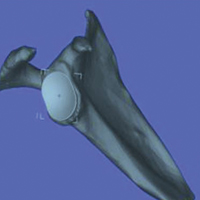
Association Between Anemia and Fatigue in Hospitalized Patients: Does the Measure of Anemia Matter?
Fatigue is the most common clinical symptom of anemia and is a significant concern to patients.1,2 In ambulatory patients, lower hemoglobin (Hb) concentration is associated with increased fatigue.2,3 Accordingly, therapies that treat anemia by increasing Hb concentration, such as erythropoiesis stimulating agents,4-7 often use fatigue as an outcome measure.
In hospitalized patients, transfusion of red blood cell increases Hb concentration and is the primary treatment for anemia. However, the extent to which transfusion and changes in Hb concentration affect hospitalized patients’ fatigue levels is not well established. Guidelines support transfusing patients with symptoms of anemia, such as fatigue, on the assumption that the increased oxygen delivery will improve the symptoms of anemia. While transfusion studies in hospitalized patients have consistently reported that transfusion at lower or “restrictive” Hb concentrations is safe compared with transfusion at higher Hb concentrations,8-10 these studies have mainly used cardiac events and mortality as outcomes rather than patient symptoms, such as fatigue. Nevertheless, they have resulted in hospitals increasingly adopting restrictive transfusion policies that discourage transfusion at higher Hb levels.11,12 Consequently, the rate of transfusion in hospitalized patients has decreased,13 raising questions of whether some patients with lower Hb concentrations may experience increased fatigue as a result of restrictive transfusion policies. Fatigue among hospitalized patients is important not only because it is an adverse symptom but because it may result in decreased activity levels, deconditioning, and losses in functional status.14,15While the effect of alternative transfusion policies on fatigue in hospitalized patients could be answered by a randomized clinical trial using fatigue and functional status as outcomes, an important first step is to assess whether the Hb concentration of hospitalized patients is associated with their fatigue level during hospitalization. Because hospitalized patients often have acute illnesses that can cause fatigue in and of themselves, it is possible that anemia is not associated with fatigue in hospitalized patients despite anemia’s association with fatigue in ambulatory patients. Additionally, Hb concentration varies during hospitalization,16 raising the question of what measures of Hb during hospitalization might be most associated with anemia-related fatigue.
The objective of this study is to explore multiple Hb measures in hospitalized medical patients with anemia and test whether any of these Hb measures are associated with patients’ fatigue level.
METHODS
Study Design
We performed a prospective, observational study of hospitalized patients with anemia on the general medicine services at The University of Chicago Medical Center (UCMC). The institutional review board approved the study procedures, and all study subjects provided informed consent.
Study Eligibility
Between April 2014 and June 2015, all general medicine inpatients were approached for written consent for The University of Chicago Hospitalist Project,17 a research infrastructure at UCMC. Among patients consenting to participate in the Hospitalist Project, patients were eligible if they had Hb <9 g/dL at any point during their hospitalization and were age ≥50 years. Hb concentration of <9 g/dL was chosen to include the range of Hb values covered by most restrictive transfusion policies.8-10,18 Age ≥50 years was an inclusion criteria because anemia is more strongly associated with poor outcomes, including functional impairment, among older patients compared with younger patients.14,19-21 If patients were not eligible for inclusion at the time of consent for the Hospitalist Project, their Hb values were reviewed twice daily until hospital discharge to assess if their Hb was <9 g/dL. Proxies were sought to answer questions for patients who failed the Short Portable Mental Status Questionnaire.22
Patient Demographic Data Collection
Research assistants abstracted patient age and sex from the electronic health record (EHR), and asked patients to self-identify their race. The individual comorbidities included as part of the Charlson Comorbidity Index were identified using International Classification of Diseases, 9th Revision codes from hospital administrative data for each encounter and specifically included the following: myocardial infarction, congestive heart failure, peripheral vascular disease, cerebrovascular disease, dementia, chronic pulmonary disease, rheumatic disease, peptic ulcer disease, liver disease, diabetes, hemiplegia and/or paraplegia, renal disease, cancer, and human immunodeficiency virus/acquired immunodeficiency syndrome.23 We also used Healthcare Cost and Utilization Project (www.hcup-us.ahrq.gov/toolssoftware/ccs/ccs.jsp) diagnosis categories to identify whether patients had sickle cell (SC) anemia, gastrointestinal bleeding (GIB), or a depressive disorder (DD) because these conditions are associated with anemia (SC and GIB) and fatigue (DD).24
Measuring Anemia
Hb measures were available only when hospital providers ordered them as part of routine practice. The first Hb concentration <9 g/dL during a patient’s hospitalization, which made them eligible for study participation, was obtained through manual review of the EHR. All additional Hb values during the patient’s hospitalization were obtained from the hospital’s administrative data mart. All Hb values collected for each patient during the hospitalization were used to calculate summary measures of Hb during the hospitalization, including the mean Hb, median Hb, minimum Hb, maximum Hb, admission (first recorded) Hb, and discharge (last recorded) Hb. Hb measures were analyzed both as a continuous variable and as a categorical variable created by dividing the continuous Hb measures into integer ranges of 3 groups of approximately the same size.
Measuring Fatigue
Our primary outcome was patients’ level of fatigue reported during hospitalization, measured using the Functional Assessment of Chronic Illness Therapy (FACIT)-Anemia questionnaire. Fatigue was measured using a 13-question fatigue subscale,1,2,25 which measures fatigue within the past 7 days. Scores on the fatigue subscale range from 0 to 52, with lower scores reflecting greater levels of fatigue. As soon as patients met the eligibility criteria for study participation during their hospitalization (age ≥50 years and Hb <9 g/dL), they were approached to answer the FACIT questions. Values for missing data in the fatigue subscale for individual subjects were filled in using a prorated score from their answered questions as long as >50% of the items in the fatigue subscale were answered, in accordance with recommendations for addressing missing data in the FACIT.26 Fatigue was analyzed as a continuous variable and as a dichotomous variable created by dividing the sample into high (FACIT <27) and low (FACIT ≥27) levels of fatigue based on the median FACIT score of the population. Previous literature has shown a FACIT fatigue subscale score between 23 and 26 to be associated with an Eastern Cooperative Oncology Group (ECOG)27 C Performance Status rating of 2 to 33 compared to scores ≥27.
Statistical Analysis
Statistical analysis was performed using Stata statistical software (StataCorp, College Station, TX). Descriptive statistics were used to characterize patient demographics. Analysis of variance was used to test for differences in the mean fatigue levels across Hb measures. χ2 tests were performed to test for associations between high fatigue levels and the Hb measures. Multivariable analysis, including both linear and logistic regression models, were used to test the association of Hb concentration and fatigue. P values <0.05 using a 2-tailed test were deemed statistically significant.
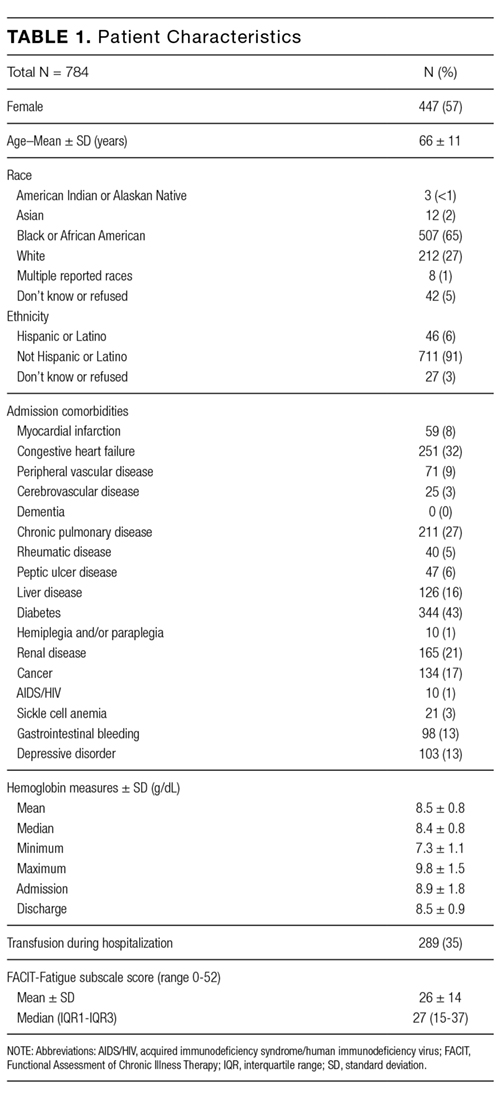
RESULTS
Patient Characteristics
During the study period, 8559 patients were admitted to the general medicine service. Of those, 5073 (59%) consented for participation in the Hospitalist Project, and 3670 (72%) completed the Hospitalist Project inpatient interview. Of these patients, 1292 (35%) had Hb <9 g/dL, and 784 (61%) were 50 years or older and completed the FACIT questionnaire.
Table 1 reports the demographic characteristics and comorbidities for the sample, the mean (standard deviation [SD]) for the 6 Hb measures, and mean (SD) and median FACIT scores.
Bivariate Association of Fatigue and Hb
Categorizing patients into low, middle, or high Hb for each of the 6 Hb measures, minimum Hb was strongly associated with fatigue, with a weaker association for mean Hb and no statistically significant association for the other measures.
Minimum Hb. Patients with a minimum Hb <7 g/dL and patients with Hb 7-8 g/dL had higher fatigue levels (FACIT = 25 for each) than patients with a minimum Hb ≥8 g/dL (FACIT = 29; P < 0.001; Table 2). When excluding patients with SC and/or GIB because their average minimum Hb differed from the average minimum Hb of the full population (P < 0.001), patients with a minimum Hb <7 g/dL or 7-8 g/dL had even higher fatigue levels (FACIT = 23 and FACIT = 24, respectively), with no change in the fatigue level of patients with a minimum Hb ≥8 g/dL (FACIT = 29; P < 0.001; Table 2). Lower minimum Hb continued to be associated with higher fatigue levels when analyzed in 0.5 g/dL increments (Figure).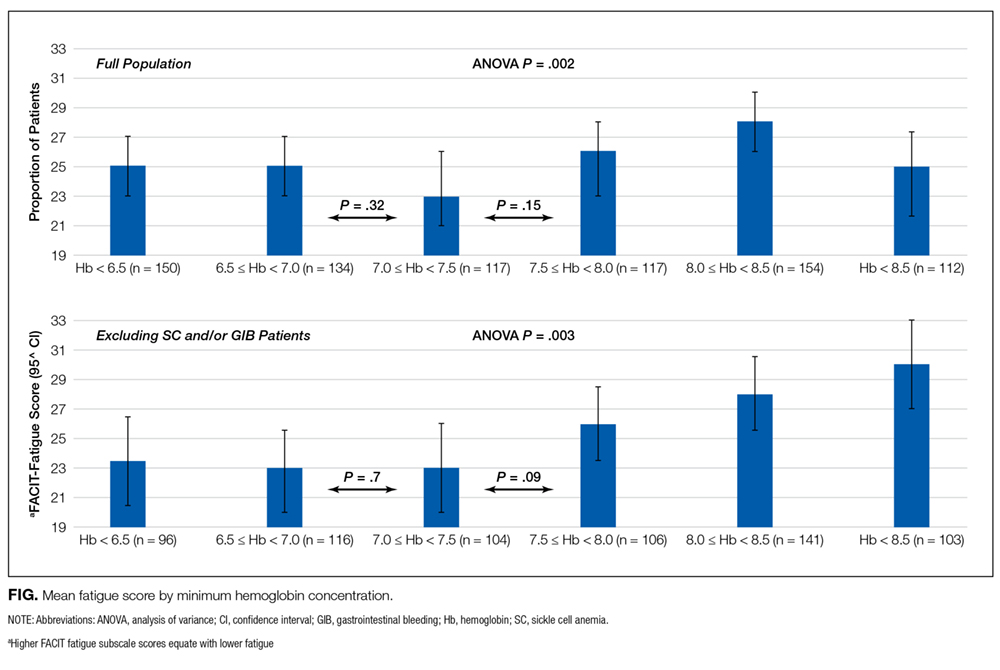
Mean Hb and Other Measures. Fatigue levels were high for 47% of patients with a mean Hb <8g /dL and 53% of patients with a mean Hb 8-9 g/dL compared with 43% of patients with a mean Hb ≥9 g/dL (P = 0.05). However, the association between high fatigue and mean Hb was not statistically significant when patients with SC and/or GIB were excluded (Table 2). None of the other 4 Hb measures was significantly associated with fatigue.
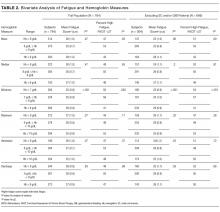
Linear Regression of Fatigue on Hb

In linear regression models, minimum Hb consistently predicted patient fatigue, mean Hb had a less robust association with fatigue, and the other Hb measures were not associated with patient fatigue. Increases in minimum Hb (analyzed as a continuous variable) were associated with reduced fatigue (higher FACIT score; β = 1.4; P = 0.005). In models in which minimum Hb was a categorical variable, patients with a minimum Hb of <7 g/dL or 7-8 g/dL had greater fatigue (lower FACIT score) than patients whose minimum Hb was ≥8 g/dL (Hb <7 g/dL: β = −4.2; P ≤ 0.001; Hb 7-8 g/dL: β = −4.1; P < 0.001). These results control for patients’ age, sex, individual comorbidities, and whether their minimum Hb occurred before or after the measurement of fatigue during hospitalization (Model 1), and the results are unchanged when also controlling for the number of Hb laboratory draws patients had during their hospitalization (Model 2; Table 3). In a stratified analysis excluding patients with either SC and/or GIB, changes in minimum Hb were associated with larger changes in patient fatigue levels (Supplemental Table 1). We also stratified our analysis to include only patients whose minimum Hb occurred before the measurement of their fatigue level during hospitalization to avoid a spurious association of fatigue with minimum Hb occurring after fatigue was measured. In both Models 1 and 2, minimum Hb remained a predictor of patients’ fatigue levels with similar effect sizes, although in Model 2, the results did not quite reach a statistically significant level, in part due to larger confidence intervals from the smaller sample size of this stratified analysis (Supplemental Table 2a). We further stratified this analysis to include only patients whose transfusion, if they received one, occurred after their minimum Hb and the measurement of their fatigue level to account for the possibility that a transfusion could affect the fatigue level patients report. In this analysis, most of the estimates of the effect of minimum Hb on fatigue were larger than those seen when only analyzing patients whose minimum Hb occurred before the measurement of their fatigue level, although again, the smaller sample size of this additional stratified analysis does produce larger confidence intervals for these estimates (Supplemental Table 2b).
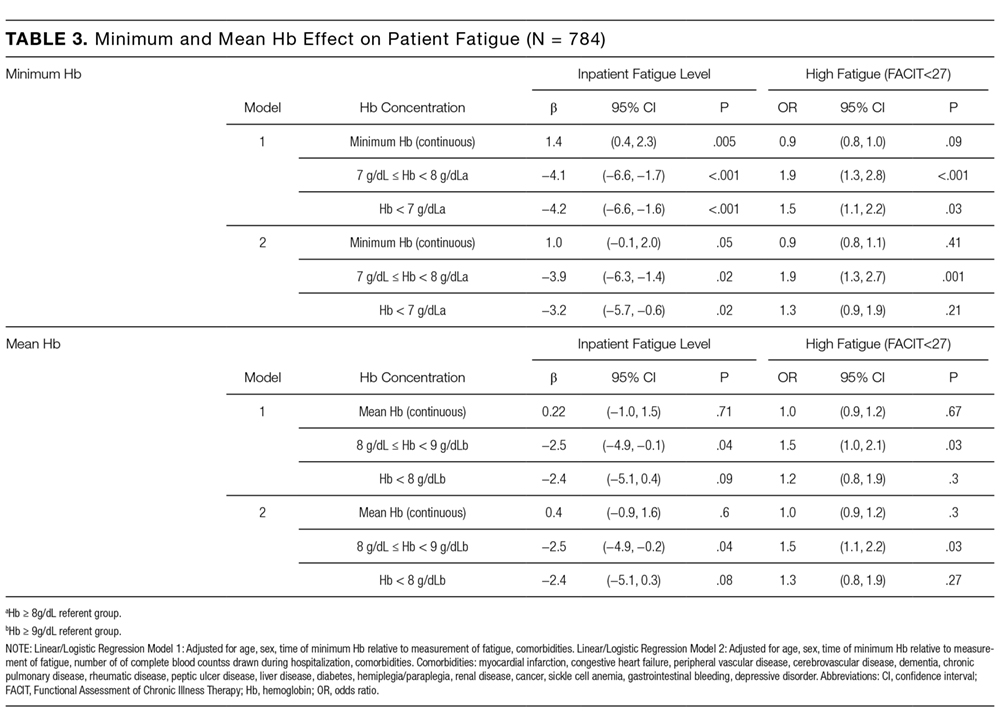
No Hb measure other than minimum or mean had significant association with patient fatigue levels in linear regression models.
Logistic Regression of High Fatigue Level on Hb
Using logistic regression, minimum Hb analyzed as a categorical variable predicted increased odds of a high fatigue level. Patients with a minimum Hb <7 g/dL were 50% (odds ratio [OR] = 1.5; P = 0.03) more likely to have high fatigue and patients with a minimum Hb 7-8 g/dL were 90% (OR = 1.9; P < 0.001) more likely to have high fatigue compared with patients with a minimum Hb ≥8 g/dL in Model 1. These results were similar in Model 2, although the effect was only statistically significant in the 7-8 g/dL Hb group (Table 3). When excluding SC and/or GIB patients, the odds of having high fatigue as minimum Hb decreased were the same or higher for both models compared to the full population of patients. However, again, in Model 2, the effect was only statistically significant in the 7-8 g/dL Hb group (Supplemental Table 1).
Patients with a mean Hb <8 g/dL were 20% to 30% more likely to have high fatigue and patients with mean Hb 8-9 g/dL were 50% more likely to have high fatigue compared with patients with a mean Hb ≥9 g/dL, but the effects were only statistically significant for patients with a mean Hb 8-9 g/dL in both Models 1 and 2 (Table 3). These results were similar when excluding patients with SC and/or GIB, but they were only significant for patients with a mean Hb 8-9 g/dL in Model 1 and patients with a mean Hb <8 g/dL in the Model 2 (Supplemental Table 3).
DISCUSSION
These results demonstrate that minimum Hb during hospitalization is associated with fatigue in hospitalized patients age ≥50 years, and the association is stronger among patients without SC and/or GIB as comorbidities. The analysis of Hb as a continuous and categorical variable and the use of both linear and logistic regression models support the robustness of these associations and illuminate their clinical significance. For example, in linear regression with minimum Hb a continuous variable, the coefficient of 1.4 suggests that an increase of 2 g/dL in Hb, as might be expected from transfusion of 2 units of red blood cells, would be associated with about a 3-point improvement in fatigue. Additionally, as a categorical variable, a minimum Hb ≥8 g/dL compared with a minimum Hb <7 g/dL or 7-8 g/dL is associated with a 3- to 4-point improvement in fatigue. Previous literature suggests that a difference of 3 in the FACIT score is the minimum clinically important difference in fatigue,3 and changes in minimum Hb in either model predict changes in fatigue that are in the range of potential clinical significance.
The clinical significance of the findings is also reflected in the results of the logistic regressions, which may be mapped to potential effects on functional status. Specifically, the odds of having a high fatigue level (FACIT <27) increase 90% for persons with a minimum Hb 7–8 g/dL compared with persons with a minimum Hb ≥8 g/dL. For persons with a minimum Hb <7 g/dL, point estimates suggest a smaller (50%) increase in the odds of high fatigue, but the 95% confidence interval overlaps heavily with the estimate of patients whose minimum Hb is 7-8 g/dL. While it might be expected that patients with a minimum Hb <7 g/dL have greater levels of fatigue compared with patients with a minimum Hb 7-8 g/dL, we did not observe such a pattern. One reason may be that the confidence intervals of our estimated effects are wide enough that we cannot exclude such a pattern. Another possible explanation is that in both groups, the fatigue levels are sufficiently severe, such that the difference in their fatigue levels may not be clinically meaningful. For example, a FACIT score of 23 to 26 has been shown to be associated with an ECOG performance status of 2 to 3, requiring bed rest for at least part of the day.3 Therefore, patients with a minimum Hb 7-8 g/dL (mean FACIT score = 24; Table 2) or a minimum Hb of <7 g/dL (mean FACIT score = 23; Table 2) are already functionally limited to the point of being partially bed bound, such that further decreases in their Hb may not produce additional fatigue in part because they reduce their activity sufficiently to prevent an increase in fatigue. In such cases, the potential benefits of increased Hb may be better assessed by measuring fatigue in response to a specific and provoked activity level, a concept known as fatigability.20
That minimum Hb is more strongly associated with fatigue than any other measure of Hb during hospitalization may not be surprising. Mean, median, maximum, and discharge Hb may all be affected by transfusion during hospitalization that could affect fatigue. Admission Hb may not reflect true oxygen-carrying capacity because of hemoconcentration.
The association between Hb and fatigue in hospitalized patients is important because increased fatigue could contribute to slower clinical recovery in hospitalized patients. Additionally, increased fatigue during hospitalization and at hospital discharge could exacerbate the known deleterious consequences of fatigue on patients and their health outcomes14,15 after hospital discharge. Although one previous study, the Functional Outcomes in Cardiovascular Patients Undergoing Surgical Hip Fracture Repair (FOCUS)8 trial, did not report differences in patients’ fatigue levels at 30 and 60 days postdischarge when transfused at restrictive (8 g/dL) compared with liberal (10 g/dL) Hb thresholds, confidence in the validity of this finding is reduced by the fact that more than half of the patients were lost to follow-up at the 30- and 60-day time points. Further, patients in the restrictive transfusion arm of FOCUS were transfused to maintain Hb levels at or above 8 g/dL. This transfusion threshold of 8 g/dL may have mitigated the high levels of fatigue that are seen in our study when patients’ Hb drops below 8 g/dL, and maintaining a Hb level of 7 g/dL is now the standard of care in stable hospitalized patients. Lastly, FOCUS was limited to postoperative hip fracture patients, and the generalizability of FOCUS to hospitalized medicine patients with anemia is limited.
Therefore, our results support guideline suggestions that practitioners incorporate the presence of patient symptoms such as fatigue into transfusion decisions, particularly if patients’ Hb is <8 g/dL.18 Though reasonable, the suggestion to incorporate symptoms such as fatigue into transfusion decisions has not been strongly supported by evidence so far, and it may often be neglected in practice. Definitive evidence to support such recommendations would benefit from study through an optimal trial18 that incorporates symptoms into decision making. Our findings add support for a study of transfusion strategies that incorporates patients’ fatigue level in addition to Hb concentration.
This study has several limitations. Although our sample size is large and includes patients with a range of comorbidities that we believe are representative of hospitalized general medicine patients, as a single-center, observational study, our results may not be generalizable to other centers. Additionally, although these data support a reliable association between hospitalized patients’ minimum Hb and fatigue level, the observational design of this study cannot prove that this relationship is causal. Also, patients’ Hb values were measured at the discretion of their clinician, and therefore, the measures of Hb were not uniformly measured for participating patients. In addition, fatigue was only measured at one time point during a patient’s hospitalization, and it is possible that patients’ fatigue levels change during hospitalization in relation to variables we did not consider. Finally, our study was not designed to assess the association of Hb with longer-term functional outcomes, which may be of greater concern than fatigue.
CONCLUSION
In hospitalized patients ≥50 years old, minimum Hb is reliably associated with patients’ fatigue level. Patients whose minimum Hb is <8 g/dL experience higher fatigue levels compared to patients whose minimum Hb is ≥8 g/dL. Additional studies are warranted to understand if patients may benefit from improved fatigue levels by correcting their anemia through transfusion.
1. Yellen SB, Cella DF, Webster K, Blendowski C, Kaplan E. Measuring fatigue and other anemia-related symptoms with the Functional Assessment of Cancer Therapy (FACT) measurement system. J Pain Symptom Manage. 1997;13(2):63-74.
2. Cella D, Lai JS, Chang CH, Peterman A, Slavin M. Fatigue in cancer patients compared with fatigue in the general United States population. Cancer. 2002;94(2):528-538. doi:10.1002/cncr.10245.
3. Cella D, Eton DT, Lai J-S, Peterman AH, Merkel DE. Combining anchor and distribution-based methods to derive minimal clinically important differences on the Functional Assessment of Cancer Therapy (FACT) anemia and fatigue scales. J Pain Symptom Manage. 2002;24(6):547-561.
4. Tonelli M, Hemmelgarn B, Reiman T, et al. Benefits and harms of erythropoiesis-stimulating agents for anemia related to cancer: a meta-analysis. CMAJ Can Med Assoc J J Assoc Medicale Can. 2009;180(11):E62-E71. doi:10.1503/cmaj.090470.
5. Foley RN, Curtis BM, Parfrey PS. Erythropoietin Therapy, Hemoglobin Targets, and Quality of Life in Healthy Hemodialysis Patients: A Randomized Trial. Clin J Am Soc Nephrol. 2009;4(4):726-733. doi:10.2215/CJN.04950908.
6. Keown PA, Churchill DN, Poulin-Costello M, et al. Dialysis patients treated with Epoetin alfa show improved anemia symptoms: A new analysis of the Canadian Erythropoietin Study Group trial. Hemodial Int Int Symp Home Hemodial. 2010;14(2):168-173. doi:10.1111/j.1542-4758.2009.00422.x.
7. Palmer SC, Saglimbene V, Mavridis D, et al. Erythropoiesis-stimulating agents for anaemia in adults with chronic kidney disease: a network meta-analysis. Cochrane Database Syst Rev. 2014:CD010590.
8. Carson JL, Terrin ML, Noveck H, et al. Liberal or Restrictive Transfusion in high-risk patients after hip surgery. N Engl J Med. 2011;365(26):2453-2462. doi:10.1056/NEJMoa1012452.
9. Holst LB, Haase N, Wetterslev J, et al. Transfusion requirements in septic shock (TRISS) trial – comparing the effects and safety of liberal versus restrictive red blood cell transfusion in septic shock patients in the ICU: protocol for a randomised controlled trial. Trials. 2013;14:150. doi:10.1186/1745-6215-14-150.
10. Hébert PC, Wells G, Blajchman MA, et al. A multicenter, randomized, controlled clinical trial of transfusion requirements in critical care. N Engl J Med. 1999;340(6):409-417. doi:10.1056/NEJM199902113400601.
11. Corwin HL, Theus JW, Cargile CS, Lang NP. Red blood cell transfusion: Impact of an education program and a clinical guideline on transfusion practice. J Hosp Med. 2014;9(12):745-749. doi:10.1002/jhm.2237.
12. Saxena, S, editor. The Transfusion Committee: Putting Patient Safety First, 2nd Edition. Bethesda (MD): American Association of Blood Banks; 2013.
13. The 2011 National Blood Collection and Utilization Report. http://www.hhs.gov/ash/bloodsafety/2011-nbcus.pdf. Accessed August 16, 2017.
14. Vestergaard S, Nayfield SG, Patel KV, et al. Fatigue in a Representative Population of Older Persons and Its Association With Functional Impairment, Functional Limitation, and Disability. J Gerontol A Biol Sci Med Sci. 2009;64A(1):76-82. doi:10.1093/gerona/gln017.
15. Gill TM, Desai MM, Gahbauer EA, Holford TR, Williams CS. Restricted activity among community-living older persons: incidence, precipitants, and health care utilization. Ann Intern Med. 2001;135(5):313-321.
16. Koch CG, Li L, Sun Z, et al. Hospital-acquired anemia: Prevalence, outcomes, and healthcare implications. J Hosp Med. 2013;8(9):506-512. doi:10.1002/jhm.2061.
17. Meltzer D, Manning WG, Morrison J, et al. Effects of Physician Experience on Costs and Outcomes on an Academic General Medicine Service: Results of a Trial of Hospitalists. Ann Intern Med. 2002;137(11):866-874. doi:10.7326/0003-4819-137-11-200212030-00007.
18. Carson JL, Grossman BJ, Kleinman S, et al. Red Blood Cell Transfusion: A Clinical Practice Guideline From the AABB*. Ann Intern Med. 2012;157(1):49-58. doi:10.7326/0003-4819-157-1-201206190-00429.
19. Moreh E, Jacobs JM, Stessman J. Fatigue, function, and mortality in older adults. J Gerontol A Biol Sci Med Sci. 2010;65(8):887-895. doi:10.1093/gerona/glq064.
20. Eldadah BA. Fatigue and Fatigability in Older Adults. PM&R. 2010;2(5):406-413. doi:10.1016/j.pmrj.2010.03.022.
21. Hardy SE, Studenski SA. Fatigue Predicts Mortality among Older Adults. J Am Geriatr Soc. 2008;56(10):1910-1914. doi:10.1111/j.1532-5415.2008.01957.x.
22. Pfeiffer E. A short portable mental status questionnaire for the assessment of organic brain deficit in elderly patients. J Am Geriatr Soc. 1975;23(10):433-441.
23. Quan H, Sundararajan V, Halfon P, et al. Coding algorithms for defining comorbidities in ICD-9-CM and ICD-10 administrative data. Med Care. 2005;43(11):1130-1139.
24. HCUP Clinical Classifications Software (CCS) for ICD-9-CM. Healthcare Cost and Utilization Project (HCUP). 2006-2009. Agency for Healthcare Research and Quality, Rockville, MD. https://www.hcup-us.ahrq.gov/toolssoftware/ccs/ccs.jsp. Accessed November 22, 2016.
25. Cella DF, Tulsky DS, Gray G, et al. The Functional Assessment of Cancer Therapy scale: development and validation of the general measure. J Clin Oncol Off J Am Soc Clin Oncol. 1993;11(3):570-579.
26. Webster K, Cella D, Yost K. The Functional Assessment of Chronic Illness Therapy (FACIT) Measurement System: properties, applications, and interpretation. Health Qual Life Outcomes. 2003;1:79. doi:10.1186/1477-7525-1-79.
27. Oken MMMD a, Creech RHMD b, Tormey DCMD, et al. Toxicity and response criteria of the Eastern Cooperative Oncology Group. J Clin Oncol. 1982;5(6):649-656.
Fatigue is the most common clinical symptom of anemia and is a significant concern to patients.1,2 In ambulatory patients, lower hemoglobin (Hb) concentration is associated with increased fatigue.2,3 Accordingly, therapies that treat anemia by increasing Hb concentration, such as erythropoiesis stimulating agents,4-7 often use fatigue as an outcome measure.
In hospitalized patients, transfusion of red blood cell increases Hb concentration and is the primary treatment for anemia. However, the extent to which transfusion and changes in Hb concentration affect hospitalized patients’ fatigue levels is not well established. Guidelines support transfusing patients with symptoms of anemia, such as fatigue, on the assumption that the increased oxygen delivery will improve the symptoms of anemia. While transfusion studies in hospitalized patients have consistently reported that transfusion at lower or “restrictive” Hb concentrations is safe compared with transfusion at higher Hb concentrations,8-10 these studies have mainly used cardiac events and mortality as outcomes rather than patient symptoms, such as fatigue. Nevertheless, they have resulted in hospitals increasingly adopting restrictive transfusion policies that discourage transfusion at higher Hb levels.11,12 Consequently, the rate of transfusion in hospitalized patients has decreased,13 raising questions of whether some patients with lower Hb concentrations may experience increased fatigue as a result of restrictive transfusion policies. Fatigue among hospitalized patients is important not only because it is an adverse symptom but because it may result in decreased activity levels, deconditioning, and losses in functional status.14,15While the effect of alternative transfusion policies on fatigue in hospitalized patients could be answered by a randomized clinical trial using fatigue and functional status as outcomes, an important first step is to assess whether the Hb concentration of hospitalized patients is associated with their fatigue level during hospitalization. Because hospitalized patients often have acute illnesses that can cause fatigue in and of themselves, it is possible that anemia is not associated with fatigue in hospitalized patients despite anemia’s association with fatigue in ambulatory patients. Additionally, Hb concentration varies during hospitalization,16 raising the question of what measures of Hb during hospitalization might be most associated with anemia-related fatigue.
The objective of this study is to explore multiple Hb measures in hospitalized medical patients with anemia and test whether any of these Hb measures are associated with patients’ fatigue level.
METHODS
Study Design
We performed a prospective, observational study of hospitalized patients with anemia on the general medicine services at The University of Chicago Medical Center (UCMC). The institutional review board approved the study procedures, and all study subjects provided informed consent.
Study Eligibility
Between April 2014 and June 2015, all general medicine inpatients were approached for written consent for The University of Chicago Hospitalist Project,17 a research infrastructure at UCMC. Among patients consenting to participate in the Hospitalist Project, patients were eligible if they had Hb <9 g/dL at any point during their hospitalization and were age ≥50 years. Hb concentration of <9 g/dL was chosen to include the range of Hb values covered by most restrictive transfusion policies.8-10,18 Age ≥50 years was an inclusion criteria because anemia is more strongly associated with poor outcomes, including functional impairment, among older patients compared with younger patients.14,19-21 If patients were not eligible for inclusion at the time of consent for the Hospitalist Project, their Hb values were reviewed twice daily until hospital discharge to assess if their Hb was <9 g/dL. Proxies were sought to answer questions for patients who failed the Short Portable Mental Status Questionnaire.22
Patient Demographic Data Collection
Research assistants abstracted patient age and sex from the electronic health record (EHR), and asked patients to self-identify their race. The individual comorbidities included as part of the Charlson Comorbidity Index were identified using International Classification of Diseases, 9th Revision codes from hospital administrative data for each encounter and specifically included the following: myocardial infarction, congestive heart failure, peripheral vascular disease, cerebrovascular disease, dementia, chronic pulmonary disease, rheumatic disease, peptic ulcer disease, liver disease, diabetes, hemiplegia and/or paraplegia, renal disease, cancer, and human immunodeficiency virus/acquired immunodeficiency syndrome.23 We also used Healthcare Cost and Utilization Project (www.hcup-us.ahrq.gov/toolssoftware/ccs/ccs.jsp) diagnosis categories to identify whether patients had sickle cell (SC) anemia, gastrointestinal bleeding (GIB), or a depressive disorder (DD) because these conditions are associated with anemia (SC and GIB) and fatigue (DD).24
Measuring Anemia
Hb measures were available only when hospital providers ordered them as part of routine practice. The first Hb concentration <9 g/dL during a patient’s hospitalization, which made them eligible for study participation, was obtained through manual review of the EHR. All additional Hb values during the patient’s hospitalization were obtained from the hospital’s administrative data mart. All Hb values collected for each patient during the hospitalization were used to calculate summary measures of Hb during the hospitalization, including the mean Hb, median Hb, minimum Hb, maximum Hb, admission (first recorded) Hb, and discharge (last recorded) Hb. Hb measures were analyzed both as a continuous variable and as a categorical variable created by dividing the continuous Hb measures into integer ranges of 3 groups of approximately the same size.
Measuring Fatigue
Our primary outcome was patients’ level of fatigue reported during hospitalization, measured using the Functional Assessment of Chronic Illness Therapy (FACIT)-Anemia questionnaire. Fatigue was measured using a 13-question fatigue subscale,1,2,25 which measures fatigue within the past 7 days. Scores on the fatigue subscale range from 0 to 52, with lower scores reflecting greater levels of fatigue. As soon as patients met the eligibility criteria for study participation during their hospitalization (age ≥50 years and Hb <9 g/dL), they were approached to answer the FACIT questions. Values for missing data in the fatigue subscale for individual subjects were filled in using a prorated score from their answered questions as long as >50% of the items in the fatigue subscale were answered, in accordance with recommendations for addressing missing data in the FACIT.26 Fatigue was analyzed as a continuous variable and as a dichotomous variable created by dividing the sample into high (FACIT <27) and low (FACIT ≥27) levels of fatigue based on the median FACIT score of the population. Previous literature has shown a FACIT fatigue subscale score between 23 and 26 to be associated with an Eastern Cooperative Oncology Group (ECOG)27 C Performance Status rating of 2 to 33 compared to scores ≥27.
Statistical Analysis
Statistical analysis was performed using Stata statistical software (StataCorp, College Station, TX). Descriptive statistics were used to characterize patient demographics. Analysis of variance was used to test for differences in the mean fatigue levels across Hb measures. χ2 tests were performed to test for associations between high fatigue levels and the Hb measures. Multivariable analysis, including both linear and logistic regression models, were used to test the association of Hb concentration and fatigue. P values <0.05 using a 2-tailed test were deemed statistically significant.
RESULTS
Patient Characteristics
During the study period, 8559 patients were admitted to the general medicine service. Of those, 5073 (59%) consented for participation in the Hospitalist Project, and 3670 (72%) completed the Hospitalist Project inpatient interview. Of these patients, 1292 (35%) had Hb <9 g/dL, and 784 (61%) were 50 years or older and completed the FACIT questionnaire.
Table 1 reports the demographic characteristics and comorbidities for the sample, the mean (standard deviation [SD]) for the 6 Hb measures, and mean (SD) and median FACIT scores.
Bivariate Association of Fatigue and Hb
Categorizing patients into low, middle, or high Hb for each of the 6 Hb measures, minimum Hb was strongly associated with fatigue, with a weaker association for mean Hb and no statistically significant association for the other measures.
Minimum Hb. Patients with a minimum Hb <7 g/dL and patients with Hb 7-8 g/dL had higher fatigue levels (FACIT = 25 for each) than patients with a minimum Hb ≥8 g/dL (FACIT = 29; P < 0.001; Table 2). When excluding patients with SC and/or GIB because their average minimum Hb differed from the average minimum Hb of the full population (P < 0.001), patients with a minimum Hb <7 g/dL or 7-8 g/dL had even higher fatigue levels (FACIT = 23 and FACIT = 24, respectively), with no change in the fatigue level of patients with a minimum Hb ≥8 g/dL (FACIT = 29; P < 0.001; Table 2). Lower minimum Hb continued to be associated with higher fatigue levels when analyzed in 0.5 g/dL increments (Figure).
Mean Hb and Other Measures. Fatigue levels were high for 47% of patients with a mean Hb <8g /dL and 53% of patients with a mean Hb 8-9 g/dL compared with 43% of patients with a mean Hb ≥9 g/dL (P = 0.05). However, the association between high fatigue and mean Hb was not statistically significant when patients with SC and/or GIB were excluded (Table 2). None of the other 4 Hb measures was significantly associated with fatigue.
Linear Regression of Fatigue on Hb
In linear regression models, minimum Hb consistently predicted patient fatigue, mean Hb had a less robust association with fatigue, and the other Hb measures were not associated with patient fatigue. Increases in minimum Hb (analyzed as a continuous variable) were associated with reduced fatigue (higher FACIT score; β = 1.4; P = 0.005). In models in which minimum Hb was a categorical variable, patients with a minimum Hb of <7 g/dL or 7-8 g/dL had greater fatigue (lower FACIT score) than patients whose minimum Hb was ≥8 g/dL (Hb <7 g/dL: β = −4.2; P ≤ 0.001; Hb 7-8 g/dL: β = −4.1; P < 0.001). These results control for patients’ age, sex, individual comorbidities, and whether their minimum Hb occurred before or after the measurement of fatigue during hospitalization (Model 1), and the results are unchanged when also controlling for the number of Hb laboratory draws patients had during their hospitalization (Model 2; Table 3). In a stratified analysis excluding patients with either SC and/or GIB, changes in minimum Hb were associated with larger changes in patient fatigue levels (Supplemental Table 1). We also stratified our analysis to include only patients whose minimum Hb occurred before the measurement of their fatigue level during hospitalization to avoid a spurious association of fatigue with minimum Hb occurring after fatigue was measured. In both Models 1 and 2, minimum Hb remained a predictor of patients’ fatigue levels with similar effect sizes, although in Model 2, the results did not quite reach a statistically significant level, in part due to larger confidence intervals from the smaller sample size of this stratified analysis (Supplemental Table 2a). We further stratified this analysis to include only patients whose transfusion, if they received one, occurred after their minimum Hb and the measurement of their fatigue level to account for the possibility that a transfusion could affect the fatigue level patients report. In this analysis, most of the estimates of the effect of minimum Hb on fatigue were larger than those seen when only analyzing patients whose minimum Hb occurred before the measurement of their fatigue level, although again, the smaller sample size of this additional stratified analysis does produce larger confidence intervals for these estimates (Supplemental Table 2b).
No Hb measure other than minimum or mean had significant association with patient fatigue levels in linear regression models.
Logistic Regression of High Fatigue Level on Hb
Using logistic regression, minimum Hb analyzed as a categorical variable predicted increased odds of a high fatigue level. Patients with a minimum Hb <7 g/dL were 50% (odds ratio [OR] = 1.5; P = 0.03) more likely to have high fatigue and patients with a minimum Hb 7-8 g/dL were 90% (OR = 1.9; P < 0.001) more likely to have high fatigue compared with patients with a minimum Hb ≥8 g/dL in Model 1. These results were similar in Model 2, although the effect was only statistically significant in the 7-8 g/dL Hb group (Table 3). When excluding SC and/or GIB patients, the odds of having high fatigue as minimum Hb decreased were the same or higher for both models compared to the full population of patients. However, again, in Model 2, the effect was only statistically significant in the 7-8 g/dL Hb group (Supplemental Table 1).
Patients with a mean Hb <8 g/dL were 20% to 30% more likely to have high fatigue and patients with mean Hb 8-9 g/dL were 50% more likely to have high fatigue compared with patients with a mean Hb ≥9 g/dL, but the effects were only statistically significant for patients with a mean Hb 8-9 g/dL in both Models 1 and 2 (Table 3). These results were similar when excluding patients with SC and/or GIB, but they were only significant for patients with a mean Hb 8-9 g/dL in Model 1 and patients with a mean Hb <8 g/dL in the Model 2 (Supplemental Table 3).
DISCUSSION
These results demonstrate that minimum Hb during hospitalization is associated with fatigue in hospitalized patients age ≥50 years, and the association is stronger among patients without SC and/or GIB as comorbidities. The analysis of Hb as a continuous and categorical variable and the use of both linear and logistic regression models support the robustness of these associations and illuminate their clinical significance. For example, in linear regression with minimum Hb a continuous variable, the coefficient of 1.4 suggests that an increase of 2 g/dL in Hb, as might be expected from transfusion of 2 units of red blood cells, would be associated with about a 3-point improvement in fatigue. Additionally, as a categorical variable, a minimum Hb ≥8 g/dL compared with a minimum Hb <7 g/dL or 7-8 g/dL is associated with a 3- to 4-point improvement in fatigue. Previous literature suggests that a difference of 3 in the FACIT score is the minimum clinically important difference in fatigue,3 and changes in minimum Hb in either model predict changes in fatigue that are in the range of potential clinical significance.
The clinical significance of the findings is also reflected in the results of the logistic regressions, which may be mapped to potential effects on functional status. Specifically, the odds of having a high fatigue level (FACIT <27) increase 90% for persons with a minimum Hb 7–8 g/dL compared with persons with a minimum Hb ≥8 g/dL. For persons with a minimum Hb <7 g/dL, point estimates suggest a smaller (50%) increase in the odds of high fatigue, but the 95% confidence interval overlaps heavily with the estimate of patients whose minimum Hb is 7-8 g/dL. While it might be expected that patients with a minimum Hb <7 g/dL have greater levels of fatigue compared with patients with a minimum Hb 7-8 g/dL, we did not observe such a pattern. One reason may be that the confidence intervals of our estimated effects are wide enough that we cannot exclude such a pattern. Another possible explanation is that in both groups, the fatigue levels are sufficiently severe, such that the difference in their fatigue levels may not be clinically meaningful. For example, a FACIT score of 23 to 26 has been shown to be associated with an ECOG performance status of 2 to 3, requiring bed rest for at least part of the day.3 Therefore, patients with a minimum Hb 7-8 g/dL (mean FACIT score = 24; Table 2) or a minimum Hb of <7 g/dL (mean FACIT score = 23; Table 2) are already functionally limited to the point of being partially bed bound, such that further decreases in their Hb may not produce additional fatigue in part because they reduce their activity sufficiently to prevent an increase in fatigue. In such cases, the potential benefits of increased Hb may be better assessed by measuring fatigue in response to a specific and provoked activity level, a concept known as fatigability.20
That minimum Hb is more strongly associated with fatigue than any other measure of Hb during hospitalization may not be surprising. Mean, median, maximum, and discharge Hb may all be affected by transfusion during hospitalization that could affect fatigue. Admission Hb may not reflect true oxygen-carrying capacity because of hemoconcentration.
The association between Hb and fatigue in hospitalized patients is important because increased fatigue could contribute to slower clinical recovery in hospitalized patients. Additionally, increased fatigue during hospitalization and at hospital discharge could exacerbate the known deleterious consequences of fatigue on patients and their health outcomes14,15 after hospital discharge. Although one previous study, the Functional Outcomes in Cardiovascular Patients Undergoing Surgical Hip Fracture Repair (FOCUS)8 trial, did not report differences in patients’ fatigue levels at 30 and 60 days postdischarge when transfused at restrictive (8 g/dL) compared with liberal (10 g/dL) Hb thresholds, confidence in the validity of this finding is reduced by the fact that more than half of the patients were lost to follow-up at the 30- and 60-day time points. Further, patients in the restrictive transfusion arm of FOCUS were transfused to maintain Hb levels at or above 8 g/dL. This transfusion threshold of 8 g/dL may have mitigated the high levels of fatigue that are seen in our study when patients’ Hb drops below 8 g/dL, and maintaining a Hb level of 7 g/dL is now the standard of care in stable hospitalized patients. Lastly, FOCUS was limited to postoperative hip fracture patients, and the generalizability of FOCUS to hospitalized medicine patients with anemia is limited.
Therefore, our results support guideline suggestions that practitioners incorporate the presence of patient symptoms such as fatigue into transfusion decisions, particularly if patients’ Hb is <8 g/dL.18 Though reasonable, the suggestion to incorporate symptoms such as fatigue into transfusion decisions has not been strongly supported by evidence so far, and it may often be neglected in practice. Definitive evidence to support such recommendations would benefit from study through an optimal trial18 that incorporates symptoms into decision making. Our findings add support for a study of transfusion strategies that incorporates patients’ fatigue level in addition to Hb concentration.
This study has several limitations. Although our sample size is large and includes patients with a range of comorbidities that we believe are representative of hospitalized general medicine patients, as a single-center, observational study, our results may not be generalizable to other centers. Additionally, although these data support a reliable association between hospitalized patients’ minimum Hb and fatigue level, the observational design of this study cannot prove that this relationship is causal. Also, patients’ Hb values were measured at the discretion of their clinician, and therefore, the measures of Hb were not uniformly measured for participating patients. In addition, fatigue was only measured at one time point during a patient’s hospitalization, and it is possible that patients’ fatigue levels change during hospitalization in relation to variables we did not consider. Finally, our study was not designed to assess the association of Hb with longer-term functional outcomes, which may be of greater concern than fatigue.
CONCLUSION
In hospitalized patients ≥50 years old, minimum Hb is reliably associated with patients’ fatigue level. Patients whose minimum Hb is <8 g/dL experience higher fatigue levels compared to patients whose minimum Hb is ≥8 g/dL. Additional studies are warranted to understand if patients may benefit from improved fatigue levels by correcting their anemia through transfusion.
1. Yellen SB, Cella DF, Webster K, Blendowski C, Kaplan E. Measuring fatigue and other anemia-related symptoms with the Functional Assessment of Cancer Therapy (FACT) measurement system. J Pain Symptom Manage. 1997;13(2):63-74.
2. Cella D, Lai JS, Chang CH, Peterman A, Slavin M. Fatigue in cancer patients compared with fatigue in the general United States population. Cancer. 2002;94(2):528-538. doi:10.1002/cncr.10245.
3. Cella D, Eton DT, Lai J-S, Peterman AH, Merkel DE. Combining anchor and distribution-based methods to derive minimal clinically important differences on the Functional Assessment of Cancer Therapy (FACT) anemia and fatigue scales. J Pain Symptom Manage. 2002;24(6):547-561.
4. Tonelli M, Hemmelgarn B, Reiman T, et al. Benefits and harms of erythropoiesis-stimulating agents for anemia related to cancer: a meta-analysis. CMAJ Can Med Assoc J J Assoc Medicale Can. 2009;180(11):E62-E71. doi:10.1503/cmaj.090470.
5. Foley RN, Curtis BM, Parfrey PS. Erythropoietin Therapy, Hemoglobin Targets, and Quality of Life in Healthy Hemodialysis Patients: A Randomized Trial. Clin J Am Soc Nephrol. 2009;4(4):726-733. doi:10.2215/CJN.04950908.
6. Keown PA, Churchill DN, Poulin-Costello M, et al. Dialysis patients treated with Epoetin alfa show improved anemia symptoms: A new analysis of the Canadian Erythropoietin Study Group trial. Hemodial Int Int Symp Home Hemodial. 2010;14(2):168-173. doi:10.1111/j.1542-4758.2009.00422.x.
7. Palmer SC, Saglimbene V, Mavridis D, et al. Erythropoiesis-stimulating agents for anaemia in adults with chronic kidney disease: a network meta-analysis. Cochrane Database Syst Rev. 2014:CD010590.
8. Carson JL, Terrin ML, Noveck H, et al. Liberal or Restrictive Transfusion in high-risk patients after hip surgery. N Engl J Med. 2011;365(26):2453-2462. doi:10.1056/NEJMoa1012452.
9. Holst LB, Haase N, Wetterslev J, et al. Transfusion requirements in septic shock (TRISS) trial – comparing the effects and safety of liberal versus restrictive red blood cell transfusion in septic shock patients in the ICU: protocol for a randomised controlled trial. Trials. 2013;14:150. doi:10.1186/1745-6215-14-150.
10. Hébert PC, Wells G, Blajchman MA, et al. A multicenter, randomized, controlled clinical trial of transfusion requirements in critical care. N Engl J Med. 1999;340(6):409-417. doi:10.1056/NEJM199902113400601.
11. Corwin HL, Theus JW, Cargile CS, Lang NP. Red blood cell transfusion: Impact of an education program and a clinical guideline on transfusion practice. J Hosp Med. 2014;9(12):745-749. doi:10.1002/jhm.2237.
12. Saxena, S, editor. The Transfusion Committee: Putting Patient Safety First, 2nd Edition. Bethesda (MD): American Association of Blood Banks; 2013.
13. The 2011 National Blood Collection and Utilization Report. http://www.hhs.gov/ash/bloodsafety/2011-nbcus.pdf. Accessed August 16, 2017.
14. Vestergaard S, Nayfield SG, Patel KV, et al. Fatigue in a Representative Population of Older Persons and Its Association With Functional Impairment, Functional Limitation, and Disability. J Gerontol A Biol Sci Med Sci. 2009;64A(1):76-82. doi:10.1093/gerona/gln017.
15. Gill TM, Desai MM, Gahbauer EA, Holford TR, Williams CS. Restricted activity among community-living older persons: incidence, precipitants, and health care utilization. Ann Intern Med. 2001;135(5):313-321.
16. Koch CG, Li L, Sun Z, et al. Hospital-acquired anemia: Prevalence, outcomes, and healthcare implications. J Hosp Med. 2013;8(9):506-512. doi:10.1002/jhm.2061.
17. Meltzer D, Manning WG, Morrison J, et al. Effects of Physician Experience on Costs and Outcomes on an Academic General Medicine Service: Results of a Trial of Hospitalists. Ann Intern Med. 2002;137(11):866-874. doi:10.7326/0003-4819-137-11-200212030-00007.
18. Carson JL, Grossman BJ, Kleinman S, et al. Red Blood Cell Transfusion: A Clinical Practice Guideline From the AABB*. Ann Intern Med. 2012;157(1):49-58. doi:10.7326/0003-4819-157-1-201206190-00429.
19. Moreh E, Jacobs JM, Stessman J. Fatigue, function, and mortality in older adults. J Gerontol A Biol Sci Med Sci. 2010;65(8):887-895. doi:10.1093/gerona/glq064.
20. Eldadah BA. Fatigue and Fatigability in Older Adults. PM&R. 2010;2(5):406-413. doi:10.1016/j.pmrj.2010.03.022.
21. Hardy SE, Studenski SA. Fatigue Predicts Mortality among Older Adults. J Am Geriatr Soc. 2008;56(10):1910-1914. doi:10.1111/j.1532-5415.2008.01957.x.
22. Pfeiffer E. A short portable mental status questionnaire for the assessment of organic brain deficit in elderly patients. J Am Geriatr Soc. 1975;23(10):433-441.
23. Quan H, Sundararajan V, Halfon P, et al. Coding algorithms for defining comorbidities in ICD-9-CM and ICD-10 administrative data. Med Care. 2005;43(11):1130-1139.
24. HCUP Clinical Classifications Software (CCS) for ICD-9-CM. Healthcare Cost and Utilization Project (HCUP). 2006-2009. Agency for Healthcare Research and Quality, Rockville, MD. https://www.hcup-us.ahrq.gov/toolssoftware/ccs/ccs.jsp. Accessed November 22, 2016.
25. Cella DF, Tulsky DS, Gray G, et al. The Functional Assessment of Cancer Therapy scale: development and validation of the general measure. J Clin Oncol Off J Am Soc Clin Oncol. 1993;11(3):570-579.
26. Webster K, Cella D, Yost K. The Functional Assessment of Chronic Illness Therapy (FACIT) Measurement System: properties, applications, and interpretation. Health Qual Life Outcomes. 2003;1:79. doi:10.1186/1477-7525-1-79.
27. Oken MMMD a, Creech RHMD b, Tormey DCMD, et al. Toxicity and response criteria of the Eastern Cooperative Oncology Group. J Clin Oncol. 1982;5(6):649-656.
© 2017 Society of Hospital Medicine
A Longitudinal Study of Transfusion Utilization in Hospitalized Veterans
Abstract
- Background: Although transfusion guidelines have changed considerably over the past 2 decades, the adoption of patient blood management programs has not been fully realized across hospitals in the United States.
- Objective: To evaluate trends in red blood cell (RBC), platelet, and plasma transfusion at 3 Veterans Health Administration (VHA) hospitals from 2000 through 2010.
- Methods: Data from all hospitalizations were collected from January 2000 through December 2010. Blood bank data (including the type and volume of products administered) were available electronically from each hospital. These files were linked to inpatient data, which included ICD-9-CM diagnoses (principal and secondary) and procedures during hospitalization. Statistical analyses were conducted using generalized linear models to evaluate trends over time. The unit of observation was hospitalization, with categorization by type.
- Results: There were 176,521 hospitalizations in 69,621 patients; of these, 13.6% of hospitalizations involved transfusion of blood products (12.7% RBCs, 1.4% platelets, 3.0% plasma). Transfusion occurred in 25.2% of surgical and 5.3% of medical hospitalizations. Transfusion use peaked in 2002 for surgical hospitalizations and declined afterwards (P < 0.001). There was no significant change in transfusion use over time (P = 0.126) for medical hospitalizations. In hospitalizations that involved transfusions, there was a 20.3% reduction in the proportion of hospitalizations in which ≥ 3 units of RBCs were given (from 51.7% to 41.1%; P < 0.001) and a 73.6% increase when 1 RBC unit was given (from 8.0% to 13.8%; P < 0.001) from 2000-2010. Of the hospitalizations with RBC transfusion, 9.6% involved the use of 1 unit over the entire study period. The most common principal diagnoses for medical patients receiving transfusion were anemia, malignancy, heart failure, pneumonia and renal failure. Over time, transfusion utilization increased in patients who were admitted for infection (P = 0.009).
- Conclusion: Blood transfusions in 3 VHA hospitals have decreased over time for surgical patients but remained the same for medical patients. Further study examining appropriateness of blood products in medical patients appears necessary.
Key words: Transfusion; red blood cells; plasma; platelets; veterans.
Transfusion practices during hospitalization have changed considerably over the past 2 decades. Guided by evidence from randomized controlled trials, patient blood management programs have been expanded [1]. Such programs include recommendations regarding minimization of blood loss during surgery, prevention and treatment of anemia, strategies for reducing transfusions in both medical and surgical patients, improved blood utilization, education of health professionals, and standardization of blood management-related metrics [2]. Some of the guidelines have been incorporated into the Choosing Wisely initiative of the American Board of Internal Medicine Foundation, including: (a) don’t transfuse more units of blood than absolutely necessary, (b) don’t transfuse red blood cells for iron deficiency without hemodynamic instability, (c) don’t routinely use blood products to reverse warfarin, and (d) don’t perform serial blood counts on clinically stable patients [3]. Although there has been growing interest in blood management, only 37.8% of the 607 AABB (formerly, American Association of Blood Banks) facilities in the United States reported having a patient blood management program in 2013 [2].
While the importance of blood safety is recognized, data regarding the overall trends in practices are conflicting. A study using the Nationwide Inpatient Sample indicated that there was a 5.6% annual mean increase in the transfusion of blood products from 2002 to 2011 in the United States [4]. This contrasts with the experience of Kaiser Permanente in Northern California, in which the incidence of RBC transfusion decreased by 3.2% from 2009 to 2013 [5]. A decline in rates of intraoperative transfusion was also reported among elderly veterans in the United States from 1997 to 2009 [6].
We conducted a study in hospitalized veterans with 2 main objectives: (a) to evaluate trends in utilization of red blood cells (RBCs), platelets, and plasma over time, and (b) to identify those groups of veterans who received specific blood products. We were particularly interested in transfusion use in medical patients.
Methods
Participants were hospitalized veterans at 3 Department of Veterans Affairs (VA) medical centers. Data from all hospitalizations were collected from January 2000 through December 2010. Blood bank data (including the type and volume of products administered) were available electronically from each hospital. These files were linked to inpatient data, which included ICD-9-CM diagnoses (principal and secondary) and procedures during hospitalization.
Statistical analyses were conducted using generalized linear models to evaluate trends over time. The unit of observation was hospitalization, with categorization by type. Surgical hospitalizations were defined as admissions in which any surgical procedure occurred, whereas medical hospitalizations were defined as admissions without any surgery. Alpha was set at 0.05, 2-tailed. All analyses were conducted in Stata/MP 14.1 (StataCorp, College Station, TX). The study received institutional review board approval from the VA Ann Arbor Healthcare System.
Results
From 2000 through 2010, there were 176,521 hospitalizations in 69,621 patients. Within this cohort, 6% were < 40 years of age, 66% were 40 to 69 years of age, and 28% were 70 years or older at the time of admission. In this cohort, 96% of patients were male. Overall, 13.6% of all hospitalizations involved transfusion of a blood product (12.7% RBCs, 1.4% platelets, 3.0% plasma).
Transfusion occurred in 25.2% of surgical hospitalizations and 5.3% of medical hospitalizations. For surgical hospitalizations, transfusion use peaked in 2002 (when 30.9% of the surgical hospitalizations involved a trans-fusion) and significantly declined afterwards (P < 0.001). By 2010, 22.5% of the surgical hospitalizations involved a transfusion. Most of the surgeries where blood products were transfused involved cardiovascular procedures. For medical hospitalizations only, there was no significant change in transfusion use over time, either from 2000 to 2010 (P = 0.126) or from 2002 to 2010 (P = 0.072). In 2010, 5.2% of the medical hospitalizations involved a transfusion.
Rates of transfusion varied by principal diagnosis (Figure 1). For patients admitted with a principal diagnosis of infection (n = 20,981 hospitalizations), there was an increase in the percentage of hospitalizations in which transfusions (RBCs, platelet, plasma) were administered over time (P = 0.009) (Figure 1). For patients admitted with a principal diagnosis of malignancy (n = 12,904 hospitalizations), cardiovascular disease (n = 40,324 hospitalizations), and other diagnoses (n = 102,312 hospitalizations), there were no significant linear trends over the entire study period (P = 0.191, P = 0.052, P = 0.314, respectively). Rather, blood utilization peaked in year 2002 and significantly declined afterwards for patients admitted for malignancy (P < 0.001) and for cardiovascular disease (P < 0.001).
The most common principal diagnoses for medical patients receiving any transfusion (RBCs, platelet, plasma) are listed in Table 1. For medical patients with a principal diagnosis of anemia, 88% of hospitalizations involved a transfusion (Table 1). Transfusion occurred in 6% to 11% of medical hospitalizations with malignancies, heart failure, pneumonia or renal failure (Table 1). A considerable proportion (43%) of medical patients with gastrointestinal hemorrhage received a transfusion.
![]()
![]()
9.6% (2154/22,344) involved the use of only 1 unit, 43.8% (9791/22,344) involved 2 units, and 46.5% (10,399/22,344) involved 3 or more units during the hospitalization. From 2000 through 2010, there was a 20.3% reduction in the proportion of hospitalizations in which 3 or more units of RBCs were given (from 51.7% to 41.1%; P < 0.001). That is, among those hospitalizations in which a RBC transfusion occurred, a smaller proportion of hospitalizations involved the administration of 3 or more units of RBCs from 2000 through 2010 (Figure 2). There was an 11.5% increase in the proportion of hospitalizations in which 2 units of RBCs were used (from 40.4% to 45.0%; P < 0.001). In addition, there was a 73.6% increase in the proportion of hospitalizations in which 1 RBC unit was given (from 8.0% to 13.8%;
P = 0.001).
![]()
16.8 mL/hospitalization in 2010. For plasma, the mean mL/hospitalization was 28.9 in year 2000, increased to 50.1 mL/hospitalization in year 2008, and declined, thereafter, to 35.1 mL/hospitalization in year 2010.
Discussion
![]()
We also observed secular trends in the volume of RBCs administered. There was an increase in the percentage of hospitalizations in which 1 or 2 RBC units were used and a decline in transfusion of 3 or more units. The reduction in the use of 3 or more RBC units may reflect the adoption and integration of recommendations in patient blood management by clinicians,
which encourage assessment of the patients’ symptoms in determining whether additional units are necessary [7]. Such guidelines also endorse the avoidance of routine
administration of 2 units of RBCs if 1 unit is sufficient [8]. We have previously shown that, after coronary artery bypass grafting, 2 RBC units doubled the risk of pneumonia [9]; additional analyses indicated that 1 or 2 units of RBCs were associated with increased postoperative morbidity [10]. In addition, our previous research indicated that the probability of infection increased considerably between 1 and 2 RBC units, with a more gradual increase beyond 2 units [11]. With this evidence in mind, some studies at single sites have reported that there was a dramatic decline from 2 RBC units before initiation of patient blood management programs to 1 unit after the programs were implemented [12,13].
![]()
Medical patients who received a transfusion were often admitted for reason of anemia, cancer, organ failure, or pneumonia. Some researchers are now reporting that blood use, at certain sites, is becoming more common in medical rather than surgical patients, which may be due to an expansion of patient blood management procedures in surgery [16]. There are a substantial number of patient blood management programs among surgical specialties and their adoption has expanded [17]. Although there are fewer patient blood management programs in the nonsurgical setting, some have been targeted to internal medicine physicians and specifically, to hospitalists [1,18]. For example, a toolkit from the Society of Hospital Medicine centers on anemia management and includes anemia assessment, treatment, evaluation of RBC transfusion risk, blood conservation, optimization of coagulation, and patient-centered decision-making [19]. Additionally, bundling of patient blood management strategies has been launched to help encourage a wider adoption of such programs [20].
While guidelines regarding use of RBCs are becoming increasingly recognized, recommendations for the use of platelets and plasma are hampered by the paucity of evidence from randomized controlled trials [21,22]. There is moderate-quality evidence for the use of platelets with therapy-induced hypoproliferative thrombocytopenia in hospitalized patients [21], but low quality evidence for other uses. Moreover, a recent review of plasma transfusion in bleeding patients found no randomized controlled trials on plasma use in hospitalized patients, although several trials were currently underway [22].
Our findings need to be considered in the context of the following limitations. The data were from 3 VA hospitals, so the results may not reflect patterns of usage at other hospitals. However, AABB reports that there has been a general decrease in transfusion of allogeneic whole blood and RBC units since 2008 at the AABB-affiliated sites in the United States [2]; this is similar to the pattern that we observed in surgical patients. In addition, we report an overall view of trends without having details regarding which specific factors influenced changes in transfusion during this 11-year period. It is possible that the severity of hospitalized patients may have changed with time which could have influenced decisions regarding the need for transfusion.
In conclusion, the use of blood products decreased in surgical patients since 2002 but remained the same in medical patients in this VA population. Transfusions increased over time for patients who were admitted to the hospital for reason of infection, but decreased since 2002 for those admitted for cardiovascular disease or cancer. The number of RBC units per hospitalization decreased over time. Additional surveillance is needed to determine whether recent evidence regarding blood management has been incorporated into clinical practice for medical patients, as we strive to deliver optimal care to our veterans.
Corresponding author: Mary A.M. Rogers, PhD, MS, Dept. of Internal Medicine, Univ. of Michigan, 016-422W NCRC, Ann Arbor, MI 48109-2800, maryroge@umich.edu.
Funding/support: Department of Veterans Affairs, Clinical Sciences Research & Development Service Merit Review Award (EPID-011-11S). The contents do not represent the views of the U.S. Department of Veterans Affairs or the U.S. Government.
Financial disclosures: None.
Author contributions: conception and design, MAMR, SS; analysis and interpretation of data, MAMR, JDB, DR, LK, SS; drafting of article, MAMR; critical revision of the article, MAMR, MTG, DR, LK, SS, VC; statistical expertise, MAMR, DR; obtaining of funding, MTG, SS, VC; administrative or technical support, MTG, LK, SS, VC; collection and assembly of data, JDB, LK.
1. Hohmuth B, Ozawa S, Ashton M, Melseth RL. Patient-centered blood management. J Hosp Med 2014;9:60–5.
2. Whitaker B, Rajbhandary S, Harris A. The 2013 AABB blood collection, utilization, and patient blood management survey report. United States Department of Health and Human Services, AABB; 2015.
3. Cassel CK, Guest JA. Choosing wisely: helping physicians and patients make smart decisions about their care. JAMA 2012;307:1801–2.
4. Pathak R, Bhatt VR, Karmacharya P, et al. Trends in blood-product transfusion among inpatients in the United States from 2002 to 2011: data from the nationwide inpatient sample. J Hosp Med 2014;9:800–1.
5. Roubinian NH, Escobar GJ, Liu V, et al. Trends in red blood cell transfusion and 30-day mortality among hospitalized patients. Transfusion 2014;54:2678–86.
6. Chen A, Trivedi AN, Jiang L, et al. Hospital blood transfusion patterns during major noncardiac surgery and surgical mortality. Medicine (Baltimore) 2015;94:e1342.
7. Carson JL, Guyatt G, Heddle NM, et al. Clinical practice guidelines from the AABB: Red blood cell transfusion thresholds and storage. JAMA 2016;316:2025–35.
8. Hicks LK, Bering H, Carson KR, et al. The ASH choosing wisely® campaign: five hematologic tests and treatments to question. Blood 2013;122:3879–83.
9. Likosky DS, Paone G, Zhang M, et al. Red blood cell transfusions impact pneumonia rates after coronary artery bypass grafting. Ann Thorac Surg 2015;100:794–801.
10. Paone G, Likosky DS, Brewer R, et al. Transfusion of 1 and 2 units of red blood cells is associated with increased morbidity and mortality. Ann Thorac Surg 2014;97:87–93; discussion 93–4.
11. Rogers MAM, Blumberg N, Heal JM, et al. Role of transfusion in the development of urinary tract–related bloodstream infection. Arch Intern Med 2011;171:1587–9.
12. Oliver JC, Griffin RL, Hannon T, Marques MB. The success of our patient blood management program depended on an institution-wide change in transfusion practices. Transfusion 2014;54:2617–24.
13. Yerrabothala S, Desrosiers KP, Szczepiorkowski ZM, Dunbar NM. Significant reduction in red blood cell transfusions in a general hospital after successful implementation of a restrictive transfusion policy supported by prospective computerized order auditing. Transfusion 2014;54:2640–5.
14. Rehm JP, Otto PS, West WW, et al. Hospital-wide educational program decreases red blood cell transfusions. J Surg Res 1998;75:183–6.
15. Lawler EV, Bradbury BD, Fonda JR, et al. Transfusion burden among patients with chronic kidney disease and anemia. Clin J Am Soc Nephrol 2010;5:667–72.
16. Tinegate H, Pendry K, Murphy M, et al. Where do all the red blood cells (RBCs) go? Results of a survey of RBC use in England and North Wales in 2014. Transfusion 2016;56:139–45.
17. Meybohm P, Herrmann E, Steinbicker AU, et al. Patient blood management is associated with a substantial reduction of red blood cell utilization and safe for patient’s outcome: a prospective, multicenter cohort study with a noninferiority design. Ann Surg 2016;264:203–11.
18. Corwin HL, Theus JW, Cargile CS, Lang NP. Red blood cell transfusion: impact of an education program and a clinical guideline on transfusion practice. J Hosp Med 2014;9:745–9.
19. Society of Hospital Medicine. Anemia prevention and management program implementation toolkit. Accessed at www.hospitalmedicine.org/Web/Quality___Innovation/Implementation_Toolkit/Anemia/anemia_overview.aspx on 9 June 2017.
20. Meybohm P, Richards T, Isbister J, et al. Patient blood management bundles to facilitate implementation. Transfus Med Rev 2017;31:62–71.
21. Kaufman RM, Djulbegovic B, Gernsheimer T, et al. Platelet transfusion: a clinical practice guideline from the AABB. Ann Intern Med 2015;162:205–13.
22. Levy JH, Grottke O, Fries D, Kozek-Langenecker S. Therapeutic plasma transfusion in bleeding patients: A systematic review. Anesth Analg 2017;124:1268–76.
Abstract
- Background: Although transfusion guidelines have changed considerably over the past 2 decades, the adoption of patient blood management programs has not been fully realized across hospitals in the United States.
- Objective: To evaluate trends in red blood cell (RBC), platelet, and plasma transfusion at 3 Veterans Health Administration (VHA) hospitals from 2000 through 2010.
- Methods: Data from all hospitalizations were collected from January 2000 through December 2010. Blood bank data (including the type and volume of products administered) were available electronically from each hospital. These files were linked to inpatient data, which included ICD-9-CM diagnoses (principal and secondary) and procedures during hospitalization. Statistical analyses were conducted using generalized linear models to evaluate trends over time. The unit of observation was hospitalization, with categorization by type.
- Results: There were 176,521 hospitalizations in 69,621 patients; of these, 13.6% of hospitalizations involved transfusion of blood products (12.7% RBCs, 1.4% platelets, 3.0% plasma). Transfusion occurred in 25.2% of surgical and 5.3% of medical hospitalizations. Transfusion use peaked in 2002 for surgical hospitalizations and declined afterwards (P < 0.001). There was no significant change in transfusion use over time (P = 0.126) for medical hospitalizations. In hospitalizations that involved transfusions, there was a 20.3% reduction in the proportion of hospitalizations in which ≥ 3 units of RBCs were given (from 51.7% to 41.1%; P < 0.001) and a 73.6% increase when 1 RBC unit was given (from 8.0% to 13.8%; P < 0.001) from 2000-2010. Of the hospitalizations with RBC transfusion, 9.6% involved the use of 1 unit over the entire study period. The most common principal diagnoses for medical patients receiving transfusion were anemia, malignancy, heart failure, pneumonia and renal failure. Over time, transfusion utilization increased in patients who were admitted for infection (P = 0.009).
- Conclusion: Blood transfusions in 3 VHA hospitals have decreased over time for surgical patients but remained the same for medical patients. Further study examining appropriateness of blood products in medical patients appears necessary.
Key words: Transfusion; red blood cells; plasma; platelets; veterans.
Transfusion practices during hospitalization have changed considerably over the past 2 decades. Guided by evidence from randomized controlled trials, patient blood management programs have been expanded [1]. Such programs include recommendations regarding minimization of blood loss during surgery, prevention and treatment of anemia, strategies for reducing transfusions in both medical and surgical patients, improved blood utilization, education of health professionals, and standardization of blood management-related metrics [2]. Some of the guidelines have been incorporated into the Choosing Wisely initiative of the American Board of Internal Medicine Foundation, including: (a) don’t transfuse more units of blood than absolutely necessary, (b) don’t transfuse red blood cells for iron deficiency without hemodynamic instability, (c) don’t routinely use blood products to reverse warfarin, and (d) don’t perform serial blood counts on clinically stable patients [3]. Although there has been growing interest in blood management, only 37.8% of the 607 AABB (formerly, American Association of Blood Banks) facilities in the United States reported having a patient blood management program in 2013 [2].
While the importance of blood safety is recognized, data regarding the overall trends in practices are conflicting. A study using the Nationwide Inpatient Sample indicated that there was a 5.6% annual mean increase in the transfusion of blood products from 2002 to 2011 in the United States [4]. This contrasts with the experience of Kaiser Permanente in Northern California, in which the incidence of RBC transfusion decreased by 3.2% from 2009 to 2013 [5]. A decline in rates of intraoperative transfusion was also reported among elderly veterans in the United States from 1997 to 2009 [6].
We conducted a study in hospitalized veterans with 2 main objectives: (a) to evaluate trends in utilization of red blood cells (RBCs), platelets, and plasma over time, and (b) to identify those groups of veterans who received specific blood products. We were particularly interested in transfusion use in medical patients.
Methods
Participants were hospitalized veterans at 3 Department of Veterans Affairs (VA) medical centers. Data from all hospitalizations were collected from January 2000 through December 2010. Blood bank data (including the type and volume of products administered) were available electronically from each hospital. These files were linked to inpatient data, which included ICD-9-CM diagnoses (principal and secondary) and procedures during hospitalization.
Statistical analyses were conducted using generalized linear models to evaluate trends over time. The unit of observation was hospitalization, with categorization by type. Surgical hospitalizations were defined as admissions in which any surgical procedure occurred, whereas medical hospitalizations were defined as admissions without any surgery. Alpha was set at 0.05, 2-tailed. All analyses were conducted in Stata/MP 14.1 (StataCorp, College Station, TX). The study received institutional review board approval from the VA Ann Arbor Healthcare System.
Results
From 2000 through 2010, there were 176,521 hospitalizations in 69,621 patients. Within this cohort, 6% were < 40 years of age, 66% were 40 to 69 years of age, and 28% were 70 years or older at the time of admission. In this cohort, 96% of patients were male. Overall, 13.6% of all hospitalizations involved transfusion of a blood product (12.7% RBCs, 1.4% platelets, 3.0% plasma).
Transfusion occurred in 25.2% of surgical hospitalizations and 5.3% of medical hospitalizations. For surgical hospitalizations, transfusion use peaked in 2002 (when 30.9% of the surgical hospitalizations involved a trans-fusion) and significantly declined afterwards (P < 0.001). By 2010, 22.5% of the surgical hospitalizations involved a transfusion. Most of the surgeries where blood products were transfused involved cardiovascular procedures. For medical hospitalizations only, there was no significant change in transfusion use over time, either from 2000 to 2010 (P = 0.126) or from 2002 to 2010 (P = 0.072). In 2010, 5.2% of the medical hospitalizations involved a transfusion.
Rates of transfusion varied by principal diagnosis (Figure 1). For patients admitted with a principal diagnosis of infection (n = 20,981 hospitalizations), there was an increase in the percentage of hospitalizations in which transfusions (RBCs, platelet, plasma) were administered over time (P = 0.009) (Figure 1). For patients admitted with a principal diagnosis of malignancy (n = 12,904 hospitalizations), cardiovascular disease (n = 40,324 hospitalizations), and other diagnoses (n = 102,312 hospitalizations), there were no significant linear trends over the entire study period (P = 0.191, P = 0.052, P = 0.314, respectively). Rather, blood utilization peaked in year 2002 and significantly declined afterwards for patients admitted for malignancy (P < 0.001) and for cardiovascular disease (P < 0.001).
The most common principal diagnoses for medical patients receiving any transfusion (RBCs, platelet, plasma) are listed in Table 1. For medical patients with a principal diagnosis of anemia, 88% of hospitalizations involved a transfusion (Table 1). Transfusion occurred in 6% to 11% of medical hospitalizations with malignancies, heart failure, pneumonia or renal failure (Table 1). A considerable proportion (43%) of medical patients with gastrointestinal hemorrhage received a transfusion.
![]()
![]()
9.6% (2154/22,344) involved the use of only 1 unit, 43.8% (9791/22,344) involved 2 units, and 46.5% (10,399/22,344) involved 3 or more units during the hospitalization. From 2000 through 2010, there was a 20.3% reduction in the proportion of hospitalizations in which 3 or more units of RBCs were given (from 51.7% to 41.1%; P < 0.001). That is, among those hospitalizations in which a RBC transfusion occurred, a smaller proportion of hospitalizations involved the administration of 3 or more units of RBCs from 2000 through 2010 (Figure 2). There was an 11.5% increase in the proportion of hospitalizations in which 2 units of RBCs were used (from 40.4% to 45.0%; P < 0.001). In addition, there was a 73.6% increase in the proportion of hospitalizations in which 1 RBC unit was given (from 8.0% to 13.8%;
P = 0.001).
![]()
16.8 mL/hospitalization in 2010. For plasma, the mean mL/hospitalization was 28.9 in year 2000, increased to 50.1 mL/hospitalization in year 2008, and declined, thereafter, to 35.1 mL/hospitalization in year 2010.
Discussion
![]()
We also observed secular trends in the volume of RBCs administered. There was an increase in the percentage of hospitalizations in which 1 or 2 RBC units were used and a decline in transfusion of 3 or more units. The reduction in the use of 3 or more RBC units may reflect the adoption and integration of recommendations in patient blood management by clinicians,
which encourage assessment of the patients’ symptoms in determining whether additional units are necessary [7]. Such guidelines also endorse the avoidance of routine
administration of 2 units of RBCs if 1 unit is sufficient [8]. We have previously shown that, after coronary artery bypass grafting, 2 RBC units doubled the risk of pneumonia [9]; additional analyses indicated that 1 or 2 units of RBCs were associated with increased postoperative morbidity [10]. In addition, our previous research indicated that the probability of infection increased considerably between 1 and 2 RBC units, with a more gradual increase beyond 2 units [11]. With this evidence in mind, some studies at single sites have reported that there was a dramatic decline from 2 RBC units before initiation of patient blood management programs to 1 unit after the programs were implemented [12,13].
![]()
Medical patients who received a transfusion were often admitted for reason of anemia, cancer, organ failure, or pneumonia. Some researchers are now reporting that blood use, at certain sites, is becoming more common in medical rather than surgical patients, which may be due to an expansion of patient blood management procedures in surgery [16]. There are a substantial number of patient blood management programs among surgical specialties and their adoption has expanded [17]. Although there are fewer patient blood management programs in the nonsurgical setting, some have been targeted to internal medicine physicians and specifically, to hospitalists [1,18]. For example, a toolkit from the Society of Hospital Medicine centers on anemia management and includes anemia assessment, treatment, evaluation of RBC transfusion risk, blood conservation, optimization of coagulation, and patient-centered decision-making [19]. Additionally, bundling of patient blood management strategies has been launched to help encourage a wider adoption of such programs [20].
While guidelines regarding use of RBCs are becoming increasingly recognized, recommendations for the use of platelets and plasma are hampered by the paucity of evidence from randomized controlled trials [21,22]. There is moderate-quality evidence for the use of platelets with therapy-induced hypoproliferative thrombocytopenia in hospitalized patients [21], but low quality evidence for other uses. Moreover, a recent review of plasma transfusion in bleeding patients found no randomized controlled trials on plasma use in hospitalized patients, although several trials were currently underway [22].
Our findings need to be considered in the context of the following limitations. The data were from 3 VA hospitals, so the results may not reflect patterns of usage at other hospitals. However, AABB reports that there has been a general decrease in transfusion of allogeneic whole blood and RBC units since 2008 at the AABB-affiliated sites in the United States [2]; this is similar to the pattern that we observed in surgical patients. In addition, we report an overall view of trends without having details regarding which specific factors influenced changes in transfusion during this 11-year period. It is possible that the severity of hospitalized patients may have changed with time which could have influenced decisions regarding the need for transfusion.
In conclusion, the use of blood products decreased in surgical patients since 2002 but remained the same in medical patients in this VA population. Transfusions increased over time for patients who were admitted to the hospital for reason of infection, but decreased since 2002 for those admitted for cardiovascular disease or cancer. The number of RBC units per hospitalization decreased over time. Additional surveillance is needed to determine whether recent evidence regarding blood management has been incorporated into clinical practice for medical patients, as we strive to deliver optimal care to our veterans.
Corresponding author: Mary A.M. Rogers, PhD, MS, Dept. of Internal Medicine, Univ. of Michigan, 016-422W NCRC, Ann Arbor, MI 48109-2800, maryroge@umich.edu.
Funding/support: Department of Veterans Affairs, Clinical Sciences Research & Development Service Merit Review Award (EPID-011-11S). The contents do not represent the views of the U.S. Department of Veterans Affairs or the U.S. Government.
Financial disclosures: None.
Author contributions: conception and design, MAMR, SS; analysis and interpretation of data, MAMR, JDB, DR, LK, SS; drafting of article, MAMR; critical revision of the article, MAMR, MTG, DR, LK, SS, VC; statistical expertise, MAMR, DR; obtaining of funding, MTG, SS, VC; administrative or technical support, MTG, LK, SS, VC; collection and assembly of data, JDB, LK.
1. Hohmuth B, Ozawa S, Ashton M, Melseth RL. Patient-centered blood management. J Hosp Med 2014;9:60–5.
2. Whitaker B, Rajbhandary S, Harris A. The 2013 AABB blood collection, utilization, and patient blood management survey report. United States Department of Health and Human Services, AABB; 2015.
3. Cassel CK, Guest JA. Choosing wisely: helping physicians and patients make smart decisions about their care. JAMA 2012;307:1801–2.
4. Pathak R, Bhatt VR, Karmacharya P, et al. Trends in blood-product transfusion among inpatients in the United States from 2002 to 2011: data from the nationwide inpatient sample. J Hosp Med 2014;9:800–1.
5. Roubinian NH, Escobar GJ, Liu V, et al. Trends in red blood cell transfusion and 30-day mortality among hospitalized patients. Transfusion 2014;54:2678–86.
6. Chen A, Trivedi AN, Jiang L, et al. Hospital blood transfusion patterns during major noncardiac surgery and surgical mortality. Medicine (Baltimore) 2015;94:e1342.
7. Carson JL, Guyatt G, Heddle NM, et al. Clinical practice guidelines from the AABB: Red blood cell transfusion thresholds and storage. JAMA 2016;316:2025–35.
8. Hicks LK, Bering H, Carson KR, et al. The ASH choosing wisely® campaign: five hematologic tests and treatments to question. Blood 2013;122:3879–83.
9. Likosky DS, Paone G, Zhang M, et al. Red blood cell transfusions impact pneumonia rates after coronary artery bypass grafting. Ann Thorac Surg 2015;100:794–801.
10. Paone G, Likosky DS, Brewer R, et al. Transfusion of 1 and 2 units of red blood cells is associated with increased morbidity and mortality. Ann Thorac Surg 2014;97:87–93; discussion 93–4.
11. Rogers MAM, Blumberg N, Heal JM, et al. Role of transfusion in the development of urinary tract–related bloodstream infection. Arch Intern Med 2011;171:1587–9.
12. Oliver JC, Griffin RL, Hannon T, Marques MB. The success of our patient blood management program depended on an institution-wide change in transfusion practices. Transfusion 2014;54:2617–24.
13. Yerrabothala S, Desrosiers KP, Szczepiorkowski ZM, Dunbar NM. Significant reduction in red blood cell transfusions in a general hospital after successful implementation of a restrictive transfusion policy supported by prospective computerized order auditing. Transfusion 2014;54:2640–5.
14. Rehm JP, Otto PS, West WW, et al. Hospital-wide educational program decreases red blood cell transfusions. J Surg Res 1998;75:183–6.
15. Lawler EV, Bradbury BD, Fonda JR, et al. Transfusion burden among patients with chronic kidney disease and anemia. Clin J Am Soc Nephrol 2010;5:667–72.
16. Tinegate H, Pendry K, Murphy M, et al. Where do all the red blood cells (RBCs) go? Results of a survey of RBC use in England and North Wales in 2014. Transfusion 2016;56:139–45.
17. Meybohm P, Herrmann E, Steinbicker AU, et al. Patient blood management is associated with a substantial reduction of red blood cell utilization and safe for patient’s outcome: a prospective, multicenter cohort study with a noninferiority design. Ann Surg 2016;264:203–11.
18. Corwin HL, Theus JW, Cargile CS, Lang NP. Red blood cell transfusion: impact of an education program and a clinical guideline on transfusion practice. J Hosp Med 2014;9:745–9.
19. Society of Hospital Medicine. Anemia prevention and management program implementation toolkit. Accessed at www.hospitalmedicine.org/Web/Quality___Innovation/Implementation_Toolkit/Anemia/anemia_overview.aspx on 9 June 2017.
20. Meybohm P, Richards T, Isbister J, et al. Patient blood management bundles to facilitate implementation. Transfus Med Rev 2017;31:62–71.
21. Kaufman RM, Djulbegovic B, Gernsheimer T, et al. Platelet transfusion: a clinical practice guideline from the AABB. Ann Intern Med 2015;162:205–13.
22. Levy JH, Grottke O, Fries D, Kozek-Langenecker S. Therapeutic plasma transfusion in bleeding patients: A systematic review. Anesth Analg 2017;124:1268–76.