User login
Postpartum depression: Moving toward improved screening with a new app
Over the last several years, there’s been increasing interest and ultimately a growing number of mandates across dozens of states to screen women for postpartum depression (PPD). As PPD is the most common, and often devastating, complication in modern obstetrics, screening for it is a movement that I fully support.
What’s been challenging is how to roll out screening in a widespread fashion using a standardized tool that is both easy to use and to score, and that has only a modest number of false positives (i.e., it has good specificity).

The first version of the MGHPDS app combines the Edinburgh Postpartum Depression Scale (EPDS) – the most commonly used screen for PPD – with screening tools that measure sleep disturbance, anxiety, and stress. And while the Edinburgh scale has been an enormous contribution to psychiatry, its implementation in obstetric settings and community settings using pen and pencil has been a challenge at times given the inclusion of some questions that are “reverse scored”; other problems when the EPDS has been scaled for use in large settings include rates of false positives as high as 25%.
Our app, which gives users an opportunity to let us review their scores after giving informed consent, ultimately will lead to the development of a shortened set of questions that zero in on the symptoms most commonly associated with PPD. That information will derive from a validation study looking at how well the questions on the MGHPDS correlate with major depression; we hope to launch version 2.0 in mid-2018. The second version of the app is likely to include some items from the Edinburgh scale and also selected symptoms of anxiety, sleep problems, and perceived stress. Thus, the goal of the second version will be realized: a more specific scale with targeted symptoms that correlate with the clinical diagnosis of depression.
Automatic scoring of the questionnaires leads to an app-generated result across a spectrum from “no evidence of depressive symptoms,” to a message noting concern and instructing the user to seek medical attention. There are also links to educational resources about PPD within the app.

The task of referring women with PPD for treatment and then getting them well is a huge undertaking, and one where we currently are falling short. I have been heartened across the last decade to see the focus land on the issue of PPD screening, but failing to couple screening with evidence-based treatment is an incomplete victory. So with the next version of the app, we want to include treatment tools and a way to track women over time, looking at whether they were treated and if they got well.
We want clinicians to be aware of our app and to share it with their patients. But even more importantly, we want to reach out directly to women because they will lead the way on this effort.
The stakes for unrecognized and untreated PPD are simply too great for women, children, and their families.
Dr. Cohen is the director of the Ammon-Pinizzotto Center for Women’s Mental Health at Massachusetts General Hospital in Boston, which provides information resources and conducts clinical care and research in reproductive mental health. He has been a consultant to manufacturers of psychiatric medications.
Over the last several years, there’s been increasing interest and ultimately a growing number of mandates across dozens of states to screen women for postpartum depression (PPD). As PPD is the most common, and often devastating, complication in modern obstetrics, screening for it is a movement that I fully support.
What’s been challenging is how to roll out screening in a widespread fashion using a standardized tool that is both easy to use and to score, and that has only a modest number of false positives (i.e., it has good specificity).
The first version of the MGHPDS app combines the Edinburgh Postpartum Depression Scale (EPDS) – the most commonly used screen for PPD – with screening tools that measure sleep disturbance, anxiety, and stress. And while the Edinburgh scale has been an enormous contribution to psychiatry, its implementation in obstetric settings and community settings using pen and pencil has been a challenge at times given the inclusion of some questions that are “reverse scored”; other problems when the EPDS has been scaled for use in large settings include rates of false positives as high as 25%.
Our app, which gives users an opportunity to let us review their scores after giving informed consent, ultimately will lead to the development of a shortened set of questions that zero in on the symptoms most commonly associated with PPD. That information will derive from a validation study looking at how well the questions on the MGHPDS correlate with major depression; we hope to launch version 2.0 in mid-2018. The second version of the app is likely to include some items from the Edinburgh scale and also selected symptoms of anxiety, sleep problems, and perceived stress. Thus, the goal of the second version will be realized: a more specific scale with targeted symptoms that correlate with the clinical diagnosis of depression.
Automatic scoring of the questionnaires leads to an app-generated result across a spectrum from “no evidence of depressive symptoms,” to a message noting concern and instructing the user to seek medical attention. There are also links to educational resources about PPD within the app.
The task of referring women with PPD for treatment and then getting them well is a huge undertaking, and one where we currently are falling short. I have been heartened across the last decade to see the focus land on the issue of PPD screening, but failing to couple screening with evidence-based treatment is an incomplete victory. So with the next version of the app, we want to include treatment tools and a way to track women over time, looking at whether they were treated and if they got well.
We want clinicians to be aware of our app and to share it with their patients. But even more importantly, we want to reach out directly to women because they will lead the way on this effort.
The stakes for unrecognized and untreated PPD are simply too great for women, children, and their families.
Dr. Cohen is the director of the Ammon-Pinizzotto Center for Women’s Mental Health at Massachusetts General Hospital in Boston, which provides information resources and conducts clinical care and research in reproductive mental health. He has been a consultant to manufacturers of psychiatric medications.
Payment changes drive hysteroscopy to the office
The benefits of integrating hysteroscopy into office practice have been compelling for some time. An in-office approach is patient centered, more efficient, and clinically valuable. It also has had the potential to be economically valuable for practices that are able to perform a mix of diagnostic and therapeutic/operative hysteroscopies.
Dramatic shifts within the Centers for Medicare & Medicaid Services fee schedule in 2017 – and commensurate changes in the private insurance market – have now ramped up this value, making it all the more important that physicians consider investing in equipment and adopting an in-office approach.
Central to this increase, in turn, is a significant increase in practice expense reimbursement. CMS has included the costs of equipment, including the costs of the hysteroscopic fluid management system and the hysteroscopic tissue resection system, in recalibrating the practice expense relative value unit. Clearly, physicians are being encouraged to move hysteroscopic procedures into the office.
Weighing an investment
In the Medicare resource-based relative value scale payment system, relative value units (RVUs) are calculated based on three elements: physician work, practice expenses, and malpractice cost. Each component is multiplied by a factor that accounts for geographic cost variations, and each total RVU is multiplied by a dollar amount known as the conversion factor.
This isn’t the first year that the payment system – a standard for many other payers in determining compensation – allows for higher reimbursement for some hysteroscopic procedures performed in the office. The practice expense relative units have been higher for some time for certain hysteroscopic procedures – such as diagnostic hysteroscopy (code 58555), removal of a foreign body (58562), endometrial ablation (58353), and biopsy/polypectomy (58558) – when these procedures are performed in the office, compared with the hospital or an ambulatory surgical center.
However, the new increase in physician office payment for 58558 changes the equation significantly and ensures a better return on investment. In 2017, CMS offered a 12% increase in the facility fee paid to hospitals and a 2% increase in the facility fee paid to outpatient surgery centers when a hysteroscopic biopsy/polypectomy is performed in these settings, but the physician reimbursement in these cases declined 11%-19%.
On the flip side, an in-office approach to hysteroscopic biopsy/polypectomy has been rewarded in 2017 through a significantly higher practice expense RVU and a “non-facility” total RVU of 38.51 – a 237% increase over the 2016 practice expense RVU of 11.4. Such dramatic differences between the practice RVUs – and total RVUs – for in-office and out-of-office hysteroscopic procedures will continue for 2018.
Private insurers are following suit, and some are increasing their reimbursement even more. As of June 2017 in metropolitan Chicago, Blue Cross Blue Shield has been reimbursing in-office hysteroscopic biopsy/polypectomy at approximately $2,424.00; prior to June, the allowable charge was $742.81.
Equipment costs for in-office hysteroscopy can range from $15,000 to $35,000, based on whether equipment is new or used, the number of trays, and the style of camera and monitor system. Ancillary equipment/disposables cost $10 or less, and $40-$50 or less for diagnostic and many operative procedures, respectively. The prices for handpiece mechanical resection disposables or tissue removal devices vary based on company and blade type, so these costs will need to be accounted for if such equipment is incorporated. Again, the CMS increase in reimbursement for offices accommodates for the inclusion of these disposables as well as fluid management disposable costs.
If diagnostic hysteroscopy (as a separate procedure) is the procedure that you perform most often, the investment will look less favorable. However, if you anticipate performing hysteroscopic biopsies and/or polypectomies as well, the investment will look significantly more favorable now than it has in past years.
Once you have established your in-office system, even those procedures that are weighted equally for the practice setting (non-facility) and hospital/surgery center setting, such as hysteroscopic lysis of adhesions (58559), can be easily incorporated from a financial point of view.
In addition to reimbursement levels, it’s important to consider the efficiencies of in-office hysteroscopy. The setup is relatively simple and requires a dedicated exam room, not a surgical suite. You can perform one or two annual exams while the assistant sets up the room and greets each patient, for instance, or see another established patient while the assistant discharges your patient and turns the room over. Hysteroscopy at the hospital, or even at an ambulatory surgical center, involves time driving, changing, and waiting for anesthesia.
For our patients, most importantly, an in-office approach offers less out-of-pocket expense (deductibles), less time away from family/work, avoidance of general anesthesia/intubation, and greater patient comfort from being within a familiar environment. For diagnostic procedures, the patient can be in and out in less than 30 minutes, and for operative procedures, she can be in and out in 1-2 hours, compared with more than 4 hours at the hospital.
Preparing the office
Physicians in Europe have been performing in-office hysteroscopy for years. But in the United States, it is a newer concept, with most gynecologic surgeons having been taught to perform surgical procedures in the operating room. Undoubtedly, our unfamiliarity with in-office surgery has played a role in the slow uptake of hysteroscopy in our practices.
Open communication about everything the patient will see hear and feel before, during and after the procedure is important. Focusing on these details can improve your patient’s experience and your professional relationship with her.
In an earlier edition of Master Class, I addressed instrumentation and technique, elements of pain control and anesthesia, and the value of a vaginoscopic approach to hysteroscopy. Vaginoscopy avoids the use of a vaginal speculum or cervical tenaculum, and is so tolerable to many patients that I use minimal premedication and only rarely use any local anesthetic and/or sedation, even for biopsies and polypectomies.
Preparing your practice for hysteroscopy is a multifaceted process involving not only the purchase and/or rental of equipment but also compliance with guidelines, regulatory considerations, patient rights, hospital transfer arrangements, and other issues. ACOG’s Report of the Presidential Task Force on Patient Safety in the Office Setting is a valuable resource for getting started. The report discusses anesthesia levels and the benefits and risks of a contract anesthesiologist, for instance, as well as the role of and processes for credentialing, privileging, and accreditation.
Checklists and drills are important for ensuring a safe practice, and the report discusses each of these elements and provides templates and examples. A sample “Office Surgical Safety Checklist” to be used for each procedure, for instance, has sections with preoperative steps (before anesthesia/analgesia, and before incision), intraoperative steps, postoperative steps, and discharge steps. Similar in format to checklists used in the aviation industry, each step has a box to be checked off to verify completion.
Mock drills help ensure that staff are knowledgeable about their roles and coordinated in their response to potential complications, such as vasovagal episodes, respiratory arrest caused by laryngospasm, and local anesthetic toxicity reactions. And, while not the focus of drills, we also must be prepared to manage cervical strictures and stenosis, cervical laceration, uterine perforation, and other complications.
Outpatient surgery guidelines from organizations such as the American College of Surgeons, the Joint Commission, state regulatory agencies, and professional liability insurers, can also be useful resources. With the use of ACOG’s report and other such resources, the set-up and the transition to in-office hysteroscopy need not be daunting. For most gynecologic surgeons, it will all feel comfortable after only a few procedures.
Dr. Cholkeri-Singh is with the University of Illinois at Chicago, and is director of gynecologic surgical education and associate director of minimally invasive gynecology at Advocate Lutheran General Hospital in Park Ridge, Ill. She is in private practice in Chicago. She is a consultant for Hologic, Bayer HealthCare, Olympus, Caldera Medical, Karl Storz, Medtronic, DYSIS Medical, and Channel Medsystems.
Understanding the new economic benefits of in-office hysteroscopy
As a practicing reproductive endocrinologist and minimally invasive gynecologic surgeon, falling reimbursement has become routine. Furthermore, it was disadvantageous to perform in-office procedures while physician reimbursement was similar whether cases were performed in office, the hospital, or a surgery center. Higher procedural costs in the office, including reusable and disposable instrumentation and staffing, actually discouraged the physician who wanted to perform cases in the office, as it led to an overall reduction in reimbursement. Of course, certain outlying procedures have been reimbursed at a far greater rate in office and, as a result, global endometrial ablation and the Essure procedure now are generally performed in office.

In order to help us all understand the “nuts and bolts” behind the changes in physician compensation for in-office hysteroscopic procedures, I have once again called upon internationally recognized expert in hysteroscopic surgery, Aarathi Cholkeri-Singh, MD. At the AAGL 45th Global Congress on Minimally Invasive Gynecologic Surgery in 2016, Dr. Cholkeri-Singh was the chair and faculty of the postgraduate course, “Hysteroscopy 360° Beyond the Basics: Maximize Treatment, Minimize Failures.” At this year’s Global Congress, Dr. Cholkeri-Singh is a cochair of the postgraduate course “Advanced Operative Hysteroscopy: Expect the Unexpected.”
I am sure after reading Dr. Cholkeri-Singh’s comments, many of our readers of the Master Class in Gynecologic Surgery will add hysteroscopic surgery to their surgical repertoire.
Dr. Miller is clinical associate professor at the University of Illinois at Chicago and past president of the AAGL. He is a reproductive endocrinologist and minimally invasive gynecologic surgeon in metropolitan Chicago; director of minimally invasive gynecologic surgery at Advocate Lutheran General Hospital, Park Ridge, Ill.; and the medical editor of this column. He is a consultant for Medtronic.
As a practicing reproductive endocrinologist and minimally invasive gynecologic surgeon, falling reimbursement has become routine. Furthermore, it was disadvantageous to perform in-office procedures while physician reimbursement was similar whether cases were performed in office, the hospital, or a surgery center. Higher procedural costs in the office, including reusable and disposable instrumentation and staffing, actually discouraged the physician who wanted to perform cases in the office, as it led to an overall reduction in reimbursement. Of course, certain outlying procedures have been reimbursed at a far greater rate in office and, as a result, global endometrial ablation and the Essure procedure now are generally performed in office.
In order to help us all understand the “nuts and bolts” behind the changes in physician compensation for in-office hysteroscopic procedures, I have once again called upon internationally recognized expert in hysteroscopic surgery, Aarathi Cholkeri-Singh, MD. At the AAGL 45th Global Congress on Minimally Invasive Gynecologic Surgery in 2016, Dr. Cholkeri-Singh was the chair and faculty of the postgraduate course, “Hysteroscopy 360° Beyond the Basics: Maximize Treatment, Minimize Failures.” At this year’s Global Congress, Dr. Cholkeri-Singh is a cochair of the postgraduate course “Advanced Operative Hysteroscopy: Expect the Unexpected.”
I am sure after reading Dr. Cholkeri-Singh’s comments, many of our readers of the Master Class in Gynecologic Surgery will add hysteroscopic surgery to their surgical repertoire.
Dr. Miller is clinical associate professor at the University of Illinois at Chicago and past president of the AAGL. He is a reproductive endocrinologist and minimally invasive gynecologic surgeon in metropolitan Chicago; director of minimally invasive gynecologic surgery at Advocate Lutheran General Hospital, Park Ridge, Ill.; and the medical editor of this column. He is a consultant for Medtronic.

Returns to Emergency Department, Observation, or Inpatient Care Within 30 Days After Hospitalization in 4 States, 2009 and 2010 Versus 2013 and 2014
Given the frequency, potential preventability, and costs associated with hospital readmissions, reducing readmissions is a priority in efforts to improve the quality and value of healthcare.1,2 State and national bodies have created diverse initiatives to facilitate improvements in hospital discharge practices and reduce 30-day readmission rates across payers.3-5 For example, the Agency for Healthcare Research and Quality (AHRQ) and the Institute for Healthcare Improvement have published tools for improving discharge practices.6,7 Medicare instituted financial penalties for hospitals with higher-than-expected readmission rates for acute myocardial infarction (AMI), heart failure (HF), and pneumonia in 2012, while private payers and Medicaid programs have established their own policies.8-13 Furthermore, private payers and Medicaid programs shifted toward capitated and value-based reimbursement models in which readmissions lead to financial losses for hospitals.14,15 Accordingly, hospitals have implemented diverse interventions to reduce readmissions.16,17 From 2009 to 2013, 30-day readmissions declined among privately insured adults (from 12.4% to 11.7%), Medicare patients (from 22.0% to 20.0%), and uninsured individuals (11.5% to 11.0%) but climbed among patients with Medicaid (from 19.8% to 20.5%) after index admissions for AMI, HF, pneumonia, or chronic obstructive pulmonary disease.18
To date, research, policies, and quality improvement interventions have largely focused on improvements to one aspect of the system of care—that provided in the inpatient setting—among older adults with Medicare. Yet, inpatient readmissions may underestimate how often patients return to the hospital because patients can be placed under observation or stabilized and discharged from the emergency department (ED) instead of being readmitted. Observation and ED visits are less costly to payers than inpatient admissions.19 Thus, information about utilization of inpatient, observation, and ED visits within 30 days of hospital discharge may be more informative than inpatient readmissions alone. However, little is known about trends in returns to the hospital for observation and ED visits and whether such trends vary by payer.
Our objective was to assess whether changes have occurred in rates of total 30-day, all-cause, unplanned returns to the hospital among adults with index admissions for AMI, HF, and pneumonia in which returns to the hospital included inpatient readmissions, observation visits, and ED visits. We also assessed whether changes in the rate of hospital inpatient readmissions coincided with changes in rates of returns for ED or observation visits. To examine the effects of readmission policies implemented by diverse payers and broad changes to the health system following the Affordable Care Act, we compared data from 201 hospitals in 4 states in 2009 and 2010 with data from the same hospitals for 2013 and 2014.
METHODS
Data Sources, Populations, and Study Variables
We used Healthcare Cost and Utilization Project (HCUP) State Inpatient Databases, State Emergency Department Databases, and State Ambulatory Surgery and Services Databases from Georgia, Nebraska, South Carolina, and Tennessee. These states comprise 7% of the US population and were the only states with data that included all observation and ED visits as well as encrypted patient identification numbers that permitted linkage across facilities and hospitals.20
Index admissions for patients aged 18 years and older were eligible if they occurred at nonfederal general medical/surgical hospitals (excluding critical access hospitals) that had at least 1 index admission per target condition per year and at least 5 inpatient, observation, and ED visits for any condition per year.
We classified patients into the following 4 populations by age and insurance coverage: 18 to 64 years with private insurance, 65 years and older with Medicare (excluding younger adults with Medicare), 18 to 64 years with Medicaid, and 18 to 64 years without insurance. We identified patients aged 65 years and older with Medicare by using the primary or secondary expected payer for the index admission. This group included patients who were dually eligible for Medicare and Medicaid. If Medicare was not the primary or secondary payer, we used the primary payer to identify Medicaid, privately insured, and uninsured patients aged 18 to 64 years. None of the states expanded Medicaid coverage during the years studied.
The primary outcome of interest was the rate of having 1 or more all-cause, unplanned return(s) to an acute care hospital within 30 days of discharge after an index admission for AMI, HF, and pneumonia as defined by a modified version of Centers for Medicare & Medicaid Services’ readmission metrics.21,22 We examined total return rates as well as rates for inpatient, observation, and ED care. We also examined the leading diagnoses associated with returns to the hospital. For each index admission, we included only 1 return visit, giving priority to inpatient readmissions, then observation visits, and then ED visits.
The HCUP databases are consistent with the definition of limited data sets under the Health Insurance Portability and Accountability Act Privacy Rule and contain no direct patient identifiers. The AHRQ Institutional Review Board considers research using HCUP data to have exempt status.
Statistical Analysis
To compare rates at which patients returned to the hospital during 2 cohort periods (2009 and 2010 vs 2013 and 2014), we used coarsened exact matching, a well-established matching technique for balancing covariates between 2 populations of patients that may be related to the outcome.23 For observational datasets, coarsened exact matching is preferable to traditional matching because it enables the investigator to assess balance between the 2 populations, select the desired degree of balance, and eliminate observations for which comparable matches cannot be found.
We assembled sets of index admissions in each study period that were similar with respect to payer, primary diagnosis, and other factors. Matching variables included the patient’s age group, sex, and Elixhauser Comorbidity Index24 (in deciles), as well as the hospital’s ratio of observation visits relative to inpatient admissions in 2009 and 2010 combined (in quartiles; see supplementary Appendix). For Medicare beneficiaries, we also matched on dual enrollment in Medicaid.
We conducted the matching process separately for each target condition and payer population. First, we grouped index admissions in both periods into strata defined by all possible combinations of the matching variables and allowing one-to-many random matching within strata. We then dropped records in any strata for which there were no records in 1 of the time periods. Finally, we calculated weights based on the size of each stratum. We used these weights to account for the different numbers of index admissions in each stratum between the 2 study periods. For example, if a stratum contained 10 index admissions in 2009 and 2010 combined and 20 in 2013 and 2014 combined, an admission weighed double in the earlier period. After weighting, the index admissions in each period (2009 and 2010; 2013 and 2014) had similar characteristics (Table 1).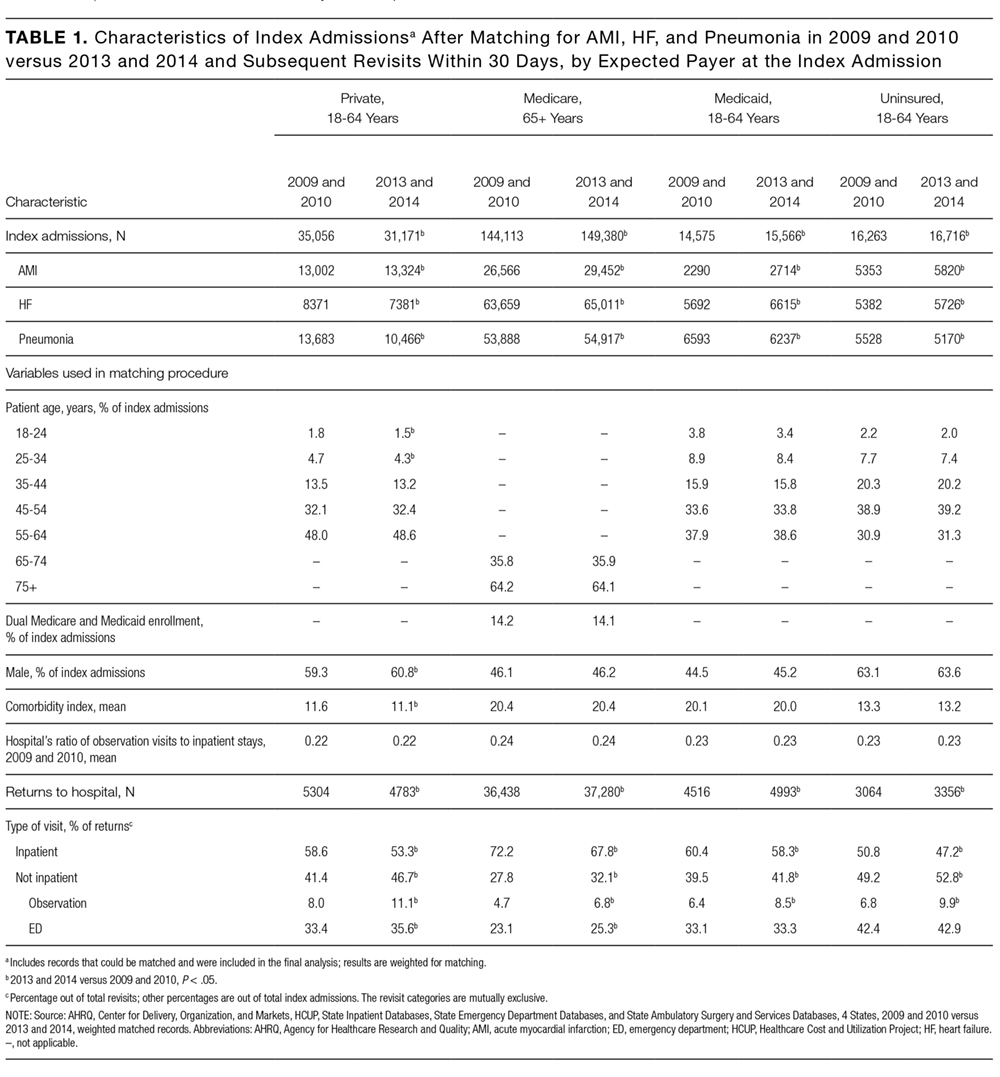
RESULTS
There were 423,503 eligible index admissions for AMI, HF, and pneumonia in the 2 periods combined; 422,840 (99.8%) were successfully matched and included in this analysis. After matching weights were applied, there were few statistically significant differences across the 2 time periods (see Table 1 and supplementary Appendix).
From 2009 and 2010 to 2013 and 2014, the percentage of patients hospitalized for AMI, HF, and pneumonia who had only observation or ED visits when they returned to the hospital increased from 41.4% to 46.7% among patients with private insurance (P < 0.001), from 27.8% to 32.1% among older patients with Medicare (P < 0.001), from 39.5% to 41.8% among patients with Medicaid (P = 0.03), and from 49.2% to 52.8% among patients without insurance (P = 0.004; Table 1). The percentage of returns to the hospital for observation increased across all payers (P < 0.001); in 2013 and 2014 combined, observation visits ranged from 6.8% of hospital returns among patients with Medicare to 11.1% among patients with private insurance. The percentage of returns to the hospital for an ED visit increased among patients with private insurance (P = 0.02) and Medicare (P < 0.001); in 2013 and 2014, ED visits ranged from 25.3% of returns to the hospital among patients with Medicare to 42.9% among uninsured patients.
The increases in 30-day observation and ED visits coincided with reductions in inpatient readmissions among patients with private insurance and Medicare and contributed to growth in total returns to the hospital among patients with Medicaid or no insurance (Figure 1).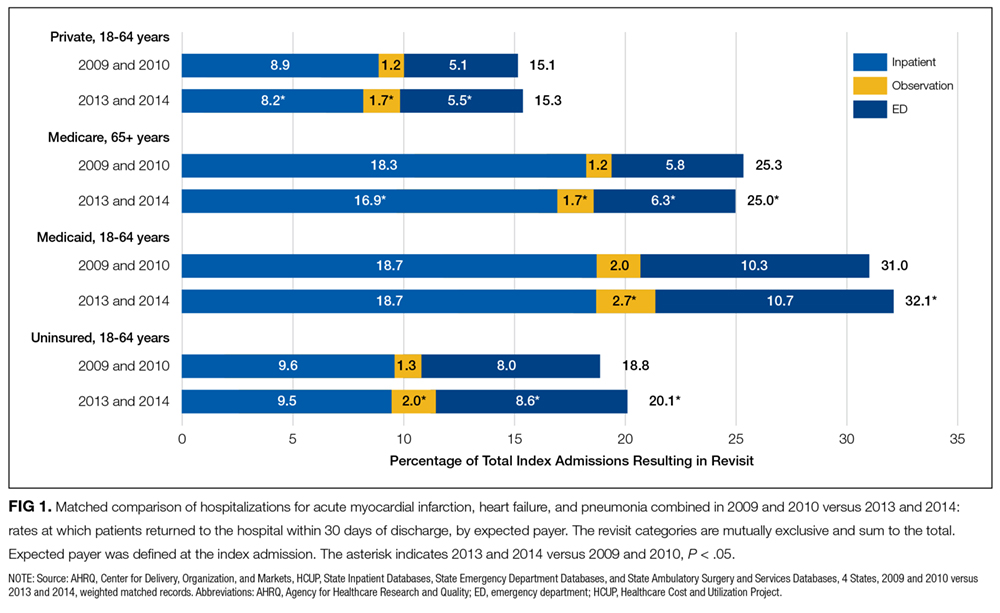
Figure 2 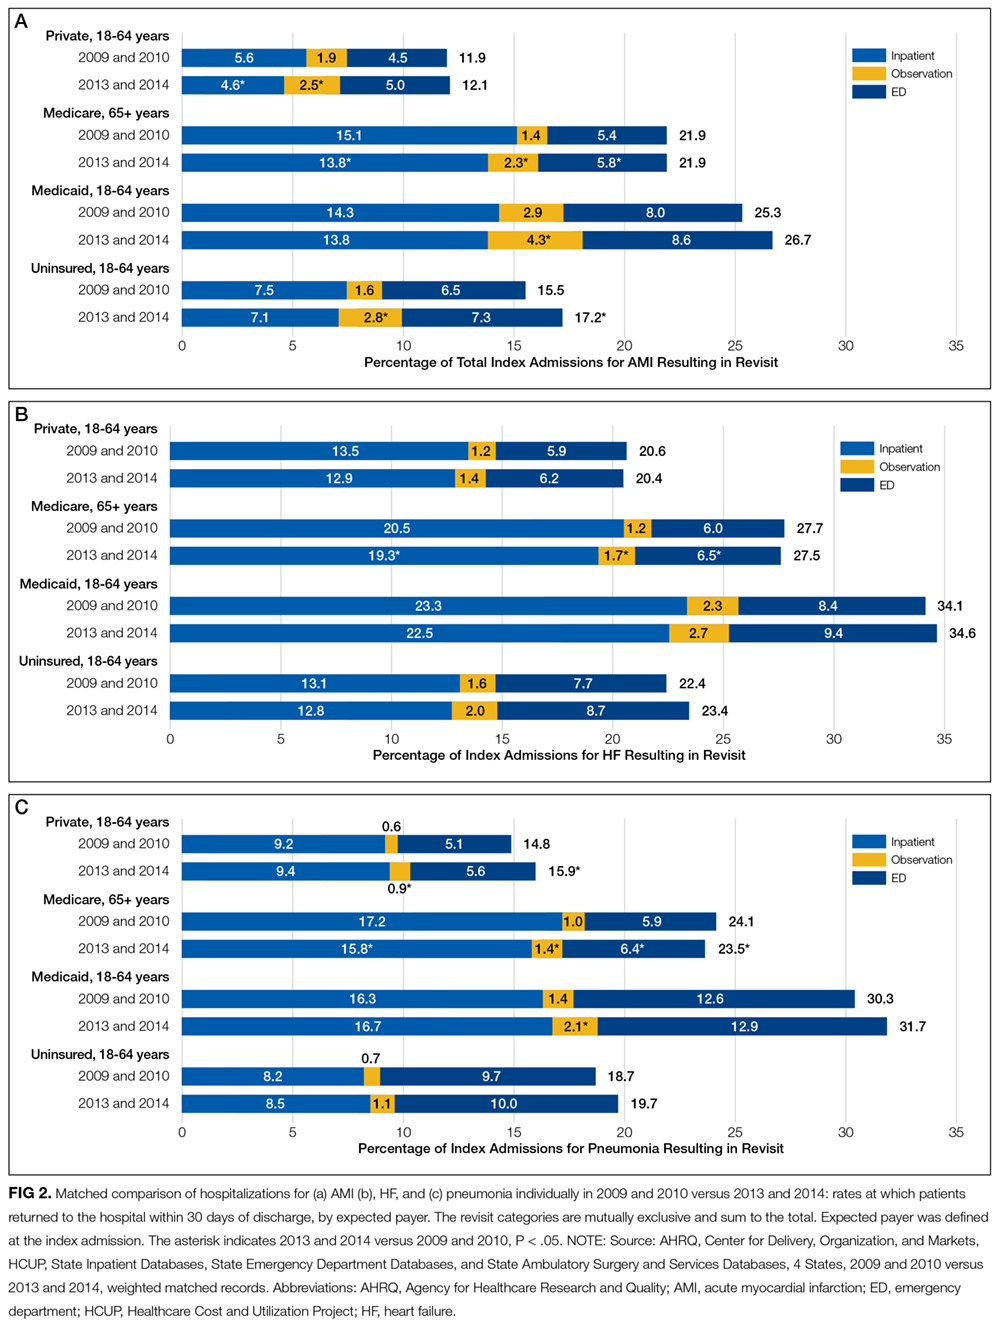
Patients initially hospitalized for HF and pneumonia who returned to the hospital within 30 days often returned for the same conditions (Table 2).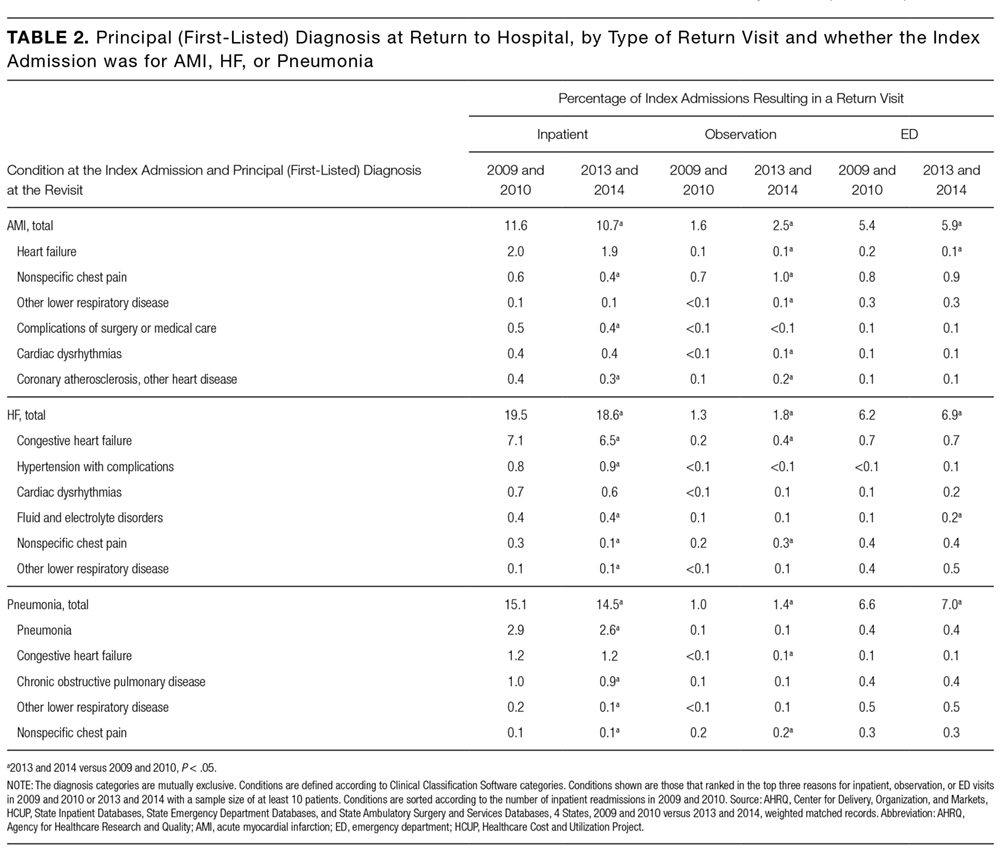
DISCUSSION
Matching index admissions for AMI, HF, or pneumonia in 201 hospitals in 2009 and 2010 with those in 2013 and 2014, we observed that increases in observation and ED visits coincided with reductions in inpatient readmissions among patients with private insurance and Medicare and contributed to growth in total returns to the hospital among patients with Medicaid or no insurance. Among patients with private insurance and Medicare, inpatient readmissions declined significantly for all 3 target conditions, but total returns to the hospital remained constant for AMI and HF, rose for privately insured patients with pneumonia, and declined modestly for Medicare patients with pneumonia. Inpatient readmissions were unchanged for adults aged 18 to 64 years with Medicaid or no insurance, but total returns to the hospital increased significantly, reaching 32% among those with Medicaid.
These findings add to recent literature, which has primarily emphasized inpatient readmissions among Medicare beneficiaries with several exceptions. A prior analysis indicates that readmissions have declined among diverse payer populations nationally.18 Gerhardt et al25 found that from 2011 to 2012, all-cause 30-day readmissions declined among fee-for-service (FFS) Medicare beneficiaries following any index admission, while ED revisits remained stable and observation revisits increased slightly. Evaluating the CMS Hospital Readmission Reductions Program (HRRP), Zuckerman et al17 reported that from 2007 to 2015, inpatient readmissions declined among FFS Medicare beneficiaries aged 65 years and older who were hospitalized with AMI, HF, or pneumonia, while returns to the hospital for observation rose approximately 2%; ED visits were not included. We found that Medicare (FFS and Medicare Advantage) patients with AMI and HF returned to the hospital with the same frequency in 2009 and 2010 as in 2013 and 2014, and those patients with pneumonia returned slightly less often. In aggregate, declines in inpatient readmissions in the 4 states we studied coincided with increases in observation and ED care. Moreover, these shifts occurred not only among Medicare beneficiaries but also among privately insured adults, Medicaid recipients, and the uninsured.
Three factors may have contributed to these apparent shifts from readmissions to observation and ED visits. First, some authors have suggested that hospitals may reduce readmissions by intentionally placing some of the patients who return to the hospital under observation instead of admitting them.17,26 If true, hospitals with greater declines in readmissions would have larger increases in observation revisits. Zuckerman et al17 found no correlation among Medicare beneficiaries between hospital-level trends in observation revisits and readmissions, but returns to observation rose more rapidly for AMI, HF, and pneumonia (compared with other conditions) during long term follow-up than during the HRRP implementation period. Other authors have documented that declines in readmissions have been greatest at hospitals with the highest baseline readmission rates,27,28 and hospitals with lower readmission rates have more observation return visits.29
Second, shifts from inpatient readmissions to return visits for observation may reflect unintentional rather than intentional changes in the services provided. Clinical practice patterns are evolving such that patients who present to the hospital for acute care increasingly are placed under observation or discharged from the ED instead of being admitted, regardless of whether they recently were hospitalized.30 Inpatient admissions, which are strongly correlated with readmission rates,28,31 are declining nationally,32 and both observation and ED visits are rising.33-35 Although little is known about effects on health outcomes and patient out-of-pocket costs,shifts from inpatient admissions to observation and ED visits reduce costs to payers.36,37
Third, instead of substitution, more patients may be returning for lower-acuity conditions that can be treated in the ED or under observation. Hospitals are implementing diverse and multifaceted interventions to reduce readmissions that can involve assessing patient needs and the risk for readmission, educating patients about self-care and risks after discharge, reconciling medication, scheduling follow-up visits, and monitoring patients through telephone calls and home nursing visits.26,38,39 Although the intent may be to reduce patients’ need to return to the hospital, interventions that educate patients about risks after discharge may lower the threshold at which they find symptoms worrisome enough to return. This could increase lower-acuity return visits. We found that reasons for returning were similar in 2009 and 2010 versus 2013 and 2014, but we did not examine acuity of illness at the time of return.
Other areas of concern are the high rates at which Medicaid patients are returning to the hospital and the increases in rates of returns among Medicaid patients and the uninsured. Individuals in these disadvantaged populations may be having difficulty accessing ambulatory care or may be turning to the ED more often for lower acuity problems that arise after discharge. In 3 of the 4 states we studied, 15% to 16% of adults live in poverty and 10% to 30% live in primary care health professional shortage areas.40,41 Given the implications for patient outcomes and costs, trends among these populations warrant further scrutiny.42,43
This analysis has several limitations. Data were from 4 states, but trends in readmissions are similar nationally. From 2010 through 2015, the all-condition readmission rate declined by 8% among Medicare beneficiaries nationally and by 6.1% in South Carolina, 7.4% in Georgia, 8.3% in Nebraska, and 8.7% in Tennessee.44 We report trends across hospitals and did not examine hospital-level revisits. Therefore, further research is needed to determine whether these findings are related to co-occurring trends, intentional substitution, or other factors.
In conclusion, measuring inpatient readmissions without accounting for return visits to the ED and observation underestimates the rate at which patients return to the hospital following an inpatient hospitalization. Because of growth in observation and ED visits, trends in the total rates at which patients return to the hospital can differ from trends in inpatient readmissions. In the 4 states we studied, total return rates were particularly high and rising among patients with Medicaid and lower, but also rising, among the uninsured. Policy analysts and researchers should investigate the factors contributing to growth in readmissions in these vulnerable populations and determine whether similar trends are occurring nationwide. Hospitalists play critical roles in admitting and discharging inpatients, caring for patients under observation, and implementing quality improvement programs. Irrespective of payer, hospitalists’ efforts to improve the quality and value of care should include observation and ED visits as well as inpatient readmissions.
Acknowledgments
The authors gratefully acknowledge Minya Sheng, M.S. (Truven Health Analytics) for assistance in programming and data management and Linda Lee, Ph.D. (Truven Health Analytics) for providing editorial review of the manuscript. We also wish to acknowledge the 4 HCUP Partner organizations that contributed to the HCUP State Databases used in this study: Georgia Hospital Association, Nebraska Hospital Association, South Carolina Revenue and Fiscal Affairs Office, and Tennessee Hospital Association.
Disclosure
Funding for this study was provided by the AHRQ Center for Delivery, Organization, and Markets, HCUP (Contract No. HHSA-290-2013-00002-C). The views expressed in this article are those of the authors and do not necessarily reflect those of the AHRQ or the U.S. Department of Health and Human Services. The authors have no conflicts of interest or financial disclosures to declare.
1. Jencks SF, Williams MV, Coleman EA. Rehospitalizations among patients in the Medicare fee-for-service program. N Engl J Med. 2009;360(14):1418-1428. PubMed
2. Lum HD, Studenski SA, Degenholtz HB, Hardy SE. Early hospital readmission is a predictor of one-year mortality in community-dwelling older Medicare beneficiaries. J Gen Intern Med. 2012;27(11):1467-1474. PubMed
3. Peach State Health Plan. New Peach State Health Plan 30-Day Readmission Payment Policy. https://www.pshpgeorgia.com/newsroom/30-day-readmission-payment-policy.html . Accessed September 26, 2017.
4. Axon RN, Cole L, Moonan A, et al. Evolution and Initial Experience of a Statewide Care Transitions Quality Improvement Collaborative: Preventing Avoidable Readmissions Together. Popul Health Manag. 2016 Feb;19(1):4-10. PubMed
5. Nebraska Hospital Association. Quality and Safety. http://www.nebraskahospitals.org/quality_and_safety/qs_home.html. Accessed July 25, 2017.
6. Agency for Healthcare Research and Quality. Re-Engineered Discharge (RED) Toolkit. http://www.ahrq.gov/professionals/systems/hospital/red/toolkit/index.html. Accessed July 25, 2017.
7. Institute for Healthcare Improvement. Readmissions. http://www.ihi.org/Topics/Readmissions/Pages/default.aspx. Accessed July 25, 2017.
8. Centers for Medicare & Medicaid Services (CMS). Readmissions Reduction Program (HRRP). https://www.cms.gov/medicare/medicare-fee-for-service-payment/acuteinpatientpps/readmissions-reduction-program.html. Accessed July 19, 2016.
9. Polinski JM, Moore JM, Kyrychenko P, et al. An insurer’s care transition program emphasizes medication reconciliation, reduces readmissions and costs. Health Aff (Millwood). 2016;35(7):1222-1229. PubMed
10. BlueCross BlueShield. Highmark’s Quality Blue Program helps hospitals reduce readmissions and infections for members. http://www.bcbs.com/healthcare-news/plans/highmark-quality-blue-program-helps-hospitals-reduce-readmissions-and-infections-for-members.html. Accessed November 7, 2016.
11. Agency for Healthcare Research and Quality (AHRQ). Designing and delivering whole-person transitional care: the hospital guide to reducing Medicaid readmissions. Rockville, MD: AHRQ; September 2016. AHRQ Pub. No. 16-0047-EF. http://www.ahrq.gov/sites/default/files/wysiwyg/professionals/systems/hospital/medicaidreadmitguide/medicaidreadmissions.pdf. Accessed March 15, 2017.
12. Aetna. Aetna, Genesis HealthCare take aim at preventing hospital readmissions. https://news.aetna.com/news-releases/aetna-genesis-healthcare-take-aim-at-preventing-hospital-readmissions/. Accessed November 7, 2016.
13. Molina Healthcare. Medical Management Program.http://www.molinahealthcare.com/providers/wi/medicaid/manual/PDF/manual_WI_19_Medical_Management.pdf. Accessed March 15, 2017.
14. Kaiser Family Foundation. Total Medicaid MCOs. State health facts, 2016. http://kff.org/other/state-indicator/total-medicaid-mcos/. Accessed July 19, 2016.
15. Muhlestein D, McClellan M. Accountable care organizations in 2016: private and public-sector growth and dispersion. Health Affairs blog. April 21, 2016. http://healthaffairs.org/blog/2016/04/21/accountable-care-organizations-in-2016-private-and-public-sector-growth-and-dispersion/. Accessed November 7, 2016.
16. Leppin AL, Gionfriddo MR, Kessler M, et al. Preventing 30-day hospital readmissions: a systematic review and meta-analysis of randomized trials. JAMA Intern Med. 2014;174(7):1095-1107. PubMed
17. Zuckerman RB, Sheingold SH, Orav EJ, Ruhter J, Epstein AM. Readmissions, observation, and the Hospital Readmissions Reduction Program. N Engl J Med. 2016;374(16):1543-1551. PubMed
18. Fingar KR, Washington R. Trends in hospital readmissions for four high-volume conditions, 2009–2013. Rockville, MD: Agency for Healthcare Research and Quality; November 2015. Statistical Brief No. 196. https://www.hcup-us.ahrq.gov/reports/statbriefs/sb196-Readmissions-Trends-High-Volume-Conditions.pdf. Accessed March 15, 2017.
19. Ross MA, Hockenberry JM, Mutter R, Barrett M, Wheatley M, Pitts SR. Protocol-driven emergency department observation units offer savings, shorter stays, and reduced admissions. Health Aff (Millwood). 2013;32(12):2149-2156. PubMed
20. Healthcare Cost and Utilization Project (HCUP). HCUP Databases. Rockville, MD: Agency for Healthcare Research and Quality; November 2016. www.hcup-us.ahrq.gov/databases.jsp. Accessed March 15, 2017.
21. QualityNet. Archived resources: readmission measures and measure methodology. https://www.qualitynet.org/dcs/ContentServer?cid=1228774371008&pagename=QnetPublic%2FPage%2FQnetTier4&c=Page. Accessed November 7, 2016.
22. Centers for Medicare & Medicaid Services. 2014 measures updates and specifications report: hospital-level 30-day risk-standardized readmission measures: acute myocardial infarction, heart failure, pneumonia, chronic obstructive pulmonary disease, stroke. March 2014. https://www.cms.gov/Medicare/Quality-Initiatives-Patient-Assessment-Instruments/HospitalQualityInits/Measure-Methodology.html. Accessed September 26, 2017.
23. Iacus SM, King G, Porro G. Causal inference without balance checking: coarsened exact matching. Political Analysis. 2012;20(1):1-24.
24. Moore BJ, White S, Washington R, Coenen N, Elixhauser A. Identifying increased risk of readmission and in-hospital mortality using hospital administrative data: The AHRQ Elixhauser Comorbidity Index. Med Care. 2017;55(7):698-705. PubMed
25. Gerhardt G, Yemane A, Apostle K, Oelschlaeger A, Rollins E, Brennan N. Evaluating whether changes in utilization of hospital outpatient services contributed to lower Medicare readmission rate. Medicare Medicaid Res Rev. 2014;4(1):mmrr2014.004.01.b03. PubMed
26. Kripalani S, Theobald CN, Anctil B, Vasilevskis EE. Reducing hospital readmission rates: current strategies and future directions. Annu Rev Med. 2014;65:471-485. PubMed
27. Desai NR, Ross JS, Kwon JY, et al. Association between hospital penalty status under the hospital readmission reduction program and readmission rates for target and nontarget conditions. JAMA. 2016;316(24):2647-2656. PubMed
28. Epstein AM, Jha AK, Orav EJ. The relationship between hospital admission rates and rehospitalizations. N Engl J Med. 2011;365(24):2287-2295. PubMed
29. Venkatesh AK, Wang C, Ross JS, et al. Hospital use of observation stays: cross sectional study of the impact on readmission rates. Med Care. 2016;54(12)1070-1077. PubMed
30. Nuckols TK, Fingar KR, Barrett M, Steiner CA, Stocks C, Owens PL. The shifting landscape in utilization of inpatient, observation, and emergency department Services Across Payers. J Hosp Med. 2017;12(6):443-446. PubMed
31. Dharmarajan K, Qin L, Lin Z, et al. Declining admission rates and thirty-day readmission rates positively associated even though patients grew sicker over time. Health Aff (Millwood). 2016;35(7):1294-1302. PubMed
32. Grube M, Kaufman K, York R. Decline in utilization rates signals a change in the inpatient business model. Health Affairs blog. March 8, 2013. http://healthaffairs.org/blog/2013/03/08/decline-in-utilization-rates-signals-a-change-in-the-inpatient-business-model/. Accessed November 7, 2016.
33. Feng Z, Wright B, Mor V. Sharp rise in Medicare enrollees being held in hospitals for observation raises concerns about causes and consequences. Health Aff (Millwood). 2012;31(6):1251-1259. PubMed
34. Venkatesh AK, Geisler BP, Gibson Chambers JJ, et al. Use of observation care in US emergency departments, 2001 to 2008. PLoS One. 2011;6(9):e24326. PubMed
35. Schuur JD, Venkatesh AK. The growing role of emergency departments in hospital admissions. N Engl J Med. 2012;367(5):391-393. PubMed
36. Kangovi S, Cafardi SG, Smith RA, Kulkarni R, Grande D. Patient financial responsibility for observation care. J Hosp Med. 2015;10(11):718-723. PubMed
37. Doyle BJ, Ettner SL, Nuckols TK. Supplemental insurance reduces out-of-pocket costs in Medicare observation services. J Hosp Med. 2016;11(7):502-504. doi:10.1002/jhm.2588. PubMed
38. Hansen LO, Young RS, Hinami K, Leung A, Williams MV. Interventions to reduce 30-day rehospitalization: a systematic review. Ann Intern Med. 2011;155(8):520-528. PubMed
39. Bradley EH, Curry L, Horwitz LI, et al. Hospital strategies associated with 30-day readmission rates for patients with heart failure. Circ Cardiovasc Qual Outcomes. 2013;6(4):444-450. PubMed
40. US Census Bureau. American Fact Finder: community facts. http://factfinder.census.gov/faces/nav/jsf/pages/index.xhtml. Accessed November 1, 2016.
41. Van Vleet A, Paradise J. Tapping nurse practitioners to meet rising demand for primary care. Kaiser Family Foundation Issue Brief. January 20, 2015. http://kff.org/medicaid/issue-brief/tapping-nurse-practitioners-to-meet-rising-demand-for-primary-care/. Accessed November 7, 2016.
42. Agency for Healthcare Research and Quality (AHRQ). Hospital guide to reducing Medicaid readmissions. Rockville, MD: AHRQ; August 2014. AHRQ Publication No. 14-0050-EF. http://www.ahrq.gov/sites/default/files/publications/files/medreadmissions.pdf. Accessed March 15, 2017.
43. Boccuti C, Casillas G. Aiming for fewer hospital U-turns: The Medicare Hospital Readmissions Reduction Program. Kaiser Family Foundation Issue Brief. March 10, 2017. http://kff.org/medicare/issue-brief/aiming-for-fewer-hospital-u-turns-the-medicare-hospital-readmission-reduction-program/. Accessed November 7, 2016.
44. Conway P, Gronniger T. New data: 49 states plus DC reduce avoidable hospital readmissions. Centers for Medicare & Medicaid Services blog. September 13, 2016. http://medtecheng.com/new-data-49-states-plus-dc-reduce-avoidable-hospital-readmissions/. Accessed September 26, 2017.
Given the frequency, potential preventability, and costs associated with hospital readmissions, reducing readmissions is a priority in efforts to improve the quality and value of healthcare.1,2 State and national bodies have created diverse initiatives to facilitate improvements in hospital discharge practices and reduce 30-day readmission rates across payers.3-5 For example, the Agency for Healthcare Research and Quality (AHRQ) and the Institute for Healthcare Improvement have published tools for improving discharge practices.6,7 Medicare instituted financial penalties for hospitals with higher-than-expected readmission rates for acute myocardial infarction (AMI), heart failure (HF), and pneumonia in 2012, while private payers and Medicaid programs have established their own policies.8-13 Furthermore, private payers and Medicaid programs shifted toward capitated and value-based reimbursement models in which readmissions lead to financial losses for hospitals.14,15 Accordingly, hospitals have implemented diverse interventions to reduce readmissions.16,17 From 2009 to 2013, 30-day readmissions declined among privately insured adults (from 12.4% to 11.7%), Medicare patients (from 22.0% to 20.0%), and uninsured individuals (11.5% to 11.0%) but climbed among patients with Medicaid (from 19.8% to 20.5%) after index admissions for AMI, HF, pneumonia, or chronic obstructive pulmonary disease.18
To date, research, policies, and quality improvement interventions have largely focused on improvements to one aspect of the system of care—that provided in the inpatient setting—among older adults with Medicare. Yet, inpatient readmissions may underestimate how often patients return to the hospital because patients can be placed under observation or stabilized and discharged from the emergency department (ED) instead of being readmitted. Observation and ED visits are less costly to payers than inpatient admissions.19 Thus, information about utilization of inpatient, observation, and ED visits within 30 days of hospital discharge may be more informative than inpatient readmissions alone. However, little is known about trends in returns to the hospital for observation and ED visits and whether such trends vary by payer.
Our objective was to assess whether changes have occurred in rates of total 30-day, all-cause, unplanned returns to the hospital among adults with index admissions for AMI, HF, and pneumonia in which returns to the hospital included inpatient readmissions, observation visits, and ED visits. We also assessed whether changes in the rate of hospital inpatient readmissions coincided with changes in rates of returns for ED or observation visits. To examine the effects of readmission policies implemented by diverse payers and broad changes to the health system following the Affordable Care Act, we compared data from 201 hospitals in 4 states in 2009 and 2010 with data from the same hospitals for 2013 and 2014.
METHODS
Data Sources, Populations, and Study Variables
We used Healthcare Cost and Utilization Project (HCUP) State Inpatient Databases, State Emergency Department Databases, and State Ambulatory Surgery and Services Databases from Georgia, Nebraska, South Carolina, and Tennessee. These states comprise 7% of the US population and were the only states with data that included all observation and ED visits as well as encrypted patient identification numbers that permitted linkage across facilities and hospitals.20
Index admissions for patients aged 18 years and older were eligible if they occurred at nonfederal general medical/surgical hospitals (excluding critical access hospitals) that had at least 1 index admission per target condition per year and at least 5 inpatient, observation, and ED visits for any condition per year.
We classified patients into the following 4 populations by age and insurance coverage: 18 to 64 years with private insurance, 65 years and older with Medicare (excluding younger adults with Medicare), 18 to 64 years with Medicaid, and 18 to 64 years without insurance. We identified patients aged 65 years and older with Medicare by using the primary or secondary expected payer for the index admission. This group included patients who were dually eligible for Medicare and Medicaid. If Medicare was not the primary or secondary payer, we used the primary payer to identify Medicaid, privately insured, and uninsured patients aged 18 to 64 years. None of the states expanded Medicaid coverage during the years studied.
The primary outcome of interest was the rate of having 1 or more all-cause, unplanned return(s) to an acute care hospital within 30 days of discharge after an index admission for AMI, HF, and pneumonia as defined by a modified version of Centers for Medicare & Medicaid Services’ readmission metrics.21,22 We examined total return rates as well as rates for inpatient, observation, and ED care. We also examined the leading diagnoses associated with returns to the hospital. For each index admission, we included only 1 return visit, giving priority to inpatient readmissions, then observation visits, and then ED visits.
The HCUP databases are consistent with the definition of limited data sets under the Health Insurance Portability and Accountability Act Privacy Rule and contain no direct patient identifiers. The AHRQ Institutional Review Board considers research using HCUP data to have exempt status.
Statistical Analysis
To compare rates at which patients returned to the hospital during 2 cohort periods (2009 and 2010 vs 2013 and 2014), we used coarsened exact matching, a well-established matching technique for balancing covariates between 2 populations of patients that may be related to the outcome.23 For observational datasets, coarsened exact matching is preferable to traditional matching because it enables the investigator to assess balance between the 2 populations, select the desired degree of balance, and eliminate observations for which comparable matches cannot be found.
We assembled sets of index admissions in each study period that were similar with respect to payer, primary diagnosis, and other factors. Matching variables included the patient’s age group, sex, and Elixhauser Comorbidity Index24 (in deciles), as well as the hospital’s ratio of observation visits relative to inpatient admissions in 2009 and 2010 combined (in quartiles; see supplementary Appendix). For Medicare beneficiaries, we also matched on dual enrollment in Medicaid.
We conducted the matching process separately for each target condition and payer population. First, we grouped index admissions in both periods into strata defined by all possible combinations of the matching variables and allowing one-to-many random matching within strata. We then dropped records in any strata for which there were no records in 1 of the time periods. Finally, we calculated weights based on the size of each stratum. We used these weights to account for the different numbers of index admissions in each stratum between the 2 study periods. For example, if a stratum contained 10 index admissions in 2009 and 2010 combined and 20 in 2013 and 2014 combined, an admission weighed double in the earlier period. After weighting, the index admissions in each period (2009 and 2010; 2013 and 2014) had similar characteristics (Table 1).
RESULTS
There were 423,503 eligible index admissions for AMI, HF, and pneumonia in the 2 periods combined; 422,840 (99.8%) were successfully matched and included in this analysis. After matching weights were applied, there were few statistically significant differences across the 2 time periods (see Table 1 and supplementary Appendix).
From 2009 and 2010 to 2013 and 2014, the percentage of patients hospitalized for AMI, HF, and pneumonia who had only observation or ED visits when they returned to the hospital increased from 41.4% to 46.7% among patients with private insurance (P < 0.001), from 27.8% to 32.1% among older patients with Medicare (P < 0.001), from 39.5% to 41.8% among patients with Medicaid (P = 0.03), and from 49.2% to 52.8% among patients without insurance (P = 0.004; Table 1). The percentage of returns to the hospital for observation increased across all payers (P < 0.001); in 2013 and 2014 combined, observation visits ranged from 6.8% of hospital returns among patients with Medicare to 11.1% among patients with private insurance. The percentage of returns to the hospital for an ED visit increased among patients with private insurance (P = 0.02) and Medicare (P < 0.001); in 2013 and 2014, ED visits ranged from 25.3% of returns to the hospital among patients with Medicare to 42.9% among uninsured patients.
The increases in 30-day observation and ED visits coincided with reductions in inpatient readmissions among patients with private insurance and Medicare and contributed to growth in total returns to the hospital among patients with Medicaid or no insurance (Figure 1).
Figure 2
Patients initially hospitalized for HF and pneumonia who returned to the hospital within 30 days often returned for the same conditions (Table 2).
DISCUSSION
Matching index admissions for AMI, HF, or pneumonia in 201 hospitals in 2009 and 2010 with those in 2013 and 2014, we observed that increases in observation and ED visits coincided with reductions in inpatient readmissions among patients with private insurance and Medicare and contributed to growth in total returns to the hospital among patients with Medicaid or no insurance. Among patients with private insurance and Medicare, inpatient readmissions declined significantly for all 3 target conditions, but total returns to the hospital remained constant for AMI and HF, rose for privately insured patients with pneumonia, and declined modestly for Medicare patients with pneumonia. Inpatient readmissions were unchanged for adults aged 18 to 64 years with Medicaid or no insurance, but total returns to the hospital increased significantly, reaching 32% among those with Medicaid.
These findings add to recent literature, which has primarily emphasized inpatient readmissions among Medicare beneficiaries with several exceptions. A prior analysis indicates that readmissions have declined among diverse payer populations nationally.18 Gerhardt et al25 found that from 2011 to 2012, all-cause 30-day readmissions declined among fee-for-service (FFS) Medicare beneficiaries following any index admission, while ED revisits remained stable and observation revisits increased slightly. Evaluating the CMS Hospital Readmission Reductions Program (HRRP), Zuckerman et al17 reported that from 2007 to 2015, inpatient readmissions declined among FFS Medicare beneficiaries aged 65 years and older who were hospitalized with AMI, HF, or pneumonia, while returns to the hospital for observation rose approximately 2%; ED visits were not included. We found that Medicare (FFS and Medicare Advantage) patients with AMI and HF returned to the hospital with the same frequency in 2009 and 2010 as in 2013 and 2014, and those patients with pneumonia returned slightly less often. In aggregate, declines in inpatient readmissions in the 4 states we studied coincided with increases in observation and ED care. Moreover, these shifts occurred not only among Medicare beneficiaries but also among privately insured adults, Medicaid recipients, and the uninsured.
Three factors may have contributed to these apparent shifts from readmissions to observation and ED visits. First, some authors have suggested that hospitals may reduce readmissions by intentionally placing some of the patients who return to the hospital under observation instead of admitting them.17,26 If true, hospitals with greater declines in readmissions would have larger increases in observation revisits. Zuckerman et al17 found no correlation among Medicare beneficiaries between hospital-level trends in observation revisits and readmissions, but returns to observation rose more rapidly for AMI, HF, and pneumonia (compared with other conditions) during long term follow-up than during the HRRP implementation period. Other authors have documented that declines in readmissions have been greatest at hospitals with the highest baseline readmission rates,27,28 and hospitals with lower readmission rates have more observation return visits.29
Second, shifts from inpatient readmissions to return visits for observation may reflect unintentional rather than intentional changes in the services provided. Clinical practice patterns are evolving such that patients who present to the hospital for acute care increasingly are placed under observation or discharged from the ED instead of being admitted, regardless of whether they recently were hospitalized.30 Inpatient admissions, which are strongly correlated with readmission rates,28,31 are declining nationally,32 and both observation and ED visits are rising.33-35 Although little is known about effects on health outcomes and patient out-of-pocket costs,shifts from inpatient admissions to observation and ED visits reduce costs to payers.36,37
Third, instead of substitution, more patients may be returning for lower-acuity conditions that can be treated in the ED or under observation. Hospitals are implementing diverse and multifaceted interventions to reduce readmissions that can involve assessing patient needs and the risk for readmission, educating patients about self-care and risks after discharge, reconciling medication, scheduling follow-up visits, and monitoring patients through telephone calls and home nursing visits.26,38,39 Although the intent may be to reduce patients’ need to return to the hospital, interventions that educate patients about risks after discharge may lower the threshold at which they find symptoms worrisome enough to return. This could increase lower-acuity return visits. We found that reasons for returning were similar in 2009 and 2010 versus 2013 and 2014, but we did not examine acuity of illness at the time of return.
Other areas of concern are the high rates at which Medicaid patients are returning to the hospital and the increases in rates of returns among Medicaid patients and the uninsured. Individuals in these disadvantaged populations may be having difficulty accessing ambulatory care or may be turning to the ED more often for lower acuity problems that arise after discharge. In 3 of the 4 states we studied, 15% to 16% of adults live in poverty and 10% to 30% live in primary care health professional shortage areas.40,41 Given the implications for patient outcomes and costs, trends among these populations warrant further scrutiny.42,43
This analysis has several limitations. Data were from 4 states, but trends in readmissions are similar nationally. From 2010 through 2015, the all-condition readmission rate declined by 8% among Medicare beneficiaries nationally and by 6.1% in South Carolina, 7.4% in Georgia, 8.3% in Nebraska, and 8.7% in Tennessee.44 We report trends across hospitals and did not examine hospital-level revisits. Therefore, further research is needed to determine whether these findings are related to co-occurring trends, intentional substitution, or other factors.
In conclusion, measuring inpatient readmissions without accounting for return visits to the ED and observation underestimates the rate at which patients return to the hospital following an inpatient hospitalization. Because of growth in observation and ED visits, trends in the total rates at which patients return to the hospital can differ from trends in inpatient readmissions. In the 4 states we studied, total return rates were particularly high and rising among patients with Medicaid and lower, but also rising, among the uninsured. Policy analysts and researchers should investigate the factors contributing to growth in readmissions in these vulnerable populations and determine whether similar trends are occurring nationwide. Hospitalists play critical roles in admitting and discharging inpatients, caring for patients under observation, and implementing quality improvement programs. Irrespective of payer, hospitalists’ efforts to improve the quality and value of care should include observation and ED visits as well as inpatient readmissions.
Acknowledgments
The authors gratefully acknowledge Minya Sheng, M.S. (Truven Health Analytics) for assistance in programming and data management and Linda Lee, Ph.D. (Truven Health Analytics) for providing editorial review of the manuscript. We also wish to acknowledge the 4 HCUP Partner organizations that contributed to the HCUP State Databases used in this study: Georgia Hospital Association, Nebraska Hospital Association, South Carolina Revenue and Fiscal Affairs Office, and Tennessee Hospital Association.
Disclosure
Funding for this study was provided by the AHRQ Center for Delivery, Organization, and Markets, HCUP (Contract No. HHSA-290-2013-00002-C). The views expressed in this article are those of the authors and do not necessarily reflect those of the AHRQ or the U.S. Department of Health and Human Services. The authors have no conflicts of interest or financial disclosures to declare.
1. Jencks SF, Williams MV, Coleman EA. Rehospitalizations among patients in the Medicare fee-for-service program. N Engl J Med. 2009;360(14):1418-1428. PubMed
2. Lum HD, Studenski SA, Degenholtz HB, Hardy SE. Early hospital readmission is a predictor of one-year mortality in community-dwelling older Medicare beneficiaries. J Gen Intern Med. 2012;27(11):1467-1474. PubMed
3. Peach State Health Plan. New Peach State Health Plan 30-Day Readmission Payment Policy. https://www.pshpgeorgia.com/newsroom/30-day-readmission-payment-policy.html . Accessed September 26, 2017.
4. Axon RN, Cole L, Moonan A, et al. Evolution and Initial Experience of a Statewide Care Transitions Quality Improvement Collaborative: Preventing Avoidable Readmissions Together. Popul Health Manag. 2016 Feb;19(1):4-10. PubMed
5. Nebraska Hospital Association. Quality and Safety. http://www.nebraskahospitals.org/quality_and_safety/qs_home.html. Accessed July 25, 2017.
6. Agency for Healthcare Research and Quality. Re-Engineered Discharge (RED) Toolkit. http://www.ahrq.gov/professionals/systems/hospital/red/toolkit/index.html. Accessed July 25, 2017.
7. Institute for Healthcare Improvement. Readmissions. http://www.ihi.org/Topics/Readmissions/Pages/default.aspx. Accessed July 25, 2017.
8. Centers for Medicare & Medicaid Services (CMS). Readmissions Reduction Program (HRRP). https://www.cms.gov/medicare/medicare-fee-for-service-payment/acuteinpatientpps/readmissions-reduction-program.html. Accessed July 19, 2016.
9. Polinski JM, Moore JM, Kyrychenko P, et al. An insurer’s care transition program emphasizes medication reconciliation, reduces readmissions and costs. Health Aff (Millwood). 2016;35(7):1222-1229. PubMed
10. BlueCross BlueShield. Highmark’s Quality Blue Program helps hospitals reduce readmissions and infections for members. http://www.bcbs.com/healthcare-news/plans/highmark-quality-blue-program-helps-hospitals-reduce-readmissions-and-infections-for-members.html. Accessed November 7, 2016.
11. Agency for Healthcare Research and Quality (AHRQ). Designing and delivering whole-person transitional care: the hospital guide to reducing Medicaid readmissions. Rockville, MD: AHRQ; September 2016. AHRQ Pub. No. 16-0047-EF. http://www.ahrq.gov/sites/default/files/wysiwyg/professionals/systems/hospital/medicaidreadmitguide/medicaidreadmissions.pdf. Accessed March 15, 2017.
12. Aetna. Aetna, Genesis HealthCare take aim at preventing hospital readmissions. https://news.aetna.com/news-releases/aetna-genesis-healthcare-take-aim-at-preventing-hospital-readmissions/. Accessed November 7, 2016.
13. Molina Healthcare. Medical Management Program.http://www.molinahealthcare.com/providers/wi/medicaid/manual/PDF/manual_WI_19_Medical_Management.pdf. Accessed March 15, 2017.
14. Kaiser Family Foundation. Total Medicaid MCOs. State health facts, 2016. http://kff.org/other/state-indicator/total-medicaid-mcos/. Accessed July 19, 2016.
15. Muhlestein D, McClellan M. Accountable care organizations in 2016: private and public-sector growth and dispersion. Health Affairs blog. April 21, 2016. http://healthaffairs.org/blog/2016/04/21/accountable-care-organizations-in-2016-private-and-public-sector-growth-and-dispersion/. Accessed November 7, 2016.
16. Leppin AL, Gionfriddo MR, Kessler M, et al. Preventing 30-day hospital readmissions: a systematic review and meta-analysis of randomized trials. JAMA Intern Med. 2014;174(7):1095-1107. PubMed
17. Zuckerman RB, Sheingold SH, Orav EJ, Ruhter J, Epstein AM. Readmissions, observation, and the Hospital Readmissions Reduction Program. N Engl J Med. 2016;374(16):1543-1551. PubMed
18. Fingar KR, Washington R. Trends in hospital readmissions for four high-volume conditions, 2009–2013. Rockville, MD: Agency for Healthcare Research and Quality; November 2015. Statistical Brief No. 196. https://www.hcup-us.ahrq.gov/reports/statbriefs/sb196-Readmissions-Trends-High-Volume-Conditions.pdf. Accessed March 15, 2017.
19. Ross MA, Hockenberry JM, Mutter R, Barrett M, Wheatley M, Pitts SR. Protocol-driven emergency department observation units offer savings, shorter stays, and reduced admissions. Health Aff (Millwood). 2013;32(12):2149-2156. PubMed
20. Healthcare Cost and Utilization Project (HCUP). HCUP Databases. Rockville, MD: Agency for Healthcare Research and Quality; November 2016. www.hcup-us.ahrq.gov/databases.jsp. Accessed March 15, 2017.
21. QualityNet. Archived resources: readmission measures and measure methodology. https://www.qualitynet.org/dcs/ContentServer?cid=1228774371008&pagename=QnetPublic%2FPage%2FQnetTier4&c=Page. Accessed November 7, 2016.
22. Centers for Medicare & Medicaid Services. 2014 measures updates and specifications report: hospital-level 30-day risk-standardized readmission measures: acute myocardial infarction, heart failure, pneumonia, chronic obstructive pulmonary disease, stroke. March 2014. https://www.cms.gov/Medicare/Quality-Initiatives-Patient-Assessment-Instruments/HospitalQualityInits/Measure-Methodology.html. Accessed September 26, 2017.
23. Iacus SM, King G, Porro G. Causal inference without balance checking: coarsened exact matching. Political Analysis. 2012;20(1):1-24.
24. Moore BJ, White S, Washington R, Coenen N, Elixhauser A. Identifying increased risk of readmission and in-hospital mortality using hospital administrative data: The AHRQ Elixhauser Comorbidity Index. Med Care. 2017;55(7):698-705. PubMed
25. Gerhardt G, Yemane A, Apostle K, Oelschlaeger A, Rollins E, Brennan N. Evaluating whether changes in utilization of hospital outpatient services contributed to lower Medicare readmission rate. Medicare Medicaid Res Rev. 2014;4(1):mmrr2014.004.01.b03. PubMed
26. Kripalani S, Theobald CN, Anctil B, Vasilevskis EE. Reducing hospital readmission rates: current strategies and future directions. Annu Rev Med. 2014;65:471-485. PubMed
27. Desai NR, Ross JS, Kwon JY, et al. Association between hospital penalty status under the hospital readmission reduction program and readmission rates for target and nontarget conditions. JAMA. 2016;316(24):2647-2656. PubMed
28. Epstein AM, Jha AK, Orav EJ. The relationship between hospital admission rates and rehospitalizations. N Engl J Med. 2011;365(24):2287-2295. PubMed
29. Venkatesh AK, Wang C, Ross JS, et al. Hospital use of observation stays: cross sectional study of the impact on readmission rates. Med Care. 2016;54(12)1070-1077. PubMed
30. Nuckols TK, Fingar KR, Barrett M, Steiner CA, Stocks C, Owens PL. The shifting landscape in utilization of inpatient, observation, and emergency department Services Across Payers. J Hosp Med. 2017;12(6):443-446. PubMed
31. Dharmarajan K, Qin L, Lin Z, et al. Declining admission rates and thirty-day readmission rates positively associated even though patients grew sicker over time. Health Aff (Millwood). 2016;35(7):1294-1302. PubMed
32. Grube M, Kaufman K, York R. Decline in utilization rates signals a change in the inpatient business model. Health Affairs blog. March 8, 2013. http://healthaffairs.org/blog/2013/03/08/decline-in-utilization-rates-signals-a-change-in-the-inpatient-business-model/. Accessed November 7, 2016.
33. Feng Z, Wright B, Mor V. Sharp rise in Medicare enrollees being held in hospitals for observation raises concerns about causes and consequences. Health Aff (Millwood). 2012;31(6):1251-1259. PubMed
34. Venkatesh AK, Geisler BP, Gibson Chambers JJ, et al. Use of observation care in US emergency departments, 2001 to 2008. PLoS One. 2011;6(9):e24326. PubMed
35. Schuur JD, Venkatesh AK. The growing role of emergency departments in hospital admissions. N Engl J Med. 2012;367(5):391-393. PubMed
36. Kangovi S, Cafardi SG, Smith RA, Kulkarni R, Grande D. Patient financial responsibility for observation care. J Hosp Med. 2015;10(11):718-723. PubMed
37. Doyle BJ, Ettner SL, Nuckols TK. Supplemental insurance reduces out-of-pocket costs in Medicare observation services. J Hosp Med. 2016;11(7):502-504. doi:10.1002/jhm.2588. PubMed
38. Hansen LO, Young RS, Hinami K, Leung A, Williams MV. Interventions to reduce 30-day rehospitalization: a systematic review. Ann Intern Med. 2011;155(8):520-528. PubMed
39. Bradley EH, Curry L, Horwitz LI, et al. Hospital strategies associated with 30-day readmission rates for patients with heart failure. Circ Cardiovasc Qual Outcomes. 2013;6(4):444-450. PubMed
40. US Census Bureau. American Fact Finder: community facts. http://factfinder.census.gov/faces/nav/jsf/pages/index.xhtml. Accessed November 1, 2016.
41. Van Vleet A, Paradise J. Tapping nurse practitioners to meet rising demand for primary care. Kaiser Family Foundation Issue Brief. January 20, 2015. http://kff.org/medicaid/issue-brief/tapping-nurse-practitioners-to-meet-rising-demand-for-primary-care/. Accessed November 7, 2016.
42. Agency for Healthcare Research and Quality (AHRQ). Hospital guide to reducing Medicaid readmissions. Rockville, MD: AHRQ; August 2014. AHRQ Publication No. 14-0050-EF. http://www.ahrq.gov/sites/default/files/publications/files/medreadmissions.pdf. Accessed March 15, 2017.
43. Boccuti C, Casillas G. Aiming for fewer hospital U-turns: The Medicare Hospital Readmissions Reduction Program. Kaiser Family Foundation Issue Brief. March 10, 2017. http://kff.org/medicare/issue-brief/aiming-for-fewer-hospital-u-turns-the-medicare-hospital-readmission-reduction-program/. Accessed November 7, 2016.
44. Conway P, Gronniger T. New data: 49 states plus DC reduce avoidable hospital readmissions. Centers for Medicare & Medicaid Services blog. September 13, 2016. http://medtecheng.com/new-data-49-states-plus-dc-reduce-avoidable-hospital-readmissions/. Accessed September 26, 2017.
© 2017 Society of Hospital Medicine
Hospital Administrators’ Perspectives on Physician Engagement: A Qualitative Study
Disengaged physicians perform worse on multiple quality metrics and are more likely to make clinical errors.1,2 A growing body of literature has examined factors contributing to rising physician burnout, yet limited research has explored elements of physician engagement.3 Although some have described engagement as the polar opposite of burnout, addressing factors that contribute to burnout may not necessarily build physician engagement.4 The National Health Service (NHS) in the United Kingdom defines physician engagement as “the degree to which an employee is satisfied in their work, motivated to perform well, able to suggest and implement ideas for improvement, and their willingness to act as an advocate for their organization by recommending it as a place to work or be treated.”5
Few studies have attempted to document and interpret the variety of approaches that healthcare organizations have taken to identify and address this problem.6 The purpose of this study was to understand hospital administrators’ perspectives on issues related to physician engagement, including determinants of physician engagement, organizational efforts to improve physician engagement, and barriers to improving physician engagement.
METHODS
We conducted a qualitative study of hospital administrators by using an online anonymous questionnaire to explore perspectives on physician engagement. We used a convenience sample of hospital administrators affiliated with Vizient Inc. member hospitals. Vizient is the largest member-owned healthcare services company in the United States; and at the time of the study, it was composed of 1519 hospitals. Eligible hospital administrators included 2 hospital executive positions: Chief Medical Officers (CMOs) and Chief Quality Officers (CQOs). We chose to focus on CMOs and CQOs because their leadership roles overseeing physician employees may require them to address challenges with physician engagement.
The questionnaire focused on administrators’ perspectives on physician engagement, which we defined using the NHS definition stated above. Questions addressed perceived determinants of engagement, effective organizational efforts to improve engagement, and perceived barriers to improving engagement (supplementary Appendix 1). We included 2 yes/no questions and 4 open-ended questions. In May and June of 2016, we sent an e-mail to 432 unique hospital administrators explaining the purpose of the study and requested their participation through a hyperlink to an online questionnaire.
We used summary statistics to report results of yes/no questions and qualitative methods to analyze open-ended responses according to the principles of conventional content analysis, which avoids using preconceived categories and instead relies on inductive methods to allow categories to emerge from the data.7 Team members (T.J.R., K.O., and S.T.R.) performed close readings of responses and coded segments representing important concepts. Through iterative discussion, members of the research team reached consensus on the final code structure.
RESULTS
Our analyses focused on responses from 39 administrators that contained the most substantial qualitative information to the 4 open-ended questions included in the questionnaire. Among these respondents, 31 (79%) indicated that their hospital had surveyed physicians to assess their level of engagement, and 32 (82%) indicated that their hospital had implemented organizational efforts to improve physician engagement within the previous 3 years. Content analysis of open-ended responses yielded 5 themes that summarized perceived contributing factors to physician engagement: (1) physician-administration alignment, (2) physician input in decision-making, (3) appreciation of physician contributions, (4) communication between physicians and administration, and (5) hospital systems and workflow. In the Table, we present exemplary quotations for each theme and the question that prompted the quote.
DISCUSSION
Results of this study provide insight into administrators’ perspectives on organizational factors affecting physician engagement in hospital settings. The majority of respondents believed physician engagement was sufficiently important to survey physicians to assess their level of engagement and implement interventions to improve engagement. We identified several overarching themes that transcend individual questions related to the determinants of engagement, organizational efforts to improve engagement, and barriers to improving engagement. Many responses focused on the relationship between administrators and physicians. Administrators in our study may also have backgrounds as physicians, providing them with a unique perspective on the importance of this relationship.
The evolution of healthcare over the past several decades has shifted power dynamics away from autonomous physician practices, particularly in hospital settings.8 Our study suggests that hospital administrators recognize the potential impact these changes have had on physician engagement and are attempting to address the detrimental effects. Furthermore, administrators acknowledged the importance of organization-directed solutions to address problems with physician morale. This finding represents a paradigm shift away from previous approaches that involved interventions directed at individual physicians.9
Our results represent a call to action for both physicians and administrators to work together to develop organizational solutions to improve physician engagement. Further research is needed to investigate the most effective ways to improve and sustain engagement. At a time when physicians are increasingly dissatisfied with their current work, understanding how to improve physician engagement is critical to maintaining a healthy and productive physician workforce.
Disclosure
Will Dardani is an employee of Vizient Inc. No other authors have conflicts of interest to declare.
1. West MA, Dawson JF. Employee engagement and NHS performance. https://www.kingsfund.org.uk/sites/default/files/employee-engagement-nhs-performance-west-dawson-leadership-review2012-paper.pdf. Accessed July 9, 2017
2. Prins JT, Hoekstra-Weebers JE, Gazendam-Donofrio SM, et al. Burnout and engagement among resident doctors in the Netherlands: a national study. Med Educ. 2010;44(3):236-247. PubMed
3. Ruotsalainen JH, Verbeek JH, Marine A, Serra C. Preventing occupational stress in healthcare workers. Cochrane Database Syst Rev. 2015(4):CD002892. PubMed
4. Gonzalez-Roma V, Schaufeli WB, Bakker AB, Lloret S. Burnout and work engagement: Independent factors or opposite poles. J Vocat Behav. 2006;60(1):165-174.
5. National Health Service. The staff engagement challenge–a factsheet for chief executives. http://www.nhsemployers.org/~/media/Employers/Documents/Retain%20and%20improve/23705%20Chief-executive%20Factsheet _WEB.pdf. Accessed July 9, 2017
6. Taitz JM, Lee TH, Sequist TD. A framework for engaging physicians in quality and safety. BMJ Qual Saf. 2012;21(9):722-728. PubMed
7. Hsieh HF, Shannon SE. Three approaches to qualitative content analysis. Qual Health Res. 2005;15(9):1277-1288. PubMed
8. Emanuel EJ, Pearson SD. Physician autonomy and health care reform. JAMA. 2012;307(4):367-368. PubMed
9. Panagioti M, Panagopoulou E, Bower P, et al. Controlled Interventions to Reduce Burnout in Physicians: A Systematic Review and Meta-analysis. JAMA Intern Med. 2017;177(2):195-205. PubMed
Disengaged physicians perform worse on multiple quality metrics and are more likely to make clinical errors.1,2 A growing body of literature has examined factors contributing to rising physician burnout, yet limited research has explored elements of physician engagement.3 Although some have described engagement as the polar opposite of burnout, addressing factors that contribute to burnout may not necessarily build physician engagement.4 The National Health Service (NHS) in the United Kingdom defines physician engagement as “the degree to which an employee is satisfied in their work, motivated to perform well, able to suggest and implement ideas for improvement, and their willingness to act as an advocate for their organization by recommending it as a place to work or be treated.”5
Few studies have attempted to document and interpret the variety of approaches that healthcare organizations have taken to identify and address this problem.6 The purpose of this study was to understand hospital administrators’ perspectives on issues related to physician engagement, including determinants of physician engagement, organizational efforts to improve physician engagement, and barriers to improving physician engagement.
METHODS
We conducted a qualitative study of hospital administrators by using an online anonymous questionnaire to explore perspectives on physician engagement. We used a convenience sample of hospital administrators affiliated with Vizient Inc. member hospitals. Vizient is the largest member-owned healthcare services company in the United States; and at the time of the study, it was composed of 1519 hospitals. Eligible hospital administrators included 2 hospital executive positions: Chief Medical Officers (CMOs) and Chief Quality Officers (CQOs). We chose to focus on CMOs and CQOs because their leadership roles overseeing physician employees may require them to address challenges with physician engagement.
The questionnaire focused on administrators’ perspectives on physician engagement, which we defined using the NHS definition stated above. Questions addressed perceived determinants of engagement, effective organizational efforts to improve engagement, and perceived barriers to improving engagement (supplementary Appendix 1). We included 2 yes/no questions and 4 open-ended questions. In May and June of 2016, we sent an e-mail to 432 unique hospital administrators explaining the purpose of the study and requested their participation through a hyperlink to an online questionnaire.
We used summary statistics to report results of yes/no questions and qualitative methods to analyze open-ended responses according to the principles of conventional content analysis, which avoids using preconceived categories and instead relies on inductive methods to allow categories to emerge from the data.7 Team members (T.J.R., K.O., and S.T.R.) performed close readings of responses and coded segments representing important concepts. Through iterative discussion, members of the research team reached consensus on the final code structure.
RESULTS
Our analyses focused on responses from 39 administrators that contained the most substantial qualitative information to the 4 open-ended questions included in the questionnaire. Among these respondents, 31 (79%) indicated that their hospital had surveyed physicians to assess their level of engagement, and 32 (82%) indicated that their hospital had implemented organizational efforts to improve physician engagement within the previous 3 years. Content analysis of open-ended responses yielded 5 themes that summarized perceived contributing factors to physician engagement: (1) physician-administration alignment, (2) physician input in decision-making, (3) appreciation of physician contributions, (4) communication between physicians and administration, and (5) hospital systems and workflow. In the Table, we present exemplary quotations for each theme and the question that prompted the quote.
DISCUSSION
Results of this study provide insight into administrators’ perspectives on organizational factors affecting physician engagement in hospital settings. The majority of respondents believed physician engagement was sufficiently important to survey physicians to assess their level of engagement and implement interventions to improve engagement. We identified several overarching themes that transcend individual questions related to the determinants of engagement, organizational efforts to improve engagement, and barriers to improving engagement. Many responses focused on the relationship between administrators and physicians. Administrators in our study may also have backgrounds as physicians, providing them with a unique perspective on the importance of this relationship.
The evolution of healthcare over the past several decades has shifted power dynamics away from autonomous physician practices, particularly in hospital settings.8 Our study suggests that hospital administrators recognize the potential impact these changes have had on physician engagement and are attempting to address the detrimental effects. Furthermore, administrators acknowledged the importance of organization-directed solutions to address problems with physician morale. This finding represents a paradigm shift away from previous approaches that involved interventions directed at individual physicians.9
Our results represent a call to action for both physicians and administrators to work together to develop organizational solutions to improve physician engagement. Further research is needed to investigate the most effective ways to improve and sustain engagement. At a time when physicians are increasingly dissatisfied with their current work, understanding how to improve physician engagement is critical to maintaining a healthy and productive physician workforce.
Disclosure
Will Dardani is an employee of Vizient Inc. No other authors have conflicts of interest to declare.
1. West MA, Dawson JF. Employee engagement and NHS performance. https://www.kingsfund.org.uk/sites/default/files/employee-engagement-nhs-performance-west-dawson-leadership-review2012-paper.pdf. Accessed July 9, 2017
2. Prins JT, Hoekstra-Weebers JE, Gazendam-Donofrio SM, et al. Burnout and engagement among resident doctors in the Netherlands: a national study. Med Educ. 2010;44(3):236-247. PubMed
3. Ruotsalainen JH, Verbeek JH, Marine A, Serra C. Preventing occupational stress in healthcare workers. Cochrane Database Syst Rev. 2015(4):CD002892. PubMed
4. Gonzalez-Roma V, Schaufeli WB, Bakker AB, Lloret S. Burnout and work engagement: Independent factors or opposite poles. J Vocat Behav. 2006;60(1):165-174.
5. National Health Service. The staff engagement challenge–a factsheet for chief executives. http://www.nhsemployers.org/~/media/Employers/Documents/Retain%20and%20improve/23705%20Chief-executive%20Factsheet _WEB.pdf. Accessed July 9, 2017
6. Taitz JM, Lee TH, Sequist TD. A framework for engaging physicians in quality and safety. BMJ Qual Saf. 2012;21(9):722-728. PubMed
7. Hsieh HF, Shannon SE. Three approaches to qualitative content analysis. Qual Health Res. 2005;15(9):1277-1288. PubMed
8. Emanuel EJ, Pearson SD. Physician autonomy and health care reform. JAMA. 2012;307(4):367-368. PubMed
9. Panagioti M, Panagopoulou E, Bower P, et al. Controlled Interventions to Reduce Burnout in Physicians: A Systematic Review and Meta-analysis. JAMA Intern Med. 2017;177(2):195-205. PubMed
© 2017 Society of Hospital Medicine
Hospitalist Perspective of Interactions with Medicine Subspecialty Consult Services
Hospitalist physicians care for an increasing proportion of general medicine inpatients and request a significant share of all subspecialty consultations.1 Subspecialty consultation in inpatient care is increasing,2,3 and effective hospitalist–consulting service interactions may affect team communication, patient care, and hospitalist learning. Therefore, enhancing hospitalist–consulting service interactions may have a broad-reaching, positive impact. Researchers in previous studies have explored resident–fellow consult interactions in the inpatient and emergency department settings as well as attending-to-attending consultation in the outpatient setting.4-7 However, to our knowledge, hospitalist–consulting team interactions have not been previously described. In academic medical centers, hospitalists are attending physicians who interact with both fellows (supervised by attending consultants) and directly with subspecialty attendings. Therefore, the exploration of the hospitalist–consultant interaction requires an evaluation of hospitalist–fellow and hospitalist–subspecialty attending interactions. The hospitalist–fellow interaction in particular is unique because it represents an unusual dynamic, in which an attending physician is primarily communicating with a trainee when requesting assistance with patient care.8 In order to explore hospitalist–consultant interactions (herein, the term “consultant” includes both fellow and attending consultants), we conducted a survey study in which we examine hospitalist practices and attitudes regarding consultation, with a specific focus on hospitalist consultation with internal medicine subspecialty consult services. In addition, we compared fellow–hospitalist and attending–hospitalist interactions and explored barriers to and facilitating factors of an effective hospitalist–consultant relationship.
METHODS
Survey Development
The survey instrument was developed by the authors based on findings of prior studies in which researchers examined consultation.2-6,9-16 The survey contained 31 questions (supplementary Appendix A) and evaluated 4 domains of the use of medical subspecialty consultation in direct patient care: (1) current consultation practices, (2) preferences regarding consultants, (3) barriers to and facilitating factors of effective consultation (both with respect to hospitalist learning and patient care), and (4) a comparison between hospitalist–fellow and hospitalist–subspecialty attending interactions. An evaluation of current consultation practices included a focus on communication methods (eg, in person, over the phone, through paging, or notes) because these have been found to be important during consultation.5,6,9,15,16 In order to explore hospitalist preferences regarding consult interactions and investigate perceptions of barriers to and facilitating factors of effective consultation, questions were developed based on previous literature, including our qualitative work examining resident–fellow interactions during consultation.4-6,9,12 We compared hospitalist consultation experiences among attending and fellow consultants because the interaction in which an attending hospitalist physician is primarily communicating with a trainee may differ from a consultation between a hospitalist attending and a subspecialty attending.8 Participants were asked to exclude their experiences when working on teaching services, during which students or housestaff often interact with consultants. The survey was cognitively tested with both hospitalist and non-hospitalist attending physicians not participating in the study and was revised by the authors using an iterative approach.
Study Participants
Hospitalist attending physicians at University of Texas Southwestern (UTSW) Medical Center, Emory University School of Medicine, Massachusetts General Hospital (MGH), and the Medical University of South Carolina (MUSC) were eligible to participate in the study. Consult team structures at each institution were composed of either a subspecialist-attending-only or a fellow-and-subspecialty-attending team. Fellows at all institutions are supervised by a subspecialty attending when performing consultations. Respondents who self-identified as nurse practitioners or physician assistants were excluded from the analysis. Hospitalists employed by the Veterans Affairs hospital system were also excluded. The study was approved by the institutional review boards of UTSW, Emory, MUSC, and MGH.
The survey was anonymous and administered to all hospitalists at participating institutions via a web-based survey tool (Qualtrics, Provo, UT). Participants were eligible to enter a raffle for a $500 gift card, and completion of the survey was not required for entry into the raffle.
Statistics
Results were summarized using the mean with standard deviation for continuous variables and the frequency with percentage for categorical variables after excluding missing values. All analyses were conducted using SAS version 9.4 (SAS Institute, Cary, NC). A 2-sided P value of ≤0.05 was considered statistically significant.
RESULTS
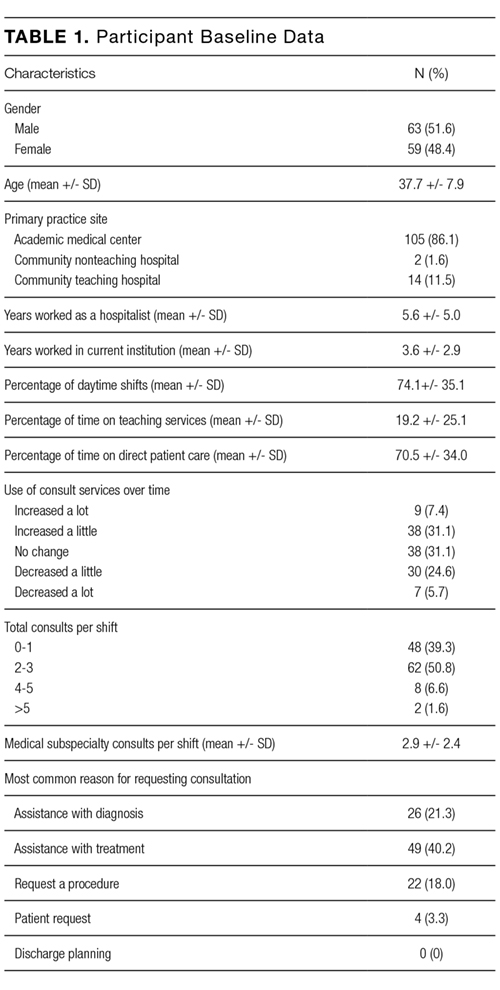
Current Consultation Practices
Current consultation practices and descriptions of hospitalist–consultant communication are shown in Table 2. Forty percent of respondents requested 0-1 consults per day, while 51.7% requested 2-3 per day. The most common reasons for requesting a consultation were assistance with treatment (48.5%), assistance with diagnosis (25.7%), and request for a procedure (21.8%). When asked whether the frequency of consultation is changing, slightly more hospitalists felt that their personal use of consultation was increasing as compared to those who felt that it was decreasing (38.5% vs 30.3%, respectively).
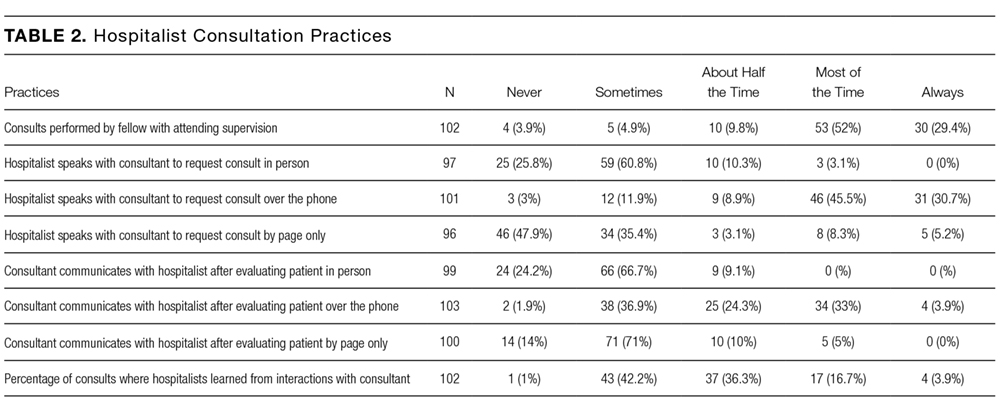
Hospitalist Preferences
Eighty-six percent of respondents agreed that consultants should be required to communicate their recommendations either in person or over the phone. Eighty-three percent of hospitalists agreed that they would like to receive more teaching from the consulting services, and 74.0% agreed that consultants should attempt to teach hospitalists during consult interactions regardless of whether the hospitalist initiates the teaching–learning interaction.
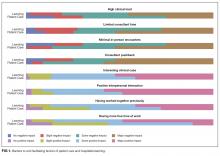
Barriers to and Facilitating Factors of Effective Consultation
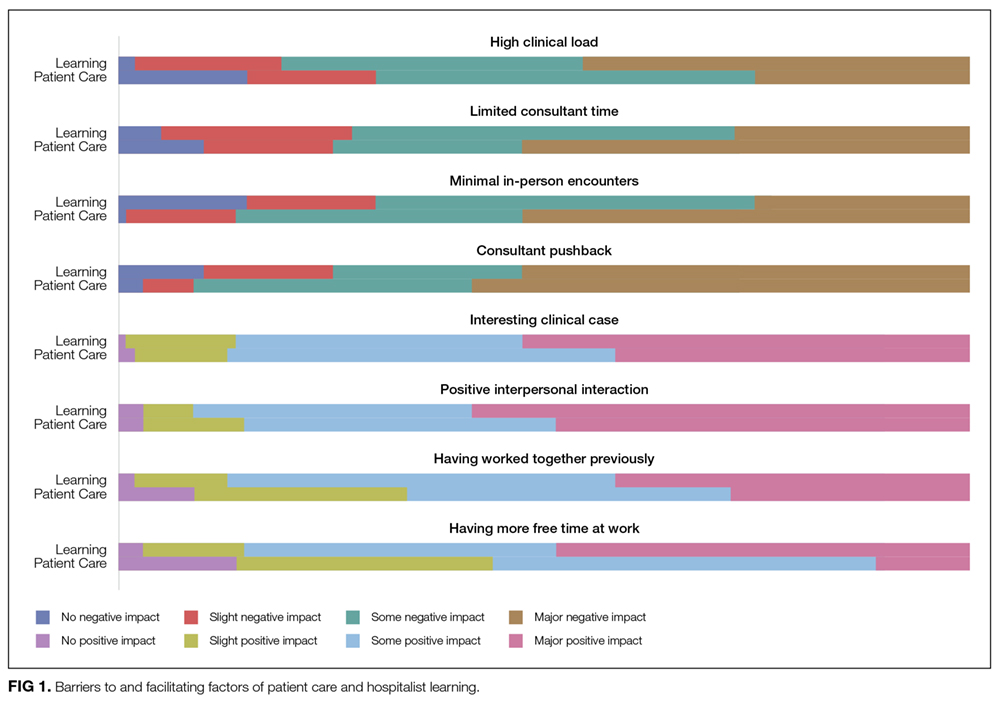
Participants reported that multiple factors affected patient care and their own learning during inpatient consultation (Figure 1). Consultant pushback, high hospitalist clinical workload, a perception that consultants had limited time, and minimal in-person interactions were all seen as factors that negatively affected the consult interaction. These generally affected both learning and patient care. Conversely, working on an interesting clinical case, more hospitalist free time, positive interaction with the consultant, and having previously worked with the consultant positively affected both learning and patient care (Figure 1).
Fellow Versus Attending Interactions
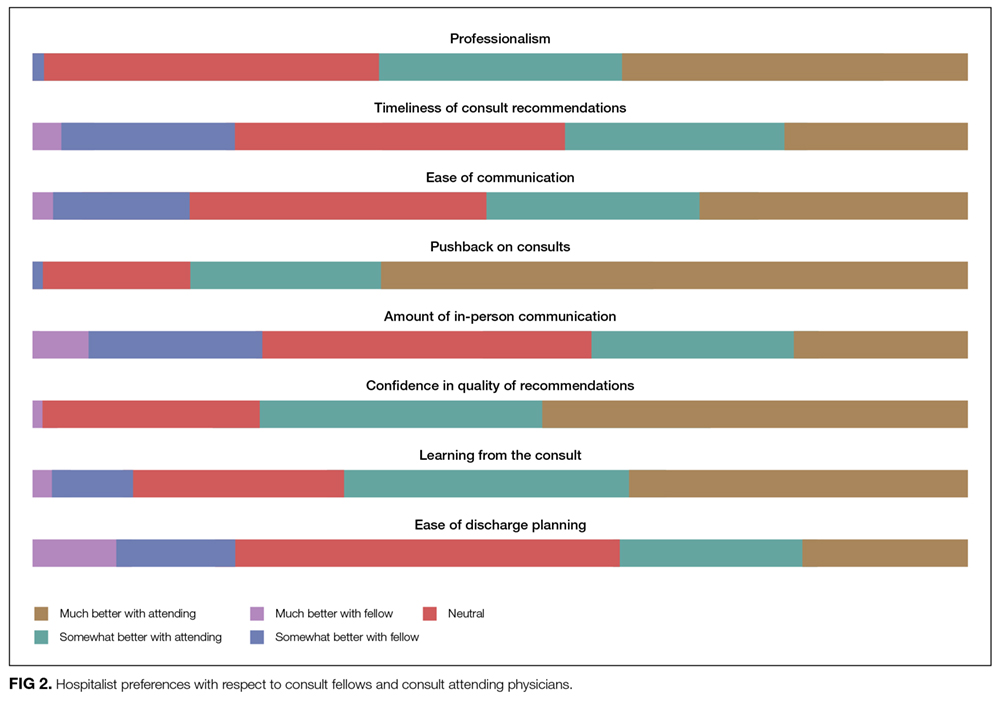
Respondents indicated that interacting directly with the consult attending was superior to hospitalist–fellow interactions in all aspects of care but particularly with respect to pushback, confidence in recommendations, professionalism, and hospitalist learning (Figure 2).
DISCUSSION
To our knowledge, this is the first study to describe hospitalist attending practices, attitudes, and perceptions of internal medicine subspecialty consultation. Our findings, which focus on the interaction between hospitalists and internal medicine subspecialty attendings and fellows, outline the hospitalist perspective on consultant interactions and identify a number of factors that are amenable to intervention. We found that hospitalists perceive the consult interaction to be important for patient care and a valuable opportunity for their own learning. In-person communication was seen as an important component of effective consultation but was reported to occur in a minority of consultations. We demonstrate that hospitalist–subspecialty attending consult interactions are perceived more positively than hospitalist–fellow interactions. Finally, we describe barriers and facilitating factors that may inform future interventions targeting this important interaction.
Effective communication between consultants and the primary team is critical for both patient care and teaching interactions.4-7 Pushback on consultation was reported to be the most significant barrier to hospitalist learning and had a major impact on patient care. Because hospitalists are attending physicians, we hypothesized that they may perceive pushback from fellows less frequently than residents.4 However, in our study, hospitalists reported pushback to be relatively frequent in their daily practice. Moreover, hospitalists reported a strong preference for in-person interactions with consultants, but our study demonstrated that such interactions are relatively infrequent. Researchers in studies of resident–fellow consult interactions have noted similar findings, suggesting that hospitalists and internal medicine residents face similar challenges during consultation.4-6 Hospitalists reported that positive interpersonal interactions and personal familiarity with the consultant positively affected the consult interaction. Most importantly, these effects were perceived to affect both hospitalist learning and patient care, suggesting the importance of interpersonal interactions in consultative medicine.
In an era of increasing clinical workload, the consult interaction represents an important workplace-based learning opportunity.4 Centered on a consult question, the hospitalist–consultant interaction embodies a teachable moment and can be an efficient opportunity to learn because both parties are familiar with the patient. Indeed, survey respondents reported that they frequently learned from consultation, and there was a strong preference for more teaching from consultants in this setting. However, the hospitalist–fellow consult interaction is unique because attending hospitalists are frequently communicating with fellow trainees, which could limit fellows’ confidence in their role as teachers and hospitalists’ perception of their role as learners. Our study identifies a number of barriers and facilitating factors (including communication, pushback, familiarity, and clinical workload) that affect the hospitalist–consultant teaching interaction and may be amenable to intervention.
Hospitalists expressed a consistent preference for interacting with attending subspecialists compared to clinical fellows during consultation. Preference for interaction with attendings was strongest in the areas of pushback, confidence in recommendations, professionalism, and learning from consultation. Some of the factors that relate to consult service structure and fellow experience, such as timeliness of consultation and confidence in recommendations, may not be amenable to intervention. For instance, fellows must first see and then staff the consult with their attending prior to leaving formal recommendations, which makes their communication less timely than that of attending physicians, when they are the primary consultant. However, aspects of the hospitalist–consultant interaction (such as professionalism, ease of communication, and pushback) should not be affected by the difference in experience between fellows and attending physicians. The reasons for such perceptions deserve further exploration; however, differences in incentive structures, workload, and communication skills between fellows and attending consultants may be potential explanations.
Our findings suggest that interventions aimed at enhancing hospitalist–consultant interactions focus on enhancing direct communication and teaching while limiting the perception of pushback. A number of interventions that are primarily focused on instituting a systematic approach to requesting consultation have shown an improvement in resident and medical student consult communication17,18 as well as resident–fellow teaching interactions.9 However, it is not clear whether these interventions would be effective given that hospitalists have more experience communicating with consultants than trainees. Given the unique nature of the hospitalist–consultant interaction, multiple barriers may need to be addressed in order to have a significant impact. Efforts to increase direct communication, such as a mechanism for hospitalists to make and request in-person or direct verbal communication about a particular consultation during the consult request, can help consultants prioritize direct communication with hospitalists for specific patients. Familiarizing fellows with hospitalist workflow and the locations of hospitalist workrooms also may promote in-person communication. Fellowship training can focus on enhancing fellow teaching and communication skills,19-22 particularly as they relate to hospitalists. Fellows in particular may benefit because the hospitalist–fellow teaching interaction may be bidirectional, with hospitalists having expertise in systems practice and quality efforts that can inform fellows’ practice. Furthermore, interacting with hospitalists is an opportunity for fellows to practice professional interactions, which will be critical to their careers. Increasing familiarity between fellows and hospitalists through joint events may also serve to enhance the interaction. Finally, enabling hospitalists to provide feedback to fellows stands to benefit both parties because multisource feedback is an important tool in assessing trainee competence and improving performance.23 However, we should note that because our study focused on hospitalist perceptions, an exploration of subspecialty fellows’ and attendings’ perceptions of the hospitalist–consultant interaction would provide additional, important data for shaping interventions.
Strengths of our study include the inclusion of multiple study sites, which may increase generalizability; however, our study has several limitations. The incomplete response rate reduces both generalizability and statistical power and may have created selection or nonresponder bias. However, low response rates occur commonly when surveying medical professionals, and our results are consistent with many prior hospitalist survey studies.24-26 Further, we conducted our study at a single time point; therefore, we could not evaluate the effect of fellow experience on hospitalist perceptions. However, we conducted our study in the second half of the academic year, when fellows had already gained considerable experience in the consultation setting. We did not capture participants’ institutional affiliations; therefore, a subgroup analysis by institution could not be performed. Additionally, our study reflects hospitalist perception rather than objectively measured communication practices between hospitalists and consultants, and it does not include the perspective of subspecialists. The specific needs of nurse practitioners and physicians’ assistants, who were excluded from this study, should also be evaluated in future research. Lastly, this is a hypothesis-generating study and should be replicated in a national cohort.
CONCLUSION
The hospitalists represented in our sample population perceived the consult interaction to be important for patient care and a valuable opportunity for their own learning. Participants expressed that they would like to increase direct communication with consultants and enhance consultant–hospitalist teaching interactions. Multiple barriers to effective hospitalist–consultant interactions (including communication, pushback, and hospitalist–consultant familiarity) are amenable to intervention.
Disclosure
The authors have no financial disclosures or conflicts of interest.
1. Kravolec PD, Miller JA, Wellikson L, Huddleston JM. The status of hospital medicine groups in the United States. J Hosp Med.2006;1(2):75-80. PubMed
2. Cai Q, Bruno CJ, Hagedorn CH, Desbiens NA. Temporal trends over ten years in formal inpatient gastroenterology consultations at an inner-city hospital. J Clin Gastroenterol. 2003;36(1):34-38. PubMed
3. Ta K, Gardner GC. Evaluation of the activity of an academic rheumatology consult service over 10 years: using data to shape curriculum. J Rheumatol. 2007;34(3):563-566. PubMed
4. Miloslavsky EM, McSparron JI, Richards JB, Puig A, Sullivan AM. Teaching during consultation: factors affecting the resident-fellow teaching interaction. Med Educ. 2015;49(7):717-730. PubMed
5. Chan T, Sabir K, Sanhan S, Sherbino J. Understanding the impact of residents’ interpersonal relationships during emergency department referrals and consultations. J Grad Med Educ. 2013;5(4):576-581. PubMed
6. Chan T, Bakewell F, Orlich D, Sherbino J. Conflict prevention, conflict mitigation, and manifestations of conflict during emergency department consultations. Acad Emerg Med. 2014;21(3):308-313. PubMed
7. Goldman L, Lee T, Rudd P. Ten commandments for effective consultations. Arch Intern Med. 1983;143(9):1753-1755. PubMed
8. Adams T. Barriers to hospitalist fellow interactions. Med Educ. 2016;50(3):370. PubMed
9. Gupta S, Alladina J, Heaton K, Miloslavsky E. A randomized trial of an intervention to improve resident-fellow teaching interaction on the wards. BMC Med Educ. 2016;16(1):276. PubMed
10. Day LW, Cello JP, Madden E, Segal M. Prospective assessment of inpatient gastrointestinal consultation requests in an academic teaching hospital. Am J Gastroenterol. 2010;105(3):484-489. PubMed
11. Kessler C, Kutka BM, Badillo C. Consultation in the emergency department: a qualitative analysis and review. J Emerg Med. 2012;42(6):704-711. PubMed
12. Salerno SM, Hurst FP, Halvorson S, Mercado DL. Principles of effective consultation: an update for the 21st-century consultant. Arch Intern Med. 2007;167(3):271-275. PubMed
13. Muzin LJ. Understanding the process of medical referral: part 1: critique of the literature. Can Fam Physician. 1991;37:2155-2161. PubMed
14. Muzin LJ. Understanding the process of medical referral: part 5: communication. Can Fam Physician. 1992;38:301-307. PubMed
15. Wadhwa A, Lingard L. A qualitative study examining tensions in interdoctor telephone consultations. Med Educ. 2006;40(8):759-767. PubMed
16. Grant IN, Dixon AS. “Thank you for seeing this patient”: studying the quality of communication between physicians. Can Fam Physician. 1987;33:605-611. PubMed
17. Kessler CS, Afshar Y, Sardar G, Yudkowsky R, Ankel F, Schwartz A. A prospective, randomized, controlled study demonstrating a novel, effective model of transfer of care between physicians: the 5 Cs of consultation. Acad Emerg Med. 2012;19(8):968-974. PubMed
18. Podolsky A, Stern DTP. The courteous consult: a CONSULT card and training to improve resident consults. J Grad Med Educ. 2015;7(1):113-117. PubMed
19. Tofil NM, Peterson DT, Harrington KF, et al. A novel iterative-learner simulation model: fellows as teachers. J. Grad. Med. Educ. 2014;6(1):127-132. PubMed
20. Kempainen RR, Hallstrand TS, Culver BH, Tonelli MR. Fellows as teachers: the teacher-assistant experience during pulmonary subspecialty training. Chest. 2005;128(1):401-406. PubMed
21. Backes CH, Reber KM, Trittmann JK, et al. Fellows as teachers: a model to enhance pediatric resident education. Med. Educ. Online. 2011;16:7205. PubMed
22. Miloslavsky EM, Degnan K, McNeill J, McSparron JI. Use of Fellow as Clinical Teacher (FACT) Curriculum for Teaching During Consultation: Effect on Subspecialty Fellow Teaching Skills. J Grad Med Educ. 2017;9(3):345-350 PubMed
23. Donnon T, Al Ansari A, Al Alawi S, Violato C. The reliability, validity, and feasibility of multisource feedback physician assessment: a systematic review. Acad. Med. 2014;89(3):511-516. PubMed
24. Monash B, Najafi N, Mourad M, et al. Standardized attending rounds to improve the patient experience: A pragmatic cluster randomized controlled trial. J Hosp Med. 2017;12(3):143-149. PubMed
25. Allen-Dicker J, Auerbach A, Herzig SJ. Perceived safety and value of inpatient “very important person” services. J Hosp Med. 2017;12(3):177-179. PubMed
26. Do D, Munchhof AM, Terry C, Emmett T, Kara A. Research and publication trends in hospital medicine. J Hosp Med. 2014;9(3):148-154. PubMed
Hospitalist physicians care for an increasing proportion of general medicine inpatients and request a significant share of all subspecialty consultations.1 Subspecialty consultation in inpatient care is increasing,2,3 and effective hospitalist–consulting service interactions may affect team communication, patient care, and hospitalist learning. Therefore, enhancing hospitalist–consulting service interactions may have a broad-reaching, positive impact. Researchers in previous studies have explored resident–fellow consult interactions in the inpatient and emergency department settings as well as attending-to-attending consultation in the outpatient setting.4-7 However, to our knowledge, hospitalist–consulting team interactions have not been previously described. In academic medical centers, hospitalists are attending physicians who interact with both fellows (supervised by attending consultants) and directly with subspecialty attendings. Therefore, the exploration of the hospitalist–consultant interaction requires an evaluation of hospitalist–fellow and hospitalist–subspecialty attending interactions. The hospitalist–fellow interaction in particular is unique because it represents an unusual dynamic, in which an attending physician is primarily communicating with a trainee when requesting assistance with patient care.8 In order to explore hospitalist–consultant interactions (herein, the term “consultant” includes both fellow and attending consultants), we conducted a survey study in which we examine hospitalist practices and attitudes regarding consultation, with a specific focus on hospitalist consultation with internal medicine subspecialty consult services. In addition, we compared fellow–hospitalist and attending–hospitalist interactions and explored barriers to and facilitating factors of an effective hospitalist–consultant relationship.
METHODS
Survey Development
The survey instrument was developed by the authors based on findings of prior studies in which researchers examined consultation.2-6,9-16 The survey contained 31 questions (supplementary Appendix A) and evaluated 4 domains of the use of medical subspecialty consultation in direct patient care: (1) current consultation practices, (2) preferences regarding consultants, (3) barriers to and facilitating factors of effective consultation (both with respect to hospitalist learning and patient care), and (4) a comparison between hospitalist–fellow and hospitalist–subspecialty attending interactions. An evaluation of current consultation practices included a focus on communication methods (eg, in person, over the phone, through paging, or notes) because these have been found to be important during consultation.5,6,9,15,16 In order to explore hospitalist preferences regarding consult interactions and investigate perceptions of barriers to and facilitating factors of effective consultation, questions were developed based on previous literature, including our qualitative work examining resident–fellow interactions during consultation.4-6,9,12 We compared hospitalist consultation experiences among attending and fellow consultants because the interaction in which an attending hospitalist physician is primarily communicating with a trainee may differ from a consultation between a hospitalist attending and a subspecialty attending.8 Participants were asked to exclude their experiences when working on teaching services, during which students or housestaff often interact with consultants. The survey was cognitively tested with both hospitalist and non-hospitalist attending physicians not participating in the study and was revised by the authors using an iterative approach.
Study Participants
Hospitalist attending physicians at University of Texas Southwestern (UTSW) Medical Center, Emory University School of Medicine, Massachusetts General Hospital (MGH), and the Medical University of South Carolina (MUSC) were eligible to participate in the study. Consult team structures at each institution were composed of either a subspecialist-attending-only or a fellow-and-subspecialty-attending team. Fellows at all institutions are supervised by a subspecialty attending when performing consultations. Respondents who self-identified as nurse practitioners or physician assistants were excluded from the analysis. Hospitalists employed by the Veterans Affairs hospital system were also excluded. The study was approved by the institutional review boards of UTSW, Emory, MUSC, and MGH.
The survey was anonymous and administered to all hospitalists at participating institutions via a web-based survey tool (Qualtrics, Provo, UT). Participants were eligible to enter a raffle for a $500 gift card, and completion of the survey was not required for entry into the raffle.
Statistics
Results were summarized using the mean with standard deviation for continuous variables and the frequency with percentage for categorical variables after excluding missing values. All analyses were conducted using SAS version 9.4 (SAS Institute, Cary, NC). A 2-sided P value of ≤0.05 was considered statistically significant.
RESULTS
Current Consultation Practices
Current consultation practices and descriptions of hospitalist–consultant communication are shown in Table 2. Forty percent of respondents requested 0-1 consults per day, while 51.7% requested 2-3 per day. The most common reasons for requesting a consultation were assistance with treatment (48.5%), assistance with diagnosis (25.7%), and request for a procedure (21.8%). When asked whether the frequency of consultation is changing, slightly more hospitalists felt that their personal use of consultation was increasing as compared to those who felt that it was decreasing (38.5% vs 30.3%, respectively).
Hospitalist Preferences
Eighty-six percent of respondents agreed that consultants should be required to communicate their recommendations either in person or over the phone. Eighty-three percent of hospitalists agreed that they would like to receive more teaching from the consulting services, and 74.0% agreed that consultants should attempt to teach hospitalists during consult interactions regardless of whether the hospitalist initiates the teaching–learning interaction.
Barriers to and Facilitating Factors of Effective Consultation
Participants reported that multiple factors affected patient care and their own learning during inpatient consultation (Figure 1). Consultant pushback, high hospitalist clinical workload, a perception that consultants had limited time, and minimal in-person interactions were all seen as factors that negatively affected the consult interaction. These generally affected both learning and patient care. Conversely, working on an interesting clinical case, more hospitalist free time, positive interaction with the consultant, and having previously worked with the consultant positively affected both learning and patient care (Figure 1).
Fellow Versus Attending Interactions
Respondents indicated that interacting directly with the consult attending was superior to hospitalist–fellow interactions in all aspects of care but particularly with respect to pushback, confidence in recommendations, professionalism, and hospitalist learning (Figure 2).
DISCUSSION
To our knowledge, this is the first study to describe hospitalist attending practices, attitudes, and perceptions of internal medicine subspecialty consultation. Our findings, which focus on the interaction between hospitalists and internal medicine subspecialty attendings and fellows, outline the hospitalist perspective on consultant interactions and identify a number of factors that are amenable to intervention. We found that hospitalists perceive the consult interaction to be important for patient care and a valuable opportunity for their own learning. In-person communication was seen as an important component of effective consultation but was reported to occur in a minority of consultations. We demonstrate that hospitalist–subspecialty attending consult interactions are perceived more positively than hospitalist–fellow interactions. Finally, we describe barriers and facilitating factors that may inform future interventions targeting this important interaction.
Effective communication between consultants and the primary team is critical for both patient care and teaching interactions.4-7 Pushback on consultation was reported to be the most significant barrier to hospitalist learning and had a major impact on patient care. Because hospitalists are attending physicians, we hypothesized that they may perceive pushback from fellows less frequently than residents.4 However, in our study, hospitalists reported pushback to be relatively frequent in their daily practice. Moreover, hospitalists reported a strong preference for in-person interactions with consultants, but our study demonstrated that such interactions are relatively infrequent. Researchers in studies of resident–fellow consult interactions have noted similar findings, suggesting that hospitalists and internal medicine residents face similar challenges during consultation.4-6 Hospitalists reported that positive interpersonal interactions and personal familiarity with the consultant positively affected the consult interaction. Most importantly, these effects were perceived to affect both hospitalist learning and patient care, suggesting the importance of interpersonal interactions in consultative medicine.
In an era of increasing clinical workload, the consult interaction represents an important workplace-based learning opportunity.4 Centered on a consult question, the hospitalist–consultant interaction embodies a teachable moment and can be an efficient opportunity to learn because both parties are familiar with the patient. Indeed, survey respondents reported that they frequently learned from consultation, and there was a strong preference for more teaching from consultants in this setting. However, the hospitalist–fellow consult interaction is unique because attending hospitalists are frequently communicating with fellow trainees, which could limit fellows’ confidence in their role as teachers and hospitalists’ perception of their role as learners. Our study identifies a number of barriers and facilitating factors (including communication, pushback, familiarity, and clinical workload) that affect the hospitalist–consultant teaching interaction and may be amenable to intervention.
Hospitalists expressed a consistent preference for interacting with attending subspecialists compared to clinical fellows during consultation. Preference for interaction with attendings was strongest in the areas of pushback, confidence in recommendations, professionalism, and learning from consultation. Some of the factors that relate to consult service structure and fellow experience, such as timeliness of consultation and confidence in recommendations, may not be amenable to intervention. For instance, fellows must first see and then staff the consult with their attending prior to leaving formal recommendations, which makes their communication less timely than that of attending physicians, when they are the primary consultant. However, aspects of the hospitalist–consultant interaction (such as professionalism, ease of communication, and pushback) should not be affected by the difference in experience between fellows and attending physicians. The reasons for such perceptions deserve further exploration; however, differences in incentive structures, workload, and communication skills between fellows and attending consultants may be potential explanations.
Our findings suggest that interventions aimed at enhancing hospitalist–consultant interactions focus on enhancing direct communication and teaching while limiting the perception of pushback. A number of interventions that are primarily focused on instituting a systematic approach to requesting consultation have shown an improvement in resident and medical student consult communication17,18 as well as resident–fellow teaching interactions.9 However, it is not clear whether these interventions would be effective given that hospitalists have more experience communicating with consultants than trainees. Given the unique nature of the hospitalist–consultant interaction, multiple barriers may need to be addressed in order to have a significant impact. Efforts to increase direct communication, such as a mechanism for hospitalists to make and request in-person or direct verbal communication about a particular consultation during the consult request, can help consultants prioritize direct communication with hospitalists for specific patients. Familiarizing fellows with hospitalist workflow and the locations of hospitalist workrooms also may promote in-person communication. Fellowship training can focus on enhancing fellow teaching and communication skills,19-22 particularly as they relate to hospitalists. Fellows in particular may benefit because the hospitalist–fellow teaching interaction may be bidirectional, with hospitalists having expertise in systems practice and quality efforts that can inform fellows’ practice. Furthermore, interacting with hospitalists is an opportunity for fellows to practice professional interactions, which will be critical to their careers. Increasing familiarity between fellows and hospitalists through joint events may also serve to enhance the interaction. Finally, enabling hospitalists to provide feedback to fellows stands to benefit both parties because multisource feedback is an important tool in assessing trainee competence and improving performance.23 However, we should note that because our study focused on hospitalist perceptions, an exploration of subspecialty fellows’ and attendings’ perceptions of the hospitalist–consultant interaction would provide additional, important data for shaping interventions.
Strengths of our study include the inclusion of multiple study sites, which may increase generalizability; however, our study has several limitations. The incomplete response rate reduces both generalizability and statistical power and may have created selection or nonresponder bias. However, low response rates occur commonly when surveying medical professionals, and our results are consistent with many prior hospitalist survey studies.24-26 Further, we conducted our study at a single time point; therefore, we could not evaluate the effect of fellow experience on hospitalist perceptions. However, we conducted our study in the second half of the academic year, when fellows had already gained considerable experience in the consultation setting. We did not capture participants’ institutional affiliations; therefore, a subgroup analysis by institution could not be performed. Additionally, our study reflects hospitalist perception rather than objectively measured communication practices between hospitalists and consultants, and it does not include the perspective of subspecialists. The specific needs of nurse practitioners and physicians’ assistants, who were excluded from this study, should also be evaluated in future research. Lastly, this is a hypothesis-generating study and should be replicated in a national cohort.
CONCLUSION
The hospitalists represented in our sample population perceived the consult interaction to be important for patient care and a valuable opportunity for their own learning. Participants expressed that they would like to increase direct communication with consultants and enhance consultant–hospitalist teaching interactions. Multiple barriers to effective hospitalist–consultant interactions (including communication, pushback, and hospitalist–consultant familiarity) are amenable to intervention.
Disclosure
The authors have no financial disclosures or conflicts of interest.
1. Kravolec PD, Miller JA, Wellikson L, Huddleston JM. The status of hospital medicine groups in the United States. J Hosp Med.2006;1(2):75-80. PubMed
2. Cai Q, Bruno CJ, Hagedorn CH, Desbiens NA. Temporal trends over ten years in formal inpatient gastroenterology consultations at an inner-city hospital. J Clin Gastroenterol. 2003;36(1):34-38. PubMed
3. Ta K, Gardner GC. Evaluation of the activity of an academic rheumatology consult service over 10 years: using data to shape curriculum. J Rheumatol. 2007;34(3):563-566. PubMed
4. Miloslavsky EM, McSparron JI, Richards JB, Puig A, Sullivan AM. Teaching during consultation: factors affecting the resident-fellow teaching interaction. Med Educ. 2015;49(7):717-730. PubMed
5. Chan T, Sabir K, Sanhan S, Sherbino J. Understanding the impact of residents’ interpersonal relationships during emergency department referrals and consultations. J Grad Med Educ. 2013;5(4):576-581. PubMed
6. Chan T, Bakewell F, Orlich D, Sherbino J. Conflict prevention, conflict mitigation, and manifestations of conflict during emergency department consultations. Acad Emerg Med. 2014;21(3):308-313. PubMed
7. Goldman L, Lee T, Rudd P. Ten commandments for effective consultations. Arch Intern Med. 1983;143(9):1753-1755. PubMed
8. Adams T. Barriers to hospitalist fellow interactions. Med Educ. 2016;50(3):370. PubMed
9. Gupta S, Alladina J, Heaton K, Miloslavsky E. A randomized trial of an intervention to improve resident-fellow teaching interaction on the wards. BMC Med Educ. 2016;16(1):276. PubMed
10. Day LW, Cello JP, Madden E, Segal M. Prospective assessment of inpatient gastrointestinal consultation requests in an academic teaching hospital. Am J Gastroenterol. 2010;105(3):484-489. PubMed
11. Kessler C, Kutka BM, Badillo C. Consultation in the emergency department: a qualitative analysis and review. J Emerg Med. 2012;42(6):704-711. PubMed
12. Salerno SM, Hurst FP, Halvorson S, Mercado DL. Principles of effective consultation: an update for the 21st-century consultant. Arch Intern Med. 2007;167(3):271-275. PubMed
13. Muzin LJ. Understanding the process of medical referral: part 1: critique of the literature. Can Fam Physician. 1991;37:2155-2161. PubMed
14. Muzin LJ. Understanding the process of medical referral: part 5: communication. Can Fam Physician. 1992;38:301-307. PubMed
15. Wadhwa A, Lingard L. A qualitative study examining tensions in interdoctor telephone consultations. Med Educ. 2006;40(8):759-767. PubMed
16. Grant IN, Dixon AS. “Thank you for seeing this patient”: studying the quality of communication between physicians. Can Fam Physician. 1987;33:605-611. PubMed
17. Kessler CS, Afshar Y, Sardar G, Yudkowsky R, Ankel F, Schwartz A. A prospective, randomized, controlled study demonstrating a novel, effective model of transfer of care between physicians: the 5 Cs of consultation. Acad Emerg Med. 2012;19(8):968-974. PubMed
18. Podolsky A, Stern DTP. The courteous consult: a CONSULT card and training to improve resident consults. J Grad Med Educ. 2015;7(1):113-117. PubMed
19. Tofil NM, Peterson DT, Harrington KF, et al. A novel iterative-learner simulation model: fellows as teachers. J. Grad. Med. Educ. 2014;6(1):127-132. PubMed
20. Kempainen RR, Hallstrand TS, Culver BH, Tonelli MR. Fellows as teachers: the teacher-assistant experience during pulmonary subspecialty training. Chest. 2005;128(1):401-406. PubMed
21. Backes CH, Reber KM, Trittmann JK, et al. Fellows as teachers: a model to enhance pediatric resident education. Med. Educ. Online. 2011;16:7205. PubMed
22. Miloslavsky EM, Degnan K, McNeill J, McSparron JI. Use of Fellow as Clinical Teacher (FACT) Curriculum for Teaching During Consultation: Effect on Subspecialty Fellow Teaching Skills. J Grad Med Educ. 2017;9(3):345-350 PubMed
23. Donnon T, Al Ansari A, Al Alawi S, Violato C. The reliability, validity, and feasibility of multisource feedback physician assessment: a systematic review. Acad. Med. 2014;89(3):511-516. PubMed
24. Monash B, Najafi N, Mourad M, et al. Standardized attending rounds to improve the patient experience: A pragmatic cluster randomized controlled trial. J Hosp Med. 2017;12(3):143-149. PubMed
25. Allen-Dicker J, Auerbach A, Herzig SJ. Perceived safety and value of inpatient “very important person” services. J Hosp Med. 2017;12(3):177-179. PubMed
26. Do D, Munchhof AM, Terry C, Emmett T, Kara A. Research and publication trends in hospital medicine. J Hosp Med. 2014;9(3):148-154. PubMed
©2017 Society of Hospital Medicine
‘Untangling’ DNA Damage
“Imagine your DNA is a giant ball of yarn,” says Matthew Schellenberg, PhD. That is the metaphor he uses to help describe the findings of a study he conducted with other researchers from the NIH. They discovered how 2 proteins work together to “untangle” DNA damage known as a DNA-protein crosslink (DPC).
When DNA becomes tangled inside of cells, organisms use another protein called topoisomerase 2 (TOP2) to straighten things out, by cutting and “retying” individual threads. To do that, it first conceals the cut DNA ends within the core of the TOP2 protein, which allows it to then retie, or rejoin, the DNA ends. However, cancer drugs or environmental chemicals sometimes can block this retying ability, so the TOP2 remains stuck. That creates a stable environment for TOP2 and DPC, leading to an accumulation of severed DNA that kills cells.
Scott Williams, PhD, deputy chief of the Genome Integrity and Structural Biology Laboratory at the National Institute of Environmental Health Sciences, headed the team that identified ZATT as a new contributor to the process of removing DPCs. He uses another metaphor, likening the TOP2-DPCs to “ticking time bombs for cells.” The molecular charges are armed, Williams says, by TOP2’s interaction with environmental toxicants, chemical metabolites, tobacco exposures, or DNA damage caused by ultraviolet light.
While cancer drugs induce formation of TOP2-DPCs to treat cancer, TOP2-DPC lesions also can cause rearrangement of an organism’s genome that leads to cancer. If they are not removed, they trigger cell death. That led Williams and the research team to find out how DPCs are located and broken down. In his metaphor, the protein ZATT “is like a bomb-sniffing dog.” When it locates the target, it sounds an alarm to mobilize the recruitment of TOP2, which “cuts the red wire to disarm these threats.”
Schellenberg says, “We’ve discovered how we defend against this potent means of killing.” The knowledge may help researchers make drugs that kill cancer cells more effective.
Method identifies effective treatments for leukemias, lymphomas

An ex vivo drug screening method can reveal optimal therapies for patients with hematologic malignancies, according to research published in The Lancet Haematology.
Researchers used a method called pharmacoscopy to measure single-cell responses to possible treatments in samples from patients with leukemias and lymphomas.
The team then used these results to guide treatment decisions and found that pharmacoscopy-guided treatment greatly improved response rates and progression-free survival (PFS).
“Having a robust, fast, and reliable predictive test at our disposal during the patient treatment process, especially at the time of relapse where a new intervention must be selected quickly, will change how medical doctors prioritize drugs to use for late-stage patients,” said study author Philipp Staber, MD, of Medical University of Vienna in Austria.
With pharmacoscopy, hundreds of drug options can be pre-tested ex vivo in small liquid biopsy samples collected from individual patients. The effects of each drug on the individual cells are quantified using high-throughput and high-content automated confocal microscopy.
In combination with specially developed analysis methods, machine learning, and other algorithms, pharmacoscopy allows quantification of never-before visualized phenotypes. The method was first described last April in Nature Chemical Biology.
Now, Dr Staber and his colleagues have reported, in The Lancet Haematology, an interim analysis of the first clinical trial testing pharmacoscopy-guided treatment.
There were 17 evaluable patients, all of whom had aggressive hematologic malignancies. This included diffuse large B-cell lymphoma (n=6), acute myeloid leukemia (n=3), B-cell acute lymphoblastic leukemia (n=2), precursor B-cell lymphoblastic lymphoma (n=1), peripheral T-cell lymphoma (n=1), primary mediastinal B-cell lymphoma (n=1), T-cell lymphoblastic lymphoma (n=1), follicular lymphoma (n=1), and T-cell prolymphocytic leukemia (n=1).
The researchers compared outcomes with pharmacoscopy-guided treatment to outcomes with the most recent regimen on which the patient had progressed.
The overall response rate was 88% with pharmacoscopy-guided treatment and 24% with the patients’ most recent previous treatment regimen (odds ratio=24.38; 95%, CI 3.99–125.4; P=0.0013).
None of the patients had progressive disease as their best overall response when they received pharmacoscopy-guided treatment. However, 7 patients had progressive disease in response to their most recent prior regimen.
At the time of analysis, 8 patients (47%) still had ongoing responses after pharmacoscopy-guided treatment.
In addition, pharmacoscopy-guided treatment significantly improved PFS. The median PFS was 22.6 weeks with pharmacoscopy-guided treatment and 5.7 weeks with the most recent prior regimen (hazard ratio=3.14; 95%, CI 1.37–7.22; P=0.0075).
“Evidence that the pharmacoscopy approach is helpful for clinical evaluation of therapy is wonderful,” said study author Giulio Superti-Furga, PhD, of CeMM Research Center for Molecular Medicine in Vienna, Austria.
“Single-cell functional analysis of primary material gives unprecedented resolution and precision that we are sure to further develop in the future to address yet more diseases.” ![]()
PTSD can persist in cancer survivors

Cancer patients may experience lasting post-traumatic stress disorder (PTSD), according to a study published in the journal Cancer.
Approximately one-fifth of patients involved in the study experienced PTSD several months after their cancer diagnosis, and roughly a third of these patients continued to live with PTSD 4 years later.
Researchers say these findings highlight the need for early identification, careful monitoring, and treatment of PTSD in cancer survivors.
Caryn Mei Hsien Chan, PhD, of the National University of Malaysia in Kuala Lumpur, and her colleagues conducted this research.
The study included 469 adults with various cancers who were within 1 month of cancer diagnosis at enrollment.
Patients who had significant psychological distress (defined as a Hospital Anxiety and Depression Scale total cutoff score of 16 or higher) underwent
testing for PTSD at 6 months of follow-up. All patients were tested for PTSD at 4 years of follow-up (regardless of their Hospital Anxiety and Depression Scale score).
The incidence of PTSD was 21.7% at 6 months and 6.1% at 4 years. Although overall rates of PTSD decreased with time, roughly one-third of patients initially diagnosed with PTSD were found to have persistent or worsening symptoms 4 years later.
“Many cancer patients believe they need to adopt a ‘warrior mentality’ and remain positive and optimistic from diagnosis through treatment to stand a better chance of beating their cancer,” Dr Chan said.
“To these patients, seeking help for the emotional issues they face is akin to admitting weakness. There needs to be greater awareness that there is nothing wrong with getting help to manage the emotional upheaval—particularly depression, anxiety, and PTSD—post-cancer.”
Dr Chan also stressed that many patients live in fear that their cancer may come back, and they may think the cancer has returned with every lump or bump, pain or ache, fatigue or fever.
In addition, cancer survivors might skip visits to their oncologists or other physicians to avoid triggering memories of their past cancer experience. This can lead to delays in seeking help for new symptoms or even refusal of treatment for unrelated conditions.
“We need psychological evaluation and support services for patients with cancer at an initial stage and at continued follows-up because psychological well-being and mental health—and by extension, quality of life—are just as important as physical health,” Dr Chan noted. ![]()
Withdrawn drug receives orphan designation for HA

The US Food and Drug Administration (FDA) has granted orphan drug designation to rofecoxib (TRM-201) as a potential treatment for degenerative joint disease in hemophilia, also known as hemophilic arthropathy (HA).
Rofecoxib is a COX-2 selective non-steroidal anti-inflammatory drug (NSAID) that was previously sold in the US under the name Vioxx.
Vioxx was FDA-approved to relieve the signs and symptoms of osteoarthritis, manage acute pain in adults, and treat primary dysmenorrhea.
Merck & Co. pulled Vioxx from the US market in 2004 due to safety concerns. The drug was shown to increase a person’s risk of cardiovascular events, including heart attack and stroke.
Now, Tremeau Pharmaceuticals, Inc., is working to bring rofecoxib back to market to treat patients with HA.
HA patients should not receive traditional NSAIDs due to their effects on platelet aggregation and the risk of gastrointestinal ulcers associated with these drugs. Therefore, high potency opioids are the current standard of care in HA.
“Being granted an orphan drug designation for rofecoxib by FDA is an important regulatory milestone for Tremeau and affirms our strategy of providing non-opioid pain treatments for rare diseases like hemophilic arthropathy,” said Bradford C. Sippy, chief executive officer of Tremeau.
Sippy is a former Merck employee who helped with the recall of Vioxx and knew the final patent protecting the drug’s monopoly was expiring this fall.
When it stopped making Vioxx, Merck was facing thousands of lawsuits from people claiming the drug caused their heart attacks or strokes.
Merck’s own research showed the drug doubled those risks, but lawyers for patients claimed the company downplayed or concealed that. Merck initially fought the lawsuits but, in 2007, agreed to a $4.85 billion settlement.
If approved to treat HA, rofecoxib would carry a warning about the increased risk of heart attack and stroke associated with the drug.
Although the orphan designation for rofecoxib is a step toward FDA approval, Sippy said Tremeau must still raise $25 million or more to fund trials of the drug in hemophilia patients.
About orphan designation
The FDA grants orphan designation to products intended to treat, diagnose, or prevent diseases/disorders that affect fewer than 200,000 people in the US.
The designation provides incentives for sponsors to develop products for rare diseases. This may include tax credits toward the cost of clinical trials, prescription drug user fee waivers, and 7 years of market exclusivity if the product is approved. ![]()