User login
From the Washington Office: Taking action
As we head into the last few weeks of the first session of the 115th Congress, it is likely that several pieces of “must pass” legislation will move through the process of becoming law. This “must pass” legislation can serve as a vehicle onto which other bills are attached and thus, also move successfully through the process for passage. I have highlighted below three such bills from the Action Alert section of the SurgeonsVoice website (www.surgeonsvoice.com) which could, with less than 5 minutes of your time, develop enough forward momentum to so move.
Ensuring Access to General Surgery Act
Increasing evidence indicates a current and growing shortage of surgeons available to serve our nation’s population. A shortage of general surgeons is a critical component of the crisis in health care workforce because only surgeons are uniquely trained and qualified to provide certain necessary, lifesaving procedures. Accordingly, the American College of Surgeons (ACS) is urging policy makers to recognize, through the designation of a formal surgical shortage area, that surgeons are an essential component of a community based health care system.
Unlike other key providers of the community-based health care system, general surgeons do not currently have a formal workforce shortage area designation. In light of growing evidence demonstrating a shortage of general surgeons, ACS believes that more accurate and actionable workforce data are necessary to determine exactly what constitutes a surgical shortage area for general surgery, and where these areas exist. Identifying where patients lack access to surgical services will provide HRSA with a valuable new tool for increasing access to the full spectrum of high-quality health care services. Determining what constitutes and defines a surgical shortage area is an important first step in guaranteeing all Medicare beneficiaries, regardless of geographic location, have access to quality surgical care.
Mission Zero Act
It has long been a priority of the ACS to establish and maintain high-quality and adequately-funded trauma systems throughout the U.S., including within the Armed Forces. The Mission Zero Act, introduced by Chairman of the House Energy and Commerce Health Subcommittee, Michael Burgess, MD (R-TX), Representatives Gene Green (D-TX), Richard Hudson (R-NC), and Kathy Castor (D-FL) in the House of Representatives and Senators Johnny Isakson (R-GA), John Cornyn (R-TX), and Tammy Duckworth (D-IL) in the Senate, would provide HHS grant funding to assist civilian trauma centers in partnering with military trauma professionals to establish a pathway to provide patients with the highest quality trauma care. As a result of these partnerships, military trauma care teams and providers will gain exposure treating critically injured patients and increase readiness for future deployments. Not only will this serve to maintain readiness among military providers, but it will facilitate the promulgation of the trauma lessons learned from the military theatres of conflict to the civilian world and potentially alleviate staffing shortages in civilian centers.
CHIP Funding
The Children’s Health Insurance Program (CHIP) is a joint federal and state program that provides health coverage to uninsured children from low-income families. In 2015, the CHIP program provided coverage to over 8 million children in the United States. In sum, CHIP ensures that these children have access to care. The ACS is very supportive of the CHIP program. The CHIP program ensures that a child’s health care concerns are addressed in a timely manner. Contrary to popular belief, many children currently covered by CHIP are not eligible to be covered under Medicaid and would therefore, be left uninsured if CHIP funding is not continued. The most recent reauthorization of this program extended funding for the CHIP program through Sept. 30, 2017, and funding for the program expired on that date. Urgent Congressional action is needed to reauthorize funding and thus, ensure that the children covered by CHIP continue to have access to the health care services they need.
The ACS strongly urges Congress to continue to make children’s health care a priority issue and accordingly, implores Congress to take action to reauthorize CHIP funding prior to concluding the business of the current session.
The SurgeonsVoice website provides an easy and efficient platform for surgeons to use to contact their senators and their representative to let them know of their support of these issues. Taking action on all three of these items would require the investment of less than 5 minutes of one’s valuable time. Our ability “to petition the government for a redress of grievances” is guaranteed by the First Amendment. I urge all Fellows to visit the SurgeonsVoice website and use it as a tool to exercise that right.
Until next month ….
Dr. Bailey is a pediatric surgeon and Medical Director, Advocacy, for the Division of Advocacy and Health Policy in the ACS offices in Washington, DC.
One-step GDM diagnosis: Research moves closer
WASHINGTON – in the United States.
The American College of Obstetricians and Gynecologists now acknowledges this approach as an option, yet “tremendous controversy persists,” according to Mark Landon, MD.
“In the U.S., we continue to be the principal purveyors of a two-step method with a 100-g [oral glucose tolerance test] diagnostic approach, which is in contrast to much of the rest of the world,” he said the biennial meeting of the Diabetes in Pregnancy Study Group of North America.
“At this time, if we’re going to [turn nationally] to the one-step approach, we have to lower the cost of diagnosis and treatment, and we may need some upwards adjustments in the [International Association of Diabetes and Pregnancy Study Groups] criteria in order to achieve consensus,” said Dr. Landon, professor and chair of the department of obstetrics and gynecology at Ohio State University, Columbus.
The International Association of Diabetes in Pregnancy Study Groups (IADPSG) created a stir in the American obstetrics community when it recommended in 2010 that a universal 75-g, 2-hour oral glucose tolerance test (OGTT) be performed during pregnancy and that gestational diabetes mellitus (GDM) be diagnosed when any single measurement threshold – a fasting value of 92 mg/dL, a 1-hour value of 180 mg/dL, or a 2-hour value of 153 mg/dL – is met or exceeded (Diabetes Care 2010 Mar; 33[3]:676-82).
The consensus group made its recommendation based largely on published associations of maternal glycemia with perinatal and long-term outcomes in offspring. Chief among the studies was the landmark Hyperglycemia and Adverse Pregnancy Outcome (HAPO) study, which found continuous linear relationships between maternal glucose levels – including levels that had been viewed as normal – and adverse fetal outcomes such as high fetal birth weight, cord-blood serum C-peptide level (an index of fetal beta-cell function and fetal hyperinsulinemia), and clinical neonatal hypoglycemia. Maternal glucose tolerance was measured in the study with the 75-g 2-hour OGTT.
The IADPSG chose its cut-off points to convey an odds ratio for adverse outcomes of 1.75. But use of the criteria meant that 16%-18% of pregnant women in the United States would be identified as having GDM – a doubling, at least.
In 2013, a National Institute of Child Health and Human Development Consensus Development Conference recommended against adoption of the new criteria, citing uncertainties regarding the benefits of treating so many additional cases of GDM, as well as the costs and additional burden on patients, providers, and the health care system.
In an updated Practice Bulletin on GDM, ACOG recommends that the suggested changes be studied “before they are proposed at a national level.” But ACOG noted that “individual practices and institutions may choose to use the IADPSG’s recommendation, if appropriate, for the population they serve” (Obstet Gynecol. 2017;130[1]:e17-37).
Since the IADPSG proposal came out, Dr. Landon said, at least a half-dozen published studies have attempted to clarify the additional benefit of their proposed criteria, analyzing the risk of adverse maternal and fetal outcomes in women who are diagnosed using IADPSG criteria and not treated, versus those with a normal glucose tolerance test. In these analyses, researchers have excluded women who would also meet usual diagnostic criteria, such as the Carpenter-Coustan criteria, in order to hone in on those with the mildest levels of GDM – the new diagnoses.
Research published “in the last 5-6 years has almost exclusively shown that, in using the IADPSG criteria, and excluding other usual criteria, you see graded, increased frequencies in large babies, preeclampsia, [neonatal] hypoglycemia” and other adverse outcomes, Dr. Landon said. “I know of only one study that refutes these associations.”
A secondary analysis of HAPO study data, for instance, grouped women into three categories: those with no GDM, GDM based on traditional Carpenter-Coustan criteria, and GDM based on IADPSG criteria but not the Carpenter-Coustan thresholds. A 3-hour OGTT result was not used in this analysis since the HAPO study did not collect this.
Compared with cases with no GDM, those with GDM based on IADPSG criteria (but not the Carpenter-Coustan criteria) were nearly twice as likely to have birth weights above the 90th percentile, newborn percentage fat over the 90th percentile, and preeclampsia, for instance (Diabetes Care 2016;39[12];2204-10).
Other researchers are trying to tease apart risk levels according to thresholds that differ slightly from traditional criteria. A retrospective cohort study from Kaiser Permanente Southern California, for instance, chose two strata of women whose GDM was in the lower levels of the IADPSG-defined spectrum for glucose intolerance and found that, in those with the lesser degree of hyperglycemia, only birth weight and large-for-gestational-age was significantly greater than in women with no GDM (Obstet Gynecol. 2015;126[1]:67-73).
“This study is interesting because it raises the question of whether there might be differential treatment effects based on the level of hyperglycemia within the IADPSG category,” Dr. Landon said.
Dr. Landon served as the principal investigator of a large national, randomized controlled trial that showed a reduction in the risk of fetal overgrowth, shoulder dystocia, cesarean delivery, and hypertensive disorders in women who were treated for mild gestational diabetes (N Engl J Med. 2009;361:1339-48). But this study defined mild gestational diabetes according to the Carpenter-Coustan criteria.
“What about the women who meet the [even lower thresholds] of the IADPSG criteria? One would expect that the treatment benefit would not be as great, but will they still benefit from treatment? To date, this is simply unknown,” he said in an interview.
Research in the last 5 years has also begun to look at the financial implications of the IADPSG criteria and strategies for reducing the cost of implementation. Dr. Landon noted that investigators in Brazil, for instance, have determined that an alternative strategy of using a fasting plasma glucose value of 92 mg/gL or greater to rule in GDM, and a fasting value of 80 mg/dL or less to rule out GDM, eliminates the need for 61% of oral glucose challenges and has 96.9% sensitivity for diagnosing GDM (Diabetes Res Clin Pract. 2015 May;108[2]:288-95).
Dr. Landon reported having no relevant financial disclosures.
EXPERT ANALYSIS FROM DPSG-NA 2017
Optimal Treatments for Cardiovascular Diseases
Click here to access Optimal Treatments for Cardiovascular Diseases
Table of Contents
- Roundtable Discussion : Anticoagulation Management
- The Pharmacist’s Role in Medication Optimization for Patients With Chronic Heart Failure
- Pharmacist Interventions to Reduce Modifiable Bleeding Risk Factors Using HAS-BLED in Patients Taking Warfarin
Rural Communities Have High Rates of Suicide
More than half a million people committed suicide between 2001 and 2015, according to the CDC. Rural counties consistently had higher rates than those of metropolitan areas. “While we’ve seen many causes of death come down in recent years, suicide rates have increased more than 20% from 2001 to 2015,” said Brenda Fitzgerald, MD, CDC director. “And this is especially concerning in rural areas.”
Related: Suicide Federal Health Data Trends
Suicide rates in rural counties were 17.32 per 100,000 people compared with 14.86 in small-to-medium metropolitan counties and 11.92 in large metropolitan counties. Rates for American Indian/Alaska Native non-Hispanics were the highest.
The researchers note that, at some points, different negative factors had more impact. For instance, rural communities were harder hit by housing foreclosures, poverty, and unemployment due to the recession. However, the researchers also point out that suicide rates were on the rise before the recession began.
“The trends in suicide rates…are magnified in rural areas,” said James Mercy, PhD, director of CDC’s Division of Violence Prevention. “This report underscores the need for suicide prevention strategies that are specifically tailored for these communities.” To that end, the CDC recently released a compilation of evidence-based strategies that have the greatest prevention potential. The set includes examples of programs that can be customized to fit the cultural needs of different groups. In North Dakota, for instance, the program Sources of Strength was developed for tribal communities to promote connectedness between youth and adults.
Related: Improving Veteran Engagement With Mental Health Care
The Health Resource and Service Administration (HRSA) also has developed activities to address suicide in rural areas, including epidemiologic studies, research, telemedicine, and programs addressing primary health care providers.
https://www.cdc.gov/violenceprevention/pub/technical-packages.html
High Deductible Health Plans: Take Accounts Receivable Action Now
If you missed the recent headlines, Why Patients Delay Medical Payments: 12 findings 1 and You think your health insurance costs too much. Try being a farmer.2, you may not be too worried about your ever-rising accounts receivables. But you should be.
The facts in these stories and the 2017 Employer Health Benefits Survey,3 released on September 19 by the non-partisan Kaiser Family Foundation and Health Research & Educational Trust (HRET), are alarming. Let’s look at some of the survey results.
Since 2007, the average family premium has increased 55% and the average worker contribution toward the premium has increased 74%.3 How does that translate into dollars and cents? Well, the average annual premiums this year are $6690 for single coverage and $18,764 for family coverage.
What does that mean exactly to the farm couple in the Crain’s story? The farmer who “will be lucky to net $75,000” on his hay crop this year has a policy premium with Blue Cross Blue Shield of Illinois that was $22,000 last year. And then there is a $5000 deductible for each him and his wife. Do the math: it means they’d spend 43% of their income before health insurance covers anything.
Do premiums vary significantly by firm size or region? Should surgeons in certain areas of the country be less concerned about these trends? No, the premiums don’t significantly vary by size or region.
The point here is not to write an essay about health insurance premiums, but rather to discuss what this economic reality means to patients who are seeing you tomorrow, next week, and next month. Given these economic realities, what is their attitude about your bill?
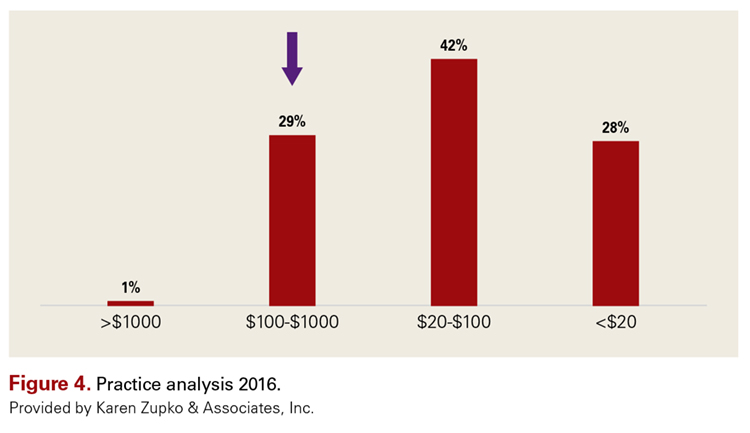
For insight, let’s look at an Advisory Board Company brief, “Minimizing Bad Debt: Point-of-Service Collections,”4 which states: “Patient propensity to pay decreases as patient obligation increases.” According to the brief, “Our analysis indicates that as the dollar value of a patient’s obligation increases, their propensity to pay any portion of the obligation decreases—for all patients, at all income levels.” See Figure 1.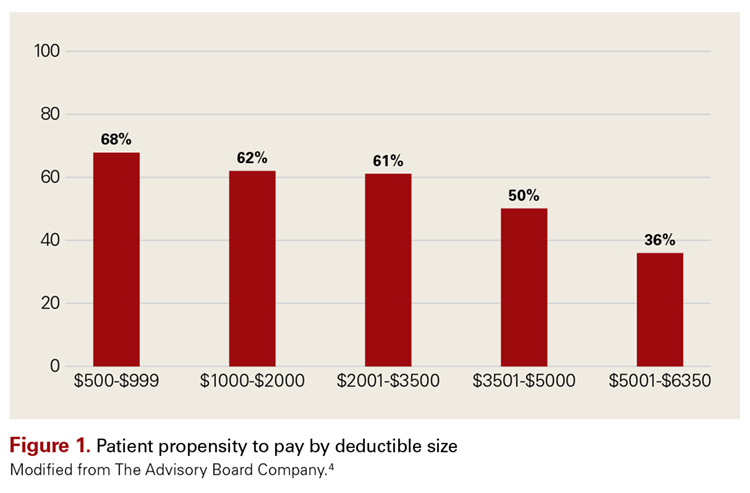
Given that market statistics show that more than a quarter of the commercially insured patients are covered by high deductible health plans (HDHPs), your practice must adapt to these changing times.
Review Your Pay or Mix
Smart practice administrators will keep their finger on the pulse of the insurance local market as more employers move toward offering HDHPs or health savings accounts. Knowing what the largest manufacturers are offering, along with local hospitals that are typically sizable employers in most communities, is critical. The coverage for school systems, police departments, fire departments, and governments should also be the practice radar.
A recent West Corporation survey5 reveals more about the demographic profile of patients who are less likely to pay or delay payments. Their study shows that 79% of patients cite affordability as the largest healthcare problem with 93% of patients saying it costs too much. So it should be no surprise that 67% say their financial situation makes it challenging to submit timely payments. If you are not familiar with the company name, you’ll be familiar with West Corporation’s products, like Televox, which are automated tools used by practices to remind patients about appointments and copays.
Here are other relevant findings from the West Corporation survey:
- 56% delay payments of medical bills at least some of the time.
- 70% of millennials have missed medical payment deadlines.
- 42% of patients cite their HDHP as the reason for delaying their payments.
- 36% of patients said they have difficulty remembering to make timely medical payments.
It’s no surprise that orthopedic surgeons are not discussing fees with patients. Although only 9% admitted that they don’t discuss costs with patients, it is safe to estimate that few surgeons have their fee schedules memorized.
In a 2013 article, Ubel and colleagues7 said, “Because treatments can be ‘financially toxic,’ physicians need to disclose the financial consequences of treatment alternatives just as they inform patients about treatments’ side effects.”
While uniquely qualified to discuss treatment options, few orthopedic surgeons have the time or the facts to personally discuss fees, out-of-pocket expenses, uncovered services and payment plans. Detailed discussions about patients’ financial liabilities are better done by qualified staff, who verify benefits and use modern technology tools to generate an electronic “estimate of costs and benefits.”
Target Your Efforts
What steps can your practice take to help patients pay their portion, even when it’s large, as well as help your practice reduce receivables and avoid collection problems and bad debt write-offs?
Start by analyzing the top Current Procedural Terminology (CPT) codes with patient responsibility, so you can focus your efforts. One such analysis, conducted by our firm, is shown in Figure 3. Although you might think the highest percent of patient financial responsibilities are for surgical procedures, notice that 4 of the top 5 services this practice identified as having the highest amount of patient collectible dollars are rendered in the office-carpal tunnel surgery being the only exception.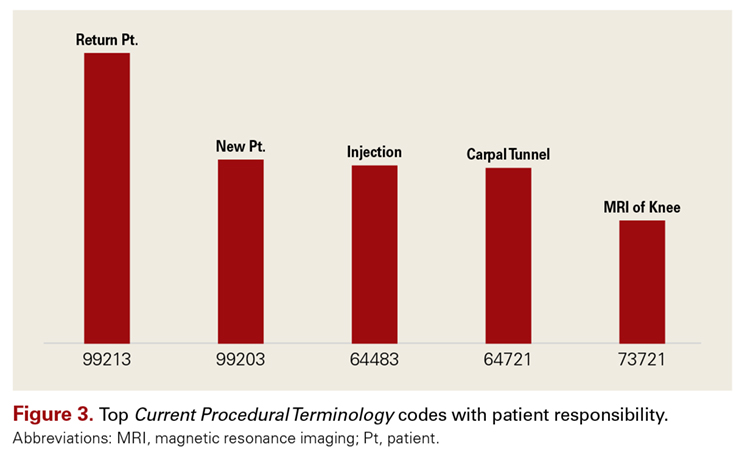
Take Action
After conducting a thorough analysis and reviewing the results, here are 5 actionable steps your practice could take:
1. Make sure your patient portal has the capacity to take patient payments. Offering online payment options increases the opportunity for patients to pay. Promote this option on the patient statement.
2. Implement a system of collecting from patients before they leave the office. After a new visit, which involves a more expensive evaluation and management code, and possibly imaging and durable medical device, counsel patients to leave a credit card on file, so the minute insurance pays, their credit card can be charged.
The 2017 Navicure Patient Payment Check-Up survey8 conducted by Healthcare Information and Management Systems Society (HIMSS) Analytics shows that 78% of patients would provide a card to be charged for one time up to $200. Think about the previously illustrated collection amounts this would alleviate.
3. Provide all surgery patients with a cost estimate. Generating cost estimates has been possible for close to 10 years. It’s done through your clearinghouse and practice management software by entering the CPT codes and diagnosis codes, along with the patient’s information. Save time and avoid tying staff up on hold.
According to the Navicure Patient Payment Check-Up survey,8 75% of provider organizations are able to provide a cost estimate upon request. It makes good business sense.
4. Collect a pre-treatment or pre-surgery scheduling deposit. In the KarenZupko & Associates/American Academy of Orthopaedic Surgeons (AAOS) pre-course survey of those attending the 2017 coding and reimbursement workshops, 55% of orthopedic practices reported that they have instituted such a practice. With the proliferation of HDHPs, asking for a scheduling deposit is fast becoming a must for all surgeons.
5. Offer patients a healthcare financing option through a third party. In response to another pre-course survey question, about offering CareCredit or another healthcare credit card, 28% of orthopedic practices say they do. Still, that leaves >70% of the orthopedic patients without a financing option. Given the reality of high deductible HDHPs and the patient responsibilities going uncollected, it’s time surgeons take a look at financing. It’s a fool’s wish to believe the practice is “saving” the service fee by sending dozens of statements, having staff make calls, and ultimately writing off unpaid balances as uncollectible.
Practices that fail to change, will fail to prosper. Those who have technology-phobic staff will suffer as healthcare continues to automate. Practices led by surgeons like one recently interviewed who said, “If patients knew how much it cost, they’d never schedule” will see patient accounts receivable soar and patient online ratings sink. The first quarter of 2018 means the number of patients with HDHPs will increase and that deductibles will have to be met. It’s wise to have a full staff meeting, share the facts, and put an action plan in place.
1. Gooch K. Why patients delay medical payments: 12 findings. Becker’s ASC. https://www.beckershospitalreview.com/finance/why-patients-delay-medical-payments-12-findings.html. Published August 28, 2017.
2. Murphy HL. You think your health insurance costs too much. Try being a farmer. Crain’s Chicago Business. http://www.chicagobusiness.com/article/20170929/ISSUE01/170929835. Published September 29, 2017. Accessed October 2, 2017.
3. 2017 Employer Health Benefits Survey. The Henry J. Kaiser Family Foundation and the Health Research & Educational Trust (HRET). https://www.kff.org/health-costs/report/2017-employer-health-benefits-survey/. Published September 19, 2017.
4. Minimizing Bad Debt: Point-of-Service Collections. The Advisory Board Company. https://www.advisory.com/-/media/Advisory-com/Research/FLC/Resources/2015/CFO-Brief-POS.pdf. Published August 21, 2015.
5. Optimizing Revenue: Solving Healthcare’s Revenue Cycle Challenges Using Technology-Enabled Communications. West Corporation. https://cdn2.hubspot.net/hubfs/402746/Assets/West%20Assets/Optimizing%20Revenue%20Report/Reports%20and%20Handouts/WEST-Optimizing%20Revenue%20Report%20final.pdf?t=1508789915319. Accessed October 26, 2017.
6. Peckham C. Medscape Orthopedist Compensation Report 2016. Medscape. https://www.medscape.com/features/slideshow/compensation/2016/orthopedics. Published April 1, 2016.
7. Ubel PA, Abernathy AP, Zafar SY. Full disclosure - out-of-pocket costs as side effects. N Engl J. Med. 2013;369:1484-1486. doi:10.1056/NEJMp1306826.
8. Patient Payment Check-Up 2017. Navicure. http://info.navicure.com/rs/669-OIJ-380/images/Navicure-Survey-Report-2017-Patient-Payment-Check-Up.pdf?mkt_tok=eyJpIjoiTVdKak1HUmhObVV6WkRVeSIsInQiOiJRcFNyRGVrOXlTS0pjalwvWEw3c2s1UmRMRHJVXC9EQzRkSnBkWCs0S2FEbUt3Z1I1a2Y3d1BBY3FKY0I1QWpEdkJRWU9ibmFlUlpnYVRIbVJMcStTVmdkRVwvSTJzcHE1cDVTajBRM3B1Q25lbDQwamViWnMwWGd1c1QzVk1cL2hYdkYifQ%3D%3D. Accessed October 26, 2017.
If you missed the recent headlines, Why Patients Delay Medical Payments: 12 findings 1 and You think your health insurance costs too much. Try being a farmer.2, you may not be too worried about your ever-rising accounts receivables. But you should be.
The facts in these stories and the 2017 Employer Health Benefits Survey,3 released on September 19 by the non-partisan Kaiser Family Foundation and Health Research & Educational Trust (HRET), are alarming. Let’s look at some of the survey results.
Since 2007, the average family premium has increased 55% and the average worker contribution toward the premium has increased 74%.3 How does that translate into dollars and cents? Well, the average annual premiums this year are $6690 for single coverage and $18,764 for family coverage.
What does that mean exactly to the farm couple in the Crain’s story? The farmer who “will be lucky to net $75,000” on his hay crop this year has a policy premium with Blue Cross Blue Shield of Illinois that was $22,000 last year. And then there is a $5000 deductible for each him and his wife. Do the math: it means they’d spend 43% of their income before health insurance covers anything.
Do premiums vary significantly by firm size or region? Should surgeons in certain areas of the country be less concerned about these trends? No, the premiums don’t significantly vary by size or region.
The point here is not to write an essay about health insurance premiums, but rather to discuss what this economic reality means to patients who are seeing you tomorrow, next week, and next month. Given these economic realities, what is their attitude about your bill?
For insight, let’s look at an Advisory Board Company brief, “Minimizing Bad Debt: Point-of-Service Collections,”4 which states: “Patient propensity to pay decreases as patient obligation increases.” According to the brief, “Our analysis indicates that as the dollar value of a patient’s obligation increases, their propensity to pay any portion of the obligation decreases—for all patients, at all income levels.” See Figure 1.
Given that market statistics show that more than a quarter of the commercially insured patients are covered by high deductible health plans (HDHPs), your practice must adapt to these changing times.
Review Your Pay or Mix
Smart practice administrators will keep their finger on the pulse of the insurance local market as more employers move toward offering HDHPs or health savings accounts. Knowing what the largest manufacturers are offering, along with local hospitals that are typically sizable employers in most communities, is critical. The coverage for school systems, police departments, fire departments, and governments should also be the practice radar.
A recent West Corporation survey5 reveals more about the demographic profile of patients who are less likely to pay or delay payments. Their study shows that 79% of patients cite affordability as the largest healthcare problem with 93% of patients saying it costs too much. So it should be no surprise that 67% say their financial situation makes it challenging to submit timely payments. If you are not familiar with the company name, you’ll be familiar with West Corporation’s products, like Televox, which are automated tools used by practices to remind patients about appointments and copays.
Here are other relevant findings from the West Corporation survey:
- 56% delay payments of medical bills at least some of the time.
- 70% of millennials have missed medical payment deadlines.
- 42% of patients cite their HDHP as the reason for delaying their payments.
- 36% of patients said they have difficulty remembering to make timely medical payments.
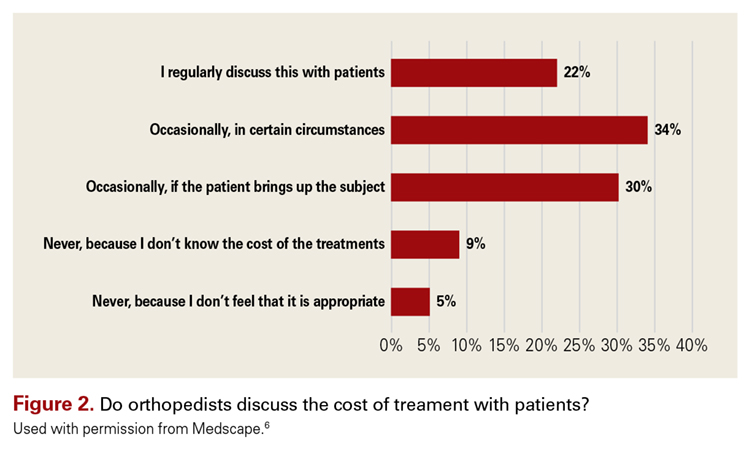
It’s no surprise that orthopedic surgeons are not discussing fees with patients. Although only 9% admitted that they don’t discuss costs with patients, it is safe to estimate that few surgeons have their fee schedules memorized.
In a 2013 article, Ubel and colleagues7 said, “Because treatments can be ‘financially toxic,’ physicians need to disclose the financial consequences of treatment alternatives just as they inform patients about treatments’ side effects.”
While uniquely qualified to discuss treatment options, few orthopedic surgeons have the time or the facts to personally discuss fees, out-of-pocket expenses, uncovered services and payment plans. Detailed discussions about patients’ financial liabilities are better done by qualified staff, who verify benefits and use modern technology tools to generate an electronic “estimate of costs and benefits.”
Target Your Efforts
What steps can your practice take to help patients pay their portion, even when it’s large, as well as help your practice reduce receivables and avoid collection problems and bad debt write-offs?
Start by analyzing the top Current Procedural Terminology (CPT) codes with patient responsibility, so you can focus your efforts. One such analysis, conducted by our firm, is shown in Figure 3. Although you might think the highest percent of patient financial responsibilities are for surgical procedures, notice that 4 of the top 5 services this practice identified as having the highest amount of patient collectible dollars are rendered in the office-carpal tunnel surgery being the only exception.
Take Action
After conducting a thorough analysis and reviewing the results, here are 5 actionable steps your practice could take:
1. Make sure your patient portal has the capacity to take patient payments. Offering online payment options increases the opportunity for patients to pay. Promote this option on the patient statement.
2. Implement a system of collecting from patients before they leave the office. After a new visit, which involves a more expensive evaluation and management code, and possibly imaging and durable medical device, counsel patients to leave a credit card on file, so the minute insurance pays, their credit card can be charged.
The 2017 Navicure Patient Payment Check-Up survey8 conducted by Healthcare Information and Management Systems Society (HIMSS) Analytics shows that 78% of patients would provide a card to be charged for one time up to $200. Think about the previously illustrated collection amounts this would alleviate.
3. Provide all surgery patients with a cost estimate. Generating cost estimates has been possible for close to 10 years. It’s done through your clearinghouse and practice management software by entering the CPT codes and diagnosis codes, along with the patient’s information. Save time and avoid tying staff up on hold.
According to the Navicure Patient Payment Check-Up survey,8 75% of provider organizations are able to provide a cost estimate upon request. It makes good business sense.
4. Collect a pre-treatment or pre-surgery scheduling deposit. In the KarenZupko & Associates/American Academy of Orthopaedic Surgeons (AAOS) pre-course survey of those attending the 2017 coding and reimbursement workshops, 55% of orthopedic practices reported that they have instituted such a practice. With the proliferation of HDHPs, asking for a scheduling deposit is fast becoming a must for all surgeons.
5. Offer patients a healthcare financing option through a third party. In response to another pre-course survey question, about offering CareCredit or another healthcare credit card, 28% of orthopedic practices say they do. Still, that leaves >70% of the orthopedic patients without a financing option. Given the reality of high deductible HDHPs and the patient responsibilities going uncollected, it’s time surgeons take a look at financing. It’s a fool’s wish to believe the practice is “saving” the service fee by sending dozens of statements, having staff make calls, and ultimately writing off unpaid balances as uncollectible.
Practices that fail to change, will fail to prosper. Those who have technology-phobic staff will suffer as healthcare continues to automate. Practices led by surgeons like one recently interviewed who said, “If patients knew how much it cost, they’d never schedule” will see patient accounts receivable soar and patient online ratings sink. The first quarter of 2018 means the number of patients with HDHPs will increase and that deductibles will have to be met. It’s wise to have a full staff meeting, share the facts, and put an action plan in place.
If you missed the recent headlines, Why Patients Delay Medical Payments: 12 findings 1 and You think your health insurance costs too much. Try being a farmer.2, you may not be too worried about your ever-rising accounts receivables. But you should be.
The facts in these stories and the 2017 Employer Health Benefits Survey,3 released on September 19 by the non-partisan Kaiser Family Foundation and Health Research & Educational Trust (HRET), are alarming. Let’s look at some of the survey results.
Since 2007, the average family premium has increased 55% and the average worker contribution toward the premium has increased 74%.3 How does that translate into dollars and cents? Well, the average annual premiums this year are $6690 for single coverage and $18,764 for family coverage.
What does that mean exactly to the farm couple in the Crain’s story? The farmer who “will be lucky to net $75,000” on his hay crop this year has a policy premium with Blue Cross Blue Shield of Illinois that was $22,000 last year. And then there is a $5000 deductible for each him and his wife. Do the math: it means they’d spend 43% of their income before health insurance covers anything.
Do premiums vary significantly by firm size or region? Should surgeons in certain areas of the country be less concerned about these trends? No, the premiums don’t significantly vary by size or region.
The point here is not to write an essay about health insurance premiums, but rather to discuss what this economic reality means to patients who are seeing you tomorrow, next week, and next month. Given these economic realities, what is their attitude about your bill?
For insight, let’s look at an Advisory Board Company brief, “Minimizing Bad Debt: Point-of-Service Collections,”4 which states: “Patient propensity to pay decreases as patient obligation increases.” According to the brief, “Our analysis indicates that as the dollar value of a patient’s obligation increases, their propensity to pay any portion of the obligation decreases—for all patients, at all income levels.” See Figure 1.
Given that market statistics show that more than a quarter of the commercially insured patients are covered by high deductible health plans (HDHPs), your practice must adapt to these changing times.
Review Your Pay or Mix
Smart practice administrators will keep their finger on the pulse of the insurance local market as more employers move toward offering HDHPs or health savings accounts. Knowing what the largest manufacturers are offering, along with local hospitals that are typically sizable employers in most communities, is critical. The coverage for school systems, police departments, fire departments, and governments should also be the practice radar.
A recent West Corporation survey5 reveals more about the demographic profile of patients who are less likely to pay or delay payments. Their study shows that 79% of patients cite affordability as the largest healthcare problem with 93% of patients saying it costs too much. So it should be no surprise that 67% say their financial situation makes it challenging to submit timely payments. If you are not familiar with the company name, you’ll be familiar with West Corporation’s products, like Televox, which are automated tools used by practices to remind patients about appointments and copays.
Here are other relevant findings from the West Corporation survey:
- 56% delay payments of medical bills at least some of the time.
- 70% of millennials have missed medical payment deadlines.
- 42% of patients cite their HDHP as the reason for delaying their payments.
- 36% of patients said they have difficulty remembering to make timely medical payments.
It’s no surprise that orthopedic surgeons are not discussing fees with patients. Although only 9% admitted that they don’t discuss costs with patients, it is safe to estimate that few surgeons have their fee schedules memorized.
In a 2013 article, Ubel and colleagues7 said, “Because treatments can be ‘financially toxic,’ physicians need to disclose the financial consequences of treatment alternatives just as they inform patients about treatments’ side effects.”
While uniquely qualified to discuss treatment options, few orthopedic surgeons have the time or the facts to personally discuss fees, out-of-pocket expenses, uncovered services and payment plans. Detailed discussions about patients’ financial liabilities are better done by qualified staff, who verify benefits and use modern technology tools to generate an electronic “estimate of costs and benefits.”
Target Your Efforts
What steps can your practice take to help patients pay their portion, even when it’s large, as well as help your practice reduce receivables and avoid collection problems and bad debt write-offs?
Start by analyzing the top Current Procedural Terminology (CPT) codes with patient responsibility, so you can focus your efforts. One such analysis, conducted by our firm, is shown in Figure 3. Although you might think the highest percent of patient financial responsibilities are for surgical procedures, notice that 4 of the top 5 services this practice identified as having the highest amount of patient collectible dollars are rendered in the office-carpal tunnel surgery being the only exception.
Take Action
After conducting a thorough analysis and reviewing the results, here are 5 actionable steps your practice could take:
1. Make sure your patient portal has the capacity to take patient payments. Offering online payment options increases the opportunity for patients to pay. Promote this option on the patient statement.
2. Implement a system of collecting from patients before they leave the office. After a new visit, which involves a more expensive evaluation and management code, and possibly imaging and durable medical device, counsel patients to leave a credit card on file, so the minute insurance pays, their credit card can be charged.
The 2017 Navicure Patient Payment Check-Up survey8 conducted by Healthcare Information and Management Systems Society (HIMSS) Analytics shows that 78% of patients would provide a card to be charged for one time up to $200. Think about the previously illustrated collection amounts this would alleviate.
3. Provide all surgery patients with a cost estimate. Generating cost estimates has been possible for close to 10 years. It’s done through your clearinghouse and practice management software by entering the CPT codes and diagnosis codes, along with the patient’s information. Save time and avoid tying staff up on hold.
According to the Navicure Patient Payment Check-Up survey,8 75% of provider organizations are able to provide a cost estimate upon request. It makes good business sense.
4. Collect a pre-treatment or pre-surgery scheduling deposit. In the KarenZupko & Associates/American Academy of Orthopaedic Surgeons (AAOS) pre-course survey of those attending the 2017 coding and reimbursement workshops, 55% of orthopedic practices reported that they have instituted such a practice. With the proliferation of HDHPs, asking for a scheduling deposit is fast becoming a must for all surgeons.
5. Offer patients a healthcare financing option through a third party. In response to another pre-course survey question, about offering CareCredit or another healthcare credit card, 28% of orthopedic practices say they do. Still, that leaves >70% of the orthopedic patients without a financing option. Given the reality of high deductible HDHPs and the patient responsibilities going uncollected, it’s time surgeons take a look at financing. It’s a fool’s wish to believe the practice is “saving” the service fee by sending dozens of statements, having staff make calls, and ultimately writing off unpaid balances as uncollectible.
Practices that fail to change, will fail to prosper. Those who have technology-phobic staff will suffer as healthcare continues to automate. Practices led by surgeons like one recently interviewed who said, “If patients knew how much it cost, they’d never schedule” will see patient accounts receivable soar and patient online ratings sink. The first quarter of 2018 means the number of patients with HDHPs will increase and that deductibles will have to be met. It’s wise to have a full staff meeting, share the facts, and put an action plan in place.
1. Gooch K. Why patients delay medical payments: 12 findings. Becker’s ASC. https://www.beckershospitalreview.com/finance/why-patients-delay-medical-payments-12-findings.html. Published August 28, 2017.
2. Murphy HL. You think your health insurance costs too much. Try being a farmer. Crain’s Chicago Business. http://www.chicagobusiness.com/article/20170929/ISSUE01/170929835. Published September 29, 2017. Accessed October 2, 2017.
3. 2017 Employer Health Benefits Survey. The Henry J. Kaiser Family Foundation and the Health Research & Educational Trust (HRET). https://www.kff.org/health-costs/report/2017-employer-health-benefits-survey/. Published September 19, 2017.
4. Minimizing Bad Debt: Point-of-Service Collections. The Advisory Board Company. https://www.advisory.com/-/media/Advisory-com/Research/FLC/Resources/2015/CFO-Brief-POS.pdf. Published August 21, 2015.
5. Optimizing Revenue: Solving Healthcare’s Revenue Cycle Challenges Using Technology-Enabled Communications. West Corporation. https://cdn2.hubspot.net/hubfs/402746/Assets/West%20Assets/Optimizing%20Revenue%20Report/Reports%20and%20Handouts/WEST-Optimizing%20Revenue%20Report%20final.pdf?t=1508789915319. Accessed October 26, 2017.
6. Peckham C. Medscape Orthopedist Compensation Report 2016. Medscape. https://www.medscape.com/features/slideshow/compensation/2016/orthopedics. Published April 1, 2016.
7. Ubel PA, Abernathy AP, Zafar SY. Full disclosure - out-of-pocket costs as side effects. N Engl J. Med. 2013;369:1484-1486. doi:10.1056/NEJMp1306826.
8. Patient Payment Check-Up 2017. Navicure. http://info.navicure.com/rs/669-OIJ-380/images/Navicure-Survey-Report-2017-Patient-Payment-Check-Up.pdf?mkt_tok=eyJpIjoiTVdKak1HUmhObVV6WkRVeSIsInQiOiJRcFNyRGVrOXlTS0pjalwvWEw3c2s1UmRMRHJVXC9EQzRkSnBkWCs0S2FEbUt3Z1I1a2Y3d1BBY3FKY0I1QWpEdkJRWU9ibmFlUlpnYVRIbVJMcStTVmdkRVwvSTJzcHE1cDVTajBRM3B1Q25lbDQwamViWnMwWGd1c1QzVk1cL2hYdkYifQ%3D%3D. Accessed October 26, 2017.
Patella Alta: A Comprehensive Review of Current Knowledge
Take-Home Points
- Patella alta has a reduced articular area of PF contact.
- Presence of patella alta depends on the measurement method.
- Patella alta is defined as ISI >1.2 and CDI >1.2 to >1.3.
- On sagittal MRI, PTI is used most often with cutoff values of <0.125 to 0.28.
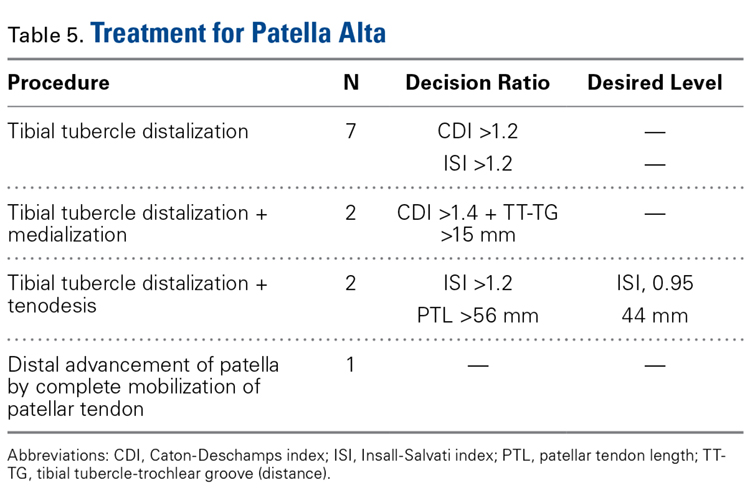
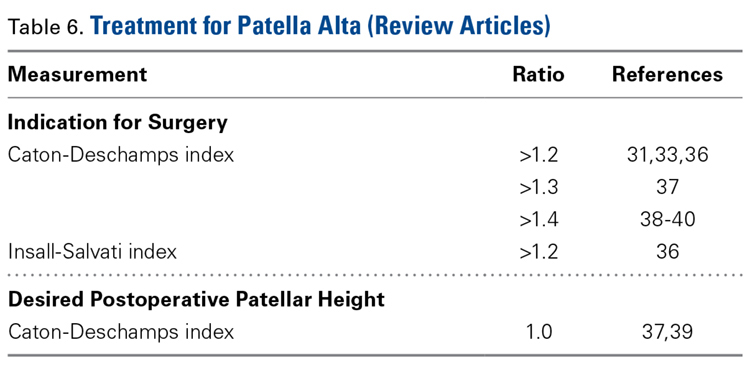
- Tibial tubercle distalization is most often used to treat patella alta. The desired postoperative patellar height is a CDI of 1.0.
Patella alta is a patella that rides abnormally high in relation to the femur, the femoral trochlea, or the tibia,1 with decreased bony stability requiring increased knee flexion angles to engage the trochlea.2,3 An abnormally high patella may therefore insufficiently engage the proximal trochlea groove both in extension and in the early phase of knee flexion—making it one of the potential risk factors for patellar instability.4-10 Accordingly, patella alta is present in 30% of patients with recurrent patellar dislocation.11 It also occurs in other disorders, such as knee extensor apparatus disorders, in patients with patellofemoral (PF) pain, chondromalacia, Sinding-Larsen-Johansson disease, Osgood-Schlatter disease, patellar tendinopathy, and osteoarthritis.1,7,8,12-18 As such, patella alta represents an important predisposing factor for patellar malalignment and PF-related complaints. On the other hand, patella alta may also be a normal variant of a person’s knee anatomy and may be well tolerated when not combined with other instability factors.4
Despite the importance of patella alta, there is no consensus on a precise definition, the most reliable measurement method, or the factors thought to be important in clinical decisions regarding treatment. To address this issue, we systematically reviewed the patella alta literature for definitions, the most common measurement methods and their patella alta cutoff values, and cutoff values for surgical correction and proposed surgical techniques.
Methods
In February 2017, using the term patella alta, we performed a systematic literature search on PubMed. Inclusion criteria were original study or review articles, publication in peer-reviewed English-language journals between 2000 and 2017, and narrative description or measurement of human patellar height on plain radiographs or magnetic resonance imaging (MRI). Excluded were abstracts and articles in languages other than English; animal and computational/biomechanical studies; case reports; and knee arthroplasties, knee extensor ruptures, and hereditary and congenital diseases. All evidence levels were included.
We assessed measurement methods, reported cutoff values for patella alta, cutoff values for performing surgical correction, proposed surgical techniques, and postoperative target values. Original study articles and review articles were analyzed separately.
Results
Of 211 articles identified, 92 met the inclusion criteria for original study, and 28 for review. All their abstracts were reviewed, and 91 were excluded: 17 for language other than English, 11 for animal study, 12 for biomechanical/computational study, 20 for case report, 8 for arthroplasty, 13 for hereditary or congenital disease, 1 for extensor apparatus rupture, 3 for editorial letter, and 6 for other reasons. Full text copies of all included articles were obtained and reviewed.
Original Study Articles
Definition. Of the 92 original study articles, 17 (18.5%) defined patella alta by description alone, and 75 (81.5%) used imaging-based measurements. Patella alta was described as a patella that rides abnormally high in relation to the trochlear groove, with a reduced articular area of PF contact1,15,19-21 or decreased patella–trochlea cartilage overlap.22 With this reduced contact area, there is increased PF stress.21
With radiographic measurements, patella alta is defined as a Caton-Deschamps index (CDI) of >1.2 to >1.3, an Insall-Salvati index (ISI) of >1.2, a Blackburne-Peel index (PBI) of >1.0,4,15,18,23-25 and a patellotrochlear index (PTI) of <0.125 to 0.28.6,26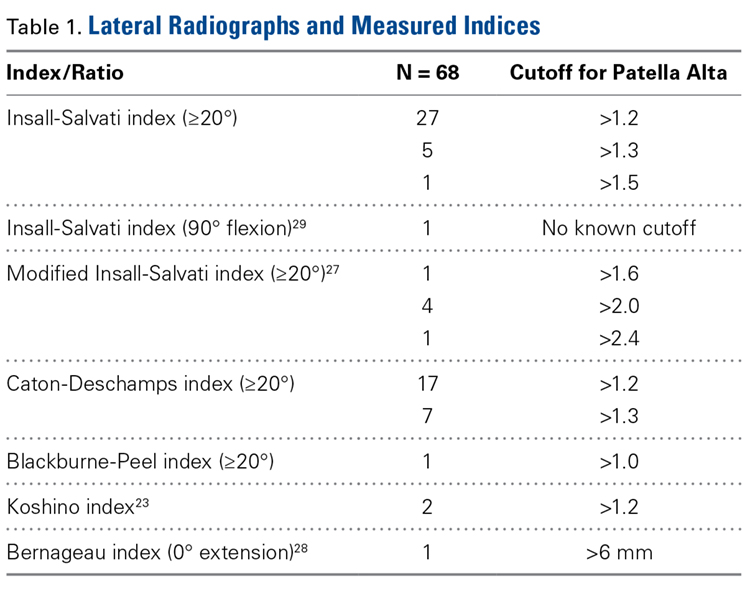
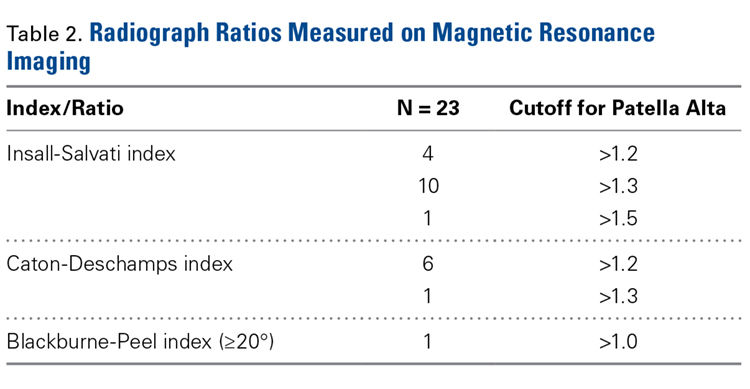
On lateral radiographs, ISI was the most common measurement (33 studies), with patella alta cutoff values ranging from >1.2 to >1.5. The second most common measurement was CDI (24 studies), with cutoff values of >1.2 to >1.3. Other indices, such as the modified ISI (6 studies), the BPI (1 study), and the Koshino index (2 studies), had their cutoff values used more consistently (>1.6 to >2.4, >1.0, and >1.2, respectively) but these indices were rarely reported in the literature (Table 1).27,28,29
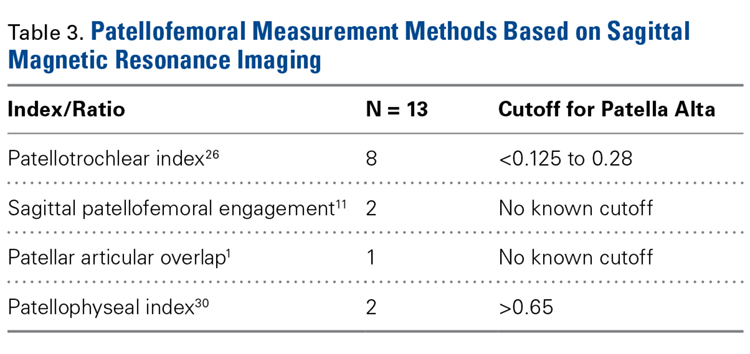
Thirty-six studies defined patella alta with MRI using either the aforementioned radiographic ratios (23 studies, 3 indices, Table 2) or PF indices (13 studies, 4 methods, Table 3).30
On sagittal MRI, PTI was used most often; cutoff values were <0.125 to 0.28.
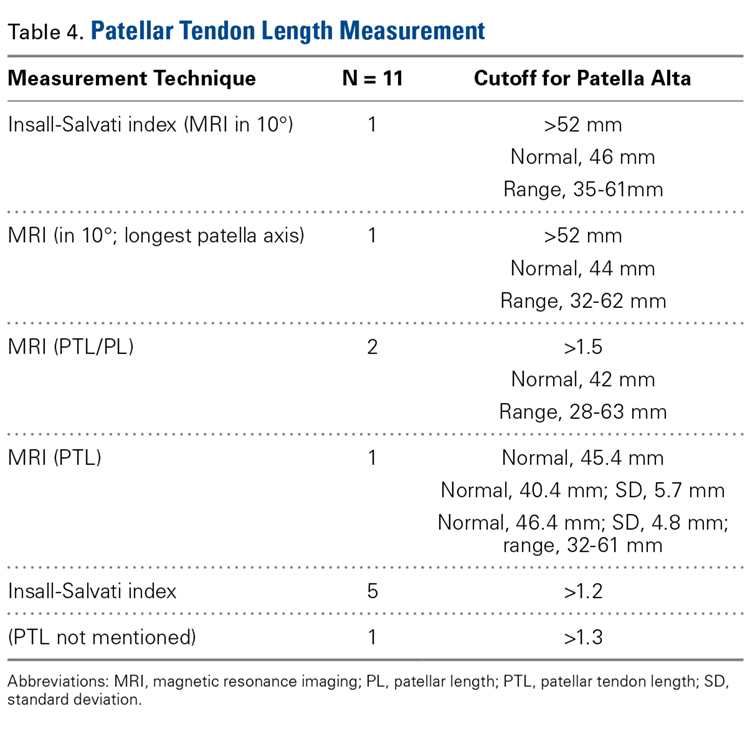
Thirteen studies defined patella alta with PTL: 5 using lateral conventional radiographs and 8 using sagittal MRI. For each type of imaging, the cutoff value was >52 mm to >56 mm. PTL was measured either independently or together with ISI on sagittal MRI (Table 4).
Review Articles
Twenty-eight review articles met the inclusion criteria.35-40 Patella alta was described mostly with ISI (75%) or CDI (64%). In up to 57% of these articles, a patella alta reference value was missing. Only 1 article mentioned different cutoff values for conventional radiographs and MRI. BPI was mentioned in 50% of studies, but only 2 indicated a cutoff value for patella alta. Eleven percent used PTI on sagittal MRI and took patella–trochlea cartilage overlap into account.
Eight review articles mentioned cutoff values for surgical correction. Only 1 of 4 articles mentioned a cutoff value for correcting patella alta in PF instability, and only 2 articles suggested an ideal postoperative patellar height (Table 6).
No review article relied on PTL to describe patella alta or to advise surgical treatment.
Discussion
Our review revealed many variations in patella alta definitions and descriptions, measurement methods, cutoff values, and treatment options. Interpretation of patellar height and, particularly, patella alta is very heterogeneous. Accordingly, comparing surgical indications, surgical treatment options, and outcomes across studies can be difficult.
Measurement Methods
Radiographs. Conventional radiographs were used to describe patella alta in two-thirds of the original study articles. The most common measurement methods marked the position of the patella relative to either the femur (direct assessment) or the tibia (indirect assessment).14,25 All established measurement methods use lateral radiographs, which do not show articular cartilage.11,14 Therefore, lateral radiograph ratios of different and variable bony landmarks do not measure actual PF articular congruence. The widely variable morphologies of patella (distal patellar nose, different articulating surface), femoral trochlea (facet in height and length), proximal tibia (inherited or acquired deformities on tibial tubercle), and slope are all confounding factors that may affect measurement (Figure 1). In addition, specific variations in PF joint morphology (eg, small patellar articular surface, short trochlea) are not well represented by these ratios.11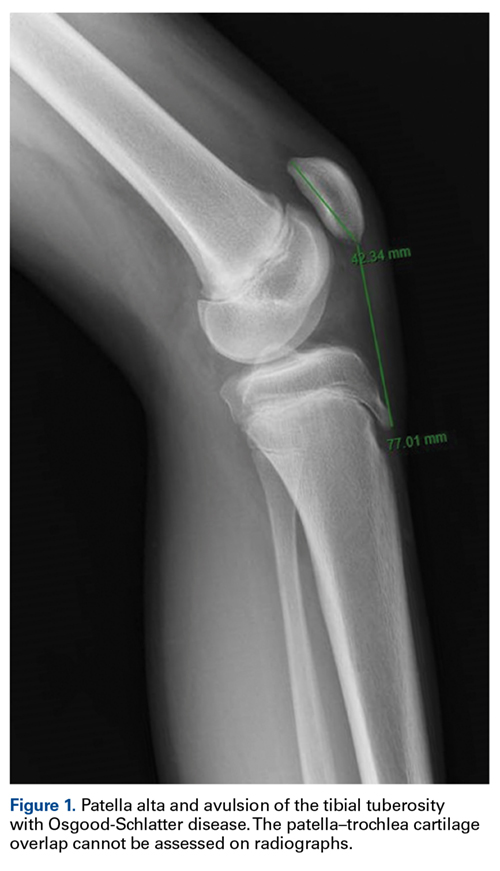
All these methods have advantages, limitations, and different values of interobserver and intraobserver variability, reliability, and reproducibility (Table 7).29,41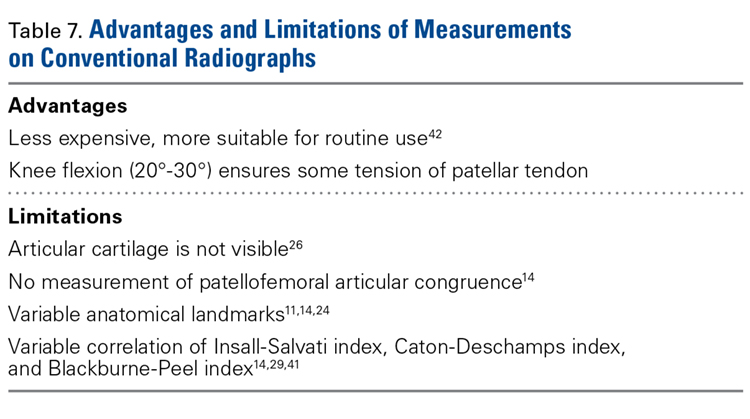
Determination of both patellar height and patella alta depends on the measurement method used and is significantly affected by anatomical variants, such as extra-articular patella and femorotibial landmarks.
The ISI method is most commonly used because it does not depend on degree of knee flexion, is thought to measure the relative length of the patellar tendon the best,5 and has established MRI criteria.6 However, ISI has limitations: Its distal bony landmark is the tibial tuberosity, which can be difficult to assess14; the shape of the patella (mainly its inferior point) varies42; and the measurement does not change after distalization of the tibial tubercle.5
CDI is the most accurate diagnostic method because it relies on readily identifiable and reproducible anatomical landmarks; does not depend on radiograph quality, knee size, radiologic enlargement, or position of the tibial tubercle or patellar modification; and is unaffected by degree of knee flexion between 10° and 80°.38,43 CDI is the method that is most useful in describing patellar height after distalization of the tibial tubercle because it assesses the height of the patella relative to the tibial plateau.5 CDI is limited with respect to clear identification of the patellar and tibial articular margin.37
BPI has the lowest interobserver variability and discriminates best among patella alta, norma, and infera.41 Like CDI, BPI assesses patellar height relative to the tibial plateau, and thus is useful in describing patellar height after distalization of the tibial tubercle.5 BPI is limited in that it uses a line drawn along the tibial plateau, where variations in inclination and tibial slope produce inaccuracies,14 and depends highly on projection angles. Clinically, BPI is rarely used.
As the literature shows, the radiologic methods of determining patellar height are variable and unreliable and depend on the ratio used.26,41 These methods do not reveal precise information about the PF articular congruence, the key finding for necessary treatment.
Radiographic Indices on MRI. Some studies measured radiographic indices on sagittal MRI. Radiologic and MRI measurements are described as not significantly different or slightly different, and 0.09 to 0.13 needs to be added with ISI and BP ratios on radiographs, MRI, and computed tomography (CT).17,44-47 ISI is commonly used, and its clinical application is easy. Although classically measured on plain radiographs, ISI is reliably measured on MRI as well.17,30 The traditional 1.2 threshold for defining patella alta was used by Charles and colleagues.44 CDI is equally well measured on radiographs and MRI.47
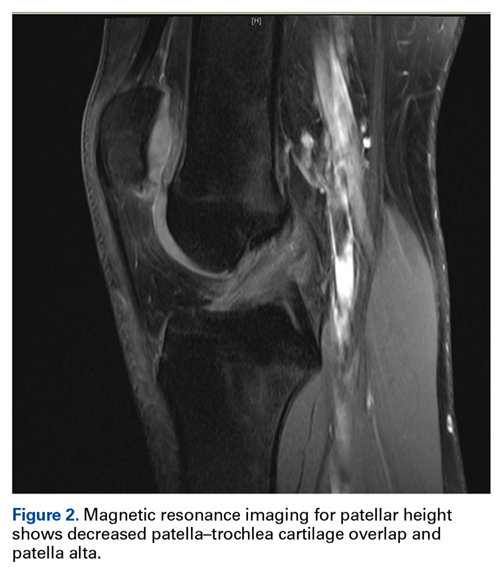
According to the literature, 3 different measurement methods have been used to describe degree of patella–trochlea cartilage overlap: PTI, sagittal patellofemoral engagement (SPE), and patellar articular overlap (PAO).1,11,26
PTI uses the true articular cartilage patella–trochlea relationship for measurement of patellar height on sagittal MRI in extension (Figure 3). If the patellar tendon is fully out to length (no laxity), PTI reliably and precisely determines the exact articular correlation of PF joint and patellar height.6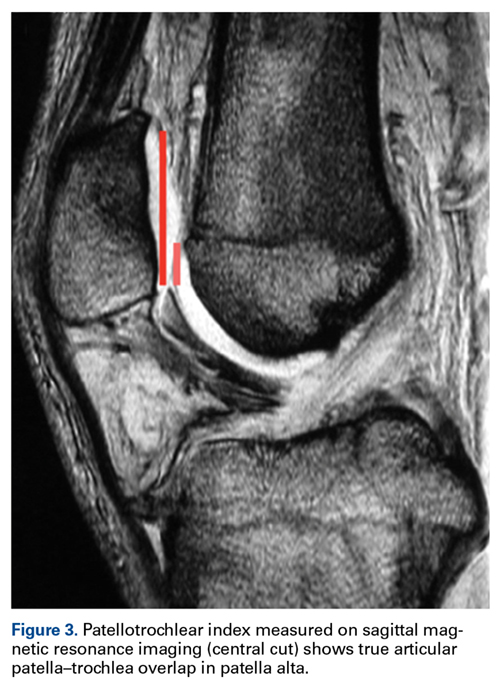
SPE is similar to percentage of articular coverage.1,11 Patellar overlap of the trochlea is measured on 2 different sagittal MRI images: 1 with the greatest length of patellar cartilage and 1 with the greatest length of femoral trochlear cartilage. This measurement did not correlate with CDI.1 SPE was not evaluated in control studies, and normal and pathologic values are unavailable.
PAO is measured with patients positioned at rest and in standard knee coils.1 MRI was not obtained in full extension or with quadriceps activation, and knee flexion angle values are unavailable. Total patellar articular length was measured on the sagittal MRI that showed the greatest patellar length and articular cartilage thickness. The same image was used to measure articular overlap, or the length of patellar cartilage overlying the trochlear cartilage, as measured parallel to the subchondral surface of the patella. PAO correlates well with conventional patellar height measurements in the sagittal plane and shows promise as a simpler alternative to the conventional indices.1 Normal and pathologic values are unavailable.
So far, PTI is the only method that was controlled in several studies, assessed for its reliability, and compared with other patellar height measurements.6,14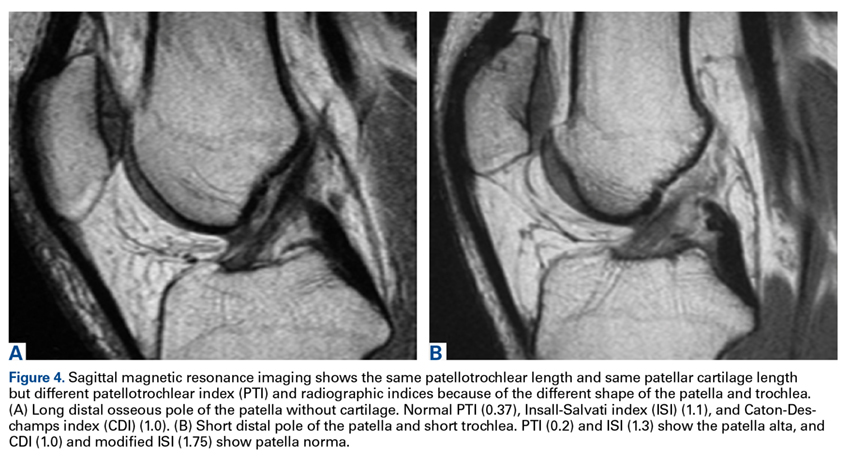
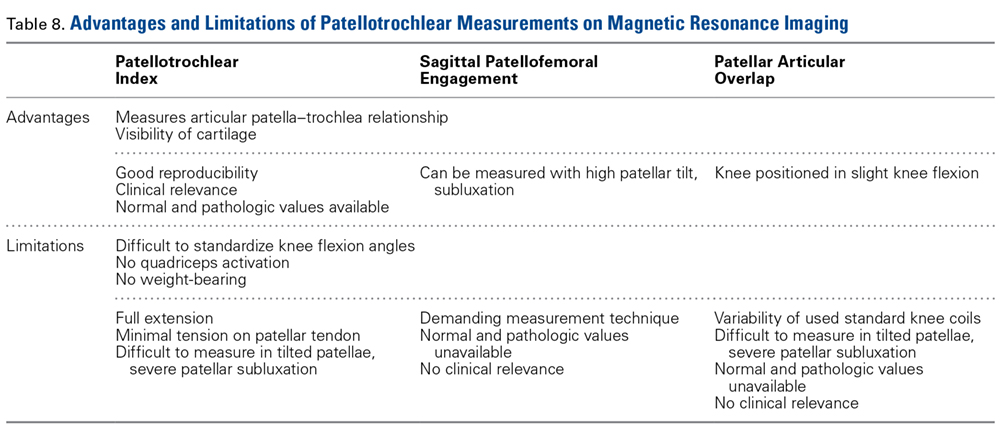
Patellar Tendon Length. PTL can be measured on lateral radiographs or sagittal MRI. Radiologic and MRI measurements are described as not significantly different47 or slightly different, and 0.09 to 0.13 needs to be added with the ISI ratio on radiographs, MRI, and CT.46 PTL is reliably evaluated with ISI.41,50 There is a weak correlation of patient height and PTL: Taller people have normally longer tendons.51-53
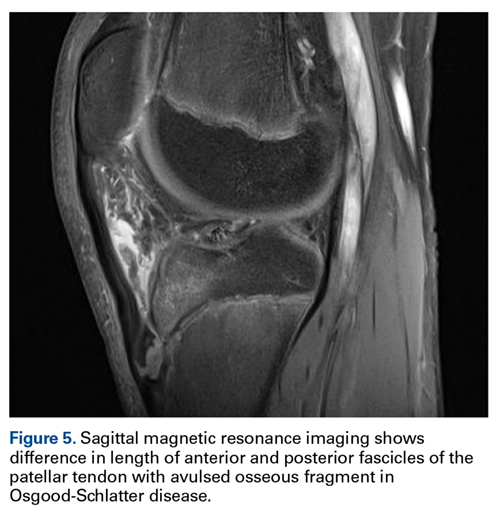
PTL measurements revealed that the posterior surface of the patellar tendon was significantly shorter than the anterior surface. Compared with their corresponding posterior fascicles, anterior fascicles are longer; their attachment is more proximal to the patella and more distal to the tibia. In addition, posterior PTL is significantly shorter with the posterior patellar attachment (adheres to posterior aspect of the inferior patellar pole) than with the anterior attachment (adheres to anterior aspect of the inferior patellar pole).56 Moreover, the lateral and medial fascicles are longer than the central fascicles attaching at the most inferior patellar pole. This issue must be considered in image cut selection (Figures 6A, 6B). Furthermore, type of inferior pole of patella (pointed, intermediate, blunt) is important in measurement.56 Overall, mean (SD) PTL was 54.9 (1.2) mm on the anterior surface and 35.0 (0.6) mm on the posterior surface.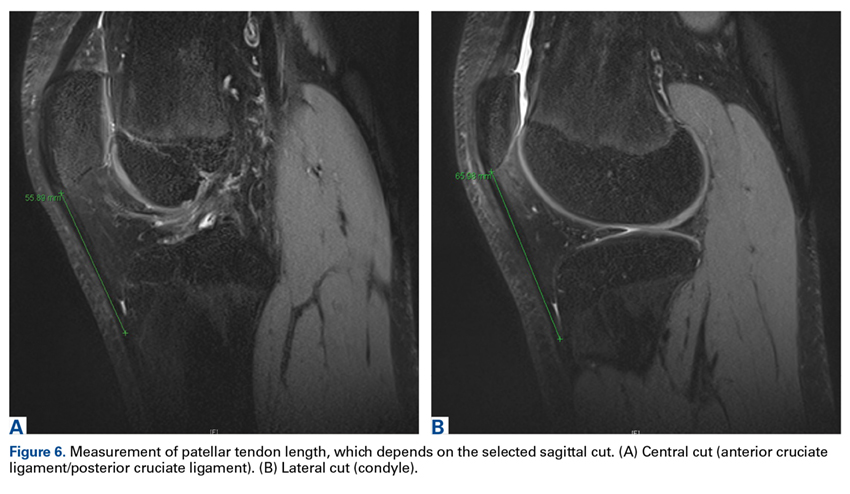
It is important to precisely describe the measurement method and location (sagittal cut) and to consider the shape of the inferior patellar pole and the site of the patellar tendon attachment.56
Treatments. For patella alta, the surgical treatment goals are to increase the PF contact area and improve PF articular congruence, and thereby increase PF stability.31-33 Four different procedures were used to treat patella alta (Table 5), but only 11 of the 92 original study articles and 8 of the 28 review articles included in our review mentioned a specific patellar height that required surgical correction (Tables 5, 6). Recommendations were based on CDI (>1.2 to >1.4) and less often on ISI (>1.2 to >1.4) or PTL (>56 mm).
Tibial tubercle distalization is effective in normalizing patellar height to correct the patellar index in patella alta (Figures 7A, 7B).13,18,38,55,57 Tibial tubercle distalization and patellar tendon tenodesis attached to the original insertion normalize PTL and stabilize the PF joint in patients with patella alta.5,47 In a comparison of these surgical procedures, cartilage stress was lower with distalization than with distalization and tenodesis.13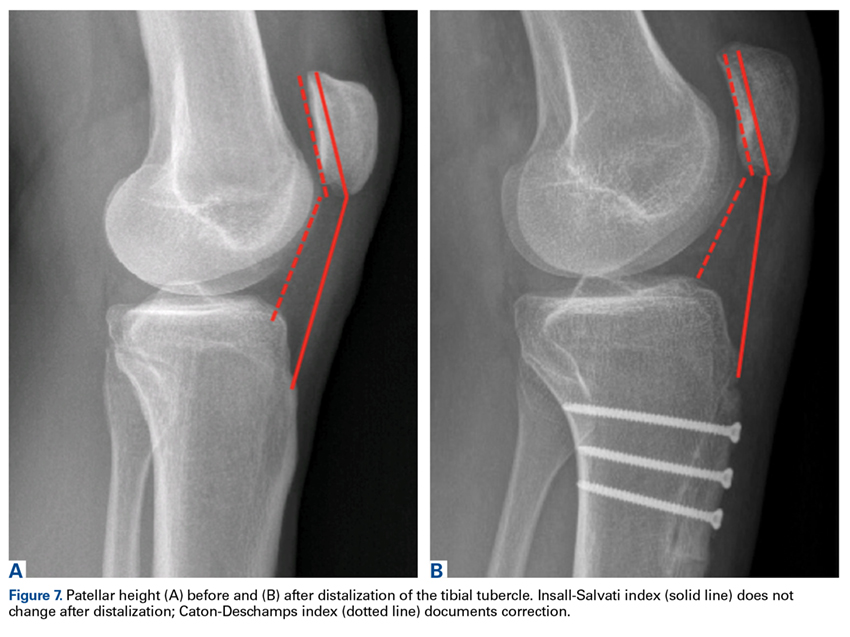
Soft-tissue methods are recommended in children, as bone procedures injure the proximal tibial physis and may cause it to close prematurely.58 The patella can be distally advanced by completely mobilizing the patellar tendon and fixating with sutures through the cartilaginous tibial tubercle. This technique is a satisfactory treatment for skeletally immature patients who present with habitual patellar dislocation associated with patella alta.58,59
CDI and BPI assess patellar height relative to the tibial plateau, and therefore are the most useful measurement methods for patellar height after distalization of the tibial tubercle.5 ISI does not change after distalization of the tibial tubercle and cannot be recommended.5,18 As PF indices (eg, PTI) can trace preoperative and postoperative values, these measurements are valuable.
Controversies
Our review found no consensus on measurement method or cutoff value. No measurement method showed clear clinical or methodologic superiority. Most published patellar height and patella alta data are based on conventional radiographs using a tibial reference point, even though a femoral or even trochlear reference point seems more reproducible, particularly in PF pathologies. Several cutoff values have been reported for each patella alta measurement method. Regarding pathologic thresholds, which might require surgical correction, very little information has been published, and scientific evidence is lacking. Numerous important aspects remain unanswered after this review, and clarification is mandatory.
Five Key Facts
1. In patella alta assessment, different morphologic, biomechanical, and functional aspects must be considered. The most relevant aspect is decreased engagement of the patella and trochlea,4-9,11,26 which results in decreased bony stability in knee extension.1-3 Therefore, patella alta is one of the potential risk factors for patellar instability with a high percentage of recurrent patellar dislocation.4-9 In early knee flexion, the patella translates more distally with better engagement of the patella in the trochlea and better stability. Therefore, measurement in extension, with the patellar tendon out to length, seems to offer a more reliable assessment of the patella–femur relationship.
2. Insufficient engagement of the patella in the trochlea is the most important aspect of patella alta.11 Therefore, direct measurement of this engagement seems logical.
3. As radiographs do not show articular cartilage, they should not be used to assess the articular patella–femur relationship.11,14,26 Patella–trochlea cartilage overlap is the most relevant factor for patella alta and should be measured on MRI.6,14,26,32
4. PTL is an important factor for patellar height and particularly patella alta. The range of normal PTL values is wide: 35 mm to 61 mm. The described cutoff values for patella alta (>52 mm to >56 mm) fall within this normal range. The cause may be the different measurement methods used.33,47,59-61 Therefore, for precise diagnostics, a standardized measurement method that includes the selected cut imaging is mandatory.
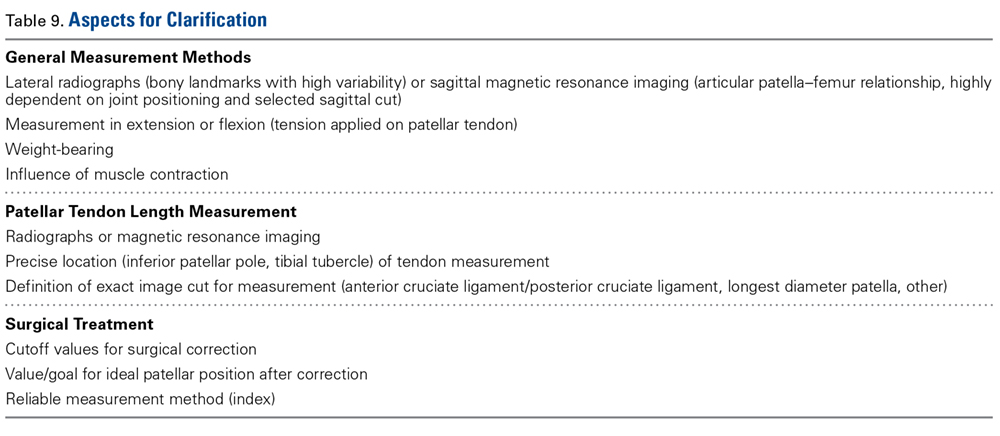
Many important aspects remain unanswered, and clarification is mandatory (Table 9).
Conclusion
Our review revealed many variations in patella alta definitions and descriptions, measurement methods, cutoff values, and treatment options. Presence of patella alta depends on measurement method used. Methods cannot be used interchangeably, and they all have their advantages and limitations. Unfortunately, there is no generally accepted consensus on measurement method, patella alta cutoff value, or treatment with ideal correction. Treatment planning and outcomes assessment require clarification of these many issues.
1 Munch JL, Sullivan JP, Nguyen JT, et al. Patellar articular overlap on MRI is a simple alternative to conventional measurements of patellar height. Orthop J Sports Med. 2016;4(7):2325967116656328.
2. Elias JJ, Soehnlen NT, Guseila LM, Cosgarea AJ. Dynamic tracking influenced by anatomy in patellar instability. Knee. 2016;23(3):450-455.
3. Fabricant PD, Ladenhauf HN, Salvati EA, Green DW. Medial patellofemoral ligament (MPFL) reconstruction improves radiographic measures of patella alta in children. Knee. 2014;21(6):1180-1184.
4. Askenberger M, Janarv PM, Finnbogason T, Arendt EA. Morphology and anatomic patellar instability risk factors in first-time traumatic lateral patellar dislocations. Am J Sports Med. 2017;45(1):50-58.
5. Mayer C, Magnussen RA, Servien E, et al. Patellar tendon tenodesis in association with tibial tubercle distalization for the treatment of episodic patellar dislocation with patella alta. Am J Sports Med. 2012;40(2):346-351.
6. Ali SA, Helmer R, Terk MR. Patella alta: lack of correlation between patellotrochlear cartilage congruence and commonly used patellar height ratios. AJR Am J Roentgenol. 2009;193(5):1361-1366.
7. Lewallen LW, McIntosh AL, Dahm DL. Predictors of recurrent instability after acute patellofemoral dislocation in pediatric and adolescent patients. Am J Sports Med. 2013;41(3):575-581.
8. Ward SR, Terk MR, Powers CM. Patella alta: association with patellofemoral alignment and changes in contact area during weight-bearing. J Bone Joint Surg Am. 2007;89(8):1749-1755.
9. Dejour H, Walch G, Nove-Josserand L, Guier C. Factors of patellar instability: an anatomic radiographic study. Knee Surg Sports Traumatol Arthrosc. 1994;2(1):19-26.
10. Arendt EA, Fithian DC, Cohen E. Current concepts of lateral patella dislocation. Clin Sports Med. 2002;21(3):499-519.
11. Dejour D, Ferrua P, Ntagiopoulos PG, et al. The introduction of a new MRI index to evaluate sagittal patellofemoral engagement. Orthop Traumatol Surg Res. 2013;99(8 suppl):S391-S398.
12. Althani S, Shahi A, Tan TL, Al-Belooshi A. Position of the patella among Emirati adult knees. Is Insall-Salvati ratio applicable to Middle-Easterners? Arch Bone Joint Surg. 2016;4(2):137-140.
13. Yin L, Liao TC, Yang L, Powers CM. Does patella tendon tenodesis improve tibial tubercle distalization in treating patella alta? A computational study. Clin Orthop Relat Res. 2016;474(11):2451-2461.
14. Barnett AJ, Prentice M, Mandalia V, Wakeley CJ, Eldridge JD. Patellar height measurement in trochlear dysplasia. Knee Surg Sports Traumatol Arthrosc. 2009;17(12):1412-1415.
15. Otsuki S, Nakajima M, Fujiwara K, et al. Influence of age on clinical outcomes of three-dimensional transfer of the tibial tuberosity for patellar instability with patella alta. Knee Surg Sports Traumatol Arthrosc. 2017;25(8):2392-2396.
16. Otsuki S, Nakajima M, Oda S, et al. Three-dimensional transfer of the tibial tuberosity for patellar instability with patella alta. J Orthop Sci. 2013;18(3):437-442.
17. Steensen RN, Bentley JC, Trinh TQ, Backes JR, Wiltfong RE. The prevalence and combined prevalences of anatomic factors associated with recurrent patellar dislocation: a magnetic resonance imaging study. Am J Sports Med. 2015;43(4):921-927.
18. Magnussen RA, De Simone V, Lustig S, Neyret P, Flanigan DC. Treatment of patella alta in patients with episodic patellar dislocation: a systematic review. Knee Surg Sports Traumatol Arthrosc. 2014;22(10):2545-2550.
19. Bertollo N, Pelletier MH, Walsh WR. Simulation of patella alta and the implications for in vitro patellar tracking in the ovine stifle joint. J Orthop Res. 2012;30(11):1789-1797.
20. Narkbunnam R, Chareancholvanich K. Effect of patient position on measurement of patellar height ratio. Arch Orthop Trauma Surg. 2015;135(8):1151-1156.
21. Stefanik JJ, Zhu Y, Zumwalt AC, et al. Association between patella alta and the prevalence and worsening of structural features of patellofemoral joint osteoarthritis: the Multicenter Osteoarthritis Study. Arthritis Care Res. 2010;62(9):1258-1265.
22. Monk AP, Doll HA, Gibbons CL, et al. The patho-anatomy of patellofemoral subluxation. J Bone Joint Surg Br. 2011;93(10):1341-1347.
23. Hirano A, Fukubayashi T, Ishii T, Ochiai N. Relationship between the patellar height and the disorder of the knee extensor mechanism in immature athletes. J Pediatr Orthop. 2001;21(4):541-544.
24. Ng JP, Cawley DT, Beecher SM, Lee MJ, Bergin D, Shannon FJ. Focal intratendinous radiolucency: a new radiographic method for diagnosing patellar tendon ruptures. Knee. 2016;23(3):482-486.
25. van Duijvenbode D, Stavenuiter M, Burger B, van Dijke C, Spermon J, Hoozemans M. The reliability of four widely used patellar height ratios. Int Orthop. 2016;40(3):493-497.
26. Biedert RM, Albrecht S. The patellotrochlear index: a new index for assessing patellar height. Knee Surg Sports Traumatol Arthrosc. 2006;14(8):707-712.
27. Grelsamer RP, Meadows S. The modified Insall-Salvati ratio for assessment of patellar height. Clin Orthop Relat Res. 1992;(282):170-176.
28. Thaunat M, Erasmus PJ. The favourable anisometry: an original concept for medial patellofemoral ligament reconstruction. Knee. 2007;14(6):424-428.
29. Anagnostakos K, Lorbach O, Reiter S, Kohn D. Comparison of five patellar height measurement methods in 90 degrees knee flexion. Int Orthop. 2011;35(12):1791-1797.
30. Miller TT, Staron RB, Feldman F. Patellar height on sagittal MR imaging of the knee. AJR Am J Roentgenol. 1996;167(2):339-341.
31. Dejour D, Le Coultre B. Osteotomies in patello-femoral instabilities. Sports Med Arthrosc Rev. 2007;15(1):39-46.
32. Rhee SJ, Pavlou G, Oakley J, Barlow D, Haddad F. Modern management of patellar instability. Int Orthop. 2012;36(12):2447-2456.
33. Servien E, Verdonk PC, Neyret P. Tibial tuberosity transfer for episodic patellar dislocation. Sports Med Arthrosc Rev. 2007;15(2):61-67.
34. Caton J, Deschamps G, Chambat P, Lerat JL, Dejour H. [Patella infera. Apropos of 128 cases]. Rev Chir Orthop Reparatrice Appar Mot. 1982;68(5):317-325.
35. Meyers AB, Laor T, Sharafinski M, Zbojniewicz AM. Imaging assessment of patellar instability and its treatment in children and adolescents. Pediatr Radiol. 2016;46(5):618-636.
36. Feller JA. Distal realignment (tibial tuberosity transfer). Sports Med Arthrosc Rev. 2012;20(3):152-161.
37. Dietrich TJ, Fucentese SF, Pfirrmann CW. Imaging of individual anatomical risk factors for patellar instability. Semin Musculoskelet Radiol. 2016;20(1):65-73.
38. Dean CS, Chahla J, Serra Cruz R, Cram TR, LaPrade RF. Patellofemoral joint reconstruction for patellar instability: medial patellofemoral ligament reconstruction, trochleoplasty, and tibial tubercle osteotomy. Arthrosc Tech. 2016;5(1):e169-e175.
39. Frosch KH, Schmeling A. A new classification system of patellar instability and patellar maltracking. Arch Orthop Trauma Surg. 2016;136(4):485-497.
40. Weber AE, Nathani A, Dines JS, et al. An algorithmic approach to the management of recurrent lateral patellar dislocation. J Bone Joint Surg Am. 2016;98(5):417-427.
41. Seil R, Muller B, Georg T, Kohn D, Rupp S. Reliability and interobserver variability in radiological patellar height ratios. Knee Surg Sports Traumatol Arthrosc. 2000;8(4):231-236.
42. Laprade J, Culham E. Radiographic measures in subjects who are asymptomatic and subjects with patellofemoral pain syndrome. Clin Orthop Relat Res. 2003;(414):172-182.
43. Caton JH, Dejour D. Tibial tubercle osteotomy in patello-femoral instability and in patellar height abnormality. Int Orthop. 2010;34(2):305-309.
44. Charles MD, Haloman S, Chen L, Ward SR, Fithian D, Afra R. Magnetic resonance imaging–based topographical differences between control and recurrent patellofemoral instability patients. Am J Sports Med. 2013;41(2):374-384.
45. Kurtul Yildiz H, Ekin EE. Patellar malalignment: a new method on knee MRI. Springerplus. 2016;5(1):1500.
46. Lee PP, Chalian M, Carrino JA, Eng J, Chhabra A. Multimodality correlations of patellar height measurement on x-ray, CT, and MRI. Skeletal Radiol. 2012;41(10):1309-1314.
47. Neyret P, Robinson AH, Le Coultre B, Lapra C, Chambat P. Patellar tendon length—the factor in patellar instability? Knee. 2002;9(1):3-6.
48. Diederichs G, Issever AS, Scheffler S. MR imaging of patellar instability: injury patterns and assessment of risk factors. Radiographics. 2010;30(4):961-981.
49. Earhart C, Patel DB, White EA, Gottsegen CJ, Forrester DM, Matcuk GR Jr. Transient lateral patellar dislocation: review of imaging findings, patellofemoral anatomy, and treatment options. Emerg Radiol. 2013;20(1):11-23.
50. Aarimaa V, Ranne J, Mattila K, Rahi K, Virolainen P, Hiltunen A. Patellar tendon shortening after treatment of patellar instability with a patellar tendon medialization procedure. Scand J Med Sci Sports. 2008;18(4):442-446.
51. Brown DE, Alexander AH, Lichtman DM. The Elmslie-Trillat procedure: evaluation in patellar dislocation and subluxation. Am J Sports Med. 1984;12(2):104-109.
52. Goldstein JL, Verma N, McNickle AG, Zelazny A, Ghodadra N, Bach BR Jr. Avoiding mismatch in allograft anterior cruciate ligament reconstruction: correlation between patient height and patellar tendon length. Arthroscopy. 2010;26(5):643-650.
53. Navali AM, Jafarabadi MA. Is there any correlation between patient height and patellar tendon length? Arch Bone Joint Surg. 2015;3(2):99-103.
54. Park MS, Chung CY, Lee KM, Lee SH, Choi IH. Which is the best method to determine the patellar height in children and adolescents? Clin Orthop Relat Res. 2010;468(5):1344-1351.
55. Berard JB, Magnussen RA, Bonjean G, et al. Femoral tunnel enlargement after medial patellofemoral ligament reconstruction: prevalence, risk factors, and clinical effect. Am J Sports Med. 2014;42(2):297-301.
56. Edama M, Kageyama I, Nakamura M, et al. Anatomical study of the inferior patellar pole and patellar tendon [published online ahead of print February 16, 2017]. Scand J Med Sci Sports. doi:10.1111/sms.12858.
57. Al-Sayyad MJ, Cameron JC. Functional outcome after tibial tubercle transfer for the painful patella alta. Clin Orthop Relat Res. 2002;(396):152-162.
58. Benoit B, Laflamme GY, Laflamme GH, Rouleau D, Delisle J, Morin B. Long-term outcome of surgically-treated habitual patellar dislocation in children with coexistent patella alta. Minimum follow-up of 11 years. J Bone Joint Surg Br. 2007;89(9):1172-1177.
59. Simmons E Jr, Cameron JC. Patella alta and recurrent dislocation of the patella. Clin Orthop Relat Res. 1992;(274):265-269.
60. Degnan AJ, Maldjian C, Adam RJ, Fu FH, Di Domenica M. Comparison of Insall-Salvati ratios in children with an acute anterior cruciate ligament tear and a matched control population. AJR Am J Roentgenol. 2015;204(1):161-166.
61. Wittstein JR, Bartlett EC, Easterbrook J, Byrd JC. Magnetic resonance imaging evaluation of patellofemoral malalignment. Arthroscopy. 2006;22(6):643-649.
Take-Home Points
- Patella alta has a reduced articular area of PF contact.
- Presence of patella alta depends on the measurement method.
- Patella alta is defined as ISI >1.2 and CDI >1.2 to >1.3.
- On sagittal MRI, PTI is used most often with cutoff values of <0.125 to 0.28.
- Tibial tubercle distalization is most often used to treat patella alta. The desired postoperative patellar height is a CDI of 1.0.
Patella alta is a patella that rides abnormally high in relation to the femur, the femoral trochlea, or the tibia,1 with decreased bony stability requiring increased knee flexion angles to engage the trochlea.2,3 An abnormally high patella may therefore insufficiently engage the proximal trochlea groove both in extension and in the early phase of knee flexion—making it one of the potential risk factors for patellar instability.4-10 Accordingly, patella alta is present in 30% of patients with recurrent patellar dislocation.11 It also occurs in other disorders, such as knee extensor apparatus disorders, in patients with patellofemoral (PF) pain, chondromalacia, Sinding-Larsen-Johansson disease, Osgood-Schlatter disease, patellar tendinopathy, and osteoarthritis.1,7,8,12-18 As such, patella alta represents an important predisposing factor for patellar malalignment and PF-related complaints. On the other hand, patella alta may also be a normal variant of a person’s knee anatomy and may be well tolerated when not combined with other instability factors.4
Despite the importance of patella alta, there is no consensus on a precise definition, the most reliable measurement method, or the factors thought to be important in clinical decisions regarding treatment. To address this issue, we systematically reviewed the patella alta literature for definitions, the most common measurement methods and their patella alta cutoff values, and cutoff values for surgical correction and proposed surgical techniques.
Methods
In February 2017, using the term patella alta, we performed a systematic literature search on PubMed. Inclusion criteria were original study or review articles, publication in peer-reviewed English-language journals between 2000 and 2017, and narrative description or measurement of human patellar height on plain radiographs or magnetic resonance imaging (MRI). Excluded were abstracts and articles in languages other than English; animal and computational/biomechanical studies; case reports; and knee arthroplasties, knee extensor ruptures, and hereditary and congenital diseases. All evidence levels were included.
We assessed measurement methods, reported cutoff values for patella alta, cutoff values for performing surgical correction, proposed surgical techniques, and postoperative target values. Original study articles and review articles were analyzed separately.
Results
Of 211 articles identified, 92 met the inclusion criteria for original study, and 28 for review. All their abstracts were reviewed, and 91 were excluded: 17 for language other than English, 11 for animal study, 12 for biomechanical/computational study, 20 for case report, 8 for arthroplasty, 13 for hereditary or congenital disease, 1 for extensor apparatus rupture, 3 for editorial letter, and 6 for other reasons. Full text copies of all included articles were obtained and reviewed.
Original Study Articles
Definition. Of the 92 original study articles, 17 (18.5%) defined patella alta by description alone, and 75 (81.5%) used imaging-based measurements. Patella alta was described as a patella that rides abnormally high in relation to the trochlear groove, with a reduced articular area of PF contact1,15,19-21 or decreased patella–trochlea cartilage overlap.22 With this reduced contact area, there is increased PF stress.21
With radiographic measurements, patella alta is defined as a Caton-Deschamps index (CDI) of >1.2 to >1.3, an Insall-Salvati index (ISI) of >1.2, a Blackburne-Peel index (PBI) of >1.0,4,15,18,23-25 and a patellotrochlear index (PTI) of <0.125 to 0.28.6,26
On lateral radiographs, ISI was the most common measurement (33 studies), with patella alta cutoff values ranging from >1.2 to >1.5. The second most common measurement was CDI (24 studies), with cutoff values of >1.2 to >1.3. Other indices, such as the modified ISI (6 studies), the BPI (1 study), and the Koshino index (2 studies), had their cutoff values used more consistently (>1.6 to >2.4, >1.0, and >1.2, respectively) but these indices were rarely reported in the literature (Table 1).27,28,29
Thirty-six studies defined patella alta with MRI using either the aforementioned radiographic ratios (23 studies, 3 indices, Table 2) or PF indices (13 studies, 4 methods, Table 3).30
On sagittal MRI, PTI was used most often; cutoff values were <0.125 to 0.28.
Thirteen studies defined patella alta with PTL: 5 using lateral conventional radiographs and 8 using sagittal MRI. For each type of imaging, the cutoff value was >52 mm to >56 mm. PTL was measured either independently or together with ISI on sagittal MRI (Table 4).
Review Articles
Twenty-eight review articles met the inclusion criteria.35-40 Patella alta was described mostly with ISI (75%) or CDI (64%). In up to 57% of these articles, a patella alta reference value was missing. Only 1 article mentioned different cutoff values for conventional radiographs and MRI. BPI was mentioned in 50% of studies, but only 2 indicated a cutoff value for patella alta. Eleven percent used PTI on sagittal MRI and took patella–trochlea cartilage overlap into account.
Eight review articles mentioned cutoff values for surgical correction. Only 1 of 4 articles mentioned a cutoff value for correcting patella alta in PF instability, and only 2 articles suggested an ideal postoperative patellar height (Table 6).
No review article relied on PTL to describe patella alta or to advise surgical treatment.
Discussion
Our review revealed many variations in patella alta definitions and descriptions, measurement methods, cutoff values, and treatment options. Interpretation of patellar height and, particularly, patella alta is very heterogeneous. Accordingly, comparing surgical indications, surgical treatment options, and outcomes across studies can be difficult.
Measurement Methods
Radiographs. Conventional radiographs were used to describe patella alta in two-thirds of the original study articles. The most common measurement methods marked the position of the patella relative to either the femur (direct assessment) or the tibia (indirect assessment).14,25 All established measurement methods use lateral radiographs, which do not show articular cartilage.11,14 Therefore, lateral radiograph ratios of different and variable bony landmarks do not measure actual PF articular congruence. The widely variable morphologies of patella (distal patellar nose, different articulating surface), femoral trochlea (facet in height and length), proximal tibia (inherited or acquired deformities on tibial tubercle), and slope are all confounding factors that may affect measurement (Figure 1). In addition, specific variations in PF joint morphology (eg, small patellar articular surface, short trochlea) are not well represented by these ratios.11
All these methods have advantages, limitations, and different values of interobserver and intraobserver variability, reliability, and reproducibility (Table 7).29,41
Determination of both patellar height and patella alta depends on the measurement method used and is significantly affected by anatomical variants, such as extra-articular patella and femorotibial landmarks.
The ISI method is most commonly used because it does not depend on degree of knee flexion, is thought to measure the relative length of the patellar tendon the best,5 and has established MRI criteria.6 However, ISI has limitations: Its distal bony landmark is the tibial tuberosity, which can be difficult to assess14; the shape of the patella (mainly its inferior point) varies42; and the measurement does not change after distalization of the tibial tubercle.5
CDI is the most accurate diagnostic method because it relies on readily identifiable and reproducible anatomical landmarks; does not depend on radiograph quality, knee size, radiologic enlargement, or position of the tibial tubercle or patellar modification; and is unaffected by degree of knee flexion between 10° and 80°.38,43 CDI is the method that is most useful in describing patellar height after distalization of the tibial tubercle because it assesses the height of the patella relative to the tibial plateau.5 CDI is limited with respect to clear identification of the patellar and tibial articular margin.37
BPI has the lowest interobserver variability and discriminates best among patella alta, norma, and infera.41 Like CDI, BPI assesses patellar height relative to the tibial plateau, and thus is useful in describing patellar height after distalization of the tibial tubercle.5 BPI is limited in that it uses a line drawn along the tibial plateau, where variations in inclination and tibial slope produce inaccuracies,14 and depends highly on projection angles. Clinically, BPI is rarely used.
As the literature shows, the radiologic methods of determining patellar height are variable and unreliable and depend on the ratio used.26,41 These methods do not reveal precise information about the PF articular congruence, the key finding for necessary treatment.
Radiographic Indices on MRI. Some studies measured radiographic indices on sagittal MRI. Radiologic and MRI measurements are described as not significantly different or slightly different, and 0.09 to 0.13 needs to be added with ISI and BP ratios on radiographs, MRI, and computed tomography (CT).17,44-47 ISI is commonly used, and its clinical application is easy. Although classically measured on plain radiographs, ISI is reliably measured on MRI as well.17,30 The traditional 1.2 threshold for defining patella alta was used by Charles and colleagues.44 CDI is equally well measured on radiographs and MRI.47
According to the literature, 3 different measurement methods have been used to describe degree of patella–trochlea cartilage overlap: PTI, sagittal patellofemoral engagement (SPE), and patellar articular overlap (PAO).1,11,26
PTI uses the true articular cartilage patella–trochlea relationship for measurement of patellar height on sagittal MRI in extension (Figure 3). If the patellar tendon is fully out to length (no laxity), PTI reliably and precisely determines the exact articular correlation of PF joint and patellar height.6
SPE is similar to percentage of articular coverage.1,11 Patellar overlap of the trochlea is measured on 2 different sagittal MRI images: 1 with the greatest length of patellar cartilage and 1 with the greatest length of femoral trochlear cartilage. This measurement did not correlate with CDI.1 SPE was not evaluated in control studies, and normal and pathologic values are unavailable.
PAO is measured with patients positioned at rest and in standard knee coils.1 MRI was not obtained in full extension or with quadriceps activation, and knee flexion angle values are unavailable. Total patellar articular length was measured on the sagittal MRI that showed the greatest patellar length and articular cartilage thickness. The same image was used to measure articular overlap, or the length of patellar cartilage overlying the trochlear cartilage, as measured parallel to the subchondral surface of the patella. PAO correlates well with conventional patellar height measurements in the sagittal plane and shows promise as a simpler alternative to the conventional indices.1 Normal and pathologic values are unavailable.
So far, PTI is the only method that was controlled in several studies, assessed for its reliability, and compared with other patellar height measurements.6,14
Patellar Tendon Length. PTL can be measured on lateral radiographs or sagittal MRI. Radiologic and MRI measurements are described as not significantly different47 or slightly different, and 0.09 to 0.13 needs to be added with the ISI ratio on radiographs, MRI, and CT.46 PTL is reliably evaluated with ISI.41,50 There is a weak correlation of patient height and PTL: Taller people have normally longer tendons.51-53
PTL measurements revealed that the posterior surface of the patellar tendon was significantly shorter than the anterior surface. Compared with their corresponding posterior fascicles, anterior fascicles are longer; their attachment is more proximal to the patella and more distal to the tibia. In addition, posterior PTL is significantly shorter with the posterior patellar attachment (adheres to posterior aspect of the inferior patellar pole) than with the anterior attachment (adheres to anterior aspect of the inferior patellar pole).56 Moreover, the lateral and medial fascicles are longer than the central fascicles attaching at the most inferior patellar pole. This issue must be considered in image cut selection (Figures 6A, 6B). Furthermore, type of inferior pole of patella (pointed, intermediate, blunt) is important in measurement.56 Overall, mean (SD) PTL was 54.9 (1.2) mm on the anterior surface and 35.0 (0.6) mm on the posterior surface.
It is important to precisely describe the measurement method and location (sagittal cut) and to consider the shape of the inferior patellar pole and the site of the patellar tendon attachment.56
Treatments. For patella alta, the surgical treatment goals are to increase the PF contact area and improve PF articular congruence, and thereby increase PF stability.31-33 Four different procedures were used to treat patella alta (Table 5), but only 11 of the 92 original study articles and 8 of the 28 review articles included in our review mentioned a specific patellar height that required surgical correction (Tables 5, 6). Recommendations were based on CDI (>1.2 to >1.4) and less often on ISI (>1.2 to >1.4) or PTL (>56 mm).
Tibial tubercle distalization is effective in normalizing patellar height to correct the patellar index in patella alta (Figures 7A, 7B).13,18,38,55,57 Tibial tubercle distalization and patellar tendon tenodesis attached to the original insertion normalize PTL and stabilize the PF joint in patients with patella alta.5,47 In a comparison of these surgical procedures, cartilage stress was lower with distalization than with distalization and tenodesis.13
Soft-tissue methods are recommended in children, as bone procedures injure the proximal tibial physis and may cause it to close prematurely.58 The patella can be distally advanced by completely mobilizing the patellar tendon and fixating with sutures through the cartilaginous tibial tubercle. This technique is a satisfactory treatment for skeletally immature patients who present with habitual patellar dislocation associated with patella alta.58,59
CDI and BPI assess patellar height relative to the tibial plateau, and therefore are the most useful measurement methods for patellar height after distalization of the tibial tubercle.5 ISI does not change after distalization of the tibial tubercle and cannot be recommended.5,18 As PF indices (eg, PTI) can trace preoperative and postoperative values, these measurements are valuable.
Controversies
Our review found no consensus on measurement method or cutoff value. No measurement method showed clear clinical or methodologic superiority. Most published patellar height and patella alta data are based on conventional radiographs using a tibial reference point, even though a femoral or even trochlear reference point seems more reproducible, particularly in PF pathologies. Several cutoff values have been reported for each patella alta measurement method. Regarding pathologic thresholds, which might require surgical correction, very little information has been published, and scientific evidence is lacking. Numerous important aspects remain unanswered after this review, and clarification is mandatory.
Five Key Facts
1. In patella alta assessment, different morphologic, biomechanical, and functional aspects must be considered. The most relevant aspect is decreased engagement of the patella and trochlea,4-9,11,26 which results in decreased bony stability in knee extension.1-3 Therefore, patella alta is one of the potential risk factors for patellar instability with a high percentage of recurrent patellar dislocation.4-9 In early knee flexion, the patella translates more distally with better engagement of the patella in the trochlea and better stability. Therefore, measurement in extension, with the patellar tendon out to length, seems to offer a more reliable assessment of the patella–femur relationship.
2. Insufficient engagement of the patella in the trochlea is the most important aspect of patella alta.11 Therefore, direct measurement of this engagement seems logical.
3. As radiographs do not show articular cartilage, they should not be used to assess the articular patella–femur relationship.11,14,26 Patella–trochlea cartilage overlap is the most relevant factor for patella alta and should be measured on MRI.6,14,26,32
4. PTL is an important factor for patellar height and particularly patella alta. The range of normal PTL values is wide: 35 mm to 61 mm. The described cutoff values for patella alta (>52 mm to >56 mm) fall within this normal range. The cause may be the different measurement methods used.33,47,59-61 Therefore, for precise diagnostics, a standardized measurement method that includes the selected cut imaging is mandatory.
Many important aspects remain unanswered, and clarification is mandatory (Table 9).
Conclusion
Our review revealed many variations in patella alta definitions and descriptions, measurement methods, cutoff values, and treatment options. Presence of patella alta depends on measurement method used. Methods cannot be used interchangeably, and they all have their advantages and limitations. Unfortunately, there is no generally accepted consensus on measurement method, patella alta cutoff value, or treatment with ideal correction. Treatment planning and outcomes assessment require clarification of these many issues.
1 Munch JL, Sullivan JP, Nguyen JT, et al. Patellar articular overlap on MRI is a simple alternative to conventional measurements of patellar height. Orthop J Sports Med. 2016;4(7):2325967116656328.
2. Elias JJ, Soehnlen NT, Guseila LM, Cosgarea AJ. Dynamic tracking influenced by anatomy in patellar instability. Knee. 2016;23(3):450-455.
3. Fabricant PD, Ladenhauf HN, Salvati EA, Green DW. Medial patellofemoral ligament (MPFL) reconstruction improves radiographic measures of patella alta in children. Knee. 2014;21(6):1180-1184.
4. Askenberger M, Janarv PM, Finnbogason T, Arendt EA. Morphology and anatomic patellar instability risk factors in first-time traumatic lateral patellar dislocations. Am J Sports Med. 2017;45(1):50-58.
5. Mayer C, Magnussen RA, Servien E, et al. Patellar tendon tenodesis in association with tibial tubercle distalization for the treatment of episodic patellar dislocation with patella alta. Am J Sports Med. 2012;40(2):346-351.
6. Ali SA, Helmer R, Terk MR. Patella alta: lack of correlation between patellotrochlear cartilage congruence and commonly used patellar height ratios. AJR Am J Roentgenol. 2009;193(5):1361-1366.
7. Lewallen LW, McIntosh AL, Dahm DL. Predictors of recurrent instability after acute patellofemoral dislocation in pediatric and adolescent patients. Am J Sports Med. 2013;41(3):575-581.
8. Ward SR, Terk MR, Powers CM. Patella alta: association with patellofemoral alignment and changes in contact area during weight-bearing. J Bone Joint Surg Am. 2007;89(8):1749-1755.
9. Dejour H, Walch G, Nove-Josserand L, Guier C. Factors of patellar instability: an anatomic radiographic study. Knee Surg Sports Traumatol Arthrosc. 1994;2(1):19-26.
10. Arendt EA, Fithian DC, Cohen E. Current concepts of lateral patella dislocation. Clin Sports Med. 2002;21(3):499-519.
11. Dejour D, Ferrua P, Ntagiopoulos PG, et al. The introduction of a new MRI index to evaluate sagittal patellofemoral engagement. Orthop Traumatol Surg Res. 2013;99(8 suppl):S391-S398.
12. Althani S, Shahi A, Tan TL, Al-Belooshi A. Position of the patella among Emirati adult knees. Is Insall-Salvati ratio applicable to Middle-Easterners? Arch Bone Joint Surg. 2016;4(2):137-140.
13. Yin L, Liao TC, Yang L, Powers CM. Does patella tendon tenodesis improve tibial tubercle distalization in treating patella alta? A computational study. Clin Orthop Relat Res. 2016;474(11):2451-2461.
14. Barnett AJ, Prentice M, Mandalia V, Wakeley CJ, Eldridge JD. Patellar height measurement in trochlear dysplasia. Knee Surg Sports Traumatol Arthrosc. 2009;17(12):1412-1415.
15. Otsuki S, Nakajima M, Fujiwara K, et al. Influence of age on clinical outcomes of three-dimensional transfer of the tibial tuberosity for patellar instability with patella alta. Knee Surg Sports Traumatol Arthrosc. 2017;25(8):2392-2396.
16. Otsuki S, Nakajima M, Oda S, et al. Three-dimensional transfer of the tibial tuberosity for patellar instability with patella alta. J Orthop Sci. 2013;18(3):437-442.
17. Steensen RN, Bentley JC, Trinh TQ, Backes JR, Wiltfong RE. The prevalence and combined prevalences of anatomic factors associated with recurrent patellar dislocation: a magnetic resonance imaging study. Am J Sports Med. 2015;43(4):921-927.
18. Magnussen RA, De Simone V, Lustig S, Neyret P, Flanigan DC. Treatment of patella alta in patients with episodic patellar dislocation: a systematic review. Knee Surg Sports Traumatol Arthrosc. 2014;22(10):2545-2550.
19. Bertollo N, Pelletier MH, Walsh WR. Simulation of patella alta and the implications for in vitro patellar tracking in the ovine stifle joint. J Orthop Res. 2012;30(11):1789-1797.
20. Narkbunnam R, Chareancholvanich K. Effect of patient position on measurement of patellar height ratio. Arch Orthop Trauma Surg. 2015;135(8):1151-1156.
21. Stefanik JJ, Zhu Y, Zumwalt AC, et al. Association between patella alta and the prevalence and worsening of structural features of patellofemoral joint osteoarthritis: the Multicenter Osteoarthritis Study. Arthritis Care Res. 2010;62(9):1258-1265.
22. Monk AP, Doll HA, Gibbons CL, et al. The patho-anatomy of patellofemoral subluxation. J Bone Joint Surg Br. 2011;93(10):1341-1347.
23. Hirano A, Fukubayashi T, Ishii T, Ochiai N. Relationship between the patellar height and the disorder of the knee extensor mechanism in immature athletes. J Pediatr Orthop. 2001;21(4):541-544.
24. Ng JP, Cawley DT, Beecher SM, Lee MJ, Bergin D, Shannon FJ. Focal intratendinous radiolucency: a new radiographic method for diagnosing patellar tendon ruptures. Knee. 2016;23(3):482-486.
25. van Duijvenbode D, Stavenuiter M, Burger B, van Dijke C, Spermon J, Hoozemans M. The reliability of four widely used patellar height ratios. Int Orthop. 2016;40(3):493-497.
26. Biedert RM, Albrecht S. The patellotrochlear index: a new index for assessing patellar height. Knee Surg Sports Traumatol Arthrosc. 2006;14(8):707-712.
27. Grelsamer RP, Meadows S. The modified Insall-Salvati ratio for assessment of patellar height. Clin Orthop Relat Res. 1992;(282):170-176.
28. Thaunat M, Erasmus PJ. The favourable anisometry: an original concept for medial patellofemoral ligament reconstruction. Knee. 2007;14(6):424-428.
29. Anagnostakos K, Lorbach O, Reiter S, Kohn D. Comparison of five patellar height measurement methods in 90 degrees knee flexion. Int Orthop. 2011;35(12):1791-1797.
30. Miller TT, Staron RB, Feldman F. Patellar height on sagittal MR imaging of the knee. AJR Am J Roentgenol. 1996;167(2):339-341.
31. Dejour D, Le Coultre B. Osteotomies in patello-femoral instabilities. Sports Med Arthrosc Rev. 2007;15(1):39-46.
32. Rhee SJ, Pavlou G, Oakley J, Barlow D, Haddad F. Modern management of patellar instability. Int Orthop. 2012;36(12):2447-2456.
33. Servien E, Verdonk PC, Neyret P. Tibial tuberosity transfer for episodic patellar dislocation. Sports Med Arthrosc Rev. 2007;15(2):61-67.
34. Caton J, Deschamps G, Chambat P, Lerat JL, Dejour H. [Patella infera. Apropos of 128 cases]. Rev Chir Orthop Reparatrice Appar Mot. 1982;68(5):317-325.
35. Meyers AB, Laor T, Sharafinski M, Zbojniewicz AM. Imaging assessment of patellar instability and its treatment in children and adolescents. Pediatr Radiol. 2016;46(5):618-636.
36. Feller JA. Distal realignment (tibial tuberosity transfer). Sports Med Arthrosc Rev. 2012;20(3):152-161.
37. Dietrich TJ, Fucentese SF, Pfirrmann CW. Imaging of individual anatomical risk factors for patellar instability. Semin Musculoskelet Radiol. 2016;20(1):65-73.
38. Dean CS, Chahla J, Serra Cruz R, Cram TR, LaPrade RF. Patellofemoral joint reconstruction for patellar instability: medial patellofemoral ligament reconstruction, trochleoplasty, and tibial tubercle osteotomy. Arthrosc Tech. 2016;5(1):e169-e175.
39. Frosch KH, Schmeling A. A new classification system of patellar instability and patellar maltracking. Arch Orthop Trauma Surg. 2016;136(4):485-497.
40. Weber AE, Nathani A, Dines JS, et al. An algorithmic approach to the management of recurrent lateral patellar dislocation. J Bone Joint Surg Am. 2016;98(5):417-427.
41. Seil R, Muller B, Georg T, Kohn D, Rupp S. Reliability and interobserver variability in radiological patellar height ratios. Knee Surg Sports Traumatol Arthrosc. 2000;8(4):231-236.
42. Laprade J, Culham E. Radiographic measures in subjects who are asymptomatic and subjects with patellofemoral pain syndrome. Clin Orthop Relat Res. 2003;(414):172-182.
43. Caton JH, Dejour D. Tibial tubercle osteotomy in patello-femoral instability and in patellar height abnormality. Int Orthop. 2010;34(2):305-309.
44. Charles MD, Haloman S, Chen L, Ward SR, Fithian D, Afra R. Magnetic resonance imaging–based topographical differences between control and recurrent patellofemoral instability patients. Am J Sports Med. 2013;41(2):374-384.
45. Kurtul Yildiz H, Ekin EE. Patellar malalignment: a new method on knee MRI. Springerplus. 2016;5(1):1500.
46. Lee PP, Chalian M, Carrino JA, Eng J, Chhabra A. Multimodality correlations of patellar height measurement on x-ray, CT, and MRI. Skeletal Radiol. 2012;41(10):1309-1314.
47. Neyret P, Robinson AH, Le Coultre B, Lapra C, Chambat P. Patellar tendon length—the factor in patellar instability? Knee. 2002;9(1):3-6.
48. Diederichs G, Issever AS, Scheffler S. MR imaging of patellar instability: injury patterns and assessment of risk factors. Radiographics. 2010;30(4):961-981.
49. Earhart C, Patel DB, White EA, Gottsegen CJ, Forrester DM, Matcuk GR Jr. Transient lateral patellar dislocation: review of imaging findings, patellofemoral anatomy, and treatment options. Emerg Radiol. 2013;20(1):11-23.
50. Aarimaa V, Ranne J, Mattila K, Rahi K, Virolainen P, Hiltunen A. Patellar tendon shortening after treatment of patellar instability with a patellar tendon medialization procedure. Scand J Med Sci Sports. 2008;18(4):442-446.
51. Brown DE, Alexander AH, Lichtman DM. The Elmslie-Trillat procedure: evaluation in patellar dislocation and subluxation. Am J Sports Med. 1984;12(2):104-109.
52. Goldstein JL, Verma N, McNickle AG, Zelazny A, Ghodadra N, Bach BR Jr. Avoiding mismatch in allograft anterior cruciate ligament reconstruction: correlation between patient height and patellar tendon length. Arthroscopy. 2010;26(5):643-650.
53. Navali AM, Jafarabadi MA. Is there any correlation between patient height and patellar tendon length? Arch Bone Joint Surg. 2015;3(2):99-103.
54. Park MS, Chung CY, Lee KM, Lee SH, Choi IH. Which is the best method to determine the patellar height in children and adolescents? Clin Orthop Relat Res. 2010;468(5):1344-1351.
55. Berard JB, Magnussen RA, Bonjean G, et al. Femoral tunnel enlargement after medial patellofemoral ligament reconstruction: prevalence, risk factors, and clinical effect. Am J Sports Med. 2014;42(2):297-301.
56. Edama M, Kageyama I, Nakamura M, et al. Anatomical study of the inferior patellar pole and patellar tendon [published online ahead of print February 16, 2017]. Scand J Med Sci Sports. doi:10.1111/sms.12858.
57. Al-Sayyad MJ, Cameron JC. Functional outcome after tibial tubercle transfer for the painful patella alta. Clin Orthop Relat Res. 2002;(396):152-162.
58. Benoit B, Laflamme GY, Laflamme GH, Rouleau D, Delisle J, Morin B. Long-term outcome of surgically-treated habitual patellar dislocation in children with coexistent patella alta. Minimum follow-up of 11 years. J Bone Joint Surg Br. 2007;89(9):1172-1177.
59. Simmons E Jr, Cameron JC. Patella alta and recurrent dislocation of the patella. Clin Orthop Relat Res. 1992;(274):265-269.
60. Degnan AJ, Maldjian C, Adam RJ, Fu FH, Di Domenica M. Comparison of Insall-Salvati ratios in children with an acute anterior cruciate ligament tear and a matched control population. AJR Am J Roentgenol. 2015;204(1):161-166.
61. Wittstein JR, Bartlett EC, Easterbrook J, Byrd JC. Magnetic resonance imaging evaluation of patellofemoral malalignment. Arthroscopy. 2006;22(6):643-649.
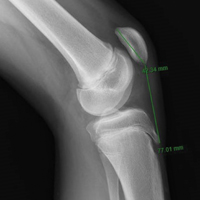
Patient-Reported Outcomes of Knotted and Knotless Glenohumeral Labral Repairs Are Equivalent
Take-Home Points
- There is no difference in PROMs following knotless or knotted labral repair.
- Operative time is shorter for knotless compared to knotted glenoid labral tears.
- Knotless constructs may be more predictable than knotted constructs biomechanically.
Orthopedic surgeons often encounter labral pathology, and labral tears historically have required open techniques.1-3 Arthroscopy allows for advanced visualization and treatment of shoulder lesions,4,5 including anterior, posterior, and superior labrum anterior to posterior (SLAP) lesions.6
The goal of arthroscopic labral repair is to restore joint stability while maintaining range of motion. Arthroscopically repairing the labrum with suture anchors has become the standard technique, and several studies have reported satisfactory biomechanical and clinical results.1,7-12 Surgeons traditionally have been required to tie knots for these anchors, but knot security varies significantly among experienced arthroscopic surgeons.13 In addition, knots can migrate,14 and bulky knots can cause chondral abrasion.15,16 Several manufacturers have introduced knotless anchors for soft-tissue fixation.15,17 The knotless technique provides a low-profile repair with potentially less operating time.8 These factors may warrant switching from knotted to knotless techniques if outcomes are clinically acceptable. However, few studies have compared knotted and knotless techniques for glenohumeral labral repair.8,15,18-21
We conducted a study to compare the clinical results and operative times of knotless and knotted fixation of anterior and posterior glenohumeral labral repairs and SLAP repairs. We hypothesized there would be no difference in patient-reported outcome measures (PROMs) between knotted and knotless techniques.
Methods
We retrospectively evaluated data that had been prospectively collected between 2012 and 2016 in a Surgical Outcomes System (SOS; Arthrex) database. Participation in this registry is elective, and enrollment can occur on a case-by-case basis. The database stores data on basic demographics, PROMs, and operative time. Data for our specific analysis were available for surgeries performed by 115 different surgeons. Inclusion criteria included primary isolated arthroscopic anterior, isolated posterior, and isolated SLAP repair with completely knotted or completely knotless labral repair and minimum 1-year follow-up. Exclusion criteria included hybrid knotted–knotless repair, rotator cuff repair, revision surgery, open surgery, and lack of complete follow-up data.
SOS is a proprietary registry that allows for the collection of basic patient demographics, diagnostic and operative data, and PROMs. PROMs in the SOS shoulder arthroscopy module include Veterans RAND 12-Item Health Survey (VR-12) mental health and physical health component summary scores, visual analog scale (VAS) pain scores, and American Shoulder and Elbow Surgeons (ASES) scores. For this study, PROMs were reviewed before surgery and 6 and 12 months after surgery. In addition, operative times of all procedures were collected.
For the analysis, completely knotted and completely knotless techniques were compared for anterior repair, posterior repair, and SLAP repair. A t test was used to compare the techniques on PROMs, and χ2 test was used to evaluate proportion differences. Statistical significance was set at P < .05.
Results
Anterior Labral Repairs
Of the 102 knotted anterior labral repairs that met the study criteria, 26 (25%) had minimum 1-year follow-up. Of the 122 knotless labral repairs, 33 (27%) had minimum 1-year follow-up. Seventy-five percent of knotted repairs and 80% of knotless repairs were performed in men. Mean (SD) age was 25.3 (11.7) years for the knotted group and 26.9 (10.6) years for the knotless group (P = .109). Anterior labral repairs did not differ in PROMs at any point (Table 1).
A mean of 2.8 anchors was used for knotted repairs, and a mean of 3.1 anchors was used for knotless repairs. Mean operative time was 75.8 minutes for knotted repairs and 67.5 minutes for knotless repairs. Mean (SD) time per anchor was 30.9 (13.9) minutes for knotted repairs and 25.6 (19.5) minutes for knotless repairs (P = .021).
Posterior Labral Repairs
Of the 165 knotted posterior labral repairs that met the study criteria, 39 (29%) had minimum 1-year follow-up. Of the 229 knotless labral repairs, 56 (24%) had minimum 1-year follow-up. Eighty-five percent of knotted repairs and 74% of knotless repairs were performed in men. Mean (SD) age was 29.1 (12.0) years for the knotted group and 27.5 (11.9) years for the knotless group (P = .148). Posterior labral repairs did not differ in PROMs before surgery or 1 year after surgery; 6 months after surgery, these repairs differed only in ASES scores (Table 2). 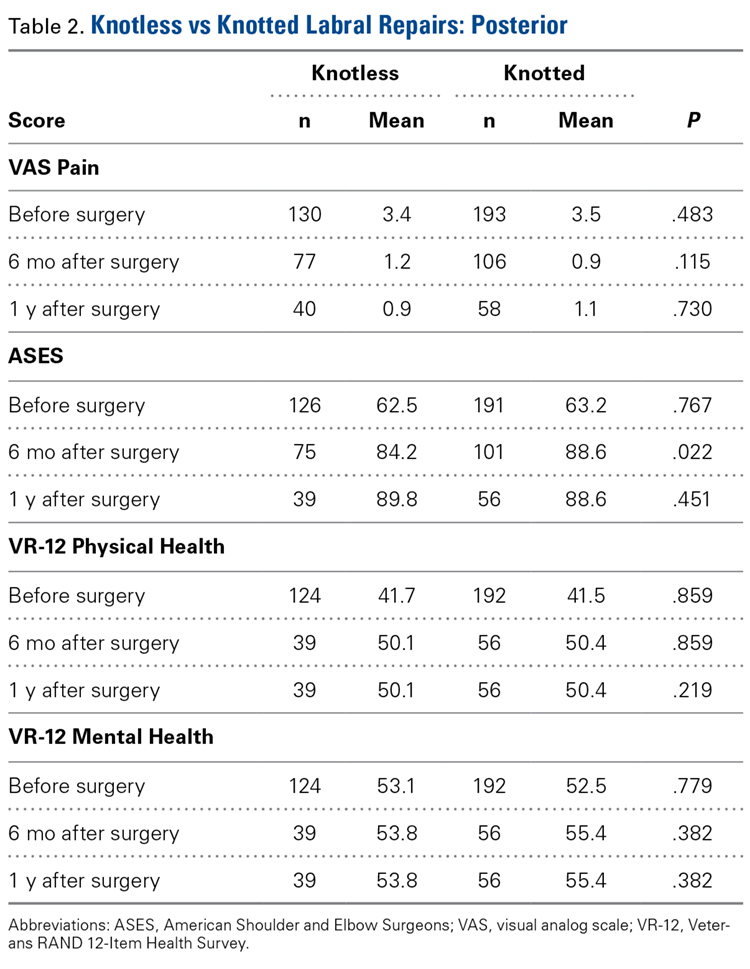
A mean of 3.6 anchors was used for knotted repairs, and a mean of 3.0 anchors was used for knotless repairs. Mean operative time was 67.0 minutes for knotted repairs and 43.1 minutes for knotless repairs. Mean (SD) time per anchor was 21.1 (10.7) minutes for knotted repairs and 17.5 (14.7) minutes for knotless repairs (P = .031).
SLAP Repairs
Of the 54 knotted SLAP repairs that met the study criteria, 24 (44%) had minimum 1-year follow-up. Of the 138 knotless SLAP repairs, 48 (35%) had minimum 1-year follow-up. Seventy-two percent of knotted repairs and 72% of knotless repairs were performed in men. Mean (SD) age was 32.1 (11.6) years for the knotted group and 35.0 (12.8) years for the knotless group (P = .246). SLAP repairs did not differ in PROMs at any point (Table 3).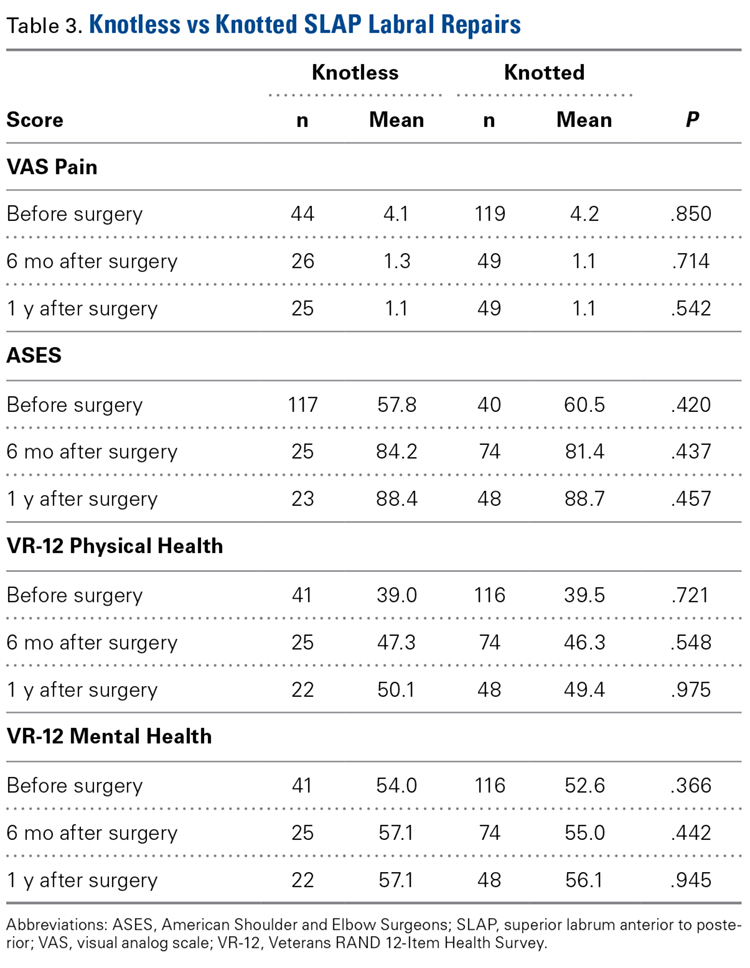
A mean of 1.9 anchors was used for knotted repairs, and a mean of 2.1 anchors was used for knotless repairs. Mean operative time was 59.0 minutes for knotted repairs and 40.9 minutes for knotless repairs. Mean (SD) time per anchor was 36.6 (22.4) minutes for knotted repairs and 26.3 (14.0) minutes for knotless repairs (P = .080).
Discussion
Our hypothesis that there would be no difference in PROMs between knotted and knotless labral repairs was confirmed. Our findings are important because this study compared the gold standard of knotted suture anchor with the alternative knotless suture anchor in glenohumeral labral repair. These findings have several important implications for labral repair.
Knot tying traditionally has been used to achieve fixation with an anchor. Although simple in concept, knot tying can be challenging and its quality variable. Thal15 wrote that good-quality arthroscopic suture anchor repair is difficult to achieve because satisfactory knot tying requires significant practice with certain devices designed specifically for knot tying. Multiple surgeons have noted a significant learning curve associated with knot tying, and there is no agreement on which knot is superior.22-26 Leedle and Miller17 even suggested that, because knot tying is difficult, tying knots arthroscopically can lead to knot failure. In their study, they concluded that the knot is consistently the weakest link in suture repair of an anterior labrum construct. In a controlled laboratory study, Hanypsiak and colleagues13 found considerable knot-strength variability among expert arthroscopists. Only 65 (18%) of 365 knots tied fell within 20% of the mean for ultimate load failure, and only 128 (36%) of 365 fell within 20% of the mean for clinical failure (3 mm of displacement). These data suggested expert arthroscopists were unable to tie 5 consecutive knots of the same type consistently. Even among experts, it seems, knot strength varies significantly, and knot-strength issues may affect the rates of labral repair failure.
Multiple authors have also reported that bulky knots can cause chondral abrasion or that knots can migrate.25,27 Rhee and Ha27 reported that, when another knot (eg, a half-hitch knot) is tied to prevent knot failure, the resulting overall knot can be too bulky for a limited space, and chondral abrasion can result. In addition, regardless of size, a knot can migrate and, in its new position, start rubbing against the head of the humerus. Kim and colleagues14 found that, even when a knot is placed away from the humeral head, migration and repeated contact with the head are possible. Park and colleagues28 found that a significant number of knotted SLAP repairs required arthroscopic knot removal for relief of knot-induced pain and clicking.
Knotless constructs have several theoretical advantages over knotted constructs. Compared with a knotted technique, a knotless technique appears to provide more predictable strength, as variability in knot tying is eliminated (unpublished data). A knotless repair also has a lower profile,8 which should lead to less contact with the humeral head.19 Last, a knotless repair is more efficient—it takes less time to perform. In our study, operative time was reduced by a mean of 5.3 minutes per anchor for anterior labral repair. Assuming a mean of 3 anchors, this reduction equates to 16 minutes per case. Therefore, a surgeon who performs 25 labral repairs a year can save 6.7 hours a year. Reduced operative time benefits the patient (ie, lower risk of infection and other complications29), the surgeon, and the healthcare system (ie, cost savings). Macario30 found that operating room costs averaged $62 per minute (range, $22-$133 per minute). Therefore, saving 16 minutes per case could lead to saving $992 per case. In summary, a knotless technique appears to be clinically and financially advantageous as long as its results are the same as or better than those of a knotted technique.
A few other studies have compared knotted and knotless techniques. In a cadaveric study, Slabaugh and colleagues20 found no difference in labral height between traditional and knotless suture anchors. Leedle and Miller17 found that knotless constructs are biomechanically stronger than knotted constructs in anterior labral repair. In a level 3 clinical study, Yang and colleagues21 compared a conventional vertical knot with a knotless horizontal mattress suture in 41 patients who underwent SLAP repair. Functional outcome was no different between the 2 groups, but postoperative range of motion was improved in the knotless group. Ng and Kumar31 compared 45 patients who had knotted Bankart repair with 42 patients who had knotless Bankart repair and found no difference in functional outcome or rate of recurrent dislocation. Similarly, Kocaoglu and colleagues22 found no difference in recurrence rate between 18 patients who underwent a knotted technique for arthroscopic Bankart repair and 20 patients who underwent a knotless technique. Our findings corroborate the findings of these studies and further support the idea that there is no difference between knotted and knotless constructs with respect to PROMs.
Study Limitations
The major strength of this study was its large cohort and large population of surgeons. However, there were several study limitations. First, we could not detail specific repair techniques, such as simple or horizontal mattress orientation, and rehabilitation protocols and other variables are likely as well. Second, the repair technique was not randomized, and therefore there may have been a selection bias based on tissue quality. Although we cannot prove no bias, we think it was unlikely given that the groups were similar in age. Third, our data did not include information on range of motion or recurrent instability. Our goal was simply to evaluate PROMs among multiple surgeons using the 2 techniques. Fourth, there was substantial follow-up loss, which introduced potential selection bias. Last, there may have been conditions under which a hybrid technique with inferior knot tying, combined with a hybrid knotless construct, could have proved advantageous.
Conclusion
Our data showed that the advantages of knotless repair are not compromised in clinical situations. Although the data showed no significant difference in clinical outcomes, knotless repairs may provide surgeons with shorter surgeries, simpler constructs, less potential for chondral damage, and more consistent suture tensioning. Additional studies may further confirm these results.
1. Levy DM, Cole BJ, Bach BR Jr. History of surgical intervention of anterior shoulder instability. J Shoulder Elbow Surg. 2016;25(6):e139-e150.
2. Gill TJ, Zarins B. Open repairs for the treatment of anterior shoulder instability. Am J Sports Med. 2003;31(1):142-153.
3. Millett PJ, Clavert P, Warner JJ. Open operative treatment for anterior shoulder instability: when and why? J Bone Joint Surg Am. 2005;87(2):419-432.
4. Stein DA, Jazrawi L, Bartolozzi AR. Arthroscopic stabilization of anterior shoulder instability: a review of the literature. Arthroscopy. 2002;18(8):912-924.
5. Kim SH, Ha KI, Kim SH. Bankart repair in traumatic anterior shoulder instability: open versus arthroscopic technique. Arthroscopy. 2002;18(7):755-763.
6. Snyder SJ, Karzel RP, Del Pizzo W, Ferkel RD, Friedman MJ. SLAP lesions of the shoulder. Arthroscopy. 1990;6(4):274-279.
7. Hantes M, Raoulis V. Arthroscopic findings in anterior shoulder instability. Open Orthop J. 2017;11:119-132.
8. Sileo MJ, Lee SJ, Kremenic IJ, et al. Biomechanical comparison of a knotless suture anchor with standard suture anchor in the repair of type II SLAP tears. Arthroscopy. 2009;25(4):348-354.
9. Iqbal S, Jacobs U, Akhtar A, Macfarlane RJ, Waseem M. A history of shoulder surgery. Open Orthop J. 2013;7:305-309.
10. Garofalo R, Mocci A, Moretti B, et al. Arthroscopic treatment of anterior shoulder instability using knotless suture anchors. Arthroscopy. 2005;21(11):1283-1289.
11. Kersten AD, Fabing M, Ensminger S, et al. Suture capsulorrhaphy versus capsulolabral advancement for shoulder instability. Arthroscopy. 2012;28(10):1344-1351.
12. Cole BJ, Warner JJ. Arthroscopic versus open Bankart repair for traumatic anterior shoulder instability. Clin Sports Med. 2000;19(1):19-48.
13. Hanypsiak BT, DeLong JM, Simmons L, Lowe W, Burkhart S. Knot strength varies widely among expert arthroscopists. Am J Sports Med. 2014;42(8):1978-1984.
14. Kim SH, Ha KI, Park JH, et al. Arthroscopic posterior labral repair and capsular shift for traumatic unidirectional recurrent posterior subluxation of the shoulder. J Bone Joint Surg Am. 2003;85(8):1479-1487.
15. Thal R. Knotless suture anchor. Clin Orthop Relat Res. 2001;(390):42-51.
16. Loutzenheiser TD, Harryman DT 2nd, Yung SW, France MP, Sidles JA. Optimizing arthroscopic knots. Arthroscopy. 1995;11(2):199-206.
17. Leedle BP, Miller MD. Pullout strength of knotless suture anchors. Arthroscopy. 2005;21(1):81-85.
18. Caldwell PE 3rd, Pearson SE, D’Angelo MS. Arthroscopic knotless repair of the posterior labrum using LabralTape. Arthrosc Tech. 2016;5(2):e315-e320.
19. Tennent D, Concina C, Pearse E. Arthroscopic posterior stabilization of the shoulder using a percutaneous knotless mattress suture technique. Arthrosc Tech. 2014;3(1):e161-e164.
20. Slabaugh MA, Friel NA, Wang VM, Cole BJ. Restoring the labral height for treatment of Bankart lesions: a comparison of suture anchor constructs. Arthroscopy. 2010;26(5):587-591.
21. Yang HJ, Yoon K, Jin H, Song HS. Clinical outcome of arthroscopic SLAP repair: conventional vertical knot versus knotless horizontal mattress sutures. Knee Surg Sports Traumatol Arthrosc. 2016;24(2):464-469.
22. Kocaoglu B, Guven O, Nalbantoglu U, Aydin N, Haklar U. No difference between knotless sutures and suture anchors in arthroscopic repair of Bankart lesions in collision athletes. Knee Surg Sports Traumatol Arthrosc. 2009;17(7):844-849.
23. Aboalata M, Halawa A, Basyoni Y. The double Bankart bridge: a technique for restoration of the labral footprint in arthroscopic shoulder instability repair. Arthrosc Tech. 2017;6(1):e43-e47.
24. Rhee SM, Kang SY, Jang EC, Kim JY, Ha YC. Clinical outcomes after arthroscopic acetabular labral repair using knot-tying or knotless suture technique. Arch Orthop Trauma Surg. 2016;136(10):1411-1416.
25. Oh JH, Lee HK, Kim JY, Kim SH, Gong HS. Clinical and radiologic outcomes of arthroscopic glenoid labrum repair with the BioKnotless suture anchor. Am J Sports Med. 2009;37(12):2340-2348.
26. Yian E, Wang C, Millett PJ, Warner JJ. Arthroscopic repair of SLAP lesions with a BioKnotless suture anchor. Arthroscopy. 2004;20(5):547-551.
27. Rhee YG, Ha JH. Knot-induced glenoid erosion after arthroscopic fixation for unstable superior labrum anterior-posterior lesion: case report. J Shoulder Elbow Surg. 2006;15(3):391-393.
28. Park JG, Cho NS, Kim JY, Song JH, Hong SJ, Rhee YG. Arthroscopic knot removal for failed superior labrum anterior-posterior repair secondary to knot-induced pain. Am J Sports Med. 2017;45(11):2563-2568.
29. Wang DS. Re: how slow is too slow? Correlation of operative time to complications: an analysis from the Tennessee Surgical Quality Collaborative. J Urol. 2016;195(5):1510-1511.
30. Macario A. What does one minute of operating room time cost? J Clin Anesth. 2010;22(4):233-236.
31. Ng DZ, Kumar VP. Arthroscopic Bankart repair using knot-tying versus knotless suture anchors: is there a difference? Arthroscopy. 2014;30(4):422-427.
Take-Home Points
- There is no difference in PROMs following knotless or knotted labral repair.
- Operative time is shorter for knotless compared to knotted glenoid labral tears.
- Knotless constructs may be more predictable than knotted constructs biomechanically.
Orthopedic surgeons often encounter labral pathology, and labral tears historically have required open techniques.1-3 Arthroscopy allows for advanced visualization and treatment of shoulder lesions,4,5 including anterior, posterior, and superior labrum anterior to posterior (SLAP) lesions.6
The goal of arthroscopic labral repair is to restore joint stability while maintaining range of motion. Arthroscopically repairing the labrum with suture anchors has become the standard technique, and several studies have reported satisfactory biomechanical and clinical results.1,7-12 Surgeons traditionally have been required to tie knots for these anchors, but knot security varies significantly among experienced arthroscopic surgeons.13 In addition, knots can migrate,14 and bulky knots can cause chondral abrasion.15,16 Several manufacturers have introduced knotless anchors for soft-tissue fixation.15,17 The knotless technique provides a low-profile repair with potentially less operating time.8 These factors may warrant switching from knotted to knotless techniques if outcomes are clinically acceptable. However, few studies have compared knotted and knotless techniques for glenohumeral labral repair.8,15,18-21
We conducted a study to compare the clinical results and operative times of knotless and knotted fixation of anterior and posterior glenohumeral labral repairs and SLAP repairs. We hypothesized there would be no difference in patient-reported outcome measures (PROMs) between knotted and knotless techniques.
Methods
We retrospectively evaluated data that had been prospectively collected between 2012 and 2016 in a Surgical Outcomes System (SOS; Arthrex) database. Participation in this registry is elective, and enrollment can occur on a case-by-case basis. The database stores data on basic demographics, PROMs, and operative time. Data for our specific analysis were available for surgeries performed by 115 different surgeons. Inclusion criteria included primary isolated arthroscopic anterior, isolated posterior, and isolated SLAP repair with completely knotted or completely knotless labral repair and minimum 1-year follow-up. Exclusion criteria included hybrid knotted–knotless repair, rotator cuff repair, revision surgery, open surgery, and lack of complete follow-up data.
SOS is a proprietary registry that allows for the collection of basic patient demographics, diagnostic and operative data, and PROMs. PROMs in the SOS shoulder arthroscopy module include Veterans RAND 12-Item Health Survey (VR-12) mental health and physical health component summary scores, visual analog scale (VAS) pain scores, and American Shoulder and Elbow Surgeons (ASES) scores. For this study, PROMs were reviewed before surgery and 6 and 12 months after surgery. In addition, operative times of all procedures were collected.
For the analysis, completely knotted and completely knotless techniques were compared for anterior repair, posterior repair, and SLAP repair. A t test was used to compare the techniques on PROMs, and χ2 test was used to evaluate proportion differences. Statistical significance was set at P < .05.
Results
Anterior Labral Repairs
Of the 102 knotted anterior labral repairs that met the study criteria, 26 (25%) had minimum 1-year follow-up. Of the 122 knotless labral repairs, 33 (27%) had minimum 1-year follow-up. Seventy-five percent of knotted repairs and 80% of knotless repairs were performed in men. Mean (SD) age was 25.3 (11.7) years for the knotted group and 26.9 (10.6) years for the knotless group (P = .109). Anterior labral repairs did not differ in PROMs at any point (Table 1).
A mean of 2.8 anchors was used for knotted repairs, and a mean of 3.1 anchors was used for knotless repairs. Mean operative time was 75.8 minutes for knotted repairs and 67.5 minutes for knotless repairs. Mean (SD) time per anchor was 30.9 (13.9) minutes for knotted repairs and 25.6 (19.5) minutes for knotless repairs (P = .021).
Posterior Labral Repairs
Of the 165 knotted posterior labral repairs that met the study criteria, 39 (29%) had minimum 1-year follow-up. Of the 229 knotless labral repairs, 56 (24%) had minimum 1-year follow-up. Eighty-five percent of knotted repairs and 74% of knotless repairs were performed in men. Mean (SD) age was 29.1 (12.0) years for the knotted group and 27.5 (11.9) years for the knotless group (P = .148). Posterior labral repairs did not differ in PROMs before surgery or 1 year after surgery; 6 months after surgery, these repairs differed only in ASES scores (Table 2).
A mean of 3.6 anchors was used for knotted repairs, and a mean of 3.0 anchors was used for knotless repairs. Mean operative time was 67.0 minutes for knotted repairs and 43.1 minutes for knotless repairs. Mean (SD) time per anchor was 21.1 (10.7) minutes for knotted repairs and 17.5 (14.7) minutes for knotless repairs (P = .031).
SLAP Repairs
Of the 54 knotted SLAP repairs that met the study criteria, 24 (44%) had minimum 1-year follow-up. Of the 138 knotless SLAP repairs, 48 (35%) had minimum 1-year follow-up. Seventy-two percent of knotted repairs and 72% of knotless repairs were performed in men. Mean (SD) age was 32.1 (11.6) years for the knotted group and 35.0 (12.8) years for the knotless group (P = .246). SLAP repairs did not differ in PROMs at any point (Table 3).
A mean of 1.9 anchors was used for knotted repairs, and a mean of 2.1 anchors was used for knotless repairs. Mean operative time was 59.0 minutes for knotted repairs and 40.9 minutes for knotless repairs. Mean (SD) time per anchor was 36.6 (22.4) minutes for knotted repairs and 26.3 (14.0) minutes for knotless repairs (P = .080).
Discussion
Our hypothesis that there would be no difference in PROMs between knotted and knotless labral repairs was confirmed. Our findings are important because this study compared the gold standard of knotted suture anchor with the alternative knotless suture anchor in glenohumeral labral repair. These findings have several important implications for labral repair.
Knot tying traditionally has been used to achieve fixation with an anchor. Although simple in concept, knot tying can be challenging and its quality variable. Thal15 wrote that good-quality arthroscopic suture anchor repair is difficult to achieve because satisfactory knot tying requires significant practice with certain devices designed specifically for knot tying. Multiple surgeons have noted a significant learning curve associated with knot tying, and there is no agreement on which knot is superior.22-26 Leedle and Miller17 even suggested that, because knot tying is difficult, tying knots arthroscopically can lead to knot failure. In their study, they concluded that the knot is consistently the weakest link in suture repair of an anterior labrum construct. In a controlled laboratory study, Hanypsiak and colleagues13 found considerable knot-strength variability among expert arthroscopists. Only 65 (18%) of 365 knots tied fell within 20% of the mean for ultimate load failure, and only 128 (36%) of 365 fell within 20% of the mean for clinical failure (3 mm of displacement). These data suggested expert arthroscopists were unable to tie 5 consecutive knots of the same type consistently. Even among experts, it seems, knot strength varies significantly, and knot-strength issues may affect the rates of labral repair failure.
Multiple authors have also reported that bulky knots can cause chondral abrasion or that knots can migrate.25,27 Rhee and Ha27 reported that, when another knot (eg, a half-hitch knot) is tied to prevent knot failure, the resulting overall knot can be too bulky for a limited space, and chondral abrasion can result. In addition, regardless of size, a knot can migrate and, in its new position, start rubbing against the head of the humerus. Kim and colleagues14 found that, even when a knot is placed away from the humeral head, migration and repeated contact with the head are possible. Park and colleagues28 found that a significant number of knotted SLAP repairs required arthroscopic knot removal for relief of knot-induced pain and clicking.
Knotless constructs have several theoretical advantages over knotted constructs. Compared with a knotted technique, a knotless technique appears to provide more predictable strength, as variability in knot tying is eliminated (unpublished data). A knotless repair also has a lower profile,8 which should lead to less contact with the humeral head.19 Last, a knotless repair is more efficient—it takes less time to perform. In our study, operative time was reduced by a mean of 5.3 minutes per anchor for anterior labral repair. Assuming a mean of 3 anchors, this reduction equates to 16 minutes per case. Therefore, a surgeon who performs 25 labral repairs a year can save 6.7 hours a year. Reduced operative time benefits the patient (ie, lower risk of infection and other complications29), the surgeon, and the healthcare system (ie, cost savings). Macario30 found that operating room costs averaged $62 per minute (range, $22-$133 per minute). Therefore, saving 16 minutes per case could lead to saving $992 per case. In summary, a knotless technique appears to be clinically and financially advantageous as long as its results are the same as or better than those of a knotted technique.
A few other studies have compared knotted and knotless techniques. In a cadaveric study, Slabaugh and colleagues20 found no difference in labral height between traditional and knotless suture anchors. Leedle and Miller17 found that knotless constructs are biomechanically stronger than knotted constructs in anterior labral repair. In a level 3 clinical study, Yang and colleagues21 compared a conventional vertical knot with a knotless horizontal mattress suture in 41 patients who underwent SLAP repair. Functional outcome was no different between the 2 groups, but postoperative range of motion was improved in the knotless group. Ng and Kumar31 compared 45 patients who had knotted Bankart repair with 42 patients who had knotless Bankart repair and found no difference in functional outcome or rate of recurrent dislocation. Similarly, Kocaoglu and colleagues22 found no difference in recurrence rate between 18 patients who underwent a knotted technique for arthroscopic Bankart repair and 20 patients who underwent a knotless technique. Our findings corroborate the findings of these studies and further support the idea that there is no difference between knotted and knotless constructs with respect to PROMs.
Study Limitations
The major strength of this study was its large cohort and large population of surgeons. However, there were several study limitations. First, we could not detail specific repair techniques, such as simple or horizontal mattress orientation, and rehabilitation protocols and other variables are likely as well. Second, the repair technique was not randomized, and therefore there may have been a selection bias based on tissue quality. Although we cannot prove no bias, we think it was unlikely given that the groups were similar in age. Third, our data did not include information on range of motion or recurrent instability. Our goal was simply to evaluate PROMs among multiple surgeons using the 2 techniques. Fourth, there was substantial follow-up loss, which introduced potential selection bias. Last, there may have been conditions under which a hybrid technique with inferior knot tying, combined with a hybrid knotless construct, could have proved advantageous.
Conclusion
Our data showed that the advantages of knotless repair are not compromised in clinical situations. Although the data showed no significant difference in clinical outcomes, knotless repairs may provide surgeons with shorter surgeries, simpler constructs, less potential for chondral damage, and more consistent suture tensioning. Additional studies may further confirm these results.
1. Levy DM, Cole BJ, Bach BR Jr. History of surgical intervention of anterior shoulder instability. J Shoulder Elbow Surg. 2016;25(6):e139-e150.
2. Gill TJ, Zarins B. Open repairs for the treatment of anterior shoulder instability. Am J Sports Med. 2003;31(1):142-153.
3. Millett PJ, Clavert P, Warner JJ. Open operative treatment for anterior shoulder instability: when and why? J Bone Joint Surg Am. 2005;87(2):419-432.
4. Stein DA, Jazrawi L, Bartolozzi AR. Arthroscopic stabilization of anterior shoulder instability: a review of the literature. Arthroscopy. 2002;18(8):912-924.
5. Kim SH, Ha KI, Kim SH. Bankart repair in traumatic anterior shoulder instability: open versus arthroscopic technique. Arthroscopy. 2002;18(7):755-763.
6. Snyder SJ, Karzel RP, Del Pizzo W, Ferkel RD, Friedman MJ. SLAP lesions of the shoulder. Arthroscopy. 1990;6(4):274-279.
7. Hantes M, Raoulis V. Arthroscopic findings in anterior shoulder instability. Open Orthop J. 2017;11:119-132.
8. Sileo MJ, Lee SJ, Kremenic IJ, et al. Biomechanical comparison of a knotless suture anchor with standard suture anchor in the repair of type II SLAP tears. Arthroscopy. 2009;25(4):348-354.
9. Iqbal S, Jacobs U, Akhtar A, Macfarlane RJ, Waseem M. A history of shoulder surgery. Open Orthop J. 2013;7:305-309.
10. Garofalo R, Mocci A, Moretti B, et al. Arthroscopic treatment of anterior shoulder instability using knotless suture anchors. Arthroscopy. 2005;21(11):1283-1289.
11. Kersten AD, Fabing M, Ensminger S, et al. Suture capsulorrhaphy versus capsulolabral advancement for shoulder instability. Arthroscopy. 2012;28(10):1344-1351.
12. Cole BJ, Warner JJ. Arthroscopic versus open Bankart repair for traumatic anterior shoulder instability. Clin Sports Med. 2000;19(1):19-48.
13. Hanypsiak BT, DeLong JM, Simmons L, Lowe W, Burkhart S. Knot strength varies widely among expert arthroscopists. Am J Sports Med. 2014;42(8):1978-1984.
14. Kim SH, Ha KI, Park JH, et al. Arthroscopic posterior labral repair and capsular shift for traumatic unidirectional recurrent posterior subluxation of the shoulder. J Bone Joint Surg Am. 2003;85(8):1479-1487.
15. Thal R. Knotless suture anchor. Clin Orthop Relat Res. 2001;(390):42-51.
16. Loutzenheiser TD, Harryman DT 2nd, Yung SW, France MP, Sidles JA. Optimizing arthroscopic knots. Arthroscopy. 1995;11(2):199-206.
17. Leedle BP, Miller MD. Pullout strength of knotless suture anchors. Arthroscopy. 2005;21(1):81-85.
18. Caldwell PE 3rd, Pearson SE, D’Angelo MS. Arthroscopic knotless repair of the posterior labrum using LabralTape. Arthrosc Tech. 2016;5(2):e315-e320.
19. Tennent D, Concina C, Pearse E. Arthroscopic posterior stabilization of the shoulder using a percutaneous knotless mattress suture technique. Arthrosc Tech. 2014;3(1):e161-e164.
20. Slabaugh MA, Friel NA, Wang VM, Cole BJ. Restoring the labral height for treatment of Bankart lesions: a comparison of suture anchor constructs. Arthroscopy. 2010;26(5):587-591.
21. Yang HJ, Yoon K, Jin H, Song HS. Clinical outcome of arthroscopic SLAP repair: conventional vertical knot versus knotless horizontal mattress sutures. Knee Surg Sports Traumatol Arthrosc. 2016;24(2):464-469.
22. Kocaoglu B, Guven O, Nalbantoglu U, Aydin N, Haklar U. No difference between knotless sutures and suture anchors in arthroscopic repair of Bankart lesions in collision athletes. Knee Surg Sports Traumatol Arthrosc. 2009;17(7):844-849.
23. Aboalata M, Halawa A, Basyoni Y. The double Bankart bridge: a technique for restoration of the labral footprint in arthroscopic shoulder instability repair. Arthrosc Tech. 2017;6(1):e43-e47.
24. Rhee SM, Kang SY, Jang EC, Kim JY, Ha YC. Clinical outcomes after arthroscopic acetabular labral repair using knot-tying or knotless suture technique. Arch Orthop Trauma Surg. 2016;136(10):1411-1416.
25. Oh JH, Lee HK, Kim JY, Kim SH, Gong HS. Clinical and radiologic outcomes of arthroscopic glenoid labrum repair with the BioKnotless suture anchor. Am J Sports Med. 2009;37(12):2340-2348.
26. Yian E, Wang C, Millett PJ, Warner JJ. Arthroscopic repair of SLAP lesions with a BioKnotless suture anchor. Arthroscopy. 2004;20(5):547-551.
27. Rhee YG, Ha JH. Knot-induced glenoid erosion after arthroscopic fixation for unstable superior labrum anterior-posterior lesion: case report. J Shoulder Elbow Surg. 2006;15(3):391-393.
28. Park JG, Cho NS, Kim JY, Song JH, Hong SJ, Rhee YG. Arthroscopic knot removal for failed superior labrum anterior-posterior repair secondary to knot-induced pain. Am J Sports Med. 2017;45(11):2563-2568.
29. Wang DS. Re: how slow is too slow? Correlation of operative time to complications: an analysis from the Tennessee Surgical Quality Collaborative. J Urol. 2016;195(5):1510-1511.
30. Macario A. What does one minute of operating room time cost? J Clin Anesth. 2010;22(4):233-236.
31. Ng DZ, Kumar VP. Arthroscopic Bankart repair using knot-tying versus knotless suture anchors: is there a difference? Arthroscopy. 2014;30(4):422-427.
Update on Internet-Based Orthopedic Registries
Take-Home Points
- PRO data collection can provide feedback for improvements in patient care and physician performance.
- Many options exist for orthopedic physicians to establish clinical data registries.
- Registry systems can help improve patient follow-up with system monitoring and patient reminders.
- Clinical registries can offer many advantages to observational research.
- With registry use becoming more prevalent, work needs to be done to establish standards for validity and reliability.
In a 2012 review of database tools, Lubowitz and Smith1 examined Internet-based applications that arthroscopic surgeons could use to record and monitor patient-reported outcome (PRO) data and potential adverse effects. In this article, we update orthopedic surgeons on the registries and monitoring software mentioned in that earlier publication and in other publications that have since become available.
Most orthopedic surgery candidates are seeking pain relief and improved function. Many patients expect their pain to be completely relieved by surgical intervention and their function to return to what it was before they became stricken.2,3 Therefore, PRO measures (PROMs) are now standard in post-orthopedic surgery outcome reporting.4 PROMs, which include any measurement that assesses a patient’s health, illness, or benefits from the perspective of the patient, are often administered as a questionnaire or survey.5 The collection of PROMs continues to increase and evolve, creating a need for data storage and analysis. Registries, large collections of patient information and outcomes, allow for evaluation of patient outcomes, monitoring of adverse effects, identification of procedure incidence, understanding of predictors of prognosis, generation of feedback for quality of care, monitoring of the safety of implantable devices, and the conducting of hypothesis-driven scientific research.6-9
Orthopedic surgery has registries at regional, national, and international levels. Although the United States has fallen well behind other countries in establishing a national registry,9 it has made some recent progress. The United States now has several national registries, including the American Joint Replacement Registry (AJRR), Function and Outcomes Research for Comparative Effectiveness in Total Joint Replacement (FORCE-TJR), the Kaiser Permanente National Total Joint Replacement Registry (TJRR), the Veterans Affairs (VA) and American College of Surgeons (ACS) National Surgical Quality Improvement Programs (NSQIPs), and the National Trauma Data Bank (NTDB).9 AJRR currently has 960 hospitals participating and is tracking 1,084,664 hip and knee replacements.10
These orthopedic registries, however, are limited in 2 ways. First, the majority are joint replacement registries. Second, though registries are established to determine patterns of care and predict patient outcomes, many are not set up to report care data back to healthcare providers.7 For procedures other than joint arthroplasty and for providers interested in tracking their patients’ PROs, systems are available for establishing clinical quality registries in orthopedics.
Registry Systems
CareSense
CareSense (Medtrak) is an Internet-based care management and data collection system designed for patient engagement, which results in fewer missed appointments, increased patient adherence, enhanced patient education, and improved patient satisfaction.11 CareSense features email/text reminders for data entry, custom and standard reports, import and export of electronic medical record (EMR) information, and tools for running research studies.12 CareSense emphasizes care navigation by helping hospitals educate and guide patients through their care by sending exercise videos to patients for home rehabilitation, transferring messages from post-acute care facilities to surgeons and caregivers, and alerting the care team to any potential readmission symptoms.11,13 CareSense is also a Centers for Medicare & Medicaid Services (CMS) approved qualified clinical data registry (QCDR). QCDRs collect data for Merit-Based Incentive Payment System (MIPS) clinicians and submit the data to CMS.12
KareOutcomes
KareOutcomes, a healthcare technology and support firm founded in 2009, advocates transparency and trust among providers and patients, and aims to optimize PROs.14 The KareOutcomes team incorporates patient follow-up personnel, administrators, engineers, physicians, software developers, and technicians. The KareOutcomes software, which is backed by a 6-month guarantee, includes system design and implementation, data collection and entry, methods of submitting data to statewide or nationwide registries and sending standardized and customized surveys, and accessible and meaningful data presentation. KareOutcomes allows patient follow-up through automated reminders by telephone, SMS text message, and email. Patients can respond to surveys or questionnaires whichever way is most convenient—by telephone, Internet, SMS text message, or on paper, either in the office or by mail.
Oberd
Oberd (Universal Research Solutions) offers a comprehensive package of solutions for collecting optimal PRO data. The package has several modules: outcomes, education, registry, operative notes, data import and export, and data reporting.15 Oberd Outcomes allows convenient and engaging data collection. For example, users can send both standardized and customized forms. Oberd Education allows patients to receive information in an interactive, narrated format that is specific to their physician’s techniques and practices. Oberd Registry allows users to input multiple datasets into a registry, compare data, and generate reports with visuals. Like CareSense, Oberd is a CMS-approved QCDR. Oberd’s MIPS Dashboard helps providers collect and report patients’ reported outcomes, and use that information to modify and improve their practice.
Ortech
Ortech is a web-based data registry system that allows physicians and administrators to mine the data they own, track key metrics in their data, and improve reporting.16 Users can collect PROMs, use them to measure and analyze patient progress, and add to their collection of information that helps support their evidence-based decision making. They can capture intraoperative and implant data through barcode scanning, which then registers the data in an implant product code library that allows quick identification of patients with a specific implant in the event of a product recall. Ortech also allows automatic generation of customized operative reports on data entered from the operating room and populated into the EMR. Ortech offers 2 versions of its data collection platform, phiDB and phiDB Lite. The phiDB Lite version is for smaller practices and focuses mainly on PROMs but lacks many of the other features that phiDB offers, such as operating room modules, automated operative reports, barcode scanning, and unlimited data reporting.
Socrates
Socrates (Standardised Orthopaedic Clinical Research and Treatment Evaluation Software; Ortholink) is dedicated orthopedic software that facilitates following patient outcomes and conducting high-quality research.17 Socrates is fully customizable to fit each user’s needs. It allows for tracking of outcome scores, intraoperative details, nonoperative procedures, clinical examinations, therapies, and adverse effects. Users can also create reports from this information, which is inputted to Socrates and can be exported into EMR. Socrates data are stored on the user’s server, on site; the software generates patient summaries, collective summaries, and follow-up reports through its built-in descriptive statistics module. Raw data can be extracted for statistical analysis. Socrates can catalogue images, radiographs, documents, and videos.
Surgical Outcomes System
Surgical Outcomes System (SOS; Arthrex) is a cloud-based orthopedic and sports medicine global registry that focuses on monitoring and evaluating the outcomes of various orthopedic and sports medicine surgical procedures, as well as nonoperative interventions, to contribute to evidence-based protocols for patient treatment.18 SOS can be fully customized with desired PROMs for arthroplasty and for surgical procedures for extremity joints and even the spine. SOS includes real-time reporting on PROs for individual patients, summary PROMs for all of the physician’s patients who are receiving the same treatment, and comparisons with all registry patients (from global de-identified registry data) who had the same treatment or surgery. This real-time analysis provides immediate patient and physician feedback on treatments and products used. A patient portal for education on surgical procedures is also available. SOS is approved for use in 21 countries and is a benefit included with Arthroscopy Association of North America (AANA) membership. SOS is listed on the National Quality Registry Network (NQRN) website and, as a specialized registry as defined by CMS, can accept data generated by EMR technology.
Discussion
Delaunay19 indicated that successful registry management depends on several factors, including “use of a single identifier for each patient to ensure full traceability of all procedures related to a given implant; a long-term funding source; a contemporary, rapid, Internet-based data collection method; and the collection of exhaustive data, at least for innovative implants.” The registry systems reviewed in this article are Internet based and allow healthcare providers to monitor the clinical outcomes of their patients in the hope of improving clinical decision-making and overall patient care. From the provider perspective, many registry systems allow for integration of outcome data reporting into EMRs, including generation of operative reports. In turn, registries can improve documentation efficiency, as it was estimated that a US physician without a registry spends more than 15 hours a week reporting quality measures,20 or almost 800 hours and $15 billion each year.20,21 It remains to be seen whether registry systems will optimize the documentation process, but there is potential improvement in time and cost-efficiency with registry use.
Although the factors involved in management are important, clinical data registries must have systems in place to help ensure patient adherence and minimize selection bias, as adherence is crucial in data accuracy.3 What helps with adherence is the ability to send automated email or SMS text message reminders to patients. According to a review, email reminders increased the completion of PROM datasets by 26%.22 When the new national quality register (NQR) HAKIR (Handkirurgiskt kvalitetsregister) was established in Sweden, it was found that when only 1 type of reminder was used (SMS text message, in this case), only about 30% of participants completed their questionnaires.23 However, after the system was changed to send both SMS text message and email reminders, the response rate increased from 50% to 60%. Using 2 types of automated reminders might minimize lost data more effectively than 1 type alone.
Another benefit of outcome monitoring through a registry is potential reduction of interviewer- related errors. Interviewer bias can occur in many different ways. Interviewers might not follow the same instructions or administer questionnaires or surveys the same way for different patients,24 the interviewer’s presence might cause the patient to alter responses based on social norms,25 and the patient might report better outcomes in the presence of a physician or interviewer.26,27 Given that clinical registries allow electronic capture of self-administered surveys, interviewer bias is reduced because all patients receive a standardized set of questions and instructions. In addition, electronic questionnaires and surveys prompt users to add or fix missed or incorrectly completed items, further reducing potential data inaccuracies.
Healthcare costs continue to rise in the United States. In 2015, the total cost of healthcare expenditure in the United States was $3.2 trillion, or almost 18% of the US gross domestic product.28 In addition, in the first half of 2016, an estimated 16.2% of people under age 65 years were in families that were struggling to pay medical bills.29,30 Healthcare reform provides a financial incentive to healthcare providers to collaborate to reduce unnecessary costs and procedures and improve the quality of healthcare.31 Porter and Teisberg32 defined value as health outcomes achieved per dollar spent. Registry monitoring of PROMs, which are the numerator in this critical value formula, allows providers to track patient outcomes over time to determine which interventions produce the best outcomes.22 Therefore, clinical registries play an important role in improving health outcomes and reducing the cost of healthcare.7
Since the Swedish Knee Arthroplasty Register (SKAR) was established 40 years ago, NQRs have been commonplace in Scandinavian countries, Australia, and the United Kingdom.23 Between 2001 and 2014, the Australian Orthopaedic Association National Joint Replacement Registry (AOANJRR) documented a decline in the financial burden of hip and knee arthroplasty revision in Australia—in comparison with the United States, which did not have a full national registry at the time and showed a revision rate increase.24 The economic benefit of reducing hip and knee arthroplasty revisions in Australia during that period was an estimated $65 million to $143 million.24 Besides having financial benefits, national registries allow early identification of flawed implantation products and methods, leading to a further reduction in the burden associated with recall and future use of such defective implants—including patient harm.
In addition to monitoring existing techniques and devices, registries can also follow new techniques and, compared with publication in clinical journals, more expeditiously provide clinical data for outcome expectations and treatment methods. This timeliness is particularly valuable given that publication of clinical trials with the usual mandatory 2-year follow-up can take 4 years or longer.33,34 For instance, in the expanding field of hip arthroscopy, data from registries in both Sweden and Denmark are being analyzed.35,36 These data are important in new fields such as hip arthroscopy, in which clinical indications and treatment techniques may vary considerably between locations.35 In 2012, the Danish Hip Arthroscopy Registry (DHAR) was started as a web-based prospective registry.36 Between 2012 and December 2014, DHAR added 2000 procedures, which included all hip arthroscopy procedures performed at 11 centers in Denmark.36 DHAR tracks PROM, surgical procedure, operative, and radiologic data.
Increased use of clinical registries has led to use of their data in clinical research. Registry-based randomized controlled trials (RCTs) are lower in cost than other types of research, allow for rapid enrollment of patients, offer larger population sizes and multi-institutional sampling, and can provide a more diverse patient population.19,37 Although nonregistry RCTs remain the gold standard of clinical research, registry RCTs have several advantages given the abilities and structure of registries. Because of resources and cost, nonregistry RCTs are usually limited in the number of examined exposures and typically focus on only 2.6 Registry RCTs, on the other hand, can monitor multiple exposures, typically at minimal cost difference.6 Another disadvantage of nonregistry RCTs is that they are often performed at institutions providing care that might not be indicative of the quality most patients expect, as these institutions might be selected for a specific clinician or specialty service.
Registry RCTs also have their limitations with respect to clinical research. A major one is their lack of validity standards or accepted benchmarks for accuracy, adherence rates, registry completeness, and data collection.37,38 In addition, lack of standardization across national and international registries could produce conflicting data. Another limitation is that data in most registries are not subjected to any third-party checks or independent auditing.9,39 Furthermore, evaluating the impact of registries is difficult because it is difficult to find comparable outcome data on nonregistry patients.40 A final limitation involves the ethics of including registry data in RCTs. Although data are often added to a registry without patient consent, should the same data be used for research without patient consent? Should patients be able to disallow use of their data for research, or require a notification each time their data are used? These issues must be addressed.
Review Limitations
One limitation of this review of clinical Internet-based outcome systems is that it might not have identified comparable systems. In addition, specific costs associated with each system were not addressed, as they depend on PROM licensing fees, total institutional access, other proprietary costs, and other variables. Another limitation, in terms of creating a national or international registry, continues to be Internet access. The Pew Research Center estimated that 84% of US adults used the Internet in 2015.41 Although 84% represents most of the adult population, the other 16% typically is over age 65 years, where only 58% of adults reported using the Internet, or come from lower income households, where access was <75%. For registries in European countries and North America, where Internet usage typically is >70%, this is not a significant problem. However, worldwide, only 47% of the population used the Internet in 2016.42 Internet usage by Asian and Arab states citizens was 41.6% and 41.9%, respectively, and usage by African citizens was only 25.1%. As a significant benefit of registry use is that researchers can obtain larger sample sizes, it is a problem that some populations—elderly people, people of lower socioeconomic standing, people living where the Internet is unavailable—might be underrepresented in registry data.
As mentioned, patient adherence is an ongoing issue for clinical registries. As adherence tends to decrease as more time passes after a patient’s treatment date, it is important to account for and encourage continued patient participation with outcome monitoring. Missing data lessen the validity and accuracy of a registry, increasing the likelihood that certain groups will be underrepresented. Although registry systems can reduce the cost of following PROMs, doing so requires monitoring and following up on issues of patient adherence. In other words, many clinicians will need the help of a research assistant. Makhni and colleagues21 found that adding a research assistant for this task increased survey adherence from 65% to 94% before surgery, from 65% to 72% 6 months after surgery, and from 38% to 56% 12 months after surgery.
Even though studies continue to use clinical data from registries, there is not much research on the impact of these registries on improvement in healthcare. Again, many factors are involved: lack of standardized benchmarks for accuracy and adherence, lack of an accepted method of data auditing and validation, and difficulty evaluating the impact of registries owing to the difficulty obtaining comparable data on nonregistry patients. Registries must adopt accepted forms of standardization in order to allow better comparisons of registries, because comparing data across registries can be useful in determining the strengths and weaknesses of different registries.27,43 As registries support decision making at clinical, institutional, and governmental levels, it is vital that their clinical data be accurate and reliable.38
Conclusion
Rising healthcare costs, and government and third-party pressures are making patient outcomes collection a standard of care. Going forward, orthopedic surgeons must be proactive, and Internet -based registries provide technological advances that facilitate the process.
1. Lubowitz JH, Smith PA. Current concepts in clinical research: web-based, automated, arthroscopic surgery prospective database registry. Arthroscopy. 2012;28(3):425-428.
2. Ayers DC, Bozic KJ. The importance of outcome measurement in orthopaedics. Clin Orthop Relat Res. 2013;471(11):3409-3411.
3. Nwachukwu BU, Fields K, Chang B, Nawabi DH, Kelly BT, Ranawat AS. Preoperative outcome scores are predictive of achieving the minimal clinically important difference after arthroscopic treatment of femoroacetabular impingement. Am J Sports Med. 2017;45(3):612-619.
4. Breckenridge K, Bekker HL, Gibbons E, et al. How to routinely collect data on patient-reported outcome and experience measures in renal registries in Europe: an expert consensus meeting. Nephrol Dial Transplant. 2015;30(10):1605-1614.
5. Inacio MC, Paxton EW, Dillon MT. Understanding orthopaedic registry studies: a comparison with clinical studies. J Bone Joint Surg Am. 2016;98(1):e3.
6. Hoque DME, Kumari V, Hoque M, Ruseckaite R, Romero L, Evans SM. Impact of clinical registries on quality of patient care and clinical outcomes: a systematic review. PLoS One. 2017;12(9):e0183667.
7. Physician Consortium for Performance Improvement. National Quality Registry Network. http://www.thepcpi.org/programs-initiatives/national-quality-registry-network/. Accessed October 5, 2017.
8. Hickey GL, Grant SW, Cosgriff R, et al. Clinical registries: governance, management, analysis and applications. Eur J Cardiothorac Surg. 2013;44(4):605-614.
9. Pugely AJ, Martin CT, Harwood J, Ong KL, Bozic KJ, Callaghan JJ. Database and registry research in orthopaedic surgery: part 2: clinical registry data. J Bone Joint Surg Am. 2015;97(21):1799-1808.
10. American Joint Replacement Registry. http://www.ajrr.net/. Accessed October 5, 2017.
11. CareSense. https://www.caresense.com/. Accessed October 4, 2017.
12. US Department of Health and Human Services, Centers for Medicare & Medicaid Services, Quality Payment Program. Merit-Based Incentive Payment System (MIPS): 2017 CMS-Approved Qualified Clinical Data Registries (QCDRs). https://qpp.cms.gov/docs/QPP_2017_CMS_Approved_QCDRs.pdf. Accessed October 9, 2017.
13. Johnson & Johnson. Johnson & Johnson Medical Devices Companies introduce Orthopaedic Episode of Care Approach, leveraging CareAdvantage capabilities to support better clinical outcomes and reduce the cost of care. https://www.jnj.com/media-center/press-releases/johnson-johnson-medical-devices-companies-introduce-orthopaedic-episode-of-care-approach-leveraging-careadvantage-capabilities-to-support-better-clinical-outcomes-and-reduce-the-cost-of-care. Published January 9, 2017. Accessed October 4, 2017.
14. KareOutcomes. http://www.kareoutcomes.com/. Accessed October 4, 2017.
15. Oberd. http://www.oberd.com/. Accessed October 4, 2017.
16. Ortech Systems. http://www.ortechsystems.com/. Accessed October 4, 2017.
17. Socrates. http://www.socratesortho.com/. Accessed October 4, 2017.
18. Surgical Outcomes System. https://www.surgicaloutcomesystem.com/. Accessed October 4, 2017.
19. Delaunay C. Registries in orthopaedics. Orthop Traumatol Surg Res. 2015;101(1 suppl):S69-S75.
20. Bryan S, Davis J, Broesch J, Doyle-Waters MM, Lewis S, McGrail K. Choosing your partner for the PROM: a review of evidence on patient-reported outcome measures for use in primary and community care. Healthc Policy. 2014;10(2):38-51.
21. Makhni EC, Higgins JD, Hamamoto JT, Cole BJ, Romeo AA, Verma NN. Patient compliance with electronic patient reported outcomes following shoulder arthroscopy [published online ahead of print September 25, 2017]. Arthroscopy. doi:10.1016/j.arthro.2017.06.016.
22. Triplet JJ, Momoh E, Kurowicki J, Villarroel LD, Law T, Levy JC. E-mail reminders improve completion rates of patient-reported outcome measures. JSES Open Access. 2017;1:25-28.
23. Arner M. Developing a national quality registry for hand surgery: challenges and opportunities. EFORT Open Rev. 2016;1(4):100-106.
24. Ngongo CJ, Frick KD, Hightower AW, Mathingau FA, Burke H, Breiman RF. The perils of straying from protocol: sampling bias and interviewer effects. PLoS One. 2015;10(2):e0118025.
25. Hammarstedt JE, Redmond JM, Gupta A, Dunne KF, Vemula SP, Domb BG. Survey mode influence on patient-reported outcome scores in orthopaedic surgery: telephone results may be positively biased. Knee Surg Sports Traumatol Arthrosc. 2017;25(1):50-54.
26. Hoher J, Bach T, Munster A, et al. Does the mode of data collection change results in a subjective knee score? Self-administration versus interview. Am J Sports Med. 1997;25(5):642-647.
27. Lacny S, Bohm E, Hawker G, Powell J, Marshall DA. Assessing the comparability of hip arthroplasty registries in order to improve the recording and monitoring of outcome. Bone Joint J. 2016;98-B(4):442-451.
28. US Department of Health and Human Services, Centers for Medicare & Medicaid Services, National Center for Health Statistics. Health, United States, 2016: With Chartbook on Long-Term Trends in Health. Hyattsville, MD: National Center for Health Statistics, Centers for Medicare & Medicaid Services, US Dept of Health and Human Services; 2017. DHHS Publication 2017-1232. https://www.cdc.gov/nchs/data/hus/hus16.pdf. Published May 2017. Accessed October 9, 2017.
29. Cohen RA, Zammitti EP. Problems paying medical bills among persons under age 65: early release of estimates from the National Health Interview Survey, 2011-June 2016. National Health Interview Survey Early Release Program, Division of Health Interview Statistics, National Center for Health Statistics, Centers for Medicare & Medicaid Services, US Dept of Health and Human Services. https://www.cdc.gov/nchs/data/nhis/earlyrelease/probs_paying_medical_bills_jan_2011_jun_2016.pdf. Published November 2016. Accessed October 9, 2017.
30. National Center for Health Statistics. National Health Interview Survey. http://www.cdc.gov/nchs/nhis/releases.htm. Accessed October 5, 2017.
31. Karhade AV, Larsen AMG, Cote DJ, Dubois HM, Smith TR. National databases for neurosurgical outcomes research: options, strengths, and limitations [published online ahead of print August 5, 2017]. Neurosurgery. https://doi.org/10.1093/neuros/nyx408.
32. Porter ME, Teisberg EO. Redefining Health Care: Creating Value-Based Competition on Results. Boston, MA: Harvard Business School Press; 2006.
33. Chen R, Desai NR, Ross JS, et al. Publication and reporting of clinical trial results: cross sectional analysis across academic medical centers. BMJ. 2016;352:i637.
34. Counsell N, Biri D, Fraczek J, Hackshaw A. Publishing interim results of randomised clinical trials in peer-reviewed journals. Clin Trials. 2017;14(1):67-77.
35. Sansone M, Ahldén M, Jonasson P, et al. A Swedish hip arthroscopy registry: demographics and development. Knee Surg Sports Traumatol Arthrosc. 2014;22(4):774-780.
36. Mygind-Klavsen B, Grønbech Nielsen T, Maagaard N, et al. Danish Hip Arthroscopy Registry: an epidemiologic and perioperative description of the first 2000 procedures. J Hip Preserv Surg. 2016;3(2):138-145.
37. Li G, Sajobi TT, Menon BK, et al; 2016 Symposium on Registry-Based Randomized Controlled Trials in Calgary. Registry-based randomized controlled trials—what are the advantages, challenges, and areas for future research? J Clin Epidemiol. 2016;80:16-24.
38. Bautista MP, Bonilla GA, Mieth KW. Data quality in institutional arthroplasty registries: description of model of validation and report of preliminary results. J Arthroplasty. 2017;32(7):2065-2069.
39. Tevaearai H, Carrel T. Clinical registries: yes, but then appropriately! Eur J Cardiothorac Surg. 2013;44(4):614-615.
40. Australian Commission on Safety and Quality in Health Care. Economic evaluation of clinical quality registries: final report. Sydney, Australia: ACSQHC; 2016.
41. Perrin A, Duggan M. Americans’ internet access: 2000-2015. Pew Research Center website. http://www.pewinternet.org/2015/06/26/americans-internet-access-2000-2015/. Published June 26, 2015. Accessed October 5, 2017.
42. Taylor A. 47 percent of the world’s population now use the internet, study says. https://www.washingtonpost.com/news/worldviews/wp/2016/11/22/47-percent-of-the-worlds-population-now-use-the-internet-users-study-says/. Published November 22, 2016. Accessed October 5, 2017.
43. Romero L, Nieuwenhuijse M, Carr A, Sedrakyan A. Review of clinical outcomes-based anchors of minimum clinically important differences in hip and knee registry–based reports and publications. J Bone Joint Surg Am. 2014;96(suppl 1):98-103.
Take-Home Points
- PRO data collection can provide feedback for improvements in patient care and physician performance.
- Many options exist for orthopedic physicians to establish clinical data registries.
- Registry systems can help improve patient follow-up with system monitoring and patient reminders.
- Clinical registries can offer many advantages to observational research.
- With registry use becoming more prevalent, work needs to be done to establish standards for validity and reliability.
In a 2012 review of database tools, Lubowitz and Smith1 examined Internet-based applications that arthroscopic surgeons could use to record and monitor patient-reported outcome (PRO) data and potential adverse effects. In this article, we update orthopedic surgeons on the registries and monitoring software mentioned in that earlier publication and in other publications that have since become available.
Most orthopedic surgery candidates are seeking pain relief and improved function. Many patients expect their pain to be completely relieved by surgical intervention and their function to return to what it was before they became stricken.2,3 Therefore, PRO measures (PROMs) are now standard in post-orthopedic surgery outcome reporting.4 PROMs, which include any measurement that assesses a patient’s health, illness, or benefits from the perspective of the patient, are often administered as a questionnaire or survey.5 The collection of PROMs continues to increase and evolve, creating a need for data storage and analysis. Registries, large collections of patient information and outcomes, allow for evaluation of patient outcomes, monitoring of adverse effects, identification of procedure incidence, understanding of predictors of prognosis, generation of feedback for quality of care, monitoring of the safety of implantable devices, and the conducting of hypothesis-driven scientific research.6-9
Orthopedic surgery has registries at regional, national, and international levels. Although the United States has fallen well behind other countries in establishing a national registry,9 it has made some recent progress. The United States now has several national registries, including the American Joint Replacement Registry (AJRR), Function and Outcomes Research for Comparative Effectiveness in Total Joint Replacement (FORCE-TJR), the Kaiser Permanente National Total Joint Replacement Registry (TJRR), the Veterans Affairs (VA) and American College of Surgeons (ACS) National Surgical Quality Improvement Programs (NSQIPs), and the National Trauma Data Bank (NTDB).9 AJRR currently has 960 hospitals participating and is tracking 1,084,664 hip and knee replacements.10
These orthopedic registries, however, are limited in 2 ways. First, the majority are joint replacement registries. Second, though registries are established to determine patterns of care and predict patient outcomes, many are not set up to report care data back to healthcare providers.7 For procedures other than joint arthroplasty and for providers interested in tracking their patients’ PROs, systems are available for establishing clinical quality registries in orthopedics.
Registry Systems
CareSense
CareSense (Medtrak) is an Internet-based care management and data collection system designed for patient engagement, which results in fewer missed appointments, increased patient adherence, enhanced patient education, and improved patient satisfaction.11 CareSense features email/text reminders for data entry, custom and standard reports, import and export of electronic medical record (EMR) information, and tools for running research studies.12 CareSense emphasizes care navigation by helping hospitals educate and guide patients through their care by sending exercise videos to patients for home rehabilitation, transferring messages from post-acute care facilities to surgeons and caregivers, and alerting the care team to any potential readmission symptoms.11,13 CareSense is also a Centers for Medicare & Medicaid Services (CMS) approved qualified clinical data registry (QCDR). QCDRs collect data for Merit-Based Incentive Payment System (MIPS) clinicians and submit the data to CMS.12
KareOutcomes
KareOutcomes, a healthcare technology and support firm founded in 2009, advocates transparency and trust among providers and patients, and aims to optimize PROs.14 The KareOutcomes team incorporates patient follow-up personnel, administrators, engineers, physicians, software developers, and technicians. The KareOutcomes software, which is backed by a 6-month guarantee, includes system design and implementation, data collection and entry, methods of submitting data to statewide or nationwide registries and sending standardized and customized surveys, and accessible and meaningful data presentation. KareOutcomes allows patient follow-up through automated reminders by telephone, SMS text message, and email. Patients can respond to surveys or questionnaires whichever way is most convenient—by telephone, Internet, SMS text message, or on paper, either in the office or by mail.
Oberd
Oberd (Universal Research Solutions) offers a comprehensive package of solutions for collecting optimal PRO data. The package has several modules: outcomes, education, registry, operative notes, data import and export, and data reporting.15 Oberd Outcomes allows convenient and engaging data collection. For example, users can send both standardized and customized forms. Oberd Education allows patients to receive information in an interactive, narrated format that is specific to their physician’s techniques and practices. Oberd Registry allows users to input multiple datasets into a registry, compare data, and generate reports with visuals. Like CareSense, Oberd is a CMS-approved QCDR. Oberd’s MIPS Dashboard helps providers collect and report patients’ reported outcomes, and use that information to modify and improve their practice.
Ortech
Ortech is a web-based data registry system that allows physicians and administrators to mine the data they own, track key metrics in their data, and improve reporting.16 Users can collect PROMs, use them to measure and analyze patient progress, and add to their collection of information that helps support their evidence-based decision making. They can capture intraoperative and implant data through barcode scanning, which then registers the data in an implant product code library that allows quick identification of patients with a specific implant in the event of a product recall. Ortech also allows automatic generation of customized operative reports on data entered from the operating room and populated into the EMR. Ortech offers 2 versions of its data collection platform, phiDB and phiDB Lite. The phiDB Lite version is for smaller practices and focuses mainly on PROMs but lacks many of the other features that phiDB offers, such as operating room modules, automated operative reports, barcode scanning, and unlimited data reporting.
Socrates
Socrates (Standardised Orthopaedic Clinical Research and Treatment Evaluation Software; Ortholink) is dedicated orthopedic software that facilitates following patient outcomes and conducting high-quality research.17 Socrates is fully customizable to fit each user’s needs. It allows for tracking of outcome scores, intraoperative details, nonoperative procedures, clinical examinations, therapies, and adverse effects. Users can also create reports from this information, which is inputted to Socrates and can be exported into EMR. Socrates data are stored on the user’s server, on site; the software generates patient summaries, collective summaries, and follow-up reports through its built-in descriptive statistics module. Raw data can be extracted for statistical analysis. Socrates can catalogue images, radiographs, documents, and videos.
Surgical Outcomes System
Surgical Outcomes System (SOS; Arthrex) is a cloud-based orthopedic and sports medicine global registry that focuses on monitoring and evaluating the outcomes of various orthopedic and sports medicine surgical procedures, as well as nonoperative interventions, to contribute to evidence-based protocols for patient treatment.18 SOS can be fully customized with desired PROMs for arthroplasty and for surgical procedures for extremity joints and even the spine. SOS includes real-time reporting on PROs for individual patients, summary PROMs for all of the physician’s patients who are receiving the same treatment, and comparisons with all registry patients (from global de-identified registry data) who had the same treatment or surgery. This real-time analysis provides immediate patient and physician feedback on treatments and products used. A patient portal for education on surgical procedures is also available. SOS is approved for use in 21 countries and is a benefit included with Arthroscopy Association of North America (AANA) membership. SOS is listed on the National Quality Registry Network (NQRN) website and, as a specialized registry as defined by CMS, can accept data generated by EMR technology.
Discussion
Delaunay19 indicated that successful registry management depends on several factors, including “use of a single identifier for each patient to ensure full traceability of all procedures related to a given implant; a long-term funding source; a contemporary, rapid, Internet-based data collection method; and the collection of exhaustive data, at least for innovative implants.” The registry systems reviewed in this article are Internet based and allow healthcare providers to monitor the clinical outcomes of their patients in the hope of improving clinical decision-making and overall patient care. From the provider perspective, many registry systems allow for integration of outcome data reporting into EMRs, including generation of operative reports. In turn, registries can improve documentation efficiency, as it was estimated that a US physician without a registry spends more than 15 hours a week reporting quality measures,20 or almost 800 hours and $15 billion each year.20,21 It remains to be seen whether registry systems will optimize the documentation process, but there is potential improvement in time and cost-efficiency with registry use.
Although the factors involved in management are important, clinical data registries must have systems in place to help ensure patient adherence and minimize selection bias, as adherence is crucial in data accuracy.3 What helps with adherence is the ability to send automated email or SMS text message reminders to patients. According to a review, email reminders increased the completion of PROM datasets by 26%.22 When the new national quality register (NQR) HAKIR (Handkirurgiskt kvalitetsregister) was established in Sweden, it was found that when only 1 type of reminder was used (SMS text message, in this case), only about 30% of participants completed their questionnaires.23 However, after the system was changed to send both SMS text message and email reminders, the response rate increased from 50% to 60%. Using 2 types of automated reminders might minimize lost data more effectively than 1 type alone.
Another benefit of outcome monitoring through a registry is potential reduction of interviewer- related errors. Interviewer bias can occur in many different ways. Interviewers might not follow the same instructions or administer questionnaires or surveys the same way for different patients,24 the interviewer’s presence might cause the patient to alter responses based on social norms,25 and the patient might report better outcomes in the presence of a physician or interviewer.26,27 Given that clinical registries allow electronic capture of self-administered surveys, interviewer bias is reduced because all patients receive a standardized set of questions and instructions. In addition, electronic questionnaires and surveys prompt users to add or fix missed or incorrectly completed items, further reducing potential data inaccuracies.
Healthcare costs continue to rise in the United States. In 2015, the total cost of healthcare expenditure in the United States was $3.2 trillion, or almost 18% of the US gross domestic product.28 In addition, in the first half of 2016, an estimated 16.2% of people under age 65 years were in families that were struggling to pay medical bills.29,30 Healthcare reform provides a financial incentive to healthcare providers to collaborate to reduce unnecessary costs and procedures and improve the quality of healthcare.31 Porter and Teisberg32 defined value as health outcomes achieved per dollar spent. Registry monitoring of PROMs, which are the numerator in this critical value formula, allows providers to track patient outcomes over time to determine which interventions produce the best outcomes.22 Therefore, clinical registries play an important role in improving health outcomes and reducing the cost of healthcare.7
Since the Swedish Knee Arthroplasty Register (SKAR) was established 40 years ago, NQRs have been commonplace in Scandinavian countries, Australia, and the United Kingdom.23 Between 2001 and 2014, the Australian Orthopaedic Association National Joint Replacement Registry (AOANJRR) documented a decline in the financial burden of hip and knee arthroplasty revision in Australia—in comparison with the United States, which did not have a full national registry at the time and showed a revision rate increase.24 The economic benefit of reducing hip and knee arthroplasty revisions in Australia during that period was an estimated $65 million to $143 million.24 Besides having financial benefits, national registries allow early identification of flawed implantation products and methods, leading to a further reduction in the burden associated with recall and future use of such defective implants—including patient harm.
In addition to monitoring existing techniques and devices, registries can also follow new techniques and, compared with publication in clinical journals, more expeditiously provide clinical data for outcome expectations and treatment methods. This timeliness is particularly valuable given that publication of clinical trials with the usual mandatory 2-year follow-up can take 4 years or longer.33,34 For instance, in the expanding field of hip arthroscopy, data from registries in both Sweden and Denmark are being analyzed.35,36 These data are important in new fields such as hip arthroscopy, in which clinical indications and treatment techniques may vary considerably between locations.35 In 2012, the Danish Hip Arthroscopy Registry (DHAR) was started as a web-based prospective registry.36 Between 2012 and December 2014, DHAR added 2000 procedures, which included all hip arthroscopy procedures performed at 11 centers in Denmark.36 DHAR tracks PROM, surgical procedure, operative, and radiologic data.
Increased use of clinical registries has led to use of their data in clinical research. Registry-based randomized controlled trials (RCTs) are lower in cost than other types of research, allow for rapid enrollment of patients, offer larger population sizes and multi-institutional sampling, and can provide a more diverse patient population.19,37 Although nonregistry RCTs remain the gold standard of clinical research, registry RCTs have several advantages given the abilities and structure of registries. Because of resources and cost, nonregistry RCTs are usually limited in the number of examined exposures and typically focus on only 2.6 Registry RCTs, on the other hand, can monitor multiple exposures, typically at minimal cost difference.6 Another disadvantage of nonregistry RCTs is that they are often performed at institutions providing care that might not be indicative of the quality most patients expect, as these institutions might be selected for a specific clinician or specialty service.
Registry RCTs also have their limitations with respect to clinical research. A major one is their lack of validity standards or accepted benchmarks for accuracy, adherence rates, registry completeness, and data collection.37,38 In addition, lack of standardization across national and international registries could produce conflicting data. Another limitation is that data in most registries are not subjected to any third-party checks or independent auditing.9,39 Furthermore, evaluating the impact of registries is difficult because it is difficult to find comparable outcome data on nonregistry patients.40 A final limitation involves the ethics of including registry data in RCTs. Although data are often added to a registry without patient consent, should the same data be used for research without patient consent? Should patients be able to disallow use of their data for research, or require a notification each time their data are used? These issues must be addressed.
Review Limitations
One limitation of this review of clinical Internet-based outcome systems is that it might not have identified comparable systems. In addition, specific costs associated with each system were not addressed, as they depend on PROM licensing fees, total institutional access, other proprietary costs, and other variables. Another limitation, in terms of creating a national or international registry, continues to be Internet access. The Pew Research Center estimated that 84% of US adults used the Internet in 2015.41 Although 84% represents most of the adult population, the other 16% typically is over age 65 years, where only 58% of adults reported using the Internet, or come from lower income households, where access was <75%. For registries in European countries and North America, where Internet usage typically is >70%, this is not a significant problem. However, worldwide, only 47% of the population used the Internet in 2016.42 Internet usage by Asian and Arab states citizens was 41.6% and 41.9%, respectively, and usage by African citizens was only 25.1%. As a significant benefit of registry use is that researchers can obtain larger sample sizes, it is a problem that some populations—elderly people, people of lower socioeconomic standing, people living where the Internet is unavailable—might be underrepresented in registry data.
As mentioned, patient adherence is an ongoing issue for clinical registries. As adherence tends to decrease as more time passes after a patient’s treatment date, it is important to account for and encourage continued patient participation with outcome monitoring. Missing data lessen the validity and accuracy of a registry, increasing the likelihood that certain groups will be underrepresented. Although registry systems can reduce the cost of following PROMs, doing so requires monitoring and following up on issues of patient adherence. In other words, many clinicians will need the help of a research assistant. Makhni and colleagues21 found that adding a research assistant for this task increased survey adherence from 65% to 94% before surgery, from 65% to 72% 6 months after surgery, and from 38% to 56% 12 months after surgery.
Even though studies continue to use clinical data from registries, there is not much research on the impact of these registries on improvement in healthcare. Again, many factors are involved: lack of standardized benchmarks for accuracy and adherence, lack of an accepted method of data auditing and validation, and difficulty evaluating the impact of registries owing to the difficulty obtaining comparable data on nonregistry patients. Registries must adopt accepted forms of standardization in order to allow better comparisons of registries, because comparing data across registries can be useful in determining the strengths and weaknesses of different registries.27,43 As registries support decision making at clinical, institutional, and governmental levels, it is vital that their clinical data be accurate and reliable.38
Conclusion
Rising healthcare costs, and government and third-party pressures are making patient outcomes collection a standard of care. Going forward, orthopedic surgeons must be proactive, and Internet -based registries provide technological advances that facilitate the process.
1. Lubowitz JH, Smith PA. Current concepts in clinical research: web-based, automated, arthroscopic surgery prospective database registry. Arthroscopy. 2012;28(3):425-428.
2. Ayers DC, Bozic KJ. The importance of outcome measurement in orthopaedics. Clin Orthop Relat Res. 2013;471(11):3409-3411.
3. Nwachukwu BU, Fields K, Chang B, Nawabi DH, Kelly BT, Ranawat AS. Preoperative outcome scores are predictive of achieving the minimal clinically important difference after arthroscopic treatment of femoroacetabular impingement. Am J Sports Med. 2017;45(3):612-619.
4. Breckenridge K, Bekker HL, Gibbons E, et al. How to routinely collect data on patient-reported outcome and experience measures in renal registries in Europe: an expert consensus meeting. Nephrol Dial Transplant. 2015;30(10):1605-1614.
5. Inacio MC, Paxton EW, Dillon MT. Understanding orthopaedic registry studies: a comparison with clinical studies. J Bone Joint Surg Am. 2016;98(1):e3.
6. Hoque DME, Kumari V, Hoque M, Ruseckaite R, Romero L, Evans SM. Impact of clinical registries on quality of patient care and clinical outcomes: a systematic review. PLoS One. 2017;12(9):e0183667.
7. Physician Consortium for Performance Improvement. National Quality Registry Network. http://www.thepcpi.org/programs-initiatives/national-quality-registry-network/. Accessed October 5, 2017.
8. Hickey GL, Grant SW, Cosgriff R, et al. Clinical registries: governance, management, analysis and applications. Eur J Cardiothorac Surg. 2013;44(4):605-614.
9. Pugely AJ, Martin CT, Harwood J, Ong KL, Bozic KJ, Callaghan JJ. Database and registry research in orthopaedic surgery: part 2: clinical registry data. J Bone Joint Surg Am. 2015;97(21):1799-1808.
10. American Joint Replacement Registry. http://www.ajrr.net/. Accessed October 5, 2017.
11. CareSense. https://www.caresense.com/. Accessed October 4, 2017.
12. US Department of Health and Human Services, Centers for Medicare & Medicaid Services, Quality Payment Program. Merit-Based Incentive Payment System (MIPS): 2017 CMS-Approved Qualified Clinical Data Registries (QCDRs). https://qpp.cms.gov/docs/QPP_2017_CMS_Approved_QCDRs.pdf. Accessed October 9, 2017.
13. Johnson & Johnson. Johnson & Johnson Medical Devices Companies introduce Orthopaedic Episode of Care Approach, leveraging CareAdvantage capabilities to support better clinical outcomes and reduce the cost of care. https://www.jnj.com/media-center/press-releases/johnson-johnson-medical-devices-companies-introduce-orthopaedic-episode-of-care-approach-leveraging-careadvantage-capabilities-to-support-better-clinical-outcomes-and-reduce-the-cost-of-care. Published January 9, 2017. Accessed October 4, 2017.
14. KareOutcomes. http://www.kareoutcomes.com/. Accessed October 4, 2017.
15. Oberd. http://www.oberd.com/. Accessed October 4, 2017.
16. Ortech Systems. http://www.ortechsystems.com/. Accessed October 4, 2017.
17. Socrates. http://www.socratesortho.com/. Accessed October 4, 2017.
18. Surgical Outcomes System. https://www.surgicaloutcomesystem.com/. Accessed October 4, 2017.
19. Delaunay C. Registries in orthopaedics. Orthop Traumatol Surg Res. 2015;101(1 suppl):S69-S75.
20. Bryan S, Davis J, Broesch J, Doyle-Waters MM, Lewis S, McGrail K. Choosing your partner for the PROM: a review of evidence on patient-reported outcome measures for use in primary and community care. Healthc Policy. 2014;10(2):38-51.
21. Makhni EC, Higgins JD, Hamamoto JT, Cole BJ, Romeo AA, Verma NN. Patient compliance with electronic patient reported outcomes following shoulder arthroscopy [published online ahead of print September 25, 2017]. Arthroscopy. doi:10.1016/j.arthro.2017.06.016.
22. Triplet JJ, Momoh E, Kurowicki J, Villarroel LD, Law T, Levy JC. E-mail reminders improve completion rates of patient-reported outcome measures. JSES Open Access. 2017;1:25-28.
23. Arner M. Developing a national quality registry for hand surgery: challenges and opportunities. EFORT Open Rev. 2016;1(4):100-106.
24. Ngongo CJ, Frick KD, Hightower AW, Mathingau FA, Burke H, Breiman RF. The perils of straying from protocol: sampling bias and interviewer effects. PLoS One. 2015;10(2):e0118025.
25. Hammarstedt JE, Redmond JM, Gupta A, Dunne KF, Vemula SP, Domb BG. Survey mode influence on patient-reported outcome scores in orthopaedic surgery: telephone results may be positively biased. Knee Surg Sports Traumatol Arthrosc. 2017;25(1):50-54.
26. Hoher J, Bach T, Munster A, et al. Does the mode of data collection change results in a subjective knee score? Self-administration versus interview. Am J Sports Med. 1997;25(5):642-647.
27. Lacny S, Bohm E, Hawker G, Powell J, Marshall DA. Assessing the comparability of hip arthroplasty registries in order to improve the recording and monitoring of outcome. Bone Joint J. 2016;98-B(4):442-451.
28. US Department of Health and Human Services, Centers for Medicare & Medicaid Services, National Center for Health Statistics. Health, United States, 2016: With Chartbook on Long-Term Trends in Health. Hyattsville, MD: National Center for Health Statistics, Centers for Medicare & Medicaid Services, US Dept of Health and Human Services; 2017. DHHS Publication 2017-1232. https://www.cdc.gov/nchs/data/hus/hus16.pdf. Published May 2017. Accessed October 9, 2017.
29. Cohen RA, Zammitti EP. Problems paying medical bills among persons under age 65: early release of estimates from the National Health Interview Survey, 2011-June 2016. National Health Interview Survey Early Release Program, Division of Health Interview Statistics, National Center for Health Statistics, Centers for Medicare & Medicaid Services, US Dept of Health and Human Services. https://www.cdc.gov/nchs/data/nhis/earlyrelease/probs_paying_medical_bills_jan_2011_jun_2016.pdf. Published November 2016. Accessed October 9, 2017.
30. National Center for Health Statistics. National Health Interview Survey. http://www.cdc.gov/nchs/nhis/releases.htm. Accessed October 5, 2017.
31. Karhade AV, Larsen AMG, Cote DJ, Dubois HM, Smith TR. National databases for neurosurgical outcomes research: options, strengths, and limitations [published online ahead of print August 5, 2017]. Neurosurgery. https://doi.org/10.1093/neuros/nyx408.
32. Porter ME, Teisberg EO. Redefining Health Care: Creating Value-Based Competition on Results. Boston, MA: Harvard Business School Press; 2006.
33. Chen R, Desai NR, Ross JS, et al. Publication and reporting of clinical trial results: cross sectional analysis across academic medical centers. BMJ. 2016;352:i637.
34. Counsell N, Biri D, Fraczek J, Hackshaw A. Publishing interim results of randomised clinical trials in peer-reviewed journals. Clin Trials. 2017;14(1):67-77.
35. Sansone M, Ahldén M, Jonasson P, et al. A Swedish hip arthroscopy registry: demographics and development. Knee Surg Sports Traumatol Arthrosc. 2014;22(4):774-780.
36. Mygind-Klavsen B, Grønbech Nielsen T, Maagaard N, et al. Danish Hip Arthroscopy Registry: an epidemiologic and perioperative description of the first 2000 procedures. J Hip Preserv Surg. 2016;3(2):138-145.
37. Li G, Sajobi TT, Menon BK, et al; 2016 Symposium on Registry-Based Randomized Controlled Trials in Calgary. Registry-based randomized controlled trials—what are the advantages, challenges, and areas for future research? J Clin Epidemiol. 2016;80:16-24.
38. Bautista MP, Bonilla GA, Mieth KW. Data quality in institutional arthroplasty registries: description of model of validation and report of preliminary results. J Arthroplasty. 2017;32(7):2065-2069.
39. Tevaearai H, Carrel T. Clinical registries: yes, but then appropriately! Eur J Cardiothorac Surg. 2013;44(4):614-615.
40. Australian Commission on Safety and Quality in Health Care. Economic evaluation of clinical quality registries: final report. Sydney, Australia: ACSQHC; 2016.
41. Perrin A, Duggan M. Americans’ internet access: 2000-2015. Pew Research Center website. http://www.pewinternet.org/2015/06/26/americans-internet-access-2000-2015/. Published June 26, 2015. Accessed October 5, 2017.
42. Taylor A. 47 percent of the world’s population now use the internet, study says. https://www.washingtonpost.com/news/worldviews/wp/2016/11/22/47-percent-of-the-worlds-population-now-use-the-internet-users-study-says/. Published November 22, 2016. Accessed October 5, 2017.
43. Romero L, Nieuwenhuijse M, Carr A, Sedrakyan A. Review of clinical outcomes-based anchors of minimum clinically important differences in hip and knee registry–based reports and publications. J Bone Joint Surg Am. 2014;96(suppl 1):98-103.
Implementing Patient-Reported Outcome Measures in Your Practice: Pearls and Pitfalls
Take-Home Points
- Systematic use of PROMs allows physicians to review data on pain, physical function, and psychological status to aid in clinical decision-making and best practices.
- PROMs should include both general outcome measures (VAS, SF-36, or EQ-5D) and reliable, valid, and responsive disease specific measures.
- PROM questionnaires should collect pertinent information while limiting the length to maximize patient compliance and reliability.
- PROMIS has been developed to standardize questionnaires, but generality for specific orthopedic procedures may result in less effective measures.
- PROMs can also be used for predictive modeling, which has the potential to help develop more cost-effective care and predict expected outcomes and recovery trajectories for individual patients.
Owing to their unique ability to recognize patients as stakeholders in their own healthcare, patient-reported outcome measures (PROMs) are becoming increasingly popular in the assessment of medical and surgical outcomes.1 PROMs are an outcome measures subset in which patients complete questionnaires about their perceptions of their overall health status and specific health limitations. By systematically using PROMs before and after a clearly defined episode of care, clinicians can collect data on perceived pain level, physical function, and psychological status and use the data to validate use of surgical procedures and shape clinical decisions about best practices.2-4 Although mortality and morbidity rates and other traditional measures are valuable in assessing outcomes, they do not represent or communicate the larger impact of an episode of care. As many orthopedic procedures are elective, and some are low-risk, the evaluation of changes in quality of life and self-reported functional improvement is an important addition to morbidity and mortality rates in capturing the true impact of a surgical procedure and recovery. The patient’s preoperative and postoperative perspectives on his or her health status have become important as well; our healthcare system has been placing more emphasis on patient-centered quality care.2,5
Although PROMs have many benefits, implementation in an orthopedic surgery practice has its challenges. With so many PROMs available, selecting those that fit the patient population for a specialized orthopedic surgery practice can be difficult. In addition, although PROM data are essential for research and for measuring individual or institutional recovery trajectories for surgical procedures, in a busy practice getting patients to provide these data can be difficult.
PROMs are heavily used for outcomes assessment in the orthopedics literature, but there are few resources for orthopedic surgeons who want to implement PROMs in their practices. In this article, we review the literature on the challenges of effectively implementing PROMs in an orthopedic surgery practice.
PROM Selection Considerations
PROMs can be categorized as either generic or disease-specific,4 but together they are used to adequately capture the impact, both broad and local, of an orthopedic condition.
Generic Outcome Measures
Generic outcome measures apply to a range of subspecialties or anatomical regions, allowing for evaluation of a patient’s overall health or quality of life. The most widely accepted measure of pain is the visual analog scale (VAS). The VAS for pain quantifies the level of pain a patient experiences at a given time on a graphic sliding scale from 0 (no pain) to 10 (worst possible pain). The VAS is used in clinical evaluation of pain and in reported outcomes literature.6,7
Many generic PROMs assess mental health status in addition to physical limitations. Poor preoperative mental health status has been recognized as a predictor of worse outcomes across a variety of orthopedic procedures.8,9 Therefore, to assess the overall influence of an orthopedic condition, it is important to include at least 1 generic PROM that assesses mental health status before and after an episode of care. Generic PROMs commonly used in orthopedic surgery include the 36-Item Short Form Health Survey (SF-36), the shorter SF-12, the Veterans RAND 12-Item Health Survey (VR-12), the World Health Organization Disability Assessment Schedule (WHODAS), the European Quality of Life-5 Dimensions (EQ-5D) index, and the 10-item Patient-Reported Outcomes Measurement Information System Global Health (PROMIS-10) scale.10-14
Some generic outcome measures (eg, the EQ-5D index) offer the “utility” calculation, which represents a preference for a patient’s desired health status. Such utilities allow for a measurement of quality of life, represented by quality-adjusted life years (QALY), which is a standardized measure of disease burden. Calculated QALY from measures such as the EQ-5D can be used in cost-effectiveness analyses of surgical interventions and have been used to validate use of procedures, particularly in arthroplasty.15-17
Disease-Specific Outcome Measures
Likewise, there is a range of disease-specific PROMs validated for use in orthopedic surgery, and providers select PROMs that fit their scope of practice. In anatomical regions such as the knee, hip, and shoulder, disease-specific outcome measures vary significantly by subspecialty and patient population. When selecting disease-specific PROMs, providers must consider tools such as reliability, validity, responsiveness, and available population norms. One study used Evaluating Measures of Patient-Reported Outcomes (EMPRO) to assess the quality of a PROM in shoulders and concluded that the American Shoulder and Elbow Surgeons (ASES) index, the Simple Shoulder Test (SST), and the Oxford Shoulder Score (OSS) were all supported for use in practice.18 It is important to note that reliability, validity, and responsiveness of a PROM may vary with the diagnosis or the patient population studied. For example, the SST was found to be responsive in assessing rotator cuff injury but not as useful in assessing shoulder instability or arthritis.19 Variable responsiveness highlights the need for a diagnosis-based level of PROM customization. For example, patients who undergo a surgical intervention for shoulder instability are given a customized survey, which includes PROMs specific to their condition, such as the Western Ontario Shoulder Instability (WOSI) index.20 For patients with knee instability, similar considerations apply; specific measures such as the Lysholm score and the Tenger Activity Scale capture the impact of injury in physically demanding activities.21 When selecting disease-specific PROMs, providers should consult articles like those by Davidson and Keating22 and Bent and colleagues,23 who present provider-friendly tools that can be used to examine the effectiveness of a PROM, and provide additional background information on selecting disease-specific PROMs. For hip and knee arthroplasty subspecialties, the International Society of Arthroplasty Registries (ISAR) created a working group that determines best practices for PROM collection and identifies PROMs most commonly reported in arthroplasty.24
Questionnaire Length Considerations
When PROMs are used in a practice, a balance must be struck between gathering enough information to determine functionality and limiting the patient burden of questionnaire length. A decision to use several PROMs all at once, at a single data collection point, can lengthen the questionnaire significantly. One study found that, with use of longer questionnaires, patients may lose interest, resulting in decreased reliability and compliance.25 For example, providers who use the long (42-item) Knee Injury and Osteoarthritis Outcome Score (KOOS) questionnaire to assess knee function are often limited in what other PROMs they may administer at the same time. Efforts to shorten this questionnaire while still capturing necessary information led to the development of the 7-item KOOS Jr, which was validated for use in knee arthroplasty and had its 7 items drawn from the original 42.26 Similarly, the 40-item Hip Disability and Osteoarthritis Outcome Score (HOOS) questionnaire was shortened to the 6-item HOOS Jr, which was validated for use in hip arthroplasty,27 and the generic SF-36 was shortened to the SF-12.11 Providers trying to build an outcomes database while minimizing patient burden should consider using the shorter versions of these questionnaires but should also consider their validity, as KOOS Jr and HOOS Jr have been validated for use only in knee and hip arthroplasty and not in other knee and hip conditions.
PROM Data Collection Considerations
Comprehensive collection of longitudinal PROM data poses many challenges for providers and patients. For providers, the greatest challenges are infrastructure, technology, and the personnel needed to administer and store paper or electronic surveys. For patients, the most common survey completion barriers are questionnaire length, confusing or irrelevant content, and, in the case of some older adults, inability to complete surveys electronically.25
Identifying a nonresponsive or noncompliant patient population is an important issue in collecting PROM data for research or other purposes. A study of factors associated with higher nonresponse rates in elective surgery patients (N = 135,474) found that noncompliance was higher for males, patients under age 55 years, nonwhites, patients in the lowest socioeconomic quintile, patients living alone, patients needing assistance in completing questionnaires, and patients who previously underwent surgery for their condition.28 In a systematic review of methods that increased the response rates of postal and electronic surveys, Edwards and colleagues29 found significantly higher odds of response for patients who were prenotified of the survey, given shorter questionnaires, or given a deadline for survey completion. Of note, response rates were lower when the word survey was used in the subject line of an email.
PROM distribution has evolved with the rise of technological advances that allow for electronic survey distribution and data capture. Several studies have found that electronically administered PROMs have high response rates.3,30,31 In a study of patients who underwent total hip arthroplasty, Rolfson and colleagues32 found that response rates were significantly higher for those who were surveyed on paper than for those surveyed over the internet. A randomized controlled study found that, compared with paper surveys, digital tablet surveys effectively and reliably collected PROM data; in addition, digital tablets provided instant data storage, and improved survey completion by requiring that all questions be answered before the survey could be submitted.33 However, age, race/ethnicity, and income disparities in technology use must be considered when administering internet-based follow-up surveys and analyzing data collected with web-based methods.34 A study of total joint arthroplasty candidates found that several groups were less likely to complete electronic PROM questionnaires: patients over age 75 years, Hispanic or black patients, patients with Medicare or Medicaid, patients who previously underwent orthopedic surgery, patients undergoing revision total joint arthroplasty, patients with other comorbidities, and patients whose primary language was not English.35 Providers interested in implementing PROMs must consider their patient population when selecting a method for survey distribution and follow-up. A study found that a majority of PROMs were written at a level many patients may not have understood, because of their literacy level or age; this lack of understanding created a barrier to compliance in many patient populations.36
PROM Limitations and PROMIS Use
Use of PROMs has its limitations. The large variety of PROMs available for use in orthopedic surgery has led to several standardization initiatives. The National Institutes of Health funded the development of PROMIS, a person-centered measures database that evaluates and monitors the physical, social, and emotional health of adults and children.37 The goal of PROMIS is to develop a standardized method of selecting PROMs, so that all medical disciplines and subspecialties can choose an applicable set of questions from the PROMIS question bank and use it in practice. Orthopedic surgery can use questions pertaining to physical functioning of the lower and upper extremities as well as quality of life and mental health. PROMIS physical function questions have been validated for use in several areas of orthopedic surgery.38-40 A disadvantage of PROMIS is the overgenerality of its questions, which may not be as effective in capturing the implications of specific diagnoses. For example, it is difficult to use generalized questions to determine the implications of a diagnosis such as shoulder instability, which may affect only higher functioning activities or sports. More research on best PROM selection practices is needed in order to either standardize PROMs or move toward use of a single database such as PROMIS.
Future Directions in PROM Applications
PROMs are being used for research and patient engagement, but there are many other applications on the horizon. As already mentioned, predictive modeling is of particular interest. The existence of vast collaborative PROM databases that capture a diverse patient population introduces the possibility of creating models capable of predicting a patient outcome and enhancing shared decision-making.3 Predicting good or excellent patient outcomes for specific patient populations may allow elimination of certain postoperative visits, thereby creating more cost-effective care and reducing the burden of unnecessary clinic visits for both patients and physicians.
As with other healthcare areas, PROM data collection technology is rapidly advancing. Not only has electronic technology almost entirely replaced paper-and-pencil collection methods, but a new method of outcome data collection has been developed: computerized adaptive testing (CAT). CAT uses item-response theory to minimize the number of questions patients must answer in order for validated and reliable outcome scores to be calculated. According to multiple studies, CAT used across several questionnaires has reliably assessed PROMs while minimizing floor and ceiling effects, eliminating irrelevant questions, and shortening survey completion time.41-43
Besides becoming more patient-friendly and accessible across multiple interfaces (mobile devices and computers), PROMs are also beginning to be integrated into the electronic medical record, allowing easier access to information during chart reviews. Use of statistical and predictive modeling, as described by Chang,3 could give PROMs a role in clinical decision-making. Informing patients of their expected outcome and recovery trajectory—based on demographics, comorbidities, preoperative functional status, and other factors—could influence their decision to undergo surgical intervention. As Halawi and colleagues44 pointed out, it is important to discuss patient expectations before surgery, as unrealistic ones can negatively affect outcomes and lead to dissatisfaction. With clinicians having ready access to statistics and models in patient charts, we may see a transformation in clinical practices and surgical decision-making.
Conclusion
PROMs offer many ways to improve research and clinical care in orthopedic surgery. However, implementing PROMs in practice is not without challenges. Interested orthopedic surgeons should select the PROMs that are most appropriate—reliable, validated, and responsive to their patient population. Electronic distribution of PROM questionnaires is effective and allows data to be stored on entry, but orthopedic surgeons must consider their patient population to ensure accurate data capture and compliance in longitudinal surveys. Proper implementation of PROMs in a practice can allow clinicians to formulate expectations for postoperative recovery and set reasonable postoperative goals while engaging patients in improving quality of care.
1. Howie L, Hirsch B, Locklear T, Abernethy AP. Assessing the value of patient-generated data to comparative effectiveness research. Health Aff (Millwood). 2014;33(7):1220-1228.
2. Haywood KL. Patient-reported outcome I: measuring what matters in musculoskeletal care. Musculoskeletal Care. 2006;4(4):187-203.
3. Chang CH. Patient-reported outcomes measurement and management with innovative methodologies and technologies. Qual Life Res. 2007;16(suppl 1):157-166.
4. Black N. Patient reported outcome measures could help transform healthcare. BMJ. 2013;346:f167.
5. Porter ME. A strategy for health care reform—toward a value-based system. N Engl J Med. 2009;361(2):109-112.
6. Scott J, Huskisson EC. Graphic representation of pain. Pain. 1976;2(2):175-184.
7. de Nies F, Fidler MW. Visual analog scale for the assessment of total hip arthroplasty. J Arthroplasty. 1997;12(4):416-419.
8. Ayers DC, Franklin PD, Ring DC. The role of emotional health in functional outcomes after orthopaedic surgery: extending the biopsychosocial model to orthopaedics: AOA critical issues. J Bone Joint Surg Am. 2013;95(21):e165.
9. Edwards RR, Haythornthwaite JA, Smith MT, Klick B, Katz JN. Catastrophizing and depressive symptoms as prospective predictors of outcomes following total knee replacement. Pain Res Manag. 2009;14(4):307-311.
10. Patel AA, Donegan D, Albert T. The 36-Item Short Form. J Am Acad Orthop Surg. 2007;15(2):126-134.
11. Ware J Jr, Kosinski M, Keller SD. A 12-Item Short-Form Health Survey: construction of scales and preliminary tests of reliability and validity. Med Care. 1996;34(3):220-233.
12. About the VR-36, VR-12 and VR-6D. Boston University School of Public Health website. http://www.bu.edu/sph/research/research-landing-page/vr-36-vr-12-and-vr-6d/. Accessed October 4, 2017.
13. Jansson KA, Granath F. Health-related quality of life (EQ-5D) before and after orthopedic surgery. Acta Orthop. 2011;82(1):82-89.
14. Oak SR, Strnad GJ, Bena J, et al. Responsiveness comparison of the EQ-5D, PROMIS Global Health, and VR-12 questionnaires in knee arthroscopy. Orthop J Sports Med. 2016;4(12):2325967116674714.
15. Lavernia CJ, Iacobelli DA, Brooks L, Villa JM. The cost-utility of total hip arthroplasty: earlier intervention, improved economics. J Arthroplasty. 2015;30(6):945-949.
16. Mather RC 3rd, Watters TS, Orlando LA, Bolognesi MP, Moorman CT 3rd. Cost effectiveness analysis of hemiarthroplasty and total shoulder arthroplasty. J Shoulder Elbow Surg. 2010;19(3):325-334.
17. Brauer CA, Rosen AB, Olchanski NV, Neumann PJ. Cost-utility analyses in orthopaedic surgery. J Bone Joint Surg Am. 2005;87(6):1253-1259.
18. Schmidt S, Ferrer M, González M, et al; EMPRO Group. Evaluation of shoulder-specific patient-reported outcome measures: a systematic and standardized comparison of available evidence. J Shoulder Elbow Surg. 2014;23(3):434-444.
19. Godfrey J, Hamman R, Lowenstein S, Briggs K, Kocher M. Reliability, validity, and responsiveness of the Simple Shoulder Test: psychometric properties by age and injury type. J Shoulder Elbow Surg. 2007;16(3):260-267.
20. Kirkley A, Griffin S, McLintock H, Ng L. The development and evaluation of a disease-specific quality of life measurement tool for shoulder instability. The Western Ontario Shoulder Instability Index (WOSI). Am J Sports Med. 1998;26(6):764-772.
21. Briggs KK, Lysholm J, Tegner Y, Rodkey WG, Kocher MS, Steadman JR. The reliability, validity, and responsiveness of the Lysholm score and Tegner Activity Scale for anterior cruciate ligament injuries of the knee: 25 years later. Am J Sports Med. 2009;37(5):890-897.
22. Davidson M, Keating J. Patient-reported outcome measures (PROMs): how should I interpret reports of measurement properties? A practical guide for clinicians and researchers who are not biostatisticians. Br J Sports Med. 2014;48(9):792-796.
23. Bent NP, Wright CC, Rushton AB, Batt ME. Selecting outcome measures in sports medicine: a guide for practitioners using the example of anterior cruciate ligament rehabilitation. Br J Sports Med. 2009;43(13):1006-1012.
24. Rolfson O, Eresian Chenok K, Bohm E, et al; Patient-Reported Outcome Measures Working Group of the International Society of Arthroplasty Registries. Patient-reported outcome measures in arthroplasty registries. Acta Orthop. 2016;87(suppl 1):3-8.
25. Franklin PD, Lewallen D, Bozic K, Hallstrom B, Jiranek W, Ayers DC. Implementation of patient-reported outcome measures in U.S. total joint replacement registries: rationale, status, and plans. J Bone Joint Surg Am. 2014;96(suppl 1):104-109.
26. Lyman S, Lee YY, Franklin PD, Li W, Cross MB, Padgett DE. Validation of the KOOS, JR: a short-form knee arthroplasty outcomes survey. Clin Orthop Relat Res. 2016;474(6):1461-1471.
27. Lyman S, Lee YY, Franklin PD, Li W, Mayman DJ, Padgett DE. Validation of the HOOS, JR: a short-form hip replacement survey. Clin Orthop Relat Res. 2016;474(6):1472-1482.
28. Hutchings A, Neuburger J, Grosse Frie K, Black N, van der Meulen J. Factors associated with non-response in routine use of patient reported outcome measures after elective surgery in England. Health Qual Life Outcomes. 2012;10:34.
29. Edwards PJ, Roberts I, Clarke MJ, et al. Methods to increase response to postal and electronic questionnaires. Cochrane Database Syst Rev. 2009;(3):MR000008.
30. Gakhar H, McConnell B, Apostolopoulos AP, Lewis P. A pilot study investigating the use of at-home, web-based questionnaires compiling patient-reported outcome measures following total hip and knee replacement surgeries. J Long Term Eff Med Implants. 2013;23(1):39-43.
31. Bojcic JL, Sue VM, Huon TS, Maletis GB, Inacio MC. Comparison of paper and electronic surveys for measuring patient-reported outcomes after anterior cruciate ligament reconstruction. Perm J. 2014;18(3):22-26.
32. Rolfson O, Salomonsson R, Dahlberg LE, Garellick G. Internet-based follow-up questionnaire for measuring patient-reported outcome after total hip replacement surgery—reliability and response rate. Value Health. 2011;14(2):316-321.
33. Shah KN, Hofmann MR, Schwarzkopf R, et al. Patient-reported outcome measures: how do digital tablets stack up to paper forms? A randomized, controlled study. Am J Orthop. 2016;45(7):E451-E457.
34. Kaiser Family Foundation. The Digital Divide and Access to Health Information Online. http://kff.org/disparities-policy/poll-finding/the-digital-divide-and-access-to-health/. Published April 1, 2011. Accessed October 4, 2017.
35. Schamber EM, Takemoto SK, Chenok KE, Bozic KJ. Barriers to completion of patient reported outcome measures. J Arthroplasty. 2013;28(9):1449-1453.
36. El-Daly I, Ibraheim H, Rajakulendran K, Culpan P, Bates P. Are patient-reported outcome measures in orthopaedics easily read by patients? Clin Orthop Relat Res. 2016;474(1):246-255.
37. Intro to PROMIS. 2016. Health Measures website. http://www.healthmeasures.net/explore-measurement-systems/promis/intro-to-promis. Accessed October 4, 2017.
38. Hung M, Baumhauer JF, Latt LD, Saltzman CL, SooHoo NF, Hunt KJ; National Orthopaedic Foot & Ankle Outcomes Research Network. Validation of PROMIS ® Physical Function computerized adaptive tests for orthopaedic foot and ankle outcome research. Clin Orthop Relat Res. 2013;471(11):3466-3474.
39. Hung M, Clegg DO, Greene T, Saltzman CL. Evaluation of the PROMIS Physical Function item bank in orthopaedic patients. J Orthop Res. 2011;29(6):947-953.
40. Tyser AR, Beckmann J, Franklin JD, et al. Evaluation of the PROMIS Physical Function computer adaptive test in the upper extremity. J Hand Surg Am. 2014;39(10):2047-2051.e4.
41. Hung M, Stuart AR, Higgins TF, Saltzman CL, Kubiak EN. Computerized adaptive testing using the PROMIS Physical Function item bank reduces test burden with less ceiling effects compared with the Short Musculoskeletal Function Assessment in orthopaedic trauma patients. J Orthop Trauma. 2014;28(8):439-443.
42. Hung M, Clegg DO, Greene T, Weir C, Saltzman CL. A lower extremity physical function computerized adaptive testing instrument for orthopaedic patients. Foot Ankle Int. 2012;33(4):326-335.
43. Döring AC, Nota SP, Hageman MG, Ring DC. Measurement of upper extremity disability using the Patient-Reported Outcomes Measurement Information System. J Hand Surg Am. 2014;39(6):1160-1165.
44. Halawi MJ, Greene K, Barsoum WK. Optimizing outcomes of total joint arthroplasty under the comprehensive care for joint replacement model. Am J Orthop. 2016;45(3):E112-E113.
Take-Home Points
- Systematic use of PROMs allows physicians to review data on pain, physical function, and psychological status to aid in clinical decision-making and best practices.
- PROMs should include both general outcome measures (VAS, SF-36, or EQ-5D) and reliable, valid, and responsive disease specific measures.
- PROM questionnaires should collect pertinent information while limiting the length to maximize patient compliance and reliability.
- PROMIS has been developed to standardize questionnaires, but generality for specific orthopedic procedures may result in less effective measures.
- PROMs can also be used for predictive modeling, which has the potential to help develop more cost-effective care and predict expected outcomes and recovery trajectories for individual patients.
Owing to their unique ability to recognize patients as stakeholders in their own healthcare, patient-reported outcome measures (PROMs) are becoming increasingly popular in the assessment of medical and surgical outcomes.1 PROMs are an outcome measures subset in which patients complete questionnaires about their perceptions of their overall health status and specific health limitations. By systematically using PROMs before and after a clearly defined episode of care, clinicians can collect data on perceived pain level, physical function, and psychological status and use the data to validate use of surgical procedures and shape clinical decisions about best practices.2-4 Although mortality and morbidity rates and other traditional measures are valuable in assessing outcomes, they do not represent or communicate the larger impact of an episode of care. As many orthopedic procedures are elective, and some are low-risk, the evaluation of changes in quality of life and self-reported functional improvement is an important addition to morbidity and mortality rates in capturing the true impact of a surgical procedure and recovery. The patient’s preoperative and postoperative perspectives on his or her health status have become important as well; our healthcare system has been placing more emphasis on patient-centered quality care.2,5
Although PROMs have many benefits, implementation in an orthopedic surgery practice has its challenges. With so many PROMs available, selecting those that fit the patient population for a specialized orthopedic surgery practice can be difficult. In addition, although PROM data are essential for research and for measuring individual or institutional recovery trajectories for surgical procedures, in a busy practice getting patients to provide these data can be difficult.
PROMs are heavily used for outcomes assessment in the orthopedics literature, but there are few resources for orthopedic surgeons who want to implement PROMs in their practices. In this article, we review the literature on the challenges of effectively implementing PROMs in an orthopedic surgery practice.
PROM Selection Considerations
PROMs can be categorized as either generic or disease-specific,4 but together they are used to adequately capture the impact, both broad and local, of an orthopedic condition.
Generic Outcome Measures
Generic outcome measures apply to a range of subspecialties or anatomical regions, allowing for evaluation of a patient’s overall health or quality of life. The most widely accepted measure of pain is the visual analog scale (VAS). The VAS for pain quantifies the level of pain a patient experiences at a given time on a graphic sliding scale from 0 (no pain) to 10 (worst possible pain). The VAS is used in clinical evaluation of pain and in reported outcomes literature.6,7
Many generic PROMs assess mental health status in addition to physical limitations. Poor preoperative mental health status has been recognized as a predictor of worse outcomes across a variety of orthopedic procedures.8,9 Therefore, to assess the overall influence of an orthopedic condition, it is important to include at least 1 generic PROM that assesses mental health status before and after an episode of care. Generic PROMs commonly used in orthopedic surgery include the 36-Item Short Form Health Survey (SF-36), the shorter SF-12, the Veterans RAND 12-Item Health Survey (VR-12), the World Health Organization Disability Assessment Schedule (WHODAS), the European Quality of Life-5 Dimensions (EQ-5D) index, and the 10-item Patient-Reported Outcomes Measurement Information System Global Health (PROMIS-10) scale.10-14
Some generic outcome measures (eg, the EQ-5D index) offer the “utility” calculation, which represents a preference for a patient’s desired health status. Such utilities allow for a measurement of quality of life, represented by quality-adjusted life years (QALY), which is a standardized measure of disease burden. Calculated QALY from measures such as the EQ-5D can be used in cost-effectiveness analyses of surgical interventions and have been used to validate use of procedures, particularly in arthroplasty.15-17
Disease-Specific Outcome Measures
Likewise, there is a range of disease-specific PROMs validated for use in orthopedic surgery, and providers select PROMs that fit their scope of practice. In anatomical regions such as the knee, hip, and shoulder, disease-specific outcome measures vary significantly by subspecialty and patient population. When selecting disease-specific PROMs, providers must consider tools such as reliability, validity, responsiveness, and available population norms. One study used Evaluating Measures of Patient-Reported Outcomes (EMPRO) to assess the quality of a PROM in shoulders and concluded that the American Shoulder and Elbow Surgeons (ASES) index, the Simple Shoulder Test (SST), and the Oxford Shoulder Score (OSS) were all supported for use in practice.18 It is important to note that reliability, validity, and responsiveness of a PROM may vary with the diagnosis or the patient population studied. For example, the SST was found to be responsive in assessing rotator cuff injury but not as useful in assessing shoulder instability or arthritis.19 Variable responsiveness highlights the need for a diagnosis-based level of PROM customization. For example, patients who undergo a surgical intervention for shoulder instability are given a customized survey, which includes PROMs specific to their condition, such as the Western Ontario Shoulder Instability (WOSI) index.20 For patients with knee instability, similar considerations apply; specific measures such as the Lysholm score and the Tenger Activity Scale capture the impact of injury in physically demanding activities.21 When selecting disease-specific PROMs, providers should consult articles like those by Davidson and Keating22 and Bent and colleagues,23 who present provider-friendly tools that can be used to examine the effectiveness of a PROM, and provide additional background information on selecting disease-specific PROMs. For hip and knee arthroplasty subspecialties, the International Society of Arthroplasty Registries (ISAR) created a working group that determines best practices for PROM collection and identifies PROMs most commonly reported in arthroplasty.24
Questionnaire Length Considerations
When PROMs are used in a practice, a balance must be struck between gathering enough information to determine functionality and limiting the patient burden of questionnaire length. A decision to use several PROMs all at once, at a single data collection point, can lengthen the questionnaire significantly. One study found that, with use of longer questionnaires, patients may lose interest, resulting in decreased reliability and compliance.25 For example, providers who use the long (42-item) Knee Injury and Osteoarthritis Outcome Score (KOOS) questionnaire to assess knee function are often limited in what other PROMs they may administer at the same time. Efforts to shorten this questionnaire while still capturing necessary information led to the development of the 7-item KOOS Jr, which was validated for use in knee arthroplasty and had its 7 items drawn from the original 42.26 Similarly, the 40-item Hip Disability and Osteoarthritis Outcome Score (HOOS) questionnaire was shortened to the 6-item HOOS Jr, which was validated for use in hip arthroplasty,27 and the generic SF-36 was shortened to the SF-12.11 Providers trying to build an outcomes database while minimizing patient burden should consider using the shorter versions of these questionnaires but should also consider their validity, as KOOS Jr and HOOS Jr have been validated for use only in knee and hip arthroplasty and not in other knee and hip conditions.
PROM Data Collection Considerations
Comprehensive collection of longitudinal PROM data poses many challenges for providers and patients. For providers, the greatest challenges are infrastructure, technology, and the personnel needed to administer and store paper or electronic surveys. For patients, the most common survey completion barriers are questionnaire length, confusing or irrelevant content, and, in the case of some older adults, inability to complete surveys electronically.25
Identifying a nonresponsive or noncompliant patient population is an important issue in collecting PROM data for research or other purposes. A study of factors associated with higher nonresponse rates in elective surgery patients (N = 135,474) found that noncompliance was higher for males, patients under age 55 years, nonwhites, patients in the lowest socioeconomic quintile, patients living alone, patients needing assistance in completing questionnaires, and patients who previously underwent surgery for their condition.28 In a systematic review of methods that increased the response rates of postal and electronic surveys, Edwards and colleagues29 found significantly higher odds of response for patients who were prenotified of the survey, given shorter questionnaires, or given a deadline for survey completion. Of note, response rates were lower when the word survey was used in the subject line of an email.
PROM distribution has evolved with the rise of technological advances that allow for electronic survey distribution and data capture. Several studies have found that electronically administered PROMs have high response rates.3,30,31 In a study of patients who underwent total hip arthroplasty, Rolfson and colleagues32 found that response rates were significantly higher for those who were surveyed on paper than for those surveyed over the internet. A randomized controlled study found that, compared with paper surveys, digital tablet surveys effectively and reliably collected PROM data; in addition, digital tablets provided instant data storage, and improved survey completion by requiring that all questions be answered before the survey could be submitted.33 However, age, race/ethnicity, and income disparities in technology use must be considered when administering internet-based follow-up surveys and analyzing data collected with web-based methods.34 A study of total joint arthroplasty candidates found that several groups were less likely to complete electronic PROM questionnaires: patients over age 75 years, Hispanic or black patients, patients with Medicare or Medicaid, patients who previously underwent orthopedic surgery, patients undergoing revision total joint arthroplasty, patients with other comorbidities, and patients whose primary language was not English.35 Providers interested in implementing PROMs must consider their patient population when selecting a method for survey distribution and follow-up. A study found that a majority of PROMs were written at a level many patients may not have understood, because of their literacy level or age; this lack of understanding created a barrier to compliance in many patient populations.36
PROM Limitations and PROMIS Use
Use of PROMs has its limitations. The large variety of PROMs available for use in orthopedic surgery has led to several standardization initiatives. The National Institutes of Health funded the development of PROMIS, a person-centered measures database that evaluates and monitors the physical, social, and emotional health of adults and children.37 The goal of PROMIS is to develop a standardized method of selecting PROMs, so that all medical disciplines and subspecialties can choose an applicable set of questions from the PROMIS question bank and use it in practice. Orthopedic surgery can use questions pertaining to physical functioning of the lower and upper extremities as well as quality of life and mental health. PROMIS physical function questions have been validated for use in several areas of orthopedic surgery.38-40 A disadvantage of PROMIS is the overgenerality of its questions, which may not be as effective in capturing the implications of specific diagnoses. For example, it is difficult to use generalized questions to determine the implications of a diagnosis such as shoulder instability, which may affect only higher functioning activities or sports. More research on best PROM selection practices is needed in order to either standardize PROMs or move toward use of a single database such as PROMIS.
Future Directions in PROM Applications
PROMs are being used for research and patient engagement, but there are many other applications on the horizon. As already mentioned, predictive modeling is of particular interest. The existence of vast collaborative PROM databases that capture a diverse patient population introduces the possibility of creating models capable of predicting a patient outcome and enhancing shared decision-making.3 Predicting good or excellent patient outcomes for specific patient populations may allow elimination of certain postoperative visits, thereby creating more cost-effective care and reducing the burden of unnecessary clinic visits for both patients and physicians.
As with other healthcare areas, PROM data collection technology is rapidly advancing. Not only has electronic technology almost entirely replaced paper-and-pencil collection methods, but a new method of outcome data collection has been developed: computerized adaptive testing (CAT). CAT uses item-response theory to minimize the number of questions patients must answer in order for validated and reliable outcome scores to be calculated. According to multiple studies, CAT used across several questionnaires has reliably assessed PROMs while minimizing floor and ceiling effects, eliminating irrelevant questions, and shortening survey completion time.41-43
Besides becoming more patient-friendly and accessible across multiple interfaces (mobile devices and computers), PROMs are also beginning to be integrated into the electronic medical record, allowing easier access to information during chart reviews. Use of statistical and predictive modeling, as described by Chang,3 could give PROMs a role in clinical decision-making. Informing patients of their expected outcome and recovery trajectory—based on demographics, comorbidities, preoperative functional status, and other factors—could influence their decision to undergo surgical intervention. As Halawi and colleagues44 pointed out, it is important to discuss patient expectations before surgery, as unrealistic ones can negatively affect outcomes and lead to dissatisfaction. With clinicians having ready access to statistics and models in patient charts, we may see a transformation in clinical practices and surgical decision-making.
Conclusion
PROMs offer many ways to improve research and clinical care in orthopedic surgery. However, implementing PROMs in practice is not without challenges. Interested orthopedic surgeons should select the PROMs that are most appropriate—reliable, validated, and responsive to their patient population. Electronic distribution of PROM questionnaires is effective and allows data to be stored on entry, but orthopedic surgeons must consider their patient population to ensure accurate data capture and compliance in longitudinal surveys. Proper implementation of PROMs in a practice can allow clinicians to formulate expectations for postoperative recovery and set reasonable postoperative goals while engaging patients in improving quality of care.
1. Howie L, Hirsch B, Locklear T, Abernethy AP. Assessing the value of patient-generated data to comparative effectiveness research. Health Aff (Millwood). 2014;33(7):1220-1228.
2. Haywood KL. Patient-reported outcome I: measuring what matters in musculoskeletal care. Musculoskeletal Care. 2006;4(4):187-203.
3. Chang CH. Patient-reported outcomes measurement and management with innovative methodologies and technologies. Qual Life Res. 2007;16(suppl 1):157-166.
4. Black N. Patient reported outcome measures could help transform healthcare. BMJ. 2013;346:f167.
5. Porter ME. A strategy for health care reform—toward a value-based system. N Engl J Med. 2009;361(2):109-112.
6. Scott J, Huskisson EC. Graphic representation of pain. Pain. 1976;2(2):175-184.
7. de Nies F, Fidler MW. Visual analog scale for the assessment of total hip arthroplasty. J Arthroplasty. 1997;12(4):416-419.
8. Ayers DC, Franklin PD, Ring DC. The role of emotional health in functional outcomes after orthopaedic surgery: extending the biopsychosocial model to orthopaedics: AOA critical issues. J Bone Joint Surg Am. 2013;95(21):e165.
9. Edwards RR, Haythornthwaite JA, Smith MT, Klick B, Katz JN. Catastrophizing and depressive symptoms as prospective predictors of outcomes following total knee replacement. Pain Res Manag. 2009;14(4):307-311.
10. Patel AA, Donegan D, Albert T. The 36-Item Short Form. J Am Acad Orthop Surg. 2007;15(2):126-134.
11. Ware J Jr, Kosinski M, Keller SD. A 12-Item Short-Form Health Survey: construction of scales and preliminary tests of reliability and validity. Med Care. 1996;34(3):220-233.
12. About the VR-36, VR-12 and VR-6D. Boston University School of Public Health website. http://www.bu.edu/sph/research/research-landing-page/vr-36-vr-12-and-vr-6d/. Accessed October 4, 2017.
13. Jansson KA, Granath F. Health-related quality of life (EQ-5D) before and after orthopedic surgery. Acta Orthop. 2011;82(1):82-89.
14. Oak SR, Strnad GJ, Bena J, et al. Responsiveness comparison of the EQ-5D, PROMIS Global Health, and VR-12 questionnaires in knee arthroscopy. Orthop J Sports Med. 2016;4(12):2325967116674714.
15. Lavernia CJ, Iacobelli DA, Brooks L, Villa JM. The cost-utility of total hip arthroplasty: earlier intervention, improved economics. J Arthroplasty. 2015;30(6):945-949.
16. Mather RC 3rd, Watters TS, Orlando LA, Bolognesi MP, Moorman CT 3rd. Cost effectiveness analysis of hemiarthroplasty and total shoulder arthroplasty. J Shoulder Elbow Surg. 2010;19(3):325-334.
17. Brauer CA, Rosen AB, Olchanski NV, Neumann PJ. Cost-utility analyses in orthopaedic surgery. J Bone Joint Surg Am. 2005;87(6):1253-1259.
18. Schmidt S, Ferrer M, González M, et al; EMPRO Group. Evaluation of shoulder-specific patient-reported outcome measures: a systematic and standardized comparison of available evidence. J Shoulder Elbow Surg. 2014;23(3):434-444.
19. Godfrey J, Hamman R, Lowenstein S, Briggs K, Kocher M. Reliability, validity, and responsiveness of the Simple Shoulder Test: psychometric properties by age and injury type. J Shoulder Elbow Surg. 2007;16(3):260-267.
20. Kirkley A, Griffin S, McLintock H, Ng L. The development and evaluation of a disease-specific quality of life measurement tool for shoulder instability. The Western Ontario Shoulder Instability Index (WOSI). Am J Sports Med. 1998;26(6):764-772.
21. Briggs KK, Lysholm J, Tegner Y, Rodkey WG, Kocher MS, Steadman JR. The reliability, validity, and responsiveness of the Lysholm score and Tegner Activity Scale for anterior cruciate ligament injuries of the knee: 25 years later. Am J Sports Med. 2009;37(5):890-897.
22. Davidson M, Keating J. Patient-reported outcome measures (PROMs): how should I interpret reports of measurement properties? A practical guide for clinicians and researchers who are not biostatisticians. Br J Sports Med. 2014;48(9):792-796.
23. Bent NP, Wright CC, Rushton AB, Batt ME. Selecting outcome measures in sports medicine: a guide for practitioners using the example of anterior cruciate ligament rehabilitation. Br J Sports Med. 2009;43(13):1006-1012.
24. Rolfson O, Eresian Chenok K, Bohm E, et al; Patient-Reported Outcome Measures Working Group of the International Society of Arthroplasty Registries. Patient-reported outcome measures in arthroplasty registries. Acta Orthop. 2016;87(suppl 1):3-8.
25. Franklin PD, Lewallen D, Bozic K, Hallstrom B, Jiranek W, Ayers DC. Implementation of patient-reported outcome measures in U.S. total joint replacement registries: rationale, status, and plans. J Bone Joint Surg Am. 2014;96(suppl 1):104-109.
26. Lyman S, Lee YY, Franklin PD, Li W, Cross MB, Padgett DE. Validation of the KOOS, JR: a short-form knee arthroplasty outcomes survey. Clin Orthop Relat Res. 2016;474(6):1461-1471.
27. Lyman S, Lee YY, Franklin PD, Li W, Mayman DJ, Padgett DE. Validation of the HOOS, JR: a short-form hip replacement survey. Clin Orthop Relat Res. 2016;474(6):1472-1482.
28. Hutchings A, Neuburger J, Grosse Frie K, Black N, van der Meulen J. Factors associated with non-response in routine use of patient reported outcome measures after elective surgery in England. Health Qual Life Outcomes. 2012;10:34.
29. Edwards PJ, Roberts I, Clarke MJ, et al. Methods to increase response to postal and electronic questionnaires. Cochrane Database Syst Rev. 2009;(3):MR000008.
30. Gakhar H, McConnell B, Apostolopoulos AP, Lewis P. A pilot study investigating the use of at-home, web-based questionnaires compiling patient-reported outcome measures following total hip and knee replacement surgeries. J Long Term Eff Med Implants. 2013;23(1):39-43.
31. Bojcic JL, Sue VM, Huon TS, Maletis GB, Inacio MC. Comparison of paper and electronic surveys for measuring patient-reported outcomes after anterior cruciate ligament reconstruction. Perm J. 2014;18(3):22-26.
32. Rolfson O, Salomonsson R, Dahlberg LE, Garellick G. Internet-based follow-up questionnaire for measuring patient-reported outcome after total hip replacement surgery—reliability and response rate. Value Health. 2011;14(2):316-321.
33. Shah KN, Hofmann MR, Schwarzkopf R, et al. Patient-reported outcome measures: how do digital tablets stack up to paper forms? A randomized, controlled study. Am J Orthop. 2016;45(7):E451-E457.
34. Kaiser Family Foundation. The Digital Divide and Access to Health Information Online. http://kff.org/disparities-policy/poll-finding/the-digital-divide-and-access-to-health/. Published April 1, 2011. Accessed October 4, 2017.
35. Schamber EM, Takemoto SK, Chenok KE, Bozic KJ. Barriers to completion of patient reported outcome measures. J Arthroplasty. 2013;28(9):1449-1453.
36. El-Daly I, Ibraheim H, Rajakulendran K, Culpan P, Bates P. Are patient-reported outcome measures in orthopaedics easily read by patients? Clin Orthop Relat Res. 2016;474(1):246-255.
37. Intro to PROMIS. 2016. Health Measures website. http://www.healthmeasures.net/explore-measurement-systems/promis/intro-to-promis. Accessed October 4, 2017.
38. Hung M, Baumhauer JF, Latt LD, Saltzman CL, SooHoo NF, Hunt KJ; National Orthopaedic Foot & Ankle Outcomes Research Network. Validation of PROMIS ® Physical Function computerized adaptive tests for orthopaedic foot and ankle outcome research. Clin Orthop Relat Res. 2013;471(11):3466-3474.
39. Hung M, Clegg DO, Greene T, Saltzman CL. Evaluation of the PROMIS Physical Function item bank in orthopaedic patients. J Orthop Res. 2011;29(6):947-953.
40. Tyser AR, Beckmann J, Franklin JD, et al. Evaluation of the PROMIS Physical Function computer adaptive test in the upper extremity. J Hand Surg Am. 2014;39(10):2047-2051.e4.
41. Hung M, Stuart AR, Higgins TF, Saltzman CL, Kubiak EN. Computerized adaptive testing using the PROMIS Physical Function item bank reduces test burden with less ceiling effects compared with the Short Musculoskeletal Function Assessment in orthopaedic trauma patients. J Orthop Trauma. 2014;28(8):439-443.
42. Hung M, Clegg DO, Greene T, Weir C, Saltzman CL. A lower extremity physical function computerized adaptive testing instrument for orthopaedic patients. Foot Ankle Int. 2012;33(4):326-335.
43. Döring AC, Nota SP, Hageman MG, Ring DC. Measurement of upper extremity disability using the Patient-Reported Outcomes Measurement Information System. J Hand Surg Am. 2014;39(6):1160-1165.
44. Halawi MJ, Greene K, Barsoum WK. Optimizing outcomes of total joint arthroplasty under the comprehensive care for joint replacement model. Am J Orthop. 2016;45(3):E112-E113.
Superior Capsular Reconstruction: Clinical Outcomes After Minimum 2-Year Follow-Up
Take-Home Points
- The SCR is a viable treatment option for massive, irreparable RCTs.
- Arm position and exact measurement between anchors will help ensure proper graft tensioning.
- Anterior and posterior tension and margin convergence are critical to stabilizing the graft.
- Acromial-humeral distance, ASES, and VAS scores are improved and maintained over long-term follow-up.
- The dermal allograft should be 3.0 mm or thicker.
Conventional treatments for irreparable massive rotator cuff tears (RCTs) have ranged from nonoperative care to débridement and biceps tenotomy,1,2 partial cuff repair,3,4 bridging patch grafts,5 tendon transfers,6,7 and reverse total shoulder arthroplasty (RTSA).8,9 Superior capsular reconstruction (SCR), originally described by Mihata and colleagues,10 has been developed as an alternative to these interventions. Dr. Hirahara modified the technique to use dermal allograft instead of fascia lata autograft.10,11
Biomechanical analysis has confirmed the integral role of the superior capsule in shoulder function.10,12-14 In the presence of a massive RCT, the humeral head migrates superiorly, causing significant pain and functional deficits, such as pseudoparalysis. It is theorized that reestablishing this important stabilizer—centering the humeral head in the glenoid and allowing the larger muscles to move the arm about a proper fulcrum—improves function and decreases pain.
Using ultrasonography (US), radiography, magnetic resonance imaging (MRI), clinical outcome scores, and a visual analog scale (VAS) for pain, we prospectively evaluated minimum 2-year clinical outcomes of performing SCR with dermal allograft for irreparable RCTs.
Methods
Except where noted otherwise, all products mentioned in this section were made by Arthrex.
Surgical Technique
The surgical technique used here was described by Hirahara and Adams.11 ArthroFlex dermal allograft was attached to the greater tuberosity and the glenoid, creating a superior restraint that replaced the anatomical superior capsule (Figures 1A, 1B). Some cases included biceps tenotomy, subscapularis repair, or infraspinatus repair. 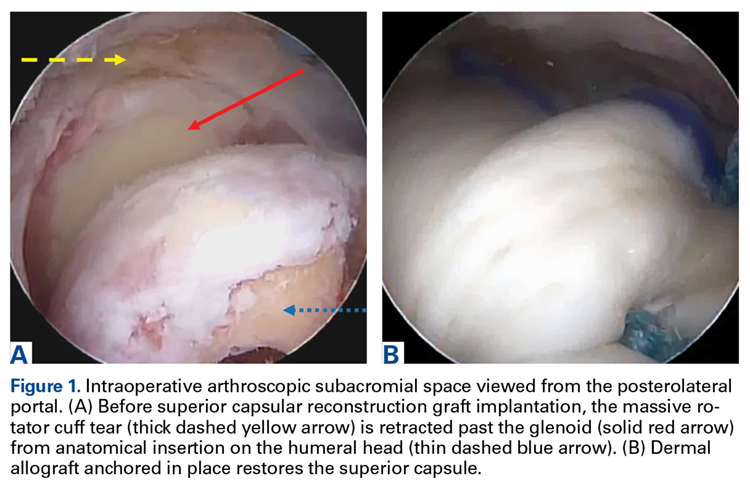
Medial fixation was obtained with a PASTA (partial articular supraspinatus tendon avulsion) bridge-type construct15 that consisted of two 3.0-mm BioComposite SutureTak anchors (placed medially on the glenoid rim, medial to the labrum) and a 3.5-mm BioComposite Vented SwiveLock. In some cases, a significant amount of tissue was present medially, and the third anchor was not used; instead, a double surgeon knot was used to fixate the double pulley medially.
Posterior margin convergence (PMC) was performed in all cases. Anterior margin convergence (AMC) was performed in only 3 cases.
Clinical Evaluation
All patients who underwent SCR were followed prospectively, and all signed an informed consent form. Between 2014 and the time of this study, 9 patients had surgery with a minimum 2-year follow-up. Before surgery, all patients received a diagnosis of full-thickness RCT with decreased acromial-humeral distance (AHD). One patient had RTSA 18 months after surgery, did not reach the 2-year follow-up, and was excluded from the data analysis. Patients were clinically evaluated on the 100-point American Shoulder and Elbow Surgeons (ASES) shoulder index and on a 10-point VAS for pain—before surgery, monthly for the first 6 months after surgery, then every 6 months until 2 years after surgery, and yearly thereafter. These patients were compared with Dr. Hirahara’s historical control patients, who had undergone repair of massive RCTs. Mean graft size was calculated and reported. Cases were separated and analyzed on the basis of whether AMC was performed. Student t tests were used to determine statistical differences between study patients’ preoperative and postoperative scores, between study and historical control patients, and between patients who had AMC performed and those who did not (P < .05).
Imaging
For all SCR patients, preoperative and postoperative radiographs were obtained in 2 planes: anterior-posterior with arm in neutral rotation, and scapular Y. On anteroposterior radiographs, AHD was measured from the most proximal aspect of the humeral head in a vertical line to the most inferior portion of the acromion (Figures 2A, 2B). 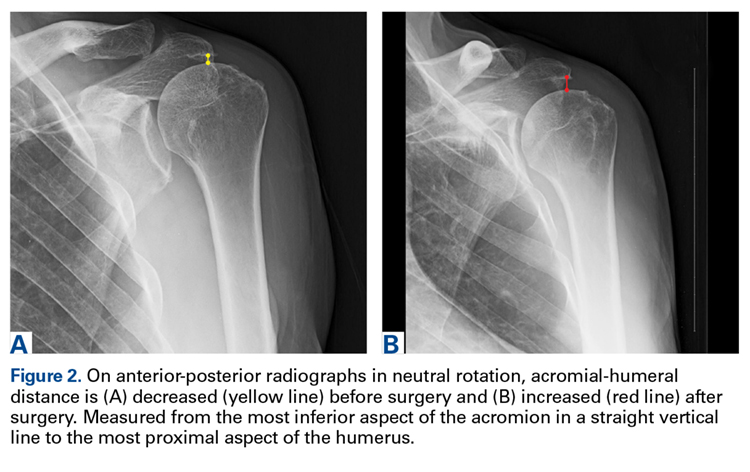
Results
The Table provides an overview of the study results. Eight patients (6 men, 2 women) met the final inclusion criteria for postoperative ASES and VAS data analysis. 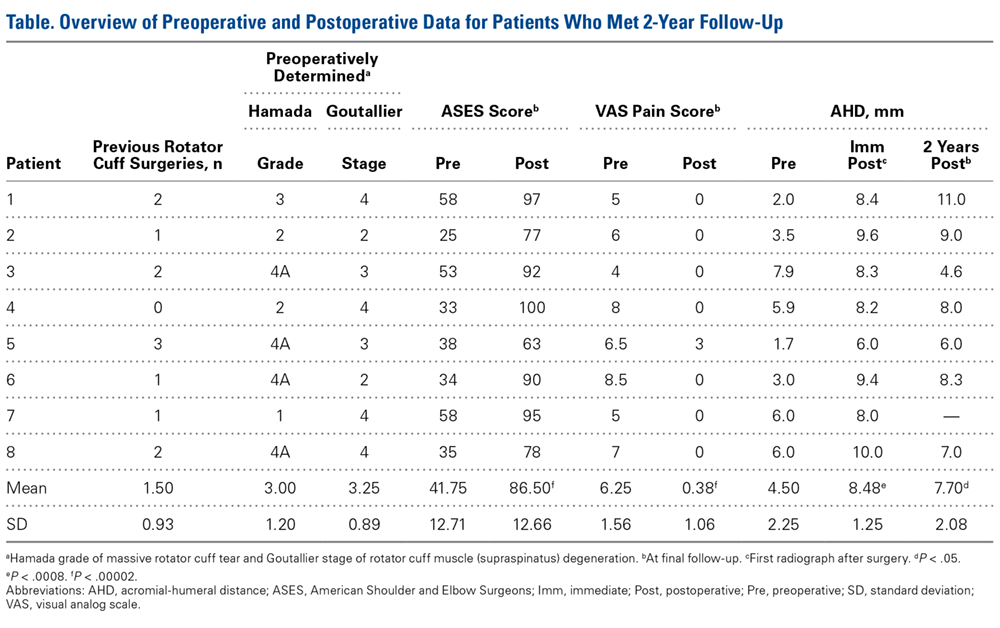
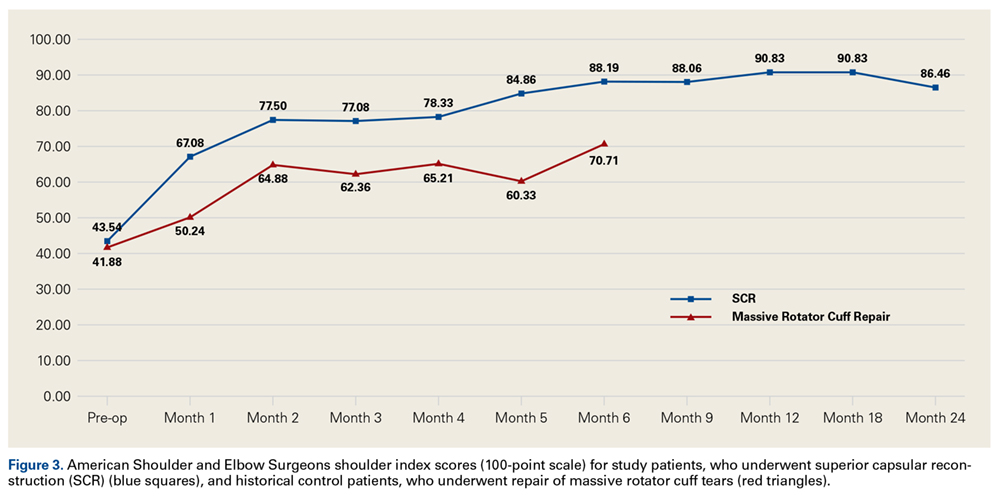
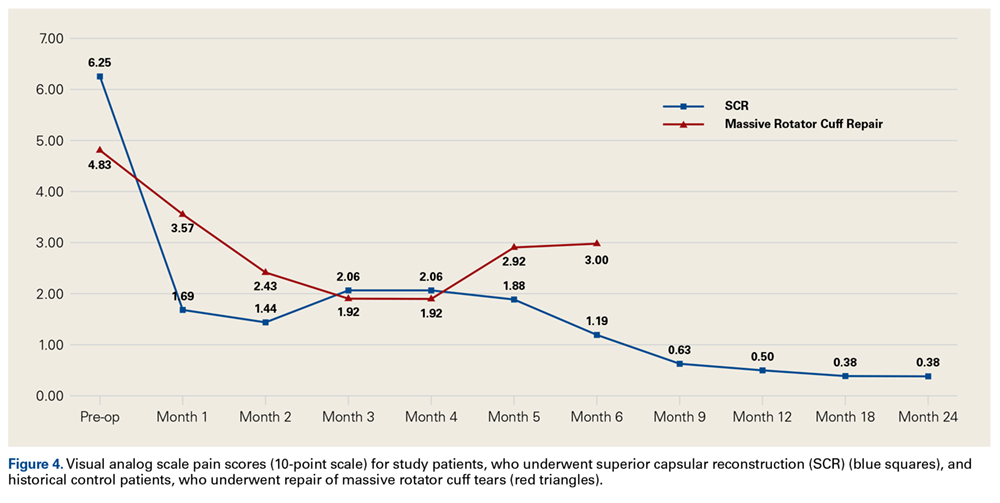
AHD was measured on a standard anteroposterior radiograph in neutral rotation. The Hamada grading scale16 was used to classify the massive RCTs before and after surgery. Before surgery, 4 were grade 4A, 1 grade 3, 2 grade 2, and 1 grade 1; immediately after surgery, all were grade 1 (AHD, ≥6 mm). Two years after surgery, 1 patient had an AHD of 4.6 mm after a failure caused by a fall. Mean (SD) preoperative AHD was 4.50 (2.25) mm (range, 1.7-7.9 mm). Radiographs obtained immediately (mean, 1.22 months; range, 1 day-2.73 months) after surgery showed AHD was significantly (P < .0008) increased (mean, 8.48 mm; SD, 1.25 mm; range, 6.0-10.0 mm) (Figure 5). 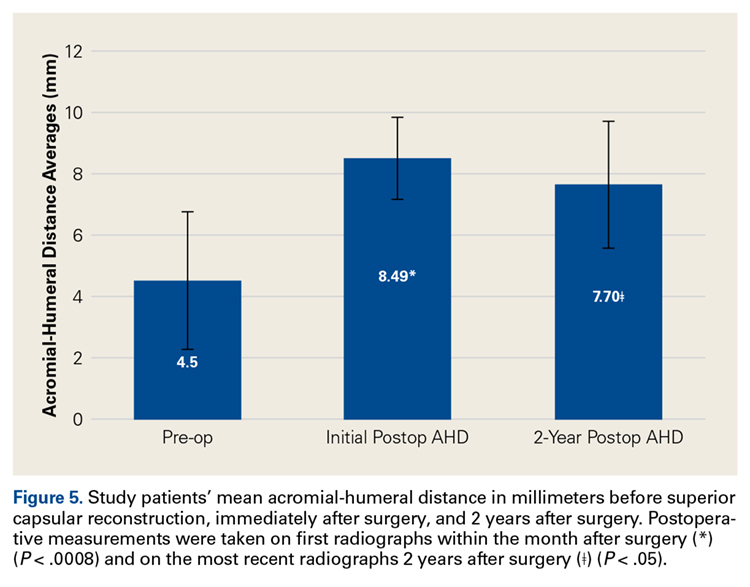
Mean graft size was 2.9 mm medial × 3.6 mm lateral × 5.4 mm anterior × 5.4 mm posterior. Three patients had AMC performed. There was a significant (P < .05) difference in ASES scores between patients who had AMC performed (93) and those who did not (77).
Ultrasonography
Two weeks to 2 months after surgery, all patients had an intact capsular graft and no pulsatile vessels on US. Between 4 months and 10 months, US showed the construct intact laterally in all cases, a pulsatile vessel in the graft at the tuberosity (evidence of blood flow) in 4 of 5 cases, and a pulsatile vessel hypertrophied in 2 cases (Figures 6A, 6B). 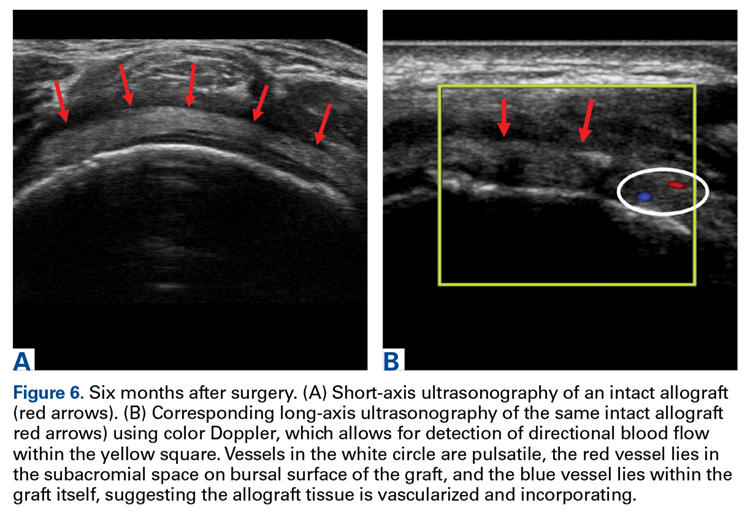
Magnetic Resonance Imaging
Before surgery, 4 patients had Goutallier17 stage 4 rotator cuff muscle degeneration, 2 had stage 3 degeneration, and 2 had stage 2 degeneration. Throughout the follow-up period, US was as effective as MRI in determining graft integrity, graft thickness, and greater tuberosity fixation. Therefore, the SCRs were assessed primarily with US. MRI was ordered only if a failure was suspected or if the patient had some form of trauma. A total of 7 MRIs were ordered for 5 of the 8 patients in the study. The graft was intact in 4 of the 5 (Figures 7A-7C) and ruptured in the fifth. 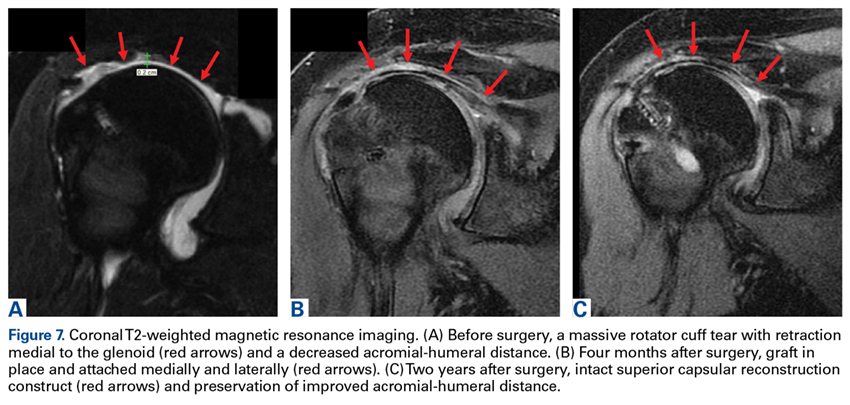
Discussion
Mihata and colleagues10 published 2-year data for their reconstructive procedure with fascia lata autograft. In a modification of their procedure, Dr. Hirahara used dermal allograft to recreate the superior capsule.11 The results of the present 2-year study mirror the clinical outcomes reported by Mihata and colleagues10 and confirm that SCR improves functional outcomes and increases AHD regardless of graft type used.
The outcomes of the SCR patients in our study were significantly better than the outcomes of the historical control patients, who underwent repair of massive RCTs. Although there was no significant difference in the 2 groups’ ASES scores, the control patients had significantly higher postoperative VAS pain scores. We think that, as more patients undergo SCR and the population sample increases, we will see a significant difference in ASES scores as well (our SCR patients already showed a trend toward improved ASES scores).
Compared with RTSA, SCR has fewer risks and fewer complications and does not limit further surgical options.8,9,18 The 9 patients who had surgery with a minimum 2-year follow-up in our study had 4 complications. Six months after surgery, 1 patient fell and tore the infraspinatus and subscapularis muscles. Outcomes continued to improve, and no issues were reported, despite a decrease in AHD, from 8 mm immediately after surgery to 4.6 mm 2 years after surgery.
Two patients were in motor vehicle accidents. In 1 case, the accident occurred about 2 months after surgery. This patient also sustained a possible injury in a fall after receiving general anesthesia for a dental procedure. After having done very well the preceding months, the patient now reported increasing pain and dysfunction. MRI showed loss of glenoid fixation. Improved ASES and VAS pain scores were maintained throughout the follow-up period. AHD was increased at 13 months and mildly decreased at 2 years. Glenoid fixation was obtained with 2 anchors and a double surgeon knot. When possible, however, it is best to add an anchor and double-row fixation, as 3 anchors and a double-row construct are biomechanically stronger.19-24
The other motor vehicle accident occurred about 23 months after surgery. Two months later, a graft rupture was found on US and MRI, but the patient was maintaining full range of motion, AHD, and improved strength. The 1.5-mm graft in this patient was thinner than the 3.5-mm grafts in the rest of the study group. This was the only patient who developed a graft rupture rather than loss of fixation.
If only patients with graft thickness >3.0 mm are included in the data analysis, mean ASES score rises to 89.76, and mean VAS pain score drops to 0. Therefore, we argue against using a graft thinner than 3.5 mm. Our excellent study results indicate that larger grafts are unnecessary. Mihata and colleagues10 used fascia lata grafts of 6 mm to 8 mm. Ultimate load to failure is significantly higher for dermal allograft than for fascia lata graft.25 In SCR, the stronger dermal allograft withstands applied forces and repeated deformations and has excellent clinical outcomes.
Only 1 patient had a failure that required RTSA. VAS pain scores were lower and ASES scores were improved the first year after surgery, but then function deteriorated. The patient said there was no specific precipitating incident. Computed tomography arthrogram, ordered to assess the construct, showed anterior and superior subluxation of the humeral head, even with an intact subscapularis tendon—an indication of underlying instability, which most likely caused the failure. Eighteen months after surgery, the patient was able to undergo RTSA. On further evaluation of this patient’s procedure, it was determined that the graft needed better fixation anteriorly.
Mihata and colleagues10,12,14 indicated that AMC was unnecessary, and our procedure did not require it. However, data in our prospective evaluation began showing improved outcomes with AMC. As dermal allograft is more elastic than fascia lata autograft,25 we concluded that graft tensioning is key to the success of this procedure. Graft tension depends on many factors, including exact measurement of the distances between the anchors to punch holes in the graft, arm position to set the relationship between the anchor distances, and AMC and PMC. We recommend placing the arm in neutral rotation, neutral flexion, and abduction with the patient at rest, based on the size of the patient’s latissimus dorsi. Too much abduction causes overtensioning, and excess rotation or flexion-extension changes the distance between the glenoid and the greater tuberosity asymmetrically, from anterior to posterior. With the arm in neutral position, distances between anchors are accurately measured, and these measurements are used to determine graft size.
Graft tension is also needed to control the amount of elasticity allowed by the graft and thereby maintain stability, as shown by the Poisson ratio, the ratio of transverse contraction to longitudinal extension on a material in the presence of a stretching force. As applied to SCR, it is the ratio of mediolateral elasticity to anteroposterior deformation or constraint. If the graft is appropriately secured in the anteroposterior direction by way of ACM and PMC, elongation in the medial-lateral direction will be limited—reducing the elasticity of the graft, improving overall stability, and ultimately producing better clinical outcomes. This issue was discussed by Burkhart and colleagues26 with respect to the “rotator cable complex,” which now might be best described as the “rotator-capsule cable complex.” In our study, this phenomenon was evident in the finding that patients who had AMC performed did significantly better than patients who did not have AMC performed. The ability of dermal allograft to deform in these dimensions without failure while allowing excellent range of motion makes dermal allograft an exceptional choice for grafting during SCR. Mihata25 also found dermal allograft had a clear advantage in providing better range of motion, whereas fascia lata autograft resulted in a stiffer construct.
Dermal allograft can also incorporate into the body and transform into host tissue. The literature has described musculoskeletal US as an effective diagnostic and interventional tool.27-31 We used it to evaluate graft size, patency, and viability. As can be seen on US, the native rotator cuff does not have any pulsatile vessels and is fed by capillary flow. Dermal allograft has native vasculature built into the tissue. After 4 months to 8 months, presence of pulsatile vessels within the graft at the greater tuberosity indicates clear revascularization and incorporation of the tissue (Figure 6B). Disappearance of pulsatile vessels on US after 1 year indicates transformation to a stabilizing structure analogous to capsule or ligament with capillary flow. US also showed graft hypertrophy after 2 years, supporting a finding of integration and growth.
Conclusion
In the past, patients with irreparable massive RCTs had few good surgical management options, RTSA being the most definitive. SCR is technically challenging and requires use of specific implantation methods but can provide patients with outstanding relief. Our clinical data showed that technically well executed SCR effectively restores the superior restraints in the glenohumeral joint and thereby increases function and decreases pain in patients with irreparable massive RCTs, even after 2 years.
1 Lee BG, Cho NS, Rhee YG. Results of arthroscopic decompression and tuberoplasty for irreparable massive rotator cuff tears. Arthroscopy. 2011;27(10):1341-1350.
2. Liem D, Lengers N, Dedy N, Poetzl W, Steinbeck J, Marquardt B. Arthroscopic debridement of massive irreparable rotator cuff tears. Arthroscopy. 2008;24(7):743-748.
3. Kim SJ, Lee IS, Kim SH, Lee WY, Chun YM. Arthroscopic partial repair of irreparable large to massive rotator cuff tears. Arthroscopy. 2012;28(6):761-768.
4. Wellmann M, Lichtenberg S, da Silva G, Magosch P, Habermeyer P. Results of arthroscopic partial repair of large retracted rotator cuff tears. Arthroscopy. 2013;29(8):1275-1282.
5. Mori D, Funakoshi N, Yamashita F. Arthroscopic surgery of irreparable large or massive rotator cuff tears with low-grade fatty degeneration of the infraspinatus: patch autograft procedure versus partial repair procedure. Arthroscopy. 2013;29(12):1911-1921.
6. Gavriilidis I, Kircher J, Mogasch P, Lichtenberg S, Habermeyer P. Pectoralis major transfer for the treatment of irreparable anterosuperior rotator cuff tears. Int Orthop. 2010;34(5):689-694.
7. Grimberg J, Kany J, Valenti P, Amaravathi R, Ramalingam AT. Arthroscopic-assisted latissimus dorsi tendon transfer for irreparable posterosuperior cuff tears. Arthroscopy. 2015;31(4):599-607.
8. Bedi A, Dines J, Warren RF, Dines DM. Massive tears of the rotator cuff. J Bone Joint Surg Am. 2010;92(9):1894-1908.
9. Ek ET, Neukom L, Catanzaro S, Gerber C. Reverse total shoulder arthroplasty for massive irreparable rotator cuff tears in patients younger than 65 years old: results after five to fifteen years. J Shoulder Elbow Surg. 2013;22(9):1199-1208.
10. Mihata T, Lee TQ, Watanabe C, et al. Clinical results of arthroscopic superior capsule reconstruction for irreparable rotator cuff tears. Arthroscopy. 2013;29(3):459-470.
11. Hirahara AM, Adams CR. Arthroscopic superior capsular reconstruction for treatment of massive irreparable rotator cuff tears. Arthrosc Tech. 2015;4(6):e637-e641.
12. Mihata T, McGarry MH, Kahn T, Goldberg I, Neo M, Lee TQ. Biomechanical role of capsular continuity in superior capsule reconstruction for irreparable tears of the supraspinatus tendon. Am J Sports Med. 2016;44(6):1423-1430.
13. Mihata T, McGarry MH, Ishihara Y, et al. Biomechanical analysis of articular-sided partial-thickness rotator cuff tear and repair. Am J Sports Med. 2015;43(2):439-446.
14. Mihata T, McGarry MH, Pirolo JM, Kinoshita M, Lee TQ. Superior capsule reconstruction to restore superior stability in irreparable rotator cuff tears: a biomechanical cadaveric study. Am J Sports Med. 2012;40(10):2248-2255.
15. Hirahara AM, Andersen WJ. The PASTA bridge: a technique for the arthroscopic repair of PASTA lesions [published online ahead of print September 18, 2017]. Arthrosc Tech. http://dx.doi.org/10.1016/j.eats.2017.06.022.
16. Hamada K, Yamanaka K, Uchiyama Y, Mikasa T, Mikasa M. A radiographic classification of massive rotator cuff tear arthritis. Clin Orthop Relat Res. 2011;469(9):2452-2460.
17. Oh JH, Kim SH, Choi JA, Kim Y, Oh CH. Reliability of the grading system for fatty degeneration of rotator cuff muscles. Clin Orthop Relat Res. 2010;468(6):1558-1564.
18. Boileau P, Sinnerton RJ, Chuinard C, Walch G. Arthroplasty of the shoulder. J Bone Joint Surg Br. 2006;88(5):562-575.
19. Apreleva M, Özbaydar M, Fitzgibbons PG, Warner JJ. Rotator cuff tears: the effect of the reconstruction method on three-dimensional repair site area. Arthroscopy. 2002;18(5):519-526.
20. Baums MH, Spahn G, Steckel H, Fischer A, Schultz W, Klinger HM. Comparative evaluation of the tendon–bone interface contact pressure in different single- versus double-row suture anchor repair techniques. Knee Surg Sports Traumatol Arthrosc. 2009;17(12):1466-1472.
21. Lo IK, Burkhart SS. Double-row arthroscopic rotator cuff repair: re-establishing the footprint of the rotator cuff. Arthroscopy. 2003;19(9):1035-1042.
22. Mazzocca AD, Millett PJ, Guanche CA, Santangelo SA, Arciero RA. Arthroscopic single-row versus double-row suture anchor rotator cuff repair. Am J Sports Med. 2005;33(12):1861-1868.
23. Pauly S, Fiebig D, Kieser B, Albrecht B, Schill A, Scheibel M. Biomechanical comparison of four double-row speed-bridging rotator cuff repair techniques with or without medial or lateral row enhancement. Knee Surg Sports Traumatol Arthrosc. 2011;19(12):2090-2097.
24. Pauly S, Kieser B, Schill A, Gerhardt C, Scheibel M. Biomechanical comparison of 4 double-row suture-bridging rotator cuff repair techniques using different medial-row configurations. Arthroscopy. 2010;26(10):1281-1288.
25. Mihata T. Superior capsule reconstruction using human dermal allograft: a biomechanical cadaveric study. Presentation at: Annual Meeting of the American Academy of Orthopaedic Surgeons; March 1-5, 2016; Orlando, FL.
26. Burkhart SS, Esch JC, Jolson RS. The rotator crescent and rotator cable: an anatomic description of the shoulder’s “suspension bridge.” Arthroscopy. 1993;9(6):611-616.
27. Hirahara AM, Andersen WJ. Ultrasound-guided percutaneous reconstruction of the anterolateral ligament: surgical technique and case report. Am J Orthop. 2016;45(7):418-422, 460.
28. Hirahara AM, Andersen WJ. Ultrasound-guided percutaneous repair of medial patellofemoral ligament: surgical technique and outcomes. Am J Orthop. 2017;46(3):152-157.
29. Hirahara AM, Mackay G, Andersen WJ. Ultrasound-guided InternalBrace of the medial collateral ligament. Arthrosc Tech. Accepted for publication.
30. Hirahara AM, Panero AJ. A guide to ultrasound of the shoulder, part 3: interventional and procedural uses. Am J Orthop. 2016;45(7):440-445.
31. Panero AJ, Hirahara AM. A guide to ultrasound of the shoulder, part 2: the diagnostic evaluation. Am J Orthop. 2016;45(4):233-238.
Take-Home Points
- The SCR is a viable treatment option for massive, irreparable RCTs.
- Arm position and exact measurement between anchors will help ensure proper graft tensioning.
- Anterior and posterior tension and margin convergence are critical to stabilizing the graft.
- Acromial-humeral distance, ASES, and VAS scores are improved and maintained over long-term follow-up.
- The dermal allograft should be 3.0 mm or thicker.
Conventional treatments for irreparable massive rotator cuff tears (RCTs) have ranged from nonoperative care to débridement and biceps tenotomy,1,2 partial cuff repair,3,4 bridging patch grafts,5 tendon transfers,6,7 and reverse total shoulder arthroplasty (RTSA).8,9 Superior capsular reconstruction (SCR), originally described by Mihata and colleagues,10 has been developed as an alternative to these interventions. Dr. Hirahara modified the technique to use dermal allograft instead of fascia lata autograft.10,11
Biomechanical analysis has confirmed the integral role of the superior capsule in shoulder function.10,12-14 In the presence of a massive RCT, the humeral head migrates superiorly, causing significant pain and functional deficits, such as pseudoparalysis. It is theorized that reestablishing this important stabilizer—centering the humeral head in the glenoid and allowing the larger muscles to move the arm about a proper fulcrum—improves function and decreases pain.
Using ultrasonography (US), radiography, magnetic resonance imaging (MRI), clinical outcome scores, and a visual analog scale (VAS) for pain, we prospectively evaluated minimum 2-year clinical outcomes of performing SCR with dermal allograft for irreparable RCTs.
Methods
Except where noted otherwise, all products mentioned in this section were made by Arthrex.
Surgical Technique
The surgical technique used here was described by Hirahara and Adams.11 ArthroFlex dermal allograft was attached to the greater tuberosity and the glenoid, creating a superior restraint that replaced the anatomical superior capsule (Figures 1A, 1B). Some cases included biceps tenotomy, subscapularis repair, or infraspinatus repair.
Medial fixation was obtained with a PASTA (partial articular supraspinatus tendon avulsion) bridge-type construct15 that consisted of two 3.0-mm BioComposite SutureTak anchors (placed medially on the glenoid rim, medial to the labrum) and a 3.5-mm BioComposite Vented SwiveLock. In some cases, a significant amount of tissue was present medially, and the third anchor was not used; instead, a double surgeon knot was used to fixate the double pulley medially.
Posterior margin convergence (PMC) was performed in all cases. Anterior margin convergence (AMC) was performed in only 3 cases.
Clinical Evaluation
All patients who underwent SCR were followed prospectively, and all signed an informed consent form. Between 2014 and the time of this study, 9 patients had surgery with a minimum 2-year follow-up. Before surgery, all patients received a diagnosis of full-thickness RCT with decreased acromial-humeral distance (AHD). One patient had RTSA 18 months after surgery, did not reach the 2-year follow-up, and was excluded from the data analysis. Patients were clinically evaluated on the 100-point American Shoulder and Elbow Surgeons (ASES) shoulder index and on a 10-point VAS for pain—before surgery, monthly for the first 6 months after surgery, then every 6 months until 2 years after surgery, and yearly thereafter. These patients were compared with Dr. Hirahara’s historical control patients, who had undergone repair of massive RCTs. Mean graft size was calculated and reported. Cases were separated and analyzed on the basis of whether AMC was performed. Student t tests were used to determine statistical differences between study patients’ preoperative and postoperative scores, between study and historical control patients, and between patients who had AMC performed and those who did not (P < .05).
Imaging
For all SCR patients, preoperative and postoperative radiographs were obtained in 2 planes: anterior-posterior with arm in neutral rotation, and scapular Y. On anteroposterior radiographs, AHD was measured from the most proximal aspect of the humeral head in a vertical line to the most inferior portion of the acromion (Figures 2A, 2B).
Results
The Table provides an overview of the study results. Eight patients (6 men, 2 women) met the final inclusion criteria for postoperative ASES and VAS data analysis.
AHD was measured on a standard anteroposterior radiograph in neutral rotation. The Hamada grading scale16 was used to classify the massive RCTs before and after surgery. Before surgery, 4 were grade 4A, 1 grade 3, 2 grade 2, and 1 grade 1; immediately after surgery, all were grade 1 (AHD, ≥6 mm). Two years after surgery, 1 patient had an AHD of 4.6 mm after a failure caused by a fall. Mean (SD) preoperative AHD was 4.50 (2.25) mm (range, 1.7-7.9 mm). Radiographs obtained immediately (mean, 1.22 months; range, 1 day-2.73 months) after surgery showed AHD was significantly (P < .0008) increased (mean, 8.48 mm; SD, 1.25 mm; range, 6.0-10.0 mm) (Figure 5).
Mean graft size was 2.9 mm medial × 3.6 mm lateral × 5.4 mm anterior × 5.4 mm posterior. Three patients had AMC performed. There was a significant (P < .05) difference in ASES scores between patients who had AMC performed (93) and those who did not (77).
Ultrasonography
Two weeks to 2 months after surgery, all patients had an intact capsular graft and no pulsatile vessels on US. Between 4 months and 10 months, US showed the construct intact laterally in all cases, a pulsatile vessel in the graft at the tuberosity (evidence of blood flow) in 4 of 5 cases, and a pulsatile vessel hypertrophied in 2 cases (Figures 6A, 6B).
Magnetic Resonance Imaging
Before surgery, 4 patients had Goutallier17 stage 4 rotator cuff muscle degeneration, 2 had stage 3 degeneration, and 2 had stage 2 degeneration. Throughout the follow-up period, US was as effective as MRI in determining graft integrity, graft thickness, and greater tuberosity fixation. Therefore, the SCRs were assessed primarily with US. MRI was ordered only if a failure was suspected or if the patient had some form of trauma. A total of 7 MRIs were ordered for 5 of the 8 patients in the study. The graft was intact in 4 of the 5 (Figures 7A-7C) and ruptured in the fifth.
Discussion
Mihata and colleagues10 published 2-year data for their reconstructive procedure with fascia lata autograft. In a modification of their procedure, Dr. Hirahara used dermal allograft to recreate the superior capsule.11 The results of the present 2-year study mirror the clinical outcomes reported by Mihata and colleagues10 and confirm that SCR improves functional outcomes and increases AHD regardless of graft type used.
The outcomes of the SCR patients in our study were significantly better than the outcomes of the historical control patients, who underwent repair of massive RCTs. Although there was no significant difference in the 2 groups’ ASES scores, the control patients had significantly higher postoperative VAS pain scores. We think that, as more patients undergo SCR and the population sample increases, we will see a significant difference in ASES scores as well (our SCR patients already showed a trend toward improved ASES scores).
Compared with RTSA, SCR has fewer risks and fewer complications and does not limit further surgical options.8,9,18 The 9 patients who had surgery with a minimum 2-year follow-up in our study had 4 complications. Six months after surgery, 1 patient fell and tore the infraspinatus and subscapularis muscles. Outcomes continued to improve, and no issues were reported, despite a decrease in AHD, from 8 mm immediately after surgery to 4.6 mm 2 years after surgery.
Two patients were in motor vehicle accidents. In 1 case, the accident occurred about 2 months after surgery. This patient also sustained a possible injury in a fall after receiving general anesthesia for a dental procedure. After having done very well the preceding months, the patient now reported increasing pain and dysfunction. MRI showed loss of glenoid fixation. Improved ASES and VAS pain scores were maintained throughout the follow-up period. AHD was increased at 13 months and mildly decreased at 2 years. Glenoid fixation was obtained with 2 anchors and a double surgeon knot. When possible, however, it is best to add an anchor and double-row fixation, as 3 anchors and a double-row construct are biomechanically stronger.19-24
The other motor vehicle accident occurred about 23 months after surgery. Two months later, a graft rupture was found on US and MRI, but the patient was maintaining full range of motion, AHD, and improved strength. The 1.5-mm graft in this patient was thinner than the 3.5-mm grafts in the rest of the study group. This was the only patient who developed a graft rupture rather than loss of fixation.
If only patients with graft thickness >3.0 mm are included in the data analysis, mean ASES score rises to 89.76, and mean VAS pain score drops to 0. Therefore, we argue against using a graft thinner than 3.5 mm. Our excellent study results indicate that larger grafts are unnecessary. Mihata and colleagues10 used fascia lata grafts of 6 mm to 8 mm. Ultimate load to failure is significantly higher for dermal allograft than for fascia lata graft.25 In SCR, the stronger dermal allograft withstands applied forces and repeated deformations and has excellent clinical outcomes.
Only 1 patient had a failure that required RTSA. VAS pain scores were lower and ASES scores were improved the first year after surgery, but then function deteriorated. The patient said there was no specific precipitating incident. Computed tomography arthrogram, ordered to assess the construct, showed anterior and superior subluxation of the humeral head, even with an intact subscapularis tendon—an indication of underlying instability, which most likely caused the failure. Eighteen months after surgery, the patient was able to undergo RTSA. On further evaluation of this patient’s procedure, it was determined that the graft needed better fixation anteriorly.
Mihata and colleagues10,12,14 indicated that AMC was unnecessary, and our procedure did not require it. However, data in our prospective evaluation began showing improved outcomes with AMC. As dermal allograft is more elastic than fascia lata autograft,25 we concluded that graft tensioning is key to the success of this procedure. Graft tension depends on many factors, including exact measurement of the distances between the anchors to punch holes in the graft, arm position to set the relationship between the anchor distances, and AMC and PMC. We recommend placing the arm in neutral rotation, neutral flexion, and abduction with the patient at rest, based on the size of the patient’s latissimus dorsi. Too much abduction causes overtensioning, and excess rotation or flexion-extension changes the distance between the glenoid and the greater tuberosity asymmetrically, from anterior to posterior. With the arm in neutral position, distances between anchors are accurately measured, and these measurements are used to determine graft size.
Graft tension is also needed to control the amount of elasticity allowed by the graft and thereby maintain stability, as shown by the Poisson ratio, the ratio of transverse contraction to longitudinal extension on a material in the presence of a stretching force. As applied to SCR, it is the ratio of mediolateral elasticity to anteroposterior deformation or constraint. If the graft is appropriately secured in the anteroposterior direction by way of ACM and PMC, elongation in the medial-lateral direction will be limited—reducing the elasticity of the graft, improving overall stability, and ultimately producing better clinical outcomes. This issue was discussed by Burkhart and colleagues26 with respect to the “rotator cable complex,” which now might be best described as the “rotator-capsule cable complex.” In our study, this phenomenon was evident in the finding that patients who had AMC performed did significantly better than patients who did not have AMC performed. The ability of dermal allograft to deform in these dimensions without failure while allowing excellent range of motion makes dermal allograft an exceptional choice for grafting during SCR. Mihata25 also found dermal allograft had a clear advantage in providing better range of motion, whereas fascia lata autograft resulted in a stiffer construct.
Dermal allograft can also incorporate into the body and transform into host tissue. The literature has described musculoskeletal US as an effective diagnostic and interventional tool.27-31 We used it to evaluate graft size, patency, and viability. As can be seen on US, the native rotator cuff does not have any pulsatile vessels and is fed by capillary flow. Dermal allograft has native vasculature built into the tissue. After 4 months to 8 months, presence of pulsatile vessels within the graft at the greater tuberosity indicates clear revascularization and incorporation of the tissue (Figure 6B). Disappearance of pulsatile vessels on US after 1 year indicates transformation to a stabilizing structure analogous to capsule or ligament with capillary flow. US also showed graft hypertrophy after 2 years, supporting a finding of integration and growth.
Conclusion
In the past, patients with irreparable massive RCTs had few good surgical management options, RTSA being the most definitive. SCR is technically challenging and requires use of specific implantation methods but can provide patients with outstanding relief. Our clinical data showed that technically well executed SCR effectively restores the superior restraints in the glenohumeral joint and thereby increases function and decreases pain in patients with irreparable massive RCTs, even after 2 years.
1 Lee BG, Cho NS, Rhee YG. Results of arthroscopic decompression and tuberoplasty for irreparable massive rotator cuff tears. Arthroscopy. 2011;27(10):1341-1350.
2. Liem D, Lengers N, Dedy N, Poetzl W, Steinbeck J, Marquardt B. Arthroscopic debridement of massive irreparable rotator cuff tears. Arthroscopy. 2008;24(7):743-748.
3. Kim SJ, Lee IS, Kim SH, Lee WY, Chun YM. Arthroscopic partial repair of irreparable large to massive rotator cuff tears. Arthroscopy. 2012;28(6):761-768.
4. Wellmann M, Lichtenberg S, da Silva G, Magosch P, Habermeyer P. Results of arthroscopic partial repair of large retracted rotator cuff tears. Arthroscopy. 2013;29(8):1275-1282.
5. Mori D, Funakoshi N, Yamashita F. Arthroscopic surgery of irreparable large or massive rotator cuff tears with low-grade fatty degeneration of the infraspinatus: patch autograft procedure versus partial repair procedure. Arthroscopy. 2013;29(12):1911-1921.
6. Gavriilidis I, Kircher J, Mogasch P, Lichtenberg S, Habermeyer P. Pectoralis major transfer for the treatment of irreparable anterosuperior rotator cuff tears. Int Orthop. 2010;34(5):689-694.
7. Grimberg J, Kany J, Valenti P, Amaravathi R, Ramalingam AT. Arthroscopic-assisted latissimus dorsi tendon transfer for irreparable posterosuperior cuff tears. Arthroscopy. 2015;31(4):599-607.
8. Bedi A, Dines J, Warren RF, Dines DM. Massive tears of the rotator cuff. J Bone Joint Surg Am. 2010;92(9):1894-1908.
9. Ek ET, Neukom L, Catanzaro S, Gerber C. Reverse total shoulder arthroplasty for massive irreparable rotator cuff tears in patients younger than 65 years old: results after five to fifteen years. J Shoulder Elbow Surg. 2013;22(9):1199-1208.
10. Mihata T, Lee TQ, Watanabe C, et al. Clinical results of arthroscopic superior capsule reconstruction for irreparable rotator cuff tears. Arthroscopy. 2013;29(3):459-470.
11. Hirahara AM, Adams CR. Arthroscopic superior capsular reconstruction for treatment of massive irreparable rotator cuff tears. Arthrosc Tech. 2015;4(6):e637-e641.
12. Mihata T, McGarry MH, Kahn T, Goldberg I, Neo M, Lee TQ. Biomechanical role of capsular continuity in superior capsule reconstruction for irreparable tears of the supraspinatus tendon. Am J Sports Med. 2016;44(6):1423-1430.
13. Mihata T, McGarry MH, Ishihara Y, et al. Biomechanical analysis of articular-sided partial-thickness rotator cuff tear and repair. Am J Sports Med. 2015;43(2):439-446.
14. Mihata T, McGarry MH, Pirolo JM, Kinoshita M, Lee TQ. Superior capsule reconstruction to restore superior stability in irreparable rotator cuff tears: a biomechanical cadaveric study. Am J Sports Med. 2012;40(10):2248-2255.
15. Hirahara AM, Andersen WJ. The PASTA bridge: a technique for the arthroscopic repair of PASTA lesions [published online ahead of print September 18, 2017]. Arthrosc Tech. http://dx.doi.org/10.1016/j.eats.2017.06.022.
16. Hamada K, Yamanaka K, Uchiyama Y, Mikasa T, Mikasa M. A radiographic classification of massive rotator cuff tear arthritis. Clin Orthop Relat Res. 2011;469(9):2452-2460.
17. Oh JH, Kim SH, Choi JA, Kim Y, Oh CH. Reliability of the grading system for fatty degeneration of rotator cuff muscles. Clin Orthop Relat Res. 2010;468(6):1558-1564.
18. Boileau P, Sinnerton RJ, Chuinard C, Walch G. Arthroplasty of the shoulder. J Bone Joint Surg Br. 2006;88(5):562-575.
19. Apreleva M, Özbaydar M, Fitzgibbons PG, Warner JJ. Rotator cuff tears: the effect of the reconstruction method on three-dimensional repair site area. Arthroscopy. 2002;18(5):519-526.
20. Baums MH, Spahn G, Steckel H, Fischer A, Schultz W, Klinger HM. Comparative evaluation of the tendon–bone interface contact pressure in different single- versus double-row suture anchor repair techniques. Knee Surg Sports Traumatol Arthrosc. 2009;17(12):1466-1472.
21. Lo IK, Burkhart SS. Double-row arthroscopic rotator cuff repair: re-establishing the footprint of the rotator cuff. Arthroscopy. 2003;19(9):1035-1042.
22. Mazzocca AD, Millett PJ, Guanche CA, Santangelo SA, Arciero RA. Arthroscopic single-row versus double-row suture anchor rotator cuff repair. Am J Sports Med. 2005;33(12):1861-1868.
23. Pauly S, Fiebig D, Kieser B, Albrecht B, Schill A, Scheibel M. Biomechanical comparison of four double-row speed-bridging rotator cuff repair techniques with or without medial or lateral row enhancement. Knee Surg Sports Traumatol Arthrosc. 2011;19(12):2090-2097.
24. Pauly S, Kieser B, Schill A, Gerhardt C, Scheibel M. Biomechanical comparison of 4 double-row suture-bridging rotator cuff repair techniques using different medial-row configurations. Arthroscopy. 2010;26(10):1281-1288.
25. Mihata T. Superior capsule reconstruction using human dermal allograft: a biomechanical cadaveric study. Presentation at: Annual Meeting of the American Academy of Orthopaedic Surgeons; March 1-5, 2016; Orlando, FL.
26. Burkhart SS, Esch JC, Jolson RS. The rotator crescent and rotator cable: an anatomic description of the shoulder’s “suspension bridge.” Arthroscopy. 1993;9(6):611-616.
27. Hirahara AM, Andersen WJ. Ultrasound-guided percutaneous reconstruction of the anterolateral ligament: surgical technique and case report. Am J Orthop. 2016;45(7):418-422, 460.
28. Hirahara AM, Andersen WJ. Ultrasound-guided percutaneous repair of medial patellofemoral ligament: surgical technique and outcomes. Am J Orthop. 2017;46(3):152-157.
29. Hirahara AM, Mackay G, Andersen WJ. Ultrasound-guided InternalBrace of the medial collateral ligament. Arthrosc Tech. Accepted for publication.
30. Hirahara AM, Panero AJ. A guide to ultrasound of the shoulder, part 3: interventional and procedural uses. Am J Orthop. 2016;45(7):440-445.
31. Panero AJ, Hirahara AM. A guide to ultrasound of the shoulder, part 2: the diagnostic evaluation. Am J Orthop. 2016;45(4):233-238.