User login
The microbiota matters: In acne, it’s not us versus them
NEW YORK – Just as an imbalance in the intestinal microbiota can disrupt gut function, dysbiosis of the facial skin can allow acne-causing bacteria to flourish.
In acne, said Adam Friedman, MD, “we’ve always been talking about bacteria,” but now the thinking has shifted from just controlling Propionibacterium acnes to a subtler understanding of what’s happening on the skin of individuals with acne. Individuals may have their own unique skin microbiota – the community of organisms resident on the skin – but dysbiosis characterized by a lack of diversity is increasingly understood as a common theme in many skin disorders, and acne is no exception.
As in many other areas of medicine, dermatology’s understanding has been informed by genetic work that moves beyond the human genome. “Using newer technology, we were able to identify that our genome really was overshadowed by the microbial genome that makes up the populations in our skin, in our gut, and what have you,” said Dr. Friedman, speaking at the summer meeting of the American Academy of Dermatology.

The human body is like a planet to the bacteria that live on the human skin, and like a planet, the skin provides multiple “climates” for many bacterial ecosystems, said Dr. Friedman, director of translational research and dermatology residency program director, at George Washington University, Washington, DC.
Some areas are dry, some are moist; some are more oily, and some areas of the skin produce little sebum; while some are mostly dark and some are more likely to be exposed to light.
Considering skin from this perspective, it makes sense that bacterial microbiota for these disparate areas varies widely, with a different mix of bacteria found in the groin than on the forearm, he noted. Further, “each individual has his or her own microbiota fingerprint,” said Dr. Friedman, citing a 2012 study showing that in four healthy volunteers, the microbiota from swabs at four sites (antecubital fossa, back, nare, and plantar heel) varied widely both in diversity and composition (Genome Res. 2012 May;22[5]:850-9).
Multiple factors can contribute to this variability, which can include endogenous factors, such as host genotype, sex, age, immune system, and pathobiology. Exogenous factors, such as climate, geographic location, and occupational exposures, also play a part.
Increasingly, said Dr. Friedman, lack of bacterial diversity in skin microbiota is recognized as an important factor in many disease states, including atopic dermatitis and psoriasis. And bacterial diversity has recently been shown to be reduced on the facial skin of patients with acne, even on areas of clear skin.
When acne treatments work, a healthy facial microbiota is restored. And perhaps counterintuitively, patients with acne who receive isotretinoin and antibiotics have much greater diversity in the microbiota of their facial skin after treatment than before, according to a study recently published online (Exp Dermatol. 2017 Jun 21. doi: 10.1111/exd.13397).
For now, this is still a chicken-and-egg situation, Dr. Friedman said. “Does the disease cause the lack of diversity, or does the lack of diversity cause the disease to develop? We don’t know yet.” (Nat Rev Microbiol. 2011 Apr;9[4]:244-53).
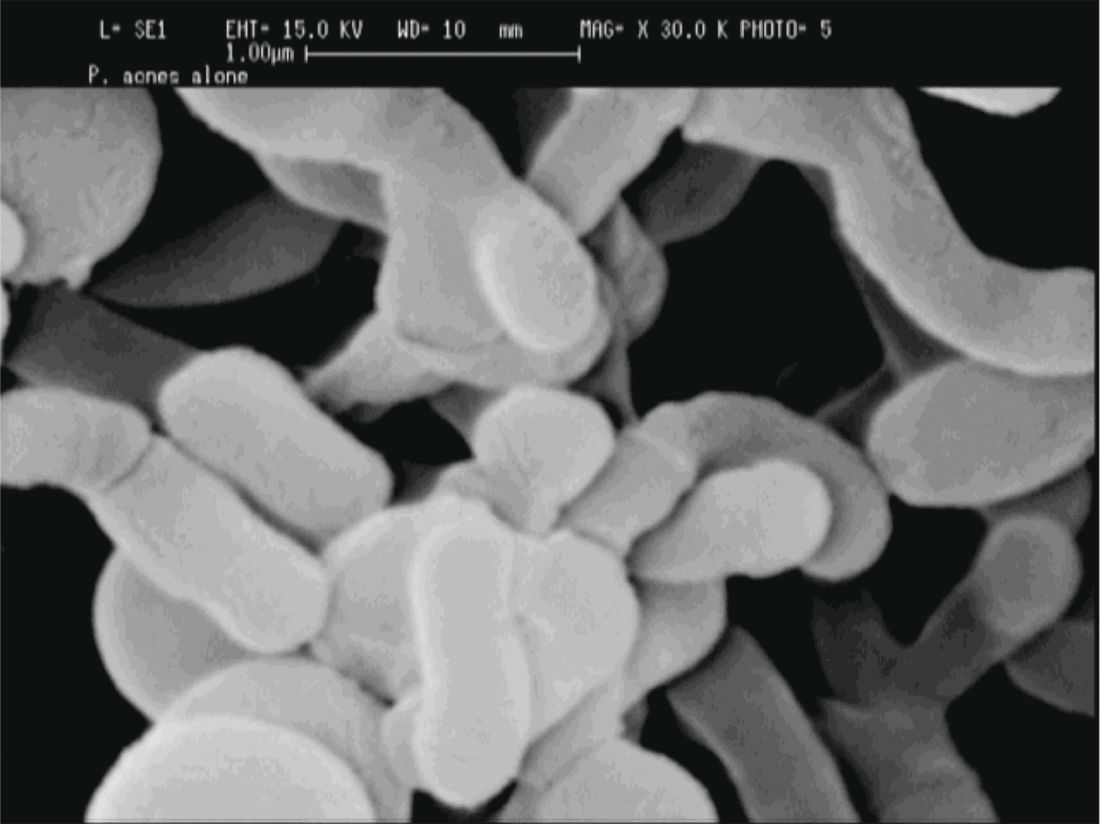
“If we’re going to think about the surface of our skin as a barrier, we must consider the microbiota as part of that barrier.”
P. acnes “is a clear instigator in eliciting a host inflammatory response,” through its recognition by toll-like receptors and the inflammasome to induce inflammation, Dr. Friedman said. However, it can also help prevent the colonization of opportunistic pathogens, including methicillin-resistant Staphylococcus aureus and Streptococcus pyogenes by helping maintain an acidic skin pH. “When and how does a commensal [organism] become a pathogen?” he asked.
The fact that P. acnes is a commensal bacterium on healthy skin seems to muddy the picture, until one also recognizes that there are different strains of P. acnes. Only some of these phylotypes cause acne, with an exaggerated host inflammatory response being one possible causative factor, noted Dr. Friedman.
A clue to how this occurs comes from a recent study that found that some types of P. acnes actually convert sebum to short-chain fatty acids that “interfere with how our bodies regulate toll-like receptors, uncoupling them and then laying them loose to create inflammation,” said Dr. Friedman (Sci Immunol. 2016 Oct 28;1[4]. pii: eaah4609).
When considering what to do with the available information, something for dermatologists to consider is the effect moisturizers have on the skin of patients with acne, Dr. Friedman said. A moisturizer contains water; it may also contain a carbon source in the form of a sugar like mannose, nitrogen in the form of amino acids, and some oligoelements such as calcium, magnesium, manganese, strontium, and selenium. All of these ingredients really serve as prebiotics for the skin microbiota, Dr. Friedman noted, adding that products that create a prebiotic environment where acnegenic P. acnes are suppressed and a healthy microbiota can flourish are being developed.
“What does all this mean? We do not know yet,” said Dr. Friedman. But, he added, “clearly, what we’re using is having an effect, and we need to figure it out.”
Dr. Friedman reported financial relationships with several pharmaceutical and skin care companies. He serves on the editorial board of Dermatology News.
koakes@frontlinemedcom.com
On Twitter @karioakes
NEW YORK – Just as an imbalance in the intestinal microbiota can disrupt gut function, dysbiosis of the facial skin can allow acne-causing bacteria to flourish.
In acne, said Adam Friedman, MD, “we’ve always been talking about bacteria,” but now the thinking has shifted from just controlling Propionibacterium acnes to a subtler understanding of what’s happening on the skin of individuals with acne. Individuals may have their own unique skin microbiota – the community of organisms resident on the skin – but dysbiosis characterized by a lack of diversity is increasingly understood as a common theme in many skin disorders, and acne is no exception.
As in many other areas of medicine, dermatology’s understanding has been informed by genetic work that moves beyond the human genome. “Using newer technology, we were able to identify that our genome really was overshadowed by the microbial genome that makes up the populations in our skin, in our gut, and what have you,” said Dr. Friedman, speaking at the summer meeting of the American Academy of Dermatology.
The human body is like a planet to the bacteria that live on the human skin, and like a planet, the skin provides multiple “climates” for many bacterial ecosystems, said Dr. Friedman, director of translational research and dermatology residency program director, at George Washington University, Washington, DC.
Some areas are dry, some are moist; some are more oily, and some areas of the skin produce little sebum; while some are mostly dark and some are more likely to be exposed to light.
Considering skin from this perspective, it makes sense that bacterial microbiota for these disparate areas varies widely, with a different mix of bacteria found in the groin than on the forearm, he noted. Further, “each individual has his or her own microbiota fingerprint,” said Dr. Friedman, citing a 2012 study showing that in four healthy volunteers, the microbiota from swabs at four sites (antecubital fossa, back, nare, and plantar heel) varied widely both in diversity and composition (Genome Res. 2012 May;22[5]:850-9).
Multiple factors can contribute to this variability, which can include endogenous factors, such as host genotype, sex, age, immune system, and pathobiology. Exogenous factors, such as climate, geographic location, and occupational exposures, also play a part.
Increasingly, said Dr. Friedman, lack of bacterial diversity in skin microbiota is recognized as an important factor in many disease states, including atopic dermatitis and psoriasis. And bacterial diversity has recently been shown to be reduced on the facial skin of patients with acne, even on areas of clear skin.
When acne treatments work, a healthy facial microbiota is restored. And perhaps counterintuitively, patients with acne who receive isotretinoin and antibiotics have much greater diversity in the microbiota of their facial skin after treatment than before, according to a study recently published online (Exp Dermatol. 2017 Jun 21. doi: 10.1111/exd.13397).
For now, this is still a chicken-and-egg situation, Dr. Friedman said. “Does the disease cause the lack of diversity, or does the lack of diversity cause the disease to develop? We don’t know yet.” (Nat Rev Microbiol. 2011 Apr;9[4]:244-53).
“If we’re going to think about the surface of our skin as a barrier, we must consider the microbiota as part of that barrier.”
P. acnes “is a clear instigator in eliciting a host inflammatory response,” through its recognition by toll-like receptors and the inflammasome to induce inflammation, Dr. Friedman said. However, it can also help prevent the colonization of opportunistic pathogens, including methicillin-resistant Staphylococcus aureus and Streptococcus pyogenes by helping maintain an acidic skin pH. “When and how does a commensal [organism] become a pathogen?” he asked.
The fact that P. acnes is a commensal bacterium on healthy skin seems to muddy the picture, until one also recognizes that there are different strains of P. acnes. Only some of these phylotypes cause acne, with an exaggerated host inflammatory response being one possible causative factor, noted Dr. Friedman.
A clue to how this occurs comes from a recent study that found that some types of P. acnes actually convert sebum to short-chain fatty acids that “interfere with how our bodies regulate toll-like receptors, uncoupling them and then laying them loose to create inflammation,” said Dr. Friedman (Sci Immunol. 2016 Oct 28;1[4]. pii: eaah4609).
When considering what to do with the available information, something for dermatologists to consider is the effect moisturizers have on the skin of patients with acne, Dr. Friedman said. A moisturizer contains water; it may also contain a carbon source in the form of a sugar like mannose, nitrogen in the form of amino acids, and some oligoelements such as calcium, magnesium, manganese, strontium, and selenium. All of these ingredients really serve as prebiotics for the skin microbiota, Dr. Friedman noted, adding that products that create a prebiotic environment where acnegenic P. acnes are suppressed and a healthy microbiota can flourish are being developed.
“What does all this mean? We do not know yet,” said Dr. Friedman. But, he added, “clearly, what we’re using is having an effect, and we need to figure it out.”
Dr. Friedman reported financial relationships with several pharmaceutical and skin care companies. He serves on the editorial board of Dermatology News.
koakes@frontlinemedcom.com
On Twitter @karioakes
NEW YORK – Just as an imbalance in the intestinal microbiota can disrupt gut function, dysbiosis of the facial skin can allow acne-causing bacteria to flourish.
In acne, said Adam Friedman, MD, “we’ve always been talking about bacteria,” but now the thinking has shifted from just controlling Propionibacterium acnes to a subtler understanding of what’s happening on the skin of individuals with acne. Individuals may have their own unique skin microbiota – the community of organisms resident on the skin – but dysbiosis characterized by a lack of diversity is increasingly understood as a common theme in many skin disorders, and acne is no exception.
As in many other areas of medicine, dermatology’s understanding has been informed by genetic work that moves beyond the human genome. “Using newer technology, we were able to identify that our genome really was overshadowed by the microbial genome that makes up the populations in our skin, in our gut, and what have you,” said Dr. Friedman, speaking at the summer meeting of the American Academy of Dermatology.
The human body is like a planet to the bacteria that live on the human skin, and like a planet, the skin provides multiple “climates” for many bacterial ecosystems, said Dr. Friedman, director of translational research and dermatology residency program director, at George Washington University, Washington, DC.
Some areas are dry, some are moist; some are more oily, and some areas of the skin produce little sebum; while some are mostly dark and some are more likely to be exposed to light.
Considering skin from this perspective, it makes sense that bacterial microbiota for these disparate areas varies widely, with a different mix of bacteria found in the groin than on the forearm, he noted. Further, “each individual has his or her own microbiota fingerprint,” said Dr. Friedman, citing a 2012 study showing that in four healthy volunteers, the microbiota from swabs at four sites (antecubital fossa, back, nare, and plantar heel) varied widely both in diversity and composition (Genome Res. 2012 May;22[5]:850-9).
Multiple factors can contribute to this variability, which can include endogenous factors, such as host genotype, sex, age, immune system, and pathobiology. Exogenous factors, such as climate, geographic location, and occupational exposures, also play a part.
Increasingly, said Dr. Friedman, lack of bacterial diversity in skin microbiota is recognized as an important factor in many disease states, including atopic dermatitis and psoriasis. And bacterial diversity has recently been shown to be reduced on the facial skin of patients with acne, even on areas of clear skin.
When acne treatments work, a healthy facial microbiota is restored. And perhaps counterintuitively, patients with acne who receive isotretinoin and antibiotics have much greater diversity in the microbiota of their facial skin after treatment than before, according to a study recently published online (Exp Dermatol. 2017 Jun 21. doi: 10.1111/exd.13397).
For now, this is still a chicken-and-egg situation, Dr. Friedman said. “Does the disease cause the lack of diversity, or does the lack of diversity cause the disease to develop? We don’t know yet.” (Nat Rev Microbiol. 2011 Apr;9[4]:244-53).
“If we’re going to think about the surface of our skin as a barrier, we must consider the microbiota as part of that barrier.”
P. acnes “is a clear instigator in eliciting a host inflammatory response,” through its recognition by toll-like receptors and the inflammasome to induce inflammation, Dr. Friedman said. However, it can also help prevent the colonization of opportunistic pathogens, including methicillin-resistant Staphylococcus aureus and Streptococcus pyogenes by helping maintain an acidic skin pH. “When and how does a commensal [organism] become a pathogen?” he asked.
The fact that P. acnes is a commensal bacterium on healthy skin seems to muddy the picture, until one also recognizes that there are different strains of P. acnes. Only some of these phylotypes cause acne, with an exaggerated host inflammatory response being one possible causative factor, noted Dr. Friedman.
A clue to how this occurs comes from a recent study that found that some types of P. acnes actually convert sebum to short-chain fatty acids that “interfere with how our bodies regulate toll-like receptors, uncoupling them and then laying them loose to create inflammation,” said Dr. Friedman (Sci Immunol. 2016 Oct 28;1[4]. pii: eaah4609).
When considering what to do with the available information, something for dermatologists to consider is the effect moisturizers have on the skin of patients with acne, Dr. Friedman said. A moisturizer contains water; it may also contain a carbon source in the form of a sugar like mannose, nitrogen in the form of amino acids, and some oligoelements such as calcium, magnesium, manganese, strontium, and selenium. All of these ingredients really serve as prebiotics for the skin microbiota, Dr. Friedman noted, adding that products that create a prebiotic environment where acnegenic P. acnes are suppressed and a healthy microbiota can flourish are being developed.
“What does all this mean? We do not know yet,” said Dr. Friedman. But, he added, “clearly, what we’re using is having an effect, and we need to figure it out.”
Dr. Friedman reported financial relationships with several pharmaceutical and skin care companies. He serves on the editorial board of Dermatology News.
koakes@frontlinemedcom.com
On Twitter @karioakes
EXPERT ANALYSIS FROM THE 2017 AAD SUMMER MEETING

Fewer complications, lower mortality with minimally invasive hernia repair
Minimally invasive surgical techniques are now used in nearly 80% of operations for paraesophageal hernia repair (PEH) and are associated with many outcome improvements, in comparison with open surgery, according to a retrospective study of data from nearly 100,000 cases.
“Many studies have shown improved perioperative outcomes in paraesophageal hernia repair with MIS [minimally invasive surgery] approaches, but the optimal approach is still debated,” wrote Patrick J. McLaren, MD, and his colleagues from the division of gastrointestinal and general surgery at Oregon Health & Science University, Portland. “In addition, the extent to which MIS has been adopted on the national level for PEH repair is unknown.” Their research letter was published online Aug. 23 in JAMA Surgery.
They found that the proportion of repair conducted using minimally invasive techniques increased from 9.8% in 2002 to 79.6% in 2012. At the same time, in-hospital mortality associated with paraesophageal hernia repair declined from 3.5% to 1.2%, and the rates of complications dropped from 29.8% to 20.6%.
Compared with open-repair procedures, minimally invasive surgery was associated with significantly lower in-hospital mortality (0.6% vs. 3%; P less than .001); wound complications (0.4% vs. 2.9%; P less than .001); septic complications (0.9% vs. 3.9%; P less than .001); and bleeding complications (0.6% vs. 1.8%; P less than .001), as well as urinary, respiratory, and cardiac complications, and intraoperative injury. No significant differences were seen between the two groups in the incidence of thromboembolic complications.
The mean length of hospital stay was 4.2 days in patients who underwent surgery using minimally invasive techniques, compared with 8.5 days in those who had open surgery.
The authors noted that early research on MIS for PEH raised the question of a possible higher risk of recurrence. While the study did not examine the incidence of hernia recurrence, the authors cited data showing that improvements in minimally invasive surgical techniques have been linked to a reduction in hiatal hernia recurrences.
“Studies have found that recurrences requiring reoperation after MIS repairs are low at 2.2%-6%,” the authors wrote. “Regardless, a role remains for open PEH repairs in cases of multiple prior abdominal operations and acute strangulation and in patients with an unstable condition.”
The study was funded by the Oregon Clinical and Translational Research Institute and the National Center for Advancing Translational Sciences of the National Institutes of Health. No conflicts of interest were declared.
This article was updated August 23, 2017.
Minimally invasive surgical techniques are now used in nearly 80% of operations for paraesophageal hernia repair (PEH) and are associated with many outcome improvements, in comparison with open surgery, according to a retrospective study of data from nearly 100,000 cases.
“Many studies have shown improved perioperative outcomes in paraesophageal hernia repair with MIS [minimally invasive surgery] approaches, but the optimal approach is still debated,” wrote Patrick J. McLaren, MD, and his colleagues from the division of gastrointestinal and general surgery at Oregon Health & Science University, Portland. “In addition, the extent to which MIS has been adopted on the national level for PEH repair is unknown.” Their research letter was published online Aug. 23 in JAMA Surgery.
They found that the proportion of repair conducted using minimally invasive techniques increased from 9.8% in 2002 to 79.6% in 2012. At the same time, in-hospital mortality associated with paraesophageal hernia repair declined from 3.5% to 1.2%, and the rates of complications dropped from 29.8% to 20.6%.
Compared with open-repair procedures, minimally invasive surgery was associated with significantly lower in-hospital mortality (0.6% vs. 3%; P less than .001); wound complications (0.4% vs. 2.9%; P less than .001); septic complications (0.9% vs. 3.9%; P less than .001); and bleeding complications (0.6% vs. 1.8%; P less than .001), as well as urinary, respiratory, and cardiac complications, and intraoperative injury. No significant differences were seen between the two groups in the incidence of thromboembolic complications.
The mean length of hospital stay was 4.2 days in patients who underwent surgery using minimally invasive techniques, compared with 8.5 days in those who had open surgery.
The authors noted that early research on MIS for PEH raised the question of a possible higher risk of recurrence. While the study did not examine the incidence of hernia recurrence, the authors cited data showing that improvements in minimally invasive surgical techniques have been linked to a reduction in hiatal hernia recurrences.
“Studies have found that recurrences requiring reoperation after MIS repairs are low at 2.2%-6%,” the authors wrote. “Regardless, a role remains for open PEH repairs in cases of multiple prior abdominal operations and acute strangulation and in patients with an unstable condition.”
The study was funded by the Oregon Clinical and Translational Research Institute and the National Center for Advancing Translational Sciences of the National Institutes of Health. No conflicts of interest were declared.
This article was updated August 23, 2017.
Minimally invasive surgical techniques are now used in nearly 80% of operations for paraesophageal hernia repair (PEH) and are associated with many outcome improvements, in comparison with open surgery, according to a retrospective study of data from nearly 100,000 cases.
“Many studies have shown improved perioperative outcomes in paraesophageal hernia repair with MIS [minimally invasive surgery] approaches, but the optimal approach is still debated,” wrote Patrick J. McLaren, MD, and his colleagues from the division of gastrointestinal and general surgery at Oregon Health & Science University, Portland. “In addition, the extent to which MIS has been adopted on the national level for PEH repair is unknown.” Their research letter was published online Aug. 23 in JAMA Surgery.
They found that the proportion of repair conducted using minimally invasive techniques increased from 9.8% in 2002 to 79.6% in 2012. At the same time, in-hospital mortality associated with paraesophageal hernia repair declined from 3.5% to 1.2%, and the rates of complications dropped from 29.8% to 20.6%.
Compared with open-repair procedures, minimally invasive surgery was associated with significantly lower in-hospital mortality (0.6% vs. 3%; P less than .001); wound complications (0.4% vs. 2.9%; P less than .001); septic complications (0.9% vs. 3.9%; P less than .001); and bleeding complications (0.6% vs. 1.8%; P less than .001), as well as urinary, respiratory, and cardiac complications, and intraoperative injury. No significant differences were seen between the two groups in the incidence of thromboembolic complications.
The mean length of hospital stay was 4.2 days in patients who underwent surgery using minimally invasive techniques, compared with 8.5 days in those who had open surgery.
The authors noted that early research on MIS for PEH raised the question of a possible higher risk of recurrence. While the study did not examine the incidence of hernia recurrence, the authors cited data showing that improvements in minimally invasive surgical techniques have been linked to a reduction in hiatal hernia recurrences.
“Studies have found that recurrences requiring reoperation after MIS repairs are low at 2.2%-6%,” the authors wrote. “Regardless, a role remains for open PEH repairs in cases of multiple prior abdominal operations and acute strangulation and in patients with an unstable condition.”
The study was funded by the Oregon Clinical and Translational Research Institute and the National Center for Advancing Translational Sciences of the National Institutes of Health. No conflicts of interest were declared.
This article was updated August 23, 2017.
FROM JAMA SURGERY
Key clinical point: Minimally invasive surgery for paraesophageal hernia repair is associated with significantly lower in-hospital mortality and complication rates than open repair.
Major finding: Compared with open-repair procedures, minimally invasive paraesophageal hernia repair was associated with significantly lower in-hospital mortality, wound, septic, bleeding, urinary, respiratory, and cardiac complications, and intraoperative injury.
Data source: A retrospective review of 97,393 inpatient admissions for paraesophageal hernia repair between 2002 and 2012.
Disclosures: The study was funded by the Oregon Clinical and Translational Research Institute and the National Center for Advancing Translational Sciences of the National Institutes of Health. No conflicts of interest were declared.

Videodermoscopy as a Novel Tool for Dermatologic Education
Dermoscopy, or the noninvasive in vivo examination of the epidermis and superficial dermis using magnification, facilitates the diagnosis of pigmented and nonpigmented skin lesions.1 Despite the benefit of dermoscopy in making early and accurate diagnoses of potentially life-limiting skin cancers, only 48% of dermatologists in the United States use dermoscopy in their practices.2 The most commonly cited reason for not using dermoscopy is lack of training.
Although the use of dermoscopy is associated with younger age and more recent graduation from residency compared to nonusers, dermatology resident physicians continue to receive limited training in dermoscopy.2 In a survey of 139 dermatology chief residents, 48% were not satisfied with the dermoscopy training that they had received during residency. Residents who received bedside instruction in dermoscopy reported greater satisfaction with their dermoscopy training compared to those who did not receive bedside instruction.3 This article provides a brief comparison of standard dermoscopy versus videodermoscopy for the instruction of trainees on common dermatologic diagnoses.
Bedside Dermoscopy
Standard optical dermatoscopes used for patient care and educational purposes typically incorporate 10-fold magnification and permit examination by a single viewer through a lens. With standard dermatoscopes, bedside dermoscopy instruction consists of the independent sequential viewing of skin lesions by instructors and trainees. Trainees must independently search for dermoscopic features noted by the instructor, which may be difficult for novice users. Simultaneous viewing of lesions would allow instructors to clearly indicate in real time pertinent dermoscopic features to their trainees.
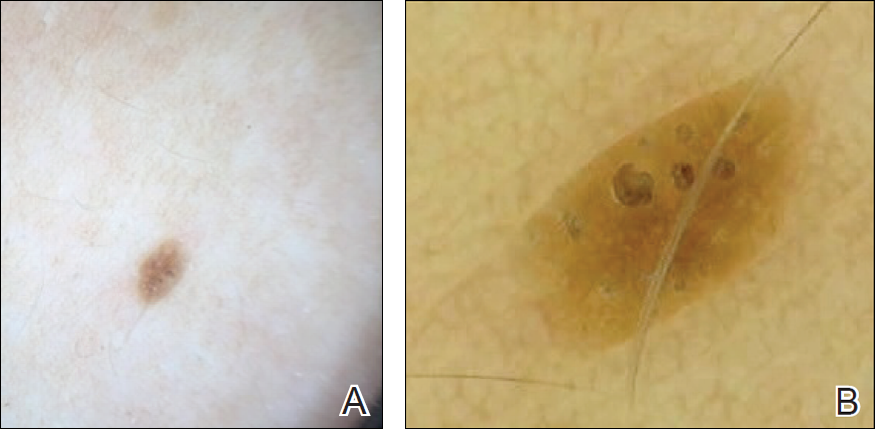
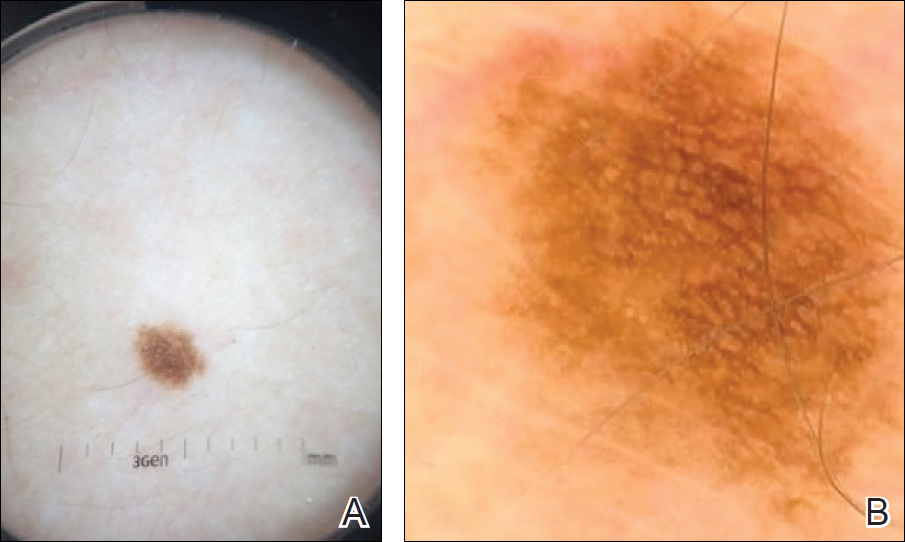
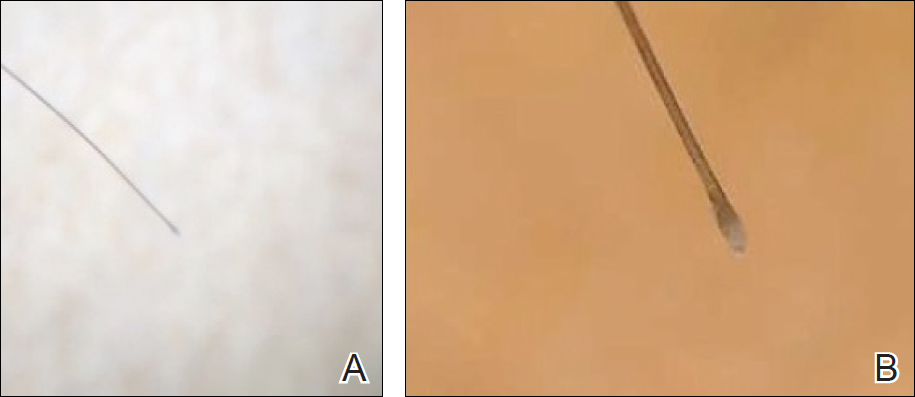
Videodermatoscopes facilitate the simultaneous examination of cutaneous lesions by projecting the dermoscopic image onto a digital screen. Furthermore, these devices can incorporate magnifications of up to 200-fold or greater. In recent years, research pertaining to videodermoscopy has focused on the high magnification capabilities of these devices, specifically dermoscopic features that are visualized at magnifications greater than 10-fold, including the light brown nests of basal cell carcinomas that are seen at 50- to 70-fold magnification, twisted red capillary loops seen in active scalp psoriasis at 50-fold magnification, and longitudinal white indentations seen on nail plates affected by onychomycosis at 20-fold magnification.4-6 The potential value of videodermoscopy in medical education lies not only in the high magnification potential, which may make subtle dermoscopic findings more apparent to novice dermoscopists, but also in the ability to facilitate simultaneous dermoscopic examinations by instructors and trainees.
Educational Applications for Videodermoscopy
To illustrate the educational potential of videodermoscopy, images taken with a standard dermatoscope at 10-fold magnification are presented with videodermoscopic images taken at magnifications ranging from 60- to 185-fold (Figures 1–3). These examples demonstrate the potential for videodermoscopy to facilitate the visualization of subtle dermoscopic features by novice dermoscopists, relating to both the enhanced magnification potential and the potential for simultaneous rather than sequential examination.
Final Thoughts
High-magnification videodermoscopy may be a useful tool to further dermoscopic education. Videodermatoscopes vary in functionality and cost but are available at price points comparable to those of standard optical dermatoscopes. Owners of standard dermatoscopes can approximate some of the benefits of a digital videodermatoscope by using the standard dermatoscope in conjunction with a camera, including those integrated into mobile phones and tablets. By attaching the standard dermatoscope to a camera with a digital display, the digital zoom of the camera can be used to magnify the standard dermoscopic image, enhancing the ability of novice dermoscopists to visualize subtle findings. By presenting this magnified image on a digital display, dermoscopy instructors and trainees would be able to simultaneously view dermoscopic images of lesions, sometimes with magnifications comparable to videodermatoscopes.
In the setting of a dermatology residency program, videodermoscopy can be incorporated into bedside teaching with experienced dermoscopists and for the live presentation of dermoscopic features at departmental grand rounds. By facilitating the simultaneous, high-magnification and live viewing of skin lesions by dermoscopy instructors and trainees, digital videodermoscopy has the potential to address an area of weakness in dermatologic training.
- Vestergaard ME, Macaskill P, Holt PE, et al. Dermoscopy compared with naked eye examination for the diagnosis of primary melanoma: a meta-analysis of studies performed in a clinical setting. Br J Dermatol. 2008;159:669-676.
- Engasser HC, Warshaw EM. Dermatoscopy use by US dermatologists: a cross-sectional survey [published online July 8, 2010]. J Am Acad Dermatol. 2010;63:412-419, 419.e1-419.e2.
- Wu TP, Newlove T, Smith L, et al. The importance of dedicated dermoscopy training during residency: a survey of US dermatology chief residents. J Am Acad Dermatol. 2013;68:1000-1005.
- Seidenari S, Bellucci C, Bassoli S, et al. High magnification digital dermoscopy of basal cell carcinoma: a single-centre study on 400 cases. Acta Derm Venereol. 2014;94:677-682.
- Ross EK, Vincenzi C, Tosti A. Videodermoscopy in the evaluation of hair and scalp disorders. J Am Acad Dermatol. 2006;55:799-806.
- Piraccini BM, Balestri R, Starace M, et al. Nail digital dermoscopy (onychoscopy) in the diagnosis of onychomycosis. J Eur Acad Dermatol Venereol. 2013;27:509-513.
Dermoscopy, or the noninvasive in vivo examination of the epidermis and superficial dermis using magnification, facilitates the diagnosis of pigmented and nonpigmented skin lesions.1 Despite the benefit of dermoscopy in making early and accurate diagnoses of potentially life-limiting skin cancers, only 48% of dermatologists in the United States use dermoscopy in their practices.2 The most commonly cited reason for not using dermoscopy is lack of training.
Although the use of dermoscopy is associated with younger age and more recent graduation from residency compared to nonusers, dermatology resident physicians continue to receive limited training in dermoscopy.2 In a survey of 139 dermatology chief residents, 48% were not satisfied with the dermoscopy training that they had received during residency. Residents who received bedside instruction in dermoscopy reported greater satisfaction with their dermoscopy training compared to those who did not receive bedside instruction.3 This article provides a brief comparison of standard dermoscopy versus videodermoscopy for the instruction of trainees on common dermatologic diagnoses.
Bedside Dermoscopy
Standard optical dermatoscopes used for patient care and educational purposes typically incorporate 10-fold magnification and permit examination by a single viewer through a lens. With standard dermatoscopes, bedside dermoscopy instruction consists of the independent sequential viewing of skin lesions by instructors and trainees. Trainees must independently search for dermoscopic features noted by the instructor, which may be difficult for novice users. Simultaneous viewing of lesions would allow instructors to clearly indicate in real time pertinent dermoscopic features to their trainees.
Videodermatoscopes facilitate the simultaneous examination of cutaneous lesions by projecting the dermoscopic image onto a digital screen. Furthermore, these devices can incorporate magnifications of up to 200-fold or greater. In recent years, research pertaining to videodermoscopy has focused on the high magnification capabilities of these devices, specifically dermoscopic features that are visualized at magnifications greater than 10-fold, including the light brown nests of basal cell carcinomas that are seen at 50- to 70-fold magnification, twisted red capillary loops seen in active scalp psoriasis at 50-fold magnification, and longitudinal white indentations seen on nail plates affected by onychomycosis at 20-fold magnification.4-6 The potential value of videodermoscopy in medical education lies not only in the high magnification potential, which may make subtle dermoscopic findings more apparent to novice dermoscopists, but also in the ability to facilitate simultaneous dermoscopic examinations by instructors and trainees.
Educational Applications for Videodermoscopy
To illustrate the educational potential of videodermoscopy, images taken with a standard dermatoscope at 10-fold magnification are presented with videodermoscopic images taken at magnifications ranging from 60- to 185-fold (Figures 1–3). These examples demonstrate the potential for videodermoscopy to facilitate the visualization of subtle dermoscopic features by novice dermoscopists, relating to both the enhanced magnification potential and the potential for simultaneous rather than sequential examination.
Final Thoughts
High-magnification videodermoscopy may be a useful tool to further dermoscopic education. Videodermatoscopes vary in functionality and cost but are available at price points comparable to those of standard optical dermatoscopes. Owners of standard dermatoscopes can approximate some of the benefits of a digital videodermatoscope by using the standard dermatoscope in conjunction with a camera, including those integrated into mobile phones and tablets. By attaching the standard dermatoscope to a camera with a digital display, the digital zoom of the camera can be used to magnify the standard dermoscopic image, enhancing the ability of novice dermoscopists to visualize subtle findings. By presenting this magnified image on a digital display, dermoscopy instructors and trainees would be able to simultaneously view dermoscopic images of lesions, sometimes with magnifications comparable to videodermatoscopes.
In the setting of a dermatology residency program, videodermoscopy can be incorporated into bedside teaching with experienced dermoscopists and for the live presentation of dermoscopic features at departmental grand rounds. By facilitating the simultaneous, high-magnification and live viewing of skin lesions by dermoscopy instructors and trainees, digital videodermoscopy has the potential to address an area of weakness in dermatologic training.
Dermoscopy, or the noninvasive in vivo examination of the epidermis and superficial dermis using magnification, facilitates the diagnosis of pigmented and nonpigmented skin lesions.1 Despite the benefit of dermoscopy in making early and accurate diagnoses of potentially life-limiting skin cancers, only 48% of dermatologists in the United States use dermoscopy in their practices.2 The most commonly cited reason for not using dermoscopy is lack of training.
Although the use of dermoscopy is associated with younger age and more recent graduation from residency compared to nonusers, dermatology resident physicians continue to receive limited training in dermoscopy.2 In a survey of 139 dermatology chief residents, 48% were not satisfied with the dermoscopy training that they had received during residency. Residents who received bedside instruction in dermoscopy reported greater satisfaction with their dermoscopy training compared to those who did not receive bedside instruction.3 This article provides a brief comparison of standard dermoscopy versus videodermoscopy for the instruction of trainees on common dermatologic diagnoses.
Bedside Dermoscopy
Standard optical dermatoscopes used for patient care and educational purposes typically incorporate 10-fold magnification and permit examination by a single viewer through a lens. With standard dermatoscopes, bedside dermoscopy instruction consists of the independent sequential viewing of skin lesions by instructors and trainees. Trainees must independently search for dermoscopic features noted by the instructor, which may be difficult for novice users. Simultaneous viewing of lesions would allow instructors to clearly indicate in real time pertinent dermoscopic features to their trainees.
Videodermatoscopes facilitate the simultaneous examination of cutaneous lesions by projecting the dermoscopic image onto a digital screen. Furthermore, these devices can incorporate magnifications of up to 200-fold or greater. In recent years, research pertaining to videodermoscopy has focused on the high magnification capabilities of these devices, specifically dermoscopic features that are visualized at magnifications greater than 10-fold, including the light brown nests of basal cell carcinomas that are seen at 50- to 70-fold magnification, twisted red capillary loops seen in active scalp psoriasis at 50-fold magnification, and longitudinal white indentations seen on nail plates affected by onychomycosis at 20-fold magnification.4-6 The potential value of videodermoscopy in medical education lies not only in the high magnification potential, which may make subtle dermoscopic findings more apparent to novice dermoscopists, but also in the ability to facilitate simultaneous dermoscopic examinations by instructors and trainees.
Educational Applications for Videodermoscopy
To illustrate the educational potential of videodermoscopy, images taken with a standard dermatoscope at 10-fold magnification are presented with videodermoscopic images taken at magnifications ranging from 60- to 185-fold (Figures 1–3). These examples demonstrate the potential for videodermoscopy to facilitate the visualization of subtle dermoscopic features by novice dermoscopists, relating to both the enhanced magnification potential and the potential for simultaneous rather than sequential examination.
Final Thoughts
High-magnification videodermoscopy may be a useful tool to further dermoscopic education. Videodermatoscopes vary in functionality and cost but are available at price points comparable to those of standard optical dermatoscopes. Owners of standard dermatoscopes can approximate some of the benefits of a digital videodermatoscope by using the standard dermatoscope in conjunction with a camera, including those integrated into mobile phones and tablets. By attaching the standard dermatoscope to a camera with a digital display, the digital zoom of the camera can be used to magnify the standard dermoscopic image, enhancing the ability of novice dermoscopists to visualize subtle findings. By presenting this magnified image on a digital display, dermoscopy instructors and trainees would be able to simultaneously view dermoscopic images of lesions, sometimes with magnifications comparable to videodermatoscopes.
In the setting of a dermatology residency program, videodermoscopy can be incorporated into bedside teaching with experienced dermoscopists and for the live presentation of dermoscopic features at departmental grand rounds. By facilitating the simultaneous, high-magnification and live viewing of skin lesions by dermoscopy instructors and trainees, digital videodermoscopy has the potential to address an area of weakness in dermatologic training.
- Vestergaard ME, Macaskill P, Holt PE, et al. Dermoscopy compared with naked eye examination for the diagnosis of primary melanoma: a meta-analysis of studies performed in a clinical setting. Br J Dermatol. 2008;159:669-676.
- Engasser HC, Warshaw EM. Dermatoscopy use by US dermatologists: a cross-sectional survey [published online July 8, 2010]. J Am Acad Dermatol. 2010;63:412-419, 419.e1-419.e2.
- Wu TP, Newlove T, Smith L, et al. The importance of dedicated dermoscopy training during residency: a survey of US dermatology chief residents. J Am Acad Dermatol. 2013;68:1000-1005.
- Seidenari S, Bellucci C, Bassoli S, et al. High magnification digital dermoscopy of basal cell carcinoma: a single-centre study on 400 cases. Acta Derm Venereol. 2014;94:677-682.
- Ross EK, Vincenzi C, Tosti A. Videodermoscopy in the evaluation of hair and scalp disorders. J Am Acad Dermatol. 2006;55:799-806.
- Piraccini BM, Balestri R, Starace M, et al. Nail digital dermoscopy (onychoscopy) in the diagnosis of onychomycosis. J Eur Acad Dermatol Venereol. 2013;27:509-513.
- Vestergaard ME, Macaskill P, Holt PE, et al. Dermoscopy compared with naked eye examination for the diagnosis of primary melanoma: a meta-analysis of studies performed in a clinical setting. Br J Dermatol. 2008;159:669-676.
- Engasser HC, Warshaw EM. Dermatoscopy use by US dermatologists: a cross-sectional survey [published online July 8, 2010]. J Am Acad Dermatol. 2010;63:412-419, 419.e1-419.e2.
- Wu TP, Newlove T, Smith L, et al. The importance of dedicated dermoscopy training during residency: a survey of US dermatology chief residents. J Am Acad Dermatol. 2013;68:1000-1005.
- Seidenari S, Bellucci C, Bassoli S, et al. High magnification digital dermoscopy of basal cell carcinoma: a single-centre study on 400 cases. Acta Derm Venereol. 2014;94:677-682.
- Ross EK, Vincenzi C, Tosti A. Videodermoscopy in the evaluation of hair and scalp disorders. J Am Acad Dermatol. 2006;55:799-806.
- Piraccini BM, Balestri R, Starace M, et al. Nail digital dermoscopy (onychoscopy) in the diagnosis of onychomycosis. J Eur Acad Dermatol Venereol. 2013;27:509-513.
Resident Pearl
- Bedside dermoscopy training can be enhanced through the use of videodermoscopy, which permits simultaneous, high-magnification viewing.

Obstetric trauma rates show long-term decline
Obstetric trauma rates have dropped since 2000 for vaginal deliveries both with and without instrument assistance, but assisted deliveries are still six times more likely to result in injuries, according to the Agency for Healthcare Research and Quality.
In 2014, the trauma rate for unassisted vaginal deliveries was 19 per 1,000, a drop of 51% from the rate of 39 per 1,000 deliveries in 2000. 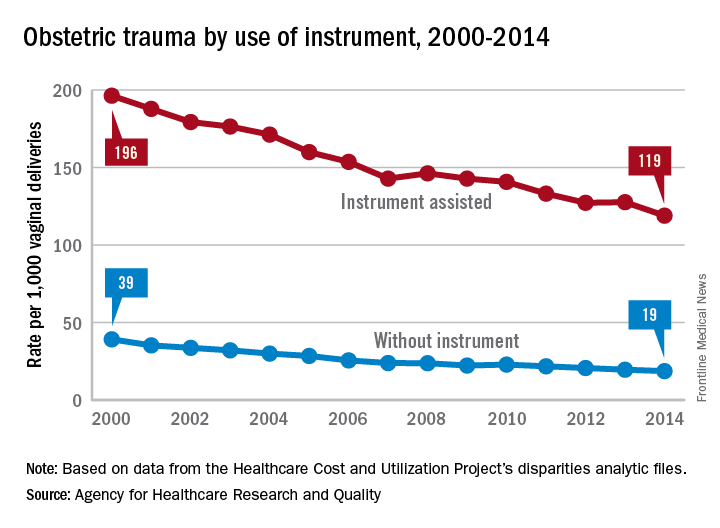
For this analysis, injuries were defined as third- or fourth-degree lacerations of the perineum; rates were adjusted by age using hospitalizations for 2010 as the standard population.
Obstetric trauma rates have dropped since 2000 for vaginal deliveries both with and without instrument assistance, but assisted deliveries are still six times more likely to result in injuries, according to the Agency for Healthcare Research and Quality.
In 2014, the trauma rate for unassisted vaginal deliveries was 19 per 1,000, a drop of 51% from the rate of 39 per 1,000 deliveries in 2000.
For this analysis, injuries were defined as third- or fourth-degree lacerations of the perineum; rates were adjusted by age using hospitalizations for 2010 as the standard population.
Obstetric trauma rates have dropped since 2000 for vaginal deliveries both with and without instrument assistance, but assisted deliveries are still six times more likely to result in injuries, according to the Agency for Healthcare Research and Quality.
In 2014, the trauma rate for unassisted vaginal deliveries was 19 per 1,000, a drop of 51% from the rate of 39 per 1,000 deliveries in 2000.
For this analysis, injuries were defined as third- or fourth-degree lacerations of the perineum; rates were adjusted by age using hospitalizations for 2010 as the standard population.
Musculoskeletal ultrasound training now offered in nearly all U.S. rheumatology fellowships
Musculoskeletal ultrasound (MSUS) fellowship opportunities are growing among rheumatology programs across the country as professionals push for more standardized education, according to a survey of fellowship program directors.
Rise in use of MSUS among rheumatologists is spurring more comprehensive education for providers to acquire these skill sets, which researchers have gathered will only become more prevalent.
The investigators sent two surveys to 113 rheumatology fellowship program directors. In the first survey, responses from the directors of 108 programs indicated that 101 (94%) offered MSUS programs (Arthritis Care Res. 2017 Aug 4. doi: 10.1002/acr.23336).
While this number has increased dramatically since a 2013 survey showed that 60% offered MSUS programs, the new survey found that 66% of respondents would prefer for the program to be optional, as opposed to a formal part of the fellowship program.
This sentiment for nonformal education programs was mirrored in the second survey specifically targeting the 101 programs that were known to provide some sort of MSUS education.
Among the 74 program directors who responded, 30 (41%) reported having a formal curriculum, while 44 (59%) did not, citing a major barrier being a lack of interested fellows to learn the material (P = .012)
Another major barrier, according to Dr. Torralba and her colleagues, is access to faculty with enough teaching experience to properly teach MSUS skills, with 62 (84%) reporting having no or only one faculty member with MSUS certification (P = .049).
Programs without proper faculty available and even those with available faculty are choosing to outsource lessons to expensive teaching programs such as the Ultrasound School of North American Rheumatologists (USSONAR) fellowship course, according to Dr. Torralba and her associates.
“While cost of external courses can be prohibitive, (expenses for a 2- to 4-day course costs between $1,500 and $4,000), programs may augment MSUS teaching using these courses for several reasons,” according to Dr. Torralba and her colleagues. [These include] insufficient number of teaching faculty, limited time or support for faculty to deliver all educational content, inadequate confidence or competency for faculty to teach content, and utilization of external materials to bolster resources.”
While these barriers will still need addressing, according to Dr. Torralba and her colleagues, half of responders noted previous barriers such as political pushback and lack of fellow interest are starting to recede, giving more room for programs to start developing MSUS programs that researchers assert are necessary for future developing rheumatologists.
“A standardized MSUS curriculum developed and endorsed by program directors and MSUS lead educators is now reasonably within sights,” the investigators wrote. “We need to work together to proactively champion MSUS education for both faculty and fellows who desire to attain this skill set.”
This study was limited by the self-reporting nature of the survey sent, as well as the small population of the sample. Researchers were also forced to rely on program directors’ perception of how effective their MSUS programs were instead of asking those participating in the programs directly.
The researchers reported no relevant financial disclosures.
ezimmerman@frontlinemedcom.com
On Twitter @eaztweets
Musculoskeletal ultrasound (MSUS) fellowship opportunities are growing among rheumatology programs across the country as professionals push for more standardized education, according to a survey of fellowship program directors.
Rise in use of MSUS among rheumatologists is spurring more comprehensive education for providers to acquire these skill sets, which researchers have gathered will only become more prevalent.
The investigators sent two surveys to 113 rheumatology fellowship program directors. In the first survey, responses from the directors of 108 programs indicated that 101 (94%) offered MSUS programs (Arthritis Care Res. 2017 Aug 4. doi: 10.1002/acr.23336).
While this number has increased dramatically since a 2013 survey showed that 60% offered MSUS programs, the new survey found that 66% of respondents would prefer for the program to be optional, as opposed to a formal part of the fellowship program.
This sentiment for nonformal education programs was mirrored in the second survey specifically targeting the 101 programs that were known to provide some sort of MSUS education.
Among the 74 program directors who responded, 30 (41%) reported having a formal curriculum, while 44 (59%) did not, citing a major barrier being a lack of interested fellows to learn the material (P = .012)
Another major barrier, according to Dr. Torralba and her colleagues, is access to faculty with enough teaching experience to properly teach MSUS skills, with 62 (84%) reporting having no or only one faculty member with MSUS certification (P = .049).
Programs without proper faculty available and even those with available faculty are choosing to outsource lessons to expensive teaching programs such as the Ultrasound School of North American Rheumatologists (USSONAR) fellowship course, according to Dr. Torralba and her associates.
“While cost of external courses can be prohibitive, (expenses for a 2- to 4-day course costs between $1,500 and $4,000), programs may augment MSUS teaching using these courses for several reasons,” according to Dr. Torralba and her colleagues. [These include] insufficient number of teaching faculty, limited time or support for faculty to deliver all educational content, inadequate confidence or competency for faculty to teach content, and utilization of external materials to bolster resources.”
While these barriers will still need addressing, according to Dr. Torralba and her colleagues, half of responders noted previous barriers such as political pushback and lack of fellow interest are starting to recede, giving more room for programs to start developing MSUS programs that researchers assert are necessary for future developing rheumatologists.
“A standardized MSUS curriculum developed and endorsed by program directors and MSUS lead educators is now reasonably within sights,” the investigators wrote. “We need to work together to proactively champion MSUS education for both faculty and fellows who desire to attain this skill set.”
This study was limited by the self-reporting nature of the survey sent, as well as the small population of the sample. Researchers were also forced to rely on program directors’ perception of how effective their MSUS programs were instead of asking those participating in the programs directly.
The researchers reported no relevant financial disclosures.
ezimmerman@frontlinemedcom.com
On Twitter @eaztweets
Musculoskeletal ultrasound (MSUS) fellowship opportunities are growing among rheumatology programs across the country as professionals push for more standardized education, according to a survey of fellowship program directors.
Rise in use of MSUS among rheumatologists is spurring more comprehensive education for providers to acquire these skill sets, which researchers have gathered will only become more prevalent.
The investigators sent two surveys to 113 rheumatology fellowship program directors. In the first survey, responses from the directors of 108 programs indicated that 101 (94%) offered MSUS programs (Arthritis Care Res. 2017 Aug 4. doi: 10.1002/acr.23336).
While this number has increased dramatically since a 2013 survey showed that 60% offered MSUS programs, the new survey found that 66% of respondents would prefer for the program to be optional, as opposed to a formal part of the fellowship program.
This sentiment for nonformal education programs was mirrored in the second survey specifically targeting the 101 programs that were known to provide some sort of MSUS education.
Among the 74 program directors who responded, 30 (41%) reported having a formal curriculum, while 44 (59%) did not, citing a major barrier being a lack of interested fellows to learn the material (P = .012)
Another major barrier, according to Dr. Torralba and her colleagues, is access to faculty with enough teaching experience to properly teach MSUS skills, with 62 (84%) reporting having no or only one faculty member with MSUS certification (P = .049).
Programs without proper faculty available and even those with available faculty are choosing to outsource lessons to expensive teaching programs such as the Ultrasound School of North American Rheumatologists (USSONAR) fellowship course, according to Dr. Torralba and her associates.
“While cost of external courses can be prohibitive, (expenses for a 2- to 4-day course costs between $1,500 and $4,000), programs may augment MSUS teaching using these courses for several reasons,” according to Dr. Torralba and her colleagues. [These include] insufficient number of teaching faculty, limited time or support for faculty to deliver all educational content, inadequate confidence or competency for faculty to teach content, and utilization of external materials to bolster resources.”
While these barriers will still need addressing, according to Dr. Torralba and her colleagues, half of responders noted previous barriers such as political pushback and lack of fellow interest are starting to recede, giving more room for programs to start developing MSUS programs that researchers assert are necessary for future developing rheumatologists.
“A standardized MSUS curriculum developed and endorsed by program directors and MSUS lead educators is now reasonably within sights,” the investigators wrote. “We need to work together to proactively champion MSUS education for both faculty and fellows who desire to attain this skill set.”
This study was limited by the self-reporting nature of the survey sent, as well as the small population of the sample. Researchers were also forced to rely on program directors’ perception of how effective their MSUS programs were instead of asking those participating in the programs directly.
The researchers reported no relevant financial disclosures.
ezimmerman@frontlinemedcom.com
On Twitter @eaztweets
FROM ARTHRITIS CARE & RESEARCH
Key clinical point:
Major finding: Of 108 program directors who responded to a survey, 101 (94%) offered a musculoskeletal ultrasound fellowship.
Data source: Survey of 113 rheumatology fellowship program directors gathered from the Fellowship and Residency Electronic Interactive Database Access (FREIDA) online database.
Disclosures: The investigators reported no relevant financial disclosures.

The Authors Reply, “What Can Be Done to Maintain Positive Patient Experience and Improve Residents’ Satisfaction?” and “Standardized Attending Rounds to Improve the Patient Experience: A Pragmatic Cluster Randomized Controlled Trial”
We thank Talari et al. for their comments in response to our randomized controlled trial evaluating the impact of standardized rounds on patient, attending, and trainee satisfaction. We agree that many factors beyond rounding structure contribute to resident satisfaction, including those highlighted by the authors, and would enthusiastically welcome additional research in this realm.
Because our study intervention addressed rounding structure, we elected to specifically focus on satisfaction with rounds, both from the physician and patient perspectives. We chose to ask about patient satisfaction with attending rounds, as opposed to more generic measures of patient satisfaction, to allow for more direct comparison between attending/resident responses and patient responses. Certainly, there are many other factors that affect overall patient experience. Surveys such as Hospital Consumer Assessment of Healthcare Providers and Systems (HCAHPS) and Press Ganey do not specifically address rounds, are often completed several weeks following hospitalization, and may have low response rates. Relying on such global assessments of patient experience may also reduce the power of the study. Although patient responses to our survey may be higher than scores seen with HCAHPS and Press Ganey, the randomized nature of our study helps control for other differences in the hospitalization experience unrelated to rounding structure. Similarly, because physician teams were randomly assigned, differences in census were not a major factor in the study. Physician blinding was not possible due to the nature of the intervention, which may have affected the satisfaction reports from attendings and residents. For our primary outcome (patient satisfaction with rounds), patients were blinded to the nature of our intervention, and all study team members involved in data collection and statistical analyses were blinded to study arm allocation.
In summary, we feel that evaluating the trade-offs and consequences of interventions should be examined from multiple perspectives, and we welcome additional investigations in this area.
We thank Talari et al. for their comments in response to our randomized controlled trial evaluating the impact of standardized rounds on patient, attending, and trainee satisfaction. We agree that many factors beyond rounding structure contribute to resident satisfaction, including those highlighted by the authors, and would enthusiastically welcome additional research in this realm.
Because our study intervention addressed rounding structure, we elected to specifically focus on satisfaction with rounds, both from the physician and patient perspectives. We chose to ask about patient satisfaction with attending rounds, as opposed to more generic measures of patient satisfaction, to allow for more direct comparison between attending/resident responses and patient responses. Certainly, there are many other factors that affect overall patient experience. Surveys such as Hospital Consumer Assessment of Healthcare Providers and Systems (HCAHPS) and Press Ganey do not specifically address rounds, are often completed several weeks following hospitalization, and may have low response rates. Relying on such global assessments of patient experience may also reduce the power of the study. Although patient responses to our survey may be higher than scores seen with HCAHPS and Press Ganey, the randomized nature of our study helps control for other differences in the hospitalization experience unrelated to rounding structure. Similarly, because physician teams were randomly assigned, differences in census were not a major factor in the study. Physician blinding was not possible due to the nature of the intervention, which may have affected the satisfaction reports from attendings and residents. For our primary outcome (patient satisfaction with rounds), patients were blinded to the nature of our intervention, and all study team members involved in data collection and statistical analyses were blinded to study arm allocation.
In summary, we feel that evaluating the trade-offs and consequences of interventions should be examined from multiple perspectives, and we welcome additional investigations in this area.
We thank Talari et al. for their comments in response to our randomized controlled trial evaluating the impact of standardized rounds on patient, attending, and trainee satisfaction. We agree that many factors beyond rounding structure contribute to resident satisfaction, including those highlighted by the authors, and would enthusiastically welcome additional research in this realm.
Because our study intervention addressed rounding structure, we elected to specifically focus on satisfaction with rounds, both from the physician and patient perspectives. We chose to ask about patient satisfaction with attending rounds, as opposed to more generic measures of patient satisfaction, to allow for more direct comparison between attending/resident responses and patient responses. Certainly, there are many other factors that affect overall patient experience. Surveys such as Hospital Consumer Assessment of Healthcare Providers and Systems (HCAHPS) and Press Ganey do not specifically address rounds, are often completed several weeks following hospitalization, and may have low response rates. Relying on such global assessments of patient experience may also reduce the power of the study. Although patient responses to our survey may be higher than scores seen with HCAHPS and Press Ganey, the randomized nature of our study helps control for other differences in the hospitalization experience unrelated to rounding structure. Similarly, because physician teams were randomly assigned, differences in census were not a major factor in the study. Physician blinding was not possible due to the nature of the intervention, which may have affected the satisfaction reports from attendings and residents. For our primary outcome (patient satisfaction with rounds), patients were blinded to the nature of our intervention, and all study team members involved in data collection and statistical analyses were blinded to study arm allocation.
In summary, we feel that evaluating the trade-offs and consequences of interventions should be examined from multiple perspectives, and we welcome additional investigations in this area.
© 2017 Society of Hospital Medicine
What Can Be Done to Maintain Positive Patient Experience and Improve Residents’ Satisfaction? In Reference to: “Standardized Attending Rounds to Improve the Patient Experience: A Pragmatic Cluster Randomized Controlled Trial”
We read the article by Monash et al.1 published in the March 2017 issue with great interest. This randomized study showed a discrepancy between patients’ and residents’ satisfaction with standardized rounds; for example, residents reported less autonomy, efficiency, teaching, and longer time of rounds.
We agree that letting residents lead the rounds with minimal participation of an attending (only when needed) may improve resident satisfaction. Other factors, such as quality of teaching, positive comments to learners during bedside rounds (whenever appropriate), and a positive attending attitude, might be helpful.2,3 We believe that the adaptation of such a model through the prism of residents’ benefit will lead to better satisfaction among trainees.
On the other hand, we note that the nature of the study might have exaggerated patient satisfaction when compared with real-world surveys.4 The survey appears to focus only on attending rounds and did not consider other factors like hospitality, pain control, etc. A low patient census and lack of double blinding are other potential factors.
In conclusion, we want to congratulate the authors for raising this important topic and showing positive patients’ satisfaction with standardized rounds on teaching services. Further research should focus on improving residents’ satisfaction without compromising patients’ experiences.
1. Monash B, Najafi N, Mourad M, et al. Standardized Attending Rounds to Improve the Patient Experience: A Pragmatic Cluster Randomized Controlled Trial. J Hosp Med. 2017;12(3):143-149. PubMed
2. Williams KN, Ramani S, Fraser B, Orlander JD. Improving bedside teaching: findings from a focus group study of learners. Acad Med. 2008;83(3):257-264. PubMed
3. Castiglioni A, Shewchuk RM, Willett LL, Heudebert GR, Centor RM. A pilot study using nominal group technique to assess residents’ perceptions of successful attending rounds. J Gen Intern Med. 2008;23(7):1060-1065. PubMed
4. Siddiqui ZK, Wu AW, Kurbanova N, Qayyum R. Comparison of Hospital Consumer Assessment of Healthcare Providers and Systems patient satisfaction scores for specialty hospitals and general medical hospitals: confounding effect of survey response rate. J Hosp Med. 2014;9(9):590-593. PubMed
We read the article by Monash et al.1 published in the March 2017 issue with great interest. This randomized study showed a discrepancy between patients’ and residents’ satisfaction with standardized rounds; for example, residents reported less autonomy, efficiency, teaching, and longer time of rounds.
We agree that letting residents lead the rounds with minimal participation of an attending (only when needed) may improve resident satisfaction. Other factors, such as quality of teaching, positive comments to learners during bedside rounds (whenever appropriate), and a positive attending attitude, might be helpful.2,3 We believe that the adaptation of such a model through the prism of residents’ benefit will lead to better satisfaction among trainees.
On the other hand, we note that the nature of the study might have exaggerated patient satisfaction when compared with real-world surveys.4 The survey appears to focus only on attending rounds and did not consider other factors like hospitality, pain control, etc. A low patient census and lack of double blinding are other potential factors.
In conclusion, we want to congratulate the authors for raising this important topic and showing positive patients’ satisfaction with standardized rounds on teaching services. Further research should focus on improving residents’ satisfaction without compromising patients’ experiences.
We read the article by Monash et al.1 published in the March 2017 issue with great interest. This randomized study showed a discrepancy between patients’ and residents’ satisfaction with standardized rounds; for example, residents reported less autonomy, efficiency, teaching, and longer time of rounds.
We agree that letting residents lead the rounds with minimal participation of an attending (only when needed) may improve resident satisfaction. Other factors, such as quality of teaching, positive comments to learners during bedside rounds (whenever appropriate), and a positive attending attitude, might be helpful.2,3 We believe that the adaptation of such a model through the prism of residents’ benefit will lead to better satisfaction among trainees.
On the other hand, we note that the nature of the study might have exaggerated patient satisfaction when compared with real-world surveys.4 The survey appears to focus only on attending rounds and did not consider other factors like hospitality, pain control, etc. A low patient census and lack of double blinding are other potential factors.
In conclusion, we want to congratulate the authors for raising this important topic and showing positive patients’ satisfaction with standardized rounds on teaching services. Further research should focus on improving residents’ satisfaction without compromising patients’ experiences.
1. Monash B, Najafi N, Mourad M, et al. Standardized Attending Rounds to Improve the Patient Experience: A Pragmatic Cluster Randomized Controlled Trial. J Hosp Med. 2017;12(3):143-149. PubMed
2. Williams KN, Ramani S, Fraser B, Orlander JD. Improving bedside teaching: findings from a focus group study of learners. Acad Med. 2008;83(3):257-264. PubMed
3. Castiglioni A, Shewchuk RM, Willett LL, Heudebert GR, Centor RM. A pilot study using nominal group technique to assess residents’ perceptions of successful attending rounds. J Gen Intern Med. 2008;23(7):1060-1065. PubMed
4. Siddiqui ZK, Wu AW, Kurbanova N, Qayyum R. Comparison of Hospital Consumer Assessment of Healthcare Providers and Systems patient satisfaction scores for specialty hospitals and general medical hospitals: confounding effect of survey response rate. J Hosp Med. 2014;9(9):590-593. PubMed
1. Monash B, Najafi N, Mourad M, et al. Standardized Attending Rounds to Improve the Patient Experience: A Pragmatic Cluster Randomized Controlled Trial. J Hosp Med. 2017;12(3):143-149. PubMed
2. Williams KN, Ramani S, Fraser B, Orlander JD. Improving bedside teaching: findings from a focus group study of learners. Acad Med. 2008;83(3):257-264. PubMed
3. Castiglioni A, Shewchuk RM, Willett LL, Heudebert GR, Centor RM. A pilot study using nominal group technique to assess residents’ perceptions of successful attending rounds. J Gen Intern Med. 2008;23(7):1060-1065. PubMed
4. Siddiqui ZK, Wu AW, Kurbanova N, Qayyum R. Comparison of Hospital Consumer Assessment of Healthcare Providers and Systems patient satisfaction scores for specialty hospitals and general medical hospitals: confounding effect of survey response rate. J Hosp Med. 2014;9(9):590-593. PubMed
The Authors Reply: “Cost and Utility of Thrombophilia Testing”
We thank Dr. Berse and colleagues for their correspondence about our paper.1,2 We are pleased they agreed with our conclusion: Thrombophilia testing has limited clinical utility in most inpatient settings.
Berse and colleagues critiqued details of our methodology in calculating payer cost, including how we estimated the number of Medicare claims for thrombophilia testing. We estimated that there were at least 280,000 Medicare claims in 2014 using CodeMap® (Wheaton Partners, LLC, Schaumburg, IL), a dataset of utilization data from the Physician Supplier Procedure Summary Master File from all Medicare Part B carriers.3 This estimate was similar to that reported in a previous publication.4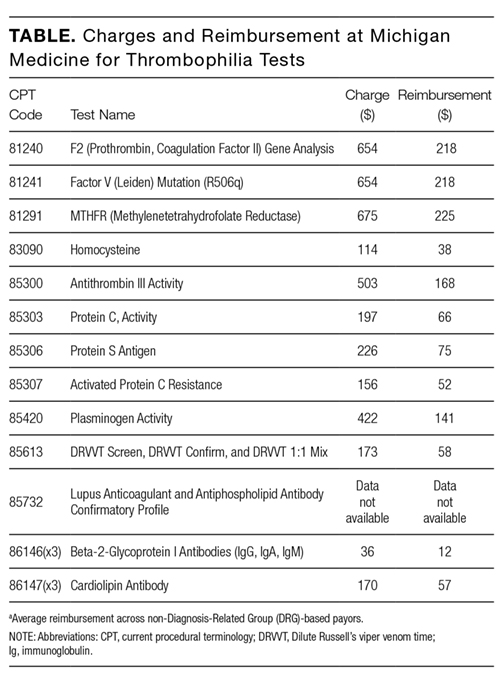
Thus, regardless of the precise estimates, even a conservative estimate of 33 to 80 million dollars of unnecessary spending is far too much. Rather, it is a perfect example of “Things We Do for No Reason.”
Disclosure
Nothing to report.
1. Petrilli CM, Mack M, Petrilli JJ, Hickner A, Saint S, Chopra V. Understanding the role of physician attire on patient perceptions: a systematic review of the literature--targeting attire to improve likelihood of rapport (TAILOR) investigators. BMJ Open. 2015;5(1):e006578. DOI:10.1136/bmjopen-2014-006578. PubMed
2. Berse B, Lynch JA, Bowen S, Grosse SD. In Reference to: “Cost and Utility of Thrombophilia Testing.” J Hosp Med. 2017;12(9):783.
3. CodeMap® https://www.codemap.com/. Accessed March 2, 2017.
4. Somma J, Sussman, II, Rand JH. An evaluation of thrombophilia screening in an urban tertiary care medical center: A “real world” experience. Am J Clin Pathol. 2006;126(1):120-7. DOI:10.1309/KV06-32LJ-8EDM-EWQT. PubMed
We thank Dr. Berse and colleagues for their correspondence about our paper.1,2 We are pleased they agreed with our conclusion: Thrombophilia testing has limited clinical utility in most inpatient settings.
Berse and colleagues critiqued details of our methodology in calculating payer cost, including how we estimated the number of Medicare claims for thrombophilia testing. We estimated that there were at least 280,000 Medicare claims in 2014 using CodeMap® (Wheaton Partners, LLC, Schaumburg, IL), a dataset of utilization data from the Physician Supplier Procedure Summary Master File from all Medicare Part B carriers.3 This estimate was similar to that reported in a previous publication.4
Thus, regardless of the precise estimates, even a conservative estimate of 33 to 80 million dollars of unnecessary spending is far too much. Rather, it is a perfect example of “Things We Do for No Reason.”
Disclosure
Nothing to report.
We thank Dr. Berse and colleagues for their correspondence about our paper.1,2 We are pleased they agreed with our conclusion: Thrombophilia testing has limited clinical utility in most inpatient settings.
Berse and colleagues critiqued details of our methodology in calculating payer cost, including how we estimated the number of Medicare claims for thrombophilia testing. We estimated that there were at least 280,000 Medicare claims in 2014 using CodeMap® (Wheaton Partners, LLC, Schaumburg, IL), a dataset of utilization data from the Physician Supplier Procedure Summary Master File from all Medicare Part B carriers.3 This estimate was similar to that reported in a previous publication.4
Thus, regardless of the precise estimates, even a conservative estimate of 33 to 80 million dollars of unnecessary spending is far too much. Rather, it is a perfect example of “Things We Do for No Reason.”
Disclosure
Nothing to report.
1. Petrilli CM, Mack M, Petrilli JJ, Hickner A, Saint S, Chopra V. Understanding the role of physician attire on patient perceptions: a systematic review of the literature--targeting attire to improve likelihood of rapport (TAILOR) investigators. BMJ Open. 2015;5(1):e006578. DOI:10.1136/bmjopen-2014-006578. PubMed
2. Berse B, Lynch JA, Bowen S, Grosse SD. In Reference to: “Cost and Utility of Thrombophilia Testing.” J Hosp Med. 2017;12(9):783.
3. CodeMap® https://www.codemap.com/. Accessed March 2, 2017.
4. Somma J, Sussman, II, Rand JH. An evaluation of thrombophilia screening in an urban tertiary care medical center: A “real world” experience. Am J Clin Pathol. 2006;126(1):120-7. DOI:10.1309/KV06-32LJ-8EDM-EWQT. PubMed
1. Petrilli CM, Mack M, Petrilli JJ, Hickner A, Saint S, Chopra V. Understanding the role of physician attire on patient perceptions: a systematic review of the literature--targeting attire to improve likelihood of rapport (TAILOR) investigators. BMJ Open. 2015;5(1):e006578. DOI:10.1136/bmjopen-2014-006578. PubMed
2. Berse B, Lynch JA, Bowen S, Grosse SD. In Reference to: “Cost and Utility of Thrombophilia Testing.” J Hosp Med. 2017;12(9):783.
3. CodeMap® https://www.codemap.com/. Accessed March 2, 2017.
4. Somma J, Sussman, II, Rand JH. An evaluation of thrombophilia screening in an urban tertiary care medical center: A “real world” experience. Am J Clin Pathol. 2006;126(1):120-7. DOI:10.1309/KV06-32LJ-8EDM-EWQT. PubMed
© 2017 Society of Hospital Medicine
In Reference to: “Cost and Utility of Thrombophilia Testing”
The article by Petrilli et al. points to the important but complicated issue of ordering laboratory testing for thrombophilia despite multiple guidelines that dispute the clinical utility of such testing for many indications.1 We question the basis of these authors’ assertion that Medicare spends $300 to $672 million for thrombophilia testing annually. They arrived at this figure by multiplying the price of a thrombophilia test panel (between $1100 and $2400) by the number of annual Medicare claims for thrombophilia analysis, which they estimated at 280,000. The price of the panel is derived from two papers: (1) a 2001 review2 that lists prices of various thrombophilia-related tests adding up to $1782, and (2) a 2006 evaluation by Somma et al.3 of thrombophilia screening at one hospital in New York in 2005. The latter paper refers to various thrombophilia panels from Quest Diagnostics with list prices ranging from $1311 to $2429. However, the repertoire of available test panels and their prices have changed over the last decade. The cost evaluation of thrombophilia testing should be based on actual current payments for tests, and not on list prices for laboratory offerings from over a decade ago. Several laboratories offer mutational analysis of 3 genes—F5, F2, and MTHFR—as a thrombophilia risk panel. Based on the Current Procedural Terminology (CPT) codes listed by the test suppliers (81240, 81241, and 81291), the average Medicare payment for the combination of these 3 markers in 2013 was $172.4 A broader panel of several biochemical, immunological, and genetic assays had a maximum Medicare payment in 2015 of $405 (Table).5
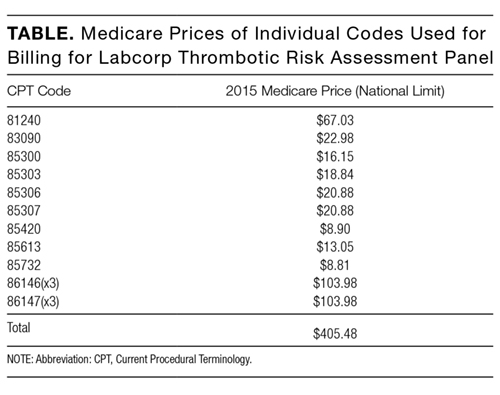
In conclusion, the cost evaluation of thrombophilia screening is more challenging than the calculation by Petrilli et al. suggests.1 Even if Medicare paid as much as $400 per individual tested and assuming up to 200,000 individuals underwent thrombophilia testing per year, the aggregate Medicare expenditure would have been no more than roughly $80 million. Thus, the estimated range in the article appears to have overstated actual Medicare expenditures by an order of magnitude. This does not take away from their overall conclusion that payers are burdened with significant expenditures for laboratory testing that may not present clinical value for many patients.6 We need research into the patterns of utilization as well as improvements in documentation of expenditures associated with these tests.
Disclosure
The findings and conclusions in this report are those of the authors and do not necessarily represent the official position of the Centers for Disease Control and Prevention, the Department of Veterans Affairs, or the United States government. The autho
1. Petrilli CM, Heidemann L, Mack M, Durance P, Chopra V. Inpatient inherited thrombophilia testing. J Hosp Med. 2016;11(11):801-804. PubMed
2. Abramson N, Abramson S. Hypercoagulability: clinical assessment and treatment. South Med J. 2001;94(10):1013-1020. PubMed
3. Somma J, Sussman, II, Rand JH. An evaluation of thrombophilia screening in an urban tertiary care medical center: A “real world” experience. Am J Clin Pathol. 2006;126(1):120-127. PubMed
4. Lynch JA, Berse B, Dotson WD, Khoury MJ, Coomer N, Kautter J. Utilization of genetic tests: Analysis of gene-specific billing in Medicare claims data [Published online ahead of print January 26, 2017]. Genet Med. 2017. doi: 10.1038/gim.2016.209. PubMed
5. Centers for Medicare and Medicaid Services. Clinical Laboratory Fee Schedule 2016. https://www.cms.gov/Medicare/Medicare-fee-for-service-Payment/clinicallabfeesched/index.html. Accessed on December 20, 2016.
6. Stevens SM, Woller SC, Bauer KA, et al. Guidance for the evaluation and treatment of hereditary and acquired thrombophilia. J Thromb Thrombolysis. 2016;41(1):154-164. PubMed
The article by Petrilli et al. points to the important but complicated issue of ordering laboratory testing for thrombophilia despite multiple guidelines that dispute the clinical utility of such testing for many indications.1 We question the basis of these authors’ assertion that Medicare spends $300 to $672 million for thrombophilia testing annually. They arrived at this figure by multiplying the price of a thrombophilia test panel (between $1100 and $2400) by the number of annual Medicare claims for thrombophilia analysis, which they estimated at 280,000. The price of the panel is derived from two papers: (1) a 2001 review2 that lists prices of various thrombophilia-related tests adding up to $1782, and (2) a 2006 evaluation by Somma et al.3 of thrombophilia screening at one hospital in New York in 2005. The latter paper refers to various thrombophilia panels from Quest Diagnostics with list prices ranging from $1311 to $2429. However, the repertoire of available test panels and their prices have changed over the last decade. The cost evaluation of thrombophilia testing should be based on actual current payments for tests, and not on list prices for laboratory offerings from over a decade ago. Several laboratories offer mutational analysis of 3 genes—F5, F2, and MTHFR—as a thrombophilia risk panel. Based on the Current Procedural Terminology (CPT) codes listed by the test suppliers (81240, 81241, and 81291), the average Medicare payment for the combination of these 3 markers in 2013 was $172.4 A broader panel of several biochemical, immunological, and genetic assays had a maximum Medicare payment in 2015 of $405 (Table).5
In conclusion, the cost evaluation of thrombophilia screening is more challenging than the calculation by Petrilli et al. suggests.1 Even if Medicare paid as much as $400 per individual tested and assuming up to 200,000 individuals underwent thrombophilia testing per year, the aggregate Medicare expenditure would have been no more than roughly $80 million. Thus, the estimated range in the article appears to have overstated actual Medicare expenditures by an order of magnitude. This does not take away from their overall conclusion that payers are burdened with significant expenditures for laboratory testing that may not present clinical value for many patients.6 We need research into the patterns of utilization as well as improvements in documentation of expenditures associated with these tests.
Disclosure
The findings and conclusions in this report are those of the authors and do not necessarily represent the official position of the Centers for Disease Control and Prevention, the Department of Veterans Affairs, or the United States government. The autho
The article by Petrilli et al. points to the important but complicated issue of ordering laboratory testing for thrombophilia despite multiple guidelines that dispute the clinical utility of such testing for many indications.1 We question the basis of these authors’ assertion that Medicare spends $300 to $672 million for thrombophilia testing annually. They arrived at this figure by multiplying the price of a thrombophilia test panel (between $1100 and $2400) by the number of annual Medicare claims for thrombophilia analysis, which they estimated at 280,000. The price of the panel is derived from two papers: (1) a 2001 review2 that lists prices of various thrombophilia-related tests adding up to $1782, and (2) a 2006 evaluation by Somma et al.3 of thrombophilia screening at one hospital in New York in 2005. The latter paper refers to various thrombophilia panels from Quest Diagnostics with list prices ranging from $1311 to $2429. However, the repertoire of available test panels and their prices have changed over the last decade. The cost evaluation of thrombophilia testing should be based on actual current payments for tests, and not on list prices for laboratory offerings from over a decade ago. Several laboratories offer mutational analysis of 3 genes—F5, F2, and MTHFR—as a thrombophilia risk panel. Based on the Current Procedural Terminology (CPT) codes listed by the test suppliers (81240, 81241, and 81291), the average Medicare payment for the combination of these 3 markers in 2013 was $172.4 A broader panel of several biochemical, immunological, and genetic assays had a maximum Medicare payment in 2015 of $405 (Table).5
In conclusion, the cost evaluation of thrombophilia screening is more challenging than the calculation by Petrilli et al. suggests.1 Even if Medicare paid as much as $400 per individual tested and assuming up to 200,000 individuals underwent thrombophilia testing per year, the aggregate Medicare expenditure would have been no more than roughly $80 million. Thus, the estimated range in the article appears to have overstated actual Medicare expenditures by an order of magnitude. This does not take away from their overall conclusion that payers are burdened with significant expenditures for laboratory testing that may not present clinical value for many patients.6 We need research into the patterns of utilization as well as improvements in documentation of expenditures associated with these tests.
Disclosure
The findings and conclusions in this report are those of the authors and do not necessarily represent the official position of the Centers for Disease Control and Prevention, the Department of Veterans Affairs, or the United States government. The autho
1. Petrilli CM, Heidemann L, Mack M, Durance P, Chopra V. Inpatient inherited thrombophilia testing. J Hosp Med. 2016;11(11):801-804. PubMed
2. Abramson N, Abramson S. Hypercoagulability: clinical assessment and treatment. South Med J. 2001;94(10):1013-1020. PubMed
3. Somma J, Sussman, II, Rand JH. An evaluation of thrombophilia screening in an urban tertiary care medical center: A “real world” experience. Am J Clin Pathol. 2006;126(1):120-127. PubMed
4. Lynch JA, Berse B, Dotson WD, Khoury MJ, Coomer N, Kautter J. Utilization of genetic tests: Analysis of gene-specific billing in Medicare claims data [Published online ahead of print January 26, 2017]. Genet Med. 2017. doi: 10.1038/gim.2016.209. PubMed
5. Centers for Medicare and Medicaid Services. Clinical Laboratory Fee Schedule 2016. https://www.cms.gov/Medicare/Medicare-fee-for-service-Payment/clinicallabfeesched/index.html. Accessed on December 20, 2016.
6. Stevens SM, Woller SC, Bauer KA, et al. Guidance for the evaluation and treatment of hereditary and acquired thrombophilia. J Thromb Thrombolysis. 2016;41(1):154-164. PubMed
1. Petrilli CM, Heidemann L, Mack M, Durance P, Chopra V. Inpatient inherited thrombophilia testing. J Hosp Med. 2016;11(11):801-804. PubMed
2. Abramson N, Abramson S. Hypercoagulability: clinical assessment and treatment. South Med J. 2001;94(10):1013-1020. PubMed
3. Somma J, Sussman, II, Rand JH. An evaluation of thrombophilia screening in an urban tertiary care medical center: A “real world” experience. Am J Clin Pathol. 2006;126(1):120-127. PubMed
4. Lynch JA, Berse B, Dotson WD, Khoury MJ, Coomer N, Kautter J. Utilization of genetic tests: Analysis of gene-specific billing in Medicare claims data [Published online ahead of print January 26, 2017]. Genet Med. 2017. doi: 10.1038/gim.2016.209. PubMed
5. Centers for Medicare and Medicaid Services. Clinical Laboratory Fee Schedule 2016. https://www.cms.gov/Medicare/Medicare-fee-for-service-Payment/clinicallabfeesched/index.html. Accessed on December 20, 2016.
6. Stevens SM, Woller SC, Bauer KA, et al. Guidance for the evaluation and treatment of hereditary and acquired thrombophilia. J Thromb Thrombolysis. 2016;41(1):154-164. PubMed
© 2017 Society of Hospital Medicine
Reducing Routine Labs—Teaching Residents Restraint
Inappropriate resource utilization is a pervasive problem in healthcare, and it has received increasing emphasis over the last few years as financial strain on the healthcare system has grown. This waste has led to new models of care—bundled care payments, accountable care organizations, and merit-based payment systems. Professional organizations have also emphasized the provision of high-value care and avoiding unnecessary diagnostic testing and treatment. In April 2012, the American Board of Internal Medicine (ABIM) launched the Choosing Wisely initiative to assist professional societies in putting forth recommendations on clinical circumstances in which particular tests and procedures should be avoided.
Until recently, teaching cost-effective care was not widely considered an important part of internal medicine residency programs. In a 2010 study surveying residents about resource utilization feedback, only 37% of internal medicine residents reported receiving any feedback on resource utilization and 20% reported receiving regular feedback.1 These findings are especially significant in the broader context of national healthcare spending, as there is evidence that physicians who train in high-spending localities tend to have high-spending patterns later in their careers.2 Another study showed similar findings when looking at region of training relative to success at recognizing high-value care on ABIM test questions.3 The Accreditation Council for Graduate Medical Education has developed the Clinical Learning Environment Review program to help address this need. This program provides feedback to teaching hospitals about their success at teaching residents and fellows to provide high-value medical care.
Given the current zeitgeist of emphasizing cost-effective, high-value care, appropriate utilization of routine labs is one area that stands out as an especially low-hanging fruit. The Society of Hospital Medicine, as part of the Choosing Wisely campaign, recommended minimizing routine lab draws in hospitalized patients with clinical and laboratory stability.4 Certainly, avoiding unnecessary routine lab draws is ideal because it saves patients the pain of superfluous phlebotomy, allows phlebotomy resources to be directed to blood draws with actual clinical utility, and saves money. There is also good evidence that hospital-acquired anemia, an effect of overuse of routine blood draws, has an adverse impact on morbidity and mortality in postmyocardial infarction patients5,6 and more generally in hospitalized patients.7
Several studies have examined lab utilization on teaching services. Not surprisingly, the vast majority of test utilization is attributable to the interns (45%) and residents (26%), rather than attendings.8 Another study showed that internal medicine residents at one center had a much stronger self-reported predilection for ordering daily recurring routine labs rather than one-time labs for the following morning when admitting patients and when picking up patients, as compared with hospitalist attendings.9 This self-reported tendency translated into ordering more complete blood counts and basic chemistry panels per patient per day. A qualitative study looking at why internal medicine and general surgery residents ordered unnecessary labs yielded a number of responses, including ingrained habit, lack of price transparency, clinical uncertainty, belief that the attending expected it, and absence of a culture emphasizing resource utilization.10
In this issue of the Journal of Hospital Medicine, Kurtzman and colleagues report on a mixed-methods study looking at internal medicine resident engagement at their center with an electronic medical record–associated dashboard providing feedback on lab utilization.11 Over a 6-month period, the residents randomized into the dashboard group received weekly e-mails while on service with a brief synopsis of their lab utilization relative to their peers and also a link to a dashboard with a time-series display of their relative lab ordering. While the majority of residents (74%) opened the e-mail, only a minority (21%) actually accessed the dashboard. Also, there was not a statistically significant relationship between dashboard use and lab ordering, though there was a trend to decreased lab ordering associated with opening the dashboard. The residents who participated in a focus group expressed both positive and negative opinions on the dashboard.
This is one example of social comparison feedback, which aims to improve performance by providing information to physicians on their performance relative to their peers. It has been shown to be effective in other areas of clinical medicine like limiting antibiotic overutilization in patients with upper respiratory infections.12 One study examining social comparison feedback and objective feedback found that social comparison feedback improved performance for a simulated work task more for high performers but less for low performers than standard objective feedback.13 The utility of this type of feedback has not been extensively studied in healthcare.
However, the audit and feedback strategy, of which social comparison feedback is a subtype, has been extensively studied in healthcare. A 2012 Cochrane Review found that audit and feedback leads to “small but potentially important improvements in professional practice.”14 They found a wide variation in the effect of feedback among the 140 studies they analyzed. The factors strongly associated with a significant improvement after feedback were as follows: poor performance at baseline, a colleague or supervisor as the one providing the audit and feedback, repetitive feedback, feedback given both verbally and in writing, and clear advice or guidance on how to improve. Many of these components were missing from this study—that may be one reason the authors did not find a significant relationship between dashboard use and lab ordering.
A number of interventions, however, have been shown to decrease lab utilization, including unbundling of the components of the metabolic panel and disallowing daily recurring lab orders,15 fee displays,16 cost reminders,17 didactics and data feedback,18 and a multifaceted approach (didactics, monthly feedback, checklist, and financial incentives).19 A multipronged strategy, including an element of education, audit and feedback, hard-stop limits on redundant lab ordering, and fee information is likely to be the most successful strategy to reducing lab overutilization for both residents and attending physicians. Resource overutilization is a multifactorial problem, and multifactorial problems call for multifaceted solutions. Moreover, it may be necessary to employ both “carrot” and “stick” elements to such an approach, rewarding physicians who practice appropriate stewardship, but also penalizing practitioners who do not appropriately adjust their lab ordering tendencies after receiving feedback showing overuse.
Physician behavior is difficult to change, and there are many reasons why physicians order inappropriate tests and studies, including provider uncertainty, fear of malpractice litigation, and inadequate time to consider the utility of a test. Audit and feedback should be integrated into residency curriculums focusing on high-value care, in which hospitalists should play a central role. If supervising attendings are not integrated into such curriculums and continue to both overorder tests themselves and allow residents to do so, then the informal curriculum will trump the formal one.
Physicians respond to incentives, and appropriately designed incentives should be developed to help steer them to order only those tests and studies that are medically indicated. Such incentives must be provided alongside audit and feedback with appropriate goals that account for patient complexity. Ultimately, routine lab ordering is just one area of overutilization in hospital medicine, and the techniques that are successful at reducing overuse in this arena will need to be applied to other aspects of medicine like imaging and medication prescribing.
Disclosure
The authors declare no conflicts of interest.
1. Dine CJ, Miller J, Fuld A, Bellini LM, Iwashyna TJ. Educating Physicians-in-Training About Resource Utilization and Their Own Outcomes of Care in the Inpatient Setting. J Grad Med Educ. 2010;2(2):175-180. PubMed
2. Chen C, Petterson S, Phillips R, Bazemore A, Mullan F. Spending patterns in region of residency training and subsequent expenditures for care provided by practicing physicians for Medicare beneficiaries. JAMA. 2014;312(22):2385-2393. PubMed
3. Sirovich BE, Lipner RS, Johnston M, Holmboe ES. The association between residency training and internists’ ability to practice conservatively. JAMA Intern Med. 2014;174(10):1640-1648. PubMed
4. Bulger J, Nickel W, Messler J, et al. Choosing wisely in adult hospital medicine: Five opportunities for improved healthcare value. J Hosp Med. 2013;8(9):486-492. PubMed
5. Salisbury AC, Amin AP, Reid KJ, et al. Hospital-acquired anemia and in-hospital mortality in patients with acute myocardial infarction. Am Heart J. 2011;162(2):300-309.e3. PubMed
6. Meroño O, Cladellas M, Recasens L, et al. In-hospital acquired anemia in acute coronary syndrome. Predictors, in-hospital prognosis and one-year mortality. Rev Esp Cardiol (Engl Ed). 2012;65(8):742-748. PubMed
7. Koch CG, Li L, Sun Z, et al. Hospital-acquired anemia: Prevalence, outcomes, and healthcare implications. J Hosp Med. 2013;8(9):506-512. PubMed
8. Iwashyna TJ, Fuld A, Asch DA, Bellini LM. The impact of residents, interns, and attendings on inpatient laboratory ordering patterns: a report from one university’s hospitalist service. Acad Med. 2011;86(1):139-145. PubMed
9. Ellenbogen MI, Ma M, Christensen NP, Lee J, O’Leary KJ. Differences in Routine Laboratory Ordering Between a Teaching Service and a Hospitalist Service at a Single Academic Medical Center. South Med J. 2017;110(1):25-30. PubMed
10. Sedrak MS, Patel MS, Ziemba JB, et al. Residents’ self-report on why they order perceived unnecessary inpatient laboratory tests. J Hosp Med. 2016;11(12):869-872. PubMed
11. Kurtzman G, Dine J, Epstein A, et al. Internal Medicine Resident Engagement with a Laboratory Utilization Dashboard: Mixed Methods Study. J Hosp Med. 2017;12(9):743-746. PubMed
12. Meeker D, Linder JA, Fox CR, et al. Effect of Behavioral Interventions on Inappropriate Antibiotic Prescribing Among Primary Care Practices: A Randomized Clinical Trial. JAMA. 2016;315(6):562-570. PubMed
13. Moon K, Lee K, Lee K, Oah S. The Effects of Social Comparison and Objective Feedback on Work Performance Across Different Performance Levels. J Organ Behav Manage. 2017;37(1):63-74.
14. Ivers N, Jamtvedt G, Flottorp S, et al. Audit and feedback : effects on professional practice and healthcare outcomes ( Review ). Cochrane Database Syst Rev. 2012;(6):CD000259. PubMed
15. Neilson EG, Johnson KB, Rosenbloom ST, Dupont WD, Talbert D, Giuse DA. The Impact of Peer Management on Test-Ordering Behavior. Ann Intern Med. 2004;141:196-204. PubMed
16. Feldman LS, Shihab HM, Thiemann D, et al. Impact of providing fee data on laboratory test ordering: a controlled clinical trial. JAMA Intern Med. 2013;173(10):903-908. PubMed
17. Stuebing EA, Miner TJ. Surgical vampires and rising health care expenditure: reducing the cost of daily phlebotomy. Arch Surg. 2011;146:524-527. PubMed
18. Iams W, Heck J, Kapp M, et al. A Multidisciplinary Housestaff-Led Initiative to Safely Reduce Daily Laboratory Testing. Acad Med. 2016;91(6):813-820. PubMed
19. Yarbrough PM, Kukhareva P V., Horton D, Edholm K, Kawamoto K. Multifaceted intervention including education, rounding checklist implementation, cost feedback, and financial incentives reduces inpatient laboratory costs. J Hosp Med. 2016;11(5):348-354. PubMed
Inappropriate resource utilization is a pervasive problem in healthcare, and it has received increasing emphasis over the last few years as financial strain on the healthcare system has grown. This waste has led to new models of care—bundled care payments, accountable care organizations, and merit-based payment systems. Professional organizations have also emphasized the provision of high-value care and avoiding unnecessary diagnostic testing and treatment. In April 2012, the American Board of Internal Medicine (ABIM) launched the Choosing Wisely initiative to assist professional societies in putting forth recommendations on clinical circumstances in which particular tests and procedures should be avoided.
Until recently, teaching cost-effective care was not widely considered an important part of internal medicine residency programs. In a 2010 study surveying residents about resource utilization feedback, only 37% of internal medicine residents reported receiving any feedback on resource utilization and 20% reported receiving regular feedback.1 These findings are especially significant in the broader context of national healthcare spending, as there is evidence that physicians who train in high-spending localities tend to have high-spending patterns later in their careers.2 Another study showed similar findings when looking at region of training relative to success at recognizing high-value care on ABIM test questions.3 The Accreditation Council for Graduate Medical Education has developed the Clinical Learning Environment Review program to help address this need. This program provides feedback to teaching hospitals about their success at teaching residents and fellows to provide high-value medical care.
Given the current zeitgeist of emphasizing cost-effective, high-value care, appropriate utilization of routine labs is one area that stands out as an especially low-hanging fruit. The Society of Hospital Medicine, as part of the Choosing Wisely campaign, recommended minimizing routine lab draws in hospitalized patients with clinical and laboratory stability.4 Certainly, avoiding unnecessary routine lab draws is ideal because it saves patients the pain of superfluous phlebotomy, allows phlebotomy resources to be directed to blood draws with actual clinical utility, and saves money. There is also good evidence that hospital-acquired anemia, an effect of overuse of routine blood draws, has an adverse impact on morbidity and mortality in postmyocardial infarction patients5,6 and more generally in hospitalized patients.7
Several studies have examined lab utilization on teaching services. Not surprisingly, the vast majority of test utilization is attributable to the interns (45%) and residents (26%), rather than attendings.8 Another study showed that internal medicine residents at one center had a much stronger self-reported predilection for ordering daily recurring routine labs rather than one-time labs for the following morning when admitting patients and when picking up patients, as compared with hospitalist attendings.9 This self-reported tendency translated into ordering more complete blood counts and basic chemistry panels per patient per day. A qualitative study looking at why internal medicine and general surgery residents ordered unnecessary labs yielded a number of responses, including ingrained habit, lack of price transparency, clinical uncertainty, belief that the attending expected it, and absence of a culture emphasizing resource utilization.10
In this issue of the Journal of Hospital Medicine, Kurtzman and colleagues report on a mixed-methods study looking at internal medicine resident engagement at their center with an electronic medical record–associated dashboard providing feedback on lab utilization.11 Over a 6-month period, the residents randomized into the dashboard group received weekly e-mails while on service with a brief synopsis of their lab utilization relative to their peers and also a link to a dashboard with a time-series display of their relative lab ordering. While the majority of residents (74%) opened the e-mail, only a minority (21%) actually accessed the dashboard. Also, there was not a statistically significant relationship between dashboard use and lab ordering, though there was a trend to decreased lab ordering associated with opening the dashboard. The residents who participated in a focus group expressed both positive and negative opinions on the dashboard.
This is one example of social comparison feedback, which aims to improve performance by providing information to physicians on their performance relative to their peers. It has been shown to be effective in other areas of clinical medicine like limiting antibiotic overutilization in patients with upper respiratory infections.12 One study examining social comparison feedback and objective feedback found that social comparison feedback improved performance for a simulated work task more for high performers but less for low performers than standard objective feedback.13 The utility of this type of feedback has not been extensively studied in healthcare.
However, the audit and feedback strategy, of which social comparison feedback is a subtype, has been extensively studied in healthcare. A 2012 Cochrane Review found that audit and feedback leads to “small but potentially important improvements in professional practice.”14 They found a wide variation in the effect of feedback among the 140 studies they analyzed. The factors strongly associated with a significant improvement after feedback were as follows: poor performance at baseline, a colleague or supervisor as the one providing the audit and feedback, repetitive feedback, feedback given both verbally and in writing, and clear advice or guidance on how to improve. Many of these components were missing from this study—that may be one reason the authors did not find a significant relationship between dashboard use and lab ordering.
A number of interventions, however, have been shown to decrease lab utilization, including unbundling of the components of the metabolic panel and disallowing daily recurring lab orders,15 fee displays,16 cost reminders,17 didactics and data feedback,18 and a multifaceted approach (didactics, monthly feedback, checklist, and financial incentives).19 A multipronged strategy, including an element of education, audit and feedback, hard-stop limits on redundant lab ordering, and fee information is likely to be the most successful strategy to reducing lab overutilization for both residents and attending physicians. Resource overutilization is a multifactorial problem, and multifactorial problems call for multifaceted solutions. Moreover, it may be necessary to employ both “carrot” and “stick” elements to such an approach, rewarding physicians who practice appropriate stewardship, but also penalizing practitioners who do not appropriately adjust their lab ordering tendencies after receiving feedback showing overuse.
Physician behavior is difficult to change, and there are many reasons why physicians order inappropriate tests and studies, including provider uncertainty, fear of malpractice litigation, and inadequate time to consider the utility of a test. Audit and feedback should be integrated into residency curriculums focusing on high-value care, in which hospitalists should play a central role. If supervising attendings are not integrated into such curriculums and continue to both overorder tests themselves and allow residents to do so, then the informal curriculum will trump the formal one.
Physicians respond to incentives, and appropriately designed incentives should be developed to help steer them to order only those tests and studies that are medically indicated. Such incentives must be provided alongside audit and feedback with appropriate goals that account for patient complexity. Ultimately, routine lab ordering is just one area of overutilization in hospital medicine, and the techniques that are successful at reducing overuse in this arena will need to be applied to other aspects of medicine like imaging and medication prescribing.
Disclosure
The authors declare no conflicts of interest.
Inappropriate resource utilization is a pervasive problem in healthcare, and it has received increasing emphasis over the last few years as financial strain on the healthcare system has grown. This waste has led to new models of care—bundled care payments, accountable care organizations, and merit-based payment systems. Professional organizations have also emphasized the provision of high-value care and avoiding unnecessary diagnostic testing and treatment. In April 2012, the American Board of Internal Medicine (ABIM) launched the Choosing Wisely initiative to assist professional societies in putting forth recommendations on clinical circumstances in which particular tests and procedures should be avoided.
Until recently, teaching cost-effective care was not widely considered an important part of internal medicine residency programs. In a 2010 study surveying residents about resource utilization feedback, only 37% of internal medicine residents reported receiving any feedback on resource utilization and 20% reported receiving regular feedback.1 These findings are especially significant in the broader context of national healthcare spending, as there is evidence that physicians who train in high-spending localities tend to have high-spending patterns later in their careers.2 Another study showed similar findings when looking at region of training relative to success at recognizing high-value care on ABIM test questions.3 The Accreditation Council for Graduate Medical Education has developed the Clinical Learning Environment Review program to help address this need. This program provides feedback to teaching hospitals about their success at teaching residents and fellows to provide high-value medical care.
Given the current zeitgeist of emphasizing cost-effective, high-value care, appropriate utilization of routine labs is one area that stands out as an especially low-hanging fruit. The Society of Hospital Medicine, as part of the Choosing Wisely campaign, recommended minimizing routine lab draws in hospitalized patients with clinical and laboratory stability.4 Certainly, avoiding unnecessary routine lab draws is ideal because it saves patients the pain of superfluous phlebotomy, allows phlebotomy resources to be directed to blood draws with actual clinical utility, and saves money. There is also good evidence that hospital-acquired anemia, an effect of overuse of routine blood draws, has an adverse impact on morbidity and mortality in postmyocardial infarction patients5,6 and more generally in hospitalized patients.7
Several studies have examined lab utilization on teaching services. Not surprisingly, the vast majority of test utilization is attributable to the interns (45%) and residents (26%), rather than attendings.8 Another study showed that internal medicine residents at one center had a much stronger self-reported predilection for ordering daily recurring routine labs rather than one-time labs for the following morning when admitting patients and when picking up patients, as compared with hospitalist attendings.9 This self-reported tendency translated into ordering more complete blood counts and basic chemistry panels per patient per day. A qualitative study looking at why internal medicine and general surgery residents ordered unnecessary labs yielded a number of responses, including ingrained habit, lack of price transparency, clinical uncertainty, belief that the attending expected it, and absence of a culture emphasizing resource utilization.10
In this issue of the Journal of Hospital Medicine, Kurtzman and colleagues report on a mixed-methods study looking at internal medicine resident engagement at their center with an electronic medical record–associated dashboard providing feedback on lab utilization.11 Over a 6-month period, the residents randomized into the dashboard group received weekly e-mails while on service with a brief synopsis of their lab utilization relative to their peers and also a link to a dashboard with a time-series display of their relative lab ordering. While the majority of residents (74%) opened the e-mail, only a minority (21%) actually accessed the dashboard. Also, there was not a statistically significant relationship between dashboard use and lab ordering, though there was a trend to decreased lab ordering associated with opening the dashboard. The residents who participated in a focus group expressed both positive and negative opinions on the dashboard.
This is one example of social comparison feedback, which aims to improve performance by providing information to physicians on their performance relative to their peers. It has been shown to be effective in other areas of clinical medicine like limiting antibiotic overutilization in patients with upper respiratory infections.12 One study examining social comparison feedback and objective feedback found that social comparison feedback improved performance for a simulated work task more for high performers but less for low performers than standard objective feedback.13 The utility of this type of feedback has not been extensively studied in healthcare.
However, the audit and feedback strategy, of which social comparison feedback is a subtype, has been extensively studied in healthcare. A 2012 Cochrane Review found that audit and feedback leads to “small but potentially important improvements in professional practice.”14 They found a wide variation in the effect of feedback among the 140 studies they analyzed. The factors strongly associated with a significant improvement after feedback were as follows: poor performance at baseline, a colleague or supervisor as the one providing the audit and feedback, repetitive feedback, feedback given both verbally and in writing, and clear advice or guidance on how to improve. Many of these components were missing from this study—that may be one reason the authors did not find a significant relationship between dashboard use and lab ordering.
A number of interventions, however, have been shown to decrease lab utilization, including unbundling of the components of the metabolic panel and disallowing daily recurring lab orders,15 fee displays,16 cost reminders,17 didactics and data feedback,18 and a multifaceted approach (didactics, monthly feedback, checklist, and financial incentives).19 A multipronged strategy, including an element of education, audit and feedback, hard-stop limits on redundant lab ordering, and fee information is likely to be the most successful strategy to reducing lab overutilization for both residents and attending physicians. Resource overutilization is a multifactorial problem, and multifactorial problems call for multifaceted solutions. Moreover, it may be necessary to employ both “carrot” and “stick” elements to such an approach, rewarding physicians who practice appropriate stewardship, but also penalizing practitioners who do not appropriately adjust their lab ordering tendencies after receiving feedback showing overuse.
Physician behavior is difficult to change, and there are many reasons why physicians order inappropriate tests and studies, including provider uncertainty, fear of malpractice litigation, and inadequate time to consider the utility of a test. Audit and feedback should be integrated into residency curriculums focusing on high-value care, in which hospitalists should play a central role. If supervising attendings are not integrated into such curriculums and continue to both overorder tests themselves and allow residents to do so, then the informal curriculum will trump the formal one.
Physicians respond to incentives, and appropriately designed incentives should be developed to help steer them to order only those tests and studies that are medically indicated. Such incentives must be provided alongside audit and feedback with appropriate goals that account for patient complexity. Ultimately, routine lab ordering is just one area of overutilization in hospital medicine, and the techniques that are successful at reducing overuse in this arena will need to be applied to other aspects of medicine like imaging and medication prescribing.
Disclosure
The authors declare no conflicts of interest.
1. Dine CJ, Miller J, Fuld A, Bellini LM, Iwashyna TJ. Educating Physicians-in-Training About Resource Utilization and Their Own Outcomes of Care in the Inpatient Setting. J Grad Med Educ. 2010;2(2):175-180. PubMed
2. Chen C, Petterson S, Phillips R, Bazemore A, Mullan F. Spending patterns in region of residency training and subsequent expenditures for care provided by practicing physicians for Medicare beneficiaries. JAMA. 2014;312(22):2385-2393. PubMed
3. Sirovich BE, Lipner RS, Johnston M, Holmboe ES. The association between residency training and internists’ ability to practice conservatively. JAMA Intern Med. 2014;174(10):1640-1648. PubMed
4. Bulger J, Nickel W, Messler J, et al. Choosing wisely in adult hospital medicine: Five opportunities for improved healthcare value. J Hosp Med. 2013;8(9):486-492. PubMed
5. Salisbury AC, Amin AP, Reid KJ, et al. Hospital-acquired anemia and in-hospital mortality in patients with acute myocardial infarction. Am Heart J. 2011;162(2):300-309.e3. PubMed
6. Meroño O, Cladellas M, Recasens L, et al. In-hospital acquired anemia in acute coronary syndrome. Predictors, in-hospital prognosis and one-year mortality. Rev Esp Cardiol (Engl Ed). 2012;65(8):742-748. PubMed
7. Koch CG, Li L, Sun Z, et al. Hospital-acquired anemia: Prevalence, outcomes, and healthcare implications. J Hosp Med. 2013;8(9):506-512. PubMed
8. Iwashyna TJ, Fuld A, Asch DA, Bellini LM. The impact of residents, interns, and attendings on inpatient laboratory ordering patterns: a report from one university’s hospitalist service. Acad Med. 2011;86(1):139-145. PubMed
9. Ellenbogen MI, Ma M, Christensen NP, Lee J, O’Leary KJ. Differences in Routine Laboratory Ordering Between a Teaching Service and a Hospitalist Service at a Single Academic Medical Center. South Med J. 2017;110(1):25-30. PubMed
10. Sedrak MS, Patel MS, Ziemba JB, et al. Residents’ self-report on why they order perceived unnecessary inpatient laboratory tests. J Hosp Med. 2016;11(12):869-872. PubMed
11. Kurtzman G, Dine J, Epstein A, et al. Internal Medicine Resident Engagement with a Laboratory Utilization Dashboard: Mixed Methods Study. J Hosp Med. 2017;12(9):743-746. PubMed
12. Meeker D, Linder JA, Fox CR, et al. Effect of Behavioral Interventions on Inappropriate Antibiotic Prescribing Among Primary Care Practices: A Randomized Clinical Trial. JAMA. 2016;315(6):562-570. PubMed
13. Moon K, Lee K, Lee K, Oah S. The Effects of Social Comparison and Objective Feedback on Work Performance Across Different Performance Levels. J Organ Behav Manage. 2017;37(1):63-74.
14. Ivers N, Jamtvedt G, Flottorp S, et al. Audit and feedback : effects on professional practice and healthcare outcomes ( Review ). Cochrane Database Syst Rev. 2012;(6):CD000259. PubMed
15. Neilson EG, Johnson KB, Rosenbloom ST, Dupont WD, Talbert D, Giuse DA. The Impact of Peer Management on Test-Ordering Behavior. Ann Intern Med. 2004;141:196-204. PubMed
16. Feldman LS, Shihab HM, Thiemann D, et al. Impact of providing fee data on laboratory test ordering: a controlled clinical trial. JAMA Intern Med. 2013;173(10):903-908. PubMed
17. Stuebing EA, Miner TJ. Surgical vampires and rising health care expenditure: reducing the cost of daily phlebotomy. Arch Surg. 2011;146:524-527. PubMed
18. Iams W, Heck J, Kapp M, et al. A Multidisciplinary Housestaff-Led Initiative to Safely Reduce Daily Laboratory Testing. Acad Med. 2016;91(6):813-820. PubMed
19. Yarbrough PM, Kukhareva P V., Horton D, Edholm K, Kawamoto K. Multifaceted intervention including education, rounding checklist implementation, cost feedback, and financial incentives reduces inpatient laboratory costs. J Hosp Med. 2016;11(5):348-354. PubMed
1. Dine CJ, Miller J, Fuld A, Bellini LM, Iwashyna TJ. Educating Physicians-in-Training About Resource Utilization and Their Own Outcomes of Care in the Inpatient Setting. J Grad Med Educ. 2010;2(2):175-180. PubMed
2. Chen C, Petterson S, Phillips R, Bazemore A, Mullan F. Spending patterns in region of residency training and subsequent expenditures for care provided by practicing physicians for Medicare beneficiaries. JAMA. 2014;312(22):2385-2393. PubMed
3. Sirovich BE, Lipner RS, Johnston M, Holmboe ES. The association between residency training and internists’ ability to practice conservatively. JAMA Intern Med. 2014;174(10):1640-1648. PubMed
4. Bulger J, Nickel W, Messler J, et al. Choosing wisely in adult hospital medicine: Five opportunities for improved healthcare value. J Hosp Med. 2013;8(9):486-492. PubMed
5. Salisbury AC, Amin AP, Reid KJ, et al. Hospital-acquired anemia and in-hospital mortality in patients with acute myocardial infarction. Am Heart J. 2011;162(2):300-309.e3. PubMed
6. Meroño O, Cladellas M, Recasens L, et al. In-hospital acquired anemia in acute coronary syndrome. Predictors, in-hospital prognosis and one-year mortality. Rev Esp Cardiol (Engl Ed). 2012;65(8):742-748. PubMed
7. Koch CG, Li L, Sun Z, et al. Hospital-acquired anemia: Prevalence, outcomes, and healthcare implications. J Hosp Med. 2013;8(9):506-512. PubMed
8. Iwashyna TJ, Fuld A, Asch DA, Bellini LM. The impact of residents, interns, and attendings on inpatient laboratory ordering patterns: a report from one university’s hospitalist service. Acad Med. 2011;86(1):139-145. PubMed
9. Ellenbogen MI, Ma M, Christensen NP, Lee J, O’Leary KJ. Differences in Routine Laboratory Ordering Between a Teaching Service and a Hospitalist Service at a Single Academic Medical Center. South Med J. 2017;110(1):25-30. PubMed
10. Sedrak MS, Patel MS, Ziemba JB, et al. Residents’ self-report on why they order perceived unnecessary inpatient laboratory tests. J Hosp Med. 2016;11(12):869-872. PubMed
11. Kurtzman G, Dine J, Epstein A, et al. Internal Medicine Resident Engagement with a Laboratory Utilization Dashboard: Mixed Methods Study. J Hosp Med. 2017;12(9):743-746. PubMed
12. Meeker D, Linder JA, Fox CR, et al. Effect of Behavioral Interventions on Inappropriate Antibiotic Prescribing Among Primary Care Practices: A Randomized Clinical Trial. JAMA. 2016;315(6):562-570. PubMed
13. Moon K, Lee K, Lee K, Oah S. The Effects of Social Comparison and Objective Feedback on Work Performance Across Different Performance Levels. J Organ Behav Manage. 2017;37(1):63-74.
14. Ivers N, Jamtvedt G, Flottorp S, et al. Audit and feedback : effects on professional practice and healthcare outcomes ( Review ). Cochrane Database Syst Rev. 2012;(6):CD000259. PubMed
15. Neilson EG, Johnson KB, Rosenbloom ST, Dupont WD, Talbert D, Giuse DA. The Impact of Peer Management on Test-Ordering Behavior. Ann Intern Med. 2004;141:196-204. PubMed
16. Feldman LS, Shihab HM, Thiemann D, et al. Impact of providing fee data on laboratory test ordering: a controlled clinical trial. JAMA Intern Med. 2013;173(10):903-908. PubMed
17. Stuebing EA, Miner TJ. Surgical vampires and rising health care expenditure: reducing the cost of daily phlebotomy. Arch Surg. 2011;146:524-527. PubMed
18. Iams W, Heck J, Kapp M, et al. A Multidisciplinary Housestaff-Led Initiative to Safely Reduce Daily Laboratory Testing. Acad Med. 2016;91(6):813-820. PubMed
19. Yarbrough PM, Kukhareva P V., Horton D, Edholm K, Kawamoto K. Multifaceted intervention including education, rounding checklist implementation, cost feedback, and financial incentives reduces inpatient laboratory costs. J Hosp Med. 2016;11(5):348-354. PubMed
© 2017 Society of Hospital Medicine