User login
Impact of HOCDI on Sepsis Patients
There are approximately 3 million cases of Clostridium difficile infection (CDI) per year in the United States.[1, 2, 3, 4] Of these, 10% result in a hospitalization or occur as a consequence of the exposures and treatments associated with hospitalization.[1, 2, 3, 4] Some patients with CDI experience mild diarrhea that is responsive to therapy, but other patients experience severe, life‐threatening disease that is refractory to treatment, leading to pseudomembranous colitis, toxic megacolon, and sepsis with a 60‐day mortality rate that exceeds 12%.[5, 6, 7, 8, 9, 10, 11, 12, 13, 14]
Hospital‐onset CDI (HOCDI), defined as C difficile‐associated diarrhea and related symptoms with onset more than 48 hours after admission to a healthcare facility,[15] represents a unique marriage of CDI risk factors.[5] A vulnerable patient is introduced into an environment that contains both exposure to C difficile (through other patients or healthcare workers) and treatment with antibacterial agents that may diminish normal flora. Consequently, CDI is common among hospitalized patients.[16, 17, 18] A particularly important group for understanding the burden of disease is patients who initially present to the hospital with sepsis and subsequently develop HOCDI. Sepsis patients are often critically ill and are universally treated with antibiotics.
Determining the incremental cost and mortality risk attributable to HOCDI is methodologically challenging. Because HOCDI is associated with presenting severity, the sickest patients are also the most likely to contract the disease. HOCDI is also associated with time of exposure or length of stay (LOS). Because LOS is a risk factor, comparing LOS between those with and without HOCDI will overestimate the impact if the time to diagnosis is not taken into account.[16, 17, 19, 20] We aimed to examine the impact of HOCDI in hospitalized patients with sepsis using a large, multihospital database with statistical methods that took presenting severity and time to diagnosis into account.
METHODS
Data Source and Subjects
Permission to conduct this study was obtained from the institutional review board at Baystate Medical Center. We used the Premier Healthcare Informatics database, a voluntary, fee‐supported database created to measure quality and healthcare utilization, which has been used extensively in health services research.[21, 22, 23] In addition to the elements found in hospital claims derived from the uniform billing 04 form, Premier data include an itemized, date‐stamped log of all items and services charged to the patient or their insurer, including medications, laboratory tests, and diagnostic and therapeutic services. Approximately 75% of hospitals that submit data also provide information on actual hospital costs, taken from internal cost accounting systems. The rest provide cost estimates based on Medicare cost‐to‐charge ratios. Participating hospitals are similar to the composition of acute care hospitals nationwide, although they are more commonly small‐ to midsized nonteaching facilities and are more likely to be located in the southern United States.
We included medical (nonsurgical) adult patients with sepsis who were admitted to a participating hospital between July 1, 2004 and December 31, 2010. Because we sought to focus on the care of patients who present to the hospital with sepsis, we defined sepsis as the presence of a diagnosis of sepsis plus evidence of both blood cultures and antibiotic treatment within the first 2 days of hospitalization; we used the first 2 days of hospitalization rather than just the first day because, in administrative datasets, the duration of the first hospital day includes partial days that can vary in length. We excluded patients who died or were discharged prior to day 3, because HOCDI is defined as onset after 48 hours in a healthcare facility.[15] We also excluded surviving patients who received less than 3 consecutive days of antibiotics, and patients who were transferred from or to another acute‐care facility; the latter exclusion criterion was used because we could not accurately determine the onset or subsequent course of their illness.
Identification of Patients at Risk for and Diagnosed With HOCDI
Among eligible patients with sepsis, we aimed to identify a cohort at risk for developing CDI during the hospital stay. We excluded patients: (1) with a diagnosis indicating that diarrhea was present on admission, (2) with a diagnosis of CDI that was indicated to be present on admission, (3) who were tested for CDI on the first or second hospital day, and (4) who received an antibiotic that could be consistent with treatment for CDI (oral or intravenous [IV] metronidazole or oral vancomycin) on hospital days 1 or 2.
Next, we aimed to identify sepsis patients at risk for HOCDI who developed HOCDI during their hospital stay. Among eligible patients described above, we considered a patient to have HOCDI if they had an International Classification of Diseases, Ninth Revision, Clinical Modification diagnosis of CDI (primary or secondary but not present on admission), plus evidence of testing for CDI after hospital day 2, and treatment with oral vancomycin or oral or IV metronidazole that was started after hospital day 2 and within 2 days of the C difficile test, and evidence of treatment for CDI for at least 3 days unless the patient was discharged or died.
Patient Information
We recorded patient age, gender, marital status, insurance status, race, and ethnicity. Using software provided by the Healthcare Costs and Utilization Project of the Agency for Healthcare Research and Quality, we categorized information on 30 comorbid conditions. We also created a single numerical comorbidity score based on a previously published and validated combined comorbidity score that predicts 1‐year mortality.[24] Based on a previously described algorithm,[25] we used diagnosis codes to assess the source (lung, abdomen, urinary tract, blood, other) and type of sepsis (Gram positive, Gram negative, mixed, anaerobic, fungal). Because patients can have more than 1 potential source of sepsis (eg, pneumonia and urinary tract infection) and more than 1 organism causing infection (eg, urine with Gram negative rods and blood culture with Gram positive cocci), these categories are not mutually exclusive (see Supporting Table 1 in the online version of this article). We used billing codes to identify the use of therapies, monitoring devices, and pharmacologic treatments to characterize both initial severity of illness and severity at the time of CDI diagnosis. These therapies are included in a validated sepsis mortality prediction model (designed for administrative datasets) with similar discrimination and calibration to clinical intensive care unit (ICU) risk‐adjustment models such as the mortality probability model, version III.[26, 27]
Outcomes
Our primary outcome of interest was in‐hospital mortality. Secondary outcomes included LOS and costs for survivors only and for all patients.
Statistical Methods
We calculated patient‐level summary statistics for all patients using frequencies for binary variables and medians and interquartile percentiles for continuous variables. P values <0.05 were considered statistically significant.
To account for presenting severity and time to diagnosis, we used methods that have been described elsewhere.[12, 13, 18, 20, 28] First, we identified patients who were eligible to develop HOCDI. Second, for all eligible patients, we identified a date of disease onset (index date). For patients who met criteria for HOCDI, this was the date on which the patient was tested for CDI. For eligible patients without disease, this was a date randomly assigned to any time during the hospital stay.[29] Next, we developed a nonparsimonious propensity score model that included all patient characteristics (demographics, comorbidities, sepsis source, and severity of illness on presentation and on the index date; all variables listed in Table 1 were included in the propensity model). Some of the variables for this model (eg, mechanical ventilation and vasopressors) were derived from a validated severity model.[26] We adjusted for correlation within hospital when creating the propensity score using Huber‐White robust standard error estimators clustered at the hospital level.[30] We then created matched pairs with the same LOS prior to the index date and similar propensity for developing CDI. We first matched on index date, and then, within each index‐datematched subset, matched patients with and without HOCDI by their propensity score using a 5‐to‐1 greedy match algorithm.[31] We used the differences in LOS between the cases and controls after the index date to calculate the additional attributable LOS estimates; we also separately estimated the impact on cost and LOS in a group limited to those who survived after discharge because of concerns that death could shorten LOS and reduce costs.
| Before Matching | After Matching | |||||
|---|---|---|---|---|---|---|
| HOCDI, n=2,368, % | No CDI, n=216,547, % | P | HOCDI, n=2,368, % | No CDI, n=2,368, % | P | |
| ||||||
| Age, y | 70.9 (15.1) | 68.6 (16.8) | <0.01 | 70.9 (15.1) | 69.8 (15.9) | 0.02 |
| Male | 46.8 | 46.0 | 0.44 | 46.8 | 47.2 | 0.79 |
| Race | ||||||
| White | 61.0 | 63.3 | 61.0 | 58.1 | ||
| Black | 15.6 | 14.5 | <0.01 | 15.6 | 17.0 | 0.11 |
| Hispanic | 3.2 | 5.4 | 3.2 | 4.1 | ||
| Other race | 20.2 | 16.8 | 20.2 | 20.9 | ||
| Marital status | ||||||
| Married | 31.6 | 36.3 | <0.01 | 31.6 | 32.6 | 0.74 |
| Single/divorced | 52.8 | 51.1 | 52.8 | 52.0 | ||
| Other/unknown | 15.7 | 12.6 | 15.7 | 14.5 | ||
| Insurance status | ||||||
| Medicare traditional | 63.2 | 59.5 | 63.2 | 60.3 | ||
| Medicare managed | 10.6 | 10.1 | 10.6 | 10.9 | ||
| Medicaid traditional | 7.6 | 6.9 | 7.6 | 8.2 | ||
| Medicaid managed | 1.8 | 2.0 | <0.01 | 1.8 | 1.8 | 0.50 |
| Managed care | 10.8 | 12.3 | 10.8 | 12.0 | ||
| Commercial | 2.0 | 3.5 | 2.0 | 2.2 | ||
| Self‐pay/other/unknown | 4.0 | 5.7 | 4.0 | 4.7 | ||
| Infection source | ||||||
| Respiratory | 46.5 | 37.0 | <0.01 | 46.5 | 49.6 | 0.03 |
| Skin/bone | 10.1 | 8.6 | 0.01 | 10.1 | 11.2 | 0.21 |
| Urinary | 52.2 | 51.3 | 0.38 | 52.2 | 50.3 | 0.18 |
| Blood | 11.1 | 15.1 | <0.01 | 11.1 | 11.5 | 0.65 |
| Infecting organism | ||||||
| Gram negative | 35.0 | 36.6 | <0.01 | 35.0 | 33.1 | 0.18 |
| Anaerobe | 1.4 | 0.7 | <0.01 | 1.4 | 1.1 | 0.24 |
| Fungal | 17.5 | 7.5 | <0.01 | 17.5 | 18.3 | 0.44 |
| Most common comorbid conditions | ||||||
| Congestive heart failure | 35.1 | 24.6 | <0.01 | 35.1 | 37.5 | 0.06 |
| Chronic lung disease | 31.6 | 27.6 | <0.01 | 31.6 | 32.1 | 0.71 |
| Hypertension | 31.5 | 37.7 | <0.01 | 31.5 | 29.7 | 0.16 |
| Renal Failure | 29.7 | 23.8 | <0.01 | 29.7 | 31.2 | 0.28 |
| Weight Loss | 27.7 | 13.3 | <0.01 | 27.7 | 29.4 | 0.17 |
| Treatments by day 2 | ||||||
| ICU admission | 40.0 | 29.5 | <0.01 | 40.0 | 40.7 | 0.64 |
| Use of bicarbonate | 12.2 | 7.1 | <0.01 | 12.2 | 13.6 | 0.15 |
| Fresh frozen plasma | 1.4 | 1.0 | 0.03 | 1.4 | 1.1 | 0.36 |
| Inotropes | 1.4 | 0.9 | 0.01 | 1.4 | 2.2 | 0.04 |
| Hydrocortisone | 6.7 | 4.7 | <0.01 | 6.7 | 7.4 | 0.33 |
| Thiamine | 4.2 | 3.3 | 0.01 | 4.2 | 4.1 | 0.83 |
| Psychotropics (eg, haldol for delirium) | 10.0 | 9.2 | 0.21 | 10.0 | 10.8 | 0.36 |
| Restraints (eg, for delirium) | 2.0 | 1.5 | 0.05 | 2.0 | 2.5 | 0.29 |
| Angiotensin‐converting enzyme inhibitors | 12.1 | 13.2 | 0.12 | 12.1 | 10.9 | 0.20 |
| Statins | 18.8 | 21.1 | 0.01 | 18.8 | 16.9 | 0.09 |
| Drotrecogin alfa | 0.6 | 0.3 | 0.00 | 0.6 | 0.6 | 0.85 |
| Foley catheter | 19.2 | 19.8 | 0.50 | 19.2 | 22.0 | 0.02 |
| Diuretics | 28.5 | 25.4 | 0.01 | 28.5 | 29.6 | 0.42 |
| Red blood cells | 15.5 | 10.6 | <0.01 | 15.5 | 15.8 | 0.81 |
| Calcium channel blockers | 19.3 | 16.8 | 0.01 | 19.3 | 19.1 | 0.82 |
| ‐Blockers | 32.7 | 29.6 | 0.01 | 32.7 | 30.6 | 0.12 |
| Proton pump inhibitors | 59.6 | 53.1 | <0.01 | 59.6 | 61.0 | 0.31 |
Analysis Across Clinical Subgroups
In a secondary analysis, we examined heterogeneity in the association between HOCDI and outcomes within subsets of patients defined by age, combined comorbidity score, and admission to the ICU by day 2. We created separate propensity scores using the same covariates in the primary analysis, but limited matches to within these subsets. For each group, we examined how the covariates in the HOCDI and control groups differed after matching with inference tests that took the paired nature of the data into account. All analyses were carried out using Stata/SE 11.1 (StataCorp, College Station, TX).
RESULTS
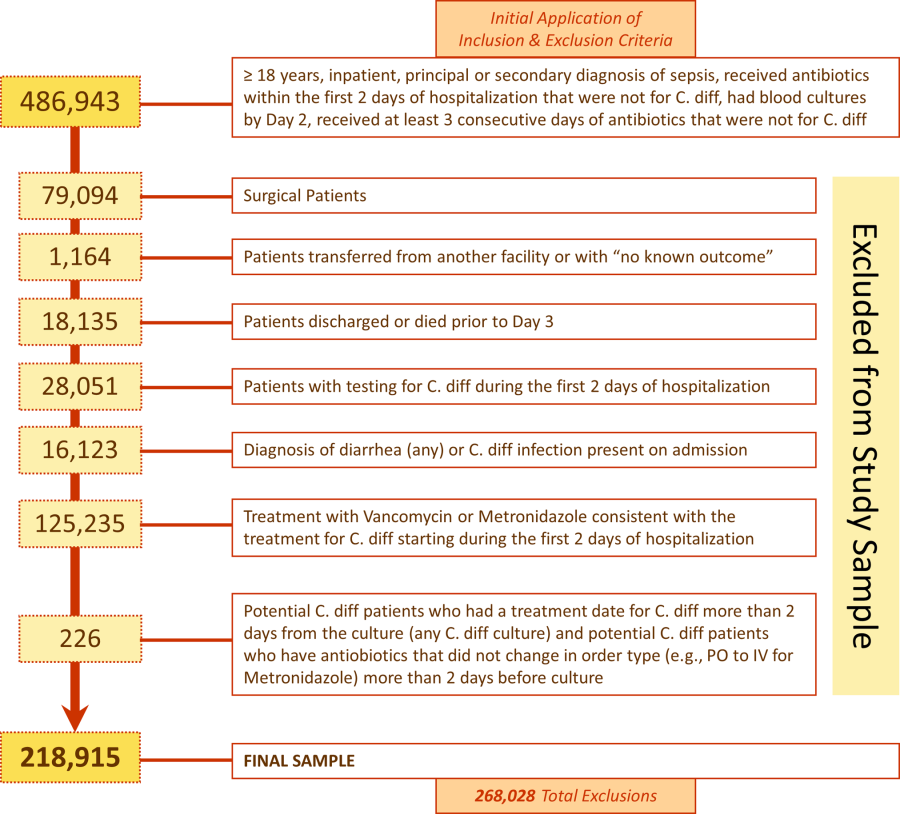
We identified 486,943 adult sepsis admissions to a Premier hospital between July 1, 2004 and December 31, 2010. After applying all exclusion criteria, we had a final sample of 218,915 admissions with sepsis (from 400 hospitals) at risk for HOCDI (Figure 1). Of these, 2368 (1.08%) met criteria for diagnosis of CDI after hospital day 2 and were matched to controls using index date and propensity score.
Patient and Hospital Factors
After matching, the median age was 71 years in cases and 70 years in controls (Table 1). Less than half (46%) of the population was male. Most cases (61%) and controls (58%) were white. Heart failure, hypertension, chronic lung disease, renal failure, and weight loss were the most common comorbid conditions. Our propensity model, which had a C statistic of 0.75, identified patients whose risk varied from a mean of 0.1% in the first decile to a mean of 3.8% in the tenth decile. Before matching, 40% of cases and 29% of controls were treated in the ICU by hospital day 2; after matching, 40% of both cases and controls were treated in the ICU by hospital day 2.
Distribution by LOS, Index Day, and Risk for Mortality
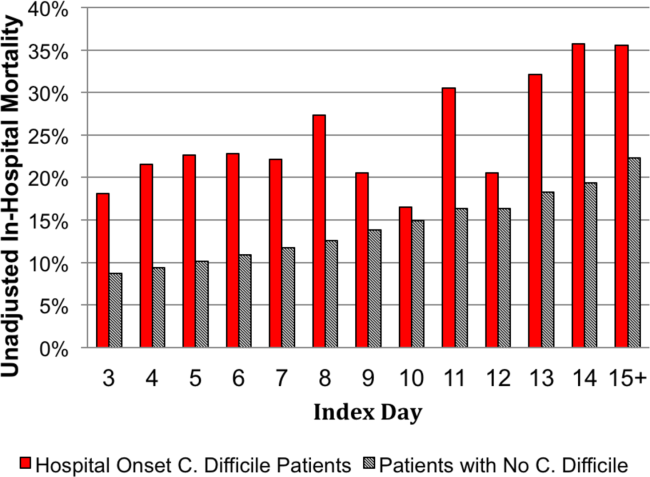
The unadjusted and unmatched LOS was longer for cases than controls (19 days vs 8 days, Table 2) (see Supporting Figure 1 in the online version of this article). Approximately 90% of the patients had an index day of 14 or less (Figure 2). Among patients both with and without CDI, the unadjusted mortality risk increased as the index day (and thus the total LOS) increased.
| Outcome | HOCDI | No HOCDI | Difference (95% CI) | P |
|---|---|---|---|---|
| ||||
| Length of stay, d | ||||
| Raw results | 19.2 | 8.3 | 8.4 (8.48.5) | <0.01 |
| Raw results for survivors only | 18.6 | 8.0 | 10.6 (10.311.0) | <0.01 |
| Matched results | 19.2 | 14.2 | 5.1(4.45.7) | <0.01 |
| Matched results for survivors only | 18.6 | 13.6 | 5.1 (4.45.8) | <0.01 |
| Mortality, % | ||||
| Raw results | 24.0 | 10.1 | 13.9 (12.615.1), RR=2.4 (2.22.5) | <0.01 |
| Matched results | 24.0 | 15.4 | 8.6 (6.410.9), RR=1.6 (1.41.8) | <0.01 |
| Costs, US$ | ||||
| Raw results median costs [interquartile range] | $26,187 [$15,117$46,273] | $9,988 [$6,296$17,351] | $16,190 ($15,826$16,555) | <0.01 |
| Raw results for survivors only [interquartile range] | $24,038 [$14,169$41,654] | $9,429 [$6,070$15,875] | $14,620 ($14,246$14,996) | <0.01 |
| Matched results [interquartile range] | $26,187 [$15,117$46,273] | $19,160 [$12,392$33,777] | $5,308 ($4,521$6,108) | |
| Matched results for survivors only [interquartile range] | $24,038 [$14,169$41,654] | $17,811 [$11,614$29,298] | $4,916 ($4,088$5,768) | <0.01 |
Adjusted Results
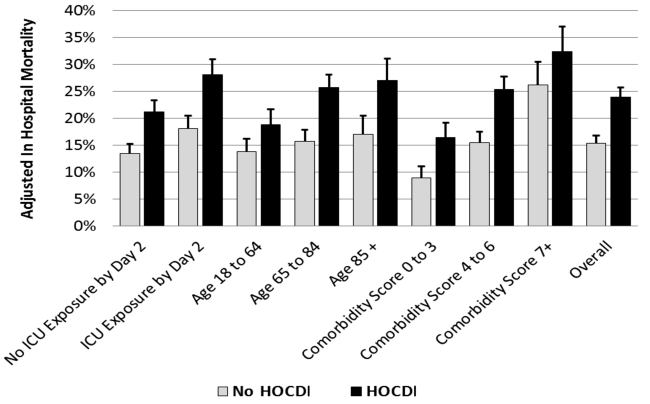
Compared to patients without disease, HOCDI patients had an increased unadjusted mortality (24% vs 10%, P<0.001). This translates into a relative risk of 2.4 (95% confidence interval [CI]: 2.2, 2.5). In the matched cohort, the difference in the mortality rates was attenuated, but still significantly higher in the HOCDI patients (24% versus 15%, P<0.001, an absolute difference of 9%; 95% CI: 6.410.8). The adjusted relative risk of mortality for HOCDI was 1.6 (95% CI: 1.41.8; Table 2). After matching, patients with CDI had a LOS of 19.2 days versus 14.2 days in matched controls (difference of 5.1 days; 95% CI: 4.45.7; P<0.001). When the LOS analysis was limited to survivors only, this difference of 5 days remained (P<0.001). In an analysis limited to survivors only, the difference in median costs between cases and controls was $4916 (95% CI: $4088$5768; P<0.001). In a secondary analysis examining heterogeneity between HOCDI and outcomes across clinical subgroups, the absolute difference in mortality and costs between cases and controls varied across demographics, comorbidity, and ICU admission, but the relative risks were similar (Figure 3) (see Supporting Figure 3 in the online version of this article).
DISCUSSION
In this large cohort of patients with sepsis, we found that approximately 1 in 100 patients with sepsis developed HOCDI. Even after matching with controls based on the date of symptom onset and propensity score, patients who developed HOCDI were more than 1.6 times more likely to die in the hospital. HOCDI also added 5 days to the average hospitalization for patients with sepsis and increased median costs by approximately $5000. These findings suggest that a hospital that prevents 1 case of HOCDI per month in sepsis patients could avoid 1 death and 60 inpatient days annually, achieving an approximate yearly savings of $60,000.
Until now, the incremental cost and mortality attributable to HOCDI in sepsis patients have been poorly understood. Attributing outcomes can be methodologically challenging because patients who are at greatest risk for poor outcomes are the most likely to contract the disease and are at risk for longer periods of time. Therefore, it is necessary to take into account differences in severity of illness and time at risk between diseased and nondiseased populations and to ensure that outcomes attributed to the disease occur after disease onset.[28, 32] The majority of prior studies examining the impact of CDI on hospitalized patients have been limited by a lack of adequate matching to controls, small sample size, or failure to take into account time to infection.[16, 17, 19, 20]
A few studies have taken into account severity, time to infection, or both in estimating the impact of HOCDI. Using a time‐dependent Cox model that accounted for time to infection, Micek et al. found no difference in mortality but a longer LOS in mechanically ventilated patients (not limited to sepsis) with CDI.[33] However, their study was conducted at only 3 centers, did not take into account severity at the time of diagnosis, and did not clearly distinguish between community‐onset CDI and HOCDI. Oake et al. and Forster et al. examined the impact of CDI on patients hospitalized in a 2‐hospital health system in Canada.[12, 13] Using the baseline mortality estimate in a Cox multivariate proportional hazards regression model that accounted for the time‐varying nature of CDI, they found that HOCDI increased absolute risk of death by approximately 10%. Also, notably similar to our study were their findings that HOCDI occurred in approximately 1 in 100 patients and that the attributable median increase in LOS due to hospital‐onset CDI was 6 days. Although methodologically rigorous, these 2 small studies did not assess the impact of CDI on costs of care, were not focused on sepsis patients or even patients who received antibiotics, and also did not clearly distinguish between community‐onset CDI and HOCDI.
Our study therefore has important strengths. It is the first to examine the impact of HOCDI, including costs, on the outcomes of patients hospitalized with sepsis. The fact that we took into account both time to diagnosis and severity at the time of diagnosis (by using an index date for both cases and controls and determining severity on that date) prevented us from overestimating the impact of HOCDI on outcomes. The large differences in outcomes we observed in unadjusted and unmatched data were tempered after multivariate adjustment (eg, difference in LOS from 10.6 days to 5.1 additional days, costs from $14,620 to $4916 additional costs after adjustment). Our patient sample was derived from a large, multihospital database that contains actual hospital costs as derived from internal accounting systems. The fact that our study used data from hundreds of hospitals means that our estimates of cost, LOS, and mortality may be more generalizable than the work of Micek et al., Oake et al., and Forster et al.
This work also has important implications. First, hospital administrators, clinicians, and researchers can use our results to evaluate the cost‐effectiveness of HOCDI prevention measures (eg, hand hygiene programs, antibiotic stewardship). By quantifying the cost per case in sepsis patients, we allow administrators and researchers to compare the incremental costs of HOCDI prevention programs to the dollars and lives saved due to prevention efforts. Second, we found that our propensity model identified patients whose risk varied greatly. This suggests that an opportunity exists to identify subgroups of patients that are at highest risk. Identifying high‐risk subgroups will allow for targeted risk reduction interventions and the opportunity to reduce transmission (eg, by placing high‐risk patients in a private room). Finally, we have reaffirmed that time to diagnosis and presenting severity need to be rigorously addressed prior to making estimates of the impact of CDI burden and other hospital‐acquired conditions and injuries.
There are limitations to this study as well. We did not have access to microbiological data. However, we required a diagnosis code of CDI, evidence of testing, and treatment after the date of testing to confirm a diagnosis. We also adopted detailed exclusion criteria to ensure that CDI that was not present on admission and that controls did not have CDI. These stringent inclusion and exclusion criteria strengthened the internal validity of our estimates of disease impact. We used administrative claims data, which limited our ability to adjust for severity. However, the detailed nature of the database allowed us to use treatments, such as vasopressors and antibiotics, to identify cases; treatments were also used as a validated indicator of severity,[26] which may have helped to reduce some of this potential bias. Although our propensity model included many predictors of CDI, such as use of proton pump inhibitors and factors associated with mortality, not every confounder was completely balanced after propensity matching, although the statistical differences may have been related to our large sample size and therefore might not be clinically significant. We also may have failed to include all possible predictors of CDI in the propensity model.
In a large, diverse cohort of hospitalized patients with sepsis, we found that HOCDI lengthened hospital stay by approximately 5 days, increased risk of in‐hospital mortality by 9%, and increased hospital cost by approximately $5000 per patient. These findings highlight the importance of identifying effective prevention measures and of determining the patient populations at greatest risk for HOCDI.
Disclosures: The study was conducted with funding from the Division of Critical Care and the Center for Quality of Care Research at Baystate Medical Center. Dr. Lagu is supported by the National Heart, Lung, and Blood Institute of the National Institutes of Health under award number K01HL114745. Dr. Stefan is supported by the National Heart, Lung, and Blood Institute of the National Institutes of Health under award number K01HL114631. Drs. Lagu and Lindenauer had full access to all of the data in the study; they take responsibility for the integrity of the data and the accuracy of the data analysis. Drs. Lagu, Lindenauer, Steingrub, Higgins, Stefan, Haessler, and Rothberg conceived of the study. Dr. Lindenauer acquired the data. Drs. Lagu, Lindenauer, Rothberg, Steingrub, Nathanson, Stefan, Haessler, Higgins, and Mr. Hannon analyzed and interpreted the data. Dr. Lagu drafted the manuscript. Drs. Lagu, Lindenauer, Rothberg, Steingrub, Nathanson, Stefan, Haessler, Higgins, and Mr. Hannon critically reviewed the manuscript for important intellectual content. Dr. Nathanson carried out the statistical analyses. Dr. Nathanson, through his company OptiStatim LLC, was paid by the investigators with funding from the Department of Medicine at Baystate Medical Center to assist in conducting the statistical analyses in this study. The authors report no further conflicts of interest.
- , , , . Increasing prevalence and severity of Clostridium difficile colitis in hospitalized patients in the United States. Arch Surg. 2007;142(7):624–631; discussion 631.
- , , , et al. The changing epidemiology of Clostridium difficile infections. Clin Microbiol Rev. 2010;23(3):529–549.
- , . Clostridium Difficile‐Associated Disease in U.S. Hospitals, 1993–2005. HCUP Statistical Brief #50. April 2008. Agency for Healthcare Research and Quality, Rockville, MD. Available at: http://www.hcup‐us.ahrq.gov/reports/statbriefs/sb50.pdf. Accessed April 4, 2014.
- , , , . National point prevalence of Clostridium difficile in US health care facility inpatients, 2008. Am J Infect Control. 2009;37(4):263–270.
- . A 76‐year‐old man with recurrent Clostridium difficile‐associated diarrhea: review of C. difficile infection. JAMA. 2009;301(9):954–962.
- , , , , , . Recurrent Clostridium difficile disease: epidemiology and clinical characteristics. Infect Control Hosp Epidemiol. 1999;20(1):43–50.
- , , , , , . Recurrent Clostridium difficile diarrhea: characteristics of and risk factors for patients enrolled in a prospective, randomized, double‐blinded trial. Clin Infect Dis. 1997;24(3):324–333.
- . Narrative review: the new epidemic of Clostridium difficile‐associated enteric disease. Ann Intern Med. 2006;145(10):758–764.
- , , , et al. Impact of emergency colectomy on survival of patients with fulminant Clostridium difficile colitis during an epidemic caused by a hypervirulent strain. Ann Surg. 2007;245(2):267–272.
- , , , . Hospital‐acquired Clostridium difficile‐associated disease in the intensive care unit setting: epidemiology, clinical course and outcome. BMC Infect Dis. 2007;7:42.
- , , , , , . Factors associated with prolonged symptoms and severe disease due to Clostridium difficile. Age Ageing. 1999;28(2):107–113.
- , , , , , . The effect of hospital‐acquired Clostridium difficile infection on in‐hospital mortality. Arch Intern Med. 2010;170(20):1804–1810.
- , , , , , . The effect of hospital‐acquired infection with Clostridium difficile on length of stay in hospital. CMAJ. 2012;184(1):37–42.
- , . Clostridium difficile—more difficult than ever. N Engl J Med. 2008;359(18):1932–1940.
- , , , et al. Clinical practice guidelines for Clostridium difficile infection in adults: 2010 update by the society for healthcare epidemiology of America (SHEA) and the infectious diseases society of America (IDSA). Infect Control Hosp Epidemiol. 2010;31(5):431–455.
- , , , . Health care costs and mortality associated with nosocomial diarrhea due to Clostridium difficile. Clin Infect Dis. 2002;34(3):346–353.
- , , , , . Short‐ and long‐term attributable costs of Clostridium difficile‐associated disease in nonsurgical inpatients. Clin Infect Dis. 2008;46(4):497–504.
- , , , , . Estimation of extra hospital stay attributable to nosocomial infections: heterogeneity and timing of events. J Clin Epidemiol. 2000;53(4):409–417.
- , , , et al. Attributable outcomes of endemic Clostridium difficile‐associated disease in nonsurgical patients. Emerging Infect Dis. 2008;14(7):1031–1038.
- , . Excess length of stay, charges, and mortality attributable to medical injuries during hospitalization. JAMA. 2003;290(14):1868–1874.
- , , , , , . Association of corticosteroid dose and route of administration with risk of treatment failure in acute exacerbation of chronic obstructive pulmonary disease. JAMA. 2010;303(23):2359–2367.
- , , , , , . The relationship between hospital spending and mortality in patients with sepsis. Arch Intern Med. 2011;171(4):292–299.
- , , , , , . Comparative effectiveness of macrolides and quinolones for patients hospitalized with acute exacerbations of chronic obstructive pulmonary disease (AECOPD). J Hosp Med. 2010;5(5):261–267.
- , , , , . A combined comorbidity score predicted mortality in elderly patients better than existing scores. J Clin Epidemiol. 2011;64(7):749–759.
- , , , , , . Epidemiology of severe sepsis in the United States: analysis of incidence, outcome, and associated costs of care. Crit Care Med. 2001;29(7):1303–1310.
- , , , et al. Development and validation of a model that uses enhanced administrative data to predict mortality in patients with sepsis. Crit Care Med. 2011;39(11):2425–2430.
- , , , , . Incorporating initial treatments improves performance of a mortality prediction model for patients with sepsis. Pharmacoepidemiol Drug Saf. 2012;21(suppl 2):44–52.
- , , , . Nosocomial infection, length of stay, and time‐dependent bias. Infect Control Hosp Epidemiol. 2009;30(3):273–276.
- , , , , , . Length of stay and hospital costs among high‐risk patients with hospital‐origin Clostridium difficile‐associated diarrhea. J Med Econ. 2013;16(3):440–448.
- Rogers. Regression standard errors in clustered samples. Stata Technical Bulletin. 1993;13(13):19–23.
- . Reducing bias in a propensity score matched‐pair sample using greedy matching techniques. In: Proceedings of the 26th Annual SAS Users Group International Conference; April 22–25, 2001; Long Beach, CA. Paper 214‐26. Available at: http://www2.sas.com/proceedings/sugi26/p214‐26.pdf. Accessed April 4, 2014.
- , . Prolongation of length of stay and Clostridium difficile infection: a review of the methods used to examine length of stay due to healthcare associated infections. Antimicrob Resist Infect Control. 2012;1(1):14.
- , , , et al. Clostridium difficile Infection: a multicenter study of epidemiology and outcomes in mechanically ventilated patients. Crit Care Med. 2013;41(8):1968–1975.
There are approximately 3 million cases of Clostridium difficile infection (CDI) per year in the United States.[1, 2, 3, 4] Of these, 10% result in a hospitalization or occur as a consequence of the exposures and treatments associated with hospitalization.[1, 2, 3, 4] Some patients with CDI experience mild diarrhea that is responsive to therapy, but other patients experience severe, life‐threatening disease that is refractory to treatment, leading to pseudomembranous colitis, toxic megacolon, and sepsis with a 60‐day mortality rate that exceeds 12%.[5, 6, 7, 8, 9, 10, 11, 12, 13, 14]
Hospital‐onset CDI (HOCDI), defined as C difficile‐associated diarrhea and related symptoms with onset more than 48 hours after admission to a healthcare facility,[15] represents a unique marriage of CDI risk factors.[5] A vulnerable patient is introduced into an environment that contains both exposure to C difficile (through other patients or healthcare workers) and treatment with antibacterial agents that may diminish normal flora. Consequently, CDI is common among hospitalized patients.[16, 17, 18] A particularly important group for understanding the burden of disease is patients who initially present to the hospital with sepsis and subsequently develop HOCDI. Sepsis patients are often critically ill and are universally treated with antibiotics.
Determining the incremental cost and mortality risk attributable to HOCDI is methodologically challenging. Because HOCDI is associated with presenting severity, the sickest patients are also the most likely to contract the disease. HOCDI is also associated with time of exposure or length of stay (LOS). Because LOS is a risk factor, comparing LOS between those with and without HOCDI will overestimate the impact if the time to diagnosis is not taken into account.[16, 17, 19, 20] We aimed to examine the impact of HOCDI in hospitalized patients with sepsis using a large, multihospital database with statistical methods that took presenting severity and time to diagnosis into account.
METHODS
Data Source and Subjects
Permission to conduct this study was obtained from the institutional review board at Baystate Medical Center. We used the Premier Healthcare Informatics database, a voluntary, fee‐supported database created to measure quality and healthcare utilization, which has been used extensively in health services research.[21, 22, 23] In addition to the elements found in hospital claims derived from the uniform billing 04 form, Premier data include an itemized, date‐stamped log of all items and services charged to the patient or their insurer, including medications, laboratory tests, and diagnostic and therapeutic services. Approximately 75% of hospitals that submit data also provide information on actual hospital costs, taken from internal cost accounting systems. The rest provide cost estimates based on Medicare cost‐to‐charge ratios. Participating hospitals are similar to the composition of acute care hospitals nationwide, although they are more commonly small‐ to midsized nonteaching facilities and are more likely to be located in the southern United States.
We included medical (nonsurgical) adult patients with sepsis who were admitted to a participating hospital between July 1, 2004 and December 31, 2010. Because we sought to focus on the care of patients who present to the hospital with sepsis, we defined sepsis as the presence of a diagnosis of sepsis plus evidence of both blood cultures and antibiotic treatment within the first 2 days of hospitalization; we used the first 2 days of hospitalization rather than just the first day because, in administrative datasets, the duration of the first hospital day includes partial days that can vary in length. We excluded patients who died or were discharged prior to day 3, because HOCDI is defined as onset after 48 hours in a healthcare facility.[15] We also excluded surviving patients who received less than 3 consecutive days of antibiotics, and patients who were transferred from or to another acute‐care facility; the latter exclusion criterion was used because we could not accurately determine the onset or subsequent course of their illness.
Identification of Patients at Risk for and Diagnosed With HOCDI
Among eligible patients with sepsis, we aimed to identify a cohort at risk for developing CDI during the hospital stay. We excluded patients: (1) with a diagnosis indicating that diarrhea was present on admission, (2) with a diagnosis of CDI that was indicated to be present on admission, (3) who were tested for CDI on the first or second hospital day, and (4) who received an antibiotic that could be consistent with treatment for CDI (oral or intravenous [IV] metronidazole or oral vancomycin) on hospital days 1 or 2.
Next, we aimed to identify sepsis patients at risk for HOCDI who developed HOCDI during their hospital stay. Among eligible patients described above, we considered a patient to have HOCDI if they had an International Classification of Diseases, Ninth Revision, Clinical Modification diagnosis of CDI (primary or secondary but not present on admission), plus evidence of testing for CDI after hospital day 2, and treatment with oral vancomycin or oral or IV metronidazole that was started after hospital day 2 and within 2 days of the C difficile test, and evidence of treatment for CDI for at least 3 days unless the patient was discharged or died.
Patient Information
We recorded patient age, gender, marital status, insurance status, race, and ethnicity. Using software provided by the Healthcare Costs and Utilization Project of the Agency for Healthcare Research and Quality, we categorized information on 30 comorbid conditions. We also created a single numerical comorbidity score based on a previously published and validated combined comorbidity score that predicts 1‐year mortality.[24] Based on a previously described algorithm,[25] we used diagnosis codes to assess the source (lung, abdomen, urinary tract, blood, other) and type of sepsis (Gram positive, Gram negative, mixed, anaerobic, fungal). Because patients can have more than 1 potential source of sepsis (eg, pneumonia and urinary tract infection) and more than 1 organism causing infection (eg, urine with Gram negative rods and blood culture with Gram positive cocci), these categories are not mutually exclusive (see Supporting Table 1 in the online version of this article). We used billing codes to identify the use of therapies, monitoring devices, and pharmacologic treatments to characterize both initial severity of illness and severity at the time of CDI diagnosis. These therapies are included in a validated sepsis mortality prediction model (designed for administrative datasets) with similar discrimination and calibration to clinical intensive care unit (ICU) risk‐adjustment models such as the mortality probability model, version III.[26, 27]
Outcomes
Our primary outcome of interest was in‐hospital mortality. Secondary outcomes included LOS and costs for survivors only and for all patients.
Statistical Methods
We calculated patient‐level summary statistics for all patients using frequencies for binary variables and medians and interquartile percentiles for continuous variables. P values <0.05 were considered statistically significant.
To account for presenting severity and time to diagnosis, we used methods that have been described elsewhere.[12, 13, 18, 20, 28] First, we identified patients who were eligible to develop HOCDI. Second, for all eligible patients, we identified a date of disease onset (index date). For patients who met criteria for HOCDI, this was the date on which the patient was tested for CDI. For eligible patients without disease, this was a date randomly assigned to any time during the hospital stay.[29] Next, we developed a nonparsimonious propensity score model that included all patient characteristics (demographics, comorbidities, sepsis source, and severity of illness on presentation and on the index date; all variables listed in Table 1 were included in the propensity model). Some of the variables for this model (eg, mechanical ventilation and vasopressors) were derived from a validated severity model.[26] We adjusted for correlation within hospital when creating the propensity score using Huber‐White robust standard error estimators clustered at the hospital level.[30] We then created matched pairs with the same LOS prior to the index date and similar propensity for developing CDI. We first matched on index date, and then, within each index‐datematched subset, matched patients with and without HOCDI by their propensity score using a 5‐to‐1 greedy match algorithm.[31] We used the differences in LOS between the cases and controls after the index date to calculate the additional attributable LOS estimates; we also separately estimated the impact on cost and LOS in a group limited to those who survived after discharge because of concerns that death could shorten LOS and reduce costs.
| Before Matching | After Matching | |||||
|---|---|---|---|---|---|---|
| HOCDI, n=2,368, % | No CDI, n=216,547, % | P | HOCDI, n=2,368, % | No CDI, n=2,368, % | P | |
| ||||||
| Age, y | 70.9 (15.1) | 68.6 (16.8) | <0.01 | 70.9 (15.1) | 69.8 (15.9) | 0.02 |
| Male | 46.8 | 46.0 | 0.44 | 46.8 | 47.2 | 0.79 |
| Race | ||||||
| White | 61.0 | 63.3 | 61.0 | 58.1 | ||
| Black | 15.6 | 14.5 | <0.01 | 15.6 | 17.0 | 0.11 |
| Hispanic | 3.2 | 5.4 | 3.2 | 4.1 | ||
| Other race | 20.2 | 16.8 | 20.2 | 20.9 | ||
| Marital status | ||||||
| Married | 31.6 | 36.3 | <0.01 | 31.6 | 32.6 | 0.74 |
| Single/divorced | 52.8 | 51.1 | 52.8 | 52.0 | ||
| Other/unknown | 15.7 | 12.6 | 15.7 | 14.5 | ||
| Insurance status | ||||||
| Medicare traditional | 63.2 | 59.5 | 63.2 | 60.3 | ||
| Medicare managed | 10.6 | 10.1 | 10.6 | 10.9 | ||
| Medicaid traditional | 7.6 | 6.9 | 7.6 | 8.2 | ||
| Medicaid managed | 1.8 | 2.0 | <0.01 | 1.8 | 1.8 | 0.50 |
| Managed care | 10.8 | 12.3 | 10.8 | 12.0 | ||
| Commercial | 2.0 | 3.5 | 2.0 | 2.2 | ||
| Self‐pay/other/unknown | 4.0 | 5.7 | 4.0 | 4.7 | ||
| Infection source | ||||||
| Respiratory | 46.5 | 37.0 | <0.01 | 46.5 | 49.6 | 0.03 |
| Skin/bone | 10.1 | 8.6 | 0.01 | 10.1 | 11.2 | 0.21 |
| Urinary | 52.2 | 51.3 | 0.38 | 52.2 | 50.3 | 0.18 |
| Blood | 11.1 | 15.1 | <0.01 | 11.1 | 11.5 | 0.65 |
| Infecting organism | ||||||
| Gram negative | 35.0 | 36.6 | <0.01 | 35.0 | 33.1 | 0.18 |
| Anaerobe | 1.4 | 0.7 | <0.01 | 1.4 | 1.1 | 0.24 |
| Fungal | 17.5 | 7.5 | <0.01 | 17.5 | 18.3 | 0.44 |
| Most common comorbid conditions | ||||||
| Congestive heart failure | 35.1 | 24.6 | <0.01 | 35.1 | 37.5 | 0.06 |
| Chronic lung disease | 31.6 | 27.6 | <0.01 | 31.6 | 32.1 | 0.71 |
| Hypertension | 31.5 | 37.7 | <0.01 | 31.5 | 29.7 | 0.16 |
| Renal Failure | 29.7 | 23.8 | <0.01 | 29.7 | 31.2 | 0.28 |
| Weight Loss | 27.7 | 13.3 | <0.01 | 27.7 | 29.4 | 0.17 |
| Treatments by day 2 | ||||||
| ICU admission | 40.0 | 29.5 | <0.01 | 40.0 | 40.7 | 0.64 |
| Use of bicarbonate | 12.2 | 7.1 | <0.01 | 12.2 | 13.6 | 0.15 |
| Fresh frozen plasma | 1.4 | 1.0 | 0.03 | 1.4 | 1.1 | 0.36 |
| Inotropes | 1.4 | 0.9 | 0.01 | 1.4 | 2.2 | 0.04 |
| Hydrocortisone | 6.7 | 4.7 | <0.01 | 6.7 | 7.4 | 0.33 |
| Thiamine | 4.2 | 3.3 | 0.01 | 4.2 | 4.1 | 0.83 |
| Psychotropics (eg, haldol for delirium) | 10.0 | 9.2 | 0.21 | 10.0 | 10.8 | 0.36 |
| Restraints (eg, for delirium) | 2.0 | 1.5 | 0.05 | 2.0 | 2.5 | 0.29 |
| Angiotensin‐converting enzyme inhibitors | 12.1 | 13.2 | 0.12 | 12.1 | 10.9 | 0.20 |
| Statins | 18.8 | 21.1 | 0.01 | 18.8 | 16.9 | 0.09 |
| Drotrecogin alfa | 0.6 | 0.3 | 0.00 | 0.6 | 0.6 | 0.85 |
| Foley catheter | 19.2 | 19.8 | 0.50 | 19.2 | 22.0 | 0.02 |
| Diuretics | 28.5 | 25.4 | 0.01 | 28.5 | 29.6 | 0.42 |
| Red blood cells | 15.5 | 10.6 | <0.01 | 15.5 | 15.8 | 0.81 |
| Calcium channel blockers | 19.3 | 16.8 | 0.01 | 19.3 | 19.1 | 0.82 |
| ‐Blockers | 32.7 | 29.6 | 0.01 | 32.7 | 30.6 | 0.12 |
| Proton pump inhibitors | 59.6 | 53.1 | <0.01 | 59.6 | 61.0 | 0.31 |
Analysis Across Clinical Subgroups
In a secondary analysis, we examined heterogeneity in the association between HOCDI and outcomes within subsets of patients defined by age, combined comorbidity score, and admission to the ICU by day 2. We created separate propensity scores using the same covariates in the primary analysis, but limited matches to within these subsets. For each group, we examined how the covariates in the HOCDI and control groups differed after matching with inference tests that took the paired nature of the data into account. All analyses were carried out using Stata/SE 11.1 (StataCorp, College Station, TX).
RESULTS
We identified 486,943 adult sepsis admissions to a Premier hospital between July 1, 2004 and December 31, 2010. After applying all exclusion criteria, we had a final sample of 218,915 admissions with sepsis (from 400 hospitals) at risk for HOCDI (Figure 1). Of these, 2368 (1.08%) met criteria for diagnosis of CDI after hospital day 2 and were matched to controls using index date and propensity score.
Patient and Hospital Factors
After matching, the median age was 71 years in cases and 70 years in controls (Table 1). Less than half (46%) of the population was male. Most cases (61%) and controls (58%) were white. Heart failure, hypertension, chronic lung disease, renal failure, and weight loss were the most common comorbid conditions. Our propensity model, which had a C statistic of 0.75, identified patients whose risk varied from a mean of 0.1% in the first decile to a mean of 3.8% in the tenth decile. Before matching, 40% of cases and 29% of controls were treated in the ICU by hospital day 2; after matching, 40% of both cases and controls were treated in the ICU by hospital day 2.
Distribution by LOS, Index Day, and Risk for Mortality
The unadjusted and unmatched LOS was longer for cases than controls (19 days vs 8 days, Table 2) (see Supporting Figure 1 in the online version of this article). Approximately 90% of the patients had an index day of 14 or less (Figure 2). Among patients both with and without CDI, the unadjusted mortality risk increased as the index day (and thus the total LOS) increased.
| Outcome | HOCDI | No HOCDI | Difference (95% CI) | P |
|---|---|---|---|---|
| ||||
| Length of stay, d | ||||
| Raw results | 19.2 | 8.3 | 8.4 (8.48.5) | <0.01 |
| Raw results for survivors only | 18.6 | 8.0 | 10.6 (10.311.0) | <0.01 |
| Matched results | 19.2 | 14.2 | 5.1(4.45.7) | <0.01 |
| Matched results for survivors only | 18.6 | 13.6 | 5.1 (4.45.8) | <0.01 |
| Mortality, % | ||||
| Raw results | 24.0 | 10.1 | 13.9 (12.615.1), RR=2.4 (2.22.5) | <0.01 |
| Matched results | 24.0 | 15.4 | 8.6 (6.410.9), RR=1.6 (1.41.8) | <0.01 |
| Costs, US$ | ||||
| Raw results median costs [interquartile range] | $26,187 [$15,117$46,273] | $9,988 [$6,296$17,351] | $16,190 ($15,826$16,555) | <0.01 |
| Raw results for survivors only [interquartile range] | $24,038 [$14,169$41,654] | $9,429 [$6,070$15,875] | $14,620 ($14,246$14,996) | <0.01 |
| Matched results [interquartile range] | $26,187 [$15,117$46,273] | $19,160 [$12,392$33,777] | $5,308 ($4,521$6,108) | |
| Matched results for survivors only [interquartile range] | $24,038 [$14,169$41,654] | $17,811 [$11,614$29,298] | $4,916 ($4,088$5,768) | <0.01 |
Adjusted Results
Compared to patients without disease, HOCDI patients had an increased unadjusted mortality (24% vs 10%, P<0.001). This translates into a relative risk of 2.4 (95% confidence interval [CI]: 2.2, 2.5). In the matched cohort, the difference in the mortality rates was attenuated, but still significantly higher in the HOCDI patients (24% versus 15%, P<0.001, an absolute difference of 9%; 95% CI: 6.410.8). The adjusted relative risk of mortality for HOCDI was 1.6 (95% CI: 1.41.8; Table 2). After matching, patients with CDI had a LOS of 19.2 days versus 14.2 days in matched controls (difference of 5.1 days; 95% CI: 4.45.7; P<0.001). When the LOS analysis was limited to survivors only, this difference of 5 days remained (P<0.001). In an analysis limited to survivors only, the difference in median costs between cases and controls was $4916 (95% CI: $4088$5768; P<0.001). In a secondary analysis examining heterogeneity between HOCDI and outcomes across clinical subgroups, the absolute difference in mortality and costs between cases and controls varied across demographics, comorbidity, and ICU admission, but the relative risks were similar (Figure 3) (see Supporting Figure 3 in the online version of this article).
DISCUSSION
In this large cohort of patients with sepsis, we found that approximately 1 in 100 patients with sepsis developed HOCDI. Even after matching with controls based on the date of symptom onset and propensity score, patients who developed HOCDI were more than 1.6 times more likely to die in the hospital. HOCDI also added 5 days to the average hospitalization for patients with sepsis and increased median costs by approximately $5000. These findings suggest that a hospital that prevents 1 case of HOCDI per month in sepsis patients could avoid 1 death and 60 inpatient days annually, achieving an approximate yearly savings of $60,000.
Until now, the incremental cost and mortality attributable to HOCDI in sepsis patients have been poorly understood. Attributing outcomes can be methodologically challenging because patients who are at greatest risk for poor outcomes are the most likely to contract the disease and are at risk for longer periods of time. Therefore, it is necessary to take into account differences in severity of illness and time at risk between diseased and nondiseased populations and to ensure that outcomes attributed to the disease occur after disease onset.[28, 32] The majority of prior studies examining the impact of CDI on hospitalized patients have been limited by a lack of adequate matching to controls, small sample size, or failure to take into account time to infection.[16, 17, 19, 20]
A few studies have taken into account severity, time to infection, or both in estimating the impact of HOCDI. Using a time‐dependent Cox model that accounted for time to infection, Micek et al. found no difference in mortality but a longer LOS in mechanically ventilated patients (not limited to sepsis) with CDI.[33] However, their study was conducted at only 3 centers, did not take into account severity at the time of diagnosis, and did not clearly distinguish between community‐onset CDI and HOCDI. Oake et al. and Forster et al. examined the impact of CDI on patients hospitalized in a 2‐hospital health system in Canada.[12, 13] Using the baseline mortality estimate in a Cox multivariate proportional hazards regression model that accounted for the time‐varying nature of CDI, they found that HOCDI increased absolute risk of death by approximately 10%. Also, notably similar to our study were their findings that HOCDI occurred in approximately 1 in 100 patients and that the attributable median increase in LOS due to hospital‐onset CDI was 6 days. Although methodologically rigorous, these 2 small studies did not assess the impact of CDI on costs of care, were not focused on sepsis patients or even patients who received antibiotics, and also did not clearly distinguish between community‐onset CDI and HOCDI.
Our study therefore has important strengths. It is the first to examine the impact of HOCDI, including costs, on the outcomes of patients hospitalized with sepsis. The fact that we took into account both time to diagnosis and severity at the time of diagnosis (by using an index date for both cases and controls and determining severity on that date) prevented us from overestimating the impact of HOCDI on outcomes. The large differences in outcomes we observed in unadjusted and unmatched data were tempered after multivariate adjustment (eg, difference in LOS from 10.6 days to 5.1 additional days, costs from $14,620 to $4916 additional costs after adjustment). Our patient sample was derived from a large, multihospital database that contains actual hospital costs as derived from internal accounting systems. The fact that our study used data from hundreds of hospitals means that our estimates of cost, LOS, and mortality may be more generalizable than the work of Micek et al., Oake et al., and Forster et al.
This work also has important implications. First, hospital administrators, clinicians, and researchers can use our results to evaluate the cost‐effectiveness of HOCDI prevention measures (eg, hand hygiene programs, antibiotic stewardship). By quantifying the cost per case in sepsis patients, we allow administrators and researchers to compare the incremental costs of HOCDI prevention programs to the dollars and lives saved due to prevention efforts. Second, we found that our propensity model identified patients whose risk varied greatly. This suggests that an opportunity exists to identify subgroups of patients that are at highest risk. Identifying high‐risk subgroups will allow for targeted risk reduction interventions and the opportunity to reduce transmission (eg, by placing high‐risk patients in a private room). Finally, we have reaffirmed that time to diagnosis and presenting severity need to be rigorously addressed prior to making estimates of the impact of CDI burden and other hospital‐acquired conditions and injuries.
There are limitations to this study as well. We did not have access to microbiological data. However, we required a diagnosis code of CDI, evidence of testing, and treatment after the date of testing to confirm a diagnosis. We also adopted detailed exclusion criteria to ensure that CDI that was not present on admission and that controls did not have CDI. These stringent inclusion and exclusion criteria strengthened the internal validity of our estimates of disease impact. We used administrative claims data, which limited our ability to adjust for severity. However, the detailed nature of the database allowed us to use treatments, such as vasopressors and antibiotics, to identify cases; treatments were also used as a validated indicator of severity,[26] which may have helped to reduce some of this potential bias. Although our propensity model included many predictors of CDI, such as use of proton pump inhibitors and factors associated with mortality, not every confounder was completely balanced after propensity matching, although the statistical differences may have been related to our large sample size and therefore might not be clinically significant. We also may have failed to include all possible predictors of CDI in the propensity model.
In a large, diverse cohort of hospitalized patients with sepsis, we found that HOCDI lengthened hospital stay by approximately 5 days, increased risk of in‐hospital mortality by 9%, and increased hospital cost by approximately $5000 per patient. These findings highlight the importance of identifying effective prevention measures and of determining the patient populations at greatest risk for HOCDI.
Disclosures: The study was conducted with funding from the Division of Critical Care and the Center for Quality of Care Research at Baystate Medical Center. Dr. Lagu is supported by the National Heart, Lung, and Blood Institute of the National Institutes of Health under award number K01HL114745. Dr. Stefan is supported by the National Heart, Lung, and Blood Institute of the National Institutes of Health under award number K01HL114631. Drs. Lagu and Lindenauer had full access to all of the data in the study; they take responsibility for the integrity of the data and the accuracy of the data analysis. Drs. Lagu, Lindenauer, Steingrub, Higgins, Stefan, Haessler, and Rothberg conceived of the study. Dr. Lindenauer acquired the data. Drs. Lagu, Lindenauer, Rothberg, Steingrub, Nathanson, Stefan, Haessler, Higgins, and Mr. Hannon analyzed and interpreted the data. Dr. Lagu drafted the manuscript. Drs. Lagu, Lindenauer, Rothberg, Steingrub, Nathanson, Stefan, Haessler, Higgins, and Mr. Hannon critically reviewed the manuscript for important intellectual content. Dr. Nathanson carried out the statistical analyses. Dr. Nathanson, through his company OptiStatim LLC, was paid by the investigators with funding from the Department of Medicine at Baystate Medical Center to assist in conducting the statistical analyses in this study. The authors report no further conflicts of interest.
- , , , . Increasing prevalence and severity of Clostridium difficile colitis in hospitalized patients in the United States. Arch Surg. 2007;142(7):624–631; discussion 631.
- , , , et al. The changing epidemiology of Clostridium difficile infections. Clin Microbiol Rev. 2010;23(3):529–549.
- , . Clostridium Difficile‐Associated Disease in U.S. Hospitals, 1993–2005. HCUP Statistical Brief #50. April 2008. Agency for Healthcare Research and Quality, Rockville, MD. Available at: http://www.hcup‐us.ahrq.gov/reports/statbriefs/sb50.pdf. Accessed April 4, 2014.
- , , , . National point prevalence of Clostridium difficile in US health care facility inpatients, 2008. Am J Infect Control. 2009;37(4):263–270.
- . A 76‐year‐old man with recurrent Clostridium difficile‐associated diarrhea: review of C. difficile infection. JAMA. 2009;301(9):954–962.
- , , , , , . Recurrent Clostridium difficile disease: epidemiology and clinical characteristics. Infect Control Hosp Epidemiol. 1999;20(1):43–50.
- , , , , , . Recurrent Clostridium difficile diarrhea: characteristics of and risk factors for patients enrolled in a prospective, randomized, double‐blinded trial. Clin Infect Dis. 1997;24(3):324–333.
- . Narrative review: the new epidemic of Clostridium difficile‐associated enteric disease. Ann Intern Med. 2006;145(10):758–764.
- , , , et al. Impact of emergency colectomy on survival of patients with fulminant Clostridium difficile colitis during an epidemic caused by a hypervirulent strain. Ann Surg. 2007;245(2):267–272.
- , , , . Hospital‐acquired Clostridium difficile‐associated disease in the intensive care unit setting: epidemiology, clinical course and outcome. BMC Infect Dis. 2007;7:42.
- , , , , , . Factors associated with prolonged symptoms and severe disease due to Clostridium difficile. Age Ageing. 1999;28(2):107–113.
- , , , , , . The effect of hospital‐acquired Clostridium difficile infection on in‐hospital mortality. Arch Intern Med. 2010;170(20):1804–1810.
- , , , , , . The effect of hospital‐acquired infection with Clostridium difficile on length of stay in hospital. CMAJ. 2012;184(1):37–42.
- , . Clostridium difficile—more difficult than ever. N Engl J Med. 2008;359(18):1932–1940.
- , , , et al. Clinical practice guidelines for Clostridium difficile infection in adults: 2010 update by the society for healthcare epidemiology of America (SHEA) and the infectious diseases society of America (IDSA). Infect Control Hosp Epidemiol. 2010;31(5):431–455.
- , , , . Health care costs and mortality associated with nosocomial diarrhea due to Clostridium difficile. Clin Infect Dis. 2002;34(3):346–353.
- , , , , . Short‐ and long‐term attributable costs of Clostridium difficile‐associated disease in nonsurgical inpatients. Clin Infect Dis. 2008;46(4):497–504.
- , , , , . Estimation of extra hospital stay attributable to nosocomial infections: heterogeneity and timing of events. J Clin Epidemiol. 2000;53(4):409–417.
- , , , et al. Attributable outcomes of endemic Clostridium difficile‐associated disease in nonsurgical patients. Emerging Infect Dis. 2008;14(7):1031–1038.
- , . Excess length of stay, charges, and mortality attributable to medical injuries during hospitalization. JAMA. 2003;290(14):1868–1874.
- , , , , , . Association of corticosteroid dose and route of administration with risk of treatment failure in acute exacerbation of chronic obstructive pulmonary disease. JAMA. 2010;303(23):2359–2367.
- , , , , , . The relationship between hospital spending and mortality in patients with sepsis. Arch Intern Med. 2011;171(4):292–299.
- , , , , , . Comparative effectiveness of macrolides and quinolones for patients hospitalized with acute exacerbations of chronic obstructive pulmonary disease (AECOPD). J Hosp Med. 2010;5(5):261–267.
- , , , , . A combined comorbidity score predicted mortality in elderly patients better than existing scores. J Clin Epidemiol. 2011;64(7):749–759.
- , , , , , . Epidemiology of severe sepsis in the United States: analysis of incidence, outcome, and associated costs of care. Crit Care Med. 2001;29(7):1303–1310.
- , , , et al. Development and validation of a model that uses enhanced administrative data to predict mortality in patients with sepsis. Crit Care Med. 2011;39(11):2425–2430.
- , , , , . Incorporating initial treatments improves performance of a mortality prediction model for patients with sepsis. Pharmacoepidemiol Drug Saf. 2012;21(suppl 2):44–52.
- , , , . Nosocomial infection, length of stay, and time‐dependent bias. Infect Control Hosp Epidemiol. 2009;30(3):273–276.
- , , , , , . Length of stay and hospital costs among high‐risk patients with hospital‐origin Clostridium difficile‐associated diarrhea. J Med Econ. 2013;16(3):440–448.
- Rogers. Regression standard errors in clustered samples. Stata Technical Bulletin. 1993;13(13):19–23.
- . Reducing bias in a propensity score matched‐pair sample using greedy matching techniques. In: Proceedings of the 26th Annual SAS Users Group International Conference; April 22–25, 2001; Long Beach, CA. Paper 214‐26. Available at: http://www2.sas.com/proceedings/sugi26/p214‐26.pdf. Accessed April 4, 2014.
- , . Prolongation of length of stay and Clostridium difficile infection: a review of the methods used to examine length of stay due to healthcare associated infections. Antimicrob Resist Infect Control. 2012;1(1):14.
- , , , et al. Clostridium difficile Infection: a multicenter study of epidemiology and outcomes in mechanically ventilated patients. Crit Care Med. 2013;41(8):1968–1975.
© 2014 Society of Hospital Medicine

Letter to the Editor
We acknowledge that our inability to measure in‐person interruptions is a limitation of our study. We maintain that while in‐person interruptions may increase in geographically localized patient care units, this form of direct face‐to‐face communication is more effective, efficient and decreases the latent errors inherent in alphanumeric paging.
Dr. Gandiga cites a study conducted in an emergency department where the vast majority of interruptions to attending physicians were in person from nurses or medical staff. We feel that this study cannot be extrapolated to medical floors, as the workflow and patient flow in an emergency department is very different than on a medical floor. The continuous throughput of patients in an emergency department would require ongoing and frequent communication between the different members of the care team. In addition, the physicians in that study were receiving an average of 1 page in 12 hours, compared to greater than 25 in 12 hours for our interns on a localized service, which illustrates the problem with comparing the emergency department to a localized medical floor.[1, 2]
We believe that the benefits of geographically localized care models, which include dramatic decreases in paging, improved efficiency, and greater agreement on the plan of care, outweigh the probable increases in in‐person interruptions. Additional study is indeed warranted to further clarify this discussion.
- , , . A study of emergency physician work and communication: a human factors approach. Isr J Em Med. 2005;5(3):35–42.
- , , . (Re)turning the pages of residency: the impact of localizing resident physicians to hospital units on paging frequency. J Hosp Med. 2014;9(2):120–122.
We acknowledge that our inability to measure in‐person interruptions is a limitation of our study. We maintain that while in‐person interruptions may increase in geographically localized patient care units, this form of direct face‐to‐face communication is more effective, efficient and decreases the latent errors inherent in alphanumeric paging.
Dr. Gandiga cites a study conducted in an emergency department where the vast majority of interruptions to attending physicians were in person from nurses or medical staff. We feel that this study cannot be extrapolated to medical floors, as the workflow and patient flow in an emergency department is very different than on a medical floor. The continuous throughput of patients in an emergency department would require ongoing and frequent communication between the different members of the care team. In addition, the physicians in that study were receiving an average of 1 page in 12 hours, compared to greater than 25 in 12 hours for our interns on a localized service, which illustrates the problem with comparing the emergency department to a localized medical floor.[1, 2]
We believe that the benefits of geographically localized care models, which include dramatic decreases in paging, improved efficiency, and greater agreement on the plan of care, outweigh the probable increases in in‐person interruptions. Additional study is indeed warranted to further clarify this discussion.
- , , . A study of emergency physician work and communication: a human factors approach. Isr J Em Med. 2005;5(3):35–42.
- , , . (Re)turning the pages of residency: the impact of localizing resident physicians to hospital units on paging frequency. J Hosp Med. 2014;9(2):120–122.
- , , . A study of emergency physician work and communication: a human factors approach. Isr J Em Med. 2005;5(3):35–42.
- , , . (Re)turning the pages of residency: the impact of localizing resident physicians to hospital units on paging frequency. J Hosp Med. 2014;9(2):120–122.
Listen Now! Patrick Torcson, MD, MMM, SFHM, discusses how being a hospitalist prepared him for the C-suite
Click here to listen to more of our interview with Dr. Torcson
Click here to listen to more of our interview with Dr. Torcson
Click here to listen to more of our interview with Dr. Torcson
Enrollment stalled for CAR T-cell study
Update: The hold on this trial has been lifted. Click here for additional details.
Memorial Sloan-Kettering Cancer Center has temporarily suspended enrollment in a study of chimeric antigen receptor (CAR) T-cell therapy, due to 2 patient deaths.
The study is an evaluation of CD19-targeted CAR T cells in patients with B-cell acute lymphoblastic leukemia (ALL).
Of the 22 patients enrolled on the study to date, 10 have died. But only 2 of these deaths gave researchers pause and made them question enrollment criteria.
Six deaths were a result of disease relapse or progression, and 2 patients died of complications from stem cell transplant.
The 2 deaths that prompted the suspension of enrollment occurred within 2 weeks of the patients receiving CAR T cells.
“The first of these patients had a prior history of cardiac disease, while the second patient died due to complications associated with persistent seizure activity,” said Renier Brentjens, MD, PhD, of Memorial Sloan-Kettering in New York.
“As a matter of routine review at Sloan-Kettering for adverse events on-study, our center made the decision to pause enrollment and review these 2 patients in greater detail.”
“And as a consequence of this review, we’ve amended the enrollment criteria in regards to comorbidities, thereby excluding patients with cardiac disease, and adjusted the T-cell dose based on the extent of disease, [in the] hope that this modification will reduce the cytokine release syndrome that these patients with morphological disease have experienced.”
The researchers expect the trial to resume enrollment soon.
Some results from this study were recently published in Science Translational Medicine, and Dr Brentjens presented the latest results at the AACR Annual Meeting 2014 in San Diego (abstract CT102*).
Thus far, the researchers have enrolled 22 adult patients who had relapsed or refractory B-ALL, were minimal residual disease-positive, or were in the first complete remission (CR1) at enrollment. Patients in CR1 were monitored and only received CAR T cells if they relapsed.
The remaining patients received re-induction chemotherapy (physician’s choice), followed by CAR T-cell infusion. After treatment, the options were allogeneic transplant, a different salvage therapy, or monitoring.
In all, 20 patients received a CAR T-cell dose of 3 x 10⁶ T cells/kg. Eighty-two percent of patients initially achieved a CR, and 72% had a morphologic CR. The average time to CR was about 24.5 days.
Twelve of the responders were eligible for transplant. Of the 8 patients who ultimately underwent transplant and survived, 1 relapsed, but the rest remain in remission.
Dr Brentjens noted that some patients developed cytokine release syndrome, and this was related to the amount of disease present at the time of CAR T-cell infusion.
“Those patients that had only minimal residual disease at the time of CAR T-cell infusion . . . less than 5% blasts, generally had either no fever or very transient, low-grade fever,” he said.
“In contrast, all those patients that had morphologic residual disease at the time of CAR T-cell infusion demonstrated a high, persistent spike in fevers . . . , became hypotensive, and required transfer—for additional, closer monitoring—to our ICU.”
The researchers initially treated these patients with high-dose steroids, which reduced cytokine levels in the serum and ameliorated fevers. But it also rapidly reduced T-cell populations to undetectable levels.
Fortunately, another group of researchers subsequently discovered that the monoclonal antibody tocilizumab can treat cytokine release syndrome without inducing this side effect. So Dr Brentjens and his colleagues began using this drug and found it both safe and effective. ![]()
*Information in the abstract differs from that presented at the meeting.
New insight into TPO and platelet production

Credit: Walter and Eliza Hall
Institute of Medical Research
Investigators say they’ve determined how thrombopoietin (TPO) stimulates platelet production, and their findings may have implications for myeloproliferative neoplasms.
Researchers have long known that TPO is responsible for signaling cells in the bone marrow to produce platelets, but precisely which cells respond to TPO’s signals has been unclear.
Now, a group of investigators studying the TPO receptor Mpl have pinpointed those cells and made an unexpected discovery.
“Thrombopoietin did not directly stimulate the platelet’s ‘parent’ cells—the megakaryocytes—to make more platelets,” said study author Ashley Ng, PhD, of the Walter and Eliza Hall Institute of Medical Research in Victoria, Australia.
“Thrombopoietin signals actually acted on stem cells and progenitor cells, several generations back.”
Dr Ng and his colleagues reported these findings in PNAS.
The researchers had generated mice that express the Mpl receptor normally on stem and progenitor cells but lack expression on megakaryocytes and platelets. And these mice exhibited “profound” megakaryocytosis and thrombocytosis, as well as “remarkable” expansion of megakaryocyte-committed and multipotent progenitor cells.
“The progenitor and stem cells in the bone marrow began massively expanding and effectively turned the bone marrow into a megakaryocyte-making machine,” Dr Ng said.
Furthermore, although the progenitor cells showed signs of chronic TPO overstimulation, TPO levels were normal. This suggests that stem and progenitor cells expressing Mpl were responsible for TPO clearance, according to the investigators.
“Our findings support a theory whereby megakaryocytes and platelets control platelet numbers by ‘mopping up’ excess amounts of thrombopoietin in the bone marrow,” Dr Ng said. “In fact, we show this ‘mopping up’ action is absolutely essential in preventing blood disease where too many megakaryocytes and platelets are produced.”
So the researchers believe these findings will have implications for myeloproliferative neoplasms, particularly essential thrombocythemia.
“[P]revious studies have shown megakaryocytes and platelets in people with essential thrombocythemia have fewer Mpl receptors, which fits our model for excessive platelet production,” Dr Ng said.
To add support to their model, the investigators compared the progenitor cells responsible for overproducing megakaryocytes in their model to progenitor cells from patients with essential thrombocythemia. Both sets of cells showed a TPO stimulation signature.
“We think this study now provides a comprehensive model of how thrombopoietin controls platelet production,” Dr Ng said, “and perhaps gives some insight into the biology and mechanism behind specific myeloproliferative disorders.” ![]()
Team creates 3D model of malaria parasite genome

a red blood cell; Credit: St Jude
Children’s Research Hospital
Scientists have generated a 3D model of the human malaria parasite genome at 3 different stages in the parasite’s life cycle, according to a report in Genome Research.
The team said this model of Plasmodium falciparum is the first to be generated during the progression of a parasite’s life cycle.
“We successfully mapped all physical interactions between genetic elements in the parasite nucleus,” said study author Karine Le Roch, PhD, of the University of California, Riverside.
“To do so, we used a chromosome conformation capture method, followed by high-throughput sequencing technology—a recently developed methodology to analyze the organization of chromosomes in the natural state of the cell. We then used the maps of all physical interactions to generate a 3D model of the genome for each stage of the parasite life cycle analyzed.”
The model revealed that genes that need to be highly expressed in the malaria parasite—for example, genes involved in translation—tend to cluster in the same area of the cell nucleus, while genes that need to be tightly repressed—for example, genes involved in virulence—are found elsewhere in the 3D structure in a “repression center.”
The 3D structure had one major repression center. And the researchers found that virulence genes, which are all organized into that one repression center in a distinct area in the nucleus, seem to drive the full genome organization of the parasite.
“If we understand how the malaria parasite genome is organized in the nucleus and which components control this organization, we may be able to disrupt this architecture and disrupt, too, the parasite development,” Dr Le Roch said.
“We know that the genome architecture is critical in regulating gene expression and, more important, in regulating genes that are critical for parasite virulence. Now, we can more carefully search for components or drugs that can disrupt this organization, helping in the identification of new antimalaria strategies.”
Dr Le Roch’s lab is now looking at other stages of the malaria life cycle in order to identify components responsible for the 3D genome architecture.
“The importance of the genome architecture was initially thought to be critical for only higher eukaryotes,” she explained. “But we found, to our surprise, that the genome architecture is closely linked to virulence, even in the case of the malaria parasite.” ![]()
Good or bad, immune responses to cancer are similar

Credit: Aaron Logan
SAN DIEGO—Researchers have found evidence to suggest there may be little difference between an immune response that kills cancer cells and one that stimulates tumor growth.
The team set out to determine whether the immune responses that mediate cancer immunosurveillance and those responsible for inflammatory facilitation are qualitatively or quantitatively distinct.
They tested antibodies in mouse models of a few different cancers, including rituximab in Burkitt lymphoma.
And they found that lower antibody concentrations stimulated tumor growth, while higher concentrations inhibited growth, and the dose range was “surprisingly narrow.”
The researchers reported these findings in a paper published in PNAS and a poster presentation at the AACR Annual Meeting 2014 (abstract 1063).
“We have found that the intensity difference between an immune response that stimulates cancer and one that kills it may not be very much,” said principal investigator Ajit Varki, MD, of the University of California, San Diego School of Medicine.
“This may come as a surprise to researchers exploring two areas typically considered distinct: the role of the immune system in preventing and killing cancers and the role of chronic inflammation in stimulating cancers. As always, it turns out that the immune system is a double-edged sword.”
The concept of naturally occurring immunosurveillance against malignancies is not new, and there is compelling evidence for it. But understanding this process is confounded by the fact that some types of immune reaction promote tumor development.
Dr Varki and his colleagues looked specifically at a non-human sialic acid sugar molecule called Neu5Gc. Previous research showed that Neu5Gc accumulates in human tumors from dietary sources, despite an ongoing antibody response against it.
The researchers deployed antibodies against Neu5Gc in a mouse tumor model to determine whether and to what degree the antibodies altered tumor progression. The team found that low antibody doses stimulated growth, but high doses inhibited it.
The effect occurred over a “linear and remarkably narrow range,” according to Dr Varki, generating an immune response curve or “inverse hormesis.” Moreover, this curve could be shifted to the left or right simply by modifying the quality of the immune response.
The researchers uncovered similar findings in experiments with mouse models of colon and lung cancer, as well as when they used rituximab in a model of Burkitt lymphoma.
Dr Varki said these results could have implications for all aspects of cancer research. The immune response can have multiple roles in the genesis of cancers, in altering the progress of established tumors and in anticancer therapies that use antibodies as drugs.
Dr Varki is a co-founder of the company Sialix, Inc., which has licensed UC San Diego technologies related to anti-Neu5Gc antibodies in cancer. ![]()
How autophagy helps cancer cells evade death

Credit: Sarah Pfau
SAN DIEGO—New research suggests that autophagy may allow cancer cells to recover and divide, rather than die, when faced with chemotherapy.
“What we showed is that if this mechanism doesn’t work right—for example, if autophagy is too high or if the target regulated by autophagy isn’t around—cancer cells may be able to rescue themselves from death caused by chemotherapies,” said study author Andrew Thorburn, PhD, of the University of Colorado Denver.
He and his colleagues believe this finding has important implications. It demonstrates a mechanism whereby autophagy controls cell death, and it further reinforces the clinical potential of inhibiting autophagy to sensitize cancer cells to chemotherapy.
Dr Thorburn and his colleagues recounted their research in Cell Reports and presented it in an education session at the AACR Annual Meeting 2014.
The researchers had set out to examine how autophagy affects canonical death receptor-induced mitochondrial outer membrane permeabilization (MOMP) and apoptosis. They found that MOMP occurs at variable times in cells, and it’s delayed by autophagy.
Furthermore, autophagy leads to inefficient MOMP. This causes some cells to die via a slower process than typical apoptosis, which allows them to eventually recover and divide.
Specifically, the researchers found that, as a cancer cell begins to die, mitochondrial cell walls break down. And the cell’s mitochondria release proteins via MOMP.
But then, high autophagy allows the cell to encapsulate and “digest” these released proteins before MOMP can keep the cell well and truly dead. The cell recovers and goes on to divide.
“The implication here is that if you inhibit autophagy, you’d make this less likely to happen; ie, when you kill cancer cells, they would stay dead,” Dr Thorburn said.
He and his colleagues also found that autophagy depends on the target PUMA to regulate cell death. When PUMA is absent, it doesn’t matter if autophagy is inhibited. Without the communicating action of PUMA, cancer cells evade apoptosis and continue to survive.
The researchers said this suggests autophagy can control apoptosis via a regulator that makes MOMP faster and more efficient, thus ensuring the rapid completion of apoptosis.
“Autophagy is complex and, as yet, not fully understood,” Dr Thorburn said. “But now that we see a molecular mechanism whereby cell fate can be determined by autophagy, we hope to discover patient populations that could benefit from drugs that inhibit this action.” ![]()
Clinical Deterioration Alerts
Patients deemed suitable for care on a general hospital unit are not expected to deteriorate; however, triage systems are not perfect, and some patients on general nursing units do develop critical illness during their hospitalization. Fortunately, there is mounting evidence that deteriorating patients exhibit measurable pathologic changes that could possibly be used to identify them prior to significant adverse outcomes, such as cardiac arrest.[1, 2, 3] Given the evidence that unplanned intensive care unit (ICU) transfers of patients on general units result in worse outcomes than more controlled ICU admissions,[1, 4, 5, 6] it is logical to assume that earlier identification of a deteriorating patient could provide a window of opportunity to prevent adverse outcomes.
The most commonly proposed systematic solution to the problem of identifying and stabilizing deteriorating patients on general hospital units includes some combination of an early warning system (EWS) to detect the deterioration and a rapid response team (RRT) to deal with it.[7, 8, 9, 10] We previously demonstrated that a relatively simple hospital‐specific method for generating EWS alerts derived from the electronic medical record (EMR) database is capable of predicting clinical deterioration and the need for ICU transfer, as well as hospital mortality, in non‐ICU patients admitted to general inpatient medicine units.[11, 12, 13, 14] However, our data also showed that simply providing the EWS alerts to these nursing units did not result in any demonstrable improvement in patient outcomes.[14] Therefore, we set out to determine whether linking real‐time EWS alerts to an intervention and notification of the RRT for patient evaluation could improve the outcomes of patients cared for on general inpatient units.
METHODS
Study Location
The study was conducted on 8 adult inpatient medicine units of Barnes‐Jewish Hospital, a 1250‐bed academic medical center in St. Louis, MO (January 15, 2013May 9, 2013). Patient care on the inpatient medicine units is delivered by either attending hospitalist physicians or dedicated housestaff physicians under the supervision of an attending physician. Continuous electronic vital sign monitoring is not provided on these units. The study was approved by the Washington University School of Medicine Human Studies Committee, and informed consent was waived. This was a nonblinded study (
Patients and Procedures
Patients admitted to the 8 medicine units received usual care during the study except as noted below. Manually obtained vital signs, laboratory data, and pharmacy data inputted in real time into the EMR were continuously assessed. The EWS searched for the 36 input variables previously described[11, 14] from the EMR for all patients admitted to the 8 medicine units 24 hours per day and 7 days a week. Values for every continuous parameter were scaled so that all measurements lay in the interval (0, 1) and were normalized by the minimum and maximum of the parameter as previously described.[14] To capture the temporal effects in our data, we retained a sliding window of all the collected data points within the last 24 hours. We then subdivided these data into a series of 6 sequential buckets of 4 hours each. We excluded the 2 hours of data prior to ICU transfer in building the model (so the data were 26 hours to 2 hours prior to ICU transfer for ICU transfer patients, and the first 24 hours of admission for everyone else). Eligible patients were selected for study entry when they triggered an alert for clinical deterioration as determined by the EWS.[11, 14]
The EWS alert was implemented in an internally developed, Java‐based clinical decision support rules engine, which identified when new data relevant to the model were available in a real‐time central data repository. In a clinical application, it is important to capture unusual changes in vital‐sign data over time. Such changes may precede clinical deterioration by hours, providing a chance to intervene if detected early enough. In addition, not all readings in time‐series data should be treated equally; the value of some kinds of data may change depending on their age. For example, a patient's condition may be better reflected by a blood‐oxygenation reading collected 1 hour ago than a reading collected 12 hours ago. This is the rationale for our use of a sliding window of all collected data points within the last 24 hours performed on a real‐time basis to determine the alert status of the patient.[11, 14]
We applied various threshold cut points to convert the EWS alert predictions into binary values and compared the results against the actual ICU transfer outcome.[14] A threshold of 0.9760 for specificity was chosen to achieve a sensitivity of approximately 40%. These operating characteristics were chosen in turn to generate a manageable number of alerts per hospital nursing unit per day (estimated at 12 per nursing unit per day). At this cut point, the C statistic was 0.8834, with an overall accuracy of 0.9292. In other words, our EWS alert system is calibrated so that for every 1000 patient discharges per year from these 8 hospital units, there would be 75 patients generating an alert, of which 30 patients would be expected to have the study outcome (ie, clinical deterioration requiring ICU transfer).
Once patients on the study units were identified as at risk for clinical deterioration by the EWS, they were assigned by a computerized random number generator to the intervention group or the control group. The control group was managed according to the usual care provided on the medicine units. The EWS alerts generated for the control patients were electronically stored, but these alerts were not sent to the RRT nurse, instead they were hidden from all clinical staff. The intervention group had their EWS alerts sent real time to the nursing member of the hospital's RRT. The RRT is composed of a registered nurse, a second‐ or third‐year internal medicine resident, and a respiratory therapist. The RRT was introduced in 2009 for the study units involved in this investigation. For 2009, 2010, and 2011 the RRT nurse was pulled from the staff of 1 of the hospital's ICUs in a rotating manner to respond to calls to the RRT as they occurred. Starting in 2012, the RRT nurse was established as a dedicated position without other clinical responsibilities. The RRT nurse carries a hospital‐issued mobile phone, to which the automated alert messages were sent real time, and was instructed to respond to all EWS alerts within 20 minutes of their receipt.
The RRT nurse would initially evaluate the alerted intervention patients using the Modified Early Warning Score[15, 16] and make further clinical and triage decisions based on those criteria and discussions with the RRT physician or the patient's treating physicians. The RRT focused their interventions using an internally developed tool called the Four Ds (discuss goals of care, drugs needing to be administered, diagnostics needing to be performed, and damage control with the use of oxygen, intravenous fluids, ventilation, and blood products). Patients evaluated by the RRT could have their current level of care maintained, have the frequency of vital sign monitoring increased, be transferred to an ICU, or have a code blue called for emergent resuscitation. The RRT reviewed goals of care for all patients to determine the appropriateness of interventions, especially for patients near the end of life who did not desire intensive care interventions. Nursing staff on the hospital units could also make calls to the RRT for patient evaluation at any time based on their clinical assessments performed during routine nursing rounds.
The primary efficacy outcome was the need for ICU transfer. Secondary outcome measures were hospital mortality and hospital length of stay. Pertinent demographic, laboratory, and clinical data were gathered prospectively including age, gender, race, underlying comorbidities, and severity of illness assessed by the Charlson comorbidity score and Elixhauser comorbidities.[17, 18]
Statistical Analysis
We required a sample size of 514 patients (257 per group) to achieve 80% power at a 5% significance level, based on the superiority design, a baseline event rate for ICU transfer of 20.0%, and an absolute reduction of 8.0% (PS Power and Sample Size Calculations, version 3.0, Vanderbilt Biostatistics, Nashville, TN). Continuous variables were reported as means with standard deviations or medians with 25th and 75th percentiles according to their distribution. The Student t test was used when comparing normally distributed data, and the Mann‐Whitney U test was employed to analyze non‐normally distributed data (eg, hospital length of stay). Categorical data were expressed as frequency distributions, and the [2] test was used to determine if differences existed between groups. A P value <0.05 was regarded as statistically significant. An interim analysis was planned for the data safety monitoring board to evaluate patient safety after 50% of the patients were recruited. The primary analysis was by intention to treat. Analyses were performed using SPSS version 11.0 for Windows (SPSS, Inc., Chicago, IL).
Data Safety Monitoring Board
An independent data safety and monitoring board was convened to monitor the study and to review and approve protocol amendments by the steering committee.
RESULTS
Between January 15, 2013 and May 9, 2013, there were 4731 consecutive patients admitted to the 8 inpatient units and electronically screened as the base population for this investigation. Five hundred seventy‐one (12.1%) patients triggered an alert and were enrolled into the study (Figure 1). There were 286 patients assigned to the intervention group and 285 assigned to the control group. No patients were lost to follow‐up. Demographics, reason for hospital admission, and comorbidities of the 2 groups were similar (Table 1). The number of patients having a separate RRT call by the primary nursing team on the hospital units within 24 hours of generating an alert was greater for the intervention group but did not reach statistical significance (19.9% vs 16.5%; odds ratio: 1.260; 95% confidence interval [CI]: 0.8231.931). Table 2 provides the new diagnostic and therapeutic interventions initiated within 24 hours after a EWS alert was generated. Patients in the intervention group were significantly more likely to have their primary care team physician notified by an RRT nurse regarding medical condition issues and to have oximetry and telemetry started, whereas control patients were significantly more likely to have new antibiotic orders written within 24 hours of generating an alert.

| Variable | Intervention Group, n=286 | Control Group, n=285 | P Value |
|---|---|---|---|
| Age, y | 63.7 16.0 | 63.1 15.4 | 0.495 |
| Gender, n (%) | |||
| Male | 132 (46.2) | 140 (49.1) | 0.503 |
| Female | 154 (53.8) | 145 (50.9) | |
| Race, n (%) | |||
| Caucasian | 155 (54.2) | 154 (54.0) | 0.417 |
| African American | 105 (36.7) | 113 (39.6) | |
| Other | 26 (9.1) | 18 (6.3) | |
| Reason for hospital admission | |||
| Cardiac | 12 (4.2) | 15 (5.3) | 0.548 |
| Pulmonary | 64 (22.4) | 72 (25.3) | 0.418 |
| Underlying malignancy | 6 (2.1) | 3 (1.1) | 0.504 |
| Renal disease | 31 (10.8) | 22 (7.7) | 0.248 |
| Thromboembolism | 4 (1.4) | 5 (1.8) | 0.752 |
| Infection | 55 (19.2) | 50 (17.5) | 0.603 |
| Neurologic disease | 33 (11.5) | 22 (7.7) | 0.122 |
| Intra‐abdominal disease | 41 (14.3) | 47 (16.5) | 0.476 |
| Hematologic condition | 4 (1.4) | 5 (1.8) | 0.752 |
| Endocrine disorder | 12 (4.2) | 6 (2.1) | 0.153 |
| Source of hospital admission | |||
| Emergency department | 201 (70.3) | 203 (71.2) | 0.200 |
| Direct admission | 36 (12.6) | 46 (16.1) | |
| Hospital transfer | 49 (17.1) | 36 (12.6) | |
| Charlson score | 6.7 3.6 | 6.6 3.2 | 0.879 |
| Elixhauser comorbidities score | 7.4 3.5 | 7.5 3.4 | 0.839 |
| Variable | Intervention Group, n=286 | Control Group, n=285 | P Value |
|---|---|---|---|
| |||
| Medications, n (%) | |||
| Antibiotics | 92 (32.2) | 121 (42.5) | 0.011 |
| Antiarrhythmics | 48 (16.8) | 44 (15.4) | 0.662 |
| Anticoagulants | 83 (29.0) | 97 (34.0) | 0.197 |
| Diuretics/antihypertensives | 71 (24.8) | 55 (19.3) | 0.111 |
| Bronchodilators | 78 (27.3) | 73 (25.6) | 0.653 |
| Anticonvulsives | 26 (9.1) | 27 (9.5) | 0.875 |
| Sedatives/narcotics | 0 (0.0) | 1 (0.4) | 0.499 |
| Respiratory support, n (%) | |||
| Noninvasive ventilation | 17 (6.0) | 9 (3.1) | 0.106 |
| Escalated oxygen support | 12 (4.2) | 7 (2.5) | 0.247 |
| Enhanced vital signs, n (%) | 50 (17.5) | 47 (16.5) | 0.752 |
| Maintenance intravenous fluids, n (%) | 48 (16.8) | 41 (14.4) | 0.430 |
| Vasopressors, n (%) | 57 (19.9) | 61 (21.4) | 0.664 |
| Bolus intravenous fluids, n (%) | 7 (2.4) | 14 (4.9) | 0.118 |
| Telemetry, n (%) | 198 (69.2) | 176 (61.8) | 0.052 |
| Oximetry, n (%) | 20 (7.0) | 6 (2.1) | 0.005 |
| New intravenous access, n (%) | 26 (9.1) | 35 (12.3) | 0.217 |
| Primary care team physician called by RRT nurse, n (%) | 82 (28.7) | 56 (19.6) | 0.012 |
Fifty‐one patients (17.8%) randomly assigned to the intervention group required ICU transfer compared with 52 of 285 patients (18.2%) in the control group (odds ratio: 0.972; 95% CI: 0.6351.490; P=0.898) (Table 3). Twenty‐one patients (7.3%) randomly assigned to the intervention group expired during their hospitalization compared with 22 of 285 patients (7.7%) in the control group (odds ratio: 0.947; 95%CI: 0.5091.764; P=0.865). Hospital length of stay was 8.49.5 days (median, 4.5 days; interquartile range, 2.311.4 days) for patients randomized to the intervention group and 9.411.1 days (median, 5.3 days; interquartile range, 3.211.2 days) for patients randomized to the control group (P=0.038). The ICU length of stay was 4.86.6 days (median, 2.9 days; interquartile range, 1.76.5 days) for patients randomized to the intervention group and 5.86.4 days (median, 2.9 days; interquartile range, 1.57.4) for patients randomized to the control group (P=0.812).The number of patients requiring transfer to a nursing home or long‐term acute care hospital was similar for patients in the intervention and control groups (26.9% vs 26.3%; odds ratio: 1.032; 95% CI: 0.7121.495; P=0.870). Similarly, the number of patients requiring hospital readmission before 30 days and 180 days, respectively, was similar for the 2 treatment groups (Table 3). For the combined study population, the EWS alerts were triggered 94138 hours (median, 27 hours; interquartile range, 7132 hours) prior to ICU transfer and 250204 hours (median200 hours; interquartile range, 54347 hours) prior to hospital mortality. The number of RRT calls for the 8 medicine units studied progressively increased from the start of the RRT program in 2009 through 2013 (121 in 2009, 194 in 2010, 298 in 2011, 415 in 2012, 415 in 2013; P<0.001 for the trend).
| Outcome | Intervention Group, n=286 | Control Group, n=285 | P Value |
|---|---|---|---|
| |||
| ICU transfer, n (%) | 51 (17.8) | 52 (18.2) | 0.898 |
| All‐cause hospital mortality, n (%) | 21 (7.3) | 22 (7.7) | 0.865 |
| Transfer to nursing home or LTAC, n (%) | 77 (26.9) | 75 (26.3) | 0.870 |
| 30‐day readmission, n (%) | 53 (18.5) | 62 (21.8) | 0.337 |
| 180‐day readmission, n (%) | 124 (43.4) | 117 (41.1) | 0.577 |
| Hospital length of stay, d* | 8.49.5, 4.5 [2.311.4] | 9.411.1, 5.3 [3.211.2] | 0.038 |
| ICU length of stay, d* | 4.86.6, 2.9 [1.76.5] | 5.86.4, 2.9 [1.57.4] | 0.812 |
DISCUSSION
We demonstrated that a real‐time EWS alert sent to a RRT nurse was associated with a modest reduction in hospital length of stay, but similar rates of hospital mortality, ICU transfer, and subsequent need for placement in a long‐term care setting compared with usual care. We also found the number of RRT calls to have increased progressively from 2009 to the present on the study units examined.
Unplanned ICU transfers occurring as early as within 8 hours of hospitalization are relatively common and associated with increased mortality.[6] Bapoje et al. evaluated a total of 152 patients over 1 year who had unplanned ICU transfers.[19] The most common reason was worsening of the problem for which the patient was admitted (48%). Other investigators have also attempted to identify predictors for clinical deterioration resulting in unplanned ICU transfer that could be employed in an EWS.[20, 21] Organizations like the Institute for Healthcare Improvement have called for the development and routine implementation of EWSs to direct the activities of RRTs and improve outcomes.[22] However, a recent systematic review found that much of the evidence in support of EWSs and emergency response teams is of poor quality and lacking prospective randomized trials.[23]
Our earlier experience demonstrated that simply providing an alert to nursing units did not result in any demonstrable improvements in the outcomes of high‐risk patients identified by our EWS.[14] Previous investigations have also had difficulty in demonstrating consistent outcome improvements with the use of EWSs and RRTs.[24, 25, 26, 27, 28, 29, 30, 31, 32] As a result of mandates from quality improvement organizations, most US hospitals currently employ RRTs for emergent mobilization of resources when a clinically deteriorating patient is identified on a hospital ward.[33, 34] Linking RRT actions with a validated real‐time alert may represent a way of improving the overall effectiveness of such teams for monitoring general hospital units, short of having all hospitalized patients in units staffed and monitored to provide higher levels of supervision (eg, ICUs, step‐down units).[9, 35]
An alternative approach to preventing patient deterioration is to provide closer overall monitoring. This has been accomplished by employing nursing personnel to increase monitoring, or with the use of automated monitoring equipment. Bellomo et al. showed that the deployment of electronic automated vital sign monitors on general hospital units was associated with improved utilization of RRTs, increased patient survival, and decreased time for vital sign measurement and recording.[36] Laurens and Dwyer found that implementation of medical emergency teams (METs) to respond to predefined MET activation criteria as observed by hospital staff resulted in reduced hospital mortality and reduced need for ICU transfer.[37] However, other investigators have observed that imperfect implementation of nursing‐performed observational monitoring resulted in no demonstrable benefit, illustrating the limitations of this approach.[38] Our findings suggest that nursing care of patients on general hospital units may be enhanced with the use of an EWS alert sent to the RRT. This is supported by the observation that communications between the RRT and the primary care teams was greater as was the use of telemetry and oximetry in the intervention arm. Moreover, there appears to have been a learning effect for the nursing staff that occurred on our study units, as evidenced by the increased number of RRT calls that occurred between 2009 and 2013. This change in nursing practices on these units certainly made it more difficult for us to observe outcome differences in our current study with the prescribed intervention, reinforcing the notion that evaluating an already established practice is a difficult proposition.[39]
Our study has several important limitations. First, the EWS alert was developed and validated at Barnes‐Jewish Hospital.[11, 12, 13, 14] We cannot say whether this alert will perform similarly in another hospital. Second, the EWS alert only contains data from medical patients. Development and validation of EWS alerts for other hospitalized populations, including surgical and pediatric patients, are needed to make such systems more generalizable. Third, the primary clinical outcome employed for this trial was problematic. Transfer to an ICU may not be an optimal outcome variable, as it may be desirable to transfer alerted patients to an ICU, which can be perceived to represent a soft landing for such patients once an alert has been generated. A better measure could be 30‐day all‐cause mortality, which would not be subject to clinician biases. Finally, we could not specifically identify explanations for the greater use of antibiotics in the control group despite similar rates of infection for both study arms. Future studies should closely evaluate the ability of EWS alerts to alter specific therapies (eg, reduce antibiotic utilization).
In summary, we have demonstrated that an EWS alert linked to a RRT likely contributed to a modest reduction in hospital length of stay, but no reductions in hospital mortality and ICU transfer. These findings suggest that inpatient deterioration on general hospital units can be identified and linked to a specific intervention. Continued efforts are needed to identify and implement systems that will not only accurately identify high‐risk patients on general hospital units but also intervene to improve their outcomes. We are moving forward with the development of a 2‐tiered EWS utilizing both EMR data and real‐time streamed vital sign data, to determine if we can further improve the prediction of clinical deterioration and potentially intervene in a more clinically meaningful manner.
Acknowledgements
The authors thank Ann Doyle, BSN, Lisa Mayfield, BSN, and Darain Mitchell for their assistance in carrying out this research protocol; and William Shannon, PhD, from the Division of General Medical Sciences at Washington University, for statistical support.
Disclosures: This study was funded in part by the Barnes‐Jewish Hospital Foundation, the Chest Foundation of the American College of Chest Physicians, and by grant number UL1 RR024992 from the National Center for Research Resources (NCRR), a component of the National Institutes of Health (NIH), and NIH Roadmap for Medical Research. Its contents are solely the responsibility of the authors and do not necessarily represent the official view of the NCRR or NIH. The steering committee was responsible for the study design, execution, analysis, and content of the article. The Barnes‐Jewish Hospital Foundation, the American College of Chest Physicians, and the Chest Foundation were not involved in the design, conduct, or analysis of the trial. The authors report no conflicts of interest. Marin Kollef, Yixin Chen, Kevin Heard, Gina LaRossa, Chenyang Lu, Nathan Martin, Nelda Martin, Scott Micek, and Thomas Bailey have all made substantial contributions to conception and design, or acquisition of data, or analysis and interpretation of data; have drafted the submitted article or revised it critically for important intellectual content; have provided final approval of the version to be published; and have agreed to be accountable for all aspects of the work in ensuring that questions related to the accuracy or integrity of any part of the work are appropriately investigated and resolved.
- , , , et al. Duration of life‐threatening antecedents prior to intensive care admission. Intensive Care Med. 2002;28(11):1629–1634.
- , , , et al. A comparison of antecedents to cardiac arrests, deaths and emergency intensive care admissions in Australia and New Zealand, and the United Kingdom—the ACADEMIA study. Resuscitation. 2004;62(3):275–282.
- , , . Abnormal vital signs are associated with an increased risk for critical events in US veteran inpatients. Resuscitation. 2009;80(11):1264–1269.
- , , , et al. Septic shock: an analysis of outcomes for patients with onset on hospital wards versus intensive care units. Crit Care Med. 1998;26(6):1020–1024.
- , , , , . Inpatient transfers to the intensive care unit: delays are associated with increased mortality and morbidity. J Gen Intern Med. 2003;18(2):77–83.
- , , , . Adverse outcomes associated with delayed intensive care unit transfers in an integrated healthcare system. J Hosp Med. 2012;7(3):224–230.
- , , , et al. Findings of the first consensus conference on medical emergency teams. Crit Care Med. 2006;34(9):2463–2478.
- , , , et al. “Identifying the hospitalised patient in crisis”—a consensus conference on the afferent limb of rapid response systems. Resuscitation. 2010;81(4):375–382.
- , , . Rapid‐response teams. N Engl J Med. 2011;365(2):139–146.
- , , , , . Acute care teams: a systematic review and meta‐analysis. Arch Intern Med. 2010;170(1):18–26.
- , , , et al. Toward a two‐tier clinical warning system for hospitalized patients. AMIA Annu Symp Proc. 2011;2011:511–519.
- , , , , , . Early prediction of septic shock in hospitalized patients. J Hosp Med. 2010;5(1):19–25.
- , , , et al. Implementation of a real‐time computerized sepsis alert in nonintensive care unit patients. Crit Care Med. 2011;39(3):469–473.
- , , , et al. A trial of a real‐time Alert for clinical deterioration in Patients hospitalized on general medical wards. J Hosp Med. 2013;8(5):236–242.
- , , , , . Prospective evaluation of a modified Early Warning Score to aid earlier detection of patients developing critical illness on a general surgical ward. Br J Anaesth. 2000;84:663P.
- , , , . Validation of a modified Early Warning Score in medical admissions. QJM. 2001;94(10):521–526.
- , , . Adapting a clinical comorbidity index for use with ICD‐9‐CM administrative databases. J Clin Epidemiol. 1992;45(6):613–619.
- , , , . Comorbidity measures for use with administrative data. Med Care. 1998;36(1):8–27.
- , , , . Unplanned transfers to a medical intensive care unit: causes and relationship to preventable errors in care. J Hosp Med. 2011;6(2):68–72.
- , , , , , . Unplanned transfers to the intensive care unit: the role of the shock index. J Hosp Med. 2010;5(8):460–465.
- , , , , , . Early detection of impending physiologic deterioration among patients who are not in intensive care: development of predictive models using data from an automated electronic medical record. J Hosp Med. 2012;7(5):388–395.
- Institute for Healthcare Improvement. Early warning systems: the next level of rapid response; 2011. Available at: http://www.ihi.org/Engage/Memberships/MentorHospitalRegistry/Pages/RapidResponseSystems.aspx. Accessed April 6, 2011.
- , . Do either early warning systems or emergency response teams improve hospital patient survival? A systematic review. Resuscitation. 2013;84(12):1652–1667.
- , , , et al. Introducing critical care outreach: a ward‐randomised trial of phased introduction in a general hospital. Intensive Care Med. 2004;30(7):1398–1404.
- . Out of our reach? Assessing the impact of introducing critical care outreach service. Anaesthesiology. 2003;58(9):882–885.
- , , . Effect of the critical care outreach team on patient survival to discharge from hospital and readmission to critical care: non‐randomised population based study. BMJ. 2003;327(7422):1014.
- , , . Reducing mortality and avoiding preventable ICU utilization: analysis of a successful rapid response program using APR DRGs. J Healthc Qual. 2011;33(5):7–16.
- , , , et al. Introduction of the medical emergency team (MET) system: a cluster‐randomised control trial. Lancet. 2005;365(9477):2091–2097.
- , , , , , . The impact of the introduction of critical care outreach services in England: a multicentre interrupted time‐series analysis. Crit Care. 2007;11(5):R113.
- , , , et al. Systematic review and evaluation of physiological track and trigger warning systems for identifying at‐risk patients on the ward. Intensive Care Med. 2007;33(4):667–679.
- , , , . Timing and teamwork—an observational pilot study of patients referred to a Rapid Response Team with the aim of identifying factors amenable to re‐design of a Rapid Response System. Resuscitation. 2012;83(6):782–787.
- , , , , , . The impact of rapid response team on outcome of patients transferred from the ward to the ICU: a single‐center study. Crit Care Med. 2013;41(10):2284–2291.
- , , , . Rapid response: a quality improvement conundrum. J Hosp Med. 2009;4(4):255–257.
- . Rapid response systems now established at 2,900 hospitals. Hospitalist News. 2010;3:1.
- , , . Early warning systems. Hosp Chron. 2012;7:37–43.
- , , , et al. A controlled trial of electronic automated advisory vital signs monitoring in general hospital wards. Crit Care Med. 2012;40(8):2349–2361.
- , . The impact of medical emergency teams on ICU admission rates, cardiopulmonary arrests and mortality in a regional hospital. Resuscitation. 2011;82(6):707–712.
- , , . Imperfect implementation of an early warning scoring system in a danish teaching hospital: a cross‐sectional study. PLoS One. 2013;8:e70068.
- , . Introduction of medical emergency teams in Australia and New Zealand: A multicentre study. Crit Care. 2008;12(3):151.
Patients deemed suitable for care on a general hospital unit are not expected to deteriorate; however, triage systems are not perfect, and some patients on general nursing units do develop critical illness during their hospitalization. Fortunately, there is mounting evidence that deteriorating patients exhibit measurable pathologic changes that could possibly be used to identify them prior to significant adverse outcomes, such as cardiac arrest.[1, 2, 3] Given the evidence that unplanned intensive care unit (ICU) transfers of patients on general units result in worse outcomes than more controlled ICU admissions,[1, 4, 5, 6] it is logical to assume that earlier identification of a deteriorating patient could provide a window of opportunity to prevent adverse outcomes.
The most commonly proposed systematic solution to the problem of identifying and stabilizing deteriorating patients on general hospital units includes some combination of an early warning system (EWS) to detect the deterioration and a rapid response team (RRT) to deal with it.[7, 8, 9, 10] We previously demonstrated that a relatively simple hospital‐specific method for generating EWS alerts derived from the electronic medical record (EMR) database is capable of predicting clinical deterioration and the need for ICU transfer, as well as hospital mortality, in non‐ICU patients admitted to general inpatient medicine units.[11, 12, 13, 14] However, our data also showed that simply providing the EWS alerts to these nursing units did not result in any demonstrable improvement in patient outcomes.[14] Therefore, we set out to determine whether linking real‐time EWS alerts to an intervention and notification of the RRT for patient evaluation could improve the outcomes of patients cared for on general inpatient units.
METHODS
Study Location
The study was conducted on 8 adult inpatient medicine units of Barnes‐Jewish Hospital, a 1250‐bed academic medical center in St. Louis, MO (January 15, 2013May 9, 2013). Patient care on the inpatient medicine units is delivered by either attending hospitalist physicians or dedicated housestaff physicians under the supervision of an attending physician. Continuous electronic vital sign monitoring is not provided on these units. The study was approved by the Washington University School of Medicine Human Studies Committee, and informed consent was waived. This was a nonblinded study (
Patients and Procedures
Patients admitted to the 8 medicine units received usual care during the study except as noted below. Manually obtained vital signs, laboratory data, and pharmacy data inputted in real time into the EMR were continuously assessed. The EWS searched for the 36 input variables previously described[11, 14] from the EMR for all patients admitted to the 8 medicine units 24 hours per day and 7 days a week. Values for every continuous parameter were scaled so that all measurements lay in the interval (0, 1) and were normalized by the minimum and maximum of the parameter as previously described.[14] To capture the temporal effects in our data, we retained a sliding window of all the collected data points within the last 24 hours. We then subdivided these data into a series of 6 sequential buckets of 4 hours each. We excluded the 2 hours of data prior to ICU transfer in building the model (so the data were 26 hours to 2 hours prior to ICU transfer for ICU transfer patients, and the first 24 hours of admission for everyone else). Eligible patients were selected for study entry when they triggered an alert for clinical deterioration as determined by the EWS.[11, 14]
The EWS alert was implemented in an internally developed, Java‐based clinical decision support rules engine, which identified when new data relevant to the model were available in a real‐time central data repository. In a clinical application, it is important to capture unusual changes in vital‐sign data over time. Such changes may precede clinical deterioration by hours, providing a chance to intervene if detected early enough. In addition, not all readings in time‐series data should be treated equally; the value of some kinds of data may change depending on their age. For example, a patient's condition may be better reflected by a blood‐oxygenation reading collected 1 hour ago than a reading collected 12 hours ago. This is the rationale for our use of a sliding window of all collected data points within the last 24 hours performed on a real‐time basis to determine the alert status of the patient.[11, 14]
We applied various threshold cut points to convert the EWS alert predictions into binary values and compared the results against the actual ICU transfer outcome.[14] A threshold of 0.9760 for specificity was chosen to achieve a sensitivity of approximately 40%. These operating characteristics were chosen in turn to generate a manageable number of alerts per hospital nursing unit per day (estimated at 12 per nursing unit per day). At this cut point, the C statistic was 0.8834, with an overall accuracy of 0.9292. In other words, our EWS alert system is calibrated so that for every 1000 patient discharges per year from these 8 hospital units, there would be 75 patients generating an alert, of which 30 patients would be expected to have the study outcome (ie, clinical deterioration requiring ICU transfer).
Once patients on the study units were identified as at risk for clinical deterioration by the EWS, they were assigned by a computerized random number generator to the intervention group or the control group. The control group was managed according to the usual care provided on the medicine units. The EWS alerts generated for the control patients were electronically stored, but these alerts were not sent to the RRT nurse, instead they were hidden from all clinical staff. The intervention group had their EWS alerts sent real time to the nursing member of the hospital's RRT. The RRT is composed of a registered nurse, a second‐ or third‐year internal medicine resident, and a respiratory therapist. The RRT was introduced in 2009 for the study units involved in this investigation. For 2009, 2010, and 2011 the RRT nurse was pulled from the staff of 1 of the hospital's ICUs in a rotating manner to respond to calls to the RRT as they occurred. Starting in 2012, the RRT nurse was established as a dedicated position without other clinical responsibilities. The RRT nurse carries a hospital‐issued mobile phone, to which the automated alert messages were sent real time, and was instructed to respond to all EWS alerts within 20 minutes of their receipt.
The RRT nurse would initially evaluate the alerted intervention patients using the Modified Early Warning Score[15, 16] and make further clinical and triage decisions based on those criteria and discussions with the RRT physician or the patient's treating physicians. The RRT focused their interventions using an internally developed tool called the Four Ds (discuss goals of care, drugs needing to be administered, diagnostics needing to be performed, and damage control with the use of oxygen, intravenous fluids, ventilation, and blood products). Patients evaluated by the RRT could have their current level of care maintained, have the frequency of vital sign monitoring increased, be transferred to an ICU, or have a code blue called for emergent resuscitation. The RRT reviewed goals of care for all patients to determine the appropriateness of interventions, especially for patients near the end of life who did not desire intensive care interventions. Nursing staff on the hospital units could also make calls to the RRT for patient evaluation at any time based on their clinical assessments performed during routine nursing rounds.
The primary efficacy outcome was the need for ICU transfer. Secondary outcome measures were hospital mortality and hospital length of stay. Pertinent demographic, laboratory, and clinical data were gathered prospectively including age, gender, race, underlying comorbidities, and severity of illness assessed by the Charlson comorbidity score and Elixhauser comorbidities.[17, 18]
Statistical Analysis
We required a sample size of 514 patients (257 per group) to achieve 80% power at a 5% significance level, based on the superiority design, a baseline event rate for ICU transfer of 20.0%, and an absolute reduction of 8.0% (PS Power and Sample Size Calculations, version 3.0, Vanderbilt Biostatistics, Nashville, TN). Continuous variables were reported as means with standard deviations or medians with 25th and 75th percentiles according to their distribution. The Student t test was used when comparing normally distributed data, and the Mann‐Whitney U test was employed to analyze non‐normally distributed data (eg, hospital length of stay). Categorical data were expressed as frequency distributions, and the [2] test was used to determine if differences existed between groups. A P value <0.05 was regarded as statistically significant. An interim analysis was planned for the data safety monitoring board to evaluate patient safety after 50% of the patients were recruited. The primary analysis was by intention to treat. Analyses were performed using SPSS version 11.0 for Windows (SPSS, Inc., Chicago, IL).
Data Safety Monitoring Board
An independent data safety and monitoring board was convened to monitor the study and to review and approve protocol amendments by the steering committee.
RESULTS
Between January 15, 2013 and May 9, 2013, there were 4731 consecutive patients admitted to the 8 inpatient units and electronically screened as the base population for this investigation. Five hundred seventy‐one (12.1%) patients triggered an alert and were enrolled into the study (Figure 1). There were 286 patients assigned to the intervention group and 285 assigned to the control group. No patients were lost to follow‐up. Demographics, reason for hospital admission, and comorbidities of the 2 groups were similar (Table 1). The number of patients having a separate RRT call by the primary nursing team on the hospital units within 24 hours of generating an alert was greater for the intervention group but did not reach statistical significance (19.9% vs 16.5%; odds ratio: 1.260; 95% confidence interval [CI]: 0.8231.931). Table 2 provides the new diagnostic and therapeutic interventions initiated within 24 hours after a EWS alert was generated. Patients in the intervention group were significantly more likely to have their primary care team physician notified by an RRT nurse regarding medical condition issues and to have oximetry and telemetry started, whereas control patients were significantly more likely to have new antibiotic orders written within 24 hours of generating an alert.
| Variable | Intervention Group, n=286 | Control Group, n=285 | P Value |
|---|---|---|---|
| Age, y | 63.7 16.0 | 63.1 15.4 | 0.495 |
| Gender, n (%) | |||
| Male | 132 (46.2) | 140 (49.1) | 0.503 |
| Female | 154 (53.8) | 145 (50.9) | |
| Race, n (%) | |||
| Caucasian | 155 (54.2) | 154 (54.0) | 0.417 |
| African American | 105 (36.7) | 113 (39.6) | |
| Other | 26 (9.1) | 18 (6.3) | |
| Reason for hospital admission | |||
| Cardiac | 12 (4.2) | 15 (5.3) | 0.548 |
| Pulmonary | 64 (22.4) | 72 (25.3) | 0.418 |
| Underlying malignancy | 6 (2.1) | 3 (1.1) | 0.504 |
| Renal disease | 31 (10.8) | 22 (7.7) | 0.248 |
| Thromboembolism | 4 (1.4) | 5 (1.8) | 0.752 |
| Infection | 55 (19.2) | 50 (17.5) | 0.603 |
| Neurologic disease | 33 (11.5) | 22 (7.7) | 0.122 |
| Intra‐abdominal disease | 41 (14.3) | 47 (16.5) | 0.476 |
| Hematologic condition | 4 (1.4) | 5 (1.8) | 0.752 |
| Endocrine disorder | 12 (4.2) | 6 (2.1) | 0.153 |
| Source of hospital admission | |||
| Emergency department | 201 (70.3) | 203 (71.2) | 0.200 |
| Direct admission | 36 (12.6) | 46 (16.1) | |
| Hospital transfer | 49 (17.1) | 36 (12.6) | |
| Charlson score | 6.7 3.6 | 6.6 3.2 | 0.879 |
| Elixhauser comorbidities score | 7.4 3.5 | 7.5 3.4 | 0.839 |
| Variable | Intervention Group, n=286 | Control Group, n=285 | P Value |
|---|---|---|---|
| |||
| Medications, n (%) | |||
| Antibiotics | 92 (32.2) | 121 (42.5) | 0.011 |
| Antiarrhythmics | 48 (16.8) | 44 (15.4) | 0.662 |
| Anticoagulants | 83 (29.0) | 97 (34.0) | 0.197 |
| Diuretics/antihypertensives | 71 (24.8) | 55 (19.3) | 0.111 |
| Bronchodilators | 78 (27.3) | 73 (25.6) | 0.653 |
| Anticonvulsives | 26 (9.1) | 27 (9.5) | 0.875 |
| Sedatives/narcotics | 0 (0.0) | 1 (0.4) | 0.499 |
| Respiratory support, n (%) | |||
| Noninvasive ventilation | 17 (6.0) | 9 (3.1) | 0.106 |
| Escalated oxygen support | 12 (4.2) | 7 (2.5) | 0.247 |
| Enhanced vital signs, n (%) | 50 (17.5) | 47 (16.5) | 0.752 |
| Maintenance intravenous fluids, n (%) | 48 (16.8) | 41 (14.4) | 0.430 |
| Vasopressors, n (%) | 57 (19.9) | 61 (21.4) | 0.664 |
| Bolus intravenous fluids, n (%) | 7 (2.4) | 14 (4.9) | 0.118 |
| Telemetry, n (%) | 198 (69.2) | 176 (61.8) | 0.052 |
| Oximetry, n (%) | 20 (7.0) | 6 (2.1) | 0.005 |
| New intravenous access, n (%) | 26 (9.1) | 35 (12.3) | 0.217 |
| Primary care team physician called by RRT nurse, n (%) | 82 (28.7) | 56 (19.6) | 0.012 |
Fifty‐one patients (17.8%) randomly assigned to the intervention group required ICU transfer compared with 52 of 285 patients (18.2%) in the control group (odds ratio: 0.972; 95% CI: 0.6351.490; P=0.898) (Table 3). Twenty‐one patients (7.3%) randomly assigned to the intervention group expired during their hospitalization compared with 22 of 285 patients (7.7%) in the control group (odds ratio: 0.947; 95%CI: 0.5091.764; P=0.865). Hospital length of stay was 8.49.5 days (median, 4.5 days; interquartile range, 2.311.4 days) for patients randomized to the intervention group and 9.411.1 days (median, 5.3 days; interquartile range, 3.211.2 days) for patients randomized to the control group (P=0.038). The ICU length of stay was 4.86.6 days (median, 2.9 days; interquartile range, 1.76.5 days) for patients randomized to the intervention group and 5.86.4 days (median, 2.9 days; interquartile range, 1.57.4) for patients randomized to the control group (P=0.812).The number of patients requiring transfer to a nursing home or long‐term acute care hospital was similar for patients in the intervention and control groups (26.9% vs 26.3%; odds ratio: 1.032; 95% CI: 0.7121.495; P=0.870). Similarly, the number of patients requiring hospital readmission before 30 days and 180 days, respectively, was similar for the 2 treatment groups (Table 3). For the combined study population, the EWS alerts were triggered 94138 hours (median, 27 hours; interquartile range, 7132 hours) prior to ICU transfer and 250204 hours (median200 hours; interquartile range, 54347 hours) prior to hospital mortality. The number of RRT calls for the 8 medicine units studied progressively increased from the start of the RRT program in 2009 through 2013 (121 in 2009, 194 in 2010, 298 in 2011, 415 in 2012, 415 in 2013; P<0.001 for the trend).
| Outcome | Intervention Group, n=286 | Control Group, n=285 | P Value |
|---|---|---|---|
| |||
| ICU transfer, n (%) | 51 (17.8) | 52 (18.2) | 0.898 |
| All‐cause hospital mortality, n (%) | 21 (7.3) | 22 (7.7) | 0.865 |
| Transfer to nursing home or LTAC, n (%) | 77 (26.9) | 75 (26.3) | 0.870 |
| 30‐day readmission, n (%) | 53 (18.5) | 62 (21.8) | 0.337 |
| 180‐day readmission, n (%) | 124 (43.4) | 117 (41.1) | 0.577 |
| Hospital length of stay, d* | 8.49.5, 4.5 [2.311.4] | 9.411.1, 5.3 [3.211.2] | 0.038 |
| ICU length of stay, d* | 4.86.6, 2.9 [1.76.5] | 5.86.4, 2.9 [1.57.4] | 0.812 |
DISCUSSION
We demonstrated that a real‐time EWS alert sent to a RRT nurse was associated with a modest reduction in hospital length of stay, but similar rates of hospital mortality, ICU transfer, and subsequent need for placement in a long‐term care setting compared with usual care. We also found the number of RRT calls to have increased progressively from 2009 to the present on the study units examined.
Unplanned ICU transfers occurring as early as within 8 hours of hospitalization are relatively common and associated with increased mortality.[6] Bapoje et al. evaluated a total of 152 patients over 1 year who had unplanned ICU transfers.[19] The most common reason was worsening of the problem for which the patient was admitted (48%). Other investigators have also attempted to identify predictors for clinical deterioration resulting in unplanned ICU transfer that could be employed in an EWS.[20, 21] Organizations like the Institute for Healthcare Improvement have called for the development and routine implementation of EWSs to direct the activities of RRTs and improve outcomes.[22] However, a recent systematic review found that much of the evidence in support of EWSs and emergency response teams is of poor quality and lacking prospective randomized trials.[23]
Our earlier experience demonstrated that simply providing an alert to nursing units did not result in any demonstrable improvements in the outcomes of high‐risk patients identified by our EWS.[14] Previous investigations have also had difficulty in demonstrating consistent outcome improvements with the use of EWSs and RRTs.[24, 25, 26, 27, 28, 29, 30, 31, 32] As a result of mandates from quality improvement organizations, most US hospitals currently employ RRTs for emergent mobilization of resources when a clinically deteriorating patient is identified on a hospital ward.[33, 34] Linking RRT actions with a validated real‐time alert may represent a way of improving the overall effectiveness of such teams for monitoring general hospital units, short of having all hospitalized patients in units staffed and monitored to provide higher levels of supervision (eg, ICUs, step‐down units).[9, 35]
An alternative approach to preventing patient deterioration is to provide closer overall monitoring. This has been accomplished by employing nursing personnel to increase monitoring, or with the use of automated monitoring equipment. Bellomo et al. showed that the deployment of electronic automated vital sign monitors on general hospital units was associated with improved utilization of RRTs, increased patient survival, and decreased time for vital sign measurement and recording.[36] Laurens and Dwyer found that implementation of medical emergency teams (METs) to respond to predefined MET activation criteria as observed by hospital staff resulted in reduced hospital mortality and reduced need for ICU transfer.[37] However, other investigators have observed that imperfect implementation of nursing‐performed observational monitoring resulted in no demonstrable benefit, illustrating the limitations of this approach.[38] Our findings suggest that nursing care of patients on general hospital units may be enhanced with the use of an EWS alert sent to the RRT. This is supported by the observation that communications between the RRT and the primary care teams was greater as was the use of telemetry and oximetry in the intervention arm. Moreover, there appears to have been a learning effect for the nursing staff that occurred on our study units, as evidenced by the increased number of RRT calls that occurred between 2009 and 2013. This change in nursing practices on these units certainly made it more difficult for us to observe outcome differences in our current study with the prescribed intervention, reinforcing the notion that evaluating an already established practice is a difficult proposition.[39]
Our study has several important limitations. First, the EWS alert was developed and validated at Barnes‐Jewish Hospital.[11, 12, 13, 14] We cannot say whether this alert will perform similarly in another hospital. Second, the EWS alert only contains data from medical patients. Development and validation of EWS alerts for other hospitalized populations, including surgical and pediatric patients, are needed to make such systems more generalizable. Third, the primary clinical outcome employed for this trial was problematic. Transfer to an ICU may not be an optimal outcome variable, as it may be desirable to transfer alerted patients to an ICU, which can be perceived to represent a soft landing for such patients once an alert has been generated. A better measure could be 30‐day all‐cause mortality, which would not be subject to clinician biases. Finally, we could not specifically identify explanations for the greater use of antibiotics in the control group despite similar rates of infection for both study arms. Future studies should closely evaluate the ability of EWS alerts to alter specific therapies (eg, reduce antibiotic utilization).
In summary, we have demonstrated that an EWS alert linked to a RRT likely contributed to a modest reduction in hospital length of stay, but no reductions in hospital mortality and ICU transfer. These findings suggest that inpatient deterioration on general hospital units can be identified and linked to a specific intervention. Continued efforts are needed to identify and implement systems that will not only accurately identify high‐risk patients on general hospital units but also intervene to improve their outcomes. We are moving forward with the development of a 2‐tiered EWS utilizing both EMR data and real‐time streamed vital sign data, to determine if we can further improve the prediction of clinical deterioration and potentially intervene in a more clinically meaningful manner.
Acknowledgements
The authors thank Ann Doyle, BSN, Lisa Mayfield, BSN, and Darain Mitchell for their assistance in carrying out this research protocol; and William Shannon, PhD, from the Division of General Medical Sciences at Washington University, for statistical support.
Disclosures: This study was funded in part by the Barnes‐Jewish Hospital Foundation, the Chest Foundation of the American College of Chest Physicians, and by grant number UL1 RR024992 from the National Center for Research Resources (NCRR), a component of the National Institutes of Health (NIH), and NIH Roadmap for Medical Research. Its contents are solely the responsibility of the authors and do not necessarily represent the official view of the NCRR or NIH. The steering committee was responsible for the study design, execution, analysis, and content of the article. The Barnes‐Jewish Hospital Foundation, the American College of Chest Physicians, and the Chest Foundation were not involved in the design, conduct, or analysis of the trial. The authors report no conflicts of interest. Marin Kollef, Yixin Chen, Kevin Heard, Gina LaRossa, Chenyang Lu, Nathan Martin, Nelda Martin, Scott Micek, and Thomas Bailey have all made substantial contributions to conception and design, or acquisition of data, or analysis and interpretation of data; have drafted the submitted article or revised it critically for important intellectual content; have provided final approval of the version to be published; and have agreed to be accountable for all aspects of the work in ensuring that questions related to the accuracy or integrity of any part of the work are appropriately investigated and resolved.
- , , , et al. Duration of life‐threatening antecedents prior to intensive care admission. Intensive Care Med. 2002;28(11):1629–1634.
- , , , et al. A comparison of antecedents to cardiac arrests, deaths and emergency intensive care admissions in Australia and New Zealand, and the United Kingdom—the ACADEMIA study. Resuscitation. 2004;62(3):275–282.
- , , . Abnormal vital signs are associated with an increased risk for critical events in US veteran inpatients. Resuscitation. 2009;80(11):1264–1269.
- , , , et al. Septic shock: an analysis of outcomes for patients with onset on hospital wards versus intensive care units. Crit Care Med. 1998;26(6):1020–1024.
- , , , , . Inpatient transfers to the intensive care unit: delays are associated with increased mortality and morbidity. J Gen Intern Med. 2003;18(2):77–83.
- , , , . Adverse outcomes associated with delayed intensive care unit transfers in an integrated healthcare system. J Hosp Med. 2012;7(3):224–230.
- , , , et al. Findings of the first consensus conference on medical emergency teams. Crit Care Med. 2006;34(9):2463–2478.
- , , , et al. “Identifying the hospitalised patient in crisis”—a consensus conference on the afferent limb of rapid response systems. Resuscitation. 2010;81(4):375–382.
- , , . Rapid‐response teams. N Engl J Med. 2011;365(2):139–146.
- , , , , . Acute care teams: a systematic review and meta‐analysis. Arch Intern Med. 2010;170(1):18–26.
- , , , et al. Toward a two‐tier clinical warning system for hospitalized patients. AMIA Annu Symp Proc. 2011;2011:511–519.
- , , , , , . Early prediction of septic shock in hospitalized patients. J Hosp Med. 2010;5(1):19–25.
- , , , et al. Implementation of a real‐time computerized sepsis alert in nonintensive care unit patients. Crit Care Med. 2011;39(3):469–473.
- , , , et al. A trial of a real‐time Alert for clinical deterioration in Patients hospitalized on general medical wards. J Hosp Med. 2013;8(5):236–242.
- , , , , . Prospective evaluation of a modified Early Warning Score to aid earlier detection of patients developing critical illness on a general surgical ward. Br J Anaesth. 2000;84:663P.
- , , , . Validation of a modified Early Warning Score in medical admissions. QJM. 2001;94(10):521–526.
- , , . Adapting a clinical comorbidity index for use with ICD‐9‐CM administrative databases. J Clin Epidemiol. 1992;45(6):613–619.
- , , , . Comorbidity measures for use with administrative data. Med Care. 1998;36(1):8–27.
- , , , . Unplanned transfers to a medical intensive care unit: causes and relationship to preventable errors in care. J Hosp Med. 2011;6(2):68–72.
- , , , , , . Unplanned transfers to the intensive care unit: the role of the shock index. J Hosp Med. 2010;5(8):460–465.
- , , , , , . Early detection of impending physiologic deterioration among patients who are not in intensive care: development of predictive models using data from an automated electronic medical record. J Hosp Med. 2012;7(5):388–395.
- Institute for Healthcare Improvement. Early warning systems: the next level of rapid response; 2011. Available at: http://www.ihi.org/Engage/Memberships/MentorHospitalRegistry/Pages/RapidResponseSystems.aspx. Accessed April 6, 2011.
- , . Do either early warning systems or emergency response teams improve hospital patient survival? A systematic review. Resuscitation. 2013;84(12):1652–1667.
- , , , et al. Introducing critical care outreach: a ward‐randomised trial of phased introduction in a general hospital. Intensive Care Med. 2004;30(7):1398–1404.
- . Out of our reach? Assessing the impact of introducing critical care outreach service. Anaesthesiology. 2003;58(9):882–885.
- , , . Effect of the critical care outreach team on patient survival to discharge from hospital and readmission to critical care: non‐randomised population based study. BMJ. 2003;327(7422):1014.
- , , . Reducing mortality and avoiding preventable ICU utilization: analysis of a successful rapid response program using APR DRGs. J Healthc Qual. 2011;33(5):7–16.
- , , , et al. Introduction of the medical emergency team (MET) system: a cluster‐randomised control trial. Lancet. 2005;365(9477):2091–2097.
- , , , , , . The impact of the introduction of critical care outreach services in England: a multicentre interrupted time‐series analysis. Crit Care. 2007;11(5):R113.
- , , , et al. Systematic review and evaluation of physiological track and trigger warning systems for identifying at‐risk patients on the ward. Intensive Care Med. 2007;33(4):667–679.
- , , , . Timing and teamwork—an observational pilot study of patients referred to a Rapid Response Team with the aim of identifying factors amenable to re‐design of a Rapid Response System. Resuscitation. 2012;83(6):782–787.
- , , , , , . The impact of rapid response team on outcome of patients transferred from the ward to the ICU: a single‐center study. Crit Care Med. 2013;41(10):2284–2291.
- , , , . Rapid response: a quality improvement conundrum. J Hosp Med. 2009;4(4):255–257.
- . Rapid response systems now established at 2,900 hospitals. Hospitalist News. 2010;3:1.
- , , . Early warning systems. Hosp Chron. 2012;7:37–43.
- , , , et al. A controlled trial of electronic automated advisory vital signs monitoring in general hospital wards. Crit Care Med. 2012;40(8):2349–2361.
- , . The impact of medical emergency teams on ICU admission rates, cardiopulmonary arrests and mortality in a regional hospital. Resuscitation. 2011;82(6):707–712.
- , , . Imperfect implementation of an early warning scoring system in a danish teaching hospital: a cross‐sectional study. PLoS One. 2013;8:e70068.
- , . Introduction of medical emergency teams in Australia and New Zealand: A multicentre study. Crit Care. 2008;12(3):151.
© 2014 Society of Hospital Medicine
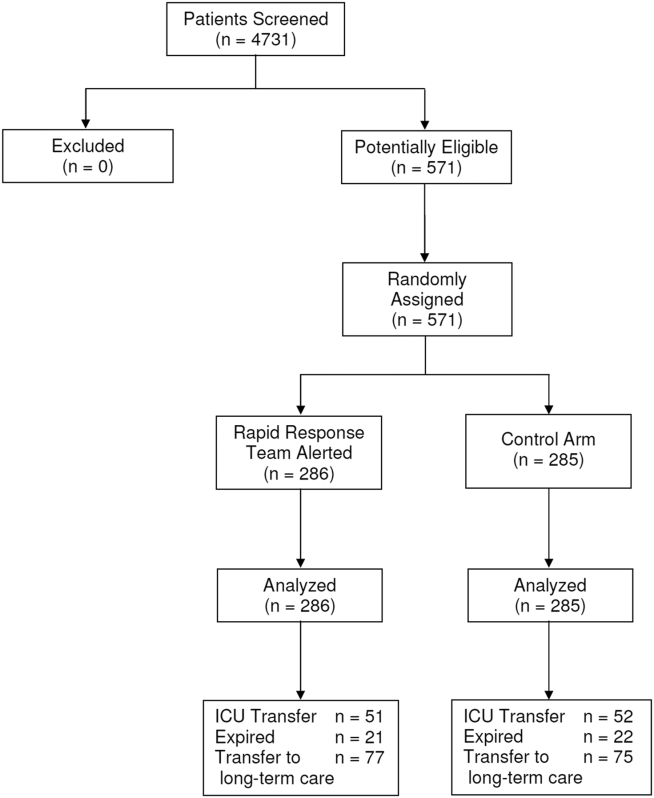
Pharmacogenomic studies follow 90/10 rule

Credit: NIGMS
Few pharmacogenomic studies focus on orphan or tropical diseases prevalent in developing countries, according to research published in Global Public Health.
Researchers found that, from 1997 to 2010, pharmacogenomics research most commonly focused on cancers, depression or psychological disorders, and cardiovascular disease.
Less than 4% of publications dealt with orphan or infectious diseases.
According to the researchers, this suggests pharmacogenomic research follows the 90/10 rule.
“It is recognized that the distribution of technology and research follows the so-called 90/10 ratio rule; that is, 90% of global funding for health research, including the development drugs, is invested to treat 10% of the world’s population,” said study author Catherine Olivier, a PhD candidate at the University of Montreal’s School of Public Health.
This inequality between rich and poor countries led the United Nations (UN) to make the fight against HIV-AIDS, malaria, and neglected tropical diseases one of its 8 Millennium Development Goals, adopted in September 2000 by the 189 UN member states.
To verify the extent to which pharmacogenomic research has addressed orphan and tropical diseases, Olivier searched for pharmacogenomic studies published from 1997 to 2010. She identified 626 studies in 171 journals.
Each study was analyzed according to the type of disease it concerned, the origin of its authors, and their affiliation with pharmaceutical companies, if any.
“The information collected allowed us to draw a map showing current and historical trends in the development of pharmacogenomic research,” Olivier said.
She found that, from 1997 to 2003, there were 401 publications on pharmacogenomics in the PubMed database. And the majority of them (67%) were published in a single journal, Pharmacogenetics. Then, from 2003 to 2010, the number of studies doubled.
However, the apparent enthusiasm for this type of research seems to have been artificially inflated. Olivier noted that the percentage of nonoriginal publications, including reviews, meta-analyses, and debates, increased from 15% in 1997 to 51% in 2010.
“The number of original articles—that is, studies focusing on a new aspect of pharmacogenomics—began to decline after 2002,” Olivier said.
Moreover, during the period analyzed, nearly 23% of published studies in pharmacogenomics dealt with the area of oncology, followed by depression and psychological disorders (14.7%), and cardiovascular disorders (13.6%).
“Rare diseases, tropical infections, and maternal health, which should have benefited from pharmacogenomic research under the Millennium Development Goals, represented only 3.8% of published studies,” Olivier explained.
She noted that investigators from countries most likely to be interested in these areas of research conducted few studies on rare diseases and tropical infections.
“Of the 65 publications from BRICS countries—Brazil, Russia, India, China, and South Africa—only 2 concerned rare diseases and tropical infections,” Olivier said.
Yet these diseases represented nearly half (45.5%) of the main causes of mortality in underdeveloped countries, and 15% in developing countries, according to 2008 data issued by the UN.
“Unfortunately, our study indicates that we are far from fulfilling the promise to reduce health inequalities in the world,” Olivier said, “a promise which was made before the adoption of the Millennium Declaration.” ![]()