User login
Healthcare Utilization after Sepsis
Sepsis, the systemic inflammatory response to infection, is a major public health concern.[1] Worldwide, sepsis affects millions of hospitalized patients each year.[2] In the United States, it is the single most expensive cause of hospitalization.[3, 4, 5, 6] Multiple studies suggest that sepsis hospitalizations are also increasing in frequency.[3, 6, 7, 8, 9, 10]
Improved sepsis care has dramatically reduced in‐hospital mortality.[11, 12, 13] However, the result is a growing number of sepsis survivors discharged with new disability.[1, 9, 14, 15, 16] Despite being a common cause of hospitalization, little is known about how to improve postsepsis care.[15, 17, 18, 19] This contrasts with other, often less common, hospital conditions for which many studies evaluating readmission and postdischarge care are available.[20, 21, 22, 23] Identifying the factors contributing to high utilization could lend critical insight to designing interventions that improve long‐term sepsis outcomes.[24]
We conducted a retrospective study of sepsis patients discharged in 2010 at Kaiser Permanente Northern California (KPNC) to describe their posthospital trajectories. In this diverse community‐hospitalbased population, we sought to identify the patient‐level factors that impact the posthospital healthcare utilization of sepsis survivors.
METHODS
This study was approved by the KPNC institutional review board.
Setting
We conducted a retrospective study of sepsis patients aged 18 years admitted to KPNC hospitals in 2010 whose hospitalizations included an overnight stay, began in a KPNC hospital, and was not for peripartum care. We identified sepsis based on International Classification of Disease, 9th Edition principal diagnosis codes used at KPNC, which capture a similar population to that from the Angus definition (see Supporting Appendix, Table 1, in the online version of this article).[7, 25, 26] We denoted each patient's first sepsis hospitalization as the index event.
| Predicted Hospital Mortality Quartiles (n=1,586 for Each Group) | |||||
|---|---|---|---|---|---|
| Overall | 1 | 2 | 3 | 4 | |
| |||||
| Baseline | |||||
| Age, y, mean | 71.915.7 | 62.317.8 | 71.214.2 | 75.612.7 | 78.612.2 |
| By age category | |||||
| <45 years | 410 (6.5) | 290 (18.3) | 71 (4.5) | 25 (1.6) | 24 (1.5) |
| 4564 years | 1,425 (22.5) | 539 (34.0) | 407 (25.7) | 292 (18.4) | 187 (11.8) |
| 6584 years | 3,036 (47.9) | 601 (37.9) | 814 (51.3) | 832 (52.5) | 789 (49.8) |
| 85 years | 1,473 (23.2) | 156 (9.8) | 294 (18.5) | 437 (27.6) | 586 (37.0) |
| Male | 2,973 (46.9) | 686 (43.3) | 792 (49.9) | 750 (47.3) | 745 (47.0) |
| Comorbidity | |||||
| COPS2 score | 5143 | 2627 | 5441 | 6445 | 6245 |
| Charlson score | 2.01.5 | 1.31.2 | 2.11.4 | 2.41.5 | 2.41.5 |
| Hospitalization | |||||
| LAPS2 severity score | 10742 | 6621 | 9020 | 11423 | 15928 |
| Admitted via emergency department | 6,176 (97.4) | 1,522 (96.0) | 1,537 (96.9) | 1,539 (97.0) | 1,578 (99.5) |
| Direct ICU admission | 1,730 (27.3) | 169 (10.7) | 309 (19.5) | 482 (30.4) | 770 (48.6) |
| ICU transfer, at any time | 2,206 (34.8) | 279 (17.6) | 474 (29.9) | 603 (38.0) | 850 (53.6) |
| Hospital mortality | |||||
| Predicted, % | 10.513.8 | 1.00.1 | 3.40.1 | 8.32.3 | 29.415.8 |
| Observed | 865 (13.6) | 26 (1.6) | 86 (5.4) | 197 (12.4) | 556 (35.1) |
| Hospital length of stay, d | 5.86.4 | 4.43.8 | 5.45.7 | 6.68.0 | 6.66.9 |
We linked hospital episodes with existing KPNC inpatient databases to describe patient characteristics.[27, 28, 29, 30] We categorized patients by age (45, 4564, 6584, and 85 years) and used Charlson comorbidity scores and Comorbidity Point Scores 2 (COPS2) to quantify comorbid illness burden.[28, 30, 31, 32] We quantified acute severity of illness using the Laboratory Acute Physiology Scores 2 (LAPS2), which incorporates 15 laboratory values, 5 vital signs, and mental status prior to hospital admission (including emergency department data).[30] Both the COPS2 and LAPS2 are independently associated with hospital mortality.[30, 31] We also generated a summary predicted risk of hospital mortality based on a validated risk model and stratified patients by quartiles.[30] We determined whether patients were admitted to the intensive care unit (ICU).[29]
Outcomes
We used patients' health insurance administrative data to quantify postsepsis utilization. Within the KPNC integrated healthcare delivery system, uniform information systems capture all healthcare utilization of insured members including services received at non‐KPNC facilities.[28, 30] We collected utilization data from the year preceding index hospitalization (presepsis) and for the year after discharge date or until death (postsepsis). We ascertained mortality after discharge from KPNC medical records as well as state and national death record files.
We grouped services into facility‐based or outpatient categories. Facility‐based services included inpatient admission, subacute nursing facility or long‐term acute care, and emergency department visits. We grouped outpatient services as hospice, home health, outpatient surgery, clinic, or other (eg, laboratory). We excluded patients whose utilization records were not available over the full presepsis interval. Among these 1211 patients (12.5% of total), the median length of records prior to index hospitalization was 67 days, with a mean value of 117 days.
Statistical Analysis
Our primary outcomes of interest were hospital readmission and utilization in the year after sepsis. We defined a hospital readmission as any inpatient stay after the index hospitalization grouped within 1‐, 3‐, 6‐, and 12‐month intervals. We designated those within 30 days as an early readmission. We grouped readmission principal diagnoses, where available, by the 17 Healthcare Cost and Utilization Project (HCUP) Clinical Classifications Software multilevel categories with sepsis in the infectious category.[33, 34] In secondary analysis, we also designated other infectious diagnoses not included in the standard HCUP infection category (eg, pneumonia, meningitis, cellulitis) as infection (see Supporting Appendix in the online version of this article).
We quantified outpatient utilization based on the number of episodes recorded. For facility‐based utilization, we calculated patient length of stay intervals. Because patients surviving their index hospitalization might not survive the entire year after discharge, we also calculated utilization adjusted for patients' living days by dividing the total facility length of stay by the number of living days after discharge.
Continuous data are represented as mean (standard deviation [SD]) and categorical data as number (%). We compared groups with analysis of variance or 2 testing. We estimated survival with Kaplan‐Meier analysis (95% confidence interval) and compared groups with log‐rank testing. We compared pre‐ and postsepsis healthcare utilization with paired t tests.
To identify factors associated with early readmission after sepsis, we used a competing risks regression model.[35] The dependent variable was time to readmission and the competing hazard was death within 30 days without early readmission; patients without early readmission or death were censored at 30 days. The independent variables included age, gender, comorbid disease burden (COPS2), acute severity of illness (LAPS2), any use of intensive care, total index length of stay, and percentage of living days prior to sepsis hospitalization spent utilizing facility‐based care. We also used logistic regression to quantify the association between these variables and high postsepsis utilization; we defined high utilization as 15% of living days postsepsis spent in facility‐based care. For each model, we quantified the relative contribution of each predictor variable to model performance based on differences in log likelihoods.[35, 36] We conducted analyses using STATA/SE version 11.2 (StataCorp, College Station, TX) and considered a P value of <0.05 to be significant.
RESULTS
Cohort Characteristics
Our study cohort included 6344 patients with index sepsis hospitalizations in 2010 (Table 1). Mean age was 72 (SD 16) years including 1835 (28.9%) patients aged <65 years. During index hospitalizations, higher predicted mortality was associated with increased age, comorbid disease burden, and severity of illness (P<0.01 for each). ICU utilization increased across predicted mortality strata; for example, 10.7% of patients in the lowest quartile were admitted directly to the ICU compared with 48.6% in the highest quartile. In the highest quartile, observed mortality was 35.1%.
One‐Year Survival
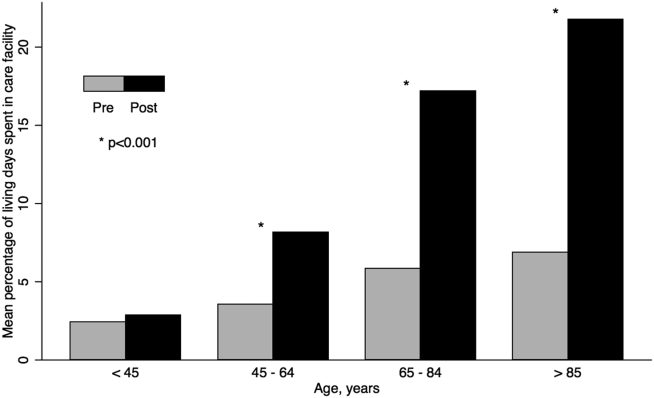
A total of 5479 (86.4%) patients survived their index sepsis hospitalization. Overall survival after living discharge was 90.5% (range, 89.6%91.2%) at 30 days and 71.3% (range, 70.1%72.5%) at 1 year. However, postsepsis survival was strongly modified by age (Figure 1). For example, 1‐year survival was 94.1% (range, 91.2%96.0%) for <45 year olds and 54.4% (range, 51.5%57.2%) for 85 year olds (P<0.01). Survival was also modified by predicted mortality, however, not by ICU admission during index hospitalization (P=0.18) (see Supporting Appendix, Figure 1, in the online version of this article).

Hospital Readmission
Overall, 978 (17.9%) patients had early readmission after index discharge (Table 2); nearly half were readmitted at least once in the year following discharge. Rehospitalization frequency was slightly lower when including patients with incomplete presepsis data (see Supporting Appendix, Table 2, in the online version of this article). The frequency of hospital readmission varied based on patient age and severity of illness. For example, 22.3% of patients in the highest predicted mortality quartile had early readmission compared with 11.6% in the lowest. The median time from discharge to early readmission was 11 days. Principal diagnoses were available for 78.6% of all readmissions (see Supporting Appendix, Table 3, in the online version of this article). Between 28.3% and 42.7% of those readmissions were for infectious diagnoses (including sepsis).
| Predicted Mortality Quartile | |||||
|---|---|---|---|---|---|
| Readmission | Overall | 1 | 2 | 3 | 4 |
| Within 30 days | 978 (17.9) | 158 (11.6) | 242 (17.7) | 274 (20.0) | 304 (22.3) |
| Within 90 days | 1,643 (30.1) | 276 (20.2) | 421 (30.8) | 463 (33.9) | 483 (35.4) |
| Within 180 days | 2,061 (37.7) | 368 (26.9) | 540 (39.5) | 584 (42.7) | 569 (41.7) |
| Within 365 days | 2,618 (47.9) | 498 (36.4) | 712 (52.1) | 723 (52.9) | 685 (50.2) |
| Variable | Hazard Ratio for Early Readmission | Odds Ratio for High Utilization | ||
|---|---|---|---|---|
| HR (95% CI) | Relative Contribution | OR (95% CI) | Relative Contribution | |
| ||||
| Age category | 1.2% | 11.1% | ||
| <45 years | 1.00 [reference] | 1.00 [reference] | ||
| 4564 years | 0.86 (0.64‐1.16) | 2.22 (1.30‐3.83)a | ||
| 6584 years | 0.92 (0.69‐1.21) | 3.66 (2.17‐6.18)a | ||
| 85 years | 0.95 (0.70‐1.28) | 4.98 (2.92‐8.50)a | ||
| Male | 0.99 (0.88‐1.13) | 0.0% | 0.86 (0.74‐1.00) | 0.1% |
| Severity of illness (LAPS2) | 1.08 (1.04‐1.12)a | 12.4% | 1.22 (1.17‐1.27)a | 11.3% |
| Comorbid illness (COPS2) | 1.16 (1.12‐1.19)a | 73.9% | 1.13 (1.09‐1.17)a | 5.9% |
| Intensive care | 1.21 (1.05‐1.40)a | 5.2% | 1.02 (0.85‐1.21) | 0.0% |
| Hospital length of stay, day | 1.01 (1.001.02)b | 6.6% | 1.04 (1.03‐1.06)a | 6.9% |
| Prior utilization, per 10% | 0.98 (0.95‐1.02) | 0.7% | 1.74 (1.61‐1.88)a | 64.2% |
Healthcare Utilization
The unadjusted difference between pre‐ and postsepsis healthcare utilization among survivors was statistically significant for most categories but of modest clinical significance (see Supporting Appendix, Table 4, in the online version of this article). For example, the mean number of presepsis hospitalizations was 0.9 (1.4) compared to 1.0 (1.5) postsepsis (P<0.01). After adjusting for postsepsis living days, the difference in utilization was more pronounced (Figure 2). Overall, there was roughly a 3‐fold increase in the mean percentage of living days spent in facility‐based care between patients' pre‐ and postsepsis phases (5.3% vs 15.0%, P<0.01). Again, the difference was strongly modified by age. For patients aged <45 years, the difference was not statistically significant (2.4% vs 2.9%, P=0.32), whereas for those aged 65 years, it was highly significant (6.2% vs 18.5%, P<0.01).
Factors associated with early readmission included severity of illness, comorbid disease burden, index hospital length of stay, and intensive care (Table 3). However, the dominant factor explaining variation in the risk of early readmission was patients' prior comorbid disease burden (73.9%), followed by acute severity of illness (12.4%), total hospital length of stay (6.6%), and the need for intensive care (5.2%). Severity of illness and age were also significantly associated with higher odds of high postsepsis utilization; however, the dominant factor contributing to this risk was a history of high presepsis utilization (64.2%).
DISCUSSION
In this population‐based study in a community healthcare system, the impact of sepsis extended well beyond the initial hospitalization. One in 6 sepsis survivors was readmitted within 30 days, and roughly half were readmitted within 1 year. Fewer than half of rehospitalizations were for sepsis. Patients had a 3‐fold increase in the percentage of living days spent in hospitals or care facilities after sepsis hospitalization. Although age and acute severity of illness strongly modified healthcare utilization and mortality after sepsis, the dominant factors contributing to early readmission and high utilization ratescomorbid disease burden and presepsis healthcare utilizationwere present prior to hospitalization.
Sepsis is the single most expensive cause of US hospitalizations.[3, 4, 5] Despite its prevalence, there are little contemporary data identifying factors that impact healthcare utilization among sepsis survivors.[9, 16, 17, 19, 24, 36, 37] Recently, Prescott and others found that in Medicare beneficiaries, following severe sepsis, healthcare utilization was markedly increased.[17] More than one‐quarter of survivors were readmitted within 30 days, and 63.8% were readmitted within a year. Severe sepsis survivors also spent an average of 26% of their living days in a healthcare facility, a nearly 4‐fold increase compared to their presepsis phase. The current study included a population with a broader age and severity range; however, in a similar subgroup of patients, for those aged 65 years within the highest predicted mortality quartile, the frequency of readmission was similar. These findings are concordant with those from prior studies.[17, 19, 36, 37]
Among sepsis survivors, most readmissions were not for sepsis or infectious diagnoses, which is a novel finding with implications for designing approaches to reduce rehospitalization. The pattern in sepsis is similar to that seen in other common and costly hospital conditions.[17, 20, 23, 38, 39, 40] For example, between 18% and 25% of Medicare beneficiaries hospitalized for heart failure, acute myocardial infarction, or pneumonia were readmitted within 30 days; fewer than one‐third had the same diagnosis.[20] The timing of readmission in our sepsis cohort was also similar to that seen in other conditions.[20] For example, the median time of early readmission in this study was 11 days; it was between 10 and 12 days for patients with heart failure, pneumonia, and myocardial infarction.[20]
Krumholz and others suggest that the pattern of early rehospitalization after common acute conditions reflects a posthospital syndromean acquired, transient period of vulnerabilitythat could be the byproduct of common hospital factors.[20, 41] Such universal impairments might result from new physical and neurocognitive disability, nutritional deficiency, and sleep deprivation or delirium, among others.[41] If this construct were also true in sepsis, it could have important implications on the design of postsepsis care. However, prior studies suggest that sepsis patients may be particularly vulnerable to the sequelae of hospitalization.[2, 42, 43, 44, 45]
Among Medicare beneficiaries, Iwashyna and others reported that hospitalizations for severe sepsis resulted in significant increases in physical limitations and moderate to severe cognitive impairment.[1, 14, 46] Encephalopathy, sleep deprivation, and delirium are also frequently seen in sepsis patients.[47, 48] Furthermore, sepsis patients frequently need intensive care, which is also associated with increased patient disability and injury.[16, 46, 49, 50] We found that severity of illness and the need for intensive care were both predictive of the need for early readmission following sepsis. We also confirmed the results of prior studies suggesting that sepsis outcomes are strongly modified by age.[16, 19, 43, 51]
However, we found that the dominant factors contributing to patients' health trajectories were conditions present prior to admission. This finding is in accord with prior suggestions that acute severity of illness only partially predicts patients facing adverse posthospital sequelae.[23, 41, 52] Among sepsis patients, prior work demonstrates that inadequate consideration for presepsis level of function and utilization can result in an overestimation of the impact of sepsis on postdischarge health.[52, 53] Further, we found that the need for intensive care was not independently associated with an increased risk of high postsepsis utilization after adjusting for illness severity, a finding also seen in prior studies.[17, 23, 38, 51]
Taken together, our findings might suggest that an optimal approach to posthospital care in sepsis should focus on treatment approaches that address disease‐specific problems within the much larger context of common hospital risks. However, further study is necessary to clearly define the mechanisms by which age, severity of illness, and intensive care affect subsequent healthcare utilization. Furthermore, sepsis patients are a heterogeneous population in terms of severity of illness, site and pathogen of infection, and underlying comorbidity whose posthospital course remains incompletely characterized, limiting our ability to draw strong inferences.
These results should be interpreted in light of the study's limitations. First, our cohort included patients with healthcare insurance within a community‐based healthcare system. Care within the KPNC system, which bears similarities with accountable care organizations, is enhanced through service integration and a comprehensive health information system. Although prior studies suggest that these characteristics result in improved population‐based care, it is unclear whether there is a similar impact in hospital‐based conditions such as sepsis.[54, 55] Furthermore, care within an integrated system may impact posthospital utilization patterns and could limit generalizability. However, prior studies demonstrate the similarity of KPNC members to other patients in the same region in terms of age, socioeconomics, overall health behaviors, and racial/ethnic diversity.[56] Second, our study did not characterize organ dysfunction based on diagnosis coding, a common feature of sepsis studies that lack detailed physiologic severity data.[4, 5, 6, 8, 26] Instead, we focused on using granular laboratory and vital signs data to ensure accurate risk adjustment using a validated system developed in >400,000 hospitalizations.[30] Although this method may hamper comparisons with existing studies, traditional methods of grading severity by diagnosis codes can be vulnerable to biases resulting in wide variability.[10, 23, 26, 57, 58] Nonetheless, it is likely that characterizing preexisting and acute organ dysfunction will improve risk stratification in the heterogeneous sepsis population. Third, this study did not include data regarding patients' functional status, which has been shown to strongly predict patient outcomes following hospitalization. Fourth, this study did not address the cost of care following sepsis hospitalizations.[19, 59] Finally, our study excluded patients with incomplete utilization records, a choice designed to avoid the spurious inferences that can result from such comparisons.[53]
In summary, we found that sepsis exacted a considerable toll on patients in the hospital and in the year following discharge. Sepsis patients were frequently rehospitalized within a month of discharge, and on average had a 3‐fold increase in their subsequent time spent in healthcare facilities. Although age, severity of illness, and the need for ICU care impacted postsepsis utilization, the dominant contributing factorscomorbid disease burden or presepsis utilizationwere present prior to sepsis hospitalization. Early readmission patterns in sepsis appeared similar to those seen in other important hospital conditions, suggesting a role for shared posthospital, rather than just postsepsis, care approaches.
Disclosures
The funding for this study was provided by The Permanente Medical Group, Inc. and Kaiser Foundation Hospitals. The authors have no conflict of interests to disclose relevant to this article.
- . The lingering consequences of sepsis: a hidden public health disaster? JAMA. 2010;304(16):1833–1834.
- , , , et al.; Surviving Sepsis Campaign Guidelines Committee including the Pediatric Subgroup. Surviving sepsis campaign: international guidelines for management of severe sepsis and septic shock: 2012. Crit Care Med. 2013;41(2):580–637.
- , , . Costs for hospital stays in the United States, 2010. HCUP statistical brief #16. January 2013. Rockville, MD: Agency for Healthcare Research and Quality; 2013. Available at: http://www.hcup‐us.ahrq.gov/reports/statbriefs/sb146.pdf. Accessed October 1, 2013.
- , , , . The epidemiology of sepsis in the United States from 1979 through 2000. N Engl J Med. 2003;348(16):1546–1554.
- , , , , , . Epidemiology of severe sepsis in the United States: analysis of incidence, outcome, and associated costs of care. Crit Care Med. 2001;29(7):1303–1310.
- , , , . Rapid increase in hospitalization and mortality rates for severe sepsis in the United States: a trend analysis from 1993 to 2003. Crit Care Med. 2007;35(5):1244–1250.
- , , . Septicemia in U.S. hospitals, 2009. HCUP statistical brief #122. October 2011. Rockville, MD: Agency for Healthcare Research and Quality; 2011. Available at: http://www.hcup‐us.ahrq.gov/reports/statbriefs/sb122.pdf. Accessed October 1, 2013.
- , , , , , . Hospitalizations, costs, and outcomes of severe sepsis in the United States 2003 to 2007. Crit Care Med. 2012;40(3):754–761.
- , , , . Population burden of long‐term survivorship after severe sepsis in older Americans. J Am Geriatr Soc. 2012;60(6):1070–1077.
- , , , . Benchmarking the incidence and mortality of severe sepsis in the United States. Crit Care Med. 2013;41(5):1167–1174.
- , , , et al. Outcomes of the Surviving Sepsis Campaign in intensive care units in the USA and Europe: a prospective cohort study. Lancet Infect Dis. 2012;12(12):919–924.
- , , , . Reducing mortality in severe sepsis: the Surviving Sepsis Campaign. Clin Chest Med. 2008;29(4):721–733, x.
- , , , et al.; Early Goal‐Directed Therapy Collaborative Group. Early goal‐directed therapy in the treatment of severe sepsis and septic shock. N Engl J Med. 2001;345(19):1368–1377.
- , , , . Long‐term cognitive impairment and functional disability among survivors of severe sepsis. JAMA. 2010;304(16):1787–1794.
- , , , , , . Long‐term mortality and quality of life in sepsis: a systematic review. Crit Care Med. 2010;38(5):1276–1283.
- , , , et al.; the Scottish Critical Care Trials Group and the Scottish Intensive Care Society Audit Group. Mortality and quality of life in the five years after severe sepsis. Crit Care. 2013;17(2):R70.
- , , , , . Post‐Discharge Health Care Use Is Markedly Higher in Survivors of Severe Sepsis. Am J Respir Crit Care Med 2013;187:A1573.
- , , , . Long‐term survival and function after suspected gram‐negative sepsis. JAMA. 1995;274(4):338–345.
- , , , , . Long‐term mortality and medical care charges in patients with severe sepsis. Crit Care Med. 2003;31(9):2316–2323.
- , , , et al. Diagnoses and timing of 30‐day readmissions after hospitalization for heart failure, acute myocardial infarction, or pneumonia. JAMA. 2013;309(4):355–363.
- , , , , . A systematic review and meta‐analysis of studies comparing readmission rates and mortality rates in patients with heart failure. Arch Intern Med. 2004;164(21):2315–2320.
- , . Hospitalizations for heart failure in the United States—a sign of hope. JAMA. 2011;306(15):1705–1706.
- , , , et al. Risk prediction models for hospital readmission: a systematic review. JAMA. 2011;306(15):1688–1698.
- , . Sepsis after Scotland: enough with the averages, show us the effect modifiers. Crit Care. 2013;17(3):148.
- , , , et al. Kaiser Permanente's performance improvement system, part 3: multisite improvements in care for patients with sepsis. Jt Comm J Qual Patient Saf. 2011;37(11): 483–493.
- , , , et al. Identifying patients with severe sepsis using administrative claims: patient‐level validation of the Angus implementation of the International Consensus Conference Definition of Severe Sepsis [published online ahead of print September 18, 2012]. Med Care. doi: 10.1097/MLR.0b013e318268ac86. Epub ahead of print.
- . Linking automated databases for research in managed care settings. Ann Intern Med. 1997;127(8 pt 2):719–724.
- , , , , , . Risk‐adjusting hospital inpatient mortality using automated inpatient, outpatient, and laboratory databases. Med Care. 2008;46(3):232–239.
- , , , , . An electronic Simplified Acute Physiology Score‐based risk adjustment score for critical illness in an integrated healthcare system. Crit Care Med. 2013;41(1):41–48.
- , , , , . Risk‐adjusting hospital mortality using a comprehensive electronic record in an integrated health care delivery system. Med Care. 2013;51(5):446–453.
- , , , , , . Early detection of impending physiologic deterioration among patients who are not in intensive care: development of predictive models using data from an automated electronic medical record. J Hosp Med. 2012;7(5):388–395.
- , , , . The Kaiser Permanente inpatient risk adjustment methodology was valid in an external patient population. J Clin Epidemiol. 2009;63(7):798–803.
- , , , , , . Casemix adjustment of managed care claims data using the clinical classification for health policy research method. Med Care. 1998;36(7):1108–1113.
- Agency for Healthcare Research and Quality Healthcare Cost and Utilization Project. Clinical Classifications Software (CCS) for ICD‐9‐CM Fact Sheet. Available at: http://www.hcup‐us.ahrq.gov/toolssoftware/ccs/ccsfactsheet.jsp. Accessed January 20, 2013.
- , . A proportional hazards model for the subdistribution of a competing risk. J Am Stat Assoc. 1997;94(446):496–509.
- , , . Severe sepsis in managed care: analysis of incidence, one‐year mortality, and associated costs of care. J Manag Care Pharm. 2004;10(6):521–530.
- , , , , , . Detailed cost analysis of care for survivors of severe sepsis. Crit Care Med. 2004;32(4):981–985.
- , , , , et al. Readmissions among patients with severe sepsis/septic shock among inner‐city minority New Yorkers. Chest. 2012;142:286A.
- , , . Readmission and late mortality after pediatric severe sepsis. Pediatrics. 2009;123(3):849–857.
- , , . Rehospitalizations among patients in the Medicare fee‐for‐service program. N Engl J Med. 2009;360(14):1418–1428.
- . Post‐hospital syndrome—an acquired, transient condition of generalized risk. N Engl J Med. 2013;368(2):100–102.
- , , , et al. Definitions for sepsis and organ failure and guidelines for the use of innovative therapies in sepsis. The ACCP/SCCM Consensus Conference Committee. American College of Chest Physicians/Society of Critical Care Medicine. Chest. 1992;101(6):1644–1655.
- , , . The effect of age on the development and outcome of adult sepsis. Crit Care Med. 2006;34(1):15–21.
- , . Multiple systems organ failure: failure of host defense homeostasis. Crit Care Clin. 1989;5(2):199–220.
- . Pathophysiology of sepsis. Am J Pathol. 2007;170(5):1435–1444.
- , . Surviving intensive care: a report from the 2002 Brussels Roundtable. Intensive Care Med. 2003;29(3):368–377.
- , , . The encephalopathy in sepsis. Crit Care Clin. 2008;24(1):67–82, viii.
- , . Sepsis‐associated encephalopathy. Nat Rev Neurol. 2012;8(10):557–566.
- , , , et al. Improving long‐term outcomes after discharge from intensive care unit: report from a stakeholders' conference. Crit Care Med. 2012;40(2):502–509.
- , , , , . The association between sepsis and potential medical injury among hospitalized patients. Chest. 2012;142(3):606–613.
- , , , , , . Three‐year outcomes for Medicare beneficiaries who survive intensive care. JAMA. 2010;303(9):849–856.
- , , , , , . Does acute organ dysfunction predict patient‐centered outcomes? Chest. 2002;121(6):1963–1971.
- , , , . Spurious inferences about long‐term outcomes: the case of severe sepsis and geriatric conditions. Am J Respir Crit Care Med. 2012;185(8):835–841.
- , , , , , . Population trends in the incidence and outcomes of acute myocardial infarction. N Engl J Med. 2010;362(23):2155–2165.
- , , , et al., Outpatient electronic health records and the clinical care and outcomes of patients with diabetes mellitus. Ann Intern Med. 2012;157(7):482–489.
- . Similarity of the adult Kaiser Permanente membership in Northern California to the insured and general population in Northern California: statistics from the 2009 California Health Interview Survey. Internal Division of Research Report. Oakland, CA: Kaiser Permanente Division of Research; January 24, 2012. Available at: http://www.dor.kaiser.org/external/chis_non_kp_2009. Accessed January 20, 2013.
- , , , , . Association of diagnostic coding with trends in hospitalizations and mortality of patients with pneumonia, 2003–2009. JAMA. 2012;307(13):1405–1413.
- , . Finding pure and simple truths with administrative data. JAMA. 2012;307(13):1433–1435.
- , , , . Cost savings attributable to reductions in intensive care unit length of stay for mechanically ventilated patients. Med Care. 2008;46(12):1226–1233.
Sepsis, the systemic inflammatory response to infection, is a major public health concern.[1] Worldwide, sepsis affects millions of hospitalized patients each year.[2] In the United States, it is the single most expensive cause of hospitalization.[3, 4, 5, 6] Multiple studies suggest that sepsis hospitalizations are also increasing in frequency.[3, 6, 7, 8, 9, 10]
Improved sepsis care has dramatically reduced in‐hospital mortality.[11, 12, 13] However, the result is a growing number of sepsis survivors discharged with new disability.[1, 9, 14, 15, 16] Despite being a common cause of hospitalization, little is known about how to improve postsepsis care.[15, 17, 18, 19] This contrasts with other, often less common, hospital conditions for which many studies evaluating readmission and postdischarge care are available.[20, 21, 22, 23] Identifying the factors contributing to high utilization could lend critical insight to designing interventions that improve long‐term sepsis outcomes.[24]
We conducted a retrospective study of sepsis patients discharged in 2010 at Kaiser Permanente Northern California (KPNC) to describe their posthospital trajectories. In this diverse community‐hospitalbased population, we sought to identify the patient‐level factors that impact the posthospital healthcare utilization of sepsis survivors.
METHODS
This study was approved by the KPNC institutional review board.
Setting
We conducted a retrospective study of sepsis patients aged 18 years admitted to KPNC hospitals in 2010 whose hospitalizations included an overnight stay, began in a KPNC hospital, and was not for peripartum care. We identified sepsis based on International Classification of Disease, 9th Edition principal diagnosis codes used at KPNC, which capture a similar population to that from the Angus definition (see Supporting Appendix, Table 1, in the online version of this article).[7, 25, 26] We denoted each patient's first sepsis hospitalization as the index event.
| Predicted Hospital Mortality Quartiles (n=1,586 for Each Group) | |||||
|---|---|---|---|---|---|
| Overall | 1 | 2 | 3 | 4 | |
| |||||
| Baseline | |||||
| Age, y, mean | 71.915.7 | 62.317.8 | 71.214.2 | 75.612.7 | 78.612.2 |
| By age category | |||||
| <45 years | 410 (6.5) | 290 (18.3) | 71 (4.5) | 25 (1.6) | 24 (1.5) |
| 4564 years | 1,425 (22.5) | 539 (34.0) | 407 (25.7) | 292 (18.4) | 187 (11.8) |
| 6584 years | 3,036 (47.9) | 601 (37.9) | 814 (51.3) | 832 (52.5) | 789 (49.8) |
| 85 years | 1,473 (23.2) | 156 (9.8) | 294 (18.5) | 437 (27.6) | 586 (37.0) |
| Male | 2,973 (46.9) | 686 (43.3) | 792 (49.9) | 750 (47.3) | 745 (47.0) |
| Comorbidity | |||||
| COPS2 score | 5143 | 2627 | 5441 | 6445 | 6245 |
| Charlson score | 2.01.5 | 1.31.2 | 2.11.4 | 2.41.5 | 2.41.5 |
| Hospitalization | |||||
| LAPS2 severity score | 10742 | 6621 | 9020 | 11423 | 15928 |
| Admitted via emergency department | 6,176 (97.4) | 1,522 (96.0) | 1,537 (96.9) | 1,539 (97.0) | 1,578 (99.5) |
| Direct ICU admission | 1,730 (27.3) | 169 (10.7) | 309 (19.5) | 482 (30.4) | 770 (48.6) |
| ICU transfer, at any time | 2,206 (34.8) | 279 (17.6) | 474 (29.9) | 603 (38.0) | 850 (53.6) |
| Hospital mortality | |||||
| Predicted, % | 10.513.8 | 1.00.1 | 3.40.1 | 8.32.3 | 29.415.8 |
| Observed | 865 (13.6) | 26 (1.6) | 86 (5.4) | 197 (12.4) | 556 (35.1) |
| Hospital length of stay, d | 5.86.4 | 4.43.8 | 5.45.7 | 6.68.0 | 6.66.9 |
We linked hospital episodes with existing KPNC inpatient databases to describe patient characteristics.[27, 28, 29, 30] We categorized patients by age (45, 4564, 6584, and 85 years) and used Charlson comorbidity scores and Comorbidity Point Scores 2 (COPS2) to quantify comorbid illness burden.[28, 30, 31, 32] We quantified acute severity of illness using the Laboratory Acute Physiology Scores 2 (LAPS2), which incorporates 15 laboratory values, 5 vital signs, and mental status prior to hospital admission (including emergency department data).[30] Both the COPS2 and LAPS2 are independently associated with hospital mortality.[30, 31] We also generated a summary predicted risk of hospital mortality based on a validated risk model and stratified patients by quartiles.[30] We determined whether patients were admitted to the intensive care unit (ICU).[29]
Outcomes
We used patients' health insurance administrative data to quantify postsepsis utilization. Within the KPNC integrated healthcare delivery system, uniform information systems capture all healthcare utilization of insured members including services received at non‐KPNC facilities.[28, 30] We collected utilization data from the year preceding index hospitalization (presepsis) and for the year after discharge date or until death (postsepsis). We ascertained mortality after discharge from KPNC medical records as well as state and national death record files.
We grouped services into facility‐based or outpatient categories. Facility‐based services included inpatient admission, subacute nursing facility or long‐term acute care, and emergency department visits. We grouped outpatient services as hospice, home health, outpatient surgery, clinic, or other (eg, laboratory). We excluded patients whose utilization records were not available over the full presepsis interval. Among these 1211 patients (12.5% of total), the median length of records prior to index hospitalization was 67 days, with a mean value of 117 days.
Statistical Analysis
Our primary outcomes of interest were hospital readmission and utilization in the year after sepsis. We defined a hospital readmission as any inpatient stay after the index hospitalization grouped within 1‐, 3‐, 6‐, and 12‐month intervals. We designated those within 30 days as an early readmission. We grouped readmission principal diagnoses, where available, by the 17 Healthcare Cost and Utilization Project (HCUP) Clinical Classifications Software multilevel categories with sepsis in the infectious category.[33, 34] In secondary analysis, we also designated other infectious diagnoses not included in the standard HCUP infection category (eg, pneumonia, meningitis, cellulitis) as infection (see Supporting Appendix in the online version of this article).
We quantified outpatient utilization based on the number of episodes recorded. For facility‐based utilization, we calculated patient length of stay intervals. Because patients surviving their index hospitalization might not survive the entire year after discharge, we also calculated utilization adjusted for patients' living days by dividing the total facility length of stay by the number of living days after discharge.
Continuous data are represented as mean (standard deviation [SD]) and categorical data as number (%). We compared groups with analysis of variance or 2 testing. We estimated survival with Kaplan‐Meier analysis (95% confidence interval) and compared groups with log‐rank testing. We compared pre‐ and postsepsis healthcare utilization with paired t tests.
To identify factors associated with early readmission after sepsis, we used a competing risks regression model.[35] The dependent variable was time to readmission and the competing hazard was death within 30 days without early readmission; patients without early readmission or death were censored at 30 days. The independent variables included age, gender, comorbid disease burden (COPS2), acute severity of illness (LAPS2), any use of intensive care, total index length of stay, and percentage of living days prior to sepsis hospitalization spent utilizing facility‐based care. We also used logistic regression to quantify the association between these variables and high postsepsis utilization; we defined high utilization as 15% of living days postsepsis spent in facility‐based care. For each model, we quantified the relative contribution of each predictor variable to model performance based on differences in log likelihoods.[35, 36] We conducted analyses using STATA/SE version 11.2 (StataCorp, College Station, TX) and considered a P value of <0.05 to be significant.
RESULTS
Cohort Characteristics
Our study cohort included 6344 patients with index sepsis hospitalizations in 2010 (Table 1). Mean age was 72 (SD 16) years including 1835 (28.9%) patients aged <65 years. During index hospitalizations, higher predicted mortality was associated with increased age, comorbid disease burden, and severity of illness (P<0.01 for each). ICU utilization increased across predicted mortality strata; for example, 10.7% of patients in the lowest quartile were admitted directly to the ICU compared with 48.6% in the highest quartile. In the highest quartile, observed mortality was 35.1%.
One‐Year Survival
A total of 5479 (86.4%) patients survived their index sepsis hospitalization. Overall survival after living discharge was 90.5% (range, 89.6%91.2%) at 30 days and 71.3% (range, 70.1%72.5%) at 1 year. However, postsepsis survival was strongly modified by age (Figure 1). For example, 1‐year survival was 94.1% (range, 91.2%96.0%) for <45 year olds and 54.4% (range, 51.5%57.2%) for 85 year olds (P<0.01). Survival was also modified by predicted mortality, however, not by ICU admission during index hospitalization (P=0.18) (see Supporting Appendix, Figure 1, in the online version of this article).
Hospital Readmission
Overall, 978 (17.9%) patients had early readmission after index discharge (Table 2); nearly half were readmitted at least once in the year following discharge. Rehospitalization frequency was slightly lower when including patients with incomplete presepsis data (see Supporting Appendix, Table 2, in the online version of this article). The frequency of hospital readmission varied based on patient age and severity of illness. For example, 22.3% of patients in the highest predicted mortality quartile had early readmission compared with 11.6% in the lowest. The median time from discharge to early readmission was 11 days. Principal diagnoses were available for 78.6% of all readmissions (see Supporting Appendix, Table 3, in the online version of this article). Between 28.3% and 42.7% of those readmissions were for infectious diagnoses (including sepsis).
| Predicted Mortality Quartile | |||||
|---|---|---|---|---|---|
| Readmission | Overall | 1 | 2 | 3 | 4 |
| Within 30 days | 978 (17.9) | 158 (11.6) | 242 (17.7) | 274 (20.0) | 304 (22.3) |
| Within 90 days | 1,643 (30.1) | 276 (20.2) | 421 (30.8) | 463 (33.9) | 483 (35.4) |
| Within 180 days | 2,061 (37.7) | 368 (26.9) | 540 (39.5) | 584 (42.7) | 569 (41.7) |
| Within 365 days | 2,618 (47.9) | 498 (36.4) | 712 (52.1) | 723 (52.9) | 685 (50.2) |
| Variable | Hazard Ratio for Early Readmission | Odds Ratio for High Utilization | ||
|---|---|---|---|---|
| HR (95% CI) | Relative Contribution | OR (95% CI) | Relative Contribution | |
| ||||
| Age category | 1.2% | 11.1% | ||
| <45 years | 1.00 [reference] | 1.00 [reference] | ||
| 4564 years | 0.86 (0.64‐1.16) | 2.22 (1.30‐3.83)a | ||
| 6584 years | 0.92 (0.69‐1.21) | 3.66 (2.17‐6.18)a | ||
| 85 years | 0.95 (0.70‐1.28) | 4.98 (2.92‐8.50)a | ||
| Male | 0.99 (0.88‐1.13) | 0.0% | 0.86 (0.74‐1.00) | 0.1% |
| Severity of illness (LAPS2) | 1.08 (1.04‐1.12)a | 12.4% | 1.22 (1.17‐1.27)a | 11.3% |
| Comorbid illness (COPS2) | 1.16 (1.12‐1.19)a | 73.9% | 1.13 (1.09‐1.17)a | 5.9% |
| Intensive care | 1.21 (1.05‐1.40)a | 5.2% | 1.02 (0.85‐1.21) | 0.0% |
| Hospital length of stay, day | 1.01 (1.001.02)b | 6.6% | 1.04 (1.03‐1.06)a | 6.9% |
| Prior utilization, per 10% | 0.98 (0.95‐1.02) | 0.7% | 1.74 (1.61‐1.88)a | 64.2% |
Healthcare Utilization
The unadjusted difference between pre‐ and postsepsis healthcare utilization among survivors was statistically significant for most categories but of modest clinical significance (see Supporting Appendix, Table 4, in the online version of this article). For example, the mean number of presepsis hospitalizations was 0.9 (1.4) compared to 1.0 (1.5) postsepsis (P<0.01). After adjusting for postsepsis living days, the difference in utilization was more pronounced (Figure 2). Overall, there was roughly a 3‐fold increase in the mean percentage of living days spent in facility‐based care between patients' pre‐ and postsepsis phases (5.3% vs 15.0%, P<0.01). Again, the difference was strongly modified by age. For patients aged <45 years, the difference was not statistically significant (2.4% vs 2.9%, P=0.32), whereas for those aged 65 years, it was highly significant (6.2% vs 18.5%, P<0.01).
Factors associated with early readmission included severity of illness, comorbid disease burden, index hospital length of stay, and intensive care (Table 3). However, the dominant factor explaining variation in the risk of early readmission was patients' prior comorbid disease burden (73.9%), followed by acute severity of illness (12.4%), total hospital length of stay (6.6%), and the need for intensive care (5.2%). Severity of illness and age were also significantly associated with higher odds of high postsepsis utilization; however, the dominant factor contributing to this risk was a history of high presepsis utilization (64.2%).
DISCUSSION
In this population‐based study in a community healthcare system, the impact of sepsis extended well beyond the initial hospitalization. One in 6 sepsis survivors was readmitted within 30 days, and roughly half were readmitted within 1 year. Fewer than half of rehospitalizations were for sepsis. Patients had a 3‐fold increase in the percentage of living days spent in hospitals or care facilities after sepsis hospitalization. Although age and acute severity of illness strongly modified healthcare utilization and mortality after sepsis, the dominant factors contributing to early readmission and high utilization ratescomorbid disease burden and presepsis healthcare utilizationwere present prior to hospitalization.
Sepsis is the single most expensive cause of US hospitalizations.[3, 4, 5] Despite its prevalence, there are little contemporary data identifying factors that impact healthcare utilization among sepsis survivors.[9, 16, 17, 19, 24, 36, 37] Recently, Prescott and others found that in Medicare beneficiaries, following severe sepsis, healthcare utilization was markedly increased.[17] More than one‐quarter of survivors were readmitted within 30 days, and 63.8% were readmitted within a year. Severe sepsis survivors also spent an average of 26% of their living days in a healthcare facility, a nearly 4‐fold increase compared to their presepsis phase. The current study included a population with a broader age and severity range; however, in a similar subgroup of patients, for those aged 65 years within the highest predicted mortality quartile, the frequency of readmission was similar. These findings are concordant with those from prior studies.[17, 19, 36, 37]
Among sepsis survivors, most readmissions were not for sepsis or infectious diagnoses, which is a novel finding with implications for designing approaches to reduce rehospitalization. The pattern in sepsis is similar to that seen in other common and costly hospital conditions.[17, 20, 23, 38, 39, 40] For example, between 18% and 25% of Medicare beneficiaries hospitalized for heart failure, acute myocardial infarction, or pneumonia were readmitted within 30 days; fewer than one‐third had the same diagnosis.[20] The timing of readmission in our sepsis cohort was also similar to that seen in other conditions.[20] For example, the median time of early readmission in this study was 11 days; it was between 10 and 12 days for patients with heart failure, pneumonia, and myocardial infarction.[20]
Krumholz and others suggest that the pattern of early rehospitalization after common acute conditions reflects a posthospital syndromean acquired, transient period of vulnerabilitythat could be the byproduct of common hospital factors.[20, 41] Such universal impairments might result from new physical and neurocognitive disability, nutritional deficiency, and sleep deprivation or delirium, among others.[41] If this construct were also true in sepsis, it could have important implications on the design of postsepsis care. However, prior studies suggest that sepsis patients may be particularly vulnerable to the sequelae of hospitalization.[2, 42, 43, 44, 45]
Among Medicare beneficiaries, Iwashyna and others reported that hospitalizations for severe sepsis resulted in significant increases in physical limitations and moderate to severe cognitive impairment.[1, 14, 46] Encephalopathy, sleep deprivation, and delirium are also frequently seen in sepsis patients.[47, 48] Furthermore, sepsis patients frequently need intensive care, which is also associated with increased patient disability and injury.[16, 46, 49, 50] We found that severity of illness and the need for intensive care were both predictive of the need for early readmission following sepsis. We also confirmed the results of prior studies suggesting that sepsis outcomes are strongly modified by age.[16, 19, 43, 51]
However, we found that the dominant factors contributing to patients' health trajectories were conditions present prior to admission. This finding is in accord with prior suggestions that acute severity of illness only partially predicts patients facing adverse posthospital sequelae.[23, 41, 52] Among sepsis patients, prior work demonstrates that inadequate consideration for presepsis level of function and utilization can result in an overestimation of the impact of sepsis on postdischarge health.[52, 53] Further, we found that the need for intensive care was not independently associated with an increased risk of high postsepsis utilization after adjusting for illness severity, a finding also seen in prior studies.[17, 23, 38, 51]
Taken together, our findings might suggest that an optimal approach to posthospital care in sepsis should focus on treatment approaches that address disease‐specific problems within the much larger context of common hospital risks. However, further study is necessary to clearly define the mechanisms by which age, severity of illness, and intensive care affect subsequent healthcare utilization. Furthermore, sepsis patients are a heterogeneous population in terms of severity of illness, site and pathogen of infection, and underlying comorbidity whose posthospital course remains incompletely characterized, limiting our ability to draw strong inferences.
These results should be interpreted in light of the study's limitations. First, our cohort included patients with healthcare insurance within a community‐based healthcare system. Care within the KPNC system, which bears similarities with accountable care organizations, is enhanced through service integration and a comprehensive health information system. Although prior studies suggest that these characteristics result in improved population‐based care, it is unclear whether there is a similar impact in hospital‐based conditions such as sepsis.[54, 55] Furthermore, care within an integrated system may impact posthospital utilization patterns and could limit generalizability. However, prior studies demonstrate the similarity of KPNC members to other patients in the same region in terms of age, socioeconomics, overall health behaviors, and racial/ethnic diversity.[56] Second, our study did not characterize organ dysfunction based on diagnosis coding, a common feature of sepsis studies that lack detailed physiologic severity data.[4, 5, 6, 8, 26] Instead, we focused on using granular laboratory and vital signs data to ensure accurate risk adjustment using a validated system developed in >400,000 hospitalizations.[30] Although this method may hamper comparisons with existing studies, traditional methods of grading severity by diagnosis codes can be vulnerable to biases resulting in wide variability.[10, 23, 26, 57, 58] Nonetheless, it is likely that characterizing preexisting and acute organ dysfunction will improve risk stratification in the heterogeneous sepsis population. Third, this study did not include data regarding patients' functional status, which has been shown to strongly predict patient outcomes following hospitalization. Fourth, this study did not address the cost of care following sepsis hospitalizations.[19, 59] Finally, our study excluded patients with incomplete utilization records, a choice designed to avoid the spurious inferences that can result from such comparisons.[53]
In summary, we found that sepsis exacted a considerable toll on patients in the hospital and in the year following discharge. Sepsis patients were frequently rehospitalized within a month of discharge, and on average had a 3‐fold increase in their subsequent time spent in healthcare facilities. Although age, severity of illness, and the need for ICU care impacted postsepsis utilization, the dominant contributing factorscomorbid disease burden or presepsis utilizationwere present prior to sepsis hospitalization. Early readmission patterns in sepsis appeared similar to those seen in other important hospital conditions, suggesting a role for shared posthospital, rather than just postsepsis, care approaches.
Disclosures
The funding for this study was provided by The Permanente Medical Group, Inc. and Kaiser Foundation Hospitals. The authors have no conflict of interests to disclose relevant to this article.
- . The lingering consequences of sepsis: a hidden public health disaster? JAMA. 2010;304(16):1833–1834.
- , , , et al.; Surviving Sepsis Campaign Guidelines Committee including the Pediatric Subgroup. Surviving sepsis campaign: international guidelines for management of severe sepsis and septic shock: 2012. Crit Care Med. 2013;41(2):580–637.
- , , . Costs for hospital stays in the United States, 2010. HCUP statistical brief #16. January 2013. Rockville, MD: Agency for Healthcare Research and Quality; 2013. Available at: http://www.hcup‐us.ahrq.gov/reports/statbriefs/sb146.pdf. Accessed October 1, 2013.
- , , , . The epidemiology of sepsis in the United States from 1979 through 2000. N Engl J Med. 2003;348(16):1546–1554.
- , , , , , . Epidemiology of severe sepsis in the United States: analysis of incidence, outcome, and associated costs of care. Crit Care Med. 2001;29(7):1303–1310.
- , , , . Rapid increase in hospitalization and mortality rates for severe sepsis in the United States: a trend analysis from 1993 to 2003. Crit Care Med. 2007;35(5):1244–1250.
- , , . Septicemia in U.S. hospitals, 2009. HCUP statistical brief #122. October 2011. Rockville, MD: Agency for Healthcare Research and Quality; 2011. Available at: http://www.hcup‐us.ahrq.gov/reports/statbriefs/sb122.pdf. Accessed October 1, 2013.
- , , , , , . Hospitalizations, costs, and outcomes of severe sepsis in the United States 2003 to 2007. Crit Care Med. 2012;40(3):754–761.
- , , , . Population burden of long‐term survivorship after severe sepsis in older Americans. J Am Geriatr Soc. 2012;60(6):1070–1077.
- , , , . Benchmarking the incidence and mortality of severe sepsis in the United States. Crit Care Med. 2013;41(5):1167–1174.
- , , , et al. Outcomes of the Surviving Sepsis Campaign in intensive care units in the USA and Europe: a prospective cohort study. Lancet Infect Dis. 2012;12(12):919–924.
- , , , . Reducing mortality in severe sepsis: the Surviving Sepsis Campaign. Clin Chest Med. 2008;29(4):721–733, x.
- , , , et al.; Early Goal‐Directed Therapy Collaborative Group. Early goal‐directed therapy in the treatment of severe sepsis and septic shock. N Engl J Med. 2001;345(19):1368–1377.
- , , , . Long‐term cognitive impairment and functional disability among survivors of severe sepsis. JAMA. 2010;304(16):1787–1794.
- , , , , , . Long‐term mortality and quality of life in sepsis: a systematic review. Crit Care Med. 2010;38(5):1276–1283.
- , , , et al.; the Scottish Critical Care Trials Group and the Scottish Intensive Care Society Audit Group. Mortality and quality of life in the five years after severe sepsis. Crit Care. 2013;17(2):R70.
- , , , , . Post‐Discharge Health Care Use Is Markedly Higher in Survivors of Severe Sepsis. Am J Respir Crit Care Med 2013;187:A1573.
- , , , . Long‐term survival and function after suspected gram‐negative sepsis. JAMA. 1995;274(4):338–345.
- , , , , . Long‐term mortality and medical care charges in patients with severe sepsis. Crit Care Med. 2003;31(9):2316–2323.
- , , , et al. Diagnoses and timing of 30‐day readmissions after hospitalization for heart failure, acute myocardial infarction, or pneumonia. JAMA. 2013;309(4):355–363.
- , , , , . A systematic review and meta‐analysis of studies comparing readmission rates and mortality rates in patients with heart failure. Arch Intern Med. 2004;164(21):2315–2320.
- , . Hospitalizations for heart failure in the United States—a sign of hope. JAMA. 2011;306(15):1705–1706.
- , , , et al. Risk prediction models for hospital readmission: a systematic review. JAMA. 2011;306(15):1688–1698.
- , . Sepsis after Scotland: enough with the averages, show us the effect modifiers. Crit Care. 2013;17(3):148.
- , , , et al. Kaiser Permanente's performance improvement system, part 3: multisite improvements in care for patients with sepsis. Jt Comm J Qual Patient Saf. 2011;37(11): 483–493.
- , , , et al. Identifying patients with severe sepsis using administrative claims: patient‐level validation of the Angus implementation of the International Consensus Conference Definition of Severe Sepsis [published online ahead of print September 18, 2012]. Med Care. doi: 10.1097/MLR.0b013e318268ac86. Epub ahead of print.
- . Linking automated databases for research in managed care settings. Ann Intern Med. 1997;127(8 pt 2):719–724.
- , , , , , . Risk‐adjusting hospital inpatient mortality using automated inpatient, outpatient, and laboratory databases. Med Care. 2008;46(3):232–239.
- , , , , . An electronic Simplified Acute Physiology Score‐based risk adjustment score for critical illness in an integrated healthcare system. Crit Care Med. 2013;41(1):41–48.
- , , , , . Risk‐adjusting hospital mortality using a comprehensive electronic record in an integrated health care delivery system. Med Care. 2013;51(5):446–453.
- , , , , , . Early detection of impending physiologic deterioration among patients who are not in intensive care: development of predictive models using data from an automated electronic medical record. J Hosp Med. 2012;7(5):388–395.
- , , , . The Kaiser Permanente inpatient risk adjustment methodology was valid in an external patient population. J Clin Epidemiol. 2009;63(7):798–803.
- , , , , , . Casemix adjustment of managed care claims data using the clinical classification for health policy research method. Med Care. 1998;36(7):1108–1113.
- Agency for Healthcare Research and Quality Healthcare Cost and Utilization Project. Clinical Classifications Software (CCS) for ICD‐9‐CM Fact Sheet. Available at: http://www.hcup‐us.ahrq.gov/toolssoftware/ccs/ccsfactsheet.jsp. Accessed January 20, 2013.
- , . A proportional hazards model for the subdistribution of a competing risk. J Am Stat Assoc. 1997;94(446):496–509.
- , , . Severe sepsis in managed care: analysis of incidence, one‐year mortality, and associated costs of care. J Manag Care Pharm. 2004;10(6):521–530.
- , , , , , . Detailed cost analysis of care for survivors of severe sepsis. Crit Care Med. 2004;32(4):981–985.
- , , , , et al. Readmissions among patients with severe sepsis/septic shock among inner‐city minority New Yorkers. Chest. 2012;142:286A.
- , , . Readmission and late mortality after pediatric severe sepsis. Pediatrics. 2009;123(3):849–857.
- , , . Rehospitalizations among patients in the Medicare fee‐for‐service program. N Engl J Med. 2009;360(14):1418–1428.
- . Post‐hospital syndrome—an acquired, transient condition of generalized risk. N Engl J Med. 2013;368(2):100–102.
- , , , et al. Definitions for sepsis and organ failure and guidelines for the use of innovative therapies in sepsis. The ACCP/SCCM Consensus Conference Committee. American College of Chest Physicians/Society of Critical Care Medicine. Chest. 1992;101(6):1644–1655.
- , , . The effect of age on the development and outcome of adult sepsis. Crit Care Med. 2006;34(1):15–21.
- , . Multiple systems organ failure: failure of host defense homeostasis. Crit Care Clin. 1989;5(2):199–220.
- . Pathophysiology of sepsis. Am J Pathol. 2007;170(5):1435–1444.
- , . Surviving intensive care: a report from the 2002 Brussels Roundtable. Intensive Care Med. 2003;29(3):368–377.
- , , . The encephalopathy in sepsis. Crit Care Clin. 2008;24(1):67–82, viii.
- , . Sepsis‐associated encephalopathy. Nat Rev Neurol. 2012;8(10):557–566.
- , , , et al. Improving long‐term outcomes after discharge from intensive care unit: report from a stakeholders' conference. Crit Care Med. 2012;40(2):502–509.
- , , , , . The association between sepsis and potential medical injury among hospitalized patients. Chest. 2012;142(3):606–613.
- , , , , , . Three‐year outcomes for Medicare beneficiaries who survive intensive care. JAMA. 2010;303(9):849–856.
- , , , , , . Does acute organ dysfunction predict patient‐centered outcomes? Chest. 2002;121(6):1963–1971.
- , , , . Spurious inferences about long‐term outcomes: the case of severe sepsis and geriatric conditions. Am J Respir Crit Care Med. 2012;185(8):835–841.
- , , , , , . Population trends in the incidence and outcomes of acute myocardial infarction. N Engl J Med. 2010;362(23):2155–2165.
- , , , et al., Outpatient electronic health records and the clinical care and outcomes of patients with diabetes mellitus. Ann Intern Med. 2012;157(7):482–489.
- . Similarity of the adult Kaiser Permanente membership in Northern California to the insured and general population in Northern California: statistics from the 2009 California Health Interview Survey. Internal Division of Research Report. Oakland, CA: Kaiser Permanente Division of Research; January 24, 2012. Available at: http://www.dor.kaiser.org/external/chis_non_kp_2009. Accessed January 20, 2013.
- , , , , . Association of diagnostic coding with trends in hospitalizations and mortality of patients with pneumonia, 2003–2009. JAMA. 2012;307(13):1405–1413.
- , . Finding pure and simple truths with administrative data. JAMA. 2012;307(13):1433–1435.
- , , , . Cost savings attributable to reductions in intensive care unit length of stay for mechanically ventilated patients. Med Care. 2008;46(12):1226–1233.
© 2014 Society of Hospital Medicine
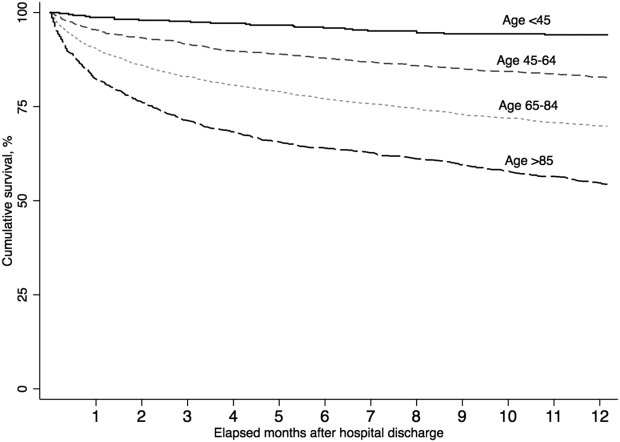
Predicting Recurrence Risk
Clostridium difficile infection (CDI) is a serious and costly condition whose volume in US hospitals has doubled over the last decade.[1, 2, 3] Along with this rise in incidence, its severity has also increased. Although in the United States there has been a doubling in age‐adjusted case fatality, in the same time period Canadian studies reported a high and increasing CDI‐associated case fatality in the setting of an outbreak of a novel epidemic hypervirulent strain BI/NAP1/027.[2, 4, 5, 6] The costs of CDI range widely ($2500 to $13,000 per hospitalization), with cumulative annual cost to the US healthcare system estimated at nearly $5 billion.[7, 8, 9]
One of the drivers of these clinical and economic outcomes is CDI recurrence (rCDI). In 2 recent randomized controlled trials, up to 25% of patients with an initial CDI (iCDI) episode developed rCDI.[10, 11] There are few data that quantify the impact of rCDI on quality of life and survival. However, patients often are readmitted to the hospital with rCDI, and physicians who treat patients with multiple episodes of rCDI can attest to the devastating toll it takes on the lives of the patients and their families (personal communications from numerous patients to E.R.D.).[12] Reducing the incidence of rCDI may significantly improve the course of this disease.
The advent of such new treatments as fidaxomicin aimed at rCDI is promising.[10, 11] However, evidence for its efficacy so far is limited to treatment‐naive iCDI patients, thus challenging clinicians to identify patients at high risk for rCDI at iCDI onset. To address this challenge, we set out to develop a bedside prediction model for rCDI based on the factors present and routinely available at the onset of iCDI.
METHODS
Study Design and Data Source
We conducted a retrospective single‐center cohort study to examine the factors present at the onset of iCDI that impact the incidence of rCDI among hospitalized patients. Patients were included in the study if they were adults (18 years) hospitalized at Barnes‐Jewish Hospital (BJH), St. Louis, Missouri, between January 1, 2003 and December 31, 2009, and who had a positive toxin assay for C difficile in the setting of unformed stools and no history of CDI in the previous 60 days (as defined by positive toxin assay). Patients were excluded if they either died during or were discharged to hospice from the iCDI hospitalization. Cases of iCDI were categorized according to published surveillance definitions as community onset‐healthcare facility associated (CO‐HCFA), healthcare facility onset, and community associated.[13] Notably, the CO‐HCFA category included surveillance definitions for both CO‐HCFA and indeterminate cases. We defined rCDI as a repeat positive toxin within 42 days following the end of iCDI treatment. This period of risk for rCDI was chosen because the current surveillance definition for rCDI is a new episode of CDI occurring within 8 weeks from the last episode of CDI, with the assumption the patient would receive 10 to 14 days of CDI treatment at the beginning of the 8‐week period.[14] Medical charts were reviewed for all readmissions during the recurrence risk period to identify patients diagnosed with rCDI by methods other than toxin assay. A study enrollment flow chart is shown in Figure 1.
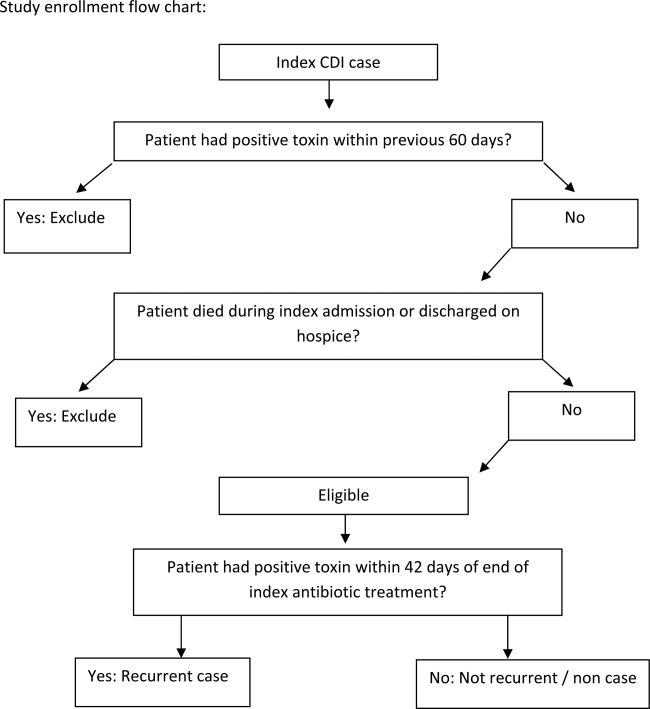
Demographic and clinical data were derived from the BJH medical informatics databases and the BJH electronic medical records (see Supporting Appendix Table 1 in the online version of this article). Comorbidities were grouped using the Charlson‐Deyo categories.[15] All variables were limited to data that are consistent throughout a hospitalization (eg, race or age) or were present within 48 hours of iCDI (eg, medications).
Model Development and Validation
First, we examined risk factors for rCDI present at the time of the iCDI diagnosis and initiation of iCDI therapy. We used principal‐component analyses, corresponding analyses, and cluster analyses to reduce the data dimensions by combining variables reflecting the same underlying construct.[16] Several antibiotic categories were created. The high‐risk category included cephalosporins, clindamycin, and aminopenicillins.[17] Other categories examined separately were fluoroquinolones, intravenous vancomycin, and antibiotics considered low risk (all other drugs not encompassed in the prior categories). Proton pump inhibitor and histamine 2 receptor‐blockers were combined into a single variable of gastric acid suppressors.
We developed a logistic regression model to identify a set of variables that best predicted the risk of rCDI. Variables with P 0.20 on univariate analyses were included in multivariable models. Backward elimination was used to determine the final model (P 0.1 for removal). The model's discrimination was examined via the C statistic and calibration through Brier score.[16] A C statistic value of 0.5 implies that the model is no better than chance, whereas the value of 1.0 means that the model is perfect in differentiating cases from noncases. A Brier score closer to zero indicates better model calibration, or how closely the predicted probabilities for rCDI match the actual observed probabilities. We validated the model using the bootstrap method with 500 iterations. To explore its properties as a decision tool to help make the decision to initiate an intervention to prevent rCDI, we tested the model's sensitivity, specificity, and positive and negative predictive values at various thresholds of prior probability of rCDI.
RESULTS
Among the 4196 patients with iCDI enrolled in the study, 425 (10.1%) developed at least 1 recurrence within 42 days of the end of iCDI treatment (Table 1). Compared to patients without a recurrence, in univariate analysis those with an rCDI episode were older and had a greater comorbidity burden. In particular, diabetes mellitus (odds ratio 1.34; 95% confidence interval [CI], 1.08‐1.66) and cerebrovascular disease (odds ratio 1.47; 95% CI, 1.04‐2.08) were significantly more prevalent in the rCDI group. The index CDI episode for patients with rCDI was approximately twice as likely to fit the surveillance definition for CO‐HCFA than the index episode for those without a recurrence (odds ratio 2.24; 95% CI, 1.80‐2.79). Commensurately, patients with rCDI also had greater odds for experiencing multiple recent hospitalizations than those without rCDI. Neither type of CDI treatment (oral metronidazole vs oral vancomycin vs both), nor duration, was significantly associated with recurrence.
| Patient Characteristics | Patients Who Developed rCDI, N = 425 | Patients Who Did Not Develop rCDI, n = 3771) | Odds Ratio (95% CI) | P Value |
|---|---|---|---|---|
| ||||
| Demographics | ||||
| Age, y, median (range)a | 64.8(18.398.2) | 61.6(18.0102.4) | 1.10 (1.041.16) | <0.001 |
| Female | 210 (49) | 1822 (48) | 1.05 (0.861.28) | 0.67 |
| Nonwhite race | 149 (35) | 1149 (31) | 1.23 (1.001.52) | 0.05 |
| Comorbiditiesb | ||||
| Myocardial infarction | 40 (9) | 328 (9) | 1.10 (0.771.54) | 0.62 |
| Congestive heart failure | 108 (25) | 854 (23) | 1.17 (0.931.47) | 0.19 |
| Peripheral vascular disease | 34 (8) | 269 (7) | 1.13 (0.781.64) | 0.51 |
| Cerebrovascular disease | 41 (10) | 256 (7) | 1.47 (1.042.08) | 0.03 |
| Chronic renal failure | 21 (5) | 190 (5) | 0.98 (0.621.56) | 0.94 |
| Dementia | 5 (1) | 23 (1) | 1.94 (0.735.14) | 0.18 |
| Chronic obstructive pulmonary disease | 116 (27) | 911 (24) | 1.18 (0.941.48) | 0.15 |
| Rheumatologic disease | 18 (4) | 146 (4) | 1.10 (0.671.81) | 0.71 |
| Peptic ulcer disease | 20 (5) | 154 (4) | 1.16 (0.721.87) | 0.54 |
| Mild liver disease | 17 (4) | 201 (5) | 0.74 (0.451.23) | 0.25 |
| Moderate‐to‐severe liver disease | 12 (3) | 134 (4) | 0.79 (0.431.44) | 0.44 |
| Diabetes, any | 135 (32) | 974 (26) | 1.34 (1.081.66) | 0.009 |
| Paraplegia or hemiplegia | 12 (3) | 77 (2) | 1.38 (0.742.55) | 0.31 |
| Any malignancy (excluding leukemia/lymphoma) | 83 (20) | 770 (20) | 0.95 (0.741.22) | 0.67 |
| Leukemia or lymphoma | 78 (18) | 660 (18) | 1.06 (0.821.38) | 0.66 |
| Metastatic solid tumor | 56 (13) | 449 (12) | 1.12 (0.841.51) | 0.44 |
| HIV/AIDS | 10 (2) | 66 (2) | 1.36 (0.692.67) | 0.38 |
| Charlson composite score | ||||
| 02 | 223 (53) | 2179 (58) | Ref | |
| 35 | 117 (28) | 921 (24) | 1.24 (0.981.57) | 0.07 |
| 6 | 85(20) | 671 (18) | 1.24 (0.951.61) | 0.11 |
| Case statusc | ||||
| HCFO/HCFA | 203 (48) | 2331 (62) | Ref | |
| CA or unknown | 57 (13) | 595 (16) | 1.10 (0.811.50) | 0.54 |
| CO/HCFA, indeterminate, or non‐ BJHHCFA | 165 (39) | 845 (22) | 2.24 (1.802.79) | <0.001 |
| Prior hospitalizations | ||||
| Admitted from another healthcare facility | 109 (26) | 1018 (27) | 0.93 (0.741.17) | 0.55 |
| No. of inpatient admissions in previous 60 days | <0.001 | |||
| 0 | 200 (47) | 2310 (61) | Ref | |
| 1 | 150 (35) | 1020 (27) | 1.70 (1.362.13) | <0.001 |
| 2+ | 75 (18) | 441 (12) | 1.96 (1.482.61) | <0.001 |
| Baseline laboratory datad | ||||
| Low albumin at iCDI | 50 (12) | 548 (15) | 0.78 (0.581.07) | 0.312 |
| Low WBC at iCDI | 64 (15) | 635 (17) | 0.88 (0.661.16) | 0.36 |
| High WBC at iCDI | 247 (58) | 2027 (54) | 1.20 (0.981.46) | 0.08 |
| Low hemoglobin at iCDI | 218 (51) | 1985 (53) | 0.95 (0.781.16) | 0.61 |
| High creatinine at iCDI | 99 (23) | 862 (23) | 1.02 (0.811.30) | 0.83 |
| Low creatinine clearance at iCDI | 218 (51) | 1635 (43) | 1.38 (1.131.68) | 0.002 |
| ICU admission at iCDI | 32 (8) | 562 (15) | 0.47 (0.320.68) | <0.001 |
| Medications | ||||
| New gastric acid suppressor at iCDI | 54 (13) | 255 (7) | 2.01 (1.472.74) | <0.001 |
| Any antibiotic at iCDI | 314 (74) | 2727 (72) | 1.08 (0.861.36) | 0.49 |
| High‐risk antibiotics at iCDIe | 174 (41) | 1489 (40) | 1.06 (0.871.30) | 0.56 |
| Fluoroquinolone at iCDI | 120 (28) | 860 (23) | 1.33 (1.061.67) | 0.01 |
| Low‐risk antibiotics at iCDI | 95 (22) | 1058 (28) | 0.74 (0.580.94) | 0.01 |
| IV vancomycin at iCDI | 130 (31) | 1321 (35) | 0.82 (0.671.02) | 0.07 |
Seven factors present at the onset of iCDI were found to predict a recurrence in multivariable analysis (Table 2). Older age, CO‐HCFA status of iCDI, and 2 or more hospitalizations in the prior 60 days increased the risk of rCDI. Concomitant exposures to gastric acid suppressors, fluoroquinolone antibiotics, and high‐risk antibiotics were also significantly associated with a recurrence. Being in the intensive care unit (ICU) at the onset of iCDI was protective against rCDI in the multivariable model. This model had a C statistic of 0.642 and a Brier score of 0.089. After cross‐validation with 500 bootstrapping iterations, the model exhibited a moderately good fit (Figure 2). The prediction was particularly accurate in the lower risk ranges, with slight divergence in the risk strata over 20%. The validated model had a C statistic of 0.630 and Brier score of 0.089.
| Prediction Factors | Adjusted Odds Ratio | 95% CI |
|---|---|---|
| ||
| Agea | 1.08 | 1.021.14 |
| CO‐HCFA CDI (ref: HO‐CDI) | 1.71 | 1.322.22 |
| 2+ hospitalizations in prior 60 days (ref: 0 hospitalizations) | 1.49 | 1.082.06 |
| New gastric acid suppression at the onset of iCDI | 1.59 | 1.132.23 |
| High‐risk antibiotic at the onset of iCDIbb | 1.25 | 1.011.55 |
| Fluoroquinolone at the onset of iCDI | 1.31 | 1.041.65 |
| ICU at the onset of iCDI | 0.49 | 0.340.72 |
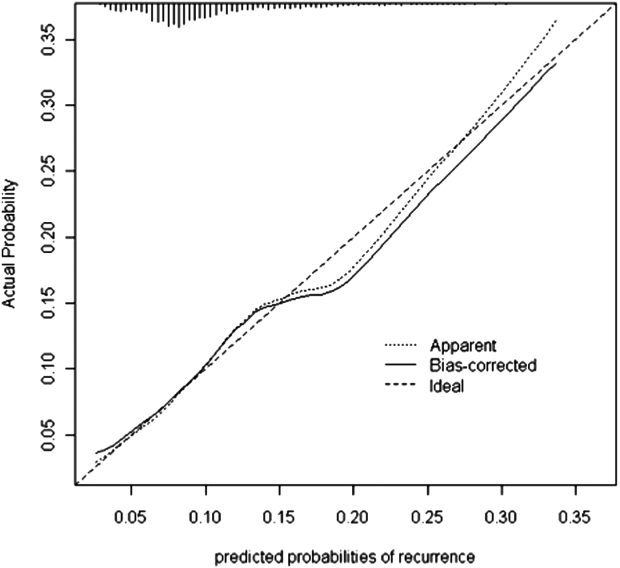
The sensitivity, specificity, and positive and negative predictive values of the model at various probability thresholds of rCDI are presented in Table 3. Thus, when the probability of rCDI was low, the model exhibited high sensitivity and low specificity. The situation was reversed as the probability of rCDI approached 30% (very low sensitivity and high specificity). The model's performance was optimal when the rCDI risk matched that in the current cohort, or 10.1%, with a sensitivity of 56% and specificity of 65%. However, when the rCDI risk dropped to 5%, the specificity dropped to below 30%. The sensitivity dropped to below 30% when rCDI risk rose to 15% (Table 3). Across the entire range of the probabilities tested, the negative predictive value of the model was persistently 90% or higher.
| Model Predicted Probability Cutpoint | Sensitivity | Specificity | PPV | NPV | Positive Likelihood Ratio | Negative Likelihood Ratio |
|---|---|---|---|---|---|---|
| ||||||
| 0.025 | 1.00 | 0.00 | 0.10 | 1.00 | 1.0 | Undef |
| 0.050 | 0.96 | 0.09 | 0.11 | 0.95 | 1.05 | 0.44 |
| 0.101a | 0.56 | 0.65 | 0.15 | 0.93 | 1.60 | 0.68 |
| 0.151 | 0.27 | 0.86 | 0.18 | 0.91 | 1.93 | 0.85 |
| 0.303 | 0.01 | 1.00 | 0.40 | 0.90 | Undef | 0.99 |
DISCUSSION
We have demonstrated that in a cohort of hospitalized patients with iCDI, 10% developed at least 1 episode of rCDI within 42 days of the end of iCDI treatment. The factors present at iCDI onset that predicted recurrence were age, CO‐HCFA CDI, prior hospitalization, high‐risk antibiotic and fluoroquinolone use, and gastric acid suppression. Although the model's performance was only moderate, its negative predictive value was 90% or higher across the entire range of rCDI probabilities tested. This means that the absence of this combination of risk factors in a patient with iCDI diminishes the probability of a rCDI episode to 10% or below, depending on the prior population risk for rCDI.
Prior investigators have developed prediction rules for rCDI. Hebert et al., using methodology similar to ours, constructed a model to predict the risk of rCDI among patients hospitalized with iCDI.[17] For example, the recurrence rate in their study was 23% compared to our 10%. This is likely due to the differing definitions of both iCDI and rCDI between the 2 studies. Although our definitions of hospital‐associated C difficile‐associated diarrhea (CDAD) conformed to the recommended surveillance definitions,[13] Hebert and colleagues used different definitions.[18] If this is so, the higher rate of rCDI in their study may have reflected these differences in surveillance definition, rather than the true prevalence of recurrent CDAD.
Several other studies have relied on either specialized laboratory tests alone or in combination with clinical factors. Stewart et al., in a small single‐center cohort study, reported the presence of the binary toxin to be the only independent predictor of rCDI.[19] Others have found lower antitoxin immunoglobulin levels at various times following the onset of iCDI to be predictive of a recurrence.[20, 21] A disadvantage of using these specialized tests as tools for clinical prediction is that they are not widely available in clinical practice. Even if these tests are available, their results are likely to return only after iCDI treatment has commenced. To make risk stratification more generalizable, we specifically focused on common data available in all clinical settings at the onset of iCDI.
We chose to restrict our risk stratification to factors present at the onset of iCDI for several reasons. First, earlier identification of patients at increased risk for rCDI may encourage clinicians to minimize subsequent exposures to non‐CDI antimicrobials and gastric acid suppressors. Second, newer anticlostridial therapies in development appear to target specifically CDI recurrence. The first anti‐CDI drug to be approved in 2 decades, fidaxomicin, has been shown to reduce the risk of a recurrence by nearly one‐half compared to vancomycin.[10, 11] Although in practice it is tempting to reserve this treatment for those patients who have multiple recurrences, there is no convincing evidence to date that the drug is similarly effective at reducing further recurrences in this population.[22, 23] Currently, the only population in which fidaxomicin treatment has been shown to reduce the risk of rCDI contains patients with at most 1 prior episode, whose first anti‐CDI exposure was to fidaxomicin.[10, 11] Thus, the intent of our model was to insure appropriate use of these new technologies from the perspective of both under‐ and overtreatment.
In general, most of the factors included in our model are neither novel nor surprising, including concurrent antibiotics and gastric acid suppression.[24, 25, 26, 27, 28, 29, 30] What is interesting about these exposures, however, is the fact that we measured them only at the onset of the iCDI episode. This implies that it is not merely the continuation of these medications after onset, but even exposure to them prior to the initial bout of CDI, that may promote a recurrence. This finding should give pause to the widespread practice of routinely prescribing gastric acid suppression to many hospitalized patients. It should also prompt a reexamination of antimicrobial choices for patients admitted for the treatment of infectious diseases in favor of those deemed at low risk for CDI whenever possible.
A relatively novel risk factor emerging from our model is the designation of the iCDI episode as CO‐HCFA.[30] A likely explanation for this relationship is that CO‐HCFA identifies a population of patients who are more ill, as evidenced by their prior hospitalization history. However, because recent hospitalizations themselves emerged as an independent predictor of rCDI in our model, CO‐HCFA designation clearly incorporates other factors important to this outcome.
Our data on illness severity are divergent from prior results. Previous work has found that increasing severity of illness is positively associated with the risk of a recurrence.[21, 31] In contrast, we found that the need for the ICU at the onset of iCDI appeared protective from rCDI. There are several explanations for this finding, the most likely being the competing mortality risk. Although we excluded from the study those patients who did not survive their iCDI hospitalizations, patients who received care in an ICU were more likely to die in the rCDI risk period than patients who did not receive care in an ICU (data not shown). Another potential explanation for this observation is that patients who develop iCDI while in the ICU may generally get more aggressive care than those contracting it on other wards, resulting in a lower risk for recurrence.
The recurrence rate in the current study is at the lower limit of what has been reported previously either in the meta‐analysis by Garey (13%50%) or in recent randomized controlled trials (25%).[10, 11, 25] This is likely due to our case identification pathway, and ascertainment bias is a potential limitation of our study. Patients with mild recurrent CDI diagnosed and treated as outpatients were not captured in our study unless their toxin assay was performed by the BJH laboratory (approximately 15% of specimens submitted to the BJH microbiology laboratory come from outpatients or affiliated outpatient or skilled nursing facilities). Similarly, recurrences diagnosed at other inpatient facilities were not captured in our study unless they were transferred to BJH for care. On the other hand, rCDI in randomized trials may be subject to a detection bias, because enrolled patients are prospectively monitored for and instructed to seek testing for recurrent diarrhea.
Our study also has limitations inherent to observational data such as confounding. We adjusted for all the available relevant potential confounders in the regression model. However, the possibility of residual confounding remains. Because our cohort was too small for a split‐cohort model validation, we employed a bootstrap method to cross‐validate our results. However, the model requires further validation in a prospective cohort in the future. The biggest limitation of our model, however, is its generalizability, because the data reflect patients and treatment patterns at an urban academic medical center, and may not mirror those of institutions with different characteristics or patients with iCDI diagnosed and managed completely in the outpatient setting.
In summary, we have developed a model to predict iCDI patients' risk of recurrence. The advantage of our model is the availability of all the factors at the onset of iCDI, when treatment decisions need to be made. Although far from perfect in its ability to discriminate those who will from those who will not develop a recurrence, it should serve as a beginning step in the direction of appropriately aggressive care that may result not only in diminishing the pool of this infection, but also in containing its spiraling costs. The cost‐benefit balance of these decisions needs to be examined explicitly, not only in terms of the financial cost of over‐ or undertreatment, but with respect to the implications of such overtreatment on development of resistance to newer anticlostridial agents.
Disclosures
This study was funded by Cubist Pharmaceuticals, Jersey City, New Jersey. The data in the article were presented in part as a poster presentation at IDWeek 2012, San Diego, California, October 1721, 2012. The authors report no conflicts of interest.
- , , . Clostridium difficile infection in patients discharged from US short‐stay hospitals, 1996–2003. Emerge Infect Dis. 2006;12:409–415.
- , , . Increase in adult Clostridium difficile‐related hospitalizations and case‐fatality rate, United States, 2000–2005. Emerg Infect Dis. 2008;14:929–931.
- , , . Clostridium difficile infections (CDI) in hospital stays, 2009. HCUP statistical brief #124. Rockville, MD: Agency for Healthcare Research and Quality; 2012. Available at: http://www.hcup‐us.ahrq.gov/reports/statbriefs/sb124.pdf. Accessed July 19, 2013.
- , , , et al. A predominantly clonal multi‐institutional outbreak of Clostridium difficile‐associated diarrhea with high morbidity and mortality. N Engl J Med. 2005;353:2442–2449.
- , , , et al. Clostridium difficile‐associated diarrhea in a region of Quebec from 1991 to 2003: a changing pattern of disease severity. CMAJ. 2004;171:466–472.
- , , , et al. An epidemic, toxin gene‐variant strain of Clostridium difficile. N Engl J Med. 2005;353(23):2433–2441.
- , , , , . Short‐ and long‐term attributable costs of Clostridium difficile‐associated disease in nonsurgical inpatients. Clin Infect Dis. 2008;46(4):497–504.
- , , , . The emerging infectious challenge of Clostridium difficile‐associated disease in Massachusetts hospitals: clinical and economic consequences. Infect Control Hosp Epidemiol. 2007;28:1219–1227.
- , . Burden of Clostridium difficile on the healthcare system. Clin Infect Dis. 2012;55(suppl 2):S88–S92.
- , , , et al. Fidaxomicin versus vancomycin for infection with Clostridium difficile in Europe, Canada, and the USA: a double‐blind, non‐inferiority, randomised controlled trial. Lancet Infect Dis. 2012;12(4):281–289.
- , , , et al. Fidaxomicin versus vancomycin for Clostridium difficile infection. N Engl J Med. 2011;364:422–431.
- , , , , , . Recurrent Clostridium difficile disease: epidemiology and clinical characteristics. Infect Control Hosp Epidemiol. 1999;20:43–50.
- , , , et al. Clinical practice guidelines for Clostridium difficile infection in adults: 2010 update by the Society for Healthcare Epidemiology of America (SHEA) and the Infectious Diseases Society of America (IDSA). Infect Control Hosp Epidemiol. 2010;31:431–455.
- , , , , , ; Ad Hoc Clostridium difficile Surveillance Working Group. Recommendations for surveillance of Clostridium difficile‐associated disease. Infect Control Hosp Epidemiol. 2007;28:140–145.
- , , . Adapting a clinical comorbidity index for use with ICD‐9‐CM administrative databases. J Clin Epidemiol. 1992;45:613–619.
- , , , . Measures for evaluating model performance. Proceedings of the Biometrics Section. Alexandria, VA: American Statistical Association, Biometrics Section; 1997:253–258.
- , , , et al. Development and validation of a Clostridium difficile infection risk prediction model. Infect Control Hosp Epidemiol. 2011;32:360–366.
- , , , . Electronic health record‐based detection of risk factors for Clostridium difficile infection relapse. Infect Control Hosp Epidemiol. 2013;34:407–414.
- , , . Predicting recurrence of C. difficile colitis using bacterial virulence factors: binary toxin is the key. J Gastrointest Surg. 2013;17:118–125.
- , , , . Association between antibody response to toxin A and protection against recurrent Clostridium difficile diarrhoea. Lancet. 2001;357:189–193.
- , , , et al. Prospective derivation and validation of a clinical prediction rule for recurrent Clostridium difficile infection. Gastroenterology. 2009;136:1206–1214.
- . Fidaxomicin failures in recurrent Clostridium difficile infection: a problem of timing. Clin Infect Dis. 2012;55:613–614.
- , . Fidaxomicin “chaser” regimen following vancomycin for patients with multiple Clostridium difficile recurrences. Clin Infect Dis. 2013;56:309–310.
- , , , et al. Predictors of first recurrence of Clostridium difficile infection: implications for initial management. Clin Infect Dis. 2012;55(suppl 2):S77–S87.
- , , , . Meta‐analysis to assess risk factors for recurrent Clostridium difficile infection. J Hosp Infect. 2008;70:298–304.
- , , , , , . Recurrent Clostridium difficile diarrhea: characteristics of and risk factors for patients enrolled in a prospective, randomized, double‐blinded trial. Clin Infect Dis. 1997;24:324–333.
- , , , , . Association of proton‐pump inhibitors with outcomes in Clostridium difficile colitis. Am J Health Syst Pharm. 2007;64:2359–2363.
- , , , et al. Proton pump inhibitors as a risk factor for recurrence of Clostridium‐difficile‐associated diarrhea. World J Gastroenterol. 2010;16:3573–3577.
- , , . Proton pump inhibitor use and recurrent Clostridium difficile‐associated disease: a case‐control analysis matched by propensity score. J Clin Gastroenterol. 2012;46:397–400.
- , , , , , . Risk of Clostridium difficile infection with acid suppressing drugs and antibiotics: meta‐analysis. Am J Gastroenterol. 2012;107(7):1011–1019.
- , , , et al. Risk factors for early recurrent Clostridium difficile‐associated diarrhea. Clin Infect Dis. 1998;26:954–959.
Clostridium difficile infection (CDI) is a serious and costly condition whose volume in US hospitals has doubled over the last decade.[1, 2, 3] Along with this rise in incidence, its severity has also increased. Although in the United States there has been a doubling in age‐adjusted case fatality, in the same time period Canadian studies reported a high and increasing CDI‐associated case fatality in the setting of an outbreak of a novel epidemic hypervirulent strain BI/NAP1/027.[2, 4, 5, 6] The costs of CDI range widely ($2500 to $13,000 per hospitalization), with cumulative annual cost to the US healthcare system estimated at nearly $5 billion.[7, 8, 9]
One of the drivers of these clinical and economic outcomes is CDI recurrence (rCDI). In 2 recent randomized controlled trials, up to 25% of patients with an initial CDI (iCDI) episode developed rCDI.[10, 11] There are few data that quantify the impact of rCDI on quality of life and survival. However, patients often are readmitted to the hospital with rCDI, and physicians who treat patients with multiple episodes of rCDI can attest to the devastating toll it takes on the lives of the patients and their families (personal communications from numerous patients to E.R.D.).[12] Reducing the incidence of rCDI may significantly improve the course of this disease.
The advent of such new treatments as fidaxomicin aimed at rCDI is promising.[10, 11] However, evidence for its efficacy so far is limited to treatment‐naive iCDI patients, thus challenging clinicians to identify patients at high risk for rCDI at iCDI onset. To address this challenge, we set out to develop a bedside prediction model for rCDI based on the factors present and routinely available at the onset of iCDI.
METHODS
Study Design and Data Source
We conducted a retrospective single‐center cohort study to examine the factors present at the onset of iCDI that impact the incidence of rCDI among hospitalized patients. Patients were included in the study if they were adults (18 years) hospitalized at Barnes‐Jewish Hospital (BJH), St. Louis, Missouri, between January 1, 2003 and December 31, 2009, and who had a positive toxin assay for C difficile in the setting of unformed stools and no history of CDI in the previous 60 days (as defined by positive toxin assay). Patients were excluded if they either died during or were discharged to hospice from the iCDI hospitalization. Cases of iCDI were categorized according to published surveillance definitions as community onset‐healthcare facility associated (CO‐HCFA), healthcare facility onset, and community associated.[13] Notably, the CO‐HCFA category included surveillance definitions for both CO‐HCFA and indeterminate cases. We defined rCDI as a repeat positive toxin within 42 days following the end of iCDI treatment. This period of risk for rCDI was chosen because the current surveillance definition for rCDI is a new episode of CDI occurring within 8 weeks from the last episode of CDI, with the assumption the patient would receive 10 to 14 days of CDI treatment at the beginning of the 8‐week period.[14] Medical charts were reviewed for all readmissions during the recurrence risk period to identify patients diagnosed with rCDI by methods other than toxin assay. A study enrollment flow chart is shown in Figure 1.
Demographic and clinical data were derived from the BJH medical informatics databases and the BJH electronic medical records (see Supporting Appendix Table 1 in the online version of this article). Comorbidities were grouped using the Charlson‐Deyo categories.[15] All variables were limited to data that are consistent throughout a hospitalization (eg, race or age) or were present within 48 hours of iCDI (eg, medications).
Model Development and Validation
First, we examined risk factors for rCDI present at the time of the iCDI diagnosis and initiation of iCDI therapy. We used principal‐component analyses, corresponding analyses, and cluster analyses to reduce the data dimensions by combining variables reflecting the same underlying construct.[16] Several antibiotic categories were created. The high‐risk category included cephalosporins, clindamycin, and aminopenicillins.[17] Other categories examined separately were fluoroquinolones, intravenous vancomycin, and antibiotics considered low risk (all other drugs not encompassed in the prior categories). Proton pump inhibitor and histamine 2 receptor‐blockers were combined into a single variable of gastric acid suppressors.
We developed a logistic regression model to identify a set of variables that best predicted the risk of rCDI. Variables with P 0.20 on univariate analyses were included in multivariable models. Backward elimination was used to determine the final model (P 0.1 for removal). The model's discrimination was examined via the C statistic and calibration through Brier score.[16] A C statistic value of 0.5 implies that the model is no better than chance, whereas the value of 1.0 means that the model is perfect in differentiating cases from noncases. A Brier score closer to zero indicates better model calibration, or how closely the predicted probabilities for rCDI match the actual observed probabilities. We validated the model using the bootstrap method with 500 iterations. To explore its properties as a decision tool to help make the decision to initiate an intervention to prevent rCDI, we tested the model's sensitivity, specificity, and positive and negative predictive values at various thresholds of prior probability of rCDI.
RESULTS
Among the 4196 patients with iCDI enrolled in the study, 425 (10.1%) developed at least 1 recurrence within 42 days of the end of iCDI treatment (Table 1). Compared to patients without a recurrence, in univariate analysis those with an rCDI episode were older and had a greater comorbidity burden. In particular, diabetes mellitus (odds ratio 1.34; 95% confidence interval [CI], 1.08‐1.66) and cerebrovascular disease (odds ratio 1.47; 95% CI, 1.04‐2.08) were significantly more prevalent in the rCDI group. The index CDI episode for patients with rCDI was approximately twice as likely to fit the surveillance definition for CO‐HCFA than the index episode for those without a recurrence (odds ratio 2.24; 95% CI, 1.80‐2.79). Commensurately, patients with rCDI also had greater odds for experiencing multiple recent hospitalizations than those without rCDI. Neither type of CDI treatment (oral metronidazole vs oral vancomycin vs both), nor duration, was significantly associated with recurrence.
| Patient Characteristics | Patients Who Developed rCDI, N = 425 | Patients Who Did Not Develop rCDI, n = 3771) | Odds Ratio (95% CI) | P Value |
|---|---|---|---|---|
| ||||
| Demographics | ||||
| Age, y, median (range)a | 64.8(18.398.2) | 61.6(18.0102.4) | 1.10 (1.041.16) | <0.001 |
| Female | 210 (49) | 1822 (48) | 1.05 (0.861.28) | 0.67 |
| Nonwhite race | 149 (35) | 1149 (31) | 1.23 (1.001.52) | 0.05 |
| Comorbiditiesb | ||||
| Myocardial infarction | 40 (9) | 328 (9) | 1.10 (0.771.54) | 0.62 |
| Congestive heart failure | 108 (25) | 854 (23) | 1.17 (0.931.47) | 0.19 |
| Peripheral vascular disease | 34 (8) | 269 (7) | 1.13 (0.781.64) | 0.51 |
| Cerebrovascular disease | 41 (10) | 256 (7) | 1.47 (1.042.08) | 0.03 |
| Chronic renal failure | 21 (5) | 190 (5) | 0.98 (0.621.56) | 0.94 |
| Dementia | 5 (1) | 23 (1) | 1.94 (0.735.14) | 0.18 |
| Chronic obstructive pulmonary disease | 116 (27) | 911 (24) | 1.18 (0.941.48) | 0.15 |
| Rheumatologic disease | 18 (4) | 146 (4) | 1.10 (0.671.81) | 0.71 |
| Peptic ulcer disease | 20 (5) | 154 (4) | 1.16 (0.721.87) | 0.54 |
| Mild liver disease | 17 (4) | 201 (5) | 0.74 (0.451.23) | 0.25 |
| Moderate‐to‐severe liver disease | 12 (3) | 134 (4) | 0.79 (0.431.44) | 0.44 |
| Diabetes, any | 135 (32) | 974 (26) | 1.34 (1.081.66) | 0.009 |
| Paraplegia or hemiplegia | 12 (3) | 77 (2) | 1.38 (0.742.55) | 0.31 |
| Any malignancy (excluding leukemia/lymphoma) | 83 (20) | 770 (20) | 0.95 (0.741.22) | 0.67 |
| Leukemia or lymphoma | 78 (18) | 660 (18) | 1.06 (0.821.38) | 0.66 |
| Metastatic solid tumor | 56 (13) | 449 (12) | 1.12 (0.841.51) | 0.44 |
| HIV/AIDS | 10 (2) | 66 (2) | 1.36 (0.692.67) | 0.38 |
| Charlson composite score | ||||
| 02 | 223 (53) | 2179 (58) | Ref | |
| 35 | 117 (28) | 921 (24) | 1.24 (0.981.57) | 0.07 |
| 6 | 85(20) | 671 (18) | 1.24 (0.951.61) | 0.11 |
| Case statusc | ||||
| HCFO/HCFA | 203 (48) | 2331 (62) | Ref | |
| CA or unknown | 57 (13) | 595 (16) | 1.10 (0.811.50) | 0.54 |
| CO/HCFA, indeterminate, or non‐ BJHHCFA | 165 (39) | 845 (22) | 2.24 (1.802.79) | <0.001 |
| Prior hospitalizations | ||||
| Admitted from another healthcare facility | 109 (26) | 1018 (27) | 0.93 (0.741.17) | 0.55 |
| No. of inpatient admissions in previous 60 days | <0.001 | |||
| 0 | 200 (47) | 2310 (61) | Ref | |
| 1 | 150 (35) | 1020 (27) | 1.70 (1.362.13) | <0.001 |
| 2+ | 75 (18) | 441 (12) | 1.96 (1.482.61) | <0.001 |
| Baseline laboratory datad | ||||
| Low albumin at iCDI | 50 (12) | 548 (15) | 0.78 (0.581.07) | 0.312 |
| Low WBC at iCDI | 64 (15) | 635 (17) | 0.88 (0.661.16) | 0.36 |
| High WBC at iCDI | 247 (58) | 2027 (54) | 1.20 (0.981.46) | 0.08 |
| Low hemoglobin at iCDI | 218 (51) | 1985 (53) | 0.95 (0.781.16) | 0.61 |
| High creatinine at iCDI | 99 (23) | 862 (23) | 1.02 (0.811.30) | 0.83 |
| Low creatinine clearance at iCDI | 218 (51) | 1635 (43) | 1.38 (1.131.68) | 0.002 |
| ICU admission at iCDI | 32 (8) | 562 (15) | 0.47 (0.320.68) | <0.001 |
| Medications | ||||
| New gastric acid suppressor at iCDI | 54 (13) | 255 (7) | 2.01 (1.472.74) | <0.001 |
| Any antibiotic at iCDI | 314 (74) | 2727 (72) | 1.08 (0.861.36) | 0.49 |
| High‐risk antibiotics at iCDIe | 174 (41) | 1489 (40) | 1.06 (0.871.30) | 0.56 |
| Fluoroquinolone at iCDI | 120 (28) | 860 (23) | 1.33 (1.061.67) | 0.01 |
| Low‐risk antibiotics at iCDI | 95 (22) | 1058 (28) | 0.74 (0.580.94) | 0.01 |
| IV vancomycin at iCDI | 130 (31) | 1321 (35) | 0.82 (0.671.02) | 0.07 |
Seven factors present at the onset of iCDI were found to predict a recurrence in multivariable analysis (Table 2). Older age, CO‐HCFA status of iCDI, and 2 or more hospitalizations in the prior 60 days increased the risk of rCDI. Concomitant exposures to gastric acid suppressors, fluoroquinolone antibiotics, and high‐risk antibiotics were also significantly associated with a recurrence. Being in the intensive care unit (ICU) at the onset of iCDI was protective against rCDI in the multivariable model. This model had a C statistic of 0.642 and a Brier score of 0.089. After cross‐validation with 500 bootstrapping iterations, the model exhibited a moderately good fit (Figure 2). The prediction was particularly accurate in the lower risk ranges, with slight divergence in the risk strata over 20%. The validated model had a C statistic of 0.630 and Brier score of 0.089.
| Prediction Factors | Adjusted Odds Ratio | 95% CI |
|---|---|---|
| ||
| Agea | 1.08 | 1.021.14 |
| CO‐HCFA CDI (ref: HO‐CDI) | 1.71 | 1.322.22 |
| 2+ hospitalizations in prior 60 days (ref: 0 hospitalizations) | 1.49 | 1.082.06 |
| New gastric acid suppression at the onset of iCDI | 1.59 | 1.132.23 |
| High‐risk antibiotic at the onset of iCDIbb | 1.25 | 1.011.55 |
| Fluoroquinolone at the onset of iCDI | 1.31 | 1.041.65 |
| ICU at the onset of iCDI | 0.49 | 0.340.72 |
The sensitivity, specificity, and positive and negative predictive values of the model at various probability thresholds of rCDI are presented in Table 3. Thus, when the probability of rCDI was low, the model exhibited high sensitivity and low specificity. The situation was reversed as the probability of rCDI approached 30% (very low sensitivity and high specificity). The model's performance was optimal when the rCDI risk matched that in the current cohort, or 10.1%, with a sensitivity of 56% and specificity of 65%. However, when the rCDI risk dropped to 5%, the specificity dropped to below 30%. The sensitivity dropped to below 30% when rCDI risk rose to 15% (Table 3). Across the entire range of the probabilities tested, the negative predictive value of the model was persistently 90% or higher.
| Model Predicted Probability Cutpoint | Sensitivity | Specificity | PPV | NPV | Positive Likelihood Ratio | Negative Likelihood Ratio |
|---|---|---|---|---|---|---|
| ||||||
| 0.025 | 1.00 | 0.00 | 0.10 | 1.00 | 1.0 | Undef |
| 0.050 | 0.96 | 0.09 | 0.11 | 0.95 | 1.05 | 0.44 |
| 0.101a | 0.56 | 0.65 | 0.15 | 0.93 | 1.60 | 0.68 |
| 0.151 | 0.27 | 0.86 | 0.18 | 0.91 | 1.93 | 0.85 |
| 0.303 | 0.01 | 1.00 | 0.40 | 0.90 | Undef | 0.99 |
DISCUSSION
We have demonstrated that in a cohort of hospitalized patients with iCDI, 10% developed at least 1 episode of rCDI within 42 days of the end of iCDI treatment. The factors present at iCDI onset that predicted recurrence were age, CO‐HCFA CDI, prior hospitalization, high‐risk antibiotic and fluoroquinolone use, and gastric acid suppression. Although the model's performance was only moderate, its negative predictive value was 90% or higher across the entire range of rCDI probabilities tested. This means that the absence of this combination of risk factors in a patient with iCDI diminishes the probability of a rCDI episode to 10% or below, depending on the prior population risk for rCDI.
Prior investigators have developed prediction rules for rCDI. Hebert et al., using methodology similar to ours, constructed a model to predict the risk of rCDI among patients hospitalized with iCDI.[17] For example, the recurrence rate in their study was 23% compared to our 10%. This is likely due to the differing definitions of both iCDI and rCDI between the 2 studies. Although our definitions of hospital‐associated C difficile‐associated diarrhea (CDAD) conformed to the recommended surveillance definitions,[13] Hebert and colleagues used different definitions.[18] If this is so, the higher rate of rCDI in their study may have reflected these differences in surveillance definition, rather than the true prevalence of recurrent CDAD.
Several other studies have relied on either specialized laboratory tests alone or in combination with clinical factors. Stewart et al., in a small single‐center cohort study, reported the presence of the binary toxin to be the only independent predictor of rCDI.[19] Others have found lower antitoxin immunoglobulin levels at various times following the onset of iCDI to be predictive of a recurrence.[20, 21] A disadvantage of using these specialized tests as tools for clinical prediction is that they are not widely available in clinical practice. Even if these tests are available, their results are likely to return only after iCDI treatment has commenced. To make risk stratification more generalizable, we specifically focused on common data available in all clinical settings at the onset of iCDI.
We chose to restrict our risk stratification to factors present at the onset of iCDI for several reasons. First, earlier identification of patients at increased risk for rCDI may encourage clinicians to minimize subsequent exposures to non‐CDI antimicrobials and gastric acid suppressors. Second, newer anticlostridial therapies in development appear to target specifically CDI recurrence. The first anti‐CDI drug to be approved in 2 decades, fidaxomicin, has been shown to reduce the risk of a recurrence by nearly one‐half compared to vancomycin.[10, 11] Although in practice it is tempting to reserve this treatment for those patients who have multiple recurrences, there is no convincing evidence to date that the drug is similarly effective at reducing further recurrences in this population.[22, 23] Currently, the only population in which fidaxomicin treatment has been shown to reduce the risk of rCDI contains patients with at most 1 prior episode, whose first anti‐CDI exposure was to fidaxomicin.[10, 11] Thus, the intent of our model was to insure appropriate use of these new technologies from the perspective of both under‐ and overtreatment.
In general, most of the factors included in our model are neither novel nor surprising, including concurrent antibiotics and gastric acid suppression.[24, 25, 26, 27, 28, 29, 30] What is interesting about these exposures, however, is the fact that we measured them only at the onset of the iCDI episode. This implies that it is not merely the continuation of these medications after onset, but even exposure to them prior to the initial bout of CDI, that may promote a recurrence. This finding should give pause to the widespread practice of routinely prescribing gastric acid suppression to many hospitalized patients. It should also prompt a reexamination of antimicrobial choices for patients admitted for the treatment of infectious diseases in favor of those deemed at low risk for CDI whenever possible.
A relatively novel risk factor emerging from our model is the designation of the iCDI episode as CO‐HCFA.[30] A likely explanation for this relationship is that CO‐HCFA identifies a population of patients who are more ill, as evidenced by their prior hospitalization history. However, because recent hospitalizations themselves emerged as an independent predictor of rCDI in our model, CO‐HCFA designation clearly incorporates other factors important to this outcome.
Our data on illness severity are divergent from prior results. Previous work has found that increasing severity of illness is positively associated with the risk of a recurrence.[21, 31] In contrast, we found that the need for the ICU at the onset of iCDI appeared protective from rCDI. There are several explanations for this finding, the most likely being the competing mortality risk. Although we excluded from the study those patients who did not survive their iCDI hospitalizations, patients who received care in an ICU were more likely to die in the rCDI risk period than patients who did not receive care in an ICU (data not shown). Another potential explanation for this observation is that patients who develop iCDI while in the ICU may generally get more aggressive care than those contracting it on other wards, resulting in a lower risk for recurrence.
The recurrence rate in the current study is at the lower limit of what has been reported previously either in the meta‐analysis by Garey (13%50%) or in recent randomized controlled trials (25%).[10, 11, 25] This is likely due to our case identification pathway, and ascertainment bias is a potential limitation of our study. Patients with mild recurrent CDI diagnosed and treated as outpatients were not captured in our study unless their toxin assay was performed by the BJH laboratory (approximately 15% of specimens submitted to the BJH microbiology laboratory come from outpatients or affiliated outpatient or skilled nursing facilities). Similarly, recurrences diagnosed at other inpatient facilities were not captured in our study unless they were transferred to BJH for care. On the other hand, rCDI in randomized trials may be subject to a detection bias, because enrolled patients are prospectively monitored for and instructed to seek testing for recurrent diarrhea.
Our study also has limitations inherent to observational data such as confounding. We adjusted for all the available relevant potential confounders in the regression model. However, the possibility of residual confounding remains. Because our cohort was too small for a split‐cohort model validation, we employed a bootstrap method to cross‐validate our results. However, the model requires further validation in a prospective cohort in the future. The biggest limitation of our model, however, is its generalizability, because the data reflect patients and treatment patterns at an urban academic medical center, and may not mirror those of institutions with different characteristics or patients with iCDI diagnosed and managed completely in the outpatient setting.
In summary, we have developed a model to predict iCDI patients' risk of recurrence. The advantage of our model is the availability of all the factors at the onset of iCDI, when treatment decisions need to be made. Although far from perfect in its ability to discriminate those who will from those who will not develop a recurrence, it should serve as a beginning step in the direction of appropriately aggressive care that may result not only in diminishing the pool of this infection, but also in containing its spiraling costs. The cost‐benefit balance of these decisions needs to be examined explicitly, not only in terms of the financial cost of over‐ or undertreatment, but with respect to the implications of such overtreatment on development of resistance to newer anticlostridial agents.
Disclosures
This study was funded by Cubist Pharmaceuticals, Jersey City, New Jersey. The data in the article were presented in part as a poster presentation at IDWeek 2012, San Diego, California, October 1721, 2012. The authors report no conflicts of interest.
- , , . Clostridium difficile infection in patients discharged from US short‐stay hospitals, 1996–2003. Emerge Infect Dis. 2006;12:409–415.
- , , . Increase in adult Clostridium difficile‐related hospitalizations and case‐fatality rate, United States, 2000–2005. Emerg Infect Dis. 2008;14:929–931.
- , , . Clostridium difficile infections (CDI) in hospital stays, 2009. HCUP statistical brief #124. Rockville, MD: Agency for Healthcare Research and Quality; 2012. Available at: http://www.hcup‐us.ahrq.gov/reports/statbriefs/sb124.pdf. Accessed July 19, 2013.
- , , , et al. A predominantly clonal multi‐institutional outbreak of Clostridium difficile‐associated diarrhea with high morbidity and mortality. N Engl J Med. 2005;353:2442–2449.
- , , , et al. Clostridium difficile‐associated diarrhea in a region of Quebec from 1991 to 2003: a changing pattern of disease severity. CMAJ. 2004;171:466–472.
- , , , et al. An epidemic, toxin gene‐variant strain of Clostridium difficile. N Engl J Med. 2005;353(23):2433–2441.
- , , , , . Short‐ and long‐term attributable costs of Clostridium difficile‐associated disease in nonsurgical inpatients. Clin Infect Dis. 2008;46(4):497–504.
- , , , . The emerging infectious challenge of Clostridium difficile‐associated disease in Massachusetts hospitals: clinical and economic consequences. Infect Control Hosp Epidemiol. 2007;28:1219–1227.
- , . Burden of Clostridium difficile on the healthcare system. Clin Infect Dis. 2012;55(suppl 2):S88–S92.
- , , , et al. Fidaxomicin versus vancomycin for infection with Clostridium difficile in Europe, Canada, and the USA: a double‐blind, non‐inferiority, randomised controlled trial. Lancet Infect Dis. 2012;12(4):281–289.
- , , , et al. Fidaxomicin versus vancomycin for Clostridium difficile infection. N Engl J Med. 2011;364:422–431.
- , , , , , . Recurrent Clostridium difficile disease: epidemiology and clinical characteristics. Infect Control Hosp Epidemiol. 1999;20:43–50.
- , , , et al. Clinical practice guidelines for Clostridium difficile infection in adults: 2010 update by the Society for Healthcare Epidemiology of America (SHEA) and the Infectious Diseases Society of America (IDSA). Infect Control Hosp Epidemiol. 2010;31:431–455.
- , , , , , ; Ad Hoc Clostridium difficile Surveillance Working Group. Recommendations for surveillance of Clostridium difficile‐associated disease. Infect Control Hosp Epidemiol. 2007;28:140–145.
- , , . Adapting a clinical comorbidity index for use with ICD‐9‐CM administrative databases. J Clin Epidemiol. 1992;45:613–619.
- , , , . Measures for evaluating model performance. Proceedings of the Biometrics Section. Alexandria, VA: American Statistical Association, Biometrics Section; 1997:253–258.
- , , , et al. Development and validation of a Clostridium difficile infection risk prediction model. Infect Control Hosp Epidemiol. 2011;32:360–366.
- , , , . Electronic health record‐based detection of risk factors for Clostridium difficile infection relapse. Infect Control Hosp Epidemiol. 2013;34:407–414.
- , , . Predicting recurrence of C. difficile colitis using bacterial virulence factors: binary toxin is the key. J Gastrointest Surg. 2013;17:118–125.
- , , , . Association between antibody response to toxin A and protection against recurrent Clostridium difficile diarrhoea. Lancet. 2001;357:189–193.
- , , , et al. Prospective derivation and validation of a clinical prediction rule for recurrent Clostridium difficile infection. Gastroenterology. 2009;136:1206–1214.
- . Fidaxomicin failures in recurrent Clostridium difficile infection: a problem of timing. Clin Infect Dis. 2012;55:613–614.
- , . Fidaxomicin “chaser” regimen following vancomycin for patients with multiple Clostridium difficile recurrences. Clin Infect Dis. 2013;56:309–310.
- , , , et al. Predictors of first recurrence of Clostridium difficile infection: implications for initial management. Clin Infect Dis. 2012;55(suppl 2):S77–S87.
- , , , . Meta‐analysis to assess risk factors for recurrent Clostridium difficile infection. J Hosp Infect. 2008;70:298–304.
- , , , , , . Recurrent Clostridium difficile diarrhea: characteristics of and risk factors for patients enrolled in a prospective, randomized, double‐blinded trial. Clin Infect Dis. 1997;24:324–333.
- , , , , . Association of proton‐pump inhibitors with outcomes in Clostridium difficile colitis. Am J Health Syst Pharm. 2007;64:2359–2363.
- , , , et al. Proton pump inhibitors as a risk factor for recurrence of Clostridium‐difficile‐associated diarrhea. World J Gastroenterol. 2010;16:3573–3577.
- , , . Proton pump inhibitor use and recurrent Clostridium difficile‐associated disease: a case‐control analysis matched by propensity score. J Clin Gastroenterol. 2012;46:397–400.
- , , , , , . Risk of Clostridium difficile infection with acid suppressing drugs and antibiotics: meta‐analysis. Am J Gastroenterol. 2012;107(7):1011–1019.
- , , , et al. Risk factors for early recurrent Clostridium difficile‐associated diarrhea. Clin Infect Dis. 1998;26:954–959.
© 2014 Society of Hospital Medicine

Homeless youths where?
Imagine a place where thousand of teens were homeless, many sleeping on park benches, hungry, and vulnerable. No, this is not a far-away land or third-world country; it’s here in the United States: 1.6 million children will be homeless for some period right here in America, according to the Substance Abuse and Mental Health Services Administration Office of Applied Studies
It’s hard to believe that in one of the richest nations that we would actually have teens walking the streets with no place to go. You might think that these are the wayward teen or the nonconformist, or oppositional defiant teens. But, statistics show that most teens run away to escape abuse they experience at home. Almost 20%-40% of homeless youths identify themselves as LGBT (lesbian, gay, bisexual, or transgender), according to a 2006 report by the National Coalition for the Homeless. Regardless of the reason, the number of homeless children is growing, and the hardship that teens face on the street is even greater than that faced by adults.
Finding shelter as a teen is particularly challenging because many shelters have only a few "youth" beds allotted. There is already a shortage of shelters so the availability is even less for teens. Teens also are particularly vulnerable to sexual predators and human traffickers. Many start by trading sex for food, which puts them at risk of HIV, physical abuse, and likely drug abuse.
Although many of us assume that this is a problem relegated to the inner city, the reality is that these children come from all areas, all cities, and all states. The majority of homeless teens are white (57%), black or African American comprises (27%), then American Indian and Alaskan (3%), according to the SAMHSA Office of Applied Studies (2004). As medical professionals, our critical role is to identify the at-risk teens.
Once we recognize that a teen is in dispute with his or her family because of sexual orientation, drug use, or as a victim of sexual abuse, we have taken the first step to identify a patient at risk.
The second step is to know what resources are available to assist teens that are homeless. The National Runaway Safeline – by phone, at 1-800-RUNAWAY (1-800-786-2929) or at their website, 1800runaway.org – is the national hotline designed to help keep America’s runaway, homeless, and at-risk youth safe and off the streets and to provides access to local shelters.
Homelessness is a growing crisis that affects our youth. If we understand that many of these teens are escaping abuse, it may help to explain why they end up in these situations and to define the support that they need. Remember that shelters are always in need of donations and volunteers.
Dr. Pearce is a pediatrician in Frankfort, Ill. E-mail her at pdnews@frontlinemedcom.com.

Helping SCD patients transition to adult care

A questionnaire may help aid the transition from pediatric to adult care for patients with sickle cell disease (SCD), according to a paper published in the Journal of Pediatric Hematology/Oncology.
Researchers showed that the questionnaire could pinpoint areas in which young SCD patients may need help to transition to an adult clinic.
The questionnaire measured 5 knowledge skill sets—medical, educational/vocational, health benefits, social, and independent living—as well as 3 psychological assessments—feelings, stress, and self-efficacy.
To test how effective the questionnaire can be, Amy Sobota, MD, of Boston Medical Center, and her colleagues looked at the answers provided by 33 patients between the ages of 18 and 22.
Most respondents had good medical knowledge of SCD. Ninety-seven percent said they could explain SCD to another person and understood “how they got” the disease.
Ninety-four percent of patients also understood that SCD might be passed on to their children, and 71% of women said they knew how SCD could affect their pregnancy. However, only 30% of patients reported knowing what their baseline hemoglobin level is.
Likewise, the questionnaire suggested some knowledge gaps with regard to health benefits. Sixty-four percent of patients said they understood the various types of health insurance available to them, and 61% knew how their age could affect their health benefits.
Patients’ educational/vocational knowledge and capabilities were promising overall. Ninety-one percent of patients said they had a specific plan for the future, and 94% said they knew the education or employment required for their job choice. Seventy-six percent said they could identify the type of work that could cause problems related to SCD.
As for independent living, 91% of patients said they could fill their prescriptions on their own, 85% could make doctor’s appointments on their own, and 79% reported going to doctor’s appointments on their own.
With regard to social support, 97% of patients said they had a good social support system. But fewer (70%) had friends they could talk to about SCD, and only 48% knew about community-based SCD programs.
Most patients said they were worried that SCD would hinder them in some ways. Seventy-six percent worried about SCD getting in the way of school or work, and 51% worried it might prevent them from doing things they enjoy.
However, most patients felt sure they could function well. Eighty-eight percent said they could keep doing most of the things they do day-to-day, and 54% said they had ways of managing their pain without medication.
A minority of patients were worried or anxious about transitioning to adult care. Twenty-five percent were “quite a bit” or “extremely” worried, and 9% were similarly anxious about the transition. Sixteen percent said they felt “not at all” or “a little bit” all right to transition to an adult health care setting.
“Our study indicates that this assessment tool—the only one of its kind—provides important information to physicians of patients with sickle cell disease who are transitioning from pediatric to adult care,” Dr Sobota said. “Caregivers can use this information from patients in order to effectively tailor and guide their treatment and education through this transition.” ![]()
Method may extend survival in patients with PE

pulmonary embolism
Medical College of Georgia
WASHINGTON, DC—Results of the SEATTLE II trial indicate that ultrasound-facilitated, catheter-directed, low-dose fibrinolysis can improve outcomes in patients with acute, massive or submassive pulmonary embolism (PE).
Overall, the treatment appeared to improve right ventricle function, minimize the risk of intracranial hemorrhage, and decrease the risk of death in this cohort of 150 patients.
However, some patients experienced major bleeding following treatment. There were 17 major bleeding events, including 1 severe event.
Gregory Piazza, MD, of Brigham and Women’s Hospital in Boston, presented these results at the American College of Cardiology’s 63rd Annual Scientific Session & Expo (presentation 407-04).
SEATTLE II is a prospective, single-arm, multicenter trial designed to evaluate the safety and efficacy of ultrasound-facilitated, catheter-directed, low-dose thrombolysis using the EkoSonic Endovascular System. The study was sponsored by the system’s makers, EKOS Corporation.
Researchers enrolled 150 patients with acute massive (N=31) or submassive (N=119) PE. Chest CT had to demonstrate proximal PE and a dilated right ventricle (RV/LV ratio ≥ 0.9) for patients to be eligible to participate.
Patients received 24 mg of tissue plasminogen activator (tPA), administered either as 1 mg/hour for 24 hours with a unilateral catheter or 1 mg/hour/catheter for 12 hours with bilateral catheters.
The treatment appeared to confer an improvement in right ventricle function. Overall, the mean RV/LV ratio decreased from 1.55 pre-procedure to 1.13 at 48 hours post-procedure, a difference of 0.42 (P<0.0001).
Previous research has suggested that massive PE has a mortality rate of about 52% at 90 days. In this study, there were 31 patients presenting with massive PE manifested by syncope and hypotension.
None of these patients died within the 30 day follow-up period. Of the 150 patients in the overall study, 1 death was directly attributed to PE.
There were no intracranial hemorrhages and no fatal bleeding events. Major bleeds occurred in 17 patients, including 1 severe bleed and 16 moderate bleeds.
Six of the major bleeds occurred in patients with comorbidities known to be associated with an increased risk of bleeding during thrombolytic therapy.
“This trial represents a breakthrough in demonstrating the safety and efficacy of thrombolytic therapy for acute PE,” said Samuel Z. Goldhaber, MD, a professor at Harvard Medical School and principal investigator for SEATTLE II.
“The reduction of the RV/LV ratio by 0.42 is substantial and clinically significant, without any intracranial hemorrhage and using a much-reduced lytic dose. These findings establish a new rationale for considering thrombolysis in both massive and submassive PE.”
About the EkoSonic Endovascular System
The EkoSonic Endovascular device is approved by the US Food and Drug Administration for controlled and selective infusion of physician-specified fluids, including thrombolytics, into the peripheral vasculature. The EkoSonic System is cleared for the infusion of solutions into the pulmonary arteries, but it is not designed for peripheral vasculature dilation purposes.
EkoSonic and MicroSonic products have earned the CE mark for the following indications. The EkoSonic Endovascular Device, consisting of the Intelligent Drug Delivery Catheter and the MicroSonic Device, is intended for controlled and selective infusion of physician-specified fluids into the peripheral vasculature.
The EkoSonic Endovascular System is intended for the treatment of PE patients with a 50% or greater clot burden in one or both main pulmonary arteries or lobar pulmonary arteries, and evidence of right heart dysfunction based on right heart pressures (mean pulmonary artery pressure ≥ 25mmHg) or echocardiographic evaluation. ![]()
Study reveals events leading to ribosomopathies

yeast buds before dividing
Credit: Carolyn Larabell
Research conducted in yeast suggests ribosomopathies are caused by a sequence of mistakes at the molecular level.
First, a genetic mutation prompts the production of defective ribosomes.
Then, a quality-control system eliminates most of these faulty ribosomes. This leaves few available for cells to produce required proteins, which causes anemia and bone marrow failure.
Next, a second mutation suppresses the quality-control system, making more ribosomes available to cells. However, these ribosomes are defective and cause changes in gene expression patterns that can result in cancer.
Jonathan Dinman, PhD, of the University of Maryland, and his colleagues described this chain of events in Proceedings of the National Academy of Sciences.
The researchers set out to investigate the structural, biochemical, and other defects in ribosomes that may lead to cancer. They selected budding yeast as their model system, as the assembly of its ribosomes shares many characteristics with human cells.
The team used the rpL10-R98S (uL16-R98S) mutant yeast model of the most commonly identified ribosomal mutation in T-cell acute lymphoblastic leukemia (T-ALL). They showed that the rpl10-R98S mutation causes a late-stage 60S subunit maturation failure that targets mutant ribosomes for degradation (the quality-control system).
When the researchers grew the mutant yeast cells on a petri dish, the cells grew very slowly. The team suggested that, because of the cells’ quality-control system, the majority of defective ribosomes carrying the T-ALL mutation do not “pass inspection.”
This severely limits the supply of ribosomes available to produce proteins, only providing enough ribosomes for cells to barely survive. This supply-and-demand problem hits rapidly dividing cells like blood cells particularly hard, and can therefore cause anemia and bone marrow failure in humans.
The bone marrow cells are subjected to selective pressure, an evolutionary process that favors the reproduction of things that resolve problems limiting their ability to thrive. In this case, cells would be favored that could circumvent the rpl10-R98S mutation.
After a few weeks, a group of fast-growing cells appeared on the petri dish containing the rpl10-R98S mutant yeast cells. The researchers sequenced the genomes of these cells and found a mutation in a second gene, NMD3, which suppresses the growth and ribosome biogenesis defects of rpl10-R98S cells.
So the mutation, NMD3-Y379D, increased the total number of ribosomes available to the cells, enabling cells with the mutation to make more protein, grow quickly, and take over the population. However, the available ribosomes were still defective.
NMD3-Y379D did not suppress the structural, biochemical, and translational fidelity defects of rpL10-R98S ribosomes. And the translational defects affected telomere maintenance. The mutant cells exhibited shortened telomeres, which have been linked to cancer.
The researchers proposed 2 different, but not mutually exclusive, explanations for these effects. The rpL10-R98S ribosomes could be directly changing patterns of gene expression and promoting T-ALL, and/or NMD3-Y379D could be driving T-ALL.
“Our yeast work has established a new paradigm that we are now translating to humans,” Dr Dinman said. “Once we determine which ribosomal mutations suppress the quality-control system in humans, we may be able to identify a potential drug target.” ![]()
Physicians Name Top Internal Medicine Residency Programs
Which are the best internal medicine residency programs in the U.S.? Now prospective hospitalists—about a third of whom will complete their residency training in internal medicine—have an answer.
Although a formal ranking system for postgraduate medical training programs doesn't exist, a new survey commissioned by U.S. News & World Report gives some idea about what programs are most popular among physicians.
The survey asked physicians who completed their internal medicine residency in the U.S. to name up to five programs they believe offer the best clinical training.
Four programs: Massachusetts General Hospital in Boston, Johns Hopkins University in Baltimore, Boston’s Brigham and Women’s Hospital, and the University of California San Francisco Medical Center (UCSF) each received almost twice as many nominations as any other program.
Out of more than 9,000 submitted nominations, the top three hospital-based apprenticeship programs each received at least 600 nods: Massachusetts General Hospital (732), Johns Hopkins (696), and Brigham and Women’s (600). UCSF received 579 nominations. Likewise, 20 other internal medicine programs each received between 100 to 300 nominations.
In a separate analysis that looked at the survey responses of general internists as a subgroup—as opposed to subspecialists who completed an internal medicine residency—UCSF received the most nominations (201) of any program.
Harry Hollander, MD, director of UCSF’s internal medicine residency program, says the positive feedback likely “reflects the strong tradition of general internal medicine training here, the prominence of both outstanding ambulatory internists and hospitalists on our faculty, and the accomplishments and reputation of our graduates who have pursued either generalist or subspecialty careers in internal medicine.”
Dr. Hollander noted that the Accreditation Council for Graduate Medical Education plans to introduce a new accreditation system that would, in theory, make the comparison of residency program metrics more transparent.
“However, no matter how much objective data exist, gut feeling and intuition about the place, the people, and the culture will always remain a key part of students choosing the right residency program for them,” he says.
Doximity, an online social network for physicians, conducted the survey through a combination of web notifications and emails sent to 18,695 members. A total of 3,410 physicians responded to the survey, which ran from last December through February 10.
Visit our website for more on internal medicine residency training programs.
New Oral Anticoagulants Increase GI Bleed Risk
Clinical question: Do thrombin and factor Xa inhibitors increase the risk of gastrointestinal (GI) bleeding when compared to vitamin K antagonists and heparins?
Background: New oral anticoagulants (thrombin and factor Xa inhibitors) are available and being used with increased frequency due to equal efficacy and ease of administration. Some studies indicate a higher risk of GI bleeding with these agents. Further evaluation is needed, because no reversal therapy is available.
Study design: Systematic review and meta-analysis.
Setting: Data from MEDLINE, Embase, and the Cochrane Library.
Synopsis: More than 150,000 patients from 43 randomized controlled trials were evaluated for risk of GI bleed when treated with new anticoagulants versus traditional therapy. Patients were treated for one of the following: embolism prevention from atrial fibrillation, venous thromboembolism (VTE) prophylaxis post orthopedic surgery, VTE prophylaxis of medical patients, acute VTE, and acute coronary syndrome (ACS). Use of aspirin or NSAIDs was discouraged but not documented. The odds ratio for GI bleeding with use of the new anticoagulants was 1.45, with a number needed to harm of 500. Evaluation of subgroups revealed increased GI bleed risk in patients treated for ACS and acute thrombosis versus prophylaxis. Postsurgical patients had the lowest risk. This study was limited by the heterogeneity and differing primary outcomes (mostly efficacy rather than safety) of the included trials. Studies excluded high-risk patients, which the authors estimate to be 25%–40% of actual patients. More studies need to be done that include high-risk patients and focus on GI bleed as a primary outcome.
Bottom line: The new anticoagulants tend to have a higher incidence of GI bleed than traditional therapy, but this varies based on indication of therapy and needs further evaluation to clarify risk.
Citation: Holster IL, Valkhoff VE, Kuipers EJ, Tjwa ET. New oral anticoagulants increase risk for gastrointestinal bleeding: A systematic review and meta-analysis. Gastroenterology. 2013;145(1):105–112.
HM 14 Special Report: How to Organize and Implement a Successful Quality Improvement Project
Presenters: Michelle Mourad, MD, director of quality and safety, UCSF School of Medicine, San Francsicso; Nasim Afsar, MD, associate chief medical officer, UCLA Hospitals, Los Angeles
“The goal is to inspire the to believe what you believe,” urged Dr. Mourad, who, along with her co-presenter, Dr. Afsar, outlined the steps needed to create a successful QI project. The steps for a successful QI project should include the following:
- Understand the problem. Often a fishbone diagram can be created while brainstorming about why you have the problem.
- Convince others there is a problem. “Every project needs a sense of urgency,” stated Dr. Mourad. Engaging others in your organization in the problem often requires appealing to both the analytical and the emotional sides of the brain. “Find the patient stories that move you.”
- Identify areas for improvement. This often will require a prioritization matrix. Starting with high impact/low effort aspects of the project may be appropriate.
- Prioritize small tests of change. Aims must be attainable, as unattainable goals may be discouraging when they are missed.
- Devise a measurement strategy. Collecting data is challenging but will allow you to ensure the problem you are fixing will result in improved outcomes.
- Measure change. This can involve measuring outcomes, processes, structure, and possibly balancing measures (unintended consequences). Integrate measurement into a daily routine, and consider using data already being collected if this is easier.
- Sustain the change. Coaching can improve motivation to continue the QI effort. Track improvement using statistical process charts, and celebrate success. Creating and referring to readily accessible data will help put process ownership into the group.
QI is a four-legged stool, concluded Drs. Mourad and Afsar: education, data audit and feedback, systems change, and culture change. TH
Dr. Chang is a pediatric hospitalist with the University of San Diego Medical Center and Rady Children's Hospital, San Diego, and the pediatric editor for The Hospitalist.
HM 14 Special Report: Nephrology Update
Presenter: Derek M. Fine, MD
Dr. Fine's presentation covered several areas of nephrology that are of special interest for hospitalists in the day-to-day management of our patients.
Drug toxicities and renal clearance. We need to know the GFR of our patients. This will, for example, keep us from ordering an MRI with gadolinium in patients with impaired renal function and prevent the debilitating complication of nephrogenic systemic fibrosis.
There are multiple medications that are frequently dosed inappropriately in CKD. Examples that stick out are: nitrofurantoin (contraindicated); gabapentin, which can cause confusion, decreased level of consciousness, and unsteady gait; and cefepime, which can cause non-convulsive status epilepticus, if not adjusted for GFR.
Ultrafiltration in CHF. The use of ultrafiltration in decompensated CHF is limited. There is no benefit over diuretic therapy in general, except for subgroups of patients, who have inadequate volume control with diuretics or who do not tolerate diuretics because of significant electrolyte abnormalities or alkalosis. A pearl for sodium restriction and IV fluids IV NS at 84 ml/hr for 24 hours provides 7000 mg of sodium for our heart-failure patients.
Dialysis access issues. Avoid PICC lines in patients with advanced CKD and ESRD in order to preserve access sites for dialysis. Don't discharge a patient with a bleeding AV fistula as they could bleed to death. A clotted AV access requires consultation with vascular surgery or interventional radiology, although it can be de-clotted for up to 2 weeks.
Renal artery stenosis. Angioplasty has not shown any benefit over medical therapy in the management of renal artery stenosis.
Key Takeaways:
- Know your patients' GFR
- Pay attention to dose adjustments in patients with CKD. It seems obvious, but dosing errors are very common.
- Preserve dialysis access sites and don't place PICC lines in patients who will need dialysis soon.
- Each liter of normal saline delivers 3542 mg of sodium to our CHF patients.
Klaus Suehler is a hospitalist at Mercy Hospital at Allina Health in Coon Rapids, MN, and a member of Team Hospitalist.