User login
Mutant HSCs appear to drive AML
A new study has shown that hematopoietic stem cells (HSCs) can acquire mutations in DNMT3A, and this may be the first step in initiating acute myeloid leukemia (AML).
These HSCs also appear to be a means of treatment resistance and may trigger relapse in patients with AML, investigators reported in Nature.
“Our discovery lays the groundwork to detect and target the pre-leukemic stem cell and thereby potentially stop the disease at a very early stage, when it may be more amenable to treatment,” said study author John Dick, PhD, of the University of Toronto in Ontario, Canada.
“Now, we have a potential tool for earlier diagnosis that may allow early intervention before the development of full AML. We can also monitor remission and initiate therapy to target the pre-leukemic stem cell to prevent relapse.”
Dr Dick and his colleagues analyzed 71 samples from AML patients and discovered that 17 of them (24%) carried mutations in DNMT3A. Fifteen of those samples (88%) also had mutated NPM1.
Both mutations were present in patients’ blasts. But 12 patients (70.5%) had T cells that contained DNMT3A mutations but no NPM1 mutations. FLT3-ITD mutations were also present in blasts but not T cells in 2 patients.
These results suggest DNMT3A mutations arise earlier than NPM1 and FLT3-ITD mutations, the researchers said.
To determine the origin of mutated DNMT3A, they analyzed hematopoietic stem and progenitor cell populations from 11 patients with DNMT3A and NPM1 mutations.
While both types of mutations were present in CD33+ blasts, mutant DNMT3A was present without mutant NPM1 across the spectrum of mature and progenitor cell populations.
Experiments in mice revealed that DNMT3A-mutant HSCs had a multilineage repopulation advantage over non-mutant HSCs. This, the investigators said, establishes the mutant cells as pre-leukemic HSCs.
The team also found the pre-leukemic HSCs in samples taken from AML patients in remission, which showed that the cells survived chemotherapy.
The researchers therefore concluded that DNMT3A mutations arise early in AML evolution and lead to a clonally expanded pool of pre-leukemic HSCs from which AML develops.
“By peering into the ‘black box’ of how cancer develops during the months and years prior to when it is first diagnosed, we have demonstrated a unique finding,” Dr Dick said. “People tend to think relapse after remission means chemotherapy didn’t kill all the cancer cells.”
“Our study suggests that, in some cases, the chemotherapy does, in fact, eradicate AML. What it does not touch are the pre-leukemic stem cells that can trigger another round of AML development and, ultimately, disease relapse.”
Dr Dick believes this finding could spawn accelerated drug development to specifically target DNMT3A. The discovery should also provide impetus for researchers to look for pre-cancerous cells in AML patients with other mutations. ![]()
Progress on Reducing Readmissions
The Hospital Readmission Reduction Program (HRRP)[1] contained within the Affordable Care Act focused national and local attention on hospital resources and efforts to reduce hospital readmissions. Driven by the Centers for Medicare and Medicaid Services' (CMS) desire to pay for value instead of volume, the response of hospitals and health systems appears to be yielding change across the United States.[2] A number of recent publications in the Journal of Hospital Medicine (JHM) exemplify the keen interest in reducing readmissions, while providing guidance regarding interventions and where we might target future research. Evidence from an exemplary systematic review of the pediatric literature confirms some experience in adults regarding effective interventionsall studies were multifacetedand highlights the importance of identifying a single healthcare provider or centrally coordinated hub to assume responsibility for extended care transition and follow‐up.[3] Notably, studies of pediatric patients and their families document the effectiveness of enhanced inpatient education and engagement while in the hospital.[3] Unfortunately, a study among adults at a top‐ranked academic institution indicates poor communication among nurses and physicians regarding patient discharge education.[4] Efforts to improve nursephysician communication by redesigning the hospitalist model of care delivery at a Veterans Affairs (VA) institution appeared to enhance perceptions of communication among the care team members and reduced length of stay, but disappointingly there was no reduction in readmission rates.[5] Studies such as this are essential in identifying which specific interventions may actually change outcomes such as readmission rates.
In 1984, a diminutive elderly woman provocatively squawked Where's the beef?, launching a highly successful advertising campaign for Wendy's hamburger chain.[6] This catchphrase may aptly describe Bradley and colleague's survey study of the State Action on Avoidable Rehospitalization (STAAR) and Hospital‐to‐Home (H2H) campaigns.[7] Auerbach and colleagues eloquently stated in a 2007 New England Journal of Medicine perspective[8] how they had witnessed recent initiatives that emphasize dissemination of innovative but unproven strategies, an approach that runs counter to the principle of following the evidence[9] in selecting interventions that meet quality and safety goals.[10] I firmly agree with this assessment, and 6 years later believe we should be more thoughtful about potentially repeating implementation of unproven strategies.
Do we know if the interventions recommended by H2H and STAAR are what hospital care teams should be attempting? Even the authors mention that definitive evidence on their effectiveness is lacking. The H2H and STAAR programs certainly encourage some theoretically laudable activitiesmedication reconciliation by nurses, alerting outpatient physicians within 48 hours of patient discharge, and providing skilled nursing facilities the direct contact number of the inpatient treating physician for patients transferred. However, do these efforts actually improve patient outcomes? Before embarking on state or national campaigns to improve care, we should consider carefully what are the best evidence‐based interventions. Remarkably, some prior evidence indicates that direct communication between the hospital‐based physician and primary care provider (PCP) may not actually impact patient outcomes.[11] Newer research published in JHM confirms my belief that the PCP needs to be engaged by hospitalists during a hospitalization. Lindquist's research group at Northwestern nicely demonstrated how communication between a patient's PCP and the admitting hospitalist, complemented by contact between the PCP and patient within 24 hours postdischarge, reduced the probability of a medication discrepancy by 70%.[12] Although no evaluation of the effect on readmissions was reported, this study may provide information on causality related to the importance of PCP involvement in the care of hospitalized patients.
Numerous publications now document research on successfully implemented programs that lowered hospital readmissions, and are cited by CMS as evidence‐based interventions.[13] Projects Re‐Engineered Discharge (RED)[14] and Better Outcomes by Optimizing Safe Transitions[15] target the hospital discharge process, and both appear to lower hospital readmission rates. The Care Transitions Intervention (CTI),[16] Transitional Care Model (TCM),[17] and the Guided Care model[18] all leverage nurse practitioners or nurses to protect elderly patients during what can be a perilous care transition from hospital to home. CTI and TCM have been further validated in effectiveness studies.[19, 20] Two recent systematic reviews provide further insight into the complexity of efforts to reduce 30‐day rehospitalizations, but unfortunately do not reveal a desired silver bullet. The first focused exclusively on interventions to reduce 30‐day rehospitalization, and concluded that no single intervention was successful alone, but identified interventions bridging the hospital‐to‐home transition (eg, CTI), and a bundle of interventions such as Project RED as showing efficacy.[21] The second review more broadly sought to evaluate the effectiveness of hospital‐initiated strategies to prevent postdischarge adverse events (AEs) such as readmissions and emergency department visits,[22] stating Because of scant evidence, no conclusions could be reached on methods to prevent postdischarge AEs. The researchers' sobering conclusion stated that strategies to improve patient safety at hospital discharge remain unclear.
With rising federal penalties for higher‐than‐expected readmission rates, many hospital leaders eagerly join collaboratives aiming to reduce hospital readmissions. H2H appears to be among the largest, reporting >600 hospital participants, and STAAR has been active since 2009, with a recently published qualitative study identifying gaps in evidence for effective interventions, and deficits in quality improvement capabilities among some organizations as implementation challenges.[23] Notably, the survey by Bradley and colleagues documented that just half of the hospitals had a quality improvement (QI) team focused on reducing readmissions. Although laudable in their goals, H2H and STAAR may represent expensive commitments of staff and time to efforts that may not improve outcomes. Importantly, recently published research evaluating QI studies showed concerning results among patients with chronic obstructive pulmonary disease (COPD). A randomized controlled trial (RCT) conducted at 6 Glasgow hospitals evaluated supported self‐management (home visits by nurses and thorough education) by patients with moderate to severe COPD, but documented no changes in hospitalization or mortality.[24]Another RCT at 20 sites evaluated a comprehensive care management program to prevent hospitalizations among 960 VA patients with COPD.[25] It had to be stopped early due to elevated all‐cause mortality in the intervention group, and there was no difference in hospitalization rates.
Moving forward, QI efforts to reduce hospital readmissions should utilize proven interventions unless they are part of a rigorous trial. The emerging field of implementation science (the scientific study of methods to promote the systematic uptake of research findings and other evidence‐based practices into routine practice, and hence, to improve the quality and effectiveness of health services[26]) needs to be applied to additional research in this area.[27] Another consideration would be for CMS and funders such as the Commonwealth Foundation or The Robert Wood Johnson Foundation to encourage and fund merging of current initiatives to move away from competition and provide clarity to community hospitals. Regardless, such collaboration should still undertake formal evaluation to discern best approaches to implementation. I applaud the authors for recognizing that Input from hospitalists who are often critical links among inpatient and outpatient care and between patients and their families is strongly needed to ensure hospitals focus on what strategies are most effective for successful transitions from hospital to home. Yet, I wonder why neither of the large STAAR and H2H initiatives actively partnered with hospitalists and their specialty society (Society of Hospital Medicine) directly in the leadership of these initiatives? On the other hand, why not ask medical societies engaged in delivery of primary care (eg, American Academy for Family Practice, American College of Physicians, or Society of General Internal Medicine), especially to elderly patients (American Geriatric Society), to contribute directly? Involvement on an advisory board is likely not sufficient. Prior efforts document the willingness of these organizations to collaborate and achieve consensus on principles for transitions of care.[28] As powerfully articulated 6 years ago, [W]e must pursue the solutions to quality and safety problems in a way that does not blind us to harms, squander scarce resources, or delude us about the effectiveness of our efforts.[8]
Acknowledgments
Disclosure: Dr. Williams is principal investigator for Project BOOST (
- Centers for Medicare and Medicaid Services. Readmissions reduction program. Available at: http://www.cms.gov/Medicare/Medicare‐Fee‐for‐service‐Payment/AcuteInpatientPPS/Readmissions‐Reduction‐Program.html. Accessed December 30, 2013.
- , , , , , . Medicare readmission rates showed meaningful decline in 2012. Medicare Medicaid Res Rev. 2013;3(2):E1–E12.
- , , , . Pediatric hospital discharge interventions to reduce subsequent utilization: a systematic review [published online ahead of print December 20, 2013]. J Hosp Med. doi: 10.1002/jhm.2134.
- , , . Communicating discharge instructions to patients: a survey of nurse, intern, and hospitalist practices. J Hosp Med. 2013;8:36–41.
- , , , et al. An academic hospitalist model to improve healthcare work communication and learner education: results from a quasi‐experimental study at a Veterans Affairs medical center. J Hosp Med. 2013;8:702–710.
- Wikipedia website. Where's the beef? Available at: http://en.wikipedia.org/wiki/Where's_the_beef%3F. Accessed November 4, 2013.
- , , , , , . Quality collaboratives and campaigns to reduce readmissions: what strategies are hospitals using? J Hosp Med. 2013;8(11):601–608.
- , , . The tension between needing to improve care and knowing how to do it. N Engl J Med. 2007;357(6):608–613.
- , , , . Accidental deaths, saved lives, and improved quality. N Engl J Med. 2005;353(13):1405–1409.
- , , . Clinical Improvement Action Guide. Oak Brook, IL: Joint Commission Resources; 1998.
- , , , et al. Association of communication between hospital‐based physicians and primary care providers with patient outcomes. J Gen Int Med. 2009;24(3):381–386.
- , , , , . Primary care physician communication a hospital discharge reduces medication discrepancies. J Hosp Med. 2013;8:672–677.
- Centers for Medicare 150(3):178–187.
- , , , et al. Project BOOST: effectiveness of a multihospital effort to reduce rehospitalization. J Hosp Med. 2013;8(8):421–427.
- , , , . The care transitions intervention: results of a randomized controlled trial. Arch Intern Med. 2006;166(17):1822–1828.
- , , , et al. Comprehensive discharge planning and home follow‐up of hospitalized elders: a randomized clinical trial. JAMA. 1999;281(7):613–620.
- , , , et al. The effect of guided care teams on the use of health services: results from a cluster‐randomized controlled trial. Arch Intern Med. 2011;171(5):460–466.
- , , , et al. Effectiveness and cost of a transitional care program for heart failure: a prospective study with concurrent controls. Arch Intern Med. 2011;171(14):1238–1243.
- , , , , , . The care transitions intervention: translating from efficacy to effectiveness. Arch Intern Med. 2011;171(14):1232–1237.
- , , , , . Interventions to reduce 30‐day rehospitalization: a systematic review. Ann Int Med. 2011;155(8):520–528.
- , , , , , . Hospital‐initiated transitional care interventions as a patient safety strategy: a systematic review. Ann Int Med. 2013;158(5 pt 2):433–440.
- , , , , , . Turning readmission reduction policies into results: some lessons from a multistate initiative to reduce readmissions. Popul Health Manag. 2013;16(4):255–260.
- , , , et al. Glasgow supported self‐management trial (GSuST) for patients with moderate to severe COPD: randomised controlled trial. BMJ. 2013;344:e1060.
- , , , et al. A comprehensive care management program to prevent chronic obstructive pulmonary disease hospitalizations: a randomized controlled trial. Ann Int Med. 2012;156(10):673–683.
- , . Welcome to implementation science. Implement Sci. 2006;1:1.
- , . Moving comparative effectiveness research into practice: implementation science and the role of academic medicine. Health Aff (Millwood). 2010;29(10):1901–1905.
- , , , et al.; American College of Physicians; Society of General Internal Medicine; Society of Hospital Medicine; American Geriatrics Society; American College of Emergency Physicians; Society of Academic Emergency Medicine. Transitions of care consensus policy statement American College of Physicians‐Society of General Internal Medicine‐Society of Hospital Medicine‐American Geriatrics Society‐American College of Emergency Physicians‐Society of Academic Emergency Medicine. J Gen Int Med. 2009;24(8):971–976.
The Hospital Readmission Reduction Program (HRRP)[1] contained within the Affordable Care Act focused national and local attention on hospital resources and efforts to reduce hospital readmissions. Driven by the Centers for Medicare and Medicaid Services' (CMS) desire to pay for value instead of volume, the response of hospitals and health systems appears to be yielding change across the United States.[2] A number of recent publications in the Journal of Hospital Medicine (JHM) exemplify the keen interest in reducing readmissions, while providing guidance regarding interventions and where we might target future research. Evidence from an exemplary systematic review of the pediatric literature confirms some experience in adults regarding effective interventionsall studies were multifacetedand highlights the importance of identifying a single healthcare provider or centrally coordinated hub to assume responsibility for extended care transition and follow‐up.[3] Notably, studies of pediatric patients and their families document the effectiveness of enhanced inpatient education and engagement while in the hospital.[3] Unfortunately, a study among adults at a top‐ranked academic institution indicates poor communication among nurses and physicians regarding patient discharge education.[4] Efforts to improve nursephysician communication by redesigning the hospitalist model of care delivery at a Veterans Affairs (VA) institution appeared to enhance perceptions of communication among the care team members and reduced length of stay, but disappointingly there was no reduction in readmission rates.[5] Studies such as this are essential in identifying which specific interventions may actually change outcomes such as readmission rates.
In 1984, a diminutive elderly woman provocatively squawked Where's the beef?, launching a highly successful advertising campaign for Wendy's hamburger chain.[6] This catchphrase may aptly describe Bradley and colleague's survey study of the State Action on Avoidable Rehospitalization (STAAR) and Hospital‐to‐Home (H2H) campaigns.[7] Auerbach and colleagues eloquently stated in a 2007 New England Journal of Medicine perspective[8] how they had witnessed recent initiatives that emphasize dissemination of innovative but unproven strategies, an approach that runs counter to the principle of following the evidence[9] in selecting interventions that meet quality and safety goals.[10] I firmly agree with this assessment, and 6 years later believe we should be more thoughtful about potentially repeating implementation of unproven strategies.
Do we know if the interventions recommended by H2H and STAAR are what hospital care teams should be attempting? Even the authors mention that definitive evidence on their effectiveness is lacking. The H2H and STAAR programs certainly encourage some theoretically laudable activitiesmedication reconciliation by nurses, alerting outpatient physicians within 48 hours of patient discharge, and providing skilled nursing facilities the direct contact number of the inpatient treating physician for patients transferred. However, do these efforts actually improve patient outcomes? Before embarking on state or national campaigns to improve care, we should consider carefully what are the best evidence‐based interventions. Remarkably, some prior evidence indicates that direct communication between the hospital‐based physician and primary care provider (PCP) may not actually impact patient outcomes.[11] Newer research published in JHM confirms my belief that the PCP needs to be engaged by hospitalists during a hospitalization. Lindquist's research group at Northwestern nicely demonstrated how communication between a patient's PCP and the admitting hospitalist, complemented by contact between the PCP and patient within 24 hours postdischarge, reduced the probability of a medication discrepancy by 70%.[12] Although no evaluation of the effect on readmissions was reported, this study may provide information on causality related to the importance of PCP involvement in the care of hospitalized patients.
Numerous publications now document research on successfully implemented programs that lowered hospital readmissions, and are cited by CMS as evidence‐based interventions.[13] Projects Re‐Engineered Discharge (RED)[14] and Better Outcomes by Optimizing Safe Transitions[15] target the hospital discharge process, and both appear to lower hospital readmission rates. The Care Transitions Intervention (CTI),[16] Transitional Care Model (TCM),[17] and the Guided Care model[18] all leverage nurse practitioners or nurses to protect elderly patients during what can be a perilous care transition from hospital to home. CTI and TCM have been further validated in effectiveness studies.[19, 20] Two recent systematic reviews provide further insight into the complexity of efforts to reduce 30‐day rehospitalizations, but unfortunately do not reveal a desired silver bullet. The first focused exclusively on interventions to reduce 30‐day rehospitalization, and concluded that no single intervention was successful alone, but identified interventions bridging the hospital‐to‐home transition (eg, CTI), and a bundle of interventions such as Project RED as showing efficacy.[21] The second review more broadly sought to evaluate the effectiveness of hospital‐initiated strategies to prevent postdischarge adverse events (AEs) such as readmissions and emergency department visits,[22] stating Because of scant evidence, no conclusions could be reached on methods to prevent postdischarge AEs. The researchers' sobering conclusion stated that strategies to improve patient safety at hospital discharge remain unclear.
With rising federal penalties for higher‐than‐expected readmission rates, many hospital leaders eagerly join collaboratives aiming to reduce hospital readmissions. H2H appears to be among the largest, reporting >600 hospital participants, and STAAR has been active since 2009, with a recently published qualitative study identifying gaps in evidence for effective interventions, and deficits in quality improvement capabilities among some organizations as implementation challenges.[23] Notably, the survey by Bradley and colleagues documented that just half of the hospitals had a quality improvement (QI) team focused on reducing readmissions. Although laudable in their goals, H2H and STAAR may represent expensive commitments of staff and time to efforts that may not improve outcomes. Importantly, recently published research evaluating QI studies showed concerning results among patients with chronic obstructive pulmonary disease (COPD). A randomized controlled trial (RCT) conducted at 6 Glasgow hospitals evaluated supported self‐management (home visits by nurses and thorough education) by patients with moderate to severe COPD, but documented no changes in hospitalization or mortality.[24]Another RCT at 20 sites evaluated a comprehensive care management program to prevent hospitalizations among 960 VA patients with COPD.[25] It had to be stopped early due to elevated all‐cause mortality in the intervention group, and there was no difference in hospitalization rates.
Moving forward, QI efforts to reduce hospital readmissions should utilize proven interventions unless they are part of a rigorous trial. The emerging field of implementation science (the scientific study of methods to promote the systematic uptake of research findings and other evidence‐based practices into routine practice, and hence, to improve the quality and effectiveness of health services[26]) needs to be applied to additional research in this area.[27] Another consideration would be for CMS and funders such as the Commonwealth Foundation or The Robert Wood Johnson Foundation to encourage and fund merging of current initiatives to move away from competition and provide clarity to community hospitals. Regardless, such collaboration should still undertake formal evaluation to discern best approaches to implementation. I applaud the authors for recognizing that Input from hospitalists who are often critical links among inpatient and outpatient care and between patients and their families is strongly needed to ensure hospitals focus on what strategies are most effective for successful transitions from hospital to home. Yet, I wonder why neither of the large STAAR and H2H initiatives actively partnered with hospitalists and their specialty society (Society of Hospital Medicine) directly in the leadership of these initiatives? On the other hand, why not ask medical societies engaged in delivery of primary care (eg, American Academy for Family Practice, American College of Physicians, or Society of General Internal Medicine), especially to elderly patients (American Geriatric Society), to contribute directly? Involvement on an advisory board is likely not sufficient. Prior efforts document the willingness of these organizations to collaborate and achieve consensus on principles for transitions of care.[28] As powerfully articulated 6 years ago, [W]e must pursue the solutions to quality and safety problems in a way that does not blind us to harms, squander scarce resources, or delude us about the effectiveness of our efforts.[8]
Acknowledgments
Disclosure: Dr. Williams is principal investigator for Project BOOST (
- Centers for Medicare and Medicaid Services. Readmissions reduction program. Available at: http://www.cms.gov/Medicare/Medicare‐Fee‐for‐service‐Payment/AcuteInpatientPPS/Readmissions‐Reduction‐Program.html. Accessed December 30, 2013.
- , , , , , . Medicare readmission rates showed meaningful decline in 2012. Medicare Medicaid Res Rev. 2013;3(2):E1–E12.
- , , , . Pediatric hospital discharge interventions to reduce subsequent utilization: a systematic review [published online ahead of print December 20, 2013]. J Hosp Med. doi: 10.1002/jhm.2134.
- , , . Communicating discharge instructions to patients: a survey of nurse, intern, and hospitalist practices. J Hosp Med. 2013;8:36–41.
- , , , et al. An academic hospitalist model to improve healthcare work communication and learner education: results from a quasi‐experimental study at a Veterans Affairs medical center. J Hosp Med. 2013;8:702–710.
- Wikipedia website. Where's the beef? Available at: http://en.wikipedia.org/wiki/Where's_the_beef%3F. Accessed November 4, 2013.
- , , , , , . Quality collaboratives and campaigns to reduce readmissions: what strategies are hospitals using? J Hosp Med. 2013;8(11):601–608.
- , , . The tension between needing to improve care and knowing how to do it. N Engl J Med. 2007;357(6):608–613.
- , , , . Accidental deaths, saved lives, and improved quality. N Engl J Med. 2005;353(13):1405–1409.
- , , . Clinical Improvement Action Guide. Oak Brook, IL: Joint Commission Resources; 1998.
- , , , et al. Association of communication between hospital‐based physicians and primary care providers with patient outcomes. J Gen Int Med. 2009;24(3):381–386.
- , , , , . Primary care physician communication a hospital discharge reduces medication discrepancies. J Hosp Med. 2013;8:672–677.
- Centers for Medicare 150(3):178–187.
- , , , et al. Project BOOST: effectiveness of a multihospital effort to reduce rehospitalization. J Hosp Med. 2013;8(8):421–427.
- , , , . The care transitions intervention: results of a randomized controlled trial. Arch Intern Med. 2006;166(17):1822–1828.
- , , , et al. Comprehensive discharge planning and home follow‐up of hospitalized elders: a randomized clinical trial. JAMA. 1999;281(7):613–620.
- , , , et al. The effect of guided care teams on the use of health services: results from a cluster‐randomized controlled trial. Arch Intern Med. 2011;171(5):460–466.
- , , , et al. Effectiveness and cost of a transitional care program for heart failure: a prospective study with concurrent controls. Arch Intern Med. 2011;171(14):1238–1243.
- , , , , , . The care transitions intervention: translating from efficacy to effectiveness. Arch Intern Med. 2011;171(14):1232–1237.
- , , , , . Interventions to reduce 30‐day rehospitalization: a systematic review. Ann Int Med. 2011;155(8):520–528.
- , , , , , . Hospital‐initiated transitional care interventions as a patient safety strategy: a systematic review. Ann Int Med. 2013;158(5 pt 2):433–440.
- , , , , , . Turning readmission reduction policies into results: some lessons from a multistate initiative to reduce readmissions. Popul Health Manag. 2013;16(4):255–260.
- , , , et al. Glasgow supported self‐management trial (GSuST) for patients with moderate to severe COPD: randomised controlled trial. BMJ. 2013;344:e1060.
- , , , et al. A comprehensive care management program to prevent chronic obstructive pulmonary disease hospitalizations: a randomized controlled trial. Ann Int Med. 2012;156(10):673–683.
- , . Welcome to implementation science. Implement Sci. 2006;1:1.
- , . Moving comparative effectiveness research into practice: implementation science and the role of academic medicine. Health Aff (Millwood). 2010;29(10):1901–1905.
- , , , et al.; American College of Physicians; Society of General Internal Medicine; Society of Hospital Medicine; American Geriatrics Society; American College of Emergency Physicians; Society of Academic Emergency Medicine. Transitions of care consensus policy statement American College of Physicians‐Society of General Internal Medicine‐Society of Hospital Medicine‐American Geriatrics Society‐American College of Emergency Physicians‐Society of Academic Emergency Medicine. J Gen Int Med. 2009;24(8):971–976.
Tablet Computers to Engage Patients
BACKGROUND
Many hospitals have initiated intense efforts to improve transitions of care[1] such as discharge coordinators or transition coaches,[2, 3] but use of mobile devices as approaches to add or extend the value of human interventions have been understudied.[4] Additionally, many hospitalized patients experience substantial inactive time between provider visits, tests, and treatments. This time could be used to engage patients in their care through interactive health education modules and by learning to use their PHR to manage medications and postdischarge appointments.
Greater understanding of the advantages and limitations of mobile devices may be important for improving transitions of care and may help leverage existing hospital personnel resources. However, prior studies have focused on healthcare provider uses of tablet computers for medical education,[5] to collect clinical registration data,[6] or to do clinical work (eg, check labs, write notes)[7, 8, 9] primarily in outpatient settings; few studies have focused on patient uses for this technology in hospital settings.[10, 11] To address these knowledge gaps, we conducted a pilot project to explore inpatient satisfaction with bedside tablets and barriers to usability. Additionally, we evaluated use of these devices to deliver 2 specific Web‐based programs: (1) an interactive video to improve inpatient education about hospital safety, and (2) PHR access to promote inpatient engagement in discharge planning.
METHODS
Study Design, Patient Selection, and Devices/Programs
We conducted a prospective study of tablet computers to engage patients in their care and discharge planning through Web‐based interactive health education modules and use of PHRs. We used 2 tablets, distributed daily by research assistants (RAs) to eligible patients after morning rounds. Inclusion criteria for patients were ability to speak English and admission to the medical (hospitalist) service at University of California San Francisco (UCSF) Medical Center. Exclusion criteria were intensive care unit admission, contact isolation, or inability to complete the consent process due to altered mental status or cognitive impairment.
RAs screened patients for inclusion/exclusion via the electronic medical record and then approached them after rounds for enrollment (11:00 am1:00 pm). RAs then performed a tiered orientation tailored to individual patient experience and needs. First, they delivered a brief tutorial focused on the tablet itself and its basic functions (touchscreen, keypad, and Internet browser use). Second, RAs showed patients how to access the online educational health module and how to navigate content within the module. RAs next explained what the PHR is and demonstrated how to login, how to navigate tabs within the PHR, and how to perform basic tasks (view/refill medications, view/modify appointments, and view/send messages to providers). The RAs left devices with patients for 3 to 5 hours and returned to collect them and perform debriefing interviews. After each device was returned, RAs cleaned devices with disinfectant wipes available in patient rooms and checked for physical damage or software malfunctions (eg, unable to turn on or unlock). Finally, RAs used the reset function to erase any personal data or setting modifications made by patients and docked the devices overnight to resynchronize the original settings and recharge the batteries.
We used the 16 gigabyte Apple iPad2 (Apple Inc., Cupertino, CA) without any enclosures, cases, or security devices. Our educational health module was Patient Safety in the Hospital, which was professionally developed by Emmi Solutions (
Survey Instruments and Data Collection
We developed pre‐ and postintervention surveys to characterize patients' demographics, device ownership, and health‐related Internet activities in the last year based on questions used in the Centers for Disease Control and Prevention National Health Interview Study (
Analyses
We used frequency analysis to describe patient demographics, ability to complete online health educational modules, and utilization of their PHR. We performed bivariate analyses (Fisher exact test) to assess correlations between demographics (age, device ownership, Internet use) and key pilot program performance measures (orientation time 15 minutes, online health module completion, and completion of 1 essential function in the PHR). All analyses were performed in SAS 9.2 (SAS Institute Inc., Cary, NC). The institutional review board of record for UCSF approved this study.
RESULTS
As shown in Table 1, we enrolled 30 patients. Most participants (60%) were aged 40 years or older, and most (87%) owned a mobile device; 70% owned a laptop and 60% owned a smartphone, but few (22%) owned a computer tablet. Most participants accessed the Internet daily, but fewer reported Internet use for health tasks; about half (52%) communicated with a provider, but few refilled a prescription (27%) or scheduled an appointment (21%) online over the last year.
| Characteristic | No. (%) |
|---|---|
| Age, y | |
| 1839 | 11 (38%) |
| 4049 | 5 (18%) |
| 5059 | 4 (14%) |
| 6069 | 5 (18%) |
| 7079 | 3 (10%) |
| Gender, female | 17 (60%) |
| Device ownership | |
| Desktop computer | 12 (44%) |
| Laptop computer | 19 (70%) |
| Smart phone | 17 (60%) |
| Tablet computer | 6 (22%) |
| Any mobile device (laptop, smartphone, or tablet) | 26 (87%) |
| Internet use | |
| Daily | 21 (72%) |
| Several times a week | 3 (10%) |
| Once a week or less | 5 (18%) |
| Prestudy online health tasks | |
| Looked up health information | 21 (72%) |
| Communicated with provider | 15 (52%) |
| Refilled prescription | 8 (27%) |
| Scheduled medical appointment | 6 (21%) |
Nearly all participants (90%) were satisfied or very satisfied with their experience using the tablet in the hospital (Figure 1). Most (87%) required 30 minutes or less for basic orientation, and 70% required only 15 minutes or less. Most participants (83%) were able to independently complete an interactive health education module on hospital safety and were highly satisfied with the module. Despite the fact that 73% of participants were first‐time users of our PHR, the majority were able to login and independently access their medication list, verify scheduled appointments, or send a secure message to their primary care provider.
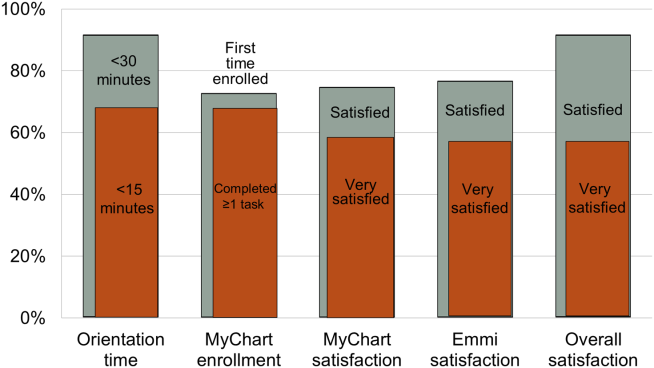
Participants aged 50 years or older were less likely to complete orientation in 15 minutes or less compared to those under 50 years old (25% vs 79%, P=0.025); however, age was not a significant factor in ability to complete the online health educational module or perform at least 1 essential PHR function. Other demographic features, such as device ownership and daily Internet use, did not correlate with shorter orientation time, educational module completion, or PHR use (data available on request).
Participants also made suggestions for improvement during the debrief interviews. Several suggested applications for entertainment (gaming, magazines, or music) and 2 suggested that all patients should be introduced to their PHR during hospitalization (data available on request). No device software malfunction (eg, device freezes, Internet connection failures), hardware issues (eg, damage from falls, wetness, or repeated disinfectant exposure), or theft or misappropriation were reported by patients or observed by the RAs to date.
DISCUSSION
Our pilot study suggests that tablet‐based access to educational modules and PHRs can increase inpatient engagement in care with high satisfaction and minimal time for orientation. Surprisingly, even older patients and those who might be considered less tech savvy in terms of Internet use and device ownership were equally able to utilize our tablet interventions. Furthermore, we did not experience any hardware issues in the harsh physical environment of inpatient wards. These preliminary findings suggest the potential utility of tablets for clinically meaningful tasks by inpatients with a low rate of technical issues.
From a technical standpoint, our experience suggests several next steps. First, although orientation time was minimal, it might be even less if patients used their own mobile devices because most patients already owned one. This bring your own device (BYOD) approach could also promote postdischarge patient engagement. Second, the flexibility of a BYOD approach raises the question of whether to also allow patients a choice of application‐based versus browser‐based platforms for specific programs such as the PHR and educational video we used. Indeed, although we used a browser‐based approach, several other teams have developed patient‐facing engagement applications (or apps) for mobile devices,[4, 12] and hospitalists could prescribe apps at discharge as a more providers are now doing in outpatient settings.[13] Of course, maximizing flexibility for BYOD and Web‐based versus app‐based approaches would likely increase patient engagement but would come at the cost of more time and effort for hospital providers to vet apps/websites and educate patients about their use. Third, regardless of the devices and programs used, broader engagement of patients, nurses, hospitalists, and other providers will be needed in the future to identify key areas for development to avoid overburdening patients and providers.
From a quality‐improvement perspective, recent literature has considered broad clinical uses for tablets by hospital providers,[14, 15] but our experience suggests more specific opportunities to improve transitions of care though direct patient engagement. Tablets and other mobile devices may help improve discharge education for patients taking high‐risk medications such as warfarin or insulin using interactive educational modules similar to the hospital safety modules we used. Additionally, clinical staff, such as nurses and pharmacists, can be trained to deliver mobile device interventions such as education on high‐risk medications.[16] Ultimately, scale up for our intervention will require that mobile devices and content eventually improve and replace current practices by hospital staff (especially nurses) in a way that streamlines, rather than compounds, current workflow. This could increase efficiency in these discharge tasks and extend contributions of these providers to high‐quality transitions.
Our study has several limitations. First, although this is a pilot study with only 30 patients, it adds needed scale to much smaller (N=58) published feasibility studies of tablet computer use by inpatients.[11, 12] Beyond more robust feasibility testing, our study adds new data about mobile device use for specific clinical tasks in the hospital such as patient education and PHR use. Second, we did not track postdischarge outcomes to test the effects of our intervention on transition care quality; this will be a focus of our future research. Third, we used existing platforms for interactive educational modules and PHR access at our site; participant satisfaction in our study may not generalize to other platforms. Furthermore, most PHR platforms (including ours) are not optimally configured to engage patients during transitions of care, but we plan to integrate existing functions (such as ability to refill medications or change appointments) into discharge education and planning. Finally, we have not engaged caregivers as surrogates for cognitively impaired patients or adapted our platform for non‐English speakers; these are areas for development in our ongoing work. Overall, our pilot results help set the stage to deploy mobile devices for better patient monitoring, engagement, and quality of care in the inpatient setting.[17]
In conclusion, our pilot project demonstrates that tablet computers can be used to improve inpatient education and patient engagement in discharge planning. Inpatients are highly satisfied with the use of tablets to complete health education modules and access their PHR, with minimal time required for patient training and device management by hospital staff. Tablets and other mobile devices have significant potential to improve patients' education and engagement in their hospital care.
Acknowledgements
The authors thank the UCSF mHealth group and Center for Digital Health Innovation for advice and for providing tablet computers for this pilot project.
Disclosures: This article was presented as a finalist in the Research, Innovations, and Clinical Vignettes competition (Innovations category) at the 2013 Annual Meeting of the Society for Hospital Medicine. Dr. Auerbach was supported by grant K24HL098372 (NHLBI). Dr. Greysen was supported by a career development award (KL‐2) from the UCSF Clinical Translational Sciences Institute. The authors have declared they have no financial, personal, or other conflicts of interest relevant to this study.
- , . Hospital readmissions and the Affordable Care Act: paying for coordinated quality care. JAMA. 2011;306(16):1794–1795.
- , , , et al. A reengineered hospital discharge program to decrease re‐hospitalization. Ann Intern Med. 2009;150:178–187.
- , , , . The care transitions intervention: results of a randomized controlled trial. Arch Intern Med. 2006;166:1822–1828.
- Project RED. Meet Louise…and virtual patient advocates. Available at: http://www.bu.edu/fammed/projectred/publications/VirtualPatientAdvocateWebsiteInfo2.pdf. Accessed July 12, 2013.
- , , , . Use of handheld computers in medical education. A systematic review. J Gen Intern Med. 2006;21(5):531–537.
- , , , . Ongoing evaluation of ease‐of‐use and usefulness of wireless tablet computers within an ambulatory care unit. Stud Health Tech Inform. 2009;143:459–464.
- . Use of a tablet personal computer to enhance patient care on multidisciplinary rounds. Am J Health Syst Pharm. 2009;66(21):1909–1911.
- , . Experiences incorporating Tablet PCs into clinical pharmacists' workflow. J Healthc Inf Manag. 2005;19(4):32–37.
- , , . The impact of mobile handheld technology on hospital physicians' work practices and patient care: a systematic review. J Am Med Inform Assoc. 2009;16(6):792–801.
- , , , et al. An investigation of the efficacy of electronic consenting interfaces of research permissions management system in a hospital setting. Int J Med Inform. 2013;82(9):854–863.
- , , , et al. A tablet computer application for patients to participate in their hospital care. AMIA Annu Symp Proc. 2011;2011:1428–1435.
- , , , et al. Building and testing a patient‐centric electronic bedside communication center. J Gerontol Nurs. 2013;39(1):15–19.
- . How apps are changing family medicine. J Fam Pract. 2013Jul;62(7):362–367.
- . The iPad: gadget or medical godsend? Ann Emerg Med. 2010;56(1):A21–A22.
- , , , et al. How might the iPad change healthcare? J R Soc Med. 2012;105(6):233–241.
- . Keeping the patient focus: using tablet technology to enhance education and practice. J Contin Educ Nurs. 2012;43(6):249–250.
- , , , et al. Advancing the science of mHealth. J Health Commun. 2012;17(suppl 1):5–10.
BACKGROUND
Many hospitals have initiated intense efforts to improve transitions of care[1] such as discharge coordinators or transition coaches,[2, 3] but use of mobile devices as approaches to add or extend the value of human interventions have been understudied.[4] Additionally, many hospitalized patients experience substantial inactive time between provider visits, tests, and treatments. This time could be used to engage patients in their care through interactive health education modules and by learning to use their PHR to manage medications and postdischarge appointments.
Greater understanding of the advantages and limitations of mobile devices may be important for improving transitions of care and may help leverage existing hospital personnel resources. However, prior studies have focused on healthcare provider uses of tablet computers for medical education,[5] to collect clinical registration data,[6] or to do clinical work (eg, check labs, write notes)[7, 8, 9] primarily in outpatient settings; few studies have focused on patient uses for this technology in hospital settings.[10, 11] To address these knowledge gaps, we conducted a pilot project to explore inpatient satisfaction with bedside tablets and barriers to usability. Additionally, we evaluated use of these devices to deliver 2 specific Web‐based programs: (1) an interactive video to improve inpatient education about hospital safety, and (2) PHR access to promote inpatient engagement in discharge planning.
METHODS
Study Design, Patient Selection, and Devices/Programs
We conducted a prospective study of tablet computers to engage patients in their care and discharge planning through Web‐based interactive health education modules and use of PHRs. We used 2 tablets, distributed daily by research assistants (RAs) to eligible patients after morning rounds. Inclusion criteria for patients were ability to speak English and admission to the medical (hospitalist) service at University of California San Francisco (UCSF) Medical Center. Exclusion criteria were intensive care unit admission, contact isolation, or inability to complete the consent process due to altered mental status or cognitive impairment.
RAs screened patients for inclusion/exclusion via the electronic medical record and then approached them after rounds for enrollment (11:00 am1:00 pm). RAs then performed a tiered orientation tailored to individual patient experience and needs. First, they delivered a brief tutorial focused on the tablet itself and its basic functions (touchscreen, keypad, and Internet browser use). Second, RAs showed patients how to access the online educational health module and how to navigate content within the module. RAs next explained what the PHR is and demonstrated how to login, how to navigate tabs within the PHR, and how to perform basic tasks (view/refill medications, view/modify appointments, and view/send messages to providers). The RAs left devices with patients for 3 to 5 hours and returned to collect them and perform debriefing interviews. After each device was returned, RAs cleaned devices with disinfectant wipes available in patient rooms and checked for physical damage or software malfunctions (eg, unable to turn on or unlock). Finally, RAs used the reset function to erase any personal data or setting modifications made by patients and docked the devices overnight to resynchronize the original settings and recharge the batteries.
We used the 16 gigabyte Apple iPad2 (Apple Inc., Cupertino, CA) without any enclosures, cases, or security devices. Our educational health module was Patient Safety in the Hospital, which was professionally developed by Emmi Solutions (
Survey Instruments and Data Collection
We developed pre‐ and postintervention surveys to characterize patients' demographics, device ownership, and health‐related Internet activities in the last year based on questions used in the Centers for Disease Control and Prevention National Health Interview Study (
Analyses
We used frequency analysis to describe patient demographics, ability to complete online health educational modules, and utilization of their PHR. We performed bivariate analyses (Fisher exact test) to assess correlations between demographics (age, device ownership, Internet use) and key pilot program performance measures (orientation time 15 minutes, online health module completion, and completion of 1 essential function in the PHR). All analyses were performed in SAS 9.2 (SAS Institute Inc., Cary, NC). The institutional review board of record for UCSF approved this study.
RESULTS
As shown in Table 1, we enrolled 30 patients. Most participants (60%) were aged 40 years or older, and most (87%) owned a mobile device; 70% owned a laptop and 60% owned a smartphone, but few (22%) owned a computer tablet. Most participants accessed the Internet daily, but fewer reported Internet use for health tasks; about half (52%) communicated with a provider, but few refilled a prescription (27%) or scheduled an appointment (21%) online over the last year.
| Characteristic | No. (%) |
|---|---|
| Age, y | |
| 1839 | 11 (38%) |
| 4049 | 5 (18%) |
| 5059 | 4 (14%) |
| 6069 | 5 (18%) |
| 7079 | 3 (10%) |
| Gender, female | 17 (60%) |
| Device ownership | |
| Desktop computer | 12 (44%) |
| Laptop computer | 19 (70%) |
| Smart phone | 17 (60%) |
| Tablet computer | 6 (22%) |
| Any mobile device (laptop, smartphone, or tablet) | 26 (87%) |
| Internet use | |
| Daily | 21 (72%) |
| Several times a week | 3 (10%) |
| Once a week or less | 5 (18%) |
| Prestudy online health tasks | |
| Looked up health information | 21 (72%) |
| Communicated with provider | 15 (52%) |
| Refilled prescription | 8 (27%) |
| Scheduled medical appointment | 6 (21%) |
Nearly all participants (90%) were satisfied or very satisfied with their experience using the tablet in the hospital (Figure 1). Most (87%) required 30 minutes or less for basic orientation, and 70% required only 15 minutes or less. Most participants (83%) were able to independently complete an interactive health education module on hospital safety and were highly satisfied with the module. Despite the fact that 73% of participants were first‐time users of our PHR, the majority were able to login and independently access their medication list, verify scheduled appointments, or send a secure message to their primary care provider.
Participants aged 50 years or older were less likely to complete orientation in 15 minutes or less compared to those under 50 years old (25% vs 79%, P=0.025); however, age was not a significant factor in ability to complete the online health educational module or perform at least 1 essential PHR function. Other demographic features, such as device ownership and daily Internet use, did not correlate with shorter orientation time, educational module completion, or PHR use (data available on request).
Participants also made suggestions for improvement during the debrief interviews. Several suggested applications for entertainment (gaming, magazines, or music) and 2 suggested that all patients should be introduced to their PHR during hospitalization (data available on request). No device software malfunction (eg, device freezes, Internet connection failures), hardware issues (eg, damage from falls, wetness, or repeated disinfectant exposure), or theft or misappropriation were reported by patients or observed by the RAs to date.
DISCUSSION
Our pilot study suggests that tablet‐based access to educational modules and PHRs can increase inpatient engagement in care with high satisfaction and minimal time for orientation. Surprisingly, even older patients and those who might be considered less tech savvy in terms of Internet use and device ownership were equally able to utilize our tablet interventions. Furthermore, we did not experience any hardware issues in the harsh physical environment of inpatient wards. These preliminary findings suggest the potential utility of tablets for clinically meaningful tasks by inpatients with a low rate of technical issues.
From a technical standpoint, our experience suggests several next steps. First, although orientation time was minimal, it might be even less if patients used their own mobile devices because most patients already owned one. This bring your own device (BYOD) approach could also promote postdischarge patient engagement. Second, the flexibility of a BYOD approach raises the question of whether to also allow patients a choice of application‐based versus browser‐based platforms for specific programs such as the PHR and educational video we used. Indeed, although we used a browser‐based approach, several other teams have developed patient‐facing engagement applications (or apps) for mobile devices,[4, 12] and hospitalists could prescribe apps at discharge as a more providers are now doing in outpatient settings.[13] Of course, maximizing flexibility for BYOD and Web‐based versus app‐based approaches would likely increase patient engagement but would come at the cost of more time and effort for hospital providers to vet apps/websites and educate patients about their use. Third, regardless of the devices and programs used, broader engagement of patients, nurses, hospitalists, and other providers will be needed in the future to identify key areas for development to avoid overburdening patients and providers.
From a quality‐improvement perspective, recent literature has considered broad clinical uses for tablets by hospital providers,[14, 15] but our experience suggests more specific opportunities to improve transitions of care though direct patient engagement. Tablets and other mobile devices may help improve discharge education for patients taking high‐risk medications such as warfarin or insulin using interactive educational modules similar to the hospital safety modules we used. Additionally, clinical staff, such as nurses and pharmacists, can be trained to deliver mobile device interventions such as education on high‐risk medications.[16] Ultimately, scale up for our intervention will require that mobile devices and content eventually improve and replace current practices by hospital staff (especially nurses) in a way that streamlines, rather than compounds, current workflow. This could increase efficiency in these discharge tasks and extend contributions of these providers to high‐quality transitions.
Our study has several limitations. First, although this is a pilot study with only 30 patients, it adds needed scale to much smaller (N=58) published feasibility studies of tablet computer use by inpatients.[11, 12] Beyond more robust feasibility testing, our study adds new data about mobile device use for specific clinical tasks in the hospital such as patient education and PHR use. Second, we did not track postdischarge outcomes to test the effects of our intervention on transition care quality; this will be a focus of our future research. Third, we used existing platforms for interactive educational modules and PHR access at our site; participant satisfaction in our study may not generalize to other platforms. Furthermore, most PHR platforms (including ours) are not optimally configured to engage patients during transitions of care, but we plan to integrate existing functions (such as ability to refill medications or change appointments) into discharge education and planning. Finally, we have not engaged caregivers as surrogates for cognitively impaired patients or adapted our platform for non‐English speakers; these are areas for development in our ongoing work. Overall, our pilot results help set the stage to deploy mobile devices for better patient monitoring, engagement, and quality of care in the inpatient setting.[17]
In conclusion, our pilot project demonstrates that tablet computers can be used to improve inpatient education and patient engagement in discharge planning. Inpatients are highly satisfied with the use of tablets to complete health education modules and access their PHR, with minimal time required for patient training and device management by hospital staff. Tablets and other mobile devices have significant potential to improve patients' education and engagement in their hospital care.
Acknowledgements
The authors thank the UCSF mHealth group and Center for Digital Health Innovation for advice and for providing tablet computers for this pilot project.
Disclosures: This article was presented as a finalist in the Research, Innovations, and Clinical Vignettes competition (Innovations category) at the 2013 Annual Meeting of the Society for Hospital Medicine. Dr. Auerbach was supported by grant K24HL098372 (NHLBI). Dr. Greysen was supported by a career development award (KL‐2) from the UCSF Clinical Translational Sciences Institute. The authors have declared they have no financial, personal, or other conflicts of interest relevant to this study.
- , . Hospital readmissions and the Affordable Care Act: paying for coordinated quality care. JAMA. 2011;306(16):1794–1795.
- , , , et al. A reengineered hospital discharge program to decrease re‐hospitalization. Ann Intern Med. 2009;150:178–187.
- , , , . The care transitions intervention: results of a randomized controlled trial. Arch Intern Med. 2006;166:1822–1828.
- Project RED. Meet Louise…and virtual patient advocates. Available at: http://www.bu.edu/fammed/projectred/publications/VirtualPatientAdvocateWebsiteInfo2.pdf. Accessed July 12, 2013.
- , , , . Use of handheld computers in medical education. A systematic review. J Gen Intern Med. 2006;21(5):531–537.
- , , , . Ongoing evaluation of ease‐of‐use and usefulness of wireless tablet computers within an ambulatory care unit. Stud Health Tech Inform. 2009;143:459–464.
- . Use of a tablet personal computer to enhance patient care on multidisciplinary rounds. Am J Health Syst Pharm. 2009;66(21):1909–1911.
- , . Experiences incorporating Tablet PCs into clinical pharmacists' workflow. J Healthc Inf Manag. 2005;19(4):32–37.
- , , . The impact of mobile handheld technology on hospital physicians' work practices and patient care: a systematic review. J Am Med Inform Assoc. 2009;16(6):792–801.
- , , , et al. An investigation of the efficacy of electronic consenting interfaces of research permissions management system in a hospital setting. Int J Med Inform. 2013;82(9):854–863.
- , , , et al. A tablet computer application for patients to participate in their hospital care. AMIA Annu Symp Proc. 2011;2011:1428–1435.
- , , , et al. Building and testing a patient‐centric electronic bedside communication center. J Gerontol Nurs. 2013;39(1):15–19.
- . How apps are changing family medicine. J Fam Pract. 2013Jul;62(7):362–367.
- . The iPad: gadget or medical godsend? Ann Emerg Med. 2010;56(1):A21–A22.
- , , , et al. How might the iPad change healthcare? J R Soc Med. 2012;105(6):233–241.
- . Keeping the patient focus: using tablet technology to enhance education and practice. J Contin Educ Nurs. 2012;43(6):249–250.
- , , , et al. Advancing the science of mHealth. J Health Commun. 2012;17(suppl 1):5–10.

Sodium and Mortality in Orthopedics
Sodium is the predominant extracellular cation and a major determinant of serum osmolality. As such, the serum sodium (SNa) concentration in humans is closely maintained by sensitive homeostatic mechanisms. However, disorders of sodium homeostasis are relatively common in selected patient populations, resulting in hyponatremia (<135 mmol/L) or hypernatremia (>144 mmol/L).[1, 2]
The presence of hyponatremia is independently associated with greater mortality in hospitalized individuals,[3] including patients with congestive heart failure[4] and cancer.[5] In prior subgroup analyses of patients with musculoskeletal disorders undergoing surgery, hyponatremia (<135 mmol/L) at the time of hospital admission was associated with a 2.31‐fold greater risk of death, compared with normonatremic individuals (135144 mmol/L).[3] Hyponatremia is also associated with increased fracture risk[6, 7] and disturbances of gait8; however, controversy remains as to whether this association is causal or simply a marker of comorbid disease. On the other hand, hypernatremia has been associated with greater risk of mortality in critically ill patients9; however, there is a relative paucity of data regarding clinical associations in the orthopedic population.
We aimed to examine the relationship of the perioperative SNa (corrected for glucose) with length of stay and 30‐day mortality in patients undergoing major orthopedic surgery. We hypothesized that both hypo‐ and hypernatremia would be associated with greater length of stay and greater 30‐day mortality.
METHODS
Study Population
Administrative and laboratory data were obtained from individuals admitted to 2 major hospitals in Boston, Massachusetts. Brigham and Women's Hospital is a 793‐bed academic medical center; Massachusetts General Hospital is a 907‐bed academic medical center. These hospitals provide care to an ethnically and socioeconomically diverse population within eastern Massachusetts and the surrounding region. The study was deemed exempt by the Partners Institutional Review Board.
The Research Patient Data Registry serves as a central data warehouse for over 1.8 million inpatients and outpatients; it contains information on patient demographics, diagnoses, procedures, medications, inpatient and outpatient encounters, and laboratory results. The database has been accessed previously for clinical studies.[3, 10] Between January 1, 2006 and January 27, 2011, data from the index admission of adult individuals undergoing major orthopedic procedures were abstracted from the Research Patient Data Registry (n=21,663). Those without availability of simultaneous measurements of SNa and glucose within 6 days of surgery (to minimize iatrogenic influences on SNa) were excluded (n=4995), leaving 16,668 admissions available for analysis. Reasons for exclusion included a length of stay 1 day (n=137) and/or age <18 years (n=327). The final cohort consisted of 16,206 unique individuals.
The following data were retrieved: age, race, sex, length of stay, vital status (linked to the Social Security Death Index), International Classification of Diseases, 9th Revision, Clinical Modification (ICD‐9‐CM) diagnosis codes (up to 10 per patient), and inpatient sodium and glucose measurements. The Deyo modification of the Charlson Comorbidity Index (D‐CI) was used to estimate comorbid disease status (sum of the weighted number of comorbid conditions based on 17 diagnostic categories identified from ICD‐9‐CM diagnosis codes).[11]
Exposures and Outcomes
The primary exposure of interest was the serum sodium concentration during hospitalization most proximal to the day of surgery. All serum sodium measurements were corrected for concomitant serum glucose >100 mg/dL in the following manner: corrected sodium (SNa)=measured sodium+(measured glucose‐100/100)*1.6.12 SNa was then categorized into moderate/severe hyponatremia (130 mmol/L), mild hyponatremia (131134 mmol/L), normonatremia (135143 mmol/L), or hypernatremia (144 mmol/L). The primary outcomes of interest were hospital length of stay and 30‐day mortality. Length of stay was log‐transformed due to the highly right‐skewed distribution. For mortality analyses, at‐risk time was considered from the date of laboratory measurement of SNa until death or 30 days later, whichever came first.
Statistical Analysis
Continuous variables were examined graphically and recorded as means ( standard deviations); comparisons were made using t tests. Categorical variables were examined by frequency distribution, recorded as proportions, and comparisons were made using the [2] test.
The association between log‐transformed length of stay and category of SNa was assessed by linear regression models; the association with all‐cause mortality was assessed by fitting Cox proportional hazards models. Initially unadjusted models were fit. To explore the extent of confounding, case‐mix adjusted models were fit as follows: model 1 was adjusted for age, race (black vs nonblack), sex (male vs female), and clinical center. Model 2 was adjusted for the same variables as model 1, in addition to the D‐CI score (1, 2, or 3) and diagnosis of fracture; model 3 was adjusted for the same covariates as model 2 plus individual covariate terms for congestive heart failure (CHF), diabetes, cancer, and liver disease. To further assess for the presence of nonlinear relationships in mortality analyses, restricted and adjusted cubic splines were fit with knots corresponding to SNa values of 135, 137, 139, 141, and 143 mmol/L (approximately the 10th, 25th, 50th, 75th, and 90th percentiles). The linearity assumption for continuous variables was assessed by comparative model fit diagnostics using Akaike's information criterion. The proportionality assumption was assessed by Schoenfeld residual testing.
Subgroup analyses were performed according to the presence or absence of a diagnostic code for fracture. As the majority of patients had their SNa measured on the same day as surgery, sensitivity analyses were performed that restricted inclusion to those individuals with SNa measured within 60 days prior to admission.
Two‐tailed P values <0.05 were considered statistically significant. Analyses were performed with SAS version 9.2 (SAS Institute, Cary, NC) and Stata 10MP (StataCorp, College Station, TX).
RESULTS
Baseline Characteristics
The primary cohort consisted of 16,206 individuals. Mean age was 62.5 years (16.6), 44.8% were male, 4.6% were black, 4.9% had CHF, and 12.4% were diabetic. The mean SNa was 138.52.9 mmol/L; 1.2% had moderate/severe hyponatremia, 6.4% had mild hyponatremia, and 2.5% were hypernatremic. Those with lower SNa tended to be older, female, and more likely to have CHF, cancer, liver disease, and higher comorbidity scores than those with normonatremia (Table 1).
| Perioperative SNa (mmol/L) | |||||
|---|---|---|---|---|---|
| 130, n=198 | 131134, n=1,036 | 135143, n=15,563 | 144, n=409 | Pb | |
| |||||
| Age (y) | 72.514.9 | 66.817.1 | 62.616.5 | 65.117.0 | <0.001 |
| Male (%) | 32.3 | 45.5 | 45.2 | 37.2 | <0.001 |
| Black (%) | 1.6 | 4.2 | 4.7 | 5.3 | 0.18 |
| CHF (%) | 13.1 | 9.2 | 4.5 | 6.6 | <0.001 |
| DM (%) | 10.1 | 13.3 | 12.4 | 12.0 | 0.61 |
| Cancer (%) | 14.1 | 10.8 | 4.5 | 4.4 | <0.001 |
| COPD (%) | 13.1 | 14.4 | 13.1 | 14.2 | 0.63 |
| Hypothyroid (%) | 12.1 | 11.0 | 10.5 | 10.3 | 0.84 |
| Liver disease (%) | 2.0 | 1.1 | 0.6 | 0.5 | 0.02 |
| D‐CI score | <0.001 | ||||
| 0 | 43.4 | 48.0 | 61.5 | 60.6 | |
| 12 | 41.4 | 38.6 | 31.9 | 33.8 | |
| 3 | 15.2 | 13.4 | 6.6 | 6.6 | |
| Glucose (mg/dL) | 142100 | 13657 | 13342 | 147108 | <0.001 |
Hospital Length of Stay
The median length of stay was 4 days (interquartile range, 36 days). The unadjusted length of stay was greater for those with hypo‐ and hypernatremia compared with those who were normonatremic. In multivariable adjusted models this pattern persisted, with evidence for a J‐shaped association for categories of SNa with greater length of stay (Table 2). In adjusted subgroup analyses, similar J‐shaped patterns of association (model 3) were evident in those with and without a diagnosis of fracture.
| Difference (95% CI) in LOS in Days According to Category of Perioperative SNab | ||||
|---|---|---|---|---|
| 130 mmol/L, n=198 | 131134 mmol/L, n=1,036 | 135143 mmol/L, n=14,563 | 144 mmol/L, n=409 | |
| ||||
| Median LOS in days [IQR] | 6 [49] | 5 [48] | 4 [36] | 5 [47] |
| Unadjusted | 2.2 (1.9‐2.6) P<0.001 | 1.8 (1.6‐1.9) P<0.001 | REF | 1.5 (1.3‐1.7) P<0.001 |
| Model 1 | 2.2 (1.8‐2.6) P<0.001 | 1.7 (1.6‐1.9) P<0.001 | REF | 1.5 (1.3‐1.7) P<0.001 |
| Model 2 | 1.7 (1.4‐2.0) P<0.001 | 1.4 (1.3‐1.5) P<0.001 | REF | 1.4 (1.2‐1.5) P<0.001 |
| Model 3 | 1.6 (1.4‐1.9) P<0.001 | 1.4 (1.3‐1.5) P<0.001 | REF | 1.4 (1.2‐1.5) P<0.001 |
| Fracturec | ||||
| Present, n=5,296 | 1.4 (1.1‐1.9) P=0.02 | 1.2 (1.01.4) P=0.01 | REF | 1.7 (1.3‐2.1) P<0.001 |
| Absent, n=10,910 | 1.8 (1.5‐2.2) P<0.001 | 1.5 (1.4‐1.7) P<0.001 | REF | 1.2 (1.01.3) P=0.02 |
In sensitivity analyses restricted to individuals with SNa available within 60 days prior to admission, the effect estimates for the relationships between categories of hyponatremia and length of stay were qualitatively unchanged (see Supporting Information, Table A, in the online version of this article).
30‐Day Mortality
Overall, patients contributed 1325 years of at‐risk time, during which 208 deaths were recorded within 30 days of orthopedic surgery. In both unadjusted and case‐mix adjusted models, there was evidence for the presence of a J‐shaped association for categories of SNa with greater 30‐day mortality (Table 3). Restricted cubic spline analyses provided additional evidence for the presence of a nonlinear relationship, with hypo‐ and hypernatremia being associated with greater 30‐day mortality (Figure 1). In adjusted subgroup analyses, mild hyponatremia and hypernatremia remained associated with greater mortality in those with fracture, whereas only moderate/severe hyponatremia remained associated with greater mortality in those without a diagnosis of fracture.
| Hazard Ratio (95% CI) for 30‐Day Mortality According to Category of Perioperative SNa | ||||
|---|---|---|---|---|
| <130 mmol/L, n= 198 | 131134 mmol/L, n=1,036 | 135143 mmol/L, n=14,563 | 144 mmol/L, n=409 | |
| ||||
| Unadjusted | 5.73 (3.11‐10.6) | 3.48 (2.40‐5.04) | REF | 4.90 (3.037.91) |
| Model 1 | 3.49 (1.88‐6.49) | 2.36 (1.60‐3.50) | REF | 3.83 (2.31‐6.35) |
| Model 2 | 2.89 (1.56‐5.35) | 1.96 (1.33‐2.90) | REF | 3.14 (1.88‐5.21) |
| Model 3 | 2.47 (1.33‐4.59) | 1.80 (1.21‐2.66) | REF | 2.99 (1.79‐4.98) |
| Fractureb | ||||
| Present, n=5,296 | 1.94 (0.84‐4.47) | 1.83 (1.13‐2.97) | REF | 3.12 (1.72‐5.66) |
| Absent, n=10,910 | 3.85 (1.53‐9.68) | 1.58 (0.80‐3.14) | REF | 2.73 (0.98‐7.62) |
In sensitivity analyses, when restricted to individuals with SNa available within 60 days prior to admission, the effect estimates for the relationships between categories of hyponatremia and length of stay were qualitatively unchanged (see Supporting Information, Table B, in the online version of this article).
DISCUSSION
In this study of hospitalized patients undergoing major orthopedic procedures, we report that abnormal preadmission and perioperative SNa during hospitalization are: (1) present in approximately 10% of patients, (2) associated with greater hospital length of stay, and (3) associated with greater 30‐day mortality.
The incidence of perioperative hyponatremia (<135 mmol/L) in prior studies ranges from 9.1% to 26.5% in studies of patients over 65 years of age admitted to the hospital with large bone fractures.[13, 14] In our study, the overall incidence of hyponatremia (SNa <135 mmol/L) was 7.6%. Of note, our sample included individuals aged 18 years and was not limited to individuals with fractures, which may partly explain why the incidence was lower than that previously reported.
Few studies have examined the association of perioperative hyponatremia with length of stay in the hospitalized orthopedic surgery population. We found that both hyponatremia and hypernatremia (corrected for glucose) were independently associated with greater adjusted hospital length of stay, compared with normonatremic individuals. This has important implications for healthcare costs and resource utilization. However, it is unclear if dysnatremia is associated with other metrics of postoperative recovery that could delay discharge, or whether dysnatremia alone is responsible for the decision to delay discharge (despite other measures of recovery being deemed adequate).
Leung et al. recently examined the association of preoperative hyponatremia (<135 mmol/L, uncorrected and measured within 90 days of surgery) with 30‐day mortality in 964,263 patients from the American College of Surgeons National Surgical Quality Improvement Program (ACS NSQIP) dataset.[15] They found that preoperative hyponatremia was associated with 44% greater adjusted odds (odds ratio [OR]: 1.44, 95% CI: 1.38‐1.50) of 30‐day mortality in the whole cohort and with 56% greater adjusted odds (OR: 1.56, 95% CI: 1.22‐1.99) in the subgroup of orthopedic patients. Waikar et al. also reported that hyponatremia is associated with greater in‐hospital and long‐term mortality in the subgroup of hospitalized patients who were admitted for musculoskeletal problems requiring surgery.[3] Our analyses support these findings and provide greater confidence by specifically focusing on patients admitted for major orthopedic surgery. We also expand the current knowledge base by correcting for serum glucose concentrations and by reporting associations of moderate/severe hyponatremia with adverse clinical outcomes.
The incidence of perioperative hypernatremia in our study was 2.5%, which compares to 1.0% to 2.6% in other studies of orthopedic patients.[14, 16] Hypernatremia has previously been associated with greater mortality in hospitalized patients in the intensive care unit (ICU) setting at the time of admission,[17] during the ICU stay,[9] in older patients (>60 years),[18] and in those with decompensated liver disease.[19] More recently, Leung et al. performed further analyses using data from the ACS NSQIP, reporting that preoperative hypernatremia (>144 mmol/L, uncorrected and measured within 90 days of surgery) is associated with 44% greater adjusted odds (OR: 1.44, 95% CI: 1.33‐1.56) of 30‐day mortality, but was not significantly associated with greater mortality in the orthopedic subgroup.[20] We extend the literature by examining glucose‐corrected SNa and again by focusing specifically on those undergoing major orthopedic surgery, reporting an association of perioperative hypernatremia with greater length of stay and 30‐day mortality. In our study, when we specifically examined the association of preoperative SNa values, we noted attenuation of the effect estimates and loss of statistical significance, confirming the subgroup findings of Leung et al.[20] The reasons for this are not clear, but may relate to the possibility that perioperative hypernatremia (as opposed to preoperative) is a stronger marker of concurrent illness severity and therefore more closely associates with adverse clinical outcomes.
As with most observational studies in this area, the question of whether dysnatremia is causative or merely a marker of comorbidity remains. In this regard, there are some unique points that deserve mention in this cohort of patients. Hyponatremia has previously been associated with several musculoskeletal abnormalities, including a greater risk of fracture,[7, 16, 21] which may contribute to the observed associations with greater morbidity and mortality. For example, Verbalis et al. reported that the induction and maintenance of hyponatremia by administration of 1‐deamino8‐d‐arginine vasopressin in rodent models is associated with reduced bone mineral density in excised rat femurs, which may predispose to greater fracture risk.[22] In humans, the same authors reported that hyponatremia (<135 mmol/L) was independently associated with greater odds of having osteoporosis at the femoral neck in individuals aged 50 years or older (OR: 2.87, 95% CI: 1.41‐5.81), compared with normonatremic individuals (135145 mmol/L).[22] On the other hand, Kinsella et al. found that hyponatremia (<135 mmol/L) associated with greater odds of having a fracture (OR: 2.25, 95% CI: 1.24‐4.09), independent of the presence of osteoporosis as measured by hip and vertebral T‐scores, suggesting an association between hyponatremia and fracture, independent of osteoporosis.[6] Other potential confounders of these associations may include gait disturbance and unsteadiness, which could contribute to greater fall and fracture risk.[7, 8, 21] Additional proposed mechanisms for the association of hyponatremia with adverse outcomes include the development of cerebral edema,[23] abnormal nerve conduction,[24] and predisposition to infection,[25] perhaps via altered immune functioning in the presence of hypo‐osmolality. Unfortunately, due to data limitations, we were unable to investigate these hypotheses further in our present study. In relation to hypernatremia, associations with impairment in neurologic,[26] myocardial,[27] and immune functioning have been reported previously, which may contribute to some of the excess risk associated with this condition.
There are several limitations of this study that deserve further mention. We used ICD‐9 and diagnosis‐related group codes to ascertain data on primary diagnoses and comorbid conditions, raising the possibility of some degree of misclassification of covariates in this study. We were unable to differentiate between elective versus urgent/emergent procedures. Given the large sample size and intrinsic data limitations, we were unable to ascertain the underlying causes of dysnatremia, or examine practice differences between the 2 institutions from which the sample was sourced. The majority of our sample had perioperative SNa measurements performed on the same day as their major orthopedic procedure. Although we were unable to confirm the timing of SNa measurements relative to the operation, it is not uncommon for elective cases to have initial hospitalization labs drawn in the recovery room, as opposed to preoperatively. In sensitivity analyses, we found similar patterns of association for hyponatremia with outcomes, but not for hypernatremia, when we examined the SNa measurement within 60 days prior to admission as the exposure of interest. Although these analyses were underpowered, they provide some modicum of reassurance that the observed associations of perioperative hyponatremia with adverse outcomes are robust. Whether perioperative dysnatremia, measured in the recovery room, has associations with clinical outcomes that are distinct from immediate preoperative dysnatremia requires further research. The possibility of residual confounding (eg, administration of fluids, medications, severity of illness) that was not captured by the D‐CI index, functional status and infection remain important considerations. Finally, caution must be applied before generalizing our results from 2 large academic centers to the general hospitalized orthopedic population.
In conclusion, we report that dysnatremia on admission for patients requiring major orthopedic surgery is present in approximately 10% of patients and is associated with greater length of stay and all‐cause mortality. Further research is required to assess whether dysnatremia is a mediator or marker for increased morbidity and mortality, and whether perioperative correction of hypo‐ or hypernatremia will improve clinical outcomes in these patients.
Acknowledgments
Disclosures: Dr. Mc Causland had full access to all the data in the study and takes responsibility for the integrity of the data and the accuracy of the data analysis. Dr. McCausland was supported by a Clinical Fellowship Grant from the National Kidney Foundation (20112013). Dr. Wright has no relevant disclosures. This work was supported by an investigator‐initiated grant from Otsuka to Dr. Waikar. Otsuka had no role in the design, conduct, management, analysis or interpretation of these data. In addition to investigator‐initiated funding from Otsuka for the present study, Dr. Waikar previously received grant support from Astellas for an investigator‐initiated study of hyponatremia and participated in an advisory board meeting for Otsuka. He is supported by National Institutes of Health grants U01DK085660 and RO1DK093574.
- . Hypernatremia. Semin Nephrol. 1998;18(1):20–30.
- , , . Incidence and prevalence of hyponatremia. Am J Med. 2006;119(7suppl 1):S30–S35.
- , , . Mortality after hospitalization with mild, moderate, and severe hyponatremia. Am J Med. 2009;122(9):857–865.
- , , , , , . Predicting mortality among patients hospitalized for heart failure: derivation and validation of a clinical model. JAMA. 2003;290(19):2581–2587.
- , , . A prospective study on hyponatraemia in medical cancer patients: epidemiology, aetiology and differential diagnosis. Support Care Cancer. 2000;8(3):192–197.
- , , , , . Hyponatremia independent of osteoporosis is associated with fracture occurrence. Clin J Am Soc Nephrol. 2010;5(2):275–280.
- , , , et al. Mild hyponatremia as a risk factor for fractures: the Rotterdam Study. J Bone Miner Res. 2011;26(8):1822–1828.
- , , , , . Mild chronic hyponatremia is associated with falls, unsteadiness, and attention deficits. Am J Med. 2006;119(1):71.e71–78.
- , , , et al. Intensive care‐acquired hypernatremia after major cardiothoracic surgery is associated with increased mortality. Intensive Care Med. 2010;36(10):1718–1723.
- , , , et al. Validity of international classification of diseases, ninth revision, clinical modification codes for acute renal failure. J Am Soc Nephrol. 2006;17(6):1688–1694.
- , , . Adapting a clinical comorbidity index for use with ICD‐9‐CM administrative databases. J Clin Epidemiol. 1992;45(6):613–619.
- . Hyperglycemia‐induced hyponatremia—calculation of expected serum sodium depression. N Engl J Med. 1973;289(16):843–844.
- , , , , . Hyponatremia associated with large‐bone fracture in elderly patients. Int Urol Nephrol. 2009;41(3):733–737.
- , , , , . Hip fracture post‐operation dysnatremia and Na+‐courses in different cognitive and functional patient groups. Arch Gerontol Geriatr. 2011;53(2):179–182.
- , , , , , . Preoperative hyponatremia and perioperative complications. Arch Intern Med. 2012;172(19):1474–1481.
- , , , . Mortality and serum urea and electrolytes on admission for hip fracture patients. Injury. 2006;37(8):698–704.
- , , , et al. Hypernatremia in the critically ill is an independent risk factor for mortality. Am J Kidney Dis. 2007;50(6):952–957.
- , , . Hypernatremia in elderly patients. A heterogeneous, morbid, and iatrogenic entity. Ann Intern Med. 1987;107(3):309–319.
- , , . Hypernatremia in hepatic failure. JAMA. 1980;243(12):1257–1260.
- , , , . Preoperative hypernatremia predicts increased perioperative morbidity and mortality. Am J Med. 2013;126(10):877–886.
- , , , , . Mild hyponatremia and risk of fracture in the ambulatory elderly. QJM. 2008;101(7):583–588.
- , , , et al. Hyponatremia‐induced osteoporosis. J Bone Miner Res. 2010;25(3):554–563.
- , . Hyponatremia and mortality: moving beyond associations. Am J Kidney Dis. 2013;62(1):139–149.
- , , , . Reversible nerve conduction slowing in hyponatremia. J Neurol. 2004;251(12):1532–1533.
- , , , et al. Risk factors for hospital‐acquired Staphylococcus aureus bacteremia. Arch Intern Med. 1999;159(13):1437–1444.
- , . Hypernatremia. N Engl J Med. 2000;342(20):1493–1499.
- , , , , , . Influence of hypernatremic‐hyperosmolar state on hemodynamics of patients with normal and depressed myocardial function. Crit Care Med. 1986;14(10):913–914.
Sodium is the predominant extracellular cation and a major determinant of serum osmolality. As such, the serum sodium (SNa) concentration in humans is closely maintained by sensitive homeostatic mechanisms. However, disorders of sodium homeostasis are relatively common in selected patient populations, resulting in hyponatremia (<135 mmol/L) or hypernatremia (>144 mmol/L).[1, 2]
The presence of hyponatremia is independently associated with greater mortality in hospitalized individuals,[3] including patients with congestive heart failure[4] and cancer.[5] In prior subgroup analyses of patients with musculoskeletal disorders undergoing surgery, hyponatremia (<135 mmol/L) at the time of hospital admission was associated with a 2.31‐fold greater risk of death, compared with normonatremic individuals (135144 mmol/L).[3] Hyponatremia is also associated with increased fracture risk[6, 7] and disturbances of gait8; however, controversy remains as to whether this association is causal or simply a marker of comorbid disease. On the other hand, hypernatremia has been associated with greater risk of mortality in critically ill patients9; however, there is a relative paucity of data regarding clinical associations in the orthopedic population.
We aimed to examine the relationship of the perioperative SNa (corrected for glucose) with length of stay and 30‐day mortality in patients undergoing major orthopedic surgery. We hypothesized that both hypo‐ and hypernatremia would be associated with greater length of stay and greater 30‐day mortality.
METHODS
Study Population
Administrative and laboratory data were obtained from individuals admitted to 2 major hospitals in Boston, Massachusetts. Brigham and Women's Hospital is a 793‐bed academic medical center; Massachusetts General Hospital is a 907‐bed academic medical center. These hospitals provide care to an ethnically and socioeconomically diverse population within eastern Massachusetts and the surrounding region. The study was deemed exempt by the Partners Institutional Review Board.
The Research Patient Data Registry serves as a central data warehouse for over 1.8 million inpatients and outpatients; it contains information on patient demographics, diagnoses, procedures, medications, inpatient and outpatient encounters, and laboratory results. The database has been accessed previously for clinical studies.[3, 10] Between January 1, 2006 and January 27, 2011, data from the index admission of adult individuals undergoing major orthopedic procedures were abstracted from the Research Patient Data Registry (n=21,663). Those without availability of simultaneous measurements of SNa and glucose within 6 days of surgery (to minimize iatrogenic influences on SNa) were excluded (n=4995), leaving 16,668 admissions available for analysis. Reasons for exclusion included a length of stay 1 day (n=137) and/or age <18 years (n=327). The final cohort consisted of 16,206 unique individuals.
The following data were retrieved: age, race, sex, length of stay, vital status (linked to the Social Security Death Index), International Classification of Diseases, 9th Revision, Clinical Modification (ICD‐9‐CM) diagnosis codes (up to 10 per patient), and inpatient sodium and glucose measurements. The Deyo modification of the Charlson Comorbidity Index (D‐CI) was used to estimate comorbid disease status (sum of the weighted number of comorbid conditions based on 17 diagnostic categories identified from ICD‐9‐CM diagnosis codes).[11]
Exposures and Outcomes
The primary exposure of interest was the serum sodium concentration during hospitalization most proximal to the day of surgery. All serum sodium measurements were corrected for concomitant serum glucose >100 mg/dL in the following manner: corrected sodium (SNa)=measured sodium+(measured glucose‐100/100)*1.6.12 SNa was then categorized into moderate/severe hyponatremia (130 mmol/L), mild hyponatremia (131134 mmol/L), normonatremia (135143 mmol/L), or hypernatremia (144 mmol/L). The primary outcomes of interest were hospital length of stay and 30‐day mortality. Length of stay was log‐transformed due to the highly right‐skewed distribution. For mortality analyses, at‐risk time was considered from the date of laboratory measurement of SNa until death or 30 days later, whichever came first.
Statistical Analysis
Continuous variables were examined graphically and recorded as means ( standard deviations); comparisons were made using t tests. Categorical variables were examined by frequency distribution, recorded as proportions, and comparisons were made using the [2] test.
The association between log‐transformed length of stay and category of SNa was assessed by linear regression models; the association with all‐cause mortality was assessed by fitting Cox proportional hazards models. Initially unadjusted models were fit. To explore the extent of confounding, case‐mix adjusted models were fit as follows: model 1 was adjusted for age, race (black vs nonblack), sex (male vs female), and clinical center. Model 2 was adjusted for the same variables as model 1, in addition to the D‐CI score (1, 2, or 3) and diagnosis of fracture; model 3 was adjusted for the same covariates as model 2 plus individual covariate terms for congestive heart failure (CHF), diabetes, cancer, and liver disease. To further assess for the presence of nonlinear relationships in mortality analyses, restricted and adjusted cubic splines were fit with knots corresponding to SNa values of 135, 137, 139, 141, and 143 mmol/L (approximately the 10th, 25th, 50th, 75th, and 90th percentiles). The linearity assumption for continuous variables was assessed by comparative model fit diagnostics using Akaike's information criterion. The proportionality assumption was assessed by Schoenfeld residual testing.
Subgroup analyses were performed according to the presence or absence of a diagnostic code for fracture. As the majority of patients had their SNa measured on the same day as surgery, sensitivity analyses were performed that restricted inclusion to those individuals with SNa measured within 60 days prior to admission.
Two‐tailed P values <0.05 were considered statistically significant. Analyses were performed with SAS version 9.2 (SAS Institute, Cary, NC) and Stata 10MP (StataCorp, College Station, TX).
RESULTS
Baseline Characteristics
The primary cohort consisted of 16,206 individuals. Mean age was 62.5 years (16.6), 44.8% were male, 4.6% were black, 4.9% had CHF, and 12.4% were diabetic. The mean SNa was 138.52.9 mmol/L; 1.2% had moderate/severe hyponatremia, 6.4% had mild hyponatremia, and 2.5% were hypernatremic. Those with lower SNa tended to be older, female, and more likely to have CHF, cancer, liver disease, and higher comorbidity scores than those with normonatremia (Table 1).
| Perioperative SNa (mmol/L) | |||||
|---|---|---|---|---|---|
| 130, n=198 | 131134, n=1,036 | 135143, n=15,563 | 144, n=409 | Pb | |
| |||||
| Age (y) | 72.514.9 | 66.817.1 | 62.616.5 | 65.117.0 | <0.001 |
| Male (%) | 32.3 | 45.5 | 45.2 | 37.2 | <0.001 |
| Black (%) | 1.6 | 4.2 | 4.7 | 5.3 | 0.18 |
| CHF (%) | 13.1 | 9.2 | 4.5 | 6.6 | <0.001 |
| DM (%) | 10.1 | 13.3 | 12.4 | 12.0 | 0.61 |
| Cancer (%) | 14.1 | 10.8 | 4.5 | 4.4 | <0.001 |
| COPD (%) | 13.1 | 14.4 | 13.1 | 14.2 | 0.63 |
| Hypothyroid (%) | 12.1 | 11.0 | 10.5 | 10.3 | 0.84 |
| Liver disease (%) | 2.0 | 1.1 | 0.6 | 0.5 | 0.02 |
| D‐CI score | <0.001 | ||||
| 0 | 43.4 | 48.0 | 61.5 | 60.6 | |
| 12 | 41.4 | 38.6 | 31.9 | 33.8 | |
| 3 | 15.2 | 13.4 | 6.6 | 6.6 | |
| Glucose (mg/dL) | 142100 | 13657 | 13342 | 147108 | <0.001 |
Hospital Length of Stay
The median length of stay was 4 days (interquartile range, 36 days). The unadjusted length of stay was greater for those with hypo‐ and hypernatremia compared with those who were normonatremic. In multivariable adjusted models this pattern persisted, with evidence for a J‐shaped association for categories of SNa with greater length of stay (Table 2). In adjusted subgroup analyses, similar J‐shaped patterns of association (model 3) were evident in those with and without a diagnosis of fracture.
| Difference (95% CI) in LOS in Days According to Category of Perioperative SNab | ||||
|---|---|---|---|---|
| 130 mmol/L, n=198 | 131134 mmol/L, n=1,036 | 135143 mmol/L, n=14,563 | 144 mmol/L, n=409 | |
| ||||
| Median LOS in days [IQR] | 6 [49] | 5 [48] | 4 [36] | 5 [47] |
| Unadjusted | 2.2 (1.9‐2.6) P<0.001 | 1.8 (1.6‐1.9) P<0.001 | REF | 1.5 (1.3‐1.7) P<0.001 |
| Model 1 | 2.2 (1.8‐2.6) P<0.001 | 1.7 (1.6‐1.9) P<0.001 | REF | 1.5 (1.3‐1.7) P<0.001 |
| Model 2 | 1.7 (1.4‐2.0) P<0.001 | 1.4 (1.3‐1.5) P<0.001 | REF | 1.4 (1.2‐1.5) P<0.001 |
| Model 3 | 1.6 (1.4‐1.9) P<0.001 | 1.4 (1.3‐1.5) P<0.001 | REF | 1.4 (1.2‐1.5) P<0.001 |
| Fracturec | ||||
| Present, n=5,296 | 1.4 (1.1‐1.9) P=0.02 | 1.2 (1.01.4) P=0.01 | REF | 1.7 (1.3‐2.1) P<0.001 |
| Absent, n=10,910 | 1.8 (1.5‐2.2) P<0.001 | 1.5 (1.4‐1.7) P<0.001 | REF | 1.2 (1.01.3) P=0.02 |
In sensitivity analyses restricted to individuals with SNa available within 60 days prior to admission, the effect estimates for the relationships between categories of hyponatremia and length of stay were qualitatively unchanged (see Supporting Information, Table A, in the online version of this article).
30‐Day Mortality
Overall, patients contributed 1325 years of at‐risk time, during which 208 deaths were recorded within 30 days of orthopedic surgery. In both unadjusted and case‐mix adjusted models, there was evidence for the presence of a J‐shaped association for categories of SNa with greater 30‐day mortality (Table 3). Restricted cubic spline analyses provided additional evidence for the presence of a nonlinear relationship, with hypo‐ and hypernatremia being associated with greater 30‐day mortality (Figure 1). In adjusted subgroup analyses, mild hyponatremia and hypernatremia remained associated with greater mortality in those with fracture, whereas only moderate/severe hyponatremia remained associated with greater mortality in those without a diagnosis of fracture.
| Hazard Ratio (95% CI) for 30‐Day Mortality According to Category of Perioperative SNa | ||||
|---|---|---|---|---|
| <130 mmol/L, n= 198 | 131134 mmol/L, n=1,036 | 135143 mmol/L, n=14,563 | 144 mmol/L, n=409 | |
| ||||
| Unadjusted | 5.73 (3.11‐10.6) | 3.48 (2.40‐5.04) | REF | 4.90 (3.037.91) |
| Model 1 | 3.49 (1.88‐6.49) | 2.36 (1.60‐3.50) | REF | 3.83 (2.31‐6.35) |
| Model 2 | 2.89 (1.56‐5.35) | 1.96 (1.33‐2.90) | REF | 3.14 (1.88‐5.21) |
| Model 3 | 2.47 (1.33‐4.59) | 1.80 (1.21‐2.66) | REF | 2.99 (1.79‐4.98) |
| Fractureb | ||||
| Present, n=5,296 | 1.94 (0.84‐4.47) | 1.83 (1.13‐2.97) | REF | 3.12 (1.72‐5.66) |
| Absent, n=10,910 | 3.85 (1.53‐9.68) | 1.58 (0.80‐3.14) | REF | 2.73 (0.98‐7.62) |
In sensitivity analyses, when restricted to individuals with SNa available within 60 days prior to admission, the effect estimates for the relationships between categories of hyponatremia and length of stay were qualitatively unchanged (see Supporting Information, Table B, in the online version of this article).
DISCUSSION
In this study of hospitalized patients undergoing major orthopedic procedures, we report that abnormal preadmission and perioperative SNa during hospitalization are: (1) present in approximately 10% of patients, (2) associated with greater hospital length of stay, and (3) associated with greater 30‐day mortality.
The incidence of perioperative hyponatremia (<135 mmol/L) in prior studies ranges from 9.1% to 26.5% in studies of patients over 65 years of age admitted to the hospital with large bone fractures.[13, 14] In our study, the overall incidence of hyponatremia (SNa <135 mmol/L) was 7.6%. Of note, our sample included individuals aged 18 years and was not limited to individuals with fractures, which may partly explain why the incidence was lower than that previously reported.
Few studies have examined the association of perioperative hyponatremia with length of stay in the hospitalized orthopedic surgery population. We found that both hyponatremia and hypernatremia (corrected for glucose) were independently associated with greater adjusted hospital length of stay, compared with normonatremic individuals. This has important implications for healthcare costs and resource utilization. However, it is unclear if dysnatremia is associated with other metrics of postoperative recovery that could delay discharge, or whether dysnatremia alone is responsible for the decision to delay discharge (despite other measures of recovery being deemed adequate).
Leung et al. recently examined the association of preoperative hyponatremia (<135 mmol/L, uncorrected and measured within 90 days of surgery) with 30‐day mortality in 964,263 patients from the American College of Surgeons National Surgical Quality Improvement Program (ACS NSQIP) dataset.[15] They found that preoperative hyponatremia was associated with 44% greater adjusted odds (odds ratio [OR]: 1.44, 95% CI: 1.38‐1.50) of 30‐day mortality in the whole cohort and with 56% greater adjusted odds (OR: 1.56, 95% CI: 1.22‐1.99) in the subgroup of orthopedic patients. Waikar et al. also reported that hyponatremia is associated with greater in‐hospital and long‐term mortality in the subgroup of hospitalized patients who were admitted for musculoskeletal problems requiring surgery.[3] Our analyses support these findings and provide greater confidence by specifically focusing on patients admitted for major orthopedic surgery. We also expand the current knowledge base by correcting for serum glucose concentrations and by reporting associations of moderate/severe hyponatremia with adverse clinical outcomes.
The incidence of perioperative hypernatremia in our study was 2.5%, which compares to 1.0% to 2.6% in other studies of orthopedic patients.[14, 16] Hypernatremia has previously been associated with greater mortality in hospitalized patients in the intensive care unit (ICU) setting at the time of admission,[17] during the ICU stay,[9] in older patients (>60 years),[18] and in those with decompensated liver disease.[19] More recently, Leung et al. performed further analyses using data from the ACS NSQIP, reporting that preoperative hypernatremia (>144 mmol/L, uncorrected and measured within 90 days of surgery) is associated with 44% greater adjusted odds (OR: 1.44, 95% CI: 1.33‐1.56) of 30‐day mortality, but was not significantly associated with greater mortality in the orthopedic subgroup.[20] We extend the literature by examining glucose‐corrected SNa and again by focusing specifically on those undergoing major orthopedic surgery, reporting an association of perioperative hypernatremia with greater length of stay and 30‐day mortality. In our study, when we specifically examined the association of preoperative SNa values, we noted attenuation of the effect estimates and loss of statistical significance, confirming the subgroup findings of Leung et al.[20] The reasons for this are not clear, but may relate to the possibility that perioperative hypernatremia (as opposed to preoperative) is a stronger marker of concurrent illness severity and therefore more closely associates with adverse clinical outcomes.
As with most observational studies in this area, the question of whether dysnatremia is causative or merely a marker of comorbidity remains. In this regard, there are some unique points that deserve mention in this cohort of patients. Hyponatremia has previously been associated with several musculoskeletal abnormalities, including a greater risk of fracture,[7, 16, 21] which may contribute to the observed associations with greater morbidity and mortality. For example, Verbalis et al. reported that the induction and maintenance of hyponatremia by administration of 1‐deamino8‐d‐arginine vasopressin in rodent models is associated with reduced bone mineral density in excised rat femurs, which may predispose to greater fracture risk.[22] In humans, the same authors reported that hyponatremia (<135 mmol/L) was independently associated with greater odds of having osteoporosis at the femoral neck in individuals aged 50 years or older (OR: 2.87, 95% CI: 1.41‐5.81), compared with normonatremic individuals (135145 mmol/L).[22] On the other hand, Kinsella et al. found that hyponatremia (<135 mmol/L) associated with greater odds of having a fracture (OR: 2.25, 95% CI: 1.24‐4.09), independent of the presence of osteoporosis as measured by hip and vertebral T‐scores, suggesting an association between hyponatremia and fracture, independent of osteoporosis.[6] Other potential confounders of these associations may include gait disturbance and unsteadiness, which could contribute to greater fall and fracture risk.[7, 8, 21] Additional proposed mechanisms for the association of hyponatremia with adverse outcomes include the development of cerebral edema,[23] abnormal nerve conduction,[24] and predisposition to infection,[25] perhaps via altered immune functioning in the presence of hypo‐osmolality. Unfortunately, due to data limitations, we were unable to investigate these hypotheses further in our present study. In relation to hypernatremia, associations with impairment in neurologic,[26] myocardial,[27] and immune functioning have been reported previously, which may contribute to some of the excess risk associated with this condition.
There are several limitations of this study that deserve further mention. We used ICD‐9 and diagnosis‐related group codes to ascertain data on primary diagnoses and comorbid conditions, raising the possibility of some degree of misclassification of covariates in this study. We were unable to differentiate between elective versus urgent/emergent procedures. Given the large sample size and intrinsic data limitations, we were unable to ascertain the underlying causes of dysnatremia, or examine practice differences between the 2 institutions from which the sample was sourced. The majority of our sample had perioperative SNa measurements performed on the same day as their major orthopedic procedure. Although we were unable to confirm the timing of SNa measurements relative to the operation, it is not uncommon for elective cases to have initial hospitalization labs drawn in the recovery room, as opposed to preoperatively. In sensitivity analyses, we found similar patterns of association for hyponatremia with outcomes, but not for hypernatremia, when we examined the SNa measurement within 60 days prior to admission as the exposure of interest. Although these analyses were underpowered, they provide some modicum of reassurance that the observed associations of perioperative hyponatremia with adverse outcomes are robust. Whether perioperative dysnatremia, measured in the recovery room, has associations with clinical outcomes that are distinct from immediate preoperative dysnatremia requires further research. The possibility of residual confounding (eg, administration of fluids, medications, severity of illness) that was not captured by the D‐CI index, functional status and infection remain important considerations. Finally, caution must be applied before generalizing our results from 2 large academic centers to the general hospitalized orthopedic population.
In conclusion, we report that dysnatremia on admission for patients requiring major orthopedic surgery is present in approximately 10% of patients and is associated with greater length of stay and all‐cause mortality. Further research is required to assess whether dysnatremia is a mediator or marker for increased morbidity and mortality, and whether perioperative correction of hypo‐ or hypernatremia will improve clinical outcomes in these patients.
Acknowledgments
Disclosures: Dr. Mc Causland had full access to all the data in the study and takes responsibility for the integrity of the data and the accuracy of the data analysis. Dr. McCausland was supported by a Clinical Fellowship Grant from the National Kidney Foundation (20112013). Dr. Wright has no relevant disclosures. This work was supported by an investigator‐initiated grant from Otsuka to Dr. Waikar. Otsuka had no role in the design, conduct, management, analysis or interpretation of these data. In addition to investigator‐initiated funding from Otsuka for the present study, Dr. Waikar previously received grant support from Astellas for an investigator‐initiated study of hyponatremia and participated in an advisory board meeting for Otsuka. He is supported by National Institutes of Health grants U01DK085660 and RO1DK093574.
- . Hypernatremia. Semin Nephrol. 1998;18(1):20–30.
- , , . Incidence and prevalence of hyponatremia. Am J Med. 2006;119(7suppl 1):S30–S35.
- , , . Mortality after hospitalization with mild, moderate, and severe hyponatremia. Am J Med. 2009;122(9):857–865.
- , , , , , . Predicting mortality among patients hospitalized for heart failure: derivation and validation of a clinical model. JAMA. 2003;290(19):2581–2587.
- , , . A prospective study on hyponatraemia in medical cancer patients: epidemiology, aetiology and differential diagnosis. Support Care Cancer. 2000;8(3):192–197.
- , , , , . Hyponatremia independent of osteoporosis is associated with fracture occurrence. Clin J Am Soc Nephrol. 2010;5(2):275–280.
- , , , et al. Mild hyponatremia as a risk factor for fractures: the Rotterdam Study. J Bone Miner Res. 2011;26(8):1822–1828.
- , , , , . Mild chronic hyponatremia is associated with falls, unsteadiness, and attention deficits. Am J Med. 2006;119(1):71.e71–78.
- , , , et al. Intensive care‐acquired hypernatremia after major cardiothoracic surgery is associated with increased mortality. Intensive Care Med. 2010;36(10):1718–1723.
- , , , et al. Validity of international classification of diseases, ninth revision, clinical modification codes for acute renal failure. J Am Soc Nephrol. 2006;17(6):1688–1694.
- , , . Adapting a clinical comorbidity index for use with ICD‐9‐CM administrative databases. J Clin Epidemiol. 1992;45(6):613–619.
- . Hyperglycemia‐induced hyponatremia—calculation of expected serum sodium depression. N Engl J Med. 1973;289(16):843–844.
- , , , , . Hyponatremia associated with large‐bone fracture in elderly patients. Int Urol Nephrol. 2009;41(3):733–737.
- , , , , . Hip fracture post‐operation dysnatremia and Na+‐courses in different cognitive and functional patient groups. Arch Gerontol Geriatr. 2011;53(2):179–182.
- , , , , , . Preoperative hyponatremia and perioperative complications. Arch Intern Med. 2012;172(19):1474–1481.
- , , , . Mortality and serum urea and electrolytes on admission for hip fracture patients. Injury. 2006;37(8):698–704.
- , , , et al. Hypernatremia in the critically ill is an independent risk factor for mortality. Am J Kidney Dis. 2007;50(6):952–957.
- , , . Hypernatremia in elderly patients. A heterogeneous, morbid, and iatrogenic entity. Ann Intern Med. 1987;107(3):309–319.
- , , . Hypernatremia in hepatic failure. JAMA. 1980;243(12):1257–1260.
- , , , . Preoperative hypernatremia predicts increased perioperative morbidity and mortality. Am J Med. 2013;126(10):877–886.
- , , , , . Mild hyponatremia and risk of fracture in the ambulatory elderly. QJM. 2008;101(7):583–588.
- , , , et al. Hyponatremia‐induced osteoporosis. J Bone Miner Res. 2010;25(3):554–563.
- , . Hyponatremia and mortality: moving beyond associations. Am J Kidney Dis. 2013;62(1):139–149.
- , , , . Reversible nerve conduction slowing in hyponatremia. J Neurol. 2004;251(12):1532–1533.
- , , , et al. Risk factors for hospital‐acquired Staphylococcus aureus bacteremia. Arch Intern Med. 1999;159(13):1437–1444.
- , . Hypernatremia. N Engl J Med. 2000;342(20):1493–1499.
- , , , , , . Influence of hypernatremic‐hyperosmolar state on hemodynamics of patients with normal and depressed myocardial function. Crit Care Med. 1986;14(10):913–914.
© 2014 Society of Hospital Medicine

Health Canada approves pomalidomide for MM

Credit: CDC
Health Canada has approved pomalidomide (Pomalyst) for use in combination with dexamethasone to treat patients with relapsed or refractory multiple myeloma (MM).
Patients must have received at least 2 prior therapies, failed treatment with lenalidomide and bortezomib, and experienced disease progression while on their last treatment regimen.
Health Canada had given pomalidomide priority review status due to the unmet need of effective therapies for patients with aggressive MM.
“Until now, there have been no approved options for patients whose disease has progressed despite available treatments,” said Donna E. Reece, MD, of the Princess Margaret Cancer Centre in Toronto.
“With Pomalyst, we have a new option that extends periods of remission, is generally well-tolerated, and can be taken in the convenience of a patient’s home.”
Trial prompts approval
Health Canada based its approval of pomalidomide on findings from the MM-003 trial. Regulatory agencies in the United States and European Union, both of which approved pomalidomide last year, based their decisions on the results of this study as well.
The phase 3 trial included 455 patients with relapsed or refractory MM who had received a median of 5 prior treatment regimens.
Patients were randomized to receive pomalidomide plus low-dose dexamethasone (POM-LoDEX, n=302) or high-dose dexamethasone alone (HiDEX, n=153). The median follow-up was 10 months.
Researchers found that response and survival rates were superior in the POM-LoDEX arm, and rates of adverse events were largely similar between the 2 arms.
The overall response rate was 31% (n=95) in the POM-LoDEX arm and 10% (n=15) in the HiDEX arm. The median duration of response was 7.0 months and 6.1 months, respectively.
The median progression-free survival was 4.0 months in the POM-LoDEX arm and 1.9 months in the HiDEX arm (P<0.001). And the median overall survival was 12.7 months in the POM-LoDEX arm and 8.1 months in the HiDEX arm (P=0.028).
Patients in the POM-LoDEX arm experienced more grade 3/4 neutropenia than patients in the HiDEX arm. But rates of grade 3/4 anemia and thrombocytopenia were similar.
Rates of grade 3/4 non-hematologic toxicities were also comparable and included infection, pneumonia, hemorrhage, glucose intolerance, and fatigue. Other adverse events of note included venous thromboembolism and peripheral neuropathy, which occurred at similar rates in both arms.
These results were presented at the 2013 ASCO Annual Meeting and published in The Lancet Oncology in October.
Drug availability
Pomalidomide is expected to be commercially available in Canada in March.
The drug will be distributed through a risk-management program called RevAid, which was developed in 2008. By adding pomalidomide to the program, regulators are aiming to prevent fetal exposure to the drug because of its structural similarities to thalidomide, a known human teratogen.
Under the program, only prescribers and pharmacists registered with RevAid are able to prescribe and dispense pomalidomide. In addition, only those patients who are registered and meet all the conditions of the RevAid program will receive the drug. ![]()
Normal enzyme aids mutated FLT3 to fuel AML

Results of preclinical research suggest the wild-type version of SYK pairs with mutated FLT3 to promote progression of acute myelogenous leukemia (AML).
And this molecular partnership promotes AML cells’ resistance to FLT3 inhibitors.
However, adding a SYK inhibitor to the mix can override this resistance. In an animal model of AML, treatment with a combination of FLT3 and SYK inhibitors was significantly more effective than either inhibitor alone.
These findings, published in Cancer Cell, raise hopes that treatment strategies focusing on both enzymes simultaneously could improve outcomes for patients with FLT3-ITD AML.
“Patients whose AML cells express FLT3-ITD are among the highest-risk group of patients with AML,” said study author Kimberly Stegmaier, MD, of the Dana-Farber Cancer Institute in Boston. “Their AML is particularly difficult to treat.”
In 2009, researchers in Dr Stegmaier’s lab discovered that SYK, a kinase that had attracted attention for its role in other malignancies, could be a potential drug target in AML. Unlike other cancer-associated kinases, SYK rarely undergoes mutations or other genomic alterations in cancer cells, remaining in its wild-type form.
With the current study, Dr Stegmaier and her colleagues set out to better understand SYK’s role in AML. The team screened AML cell lines to reveal the full scope of the enzyme’s molecular interactions. And they found evidence of strong interactions between wild-type SYK and mutated FLT3, particularly FLT3-ITD.
“We wanted to understand the cooperative oncologic effects by which SYK contributes to AML,” Dr Stegmaier said. “The concept of a normal enzyme aiding a mutant one has not yet been widely explored, and so we were both surprised and pleased to see FLT3-ITD come up as a high-priority hit in our screens.”
Through experiments in cell lines, primary patient samples, and animal models, the researchers found that SYK and FLT3-ITD’s interactions are a key ingredient in the progression of myeloproliferative neoplasms into AML. AML cells’ continued growth after turning malignant also relied on these interactions.
In addition, the team found that SYK’s hyperactivated form can promote resistance to the FLT3-targeting drug quizartinib. However, a combination of quizartinib and the SYK inhibitor PRT062607 overcame this resistance, significantly increasing survival and reducing signs of disease in a FLT3-ITD AML mouse model.
Highlighting their findings’ clinical relevance, the researchers found strong SYK activity in cells from FLT3-ITD AML patients. The cells were also highly sensitive to SYK inhibition.
“These data affirm that SYK is an important target in AML,” Dr Stegmaier said. “They also suggest that interactions between oncologic kinases and SYK or other wild-type enzymes may contribute to resistance of kinase inhibitors more broadly.”
Dr Stegmaier added that, over the course of this research, the team has developed a suite of tools that could prove useful for future clinical studies of treatments with SYK inhibitors or SYK inhibitors in combination with FLT3 inhibitors.
“We have not only identified SYK as a candidate treatment target in AML, but we have also identified a specific population of patients with AML more likely to respond to SYK inhibitors: patients with FLT3 mutations,” she said.
“Moreover, we have developed tools for identifying patients with high levels of SYK and FLT3 activation and can monitor these 2 targets while patients are receiving treatment. Predictive biomarkers of response are becoming increasingly important in the development of effective clinical trials of targeted therapies.” ![]()
Proteins may help explain PEL pathogenesis

Researchers say they’ve identified 20 proteins specific to primary effusion lymphoma (PEL).
The proteins, which were found by growing PEL cells in culture and analyzing the secretome, may explain PEL pathogenesis, its peculiar cell adhesion, and migration patterns.
The investigators also uncovered related oncogenic pathways, which could pave the way for more individualized treatment of PEL.
These findings appear in The American Journal of Pathology.
The researchers analyzed secretomes from 4 established PEL cell lines—CRO-AP2, CRO-AP3, CRO-AP5, and CRO-AP6—as well as from 4 PEL clinical samples and 3 primary solid lymphomas. PEL cells are characterized by Kaposi’s sarcoma-associated herpesvirus (KSHV) infection, and the primary solid lymphomas were KSHV-positive as well.
The investigators measured protein content using 2 complementary mass spectrometry platforms. The experiments allowed cells to grow for 16 to 18 hours and were performed under serum-free conditions to increase the ability to detect secreted proteins.
Of the 266 proteins identified, 139 (52%) were secreted, and 127 were considered to have an intracellular origin or were secreted in an unconventional fashion.
“Most of the proteins we recognized in the secretome of PEL are new with respect to previous studies utilizing conventional proteomic analysis and gene expression profiling,” said study author Annunziata Gloghini, PhD, of Istituto Nazionale dei Tumori in Milan, Italy.
“Importantly, 27 proteins were shared by secretomes from all PEL cell lines.”
The PEL secretomes were enriched with proteins specifically involved in inflammation and the immune response—such as HMGB1, GRAA, and PCBP2—as well as cell growth—such as LEG1, STMN1, and S10A6.
Other proteins are known to play roles in mRNA processing—such as ANM1 and PCBP2—or cell structure, adhesion, migration, and organization—such as EZRI and MOES. Some of the proteins have enzymatic activity—such as CATA and GSTK1.
A comparison of secretomes from PEL with those from other tumor cell lines revealed 20 proteins specific to the PEL cell lines. This suggests secretome profiling provides a source of tumor biomarkers and may ultimately improve patient management, the researchers said.
The group also conducted pathway/network enrichment analyses and found that the pathways most activated in PEL cell lines were involved with the regulation of autophagy through LRRK2-mediated signaling pathways and with apoptosis and survival through granzyme A signaling.
“The extracellular functions of granzyme A might be involved in the particular tropism of PEL and its cell growth,” said study author Italia Bongarzone, PhD, also of the Istituto Nazionale dei Tumori.
“Further studies are needed to confirm and validate the importance of these pathways/processes and their roles in lymphoma tumorigenesis and progression.” ![]()
Team develops new live-cell printing technology

Credit: Lidong Qin lab
A new technique allows scientists to print living cells onto any surface in virtually any shape, according to a paper published in Proceedings of the National Academy of Sciences.
The approach, called Block-Cell-Printing (BloC-Printing), produces 2-D cell arrays in as little as half an hour, prints the cells as close together as 5 μm, and allows for the use of different cell types.
And unlike similar work using inkjet printing approaches, almost all cells survive BloC-Printing.
“Cell printing is used in so many different ways now—for drug development and in studies of tissue regeneration, cell function, and cell-cell communication,” said study author Lidong Qin, PhD, of Houston Methodist Research Institute in Texas.
“Such things can only be done when cells are alive and active. A survival rate of 50% to 80% is typical as cells exit the inkjet nozzles. By comparison, we are seeing close to 100% of cells in BloC-Printing survive the printing process.”
On the other hand, Dr Qin noted that inkjet printing remains faster than BloC-Printing. And BloC-Printing cannot yet print multi-layer structures as inkjetting can.
BloC-Printing manipulates microfluidic physics to guide living cells into hook-like traps in a silicone mold. Cells flow down a column in the mold, past trapped cells to the next available slot, eventually creating a line of cells (in a grid of such lines).
The position and spacing of the traps and the shape of the channel navigated by the cells is fully configurable during the mold’s creation. When the mold is lifted away, the living cells remain behind, adhering to the growth medium or other substrate in prescribed formation.
Dr Qin’s group tested BloC-Printing for its utility in studying breast cancer cells and primary neurons.
By arranging the cancer cells in a grid and examining their growth in comparison with a non-metastatic control, the researchers found they could easily characterize the metastatic potential of the cancer cells.
“We looked at cancer cells for their protrusion generation capability, which correlates to their malignancy level,” Dr Qin said. “Longer protrusion means more aggressive cancer cells. The measurement may help to diagnose a cancer’s stage.”
The researchers also printed a grid of brain cells and gave the cells time to form synaptic and autaptic junctions.
“The cell junctions we created may be useful for future neuron signal transduction and axon regeneration studies,” Dr Qin said. “Such work could be helpful in understanding Alzheimer’s disease and other neurodegenerative diseases.”
While it is too early to predict the market cost of BloC-Printing, Dr Qin said the materials of a single BloC mold cost about $1. After the mold has been fabricated and delivered, a researcher only needs a syringe, a carefully prepared suspension of living cells, a Petri dish, and a steady hand.
“BloC-Printing can be combined with molecular printing for many types of drug screening, RNA interference, and molecule-cell interaction studies,” Dr Qin said. “We believe the technology has big potential.” ![]()
Actinic keratoses: The cold truth
Actinic keratosis, or solar keratosis, results from the proliferation of atypical epidermal keratinocytes. When we can take the time to do a skin examination, we all see a lot of them especially among our older and middle-aged sun worshippers and sunscreen agnostics. My traditional approach, for better or for worse, has been to acquire the liquid nitrogen bottle on the floor and go to work. But my recent review of guidelines prepared on behalf of the British Association of Dermatologists and published several years ago have prompted me to open my eyes a bit more to other possible approaches.
Reassuringly, the likelihood of progression of an AK to squamous cell carcinoma (SCC) is low. Estimates from a large U.S. cohort revealed a rate of transformation to invasive or in situ SCC of 0.6% after 1 year and 2.6 % after 4 years. But we have to remember that although the progression rate is low, 60% of SCC arise from AKs.
The AK guideline authors synthesized and graded published evidence. Topical therapies receiving an "A grade" (i.e., good evidence) included no therapy or emollients for mild AKs and 5-fluorouracil. Therapies with a "B grade" (i.e., fair evidence) include diclofenac gel and imiquimod.
Other treatments include cryosurgery (A grade) and photodynamic therapy (B grade). We do a lot of cryotherapy in our practice but patients need to be informed of the scarring and possible hyper- or hypopigmentation that can occur with treatment. Photodynamic therapy will, in most cases, be administered by dermatologists.
According to a recent paper in the Drugs and Therapeutic Bulletin, patients should be referred to a dermatologist if there is diagnostic uncertainty, concerns about malignancy, treatment failure or management concerns, or if the patient is at high risk (e.g., organ transplant recipients, multiple large lesions, or previous SCC).
The guideline authors suggest that most patients can be evaluated and treated in the primary care setting. They go on to say that there is inadequate evidence to justify treatment of all AKs in an attempt to prevent malignant transformation. While reassuring, this requires us to consider all possible treatment approaches. One liquid nitrogen bottle does not fit all.
Dr. Ebbert is professor of medicine and general internist at the Mayo Clinic in Rochester, Minn., and a diplomate of the American Board of Addiction Medicine. The opinions expressed are those of the author. He reports no conflicts of interest.

'I'm going to live forever': the guarantee-time bias
Some study findings are more probably due to a bias in terms of who is included in the studies than to the miraculous effects of occupation, winning awards, or ER status, or whatever is being studied. How should investigators go about avoiding this bias, and more specifically, what should readers look for when they’re reading about some new miracle cure?
Click on the PDF icon above to read the full article.