User login
Management and Prevention of Intraoperative Acetabular Fracture in Primary Total Hip Arthroplasty
Take Home Points
- IAF is an uncommon, but serious complication of primary THA.
- Small (<50 mm) cups are at higher risk for causing IAF.
- Prompt recognition is critical to prevent component migration and need for revision.
- Posterior column integrity is cirtical to a successful outcome when IAF occurs.
- Initial stable fixation, with or without intraoperative acetabular revision, is critical for successful outcome when IAF is identified.
Intraoperative acetabular fracture (IAF) is a rare complication of primary total hip arthroplasty (THA).1-3 IAFs commonly occur with impaction of the acetabular component. Studies have found that underreaming of the acetabulum and impaction of relatively large, elliptic, or monoblock components may increase the risk of IAFs.2-5 There is a paucity of literature on risk factors, treatment strategies, and outcomes of this potentially devastating complication.
In this article, we report on the incidence of IAF in primary THA at our high-volume institution and present strategies for managing and preventing this rare fracture.
Materials and Methods
Between 1997 and 2015, more than 20 fellowship-trained arthroplasty surgeons performed 21,519 primary THAs at our institution. After obtaining Institutional Review Board approval for this study, we retrospectively searched the hospital database and identified 16 patients (16 hips) who sustained an IAF in primary THA. Mean age of the cohort (13 women, 3 men) at time of surgery was 70 years (range, 42-89 years). Of the 16 patients, 13 had a preoperative diagnosis of osteoarthritis, 2 had posttraumatic arthritis, and 1 had rheumatoid arthritis. A posterolateral approach was used with 14 patients and a modified anterolateral approach with the other 2. Surgical technique and implant selection varied among surgeons. Thirteen THAs were performed with an all-press-fit technique and 3 with a hybrid technique (uncemented acetabular component, cemented femoral component). In 9 cases, the acetabular component underwent supplemental screw fixation. Whether to use acetabular component screws or cemented femoral components was decided intraoperatively by the surgeon.
The cohort’s acetabular components were either elliptic modular or hemispheric modular. The elliptic modular component used was the Peripheral Self-Locking (PSL) implant (Stryker Howmedica Osteonics), and the hemispheric modular components used were either the Trident implant (Stryker Howmedica Osteonics) or the ZTT-II implant (DePuy Synthes). Elliptic acetabular components have a peripheral flare, in contrast to true hemispheric acetabular components. Ten elliptic modular and 6 hemispheric modular components were implanted. In all cases, the difference between the final reamer used to prepare the acetabular bed and the true largest external diameter of the impacted shell was 2 mm or less.
The cohort’s 16 femoral components consisted of 8 Secur-Fit uncemented components (Stryker Howmedica Osteonics), 3 Accolade uncemented components (Stryker Howmedica Osteonics), 3 Omnifit EON cemented components (Stryker Howmedica Osteonics), and 2 S-ROM uncemented components (DePuy Synthes).
After surgery, all patients were followed up according to individual surgeon protocol for radiographic and physical examination.
Data on IAF incidence were obtained from a hospital database and were confirmed with electronic medical record (EMR) documentation. Also obtained were IAF causes and locations recorded in operative notes. For fractures identified after surgery, location was obtained from the immediate postoperative radiograph. Fracture management (eg, supplemental screw fixation, fracture reduction and fixation, bone grafting, acetabular component revision, protected weight-bearing) was determined from EMR documentation.
Results
Sixteen patients sustained an IAF in primary THA. All IAFs occurred in cases involving cementless acetabular components. The institution’s incidence of IAF with use of cementless components was 0.0007%. 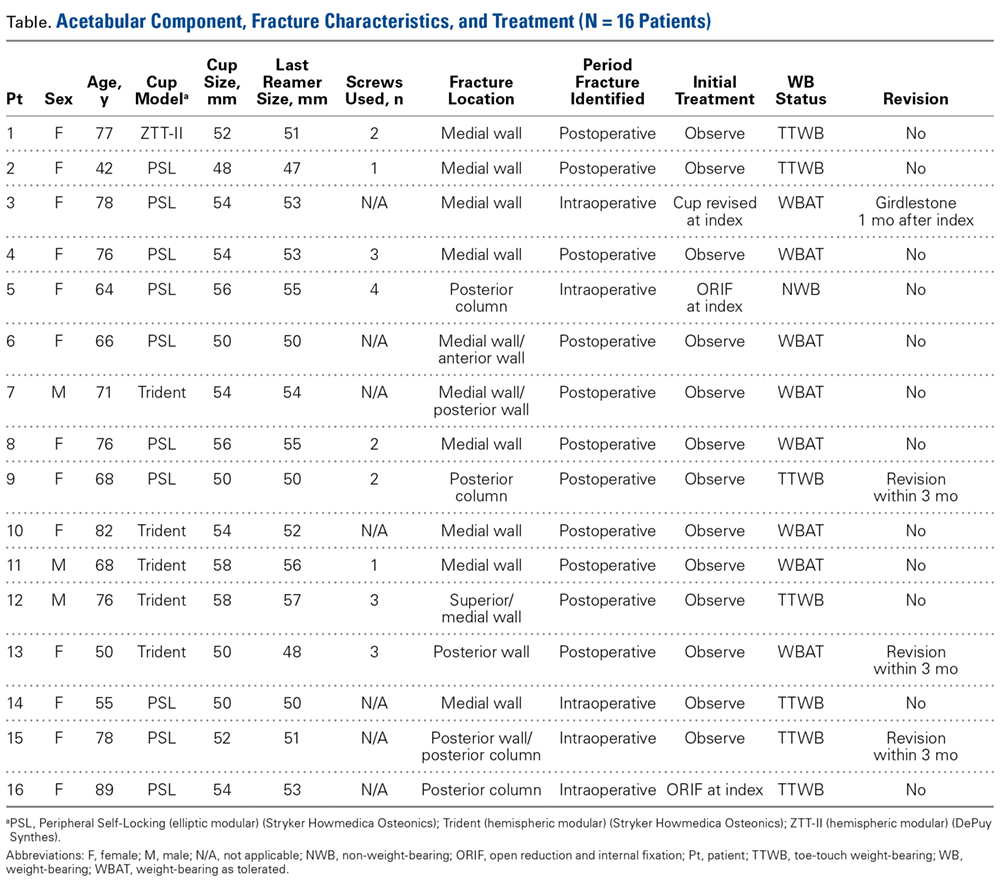
Of the 5 IAFs (31%) identified during surgery, 4 were noted during impaction of the acetabular component, and 1 was noted during reaming. Eighty percent of these IAFs occurred directly posterior, and 60% were addressed at time of index procedure secondary to acetabular component instability. The other 11 fractures (69%) were identified on standard postoperative anteroposterior pelvis radiographs obtained in the postanesthesia care unit (PACU). Details of component characteristics, fracture location, immediate treatment, and weight-bearing precautions for all 16 patients are listed in the Table. 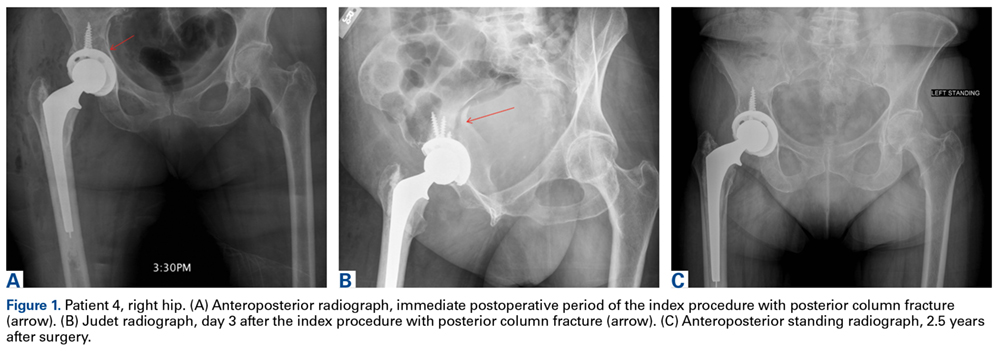
There were additional complications. One patient sustained an intraoperative proximal femur fracture, which was addressed at the index THA with application of a cerclage wire and reinsertion of the femoral component; no further surgical intervention was required, and the femur fracture healed uneventfully. Another patient had a postoperative ileus that required nasogastric tube decompression and monitoring in the intensive care unit; the ileus resolved spontaneously. A third patient, initially treated with bone grafting and cemented cup insertion, was diagnosed with a periprosthetic joint infection 3 weeks after the index THA and was treated with explantation of all components and girdlestone resection arthroplasty; 1 month after the resection arthroplasty, a persistently draining wound was treated with irrigation and débridement. There were no other medical complications, thromboembolic events, or dislocations.
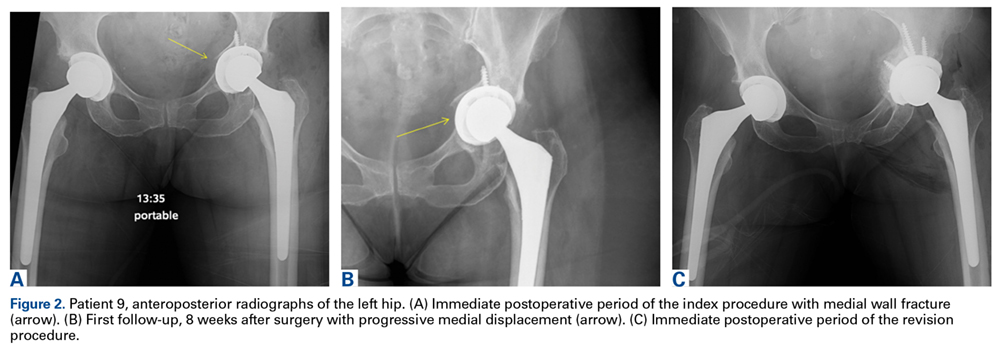
One to 7 weeks after surgery, patients returned for initial follow-up, and radiographs were obtained for component stability assessment. Three patients presented with gross acetabular instability, and revisions were performed. Standard clinical follow-up continued for all patients per individual surgeon protocol. Mean follow-up was 4 years.
Discussion
IAF is an uncommon complication of THA. The rarity of IAFs makes it difficult to obtain a cohort large enough to study the problem. Given the increasing incidence of primary THAs and the almost ubiquitous use of press-fit acetabular components, surgeons who perform THAs undoubtedly will encounter IAFs in their own practice. In this article, we report our institution’s experience with periprosthetic IAFs and provide a framework for making decisions regarding these complications.
Anatomical locations of IAFs have been associated with variable outcomes. In a 2015 series, Laflamme and colleagues6 found posterior column stability a crucial factor in implant stability. Fractures with posterior column instability had a 67% failure rate, and patients with an intact posterior column reliably had osteointegration occur without further intervention.6 In our series, fractures that violated the posterior column had similar results. All these fractures required further operative intervention, either at the index procedure or in the early postoperative period. Loss of posterior column stability prevents secure fixation of the acetabular component, thereby preventing successful hip reconstruction. One posterior column fracture in our series was not recognized until after surgery, on a PACU radiograph, and 1 posterior column fracture was fully appreciated only after postoperative computed tomography (CT) was obtained during immediate hospitalization after the index procedure. In both cases, conservative management was unsuccessful. Revision arthroplasty (and in 1 case late posterior column fixation) was performed to achieve adequate reconstruction. There were no failures after posterior column fixation. In cases of posterior wall or column fracture, we recommend early aggressive treatment, preferably at the time of index arthroplasty, to prevent catastrophic failure.
Most commonly, periprosthetic IAFs go unnoticed until initial postoperative radiographs are examined.6 Eleven of the 16 IAFs in our series were first recognized on radiographs obtained in the PACU. Surgeons thus have difficult decisions to make. The literature has little discussion on managing early postoperative periprosthetic IAFs. Most recent studies, which consist of small series and case reports, have focused on late and often traumatic IAFs.7-9 These were initially classified by Peterson and Lewallen10 as type I, which are stable radiographically (no movement relative to previous radiographs) and do not produce pain with minor movement of the extremity, or type II, which are unstable radiographically (gross displacement of component) or produce pain with any hip motion. Type I fractures were more common and were often managed with protected weight-bearing and observation. The authors concluded that, in type I fractures, retaining the original acetabular component is difficult; however, when these fractures are treated appropriately, a functional prosthesis can be salvaged, and fracture union can be expected.
Less common are acetabular fractures detected during surgery, as in our study. In an outcome series, Haidukewych and colleagues3 reported on 21 periprosthetic acetabular fractures, all recognized during surgery and managed according to perceived stability of the component. All fractures healed uneventfully, and there were no other complications.
These studies provide a framework for addressing IAFs noticed in the early postoperative period. The diagnostic dilemma presented by these fractures was first discussed by Laflamme and colleagues.6 Nine of the 32 fractures in their series were classified as so-called type III fractures, recognized only after the early postoperative period. Additional radiographs (eg, Judet views) or CT scans were crucial in determining acetabular component stability, given the known poor outcomes associated with posterior column fracture. In our series, only 1 patient had CT performed after intraoperative recognition of fracture, and the extent of the fracture was not readily apparent on the patient’s postoperative radiograph. Given the successful recognition and treatment of these fractures in the early postoperative period in our series,
it is difficult to recommend advanced imaging for all periprosthetic IAFs. Perhaps this success is attributable to our almost universal use of screws for acetabular component fixation. Of the 11 patients with fractures recognized during the postoperative period, 8 had supplemental screw fixation at time of index surgery. If there is a question of fixation during component insertion, we recommend scrutinizing the acetabular rim for fracture and placing supplemental screw fixation. Screws placed for acetabular component fixation provide initial stability and may prevent early component failure in the setting of unrecognized medial or anterior fracture. In addition, when component stability is in question after impaction, we recommend using finger palpation to evaluate the sciatic notch for cortical step-off from an otherwise unrecognized fracture. Protected weight-bearing in the postoperative period may be left to the discretion of the surgeon, and the decision should be based on intraoperative stability of the acetabular component.
In our series, there was a disproportionate representation of fractures associated with elliptic acetabular components. All 5 of the fractures recognized during surgery and 5 of the 11 recognized after surgery occurred with elliptic components. The association between elliptic cup design and periprosthetic IAF was identified earlier, by Haidukewych and colleagues.3 Their series showed a statistically significant increase in fracture incidence with impaction of an elliptic cup into a bed prepared with a hemispheric reamer. In the present series, 75% of our acetabular components were impacted into a bed underreamed by 1 mm to 2 mm. It is typical of many surgeons at our institution to underream by 1 mm to 2 mm regardless of the type of component being implanted, though they show a growing trend to overream by only 1 mm with the PSL component, which has been both safe and reliable in preventing catastrophic posterior column fractures, especially with impaction of small (<50 mm) acetabular components. We have not observed early loosening or other evidence of failure with this technique. Cup impaction generates significant hoop stresses that can easily fracture sclerotic or otherwise poor-quality bone, and the dense bone around the acetabular rim experiences increased stress with impaction of elliptic components.2,11-15 Surgeons must understand the design traits of their components and be cognizant of the true difference between the diameter of the final reamer used and the real diameter of the acetabular component. We recommend having a difference of ≤1 mm to mitigate the risk of IAF occurring with cup insertion. With use of elliptic components, slight overreaming of the acetabular bed should be considered. More study is needed to better define these outcomes.
Study Limitations
Our study had several limitations, including the inherent biases of its retrospective design, small cohort size, and inclusion of multiple surgeons. Small cohort size is unavoidable given the low incidence of these injuries, and our study encompassed the experience of a high-volume hip arthroplasty service. There is the possibility that a subset of fractures may have persistently gone unrecognized, either during or after surgery, and the actual incidence of these complications may be higher. These outcomes represent our institutional experience addressing the complexities of these injuries. The lack of standardization in the management of these fractures in our series reflects the diagnostic dilemma they present, as well as the need for more study focused on their management and outcomes.
Conclusion
IAF, an uncommon complication of primary THA, most commonly occurs during component impaction. Acetabular component and surgical technique may influence the fracture rate. Intraoperative or prompt postoperative recognition of these fractures is crucial, as their location is associated with stability and outcome. Careful examination of postoperative radiographs, judicious use of advanced imaging, and close follow-up are needed to prevent early catastrophic failure. We argue against simply observing these unstable fractures and recommend early treatment with rigid fixation and, when necessary, acetabular component revision.
1. Sharkey PF, Hozack WJ, Callaghan JJ, et al. Acetabular fractures associated with cementless acetabular cup insertion: a report of 13 cases. J Arthroplasty.1999;14(4):426-431.
2. Kim YS, Callaghan JJ, Ahn PB, Brown TD. Fracture of the acetabulum during insertion of an oversized hemispherical component. J Bone Joint Surg Am. 1995;77(1):111-117.
3. Haidukewych GJ, Jacofsky DJ, Hanssen AD, Lewallen DG. Intraoperative fractures of the acetabulum during primary total hip arthroplasty. J Bone Joint Surg Am. 2006;88(9):1952-1956.
4. Curtis MJ, Jinnah RH, Wilson VD, Hungerford DS. The initial stability of uncemented acetabular components. J Bone Joint Surg Br. 1992;74(3):372-376.
5. Lachiewicz PF, Suh PB, Gilbert JA. In vitro initial fixation of porous-coated acetabular total hip components. A biomechanical and comparative study. J Arthroplasty. 1989;4(3):201-205.
6. Laflamme GY, Belzile EL, Fernandes JC, Vendittoli PA, Hébert-Davies J. Periprosthetic fractures of the acetabulum during component insertion: posterior column stability
is crucial. J Arthroplasty. 2015;30(2):265-269.
7. Desai G, Reis MD. Early postoperative acetabular discontinuity after total hip arthroplasty. J Arthroplasty. 2011;26(8):1570.e17-e19.
8. Gelalis ID, Politis AN, Arnaoutoglou CM, Georgakopoulos N, Mitsiou D, Xenakis TA. Traumatic periprosthetic acetabular fracture treated by acute one-stage revision arthroplasty. A case report and review of the literature. Injury. 2010;41(4):421-424.
9. Gras F, Marintschev I, Klos K, Fujak A, Mückley T, Hofmann GO. Navigated percutaneous screw fixation of a periprosthetic acetabular fracture. J Arthroplasty. 2010;25(7):1169.e1-e4.
10. Peterson CA, Lewallen DG. Periprosthetic fracture of the acetabulum after total hip arthroplasty. J Bone Joint Surg Am. 1996;78(8):1206-1213.
11. Hansen TM, Koenman JB, Headley AK. 3-D FEM analysis of interface fixation of acetabular implants. Trans Orthop Res Soc. 1992;17:400.
12. Yerby SA, Taylor JK, Murzic WJ. Acetabular component interface: press-fit fixation. Trans Orthop Res Soc. 1992;17:384.
13. Callaghan JJ. The clinical results and basic science of total hip arthroplasty with porous-coated prostheses. J Bone Joint Surg Am. 1993;75(2):299-310.
14. Cheng SL, Binnington AG, Bragdon CR, Jasty M, Harris WH, Davey JR. The effect of sizing mismatch on bone ingrowth into uncemented porous coated acetabular components: an in vivo canine study. Trans Orthop Res Soc. 1990;15:442.
15. Morscher E, Bereiter H, Lampert C, Cementless press-fit cup: principles, experimental data, and three-year follow-up study. Clin Orthop Relat Res. 1989;(249):12-20.
Take Home Points
- IAF is an uncommon, but serious complication of primary THA.
- Small (<50 mm) cups are at higher risk for causing IAF.
- Prompt recognition is critical to prevent component migration and need for revision.
- Posterior column integrity is cirtical to a successful outcome when IAF occurs.
- Initial stable fixation, with or without intraoperative acetabular revision, is critical for successful outcome when IAF is identified.
Intraoperative acetabular fracture (IAF) is a rare complication of primary total hip arthroplasty (THA).1-3 IAFs commonly occur with impaction of the acetabular component. Studies have found that underreaming of the acetabulum and impaction of relatively large, elliptic, or monoblock components may increase the risk of IAFs.2-5 There is a paucity of literature on risk factors, treatment strategies, and outcomes of this potentially devastating complication.
In this article, we report on the incidence of IAF in primary THA at our high-volume institution and present strategies for managing and preventing this rare fracture.
Materials and Methods
Between 1997 and 2015, more than 20 fellowship-trained arthroplasty surgeons performed 21,519 primary THAs at our institution. After obtaining Institutional Review Board approval for this study, we retrospectively searched the hospital database and identified 16 patients (16 hips) who sustained an IAF in primary THA. Mean age of the cohort (13 women, 3 men) at time of surgery was 70 years (range, 42-89 years). Of the 16 patients, 13 had a preoperative diagnosis of osteoarthritis, 2 had posttraumatic arthritis, and 1 had rheumatoid arthritis. A posterolateral approach was used with 14 patients and a modified anterolateral approach with the other 2. Surgical technique and implant selection varied among surgeons. Thirteen THAs were performed with an all-press-fit technique and 3 with a hybrid technique (uncemented acetabular component, cemented femoral component). In 9 cases, the acetabular component underwent supplemental screw fixation. Whether to use acetabular component screws or cemented femoral components was decided intraoperatively by the surgeon.
The cohort’s acetabular components were either elliptic modular or hemispheric modular. The elliptic modular component used was the Peripheral Self-Locking (PSL) implant (Stryker Howmedica Osteonics), and the hemispheric modular components used were either the Trident implant (Stryker Howmedica Osteonics) or the ZTT-II implant (DePuy Synthes). Elliptic acetabular components have a peripheral flare, in contrast to true hemispheric acetabular components. Ten elliptic modular and 6 hemispheric modular components were implanted. In all cases, the difference between the final reamer used to prepare the acetabular bed and the true largest external diameter of the impacted shell was 2 mm or less.
The cohort’s 16 femoral components consisted of 8 Secur-Fit uncemented components (Stryker Howmedica Osteonics), 3 Accolade uncemented components (Stryker Howmedica Osteonics), 3 Omnifit EON cemented components (Stryker Howmedica Osteonics), and 2 S-ROM uncemented components (DePuy Synthes).
After surgery, all patients were followed up according to individual surgeon protocol for radiographic and physical examination.
Data on IAF incidence were obtained from a hospital database and were confirmed with electronic medical record (EMR) documentation. Also obtained were IAF causes and locations recorded in operative notes. For fractures identified after surgery, location was obtained from the immediate postoperative radiograph. Fracture management (eg, supplemental screw fixation, fracture reduction and fixation, bone grafting, acetabular component revision, protected weight-bearing) was determined from EMR documentation.
Results
Sixteen patients sustained an IAF in primary THA. All IAFs occurred in cases involving cementless acetabular components. The institution’s incidence of IAF with use of cementless components was 0.0007%.
Of the 5 IAFs (31%) identified during surgery, 4 were noted during impaction of the acetabular component, and 1 was noted during reaming. Eighty percent of these IAFs occurred directly posterior, and 60% were addressed at time of index procedure secondary to acetabular component instability. The other 11 fractures (69%) were identified on standard postoperative anteroposterior pelvis radiographs obtained in the postanesthesia care unit (PACU). Details of component characteristics, fracture location, immediate treatment, and weight-bearing precautions for all 16 patients are listed in the Table.
There were additional complications. One patient sustained an intraoperative proximal femur fracture, which was addressed at the index THA with application of a cerclage wire and reinsertion of the femoral component; no further surgical intervention was required, and the femur fracture healed uneventfully. Another patient had a postoperative ileus that required nasogastric tube decompression and monitoring in the intensive care unit; the ileus resolved spontaneously. A third patient, initially treated with bone grafting and cemented cup insertion, was diagnosed with a periprosthetic joint infection 3 weeks after the index THA and was treated with explantation of all components and girdlestone resection arthroplasty; 1 month after the resection arthroplasty, a persistently draining wound was treated with irrigation and débridement. There were no other medical complications, thromboembolic events, or dislocations.
One to 7 weeks after surgery, patients returned for initial follow-up, and radiographs were obtained for component stability assessment. Three patients presented with gross acetabular instability, and revisions were performed. Standard clinical follow-up continued for all patients per individual surgeon protocol. Mean follow-up was 4 years.
Discussion
IAF is an uncommon complication of THA. The rarity of IAFs makes it difficult to obtain a cohort large enough to study the problem. Given the increasing incidence of primary THAs and the almost ubiquitous use of press-fit acetabular components, surgeons who perform THAs undoubtedly will encounter IAFs in their own practice. In this article, we report our institution’s experience with periprosthetic IAFs and provide a framework for making decisions regarding these complications.
Anatomical locations of IAFs have been associated with variable outcomes. In a 2015 series, Laflamme and colleagues6 found posterior column stability a crucial factor in implant stability. Fractures with posterior column instability had a 67% failure rate, and patients with an intact posterior column reliably had osteointegration occur without further intervention.6 In our series, fractures that violated the posterior column had similar results. All these fractures required further operative intervention, either at the index procedure or in the early postoperative period. Loss of posterior column stability prevents secure fixation of the acetabular component, thereby preventing successful hip reconstruction. One posterior column fracture in our series was not recognized until after surgery, on a PACU radiograph, and 1 posterior column fracture was fully appreciated only after postoperative computed tomography (CT) was obtained during immediate hospitalization after the index procedure. In both cases, conservative management was unsuccessful. Revision arthroplasty (and in 1 case late posterior column fixation) was performed to achieve adequate reconstruction. There were no failures after posterior column fixation. In cases of posterior wall or column fracture, we recommend early aggressive treatment, preferably at the time of index arthroplasty, to prevent catastrophic failure.
Most commonly, periprosthetic IAFs go unnoticed until initial postoperative radiographs are examined.6 Eleven of the 16 IAFs in our series were first recognized on radiographs obtained in the PACU. Surgeons thus have difficult decisions to make. The literature has little discussion on managing early postoperative periprosthetic IAFs. Most recent studies, which consist of small series and case reports, have focused on late and often traumatic IAFs.7-9 These were initially classified by Peterson and Lewallen10 as type I, which are stable radiographically (no movement relative to previous radiographs) and do not produce pain with minor movement of the extremity, or type II, which are unstable radiographically (gross displacement of component) or produce pain with any hip motion. Type I fractures were more common and were often managed with protected weight-bearing and observation. The authors concluded that, in type I fractures, retaining the original acetabular component is difficult; however, when these fractures are treated appropriately, a functional prosthesis can be salvaged, and fracture union can be expected.
Less common are acetabular fractures detected during surgery, as in our study. In an outcome series, Haidukewych and colleagues3 reported on 21 periprosthetic acetabular fractures, all recognized during surgery and managed according to perceived stability of the component. All fractures healed uneventfully, and there were no other complications.
These studies provide a framework for addressing IAFs noticed in the early postoperative period. The diagnostic dilemma presented by these fractures was first discussed by Laflamme and colleagues.6 Nine of the 32 fractures in their series were classified as so-called type III fractures, recognized only after the early postoperative period. Additional radiographs (eg, Judet views) or CT scans were crucial in determining acetabular component stability, given the known poor outcomes associated with posterior column fracture. In our series, only 1 patient had CT performed after intraoperative recognition of fracture, and the extent of the fracture was not readily apparent on the patient’s postoperative radiograph. Given the successful recognition and treatment of these fractures in the early postoperative period in our series,
it is difficult to recommend advanced imaging for all periprosthetic IAFs. Perhaps this success is attributable to our almost universal use of screws for acetabular component fixation. Of the 11 patients with fractures recognized during the postoperative period, 8 had supplemental screw fixation at time of index surgery. If there is a question of fixation during component insertion, we recommend scrutinizing the acetabular rim for fracture and placing supplemental screw fixation. Screws placed for acetabular component fixation provide initial stability and may prevent early component failure in the setting of unrecognized medial or anterior fracture. In addition, when component stability is in question after impaction, we recommend using finger palpation to evaluate the sciatic notch for cortical step-off from an otherwise unrecognized fracture. Protected weight-bearing in the postoperative period may be left to the discretion of the surgeon, and the decision should be based on intraoperative stability of the acetabular component.
In our series, there was a disproportionate representation of fractures associated with elliptic acetabular components. All 5 of the fractures recognized during surgery and 5 of the 11 recognized after surgery occurred with elliptic components. The association between elliptic cup design and periprosthetic IAF was identified earlier, by Haidukewych and colleagues.3 Their series showed a statistically significant increase in fracture incidence with impaction of an elliptic cup into a bed prepared with a hemispheric reamer. In the present series, 75% of our acetabular components were impacted into a bed underreamed by 1 mm to 2 mm. It is typical of many surgeons at our institution to underream by 1 mm to 2 mm regardless of the type of component being implanted, though they show a growing trend to overream by only 1 mm with the PSL component, which has been both safe and reliable in preventing catastrophic posterior column fractures, especially with impaction of small (<50 mm) acetabular components. We have not observed early loosening or other evidence of failure with this technique. Cup impaction generates significant hoop stresses that can easily fracture sclerotic or otherwise poor-quality bone, and the dense bone around the acetabular rim experiences increased stress with impaction of elliptic components.2,11-15 Surgeons must understand the design traits of their components and be cognizant of the true difference between the diameter of the final reamer used and the real diameter of the acetabular component. We recommend having a difference of ≤1 mm to mitigate the risk of IAF occurring with cup insertion. With use of elliptic components, slight overreaming of the acetabular bed should be considered. More study is needed to better define these outcomes.
Study Limitations
Our study had several limitations, including the inherent biases of its retrospective design, small cohort size, and inclusion of multiple surgeons. Small cohort size is unavoidable given the low incidence of these injuries, and our study encompassed the experience of a high-volume hip arthroplasty service. There is the possibility that a subset of fractures may have persistently gone unrecognized, either during or after surgery, and the actual incidence of these complications may be higher. These outcomes represent our institutional experience addressing the complexities of these injuries. The lack of standardization in the management of these fractures in our series reflects the diagnostic dilemma they present, as well as the need for more study focused on their management and outcomes.
Conclusion
IAF, an uncommon complication of primary THA, most commonly occurs during component impaction. Acetabular component and surgical technique may influence the fracture rate. Intraoperative or prompt postoperative recognition of these fractures is crucial, as their location is associated with stability and outcome. Careful examination of postoperative radiographs, judicious use of advanced imaging, and close follow-up are needed to prevent early catastrophic failure. We argue against simply observing these unstable fractures and recommend early treatment with rigid fixation and, when necessary, acetabular component revision.
1. Sharkey PF, Hozack WJ, Callaghan JJ, et al. Acetabular fractures associated with cementless acetabular cup insertion: a report of 13 cases. J Arthroplasty.1999;14(4):426-431.
2. Kim YS, Callaghan JJ, Ahn PB, Brown TD. Fracture of the acetabulum during insertion of an oversized hemispherical component. J Bone Joint Surg Am. 1995;77(1):111-117.
3. Haidukewych GJ, Jacofsky DJ, Hanssen AD, Lewallen DG. Intraoperative fractures of the acetabulum during primary total hip arthroplasty. J Bone Joint Surg Am. 2006;88(9):1952-1956.
4. Curtis MJ, Jinnah RH, Wilson VD, Hungerford DS. The initial stability of uncemented acetabular components. J Bone Joint Surg Br. 1992;74(3):372-376.
5. Lachiewicz PF, Suh PB, Gilbert JA. In vitro initial fixation of porous-coated acetabular total hip components. A biomechanical and comparative study. J Arthroplasty. 1989;4(3):201-205.
6. Laflamme GY, Belzile EL, Fernandes JC, Vendittoli PA, Hébert-Davies J. Periprosthetic fractures of the acetabulum during component insertion: posterior column stability
is crucial. J Arthroplasty. 2015;30(2):265-269.
7. Desai G, Reis MD. Early postoperative acetabular discontinuity after total hip arthroplasty. J Arthroplasty. 2011;26(8):1570.e17-e19.
8. Gelalis ID, Politis AN, Arnaoutoglou CM, Georgakopoulos N, Mitsiou D, Xenakis TA. Traumatic periprosthetic acetabular fracture treated by acute one-stage revision arthroplasty. A case report and review of the literature. Injury. 2010;41(4):421-424.
9. Gras F, Marintschev I, Klos K, Fujak A, Mückley T, Hofmann GO. Navigated percutaneous screw fixation of a periprosthetic acetabular fracture. J Arthroplasty. 2010;25(7):1169.e1-e4.
10. Peterson CA, Lewallen DG. Periprosthetic fracture of the acetabulum after total hip arthroplasty. J Bone Joint Surg Am. 1996;78(8):1206-1213.
11. Hansen TM, Koenman JB, Headley AK. 3-D FEM analysis of interface fixation of acetabular implants. Trans Orthop Res Soc. 1992;17:400.
12. Yerby SA, Taylor JK, Murzic WJ. Acetabular component interface: press-fit fixation. Trans Orthop Res Soc. 1992;17:384.
13. Callaghan JJ. The clinical results and basic science of total hip arthroplasty with porous-coated prostheses. J Bone Joint Surg Am. 1993;75(2):299-310.
14. Cheng SL, Binnington AG, Bragdon CR, Jasty M, Harris WH, Davey JR. The effect of sizing mismatch on bone ingrowth into uncemented porous coated acetabular components: an in vivo canine study. Trans Orthop Res Soc. 1990;15:442.
15. Morscher E, Bereiter H, Lampert C, Cementless press-fit cup: principles, experimental data, and three-year follow-up study. Clin Orthop Relat Res. 1989;(249):12-20.
Cervical artery dissection related to chiropractic manipulation: One institution’s experience
ABSTRACT
Purpose The purpose of this study was to determine the frequency of patients seen at a single institution who were diagnosed with a cervical vessel dissection related to chiropractic neck manipulation.
Methods We identified cases through a retrospective chart review of patients seen between April 2008 and March 2012 who had a diagnosis of cervical artery dissection following a recent chiropractic manipulation. Relevant imaging studies were reviewed by a board-certified neuroradiologist to confirm the findings of a cervical artery dissection and stroke. We conducted telephone interviews to ascertain the presence of residual symptoms in the affected patients.
Results Of the 141 patients with cervical artery dissection, 12 had documented chiropractic neck manipulation prior to the onset of the symptoms that led to medical presentation. The 12 patients had a total of 16 cervical artery dissections. All 12 patients developed symptoms of acute stroke. All strokes were confirmed with magnetic resonance imaging or computerized tomography. We obtained follow-up information on 9 patients, 8 of whom had residual symptoms and one of whom died as a result of his injury.
Conclusions In this case series, 12 patients with newly diagnosed cervical artery dissection(s) had recent chiropractic neck manipulation. Patients who are considering chiropractic cervical manipulation should be informed of the potential risk and be advised to seek immediate medical attention should they develop symptoms.
A prospective randomized controlled study published in 2012 showed chiropractic manipulation is beneficial in the treatment of neck pain compared with medical treatment, but it showed no significant difference between chiropractic manipulation and physical therapy exercises.1 Although chiropractic manipulation of the cervical spine may be effective, it may also cause harm.
Cerebellar and spinal cord injuries related to cervical chiropractic manipulation were first reported in 1947.2 By 1974, there were 12 reported cases.3 Noninvasive imaging has since greatly improved the diagnosis of cervical artery dissection and of stroke,4 and cervical artery dissection is now recognized as pathogenic of strokes occurring in association with chiropractic manipulation.5
A prospective series published in 2011 reported that, over 4 years, 13 patients were treated at a single institution for cervical arterial dissection following chiropractic treatment.6 That so many patients might be seen for this condition in that time frame at a single institution suggests the risk for such injury may be greater than thought. To explore that possibility, we performed a 4-year retrospective review to determine the experience at OSF Saint Francis Medical Center, which is affiliated with the University of Illinois College of Medicine, Peoria.
METHODS
Data sources. After receiving approval by the local institutional review board, we obtained data from the electronic medical records of OSF Saint Francis Medical Center, Peoria, Ill., using Epic (Epic Systems Corporation, Verona, Wis.) and IDX (General Electric Corporation, Fairfield, Conn.) systems. The records were queried using ICD-9 codes 443.21 and 443.24 to identify patients from April 2008 through March 2012 who had primary or secondary diagnoses of vertebral artery dissection (VAD) or carotid artery dissection (CAD). We reviewed all records of VAD and CAD to identify those that may have been associated with chiropractic manipulation.
Data collection. We abstracted data from 12 patients’ charts. Two patients were unavailable for direct contact: one was involved in ongoing litigation, and one had died (although we were able to speak with his wife). We attempted telephone contact with the 10 remaining patients and reached 8.
Data included the symptoms leading to chiropractic manipulation, symptoms following manipulation, timing of onset of symptoms relative to chiropractic manipulation, identifying information for the treating chiropractor, and residual patient symptoms. We also recorded patients’ ages, sex, locations of dissection, and locations of stroke. All dissections and strokes had been diagnosed during the patient’s initial hospitalization.
A board-certified radiologist (JRD) with a Certificate of Added Qualification in Neuroradiology (American Board of Medical Specialties) reviewed all pertinent imaging to confirm all dissections and strokes.
RESULTS
The medical record query yielded 141 patients with VAD or CAD, 15 of whom had undergone chiropractic manipulation prior to their presentation. The temporal association between chiropractic manipulation and arterial dissection was equivocal for 3 patients. In 12 patients, there was a verifiable temporal association between chiropractic manipulation and the arterial dissection. Three of the 12 patients were men and 9 were women. Ages ranged from 22 to 46 years, with a mean of 35.3 years.
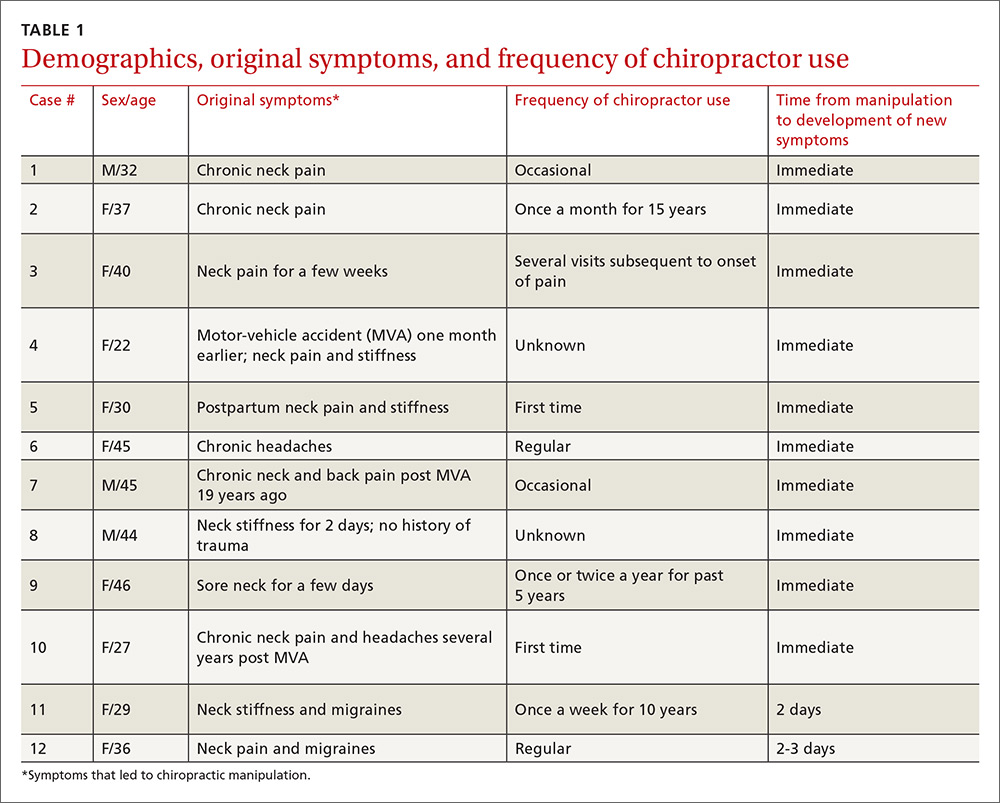
Acute or chronic neck pain was the most common reason for seeking chiropractic care (TABLE 1). Immediately upon performance of cervical manipulation, 10 of the 12 developed acute symptoms different than those that caused them to seek chiropractic care. Two patients developed symptoms 2 to 3 days post-manipulation. Neither of the 2 had a history of neck trauma within the preceding year. Ten of the 12 patients sought immediate medical attention. Two of the 12 patients sought care when their symptoms became more severe, ranging from 2 days to several weeks later (TABLE 2). The treating chiropractor was identified in 7 cases and was different in each of the 7 cases.
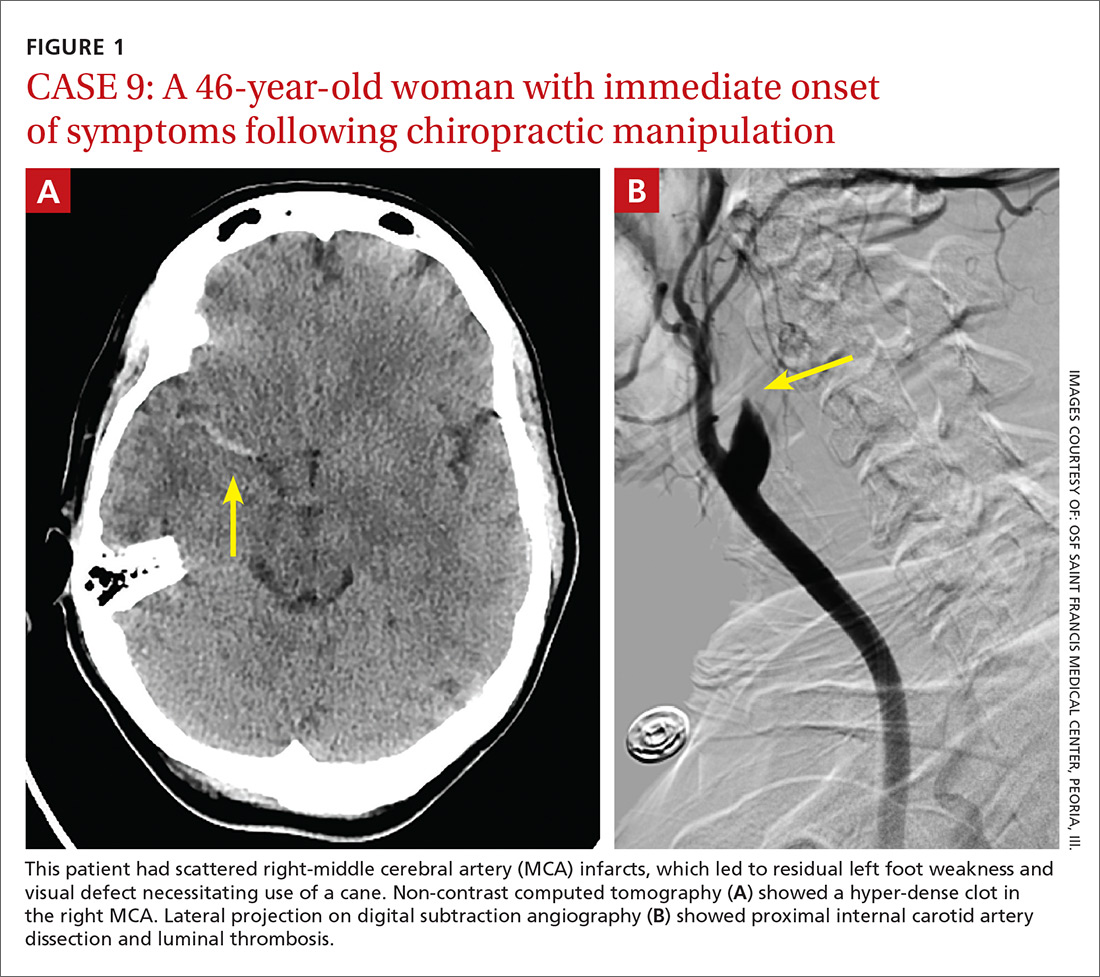
A total of 16 cervical artery dissections, 14 VAD and 2 CAD, were confirmed by computed tomography angiography (CTA), magnetic resonance angiography (MRA), or catheter angiography (FIGURE 1). All 12 patients had acute strokes confirmed by MRA or CTA, including 9 in the cerebellum (FIGURE 2), 4 in the cerebrum, 2 in the medulla, and one in the pons.
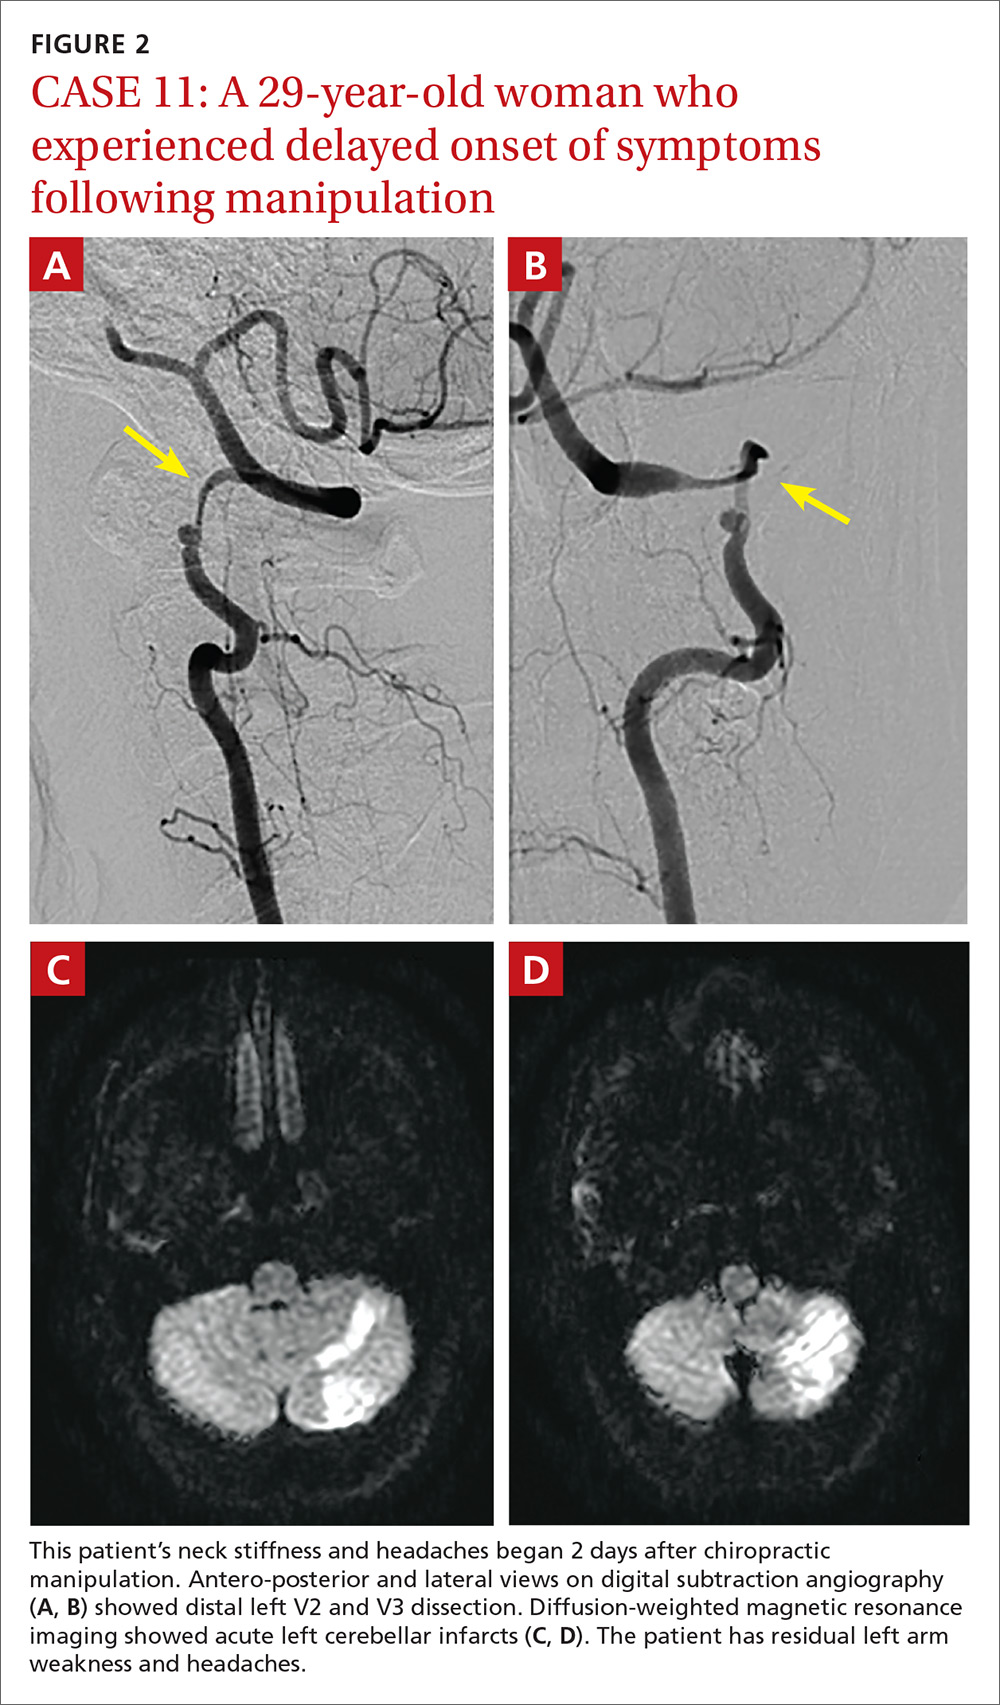
Long-term outcomes were determined for 9 patients (TABLE 2). One patient’s symptoms resolved. Three patients had dizziness, clumsiness, or balance problems; 3 had persistent headaches; 2 had bilateral visual field abnormalities; and one patient walked with a cane, was no longer driving a car, and was on disability. One patient died as a result of his injury. One of the 12 cases was previously described in a case report.7

DISCUSSION
Dissection of the cervical arteries is more common than dissection in other arteries of comparable size. This increased risk in the cervical arteries is believed to be due to their relative mobility and proximity to bony structures.4
Sudden neck movement, a feature of chiropractic treatment, is one of several known risk factors for ‘spontaneous’ cervical artery dissection.8,9 Symptom onset and stroke may be delayed after a spontaneous cervical artery dissection.10 Spontaneous dissection more commonly involves the carotid arteries;4 however, the vertebral arteries appear more prone to dissection as a consequence of chiropractic manipulation,11 likely due to their relation to the cervical spine.
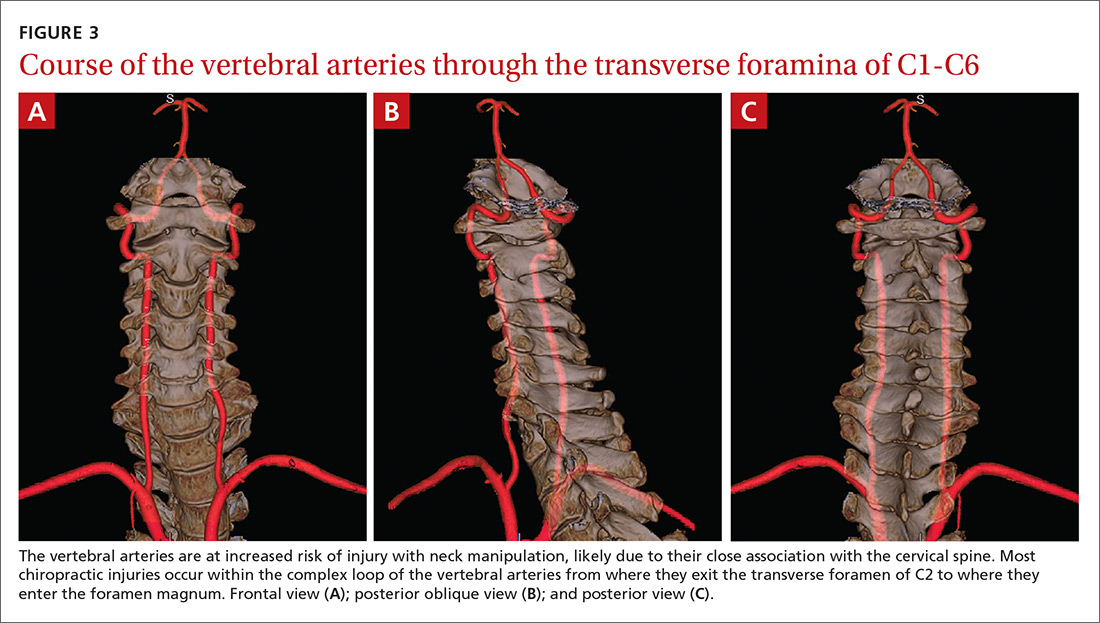
The vertebral artery runs through foramina in the transverse processes of vertebral bodies C1 through C6 (FIGURE 3). On exiting the C2 transverse process, the vertebral artery has a tortuous course, making several turns over and through adjacent bony structures.12 The artery is most prone to injury between the entrance to the transverse foramen of C6 and the foramen magnum (V2 and V3 segments).13 (The area of highest vulnerability is the tortuous segment from the transverse foramen of C2 to the foramen magnum.)
Sudden movements of the cervical spine may cause arterial dissection, whether the maneuvers are performed by a physician, a chiropractor, or a physical therapist.14 Injuries reported in the literature, however, most commonly follow chiropractic manipulation. In our series of 141 dissections, we found no cases associated with manipulation by other health professionals.
A 2003 study revealed cervical spine manipulation to be an independent and strong risk factor for vertebral artery dissection. The authors believed the relationship was likely causal.5 Data from the Canadian Stroke Consortium showed a 28% incidence of chiropractic manipulation in cases of cervical artery dissection.10
A 2008 study showed an association between vertebrobasilar stroke and chiropractic visits within one month of the vascular event.15 However, the study also showed an association of similar magnitude between vertebrobasilar stroke and visits to primary care physicians within the prior month. This suggests that cervical manipulation by chiropractors poses no more risk for cervical artery dissection than visits to primary care physicians. However, it is hard to reconcile such a conclusion with other studies, including our own, in which 10 patients developed new symptoms immediately with chiropractic manipulation of their cervical spines.
Perhaps the one-month observation period of Cassidy et al was excessive. Many post-manipulation events occur within hours or at most a few days, as would be expected given the hypothesized pathogenic mechanism. Perhaps if they had shortened their interval of study to the preceding 3 days, their findings may have been different.
A recent systematic review and meta-analysis demonstrated a slight association between chiropractic neck manipulation and cervical artery dissection. It stated that the quality of the published literature was very low, and it concluded there was no convincing evidence of causation.16 The fact that 10 of the 12 patients in our case series demonstrated acute symptoms immediately upon receiving spinal manipulation suggests a possible causal link; however, we agree with the authors of the meta-analysis that the quality of the literature is low.
A recent statement from the American Heart Association/American Stroke Association (and endorsed by the American Association of Neurological Surgeons and the Congress of Neurological Surgeons) has recommended that chiropractors inform patients of the statistical association between cervical artery dissection and cervical manipulation.17 In addition, it is important for chiropractors to be aware of the signs and symptoms of cervical artery dissection and stroke and to assess for these symptoms before performing neck manipulation, as illustrated in a recent case report.18 Due to the risk of death, patients who experience symptoms consistent with cervical artery dissection after chiropractic manipulation of the cervical spine should be advised to seek medical care immediately.
Our case series has several limitations. The study was retrospective. Existing documentation of associated chiropractic care was often sparse, necessitating phone calls to supplement the information. We believe it is possible that cases may have been missed because of inaccurate medical record documentation, deficits in the interview process concerning chiropractic care at the time of hospitalization, or because information concerning chiropractic care was not recorded in the chart.
A significant portion of our information came through phone contact with several of the patients. In some cases, we relied heavily on their recollection of events that had occurred anytime from a few days to a few years earlier. The accuracy and completeness of the information supplied by patients was not verified, allowing for potential recall bias.
We do not know whether our experience is consistent with that of other areas of the United States. However, the fact that a similar-size hospital in Phoenix reported similar findings suggests the experience may be more widespread.6
IMPLICATIONS OF OUR FINDINGS
Over a 4-year period at our institution, 12 patients experienced cervical vessel dissection related to chiropractic neck manipulation. A similar institution in another part of the country had previously described 13 such cases. The patients at both institutions were relatively young and incurred substantial residual morbidity. A single patient at each institution died. If these findings are representative of other institutions across the United States, the incidence of stroke secondary to chiropractic manipulation may be higher than supposed.
To assess this problem further, a randomized prospective cohort study could establish the relative risk of chiropractic manipulation of the cervical spine resulting in a cervical artery dissection. But such a study may be methodologically prohibitive. More feasible would be a case-control study similar to one carried out by Smith et al5 in which patients who had experienced cervical artery dissection were matched with subjects who had not incurred such injuries. Comparing the groups’ odds of having received chiropractic manipulation demonstrated that spinal manipulative therapy is an independent risk factor for vertebral artery dissection and is highly suggestive of a causal association. Replicating this study in a different population would be valuable.
Based on our findings, all patients who visit chiropractors for cervical spine manipulation should be informed of the potential risks and of the need to seek immediate medical assistance should symptoms suggestive of dissection or stroke occur during or after manipulation. Until the actual level of risk from chiropractic manipulation is known, patients with neck pain may be better served by equally effective passive physical therapy exercises.1
CORRESPONDENCE
Raymond E. Bertino, MD, 427 West Crestwood Drive, Peoria, IL 61614; rebertino@comcast.net.
ACKNOWLEDGEMENTS
We thank Deepak Nair, MD, for his assistance in reviewing the stroke neurology aspects of this study; Katie Groesch, MD, for her assistance in drafting portions of the Methods and Results sections; Rita Hermacinski for the generation of 3D images; and Stephanie Arthalony for her assistance in gathering information through patient telephone interviews.
1.
2. Pratt-Thomas HR, Knute EB. Cerebellar and spinal injuries after chiropractic manipulation. JAMA. 1947;133:600-603.
3. Miller RG, Burton R. Stroke following chiropractic manipulation of the spine. JAMA. 1974;229:189-190.
4. Schievink WI. Spontaneous dissection of the carotid and vertebral arteries. N Eng J Med. 2001;344:898-906.
5. Smith WS, Johnston SC, Skalabrin EJ, et al. Spinal manipulative therapy is an independent risk factor for vertebral artery dissection. Neurology. 2003;60:1424-1428.
6. Albuquerque FC, Hu YC, Dashti SR, et al. Craniocervical arterial dissections as sequelae of chiropractic manipulation: patterns of injury and management. J Neurosurg. 2011;115:1197-1205.
7. Bertino RE, Talkad AV, DeSanto JR, et al. Chiropractic manipulation of the neck and cervical artery dissection. Ann Intern Med. 2012;157:150-152.
8. Dittrich R, Rohsbach D, Heidbreder A, et al. Mild mechanical traumas are possible risk factors for cervical artery dissection. Cerebrovasc Dis. 2006;23:275-281.
9. Debette S, Leys D. Cervical-artery dissections: predisposing factors, diagnosis, and outcome. Lancet Neurol. 2009;8:668-678.
10. Norris JW, Beletsky V, Nadareishvili ZG. Sudden neck movement and cervical artery dissection. The Canadian Stroke Consortium. CMAJ. 2000;163:38-40.
11. Stevinson C, Ernst E. Risks associated with spinal manipulation. Am J Med. 2002;112:566–571.
12. Doshi AH, Aggarwal A, Patel AB. Normal vascular anatomy. In Naidich TP, Castillo M, Cha S, Smirniotopoulos JG, eds. Imaging of the Brain. Philadelphia, Pa: Saunders;
13. Arnold M, Bousser MG, Fahrni G, et al. Vertebral artery dissection: presenting findings and predictors of outcome. Stroke. 2006;37:2499-2503.
14. Reuter U, Hämling M, Kavuk I, et al. Vertebral artery dissections after chiropractic neck manipulation in Germany over three years. J Neurol. 2006;253:724-730.
15. Cassidy JD, Boyle E, Cote P, et al. Risk of vertebrobasilar stroke and chiropractic care: results of a population-based case-control and case-crossover study. Spine. 2008;17(Suppl 1):S176-S183.
16. Church EW, Sieg EP, Zalatima O, et al. Systematic review and meta-analysis of chiropractic care and cervical artery dissection: No evidence for causation. Cureus. 2016;8:e498.
17. Biller J, Sacco RL, Albuquerque FC, et al. Cervical arterial dissections and association with cervical manipulative therapy: a statement for healthcare professionals from the American Heart Association/American Stroke Association. Stroke. 2014;45:3155-3174.
18. Tarola G, Phillips RB. Chiropractic response to a spontaneous vertebral artery dissection. J Chiropr Med. 2015;14:183-190.
ABSTRACT
Purpose The purpose of this study was to determine the frequency of patients seen at a single institution who were diagnosed with a cervical vessel dissection related to chiropractic neck manipulation.
Methods We identified cases through a retrospective chart review of patients seen between April 2008 and March 2012 who had a diagnosis of cervical artery dissection following a recent chiropractic manipulation. Relevant imaging studies were reviewed by a board-certified neuroradiologist to confirm the findings of a cervical artery dissection and stroke. We conducted telephone interviews to ascertain the presence of residual symptoms in the affected patients.
Results Of the 141 patients with cervical artery dissection, 12 had documented chiropractic neck manipulation prior to the onset of the symptoms that led to medical presentation. The 12 patients had a total of 16 cervical artery dissections. All 12 patients developed symptoms of acute stroke. All strokes were confirmed with magnetic resonance imaging or computerized tomography. We obtained follow-up information on 9 patients, 8 of whom had residual symptoms and one of whom died as a result of his injury.
Conclusions In this case series, 12 patients with newly diagnosed cervical artery dissection(s) had recent chiropractic neck manipulation. Patients who are considering chiropractic cervical manipulation should be informed of the potential risk and be advised to seek immediate medical attention should they develop symptoms.
A prospective randomized controlled study published in 2012 showed chiropractic manipulation is beneficial in the treatment of neck pain compared with medical treatment, but it showed no significant difference between chiropractic manipulation and physical therapy exercises.1 Although chiropractic manipulation of the cervical spine may be effective, it may also cause harm.
Cerebellar and spinal cord injuries related to cervical chiropractic manipulation were first reported in 1947.2 By 1974, there were 12 reported cases.3 Noninvasive imaging has since greatly improved the diagnosis of cervical artery dissection and of stroke,4 and cervical artery dissection is now recognized as pathogenic of strokes occurring in association with chiropractic manipulation.5
A prospective series published in 2011 reported that, over 4 years, 13 patients were treated at a single institution for cervical arterial dissection following chiropractic treatment.6 That so many patients might be seen for this condition in that time frame at a single institution suggests the risk for such injury may be greater than thought. To explore that possibility, we performed a 4-year retrospective review to determine the experience at OSF Saint Francis Medical Center, which is affiliated with the University of Illinois College of Medicine, Peoria.
METHODS
Data sources. After receiving approval by the local institutional review board, we obtained data from the electronic medical records of OSF Saint Francis Medical Center, Peoria, Ill., using Epic (Epic Systems Corporation, Verona, Wis.) and IDX (General Electric Corporation, Fairfield, Conn.) systems. The records were queried using ICD-9 codes 443.21 and 443.24 to identify patients from April 2008 through March 2012 who had primary or secondary diagnoses of vertebral artery dissection (VAD) or carotid artery dissection (CAD). We reviewed all records of VAD and CAD to identify those that may have been associated with chiropractic manipulation.
Data collection. We abstracted data from 12 patients’ charts. Two patients were unavailable for direct contact: one was involved in ongoing litigation, and one had died (although we were able to speak with his wife). We attempted telephone contact with the 10 remaining patients and reached 8.
Data included the symptoms leading to chiropractic manipulation, symptoms following manipulation, timing of onset of symptoms relative to chiropractic manipulation, identifying information for the treating chiropractor, and residual patient symptoms. We also recorded patients’ ages, sex, locations of dissection, and locations of stroke. All dissections and strokes had been diagnosed during the patient’s initial hospitalization.
A board-certified radiologist (JRD) with a Certificate of Added Qualification in Neuroradiology (American Board of Medical Specialties) reviewed all pertinent imaging to confirm all dissections and strokes.
RESULTS
The medical record query yielded 141 patients with VAD or CAD, 15 of whom had undergone chiropractic manipulation prior to their presentation. The temporal association between chiropractic manipulation and arterial dissection was equivocal for 3 patients. In 12 patients, there was a verifiable temporal association between chiropractic manipulation and the arterial dissection. Three of the 12 patients were men and 9 were women. Ages ranged from 22 to 46 years, with a mean of 35.3 years.
Acute or chronic neck pain was the most common reason for seeking chiropractic care (TABLE 1). Immediately upon performance of cervical manipulation, 10 of the 12 developed acute symptoms different than those that caused them to seek chiropractic care. Two patients developed symptoms 2 to 3 days post-manipulation. Neither of the 2 had a history of neck trauma within the preceding year. Ten of the 12 patients sought immediate medical attention. Two of the 12 patients sought care when their symptoms became more severe, ranging from 2 days to several weeks later (TABLE 2). The treating chiropractor was identified in 7 cases and was different in each of the 7 cases.
A total of 16 cervical artery dissections, 14 VAD and 2 CAD, were confirmed by computed tomography angiography (CTA), magnetic resonance angiography (MRA), or catheter angiography (FIGURE 1). All 12 patients had acute strokes confirmed by MRA or CTA, including 9 in the cerebellum (FIGURE 2), 4 in the cerebrum, 2 in the medulla, and one in the pons.
Long-term outcomes were determined for 9 patients (TABLE 2). One patient’s symptoms resolved. Three patients had dizziness, clumsiness, or balance problems; 3 had persistent headaches; 2 had bilateral visual field abnormalities; and one patient walked with a cane, was no longer driving a car, and was on disability. One patient died as a result of his injury. One of the 12 cases was previously described in a case report.7
DISCUSSION
Dissection of the cervical arteries is more common than dissection in other arteries of comparable size. This increased risk in the cervical arteries is believed to be due to their relative mobility and proximity to bony structures.4
Sudden neck movement, a feature of chiropractic treatment, is one of several known risk factors for ‘spontaneous’ cervical artery dissection.8,9 Symptom onset and stroke may be delayed after a spontaneous cervical artery dissection.10 Spontaneous dissection more commonly involves the carotid arteries;4 however, the vertebral arteries appear more prone to dissection as a consequence of chiropractic manipulation,11 likely due to their relation to the cervical spine.
The vertebral artery runs through foramina in the transverse processes of vertebral bodies C1 through C6 (FIGURE 3). On exiting the C2 transverse process, the vertebral artery has a tortuous course, making several turns over and through adjacent bony structures.12 The artery is most prone to injury between the entrance to the transverse foramen of C6 and the foramen magnum (V2 and V3 segments).13 (The area of highest vulnerability is the tortuous segment from the transverse foramen of C2 to the foramen magnum.)
Sudden movements of the cervical spine may cause arterial dissection, whether the maneuvers are performed by a physician, a chiropractor, or a physical therapist.14 Injuries reported in the literature, however, most commonly follow chiropractic manipulation. In our series of 141 dissections, we found no cases associated with manipulation by other health professionals.
A 2003 study revealed cervical spine manipulation to be an independent and strong risk factor for vertebral artery dissection. The authors believed the relationship was likely causal.5 Data from the Canadian Stroke Consortium showed a 28% incidence of chiropractic manipulation in cases of cervical artery dissection.10
A 2008 study showed an association between vertebrobasilar stroke and chiropractic visits within one month of the vascular event.15 However, the study also showed an association of similar magnitude between vertebrobasilar stroke and visits to primary care physicians within the prior month. This suggests that cervical manipulation by chiropractors poses no more risk for cervical artery dissection than visits to primary care physicians. However, it is hard to reconcile such a conclusion with other studies, including our own, in which 10 patients developed new symptoms immediately with chiropractic manipulation of their cervical spines.
Perhaps the one-month observation period of Cassidy et al was excessive. Many post-manipulation events occur within hours or at most a few days, as would be expected given the hypothesized pathogenic mechanism. Perhaps if they had shortened their interval of study to the preceding 3 days, their findings may have been different.
A recent systematic review and meta-analysis demonstrated a slight association between chiropractic neck manipulation and cervical artery dissection. It stated that the quality of the published literature was very low, and it concluded there was no convincing evidence of causation.16 The fact that 10 of the 12 patients in our case series demonstrated acute symptoms immediately upon receiving spinal manipulation suggests a possible causal link; however, we agree with the authors of the meta-analysis that the quality of the literature is low.
A recent statement from the American Heart Association/American Stroke Association (and endorsed by the American Association of Neurological Surgeons and the Congress of Neurological Surgeons) has recommended that chiropractors inform patients of the statistical association between cervical artery dissection and cervical manipulation.17 In addition, it is important for chiropractors to be aware of the signs and symptoms of cervical artery dissection and stroke and to assess for these symptoms before performing neck manipulation, as illustrated in a recent case report.18 Due to the risk of death, patients who experience symptoms consistent with cervical artery dissection after chiropractic manipulation of the cervical spine should be advised to seek medical care immediately.
Our case series has several limitations. The study was retrospective. Existing documentation of associated chiropractic care was often sparse, necessitating phone calls to supplement the information. We believe it is possible that cases may have been missed because of inaccurate medical record documentation, deficits in the interview process concerning chiropractic care at the time of hospitalization, or because information concerning chiropractic care was not recorded in the chart.
A significant portion of our information came through phone contact with several of the patients. In some cases, we relied heavily on their recollection of events that had occurred anytime from a few days to a few years earlier. The accuracy and completeness of the information supplied by patients was not verified, allowing for potential recall bias.
We do not know whether our experience is consistent with that of other areas of the United States. However, the fact that a similar-size hospital in Phoenix reported similar findings suggests the experience may be more widespread.6
IMPLICATIONS OF OUR FINDINGS
Over a 4-year period at our institution, 12 patients experienced cervical vessel dissection related to chiropractic neck manipulation. A similar institution in another part of the country had previously described 13 such cases. The patients at both institutions were relatively young and incurred substantial residual morbidity. A single patient at each institution died. If these findings are representative of other institutions across the United States, the incidence of stroke secondary to chiropractic manipulation may be higher than supposed.
To assess this problem further, a randomized prospective cohort study could establish the relative risk of chiropractic manipulation of the cervical spine resulting in a cervical artery dissection. But such a study may be methodologically prohibitive. More feasible would be a case-control study similar to one carried out by Smith et al5 in which patients who had experienced cervical artery dissection were matched with subjects who had not incurred such injuries. Comparing the groups’ odds of having received chiropractic manipulation demonstrated that spinal manipulative therapy is an independent risk factor for vertebral artery dissection and is highly suggestive of a causal association. Replicating this study in a different population would be valuable.
Based on our findings, all patients who visit chiropractors for cervical spine manipulation should be informed of the potential risks and of the need to seek immediate medical assistance should symptoms suggestive of dissection or stroke occur during or after manipulation. Until the actual level of risk from chiropractic manipulation is known, patients with neck pain may be better served by equally effective passive physical therapy exercises.1
CORRESPONDENCE
Raymond E. Bertino, MD, 427 West Crestwood Drive, Peoria, IL 61614; rebertino@comcast.net.
ACKNOWLEDGEMENTS
We thank Deepak Nair, MD, for his assistance in reviewing the stroke neurology aspects of this study; Katie Groesch, MD, for her assistance in drafting portions of the Methods and Results sections; Rita Hermacinski for the generation of 3D images; and Stephanie Arthalony for her assistance in gathering information through patient telephone interviews.
1.
2. Pratt-Thomas HR, Knute EB. Cerebellar and spinal injuries after chiropractic manipulation. JAMA. 1947;133:600-603.
3. Miller RG, Burton R. Stroke following chiropractic manipulation of the spine. JAMA. 1974;229:189-190.
4. Schievink WI. Spontaneous dissection of the carotid and vertebral arteries. N Eng J Med. 2001;344:898-906.
5. Smith WS, Johnston SC, Skalabrin EJ, et al. Spinal manipulative therapy is an independent risk factor for vertebral artery dissection. Neurology. 2003;60:1424-1428.
6. Albuquerque FC, Hu YC, Dashti SR, et al. Craniocervical arterial dissections as sequelae of chiropractic manipulation: patterns of injury and management. J Neurosurg. 2011;115:1197-1205.
7. Bertino RE, Talkad AV, DeSanto JR, et al. Chiropractic manipulation of the neck and cervical artery dissection. Ann Intern Med. 2012;157:150-152.
8. Dittrich R, Rohsbach D, Heidbreder A, et al. Mild mechanical traumas are possible risk factors for cervical artery dissection. Cerebrovasc Dis. 2006;23:275-281.
9. Debette S, Leys D. Cervical-artery dissections: predisposing factors, diagnosis, and outcome. Lancet Neurol. 2009;8:668-678.
10. Norris JW, Beletsky V, Nadareishvili ZG. Sudden neck movement and cervical artery dissection. The Canadian Stroke Consortium. CMAJ. 2000;163:38-40.
11. Stevinson C, Ernst E. Risks associated with spinal manipulation. Am J Med. 2002;112:566–571.
12. Doshi AH, Aggarwal A, Patel AB. Normal vascular anatomy. In Naidich TP, Castillo M, Cha S, Smirniotopoulos JG, eds. Imaging of the Brain. Philadelphia, Pa: Saunders;
13. Arnold M, Bousser MG, Fahrni G, et al. Vertebral artery dissection: presenting findings and predictors of outcome. Stroke. 2006;37:2499-2503.
14. Reuter U, Hämling M, Kavuk I, et al. Vertebral artery dissections after chiropractic neck manipulation in Germany over three years. J Neurol. 2006;253:724-730.
15. Cassidy JD, Boyle E, Cote P, et al. Risk of vertebrobasilar stroke and chiropractic care: results of a population-based case-control and case-crossover study. Spine. 2008;17(Suppl 1):S176-S183.
16. Church EW, Sieg EP, Zalatima O, et al. Systematic review and meta-analysis of chiropractic care and cervical artery dissection: No evidence for causation. Cureus. 2016;8:e498.
17. Biller J, Sacco RL, Albuquerque FC, et al. Cervical arterial dissections and association with cervical manipulative therapy: a statement for healthcare professionals from the American Heart Association/American Stroke Association. Stroke. 2014;45:3155-3174.
18. Tarola G, Phillips RB. Chiropractic response to a spontaneous vertebral artery dissection. J Chiropr Med. 2015;14:183-190.

Percutaneous Release of Trigger Digits
Take-Home Points
- The author had a 90% success rate with no complications in treating almost 600 trigger digits.
- All digits can be safely treated, including multiple fingers on one hand, all in an office setting.
- Percutaneous trigger release appears to be a safe and reliable alternative to open surgery.
- Success rate, discomfort, and cost may make a percutaneous trigger release preferable to even a trial of corticosteroid injection.
- A failed percutaneous release can be successfully treated with an open release, if needed.
Trigger finger, or stenosing flexor tenosynovitis, is a condition characterized by clicking or locking during finger movement, sometimes resulting in the freezing of a digit in flexion or extension1 (Figure 1). [[{"fid":"202300","view_mode":"medstat_image_flush_left","attributes":{"class":"media-element file-medstat-image-flush-left","data-delta":"1"},"fields":{"format":"medstat_image_flush_left","field_file_image_caption[und][0][value]":"Figure 1.","field_file_image_credit[und][0][value]":"","field_file_image_caption[und][0][format]":"plain_text","field_file_image_credit[und][0][format]":"plain_text"},"type":"media","field_deltas":{"1":{"format":"medstat_image_flush_left","field_file_image_caption[und][0][value]":"Figure 1.","field_file_image_credit[und][0][value]":""}}}]]Tendon inflammation is thought to cause constriction of the tendon sheath and bunching of the fibrous bundles of the first annular (A1) pulley, often creating a palpable nodule at the base of the digit.2,3 Many patients experience intermittent joint pain and swelling, which may progress to triggering or complete locking of the digit.1 One of the most common conditions treated by hand surgeons, trigger finger is most often reported in the dominant hand of women in their sixth decade of life and has been associated with several conditions, including diabetes and rheumatoid arthritis.4-6 Other researchers have indicated the thumb and ring finger are most commonly affected, though all fingers can potentially trigger.7,8
Initial treatment often involves injecting corticosteroid into the flexor tendon sheath, at or proximal to the annular pulley system, to reduce inflammation and the fibrous nodule.3 Another injection study found an initial success rate of 57% with a single injection, and 86% with a second injection, but patients were monitored for only 6 months, a period that may have been too short for symptom recurrence.7
On failure of steroid injections, patients typically are treated with open tendon sheath incision.9 This procedure, usually performed in a hospital or outpatient surgery setting, requires postoperative wound care, including dressing changes, suture removal, possible hand therapy, and follow-up physician visits. Operative treatment involves making a 1-cm to 2-cm incision, releasing the A1 pulley, and skin suturing.7,8,10 The most common postoperative complaint is incisional tenderness, though long-term scar pain, infection, nerve injury, and disease recurrence have been reported.8 Overall, the procedure is very successful, providing up to 100% symptom relief.7,8,10
Endoscopic release of trigger finger has also been described as an effective operative treatment. This technique involves passing a small cannula through a palmar incision—using an endoscope and retrograde knife within this 2.7-mm tunnel.10 With this treatment, reduced visibility may increase the risk of nerve injury.10 Although generally successful, endoscopic release requires anesthesia and expensive instruments and has a significant learning curve.8,10
More recently, percutaneous release of trigger finger has been described as a definitive, in-office treatment.5,6,11,12 Percutaneous release has the obvious advantages of no open incision, less scarring, less discomfort, and shorter recovery. Several studies have found comparable success rates for open and percutaneous procedures but consistently shorter recovery with the percutaneous technique.7,8,12 Given its lower recurrence rate (vs steroid injections) and shorter recovery and lower cost (vs a surgical procedure), percutaneous treatment of stenosing tenosynovitis appears to be a safe, highly successful, and minimally invasive treatment method.8 This study represents a single surgeon’s experience with percutaneous tendon sheath incision over a 10-year period.
Methods
Patients presented with symptoms of stenosing flexor tenosynovitis with severity ranging from intermittent triggering to frank locking of the digit. Most patients underwent prior conservative treatment, including corticosteroid injections and hand therapy. With each patient, the senior author discussed the pathophysiology of trigger digit; treatment options, including observation, hand therapy, corticosteroid injection, percutaneous release, and open release; and potential risks and complications. The treatment path—initial corticosteroid injection, percutaneous release, or open release—was left up to the patient. The only exclusion criterion was prior surgery to the involved digit, and there was no discrimination by finger, symptomatic period, or severity. Each released digit was recorded independently. In no case was anticoagulant therapy discontinued.
A complete medical history was obtained for each patient.
Over a 10-year period (March 2003-December 2013), percutaneous release was performed on 596 trigger fingers in 429 patients, 18 years old or older. Of these patients, 279 were female. Mean age was 62 years (range, 26-97 years). Of the 531 releases with handedness recorded, 56.3% were performed on trigger digits on dominant hands (Table 1). [[{"fid":"202302","view_mode":"medstat_image_flush_right","attributes":{"class":"media-element file-medstat-image-flush-right","data-delta":"2"},"fields":{"format":"medstat_image_flush_right","field_file_image_caption[und][0][value]":"Table 1.","field_file_image_credit[und][0][value]":"","field_file_image_caption[und][0][format]":"plain_text","field_file_image_credit[und][0][format]":"plain_text"},"type":"media","field_deltas":{"2":{"format":"medstat_image_flush_right","field_file_image_caption[und][0][value]":"Table 1.","field_file_image_credit[und][0][value]":""}}}]]Mean duration of symptoms before percutaneous release was 9.7 months (range, 0.5-132 months). Of the 596 digits, 69 were reported to have previously sustained trauma, and 161 had been unsuccessfully treated with one or more cortisone injections before undergoing release. Of the suspected comorbidities examined, carpal tunnel syndrome was previously diagnosed in 79 patients and diabetes in 56 patients.1
Of the 429 patients, 313 had a single digit released and 116 had multiple digits released. Of the 116 patients in the multiple-release group, 80 had 2 fingers released, 24 had 3 released, 7 had 4 released, and 5 had 5 released. The 596 released trigger fingers consisted of 188 thumbs, 41 index fingers, 185 middle fingers, 140 ring fingers, and 42 small fingers.
Surgical Technique
In-office percutaneous trigger finger releases were performed with a local anesthetic. One milliliter of lidocaine 1% injection was used to anesthetize the skin, the subcutaneous tissues, and the flexor tendon sheath at the level of the A1 pulley. As described by Pandey and colleagues,6 the proper location of the pulley was confirmed using specific surface landmarks on each digit. After waiting several minutes to allow the anesthetic to take effect, the surgeon inserted an 18-gauge needle into the center of the pulley with the digit held in extension (Figure 2). [[{"fid":"202303","view_mode":"medstat_image_flush_left","attributes":{"class":"media-element file-medstat-image-flush-left","data-delta":"3"},"fields":{"format":"medstat_image_flush_left","field_file_image_caption[und][0][value]":"Figure 2.","field_file_image_credit[und][0][value]":"","field_file_image_caption[und][0][format]":"plain_text","field_file_image_credit[und][0][format]":"plain_text"},"type":"media","field_deltas":{"3":{"format":"medstat_image_flush_left","field_file_image_caption[und][0][value]":"Figure 2.","field_file_image_credit[und][0][value]":""}}}]]The needle was carefully moved longitudinally along the length of the pulley with the bevel of the needle parallel to the tendon. A grating sensation was felt as the fibers of the pulley were cut. Several needle passes were made until the pulley was felt to have been released. Complete release was determined by loss of the grating sensation, along with complete relief of any further symptoms of triggering. The puncture site was cleaned and covered with a light sterile dressing (watch the Video online). There was no postoperative immobilization, and patients were encouraged to immediately return to normal use of the digit. Hand therapy was not prescribed, and pain medications were not dispensed. A 1-week follow-up appointment was scheduled, and patients were advised to return for evaluation in the event of any recurring symptoms (eg, triggering, swelling, stiffness, pain).
Results
were successfully released with 1 percutaneous procedure (recurrence or failure rate, 9.9%). The thumb was the digit most reliably released (success rate, 94.7%) (Table 2). [[{"fid":"202306","view_mode":"medstat_image_flush_right","attributes":{"class":"media-element file-medstat-image-flush-right","data-delta":"4"},"fields":{"format":"medstat_image_flush_right","field_file_image_caption[und][0][value]":"Table 2.","field_file_image_credit[und][0][value]":"","field_file_image_caption[und][0][format]":"plain_text","field_file_image_credit[und][0][format]":"plain_text"},"type":"media","field_deltas":{"4":{"format":"medstat_image_flush_right","field_file_image_caption[und][0][value]":"Table 2.","field_file_image_credit[und][0][value]":""}}}]]Patients with recurrent or unresolved symptoms were given the options of a second percutaneous release or an open surgical procedure. Of the 59 digits unsuccessfully released, as identified by persistent triggering or locking of the digit, 17 were treated with a second percutaneous release (15 were successful), and 40 underwent open tendon sheath incision as a second procedure (success rate, 100%); triggering persisted in the remaining 2 digits, and these were considered failures (the 2 patients did not pursue further treatment).
There were no complications: infection; nerve, artery, or tendon injury; or chronic pain. Some patients had mild stiffness, swelling, or pain for a few days after the procedure, and these effects typically resolved without treatment. In 29 digits, persistent pain or swelling without triggering was successfully treated with a corticosteroid injection.
Discussion
[[{"fid":"202307","view_mode":"medstat_image_flush_left","attributes":{"class":"media-element file-medstat-image-flush-left","data-delta":"5"},"fields":{"format":"medstat_image_flush_left","field_file_image_caption[und][0][value]":"Table 3.","field_file_image_credit[und][0][value]":"","field_file_image_caption[und][0][format]":"plain_text","field_file_image_credit[und][0][format]":"plain_text"},"type":"media","field_deltas":{"5":{"format":"medstat_image_flush_left","field_file_image_caption[und][0][value]":"Table 3.","field_file_image_credit[und][0][value]":""}}}]]Over a 10-year period, 596 percutaneous trigger finger releases were sequentially performed by a single surgeon. The 90% success rate compares favorably with rates found in other studies (Table 3).5-9,12-14 The surgeon’s success rates for individual years vary and demonstrate no clear trend or learning curve with the procedure (Figure 3). There were no significant complications. Patient satisfaction with the procedure was high.[[{"fid":"202308","view_mode":"medstat_image_flush_right","attributes":{"class":"media-element file-medstat-image-flush-right","data-delta":"6"},"fields":{"format":"medstat_image_flush_right","field_file_image_caption[und][0][value]":"Figure 3.","field_file_image_credit[und][0][value]":"","field_file_image_caption[und][0][format]":"plain_text","field_file_image_credit[und][0][format]":"plain_text"},"type":"media","field_deltas":{"6":{"format":"medstat_image_flush_right","field_file_image_caption[und][0][value]":"Figure 3.","field_file_image_credit[und][0][value]":""}}}]]
There were no injuries to digital nerves, arteries, or flexor tendons, either early or late, and no reports of infections or long-term pain or loss of motion. Although it is quite probable that in some procedures the longitudinal passes of the 18-gauge needle may have also slightly cut into the flexor tendon after passing through the A1 pulley, the direction of the needle passes was in line with the direction of the collagen fibers of the tendon, and thus any inadvertent superficial abrasion would not have structurally weakened the tendon. Of the 40 digits that underwent open release after incomplete or failed percutaneous release, none showed significant longitudinal lacerations of the superficialis tendon. During these revision surgeries, the typical intraoperative finding was incomplete release of the A1 pulley, usually at the distal end. Although loss of the grating sensation or relief of further triggering symptoms was considered adequate evidence of a successful release in this study, small tendon attachments could remain and potentially could lead to recurrent triggering. Given the high success rate achieved with the large sample, however, these 2 factors are considered appropriate indicators of successful release.
It is unclear why there was a relatively consistent 10% failure rate and why it did not decrease over the 10-year study period. Although the technique used does not have a significant learning curve, it appears that digits are not actively triggering at time of procedure have a higher failure rate. When a patient’s digit is actively triggering, assessment of the success of the procedure is relatively straightforward, whereas when a digit intermittently triggers and locks and is not symptomatic in the office, success cannot be immediately determined.
No specific digit was significantly more prone to failed releases, though the small finger had the lowest success rate (85.7%). Given that only 56.4% of patients experienced triggering on the dominant hand, there is not enough evidence to suggest a significant relationship between likelihood of a trigger digit and a patient’s hand dominance. Similarly, there was no correlation between the duration of symptoms and the success of the percutaneous procedure.
Investigation of the relationship between the previously suggested comorbidities of carpal tunnel syndrome and diabetes was also inconclusive. Only 79 (18%) of 429 patients reported having carpal tunnel syndrome, and even fewer, 56 (13.0%), reported having diabetes. Only 69 of the 596 treated digits reportedly had sustained trauma before developing triggering symptoms, and only 12 of the 69 were unsuccessfully released. In addition, of the 161 digits in which one or more steroid injections failed to resolve triggering symptoms, 158 (87.3%) were successfully released with 1 percutaneous procedure. Collectively, these data show percutaneous release can effectively eliminate triggering symptoms in a digit that has sustained injury or that has been unsuccessfully treated with nonoperative methods. Failed percutaneous release subsequently can be reliably treated with an open procedure, and results are excellent.
This study had several limitations. It was retrospective, nonblinded, and did not compare outcomes of percutaneous release with those of an open procedure. Data are presented to support the efficacy and safety of percutaneous release as a treatment option. Another limitation is that pre-release treatment was not controlled. Patients had been treated with a variety of nonoperative methods, including use of anti-inflammatory medication, hand therapy, splinting, and one or more corticosteroid injections, both at our office and elsewhere.
Percutaneous release appears to have an advantage in terms of pain relief, but the study did not evaluate or control for procedure discomfort. However, patients who had been treated with a corticosteroid injection before percutaneous release consistently refused corticosteroid injections for subsequent trigger digits, citing the dramatic pain reduction achieved with release relative to injection. Similarly, all patients who had a trigger digit treated with open tendon sheath incision in the past indicated a strong preference for the percutaneous release.
Follow-up on this patient population was inconsistent and incomplete. Many patients did not return, presumably because they considered the procedure a success and thought follow-up was unnecessary. However, some patients may have had a recurrence or an incomplete release and gone elsewhere for treatment.
The results of this study, to date the largest study on percutaneous release of trigger finger, provide more evidence of the safety and efficacy of this procedure as a treatment option. The success rate of percutaneous release is high, surpasses that of nonoperative treatments such as steroid injections, and approaches that of open and endoscopic surgical alternatives. Some of the obvious advantages of percutaneous release are less visible scarring, fewer incision-related complications, and shorter rehabilitation.10 In addition, post-procedure pain is possibly reduced, symptom relief is comparable, operative time is significantly shorter,8 and percutaneous release is easily performed in the office setting.
Percutaneous release is a viable treatment option for stenosing flexor tenosynovitis, regardless of previously used nonoperative treatment methods, duration or severity of symptoms, or trigger digit treated.
1. Makkouk AH, Oetgen ME, Swigart CR, Dodds SD. Trigger finger: etiology, evaluation, and treatment. Curr Rev Musculoskelet Med. 2008;1(2):92-96.
2. Fahey JJ, Bollinger JA. Trigger-finger in adults and children. J Bone Joint Surg Am. 1954;36(6):1200-1218.
3. Marks MR, Gunther SF. Efficacy of cortisone injection in treatment of trigger fingers and thumbs. J Hand Surg Am. 1989;14(4):722-727.
4. Chammas M, Bousquet P, Renard E, Poirier JL, Jaffiol C, Allieu Y. Dupuytren’s disease, carpal tunnel syndrome, trigger finger, and diabetes mellitus. J Hand Surg Am. 1995;20(1):109-114.
5. Habbu R, Putman MD, Adams JE. Percutaneous release of the A1 pulley: a cadaver study. J Hand Surg Am. 2012;37(11):2273-2277.
6. Pandey BK, Sharma S, Manandhar RR, Pradhan RL, Lakhey S, Rijal KP. Percutaneous trigger finger release. Nepal Orthop Assoc J. 2010;1(1):1-5.
7. Sato ES, Gomes dos Santos JB, Belloti JC, Albertoni WM, Faloppa F. Treatment of trigger finger: randomized clinical trial comparing the methods of corticosteroid injection, percutaneous release and open surgery. Rheumatology. 2012;51(1):93-99.
8. Dierks U, Hoffmann R, Meek MF. Open versus percutaneous release of the A1-pulley for stenosing tendovaginitis: a prospective randomized trial. Tech Hand Up Extrem Surg. 2008;12(3):183-187.
9. Tanaka J. Percutaneous trigger finger release. Tech Hand Up Extrem Surg. 1999;3(1):52-57.
10. Pegoli L, Cavalli E, Cortese P, Parolo C, Pajardi G. A comparison of endoscopic and open trigger finger release. Hand Surg. 2008;13(3):147-151.
11. Ryzewicz M, Wolf JM. Trigger digits: principles, management, and complications. J Hand Surg Am. 2006;31(1):135-146.
12. Schramm JM, Nguyen M, Wongworawat MD. The safety of percutaneous trigger finger release. Hand. 2008;3(1):44-46.
13. Paulius KL, Maguina P. Ultrasound-assisted percutaneous trigger finger release: is it safe? Hand. 2009;4(1):35-37.
14. Cihantimur B, Akin S, Ozcan M. Percutaneous treatment of trigger finger. 34 fingers followed 0.5-2 years. Acta Orthop Scand. 1998;69(2):167-168.
Take-Home Points
- The author had a 90% success rate with no complications in treating almost 600 trigger digits.
- All digits can be safely treated, including multiple fingers on one hand, all in an office setting.
- Percutaneous trigger release appears to be a safe and reliable alternative to open surgery.
- Success rate, discomfort, and cost may make a percutaneous trigger release preferable to even a trial of corticosteroid injection.
- A failed percutaneous release can be successfully treated with an open release, if needed.
Trigger finger, or stenosing flexor tenosynovitis, is a condition characterized by clicking or locking during finger movement, sometimes resulting in the freezing of a digit in flexion or extension1 (Figure 1). [[{"fid":"202300","view_mode":"medstat_image_flush_left","attributes":{"class":"media-element file-medstat-image-flush-left","data-delta":"1"},"fields":{"format":"medstat_image_flush_left","field_file_image_caption[und][0][value]":"Figure 1.","field_file_image_credit[und][0][value]":"","field_file_image_caption[und][0][format]":"plain_text","field_file_image_credit[und][0][format]":"plain_text"},"type":"media","field_deltas":{"1":{"format":"medstat_image_flush_left","field_file_image_caption[und][0][value]":"Figure 1.","field_file_image_credit[und][0][value]":""}}}]]Tendon inflammation is thought to cause constriction of the tendon sheath and bunching of the fibrous bundles of the first annular (A1) pulley, often creating a palpable nodule at the base of the digit.2,3 Many patients experience intermittent joint pain and swelling, which may progress to triggering or complete locking of the digit.1 One of the most common conditions treated by hand surgeons, trigger finger is most often reported in the dominant hand of women in their sixth decade of life and has been associated with several conditions, including diabetes and rheumatoid arthritis.4-6 Other researchers have indicated the thumb and ring finger are most commonly affected, though all fingers can potentially trigger.7,8
Initial treatment often involves injecting corticosteroid into the flexor tendon sheath, at or proximal to the annular pulley system, to reduce inflammation and the fibrous nodule.3 Another injection study found an initial success rate of 57% with a single injection, and 86% with a second injection, but patients were monitored for only 6 months, a period that may have been too short for symptom recurrence.7
On failure of steroid injections, patients typically are treated with open tendon sheath incision.9 This procedure, usually performed in a hospital or outpatient surgery setting, requires postoperative wound care, including dressing changes, suture removal, possible hand therapy, and follow-up physician visits. Operative treatment involves making a 1-cm to 2-cm incision, releasing the A1 pulley, and skin suturing.7,8,10 The most common postoperative complaint is incisional tenderness, though long-term scar pain, infection, nerve injury, and disease recurrence have been reported.8 Overall, the procedure is very successful, providing up to 100% symptom relief.7,8,10
Endoscopic release of trigger finger has also been described as an effective operative treatment. This technique involves passing a small cannula through a palmar incision—using an endoscope and retrograde knife within this 2.7-mm tunnel.10 With this treatment, reduced visibility may increase the risk of nerve injury.10 Although generally successful, endoscopic release requires anesthesia and expensive instruments and has a significant learning curve.8,10
More recently, percutaneous release of trigger finger has been described as a definitive, in-office treatment.5,6,11,12 Percutaneous release has the obvious advantages of no open incision, less scarring, less discomfort, and shorter recovery. Several studies have found comparable success rates for open and percutaneous procedures but consistently shorter recovery with the percutaneous technique.7,8,12 Given its lower recurrence rate (vs steroid injections) and shorter recovery and lower cost (vs a surgical procedure), percutaneous treatment of stenosing tenosynovitis appears to be a safe, highly successful, and minimally invasive treatment method.8 This study represents a single surgeon’s experience with percutaneous tendon sheath incision over a 10-year period.
Methods
Patients presented with symptoms of stenosing flexor tenosynovitis with severity ranging from intermittent triggering to frank locking of the digit. Most patients underwent prior conservative treatment, including corticosteroid injections and hand therapy. With each patient, the senior author discussed the pathophysiology of trigger digit; treatment options, including observation, hand therapy, corticosteroid injection, percutaneous release, and open release; and potential risks and complications. The treatment path—initial corticosteroid injection, percutaneous release, or open release—was left up to the patient. The only exclusion criterion was prior surgery to the involved digit, and there was no discrimination by finger, symptomatic period, or severity. Each released digit was recorded independently. In no case was anticoagulant therapy discontinued.
A complete medical history was obtained for each patient.
Over a 10-year period (March 2003-December 2013), percutaneous release was performed on 596 trigger fingers in 429 patients, 18 years old or older. Of these patients, 279 were female. Mean age was 62 years (range, 26-97 years). Of the 531 releases with handedness recorded, 56.3% were performed on trigger digits on dominant hands (Table 1). [[{"fid":"202302","view_mode":"medstat_image_flush_right","attributes":{"class":"media-element file-medstat-image-flush-right","data-delta":"2"},"fields":{"format":"medstat_image_flush_right","field_file_image_caption[und][0][value]":"Table 1.","field_file_image_credit[und][0][value]":"","field_file_image_caption[und][0][format]":"plain_text","field_file_image_credit[und][0][format]":"plain_text"},"type":"media","field_deltas":{"2":{"format":"medstat_image_flush_right","field_file_image_caption[und][0][value]":"Table 1.","field_file_image_credit[und][0][value]":""}}}]]Mean duration of symptoms before percutaneous release was 9.7 months (range, 0.5-132 months). Of the 596 digits, 69 were reported to have previously sustained trauma, and 161 had been unsuccessfully treated with one or more cortisone injections before undergoing release. Of the suspected comorbidities examined, carpal tunnel syndrome was previously diagnosed in 79 patients and diabetes in 56 patients.1
Of the 429 patients, 313 had a single digit released and 116 had multiple digits released. Of the 116 patients in the multiple-release group, 80 had 2 fingers released, 24 had 3 released, 7 had 4 released, and 5 had 5 released. The 596 released trigger fingers consisted of 188 thumbs, 41 index fingers, 185 middle fingers, 140 ring fingers, and 42 small fingers.
Surgical Technique
In-office percutaneous trigger finger releases were performed with a local anesthetic. One milliliter of lidocaine 1% injection was used to anesthetize the skin, the subcutaneous tissues, and the flexor tendon sheath at the level of the A1 pulley. As described by Pandey and colleagues,6 the proper location of the pulley was confirmed using specific surface landmarks on each digit. After waiting several minutes to allow the anesthetic to take effect, the surgeon inserted an 18-gauge needle into the center of the pulley with the digit held in extension (Figure 2). [[{"fid":"202303","view_mode":"medstat_image_flush_left","attributes":{"class":"media-element file-medstat-image-flush-left","data-delta":"3"},"fields":{"format":"medstat_image_flush_left","field_file_image_caption[und][0][value]":"Figure 2.","field_file_image_credit[und][0][value]":"","field_file_image_caption[und][0][format]":"plain_text","field_file_image_credit[und][0][format]":"plain_text"},"type":"media","field_deltas":{"3":{"format":"medstat_image_flush_left","field_file_image_caption[und][0][value]":"Figure 2.","field_file_image_credit[und][0][value]":""}}}]]The needle was carefully moved longitudinally along the length of the pulley with the bevel of the needle parallel to the tendon. A grating sensation was felt as the fibers of the pulley were cut. Several needle passes were made until the pulley was felt to have been released. Complete release was determined by loss of the grating sensation, along with complete relief of any further symptoms of triggering. The puncture site was cleaned and covered with a light sterile dressing (watch the Video online). There was no postoperative immobilization, and patients were encouraged to immediately return to normal use of the digit. Hand therapy was not prescribed, and pain medications were not dispensed. A 1-week follow-up appointment was scheduled, and patients were advised to return for evaluation in the event of any recurring symptoms (eg, triggering, swelling, stiffness, pain).
Results
were successfully released with 1 percutaneous procedure (recurrence or failure rate, 9.9%). The thumb was the digit most reliably released (success rate, 94.7%) (Table 2). [[{"fid":"202306","view_mode":"medstat_image_flush_right","attributes":{"class":"media-element file-medstat-image-flush-right","data-delta":"4"},"fields":{"format":"medstat_image_flush_right","field_file_image_caption[und][0][value]":"Table 2.","field_file_image_credit[und][0][value]":"","field_file_image_caption[und][0][format]":"plain_text","field_file_image_credit[und][0][format]":"plain_text"},"type":"media","field_deltas":{"4":{"format":"medstat_image_flush_right","field_file_image_caption[und][0][value]":"Table 2.","field_file_image_credit[und][0][value]":""}}}]]Patients with recurrent or unresolved symptoms were given the options of a second percutaneous release or an open surgical procedure. Of the 59 digits unsuccessfully released, as identified by persistent triggering or locking of the digit, 17 were treated with a second percutaneous release (15 were successful), and 40 underwent open tendon sheath incision as a second procedure (success rate, 100%); triggering persisted in the remaining 2 digits, and these were considered failures (the 2 patients did not pursue further treatment).
There were no complications: infection; nerve, artery, or tendon injury; or chronic pain. Some patients had mild stiffness, swelling, or pain for a few days after the procedure, and these effects typically resolved without treatment. In 29 digits, persistent pain or swelling without triggering was successfully treated with a corticosteroid injection.
Discussion
[[{"fid":"202307","view_mode":"medstat_image_flush_left","attributes":{"class":"media-element file-medstat-image-flush-left","data-delta":"5"},"fields":{"format":"medstat_image_flush_left","field_file_image_caption[und][0][value]":"Table 3.","field_file_image_credit[und][0][value]":"","field_file_image_caption[und][0][format]":"plain_text","field_file_image_credit[und][0][format]":"plain_text"},"type":"media","field_deltas":{"5":{"format":"medstat_image_flush_left","field_file_image_caption[und][0][value]":"Table 3.","field_file_image_credit[und][0][value]":""}}}]]Over a 10-year period, 596 percutaneous trigger finger releases were sequentially performed by a single surgeon. The 90% success rate compares favorably with rates found in other studies (Table 3).5-9,12-14 The surgeon’s success rates for individual years vary and demonstrate no clear trend or learning curve with the procedure (Figure 3). There were no significant complications. Patient satisfaction with the procedure was high.[[{"fid":"202308","view_mode":"medstat_image_flush_right","attributes":{"class":"media-element file-medstat-image-flush-right","data-delta":"6"},"fields":{"format":"medstat_image_flush_right","field_file_image_caption[und][0][value]":"Figure 3.","field_file_image_credit[und][0][value]":"","field_file_image_caption[und][0][format]":"plain_text","field_file_image_credit[und][0][format]":"plain_text"},"type":"media","field_deltas":{"6":{"format":"medstat_image_flush_right","field_file_image_caption[und][0][value]":"Figure 3.","field_file_image_credit[und][0][value]":""}}}]]
There were no injuries to digital nerves, arteries, or flexor tendons, either early or late, and no reports of infections or long-term pain or loss of motion. Although it is quite probable that in some procedures the longitudinal passes of the 18-gauge needle may have also slightly cut into the flexor tendon after passing through the A1 pulley, the direction of the needle passes was in line with the direction of the collagen fibers of the tendon, and thus any inadvertent superficial abrasion would not have structurally weakened the tendon. Of the 40 digits that underwent open release after incomplete or failed percutaneous release, none showed significant longitudinal lacerations of the superficialis tendon. During these revision surgeries, the typical intraoperative finding was incomplete release of the A1 pulley, usually at the distal end. Although loss of the grating sensation or relief of further triggering symptoms was considered adequate evidence of a successful release in this study, small tendon attachments could remain and potentially could lead to recurrent triggering. Given the high success rate achieved with the large sample, however, these 2 factors are considered appropriate indicators of successful release.
It is unclear why there was a relatively consistent 10% failure rate and why it did not decrease over the 10-year study period. Although the technique used does not have a significant learning curve, it appears that digits are not actively triggering at time of procedure have a higher failure rate. When a patient’s digit is actively triggering, assessment of the success of the procedure is relatively straightforward, whereas when a digit intermittently triggers and locks and is not symptomatic in the office, success cannot be immediately determined.
No specific digit was significantly more prone to failed releases, though the small finger had the lowest success rate (85.7%). Given that only 56.4% of patients experienced triggering on the dominant hand, there is not enough evidence to suggest a significant relationship between likelihood of a trigger digit and a patient’s hand dominance. Similarly, there was no correlation between the duration of symptoms and the success of the percutaneous procedure.
Investigation of the relationship between the previously suggested comorbidities of carpal tunnel syndrome and diabetes was also inconclusive. Only 79 (18%) of 429 patients reported having carpal tunnel syndrome, and even fewer, 56 (13.0%), reported having diabetes. Only 69 of the 596 treated digits reportedly had sustained trauma before developing triggering symptoms, and only 12 of the 69 were unsuccessfully released. In addition, of the 161 digits in which one or more steroid injections failed to resolve triggering symptoms, 158 (87.3%) were successfully released with 1 percutaneous procedure. Collectively, these data show percutaneous release can effectively eliminate triggering symptoms in a digit that has sustained injury or that has been unsuccessfully treated with nonoperative methods. Failed percutaneous release subsequently can be reliably treated with an open procedure, and results are excellent.
This study had several limitations. It was retrospective, nonblinded, and did not compare outcomes of percutaneous release with those of an open procedure. Data are presented to support the efficacy and safety of percutaneous release as a treatment option. Another limitation is that pre-release treatment was not controlled. Patients had been treated with a variety of nonoperative methods, including use of anti-inflammatory medication, hand therapy, splinting, and one or more corticosteroid injections, both at our office and elsewhere.
Percutaneous release appears to have an advantage in terms of pain relief, but the study did not evaluate or control for procedure discomfort. However, patients who had been treated with a corticosteroid injection before percutaneous release consistently refused corticosteroid injections for subsequent trigger digits, citing the dramatic pain reduction achieved with release relative to injection. Similarly, all patients who had a trigger digit treated with open tendon sheath incision in the past indicated a strong preference for the percutaneous release.
Follow-up on this patient population was inconsistent and incomplete. Many patients did not return, presumably because they considered the procedure a success and thought follow-up was unnecessary. However, some patients may have had a recurrence or an incomplete release and gone elsewhere for treatment.
The results of this study, to date the largest study on percutaneous release of trigger finger, provide more evidence of the safety and efficacy of this procedure as a treatment option. The success rate of percutaneous release is high, surpasses that of nonoperative treatments such as steroid injections, and approaches that of open and endoscopic surgical alternatives. Some of the obvious advantages of percutaneous release are less visible scarring, fewer incision-related complications, and shorter rehabilitation.10 In addition, post-procedure pain is possibly reduced, symptom relief is comparable, operative time is significantly shorter,8 and percutaneous release is easily performed in the office setting.
Percutaneous release is a viable treatment option for stenosing flexor tenosynovitis, regardless of previously used nonoperative treatment methods, duration or severity of symptoms, or trigger digit treated.
1. Makkouk AH, Oetgen ME, Swigart CR, Dodds SD. Trigger finger: etiology, evaluation, and treatment. Curr Rev Musculoskelet Med. 2008;1(2):92-96.
2. Fahey JJ, Bollinger JA. Trigger-finger in adults and children. J Bone Joint Surg Am. 1954;36(6):1200-1218.
3. Marks MR, Gunther SF. Efficacy of cortisone injection in treatment of trigger fingers and thumbs. J Hand Surg Am. 1989;14(4):722-727.
4. Chammas M, Bousquet P, Renard E, Poirier JL, Jaffiol C, Allieu Y. Dupuytren’s disease, carpal tunnel syndrome, trigger finger, and diabetes mellitus. J Hand Surg Am. 1995;20(1):109-114.
5. Habbu R, Putman MD, Adams JE. Percutaneous release of the A1 pulley: a cadaver study. J Hand Surg Am. 2012;37(11):2273-2277.
6. Pandey BK, Sharma S, Manandhar RR, Pradhan RL, Lakhey S, Rijal KP. Percutaneous trigger finger release. Nepal Orthop Assoc J. 2010;1(1):1-5.
7. Sato ES, Gomes dos Santos JB, Belloti JC, Albertoni WM, Faloppa F. Treatment of trigger finger: randomized clinical trial comparing the methods of corticosteroid injection, percutaneous release and open surgery. Rheumatology. 2012;51(1):93-99.
8. Dierks U, Hoffmann R, Meek MF. Open versus percutaneous release of the A1-pulley for stenosing tendovaginitis: a prospective randomized trial. Tech Hand Up Extrem Surg. 2008;12(3):183-187.
9. Tanaka J. Percutaneous trigger finger release. Tech Hand Up Extrem Surg. 1999;3(1):52-57.
10. Pegoli L, Cavalli E, Cortese P, Parolo C, Pajardi G. A comparison of endoscopic and open trigger finger release. Hand Surg. 2008;13(3):147-151.
11. Ryzewicz M, Wolf JM. Trigger digits: principles, management, and complications. J Hand Surg Am. 2006;31(1):135-146.
12. Schramm JM, Nguyen M, Wongworawat MD. The safety of percutaneous trigger finger release. Hand. 2008;3(1):44-46.
13. Paulius KL, Maguina P. Ultrasound-assisted percutaneous trigger finger release: is it safe? Hand. 2009;4(1):35-37.
14. Cihantimur B, Akin S, Ozcan M. Percutaneous treatment of trigger finger. 34 fingers followed 0.5-2 years. Acta Orthop Scand. 1998;69(2):167-168.

Patient Preference Before and After Arthroscopic Rotator Cuff Repair: Which Is More Important, Pain Relief or Strength Return?
Take-Home Points
- Pain relief and return of strength are important satisfaction variables for patients undergoing ARCR.
- Pain relief and strength return are equally desirable in the majority (50%) of the patients before and after ARCR.
- Overall, patient preference for strength return dominates pain relief in long-term.
- Increasing age is associated with a stronger preference for pain relief.
- Improved understanding of patient expectations after ARCR will promote meaningful changes in patient satisfaction.
A rotator cuff tear (RCT) can cause significant pain, weakness, stiffness, and loss of function in the shoulder. In most patients, arthroscopic rotator cuff repair (ARCR) provides significant and reproducible pain relief and variable return of shoulder strength and function.1-4 ARCR outcomes are well described and well represented by validated outcome measures.5-9 However, these outcomes do not always correlate with patient satisfaction. For example, after ARCR, 2 patients with similar outcome scores may have different satisfaction levels.
Patient satisfaction involves multiple factors and varies with the patient’s preoperative expectations and the degree to which the surgery matches the patient’s desired outcomes.10-15 In clinical studies, Tashjian and colleagues,10 Henn and colleagues,11 and O’Holleran and colleagues12 found patient satisfaction correlated most highly with postoperative shoulder pain, shoulder function, general health status, and outcome scores. However, our understanding of patients’ desired outcomes and expectations of ARCR is limited, particularly regarding the importance of pain relief and strength return relative to each other. We believe patients’ preoperative expectations are influenced by their self-assessments of symptom severity and by their understanding of the outcomes of surgical procedures and of the information they receive from their surgeons during preoperative evaluation.
We conducted an observational study to determine patients’ preoperative preferences and the importance of post-ARCR pain relief and strength return relative to each other. After surgery, preferences and ratings of pain relief and strength return were reevaluated to determine if they were altered by outcomes. We also studied the influence of multiple factors, including severity of preoperative symptoms (pain, weakness), age, sex, occupation, and active sports involvement, on patients’ preoperative ratings of the importance of post-ARCR improvements in pain relief and strength return. We hypothesized that patients would vary in how they preoperatively value and desire post-ARCR pain relief and strength return.
Materials and Methods
The simple shoulder questionnaire (Figure) designed for this study had 12 items. Patients subjectively assessed the severity of their symptoms (pain level, shoulder weakness) and rated the importance of both pain relief and strength return to their occupational and personal life.
Before patients underwent surgery for symptomatic suspected RCTs, they were approached to participate in this prospective study. Sixty-five patients provided informed consent on forms approved by an Institutional Review Board. Inclusion criteria were suspected unilateral rotator cuff pathology and willingness to participate. Of the 65 patients, 60 underwent ARCR without another procedure, such as shoulder instability repair, SLAP (superior labrum anterior-to-posterior) repair, or distal clavicle excision; the other 5 patients elected nonoperative treatment and were excluded from review. At a mean (SD) follow-up of 5.2 (0.2) years, the 60 patients who had surgery completed the questionnaire again and rated the importance of pain relief and strength return relative to each other.
Patients with RCTs were divided according to age, sex, shoulder dominance, occupation type, and active sports involvement. Standard definitions for occupation types were used: blue-collar, manual labor jobs; white-collar, salaried/educated positions; and retired.
Matched-pairs t tests were used to compare preoperative and postoperative continuous variables (strength return preference, pain relief preference, SPD). One-way analysis of variance (ANOVA) was used to compare categorical variables (sex, shoulder dominance, active sports involvement) with continuous variables (SPD), and bivariate regression was used to compare groups with continuous data (age, SPD). In cases involving more than 2 groups (occupation types), the Tukey honestly significant difference (HSD) test was used to evaluate intergroup differences. P < .05 was used for statistical significance.
Results
ARCR Outcomes
After ARCR, there was significant improvement in patient-reported pain and subjective strength scores. Mean (SD) pain score improved from 5.9 (2.3) to 1.3 (2.3) after ARCR (P < .001), and mean (SD) strength improved from 46% (22%) of normal to 84% (17%) of normal (P < .001).
Importance of Post-ARCR Pain Relief and Strength Return
Analysis of preoperative questionnaire responses
revealed that, of 60 patients, 29 (48.3%) considered pain relief and strength return equally important, 20 (33.3%) valued postoperative strength return was more important, and 11 patients (18.3%) rated pain relief was more important than strength return. After a mean (SD) follow-up of 5.2 (0.2) years, 33 patients (55 %) valued pain relief and strength return as equally important, 17 patients (28.3%) preferred a strength recovery, and 10 patients (16.7%) preferred pain relief.
Overall patient ratings were significantly higher for strength return compared to pain relief before surgery, mean (SD), 9.2 (2.1) and 8.6 (2.3) (P = .02), and afterward, 8.9 (1.9) and 8.2 (3.1) (P = .03) (Table 1). 
Subgroup Analyses
Sex and Age. Of the 60 patients, 43 were male and 17 female. Mean (SD) preoperative SPD was 1.0 (2.7) for males and 0.7 (2.3) females; the difference was not significant (P = .61). After surgery, females emphasized strength return over pain relief more than males did: Mean (SD) SPD was significantly higher (P = .04) for females, 1.7 (3.0), than for males, 0.4 (2.5). There were no preoperative–postoperative differences (P = .33) for males or females (Table 2). 
Hand Dominance. RCT was found in the dominant shoulder of 31 patients (52%). Shoulder dominance did not affect SPD: Mean (SD) preoperative SPD was 1.3 (2.3) for dominant shoulders and 0.5 (2.7) for nondominant shoulders (P = .21), and postoperative SPD was 0.7 (2.6) for dominant and 0.9 (2.8) for nondominant (P = .79). SPD did not change from before surgery to after surgery for dominant (P = .14) or nondominant (P = .28) shoulders (Table 2).
Active Sports Participation. Thirty-two patients (53%) reported preoperative involvement in sports; 35 (58%) reported postoperative involvement (P = .37). Mean (SD) preoperative SPD was 1.4 (3.0) for involved patients and 0.3 (1.7) for uninvolved patients (P = .09), and postoperative SPD was 0.6 (2.8) for involved patients and 1.0 (2.6) for uninvolved patients (P = .53). SPD did not change from before surgery to after surgery for involved (P = .17) or uninvolved (P = .26) patients (Table 2).
Occupation Type. There were 9 blue-collar workers (15%), 32 white-collar workers (53%), and 19 retirees (32%). Mean (SD) preoperative SPD was 2.8 (4.2) for blue-collar workers, 1.2 (2.1) for white-collar workers, and –0.4 (0.4) for retirees. There were no significant differences in preoperative SPD between blue-collar and white-collar workers (P = .19) or between white-collar workers and retirees (P = .06), but there was a significant difference between blue-collar workers and retirees (P = .004). Mean (SD) postoperative SPD was 1.3 (2.7) for blue-collar workers, 1.2 (3.1) for white-collar workers, and –0.3 (1.6) for retirees. There were no significant differences between blue-collar and white-collar workers (P = .99), white-collar workers and retirees (P = .13), or blue-collar workers and retirees (P = .3).
Discussion
In this study, we wanted to determine patients’ pre- and postoperative preferences for pain relief and strength return after ARCR. Preoperative and postoperative preference analysis of the 60 patients who underwent ARCR revealed that the majority valued pain relief and strength return equally. However, overall, there was higher ratings for strength return in long term after ARCR, irrespective of age, sex, preoperative levels of shoulder pain and weakness, and preoperative and postoperative sports involvement.
Patients’ preoperative expectations are a function of their assessment of their symptoms, their perceptions of expected surgical outcomes, and their understanding of preoperative discussion with their surgeons. In this study, patients self-assessed their shoulder symptoms and their effect on their occupational and personal life. They also rated the importance of post-ARCR pain relief and strength return relative to each other. To assess whether surgical outcomes affected perceptions of pain relief and strength return, patients completed the questionnaire before and after surgery. Overall, patients rated postoperative strength return over pain relief on long-term (5 years).
Subgroup analysis revealed a weak positive correlation between patient-reported preoperative pain scores and ratings of the importance of pain relief after surgery, but there was no correlation between postoperative pain scores and ratings of the importance of pain relief after surgery. This finding was surprising because we thought pain relief would be more important than strength return for patients with higher pain scores.1-3,16-21 We would like to clarify a point about this study: That patients preferred strength return over pain relief does not mean they did not care about pain relief. A substantial subset of patients (~50%) valued pain relief and strength return equally. In rotator cuff pathology, pain and weakness are to an extent interrelated. Shoulder pain that limits a patient’s ability to perform a strenuous task can be perceived as shoulder weakness, which may explain why, despite having higher pain scores, patients preferred strength return over pain relief. Increasing age showed a positive correlation with preference for pain relief, which explains the finding that retirees preferred pain relief over strength return. We used SPD to express the preference for strength return over pain relief before and after ARCR. Unfortunately, SPD may not be used to quantitatively define the preference for strength return over pain relief.
Patient satisfaction after RCR involves multiple factors and has been well studied. In a retrospective analysis of 112 patients, Tashjian and colleagues10 found that patient satisfaction was affected by preoperative expectations, marital status, disability status, preoperative pain function, and general health status after RCR. They also found a positive but weak correlation between patient satisfaction and functional outcome scores, including visual analog scale (VAS), Simple Shoulder Test (SST), and Disabilities of the Arm, Shoulder, and Hand (DASH) scores. Henn and colleagues11 evaluated 125 patients who underwent primary RCR for a chronic RCT. Higher preoperative expectations correlated with better postoperative VAS, SST, DASH, and Short Form 36 performance, irrespective of worker compensation status, symptom duration, number of patient comorbidities, tear size, repair technique, and number of previous operations. In a prospective cohort analysis of 311 RCR patients, O’Holleran and colleagues12 found that decreased patient satisfaction was associated with postoperative pain and dysfunction. Furthermore, willingness to recommend surgery to another person was significantly related to patient satisfaction. In the present study, we did not correlate preoperative expectations with postoperative outcome scores or evaluate the effect of other known factors on RCR outcomes. Our main goal was to understand ARCR patients’ preoperative and postoperative evaluations of the importance of pain relief and strength return relative to each other. Improved understanding of patients’ expectations will allow us to identify disparities between expectations and outcomes.
Our study had several limitations. First, our questionnaire was not validated. However, we used it only as an assessment tool, to collect data, and do not propose using it to assess ARCR outcomes. Second, objective strength measurements were not performed, before or after surgery, and therefore patients’ perceptions of weakness were not tested. Third, we did not correlate preoperative or postoperative shoulder outcome scores with patients’ expectations. Our intention was to understand how ARCR patients rate the importance of pain relief and strength return relative to each other. Fourth, we did not correlate patients’ expectations of strength return and pain relief with preoperative tear size or postoperative retear status.
Our observational study results showed that, before undergoing ARCR, most patients valued postoperative pain relief and strength return equally. However, there was an overall preference for strength return over pain relief. Furthermore, this preference held up irrespective of age, sex, sports involvement, or preoperative symptom severity. These findings add to our understanding of patients’ preoperative expectations of ARCR.
Am J Orthop. 2017;46(4):E244-E250. Copyright Frontline Medical Communications Inc. 2017. All rights reserved.
1. Cole BJ, McCarty LP 3rd, Kang RW, Alford W, Lewis PB, Hayden JK. Arthroscopic rotator cuff repair: prospective functional outcome and repair integrity at minimum 2-year follow-up. J Shoulder Elbow Surg. 2007;16(5):579-585.
2. Huijsmans PE, Pritchard MP, Berghs BM, van Rooyen KS, Wallace AL, de Beer JF. Arthroscopic rotator cuff repair with double-row fixation. J Bone Joint Surg Am. 2007;89(6):1248-1257.
3. Wilson F, Hinov V, Adams G. Arthroscopic repair of full-thickness tears of the rotator cuff: 2- to 14-year follow-up. Arthroscopy. 2002;18(2):136-144.
4. Denard PJ, Jiwani AZ, Lädermann A, Burkhart SS. Long-term outcome of a consecutive series of subscapularis tendon tears repaired arthroscopically. Arthroscopy. 2012;28(11):1587-1591.
5. Richards RR, An KN, Bigliani LU, et al. A standardized method for the assessment of shoulder function. J Shoulder Elbow Surg. 1994;3(6):347-352.
6. Roach KE, Budiman-Mak E, Songsiridej N, Lertratanakul Y. Development of a shoulder pain and disability index. Arthritis Care Res. 1991;4(4):143-149.
7. Constant CR, Murley AH. A clinical method of functional assessment of the shoulder. Clin Orthop Relat Res. 1987;(214):160-164.
8. Michener LA, McClure PW, Sennett BJ. American Shoulder and Elbow Surgeons Standardized Shoulder Assessment Form, patient self-report section: reliability, validity, and responsiveness. J Shoulder Elbow Surg. 2002;11(6):587-594.
9. Romeo AA, Bach BR Jr, O’Halloran KL. Scoring systems for shoulder conditions. Am J Sports Med. 1996;24(4):472-476.
10. Tashjian RZ, Bradley MP, Tocci S, Rey J, Henn RF, Green A. Factors influencing patient satisfaction after rotator cuff repair. J Shoulder Elbow Surg. 2007;16(6):752-758.
11. Henn RF 3rd, Kang L, Tashjian RZ, Green A. Patients’ preoperative expectations predict the outcome of rotator cuff repair. J Bone Joint Surg Am. 2007;89(9):1913-1919.
12. O’Holleran JD, Kocher MS, Horan MP, Briggs KK, Hawkins RJ. Determinants of patient satisfaction with outcome after rotator cuff surgery. J Bone Joint Surg Am. 2005;87(1):121-126.
13. Namdari S, Donegan RP, Chamberlain AM, Galatz LM, Yamaguchi K, Keener JD. Factors affecting outcome after structural failure of repaired rotator cuff tears. J Bone Joint Surg Am. 2014;96(2):99-105.
14. Nho SJ, Brown BS, Lyman S, Adler RS, Altchek DW, MacGillivray JD. Prospective analysis of arthroscopic rotator cuff repair: prognostic factors affecting clinical and ultrasound outcome. J Shoulder Elbow Surg. 2009;18(1):13-20.
15. Sonnabend DH, Watson EM. Structural factors affecting the outcome of rotator cuff repair. J Shoulder Elbow Surg. 2002;11(3):212-218.
16. Boileau P, Brassart N, Watkinson DJ, Carles M, Hatzidakis AM, Krishnan SG. Arthroscopic repair of full-thickness tears of the supraspinatus: does the tendon really heal? J Bone Joint Surg Am. 2005;87(6):1229-1240.
17. Sugaya H, Maeda K, Matsuki K, Moriishi J. Repair integrity and functional outcome after arthroscopic double-row rotator cuff repair. A prospective outcome study. J Bone Joint Surg Am. 2007;89(5):953-960.
18. DeFranco MJ, Bershadsky B, Ciccone J, Yum JK, Iannotti JP. Functional outcome of arthroscopic rotator cuff repairs: a correlation of anatomic and clinical results. J Shoulder Elbow Surg. 2007;16(6):759-765.
19. Galatz LM, Ball CM, Teefey SA, Middleton WD, Yamaguchi K. The outcome and repair integrity of completely arthroscopically repaired large and massive rotator cuff tears. J Bone Joint Surg Am. 2004;86(2):219-224.
20. Harryman DT 2nd, Mack LA, Wang KY, Jackins SE, Richardson ML, Matsen FA 3rd. Repairs of the rotator cuff. Correlation of functional results with integrity of the cuff. J Bone Joint Surg Am. 1991;73(7):982-989.
21. Romeo AA, Hang DW, Bach BR Jr, Shott S. Repair of full thickness rotator cuff tears. Gender, age, and other factors affecting outcome. Clin Orthop Relat Res. 1999;(367):243-255.
Take-Home Points
- Pain relief and return of strength are important satisfaction variables for patients undergoing ARCR.
- Pain relief and strength return are equally desirable in the majority (50%) of the patients before and after ARCR.
- Overall, patient preference for strength return dominates pain relief in long-term.
- Increasing age is associated with a stronger preference for pain relief.
- Improved understanding of patient expectations after ARCR will promote meaningful changes in patient satisfaction.
A rotator cuff tear (RCT) can cause significant pain, weakness, stiffness, and loss of function in the shoulder. In most patients, arthroscopic rotator cuff repair (ARCR) provides significant and reproducible pain relief and variable return of shoulder strength and function.1-4 ARCR outcomes are well described and well represented by validated outcome measures.5-9 However, these outcomes do not always correlate with patient satisfaction. For example, after ARCR, 2 patients with similar outcome scores may have different satisfaction levels.
Patient satisfaction involves multiple factors and varies with the patient’s preoperative expectations and the degree to which the surgery matches the patient’s desired outcomes.10-15 In clinical studies, Tashjian and colleagues,10 Henn and colleagues,11 and O’Holleran and colleagues12 found patient satisfaction correlated most highly with postoperative shoulder pain, shoulder function, general health status, and outcome scores. However, our understanding of patients’ desired outcomes and expectations of ARCR is limited, particularly regarding the importance of pain relief and strength return relative to each other. We believe patients’ preoperative expectations are influenced by their self-assessments of symptom severity and by their understanding of the outcomes of surgical procedures and of the information they receive from their surgeons during preoperative evaluation.
We conducted an observational study to determine patients’ preoperative preferences and the importance of post-ARCR pain relief and strength return relative to each other. After surgery, preferences and ratings of pain relief and strength return were reevaluated to determine if they were altered by outcomes. We also studied the influence of multiple factors, including severity of preoperative symptoms (pain, weakness), age, sex, occupation, and active sports involvement, on patients’ preoperative ratings of the importance of post-ARCR improvements in pain relief and strength return. We hypothesized that patients would vary in how they preoperatively value and desire post-ARCR pain relief and strength return.
Materials and Methods
The simple shoulder questionnaire (Figure) designed for this study had 12 items. Patients subjectively assessed the severity of their symptoms (pain level, shoulder weakness) and rated the importance of both pain relief and strength return to their occupational and personal life.
Before patients underwent surgery for symptomatic suspected RCTs, they were approached to participate in this prospective study. Sixty-five patients provided informed consent on forms approved by an Institutional Review Board. Inclusion criteria were suspected unilateral rotator cuff pathology and willingness to participate. Of the 65 patients, 60 underwent ARCR without another procedure, such as shoulder instability repair, SLAP (superior labrum anterior-to-posterior) repair, or distal clavicle excision; the other 5 patients elected nonoperative treatment and were excluded from review. At a mean (SD) follow-up of 5.2 (0.2) years, the 60 patients who had surgery completed the questionnaire again and rated the importance of pain relief and strength return relative to each other.
Patients with RCTs were divided according to age, sex, shoulder dominance, occupation type, and active sports involvement. Standard definitions for occupation types were used: blue-collar, manual labor jobs; white-collar, salaried/educated positions; and retired.
Matched-pairs t tests were used to compare preoperative and postoperative continuous variables (strength return preference, pain relief preference, SPD). One-way analysis of variance (ANOVA) was used to compare categorical variables (sex, shoulder dominance, active sports involvement) with continuous variables (SPD), and bivariate regression was used to compare groups with continuous data (age, SPD). In cases involving more than 2 groups (occupation types), the Tukey honestly significant difference (HSD) test was used to evaluate intergroup differences. P < .05 was used for statistical significance.
Results
ARCR Outcomes
After ARCR, there was significant improvement in patient-reported pain and subjective strength scores. Mean (SD) pain score improved from 5.9 (2.3) to 1.3 (2.3) after ARCR (P < .001), and mean (SD) strength improved from 46% (22%) of normal to 84% (17%) of normal (P < .001).
Importance of Post-ARCR Pain Relief and Strength Return
Analysis of preoperative questionnaire responses
revealed that, of 60 patients, 29 (48.3%) considered pain relief and strength return equally important, 20 (33.3%) valued postoperative strength return was more important, and 11 patients (18.3%) rated pain relief was more important than strength return. After a mean (SD) follow-up of 5.2 (0.2) years, 33 patients (55 %) valued pain relief and strength return as equally important, 17 patients (28.3%) preferred a strength recovery, and 10 patients (16.7%) preferred pain relief.
Overall patient ratings were significantly higher for strength return compared to pain relief before surgery, mean (SD), 9.2 (2.1) and 8.6 (2.3) (P = .02), and afterward, 8.9 (1.9) and 8.2 (3.1) (P = .03) (Table 1).
Subgroup Analyses
Sex and Age. Of the 60 patients, 43 were male and 17 female. Mean (SD) preoperative SPD was 1.0 (2.7) for males and 0.7 (2.3) females; the difference was not significant (P = .61). After surgery, females emphasized strength return over pain relief more than males did: Mean (SD) SPD was significantly higher (P = .04) for females, 1.7 (3.0), than for males, 0.4 (2.5). There were no preoperative–postoperative differences (P = .33) for males or females (Table 2).
Hand Dominance. RCT was found in the dominant shoulder of 31 patients (52%). Shoulder dominance did not affect SPD: Mean (SD) preoperative SPD was 1.3 (2.3) for dominant shoulders and 0.5 (2.7) for nondominant shoulders (P = .21), and postoperative SPD was 0.7 (2.6) for dominant and 0.9 (2.8) for nondominant (P = .79). SPD did not change from before surgery to after surgery for dominant (P = .14) or nondominant (P = .28) shoulders (Table 2).
Active Sports Participation. Thirty-two patients (53%) reported preoperative involvement in sports; 35 (58%) reported postoperative involvement (P = .37). Mean (SD) preoperative SPD was 1.4 (3.0) for involved patients and 0.3 (1.7) for uninvolved patients (P = .09), and postoperative SPD was 0.6 (2.8) for involved patients and 1.0 (2.6) for uninvolved patients (P = .53). SPD did not change from before surgery to after surgery for involved (P = .17) or uninvolved (P = .26) patients (Table 2).
Occupation Type. There were 9 blue-collar workers (15%), 32 white-collar workers (53%), and 19 retirees (32%). Mean (SD) preoperative SPD was 2.8 (4.2) for blue-collar workers, 1.2 (2.1) for white-collar workers, and –0.4 (0.4) for retirees. There were no significant differences in preoperative SPD between blue-collar and white-collar workers (P = .19) or between white-collar workers and retirees (P = .06), but there was a significant difference between blue-collar workers and retirees (P = .004). Mean (SD) postoperative SPD was 1.3 (2.7) for blue-collar workers, 1.2 (3.1) for white-collar workers, and –0.3 (1.6) for retirees. There were no significant differences between blue-collar and white-collar workers (P = .99), white-collar workers and retirees (P = .13), or blue-collar workers and retirees (P = .3).
Discussion
In this study, we wanted to determine patients’ pre- and postoperative preferences for pain relief and strength return after ARCR. Preoperative and postoperative preference analysis of the 60 patients who underwent ARCR revealed that the majority valued pain relief and strength return equally. However, overall, there was higher ratings for strength return in long term after ARCR, irrespective of age, sex, preoperative levels of shoulder pain and weakness, and preoperative and postoperative sports involvement.
Patients’ preoperative expectations are a function of their assessment of their symptoms, their perceptions of expected surgical outcomes, and their understanding of preoperative discussion with their surgeons. In this study, patients self-assessed their shoulder symptoms and their effect on their occupational and personal life. They also rated the importance of post-ARCR pain relief and strength return relative to each other. To assess whether surgical outcomes affected perceptions of pain relief and strength return, patients completed the questionnaire before and after surgery. Overall, patients rated postoperative strength return over pain relief on long-term (5 years).
Subgroup analysis revealed a weak positive correlation between patient-reported preoperative pain scores and ratings of the importance of pain relief after surgery, but there was no correlation between postoperative pain scores and ratings of the importance of pain relief after surgery. This finding was surprising because we thought pain relief would be more important than strength return for patients with higher pain scores.1-3,16-21 We would like to clarify a point about this study: That patients preferred strength return over pain relief does not mean they did not care about pain relief. A substantial subset of patients (~50%) valued pain relief and strength return equally. In rotator cuff pathology, pain and weakness are to an extent interrelated. Shoulder pain that limits a patient’s ability to perform a strenuous task can be perceived as shoulder weakness, which may explain why, despite having higher pain scores, patients preferred strength return over pain relief. Increasing age showed a positive correlation with preference for pain relief, which explains the finding that retirees preferred pain relief over strength return. We used SPD to express the preference for strength return over pain relief before and after ARCR. Unfortunately, SPD may not be used to quantitatively define the preference for strength return over pain relief.
Patient satisfaction after RCR involves multiple factors and has been well studied. In a retrospective analysis of 112 patients, Tashjian and colleagues10 found that patient satisfaction was affected by preoperative expectations, marital status, disability status, preoperative pain function, and general health status after RCR. They also found a positive but weak correlation between patient satisfaction and functional outcome scores, including visual analog scale (VAS), Simple Shoulder Test (SST), and Disabilities of the Arm, Shoulder, and Hand (DASH) scores. Henn and colleagues11 evaluated 125 patients who underwent primary RCR for a chronic RCT. Higher preoperative expectations correlated with better postoperative VAS, SST, DASH, and Short Form 36 performance, irrespective of worker compensation status, symptom duration, number of patient comorbidities, tear size, repair technique, and number of previous operations. In a prospective cohort analysis of 311 RCR patients, O’Holleran and colleagues12 found that decreased patient satisfaction was associated with postoperative pain and dysfunction. Furthermore, willingness to recommend surgery to another person was significantly related to patient satisfaction. In the present study, we did not correlate preoperative expectations with postoperative outcome scores or evaluate the effect of other known factors on RCR outcomes. Our main goal was to understand ARCR patients’ preoperative and postoperative evaluations of the importance of pain relief and strength return relative to each other. Improved understanding of patients’ expectations will allow us to identify disparities between expectations and outcomes.
Our study had several limitations. First, our questionnaire was not validated. However, we used it only as an assessment tool, to collect data, and do not propose using it to assess ARCR outcomes. Second, objective strength measurements were not performed, before or after surgery, and therefore patients’ perceptions of weakness were not tested. Third, we did not correlate preoperative or postoperative shoulder outcome scores with patients’ expectations. Our intention was to understand how ARCR patients rate the importance of pain relief and strength return relative to each other. Fourth, we did not correlate patients’ expectations of strength return and pain relief with preoperative tear size or postoperative retear status.
Our observational study results showed that, before undergoing ARCR, most patients valued postoperative pain relief and strength return equally. However, there was an overall preference for strength return over pain relief. Furthermore, this preference held up irrespective of age, sex, sports involvement, or preoperative symptom severity. These findings add to our understanding of patients’ preoperative expectations of ARCR.
Am J Orthop. 2017;46(4):E244-E250. Copyright Frontline Medical Communications Inc. 2017. All rights reserved.
1. Cole BJ, McCarty LP 3rd, Kang RW, Alford W, Lewis PB, Hayden JK. Arthroscopic rotator cuff repair: prospective functional outcome and repair integrity at minimum 2-year follow-up. J Shoulder Elbow Surg. 2007;16(5):579-585.
2. Huijsmans PE, Pritchard MP, Berghs BM, van Rooyen KS, Wallace AL, de Beer JF. Arthroscopic rotator cuff repair with double-row fixation. J Bone Joint Surg Am. 2007;89(6):1248-1257.
3. Wilson F, Hinov V, Adams G. Arthroscopic repair of full-thickness tears of the rotator cuff: 2- to 14-year follow-up. Arthroscopy. 2002;18(2):136-144.
4. Denard PJ, Jiwani AZ, Lädermann A, Burkhart SS. Long-term outcome of a consecutive series of subscapularis tendon tears repaired arthroscopically. Arthroscopy. 2012;28(11):1587-1591.
5. Richards RR, An KN, Bigliani LU, et al. A standardized method for the assessment of shoulder function. J Shoulder Elbow Surg. 1994;3(6):347-352.
6. Roach KE, Budiman-Mak E, Songsiridej N, Lertratanakul Y. Development of a shoulder pain and disability index. Arthritis Care Res. 1991;4(4):143-149.
7. Constant CR, Murley AH. A clinical method of functional assessment of the shoulder. Clin Orthop Relat Res. 1987;(214):160-164.
8. Michener LA, McClure PW, Sennett BJ. American Shoulder and Elbow Surgeons Standardized Shoulder Assessment Form, patient self-report section: reliability, validity, and responsiveness. J Shoulder Elbow Surg. 2002;11(6):587-594.
9. Romeo AA, Bach BR Jr, O’Halloran KL. Scoring systems for shoulder conditions. Am J Sports Med. 1996;24(4):472-476.
10. Tashjian RZ, Bradley MP, Tocci S, Rey J, Henn RF, Green A. Factors influencing patient satisfaction after rotator cuff repair. J Shoulder Elbow Surg. 2007;16(6):752-758.
11. Henn RF 3rd, Kang L, Tashjian RZ, Green A. Patients’ preoperative expectations predict the outcome of rotator cuff repair. J Bone Joint Surg Am. 2007;89(9):1913-1919.
12. O’Holleran JD, Kocher MS, Horan MP, Briggs KK, Hawkins RJ. Determinants of patient satisfaction with outcome after rotator cuff surgery. J Bone Joint Surg Am. 2005;87(1):121-126.
13. Namdari S, Donegan RP, Chamberlain AM, Galatz LM, Yamaguchi K, Keener JD. Factors affecting outcome after structural failure of repaired rotator cuff tears. J Bone Joint Surg Am. 2014;96(2):99-105.
14. Nho SJ, Brown BS, Lyman S, Adler RS, Altchek DW, MacGillivray JD. Prospective analysis of arthroscopic rotator cuff repair: prognostic factors affecting clinical and ultrasound outcome. J Shoulder Elbow Surg. 2009;18(1):13-20.
15. Sonnabend DH, Watson EM. Structural factors affecting the outcome of rotator cuff repair. J Shoulder Elbow Surg. 2002;11(3):212-218.
16. Boileau P, Brassart N, Watkinson DJ, Carles M, Hatzidakis AM, Krishnan SG. Arthroscopic repair of full-thickness tears of the supraspinatus: does the tendon really heal? J Bone Joint Surg Am. 2005;87(6):1229-1240.
17. Sugaya H, Maeda K, Matsuki K, Moriishi J. Repair integrity and functional outcome after arthroscopic double-row rotator cuff repair. A prospective outcome study. J Bone Joint Surg Am. 2007;89(5):953-960.
18. DeFranco MJ, Bershadsky B, Ciccone J, Yum JK, Iannotti JP. Functional outcome of arthroscopic rotator cuff repairs: a correlation of anatomic and clinical results. J Shoulder Elbow Surg. 2007;16(6):759-765.
19. Galatz LM, Ball CM, Teefey SA, Middleton WD, Yamaguchi K. The outcome and repair integrity of completely arthroscopically repaired large and massive rotator cuff tears. J Bone Joint Surg Am. 2004;86(2):219-224.
20. Harryman DT 2nd, Mack LA, Wang KY, Jackins SE, Richardson ML, Matsen FA 3rd. Repairs of the rotator cuff. Correlation of functional results with integrity of the cuff. J Bone Joint Surg Am. 1991;73(7):982-989.
21. Romeo AA, Hang DW, Bach BR Jr, Shott S. Repair of full thickness rotator cuff tears. Gender, age, and other factors affecting outcome. Clin Orthop Relat Res. 1999;(367):243-255.
Comparison of Anterior and Posterior Corticosteroid Injections for Pain Relief and Functional Improvement in Shoulder Impingement Syndrome
Take-Home Points
When conservative treatments for SIS do not resolve symptoms, inflammation and pain can be reduced with use of subacromial CSI.
Both anterior CSI and posterior CSI significantly improved pain and function for up to 6 months
CSI combined with structured PT produced significant improvement in pain and function in patients with SIS, regardless of injection route used.
Clinical response to CSI may not depend on injection accuracy.
Clinicians should rely on their clinical acumen when selecting injection routes, as anterior and posterior are both beneficial.
Shoulder pain, a common clinical problem, occurs in 7% to 34% of the general population and in 21% of people older than 70 years.1Subacromial impingement refers to shoulder pain resulting from mechanical impingement of the rotator cuff underneath the coracoacromial arch between the acromion and the humeral head.2,3 Subacromial impingement syndrome (SIS) is the most common cause of shoulder pain, resulting in significant functional deficits and disability.3
Treatment options for SIS include conservative modalities such as use of nonsteroidal anti-inflammatory drugs, physical therapy (PT), and subacromial corticosteroid injections (CSIs). Studies have found short- and long-term improvement in pain, function, and range of motion after CSI.4-8 Subacromial CSI can be administered through an anterior or a posterior route.4,9 There have been several studies of the accuracy of anterior and posterior CSIs,10-12 with 2 studies finding similar accuracy for these routes.10,11 However, there may be a sex difference: In women, a posterior route may be less accurate than an anterior or a lateral route.12
Although the accuracy of anterior and posterior routes has been studied, their effect on clinical outcomes has not. We conducted a study to understand the effects of anterior and posterior CSIs on SIS. As one of the accuracy studies suggested anterior CSI is more accurate—the anterior route was theorized to provide easier access to the subacromial space12—we hypothesized patients treated with anterior CSI would have superior clinical outcomes 6 months after injection.12,13
Materials and Methods
Study Participants and Randomization
After this study received Institutional Review Board approval, patients with shoulder pain of more than 3 months’ duration and consistent with SIS were screened for inclusion. Eligible patients had pain in the anterior biceps and over the top of the shoulder with overhead activities as well as one or more clinical findings on physical examination: Hawkins-Kennedy sign, Neer sign, painful arc, and infraspinatus pain (pain with external rotation).
Patients were excluded if their history included prior subacromial CSI, adhesive capsulitis (inability to passively abduct shoulder to 90° with scapular stabilization), calcific tendonitis, radiographic evidence of os acromiale, cervical radiculopathy, Spurling sign, neck pain, radiating arm pain or numbness, sensory deficits, or neck and upper extremity motor dysfunction. Also excluded were patients with full-thickness rotator cuff tear, weakness on arm elevation, positive "drop arm sign," or high-riding humerus on standing shoulder radiograph. Patients who had work-related injuries or who were involved in worker compensation were excluded as well.
Enrolled patients were randomly assigned (with use of a computer-based random number generator) to receive either anterior CSI or posterior CSI.
Injection Procedures
All patients were administered 5 mL of lidocaine 1% (without epinephrine) and 2 mL (80 mg) of triamcinolone by 2 board-certified orthopedic surgeons using a 22-gauge 1½-inch needle. For patients who received their subacromial CSI by the anterior route, the arm was held in 0° of abduction and 20° of external rotation. The needle was inserted medial to the humeral head, lateral to the coracoid process, beginning 1 cm inferior to the clavicle with the needle directed posteriorly and laterally toward the acromion.10 For patients who received their CSI by the posterior route, the arm was held in 0° of abduction, the posterolateral corner of the acromion was identified by palpation, and the needle was inserted 1 cm inferior and medial to this point with the needle directed anteriorly and laterally toward the acromion.10,12 In both groups, the subacromial space was identified when a drop in pressure was felt during needle insertion. Accuracy was assessed post hoc by asking patients to grade their response to the injection on a visual analog scale (VAS); VAS score was used as a surrogate for improvement. All patients had a positive Neer test: Pain decreased with impingement maneuvers immediately after injection.
All patients were referred for PT provided according to an evidence-based rehabilitation protocol.14 This program emphasized range of motion with shoulder shrugs, scapular retraction, and pendulum exercises; flexibility with stretching exercises targeting the anterior and posterior aspects of the shoulder and cane stretching for forward elevation and external rotation; and strength with strengthening exercises involving the rotator cuff and scapular stabilizers.
Outcome Measures
Pain was measured with VAS scores and function with Single Assessment Numeric Evaluation (SANE) scores. The VAS is a validated outcome measure of pain intensity. A numeric version of the VAS was used: Patients selected the whole number, from 0 (no pain) to 10 (worst possible pain), that best reflected their pain intensity. On SANE, another validated outcome measure, patients rated their shoulder function as a percentage of normal, from 0% (no function possible) to 100% (perfect).15 Before injection, all patients were administered the VAS and SANE questionnaires to establish their baseline pain level and opinion of shoulder function. These measures were repeated 1, 3, and 6 months after injection. Telephone interviews were conducted at 1 month and 6 months. Patients were asked to return to clinic 3 months after injection as part of the standard of care. At 3 months, 47 (86%) of the 55 patients returned for follow-up and were administered the VAS and SANE questionnaires; the other 8 completed the questionnaires by telephone. At each time point, patients were asked to report on their participation in PT and/or adherence to their home exercise program.
Statistical Analysis
Power analysis performed with Student t test and a 2-sided level of P = .05 compared VAS pain scores between the anterior and posterior injection routes and found a mean (SD) difference of 1.4 (1.7).16 Power calculations made with nQuery Advisor Version 7.0 (Statistical Solutions) indicated a total sample size of 60 patients (30/group) would provide 80% power for detecting a significant difference assuming a 20% dropout rate.
Two-way mixed-model analysis of variance (ANOVA) was used to compare the anterior and posterior routes for statistical differences in both VAS pain scores and SANE function scores at baseline and 1, 3, and 6 months after injection. Likewise, time at baseline (just before injection)was compared with follow-up (1, 3, 6 months) with 2-way mixed-model ANOVA adjusting for anterior or posterior route. Multivariate analysis was performed to evaluate differences between baseline and 6-month follow-up with respect to anterior and posterior injection routes, controlling for age, sex, and body mass index (BMI) for VAS and SANE scores. Parametric testing methods were used for statistical analysis, which was performed with IBM SPSS Statistics Version 21.0 (IBM Corp). Significance was set at P < .05.
Results
Patient Characteristics
Of the 55 patients enrolled, 25 (46%) received anterior subacromial CSI and 30 (54%) received posterior CSI. All enrolled patients had a positive Neer impingement test immediately after injection. Mean (SD) age was 48 (9.3) years for anterior group patients and 48 (9.0) years for posterior group patients. There was no significant difference in age or BMI between the 2 groups (Table). 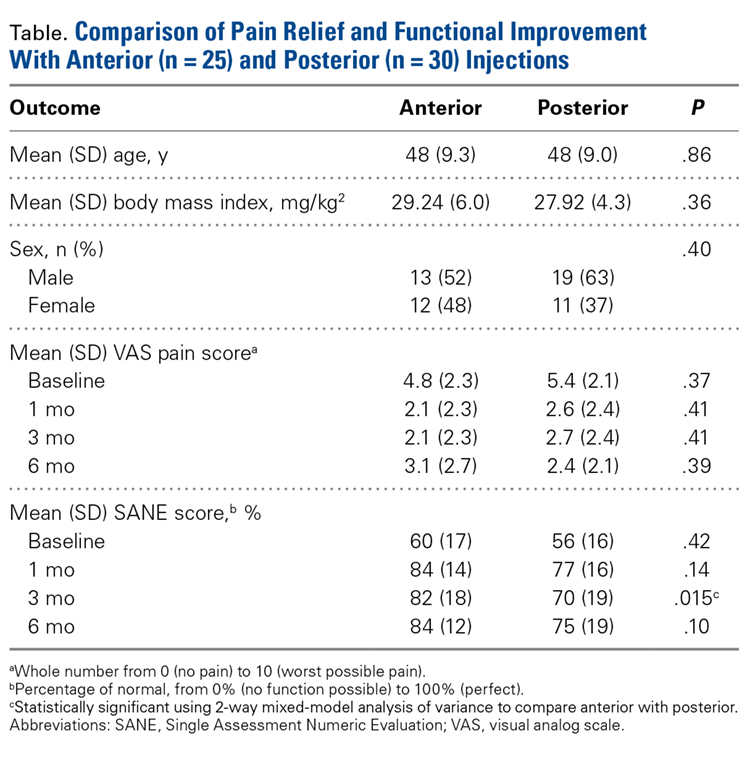
Five patients (9%) were excluded from the study after randomization and CSI: 2 for a full-thickness rotator cuff tear, 1 for a Bankart lesion, 1 for adhesive capsulitis, and 1 for a worker compensation claim.
One month after injection, 41 patients (75%) reported having engaged in PT as prescribed. Of the 47 patients (86%) who returned for the 3-month follow-up, 25 (46%) reported having engaged in PT between 1 month and 3 months after injection. Fourteen patients (26%) reported attending PT between 3 and 6 months post-injection.
Outcome Measures
Two-way repeated-measures ANOVA with age, sex, and BMI included as covariates revealed no significant differences in VAS scores between the anterior and posterior groups at any time point (P = .45). Both groups had highly significant pain reductions (anterior, F = 9.71, P < .001; posterior, F = 13.46, P < .001). Figure 1 shows mean VAS scores and significant reductions in pain 1, 3, and 6 months after injection (see asterisks for anterior and posterior groups; P < .001 for all). The groups had parallel rates of pain reduction over time, as indicated by a nonsignificant (P = .50) difference in slopes. These pain score reductions were significant for both injection routes and were independent of age, sex, and BMI (P > .05 for all).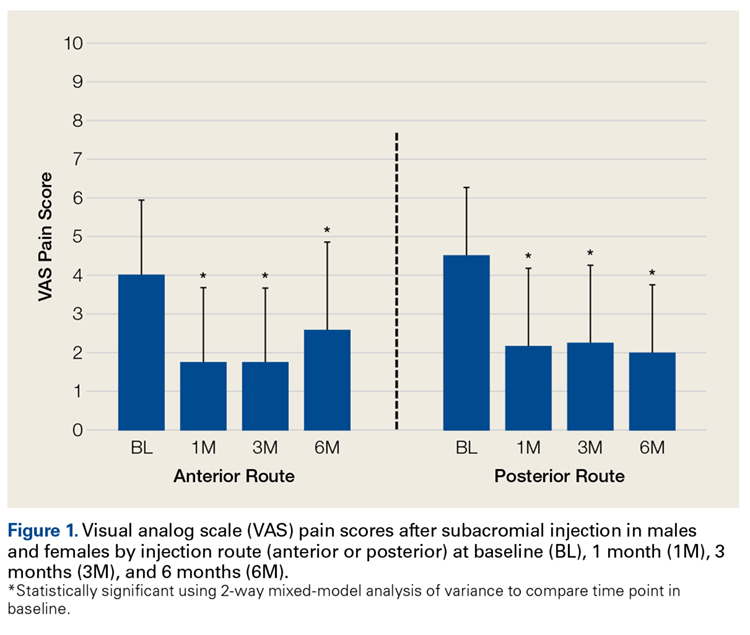
Two-way repeated-measures ANOVA with age, sex, and BMI included as covariates revealed no significant differences in SANE scores between the anterior and posterior groups, except for a higher mean score in the anterior group at 3 months
(P = .02). There were no other group differences (P > .10 for all). Both groups had highly significant improvements in function (anterior, F = 17.34,
P < .001; posterior, F = 13.57, P < .001). Figure 2 shows mean SANE scores and significant improvement at 1, 3, and 6 months (see asterisks for anterior and posterior groups; P < .001 for all). The groups had parallel rates of improved function over time, as indicated by a nonsignificant (P = .51) difference in slopes. These function score improvements were significant for both injection routes and were independent of age, sex, and BMI (P > .05 for all).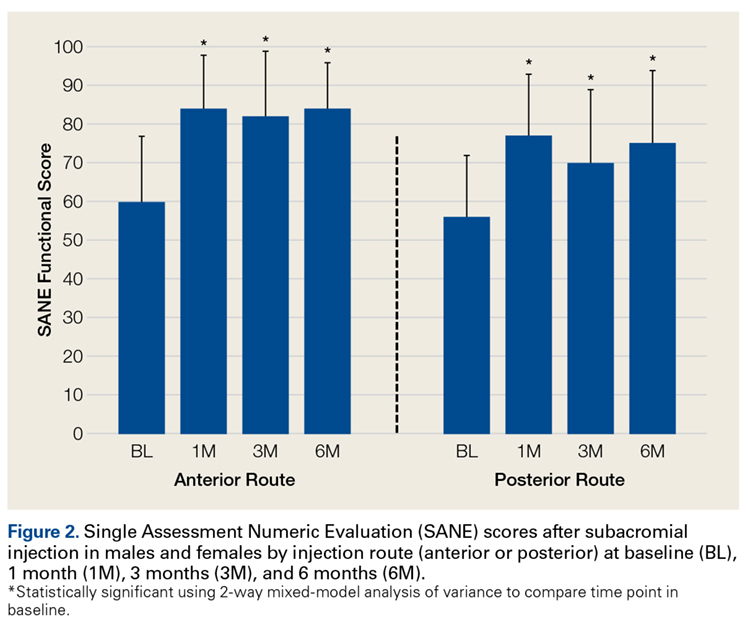
From the results of this prospective randomized study, we concluded subacromial CSI significantly reduces pain and improves function regardless of route used. In addition, age, sex, and BMI do not significantly affect the efficacy of either anterior CSI or posterior CSI.
Discussion
In patients with SIS, anterior CSI and posterior CSI provided significant improvements in pain and function 1, 3, and 6 months after injection. These effects were independent of age, sex, BMI, and PT participation. There were no significant differences in outcomes between injection routes.
When conservative treatments for SIS do not resolve symptoms, inflammation and pain can be reduced with use of subacromial CSI.4-8 Although clinical outcomes are inconsistent, CSI can be used to address SIS symptoms in appropriate patients. Specifically, Blair and colleagues6 found that, CSI consisting of 4 mL of lidocaine 1% (without epinephrine) and 2 mL (80 mg) of triamcinolone was effective in alleviating shoulder pain and improving shoulder range of motion. Other authors have similarly reported improved outcomes after subacromial injection and short-term follow-up with PT.4,7,8 Our findings are consistent with these reports: CSI coupled with a structured rehabilitation program is effective in alleviating symptoms associated with acute or subacute SIS.
Numerous studies have found improved clinical outcomes after anterior CSI and after posterior CSI,6-8 but no study has directly compared the clinical impact of anterior CSI with that of posterior CSI—which suggests injection route may not affect ultimate clinical outcomes.
CSI accuracy has been studied extensively.10-12,17-20 Although 2 studies found similar accuracy for anterior and posterior routes,10,11 there may be a sex difference: In women, a posterior route may be less accurate than an anterior or a lateral route.12 Collectively, these studies expose the inherent difficulty in treating shoulder pain with localized subacromial injection. Therapy may fail because of errant needle positioning. Two prospective studies found improved clinical outcomes with successful delivery of medication into the subacromial space.17,18 Poor clinical outcomes may result from inaccurate CSI.
In contrast to other clinical studies, our study found that injection route was not associated with differences in clinical response. In a prospective randomized clinical trial in which 75 patients received a subacromial injection, Marder and colleagues12 found anterior routes 84% accurate and posterior routes 56% accurate; they concluded acromion anatomy and subacromial bursa anatomy make posterior injections more difficult. As theorized by Gruson and colleagues,13 with use of an anterior route, the needle enters inferior to the concavity of the acromion and provides easier access to the subacromial space. This idea is in line with Marder and colleagues’12 conclusion that subacromial bursa anatomy provides a favorable environment for accurate CSI.
If accuracy is positively correlated with clinical improvement and anterior routes are more accurate, there should be a difference in response to posterior injections. Our results provide evidence that clinical response to CSI may not depend on injection accuracy. Perhaps merely placing the corticosteroid near the bursa is adequate for improving symptoms or perhaps some of the clinical improvement is due to the systemic effect of corticosteroids. These possibilities require further analysis.
Establishing the efficacy of CSI in SIS is difficult. The literature includes various study designs, different CSI indications and medication formulations, and varying emphasis on the role of organized PT. Rehabilitation has been found to alleviate joint pain by reducing inflammation,14 but data do not universally support this finding.21,22 Nevertheless, use of PT might explain the divergence in clinical outcomes reported by Marder and colleagues,12 who found anterior CSI more accurate than posterior CSI. In our practice, PT is recommended for all SIS patients, not only those who have CSI. Thus, our findings are framed within the context of successful CSI but may include patients who improved with PT alone. This issue raises the question of whether subacromial CSI should be guided by ultrasound. Ultrasound guidance can improve CSI accuracy and clinical outcomes,23-25 though the value of this benefit is debated.26
This study had several limitations. First, pain relief was patient reported. Second, the treatment plan involved CSI with PT but did not control for CSI used alone. PT, which is part of the standard of care for patients with SIS, added another degree of complexity to the study. Third, there may have been some variability in SIS severity (stage 1, 2, or 3). Fourth, although the study design controlled for various shoulder pathologies, advanced imaging, which could have provided diagnosis confirmation, was not available for all patients. Therefore, concurrent conditions may have confounded results. However, randomization was used to try to minimize this effect. Fifth, although injection routes were randomly assigned, the trial was not blinded. Sixth, the study was underpowered by 1 patient, as there was an estimated 20% dropout rate over 3 and 6 months of follow-up. However, we do not think our results were significantly affected.
Although more research is needed to fully describe the role of subacromial CSI in SIS, our study findings suggested that CSI using either an anterior or a posterior route creates a window of symptomatic relief in which patients may be able to engage in PT.
Conclusion
Both anterior CSI and posterior CSI significantly improved pain and function for up to 6 months. No differences were found between anterior and posterior CSIs. In the context of this study, CSI combined with structured PT produced significant improvement in pain and function in patients with SIS, regardless of injection route used. Clinicians should rely on their clinical acumen when selecting injection routes, as anterior and posterior are both beneficial.
1. Buchbinder R, Green S, Youd JM. Corticosteroid injections for shoulder pain. Cochrane Database Syst Rev. 2003;(1):CD004016.
2. Bell AD, Conaway D. Corticosteroid injections for painful shoulders. Int J Clin Pract. 2005;59(10):1178-1186.
3. Michener LA, McClure PW, Karduna AR. Anatomical and biomechanical mechanisms of subacromial impingement syndrome. Clin Biomech. 2003;18(5):369-379.
4. Akgün K, Birtane M, Akarirmak U. Is local subacromial corticosteroid injection beneficial in subacromial impingement syndrome? Clin Rheumatol. 2004;23(6):496-500.
5. Bhagra A, Syed H, Reed DA, et al. Efficacy of musculoskeletal injections by primary care providers in the office: a retrospective cohort study. Int J Gen Med. 2013;6:237-243.
6. Blair B, Rokito AS, Cuomo F, Jarolem K, Zuckerman JD. Efficacy of injections of corticosteroids for subacromial impingement syndrome. J Bone Joint Surg Am. 1996;78(11):1685-1689.
7. Cummins CA, Sasso LM, Nicholson D. Impingement syndrome: temporal outcomes of nonoperative treatment.
J Shoulder Elbow Surg. 2009;18(2):172-177.
8. Yu C, Chen CH, Liu HT, Dai MH, Wang IC, Wang KC. Subacromial injections of corticosteroids and Xylocaine for painful subacromial impingement syndrome. Chang Gung Med J. 2006;29(5):474-478.
9. Codsi MJ. The painful shoulder: when to inject and when to refer. Cleve Clin J Med. 2007;74(7):473-474, 477-478, 480-482 passim.
10. Henkus HE, Cobben LP, Coerkamp EG, Nelissen RG, van Arkel ER. The accuracy of subacromial injections: a prospective randomized magnetic resonance imaging study. Arthroscopy. 2006;22(3):277-282.
11. Kang MN, Rizio L, Prybicien M, Middlemas DA, Blacksin MF. The accuracy of subacromial corticosteroid injections: a comparison of multiple methods. J Shoulder Elbow Surg. 2008;17(15):61S-66S.
12. Marder RA, Kim SH, Labson JD, Hunter JC. Injection of the subacromial bursa in patients with rotator cuff syndrome: a prospective, randomized study comparing the effectiveness of different routes. J Bone Joint Surg Am. 2012;94(16):
1442-1447.
13. Gruson, KI, Ruchelsman DE, Zuckerman JD. Subacromial corticosteroid injections. J Shoulder Elbow Surg. 2008;17(1 suppl):118S-130S.
14. Kuhn JE. Exercise in the treatment of rotator cuff impingement: a systematic review and a synthesized evidence-based rehabilitation protocol. J Shoulder Elbow Surg. 2009;18(1):138-160.
15. Williams GN, Gangel TJ, Arciero RA, Uhorchak JM, Taylor DC. Comparison of the Single Assessment Numeric Evaluation method and two shoulder rating scales. Outcomes measures after shoulder surgery. Am J Sports Med. 1999;27(2):214-221.
16. Tashjian RZ, Deloach J, Porucznik CA, Powell AP. Minimal clinically important differences (MCID) and patient acceptable symptomatic state (PASS) for visual analog scales (VAS) measuring pain in patients treated for rotator cuff disease.
J Shoulder Elbow Surg. 2009;88(6):927-932.
17. Eustace JA, Brophy DP, Gibney RP, Bresnihan B, FitzGerald O. Comparison of the accuracy of steroid placement with clinical outcome in patients with shoulder symptoms. Ann Rheum Dis. 1997;56(1):59-63.
18. Esenyel CZ, Esenyel M, Yeiltepe R, et al. The correlation between the accuracy of steroid injections and subsequent shoulder pain and function in subacromial impingement
syndrome [in Turkish]. Acta Orthop Traumatol Turc. 2003;37(1):
41-45.
19. Powell SE, Davis SM, Lee EH, et al. Accuracy of palpation-directed intra-articular glenohumeral injection confirmed by magnetic resonance arthrography. Arthroscopy. 2015;31(2):205-208.
20. Rutten MJ, Maresch BJ, Jager GJ, de Waal Malefijt MC. Injection of the subacromial-subdeltoid bursa: blind or ultrasound-guided? Acta Orthop. 2007;78(2):254-257.
21. Desmeules F, Côté CH, Frémont P. Therapeutic exercise and orthopedic manual therapy for impingement syndrome: a systematic review. Clin J Sport Med. 2003;13(3):176-182.
22. Winters JC, Sobel JS, Groenier KH, Arendzen HJ, Meyboom-de Jong B. Comparison of physiotherapy, manipulation, and corticosteroid injection for treating shoulder complaints in general practice: randomised, single blind study. BMJ. 1997;314(7090):1320-1325.
23. Chen MJ, Lew HL, Hsu TC, et al. Ultrasound-guided shoulder injections in the treatment of subacromial bursitis. Am J Phys Med Rehabil. 2006;85(1):31-35.
24. Hsieh LF, Hsu WC, Lin YJ, Wu SH, Chang KC, Chang HL. Is ultrasound-guided injection more effective in chronic subacromial bursitis? Med Sci Sports Exerc. 2013;45(12):
2205-2213.
25. Naredo E, Cabero F, Beneyto P, et al. A randomized comparative study of short term response to blind injection versus sonographic-guided injection of local corticosteroids in patients with painful shoulder. J Rheumatol. 2004;31(2):308-314.
26. Hall S, Buchbinder R. Do imaging methods that guide needle placement improve outcome? Ann Rheum Dis. 2004;63(9):1007-1008.
Take-Home Points
When conservative treatments for SIS do not resolve symptoms, inflammation and pain can be reduced with use of subacromial CSI.
Both anterior CSI and posterior CSI significantly improved pain and function for up to 6 months
CSI combined with structured PT produced significant improvement in pain and function in patients with SIS, regardless of injection route used.
Clinical response to CSI may not depend on injection accuracy.
Clinicians should rely on their clinical acumen when selecting injection routes, as anterior and posterior are both beneficial.
Shoulder pain, a common clinical problem, occurs in 7% to 34% of the general population and in 21% of people older than 70 years.1Subacromial impingement refers to shoulder pain resulting from mechanical impingement of the rotator cuff underneath the coracoacromial arch between the acromion and the humeral head.2,3 Subacromial impingement syndrome (SIS) is the most common cause of shoulder pain, resulting in significant functional deficits and disability.3
Treatment options for SIS include conservative modalities such as use of nonsteroidal anti-inflammatory drugs, physical therapy (PT), and subacromial corticosteroid injections (CSIs). Studies have found short- and long-term improvement in pain, function, and range of motion after CSI.4-8 Subacromial CSI can be administered through an anterior or a posterior route.4,9 There have been several studies of the accuracy of anterior and posterior CSIs,10-12 with 2 studies finding similar accuracy for these routes.10,11 However, there may be a sex difference: In women, a posterior route may be less accurate than an anterior or a lateral route.12
Although the accuracy of anterior and posterior routes has been studied, their effect on clinical outcomes has not. We conducted a study to understand the effects of anterior and posterior CSIs on SIS. As one of the accuracy studies suggested anterior CSI is more accurate—the anterior route was theorized to provide easier access to the subacromial space12—we hypothesized patients treated with anterior CSI would have superior clinical outcomes 6 months after injection.12,13
Materials and Methods
Study Participants and Randomization
After this study received Institutional Review Board approval, patients with shoulder pain of more than 3 months’ duration and consistent with SIS were screened for inclusion. Eligible patients had pain in the anterior biceps and over the top of the shoulder with overhead activities as well as one or more clinical findings on physical examination: Hawkins-Kennedy sign, Neer sign, painful arc, and infraspinatus pain (pain with external rotation).
Patients were excluded if their history included prior subacromial CSI, adhesive capsulitis (inability to passively abduct shoulder to 90° with scapular stabilization), calcific tendonitis, radiographic evidence of os acromiale, cervical radiculopathy, Spurling sign, neck pain, radiating arm pain or numbness, sensory deficits, or neck and upper extremity motor dysfunction. Also excluded were patients with full-thickness rotator cuff tear, weakness on arm elevation, positive "drop arm sign," or high-riding humerus on standing shoulder radiograph. Patients who had work-related injuries or who were involved in worker compensation were excluded as well.
Enrolled patients were randomly assigned (with use of a computer-based random number generator) to receive either anterior CSI or posterior CSI.
Injection Procedures
All patients were administered 5 mL of lidocaine 1% (without epinephrine) and 2 mL (80 mg) of triamcinolone by 2 board-certified orthopedic surgeons using a 22-gauge 1½-inch needle. For patients who received their subacromial CSI by the anterior route, the arm was held in 0° of abduction and 20° of external rotation. The needle was inserted medial to the humeral head, lateral to the coracoid process, beginning 1 cm inferior to the clavicle with the needle directed posteriorly and laterally toward the acromion.10 For patients who received their CSI by the posterior route, the arm was held in 0° of abduction, the posterolateral corner of the acromion was identified by palpation, and the needle was inserted 1 cm inferior and medial to this point with the needle directed anteriorly and laterally toward the acromion.10,12 In both groups, the subacromial space was identified when a drop in pressure was felt during needle insertion. Accuracy was assessed post hoc by asking patients to grade their response to the injection on a visual analog scale (VAS); VAS score was used as a surrogate for improvement. All patients had a positive Neer test: Pain decreased with impingement maneuvers immediately after injection.
All patients were referred for PT provided according to an evidence-based rehabilitation protocol.14 This program emphasized range of motion with shoulder shrugs, scapular retraction, and pendulum exercises; flexibility with stretching exercises targeting the anterior and posterior aspects of the shoulder and cane stretching for forward elevation and external rotation; and strength with strengthening exercises involving the rotator cuff and scapular stabilizers.
Outcome Measures
Pain was measured with VAS scores and function with Single Assessment Numeric Evaluation (SANE) scores. The VAS is a validated outcome measure of pain intensity. A numeric version of the VAS was used: Patients selected the whole number, from 0 (no pain) to 10 (worst possible pain), that best reflected their pain intensity. On SANE, another validated outcome measure, patients rated their shoulder function as a percentage of normal, from 0% (no function possible) to 100% (perfect).15 Before injection, all patients were administered the VAS and SANE questionnaires to establish their baseline pain level and opinion of shoulder function. These measures were repeated 1, 3, and 6 months after injection. Telephone interviews were conducted at 1 month and 6 months. Patients were asked to return to clinic 3 months after injection as part of the standard of care. At 3 months, 47 (86%) of the 55 patients returned for follow-up and were administered the VAS and SANE questionnaires; the other 8 completed the questionnaires by telephone. At each time point, patients were asked to report on their participation in PT and/or adherence to their home exercise program.
Statistical Analysis
Power analysis performed with Student t test and a 2-sided level of P = .05 compared VAS pain scores between the anterior and posterior injection routes and found a mean (SD) difference of 1.4 (1.7).16 Power calculations made with nQuery Advisor Version 7.0 (Statistical Solutions) indicated a total sample size of 60 patients (30/group) would provide 80% power for detecting a significant difference assuming a 20% dropout rate.
Two-way mixed-model analysis of variance (ANOVA) was used to compare the anterior and posterior routes for statistical differences in both VAS pain scores and SANE function scores at baseline and 1, 3, and 6 months after injection. Likewise, time at baseline (just before injection)was compared with follow-up (1, 3, 6 months) with 2-way mixed-model ANOVA adjusting for anterior or posterior route. Multivariate analysis was performed to evaluate differences between baseline and 6-month follow-up with respect to anterior and posterior injection routes, controlling for age, sex, and body mass index (BMI) for VAS and SANE scores. Parametric testing methods were used for statistical analysis, which was performed with IBM SPSS Statistics Version 21.0 (IBM Corp). Significance was set at P < .05.
Results
Patient Characteristics
Of the 55 patients enrolled, 25 (46%) received anterior subacromial CSI and 30 (54%) received posterior CSI. All enrolled patients had a positive Neer impingement test immediately after injection. Mean (SD) age was 48 (9.3) years for anterior group patients and 48 (9.0) years for posterior group patients. There was no significant difference in age or BMI between the 2 groups (Table).
Five patients (9%) were excluded from the study after randomization and CSI: 2 for a full-thickness rotator cuff tear, 1 for a Bankart lesion, 1 for adhesive capsulitis, and 1 for a worker compensation claim.
One month after injection, 41 patients (75%) reported having engaged in PT as prescribed. Of the 47 patients (86%) who returned for the 3-month follow-up, 25 (46%) reported having engaged in PT between 1 month and 3 months after injection. Fourteen patients (26%) reported attending PT between 3 and 6 months post-injection.
Outcome Measures
Two-way repeated-measures ANOVA with age, sex, and BMI included as covariates revealed no significant differences in VAS scores between the anterior and posterior groups at any time point (P = .45). Both groups had highly significant pain reductions (anterior, F = 9.71, P < .001; posterior, F = 13.46, P < .001). Figure 1 shows mean VAS scores and significant reductions in pain 1, 3, and 6 months after injection (see asterisks for anterior and posterior groups; P < .001 for all). The groups had parallel rates of pain reduction over time, as indicated by a nonsignificant (P = .50) difference in slopes. These pain score reductions were significant for both injection routes and were independent of age, sex, and BMI (P > .05 for all).
Two-way repeated-measures ANOVA with age, sex, and BMI included as covariates revealed no significant differences in SANE scores between the anterior and posterior groups, except for a higher mean score in the anterior group at 3 months
(P = .02). There were no other group differences (P > .10 for all). Both groups had highly significant improvements in function (anterior, F = 17.34,
P < .001; posterior, F = 13.57, P < .001). Figure 2 shows mean SANE scores and significant improvement at 1, 3, and 6 months (see asterisks for anterior and posterior groups; P < .001 for all). The groups had parallel rates of improved function over time, as indicated by a nonsignificant (P = .51) difference in slopes. These function score improvements were significant for both injection routes and were independent of age, sex, and BMI (P > .05 for all).
From the results of this prospective randomized study, we concluded subacromial CSI significantly reduces pain and improves function regardless of route used. In addition, age, sex, and BMI do not significantly affect the efficacy of either anterior CSI or posterior CSI.
Discussion
In patients with SIS, anterior CSI and posterior CSI provided significant improvements in pain and function 1, 3, and 6 months after injection. These effects were independent of age, sex, BMI, and PT participation. There were no significant differences in outcomes between injection routes.
When conservative treatments for SIS do not resolve symptoms, inflammation and pain can be reduced with use of subacromial CSI.4-8 Although clinical outcomes are inconsistent, CSI can be used to address SIS symptoms in appropriate patients. Specifically, Blair and colleagues6 found that, CSI consisting of 4 mL of lidocaine 1% (without epinephrine) and 2 mL (80 mg) of triamcinolone was effective in alleviating shoulder pain and improving shoulder range of motion. Other authors have similarly reported improved outcomes after subacromial injection and short-term follow-up with PT.4,7,8 Our findings are consistent with these reports: CSI coupled with a structured rehabilitation program is effective in alleviating symptoms associated with acute or subacute SIS.
Numerous studies have found improved clinical outcomes after anterior CSI and after posterior CSI,6-8 but no study has directly compared the clinical impact of anterior CSI with that of posterior CSI—which suggests injection route may not affect ultimate clinical outcomes.
CSI accuracy has been studied extensively.10-12,17-20 Although 2 studies found similar accuracy for anterior and posterior routes,10,11 there may be a sex difference: In women, a posterior route may be less accurate than an anterior or a lateral route.12 Collectively, these studies expose the inherent difficulty in treating shoulder pain with localized subacromial injection. Therapy may fail because of errant needle positioning. Two prospective studies found improved clinical outcomes with successful delivery of medication into the subacromial space.17,18 Poor clinical outcomes may result from inaccurate CSI.
In contrast to other clinical studies, our study found that injection route was not associated with differences in clinical response. In a prospective randomized clinical trial in which 75 patients received a subacromial injection, Marder and colleagues12 found anterior routes 84% accurate and posterior routes 56% accurate; they concluded acromion anatomy and subacromial bursa anatomy make posterior injections more difficult. As theorized by Gruson and colleagues,13 with use of an anterior route, the needle enters inferior to the concavity of the acromion and provides easier access to the subacromial space. This idea is in line with Marder and colleagues’12 conclusion that subacromial bursa anatomy provides a favorable environment for accurate CSI.
If accuracy is positively correlated with clinical improvement and anterior routes are more accurate, there should be a difference in response to posterior injections. Our results provide evidence that clinical response to CSI may not depend on injection accuracy. Perhaps merely placing the corticosteroid near the bursa is adequate for improving symptoms or perhaps some of the clinical improvement is due to the systemic effect of corticosteroids. These possibilities require further analysis.
Establishing the efficacy of CSI in SIS is difficult. The literature includes various study designs, different CSI indications and medication formulations, and varying emphasis on the role of organized PT. Rehabilitation has been found to alleviate joint pain by reducing inflammation,14 but data do not universally support this finding.21,22 Nevertheless, use of PT might explain the divergence in clinical outcomes reported by Marder and colleagues,12 who found anterior CSI more accurate than posterior CSI. In our practice, PT is recommended for all SIS patients, not only those who have CSI. Thus, our findings are framed within the context of successful CSI but may include patients who improved with PT alone. This issue raises the question of whether subacromial CSI should be guided by ultrasound. Ultrasound guidance can improve CSI accuracy and clinical outcomes,23-25 though the value of this benefit is debated.26
This study had several limitations. First, pain relief was patient reported. Second, the treatment plan involved CSI with PT but did not control for CSI used alone. PT, which is part of the standard of care for patients with SIS, added another degree of complexity to the study. Third, there may have been some variability in SIS severity (stage 1, 2, or 3). Fourth, although the study design controlled for various shoulder pathologies, advanced imaging, which could have provided diagnosis confirmation, was not available for all patients. Therefore, concurrent conditions may have confounded results. However, randomization was used to try to minimize this effect. Fifth, although injection routes were randomly assigned, the trial was not blinded. Sixth, the study was underpowered by 1 patient, as there was an estimated 20% dropout rate over 3 and 6 months of follow-up. However, we do not think our results were significantly affected.
Although more research is needed to fully describe the role of subacromial CSI in SIS, our study findings suggested that CSI using either an anterior or a posterior route creates a window of symptomatic relief in which patients may be able to engage in PT.
Conclusion
Both anterior CSI and posterior CSI significantly improved pain and function for up to 6 months. No differences were found between anterior and posterior CSIs. In the context of this study, CSI combined with structured PT produced significant improvement in pain and function in patients with SIS, regardless of injection route used. Clinicians should rely on their clinical acumen when selecting injection routes, as anterior and posterior are both beneficial.
1. Buchbinder R, Green S, Youd JM. Corticosteroid injections for shoulder pain. Cochrane Database Syst Rev. 2003;(1):CD004016.
2. Bell AD, Conaway D. Corticosteroid injections for painful shoulders. Int J Clin Pract. 2005;59(10):1178-1186.
3. Michener LA, McClure PW, Karduna AR. Anatomical and biomechanical mechanisms of subacromial impingement syndrome. Clin Biomech. 2003;18(5):369-379.
4. Akgün K, Birtane M, Akarirmak U. Is local subacromial corticosteroid injection beneficial in subacromial impingement syndrome? Clin Rheumatol. 2004;23(6):496-500.
5. Bhagra A, Syed H, Reed DA, et al. Efficacy of musculoskeletal injections by primary care providers in the office: a retrospective cohort study. Int J Gen Med. 2013;6:237-243.
6. Blair B, Rokito AS, Cuomo F, Jarolem K, Zuckerman JD. Efficacy of injections of corticosteroids for subacromial impingement syndrome. J Bone Joint Surg Am. 1996;78(11):1685-1689.
7. Cummins CA, Sasso LM, Nicholson D. Impingement syndrome: temporal outcomes of nonoperative treatment.
J Shoulder Elbow Surg. 2009;18(2):172-177.
8. Yu C, Chen CH, Liu HT, Dai MH, Wang IC, Wang KC. Subacromial injections of corticosteroids and Xylocaine for painful subacromial impingement syndrome. Chang Gung Med J. 2006;29(5):474-478.
9. Codsi MJ. The painful shoulder: when to inject and when to refer. Cleve Clin J Med. 2007;74(7):473-474, 477-478, 480-482 passim.
10. Henkus HE, Cobben LP, Coerkamp EG, Nelissen RG, van Arkel ER. The accuracy of subacromial injections: a prospective randomized magnetic resonance imaging study. Arthroscopy. 2006;22(3):277-282.
11. Kang MN, Rizio L, Prybicien M, Middlemas DA, Blacksin MF. The accuracy of subacromial corticosteroid injections: a comparison of multiple methods. J Shoulder Elbow Surg. 2008;17(15):61S-66S.
12. Marder RA, Kim SH, Labson JD, Hunter JC. Injection of the subacromial bursa in patients with rotator cuff syndrome: a prospective, randomized study comparing the effectiveness of different routes. J Bone Joint Surg Am. 2012;94(16):
1442-1447.
13. Gruson, KI, Ruchelsman DE, Zuckerman JD. Subacromial corticosteroid injections. J Shoulder Elbow Surg. 2008;17(1 suppl):118S-130S.
14. Kuhn JE. Exercise in the treatment of rotator cuff impingement: a systematic review and a synthesized evidence-based rehabilitation protocol. J Shoulder Elbow Surg. 2009;18(1):138-160.
15. Williams GN, Gangel TJ, Arciero RA, Uhorchak JM, Taylor DC. Comparison of the Single Assessment Numeric Evaluation method and two shoulder rating scales. Outcomes measures after shoulder surgery. Am J Sports Med. 1999;27(2):214-221.
16. Tashjian RZ, Deloach J, Porucznik CA, Powell AP. Minimal clinically important differences (MCID) and patient acceptable symptomatic state (PASS) for visual analog scales (VAS) measuring pain in patients treated for rotator cuff disease.
J Shoulder Elbow Surg. 2009;88(6):927-932.
17. Eustace JA, Brophy DP, Gibney RP, Bresnihan B, FitzGerald O. Comparison of the accuracy of steroid placement with clinical outcome in patients with shoulder symptoms. Ann Rheum Dis. 1997;56(1):59-63.
18. Esenyel CZ, Esenyel M, Yeiltepe R, et al. The correlation between the accuracy of steroid injections and subsequent shoulder pain and function in subacromial impingement
syndrome [in Turkish]. Acta Orthop Traumatol Turc. 2003;37(1):
41-45.
19. Powell SE, Davis SM, Lee EH, et al. Accuracy of palpation-directed intra-articular glenohumeral injection confirmed by magnetic resonance arthrography. Arthroscopy. 2015;31(2):205-208.
20. Rutten MJ, Maresch BJ, Jager GJ, de Waal Malefijt MC. Injection of the subacromial-subdeltoid bursa: blind or ultrasound-guided? Acta Orthop. 2007;78(2):254-257.
21. Desmeules F, Côté CH, Frémont P. Therapeutic exercise and orthopedic manual therapy for impingement syndrome: a systematic review. Clin J Sport Med. 2003;13(3):176-182.
22. Winters JC, Sobel JS, Groenier KH, Arendzen HJ, Meyboom-de Jong B. Comparison of physiotherapy, manipulation, and corticosteroid injection for treating shoulder complaints in general practice: randomised, single blind study. BMJ. 1997;314(7090):1320-1325.
23. Chen MJ, Lew HL, Hsu TC, et al. Ultrasound-guided shoulder injections in the treatment of subacromial bursitis. Am J Phys Med Rehabil. 2006;85(1):31-35.
24. Hsieh LF, Hsu WC, Lin YJ, Wu SH, Chang KC, Chang HL. Is ultrasound-guided injection more effective in chronic subacromial bursitis? Med Sci Sports Exerc. 2013;45(12):
2205-2213.
25. Naredo E, Cabero F, Beneyto P, et al. A randomized comparative study of short term response to blind injection versus sonographic-guided injection of local corticosteroids in patients with painful shoulder. J Rheumatol. 2004;31(2):308-314.
26. Hall S, Buchbinder R. Do imaging methods that guide needle placement improve outcome? Ann Rheum Dis. 2004;63(9):1007-1008.
National Trends (2007-2013) of Clostridium difficile Infection in Patients with Septic Shock: Impact on Outcome
Clostridium difficile infection (CDI) is the most common infectious cause of healthcare-associated diarrhea.1 Development of a CDI during hospitalization is associated with increases in morbidity, mortality, length of stay (LOS), and cost.2-5 The prevalence of CDI in hospitalized patients has increased dramatically from the mid-1990s to the mid-2000s to almost 9 cases per 1000 discharges; however, the CDI rate since 2007 appears to have plateaued.6,7 Antibiotic use has historically been the most important risk factor for acquiring CDI; however, use of acid-suppressing agents, chemotherapy, chronic comorbidities, and healthcare exposure all also increase the risk of CDI.7-10 The elderly (> 65 years of age) are particularly at risk for developing CDI and having worse clinical outcomes with CDI.6,7
Patients with septic shock (SS) often have multiple CDI risk factors (in particular, extensive antibiotic exposure) and thus, represent a population at a particularly high risk for acquiring a CDI during hospitalization. However, little data are available on the prevalence of CDI acquired in patients hospitalized with SS. We sought to determine the national-level temporal trends in the prevalence of CDI in patients with SS and the impact of CDI complicating SS on clinical outcomes between 2007 and 2013.
METHODS
Data Source
We used the National Inpatient Sample (NIS) and Nationwide Readmissions Database (NRD) for this study. The NIS is a database developed by the Agency of Healthcare Research and Quality for the Healthcare Cost and Utilization Project (HCUP).11 It is the largest all-payer inpatient database in the United States and has been used by researchers and policy makers to analyze national trends in outcomes and healthcare utilization. The NIS database now approximates a 20% stratified sample of all discharges from all participating US hospitals. Sampling weights are provided by the manufacturer and can be used to produce national-level estimates. Following the redesign of the NIS in 2012, new sampling weights were provided for trend analysis for the years prior to 2012 to account for the new design. Every hospitalization is deidentified and converted into one unique entry that provides information on demographics, hospital characteristics, 1 primary and up to 24 secondary discharge diagnoses, comorbidities, LOS, in-hospital mortality, and procedures performed during stay. The discharge diagnoses are provided in the form of the International Classification of Diseases, 9th Revision-Clinical Modification (ICD-9-CM) codes.
The NRD is a database developed for HCUP that contains about 35 million discharges each year and supports readmission data analyses. In 2013, the NRD contained data from 21 geographically diverse states, accounting for 49.1% of all US hospitalizations. Diagnosis, comorbidities, and outcomes are presented in a similar manner to NIS.
Study Design
This was a retrospective cohort study. Data from the NIS between 2007 and 2013 were used for the analysis. Demographic data obtained included age, gender, race, Charlson-Deyo Comorbidity Index,12 hospital characteristics (hospital region, hospital-bed size, urban versus rural location, and teaching status), calendar year, and use of mechanical ventilation. Cases with information missing on key demographic variables (age, gender, and race) were excluded. Only adults (>18 years of age) were included for the analysis.
SS was identified by either (1) ICD-9-CM diagnosis code for SS (785.52) or (2) presence of vasopressor use (00.17) along with ICD-9-CM codes of sepsis, severe sepsis, septicemia, bacteremia, or fungemia. This approach is consistent with what has been utilized in other studies to identify cases of sepsis or SS from administrative databases.13-15 The appendix provides a complete list of ICD-9-CM codes used in the study. CDI was identified by ICD-9-CM code 008.45 among the secondary diagnosis. This code has been shown to have good accuracy for identifying CDI using administrative data.16 To minimize the inclusion of cases in which a CDI was present at admission, hospitalizations with a primary diagnosis of CDI were not included as cases of CDI complicating SS.
We used NRD 2013 for estimating the effect of CDI on 30-day readmission after initial hospitalizations with SS. We used the criteria for index admissions and 30-day readmissions as defined by the Centers for Medicare and Medicaid Services. We excluded patients who died during their index admission, patients with index discharges in December due to a lack of sufficient time to capture 30-day readmissions, and patients with missing information on key variables. We also excluded patients who were not a resident of the state of index hospitalization since readmission across state boundaries could not be identified in NRD. Manufacturer provided sampling weights were used to produce national level estimates. The cases of SS and CDI were identified by ICD-9-CM codes using the methodology described above.
Outcomes
Our primary outcome of interest was the total and yearly prevalence of CDI in patients with SS from 2007 to 2013. The secondary outcomes were mortality, LOS, and 30-day readmissions in patients with SS with and without CDI.
Statistical Analysis
Weighted data from NIS were used for all analyses. Demographics, hospital characteristics, and outcomes of all patients with SS were obtained. The prevalence of CDI was calculated for each calendar year. The temporal trends of outcomes (LOS and in-hospital mortality) of patients were plotted for patients with SS with and without CDI. A χ2 test of trend for proportions was used with the Cochran-Armitage test to calculate statistical significance of changes in prevalence. To test for statistical significance of the temporal trends of LOS, a univariate linear regression was used, with calendar year as a covariate. Independent samples t test, a Mann-Whitney U test, and a χ2 test were used to determine statistical significance of parameters between the group with CDI and the group without CDI.
Prolonged LOS was defined either as a LOS > 75th or > 90th percentile of LOS among all patients with SS. To identify if CDI was associated with a prolonged LOS after adjusting for patient and hospital characteristics, a multivariate logistic regression analysis was used. Variables included in the regression model were age, gender, race, Charlson-Deyo Comorbidity Index, hospital characteristics (hospital region, hospital-bed size, urban versus rural location, and teaching status), calendar year, and use of mechanical ventilation. Data on cases were available for all the above covariates except hospital characteristics, such as teaching status, location, and bed size (these were missing for 0.7% of hospitals).
Stata 13.1.0 (Stata Corp, College Station, TX) and SPSS 23.0 (SPSS Inc., Chicago, IL) were used to perform statistical analyses. A P value of <0.05 was considered statistically significant.
RESULTS
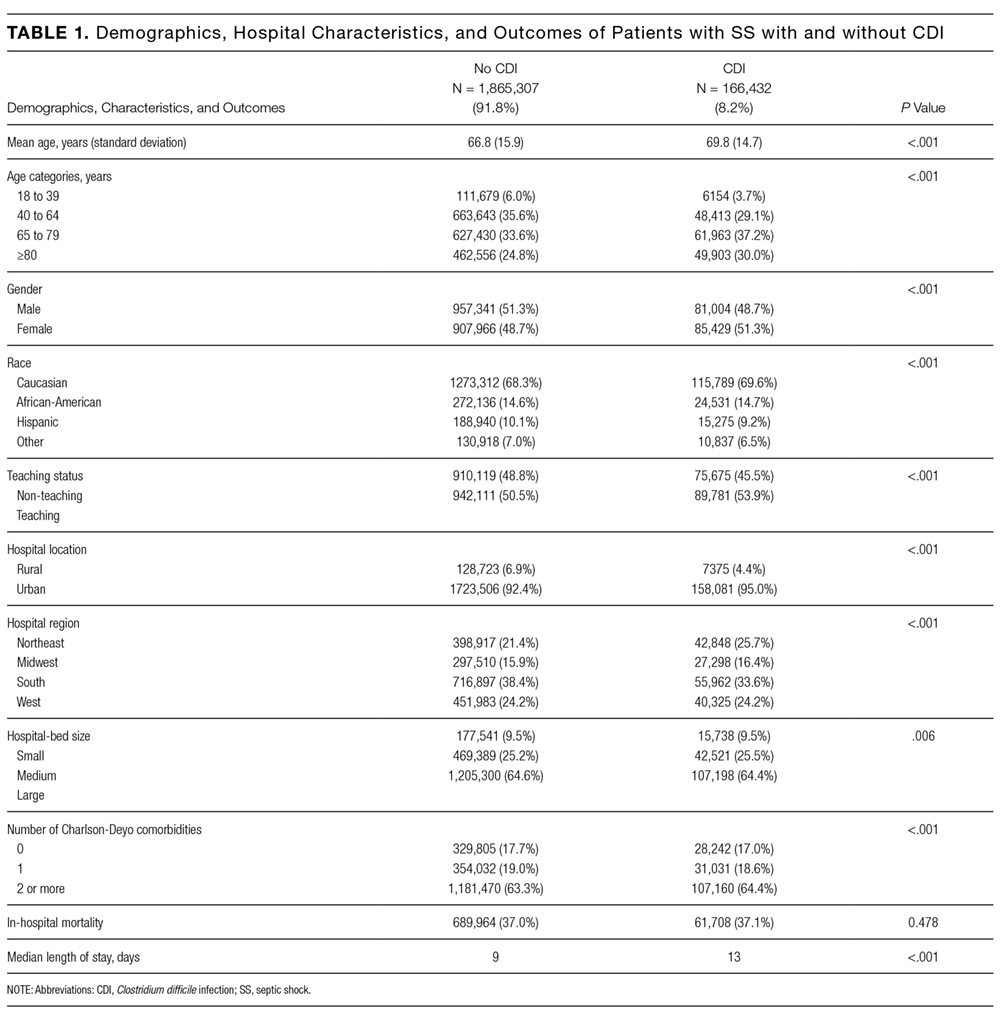
Demographics
A total of 2,031,739 hospitalizations of adults with SS were identified between 2007 and 2013. CDI was present in 166,432 (8.2%) of these patients. Demographic data are displayed in Table 1. CDI was more commonly observed in elderly patients (> 65 years) with SS; 9.3% among the elderly versus 6.6% among individuals < 65 years; P < 0.001. The prevalence of CDI was greater in urban than in rural hospitals (8.4% vs 5.4%; P < 0.001) and greater in teaching than in nonteaching hospitals (8.7% vs 7.7%; P < 0.001). The prevalence of CDI in SS remained stable between 2007 and 2013 (Table 2).

Mortality

In the overall study cohort, the in-hospital mortality for SS was 37%. The in-hospital mortality rate of patients with SS complicated by a CDI was comparable to the mortality rate of patients without a CDI (37.1% vs 37.0%; P = 0.48). The mortality of patients with SS, with or without CDI, progressively decreased from 2007 to 2013 (P value for trend < 0.001 for each group; Figure 1).
Length of Stay

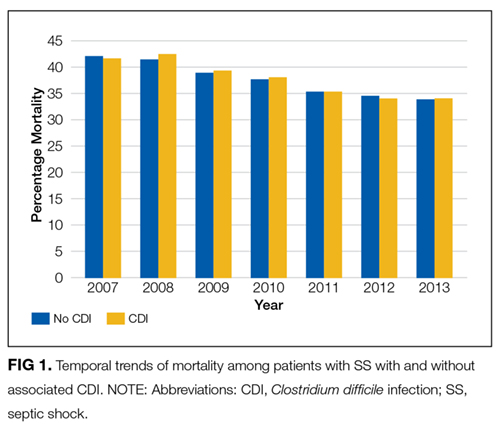
The median LOS for all patients with SS was 9 days. Patients with CDI had a longer median LOS than did those without CDI (13 vs 9 days; P < 0.001). Between 2007 and 2013, the median LOS of CDI group decreased from 14 to 12 days (P < 0.001) while that of non-CDI group decreased from 9 to 8 days (P < 0.001; Figure 2). We also examined LOS among subgroups who were discharged alive and those who died during hospitalization. For patients who were discharged alive, the LOS with and without CDI was 15 days versus 10 days, respectively (P < 0.001). For patients who died during hospitalization, LOS with and without CDI was 10 days versus 6 days, respectively (P < 0.001).
The 75th percentile of LOS of the total SS cohort was 17 days. An LOS > 17 days was observed in 36.9% of SS patients with CDI versus 22.7% without CDI (P < 0.001). After adjusting for patient and provider level variables, the odds of a LOS > 17 days were significantly greater for SS patients with CDI (odds ratio [OR] 2.11; 95% confidence interval [CI], 2.06-2.15; P < 0.001).
The 90th percentile of LOS of the total SS cohort was 29 days. An LOS > 29 days was observed in 17.5% of SS patients with a CDI versus 9.1% without a CDI (P < 0.001). After adjustment for patient and provider level variables, the odds of a LOS > 29 days were significantly greater for SS patients with a CDI (OR 2.25; 95% CI, 2.22-2.28; P < 0.001).
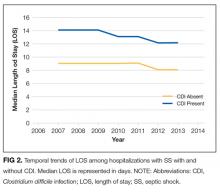
Hospital Readmission
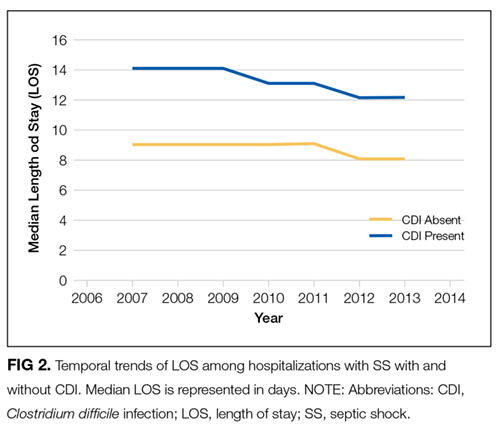
In 2013, patients with SS and CDI had a higher rate of 30-day readmission as compared to patients with SS without CDI (9.8% vs 7.4% respectively; P < 0.001). The multivariate adjusted OR for 30-day readmission for patients with SS and a CDI was 1.26 (95% CI, 1.22-1.31; P < 0.001).
Additional Analyses
Lastly, we performed an additional analysis to confirm our hypothesis that a CDI by itself is rarely a cause of SS, and that CDI as the principal diagnosis would constitute an extremely low number of patients with SS in an administrative dataset. In NIS 2013, there were 105,750 cases with CDI as the primary diagnosis. A total of 4470 (4.2%) had a secondary diagnosis of sepsis and only 930 (0.9%) cases had a secondary diagnosis of SS.
DISCUSSION
This is the first study to report on the prevalence and outcome of CDI complicating SS. By using a large nationally representative sample, we found CDI was very prevalent among individuals hospitalized with SS and, at a level in excess of that seen in other populations. Of interest, we did not observe an increase in mortality of SS when complicated by CDI. On the other hand, patients with SS complicated by CDI were more much likely to have a prolonged hospital LOS and a higher risk of 30-day hospital readmission.
The prevalence of CDI exploded between the mid-1990s and mid-2000s, including community, hospital, and intensive care unit (ICU)–related disease.6,7,17-20 Patients with SS often have multiple risk factors associated with CDI and thus represent a high-risk population for developing CDI.7 Our findings are consistent with the suggestion that individuals with SS are at a higher risk of developing CDI. Compared to the rate of CDI in all hospitalized patients, our data suggest an almost 10-fold increase in CDI rate for patients with SS.6 Patients with SS and CDI may account for as much as 10% of total CDIs.6,7 As has been reported for CDI in general, we observed that CDI complicating SS was more common in those > 65 years of age.4,21 The prevalence of CDI we observed in patients with SS was also higher than has been reported in ICU patients in general (1%), and higher than reported for patients requiring mechanical ventilation (6.6%), including prolonged mechanical ventilation (5.3%); further supporting the conclusion that patients with SS are a particularly high-risk group for acquiring CDI, even compared with other ICU patients.20,22,23 Similarly, the rate of CDI among SS was 8 times higher than that of recently reported hospital-onset CDI among patients with sepsis in general (incidence 1.08%).24 We have no data regarding why patients with SS have a higher rate of CDI; however, the intensity and duration of antibiotic treatment of these patients may certainly play a role.25 It has recently been reported that CDI in itself can be a precursor leading to intestinal dysbiosis that can increase the risk of subsequent sepsis. Similarly, patients with SS may have higher prevalence of dysbiosis that, in turn, might predispose them to CDI at a higher rate than other individuals.
Following the increase in CDIs in the mid-1990s and the mid-2000s, since 2007 the overall prevalence of CDIs has been stable, albeit at the higher rate. More recently, the Centers for Disease Control and Prevention (CDC) has reported a decrease in hospital onset CDI after 2011.26
The finding that CDI in SS patients was not associated with an increase in mortality is consistent with other reports of CDI in ICU patients in general as well as higher-risk ICU populations such as patients requiring mechanical ventilation, including those on long-term mechanical ventilator support.17,18,20,22,23 Why the mortality of ICU patients with CDI is not increased is not completely clear. It has been suggested that this may be related to early recognition and treatment of CDI developing in the ICU.22 Along these lines, it has been previously observed that for patients with CDI on mechanical ventilation, patients who were transferred to the ICU from the ward had worse clinical outcomes compared to patients directly admitted to the ICU, likely due to delayed recognition and treatment in the former.22 Similarly, ICU patients in whom CDI was identified prior to ICU admission had more severe CDI, and mortality that was directly related to CDI was only observed in patients who had CDI identified pre-ICU transfer.18 The increase in mortality observed in patients with sepsis in general with CDI may reflect similar factors.24 We observed a trend of decreasing mortality in SS patients with or without CDI during 2007 to 2013 consistent to what has been generally reported in SS.13,14
The increase in LOS observed in SS patients with CDI is also consistent with what has been observed in other ICU populations, as well as in patients with sepsis in general.17,22-24 Of note, in addition to the increase in median LOS, we found a significant increase in the number of patients with a prolonged LOS associated with having SS with CDI. It is important to note that development of CDI during hospitalization is affected by pre-CDI hospital LOS, so prolonged LOS may not be solely attributable to CDI. The interaction between LOS and CDI remains complex in which higher LOS might be associated with higher incidence of CDI occurrence, and once established, CDI might be associated with changes in LOS for the remaining hospitalization.
Hospitalized patients with CDI have an overall higher resource utilization than those without CDI.27 A recent review has estimated the overall attributable cost of CDI to be $6.3 billion; the attributable cost per case of hospital acquired CDI being 1.5 times the cost of community-acquired CDI.5 We did not look at cost directly. However, in the high-CDI risk ICU population requiring prolonged mechanical ventilation, those with CDI had a substantial increase in total costs.23 Given the substantial increase in LOS associated with CDI complicating SS, there would likely be a significant increase in hospital costs related to providing care for these patients. Further adding to the potential burden of CDI is our finding that CDI and SS was associated with an increase in 30-day hospital readmission rate. This is consistent with a recent report that ICU patients with CDI who are discharged from the hospital have a 25% 30-day hospital readmission rate.28 However, we do not have data either as to the reason for hospital readmission or whether the initial CDI or CDI recurrence played a role. This suggests that, in addition to intervention directed toward preventing CDI, efforts should be directed towards identifying factors that can be modified in CDI patients prior to or after hospital discharge.
This study has several limitations. Using an administrative database (such as NIS) has an inherent limitation of coding errors and reporting bias can lead to misclassification of cohort definition (SS) and outcome (CDI). To minimize bias due to coding errors, we used previously validated ICD-9-CM codes and approach to identify individuals with SS and CDI.13-15 Although the SS population was identified with ICD-9-CM codes using an administrative database, the in-hospital mortality for our septic population was similar to previously reported mortality of SS, suggesting the population selected was appropriate.13 SS due to CDI could not be identified; however, CDI by itself causing SS is rare, as described in recent literature.29,30 An important potential bias that needs to be acknowledged is the immortal time bias. The occurrence of CDI in itself can be influenced by pre-CDI hospital LOS. Patients who were extremely sick could have died early in their hospital course before they could acquire CDI, which would influence the mortality difference between the group with CDI and group without CDI. Furthermore, we did not have information on either the treatment of CDI or SS or any measures of severity of illness, which could lead to residual confounding despite adjusting for multiple variables. In terms of readmission data, it was necessary to exclude nonresidents of a state for the 30-day readmission analysis, as readmissions could not be tracked across state boundaries by using the NRD. This might have resulted in an underrepresentation of the readmission burden. Lastly, it was not possible to identify mortality after hospital discharge as the NIS provides only in-hospital mortality.
In conclusion, CDI is more prevalent in SS than are other ICU populations or the hospital population in general, and CDI complicating SS is associated with significant increase in LOS and risk of 30-day hospital readmission. How much of the increase in resource utilization and cost are in fact attributable to CDI in this population remains to be studied. Our finding of high prevalence of CDI in the SS population further emphasizes the importance of maintaining and furthering approaches to reduce incidence of hospital acquired CDI. While reducing unnecessary antibiotics is important, a multipronged approach that includes education and infection control interventions has also been shown to reduce the incidence of CDI in the ICU.31 Given the economic burden of CDI, implementing these strategies to reduce CDI is warranted. Similarly, the risk of 30-day hospital readmission with CDI highlights the importance of identifying the factors that contribute to hospital readmission prior to initial hospital discharge. Programs to reduce CDI will not only improve outcomes directly attributable to CDI but also decrease the reservoir of CDI. Finally, to the extent that CDI can be reduced in the ICU, the utilization of ICU resources will be more effective.
Disclosure
No conflicts of interest or financial disclosures to report. Author Contributions: KC had full access to all of the data in the study and takes responsibility for the integrity of the data and the accuracy of the data analysis, including and especially any adverse effects. KC, AG, AC, KK, and HC contributed to study design, data analysis, interpretation, and the writing of the manuscript. Guarantor statement: Kshitij Chatterjee takes responsibility for (is the guarantor of) the content of the manuscript, including the data and analysis.
1. Polage CR, Solnick JV, Cohen SH. Nosocomial diarrhea: evaluation and treatment of causes other than Clostridium difficile. Clin Infect Dis. 2012;55(7):982-989. Doi: 10.1093/cid/cis551. PubMed
2. Kyne L, Hamel MB, Polavaram R, Kelly CP. Health care costs and mortality associated with nosocomial diarrhea due to Clostridium difficile. Clin Infect Dis. 2002;34(3):346-353. Doi: 10.1086/338260. PubMed
3. Dubberke ER, Olsen MA. Burden of Clostridium difficile on the healthcare system. Clin Infect Dis. 2012;55(Suppl 2):S88-S92. Doi: 10.1093/cid/cis335. PubMed
4. Lessa FC, Mu Y, Bamberg WM, et al. Burden of Clostridium difficile infection in the United States. N Engl J Med. 2015;372(9):825-834. Doi: 10.1056/NEJMoa1408913. PubMed
5. Zhang S, Palazuelos-Munoz S, Balsells EM, Nair H, Chit A, Kyaw MH. Cost of hospital management of Clostridium difficile infection in United States-a meta-analysis and modelling study. BMC Infect Dis. 2016;16(1):447. Doi: 10.1186/s12879-016-1786-6. PubMed
6. Lessa FC, Gould CV, McDonald LC. Current status of Clostridium difficile infection epidemiology. Clin Infect Dis. 2012;55(Suppl 2):S65-S70. Doi: 10.1093/cid/cis319. PubMed
7. Depestel DD, Aronoff DM. Epidemiology of Clostridium difficile infection. J Pharm Pract. 2013;26(5):464-475. Doi: 10.1177/0897190013499521. PubMed
8. Dial S., Delaney JAC, Barkun AN, Suissa S. Use of gastric acid-suppressive agents and the risk of community-acquired Clostridium difficile-associated disease. JAMA. 2005;294(23):2989-2995. Doi: 10.1001/jama.294.23.2989. PubMed
9. Aseeri M., Schroeder T, Kramer J, Zackula R. Gastric acid suppression by proton pump inhibitors as a risk factor for clostridium difficile-associated diarrhea in hospitalized patients. Am J Gastroenterol. 2008;103(9):2308-2313. Doi: 10.1111/j.1572-0241.2008.01975.x. PubMed
10. Cunningham R, Dial S. Is over-use of proton pump inhibitors fuelling the current epidemic of Clostridium difficile-associated diarrhoea? J Hosp Infect. 2008;70(1):1-6. Doi: 10.1016/j.jhin.2008.04.023. PubMed
11. HCUP-US NIS Overview. https://www.hcup-us.ahrq.gov/nisoverview.jsp. Accessed on April 23, 2016.
12. Deyo RA, Cherkin DC, Ciol MA. Adapting a clinical comorbidity index for use with ICD-9-CM administrative databases. J Clin Epidemiol. 1992;45(6):613-619. PubMed
13. Goto T, Yoshida K, Tsugawa Y, Filbin MR, Camargo CA, Hasegawa K. Mortality trends in U.S. adults with septic shock, 2005-2011: a serial cross-sectional analysis of nationally-representative data. BMC Infect Dis. 2016;16:294. Doi: 10.1186/s12879-016-1620-1. PubMed
14. Kumar G, Kumar N, Taneja A, et al. Nationwide trends of severe sepsis in the 21st century (2000-2007). Chest. 2011;140(5):1223-1231. Doi: 10.1378/chest.11-0352. PubMed
15. Martin GS, Mannino DM, Eaton S, Moss M. The epidemiology of sepsis in the United States from 1979 through 2000. N Engl J Med. 2003;348(16):1546-1554. Doi: 10.1056/NEJMoa022139. PubMed
16. Scheurer DB, Hicks LS, Cook EF, Schnipper JL. Accuracy of ICD-9 coding for Clostridium difficile infections: a retrospective cohort. Epidemiol Infect. 2007;135(6):1010-1013. Doi: 10.1017/S0950268806007655. PubMed
17. Dodek PM, Norena M, Ayas NT, Romney M, Wong H. Length of stay and mortality due to Clostridium difficile infection acquired in the intensive care unit. J Crit Care. 2013;28(4):335-340. Doi: 10.1016/j.jcrc.2012.11.008. PubMed
18. Bouza E, Rodríguez-Créixems M, Alcalá L, et al. Is Clostridium difficile infection an increasingly common severe disease in adult intensive care units? A 10-year experience. J Crit Care. 2015;30(3):543-549. Doi: 10.1016/j.jcrc.2015.02.011. PubMed
19. Karanika S, Paudel S, Zervou FN, Grigoras C, Zacharioudakis IM, Mylonakis E. Prevalence and clinical outcomes of Clostridium difficile infection in the intensive care unit: a systematic review and meta-analysis. Open Forum Infect Dis. 2016;3(1):ofv186. Doi: 10.1093/ofid/ofv186. PubMed
20. Zahar JR, Schwebel C, Adrie C, et al. Outcome of ICU patients with Clostridium difficile infection. Crit Care. 2012;16(6):R215. Doi: 10.1186/cc11852. PubMed
21. Shorr AF, Zilberberg MD, Wang L, Baser O, Yu H. Mortality and costs in clostridium difficile infection among the elderly in the United States. Infect Control Hosp Epidemiol. 2016;37(11):1331-1336. Doi: 10.1017/ice.2016.188. PubMed
22. Micek ST, Schramm G, Morrow L, et al. Clostridium difficile infection: a multicenter study of epidemiology and outcomes in mechanically ventilated patients. Crit Care Med. 2013;41(8):1968-1975. Doi: 10.1097/CCM.0b013e31828a40d5. PubMed
23. Zilberberg MD, Nathanson BH, Sadigov S, Higgins TL, Kollef MH, Shorr AF. Epidemiology and outcomes of clostridium difficile-associated disease among patients on prolonged acute mechanical ventilation. Chest. 2009;136(3):752-758. Doi: 10.1378/chest.09-0596. PubMed
24. Lagu T, Stefan MS, Haessler S, et al. The impact of hospital-onset Clostridium difficile infection on outcomes of hospitalized patients with sepsis. J Hosp Med. 2014;9(7):411-417. Doi: 10.1002/jhm.2199. PubMed
25. Prescott HC, Dickson RP, Rogers MA, Langa KM, Iwashyna TJ. Hospitalization type and subsequent severe sepsis. Am J Respir Crit Care Med. 2015;192(5):581-588. Doi: 10.1164/rccm.201503-0483OC. PubMed
26. Healthcare-associated Infections (HAI) Progress Report. Centers for Disease Control and Prevention. http://www.cdc.gov/hai/surveillance/progress-report/index.html. Accessed on July 29, 2017.
27. Song X, Bartlett JG, Speck K, Naegeli A, Carroll K, Perl TM. Rising economic impact of clostridium difficile-associated disease in adult hospitalized patient population. Infect Control Hosp Epidemiol. 2008;29(9):823-828. Doi: 10.1086/588756. PubMed
28. Zilberberg MD, Shorr AF, Micek ST, et al. Clostridium difficile recurrence is a strong predictor of 30-day rehospitalization among patients in intensive care. Infect Control Hosp Epidemiol. 2015;36(3):273-279. Doi: 10.1017/ice.2014.47. PubMed
29. Loftus KV, Wilson PM. A curiously rare case of septic shock from Clostridium difficile colitis. Pediatr Emerg Care. 2015. [Epub ahead of print]. Doi: 10.1097/PEC.0000000000000496. PubMed
30. Bermejo C, Maseda E, Salgado P, Gabilondo G., Gilsanz F. Septic shock due to a community acquired Clostridium difficile infection. A case study and a review of the literature. Rev Esp Anestesiol Reanimvol. 2014;61(4):219-222. PubMed
31. You E, Song H, Cho J, Lee J. Reduction in the incidence of hospital-acquired Clostridium difficile infection through infection control interventions other than the restriction of antimicrobial use. Int J Infect Dis. 2014;22:9-10. 2014. PubMed
Clostridium difficile infection (CDI) is the most common infectious cause of healthcare-associated diarrhea.1 Development of a CDI during hospitalization is associated with increases in morbidity, mortality, length of stay (LOS), and cost.2-5 The prevalence of CDI in hospitalized patients has increased dramatically from the mid-1990s to the mid-2000s to almost 9 cases per 1000 discharges; however, the CDI rate since 2007 appears to have plateaued.6,7 Antibiotic use has historically been the most important risk factor for acquiring CDI; however, use of acid-suppressing agents, chemotherapy, chronic comorbidities, and healthcare exposure all also increase the risk of CDI.7-10 The elderly (> 65 years of age) are particularly at risk for developing CDI and having worse clinical outcomes with CDI.6,7
Patients with septic shock (SS) often have multiple CDI risk factors (in particular, extensive antibiotic exposure) and thus, represent a population at a particularly high risk for acquiring a CDI during hospitalization. However, little data are available on the prevalence of CDI acquired in patients hospitalized with SS. We sought to determine the national-level temporal trends in the prevalence of CDI in patients with SS and the impact of CDI complicating SS on clinical outcomes between 2007 and 2013.
METHODS
Data Source
We used the National Inpatient Sample (NIS) and Nationwide Readmissions Database (NRD) for this study. The NIS is a database developed by the Agency of Healthcare Research and Quality for the Healthcare Cost and Utilization Project (HCUP).11 It is the largest all-payer inpatient database in the United States and has been used by researchers and policy makers to analyze national trends in outcomes and healthcare utilization. The NIS database now approximates a 20% stratified sample of all discharges from all participating US hospitals. Sampling weights are provided by the manufacturer and can be used to produce national-level estimates. Following the redesign of the NIS in 2012, new sampling weights were provided for trend analysis for the years prior to 2012 to account for the new design. Every hospitalization is deidentified and converted into one unique entry that provides information on demographics, hospital characteristics, 1 primary and up to 24 secondary discharge diagnoses, comorbidities, LOS, in-hospital mortality, and procedures performed during stay. The discharge diagnoses are provided in the form of the International Classification of Diseases, 9th Revision-Clinical Modification (ICD-9-CM) codes.
The NRD is a database developed for HCUP that contains about 35 million discharges each year and supports readmission data analyses. In 2013, the NRD contained data from 21 geographically diverse states, accounting for 49.1% of all US hospitalizations. Diagnosis, comorbidities, and outcomes are presented in a similar manner to NIS.
Study Design
This was a retrospective cohort study. Data from the NIS between 2007 and 2013 were used for the analysis. Demographic data obtained included age, gender, race, Charlson-Deyo Comorbidity Index,12 hospital characteristics (hospital region, hospital-bed size, urban versus rural location, and teaching status), calendar year, and use of mechanical ventilation. Cases with information missing on key demographic variables (age, gender, and race) were excluded. Only adults (>18 years of age) were included for the analysis.
SS was identified by either (1) ICD-9-CM diagnosis code for SS (785.52) or (2) presence of vasopressor use (00.17) along with ICD-9-CM codes of sepsis, severe sepsis, septicemia, bacteremia, or fungemia. This approach is consistent with what has been utilized in other studies to identify cases of sepsis or SS from administrative databases.13-15 The appendix provides a complete list of ICD-9-CM codes used in the study. CDI was identified by ICD-9-CM code 008.45 among the secondary diagnosis. This code has been shown to have good accuracy for identifying CDI using administrative data.16 To minimize the inclusion of cases in which a CDI was present at admission, hospitalizations with a primary diagnosis of CDI were not included as cases of CDI complicating SS.
We used NRD 2013 for estimating the effect of CDI on 30-day readmission after initial hospitalizations with SS. We used the criteria for index admissions and 30-day readmissions as defined by the Centers for Medicare and Medicaid Services. We excluded patients who died during their index admission, patients with index discharges in December due to a lack of sufficient time to capture 30-day readmissions, and patients with missing information on key variables. We also excluded patients who were not a resident of the state of index hospitalization since readmission across state boundaries could not be identified in NRD. Manufacturer provided sampling weights were used to produce national level estimates. The cases of SS and CDI were identified by ICD-9-CM codes using the methodology described above.
Outcomes
Our primary outcome of interest was the total and yearly prevalence of CDI in patients with SS from 2007 to 2013. The secondary outcomes were mortality, LOS, and 30-day readmissions in patients with SS with and without CDI.
Statistical Analysis
Weighted data from NIS were used for all analyses. Demographics, hospital characteristics, and outcomes of all patients with SS were obtained. The prevalence of CDI was calculated for each calendar year. The temporal trends of outcomes (LOS and in-hospital mortality) of patients were plotted for patients with SS with and without CDI. A χ2 test of trend for proportions was used with the Cochran-Armitage test to calculate statistical significance of changes in prevalence. To test for statistical significance of the temporal trends of LOS, a univariate linear regression was used, with calendar year as a covariate. Independent samples t test, a Mann-Whitney U test, and a χ2 test were used to determine statistical significance of parameters between the group with CDI and the group without CDI.
Prolonged LOS was defined either as a LOS > 75th or > 90th percentile of LOS among all patients with SS. To identify if CDI was associated with a prolonged LOS after adjusting for patient and hospital characteristics, a multivariate logistic regression analysis was used. Variables included in the regression model were age, gender, race, Charlson-Deyo Comorbidity Index, hospital characteristics (hospital region, hospital-bed size, urban versus rural location, and teaching status), calendar year, and use of mechanical ventilation. Data on cases were available for all the above covariates except hospital characteristics, such as teaching status, location, and bed size (these were missing for 0.7% of hospitals).
Stata 13.1.0 (Stata Corp, College Station, TX) and SPSS 23.0 (SPSS Inc., Chicago, IL) were used to perform statistical analyses. A P value of <0.05 was considered statistically significant.
RESULTS
Demographics
A total of 2,031,739 hospitalizations of adults with SS were identified between 2007 and 2013. CDI was present in 166,432 (8.2%) of these patients. Demographic data are displayed in Table 1. CDI was more commonly observed in elderly patients (> 65 years) with SS; 9.3% among the elderly versus 6.6% among individuals < 65 years; P < 0.001. The prevalence of CDI was greater in urban than in rural hospitals (8.4% vs 5.4%; P < 0.001) and greater in teaching than in nonteaching hospitals (8.7% vs 7.7%; P < 0.001). The prevalence of CDI in SS remained stable between 2007 and 2013 (Table 2).
Mortality
In the overall study cohort, the in-hospital mortality for SS was 37%. The in-hospital mortality rate of patients with SS complicated by a CDI was comparable to the mortality rate of patients without a CDI (37.1% vs 37.0%; P = 0.48). The mortality of patients with SS, with or without CDI, progressively decreased from 2007 to 2013 (P value for trend < 0.001 for each group; Figure 1).
Length of Stay
The median LOS for all patients with SS was 9 days. Patients with CDI had a longer median LOS than did those without CDI (13 vs 9 days; P < 0.001). Between 2007 and 2013, the median LOS of CDI group decreased from 14 to 12 days (P < 0.001) while that of non-CDI group decreased from 9 to 8 days (P < 0.001; Figure 2). We also examined LOS among subgroups who were discharged alive and those who died during hospitalization. For patients who were discharged alive, the LOS with and without CDI was 15 days versus 10 days, respectively (P < 0.001). For patients who died during hospitalization, LOS with and without CDI was 10 days versus 6 days, respectively (P < 0.001).
The 75th percentile of LOS of the total SS cohort was 17 days. An LOS > 17 days was observed in 36.9% of SS patients with CDI versus 22.7% without CDI (P < 0.001). After adjusting for patient and provider level variables, the odds of a LOS > 17 days were significantly greater for SS patients with CDI (odds ratio [OR] 2.11; 95% confidence interval [CI], 2.06-2.15; P < 0.001).
The 90th percentile of LOS of the total SS cohort was 29 days. An LOS > 29 days was observed in 17.5% of SS patients with a CDI versus 9.1% without a CDI (P < 0.001). After adjustment for patient and provider level variables, the odds of a LOS > 29 days were significantly greater for SS patients with a CDI (OR 2.25; 95% CI, 2.22-2.28; P < 0.001).
Hospital Readmission
In 2013, patients with SS and CDI had a higher rate of 30-day readmission as compared to patients with SS without CDI (9.8% vs 7.4% respectively; P < 0.001). The multivariate adjusted OR for 30-day readmission for patients with SS and a CDI was 1.26 (95% CI, 1.22-1.31; P < 0.001).
Additional Analyses
Lastly, we performed an additional analysis to confirm our hypothesis that a CDI by itself is rarely a cause of SS, and that CDI as the principal diagnosis would constitute an extremely low number of patients with SS in an administrative dataset. In NIS 2013, there were 105,750 cases with CDI as the primary diagnosis. A total of 4470 (4.2%) had a secondary diagnosis of sepsis and only 930 (0.9%) cases had a secondary diagnosis of SS.
DISCUSSION
This is the first study to report on the prevalence and outcome of CDI complicating SS. By using a large nationally representative sample, we found CDI was very prevalent among individuals hospitalized with SS and, at a level in excess of that seen in other populations. Of interest, we did not observe an increase in mortality of SS when complicated by CDI. On the other hand, patients with SS complicated by CDI were more much likely to have a prolonged hospital LOS and a higher risk of 30-day hospital readmission.
The prevalence of CDI exploded between the mid-1990s and mid-2000s, including community, hospital, and intensive care unit (ICU)–related disease.6,7,17-20 Patients with SS often have multiple risk factors associated with CDI and thus represent a high-risk population for developing CDI.7 Our findings are consistent with the suggestion that individuals with SS are at a higher risk of developing CDI. Compared to the rate of CDI in all hospitalized patients, our data suggest an almost 10-fold increase in CDI rate for patients with SS.6 Patients with SS and CDI may account for as much as 10% of total CDIs.6,7 As has been reported for CDI in general, we observed that CDI complicating SS was more common in those > 65 years of age.4,21 The prevalence of CDI we observed in patients with SS was also higher than has been reported in ICU patients in general (1%), and higher than reported for patients requiring mechanical ventilation (6.6%), including prolonged mechanical ventilation (5.3%); further supporting the conclusion that patients with SS are a particularly high-risk group for acquiring CDI, even compared with other ICU patients.20,22,23 Similarly, the rate of CDI among SS was 8 times higher than that of recently reported hospital-onset CDI among patients with sepsis in general (incidence 1.08%).24 We have no data regarding why patients with SS have a higher rate of CDI; however, the intensity and duration of antibiotic treatment of these patients may certainly play a role.25 It has recently been reported that CDI in itself can be a precursor leading to intestinal dysbiosis that can increase the risk of subsequent sepsis. Similarly, patients with SS may have higher prevalence of dysbiosis that, in turn, might predispose them to CDI at a higher rate than other individuals.
Following the increase in CDIs in the mid-1990s and the mid-2000s, since 2007 the overall prevalence of CDIs has been stable, albeit at the higher rate. More recently, the Centers for Disease Control and Prevention (CDC) has reported a decrease in hospital onset CDI after 2011.26
The finding that CDI in SS patients was not associated with an increase in mortality is consistent with other reports of CDI in ICU patients in general as well as higher-risk ICU populations such as patients requiring mechanical ventilation, including those on long-term mechanical ventilator support.17,18,20,22,23 Why the mortality of ICU patients with CDI is not increased is not completely clear. It has been suggested that this may be related to early recognition and treatment of CDI developing in the ICU.22 Along these lines, it has been previously observed that for patients with CDI on mechanical ventilation, patients who were transferred to the ICU from the ward had worse clinical outcomes compared to patients directly admitted to the ICU, likely due to delayed recognition and treatment in the former.22 Similarly, ICU patients in whom CDI was identified prior to ICU admission had more severe CDI, and mortality that was directly related to CDI was only observed in patients who had CDI identified pre-ICU transfer.18 The increase in mortality observed in patients with sepsis in general with CDI may reflect similar factors.24 We observed a trend of decreasing mortality in SS patients with or without CDI during 2007 to 2013 consistent to what has been generally reported in SS.13,14
The increase in LOS observed in SS patients with CDI is also consistent with what has been observed in other ICU populations, as well as in patients with sepsis in general.17,22-24 Of note, in addition to the increase in median LOS, we found a significant increase in the number of patients with a prolonged LOS associated with having SS with CDI. It is important to note that development of CDI during hospitalization is affected by pre-CDI hospital LOS, so prolonged LOS may not be solely attributable to CDI. The interaction between LOS and CDI remains complex in which higher LOS might be associated with higher incidence of CDI occurrence, and once established, CDI might be associated with changes in LOS for the remaining hospitalization.
Hospitalized patients with CDI have an overall higher resource utilization than those without CDI.27 A recent review has estimated the overall attributable cost of CDI to be $6.3 billion; the attributable cost per case of hospital acquired CDI being 1.5 times the cost of community-acquired CDI.5 We did not look at cost directly. However, in the high-CDI risk ICU population requiring prolonged mechanical ventilation, those with CDI had a substantial increase in total costs.23 Given the substantial increase in LOS associated with CDI complicating SS, there would likely be a significant increase in hospital costs related to providing care for these patients. Further adding to the potential burden of CDI is our finding that CDI and SS was associated with an increase in 30-day hospital readmission rate. This is consistent with a recent report that ICU patients with CDI who are discharged from the hospital have a 25% 30-day hospital readmission rate.28 However, we do not have data either as to the reason for hospital readmission or whether the initial CDI or CDI recurrence played a role. This suggests that, in addition to intervention directed toward preventing CDI, efforts should be directed towards identifying factors that can be modified in CDI patients prior to or after hospital discharge.
This study has several limitations. Using an administrative database (such as NIS) has an inherent limitation of coding errors and reporting bias can lead to misclassification of cohort definition (SS) and outcome (CDI). To minimize bias due to coding errors, we used previously validated ICD-9-CM codes and approach to identify individuals with SS and CDI.13-15 Although the SS population was identified with ICD-9-CM codes using an administrative database, the in-hospital mortality for our septic population was similar to previously reported mortality of SS, suggesting the population selected was appropriate.13 SS due to CDI could not be identified; however, CDI by itself causing SS is rare, as described in recent literature.29,30 An important potential bias that needs to be acknowledged is the immortal time bias. The occurrence of CDI in itself can be influenced by pre-CDI hospital LOS. Patients who were extremely sick could have died early in their hospital course before they could acquire CDI, which would influence the mortality difference between the group with CDI and group without CDI. Furthermore, we did not have information on either the treatment of CDI or SS or any measures of severity of illness, which could lead to residual confounding despite adjusting for multiple variables. In terms of readmission data, it was necessary to exclude nonresidents of a state for the 30-day readmission analysis, as readmissions could not be tracked across state boundaries by using the NRD. This might have resulted in an underrepresentation of the readmission burden. Lastly, it was not possible to identify mortality after hospital discharge as the NIS provides only in-hospital mortality.
In conclusion, CDI is more prevalent in SS than are other ICU populations or the hospital population in general, and CDI complicating SS is associated with significant increase in LOS and risk of 30-day hospital readmission. How much of the increase in resource utilization and cost are in fact attributable to CDI in this population remains to be studied. Our finding of high prevalence of CDI in the SS population further emphasizes the importance of maintaining and furthering approaches to reduce incidence of hospital acquired CDI. While reducing unnecessary antibiotics is important, a multipronged approach that includes education and infection control interventions has also been shown to reduce the incidence of CDI in the ICU.31 Given the economic burden of CDI, implementing these strategies to reduce CDI is warranted. Similarly, the risk of 30-day hospital readmission with CDI highlights the importance of identifying the factors that contribute to hospital readmission prior to initial hospital discharge. Programs to reduce CDI will not only improve outcomes directly attributable to CDI but also decrease the reservoir of CDI. Finally, to the extent that CDI can be reduced in the ICU, the utilization of ICU resources will be more effective.
Disclosure
No conflicts of interest or financial disclosures to report. Author Contributions: KC had full access to all of the data in the study and takes responsibility for the integrity of the data and the accuracy of the data analysis, including and especially any adverse effects. KC, AG, AC, KK, and HC contributed to study design, data analysis, interpretation, and the writing of the manuscript. Guarantor statement: Kshitij Chatterjee takes responsibility for (is the guarantor of) the content of the manuscript, including the data and analysis.
1. Polage CR, Solnick JV, Cohen SH. Nosocomial diarrhea: evaluation and treatment of causes other than Clostridium difficile. Clin Infect Dis. 2012;55(7):982-989. Doi: 10.1093/cid/cis551. PubMed
2. Kyne L, Hamel MB, Polavaram R, Kelly CP. Health care costs and mortality associated with nosocomial diarrhea due to Clostridium difficile. Clin Infect Dis. 2002;34(3):346-353. Doi: 10.1086/338260. PubMed
3. Dubberke ER, Olsen MA. Burden of Clostridium difficile on the healthcare system. Clin Infect Dis. 2012;55(Suppl 2):S88-S92. Doi: 10.1093/cid/cis335. PubMed
4. Lessa FC, Mu Y, Bamberg WM, et al. Burden of Clostridium difficile infection in the United States. N Engl J Med. 2015;372(9):825-834. Doi: 10.1056/NEJMoa1408913. PubMed
5. Zhang S, Palazuelos-Munoz S, Balsells EM, Nair H, Chit A, Kyaw MH. Cost of hospital management of Clostridium difficile infection in United States-a meta-analysis and modelling study. BMC Infect Dis. 2016;16(1):447. Doi: 10.1186/s12879-016-1786-6. PubMed
6. Lessa FC, Gould CV, McDonald LC. Current status of Clostridium difficile infection epidemiology. Clin Infect Dis. 2012;55(Suppl 2):S65-S70. Doi: 10.1093/cid/cis319. PubMed
7. Depestel DD, Aronoff DM. Epidemiology of Clostridium difficile infection. J Pharm Pract. 2013;26(5):464-475. Doi: 10.1177/0897190013499521. PubMed
8. Dial S., Delaney JAC, Barkun AN, Suissa S. Use of gastric acid-suppressive agents and the risk of community-acquired Clostridium difficile-associated disease. JAMA. 2005;294(23):2989-2995. Doi: 10.1001/jama.294.23.2989. PubMed
9. Aseeri M., Schroeder T, Kramer J, Zackula R. Gastric acid suppression by proton pump inhibitors as a risk factor for clostridium difficile-associated diarrhea in hospitalized patients. Am J Gastroenterol. 2008;103(9):2308-2313. Doi: 10.1111/j.1572-0241.2008.01975.x. PubMed
10. Cunningham R, Dial S. Is over-use of proton pump inhibitors fuelling the current epidemic of Clostridium difficile-associated diarrhoea? J Hosp Infect. 2008;70(1):1-6. Doi: 10.1016/j.jhin.2008.04.023. PubMed
11. HCUP-US NIS Overview. https://www.hcup-us.ahrq.gov/nisoverview.jsp. Accessed on April 23, 2016.
12. Deyo RA, Cherkin DC, Ciol MA. Adapting a clinical comorbidity index for use with ICD-9-CM administrative databases. J Clin Epidemiol. 1992;45(6):613-619. PubMed
13. Goto T, Yoshida K, Tsugawa Y, Filbin MR, Camargo CA, Hasegawa K. Mortality trends in U.S. adults with septic shock, 2005-2011: a serial cross-sectional analysis of nationally-representative data. BMC Infect Dis. 2016;16:294. Doi: 10.1186/s12879-016-1620-1. PubMed
14. Kumar G, Kumar N, Taneja A, et al. Nationwide trends of severe sepsis in the 21st century (2000-2007). Chest. 2011;140(5):1223-1231. Doi: 10.1378/chest.11-0352. PubMed
15. Martin GS, Mannino DM, Eaton S, Moss M. The epidemiology of sepsis in the United States from 1979 through 2000. N Engl J Med. 2003;348(16):1546-1554. Doi: 10.1056/NEJMoa022139. PubMed
16. Scheurer DB, Hicks LS, Cook EF, Schnipper JL. Accuracy of ICD-9 coding for Clostridium difficile infections: a retrospective cohort. Epidemiol Infect. 2007;135(6):1010-1013. Doi: 10.1017/S0950268806007655. PubMed
17. Dodek PM, Norena M, Ayas NT, Romney M, Wong H. Length of stay and mortality due to Clostridium difficile infection acquired in the intensive care unit. J Crit Care. 2013;28(4):335-340. Doi: 10.1016/j.jcrc.2012.11.008. PubMed
18. Bouza E, Rodríguez-Créixems M, Alcalá L, et al. Is Clostridium difficile infection an increasingly common severe disease in adult intensive care units? A 10-year experience. J Crit Care. 2015;30(3):543-549. Doi: 10.1016/j.jcrc.2015.02.011. PubMed
19. Karanika S, Paudel S, Zervou FN, Grigoras C, Zacharioudakis IM, Mylonakis E. Prevalence and clinical outcomes of Clostridium difficile infection in the intensive care unit: a systematic review and meta-analysis. Open Forum Infect Dis. 2016;3(1):ofv186. Doi: 10.1093/ofid/ofv186. PubMed
20. Zahar JR, Schwebel C, Adrie C, et al. Outcome of ICU patients with Clostridium difficile infection. Crit Care. 2012;16(6):R215. Doi: 10.1186/cc11852. PubMed
21. Shorr AF, Zilberberg MD, Wang L, Baser O, Yu H. Mortality and costs in clostridium difficile infection among the elderly in the United States. Infect Control Hosp Epidemiol. 2016;37(11):1331-1336. Doi: 10.1017/ice.2016.188. PubMed
22. Micek ST, Schramm G, Morrow L, et al. Clostridium difficile infection: a multicenter study of epidemiology and outcomes in mechanically ventilated patients. Crit Care Med. 2013;41(8):1968-1975. Doi: 10.1097/CCM.0b013e31828a40d5. PubMed
23. Zilberberg MD, Nathanson BH, Sadigov S, Higgins TL, Kollef MH, Shorr AF. Epidemiology and outcomes of clostridium difficile-associated disease among patients on prolonged acute mechanical ventilation. Chest. 2009;136(3):752-758. Doi: 10.1378/chest.09-0596. PubMed
24. Lagu T, Stefan MS, Haessler S, et al. The impact of hospital-onset Clostridium difficile infection on outcomes of hospitalized patients with sepsis. J Hosp Med. 2014;9(7):411-417. Doi: 10.1002/jhm.2199. PubMed
25. Prescott HC, Dickson RP, Rogers MA, Langa KM, Iwashyna TJ. Hospitalization type and subsequent severe sepsis. Am J Respir Crit Care Med. 2015;192(5):581-588. Doi: 10.1164/rccm.201503-0483OC. PubMed
26. Healthcare-associated Infections (HAI) Progress Report. Centers for Disease Control and Prevention. http://www.cdc.gov/hai/surveillance/progress-report/index.html. Accessed on July 29, 2017.
27. Song X, Bartlett JG, Speck K, Naegeli A, Carroll K, Perl TM. Rising economic impact of clostridium difficile-associated disease in adult hospitalized patient population. Infect Control Hosp Epidemiol. 2008;29(9):823-828. Doi: 10.1086/588756. PubMed
28. Zilberberg MD, Shorr AF, Micek ST, et al. Clostridium difficile recurrence is a strong predictor of 30-day rehospitalization among patients in intensive care. Infect Control Hosp Epidemiol. 2015;36(3):273-279. Doi: 10.1017/ice.2014.47. PubMed
29. Loftus KV, Wilson PM. A curiously rare case of septic shock from Clostridium difficile colitis. Pediatr Emerg Care. 2015. [Epub ahead of print]. Doi: 10.1097/PEC.0000000000000496. PubMed
30. Bermejo C, Maseda E, Salgado P, Gabilondo G., Gilsanz F. Septic shock due to a community acquired Clostridium difficile infection. A case study and a review of the literature. Rev Esp Anestesiol Reanimvol. 2014;61(4):219-222. PubMed
31. You E, Song H, Cho J, Lee J. Reduction in the incidence of hospital-acquired Clostridium difficile infection through infection control interventions other than the restriction of antimicrobial use. Int J Infect Dis. 2014;22:9-10. 2014. PubMed
© 2017 Society of Hospital Medicine
Appropriate Reconciliation of Cardiovascular Medications After Elective Surgery and Postdischarge Acute Hospital and Ambulatory Visits
Medication reconciliation at hospital discharge is a critical component of the posthospital transition of care.1 Effective reconciliation involves a clear process for documenting a current medication list, identifying and resolving discrepancies, and then documenting decisions and instructions around which medications should be continued, modified, or stopped.2 Existing studies3-5 suggest that medication discrepancies are common during hospital discharge transitions of care and lead to preventable adverse drug events, patient disability, and increased healthcare utilization following hospital discharge, including physician office visits, emergency department (ED) visits, and hospitalizations.6-8
While the majority of studies of medication discrepancies have been conducted in general medical patients, few have examined how gaps in discharge medication reconciliation might affect surgical patients.9,10 Two prior studies9,10 suggest that medication discrepancies may occur more frequently for surgical patients, compared with medical patients, particularly discrepancies in reordering home medications postoperatively, raising patient safety concerns for more than 50 million patients hospitalized for surgery each year.11 In particular, little is known about the appropriate discharge reconciliation of chronic cardiovascular medications, such as beta-blockers, renin-angiotensin system inhibitors, and statins in surgical patients, despite perioperative practice guidelines recommending continuation or rapid reinitiation of these medications after noncardiac surgery.12 Problems with chronic cardiovascular medications have been implicated as major contributors to ED visits and hospitalizations for adverse drug events,13,14 further highlighting the importance of safe and appropriate management of these medications.
To better understand the current state and impact of postoperative discharge medication reconciliation of chronic cardiovascular medications in surgical patients, we examined (1) the appropriate discharge reconciliation of 4 cardiovascular medication classes, and (2) the associations between the appropriate discharge reconciliation of these medication classes and postdischarge acute hospital and ambulatory visits in patients hospitalized for elective noncardiac surgery at an academic medical center.
METHODS
Study Design and Patient Selection
We performed a retrospective analysis of data collected as part of a cohort study of hospitalized surgical patients admitted between January 2007 and December 2011. The original study was designed to assess the impact of a social marketing intervention on guideline-appropriate perioperative beta-blocker use in surgical patients. The study was conducted at 1 academic medical center that had 2 campuses with full noncardiac operative facilities and a 600-bed total capacity. Both sites had preoperative clinics, and patients were recruited by review of preoperative clinic records. Institutional review boards responsible for all sites approved the study.
For this analysis, we included adults (age >18 years) undergoing elective noncardiac surgery, who were expected to remain hospitalized for at least 1 day and were taking antiplatelet agents (aspirin, aspirin-dipyridamole, or clopidogrel), beta-blockers, renin-angiotensin system inhibitors (angiotensin-converting-enzyme inhibitors or angiotensin-receptor blockers), or statin lipid-lowering agents.
Data Collection
Data Sources. We collected data from a structured review of medical records as well as from discharge abstract information obtained from administrative data systems. Data regarding patient demographics (age, sex, and race/ethnicity), medical history, preoperative cardiovascular medications, surgical procedure and service, and attending surgeon were obtained from a medical record review of comprehensive preoperative clinic evaluations. Data regarding complications during hospitalization were obtained from medical record review and administrative data (Supplement for International Classification of Diseases, Ninth Revision codes).15 Research assistants abstracting data were trained by using a comprehensive reference manual providing specific criteria for classifying chart abstraction data. Research assistants also were directly observed during initial chart abstractions and underwent random chart validation audits by a senior investigator to ensure consistency. Any discrepancies in coding were resolved by consensus among senior investigators.
Definition of Key Predictor: Appropriate Reconciliation. We abstracted discharge medication lists from the electronic medical record. We defined the appropriate reconciliation of cardiovascular medications at discharge as documentation in discharge instructions, medication reconciliation tools, or discharge summaries that a preadmission cardiovascular medication was being continued at discharge, or, if the medication was not continued, documentation of a new contraindication to the medication or complication precluding its use during hospitalization. Medication continuity was considered appropriate if it was continued at discharge irrespective of changes in dosage. By using this measure for individual medications, we also assessed appropriate reconciliation as an “all-or-none” complete versus incomplete measure (appropriate reconciliation of all preoperative cardiovascular medication classes the patient was taking).16
Definition of Outcomes. Our coprimary outcomes were acute hospital visits (ED visits or hospitalizations) and unplanned ambulatory visits (primary care or surgical) at 30 days after surgery. Postoperative ambulatory visits that were not planned prior to surgery were defined as unplanned. Outcomes were ascertained by patient reports during follow-up telephone questionnaires administered by trained research staff and verified by medical record review.
Definition of Covariates. Using these data, we calculated a Revised Cardiac Risk Index (RCRI) score,17 which estimates the risk of perioperative cardiac complications in patients undergoing surgery. Through chart abstraction data supplemented by diagnosis codes from administrative data, we also constructed variables indicating occurrences of postoperative complications anytime during hospitalization that might pose contraindications to continuation of the 4 cardiovascular medication classes studied. For example, if a chart indicated that the patient had an acute rise in creatinine (elevation of baseline creatinine by 50% or absolute rise of 1 mg/dL in patients with baseline creatinine greater than 3 mg/dL) during hospitalization and a preoperative renin-angiotensin system inhibitor was not prescribed at discharge, we would have considered discontinuation appropriate. Other complications we abstracted were hypotension (systolic blood pressure less than 90 mmHg) for beta-blockers and renin-angiotensin system inhibitors, bradycardia (heart rate less than 50 bpm) for beta-blockers, acute kidney injury (defined above) and hyperkalemia for renin-angiotensin system inhibitors, and bleeding (any site) for antiplatelet agents.
Statistical Analysis
We used χ2 and Kruskal-Wallis tests to compare baseline patient characteristics. To assess associations between appropriate medication reconciliation and patient outcomes, we used multilevel mixed-effects logistic regression to account for the clustering of patients by the attending surgeon. We adjusted for baseline patient demographics, surgical service, the number of baseline cardiovascular medications, and individual RCRI criteria. We constructed separate models for all-or-none appropriate reconciliation and for each individual medication class.
As a sensitivity analysis, we constructed similar models by using a simplified definition of appropriate reconciliation based entirely on medication continuity (continued or not continued at discharge) without taking potential contraindications during hospitalization into account. For complete versus incomplete reconciliation, we also constructed models with an interaction term between the number of baseline cardiovascular medications and appropriate medication reconciliation to test the hypothesis that inappropriate reconciliation would be more likely with an increasing number of preoperative cardiovascular medications. Because this interaction term was not statistically significant, we did not include it in the final models for ease of reporting and interpretability. We performed all statistical analyses using Stata 14 (StataCorp, LLC, College Station, Texas), and used 2-sided statistical tests and a P value of less than .05 to define statistical significance.
RESULTS
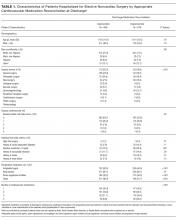
Patient Characteristics
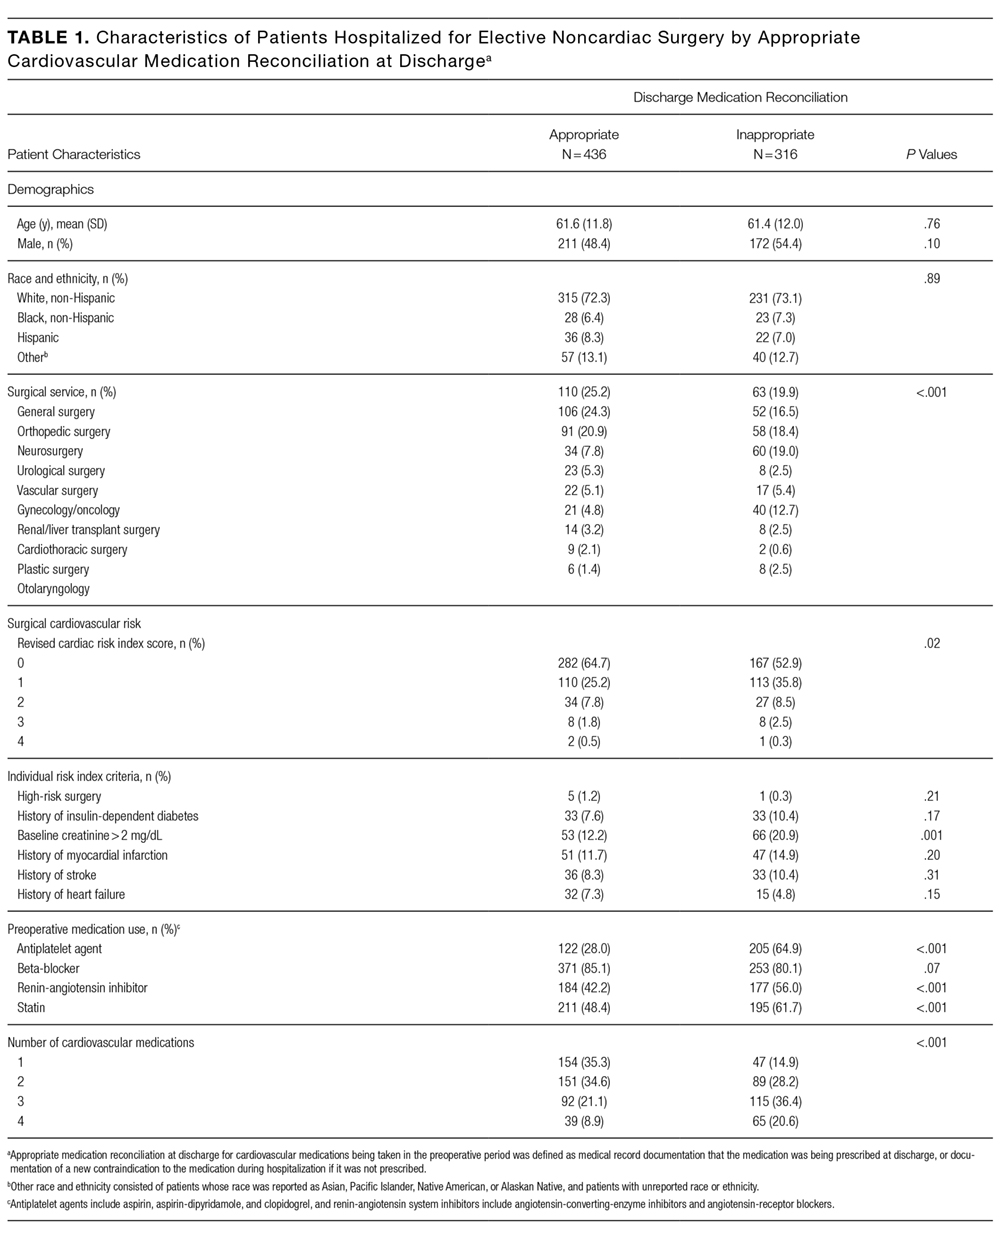
A total of 849 patients were enrolled, of which 752 (88.6%) were taking at least 1 of the specified cardiovascular medications in the preoperative period. Their mean age was 61.5; 50.9% were male, 72.6% were non-Hispanic white, and 89.4% had RCRI scores of 0 or 1 (Table 1). The majority (63.8%) were undergoing general surgery, orthopedic surgery, or neurosurgery procedures. In the preoperative period, 327 (43.5%) patients were taking antiplatelet agents, 624 (83.0%) were taking beta-blockers, 361 (48.0%) were taking renin-angiotensin system inhibitors, and 406 (54.0%) were taking statins (Table 2). Among patients taking antiplatelet agents, 271 (82.9%) were taking aspirin alone, 21 (6.4%) were taking clopidogrel alone, and 35 (10.7%) were taking dual antiplatelet therapy with aspirin and clopidogrel. Nearly three-quarters of the patients (551, 73.3%) were taking medications from 2 or more classes, and the proportion of patients with inappropriate reconciliation increased with the number of preoperative cardiovascular medications.
Patients with and without appropriate reconciliation of all preoperative cardiovascular medications were similar in age, sex, and race/ethnicity (Table 1). Patients with inappropriate reconciliation of at least 1 medication were more likely to be on the urology and renal/liver transplant surgical services, have higher RCRI scores, and be taking antiplatelet agents, statins, renin-angiotensin system inhibitors, and 3 or more cardiovascular medications in the preoperative period.
Appropriate Medication Reconciliation
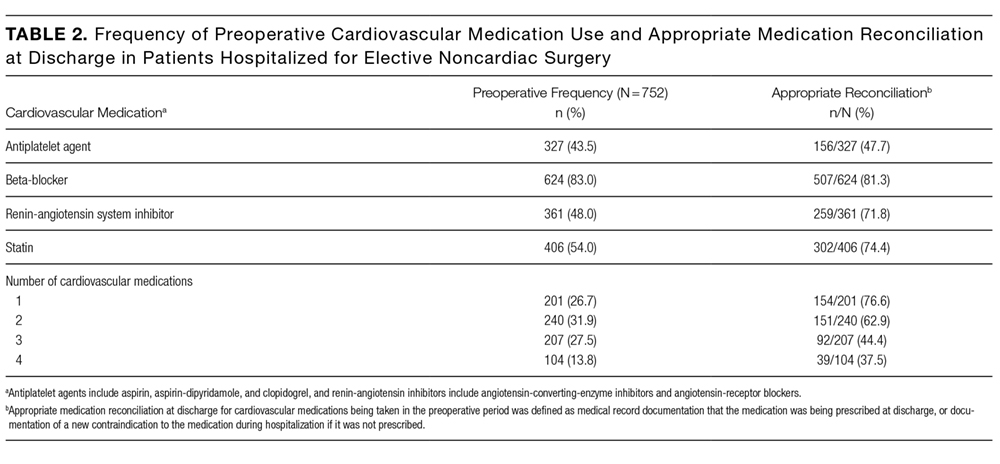
Four hundred thirty-six patients (58.0%) had their baseline cardiovascular medications appropriately reconciled. Among all patients with appropriately reconciled medications, 1 (0.2%) had beta-blockers discontinued due to a documented episode of hypotension; 17 (3.9%) had renin-angiotensin system inhibitors discontinued due to episodes of acute kidney injury, hypotension, or hyperkalemia; and 1 (0.2%) had antiplatelet agents discontinued due to bleeding. For individual medications, appropriate reconciliation between the preoperative and discharge periods occurred for 156 of the 327 patients on antiplatelet agents (47.7%), 507 of the 624 patients on beta-blockers (81.3%), 259 of the 361 patients on renin-angiotensin system inhibitors (71.8%), and 302 of the 406 patients on statins (74.4%; Table 2).
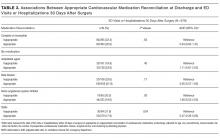
Associations Between Medication Reconciliation and Outcomes
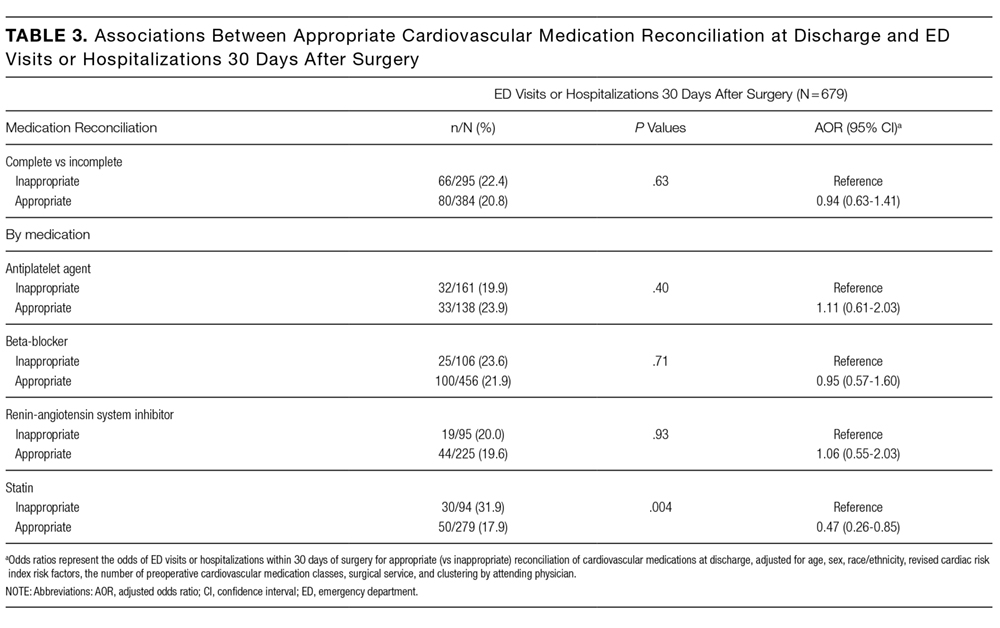
Thirty-day outcome data on acute hospital visits were available for 679 (90.3%) patients. Of these, 146 (21.5%) were seen in the ED or were hospitalized, and 111 (16.3%) were seen for an unplanned primary care or surgical outpatient visit at 30 days after surgery. Patients with incomplete outcome data were more likely to have complete medication reconciliation compared with those with complete outcome data (71.2% vs 56.6%, P = 0.02). As shown in Table 3, the proportion of patients with 30-day acute hospital visits was nonstatistically significantly lower in patients with complete medication reconciliation (20.8% vs 22.4%, P = 0.63) and the appropriate reconciliation of beta-blockers (21.9% vs 23.6%, P = 0.71) and renin-angiotensin system inhibitors (19.6% vs 20.0%, P = 0.93), and nonsignificantly higher with the appropriate reconciliation of antiplatelet agents (23.9% vs 19.9%, P = 0.40). Acute hospital visits were statistically significantly lower with the appropriate reconciliation of statins (17.9% vs 31.9%, P = 0.004).
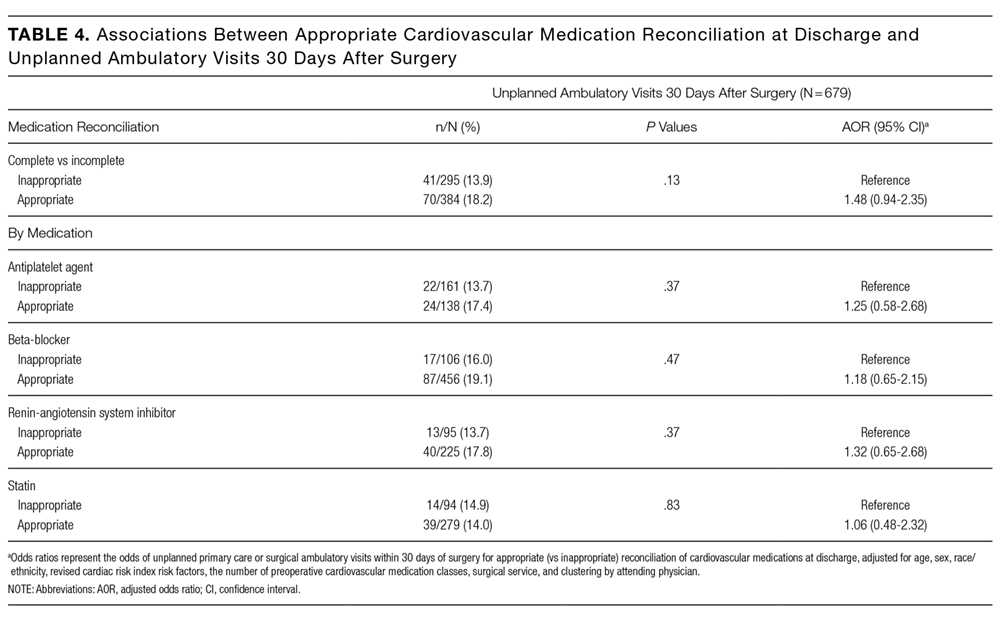
Sensitivity Analysis
Overall, 430 (57.2%) patients had complete cardiovascular medication continuity without considering potential contraindications during hospitalization. Associations between medication continuity and acute hospital and ambulatory visits were similar to the primary analyses.
DISCUSSION
In this study of 752 patients hospitalized for elective noncardiac surgery, we found significant gaps in the appropriate reconciliation of commonly prescribed cardiovascular medications, with inappropriate discontinuation ranging from 18.8% to 52.3% for individual medications. Unplanned postdischarge healthcare utilization was high, with acute hospital visits documented in 21.5% of patients and unplanned ambulatory visits in 16.3% at 30 days after surgery. However, medication reconciliation gaps were not consistently associated with ED visits, hospitalizations, or unplanned ambulatory visits.
Our finding of large gaps in postoperative medication reconciliation is consistent with existing studies of medication reconciliation in surgical patients.9,10,18 One study found medication discrepancies in 40.2% of postoperative patients receiving usual care and discrepancies judged to have the potential to cause harm (such as the omission of beta-blockers) in 29.9%.9 Consistent with our findings, this study also found that most postoperative medication discrepancies were omissions in reordering home medications, though at a rate somewhat higher than those seen in medical patients at discharge.5 While hospitalization by itself increases the risk of unintentional discontinuation of chronic medications,3 our results, along with existing literature, suggest that the risk for omission of chronic medications is unacceptably high.
We also found significant variation in reconciliation among cardiovascular medications, with appropriate reconciliation occurring least frequently for antiplatelet agents and most frequently for beta-blockers. The low rates of appropriate reconciliation for antiplatelet agents may be attributable to deliberate withholding of antiplatelet therapy in the postoperative period based on clinical assessments of surgical bleeding risk in the absence of active bleeding. Perioperative management of antiplatelet agents for noncardiac surgery remains an unclear and controversial topic, which may also contribute to the variation noted.19 Conversely, beta-blockers demonstrated high rates of preoperative use (over 80% of patients) and appropriate reconciliation. Both findings are likely attributable in part to the timing of the study, which began prior to the publication of the Perioperative Ischemic Evaluation trial, which more definitively demonstrated the potential harms of perioperative beta-blocker therapy.20
Despite a high proportion of patients with discontinuous medications at discharge, we found no associations between the appropriate reconciliation of beta-blockers, renin-angiotensin system inhibitors, and antiplatelet agents and acute hospital or ambulatory visits in the first 30 days after discharge. One explanation for this discrepancy is that, although we focused on cardiovascular medications commonly implicated in acute hospital visits, the vast majority of patients in our study had low perioperative cardiovascular risk as assessed by the RCRI. Previous studies have demonstrated that the benefit of perioperative beta-blocker therapy is predominantly in patients with moderate to high perioperative cardiovascular risk.21,22 It is possible that the detrimental effects of the discontinuation of chronic cardiovascular medications are more prominent in populations at a higher risk of perioperative cardiovascular complications or that complications will occur later than 30 days after discharge. Similarly, while the benefits of continuation of renin-angiotensin system inhibitors are less clear,23 few patients in our cohort had a history of congestive heart failure (6.3%) or coronary artery disease (13.0%), 2 conditions in which the impact of perioperative discontinuation of renin-angiotensin inhibitor or beta-blocker therapy would likely be more pronounced.24,25 An additional explanation for the lack of associations is that, while multiple studies have demonstrated that medication errors are common, the proportion of errors with the potential for harm is much lower, and the proportion that causes actual harm is lower still.5,26,27 Thus, while we likely captured high-severity medication errors leading to acute hospital or unplanned ambulatory visits, we would not have captured medication errors with lower severity clinical consequences that did not result in medical encounters.
We did find an association between the continuation of statin therapy and reduced ED visits and hospitalizations. This finding is supported by previous studies of patients undergoing noncardiac surgery, including 1 demonstrating an association between immediate postoperative statin therapy and reduced in-hospital mortality28 and another study demonstrating an association between postoperative statin therapy and reductions in a composite endpoint of 30-day mortality, atrial fibrillation, and nonfatal myocardial infarction.29 Alternatively, this finding could reflect the effects of unaddressed confounding by factors contributing to statin discontinuation and poor health outcomes leading to acute hospital visits, such as acute elevations in liver enzymes.
Our study has important implications for patients undergoing elective noncardiac surgery and the healthcare providers caring for them. First, inappropriate omissions of chronic cardiovascular medications at discharge are common; clinicians should increase their general awareness and focus on appropriately reconciling these medications, for even if our results do not connect medication discontinuity to readmissions or unexpected clinical encounters, their impact on patients’ understanding of their medications remains a potential concern. Second, the overall high rates of unplanned postdischarge healthcare utilization in this study highlight the need for close postdischarge monitoring of patients undergoing elective surgical procedures and for further research to identify preventable etiologies of postdischarge healthcare utilization in this population. Third, further study is needed to identify specific patient populations and medication classes, in which appropriate reconciliation is associated with patient outcomes that may benefit from more intensive discharge medication reconciliation interventions.
Our study has limitations. First, the majority of patients in this single-center study were at low risk of perioperative cardiovascular events, and our results may not be generalizable to higher-risk patients undergoing elective surgery. Second, discharge reconciliation was based on documentation of medication reconciliation and not on patient-reported medication adherence. In addition, the ability to judge the accuracy of discharge medication reconciliation is in part dependent on the accuracy of the admission medication reconciliation. Thus, although we used preoperative medication regimens documented during preadmission visits to comprehensive preoperative clinics for comparison, discrepancies in these preoperative regimens could have affected our analysis of appropriate discharge reconciliation. Third, inadequate documentation of clinical reasons for discontinuing medications may have led to residual confounding by indication in our observational study. Finally, the outcomes available to us may have been relatively insensitive to other adverse effects of medication discontinuity, such as patient symptoms (eg, angina severity), patient awareness of medications, or work placed on primary care physicians needing to “clean up” erroneous medication lists.
In conclusion, gaps in appropriate discharge reconciliation of chronic cardiovascular medications were common but not consistently associated with postdischarge acute hospital or unplanned ambulatory visits in a relatively low-risk cohort of patients undergoing elective surgery. While appropriate medication reconciliation should always be a priority, further study is needed to identify medication reconciliation approaches associated with postdischarge healthcare utilization and other patient outcomes.
Disclosure
Dr. Lee reports receiving grant support from the Health Resources and Services Administration (T32HP19025). Dr. Vittinghoff reports receiving grant support from the Agency for Healthcare Research and Quality. Dr. Auerbach and Dr. Fleischmann report receiving grant support from the National Institutes of Health. Dr. Auerbach also reports receiving honorarium as Editor-in-Chief of the Journal of Hospital Medicine. Dr. Corbett reports receiving grant and travel support from Simon Fraser University. The remaining authors have no disclosures to report.
1. The Joint Commission. National Patient Safety Goals. 2016; https://www.jointcommission.org/standards_information/npsgs.aspx. Accessed June 21, 2016.
2. Institute for Healthcare Improvement. Medication Reconciliation to Prevent Adverse Drug Events. 2016; http://www.ihi.org/topics/ADEsMedicationReconciliation/Pages/default.aspx. Accessed June 24, 2016.
3. Bell CM, Brener SS, Gunraj N, et al. Association of ICU or hospital admission with unintentional discontinuation of medications for chronic diseases. JAMA. 2011;306(8):840-847. PubMed
4. Coleman EA, Smith JD, Raha D, Min SJ. Posthospital medication discrepancies: prevalence and contributing factors. Arch Intern Med. 2005;165(16):1842-1847. PubMed
5. Wong JD, Bajcar JM, Wong GG, et al. Medication reconciliation at hospital discharge: evaluating discrepancies. Ann Pharmacother. 2008;42(10):1373-1379. PubMed
6. Forster AJ, Clark HD, Menard A, et al. Adverse events among medical patients after discharge from hospital. CMAJ. 2004;170(3):345-349. PubMed
7. Forster AJ, Murff HJ, Peterson JF, Gandhi TK, Bates DW. The incidence and severity of adverse events affecting patients after discharge from the hospital. Ann Intern Med. 2003;138(3):161-167. PubMed
8. Forster AJ, Murff HJ, Peterson JF, Gandhi TK, Bates DW. Adverse drug events occurring following hospital discharge. JGIM. 2005;20(4):317-323. PubMed
9. Kwan Y, Fernandes OA, Nagge JJ, et al. Pharmacist medication assessments in a surgical preadmission clinic. Arch Intern Med. 2007;167(10):1034-1040. PubMed
10. Unroe KT, Pfeiffenberger T, Riegelhaupt S, Jastrzembski J, Lokhnygina Y, Colon-Emeric C. Inpatient Medication Reconciliation at Admission and Discharge: A Retrospective Cohort Study of Age and Other Risk Factors for Medication Discrepancies. Am J Geriatr Pharmacother. 2010;8(2):115-126. PubMed
11. CDC - National Center for Health Statistics. Fast Stats: Inpatient Surgery. http://www.cdc.gov/nchs/fastats/inpatient-surgery.htm. Accessed on June 24, 2016.
12. Fleisher LA, Fleischmann KE, Auerbach AD, et al. 2014 ACC/AHA guideline on perioperative cardiovascular evaluation and management of patients undergoing noncardiac surgery: a report of the American College of Cardiology/American Heart Association Task Force on Practice Guidelines. Circulation. 2014;130(24):e278-e333. PubMed
13. Budnitz DS, Lovegrove MC, Shehab N, Richards CL. Emergency hospitalizations for adverse drug events in older Americans. N Engl J Med. 2011;365(21):2002-2012. PubMed
14. Budnitz DS, Pollock DA, Weidenbach KN, Mendelsohn AB, Schroeder TJ, Annest JL. National surveillance of emergency department visits for outpatient adverse drug events. JAMA. 2006;296(15):1858-1866. PubMed
15. Bozic KJ, Maselli J, Pekow PS, Lindenauer PK, Vail TP, Auerbach AD. The influence of procedure volumes and standardization of care on quality and efficiency in total joint replacement surgery. J Bone Joint Surg Am. 2010;92(16):2643-2652. PubMed
16. Nolan T, Berwick DM. All-or-none measurement raises the bar on performance. JAMA. 2006;295(10):1168-1170. PubMed
17. Lee TH, Marcantonio ER, Mangione CM, et al. Derivation and prospective validation of a simple index for prediction of cardiac risk of major noncardiac surgery. Circulation. 1999;100(10):1043-1049. PubMed
18. Gonzalez-Garcia L, Salmeron-Garcia A, Garcia-Lirola MA, Moya-Roldan S, Belda-Rustarazo S, Cabeza-Barrera J. Medication reconciliation at admission to surgical departments. J Eval Clin Pract. 2016;22(1):20-25. PubMed
19. Devereaux PJ, Mrkobrada M, Sessler DI, et al. Aspirin in patients undergoing noncardiac surgery. N Engl J Med. 2014;370(16):1494-1503. PubMed
20. Devereaux PJ, Yang H, Yusuf S, et al. Effects of extended-release metoprolol succinate in patients undergoing non-cardiac surgery (POISE trial): a randomised controlled trial. Lancet. 2008;371(9627):1839-1847. PubMed
21. Lindenauer PK, Pekow P, Wang K, Mamidi DK, Gutierrez B, Benjamin EM. Perioperative beta-blocker therapy and mortality after major noncardiac surgery. N Engl J Med. 2005;353(4):349-361. PubMed
22. London MJ, Hur K, Schwartz GG, Henderson WG. Association of perioperative beta-blockade with mortality and cardiovascular morbidity following major noncardiac surgery. JAMA. 2013;309(16):1704-1713. PubMed
23. Rosenman DJ, McDonald FS, Ebbert JO, Erwin PJ, LaBella M, Montori VM. Clinical consequences of withholding versus administering renin-angiotensin-aldosterone system antagonists in the preoperative period. J Hosp Med. 2008;3(4):319-325. PubMed
24. Andersson C, Merie C, Jorgensen M, et al. Association of beta-blocker therapy with risks of adverse cardiovascular events and deaths in patients with ischemic heart disease undergoing noncardiac surgery: a Danish nationwide cohort study. JAMA Intern Med. 2014;174(3):336-344. PubMed
25. Yancy CW, Jessup M, Bozkurt B, et al. 2013 ACCF/AHA Guideline for the Management of Heart Failure A Report of the American College of Cardiology Foundation/American Heart Association Task Force on Practice Guidelines. Circulation. 2013;128(16):E240-E327. PubMed
26. Kwan JL, Lo L, Sampson M, Shojania KG. Medication reconciliation during transitions of care as a patient safety strategy: a systematic review. Ann Intern Med. 2013;158(5 Pt 2):397-403. PubMed
27. Tam VC, Knowles SR, Cornish PL, Fine N, Marchesano R, Etchells EE. Frequency, type and clinical importance of medication history errors at admission to hospital: a systematic review. CMAJ. 2005;173(5):510-515. PubMed
28. Lindenauer PK, Pekow P, Wang K, Gutierrez B, Benjamin EM. Lipid-lowering therapy and in-hospital mortality following major noncardiac surgery. JAMA. 2004;291(17):2092-2099. PubMed
29. Raju MG, Pachika A, Punnam SR, et al. Statin Therapy in the Reduction of Cardiovascular Events in Patients Undergoing Intermediate-Risk Noncardiac, Nonvascular Surgery. Clin Cardiol. 2013;36(8):456-461. PubMed
Medication reconciliation at hospital discharge is a critical component of the posthospital transition of care.1 Effective reconciliation involves a clear process for documenting a current medication list, identifying and resolving discrepancies, and then documenting decisions and instructions around which medications should be continued, modified, or stopped.2 Existing studies3-5 suggest that medication discrepancies are common during hospital discharge transitions of care and lead to preventable adverse drug events, patient disability, and increased healthcare utilization following hospital discharge, including physician office visits, emergency department (ED) visits, and hospitalizations.6-8
While the majority of studies of medication discrepancies have been conducted in general medical patients, few have examined how gaps in discharge medication reconciliation might affect surgical patients.9,10 Two prior studies9,10 suggest that medication discrepancies may occur more frequently for surgical patients, compared with medical patients, particularly discrepancies in reordering home medications postoperatively, raising patient safety concerns for more than 50 million patients hospitalized for surgery each year.11 In particular, little is known about the appropriate discharge reconciliation of chronic cardiovascular medications, such as beta-blockers, renin-angiotensin system inhibitors, and statins in surgical patients, despite perioperative practice guidelines recommending continuation or rapid reinitiation of these medications after noncardiac surgery.12 Problems with chronic cardiovascular medications have been implicated as major contributors to ED visits and hospitalizations for adverse drug events,13,14 further highlighting the importance of safe and appropriate management of these medications.
To better understand the current state and impact of postoperative discharge medication reconciliation of chronic cardiovascular medications in surgical patients, we examined (1) the appropriate discharge reconciliation of 4 cardiovascular medication classes, and (2) the associations between the appropriate discharge reconciliation of these medication classes and postdischarge acute hospital and ambulatory visits in patients hospitalized for elective noncardiac surgery at an academic medical center.
METHODS
Study Design and Patient Selection
We performed a retrospective analysis of data collected as part of a cohort study of hospitalized surgical patients admitted between January 2007 and December 2011. The original study was designed to assess the impact of a social marketing intervention on guideline-appropriate perioperative beta-blocker use in surgical patients. The study was conducted at 1 academic medical center that had 2 campuses with full noncardiac operative facilities and a 600-bed total capacity. Both sites had preoperative clinics, and patients were recruited by review of preoperative clinic records. Institutional review boards responsible for all sites approved the study.
For this analysis, we included adults (age >18 years) undergoing elective noncardiac surgery, who were expected to remain hospitalized for at least 1 day and were taking antiplatelet agents (aspirin, aspirin-dipyridamole, or clopidogrel), beta-blockers, renin-angiotensin system inhibitors (angiotensin-converting-enzyme inhibitors or angiotensin-receptor blockers), or statin lipid-lowering agents.
Data Collection
Data Sources. We collected data from a structured review of medical records as well as from discharge abstract information obtained from administrative data systems. Data regarding patient demographics (age, sex, and race/ethnicity), medical history, preoperative cardiovascular medications, surgical procedure and service, and attending surgeon were obtained from a medical record review of comprehensive preoperative clinic evaluations. Data regarding complications during hospitalization were obtained from medical record review and administrative data (Supplement for International Classification of Diseases, Ninth Revision codes).15 Research assistants abstracting data were trained by using a comprehensive reference manual providing specific criteria for classifying chart abstraction data. Research assistants also were directly observed during initial chart abstractions and underwent random chart validation audits by a senior investigator to ensure consistency. Any discrepancies in coding were resolved by consensus among senior investigators.
Definition of Key Predictor: Appropriate Reconciliation. We abstracted discharge medication lists from the electronic medical record. We defined the appropriate reconciliation of cardiovascular medications at discharge as documentation in discharge instructions, medication reconciliation tools, or discharge summaries that a preadmission cardiovascular medication was being continued at discharge, or, if the medication was not continued, documentation of a new contraindication to the medication or complication precluding its use during hospitalization. Medication continuity was considered appropriate if it was continued at discharge irrespective of changes in dosage. By using this measure for individual medications, we also assessed appropriate reconciliation as an “all-or-none” complete versus incomplete measure (appropriate reconciliation of all preoperative cardiovascular medication classes the patient was taking).16
Definition of Outcomes. Our coprimary outcomes were acute hospital visits (ED visits or hospitalizations) and unplanned ambulatory visits (primary care or surgical) at 30 days after surgery. Postoperative ambulatory visits that were not planned prior to surgery were defined as unplanned. Outcomes were ascertained by patient reports during follow-up telephone questionnaires administered by trained research staff and verified by medical record review.
Definition of Covariates. Using these data, we calculated a Revised Cardiac Risk Index (RCRI) score,17 which estimates the risk of perioperative cardiac complications in patients undergoing surgery. Through chart abstraction data supplemented by diagnosis codes from administrative data, we also constructed variables indicating occurrences of postoperative complications anytime during hospitalization that might pose contraindications to continuation of the 4 cardiovascular medication classes studied. For example, if a chart indicated that the patient had an acute rise in creatinine (elevation of baseline creatinine by 50% or absolute rise of 1 mg/dL in patients with baseline creatinine greater than 3 mg/dL) during hospitalization and a preoperative renin-angiotensin system inhibitor was not prescribed at discharge, we would have considered discontinuation appropriate. Other complications we abstracted were hypotension (systolic blood pressure less than 90 mmHg) for beta-blockers and renin-angiotensin system inhibitors, bradycardia (heart rate less than 50 bpm) for beta-blockers, acute kidney injury (defined above) and hyperkalemia for renin-angiotensin system inhibitors, and bleeding (any site) for antiplatelet agents.
Statistical Analysis
We used χ2 and Kruskal-Wallis tests to compare baseline patient characteristics. To assess associations between appropriate medication reconciliation and patient outcomes, we used multilevel mixed-effects logistic regression to account for the clustering of patients by the attending surgeon. We adjusted for baseline patient demographics, surgical service, the number of baseline cardiovascular medications, and individual RCRI criteria. We constructed separate models for all-or-none appropriate reconciliation and for each individual medication class.
As a sensitivity analysis, we constructed similar models by using a simplified definition of appropriate reconciliation based entirely on medication continuity (continued or not continued at discharge) without taking potential contraindications during hospitalization into account. For complete versus incomplete reconciliation, we also constructed models with an interaction term between the number of baseline cardiovascular medications and appropriate medication reconciliation to test the hypothesis that inappropriate reconciliation would be more likely with an increasing number of preoperative cardiovascular medications. Because this interaction term was not statistically significant, we did not include it in the final models for ease of reporting and interpretability. We performed all statistical analyses using Stata 14 (StataCorp, LLC, College Station, Texas), and used 2-sided statistical tests and a P value of less than .05 to define statistical significance.
RESULTS
Patient Characteristics
A total of 849 patients were enrolled, of which 752 (88.6%) were taking at least 1 of the specified cardiovascular medications in the preoperative period. Their mean age was 61.5; 50.9% were male, 72.6% were non-Hispanic white, and 89.4% had RCRI scores of 0 or 1 (Table 1). The majority (63.8%) were undergoing general surgery, orthopedic surgery, or neurosurgery procedures. In the preoperative period, 327 (43.5%) patients were taking antiplatelet agents, 624 (83.0%) were taking beta-blockers, 361 (48.0%) were taking renin-angiotensin system inhibitors, and 406 (54.0%) were taking statins (Table 2). Among patients taking antiplatelet agents, 271 (82.9%) were taking aspirin alone, 21 (6.4%) were taking clopidogrel alone, and 35 (10.7%) were taking dual antiplatelet therapy with aspirin and clopidogrel. Nearly three-quarters of the patients (551, 73.3%) were taking medications from 2 or more classes, and the proportion of patients with inappropriate reconciliation increased with the number of preoperative cardiovascular medications.
Patients with and without appropriate reconciliation of all preoperative cardiovascular medications were similar in age, sex, and race/ethnicity (Table 1). Patients with inappropriate reconciliation of at least 1 medication were more likely to be on the urology and renal/liver transplant surgical services, have higher RCRI scores, and be taking antiplatelet agents, statins, renin-angiotensin system inhibitors, and 3 or more cardiovascular medications in the preoperative period.
Appropriate Medication Reconciliation
Four hundred thirty-six patients (58.0%) had their baseline cardiovascular medications appropriately reconciled. Among all patients with appropriately reconciled medications, 1 (0.2%) had beta-blockers discontinued due to a documented episode of hypotension; 17 (3.9%) had renin-angiotensin system inhibitors discontinued due to episodes of acute kidney injury, hypotension, or hyperkalemia; and 1 (0.2%) had antiplatelet agents discontinued due to bleeding. For individual medications, appropriate reconciliation between the preoperative and discharge periods occurred for 156 of the 327 patients on antiplatelet agents (47.7%), 507 of the 624 patients on beta-blockers (81.3%), 259 of the 361 patients on renin-angiotensin system inhibitors (71.8%), and 302 of the 406 patients on statins (74.4%; Table 2).
Associations Between Medication Reconciliation and Outcomes
Thirty-day outcome data on acute hospital visits were available for 679 (90.3%) patients. Of these, 146 (21.5%) were seen in the ED or were hospitalized, and 111 (16.3%) were seen for an unplanned primary care or surgical outpatient visit at 30 days after surgery. Patients with incomplete outcome data were more likely to have complete medication reconciliation compared with those with complete outcome data (71.2% vs 56.6%, P = 0.02). As shown in Table 3, the proportion of patients with 30-day acute hospital visits was nonstatistically significantly lower in patients with complete medication reconciliation (20.8% vs 22.4%, P = 0.63) and the appropriate reconciliation of beta-blockers (21.9% vs 23.6%, P = 0.71) and renin-angiotensin system inhibitors (19.6% vs 20.0%, P = 0.93), and nonsignificantly higher with the appropriate reconciliation of antiplatelet agents (23.9% vs 19.9%, P = 0.40). Acute hospital visits were statistically significantly lower with the appropriate reconciliation of statins (17.9% vs 31.9%, P = 0.004).
Sensitivity Analysis
Overall, 430 (57.2%) patients had complete cardiovascular medication continuity without considering potential contraindications during hospitalization. Associations between medication continuity and acute hospital and ambulatory visits were similar to the primary analyses.
DISCUSSION
In this study of 752 patients hospitalized for elective noncardiac surgery, we found significant gaps in the appropriate reconciliation of commonly prescribed cardiovascular medications, with inappropriate discontinuation ranging from 18.8% to 52.3% for individual medications. Unplanned postdischarge healthcare utilization was high, with acute hospital visits documented in 21.5% of patients and unplanned ambulatory visits in 16.3% at 30 days after surgery. However, medication reconciliation gaps were not consistently associated with ED visits, hospitalizations, or unplanned ambulatory visits.
Our finding of large gaps in postoperative medication reconciliation is consistent with existing studies of medication reconciliation in surgical patients.9,10,18 One study found medication discrepancies in 40.2% of postoperative patients receiving usual care and discrepancies judged to have the potential to cause harm (such as the omission of beta-blockers) in 29.9%.9 Consistent with our findings, this study also found that most postoperative medication discrepancies were omissions in reordering home medications, though at a rate somewhat higher than those seen in medical patients at discharge.5 While hospitalization by itself increases the risk of unintentional discontinuation of chronic medications,3 our results, along with existing literature, suggest that the risk for omission of chronic medications is unacceptably high.
We also found significant variation in reconciliation among cardiovascular medications, with appropriate reconciliation occurring least frequently for antiplatelet agents and most frequently for beta-blockers. The low rates of appropriate reconciliation for antiplatelet agents may be attributable to deliberate withholding of antiplatelet therapy in the postoperative period based on clinical assessments of surgical bleeding risk in the absence of active bleeding. Perioperative management of antiplatelet agents for noncardiac surgery remains an unclear and controversial topic, which may also contribute to the variation noted.19 Conversely, beta-blockers demonstrated high rates of preoperative use (over 80% of patients) and appropriate reconciliation. Both findings are likely attributable in part to the timing of the study, which began prior to the publication of the Perioperative Ischemic Evaluation trial, which more definitively demonstrated the potential harms of perioperative beta-blocker therapy.20
Despite a high proportion of patients with discontinuous medications at discharge, we found no associations between the appropriate reconciliation of beta-blockers, renin-angiotensin system inhibitors, and antiplatelet agents and acute hospital or ambulatory visits in the first 30 days after discharge. One explanation for this discrepancy is that, although we focused on cardiovascular medications commonly implicated in acute hospital visits, the vast majority of patients in our study had low perioperative cardiovascular risk as assessed by the RCRI. Previous studies have demonstrated that the benefit of perioperative beta-blocker therapy is predominantly in patients with moderate to high perioperative cardiovascular risk.21,22 It is possible that the detrimental effects of the discontinuation of chronic cardiovascular medications are more prominent in populations at a higher risk of perioperative cardiovascular complications or that complications will occur later than 30 days after discharge. Similarly, while the benefits of continuation of renin-angiotensin system inhibitors are less clear,23 few patients in our cohort had a history of congestive heart failure (6.3%) or coronary artery disease (13.0%), 2 conditions in which the impact of perioperative discontinuation of renin-angiotensin inhibitor or beta-blocker therapy would likely be more pronounced.24,25 An additional explanation for the lack of associations is that, while multiple studies have demonstrated that medication errors are common, the proportion of errors with the potential for harm is much lower, and the proportion that causes actual harm is lower still.5,26,27 Thus, while we likely captured high-severity medication errors leading to acute hospital or unplanned ambulatory visits, we would not have captured medication errors with lower severity clinical consequences that did not result in medical encounters.
We did find an association between the continuation of statin therapy and reduced ED visits and hospitalizations. This finding is supported by previous studies of patients undergoing noncardiac surgery, including 1 demonstrating an association between immediate postoperative statin therapy and reduced in-hospital mortality28 and another study demonstrating an association between postoperative statin therapy and reductions in a composite endpoint of 30-day mortality, atrial fibrillation, and nonfatal myocardial infarction.29 Alternatively, this finding could reflect the effects of unaddressed confounding by factors contributing to statin discontinuation and poor health outcomes leading to acute hospital visits, such as acute elevations in liver enzymes.
Our study has important implications for patients undergoing elective noncardiac surgery and the healthcare providers caring for them. First, inappropriate omissions of chronic cardiovascular medications at discharge are common; clinicians should increase their general awareness and focus on appropriately reconciling these medications, for even if our results do not connect medication discontinuity to readmissions or unexpected clinical encounters, their impact on patients’ understanding of their medications remains a potential concern. Second, the overall high rates of unplanned postdischarge healthcare utilization in this study highlight the need for close postdischarge monitoring of patients undergoing elective surgical procedures and for further research to identify preventable etiologies of postdischarge healthcare utilization in this population. Third, further study is needed to identify specific patient populations and medication classes, in which appropriate reconciliation is associated with patient outcomes that may benefit from more intensive discharge medication reconciliation interventions.
Our study has limitations. First, the majority of patients in this single-center study were at low risk of perioperative cardiovascular events, and our results may not be generalizable to higher-risk patients undergoing elective surgery. Second, discharge reconciliation was based on documentation of medication reconciliation and not on patient-reported medication adherence. In addition, the ability to judge the accuracy of discharge medication reconciliation is in part dependent on the accuracy of the admission medication reconciliation. Thus, although we used preoperative medication regimens documented during preadmission visits to comprehensive preoperative clinics for comparison, discrepancies in these preoperative regimens could have affected our analysis of appropriate discharge reconciliation. Third, inadequate documentation of clinical reasons for discontinuing medications may have led to residual confounding by indication in our observational study. Finally, the outcomes available to us may have been relatively insensitive to other adverse effects of medication discontinuity, such as patient symptoms (eg, angina severity), patient awareness of medications, or work placed on primary care physicians needing to “clean up” erroneous medication lists.
In conclusion, gaps in appropriate discharge reconciliation of chronic cardiovascular medications were common but not consistently associated with postdischarge acute hospital or unplanned ambulatory visits in a relatively low-risk cohort of patients undergoing elective surgery. While appropriate medication reconciliation should always be a priority, further study is needed to identify medication reconciliation approaches associated with postdischarge healthcare utilization and other patient outcomes.
Disclosure
Dr. Lee reports receiving grant support from the Health Resources and Services Administration (T32HP19025). Dr. Vittinghoff reports receiving grant support from the Agency for Healthcare Research and Quality. Dr. Auerbach and Dr. Fleischmann report receiving grant support from the National Institutes of Health. Dr. Auerbach also reports receiving honorarium as Editor-in-Chief of the Journal of Hospital Medicine. Dr. Corbett reports receiving grant and travel support from Simon Fraser University. The remaining authors have no disclosures to report.
1. The Joint Commission. National Patient Safety Goals. 2016; https://www.jointcommission.org/standards_information/npsgs.aspx. Accessed June 21, 2016.
2. Institute for Healthcare Improvement. Medication Reconciliation to Prevent Adverse Drug Events. 2016; http://www.ihi.org/topics/ADEsMedicationReconciliation/Pages/default.aspx. Accessed June 24, 2016.
3. Bell CM, Brener SS, Gunraj N, et al. Association of ICU or hospital admission with unintentional discontinuation of medications for chronic diseases. JAMA. 2011;306(8):840-847. PubMed
4. Coleman EA, Smith JD, Raha D, Min SJ. Posthospital medication discrepancies: prevalence and contributing factors. Arch Intern Med. 2005;165(16):1842-1847. PubMed
5. Wong JD, Bajcar JM, Wong GG, et al. Medication reconciliation at hospital discharge: evaluating discrepancies. Ann Pharmacother. 2008;42(10):1373-1379. PubMed
6. Forster AJ, Clark HD, Menard A, et al. Adverse events among medical patients after discharge from hospital. CMAJ. 2004;170(3):345-349. PubMed
7. Forster AJ, Murff HJ, Peterson JF, Gandhi TK, Bates DW. The incidence and severity of adverse events affecting patients after discharge from the hospital. Ann Intern Med. 2003;138(3):161-167. PubMed
8. Forster AJ, Murff HJ, Peterson JF, Gandhi TK, Bates DW. Adverse drug events occurring following hospital discharge. JGIM. 2005;20(4):317-323. PubMed
9. Kwan Y, Fernandes OA, Nagge JJ, et al. Pharmacist medication assessments in a surgical preadmission clinic. Arch Intern Med. 2007;167(10):1034-1040. PubMed
10. Unroe KT, Pfeiffenberger T, Riegelhaupt S, Jastrzembski J, Lokhnygina Y, Colon-Emeric C. Inpatient Medication Reconciliation at Admission and Discharge: A Retrospective Cohort Study of Age and Other Risk Factors for Medication Discrepancies. Am J Geriatr Pharmacother. 2010;8(2):115-126. PubMed
11. CDC - National Center for Health Statistics. Fast Stats: Inpatient Surgery. http://www.cdc.gov/nchs/fastats/inpatient-surgery.htm. Accessed on June 24, 2016.
12. Fleisher LA, Fleischmann KE, Auerbach AD, et al. 2014 ACC/AHA guideline on perioperative cardiovascular evaluation and management of patients undergoing noncardiac surgery: a report of the American College of Cardiology/American Heart Association Task Force on Practice Guidelines. Circulation. 2014;130(24):e278-e333. PubMed
13. Budnitz DS, Lovegrove MC, Shehab N, Richards CL. Emergency hospitalizations for adverse drug events in older Americans. N Engl J Med. 2011;365(21):2002-2012. PubMed
14. Budnitz DS, Pollock DA, Weidenbach KN, Mendelsohn AB, Schroeder TJ, Annest JL. National surveillance of emergency department visits for outpatient adverse drug events. JAMA. 2006;296(15):1858-1866. PubMed
15. Bozic KJ, Maselli J, Pekow PS, Lindenauer PK, Vail TP, Auerbach AD. The influence of procedure volumes and standardization of care on quality and efficiency in total joint replacement surgery. J Bone Joint Surg Am. 2010;92(16):2643-2652. PubMed
16. Nolan T, Berwick DM. All-or-none measurement raises the bar on performance. JAMA. 2006;295(10):1168-1170. PubMed
17. Lee TH, Marcantonio ER, Mangione CM, et al. Derivation and prospective validation of a simple index for prediction of cardiac risk of major noncardiac surgery. Circulation. 1999;100(10):1043-1049. PubMed
18. Gonzalez-Garcia L, Salmeron-Garcia A, Garcia-Lirola MA, Moya-Roldan S, Belda-Rustarazo S, Cabeza-Barrera J. Medication reconciliation at admission to surgical departments. J Eval Clin Pract. 2016;22(1):20-25. PubMed
19. Devereaux PJ, Mrkobrada M, Sessler DI, et al. Aspirin in patients undergoing noncardiac surgery. N Engl J Med. 2014;370(16):1494-1503. PubMed
20. Devereaux PJ, Yang H, Yusuf S, et al. Effects of extended-release metoprolol succinate in patients undergoing non-cardiac surgery (POISE trial): a randomised controlled trial. Lancet. 2008;371(9627):1839-1847. PubMed
21. Lindenauer PK, Pekow P, Wang K, Mamidi DK, Gutierrez B, Benjamin EM. Perioperative beta-blocker therapy and mortality after major noncardiac surgery. N Engl J Med. 2005;353(4):349-361. PubMed
22. London MJ, Hur K, Schwartz GG, Henderson WG. Association of perioperative beta-blockade with mortality and cardiovascular morbidity following major noncardiac surgery. JAMA. 2013;309(16):1704-1713. PubMed
23. Rosenman DJ, McDonald FS, Ebbert JO, Erwin PJ, LaBella M, Montori VM. Clinical consequences of withholding versus administering renin-angiotensin-aldosterone system antagonists in the preoperative period. J Hosp Med. 2008;3(4):319-325. PubMed
24. Andersson C, Merie C, Jorgensen M, et al. Association of beta-blocker therapy with risks of adverse cardiovascular events and deaths in patients with ischemic heart disease undergoing noncardiac surgery: a Danish nationwide cohort study. JAMA Intern Med. 2014;174(3):336-344. PubMed
25. Yancy CW, Jessup M, Bozkurt B, et al. 2013 ACCF/AHA Guideline for the Management of Heart Failure A Report of the American College of Cardiology Foundation/American Heart Association Task Force on Practice Guidelines. Circulation. 2013;128(16):E240-E327. PubMed
26. Kwan JL, Lo L, Sampson M, Shojania KG. Medication reconciliation during transitions of care as a patient safety strategy: a systematic review. Ann Intern Med. 2013;158(5 Pt 2):397-403. PubMed
27. Tam VC, Knowles SR, Cornish PL, Fine N, Marchesano R, Etchells EE. Frequency, type and clinical importance of medication history errors at admission to hospital: a systematic review. CMAJ. 2005;173(5):510-515. PubMed
28. Lindenauer PK, Pekow P, Wang K, Gutierrez B, Benjamin EM. Lipid-lowering therapy and in-hospital mortality following major noncardiac surgery. JAMA. 2004;291(17):2092-2099. PubMed
29. Raju MG, Pachika A, Punnam SR, et al. Statin Therapy in the Reduction of Cardiovascular Events in Patients Undergoing Intermediate-Risk Noncardiac, Nonvascular Surgery. Clin Cardiol. 2013;36(8):456-461. PubMed
© 2017 Society of Hospital Medicine
Influenza Season Hospitalization Trends in Israel: A Multi-Year Comparative Analysis 2005/2006 Through 2012/2013
Influenza-associated morbidity poses a significant hospital burden.1 A study from the United States estimated that seasonal influenza is responsible for 3.1 million hospitalization days per year.2
Assessment of hospital burden during influenza seasons presents a challenge due to several possible factors, such as inaccurate recording of diagnosis3 and incomplete age group data. Although great emphasis has historically been placed on older age groups, a study from England and Wales showed that the number of hospitalizations and deaths resulting from influenza was significantly higher in children as compared with adults.4 Moreover, excess visits to emergency departments in New York City because of fever and respiratory morbidity during influenza seasons were found mostly among school-age children, whereas in adults, the surplus was small to nonexistent.5
Studies examining influenza-related hospitalizations evaluated numbers and rates of hospitalization.6-11 However, information regarding length of hospitalizations, hospitalizations during the influenza season that were not influenza related, or comparisons between influenza seasons and summer seasons is scarce. These determinants are of great importance for hospital preparedness towards influenza seasons. The aim of the current study was to estimate excess hospitalizations and length of hospitalization during influenza seasons, as compared with the summer, in different age groups and selected diagnoses in Israel.
METHODS
Data Sources
Hospitalization data of internal medicine and pediatric departments in 28 acute care hospitals in Israel between 2005 and 2013 were obtained from the National Hospital Discharges Database managed by the Health Information Division (HID) in the Israel Ministry of Health (MOH). The information included number of discharges (including in-hospital deaths), number of hospitalization days, and the mean length of stay (LOS) per discharge for all diagnoses and for primary or secondary diagnoses of respiratory/cardiovascular disease (ICD9 390-519) and influenza/pneumonia (ICD9 480-487).
Bed occupancy rates for internal medicine and pediatric departments were based on the National Patient Flow Database managed by the HID.
The 2009-2010 pandemic influenza season was excluded from analysis due to different morbidity patterns and timing (April 2009 until August 2010) as compared with seasonal influenza.
Data Classification
Hospitalizations data were analyzed for all ages, for specific age groups (the first year of life [0], ages 1-4, 5-14, 15-24, 25-34, 35-44, 45-54, 55-64, 65-74, 75-84, and 85 years and older), for all diagnoses, and for primary or secondary discharge diagnosis of respiratory/cardiovascular disease (ICD9 390-519) and influenza/pneumonia (ICD9 480-487).
Duration of Influenza Season
The beginning and the end of the influenza season were determined by the National Influenza surveillance program, which includes on average 22 community sentinel clinics, throughout Israel, each influenza season. These clinics send nose-throat samples from a convenience sample of patients with influenza-like illness (ILI), from week 40 of each year until the end of the influenza season in the subsequent year. These samples are analyzed for the presence of influenza virus by real-time reverse transcription polymerase chain reaction (RT-PCR) at the Central Virology Laboratory of Israel. Based on influenza virus detection in nose-throat samples from patients with ILI attending the community sentinel clinics, we determined the first and last month of each influenza season. The first month in which positive influenza samples were identified in sequence was defined as the first month of the season. The month in which the sequence of positive influenza samples stopped was defined as the last month of the season.
The 2009-2010 pandemic influenza season was excluded from analysis due to different morbidity patterns and timing (April 2009 until August 2010) as compared with seasonal influenza.
Data Analysis
Rates. Rates of monthly hospitalizations and monthly hospitalization days were calculated per 100,000 residents for all ages and for the specific age groups. Estimated average population sizes in different years for all ages and for specific age groups were obtained from the Central Bureau of Statistics (http://www.cbs.gov.il/reader/shnaton/templ_shnaton.html?num_tab=st02_01&CYear=2014). Monthly LOS was not converted to rates.
Hospitalizations. Mean monthly rate of hospitalizations during influenza and summer seasons was calculated by dividing the sum of hospital discharge rates during influenza/summer seasons of the entire evaluation period (2005/2006 to 2012/2013) by the number of influenza/summer activity months of that period.
Hospitalization Days. The measure “hospitalization days” refers to the hospitalization days of all patients who were discharged during influenza seasons. Mean monthly rate of hospitalization days during the influenza season and summer season was calculated using the procedure described for monthly mean rate of hospitalizations.
Length of Stay. The measure “length of stay” refers to the number of days that individual patients stayed in the hospital during an admission in the evaluated seasons.
Mean monthly LOS during the influenza and summer seasons for all patients (in both internal medicine and pediatric departments) and by age group was calculated by dividing the sum of monthly LOS during influenza seasons/summer season of the entire evaluation period (2005/2006 to 2012/2013 except for the 2009/2010 season) by the number of influenza/summer activity months of that period.
LOS for each specific month of the evaluation period for a single patient was calculated by dividing the number of hospitalization days of all patients that were discharged that month (stratified by age group) by the number of discharges in the same month.
Bed Occupancy. Bed occupancy rates for internal medicine and pediatric departments of the seasons evaluated were computed as a weighted rate based on the hospitalization days and licensed inpatient beds for the period of each influenza and summer season. The calculation took into account the number of days of each month and was based on the monthly reporting of hospital inpatient days in these departments and on the number of inpatient beds according to standard license documents issued by the MOH for each hospital.
Difference Between Influenza and Summer Seasons. Differences in mean monthly rates of hospitalizations, mean monthly rate of hospitalization days, and LOS during influenza seasons and the preceding summer were calculated as absolute numbers per month and as a percentage. The difference between bed occupancy during the influenza seasons and the preceding summers was expressed in percentage. Differences were computed for all diagnoses and for ICD9 480-487 and 390-519.
Statistical Analysis
Mean and standard deviation for monthly hospitalization rates, rates of monthly hospitalization days, and for LOS were calculated for all the influenza and summer seasons that were evaluated. Differences and statistical significance for these parameters were evaluated using a two-tailed Wilcoxon-Mann-Whitney test adjusted for ties, with 95% confidence interval for mean locations. The null hypothesis of the Wilcoxon test used was that the mean ranks of the influenza and summer season observations were equal.
Mean of bed occupancy percentage was calculated for influenza and summer seasons, with the difference and statistical significance being evaluated using a χ2 test. P value of < 0.05 was considered statistically significant. SAS Version 9.1 and R program version 3.3.1 software were used for analysis.
RESULTS

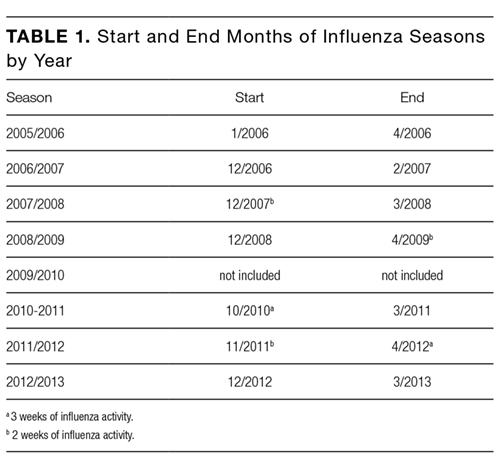
Influenza Seasons
The length of influenza seasons varied, with the shortest season lasting 3 months (2006-2007) and the longest season lasting six months (2010-2011 and 2011-2012; Table 1). Of the 14 first and last months of the 7 influenza seasons, 9 had influenza activity throughout the month, 2 had 3 weeks of influenza activity, and 3 had 2 weeks of influenza activity (Table 1).
Hospitalizations
A total of 452,209 hospital discharges occurred in pediatric and internal medicine departments during the influenza seasons that were evaluated. The mean monthly rate of hospitalizations (as defined in M
The mean monthly rate of hospitalizations for all ages due to the diagnosis of respiratory/cardiovascular diseases and influenza/pneumonia was 18.6% and 60.8% higher, respectively, during influenza seasons compared with the preceding summers (panels B and C in Figure). These differences were statistically significant (panels B and C in Figure; Supplementary Table 1).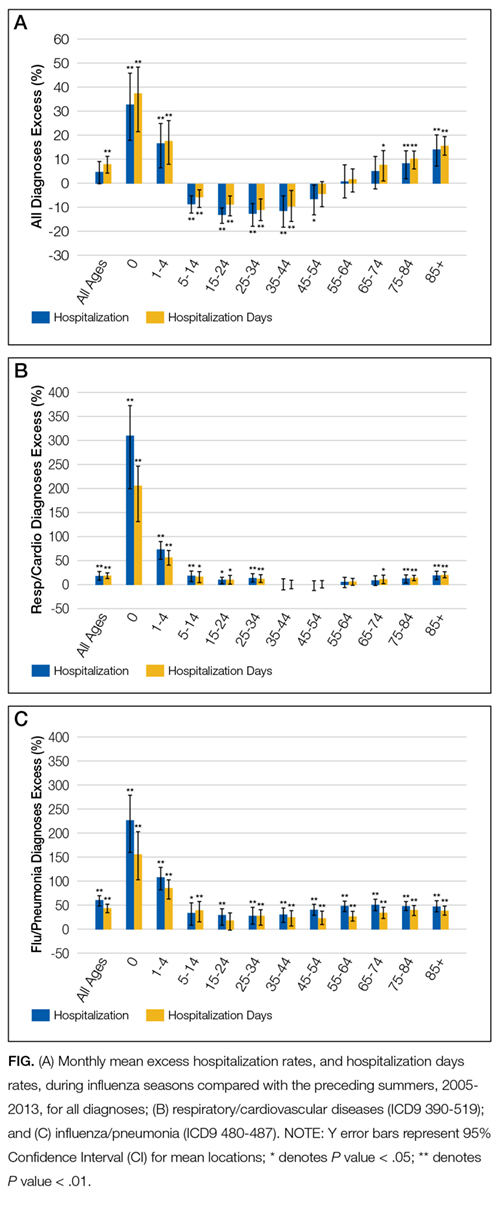
The increase in mean monthly hospitalization rates for patients with a diagnosis of respiratory/cardiovascular diseases and pneumonia/influenza was highest among infants <1 year and children aged 1-4 years (panels B and C in Figure; Supplementary Table 1). Increases were also observed among other age groups. However, they were more modest and reached statistical significance for respiratory/cardiovascular diseases in the age groups of ≤34 years and ≥75 years (panel B in Figure; Supplementary Table 1). The increases in mean monthly hospitalization rates for pneumonia/influenza were statistically significant in all age groups and were greater than 40% among adults ≥55 years (panel C in Figure; Supplementary Table 1).
Statistically significant decreases in mean monthly hospitalization rates during influenza seasons were observed for all diagnoses in the 5-54 age groups (panel A in Figure; Supplementary Table 1). Decreases were not seen for the diagnoses of respiratory/cardiovascular diseases or pneumonia/influenza (panels B and C in Figure; Supplementary Table 1).
Hospitalization Days
The mean monthly rate of hospitalization days per 100,000 residents showed a similar trend to that of the hospitalization rates (panels A, B, and C in Figure; Supplementary Table 2), with the most prominent increases observed among infants and children <5 years and adults ≥65 years.
The mean monthly rate of hospitalization days per 100,000 during influenza seasons for all ages due to all diagnoses was 8% higher (P < 0.001) as compared with the summer seasons (panel A in Figure; Supplementary Table 2). Statistically significant increases were also found among patients diagnosed with respiratory/cardiovascular diseases and for influenza/pneumonia (panels B and C in Figure; Supplementary Table 2).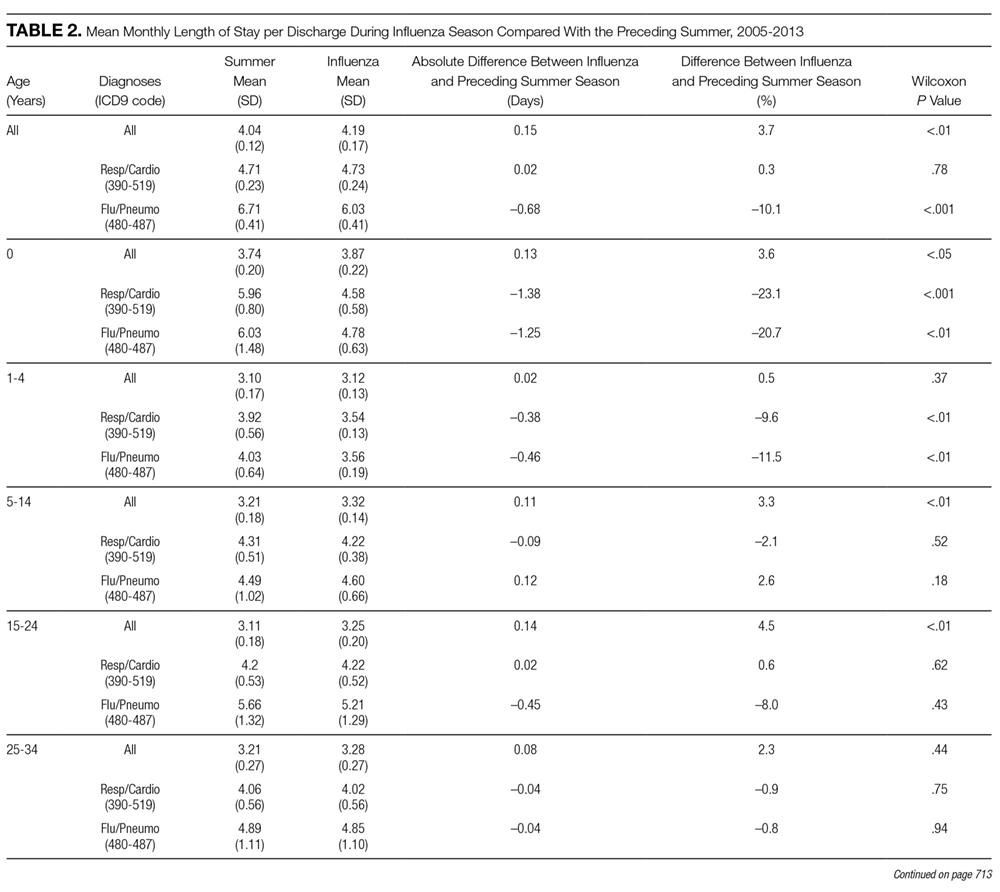
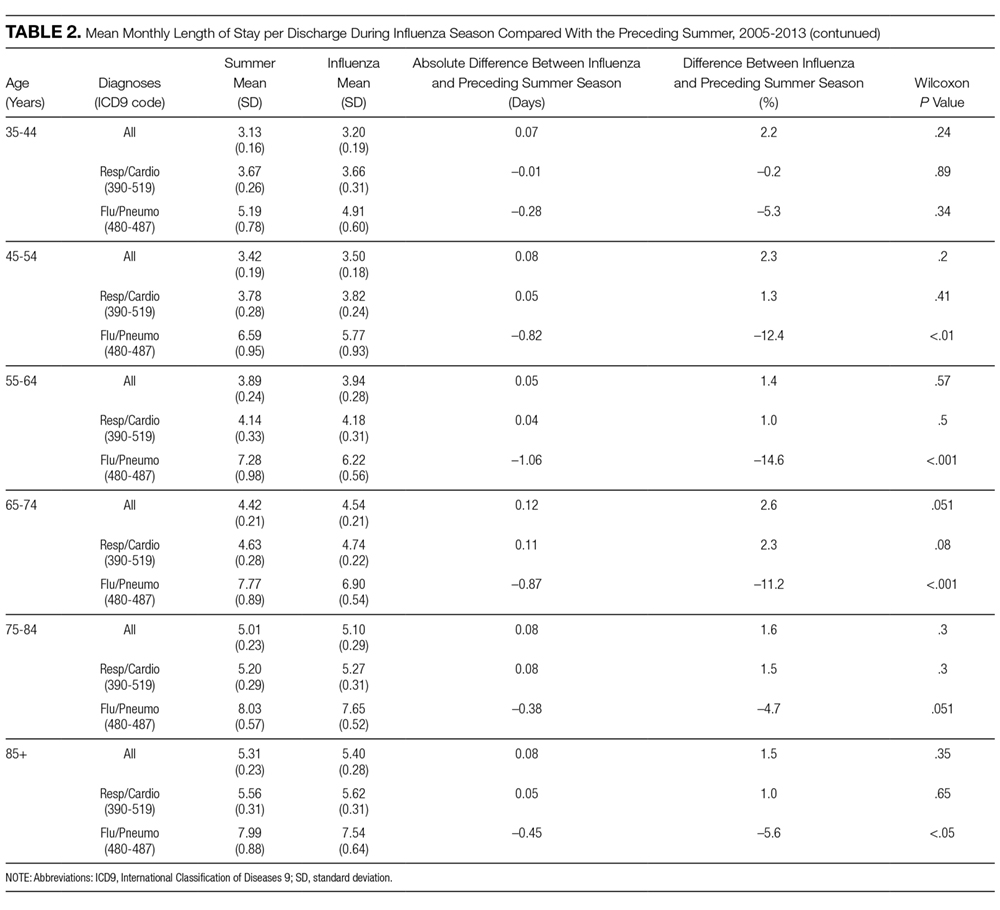
Children <5 years of age showed the largest increases during the influenza season as compared with the summer, with an up to 155.9% increase in the mean monthly rate of hospitalization days due to influenza/pneumonia (panel C in Figure; Supplementary Table 2), and an up to 206.6% increase for respiratory/cardiovascular diseases in infants <1 year of age (panel B in Figure; Supplementary Table 2). In adults, the largest increases were observed among those ≥75 years; the rates for influenza/pneumonia increased by about 40% (panel C in Figure; Supplementary Table 2), and the rates for respiratory/cardiovascular diseases increased by 14.8%-20.7% as compared with the summer months (panel B in Figure; Supplementary Table 2).
Statistically significant decreases in monthly mean rate of hospitalization days during influenza seasons were observed for all diagnoses in the 5-54 age groups (panel A in Figure; Supplementary Table 2). Decreases were not seen for the diagnoses of respiratory/cardiovascular diseases or influenza/pneumonia (panels B and C in Figure; Supplementary Table 2).
Hospital Length of Stay
The longest mean monthly LOS due to all diagnoses (for both influenza and summer seasons) was observed in adults ≥65 years of age (Table 2). The longest mean monthly LOS due to influenza/pneumonia (for both influenza and summer seasons) was observed in adults ≥55 years or older, and for the diagnosis of respiratory/cardiovascular diseases, infants <1 year and adults ≥55 years had the longest LOS.
The differences between influenza and summer seasons in mean monthly LOS were mostly small or not observed in any of the diagnostic categories examined. The mean monthly LOS due to a diagnosis of influenza/pneumonia was shorter during the influenza seasons than summer seasons in most age groups. These differences were statistically significant in children <5 years and adults ≥45 years (Table 2).
The mean LOS due to respiratory/cardiovascular diseases was significantly shorter during influenza seasons than summer seasons in children under 5.
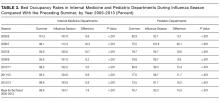
Bed Occupancy
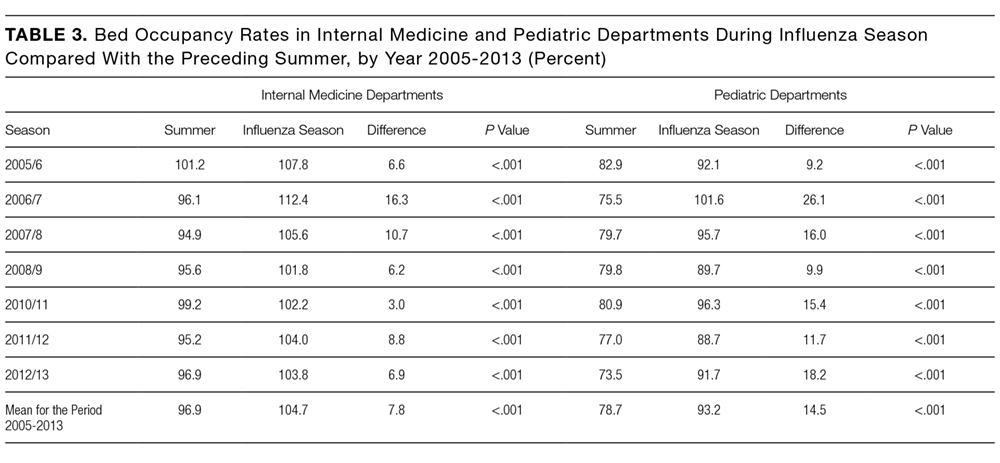
Mean bed occupancy was significantly higher during influenza seasons compared with the preceding summer seasons, both in internal medicine and pediatric departments (Table 3). The differences were higher in pediatric departments as compared with internal medicine departments for most years evaluated.
DISCUSSION
Our study demonstrates trends of excess hospitalizations during influenza as compared with summer seasons and identifies patient groups that contribute mostly to changes in hospital burden between these seasons.
Overall, the present study demonstrates differences between influenza and summer seasons for all measures tested: hospitalizations, hospitalization days, LOS, and bed occupancy. These differences were due primarily to excess number of hospitalizations and hospitalization days, rather than to longer LOS.
Our results concerning hospitalizations for all diagnoses are consistent with a United States report showing about 5% more hospitalizations following emergency department visits during winter compared with summer.12
The increase in hospitalizations and total hospitalization days in older age groups reflects the probability of severe diseases in a population with multiple comorbidities, and is consistent with a 90% influenza-related mortality due to respiratory and cardiovascular diseases reported in patients 65 and older.13 The increase in hospitalization and total hospitalization days in the age groups <5 years during influenza seasons are consistent with studies showing that the risk of children to contract influenza is higher than that of adults surrounding them. In this regard, outbreak investigations during the 2009 influenza pandemic showed that influenza attack rates in children were higher than those of adults.14
Nationwide studies from Singapore and Taiwan also showed more hospitalizations related to influenza in young children and older adults.15,16
The increase in hospitalization days for all patients should be interpreted while taking into account the mean monthly LOS per patient (Table 2). In most age groups, a small decrease in the mean LOS for individual patients with the diagnosis of influenza/pneumonia was observed (Table 2). This decrease may suggest a need to shorten hospitalization slightly in order to accommodate new patients. Similarly, the decrease in hospitalization rates from all diagnoses during influenza seasons in the 5-54 years age groups (Figure) may stem, at least in part, from the shortage of available hospital beds due to patient overload. Additional study is required to further explore these decreases and their possible effects on morbidity and mortality.
Influenza vaccine guidelines in Israel following the 2009 influenza pandemic recommend influenza vaccination for all individuals age 6 months and older. However, influenza vaccination in Israel has remained low. Specifically, vaccination rates among children below the age of 5 years have been approximately 21%, as compared with 60%-65% in adults 65 years and over.17 Given the low rate of vaccination in children, we believe that there would be minimal or no difference in hospitalization of children under the age of 5 years, between the pre- and postpandemic years. Israel has started a school-based influenza vaccination program for the 2016-2017 influenza season in an effort to increase childhood influenza vaccination. It would be important to see if the expansion and continuation of the program would have an effect on influenza season hospitalizations.
Our study has several advantages. To the best of our knowledge, it is the first study examining differences in hospital burden between influenza and summer seasons on a national level. As such, it constitutes one of the largest studies on the subject. In addition, our study relies on original data, rather than estimates. Analysis of specific months of each year in which influenza virus circulates provides a targeted analysis of influenza seasons, rather than the entire winter season. The comparison with summer months is of great importance for preparatory plans by health systems, as it takes into account the degree of variation between the seasons. The analysis of 6 influenza seasons in our study intended to take into account season-to-season disease variability. Such variability among influenza seasons has been described previously due to changes in the virus itself, the population immune status, and the weather.18
We used several diagnosis categories to evaluate different aspects of hospital burden. Although the category of “all diagnoses” provided a broad assessment of hospital burden, influenza/pneumonia or pulmonary/cardiovascular disease constituted a more specific measure of influenza-associated burden.
Evaluating LOS added to the accuracy of hospital burden estimates, and our age-group analysis highlighted the specific age groups responsible for changes in hospital burden. Thus, the use of several measures to assess influenza season morbidity provides a comprehensive picture of the hospitalization dynamics between influenza and summer seasons. In this regard, the trends observed in our study for hospitalizations and total hospitalization days correspond to those observed in bed occupancy, especially for hospitalization rates due to all causes.
Our study has several limitations. We did not rely on laboratory diagnosis of influenza to determine burden. Because obtaining specimens for viral detection is usually based on individual clinical judgement, and patients hospitalized with influenza-related complications can often test negative for the virus due to time elapsed from disease onset, relying on a laboratory-based analysis may lead to underestimation of hospital burden. On the other hand, it is possible that patients with morbidity not specifically related to influenza were included in our analysis. Respiratory syncytial virus (RSV), for example, can also cause respiratory illness during the fall and winter.19 However, in Israel, RSV epidemic usually occurs before the influenza epidemic.17,20 Thus, it is expected that only a small percentage of hospital admissions due to RSV would occur during the influenza season. Another limitation of our study relates to the small number of months in the beginning and end of influenza seasons in which influenza activity was recorded only during part of the month. Thus, hospital burden may have been underestimated during these “incomplete” months. Future studies using time series analysis methods will contribute to a more accurate estimation of such differences, as well as account for variability in influenza activity.
Our results clearly highlight the issues that challenge hospitals in Israel, and possibly other countries, during influenza seasons, such as the most affected age groups and the shortening of hospital stay. Thus, our findings are most relevant for hospital preparedness towards influenza seasons, particularly in terms of the need for additional hospital beds and personnel.
Acknowledgment
We would like to thank Anneke ifrah for English language editing
Disclosure
All authors report no conflict of interest relevant to this article. No financial support was provided relevant to this article.
1. Bromberg M, Kaufman Z, Mandelboim M, et al. [Clinical and virological surveillance of influenza in Israel--implementation during pandemic influenza]. Harefuah. 2009;148(9):577-582, 659. PubMed
2. Molinari NA, Ortega-Sanchez IR, Messonnier ML, et al. The annual impact of seasonal influenza in the US: measuring disease burden and costs. Vaccine. 2007;25(27):5086-5096. Epub 2007/06/05. doi: 10.1016/j.vaccine.2007.03.046. PubMed
3. De Pascale G, Bittner EA. Influenza-associated critical illness: estimating the burden and the burden of estimation. Crit Care Med. 2014;42(11):2441-2442. Epub 2014/10/17. doi: 10.1097/ccm.0000000000000589. PubMed
4. Pitman RJ, Melegaro A, Gelb D, Siddiqui MR, Gay NJ, Edmunds WJ. Assessing the burden of influenza and other respiratory infections in England and Wales. J Infect. 2007;54(6):530-538. Epub 2006/11/14. doi: 10.1016/j.jinf.2006.09.017. PubMed
5. Olson DR, Heffernan RT, Paladini M, Konty K, Weiss D, Mostashari F. Monitoring the impact of influenza by age: emergency department fever and respiratory complaint surveillance in New York City. PLoS Med. 2007;4(8):e247. doi: 10.1371/journal.pmed.0040247. PubMed
6. Sheu SM, Tsai CF, Yang HY, Pai HW, Chen SC. Comparison of age-specific hospitalization during pandemic and seasonal influenza periods from 2009 to 2012 in Taiwan: a nationwide population-based study. BMC Infect Dis. 2016;16:88. doi: 10.1186/s12879-016-1438-x. PubMed
7. Goldstein E, Greene SK, Olson DR, Hanage WP, Lipsitch M. Estimating the hospitalization burden associated with influenza and respiratory syncytial virus in New York City, 2003-2011. Influenza Other Respir Viruses. 2015;9(5):225-233. doi: 10.1111/irv.12325. PubMed
8. Matias G, Taylor RJ, Haguinet F, Schuck-Paim C, Lustig RL, Fleming DM. Modelling estimates of age-specific influenza-related hospitalisation and mortality in the United Kingdom. BMC Public Health. 2016;16:481. doi: 10.1186/s12889-016-3128-4. PubMed
9. Reed C, Chaves SS, Daily Kirley P, et al. Estimating influenza disease burden from population-based surveillance data in the United States. PLoS One. 2015;10(3):e0118369. doi: 10.1371/journal.pone.0118369. PubMed
10. Hirve S, Krishnan A, Dawood FS, et al. Incidence of influenza-associated hospitalization in rural communities in western and northern India, 2010-2012: a multi-site population-based study. J Infect. 2015;70(2):160-170. doi: 10.1016/j.jinf.2014.08.015. PubMed
11. Chaves SS, Perez A, Farley MM, et al. The burden of influenza hospitalizations in infants from 2003 to 2012, United States. Pediatr Infect Dis J. 2014;33(9):912-919. doi: 10.1097/inf.0000000000000321. PubMed
12. Pitts SR, Niska RW, Xu J, Burt CW. National Hospital Ambulatory Medical Care Survey: 2006 emergency department summary. Natl Health Stat Report. 2008;(7):1-38. PubMed
13. Linhart Y, Shohat T, Bromberg M, Mendelson E, Dictiar R, Green MS. Excess mortality from seasonal influenza is negligible below the age of 50 in Israel: implications for vaccine policy. Infection. 2011;39(5):399-404. doi: 10.1007/s15010-011-0153-1. PubMed
14. Glatman-Freedman A, Portelli I, Jacobs SK, et al. Attack rates assessment of the 2009 pandemic H1N1 influenza A in children and their contacts: a systematic review and meta-analysis. PLoS One. 2012;7(11):e50228. doi: 10.1371/journal.pone.0050228. PubMed
15. Ang LW, Lim C, Lee VJ, et al. Influenza-associated hospitalizations, Singapore, 2004-2008 and 2010-2012. Emerg Infect Dis. 2014;20(10). doi: 10.3201/eid2010.131768. PubMed
16. Sheu SM, Tsai CF, Yang HY, Pai HW, Chen SC. Comparison of age-specific hospitalization during pandemic and seasonal influenza periods from 2009 to 2012 in Taiwan: a nationwide population-based study. BMC Infect Dis. 2016;16(1):88. doi: 10.1186/s12879-016-1438-x. PubMed
17. Israel Center for Disease Control. Summary Report - The 2015/2016 Influenza Season. https://www.health.gov.il/PublicationsFiles/flu2015-2016e.pdf. Accessed July 18, 2017.
18. Yaari R, Katriel G, Huppert A, Axelsen JB, Stone L. Modelling seasonal influenza: the role of weather and punctuated antigenic drift. J R Soc Interface. 2013;10(84):20130298. doi: 10.1098/rsif.2013.0298. PubMed
19. Hirsh S, Hindiyeh M, Kolet L, et al. Epidemiological changes of respiratory syncytial virus (RSV) infections in Israel. PLoS One. 2014;9(3):e90515. doi: 10.1371/journal.pone.0090515. PubMed
20. Miguez A, Iftimi A, Montes F. Temporal association between the influenza virus and respiratory syncytial virus (RSV): RSV as a predictor of seasonal influenza. Epidemiol Infect. 2016;144(12):2621-32. doi: 10.1017/s095026881600090x. PubMed
Influenza-associated morbidity poses a significant hospital burden.1 A study from the United States estimated that seasonal influenza is responsible for 3.1 million hospitalization days per year.2
Assessment of hospital burden during influenza seasons presents a challenge due to several possible factors, such as inaccurate recording of diagnosis3 and incomplete age group data. Although great emphasis has historically been placed on older age groups, a study from England and Wales showed that the number of hospitalizations and deaths resulting from influenza was significantly higher in children as compared with adults.4 Moreover, excess visits to emergency departments in New York City because of fever and respiratory morbidity during influenza seasons were found mostly among school-age children, whereas in adults, the surplus was small to nonexistent.5
Studies examining influenza-related hospitalizations evaluated numbers and rates of hospitalization.6-11 However, information regarding length of hospitalizations, hospitalizations during the influenza season that were not influenza related, or comparisons between influenza seasons and summer seasons is scarce. These determinants are of great importance for hospital preparedness towards influenza seasons. The aim of the current study was to estimate excess hospitalizations and length of hospitalization during influenza seasons, as compared with the summer, in different age groups and selected diagnoses in Israel.
METHODS
Data Sources
Hospitalization data of internal medicine and pediatric departments in 28 acute care hospitals in Israel between 2005 and 2013 were obtained from the National Hospital Discharges Database managed by the Health Information Division (HID) in the Israel Ministry of Health (MOH). The information included number of discharges (including in-hospital deaths), number of hospitalization days, and the mean length of stay (LOS) per discharge for all diagnoses and for primary or secondary diagnoses of respiratory/cardiovascular disease (ICD9 390-519) and influenza/pneumonia (ICD9 480-487).
Bed occupancy rates for internal medicine and pediatric departments were based on the National Patient Flow Database managed by the HID.
The 2009-2010 pandemic influenza season was excluded from analysis due to different morbidity patterns and timing (April 2009 until August 2010) as compared with seasonal influenza.
Data Classification
Hospitalizations data were analyzed for all ages, for specific age groups (the first year of life [0], ages 1-4, 5-14, 15-24, 25-34, 35-44, 45-54, 55-64, 65-74, 75-84, and 85 years and older), for all diagnoses, and for primary or secondary discharge diagnosis of respiratory/cardiovascular disease (ICD9 390-519) and influenza/pneumonia (ICD9 480-487).
Duration of Influenza Season
The beginning and the end of the influenza season were determined by the National Influenza surveillance program, which includes on average 22 community sentinel clinics, throughout Israel, each influenza season. These clinics send nose-throat samples from a convenience sample of patients with influenza-like illness (ILI), from week 40 of each year until the end of the influenza season in the subsequent year. These samples are analyzed for the presence of influenza virus by real-time reverse transcription polymerase chain reaction (RT-PCR) at the Central Virology Laboratory of Israel. Based on influenza virus detection in nose-throat samples from patients with ILI attending the community sentinel clinics, we determined the first and last month of each influenza season. The first month in which positive influenza samples were identified in sequence was defined as the first month of the season. The month in which the sequence of positive influenza samples stopped was defined as the last month of the season.
The 2009-2010 pandemic influenza season was excluded from analysis due to different morbidity patterns and timing (April 2009 until August 2010) as compared with seasonal influenza.
Data Analysis
Rates. Rates of monthly hospitalizations and monthly hospitalization days were calculated per 100,000 residents for all ages and for the specific age groups. Estimated average population sizes in different years for all ages and for specific age groups were obtained from the Central Bureau of Statistics (http://www.cbs.gov.il/reader/shnaton/templ_shnaton.html?num_tab=st02_01&CYear=2014). Monthly LOS was not converted to rates.
Hospitalizations. Mean monthly rate of hospitalizations during influenza and summer seasons was calculated by dividing the sum of hospital discharge rates during influenza/summer seasons of the entire evaluation period (2005/2006 to 2012/2013) by the number of influenza/summer activity months of that period.
Hospitalization Days. The measure “hospitalization days” refers to the hospitalization days of all patients who were discharged during influenza seasons. Mean monthly rate of hospitalization days during the influenza season and summer season was calculated using the procedure described for monthly mean rate of hospitalizations.
Length of Stay. The measure “length of stay” refers to the number of days that individual patients stayed in the hospital during an admission in the evaluated seasons.
Mean monthly LOS during the influenza and summer seasons for all patients (in both internal medicine and pediatric departments) and by age group was calculated by dividing the sum of monthly LOS during influenza seasons/summer season of the entire evaluation period (2005/2006 to 2012/2013 except for the 2009/2010 season) by the number of influenza/summer activity months of that period.
LOS for each specific month of the evaluation period for a single patient was calculated by dividing the number of hospitalization days of all patients that were discharged that month (stratified by age group) by the number of discharges in the same month.
Bed Occupancy. Bed occupancy rates for internal medicine and pediatric departments of the seasons evaluated were computed as a weighted rate based on the hospitalization days and licensed inpatient beds for the period of each influenza and summer season. The calculation took into account the number of days of each month and was based on the monthly reporting of hospital inpatient days in these departments and on the number of inpatient beds according to standard license documents issued by the MOH for each hospital.
Difference Between Influenza and Summer Seasons. Differences in mean monthly rates of hospitalizations, mean monthly rate of hospitalization days, and LOS during influenza seasons and the preceding summer were calculated as absolute numbers per month and as a percentage. The difference between bed occupancy during the influenza seasons and the preceding summers was expressed in percentage. Differences were computed for all diagnoses and for ICD9 480-487 and 390-519.
Statistical Analysis
Mean and standard deviation for monthly hospitalization rates, rates of monthly hospitalization days, and for LOS were calculated for all the influenza and summer seasons that were evaluated. Differences and statistical significance for these parameters were evaluated using a two-tailed Wilcoxon-Mann-Whitney test adjusted for ties, with 95% confidence interval for mean locations. The null hypothesis of the Wilcoxon test used was that the mean ranks of the influenza and summer season observations were equal.
Mean of bed occupancy percentage was calculated for influenza and summer seasons, with the difference and statistical significance being evaluated using a χ2 test. P value of < 0.05 was considered statistically significant. SAS Version 9.1 and R program version 3.3.1 software were used for analysis.
RESULTS
Influenza Seasons
The length of influenza seasons varied, with the shortest season lasting 3 months (2006-2007) and the longest season lasting six months (2010-2011 and 2011-2012; Table 1). Of the 14 first and last months of the 7 influenza seasons, 9 had influenza activity throughout the month, 2 had 3 weeks of influenza activity, and 3 had 2 weeks of influenza activity (Table 1).
Hospitalizations
A total of 452,209 hospital discharges occurred in pediatric and internal medicine departments during the influenza seasons that were evaluated. The mean monthly rate of hospitalizations (as defined in M
The mean monthly rate of hospitalizations for all ages due to the diagnosis of respiratory/cardiovascular diseases and influenza/pneumonia was 18.6% and 60.8% higher, respectively, during influenza seasons compared with the preceding summers (panels B and C in Figure). These differences were statistically significant (panels B and C in Figure; Supplementary Table 1).
The increase in mean monthly hospitalization rates for patients with a diagnosis of respiratory/cardiovascular diseases and pneumonia/influenza was highest among infants <1 year and children aged 1-4 years (panels B and C in Figure; Supplementary Table 1). Increases were also observed among other age groups. However, they were more modest and reached statistical significance for respiratory/cardiovascular diseases in the age groups of ≤34 years and ≥75 years (panel B in Figure; Supplementary Table 1). The increases in mean monthly hospitalization rates for pneumonia/influenza were statistically significant in all age groups and were greater than 40% among adults ≥55 years (panel C in Figure; Supplementary Table 1).
Statistically significant decreases in mean monthly hospitalization rates during influenza seasons were observed for all diagnoses in the 5-54 age groups (panel A in Figure; Supplementary Table 1). Decreases were not seen for the diagnoses of respiratory/cardiovascular diseases or pneumonia/influenza (panels B and C in Figure; Supplementary Table 1).
Hospitalization Days
The mean monthly rate of hospitalization days per 100,000 residents showed a similar trend to that of the hospitalization rates (panels A, B, and C in Figure; Supplementary Table 2), with the most prominent increases observed among infants and children <5 years and adults ≥65 years.
The mean monthly rate of hospitalization days per 100,000 during influenza seasons for all ages due to all diagnoses was 8% higher (P < 0.001) as compared with the summer seasons (panel A in Figure; Supplementary Table 2). Statistically significant increases were also found among patients diagnosed with respiratory/cardiovascular diseases and for influenza/pneumonia (panels B and C in Figure; Supplementary Table 2).
Children <5 years of age showed the largest increases during the influenza season as compared with the summer, with an up to 155.9% increase in the mean monthly rate of hospitalization days due to influenza/pneumonia (panel C in Figure; Supplementary Table 2), and an up to 206.6% increase for respiratory/cardiovascular diseases in infants <1 year of age (panel B in Figure; Supplementary Table 2). In adults, the largest increases were observed among those ≥75 years; the rates for influenza/pneumonia increased by about 40% (panel C in Figure; Supplementary Table 2), and the rates for respiratory/cardiovascular diseases increased by 14.8%-20.7% as compared with the summer months (panel B in Figure; Supplementary Table 2).
Statistically significant decreases in monthly mean rate of hospitalization days during influenza seasons were observed for all diagnoses in the 5-54 age groups (panel A in Figure; Supplementary Table 2). Decreases were not seen for the diagnoses of respiratory/cardiovascular diseases or influenza/pneumonia (panels B and C in Figure; Supplementary Table 2).
Hospital Length of Stay
The longest mean monthly LOS due to all diagnoses (for both influenza and summer seasons) was observed in adults ≥65 years of age (Table 2). The longest mean monthly LOS due to influenza/pneumonia (for both influenza and summer seasons) was observed in adults ≥55 years or older, and for the diagnosis of respiratory/cardiovascular diseases, infants <1 year and adults ≥55 years had the longest LOS.
The differences between influenza and summer seasons in mean monthly LOS were mostly small or not observed in any of the diagnostic categories examined. The mean monthly LOS due to a diagnosis of influenza/pneumonia was shorter during the influenza seasons than summer seasons in most age groups. These differences were statistically significant in children <5 years and adults ≥45 years (Table 2).
The mean LOS due to respiratory/cardiovascular diseases was significantly shorter during influenza seasons than summer seasons in children under 5.
Bed Occupancy
Mean bed occupancy was significantly higher during influenza seasons compared with the preceding summer seasons, both in internal medicine and pediatric departments (Table 3). The differences were higher in pediatric departments as compared with internal medicine departments for most years evaluated.
DISCUSSION
Our study demonstrates trends of excess hospitalizations during influenza as compared with summer seasons and identifies patient groups that contribute mostly to changes in hospital burden between these seasons.
Overall, the present study demonstrates differences between influenza and summer seasons for all measures tested: hospitalizations, hospitalization days, LOS, and bed occupancy. These differences were due primarily to excess number of hospitalizations and hospitalization days, rather than to longer LOS.
Our results concerning hospitalizations for all diagnoses are consistent with a United States report showing about 5% more hospitalizations following emergency department visits during winter compared with summer.12
The increase in hospitalizations and total hospitalization days in older age groups reflects the probability of severe diseases in a population with multiple comorbidities, and is consistent with a 90% influenza-related mortality due to respiratory and cardiovascular diseases reported in patients 65 and older.13 The increase in hospitalization and total hospitalization days in the age groups <5 years during influenza seasons are consistent with studies showing that the risk of children to contract influenza is higher than that of adults surrounding them. In this regard, outbreak investigations during the 2009 influenza pandemic showed that influenza attack rates in children were higher than those of adults.14
Nationwide studies from Singapore and Taiwan also showed more hospitalizations related to influenza in young children and older adults.15,16
The increase in hospitalization days for all patients should be interpreted while taking into account the mean monthly LOS per patient (Table 2). In most age groups, a small decrease in the mean LOS for individual patients with the diagnosis of influenza/pneumonia was observed (Table 2). This decrease may suggest a need to shorten hospitalization slightly in order to accommodate new patients. Similarly, the decrease in hospitalization rates from all diagnoses during influenza seasons in the 5-54 years age groups (Figure) may stem, at least in part, from the shortage of available hospital beds due to patient overload. Additional study is required to further explore these decreases and their possible effects on morbidity and mortality.
Influenza vaccine guidelines in Israel following the 2009 influenza pandemic recommend influenza vaccination for all individuals age 6 months and older. However, influenza vaccination in Israel has remained low. Specifically, vaccination rates among children below the age of 5 years have been approximately 21%, as compared with 60%-65% in adults 65 years and over.17 Given the low rate of vaccination in children, we believe that there would be minimal or no difference in hospitalization of children under the age of 5 years, between the pre- and postpandemic years. Israel has started a school-based influenza vaccination program for the 2016-2017 influenza season in an effort to increase childhood influenza vaccination. It would be important to see if the expansion and continuation of the program would have an effect on influenza season hospitalizations.
Our study has several advantages. To the best of our knowledge, it is the first study examining differences in hospital burden between influenza and summer seasons on a national level. As such, it constitutes one of the largest studies on the subject. In addition, our study relies on original data, rather than estimates. Analysis of specific months of each year in which influenza virus circulates provides a targeted analysis of influenza seasons, rather than the entire winter season. The comparison with summer months is of great importance for preparatory plans by health systems, as it takes into account the degree of variation between the seasons. The analysis of 6 influenza seasons in our study intended to take into account season-to-season disease variability. Such variability among influenza seasons has been described previously due to changes in the virus itself, the population immune status, and the weather.18
We used several diagnosis categories to evaluate different aspects of hospital burden. Although the category of “all diagnoses” provided a broad assessment of hospital burden, influenza/pneumonia or pulmonary/cardiovascular disease constituted a more specific measure of influenza-associated burden.
Evaluating LOS added to the accuracy of hospital burden estimates, and our age-group analysis highlighted the specific age groups responsible for changes in hospital burden. Thus, the use of several measures to assess influenza season morbidity provides a comprehensive picture of the hospitalization dynamics between influenza and summer seasons. In this regard, the trends observed in our study for hospitalizations and total hospitalization days correspond to those observed in bed occupancy, especially for hospitalization rates due to all causes.
Our study has several limitations. We did not rely on laboratory diagnosis of influenza to determine burden. Because obtaining specimens for viral detection is usually based on individual clinical judgement, and patients hospitalized with influenza-related complications can often test negative for the virus due to time elapsed from disease onset, relying on a laboratory-based analysis may lead to underestimation of hospital burden. On the other hand, it is possible that patients with morbidity not specifically related to influenza were included in our analysis. Respiratory syncytial virus (RSV), for example, can also cause respiratory illness during the fall and winter.19 However, in Israel, RSV epidemic usually occurs before the influenza epidemic.17,20 Thus, it is expected that only a small percentage of hospital admissions due to RSV would occur during the influenza season. Another limitation of our study relates to the small number of months in the beginning and end of influenza seasons in which influenza activity was recorded only during part of the month. Thus, hospital burden may have been underestimated during these “incomplete” months. Future studies using time series analysis methods will contribute to a more accurate estimation of such differences, as well as account for variability in influenza activity.
Our results clearly highlight the issues that challenge hospitals in Israel, and possibly other countries, during influenza seasons, such as the most affected age groups and the shortening of hospital stay. Thus, our findings are most relevant for hospital preparedness towards influenza seasons, particularly in terms of the need for additional hospital beds and personnel.
Acknowledgment
We would like to thank Anneke ifrah for English language editing
Disclosure
All authors report no conflict of interest relevant to this article. No financial support was provided relevant to this article.
1. Bromberg M, Kaufman Z, Mandelboim M, et al. [Clinical and virological surveillance of influenza in Israel--implementation during pandemic influenza]. Harefuah. 2009;148(9):577-582, 659. PubMed
2. Molinari NA, Ortega-Sanchez IR, Messonnier ML, et al. The annual impact of seasonal influenza in the US: measuring disease burden and costs. Vaccine. 2007;25(27):5086-5096. Epub 2007/06/05. doi: 10.1016/j.vaccine.2007.03.046. PubMed
3. De Pascale G, Bittner EA. Influenza-associated critical illness: estimating the burden and the burden of estimation. Crit Care Med. 2014;42(11):2441-2442. Epub 2014/10/17. doi: 10.1097/ccm.0000000000000589. PubMed
4. Pitman RJ, Melegaro A, Gelb D, Siddiqui MR, Gay NJ, Edmunds WJ. Assessing the burden of influenza and other respiratory infections in England and Wales. J Infect. 2007;54(6):530-538. Epub 2006/11/14. doi: 10.1016/j.jinf.2006.09.017. PubMed
5. Olson DR, Heffernan RT, Paladini M, Konty K, Weiss D, Mostashari F. Monitoring the impact of influenza by age: emergency department fever and respiratory complaint surveillance in New York City. PLoS Med. 2007;4(8):e247. doi: 10.1371/journal.pmed.0040247. PubMed
6. Sheu SM, Tsai CF, Yang HY, Pai HW, Chen SC. Comparison of age-specific hospitalization during pandemic and seasonal influenza periods from 2009 to 2012 in Taiwan: a nationwide population-based study. BMC Infect Dis. 2016;16:88. doi: 10.1186/s12879-016-1438-x. PubMed
7. Goldstein E, Greene SK, Olson DR, Hanage WP, Lipsitch M. Estimating the hospitalization burden associated with influenza and respiratory syncytial virus in New York City, 2003-2011. Influenza Other Respir Viruses. 2015;9(5):225-233. doi: 10.1111/irv.12325. PubMed
8. Matias G, Taylor RJ, Haguinet F, Schuck-Paim C, Lustig RL, Fleming DM. Modelling estimates of age-specific influenza-related hospitalisation and mortality in the United Kingdom. BMC Public Health. 2016;16:481. doi: 10.1186/s12889-016-3128-4. PubMed
9. Reed C, Chaves SS, Daily Kirley P, et al. Estimating influenza disease burden from population-based surveillance data in the United States. PLoS One. 2015;10(3):e0118369. doi: 10.1371/journal.pone.0118369. PubMed
10. Hirve S, Krishnan A, Dawood FS, et al. Incidence of influenza-associated hospitalization in rural communities in western and northern India, 2010-2012: a multi-site population-based study. J Infect. 2015;70(2):160-170. doi: 10.1016/j.jinf.2014.08.015. PubMed
11. Chaves SS, Perez A, Farley MM, et al. The burden of influenza hospitalizations in infants from 2003 to 2012, United States. Pediatr Infect Dis J. 2014;33(9):912-919. doi: 10.1097/inf.0000000000000321. PubMed
12. Pitts SR, Niska RW, Xu J, Burt CW. National Hospital Ambulatory Medical Care Survey: 2006 emergency department summary. Natl Health Stat Report. 2008;(7):1-38. PubMed
13. Linhart Y, Shohat T, Bromberg M, Mendelson E, Dictiar R, Green MS. Excess mortality from seasonal influenza is negligible below the age of 50 in Israel: implications for vaccine policy. Infection. 2011;39(5):399-404. doi: 10.1007/s15010-011-0153-1. PubMed
14. Glatman-Freedman A, Portelli I, Jacobs SK, et al. Attack rates assessment of the 2009 pandemic H1N1 influenza A in children and their contacts: a systematic review and meta-analysis. PLoS One. 2012;7(11):e50228. doi: 10.1371/journal.pone.0050228. PubMed
15. Ang LW, Lim C, Lee VJ, et al. Influenza-associated hospitalizations, Singapore, 2004-2008 and 2010-2012. Emerg Infect Dis. 2014;20(10). doi: 10.3201/eid2010.131768. PubMed
16. Sheu SM, Tsai CF, Yang HY, Pai HW, Chen SC. Comparison of age-specific hospitalization during pandemic and seasonal influenza periods from 2009 to 2012 in Taiwan: a nationwide population-based study. BMC Infect Dis. 2016;16(1):88. doi: 10.1186/s12879-016-1438-x. PubMed
17. Israel Center for Disease Control. Summary Report - The 2015/2016 Influenza Season. https://www.health.gov.il/PublicationsFiles/flu2015-2016e.pdf. Accessed July 18, 2017.
18. Yaari R, Katriel G, Huppert A, Axelsen JB, Stone L. Modelling seasonal influenza: the role of weather and punctuated antigenic drift. J R Soc Interface. 2013;10(84):20130298. doi: 10.1098/rsif.2013.0298. PubMed
19. Hirsh S, Hindiyeh M, Kolet L, et al. Epidemiological changes of respiratory syncytial virus (RSV) infections in Israel. PLoS One. 2014;9(3):e90515. doi: 10.1371/journal.pone.0090515. PubMed
20. Miguez A, Iftimi A, Montes F. Temporal association between the influenza virus and respiratory syncytial virus (RSV): RSV as a predictor of seasonal influenza. Epidemiol Infect. 2016;144(12):2621-32. doi: 10.1017/s095026881600090x. PubMed
© 2017 Society of Hospital Medicine
Patterns and Appropriateness of Thrombophilia Testing in an Academic Medical Center
Thrombophilia is a prothrombotic state, either acquired or inherited, leading to a thrombotic predisposition.1 The most common heritable thrombophilias include factor V Leiden (FVL) and prothrombin G20210A. The most common acquired thrombophilia is the presence of phospholipid antibodies.1 Thrombotic risk varies with thrombophilia type. For example, deficiencies of antithrombin, protein C and protein S, and the presence of phospholipid antibodies, confer higher risk than FVL and prothrombin G20210A.2-5 Other thrombophilias (eg, methylenetetrahydrofolate reductase mutation, increased factor VIII activity) are relatively uncommon and/or their impact on thrombosis risk appears to be either minimal or unknown.1-6 There is little clinical evidence that testing for thrombophilia impacts subsequent thrombosis prevention.5,7,8 Multiple clinical guidelines and medical societies recommend against the routine and indiscriminate use of thrombophilia testing.8-13 In general, thrombophilia testing should be considered only if the result would lead to changes in anticoagulant initiation, intensity, and/or duration, or might inform interventions to prevent thrombosis in asymptomatic family members.8-13 However, thrombophilia testing rarely changes the acute management of a thrombotic event and may have harmful effects on patients and their family members because positive results may unnecessarily increase anxiety and negative results may provide false reassurance.6,14-18 The cost-effectiveness of thrombophilia testing is unknown. Economic models have sought to quantify cost-effectiveness, but conclusions from these studies are limited.7
The utility of thrombophilia testing in emergency department (ED) and inpatient settings is further limited because patients are often treated and discharged before thrombophilia test results are available. Additionally, in these settings, multiple factors increase the risk of false-positive or false-negative results (eg, acute thrombosis, acute illness, pregnancy, and anticoagulant therapy).19,20 The purpose of this study was to systematically assess thrombophilia testing patterns in the ED and hospitalized patients at an academic medical center and to quantify the proportion of tests associated with minimal clinical utility. We hypothesize that the majority of thrombophilia tests completed in the inpatient setting are associated with minimal clinical utility.
METHODS
Setting and Patients
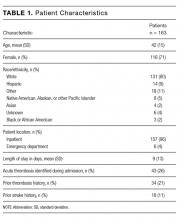
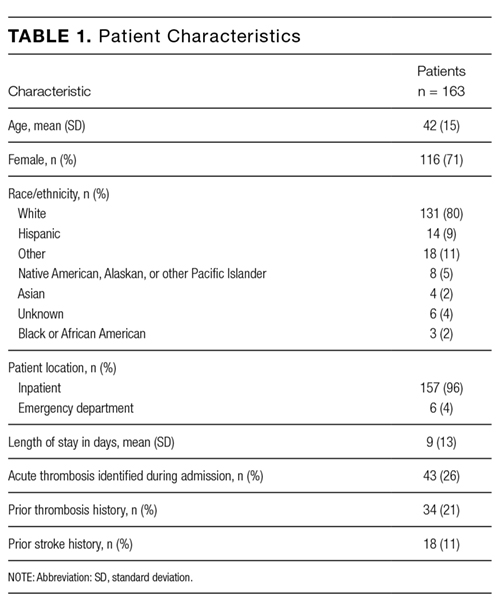
This study was conducted at University of Utah Health Care (UUHC) University Hospital, a 488-bed academic medical center with a level I trauma center, primary stroke center, and 50-bed ED. Laboratory services for UUHC, including thrombophilia testing, are provided by a national reference laboratory, Associated Regional and University Pathologists Laboratories. This study included patients ≥18 years of age who received thrombophilia testing (Supplementary Table 1) during an ED visit or inpatient admission at University Hospital between July 1, 2014 and December 31, 2014. There were no exclusion criteria. An institutional electronic data repository was used to identify patients matching inclusion criteria. All study activities were reviewed and approved by the UUHC Institutional Review Board with a waiver of informed consent.
Outcomes
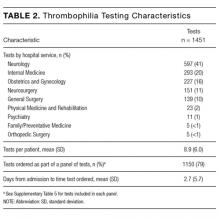
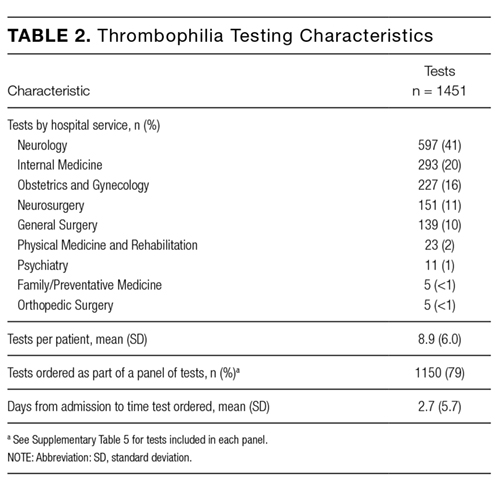
An electronic database query was used to identify patients, collect patient demographic information, and collect test characteristics. Each patient’s electronic medical record was manually reviewed to collect all other outcomes. Indication for thrombophilia testing was identified by manual review of provider notes. Thrombophilia tests occurring in situations associated with minimal clinical utility were defined as tests meeting at least one of the following criteria: patient discharged before test results were available for review; test type not recommended by published guidelines or by UUHC Thrombosis Service physicians for thrombophilia testing (Supplementary Table 2); test performed in situations associated with decreased accuracy; test was a duplicate test as a result of different thrombophilia panels containing identical tests; and test followed a provoked venous thromboembolism (VTE). Testing in situations associated with decreased accuracy are summarized in Supplementary Table 3 and included at least one of the following at the time of the test: anticoagulant therapy, acute thrombosis, pregnant or <8 weeks postpartum, and receiving estrogen-containing medications. Only test types known to be affected by the respective situation were included. Testing following a provoked VTE was defined as testing prompted by an acute thrombosis and performed within 3 months following major surgery (defined administratively as any surgery performed in an operating room), during pregnancy, <8 weeks postpartum, or while on estrogen-containing medications. Thrombophilia testing during anticoagulant therapy was defined as testing within 4 half-lives of anticoagulant administration based on medication administration records. Anticoagulant therapy changes were identified by comparing prior-to-admission and discharge medication lists.
Data Analysis


Patient and laboratory characteristics were summarized using descriptive statistics, including mean and standard deviation (SD) for continuous variables and proportions for categorical variables. Data analysis was performed using Excel (Version 2013, Microsoft Corporation. Redmond, Washington).
RESULTS
During the 6-month study period, 163 patients received at least 1 thrombophilia test during an ED visit or inpatient admission. Patient characteristics are summarized in Table 1. Tested patients were most commonly inpatients (96%) and female (71%). A total of 1451 thrombophilia tests were performed with a mean (± SD) of 8.9 ± 6.0 tests per patient. Testing characteristics are summarized in Table 2. Of the 39 different test types performed, the most commonly ordered were cardiolipin IgG and IgM antibodies (9% each), lupus anticoagulant (9%), and β2-glycoprotein 1 IgG and IgM antibodies (8% each). When combined with testing for phosphatidyl antibodies, antiphospholipid tests accounted for 70% of all tests. Overall, 134 (9%) test results were positive. The mean time for results to become available was 2.2 ± 2.5 days. The frequency of test types with corresponding positivity rates and mean time for results to become available are summarized in Supplementary Table 4.
The indications for thrombophilia testing are summarized in Table 3. Ischemic stroke was the most common indication for testing (50% of tests; 35% of patients), followed by VTE (21% of tests; 21% of patients), and pregnancy-related conditions (eg, preeclampsia, intrauterine fetal demise; 15% of tests; 25% of patients). Overall, 911 tests (63%) occurred in situations associated with minimal clinical utility, with 126 patients (77%) receiving at least one of these tests (Table 4).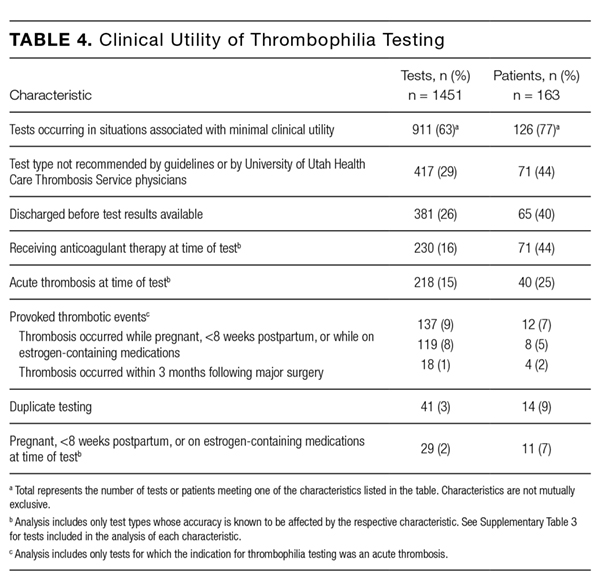
Anticoagulant therapy was changed in 43 patients (26%) in the following ways: initiated in 35 patients (21%), transitioned to a different anticoagulant in 6 patients (4%), and discontinued in 2 patients (1%). Of the 35 patients initiating anticoagulant therapy, 29 had documented thrombosis (24 had VTE, 4 had cerebral venous sinus thrombosis [CVST], and 1 had basilar artery thrombosis). Overall, 2 instances were identified in which initiation of anticoagulant therapy at discharge was in response to thrombophilia test results. In the first instance, warfarin without a parenteral anticoagulant bridge was initiated for a 54-year-old patient with a cryptogenic stroke who tested positive for β2-glycoprotein 1 IgG antibodies, lupus anticoagulant, and protein S deficiency. In the second instance, warfarin with an enoxaparin bridge was initiated for a 26-year-old patient with a cryptogenic stroke who tested positive for β2-glycoprotein 1 IgG and IgM antibodies, cardiolipin IgG antibodies, lupus anticoagulant, protein C deficiency, and antithrombin deficiency. Of the 163 patients receiving thrombophilia testing, only 2 patients (1%) had clear documentation of being offered genetic consultation.
DISCUSSION
In this retrospective analysis, 1451 thrombophilia tests were performed in 163 patients over 6 months. Tested patients were relatively young, which is likely explained by the number of patients tested for pregnancy-related conditions and the fact that a stroke or VTE in younger patients more frequently prompted providers to suspect thrombophilia. Nearly three-fourths of patients were female, which is likely due to testing for pregnancy-related conditions and possibly diagnostic suspicion bias given the comparative predilection of antiphospholipid syndrome for women. The patient characteristics in our study are consistent with other studies evaluating thrombophilia testing.21,22
Thrombophilia testing was most frequently prompted by stroke, VTE, and pregnancy-related conditions. Only 26% of patients had acute thrombosis identified during the admission, primarily because of the high proportion of tests for cryptogenic strokes and pregnancy-related conditions. Thrombophilia testing is recommended in patients who have had a stroke when the stroke is considered to be cryptogenic after a standard stroke evaluation.23 Thrombophilia testing in pregnancy-related conditions is controversial but is often considered in situations such as stillbirths with severe placental pathology and/or significant growth restriction, or in mothers with a personal or family history of thrombosis.24 The proportion of testing for pregnancy-related conditions may be greater than at other institutions because UUHC Maternal Fetal Medicine is a referral center for women with conditions associated with hypercoagulability. Anticoagulant therapy was initiated in 21% of patients, but specifically in response to thrombophilia testing in only 2 instances; in most cases, anticoagulant therapy was initiated regardless of thrombophilia test results.
The results of this study confirm our hypothesis because the majority of thrombophilia tests occurred in situations associated with minimal clinical utility. Testing in these situations was not isolated to specific patients or medical services because 77% of tested patients received at least 1 test associated with minimal clinical utility. Our study took a conservative approach in defining scenarios associated with minimal clinical utility because other situations can also affect testing accuracy (eg, hepatic disease, nephrotic syndrome) but were not included in our analysis of this outcome.
The results of this study highlight opportunities to improve thrombophilia testing practices at our institution and may be generalizable to institutions with similar testing patterns. Because multiple medical services order thrombophilia tests, strategies to improve testing practices are still being determined. The results of this study can serve as a baseline for comparison after strategies are implemented. The most common situation associated with minimal clinical utility was the use of test types not generally recommended by guidelines or UUHC Thrombosis Service physicians for thrombophilia testing (eg, β2-glycoprotein 1 IgA antibodies, phosphatidyl antibodies). We intend to require a hematology or thrombosis specialty consult prior to ordering these tests. This intervention alone could potentially decrease unnecessary testing by a third. Another consideration is to require a specialty consult prior to any inpatient thrombophilia testing. This strategy has been found to decrease inappropriate testing at other institutions.21 We also intend to streamline available thrombophilia testing panels because a poorly designed panel could lead to ordering of multiple tests associated with minimal clinical utility. At least 12 different thrombophilia panels are currently available in our computerized physician order entry system (see Supplementary Table 5). We hypothesize that current panel designs contribute to providers inadvertently ordering unintended or duplicate tests and that reducing the number of available panels and clearly delineating what tests are contained in each panel is likely to reduce unnecessary testing. Other strategies being considered include using electronic clinical decision support tools, implementing strict ordering criteria for all inpatient testing, and establishing a thrombosis stewardship program.
Our study was unique in at least 2 ways. First, previous studies describing thrombophilia testing have described testing patterns for patients with specific indications (eg, VTE), whereas our study described all thrombophilia tests regardless of indication. This allows for testing pattern comparisons across indications and medical services, increasing the generalizability of our results. Second, this study quantifies tests occurring in situations associated with a practical definition of minimal clinical utility.
Our study has several limitations: (1) Many variables were reliant on provider notes and other documentation, which allows for potential misclassification of variables. (2) It was not always possible to determine the ultimate utility of each test in clinical management decisions, and our study did not investigate the impact of thrombophilia testing on duration of anticoagulant therapy. Additionally, select situations could benefit from testing regardless if anticoagulant therapy is altered (eg, informing contraceptive choices). (3) Testing performed following a provoked acute thrombosis was defined as testing within 3 months following administratively defined major surgery. This definition could have included some minor procedures that do not substantially increase VTE risk, resulting in underestimated clinical utility. (4) The UUHC University Hospital serves as a referral hospital for a large geographical area, and investigators did not have access to outpatient records for a large proportion of discharged patients. As a result, frequency of repeat testing could not be assessed, possibly resulting in overestimated clinical utility. (5) In categorizing indications for testing, testing for CVST was subcategorized under testing for ischemic stroke based on presenting symptoms rather than on underlying pathophysiology. The rationale for this categorization is that patients with CVST were often tested based on presenting symptoms. Additionally, tests for CVST were ordered by the neurology service, which also ordered tests for all other ischemic stroke indications. (6) The purpose of our study was to investigate the subset of the hospital’s patient population that received thrombophilia testing, and patients were identified by tests received and not by diagnosis codes. As a result, we are unable to provide the proportion of total patients treated at the hospital for specific conditions who were tested (eg, the proportion of stroke patients that received thrombophilia testing). (7) Current practice guidelines do not recommend testing for phosphatidyl antibodies, even when traditional antiphospholipid testing is negative.25-27 Although expert panels continue to explore associations between phosphatidyl antibodies and pregnancy morbidity and thrombotic events, the low level of evidence is insufficient to guide clinical management.28 Therefore, we categorized all phosphatidyl testing as associated with minimal clinical utility.
CONCLUSIONS
In a large academic medical center, the majority of tests occurred in situations associated with minimal clinical utility. Strategies to improve thrombophilia testing practices are needed in order to minimize potentially inappropriate testing, provide more cost-effective care, and promote value-driven outcomes.
Disclosure
S.W. received financial support for this submitted work via a Bristol-Myers-Squibb grant. G.F. received financial support from Portola Pharmaceuticals for consulting and lectures that were not related to this submitted work.
1. Franco RF, Reitsma PH. Genetic risk factors of venous thrombosis. Hum Genet. 2001;109(4):369-384. PubMed
2. Ridker PM, Hennekens CH, Lindpaintner K, Stampfer MJ, Eisenberg PR, Miletich JP. Mutation in the gene coding for coagulation factor V and the risk of myocardial infarction, stroke, and venous thrombosis in apparently healthy men. N Engl J Med. 1995;332(14):912-917. PubMed
3. Koster T, Rosendaal FR, de Ronde H, Briët E, Vandenbroucke JP, Bertina RM. Venous thrombosis due to poor anticoagulant response to activated protein C: Leiden Thrombophilia Study. Lancet. 1993;342(8886-8887):1503-1506. PubMed
4. Margaglione M, Brancaccio V, Giuliani N, et al. Increased risk for venous thrombosis in carriers of the prothrombin G-->A20210 gene variant. Ann Intern Med. 1998;129(2):89-93. PubMed
5. De Stefano V, Martinelli I, Mannucci PM, et al. The risk of recurrent deep venous thrombosis among heterozygous carriers of both factor V Leiden and the G20210A prothrombin mutation. N Engl J Med. 1999;341:801-806. PubMed
6. Dickey TL. Can thrombophilia testing help to prevent recurrent VTE? Part 2. JAAPA. 2002;15(12):23-24, 27-29. PubMed
7. Simpson EL, Stevenson MD, Rawdin A, Papaioannou D. Thrombophilia testing in people with venous thromboembolism: systematic review and cost-effectiveness analysis. Health Technol Assess. 2009;13(2):iii, ix-x, 1-91. PubMed
8. National Institute for Health and Clinical Excellence. Venous thromboembolic disease: the management of venous thromboembolic diseases and the role of thrombophilia testing. NICE clinical guideline 144. https://www.nice.org.uk/guidance/cg144. Accessed on June 30, 2017.
9. Evalution of Genomic Applications in Practice and Prevention (EGAPP) Working Group. Recommendations from the EGAPP Working Group: routine testing for factor V Leiden (R506Q) and prothrombin (20210G>A) mutations in adults with a history of idiopathic venous thromboembolism and their adult family members. Genet Med. 2011;13(1):67-76.
10. Kearon C, Akl EA, Comerota AJ, et al. Antithrombotic therapy for VTE disease: antithrombotic therapy and prevention of thrombosis, 9th ed: American College of Chest Physicians evidence-based clinical practice guidelines. Chest. 2012;141(2 Suppl):e419S-494S. PubMed
11. Baglin T, Gray E, Greaves M, et al. Clinical guidelines for testing for heritable thrombophilia. Br J Haematol. 2010;149(2):209-220. PubMed
12. Hicks LK, Bering H, Carson KR, et al. The ASH Choosing Wisely® campaign: five hematologic tests and treatments to question. Hematology Am Soc Hematol Educ Program. 2013;2013:9-14. PubMed
13. Stevens SM, Woller SC, Bauer KA, et al. Guidance for the evaluation and treatment of hereditary and acquired thrombophilia. J Thromb Thrombolysis. 2016;41(1):154-164. PubMed
14. Christiansen SC, Cannegieter SC, Koster T, Vandenbroucke JP, Rosendaal FR. Thrombophilia, clinical factors, and recurrent venous thrombotic events. JAMA. 2005;293(19):2352-2361. PubMed
15. Prandoni P, Lensing AW, Cogo A, et al. The long-term clinical course of acute deep venous thrombosis. Ann Intern Med. 1996;125(1):1-7. PubMed
16. Miles JS, Miletich JP, Goldhaber SZ, Hennekens CH, Ridker PM. G20210A mutation in the prothrombin gene and the risk of recurrent venous thromboembolism. J Am Coll Cardiol. 2001;37(1):215-218. PubMed
17. Eichinger S, Weltermann A, Mannhalter C, et al. The risk of recurrent venous thromboembolism in heterozygous carriers of factor V Leiden and a first spontaneous venous thromboembolism. Arch Intern Med. 2002;162(20):2357-2360. PubMed
18. Mazzolai L, Duchosal MA. Hereditary thrombophilia and venous thromboembolism: critical evaluation of the clinical implications of screening. Eur J Vasc Endovasc Surg. 2007;34(4):483-488. PubMed
19. Merriman L, Greaves M. Testing for thrombophilia: an evidence‐based approach. Postgrad Med J. 2006;82(973):699-704. PubMed
20. Favaloro EJ, McDonald D, Lippi G. Laboratory investigation of thrombophilia: the good, the bad, and the ugly. Semin Thromb Hemost. 2009;35(7):695-710. PubMed
21. Shen YM, Tsai J, Taiwo E, et al. Analysis of thrombophilia test ordering practices at an academic center: a proposal for appropriate testing to reduce harm and cost. PLoS One. 2016;11(5):e0155326. PubMed
22. Meyer MR, Witt DM, Delate T, et al. Thrombophilia testing patterns amongst patients with acute venous thromboembolism. Thromb Res. 2015;136(6):1160-1164. PubMed
23. Saver JL. Clinical practice: cryptogenic stroke. N Engl J Med. 2016;374(21):2065-2074. PubMed
24. ACOG practice bulletin no. 102: management of stillbirth. Obstet Gynecol. 2009;113(3):748-761. PubMed
25. Miyakis S, Lockshin MD, Atsumi T, et al. International consensus statement on an update of the classification criteria for definite antiphospholipid syndrome (APS). J Thromb Haemost. 2006;4(2):295-306. PubMed
26. Keeling D, Mackie I, Moore GW, Greer IA, Greaves M, British Committee for Standards in Haematology. Guidelines on the investigation and management of antiphospholipid syndrome. Br J Haematol. 2012;157(1):47-58. PubMed
27. Committee on Practice Bulletins—Obstetrics, American College of Obstetricians and Gynecologists. Practice bulletin no. 132: antiphospholipid syndrome. Obstet Gynecol. 2012;120(6):1514-1521. PubMed
28. Bertolaccini ML, Amengual O, Andreoli L, et al. 14th International Congress on Antiphospholipid Antibodies Task Force. Report on antiphospholipid syndrome laboratory diagnostics and trends. Autoimmun Rev. 2014;13(9):917-930. PubMed
Thrombophilia is a prothrombotic state, either acquired or inherited, leading to a thrombotic predisposition.1 The most common heritable thrombophilias include factor V Leiden (FVL) and prothrombin G20210A. The most common acquired thrombophilia is the presence of phospholipid antibodies.1 Thrombotic risk varies with thrombophilia type. For example, deficiencies of antithrombin, protein C and protein S, and the presence of phospholipid antibodies, confer higher risk than FVL and prothrombin G20210A.2-5 Other thrombophilias (eg, methylenetetrahydrofolate reductase mutation, increased factor VIII activity) are relatively uncommon and/or their impact on thrombosis risk appears to be either minimal or unknown.1-6 There is little clinical evidence that testing for thrombophilia impacts subsequent thrombosis prevention.5,7,8 Multiple clinical guidelines and medical societies recommend against the routine and indiscriminate use of thrombophilia testing.8-13 In general, thrombophilia testing should be considered only if the result would lead to changes in anticoagulant initiation, intensity, and/or duration, or might inform interventions to prevent thrombosis in asymptomatic family members.8-13 However, thrombophilia testing rarely changes the acute management of a thrombotic event and may have harmful effects on patients and their family members because positive results may unnecessarily increase anxiety and negative results may provide false reassurance.6,14-18 The cost-effectiveness of thrombophilia testing is unknown. Economic models have sought to quantify cost-effectiveness, but conclusions from these studies are limited.7
The utility of thrombophilia testing in emergency department (ED) and inpatient settings is further limited because patients are often treated and discharged before thrombophilia test results are available. Additionally, in these settings, multiple factors increase the risk of false-positive or false-negative results (eg, acute thrombosis, acute illness, pregnancy, and anticoagulant therapy).19,20 The purpose of this study was to systematically assess thrombophilia testing patterns in the ED and hospitalized patients at an academic medical center and to quantify the proportion of tests associated with minimal clinical utility. We hypothesize that the majority of thrombophilia tests completed in the inpatient setting are associated with minimal clinical utility.
METHODS
Setting and Patients
This study was conducted at University of Utah Health Care (UUHC) University Hospital, a 488-bed academic medical center with a level I trauma center, primary stroke center, and 50-bed ED. Laboratory services for UUHC, including thrombophilia testing, are provided by a national reference laboratory, Associated Regional and University Pathologists Laboratories. This study included patients ≥18 years of age who received thrombophilia testing (Supplementary Table 1) during an ED visit or inpatient admission at University Hospital between July 1, 2014 and December 31, 2014. There were no exclusion criteria. An institutional electronic data repository was used to identify patients matching inclusion criteria. All study activities were reviewed and approved by the UUHC Institutional Review Board with a waiver of informed consent.
Outcomes
An electronic database query was used to identify patients, collect patient demographic information, and collect test characteristics. Each patient’s electronic medical record was manually reviewed to collect all other outcomes. Indication for thrombophilia testing was identified by manual review of provider notes. Thrombophilia tests occurring in situations associated with minimal clinical utility were defined as tests meeting at least one of the following criteria: patient discharged before test results were available for review; test type not recommended by published guidelines or by UUHC Thrombosis Service physicians for thrombophilia testing (Supplementary Table 2); test performed in situations associated with decreased accuracy; test was a duplicate test as a result of different thrombophilia panels containing identical tests; and test followed a provoked venous thromboembolism (VTE). Testing in situations associated with decreased accuracy are summarized in Supplementary Table 3 and included at least one of the following at the time of the test: anticoagulant therapy, acute thrombosis, pregnant or <8 weeks postpartum, and receiving estrogen-containing medications. Only test types known to be affected by the respective situation were included. Testing following a provoked VTE was defined as testing prompted by an acute thrombosis and performed within 3 months following major surgery (defined administratively as any surgery performed in an operating room), during pregnancy, <8 weeks postpartum, or while on estrogen-containing medications. Thrombophilia testing during anticoagulant therapy was defined as testing within 4 half-lives of anticoagulant administration based on medication administration records. Anticoagulant therapy changes were identified by comparing prior-to-admission and discharge medication lists.
Data Analysis
Patient and laboratory characteristics were summarized using descriptive statistics, including mean and standard deviation (SD) for continuous variables and proportions for categorical variables. Data analysis was performed using Excel (Version 2013, Microsoft Corporation. Redmond, Washington).
RESULTS
During the 6-month study period, 163 patients received at least 1 thrombophilia test during an ED visit or inpatient admission. Patient characteristics are summarized in Table 1. Tested patients were most commonly inpatients (96%) and female (71%). A total of 1451 thrombophilia tests were performed with a mean (± SD) of 8.9 ± 6.0 tests per patient. Testing characteristics are summarized in Table 2. Of the 39 different test types performed, the most commonly ordered were cardiolipin IgG and IgM antibodies (9% each), lupus anticoagulant (9%), and β2-glycoprotein 1 IgG and IgM antibodies (8% each). When combined with testing for phosphatidyl antibodies, antiphospholipid tests accounted for 70% of all tests. Overall, 134 (9%) test results were positive. The mean time for results to become available was 2.2 ± 2.5 days. The frequency of test types with corresponding positivity rates and mean time for results to become available are summarized in Supplementary Table 4.
The indications for thrombophilia testing are summarized in Table 3. Ischemic stroke was the most common indication for testing (50% of tests; 35% of patients), followed by VTE (21% of tests; 21% of patients), and pregnancy-related conditions (eg, preeclampsia, intrauterine fetal demise; 15% of tests; 25% of patients). Overall, 911 tests (63%) occurred in situations associated with minimal clinical utility, with 126 patients (77%) receiving at least one of these tests (Table 4).
Anticoagulant therapy was changed in 43 patients (26%) in the following ways: initiated in 35 patients (21%), transitioned to a different anticoagulant in 6 patients (4%), and discontinued in 2 patients (1%). Of the 35 patients initiating anticoagulant therapy, 29 had documented thrombosis (24 had VTE, 4 had cerebral venous sinus thrombosis [CVST], and 1 had basilar artery thrombosis). Overall, 2 instances were identified in which initiation of anticoagulant therapy at discharge was in response to thrombophilia test results. In the first instance, warfarin without a parenteral anticoagulant bridge was initiated for a 54-year-old patient with a cryptogenic stroke who tested positive for β2-glycoprotein 1 IgG antibodies, lupus anticoagulant, and protein S deficiency. In the second instance, warfarin with an enoxaparin bridge was initiated for a 26-year-old patient with a cryptogenic stroke who tested positive for β2-glycoprotein 1 IgG and IgM antibodies, cardiolipin IgG antibodies, lupus anticoagulant, protein C deficiency, and antithrombin deficiency. Of the 163 patients receiving thrombophilia testing, only 2 patients (1%) had clear documentation of being offered genetic consultation.
DISCUSSION
In this retrospective analysis, 1451 thrombophilia tests were performed in 163 patients over 6 months. Tested patients were relatively young, which is likely explained by the number of patients tested for pregnancy-related conditions and the fact that a stroke or VTE in younger patients more frequently prompted providers to suspect thrombophilia. Nearly three-fourths of patients were female, which is likely due to testing for pregnancy-related conditions and possibly diagnostic suspicion bias given the comparative predilection of antiphospholipid syndrome for women. The patient characteristics in our study are consistent with other studies evaluating thrombophilia testing.21,22
Thrombophilia testing was most frequently prompted by stroke, VTE, and pregnancy-related conditions. Only 26% of patients had acute thrombosis identified during the admission, primarily because of the high proportion of tests for cryptogenic strokes and pregnancy-related conditions. Thrombophilia testing is recommended in patients who have had a stroke when the stroke is considered to be cryptogenic after a standard stroke evaluation.23 Thrombophilia testing in pregnancy-related conditions is controversial but is often considered in situations such as stillbirths with severe placental pathology and/or significant growth restriction, or in mothers with a personal or family history of thrombosis.24 The proportion of testing for pregnancy-related conditions may be greater than at other institutions because UUHC Maternal Fetal Medicine is a referral center for women with conditions associated with hypercoagulability. Anticoagulant therapy was initiated in 21% of patients, but specifically in response to thrombophilia testing in only 2 instances; in most cases, anticoagulant therapy was initiated regardless of thrombophilia test results.
The results of this study confirm our hypothesis because the majority of thrombophilia tests occurred in situations associated with minimal clinical utility. Testing in these situations was not isolated to specific patients or medical services because 77% of tested patients received at least 1 test associated with minimal clinical utility. Our study took a conservative approach in defining scenarios associated with minimal clinical utility because other situations can also affect testing accuracy (eg, hepatic disease, nephrotic syndrome) but were not included in our analysis of this outcome.
The results of this study highlight opportunities to improve thrombophilia testing practices at our institution and may be generalizable to institutions with similar testing patterns. Because multiple medical services order thrombophilia tests, strategies to improve testing practices are still being determined. The results of this study can serve as a baseline for comparison after strategies are implemented. The most common situation associated with minimal clinical utility was the use of test types not generally recommended by guidelines or UUHC Thrombosis Service physicians for thrombophilia testing (eg, β2-glycoprotein 1 IgA antibodies, phosphatidyl antibodies). We intend to require a hematology or thrombosis specialty consult prior to ordering these tests. This intervention alone could potentially decrease unnecessary testing by a third. Another consideration is to require a specialty consult prior to any inpatient thrombophilia testing. This strategy has been found to decrease inappropriate testing at other institutions.21 We also intend to streamline available thrombophilia testing panels because a poorly designed panel could lead to ordering of multiple tests associated with minimal clinical utility. At least 12 different thrombophilia panels are currently available in our computerized physician order entry system (see Supplementary Table 5). We hypothesize that current panel designs contribute to providers inadvertently ordering unintended or duplicate tests and that reducing the number of available panels and clearly delineating what tests are contained in each panel is likely to reduce unnecessary testing. Other strategies being considered include using electronic clinical decision support tools, implementing strict ordering criteria for all inpatient testing, and establishing a thrombosis stewardship program.
Our study was unique in at least 2 ways. First, previous studies describing thrombophilia testing have described testing patterns for patients with specific indications (eg, VTE), whereas our study described all thrombophilia tests regardless of indication. This allows for testing pattern comparisons across indications and medical services, increasing the generalizability of our results. Second, this study quantifies tests occurring in situations associated with a practical definition of minimal clinical utility.
Our study has several limitations: (1) Many variables were reliant on provider notes and other documentation, which allows for potential misclassification of variables. (2) It was not always possible to determine the ultimate utility of each test in clinical management decisions, and our study did not investigate the impact of thrombophilia testing on duration of anticoagulant therapy. Additionally, select situations could benefit from testing regardless if anticoagulant therapy is altered (eg, informing contraceptive choices). (3) Testing performed following a provoked acute thrombosis was defined as testing within 3 months following administratively defined major surgery. This definition could have included some minor procedures that do not substantially increase VTE risk, resulting in underestimated clinical utility. (4) The UUHC University Hospital serves as a referral hospital for a large geographical area, and investigators did not have access to outpatient records for a large proportion of discharged patients. As a result, frequency of repeat testing could not be assessed, possibly resulting in overestimated clinical utility. (5) In categorizing indications for testing, testing for CVST was subcategorized under testing for ischemic stroke based on presenting symptoms rather than on underlying pathophysiology. The rationale for this categorization is that patients with CVST were often tested based on presenting symptoms. Additionally, tests for CVST were ordered by the neurology service, which also ordered tests for all other ischemic stroke indications. (6) The purpose of our study was to investigate the subset of the hospital’s patient population that received thrombophilia testing, and patients were identified by tests received and not by diagnosis codes. As a result, we are unable to provide the proportion of total patients treated at the hospital for specific conditions who were tested (eg, the proportion of stroke patients that received thrombophilia testing). (7) Current practice guidelines do not recommend testing for phosphatidyl antibodies, even when traditional antiphospholipid testing is negative.25-27 Although expert panels continue to explore associations between phosphatidyl antibodies and pregnancy morbidity and thrombotic events, the low level of evidence is insufficient to guide clinical management.28 Therefore, we categorized all phosphatidyl testing as associated with minimal clinical utility.
CONCLUSIONS
In a large academic medical center, the majority of tests occurred in situations associated with minimal clinical utility. Strategies to improve thrombophilia testing practices are needed in order to minimize potentially inappropriate testing, provide more cost-effective care, and promote value-driven outcomes.
Disclosure
S.W. received financial support for this submitted work via a Bristol-Myers-Squibb grant. G.F. received financial support from Portola Pharmaceuticals for consulting and lectures that were not related to this submitted work.
1. Franco RF, Reitsma PH. Genetic risk factors of venous thrombosis. Hum Genet. 2001;109(4):369-384. PubMed
2. Ridker PM, Hennekens CH, Lindpaintner K, Stampfer MJ, Eisenberg PR, Miletich JP. Mutation in the gene coding for coagulation factor V and the risk of myocardial infarction, stroke, and venous thrombosis in apparently healthy men. N Engl J Med. 1995;332(14):912-917. PubMed
3. Koster T, Rosendaal FR, de Ronde H, Briët E, Vandenbroucke JP, Bertina RM. Venous thrombosis due to poor anticoagulant response to activated protein C: Leiden Thrombophilia Study. Lancet. 1993;342(8886-8887):1503-1506. PubMed
4. Margaglione M, Brancaccio V, Giuliani N, et al. Increased risk for venous thrombosis in carriers of the prothrombin G-->A20210 gene variant. Ann Intern Med. 1998;129(2):89-93. PubMed
5. De Stefano V, Martinelli I, Mannucci PM, et al. The risk of recurrent deep venous thrombosis among heterozygous carriers of both factor V Leiden and the G20210A prothrombin mutation. N Engl J Med. 1999;341:801-806. PubMed
6. Dickey TL. Can thrombophilia testing help to prevent recurrent VTE? Part 2. JAAPA. 2002;15(12):23-24, 27-29. PubMed
7. Simpson EL, Stevenson MD, Rawdin A, Papaioannou D. Thrombophilia testing in people with venous thromboembolism: systematic review and cost-effectiveness analysis. Health Technol Assess. 2009;13(2):iii, ix-x, 1-91. PubMed
8. National Institute for Health and Clinical Excellence. Venous thromboembolic disease: the management of venous thromboembolic diseases and the role of thrombophilia testing. NICE clinical guideline 144. https://www.nice.org.uk/guidance/cg144. Accessed on June 30, 2017.
9. Evalution of Genomic Applications in Practice and Prevention (EGAPP) Working Group. Recommendations from the EGAPP Working Group: routine testing for factor V Leiden (R506Q) and prothrombin (20210G>A) mutations in adults with a history of idiopathic venous thromboembolism and their adult family members. Genet Med. 2011;13(1):67-76.
10. Kearon C, Akl EA, Comerota AJ, et al. Antithrombotic therapy for VTE disease: antithrombotic therapy and prevention of thrombosis, 9th ed: American College of Chest Physicians evidence-based clinical practice guidelines. Chest. 2012;141(2 Suppl):e419S-494S. PubMed
11. Baglin T, Gray E, Greaves M, et al. Clinical guidelines for testing for heritable thrombophilia. Br J Haematol. 2010;149(2):209-220. PubMed
12. Hicks LK, Bering H, Carson KR, et al. The ASH Choosing Wisely® campaign: five hematologic tests and treatments to question. Hematology Am Soc Hematol Educ Program. 2013;2013:9-14. PubMed
13. Stevens SM, Woller SC, Bauer KA, et al. Guidance for the evaluation and treatment of hereditary and acquired thrombophilia. J Thromb Thrombolysis. 2016;41(1):154-164. PubMed
14. Christiansen SC, Cannegieter SC, Koster T, Vandenbroucke JP, Rosendaal FR. Thrombophilia, clinical factors, and recurrent venous thrombotic events. JAMA. 2005;293(19):2352-2361. PubMed
15. Prandoni P, Lensing AW, Cogo A, et al. The long-term clinical course of acute deep venous thrombosis. Ann Intern Med. 1996;125(1):1-7. PubMed
16. Miles JS, Miletich JP, Goldhaber SZ, Hennekens CH, Ridker PM. G20210A mutation in the prothrombin gene and the risk of recurrent venous thromboembolism. J Am Coll Cardiol. 2001;37(1):215-218. PubMed
17. Eichinger S, Weltermann A, Mannhalter C, et al. The risk of recurrent venous thromboembolism in heterozygous carriers of factor V Leiden and a first spontaneous venous thromboembolism. Arch Intern Med. 2002;162(20):2357-2360. PubMed
18. Mazzolai L, Duchosal MA. Hereditary thrombophilia and venous thromboembolism: critical evaluation of the clinical implications of screening. Eur J Vasc Endovasc Surg. 2007;34(4):483-488. PubMed
19. Merriman L, Greaves M. Testing for thrombophilia: an evidence‐based approach. Postgrad Med J. 2006;82(973):699-704. PubMed
20. Favaloro EJ, McDonald D, Lippi G. Laboratory investigation of thrombophilia: the good, the bad, and the ugly. Semin Thromb Hemost. 2009;35(7):695-710. PubMed
21. Shen YM, Tsai J, Taiwo E, et al. Analysis of thrombophilia test ordering practices at an academic center: a proposal for appropriate testing to reduce harm and cost. PLoS One. 2016;11(5):e0155326. PubMed
22. Meyer MR, Witt DM, Delate T, et al. Thrombophilia testing patterns amongst patients with acute venous thromboembolism. Thromb Res. 2015;136(6):1160-1164. PubMed
23. Saver JL. Clinical practice: cryptogenic stroke. N Engl J Med. 2016;374(21):2065-2074. PubMed
24. ACOG practice bulletin no. 102: management of stillbirth. Obstet Gynecol. 2009;113(3):748-761. PubMed
25. Miyakis S, Lockshin MD, Atsumi T, et al. International consensus statement on an update of the classification criteria for definite antiphospholipid syndrome (APS). J Thromb Haemost. 2006;4(2):295-306. PubMed
26. Keeling D, Mackie I, Moore GW, Greer IA, Greaves M, British Committee for Standards in Haematology. Guidelines on the investigation and management of antiphospholipid syndrome. Br J Haematol. 2012;157(1):47-58. PubMed
27. Committee on Practice Bulletins—Obstetrics, American College of Obstetricians and Gynecologists. Practice bulletin no. 132: antiphospholipid syndrome. Obstet Gynecol. 2012;120(6):1514-1521. PubMed
28. Bertolaccini ML, Amengual O, Andreoli L, et al. 14th International Congress on Antiphospholipid Antibodies Task Force. Report on antiphospholipid syndrome laboratory diagnostics and trends. Autoimmun Rev. 2014;13(9):917-930. PubMed
© 2017 Society of Hospital Medicine