Facial acne vulgaris is a common skin disease among teenagers and adolescents that may negatively affect self-esteem, perceived facial attractiveness, and social participation.1 Treatments for acne often are multimodal and require the utmost adherence. For these reasons, acne treatments have been challenging to clinicians and patients alike, as patient compliance in maintaining the use of prescribed topical and oral medications remains essential to attain improvement in quality of life (QOL).
Salicylic acid is a popular medicament for acne treatment that frequently is used as monotherapy or as an adjuvant for other acne treatments, especially in patients with oily skin.2 Salicylic acid has a keratolytic effect, causing corneocyte discohesion in clogged pores or congested follicles,2 and it is effective in treating both inflammatory and noninflammatory acne.3,4
Light therapy, particularly with visible light, has been demonstrated to improve acne outcomes.5 Pneumatic broadband light (PBBL) is a therapeutic light treatment in the broadband range (400–1200 nm) that is combined with vacuum suction, which creates a mechanical lysis of thin-walled pustules and dislodges pore impaction. Additionally, the blue light portion of the PBBL spectrum targets endogenous porphyrins in Propionibacterium acnes, resulting in bacterial destruction.6-8
The purpose of this study was to compare the efficacy, tolerability, and safety of salicylic acid 30% peel versus PBBL in the treatment of mild to moderately severe facial acne vulgaris.
METHODS
Study Design
This single-blind, randomized, split-face pilot study was approved by the institutional review board of the University of Pennsylvania (Philadelphia, Pennsylvania). All patients provided informed consent before entering the study. The single-blind evaluation was performed by one dermatologist (C.T.) who examined the participants on every visit prior to PBBL treatment.
Before the study started, participants were randomized for which side of the face was to be treated with PBBL using a number assigned to each participant. Participants received both treatments—salicylic acid 30% peel on one side of the face and PBBL treatment on the other side of the face—once weekly for a total of 6 treatments. They were then asked to return for 2 follow-up evaluations at weeks 3 and 6 following the last treatment session and were instructed not to use any topical or oral acne medications during these follow-up periods.
Inclusion and Exclusion Criteria
Patients aged 18 years and older of any race and sex with noninflammatory papules, some inflammatory papules, and no more than 1 nodule (considered as mild to moderately severe facial acne) were included in the study. Participants had not been on any topical acne medications for at least 1 month and/or oral retinoids for at least 1 year prior to the study period. All women completed urine pregnancy tests prior to the study and were advised to utilize birth control during the study period.
Study Treatments
Salicylic Acid 30% Peel
The participant’s face was cleansed thoroughly before application of salicylic acid 30%(1.5 g/2.5 mL) to half of the face and left on for 5 minutes before being carefully rinsed off by spraying with spring water. Prior to initiating PBBL therapy, the peeled side of the participant’s face was covered with a towel.
Pneumatic Broadband Light
On the other side of the face, PBBL was performed to deliver broadband light within the spectrum range of 400 to 1200 nm at a setting approximately equivalent to a fluence of 4 to 6 J/cm2 and a vacuum setting approximately equivalent to a negative pressure of 3 lb/in2. The power setting was increased on each subsequent visit depending on each participant’s tolerability.
Participants were required to apply a moisturizer and sunscreen to the face and avoid excessive sun exposure between study visits.
Efficacy Evaluation
A comparison of the efficacy of the treatments was determined by clinical evaluation and examining the results of the outcome measurements with the modified Global Acne Grading Score (mGAGS) and Acne QOL Scale during each treatment visit. Facial photographs were taken at each visit.
Modified Global Acne Grading Score
The mGAGS is a modification of the Global Acne Grading Scale (GAGS) that has been used to evaluate acne severity in many studies.9-11 The GAGS considers 6 locations on the face with a grading factor for each location. The local score is obtained by multiplying the factor rated by location with the factor of clinical assessment: local score = factor rated by location × factor rated by clinical assessment. The total score is the sum of the individual local scores (Table 1).
Although the original GAGS incorporated the type and location of the lesions in its calculation, we felt that the number of lesions also was important to add to our grading score. Therefore, we modified the GAGS by adding a factor rated by the number of lesions to improve the accuracy of the test. Accordingly, the local mGAGS scores were calculated by multiplying the location factor by the lesion type and number of lesions factors: local score = location factor × lesion type factor × number of lesions factor.
Acne QOL Questionnaire
Acne QOL was assessed during each visit to demonstrate if the treatment results affected participants’ socialization due to appearance.12 Participants were asked to complete the questionnaire, which consisted of 9 questions with 4 rating answers (0=not affected; 1=mildly affected; 2=moderately affected; 3=markedly affected). A total score of 9 or higher (high score) indicated that acne had a substantial negative impact on the participant, while a total score below 9 (low score) meant acne scarcely impacted social aspects and daily activities of the patient.
Safety Evaluation
The safety of the treatments was evaluated by clinical inspection and by comparing the results of the Wong-Baker FACES Pain Rating Scale (WBPRS)13 after treatment. The WBPRS is used worldwide among researchers to assess pain, particularly in children.14,15 It is composed of 6 faces expressing pain with word descriptions with a corresponding number range reflecting pain severity from 0 to 5 (0=no hurt; 1=hurts little bit; 2=hurts little more; 3=hurts even more; 4=hurts whole lot; 5=hurts worst).13
Statistical Analysis
All variables were presented as the median (range). A Wilcoxon signed rank test was used to compare clinical responses between the salicylic acid 30% peel and PBBL therapies. SPSS software version 12.0 was used for all statistical analysis. A 2-tailed P value of ≤.05 was considered statistically significant.
RESULTS
Study Population
Twelve participants (2 males, 10 females) aged 17 to 36 years (median age, 22 years; mean age [SD], 23.33 [1.65] years) with both comedonal and inflammatory acne were enrolled into this study for 6 split-face treatments of salicylic acid 30% peel and PBBL at 1-week intervals for 6 weeks, with 2 subsequent follow-up sessions at weeks 3 and 6 posttreatment. Of the 12 participants, 11 were white and 1 was Asian American, with Fitzpatrick skin types II to IV. Nine participants (75%) completed the study. One participant dropped out of the study after the fourth treatment due to a scheduling conflict, and the other 2 participants did not return for follow-up. No participants withdrew from the study because of adverse therapeutic events.
Efficacy Evaluation
Comparisons between the salicylic acid 30% peel and PBBL procedures for mGAGS at each visit are shown in Table 2. There was no significant difference in treatment efficacy between the salicylic acid 30% peel and PBBL therapies during the study’s treatment and follow-up events; however, both procedures contributed to a major improvement in acne symptoms by the third treatment session and through to the last follow-up session (P≤.05). Clinical photographs at baseline, at last treatment visit (week 6), and at last follow-up (week 12) are shown in Figures 1 and 2.
Figure 1. A 19-year-old woman with mild acne who was treated with salicylic acid 30% peel on the right side of the face at baseline (A), week 6 (B), and week 12 (C).
Figure 2. A 19-year-old woman with mild acne who was treated with pneumatic broadband light on the left side of the face at baseline (A), week 6 (B), and week 12 (C).
The results of the acne QOL questionnaire are shown in Table2. Lower scores reflect a higher QOL. Median QOL scores at each visit ranged from 0.5 to 4.5. There was no significant difference found between the peel agent or PBBL based on the baseline QOL and subsequent visit assessments; however, the differences between the 2 treatments were significant at weeks 3 (P=.05) and 5 (P=.03) of treatment as well as at the last follow-up visit (P=.05).
According to the QOL scores, by the third treatment session participants were more satisfied with their improved acne condition from the PBBL procedure than the salicylic acid 30% peel as demonstrated by a positive range of the QOL assessments between PBBL and salicylic acid 30% peel (as shown in the difference in QOL in Table 2: week 3, 0–6; week 4, 0–3; week 5, 0–7). On the other hand, participants saw more improvement from the salicylic acid 30% peel than from PBBL by the last follow-up evaluation, as the differences in QOL scores between the 2 treatments resulted in a negative range (−5–0).
Safety
Pain assessment by the WBPRS at every visit showed a low pain rating associated with both salicylic acid 30% peel (range, 0–0.5) and PBBL (range, 1.0–1.5) treatments. The median pain score of the salicylic acid 30% peel appeared higher compared to the PBBL treatment, yet a significant difference between both treatments was seen only at weeks 1, 3, and 6 of treatment (P≤.05).
There were no unexpected therapeutic reactions reported in our study, and no participants withdrew from the study due to adverse events. Most participants experienced only mild adverse reactions, including redness, stinging, and a burning sensation on the salicylic acid 30% peel side, which were transient and disappeared in minutes; only redness occurred on the PBBL-treated side.
Comment
Facial acne treatment is challenging, as prolonged and/or severe acne contributes to scarring, declining self-confidence, and undesirable financial consequences. Even though salicylic acid peel is a commonly used acne treatment choice, the PBBL methodology was approved by the US Food and Drug Administration6 and has become an alternative procedure for acne treatment.
The pharmacological effects of salicylic acid are related to its corneocyte desquamation and exfoliative actions, thereby reducing corneocyte cohesion and unclogging follicular pores.16 Salicylic acid has been demonstrated to ameliorate inflammatory acne by its effects on the arachidonic acid cascade.2,4,17 In our study, salicylic acid 30% peel met participants’ satisfaction in acne improvement similar to a study showing a 50% improvement in acne scores after just 2 treatments.18 Our data support and corroborate that salicylic acid 30% peel renders an improvement in acne sequelae reported in several other studies.2,17,18
Pneumatic broadband light has been known to treat acne by the mechanism of pneumatic suction combined with photodynamic therapy using broadband-pulsed light (400–1200 nm).6-8 By applying the pneumatic device, a vacuum is created on the skin to remove sebum contents from follicles, whereas broadband light is emitted simultaneously to destroy bacteria and decrease the inflammatory process.7 During the vacuum process, the skin is stretched to reduce pain and avoid competitive chromophores (eg, hemoglobin), while the broadband light is administered.7 Broadband light encompasses 2 main light spectrums: blue light (415 nm) activates coproporphyrin III, which induces reactive free radicals and singlet oxygen species and has been reported to be the cause of bacterial cell death,19 and red light (633 nm), which renders an increase of fibroblast growth factors to work against the inflammatory processes.20 There are numerous studies showing a reduction of acne lesions after photopneumatic therapy with minimal side effects.6-8
In our study, we compared the efficacy of salicylic acid 30% peel with PBBL in the treatment of acne. Both treatments showed significant reduction of mGAGS compared to baseline starting from week 3 and lasting until week 12. Remarkably, although there were some participants who reported acne recurrence after completing all treatments at week 6, which could have happened when the treatments were ended, the final acne score at week 12 was still significantly lower than baseline. It is clear that the participants continued their acne improvement up to the 6-week follow-up period without any topical or oral medication. We do not propose that either salicylic acid peel or PBBL treatment is a solitary option but speculate that the combination of both treatments may initiate a faster resolution in the disappearance of acne.
Although there was no statistically significant difference in efficacy between salicylic acid 30% peel and PBBL procedures at each visit, QOL assessments related to treatment satisfaction did yield significant differences between baseline and the end of treatment. We noticed that participants had more positive attitudes toward the PBBL side at week 3 and week 5 but only mild satisfaction at week 4, as the differences in QOL scores between both treatments showed positive ranging values. This finding is most likely related to the immediate reduction of acne pustules by the PBBL vacuum lysis of these lesions. The differences in the QOL scores between both treatments at week 12 (the last follow-up evaluation) provided opposite findings, which meant patients had nearly even improvement in both PBBL method and salicylic acid 30% peel. Therefore, according to QOL data, acne disappeared quickly with the application of PBBL therapy but reappeared on the PBBL-treated side by the follow-up evaluations, though the acne score between both sides showed no statistically significant difference.
We reason that the PBBL therapy works better than salicylic acid 30% peel because the pneumatic system may help to unclog the pores through mechanical debridement via suctioning versus desquamation from salicylic acid 30% peel. Nonetheless, salicylic acid 30% peel sustained improvement when compared to PBBL through the follow-up periods. Both salicylic acid 30% peel and PBBL treatments are well tolerated and may initiate a faster resolution in the improvement of acne when incorporated with a medical program.
Because of the recurrence of acne after treatments were stopped, additional medical therapies are advised to be used along with this study’s clinical treatments to help mitigate the acne symptoms. These treatments should be considered in patients concerned about antibiotic resistance or those who cannot take oral antibiotics or retinoids. Salicylic acid peel is more accessible and affordable than PBBL, whereas PBBL is slightly more tolerable and less irritating than salicylic acid peel. Nevertheless, the cost of investment in PBBL is quite high—as much as $70,000—and does not include disposable, single-use tips, which cost $30 each. The machine is easy to set up, weighs about 40 lb, and requires little space to store. The average cost per visit of PBBL treatment in office is $150.00 and $75.00 for salicylic acid peel (unpublished data, Hospital of the University of Pennsylvania, 2010). Most patients may select salicylic acid peel over PBBL due to the cost and convenience of the treatment. Neither procedure should be considered as a solitary treatment option but rather as adjunctive procedures combined with oral and/or topical acne medications. After this study’s treatments were stopped and without other medications to maintain treatment effectiveness, the lesions reappeared, trending back toward baseline.
Conclusion
Both salicylic acid 30% peel and PBBL procedures are effective, safe, and well tolerated in treating acne. Although there was no significant difference in the efficacy between both treatments in this study, the small sample size and short follow-up intervals warrant further studies to support the observed outstanding outcomes and should be considered in combination with other medical treatment options. These procedures may be beneficial in holding the patient compliant until their medical therapies have an opportunity to work.
Acknowledgment
The authors would like to thank Joyce Okawa, RN (Philadelphia, Pennsylvania), for her assistance in the submission to the institutional review board of the University of Pennsylvania.
References
Rapp DA, Brenes GA, Feldman SR, et al. Anger and acne: implications for quality of life, patient satisfaction and clinical care. Br J Dermatol. 2004;151:183-189.
Zakopoulou N, Kontochristopoulos G. Superficial chemical peels. J Cosmet Dermatol. 2006;5:246-253.
Berson DS, Cohen JL, Rendon MI, et al. Clinical role and application of superficial chemical peels in today’s practice. J Drugs Dermatol. 2009;8:803-811.
Shalita AR. Treatment of mild and moderate acne vulgaris with salicylic acid in an alcohol-detergent vehicle. Cutis. 1981;28:556-558, 561.
Sakamoto FH, Lopes JD, Anderson RR. Photodynamic therapy for acne vulgaris: a critical review from basics to clinical practice: part I. acne vulgaris: when and why consider photodynamic therapy? J Am Acad Dermatol. 2010;63:183-193; quiz 93-94.
Gold MH, Biron J. Efficacy of a novel combination of pneumatic energy and broadband light for the treatment of acne. J Drugs Dermatol. 2008;7:639-642.
Shamban AT, Enokibori M, Narurkar V, et al. Photopneumatic technology for the treatment of acne vulgaris. J Drugs Dermatol. 2008;7:139-145.
Wanitphakdeedecha R, Tanzi EL, Alster TS. Photopneumatic therapy for the treatment of acne. J DrugsDermatol. 2009;8:239-241.
Doshi A, Zaheer A, Stiller MJ. A comparison of current acne grading systems and proposal of a novel system. Int J Dermatol. 1997;36:416-418.
Weiss JW, Shavin J, Davis M. Preliminary results of a nonrandomized, multicenter, open-label study of patient satisfaction after treatment with combination benzoyl peroxide/clindamycin topical gel for mild to moderate acne. Clin Ther. 2002;24:1706-1717.
Demircay Z, Kus S, Sur H. Predictive factors for acne flare during isotretinoin treatment. Eur JDermatol. 2008;18:452-456.
Gupta MA, Johnson AM, Gupta AK. The development of an Acne Quality of Life scale: reliability, validity, and relation to subjective acne severity in mild to moderate acne vulgaris. Acta Derm Venereol. 1998;78:451-456.
Wong DL, Baker CM. Pain in children: comparison of assessment scales. Pediatr Nurs. 1988;14:9-17.
Wong DL, Hockenberry-Eaton M, Wilson D, et al. Wong’s Essentials ofPediatric Nursing. 6th ed. St. Louis, MO: Mosby; 2001:1301.
Zempsky WT, Robbins B, McKay K. Reduction of topical anesthetic onset time using ultrasound: a randomized controlled trial prior to venipuncture in young children. Pain Med. 2008;9:795-802.
Imayama S, Ueda S, Isoda M. Histologic changes in the skin of hairless mice following peeling with salicylic acid. Arch Dermatol. 2000;136:1390-1395.
Lee H, Kim I. Salicylic acid peels for the treatment of acne vulgaris in Asian patients. Dermatol Surg. 2003;29:1196-1199.
Kessler E, Flanagan K, Chia C, et al. Comparison of alpha- and beta-hydroxy acid chemical peels in the treatment of mild to moderately severe facial acne vulgaris. Dermatol Surg. 2008;34:45-50.
Omi T, Munavalli GS, Kawana S, et al. Ultrastructural evidencefor thermal injury to pilosebaceous units during the treatment of acne using photopneumatic (PPX) therapy. J Cosmet Laser Ther. 2008;10:7-11.
Papageorgiou P, Katsambas A, Chu A. Phototherapy with blue (415 nm) and red (660 nm) light in the treatment of acne vulgaris. Br J Dermatol. 2000;142:973-978.
Drs. Thuangtong and Rattanaumpawan are from the Faculty of Medicine, Siriraj Hospital, Mahidol University, Bangkok, Thailand. Dr. Thuangtong is from the Department of Dermatology, and Dr. Rattanaumpawan is from the Department of Medicine. Dr. Tangjaturonrusamee is from the Institute of Dermatology, Department of Medical Services, Ministry of Public Health, Bangkok. Dr. Ditre is from the Department of Dermatology, Perelman School of Medicine at University of Pennsylvania, Philadelphia, and Penn Medicine Radnor, Pennsylvania.
The authors report no conflict of interest.
Correspondence: Chérie M. Ditre, MD, Department of Dermatology, Perelman School of Medicine, University of Pennsylvania, 250 King of Prussia Rd, Radnor, PA 19087 (cherie.ditre@uphs.upenn.edu).
Author and Disclosure Information
Drs. Thuangtong and Rattanaumpawan are from the Faculty of Medicine, Siriraj Hospital, Mahidol University, Bangkok, Thailand. Dr. Thuangtong is from the Department of Dermatology, and Dr. Rattanaumpawan is from the Department of Medicine. Dr. Tangjaturonrusamee is from the Institute of Dermatology, Department of Medical Services, Ministry of Public Health, Bangkok. Dr. Ditre is from the Department of Dermatology, Perelman School of Medicine at University of Pennsylvania, Philadelphia, and Penn Medicine Radnor, Pennsylvania.
The authors report no conflict of interest.
Correspondence: Chérie M. Ditre, MD, Department of Dermatology, Perelman School of Medicine, University of Pennsylvania, 250 King of Prussia Rd, Radnor, PA 19087 (cherie.ditre@uphs.upenn.edu).
Facial acne vulgaris is a common skin disease among teenagers and adolescents that may negatively affect self-esteem, perceived facial attractiveness, and social participation.1 Treatments for acne often are multimodal and require the utmost adherence. For these reasons, acne treatments have been challenging to clinicians and patients alike, as patient compliance in maintaining the use of prescribed topical and oral medications remains essential to attain improvement in quality of life (QOL).
Salicylic acid is a popular medicament for acne treatment that frequently is used as monotherapy or as an adjuvant for other acne treatments, especially in patients with oily skin.2 Salicylic acid has a keratolytic effect, causing corneocyte discohesion in clogged pores or congested follicles,2 and it is effective in treating both inflammatory and noninflammatory acne.3,4
Light therapy, particularly with visible light, has been demonstrated to improve acne outcomes.5 Pneumatic broadband light (PBBL) is a therapeutic light treatment in the broadband range (400–1200 nm) that is combined with vacuum suction, which creates a mechanical lysis of thin-walled pustules and dislodges pore impaction. Additionally, the blue light portion of the PBBL spectrum targets endogenous porphyrins in Propionibacterium acnes, resulting in bacterial destruction.6-8
The purpose of this study was to compare the efficacy, tolerability, and safety of salicylic acid 30% peel versus PBBL in the treatment of mild to moderately severe facial acne vulgaris.
METHODS
Study Design
This single-blind, randomized, split-face pilot study was approved by the institutional review board of the University of Pennsylvania (Philadelphia, Pennsylvania). All patients provided informed consent before entering the study. The single-blind evaluation was performed by one dermatologist (C.T.) who examined the participants on every visit prior to PBBL treatment.
Before the study started, participants were randomized for which side of the face was to be treated with PBBL using a number assigned to each participant. Participants received both treatments—salicylic acid 30% peel on one side of the face and PBBL treatment on the other side of the face—once weekly for a total of 6 treatments. They were then asked to return for 2 follow-up evaluations at weeks 3 and 6 following the last treatment session and were instructed not to use any topical or oral acne medications during these follow-up periods.
Inclusion and Exclusion Criteria
Patients aged 18 years and older of any race and sex with noninflammatory papules, some inflammatory papules, and no more than 1 nodule (considered as mild to moderately severe facial acne) were included in the study. Participants had not been on any topical acne medications for at least 1 month and/or oral retinoids for at least 1 year prior to the study period. All women completed urine pregnancy tests prior to the study and were advised to utilize birth control during the study period.
Study Treatments
Salicylic Acid 30% Peel
The participant’s face was cleansed thoroughly before application of salicylic acid 30%(1.5 g/2.5 mL) to half of the face and left on for 5 minutes before being carefully rinsed off by spraying with spring water. Prior to initiating PBBL therapy, the peeled side of the participant’s face was covered with a towel.
Pneumatic Broadband Light
On the other side of the face, PBBL was performed to deliver broadband light within the spectrum range of 400 to 1200 nm at a setting approximately equivalent to a fluence of 4 to 6 J/cm2 and a vacuum setting approximately equivalent to a negative pressure of 3 lb/in2. The power setting was increased on each subsequent visit depending on each participant’s tolerability.
Participants were required to apply a moisturizer and sunscreen to the face and avoid excessive sun exposure between study visits.
Efficacy Evaluation
A comparison of the efficacy of the treatments was determined by clinical evaluation and examining the results of the outcome measurements with the modified Global Acne Grading Score (mGAGS) and Acne QOL Scale during each treatment visit. Facial photographs were taken at each visit.
Modified Global Acne Grading Score
The mGAGS is a modification of the Global Acne Grading Scale (GAGS) that has been used to evaluate acne severity in many studies.9-11 The GAGS considers 6 locations on the face with a grading factor for each location. The local score is obtained by multiplying the factor rated by location with the factor of clinical assessment: local score = factor rated by location × factor rated by clinical assessment. The total score is the sum of the individual local scores (Table 1).
Although the original GAGS incorporated the type and location of the lesions in its calculation, we felt that the number of lesions also was important to add to our grading score. Therefore, we modified the GAGS by adding a factor rated by the number of lesions to improve the accuracy of the test. Accordingly, the local mGAGS scores were calculated by multiplying the location factor by the lesion type and number of lesions factors: local score = location factor × lesion type factor × number of lesions factor.
Acne QOL Questionnaire
Acne QOL was assessed during each visit to demonstrate if the treatment results affected participants’ socialization due to appearance.12 Participants were asked to complete the questionnaire, which consisted of 9 questions with 4 rating answers (0=not affected; 1=mildly affected; 2=moderately affected; 3=markedly affected). A total score of 9 or higher (high score) indicated that acne had a substantial negative impact on the participant, while a total score below 9 (low score) meant acne scarcely impacted social aspects and daily activities of the patient.
Safety Evaluation
The safety of the treatments was evaluated by clinical inspection and by comparing the results of the Wong-Baker FACES Pain Rating Scale (WBPRS)13 after treatment. The WBPRS is used worldwide among researchers to assess pain, particularly in children.14,15 It is composed of 6 faces expressing pain with word descriptions with a corresponding number range reflecting pain severity from 0 to 5 (0=no hurt; 1=hurts little bit; 2=hurts little more; 3=hurts even more; 4=hurts whole lot; 5=hurts worst).13
Statistical Analysis
All variables were presented as the median (range). A Wilcoxon signed rank test was used to compare clinical responses between the salicylic acid 30% peel and PBBL therapies. SPSS software version 12.0 was used for all statistical analysis. A 2-tailed P value of ≤.05 was considered statistically significant.
RESULTS
Study Population
Twelve participants (2 males, 10 females) aged 17 to 36 years (median age, 22 years; mean age [SD], 23.33 [1.65] years) with both comedonal and inflammatory acne were enrolled into this study for 6 split-face treatments of salicylic acid 30% peel and PBBL at 1-week intervals for 6 weeks, with 2 subsequent follow-up sessions at weeks 3 and 6 posttreatment. Of the 12 participants, 11 were white and 1 was Asian American, with Fitzpatrick skin types II to IV. Nine participants (75%) completed the study. One participant dropped out of the study after the fourth treatment due to a scheduling conflict, and the other 2 participants did not return for follow-up. No participants withdrew from the study because of adverse therapeutic events.
Efficacy Evaluation
Comparisons between the salicylic acid 30% peel and PBBL procedures for mGAGS at each visit are shown in Table 2. There was no significant difference in treatment efficacy between the salicylic acid 30% peel and PBBL therapies during the study’s treatment and follow-up events; however, both procedures contributed to a major improvement in acne symptoms by the third treatment session and through to the last follow-up session (P≤.05). Clinical photographs at baseline, at last treatment visit (week 6), and at last follow-up (week 12) are shown in Figures 1 and 2.
Figure 1. A 19-year-old woman with mild acne who was treated with salicylic acid 30% peel on the right side of the face at baseline (A), week 6 (B), and week 12 (C).
Figure 2. A 19-year-old woman with mild acne who was treated with pneumatic broadband light on the left side of the face at baseline (A), week 6 (B), and week 12 (C).
The results of the acne QOL questionnaire are shown in Table2. Lower scores reflect a higher QOL. Median QOL scores at each visit ranged from 0.5 to 4.5. There was no significant difference found between the peel agent or PBBL based on the baseline QOL and subsequent visit assessments; however, the differences between the 2 treatments were significant at weeks 3 (P=.05) and 5 (P=.03) of treatment as well as at the last follow-up visit (P=.05).
According to the QOL scores, by the third treatment session participants were more satisfied with their improved acne condition from the PBBL procedure than the salicylic acid 30% peel as demonstrated by a positive range of the QOL assessments between PBBL and salicylic acid 30% peel (as shown in the difference in QOL in Table 2: week 3, 0–6; week 4, 0–3; week 5, 0–7). On the other hand, participants saw more improvement from the salicylic acid 30% peel than from PBBL by the last follow-up evaluation, as the differences in QOL scores between the 2 treatments resulted in a negative range (−5–0).
Safety
Pain assessment by the WBPRS at every visit showed a low pain rating associated with both salicylic acid 30% peel (range, 0–0.5) and PBBL (range, 1.0–1.5) treatments. The median pain score of the salicylic acid 30% peel appeared higher compared to the PBBL treatment, yet a significant difference between both treatments was seen only at weeks 1, 3, and 6 of treatment (P≤.05).
There were no unexpected therapeutic reactions reported in our study, and no participants withdrew from the study due to adverse events. Most participants experienced only mild adverse reactions, including redness, stinging, and a burning sensation on the salicylic acid 30% peel side, which were transient and disappeared in minutes; only redness occurred on the PBBL-treated side.
Comment
Facial acne treatment is challenging, as prolonged and/or severe acne contributes to scarring, declining self-confidence, and undesirable financial consequences. Even though salicylic acid peel is a commonly used acne treatment choice, the PBBL methodology was approved by the US Food and Drug Administration6 and has become an alternative procedure for acne treatment.
The pharmacological effects of salicylic acid are related to its corneocyte desquamation and exfoliative actions, thereby reducing corneocyte cohesion and unclogging follicular pores.16 Salicylic acid has been demonstrated to ameliorate inflammatory acne by its effects on the arachidonic acid cascade.2,4,17 In our study, salicylic acid 30% peel met participants’ satisfaction in acne improvement similar to a study showing a 50% improvement in acne scores after just 2 treatments.18 Our data support and corroborate that salicylic acid 30% peel renders an improvement in acne sequelae reported in several other studies.2,17,18
Pneumatic broadband light has been known to treat acne by the mechanism of pneumatic suction combined with photodynamic therapy using broadband-pulsed light (400–1200 nm).6-8 By applying the pneumatic device, a vacuum is created on the skin to remove sebum contents from follicles, whereas broadband light is emitted simultaneously to destroy bacteria and decrease the inflammatory process.7 During the vacuum process, the skin is stretched to reduce pain and avoid competitive chromophores (eg, hemoglobin), while the broadband light is administered.7 Broadband light encompasses 2 main light spectrums: blue light (415 nm) activates coproporphyrin III, which induces reactive free radicals and singlet oxygen species and has been reported to be the cause of bacterial cell death,19 and red light (633 nm), which renders an increase of fibroblast growth factors to work against the inflammatory processes.20 There are numerous studies showing a reduction of acne lesions after photopneumatic therapy with minimal side effects.6-8
In our study, we compared the efficacy of salicylic acid 30% peel with PBBL in the treatment of acne. Both treatments showed significant reduction of mGAGS compared to baseline starting from week 3 and lasting until week 12. Remarkably, although there were some participants who reported acne recurrence after completing all treatments at week 6, which could have happened when the treatments were ended, the final acne score at week 12 was still significantly lower than baseline. It is clear that the participants continued their acne improvement up to the 6-week follow-up period without any topical or oral medication. We do not propose that either salicylic acid peel or PBBL treatment is a solitary option but speculate that the combination of both treatments may initiate a faster resolution in the disappearance of acne.
Although there was no statistically significant difference in efficacy between salicylic acid 30% peel and PBBL procedures at each visit, QOL assessments related to treatment satisfaction did yield significant differences between baseline and the end of treatment. We noticed that participants had more positive attitudes toward the PBBL side at week 3 and week 5 but only mild satisfaction at week 4, as the differences in QOL scores between both treatments showed positive ranging values. This finding is most likely related to the immediate reduction of acne pustules by the PBBL vacuum lysis of these lesions. The differences in the QOL scores between both treatments at week 12 (the last follow-up evaluation) provided opposite findings, which meant patients had nearly even improvement in both PBBL method and salicylic acid 30% peel. Therefore, according to QOL data, acne disappeared quickly with the application of PBBL therapy but reappeared on the PBBL-treated side by the follow-up evaluations, though the acne score between both sides showed no statistically significant difference.
We reason that the PBBL therapy works better than salicylic acid 30% peel because the pneumatic system may help to unclog the pores through mechanical debridement via suctioning versus desquamation from salicylic acid 30% peel. Nonetheless, salicylic acid 30% peel sustained improvement when compared to PBBL through the follow-up periods. Both salicylic acid 30% peel and PBBL treatments are well tolerated and may initiate a faster resolution in the improvement of acne when incorporated with a medical program.
Because of the recurrence of acne after treatments were stopped, additional medical therapies are advised to be used along with this study’s clinical treatments to help mitigate the acne symptoms. These treatments should be considered in patients concerned about antibiotic resistance or those who cannot take oral antibiotics or retinoids. Salicylic acid peel is more accessible and affordable than PBBL, whereas PBBL is slightly more tolerable and less irritating than salicylic acid peel. Nevertheless, the cost of investment in PBBL is quite high—as much as $70,000—and does not include disposable, single-use tips, which cost $30 each. The machine is easy to set up, weighs about 40 lb, and requires little space to store. The average cost per visit of PBBL treatment in office is $150.00 and $75.00 for salicylic acid peel (unpublished data, Hospital of the University of Pennsylvania, 2010). Most patients may select salicylic acid peel over PBBL due to the cost and convenience of the treatment. Neither procedure should be considered as a solitary treatment option but rather as adjunctive procedures combined with oral and/or topical acne medications. After this study’s treatments were stopped and without other medications to maintain treatment effectiveness, the lesions reappeared, trending back toward baseline.
Conclusion
Both salicylic acid 30% peel and PBBL procedures are effective, safe, and well tolerated in treating acne. Although there was no significant difference in the efficacy between both treatments in this study, the small sample size and short follow-up intervals warrant further studies to support the observed outstanding outcomes and should be considered in combination with other medical treatment options. These procedures may be beneficial in holding the patient compliant until their medical therapies have an opportunity to work.
Acknowledgment
The authors would like to thank Joyce Okawa, RN (Philadelphia, Pennsylvania), for her assistance in the submission to the institutional review board of the University of Pennsylvania.
References
Rapp DA, Brenes GA, Feldman SR, et al. Anger and acne: implications for quality of life, patient satisfaction and clinical care. Br J Dermatol. 2004;151:183-189.
Zakopoulou N, Kontochristopoulos G. Superficial chemical peels. J Cosmet Dermatol. 2006;5:246-253.
Berson DS, Cohen JL, Rendon MI, et al. Clinical role and application of superficial chemical peels in today’s practice. J Drugs Dermatol. 2009;8:803-811.
Shalita AR. Treatment of mild and moderate acne vulgaris with salicylic acid in an alcohol-detergent vehicle. Cutis. 1981;28:556-558, 561.
Sakamoto FH, Lopes JD, Anderson RR. Photodynamic therapy for acne vulgaris: a critical review from basics to clinical practice: part I. acne vulgaris: when and why consider photodynamic therapy? J Am Acad Dermatol. 2010;63:183-193; quiz 93-94.
Gold MH, Biron J. Efficacy of a novel combination of pneumatic energy and broadband light for the treatment of acne. J Drugs Dermatol. 2008;7:639-642.
Shamban AT, Enokibori M, Narurkar V, et al. Photopneumatic technology for the treatment of acne vulgaris. J Drugs Dermatol. 2008;7:139-145.
Wanitphakdeedecha R, Tanzi EL, Alster TS. Photopneumatic therapy for the treatment of acne. J DrugsDermatol. 2009;8:239-241.
Doshi A, Zaheer A, Stiller MJ. A comparison of current acne grading systems and proposal of a novel system. Int J Dermatol. 1997;36:416-418.
Weiss JW, Shavin J, Davis M. Preliminary results of a nonrandomized, multicenter, open-label study of patient satisfaction after treatment with combination benzoyl peroxide/clindamycin topical gel for mild to moderate acne. Clin Ther. 2002;24:1706-1717.
Demircay Z, Kus S, Sur H. Predictive factors for acne flare during isotretinoin treatment. Eur JDermatol. 2008;18:452-456.
Gupta MA, Johnson AM, Gupta AK. The development of an Acne Quality of Life scale: reliability, validity, and relation to subjective acne severity in mild to moderate acne vulgaris. Acta Derm Venereol. 1998;78:451-456.
Wong DL, Baker CM. Pain in children: comparison of assessment scales. Pediatr Nurs. 1988;14:9-17.
Wong DL, Hockenberry-Eaton M, Wilson D, et al. Wong’s Essentials ofPediatric Nursing. 6th ed. St. Louis, MO: Mosby; 2001:1301.
Zempsky WT, Robbins B, McKay K. Reduction of topical anesthetic onset time using ultrasound: a randomized controlled trial prior to venipuncture in young children. Pain Med. 2008;9:795-802.
Imayama S, Ueda S, Isoda M. Histologic changes in the skin of hairless mice following peeling with salicylic acid. Arch Dermatol. 2000;136:1390-1395.
Lee H, Kim I. Salicylic acid peels for the treatment of acne vulgaris in Asian patients. Dermatol Surg. 2003;29:1196-1199.
Kessler E, Flanagan K, Chia C, et al. Comparison of alpha- and beta-hydroxy acid chemical peels in the treatment of mild to moderately severe facial acne vulgaris. Dermatol Surg. 2008;34:45-50.
Omi T, Munavalli GS, Kawana S, et al. Ultrastructural evidencefor thermal injury to pilosebaceous units during the treatment of acne using photopneumatic (PPX) therapy. J Cosmet Laser Ther. 2008;10:7-11.
Papageorgiou P, Katsambas A, Chu A. Phototherapy with blue (415 nm) and red (660 nm) light in the treatment of acne vulgaris. Br J Dermatol. 2000;142:973-978.
Salicylic acid peel and pneumatic broadband light (PBBL) are good alternative options in treating acne in addition to regular oral and topical treatments.
Both salicylic acid peel and PBBL are effective, safe, and tolerable.
Clinician educators face numerous obstacles to their joint mission of facilitating learning while also ensuring high-quality and patient-centered care. Time constraints, including the institution of house officer duty hour limitations,1 shorter lengths of stay for hospitalized patients,2 and competing career responsibilities, combine to create a dynamic learning environment. Additionally, clinician educators must balance the autonomy of their learners with the safety of their patients. They must teach to multiple learning levels and work collaboratively with multiple disciplines to foster an effective team-based approach to patient care. Yet, many clinician educators have no formal training in pedagogical methods.3 Such challenges necessitate increased attention to the work of excellent clinician educators and their respective teaching approaches.
Many studies of clinical teaching rely primarily on survey data of attributes of good clinical teachers.3-7 While some studies have incorporated direct observations of teaching8,9 or interviews with clinician educators or learners,10,11 few have incorporated multiple perspectives from the current team and from former learners in order to provide a comprehensive picture of team-based learning.12
The goal of this study was to gain a thorough understanding, through multiple perspectives, of the techniques and behaviors used by exemplary educators within actual clinical environments. We studied attitudes, behaviors, and approaches of 12 such inpatient clinician educators.
METHODS
Study Design and Sampling
This was a multisite study using an exploratory qualitative approach to inquiry. This approach was used to study the techniques and behaviors of excellent attendings during inpatient general medicine rounds. A modified snowball sampling approach13 was used, meaning individuals known to one member of the research team (SS) were initially contacted and asked to identify clinician educators (also referred to as attendings) for potential inclusion in the study. In an effort to identify attendings from a broad range of medical schools, the “2015 U.S. News and World Report Top Medical Schools: Research” rankings14 were also reviewed, with priority given to the top 25, as these are widely used to represent the best US hospitals. In an attempt to invite attendings from diverse institutions, additional medical schools not in the top 25 as well as historically black medical schools were also included. Division chiefs and chairs of internal medicine and/or directors of internal medicine residency programs at these schools were contacted and asked for recommendations of attendings, both within and outside their institutions, who they considered to be great inpatient teachers. In addition, key experts who have won teaching awards or were known to be specialists in the field of medical education were asked to nominate one or two other outstanding attendings.
Table 1
By using this sampling method, 59 potential participants were identified. An internet search was conducted to obtain information about the potential participants and their institutions. Organizational characteristics such as geographic location, hospital size and affiliation, and patient population, as well as individual characteristics such as gender, medical education and training, and educational awards received were considered so that a diversity of organizations and backgrounds was represented. The list was narrowed down to 16 attendings who were contacted via e-mail and asked to participate. Interested participants were asked for a list of their current team members and 6 to 10 former learners to contact for interviews and focus groups. Former learners were included in an effort to better understand lasting effects on learners from their exemplary teaching attendings. A total of 12 attending physicians agreed to participate (Table 1). Literature on field methods has shown that 12 interviews are found to be adequate in accomplishing data saturation.15 Although 2 attendings were located at the same institution, we decided to include them given that both are recognized as master clinician educators and were each recommended by several individuals from various institutions. Hospitals were located throughout the US and included both university-affiliated hospitals and Veterans Affairs medical centers. Despite efforts to include physicians from historically black colleges and universities, only one attending was identified, and they declined the request to participate.
Data Collection
Observations.The one-day site visits were mainly conducted by two research team members, a physician (SS) and a medical anthropologist (MH), both of whom have extensive experience in qualitative methods. Teams were not uniform but were generally comprised of 1 attending, 1 senior medical resident, 1 to 2 interns, and approximately 2 medical students. Occasionally, a pharmacist, clinical assistant, or other health professional accompanied the team on rounds. Not infrequently, the bedside nurse would explicitly be included in the discussion regarding his or her specific patient. Each site visit began with observing attendings (N = 12) and current learners (N = 57) during rounds. Each research team member recorded their own observations via handwritten field notes, paying particular attention to group interactions, teaching approach, conversations occurring within and peripheral to the team, patient-team interactions, and the physical environment. By standing outside of the medical team circle and remaining silent during rounds, research team members remained unobtrusive to the discussion and process of rounds. Materials the attendings used during their teaching rounds were also documented and collected. Rounds generally lasted 2 to 3 hours. After each site visit, the research team met to compare and combine field notes.
Interviews and Focus Groups. The research team then conducted individual, semi-structured interviews with the attendings, focus groups with their current team (N = 46), and interviews or focus groups with their former learners (N = 26; Supplement 1). Eleven of the current team members observed during rounds were unable to participate in the focus groups due to clinical duties. Because the current learners who participated in the focus groups were also observed during rounds, the research team was able to ask them open-ended questions regarding teaching rounds and their roles as learners within this environment. Former learners who were still at the hospital participated in separate focus groups or interviews. Former learners who were no longer present at the hospital were contacted by telephone and individually interviewed by one research team member (MH). All interviews and focus groups were audio-recorded and transcribed.
This study was determined to be exempt by the University of Michigan Institutional Review Board. All participants were informed that their participation was completely voluntary and that they could terminate their involvement at any time.
Data Analysis
Data were analyzed using a thematic analysis approach.16 Thematic analysis entails reading through the data to identify patterns (and create codes) that relate to behaviors, experiences, meanings, and activities. Once patterns have been identified, they are grouped according to similarity into themes, which help to further explain the findings.17
After the first site visit was completed, the research team members that participated (SS and MH) met to develop initial ideas about meanings and possible patterns. All transcripts were read by one team member (MH) and, based on review of the data, codes were developed, defined, and documented in a codebook. This process was repeated after every site visit using the codebook to expand or combine codes and refine definitions as necessary. If a new code was added, the previously coded data were reviewed to apply the new code. NVivo® 10 software (QSR International; Melbourne, Australia) was used to manage the data.
Once all field notes and transcripts were coded (MH), the code reports, which list all data described within a specific code, were run to ensure consistency and identify relationships between codes. Once coding was verified, codes were grouped based on similarities and relationships into salient themes by 3 members of the research team (NH, MH, and SM). Themes, along with their supporting codes, were then further defined to understand how these attendings worked to facilitate excellent teaching in clinical settings.
Table 2
RESULTS
The coded interview data and field notes were categorized into broad, overlapping themes. Three of these major themes include (1) fostering positive relationships, (2) patient-centered teaching, and (3) collaboration and coaching. Table 2 lists each theme, salient behaviors, examples, and selected quotes that further elucidate its meaning.
Fostering Positive Relationships
Attending physicians took observable steps to develop positive relationships with their team members, which in turn created a safe learning environment. For instance, attendings used learners’ first names, demonstrated interest in their well-being, deployed humor, and generally displayed informal actions—uncrossed arms, “fist bump” when recognizing learners’ success, standing outside the circle of team members and leaning in to listen—during learner interactions. Attendings also made it a priority to get to know individuals on a personal level. As one current learner put it, “He asks about where we are from. He will try to find some kind of connection that he can establish with not only each of the team members but also with each of the patients.”
Additionally, attendings built positive relationships with their learners by responding thoughtfully to their input, even when learners’ evaluations of patients required modification. In turn, learners reported feeling safe to ask questions, admit uncertainty, and respectfully disagree with their attendings. As one attending reflected, “If I can get them into a place where they feel like the learning environment is someplace where they can make a mistake and know that that mistake does not necessarily mean that it’s going to cost them in their evaluation part, then I feel like that’s why it’s important.”
To build rapport and create a safe learning environment, attendings used a number of strategies to position themselves as learners alongside their team members. For instance, attendings indicated that they wanted their ideas questioned because they saw it as an opportunity to learn. Moreover, in conversations with learners, attendings demonstrated humility, admitting when they did not know something. One former learner noted, “There have been times when he has asked [a] question…nobody knows and then he admits that he doesn’t know either. So everybody goes and looks it up…The whole thing turns out to be a fun learning experience.”
Attendings demonstrated respect for their team members’ time by reading about patients before rounds, identifying learning opportunities during rounds, and integrating teaching points into the daily work of patient care. Teaching was not relegated exclusively to the conference room or confined to the traditional “chalk talk” before or after rounds but rather was assimilated into daily workflow. They appeared to be responsive to the needs of individual patients and the team, which allowed attendings to both directly oversee their patients’ care and overcome the challenges of multiple competing demands for time. The importance of this approach was made clear by one current learner who stated “…she does prepare before, especially you know on call days, she does prepare for the new patients before coming in to staff, which is really appreciated… it saves a lot of time on rounds.”
Attendings also included other health professionals in team discussions. Attendings used many of the same relationship-building techniques with these professionals as they did with learners and patients. They consistently asked these professionals to provide insight and direction in patients’ plans of care. A former learner commented, “He always asks the [nurse] what is her impression of the patient...he truly values the [nurse’s] opinion of the patient.” One attending reiterated this approach, stating “I don’t want them to think that anything I have to say is more valuable than our pharmacist or the [nurse].”
Patient-Centered Teaching
Attending physicians modeled numerous teaching techniques that focused learning around the patient. Attendings knew their patients well through review of the medical records, discussion with the patient, and personal examination. This preparation allowed attendings to focus on key teaching points in the context of the patient. One former learner noted, “He tended to bring up a variety of things that really fit well into the clinical scenario. So whether that is talking about what is the differential for a new symptom that just came up for this patient or kind of here is a new paper talking about this condition or maybe some other pearl of physical exam for a patient that has a certain physical condition.”
Attendings served as effective role models by being directly involved in examining and talking with patients as well as demonstrating excellent physical examination and communication techniques. One current learner articulated the importance of learning these skills by observing them done well: “I think he teaches by example and by doing, again, those little things: being attentive to the patients and being very careful during exams…I think those are things that you teach people by doing them, not by saying you need to do this better during the patient encounter.”
Collaboration and Coaching
Attending physicians used varied collaboration and coaching techniques to facilitate learning across the entire care team. During rounds, attendings utilized visual aids to reinforce key concepts and simplify complex topics. They also collaborated by using discussion rather than lecture to engage with team members. For instance, attendings used Socratic questioning, asking questions that lead learners through critical thinking and allow them to solve problems themselves, to guide learners’ decision-making. One former learner reported, “He never gives you the answer, and he always asks your opinion; ‘So what are your thoughts on this?’”
Coaching for success, rather than directing the various team members, was emphasized. Attendings did not wish to be seen as the “leaders” of the team. During rounds, one attending was noted to explain his role in ensuring that the team was building connections with others: “When we have a bad outcome, if it feels like your soul has been ripped out, then you’ve done something right. You’ve made that connection with the patient. My job, as your coach, was to build communication between all of us so we feel vested in each other and our patients.”
Attendings also fostered clinical reasoning skills in their learners by encouraging them to verbalize their thought processes aloud in order to clarify and check for understanding. Attendings also placed emphasis not simply on memorizing content but rather prioritization of the patient’s problems and thinking step by step through individual medical problems. One current learner applauded an attending who could “come up with schematics of how to approach problems rather than feeding us factual information of this paper or this trial.”
Additionally, attendings facilitated learning across the entire care team by differentiating their teaching to meet the needs of multiple learning levels. While the entire team was explicitly included in the learning process, attendings encouraged learners to play various roles, execute tasks, and answer questions depending on their educational level. Attendings positioned learners as leaders of the team by allowing them to talk without interruption and by encouraging them to take ownership of their patients’ care. One former learner stated, “She set expectations…we would be the ones who would be running the team, that you know it would very much be our team and that she is there to advise us and provide supervision but also safety for the patients as well.”
Table 3
CONCLUSION
This study reveals the complex ways effective attendings build rapport, create a safe learning environment, utilize patient-centered teaching strategies, and engage in collaboration and coaching with all members of the team. These findings provide a framework of shared themes and their salient behaviors that may influence the success of inpatient general medicine clinician educators (Table 3).
There is a broad and voluminous literature on the subject of outstanding clinical teaching characteristics, much of which has shaped various faculty development curricula for decades. This study sought not to identify novel approaches of inpatient teaching necessarily but rather to closely examine the techniques and behaviors of clinician educators identified as exemplary. The findings affirm and reinforce the numerous, well-documented lists of personal attributes, techniques, and behaviors that resonate with learners, including creating a positive environment, demonstrating enthusiasm and interest in the learner, reading facial expressions, being student-centered, maintaining a high level of clinical knowledge, and utilizing effective communication skills.18-24 The strengths of this study lie within the nuanced and rich observations and discussions that move beyond learners’ Likert scale evaluations and responses.3-7,12 Input was sought from multiple perspectives on the care team, which provided detail from key stakeholders. Out of these comprehensive data arose several conclusions that extend the research literature on medical education.
In their seminal review, Sutkin et al.18 demonstrate that two thirds of characteristics of outstanding clinical teachers are “noncognitive” and that, “Perhaps what makes a clinical educator truly great depends less on the acquisition of cognitive skills such as medical knowledge and formulating learning objectives, and more on inherent, relationship-based, noncognitive attributes. Whereas cognitive abilities generally involve skills that may be taught and learned, albeit with difficulty, noncognitive abilities represent personal attributes, such as relationship skills, personality types, and emotional states, which are more difficult to develop and teach.”18 Our study, thus, adds to the literature by (1) highlighting examples of techniques and behaviors that encompass the crucial “noncognitive” arena and (2) informing best practices in teaching clinical medicine, especially those that resonate with learners, for future faculty development.
The findings highlight the role that relationships play in the teaching and learning of team-based medicine. Building rapport and sustaining successful relationships are cornerstones of effective teaching.18 For the attendings in this study, this manifested in observable, tangible behaviors such as greeting others by name, joking, using physical touch, and actively involving all team members, regardless of role or level of education. Previous literature has highlighted the importance of showing interest in learners.7,19,25-27 This study provides multiple and varied examples of ways in which interest might be displayed.
For patients, the critical role of relationships was evidenced through rapport building and attention to patients as people outside their acute hospitalization. For instance, attendings regularly put patients’ medical issues into context and anticipated future outpatient challenges. To the authors’ knowledge, previous scholarship has not significantly emphasized this form of contextualized medicine, which involves the mindful consideration of the ongoing needs patients may experience upon transitions of care.
Several participants highlighted humility as an important characteristic of effective clinician educators. Attendings recognized that the field produces more new knowledge than can possibly be assimilated and that uncertainty is a mainstay of modern medical care. Attendings frequently utilized self-deprecation to acknowledge doubt, a technique that created a collaborative environment in which learners also felt safe to ask questions. These findings support the viewpoints by Reilly and Beckman that humility and an appreciation for questions and push-back from learners encourage lifelong learning through role modeling.19,23 In responding to the interviewer’s question “And what happens when [the attending] is wrong?” one learner simply stated, “He makes fun of himself.”
This study has several limitations. First, it was conducted in a limited number of US based healthcare systems. The majority of institutions represented were larger, research intensive hospitals. While these hospitals were purposefully selected to provide a range in geography, size, type, and access to resources, the findings may differ in other settings. Second, it was conducted with a limited number of attendings and learners, which may limit the study’s generalizability. However, enough interviews were conducted to reach data saturation.15 Because evidence for a causal relationship between quality teaching and student and patient outcomes is lacking,18 we must rely on imperfect proxies for teaching excellence, including awards and recognition. This study attempted to identify exemplary educators through various means, but it is recognized that bias is likely. Third, because attendings provided lists of former learners, selection and recall biases may have been introduced, as attendings may have more readily identified former learners with whom they formed strong relationships. Fourth, focus was placed exclusively on teaching and learning within general medicine rounds. This was because there would be ample opportunity for teaching on this service, the structure of the teams and the types of patients would be comparable across sites, and the principal investigator was also a general medicine attending and would have a frame of reference for these types of rounds. Due to this narrow focus, the findings may not be generalizable to other subspecialties. Fifth, attendings were selected through a nonexhaustive method. However, the multisite design, the modified snowball sampling, and the inclusion of several types of institutions in the final participant pool introduced diversity to the final list. Finally, although we cannot discount the potential role of a Hawthorne effect on our data collection, the research team did attempt to mitigate this by standing apart from the care teams and remaining unobtrusive during observations.
Using a combination of interviews, focus group discussions, and direct observation, we identified consistent techniques and behaviors of excellent teaching attendings during inpatient general medicine rounds. We hope that all levels of clinician educators may use them to elevate their own teaching.
Disclosure
Dr. Saint is on a medical advisory board of Doximity, a new social networking site for physicians, and receives an honorarium. He is also on the scientific advisory board of Jvion, a healthcare technology company. Drs. Houchens, Harrod, Moody, and Ms. Fowler have no conflicts of interest.
1. Accreditation Council for Graduate Medical Education. Common program requirements. 2011. http://www.acgme.org/Portals/0/PDFs/Common_Program_Requirements_07012011[2].pdf. Accessed September 16, 2016. 2. Healthcare Cost and Utilization Project. Overview statistics for inpatient hospital stays. HCUP Facts and Figures: Statistics on Hospital-Based Care in the United States, 2009. Rockville, MD: Agency for Healthcare Research and Quality; 2011. 3. Busari JO, W eggelaar NM, Knottnerus AC, Greidanus PM, Scherpbier AJ. How medical residents perceive the quality of supervision provided by attending doctors in the clinical setting. Med Educ. 2005;39(7):696-703. PubMed 4. Smith CA, Varkey AB, Evans AT, Reilly BM. Evaluating the performance of inpatient attending physicians: a new instrument for today’s teaching hospitals. J Gen Intern Med. 2004;19(7):766-771. PubMed 5. Elnicki DM, Cooper A. Medical students’ perceptions of the elements of effective inpatient teaching by attending physicians and housestaff. J Gen Intern Med. 2005;20(7):635-639. PubMed 6. Buchel TL, Edwards FD. Characteristics of effective clinical teachers. Fam Med. 2005;37(1):30-35. PubMed 7. Guarino CM, Ko CY, Baker LC, Klein DJ, Quiter ES, Escarce JJ. Impact of instructional practices on student satisfaction with attendings’ teaching in the inpatient component of internal medicine clerkships. J Gen Intern Med. 2006;21(1):7-12. PubMed 8. Irby DM. How attending physicians make instructional decisions when conducting teaching rounds. Acad Med. 1992;67(10):630-638. PubMed 9. Beckman TJ. Lessons learned from a peer review of bedside teaching. Acad Med. 2004;79(4):343-346. PubMed 10. Wright SM, Carrese JA. Excellence in role modelling: insight and perspectives from the pros. CMAJ. 2002;167(6):638-643. PubMed 11. Castiglioni A, Shewchuk RM, Willett LL, Heudebert GR, Centor RM. A pilot study using nominal group technique to assess residents’ perceptions of successful attending rounds. J Gen Intern Med. 2008;23(7):1060-1065. PubMed 12. Bergman K, Gaitskill T. Faculty and student perceptions of effective clinical teachers: an extension study. J Prof Nurs. 1990;6(1):33-44. PubMed 13. Richards L, Morse J. README FIRST for a User’s Guide to Qualitative Methods. 3rd ed. Los Angeles, CA: SAGE Publications, Inc.; 2013. 14. U.S. News and World Report. Best Medical Schools: Research. 2014. http://grad-schools.usnews.rankingsandreviews.com/best-graduate-schools/top-medical-schools/research-rankings. Accessed September 16, 2016. 15. Guest G, Bunce A, Johnson L. How many interviews are enough? An experiment with data saturation and variability. Field Methods. 2006;18(1):59-82. 16. Braun V, Clarke V. Using thematic analysis in psychology. Qual Res Psychol. 2006;3(2):77-101. 17. Aronson J. A pragmatic view of thematic analysis. Qual Rep. 1995;2(1):1-3. 18. Sutkin G, Wagner E, Harris I, Schiffer R. What makes a good clinical teacher in medicine? A review of the literature. Acad Med. 2008;83(5):452-466. PubMed 19. Beckman TJ, Lee MC. Proposal for a collaborative approach to clinical teaching. Mayo Clin Proc. 2009;84(4):339-344. PubMed 20. Ramani S. Twelve tips to improve bedside teaching. Med Teach. 2003;25(2):112-115. PubMed 21. Irby DM. What clinical teachers in medicine need to know. Acad Med. 1994;69(5):333-342. PubMed 22. Wiese J, ed. Teaching in the Hospital. Philadelphia, PA: American College of Physicians; 2010. 23. Reilly BM. Inconvenient truths about effective clinical teaching. Lancet. 2007;370(9588):705-711. PubMed 24. Branch WT Jr, Kern D, Haidet P, et al. The patient-physician relationship. Teaching the human dimensions of care in clinical settings. JAMA. 2001;286(9):1067-1074. PubMed 25. McLeod PJ, Harden RM. Clinical teaching strategies for physicians. Med Teach. 1985;7(2):173-189. PubMed 26. Pinsky LE, Monson D, Irby DM. How excellent teachers are made: reflecting on success to improve teaching. Adv Health Sci Educ Theory Pract. 1998;3(3):207-215. PubMed 27. Ullian JA, Bland CJ, Simpson DE. An alternative approach to defining the role of the clinical teacher. Acad Med. 1994;69(10):832-838. PubMed
Clinician educators face numerous obstacles to their joint mission of facilitating learning while also ensuring high-quality and patient-centered care. Time constraints, including the institution of house officer duty hour limitations,1 shorter lengths of stay for hospitalized patients,2 and competing career responsibilities, combine to create a dynamic learning environment. Additionally, clinician educators must balance the autonomy of their learners with the safety of their patients. They must teach to multiple learning levels and work collaboratively with multiple disciplines to foster an effective team-based approach to patient care. Yet, many clinician educators have no formal training in pedagogical methods.3 Such challenges necessitate increased attention to the work of excellent clinician educators and their respective teaching approaches.
Many studies of clinical teaching rely primarily on survey data of attributes of good clinical teachers.3-7 While some studies have incorporated direct observations of teaching8,9 or interviews with clinician educators or learners,10,11 few have incorporated multiple perspectives from the current team and from former learners in order to provide a comprehensive picture of team-based learning.12
The goal of this study was to gain a thorough understanding, through multiple perspectives, of the techniques and behaviors used by exemplary educators within actual clinical environments. We studied attitudes, behaviors, and approaches of 12 such inpatient clinician educators.
METHODS
Study Design and Sampling
This was a multisite study using an exploratory qualitative approach to inquiry. This approach was used to study the techniques and behaviors of excellent attendings during inpatient general medicine rounds. A modified snowball sampling approach13 was used, meaning individuals known to one member of the research team (SS) were initially contacted and asked to identify clinician educators (also referred to as attendings) for potential inclusion in the study. In an effort to identify attendings from a broad range of medical schools, the “2015 U.S. News and World Report Top Medical Schools: Research” rankings14 were also reviewed, with priority given to the top 25, as these are widely used to represent the best US hospitals. In an attempt to invite attendings from diverse institutions, additional medical schools not in the top 25 as well as historically black medical schools were also included. Division chiefs and chairs of internal medicine and/or directors of internal medicine residency programs at these schools were contacted and asked for recommendations of attendings, both within and outside their institutions, who they considered to be great inpatient teachers. In addition, key experts who have won teaching awards or were known to be specialists in the field of medical education were asked to nominate one or two other outstanding attendings.
Table 1
By using this sampling method, 59 potential participants were identified. An internet search was conducted to obtain information about the potential participants and their institutions. Organizational characteristics such as geographic location, hospital size and affiliation, and patient population, as well as individual characteristics such as gender, medical education and training, and educational awards received were considered so that a diversity of organizations and backgrounds was represented. The list was narrowed down to 16 attendings who were contacted via e-mail and asked to participate. Interested participants were asked for a list of their current team members and 6 to 10 former learners to contact for interviews and focus groups. Former learners were included in an effort to better understand lasting effects on learners from their exemplary teaching attendings. A total of 12 attending physicians agreed to participate (Table 1). Literature on field methods has shown that 12 interviews are found to be adequate in accomplishing data saturation.15 Although 2 attendings were located at the same institution, we decided to include them given that both are recognized as master clinician educators and were each recommended by several individuals from various institutions. Hospitals were located throughout the US and included both university-affiliated hospitals and Veterans Affairs medical centers. Despite efforts to include physicians from historically black colleges and universities, only one attending was identified, and they declined the request to participate.
Data Collection
Observations.The one-day site visits were mainly conducted by two research team members, a physician (SS) and a medical anthropologist (MH), both of whom have extensive experience in qualitative methods. Teams were not uniform but were generally comprised of 1 attending, 1 senior medical resident, 1 to 2 interns, and approximately 2 medical students. Occasionally, a pharmacist, clinical assistant, or other health professional accompanied the team on rounds. Not infrequently, the bedside nurse would explicitly be included in the discussion regarding his or her specific patient. Each site visit began with observing attendings (N = 12) and current learners (N = 57) during rounds. Each research team member recorded their own observations via handwritten field notes, paying particular attention to group interactions, teaching approach, conversations occurring within and peripheral to the team, patient-team interactions, and the physical environment. By standing outside of the medical team circle and remaining silent during rounds, research team members remained unobtrusive to the discussion and process of rounds. Materials the attendings used during their teaching rounds were also documented and collected. Rounds generally lasted 2 to 3 hours. After each site visit, the research team met to compare and combine field notes.
Interviews and Focus Groups. The research team then conducted individual, semi-structured interviews with the attendings, focus groups with their current team (N = 46), and interviews or focus groups with their former learners (N = 26; Supplement 1). Eleven of the current team members observed during rounds were unable to participate in the focus groups due to clinical duties. Because the current learners who participated in the focus groups were also observed during rounds, the research team was able to ask them open-ended questions regarding teaching rounds and their roles as learners within this environment. Former learners who were still at the hospital participated in separate focus groups or interviews. Former learners who were no longer present at the hospital were contacted by telephone and individually interviewed by one research team member (MH). All interviews and focus groups were audio-recorded and transcribed.
This study was determined to be exempt by the University of Michigan Institutional Review Board. All participants were informed that their participation was completely voluntary and that they could terminate their involvement at any time.
Data Analysis
Data were analyzed using a thematic analysis approach.16 Thematic analysis entails reading through the data to identify patterns (and create codes) that relate to behaviors, experiences, meanings, and activities. Once patterns have been identified, they are grouped according to similarity into themes, which help to further explain the findings.17
After the first site visit was completed, the research team members that participated (SS and MH) met to develop initial ideas about meanings and possible patterns. All transcripts were read by one team member (MH) and, based on review of the data, codes were developed, defined, and documented in a codebook. This process was repeated after every site visit using the codebook to expand or combine codes and refine definitions as necessary. If a new code was added, the previously coded data were reviewed to apply the new code. NVivo® 10 software (QSR International; Melbourne, Australia) was used to manage the data.
Once all field notes and transcripts were coded (MH), the code reports, which list all data described within a specific code, were run to ensure consistency and identify relationships between codes. Once coding was verified, codes were grouped based on similarities and relationships into salient themes by 3 members of the research team (NH, MH, and SM). Themes, along with their supporting codes, were then further defined to understand how these attendings worked to facilitate excellent teaching in clinical settings.
Table 2
RESULTS
The coded interview data and field notes were categorized into broad, overlapping themes. Three of these major themes include (1) fostering positive relationships, (2) patient-centered teaching, and (3) collaboration and coaching. Table 2 lists each theme, salient behaviors, examples, and selected quotes that further elucidate its meaning.
Fostering Positive Relationships
Attending physicians took observable steps to develop positive relationships with their team members, which in turn created a safe learning environment. For instance, attendings used learners’ first names, demonstrated interest in their well-being, deployed humor, and generally displayed informal actions—uncrossed arms, “fist bump” when recognizing learners’ success, standing outside the circle of team members and leaning in to listen—during learner interactions. Attendings also made it a priority to get to know individuals on a personal level. As one current learner put it, “He asks about where we are from. He will try to find some kind of connection that he can establish with not only each of the team members but also with each of the patients.”
Additionally, attendings built positive relationships with their learners by responding thoughtfully to their input, even when learners’ evaluations of patients required modification. In turn, learners reported feeling safe to ask questions, admit uncertainty, and respectfully disagree with their attendings. As one attending reflected, “If I can get them into a place where they feel like the learning environment is someplace where they can make a mistake and know that that mistake does not necessarily mean that it’s going to cost them in their evaluation part, then I feel like that’s why it’s important.”
To build rapport and create a safe learning environment, attendings used a number of strategies to position themselves as learners alongside their team members. For instance, attendings indicated that they wanted their ideas questioned because they saw it as an opportunity to learn. Moreover, in conversations with learners, attendings demonstrated humility, admitting when they did not know something. One former learner noted, “There have been times when he has asked [a] question…nobody knows and then he admits that he doesn’t know either. So everybody goes and looks it up…The whole thing turns out to be a fun learning experience.”
Attendings demonstrated respect for their team members’ time by reading about patients before rounds, identifying learning opportunities during rounds, and integrating teaching points into the daily work of patient care. Teaching was not relegated exclusively to the conference room or confined to the traditional “chalk talk” before or after rounds but rather was assimilated into daily workflow. They appeared to be responsive to the needs of individual patients and the team, which allowed attendings to both directly oversee their patients’ care and overcome the challenges of multiple competing demands for time. The importance of this approach was made clear by one current learner who stated “…she does prepare before, especially you know on call days, she does prepare for the new patients before coming in to staff, which is really appreciated… it saves a lot of time on rounds.”
Attendings also included other health professionals in team discussions. Attendings used many of the same relationship-building techniques with these professionals as they did with learners and patients. They consistently asked these professionals to provide insight and direction in patients’ plans of care. A former learner commented, “He always asks the [nurse] what is her impression of the patient...he truly values the [nurse’s] opinion of the patient.” One attending reiterated this approach, stating “I don’t want them to think that anything I have to say is more valuable than our pharmacist or the [nurse].”
Patient-Centered Teaching
Attending physicians modeled numerous teaching techniques that focused learning around the patient. Attendings knew their patients well through review of the medical records, discussion with the patient, and personal examination. This preparation allowed attendings to focus on key teaching points in the context of the patient. One former learner noted, “He tended to bring up a variety of things that really fit well into the clinical scenario. So whether that is talking about what is the differential for a new symptom that just came up for this patient or kind of here is a new paper talking about this condition or maybe some other pearl of physical exam for a patient that has a certain physical condition.”
Attendings served as effective role models by being directly involved in examining and talking with patients as well as demonstrating excellent physical examination and communication techniques. One current learner articulated the importance of learning these skills by observing them done well: “I think he teaches by example and by doing, again, those little things: being attentive to the patients and being very careful during exams…I think those are things that you teach people by doing them, not by saying you need to do this better during the patient encounter.”
Collaboration and Coaching
Attending physicians used varied collaboration and coaching techniques to facilitate learning across the entire care team. During rounds, attendings utilized visual aids to reinforce key concepts and simplify complex topics. They also collaborated by using discussion rather than lecture to engage with team members. For instance, attendings used Socratic questioning, asking questions that lead learners through critical thinking and allow them to solve problems themselves, to guide learners’ decision-making. One former learner reported, “He never gives you the answer, and he always asks your opinion; ‘So what are your thoughts on this?’”
Coaching for success, rather than directing the various team members, was emphasized. Attendings did not wish to be seen as the “leaders” of the team. During rounds, one attending was noted to explain his role in ensuring that the team was building connections with others: “When we have a bad outcome, if it feels like your soul has been ripped out, then you’ve done something right. You’ve made that connection with the patient. My job, as your coach, was to build communication between all of us so we feel vested in each other and our patients.”
Attendings also fostered clinical reasoning skills in their learners by encouraging them to verbalize their thought processes aloud in order to clarify and check for understanding. Attendings also placed emphasis not simply on memorizing content but rather prioritization of the patient’s problems and thinking step by step through individual medical problems. One current learner applauded an attending who could “come up with schematics of how to approach problems rather than feeding us factual information of this paper or this trial.”
Additionally, attendings facilitated learning across the entire care team by differentiating their teaching to meet the needs of multiple learning levels. While the entire team was explicitly included in the learning process, attendings encouraged learners to play various roles, execute tasks, and answer questions depending on their educational level. Attendings positioned learners as leaders of the team by allowing them to talk without interruption and by encouraging them to take ownership of their patients’ care. One former learner stated, “She set expectations…we would be the ones who would be running the team, that you know it would very much be our team and that she is there to advise us and provide supervision but also safety for the patients as well.”
Table 3
CONCLUSION
This study reveals the complex ways effective attendings build rapport, create a safe learning environment, utilize patient-centered teaching strategies, and engage in collaboration and coaching with all members of the team. These findings provide a framework of shared themes and their salient behaviors that may influence the success of inpatient general medicine clinician educators (Table 3).
There is a broad and voluminous literature on the subject of outstanding clinical teaching characteristics, much of which has shaped various faculty development curricula for decades. This study sought not to identify novel approaches of inpatient teaching necessarily but rather to closely examine the techniques and behaviors of clinician educators identified as exemplary. The findings affirm and reinforce the numerous, well-documented lists of personal attributes, techniques, and behaviors that resonate with learners, including creating a positive environment, demonstrating enthusiasm and interest in the learner, reading facial expressions, being student-centered, maintaining a high level of clinical knowledge, and utilizing effective communication skills.18-24 The strengths of this study lie within the nuanced and rich observations and discussions that move beyond learners’ Likert scale evaluations and responses.3-7,12 Input was sought from multiple perspectives on the care team, which provided detail from key stakeholders. Out of these comprehensive data arose several conclusions that extend the research literature on medical education.
In their seminal review, Sutkin et al.18 demonstrate that two thirds of characteristics of outstanding clinical teachers are “noncognitive” and that, “Perhaps what makes a clinical educator truly great depends less on the acquisition of cognitive skills such as medical knowledge and formulating learning objectives, and more on inherent, relationship-based, noncognitive attributes. Whereas cognitive abilities generally involve skills that may be taught and learned, albeit with difficulty, noncognitive abilities represent personal attributes, such as relationship skills, personality types, and emotional states, which are more difficult to develop and teach.”18 Our study, thus, adds to the literature by (1) highlighting examples of techniques and behaviors that encompass the crucial “noncognitive” arena and (2) informing best practices in teaching clinical medicine, especially those that resonate with learners, for future faculty development.
The findings highlight the role that relationships play in the teaching and learning of team-based medicine. Building rapport and sustaining successful relationships are cornerstones of effective teaching.18 For the attendings in this study, this manifested in observable, tangible behaviors such as greeting others by name, joking, using physical touch, and actively involving all team members, regardless of role or level of education. Previous literature has highlighted the importance of showing interest in learners.7,19,25-27 This study provides multiple and varied examples of ways in which interest might be displayed.
For patients, the critical role of relationships was evidenced through rapport building and attention to patients as people outside their acute hospitalization. For instance, attendings regularly put patients’ medical issues into context and anticipated future outpatient challenges. To the authors’ knowledge, previous scholarship has not significantly emphasized this form of contextualized medicine, which involves the mindful consideration of the ongoing needs patients may experience upon transitions of care.
Several participants highlighted humility as an important characteristic of effective clinician educators. Attendings recognized that the field produces more new knowledge than can possibly be assimilated and that uncertainty is a mainstay of modern medical care. Attendings frequently utilized self-deprecation to acknowledge doubt, a technique that created a collaborative environment in which learners also felt safe to ask questions. These findings support the viewpoints by Reilly and Beckman that humility and an appreciation for questions and push-back from learners encourage lifelong learning through role modeling.19,23 In responding to the interviewer’s question “And what happens when [the attending] is wrong?” one learner simply stated, “He makes fun of himself.”
This study has several limitations. First, it was conducted in a limited number of US based healthcare systems. The majority of institutions represented were larger, research intensive hospitals. While these hospitals were purposefully selected to provide a range in geography, size, type, and access to resources, the findings may differ in other settings. Second, it was conducted with a limited number of attendings and learners, which may limit the study’s generalizability. However, enough interviews were conducted to reach data saturation.15 Because evidence for a causal relationship between quality teaching and student and patient outcomes is lacking,18 we must rely on imperfect proxies for teaching excellence, including awards and recognition. This study attempted to identify exemplary educators through various means, but it is recognized that bias is likely. Third, because attendings provided lists of former learners, selection and recall biases may have been introduced, as attendings may have more readily identified former learners with whom they formed strong relationships. Fourth, focus was placed exclusively on teaching and learning within general medicine rounds. This was because there would be ample opportunity for teaching on this service, the structure of the teams and the types of patients would be comparable across sites, and the principal investigator was also a general medicine attending and would have a frame of reference for these types of rounds. Due to this narrow focus, the findings may not be generalizable to other subspecialties. Fifth, attendings were selected through a nonexhaustive method. However, the multisite design, the modified snowball sampling, and the inclusion of several types of institutions in the final participant pool introduced diversity to the final list. Finally, although we cannot discount the potential role of a Hawthorne effect on our data collection, the research team did attempt to mitigate this by standing apart from the care teams and remaining unobtrusive during observations.
Using a combination of interviews, focus group discussions, and direct observation, we identified consistent techniques and behaviors of excellent teaching attendings during inpatient general medicine rounds. We hope that all levels of clinician educators may use them to elevate their own teaching.
Disclosure
Dr. Saint is on a medical advisory board of Doximity, a new social networking site for physicians, and receives an honorarium. He is also on the scientific advisory board of Jvion, a healthcare technology company. Drs. Houchens, Harrod, Moody, and Ms. Fowler have no conflicts of interest.
References
1. Accreditation Council for Graduate Medical Education. Common program requirements. 2011. http://www.acgme.org/Portals/0/PDFs/Common_Program_Requirements_07012011[2].pdf. Accessed September 16, 2016. 2. Healthcare Cost and Utilization Project. Overview statistics for inpatient hospital stays. HCUP Facts and Figures: Statistics on Hospital-Based Care in the United States, 2009. Rockville, MD: Agency for Healthcare Research and Quality; 2011. 3. Busari JO, W eggelaar NM, Knottnerus AC, Greidanus PM, Scherpbier AJ. How medical residents perceive the quality of supervision provided by attending doctors in the clinical setting. Med Educ. 2005;39(7):696-703. PubMed 4. Smith CA, Varkey AB, Evans AT, Reilly BM. Evaluating the performance of inpatient attending physicians: a new instrument for today’s teaching hospitals. J Gen Intern Med. 2004;19(7):766-771. PubMed 5. Elnicki DM, Cooper A. Medical students’ perceptions of the elements of effective inpatient teaching by attending physicians and housestaff. J Gen Intern Med. 2005;20(7):635-639. PubMed 6. Buchel TL, Edwards FD. Characteristics of effective clinical teachers. Fam Med. 2005;37(1):30-35. PubMed 7. Guarino CM, Ko CY, Baker LC, Klein DJ, Quiter ES, Escarce JJ. Impact of instructional practices on student satisfaction with attendings’ teaching in the inpatient component of internal medicine clerkships. J Gen Intern Med. 2006;21(1):7-12. PubMed 8. Irby DM. How attending physicians make instructional decisions when conducting teaching rounds. Acad Med. 1992;67(10):630-638. PubMed 9. Beckman TJ. Lessons learned from a peer review of bedside teaching. Acad Med. 2004;79(4):343-346. PubMed 10. Wright SM, Carrese JA. Excellence in role modelling: insight and perspectives from the pros. CMAJ. 2002;167(6):638-643. PubMed 11. Castiglioni A, Shewchuk RM, Willett LL, Heudebert GR, Centor RM. A pilot study using nominal group technique to assess residents’ perceptions of successful attending rounds. J Gen Intern Med. 2008;23(7):1060-1065. PubMed 12. Bergman K, Gaitskill T. Faculty and student perceptions of effective clinical teachers: an extension study. J Prof Nurs. 1990;6(1):33-44. PubMed 13. Richards L, Morse J. README FIRST for a User’s Guide to Qualitative Methods. 3rd ed. Los Angeles, CA: SAGE Publications, Inc.; 2013. 14. U.S. News and World Report. Best Medical Schools: Research. 2014. http://grad-schools.usnews.rankingsandreviews.com/best-graduate-schools/top-medical-schools/research-rankings. Accessed September 16, 2016. 15. Guest G, Bunce A, Johnson L. How many interviews are enough? An experiment with data saturation and variability. Field Methods. 2006;18(1):59-82. 16. Braun V, Clarke V. Using thematic analysis in psychology. Qual Res Psychol. 2006;3(2):77-101. 17. Aronson J. A pragmatic view of thematic analysis. Qual Rep. 1995;2(1):1-3. 18. Sutkin G, Wagner E, Harris I, Schiffer R. What makes a good clinical teacher in medicine? A review of the literature. Acad Med. 2008;83(5):452-466. PubMed 19. Beckman TJ, Lee MC. Proposal for a collaborative approach to clinical teaching. Mayo Clin Proc. 2009;84(4):339-344. PubMed 20. Ramani S. Twelve tips to improve bedside teaching. Med Teach. 2003;25(2):112-115. PubMed 21. Irby DM. What clinical teachers in medicine need to know. Acad Med. 1994;69(5):333-342. PubMed 22. Wiese J, ed. Teaching in the Hospital. Philadelphia, PA: American College of Physicians; 2010. 23. Reilly BM. Inconvenient truths about effective clinical teaching. Lancet. 2007;370(9588):705-711. PubMed 24. Branch WT Jr, Kern D, Haidet P, et al. The patient-physician relationship. Teaching the human dimensions of care in clinical settings. JAMA. 2001;286(9):1067-1074. PubMed 25. McLeod PJ, Harden RM. Clinical teaching strategies for physicians. Med Teach. 1985;7(2):173-189. PubMed 26. Pinsky LE, Monson D, Irby DM. How excellent teachers are made: reflecting on success to improve teaching. Adv Health Sci Educ Theory Pract. 1998;3(3):207-215. PubMed 27. Ullian JA, Bland CJ, Simpson DE. An alternative approach to defining the role of the clinical teacher. Acad Med. 1994;69(10):832-838. PubMed
*Address for correspondence and reprint requests: Nathan Houchens, MD, University of Michigan and Veterans Affairs Ann Arbor Healthcare System, 2215 Fuller Road, Mail Code 111, Ann Arbor, MI 48105; Telephone: 734-845-5922; Fax: 734-913-0883; E-mail: nathanho@med.umich.edu
The transition from hospital to home can be overwhelming for caregivers.1 Stress of hospitalization coupled with the expectation of families to execute postdischarge care plans make understandable discharge communication critical. Communication failures, inadequate education, absence of caregiver confidence, and lack of clarity regarding care plans may prohibit smooth transitions and lead to adverse postdischarge outcomes.2-4
Health literacy plays a pivotal role in caregivers’ capacity to navigate the healthcare system, comprehend, and execute care plans. An estimated 90 million Americans have limited health literacy that may negatively impact the provision of safe and quality care5,6 and be a risk factor for poor outcomes, including increased emergency department (ED) utilization and readmission rates.7-9 Readability strongly influences the effectiveness of written materials.10 However, written medical information for patients and families are frequently between the 10th and 12th grade reading levels; more than 75% of all pediatric health information is written at or above 10th grade reading level.11 Government agencies recommend between a 6th and 8th grade reading level, for written material;5,12,13 written discharge instructions have been identified as an important quality metric for hospital-to-home transitions.14-16
At our center, we found that discharge instructions were commonly written at high reading levels and often incomplete.17 Poor discharge instructions may contribute to increased readmission rates and unnecessary ED visits.9,18 Our global aim targeted improved health-literate written information, including understandability and completeness.
Our specific aim was to increase the percentage of discharge instructions written at or below the 7th grade level for hospital medicine (HM) patients on a community hospital pediatric unit from 13% to 80% in 6 months.
METHODS
Context
The improvement work took place at a 42-bed inpatient pediatric unit at a community satellite of our large, urban, academic hospital. The unit is staffed by medical providers including attendings, fellows, nurse practitioners (NPs), and senior pediatric residents, and had more than 1000 HM discharges in fiscal year 2016. Children with common general pediatric diagnoses are admitted to this service; postsurgical patients are not admitted primarily to the HM service. In Cincinnati, the neighborhood-level high school drop-out rates are as high as 64%.19 Discharge instructions are written by medical providers in the electronic health record (EHR). A printed copy is given to families and verbally reviewed by a bedside nurse prior to discharge. Quality improvement (QI) efforts focused on discharge instructions were ignited by a prior review of 200 discharge instructions that showed they were difficult to read (median reading level of 10th grade), poorly understandable (36% of instructions met the threshold of understandability as measured by the Patient Education Materials Assessment Tool20) and were missing key elements of information.17
Improvement Team
The improvement team consisted of 4 pediatric hospitalists, 2 NPs, 1 nurse educator with health literacy expertise, 1 pediatric resident, 1 fourth-year medical student, 1 QI consultant, and 2 parents who had first-hand experience on the HM service. The improvement team observed the discharge process, including roles of the provider, nurse and family, outlined a process map, and created a modified failure mode and effect analysis.21 Prior to our work, discharge instructions written by providers often occurred as a last step, and the content was created as free text or from nonstandardized templates. Key drivers that informed interventions were determined and revised over time (Figure 1). The study was reviewed by our institutional review board and deemed not human subjects research.
Figure 1Improvement Activities
Key drivers were identified, and interventions were executed using Plan-Do Study-Act cycles.22 The key drivers thought to be critical for the success of the QI efforts were family engagement; standardization of discharge instructions; medical staff engagement; and audit and feedback of data. The corresponding interventions were as follows:
Family Engagement
Understanding the discharge information families desired. Prior to testing, 10 families admitted to the HM service were asked about the discharge experience. We asked families about information they wanted in written discharge instructions: 1) reasons to call your primary doctor or return to the hospital; 2) when to see your primary doctor for a follow-up visit; 3) the phone number to reach your child’s doctor; 4) more information about why your child was admitted; 5) information about new medications; and 6) what to do to help your child continue to recover at home.
Development of templates. We engaged families throughout the process of creating general and disease-specific discharge templates. After a specific template was created and reviewed by the parents on our team, it was sent to members of the institutional Patient Education Committee, which includes parents and local health literacy experts, to review and critique. Feedback from the reviewers was incorporated into the templates prior to use in the EHR.
Postdischarge phone calls.A convenience sample of families discharged from the satellite campus was called 24 to 48 hours after discharge over a 2-week period in January, 2016. A member of our improvement team solicited feedback from families about the quality of the discharge instructions. Families were asked if discharge instructions were reviewed with them prior to going home, if they were given a copy of the instructions, how they would rate the ability to read and use the information, and if there were additional pieces of information that would have improved the instructions.
Standardization of Instructions
Education. A presentation was created and shared with medical providers; it was re-disseminated monthly to new residents rotating onto the service and to the attendings, fellows, and NPs scheduled for shifts during the month. This education continued for the duration of the study. The presentation included the definition of health literacy, scope of the problem, examples of poorly written discharge instructions, and tips on how to write readable and understandable instructions. Laminated cards that included tips on how to write instructions were also placed on work stations.
Figure 2Creation of discharge instruction templates in the EHR.A general discharge instruction template that was initially created and tested in the EHR (Figure 2) included text written below the 7th grade and employed 14 point font, bolded words for emphasis, and lists with bullet points. Asterisks were used to indicate where providers needed to include patient-specific information. The sections included in the general template were informed by feedback from providers and parents prior to testing, parents on the improvement team, and parents of patients admitted to our satellite campus. The sections reflect components critical to successful postdischarge care: discharge diagnosis and its brief description, postdischarge care information, new medications, signs and symptoms that would warrant escalation of care to the patient’s primary care provider or the ED, and follow-up instructions and contact information for the patent’s primary care doctor.
While the general template was an important first step, the content relied heavily on free text by providers, which could still lead to instructions written at a high reading level. Thus, disease-specific discharge instruction templates were created with prepopulated information that was written at a reading level at or below 7th grade level (Figure 2). The diseases were prioritized based on the most common diagnoses on our HM service. Each template included information under each of the subheadings noted in the general template. Twelve disease-specific templates were tested and ultimately embedded in the EHR; the general template remained for use when the discharge diagnosis was not covered by a disease-specific template.
Medical Staff Engagement
Previously described tests of change also aimed to enhance staff engagement. These included frequent e-mails, discussion of the QI efforts at specific team meetings, and the creation of visual cues posted at computer work stations, which prompted staff to begin to work on discharge instructions soon after admission.
Audit and Feedback of Data
Weekly phone calls. One team updated clinicians through a regularly scheduled bi-weekly phone conference. The phone conference was established prior to our work and was designed to relay pertinent information to attendings and NPs who work at the satellite hospital. During the phone conferences, clinicians were notified of current performance on discharge instruction readability and specific tests of change for the week. Additionally, providers gave feedback about the improvement efforts. These updates continued for the first 6 months of the project until sustained improvements were observed.
E-mails. Weekly e-mails were sent to all providers scheduled for clinical time at the satellite campus. The e-mail contained information on current tests of change, a list of discharge instruction templates that were available in the EHR, and the annotated run chart illustrating readability levels over time.
Additionally, individual e-mails were sent to each provider after review of the written discharge instructions for the week. Providers were given information on the number of discharge instructions they personally composed, the percentage of those instructions that were written at or below 7th grade level, and specific feedback on how their written instructions could be improved. We also encouraged feedback from each provider to better identify barriers to achieving our goal.
Study of the Interventions
Baseline data included a review of all instructions for patients discharged from the satellite campus from the end of April 2015 through mid-September 2015. The time period for testing of interventions during the fall and winter months allowed for rapid cycle learning due to higher patient census and predictability of admissions for specific diagnosis (ie, asthma and bronchiolitis). An automated report was generated from the EHR weekly with specific demographics and identifiers for patient discharged over the past 7 days, including patient age, gender, length of stay, discharge diagnosis, and insurance classification. Data was collected during the intervention period via structured review of the discharge instructions in the EHR by the principal investigator or a trained research coordinator. Discharge instructions for medically cleared mental health patients admitted to hospital medicine while awaiting psychiatric bed availability and patients and parents who were non-English speaking were excluded from review. All other instructions for patients discharged from the HM service at our Liberty Campus were included for review.
Measures
Readability, our primary measure of interest, was calculated using the mean score from the following formulas: Flesch Kincaid Grade Level,23 Simple Measure of Gobbledygook Index,24 Coleman-Liau Index,25 Gunning-Fog Index,26 and Automated Readability Index27 by means of an online platform (https://readability-score.com).28 This platform was chosen because it incorporated a variety of formulas, was user-friendly, and required minimal data cleaning. Each of the readability formulas have been used to assesses readability of health information given to patients and families.29,30 The threshold of 7th grade is in alignment with our institutional policy for educational materials and with recommendations from several government agencies.5,12
Analysis
A statistical process control p-chart was used to analyze our primary measure of readability, dichotomized as percent discharge instructions written at or below 7th grade level. Run charts were used to follow mean reading level of discharge instructions and our process measure of percent of discharge instruction written with a general or disease-specific standardized template. Run chart and control chart rules for identifying special cause were used for midline shifts.31
Table
RESULTS
The Table includes the demographic and clinical information of patients included in our analyses. Through sequential interventions, the percentage of discharge instructions written at or below 7th grade readability level increased from a mean of 13% to more than 80% in 3 months (Figure 3). Furthermore, the mean was sustained above 90% for 10 months and at 98% for the last 4 months. The use of 1 of the 13 EHR templates increased from 0% to 96% and was associated with the largest impact on the overall improvements (Supplemental Figure 1). Additionally, the average reading level of the discharge instructions decreased from 10th grade to 6th grade level (Supplemental Figure 2).
Figure 3
Qualitative comments from providers about the discharge instructions included:
“Are these [discharge instructions] available at base?? Great resource for interns.” “These [discharge] instructions make the [discharge] process so easy!!! Love these...” “Also feel like they have helped my discharge teaching in the room!”
Qualitative comments from families postdischarge included: “I thought the instructions were very clear and easy to read. I especially thought that highlighting the important areas really helped.” “I think this form looks great, and I really like the idea of having your child’s name on it.”
DISCUSSION
Through sequential Plan-Do Study-Act cycles, we increased the percentage of discharge instructions written at or below 7th grade reading level from 13% to 98%. Our most impactful intervention was the creation and dissemination of standardized disease-specific discharge instruction templates. Our findings complement evidence in the adult and pediatric literature that the use of standardized, disease-specific discharge instruction templates may improve readability of instructions.32,33 And, while quality improvement efforts have been employed to improve the discharge process for patients,34-36 this is the first study in the inpatient setting that, to our knowledge, specifically addresses discharge instructions using quality improvement methods.
Our work targeted the critical intersection between individual health literacy, an individual’s capacity to acquire, interpret, and use health information, and the necessary changes needed within our healthcare system to ensure that appropriately written instructions are given to patients and families.17,37 Our efforts focused on improving discharge instructions answer the call to consider health literacy a modifiable clinical risk factor.37 Furthermore, we address the 6 aims for quality healthcare delivery: 1) safe, timely, efficient and equitable delivery of care through the creation and dissemination of standardized instructions that are written at the appropriate reading level for families to ease hospital-to-home transitions and streamline the workflow of medical providers; 2) effective education of medical providers on health literacy concepts; and 3) family-centeredness through the involvement of families in our QI efforts. While previous QI efforts to improve hospital-to-home transitions have focused on medication reconciliation, communication with primary care physicians, follow-up appointments, and timely discharges of patients, none have specifically focused on the quality of discharge instructions.34-36
Most physicians do not receive education about how to write information that is readable and understandable; more than half of providers desired more education in this area.38 Furthermore, pediatric providers may overestimate parental health literacy levels,39 which may contribute to variability in the readability of written health materials. While education alone can contribute to a provider’s ability to create readable instructions, we note the improvement after the introduction of disease templates to demonstrate the importance of workflow-integrated higher reliability interventions to sustain improvements.
Our baseline poor readability rates were due to limited knowledge by frontline providers composing the instructions and a system in which an important element for successful hospital-to-home transitions was not tackled until patients were ready for discharge. Streamlining of the discharge process, including the creation of discharge instructions, may lead to improved efficiency, fewer discrepancies, more effective communication, and an enhanced family experience. Moreover, the success of our improvement work was due to key stakeholders, including parents, being a part of the team and the notable buy-in from providers.
Our work was not without limitations. We excluded non-English speaking families from the study. We were unable to measure reading level of our population directly and instead based our goals on national estimates. Our primary measure was readability, which is only 1 piece contributing to quality discharge instructions. Understandability and actionability are also important considerations; 17,20,29,40 however, improvements in these areas were limited by our design options within the EHR. Our efforts focused on children with common general pediatric diagnoses, and it is unclear how our interventions would generalize to medically complex patients with more volume of information to communicate at discharge and with uncommon diagnoses that are less readily incorporated into standardized templates. Relatedly, our work occurred at the satellite campus of our tertiary care center and may not represent generalizable material or methods to implement templates at our main campus location or at other hospitals. To begin to better understand this, we have spread to HM patients at our main campus, including medically complex patients with technology dependence and/or neurological impairments. Standardized, disease-specific templates most relevant to this population as well as several patient specific templates, for those with frequent readmissions due to medical complexity, have been created and are actively being tested.
CONCLUSION
In conclusion, in using interventions targeted at standardization of discharge instructions and timely feedback to staff, we saw rapid, dramatic, and sustained improvement in the readability of discharge instructions. Next steps include adaptation and spread to other patient populations and care teams, collaborations with other centers, and assessing the impact of effectively written discharge instructions on patient outcomes, such as adverse drug events, readmission rates, and family experience.
Disclosure
No external funding was secured for this study. Dr. Brady is supported by a Patient-Centered Outcomes Research Mentored Clinical Investigator Award from the Agency for Healthcare Research and Quality, Award Number K08HS023827. The content is solely the responsibility of the authors and does not necessarily represent the official views of the funding organizations. The funding organization had no role in the design, preparation, review, or approval of this paper; nor the decision to submit the manuscript for publication. The authors have no financial relationships relevant to this article to disclose.
1. Solan LG, Beck AF, Brunswick SA, et al. The family perspective on hospital to home transitions: a qualitative study. Pediatrics. 2015;136:e1539-e1549. PubMed 2. Engel KG, Buckley BA, Forth VE, et al. Patient understanding of emergency department discharge instructions: where are knowledge deficits greatest? Acad Emerg Med. 2012;19:E1035-E1044. PubMed 3. Ashbrook L, Mourad M, Sehgal N. Communicating discharge instructions to patients: a survey of nurse, intern, and hospitalist practices. J Hosp Med. 2013;8: 36-41. PubMed 4. Kripalani S, Jacobson TA, Mugalla IC, Cawthon CR, Niesner KJ, Vaccarino V. Health literacy and the quality of physician-patient communication during hospitalization. J Hosp Med. 2010;5:269-275. PubMed 5. Institute of Medicine Committee on Health Literacy. Kindig D, Alfonso D, Chudler E, et al, eds. Health Literacy: A Prescription to End Confusion. Washington, DC: National Academies Press; 2004. 6. Yin HS, Johnson M, Mendelsohn AL, Abrams MA, Sanders LM, Dreyer BP. The health literacy of parents in the United States: a nationally representative study. Pediatrics. 2009;124(suppl 3):S289-S298. PubMed 7. Rak EC, Hooper SR, Belsante MJ, et al. Caregiver word reading literacy and health outcomes among children treated in a pediatric nephrology practice. Clin Kid J. 2016;9:510-515. PubMed 8. Morrison AK, Schapira MM, Gorelick MH, Hoffmann RG, Brousseau DC. Low caregiver health literacy is associated with higher pediatric emergency department use and nonurgent visits. Acad Pediatr. 2014;14:309-314. PubMed 9. Howard-Anderson J, Busuttil A, Lonowski S, Vangala S, Afsar-Manesh N. From discharge to readmission: Understanding the process from the patient perspective. J Hosp Med. 2016;11:407-412. PubMed 10. Doak CC, Doak LG, Root JH. Teaching Patients with Low Literacy Skills. 2nd ed. Philadelphia PA: J.B. Lippincott; 1996. PubMed 11. Berkman ND, Sheridan SL, Donahue KE, et al. Health literacy interventions and outcomes: an updated systematic review. Evid Rep/Technol Assess. 2011;199:1-941. PubMed 12. Prevention CfDCa. Health Literacy for Public Health Professionals. In: Prevention CfDCa, ed. Atlanta, GA2009. 13. “What Did the Doctor Say?” Improving Health Literacy to Protect Patient Safety. Oakbrook Terrace, IL: The Joint Commission, 2007. 14. Desai AD, Burkhart Q, Parast L, et al. Development and pilot testing of caregiver- reported pediatric quality measures for transitions between sites of care. Acad Pediatr. 2016;16:760-769. PubMed 15. Leyenaar JK, Desai AD, Burkhart Q, et al. Quality measures to assess care transitions for hospitalized children. Pediatrics. 2016;138(2). PubMed 16. Akinsola B, Cheng J, Zmitrovich A, Khan N, Jain S. Improving discharge instructions in a pediatric emergency department: impact of a quality initiative. Pediatr Emerg Care. 2017;33:10-13. PubMed 17. Unaka NI, Statile AM, Haney J, Beck AF, Brady PW, Jerardi K. Assessment of the readability, understandability and completeness of pediatric hospital medicine discharge instructions J Hosp Med. In press. PubMed 18. Stella SA, Allyn R, Keniston A, et al. Postdischarge problems identified by telephone calls to an advice line. J Hosp Med. 2014;9:695-699. PubMed 19. Maloney M, Auffrey C. The social areas of Cincinnati. 20. The Patient Education Materials Assessment Tool (PEMAT) and User’s Guide: An Instrument To Assess the Understandability and Actionability of Print and Audiovisual Patient Education Materials. Available at: http://www.ahrq.gov/ professionals/prevention-chronic-care/improve/self-mgmt/pemat/index.html. Accessed November 27, 2013. 21. Cohen MR, Senders J, Davis NM. Failure mode and effects analysis: a novel approach to avoiding dangerous medication errors and accidents. Hosp Pharm. 1994;29:319-30. PubMed 22. Langley GJ, Moen R, Nolan KM, Nolan TW, Norman CL, Provost LP. The Improvement Guide: A Practical Approach to Enhancing Organizational Performance. San Franciso, CA: John Wiley & Sons; 2009. 23. Flesch R. A new readability yardstick. J Appl Psychol. 1948;32:221-233. PubMed 24. McLaughlin GH. SMOG grading-a new readability formula. J Reading. 1969;12:639-646. 25. Coleman M, Liau TL. A computer readability formula designed for machine scoring. J Appl Psych. 1975;60:283. 26. Gunning R. {The Technique of Clear Writing}. 1952. 27. Smith EA, Senter R. Automated readability index. AMRL-TR Aerospace Medical Research Laboratories (6570th) 1967:1. PubMed 28. How readable is your writing. 2011. https://readability-score.com. Accessed September 23, 2016. An Official Publication of the Society of Hospital Medicine Journal of Hospital Medicine Vol 12 | No 7 | July 2017 557 Improving Readability of Discharge Instructions | Unaka et al 29. Yin HS, Gupta RS, Tomopoulos S, et al. Readability, suitability, and characteristics of asthma action plans: examination of factors that may impair understanding. Pediatrics. 2013;131:e116-E126. PubMed 30. Brigo F, Otte WM, Igwe SC, Tezzon F, Nardone R. Clearly written, easily comprehended? The readability of websites providing information on epilepsy. Epilepsy Behav. 2015;44:35-39. PubMed 31. Benneyan JC. Use and interpretation of statistical quality control charts. Int J Qual Health Care. 1998;10:69-73. PubMed 32. Mueller SK, Giannelli K, Boxer R, Schnipper JL. Readability of patient discharge instructions with and without the use of electronically available disease-specific templates. J Am Med Inform Assoc. 2015;22:857-863. PubMed 33. Lauster CD, Gibson JM, DiNella JV, DiNardo M, Korytkowski MT, Donihi AC. Implementation of standardized instructions for insulin at hospital discharge. J Hosp Med. 2009;4:E41-E42. PubMed 34. Tuso P, Huynh DN, Garofalo L, et al. The readmission reduction program of Kaiser Permanente Southern California-knowledge transfer and performance improvement. Perm J. 2013;17:58-63. PubMed 35. White CM, Statile AM, White DL, et al. Using quality improvement to optimise paediatric discharge efficiency. BMJ Qual Saf. 2014;23:428-436. PubMed 36. Mussman GM, Vossmeyer MT, Brady PW, Warrick DM, Simmons JM, White CM. Improving the reliability of verbal communication between primary care physicians and pediatric hospitalists at hospital discharge. J Hosp Med. 2015;10:574- 580. PubMed 37. Rothman RL, Yin HS, Mulvaney S, Co JP, Homer C, Lannon C. Health literacy and quality: focus on chronic illness care and patient safety. Pediatrics 2009;124(suppl 3):S315-S326. PubMed 38. Turner T, Cull WL, Bayldon B, et al. Pediatricians and health literacy: descriptive results from a national survey. Pediatrics. 2009;124(suppl 3):S299-S305. PubMed 39. Harrington KF, Haven KM, Bailey WC, Gerald LB. Provider perceptions of parent health literacy and effect on asthma treatment: recommendations and instructions. Pediatr Allergy immunol Pulmonol. 2013;26:69-75. PubMed 40. Yin HS, Parker RM, Wolf MS, et al. Health literacy assessment of labeling of pediatric nonprescription medications: examination of characteristics that may impair parent understanding. Acad Pediatr. 2012;12:288-296. PubMed
The transition from hospital to home can be overwhelming for caregivers.1 Stress of hospitalization coupled with the expectation of families to execute postdischarge care plans make understandable discharge communication critical. Communication failures, inadequate education, absence of caregiver confidence, and lack of clarity regarding care plans may prohibit smooth transitions and lead to adverse postdischarge outcomes.2-4
Health literacy plays a pivotal role in caregivers’ capacity to navigate the healthcare system, comprehend, and execute care plans. An estimated 90 million Americans have limited health literacy that may negatively impact the provision of safe and quality care5,6 and be a risk factor for poor outcomes, including increased emergency department (ED) utilization and readmission rates.7-9 Readability strongly influences the effectiveness of written materials.10 However, written medical information for patients and families are frequently between the 10th and 12th grade reading levels; more than 75% of all pediatric health information is written at or above 10th grade reading level.11 Government agencies recommend between a 6th and 8th grade reading level, for written material;5,12,13 written discharge instructions have been identified as an important quality metric for hospital-to-home transitions.14-16
At our center, we found that discharge instructions were commonly written at high reading levels and often incomplete.17 Poor discharge instructions may contribute to increased readmission rates and unnecessary ED visits.9,18 Our global aim targeted improved health-literate written information, including understandability and completeness.
Our specific aim was to increase the percentage of discharge instructions written at or below the 7th grade level for hospital medicine (HM) patients on a community hospital pediatric unit from 13% to 80% in 6 months.
METHODS
Context
The improvement work took place at a 42-bed inpatient pediatric unit at a community satellite of our large, urban, academic hospital. The unit is staffed by medical providers including attendings, fellows, nurse practitioners (NPs), and senior pediatric residents, and had more than 1000 HM discharges in fiscal year 2016. Children with common general pediatric diagnoses are admitted to this service; postsurgical patients are not admitted primarily to the HM service. In Cincinnati, the neighborhood-level high school drop-out rates are as high as 64%.19 Discharge instructions are written by medical providers in the electronic health record (EHR). A printed copy is given to families and verbally reviewed by a bedside nurse prior to discharge. Quality improvement (QI) efforts focused on discharge instructions were ignited by a prior review of 200 discharge instructions that showed they were difficult to read (median reading level of 10th grade), poorly understandable (36% of instructions met the threshold of understandability as measured by the Patient Education Materials Assessment Tool20) and were missing key elements of information.17
Improvement Team
The improvement team consisted of 4 pediatric hospitalists, 2 NPs, 1 nurse educator with health literacy expertise, 1 pediatric resident, 1 fourth-year medical student, 1 QI consultant, and 2 parents who had first-hand experience on the HM service. The improvement team observed the discharge process, including roles of the provider, nurse and family, outlined a process map, and created a modified failure mode and effect analysis.21 Prior to our work, discharge instructions written by providers often occurred as a last step, and the content was created as free text or from nonstandardized templates. Key drivers that informed interventions were determined and revised over time (Figure 1). The study was reviewed by our institutional review board and deemed not human subjects research.
Figure 1Improvement Activities
Key drivers were identified, and interventions were executed using Plan-Do Study-Act cycles.22 The key drivers thought to be critical for the success of the QI efforts were family engagement; standardization of discharge instructions; medical staff engagement; and audit and feedback of data. The corresponding interventions were as follows:
Family Engagement
Understanding the discharge information families desired. Prior to testing, 10 families admitted to the HM service were asked about the discharge experience. We asked families about information they wanted in written discharge instructions: 1) reasons to call your primary doctor or return to the hospital; 2) when to see your primary doctor for a follow-up visit; 3) the phone number to reach your child’s doctor; 4) more information about why your child was admitted; 5) information about new medications; and 6) what to do to help your child continue to recover at home.
Development of templates. We engaged families throughout the process of creating general and disease-specific discharge templates. After a specific template was created and reviewed by the parents on our team, it was sent to members of the institutional Patient Education Committee, which includes parents and local health literacy experts, to review and critique. Feedback from the reviewers was incorporated into the templates prior to use in the EHR.
Postdischarge phone calls.A convenience sample of families discharged from the satellite campus was called 24 to 48 hours after discharge over a 2-week period in January, 2016. A member of our improvement team solicited feedback from families about the quality of the discharge instructions. Families were asked if discharge instructions were reviewed with them prior to going home, if they were given a copy of the instructions, how they would rate the ability to read and use the information, and if there were additional pieces of information that would have improved the instructions.
Standardization of Instructions
Education. A presentation was created and shared with medical providers; it was re-disseminated monthly to new residents rotating onto the service and to the attendings, fellows, and NPs scheduled for shifts during the month. This education continued for the duration of the study. The presentation included the definition of health literacy, scope of the problem, examples of poorly written discharge instructions, and tips on how to write readable and understandable instructions. Laminated cards that included tips on how to write instructions were also placed on work stations.
Figure 2Creation of discharge instruction templates in the EHR.A general discharge instruction template that was initially created and tested in the EHR (Figure 2) included text written below the 7th grade and employed 14 point font, bolded words for emphasis, and lists with bullet points. Asterisks were used to indicate where providers needed to include patient-specific information. The sections included in the general template were informed by feedback from providers and parents prior to testing, parents on the improvement team, and parents of patients admitted to our satellite campus. The sections reflect components critical to successful postdischarge care: discharge diagnosis and its brief description, postdischarge care information, new medications, signs and symptoms that would warrant escalation of care to the patient’s primary care provider or the ED, and follow-up instructions and contact information for the patent’s primary care doctor.
While the general template was an important first step, the content relied heavily on free text by providers, which could still lead to instructions written at a high reading level. Thus, disease-specific discharge instruction templates were created with prepopulated information that was written at a reading level at or below 7th grade level (Figure 2). The diseases were prioritized based on the most common diagnoses on our HM service. Each template included information under each of the subheadings noted in the general template. Twelve disease-specific templates were tested and ultimately embedded in the EHR; the general template remained for use when the discharge diagnosis was not covered by a disease-specific template.
Medical Staff Engagement
Previously described tests of change also aimed to enhance staff engagement. These included frequent e-mails, discussion of the QI efforts at specific team meetings, and the creation of visual cues posted at computer work stations, which prompted staff to begin to work on discharge instructions soon after admission.
Audit and Feedback of Data
Weekly phone calls. One team updated clinicians through a regularly scheduled bi-weekly phone conference. The phone conference was established prior to our work and was designed to relay pertinent information to attendings and NPs who work at the satellite hospital. During the phone conferences, clinicians were notified of current performance on discharge instruction readability and specific tests of change for the week. Additionally, providers gave feedback about the improvement efforts. These updates continued for the first 6 months of the project until sustained improvements were observed.
E-mails. Weekly e-mails were sent to all providers scheduled for clinical time at the satellite campus. The e-mail contained information on current tests of change, a list of discharge instruction templates that were available in the EHR, and the annotated run chart illustrating readability levels over time.
Additionally, individual e-mails were sent to each provider after review of the written discharge instructions for the week. Providers were given information on the number of discharge instructions they personally composed, the percentage of those instructions that were written at or below 7th grade level, and specific feedback on how their written instructions could be improved. We also encouraged feedback from each provider to better identify barriers to achieving our goal.
Study of the Interventions
Baseline data included a review of all instructions for patients discharged from the satellite campus from the end of April 2015 through mid-September 2015. The time period for testing of interventions during the fall and winter months allowed for rapid cycle learning due to higher patient census and predictability of admissions for specific diagnosis (ie, asthma and bronchiolitis). An automated report was generated from the EHR weekly with specific demographics and identifiers for patient discharged over the past 7 days, including patient age, gender, length of stay, discharge diagnosis, and insurance classification. Data was collected during the intervention period via structured review of the discharge instructions in the EHR by the principal investigator or a trained research coordinator. Discharge instructions for medically cleared mental health patients admitted to hospital medicine while awaiting psychiatric bed availability and patients and parents who were non-English speaking were excluded from review. All other instructions for patients discharged from the HM service at our Liberty Campus were included for review.
Measures
Readability, our primary measure of interest, was calculated using the mean score from the following formulas: Flesch Kincaid Grade Level,23 Simple Measure of Gobbledygook Index,24 Coleman-Liau Index,25 Gunning-Fog Index,26 and Automated Readability Index27 by means of an online platform (https://readability-score.com).28 This platform was chosen because it incorporated a variety of formulas, was user-friendly, and required minimal data cleaning. Each of the readability formulas have been used to assesses readability of health information given to patients and families.29,30 The threshold of 7th grade is in alignment with our institutional policy for educational materials and with recommendations from several government agencies.5,12
Analysis
A statistical process control p-chart was used to analyze our primary measure of readability, dichotomized as percent discharge instructions written at or below 7th grade level. Run charts were used to follow mean reading level of discharge instructions and our process measure of percent of discharge instruction written with a general or disease-specific standardized template. Run chart and control chart rules for identifying special cause were used for midline shifts.31
Table
RESULTS
The Table includes the demographic and clinical information of patients included in our analyses. Through sequential interventions, the percentage of discharge instructions written at or below 7th grade readability level increased from a mean of 13% to more than 80% in 3 months (Figure 3). Furthermore, the mean was sustained above 90% for 10 months and at 98% for the last 4 months. The use of 1 of the 13 EHR templates increased from 0% to 96% and was associated with the largest impact on the overall improvements (Supplemental Figure 1). Additionally, the average reading level of the discharge instructions decreased from 10th grade to 6th grade level (Supplemental Figure 2).
Figure 3
Qualitative comments from providers about the discharge instructions included:
“Are these [discharge instructions] available at base?? Great resource for interns.” “These [discharge] instructions make the [discharge] process so easy!!! Love these...” “Also feel like they have helped my discharge teaching in the room!”
Qualitative comments from families postdischarge included: “I thought the instructions were very clear and easy to read. I especially thought that highlighting the important areas really helped.” “I think this form looks great, and I really like the idea of having your child’s name on it.”
DISCUSSION
Through sequential Plan-Do Study-Act cycles, we increased the percentage of discharge instructions written at or below 7th grade reading level from 13% to 98%. Our most impactful intervention was the creation and dissemination of standardized disease-specific discharge instruction templates. Our findings complement evidence in the adult and pediatric literature that the use of standardized, disease-specific discharge instruction templates may improve readability of instructions.32,33 And, while quality improvement efforts have been employed to improve the discharge process for patients,34-36 this is the first study in the inpatient setting that, to our knowledge, specifically addresses discharge instructions using quality improvement methods.
Our work targeted the critical intersection between individual health literacy, an individual’s capacity to acquire, interpret, and use health information, and the necessary changes needed within our healthcare system to ensure that appropriately written instructions are given to patients and families.17,37 Our efforts focused on improving discharge instructions answer the call to consider health literacy a modifiable clinical risk factor.37 Furthermore, we address the 6 aims for quality healthcare delivery: 1) safe, timely, efficient and equitable delivery of care through the creation and dissemination of standardized instructions that are written at the appropriate reading level for families to ease hospital-to-home transitions and streamline the workflow of medical providers; 2) effective education of medical providers on health literacy concepts; and 3) family-centeredness through the involvement of families in our QI efforts. While previous QI efforts to improve hospital-to-home transitions have focused on medication reconciliation, communication with primary care physicians, follow-up appointments, and timely discharges of patients, none have specifically focused on the quality of discharge instructions.34-36
Most physicians do not receive education about how to write information that is readable and understandable; more than half of providers desired more education in this area.38 Furthermore, pediatric providers may overestimate parental health literacy levels,39 which may contribute to variability in the readability of written health materials. While education alone can contribute to a provider’s ability to create readable instructions, we note the improvement after the introduction of disease templates to demonstrate the importance of workflow-integrated higher reliability interventions to sustain improvements.
Our baseline poor readability rates were due to limited knowledge by frontline providers composing the instructions and a system in which an important element for successful hospital-to-home transitions was not tackled until patients were ready for discharge. Streamlining of the discharge process, including the creation of discharge instructions, may lead to improved efficiency, fewer discrepancies, more effective communication, and an enhanced family experience. Moreover, the success of our improvement work was due to key stakeholders, including parents, being a part of the team and the notable buy-in from providers.
Our work was not without limitations. We excluded non-English speaking families from the study. We were unable to measure reading level of our population directly and instead based our goals on national estimates. Our primary measure was readability, which is only 1 piece contributing to quality discharge instructions. Understandability and actionability are also important considerations; 17,20,29,40 however, improvements in these areas were limited by our design options within the EHR. Our efforts focused on children with common general pediatric diagnoses, and it is unclear how our interventions would generalize to medically complex patients with more volume of information to communicate at discharge and with uncommon diagnoses that are less readily incorporated into standardized templates. Relatedly, our work occurred at the satellite campus of our tertiary care center and may not represent generalizable material or methods to implement templates at our main campus location or at other hospitals. To begin to better understand this, we have spread to HM patients at our main campus, including medically complex patients with technology dependence and/or neurological impairments. Standardized, disease-specific templates most relevant to this population as well as several patient specific templates, for those with frequent readmissions due to medical complexity, have been created and are actively being tested.
CONCLUSION
In conclusion, in using interventions targeted at standardization of discharge instructions and timely feedback to staff, we saw rapid, dramatic, and sustained improvement in the readability of discharge instructions. Next steps include adaptation and spread to other patient populations and care teams, collaborations with other centers, and assessing the impact of effectively written discharge instructions on patient outcomes, such as adverse drug events, readmission rates, and family experience.
Disclosure
No external funding was secured for this study. Dr. Brady is supported by a Patient-Centered Outcomes Research Mentored Clinical Investigator Award from the Agency for Healthcare Research and Quality, Award Number K08HS023827. The content is solely the responsibility of the authors and does not necessarily represent the official views of the funding organizations. The funding organization had no role in the design, preparation, review, or approval of this paper; nor the decision to submit the manuscript for publication. The authors have no financial relationships relevant to this article to disclose.
References
1. Solan LG, Beck AF, Brunswick SA, et al. The family perspective on hospital to home transitions: a qualitative study. Pediatrics. 2015;136:e1539-e1549. PubMed 2. Engel KG, Buckley BA, Forth VE, et al. Patient understanding of emergency department discharge instructions: where are knowledge deficits greatest? Acad Emerg Med. 2012;19:E1035-E1044. PubMed 3. Ashbrook L, Mourad M, Sehgal N. Communicating discharge instructions to patients: a survey of nurse, intern, and hospitalist practices. J Hosp Med. 2013;8: 36-41. PubMed 4. Kripalani S, Jacobson TA, Mugalla IC, Cawthon CR, Niesner KJ, Vaccarino V. Health literacy and the quality of physician-patient communication during hospitalization. J Hosp Med. 2010;5:269-275. PubMed 5. Institute of Medicine Committee on Health Literacy. Kindig D, Alfonso D, Chudler E, et al, eds. Health Literacy: A Prescription to End Confusion. Washington, DC: National Academies Press; 2004. 6. Yin HS, Johnson M, Mendelsohn AL, Abrams MA, Sanders LM, Dreyer BP. The health literacy of parents in the United States: a nationally representative study. Pediatrics. 2009;124(suppl 3):S289-S298. PubMed 7. Rak EC, Hooper SR, Belsante MJ, et al. Caregiver word reading literacy and health outcomes among children treated in a pediatric nephrology practice. Clin Kid J. 2016;9:510-515. PubMed 8. Morrison AK, Schapira MM, Gorelick MH, Hoffmann RG, Brousseau DC. Low caregiver health literacy is associated with higher pediatric emergency department use and nonurgent visits. Acad Pediatr. 2014;14:309-314. PubMed 9. Howard-Anderson J, Busuttil A, Lonowski S, Vangala S, Afsar-Manesh N. From discharge to readmission: Understanding the process from the patient perspective. J Hosp Med. 2016;11:407-412. PubMed 10. Doak CC, Doak LG, Root JH. Teaching Patients with Low Literacy Skills. 2nd ed. Philadelphia PA: J.B. Lippincott; 1996. PubMed 11. Berkman ND, Sheridan SL, Donahue KE, et al. Health literacy interventions and outcomes: an updated systematic review. Evid Rep/Technol Assess. 2011;199:1-941. PubMed 12. Prevention CfDCa. Health Literacy for Public Health Professionals. In: Prevention CfDCa, ed. Atlanta, GA2009. 13. “What Did the Doctor Say?” Improving Health Literacy to Protect Patient Safety. Oakbrook Terrace, IL: The Joint Commission, 2007. 14. Desai AD, Burkhart Q, Parast L, et al. Development and pilot testing of caregiver- reported pediatric quality measures for transitions between sites of care. Acad Pediatr. 2016;16:760-769. PubMed 15. Leyenaar JK, Desai AD, Burkhart Q, et al. Quality measures to assess care transitions for hospitalized children. Pediatrics. 2016;138(2). PubMed 16. Akinsola B, Cheng J, Zmitrovich A, Khan N, Jain S. Improving discharge instructions in a pediatric emergency department: impact of a quality initiative. Pediatr Emerg Care. 2017;33:10-13. PubMed 17. Unaka NI, Statile AM, Haney J, Beck AF, Brady PW, Jerardi K. Assessment of the readability, understandability and completeness of pediatric hospital medicine discharge instructions J Hosp Med. In press. PubMed 18. Stella SA, Allyn R, Keniston A, et al. Postdischarge problems identified by telephone calls to an advice line. J Hosp Med. 2014;9:695-699. PubMed 19. Maloney M, Auffrey C. The social areas of Cincinnati. 20. The Patient Education Materials Assessment Tool (PEMAT) and User’s Guide: An Instrument To Assess the Understandability and Actionability of Print and Audiovisual Patient Education Materials. Available at: http://www.ahrq.gov/ professionals/prevention-chronic-care/improve/self-mgmt/pemat/index.html. Accessed November 27, 2013. 21. Cohen MR, Senders J, Davis NM. Failure mode and effects analysis: a novel approach to avoiding dangerous medication errors and accidents. Hosp Pharm. 1994;29:319-30. PubMed 22. Langley GJ, Moen R, Nolan KM, Nolan TW, Norman CL, Provost LP. The Improvement Guide: A Practical Approach to Enhancing Organizational Performance. San Franciso, CA: John Wiley & Sons; 2009. 23. Flesch R. A new readability yardstick. J Appl Psychol. 1948;32:221-233. PubMed 24. McLaughlin GH. SMOG grading-a new readability formula. J Reading. 1969;12:639-646. 25. Coleman M, Liau TL. A computer readability formula designed for machine scoring. J Appl Psych. 1975;60:283. 26. Gunning R. {The Technique of Clear Writing}. 1952. 27. Smith EA, Senter R. Automated readability index. AMRL-TR Aerospace Medical Research Laboratories (6570th) 1967:1. PubMed 28. How readable is your writing. 2011. https://readability-score.com. Accessed September 23, 2016. An Official Publication of the Society of Hospital Medicine Journal of Hospital Medicine Vol 12 | No 7 | July 2017 557 Improving Readability of Discharge Instructions | Unaka et al 29. Yin HS, Gupta RS, Tomopoulos S, et al. Readability, suitability, and characteristics of asthma action plans: examination of factors that may impair understanding. Pediatrics. 2013;131:e116-E126. PubMed 30. Brigo F, Otte WM, Igwe SC, Tezzon F, Nardone R. Clearly written, easily comprehended? The readability of websites providing information on epilepsy. Epilepsy Behav. 2015;44:35-39. PubMed 31. Benneyan JC. Use and interpretation of statistical quality control charts. Int J Qual Health Care. 1998;10:69-73. PubMed 32. Mueller SK, Giannelli K, Boxer R, Schnipper JL. Readability of patient discharge instructions with and without the use of electronically available disease-specific templates. J Am Med Inform Assoc. 2015;22:857-863. PubMed 33. Lauster CD, Gibson JM, DiNella JV, DiNardo M, Korytkowski MT, Donihi AC. Implementation of standardized instructions for insulin at hospital discharge. J Hosp Med. 2009;4:E41-E42. PubMed 34. Tuso P, Huynh DN, Garofalo L, et al. The readmission reduction program of Kaiser Permanente Southern California-knowledge transfer and performance improvement. Perm J. 2013;17:58-63. PubMed 35. White CM, Statile AM, White DL, et al. Using quality improvement to optimise paediatric discharge efficiency. BMJ Qual Saf. 2014;23:428-436. PubMed 36. Mussman GM, Vossmeyer MT, Brady PW, Warrick DM, Simmons JM, White CM. Improving the reliability of verbal communication between primary care physicians and pediatric hospitalists at hospital discharge. J Hosp Med. 2015;10:574- 580. PubMed 37. Rothman RL, Yin HS, Mulvaney S, Co JP, Homer C, Lannon C. Health literacy and quality: focus on chronic illness care and patient safety. Pediatrics 2009;124(suppl 3):S315-S326. PubMed 38. Turner T, Cull WL, Bayldon B, et al. Pediatricians and health literacy: descriptive results from a national survey. Pediatrics. 2009;124(suppl 3):S299-S305. PubMed 39. Harrington KF, Haven KM, Bailey WC, Gerald LB. Provider perceptions of parent health literacy and effect on asthma treatment: recommendations and instructions. Pediatr Allergy immunol Pulmonol. 2013;26:69-75. PubMed 40. Yin HS, Parker RM, Wolf MS, et al. Health literacy assessment of labeling of pediatric nonprescription medications: examination of characteristics that may impair parent understanding. Acad Pediatr. 2012;12:288-296. PubMed
*Address for correspondence and reprint requests: Ndidi I. Unaka, Division of Hospital Medicine, Cincinnati Children’s Hospital Medical Center, 3333 Burnet Ave., ML 5018, Cincinnati, OH 45229; Telephone: 513-636-8354; Fax: 513-636-7905; E-mail: ndidi.unaka@cchmc.org
Content Gating
Open Access (article Unlocked/Open Access)
Alternative CME
Disqus Comments
Default
Consolidated Pubs: Do Not Show Source Publication Logo
Direct-acting oral anticoagulants (DOACs) have been introduced into clinical use for stroke prevention in patients with nonvalvular atrial fibrillation (NVAF), prevention of venous thrombosis after hip or knee surgery, and treatment of deep vein thrombosis (DVT) and pulmonary embolism (PE).1-7 Advantages of DOACs over warfarin are often stated as fixed dosing, minor drug and food interactions, wider therapeutic index, and no need for laboratory test monitoring.1,8 Yet, recommended DOAC dosages vary by renal function and therapeutic indications. Dosing recommendations for prevention of stroke in patients with NVAF are based on estimated creatinine clearance (dabigatran, rivaroxaban, edoxaban), age (apixaban), weight (apixaban, edoxaban), serum creatinine level (apixaban, edoxaban), and presence of cirrhosis by Child-Pugh class9,10 (apixaban, edoxaban).4-6,11,12 Dosing recommendations based on coadministration of strong CYP34A and P-glycoprotein inhibitors or inducers vary by DOAC. In addition, dabigatran cannot be crushed and must be stored in its original packaging, and rivaroxaban should be taken with food when the dose is over 10 mg.
We studied DOAC prescribing in adults admitted to a large academic medical center by comparing initial prescribed dosing with FDA-approved prescribing information. We hypothesized that the complexity of DOAC dosing may not be recognized by prescribers.
METHODS
Our study protocol was approved by the Committee on Human Research (Institutional Review Board) of the University of California San Francisco.
Data Collection
We used electronic medical records (EMRs) to identify adult inpatients who were prescribed a DOAC (apixaban, dabigatran, edoxaban, or rivaroxaban) at the University of California San Francisco Medical Center, a large academic hospital, between July 1, 2014 and June 30, 2015. Demographic and medical information related to therapeutic indications, contraindications, and indications for dose adjustments were collected and included diagnoses classified by International Classification of Diseases, Ninth Revision (ICD-9) and Tenth Revision (ICD-10) for venous thromboses; phlebitis or thrombophlebitis; PE or venous embolism; atrial arrhythmias; surgical procedures; cirrhosis and/or ascites or liver disease; coagulopathies; artificial heart valves or implanted devices; prior use of medications including parenteral anticoagulants; and laboratory data obtained before the first DOAC order (serum creatinine level, estimated glomerular filtration rate [eGFR] determined by Chronic Kidney Disease Epidemiology Collaboration,13 international normalized ratio, or, if available, activated partial thromboplastin time and bilirubin level). Creatinine clearance was calculated with the Cockcroft-Gault method14 using total body weight, per drug label recommendation. Child-Pugh class was calculated if cirrhosis was diagnosed.10 DOAC dose, frequency, dosing directions, and prescriber medical specialty were determined.
Accuracy of search results was confirmed by review of the first 200 patients’ records. Records were manually reviewed for encounters lacking ICD-9/10 codes and approved DOAC indications (30%) and encounters having multiple coded diagnostic indications (to identify the indication). ICD-9 codes for venous thrombosis were reviewed to differentiate acute from chronic events.
Data Analysis
The main outcome was concordance or discordance between the first DOAC prescribing order and the FDA-approved prescribing information at the time. Initial classification, performed by 2 independent reviewers (a pharmacist and a physician, or 2 pharmacists), was followed by adjudication and individual record review (by 2 independent reviewers) of all initial prescribing orders classified as discordant. A third reviewer adjudicated any disagreement. Records and notes were reviewed to identify stated or potential reasons for dosing variation and pre-admission prescriptions. Data are presented as means and standard deviations (SDs) and as raw numbers and percentages. Differences in patient characteristics by DOAC or therapeutic indication were determined by analysis of variance (ANOVA) with Bonferroni correction for post hoc comparisons. Dosing information was categorized as the same as recommended, lower than recommended, higher than recommended, or avoid drug use (drug–drug or drug–disease interaction), per FDA-approved prescribing information, and χ2 tests were used to determine whether variation in dosing occurred by individual DOAC, therapeutic indication, or prescriber specialty. Relationships between dosing variation and age or renal function were tested by ANOVA with Bonferroni correction for post hoc comparisons.
RESULTS
Table 1There were 635 admissions with apixaban, dabigatran, or rivaroxaban prescribed for 508 patients (Table 1). Edoxaban was not on the formulary and not prescribed during the period studied. The therapeutic indication was prevention of embolic stroke in patients with atrial fibrillation/flutter or AF (465 admissions, or 73%, with valvular disease and/or tissue valve in 35), chronic DVT (67 admissions, or 11%, with active malignancy in 14), acute DVT (32 admissions, with malignancy in 2), chronic PE (23 admissions, with malignancy in 3), acute PE (19 admissions, with malignancy in 4), and DVT prevention after hip or knee surgery (19 admissions). DOACs were prescribed for unapproved indications in 10 admissions, and these were excluded from further analysis (mural thrombus in 3 admissions, low ejection fraction in 2, bedrest immobilization in 2, aortic aneurysm in 1, thrombocytosis in 1, and extensive superficial venous thrombosis in 1) (Table 2).
Table 2
Patients with AF were older with lower creatinine clearance compared to patients with other diagnoses. Mean (SD) patient age was 72.1 (12.7) years for AF, 53.1 (10.9) years for chronic PE, 55.5 (14) years for acute PE, 56.4 (15.9) years for chronic DVT, 57.9 (18.4) years for acute DVT, and 61.4 (11.6) years for DVT prevention after hip or knee surgery (P < 0.0001 for all comparisons). Mean (SD) estimated creatinine clearance was 76.8 (43.5) mL/min for AF, 92.4 (44.4) mL/min for DVT prevention after hip or knee surgery, 111 (53) mL/min for chronic DVT, 118 (55) mL/min for acute DVT, 126 (60) mL/min for chronic PE, and 127 (54) mL/min for acute PE (P < 0.0001 for all comparisons). Differences between patient groups by therapeutic indication were not detected for weight, body mass index, or serum creatinine level.
The most frequent deviation from prescribing recommendations was omission of directions to administer rivaroxaban with food—93% (248/268) of orders—but not for DVT prevention after hip or knee surgery, for which the 10-mg dose is appropriately administered without food. Doses were the same as recommended for 82% of apixaban orders, 84% of rivaroxaban orders, and 93% of initial dabigatran orders (P < 0.05 for differences; Table 3). Dosages not concordant with FDA recommendations were prescribed in 44 (18.1%) of 243 apixaban orders, 41 (14.3%) of 286 rivaroxaban orders, and 7 (7.2%) of 89 initial dabigatran orders. Lower than recommended doses were more common than higher than recommended doses (Table 3, Figure 1): 15.2% versus 2.1% of apixaban orders, 9.4% versus 3.5% of rivaroxaban orders, and 4.2% versus 1.0% of initial dabigatran orders (P < 0.05). Failure to avoid drug use (for potential drug–drug or drug–disease interactions) was uncommon (1%-2%). There were more deviations from recommended doses for patients with AF or DVT prevention after hip or knee surgery than for patients with acute or chronic PE or acute DVT (Table 3). No significant differences were detected between prescribed and recommended doses by prescriber specialty.
Table 3In most cases, a reason for deviating from FDA dosing recommendations was not stated in the EMR. The exception was fluctuating renal function, which was cited in 8 cases.
Figure
For apixaban, patients who were prescribed lower than recommended doses were older than those prescribed recommended doses: mean (SD), 78.1 (12.2) years versus 71 (13.6) years (P = 0.003). Seventy-six percent of those prescribed lower than recommended doses were older than 75. Prescriptions for apixaban at lower than recommended doses were continuations of prior outpatient prescriptions in 20 of 37 cases (almost half), and in 12 cases (one-fourth) antiplatelet drugs were coprescribed (aspirin in 10 cases, clopidogrel in 1, prasugrel in 1). For rivaroxaban, older age was associated with both lower than recommended dosing (P = 0.003) and higher than recommended dosing (P < 0.001). Variations from prescribing recommendations were continuations of outpatient rivaroxaban doses in about two-thirds (26 of 41; 63.4 %) with 13 receiving antiplatelet drugs. For dabigatran, 6 of 7 orders not in agreement with recommendations were continuations of outpatient dosing.
The specific equation used to estimate renal function also had the potential to lead to dosing errors. Among the 41 rivaroxaban patients categorized as receiving doses discordant with recommendations, 8 would have had an inappropriate DOAC dose if eGFR were used instead of eCrCL as recommended. No relationships were detected for other patient variables/measures and dosing deviations from recommendations.
DISCUSSION
We examined initial hospital orders for DOACs in adults admitted to a single academic medical center during 2014-2015. Dabigatran, apixaban and rivaroxaban were prescribed for prevention of stroke in patients with atrial fibrillation/flutter (AF) in three quarters of the encounters similar to national patterns. (15) Prescribing departures from FDA-approved recommendations ranged from failure to prescribe rivaroxaban with food to failure to recognize drug-drug interactions in 1% to 2%. Unexpectedly, lower than recommended dosing was more common than higher than recommended dosing of the three DOACs.
Rivaroxaban bioavailability is dose dependent with the presence of food required to enhance absorption for doses over 10 mg that are used for prevention of stroke in patients with non-valvular AF or treatment of DVT or PE.5,16 Peak rivaroxaban concentrations are 75% higher and the total area under the concentration vs. time curve after dosing is 40% higher when rivaroxaban is administered with high fat high calorie meals compared to the fasting state.16 If rivaroxaban is not administered with food, drug concentrations and pharmacologic effects may be less than in clinical trials that specified co-administration with food.17-19 A small survey of outpatients receiving rivaroxaban found that 23% reported taking it without food.20 With electronic pharmacy systems in almost all hospitals and electronic prescriber order entry in most, automated addition of directions for rivaroxaban administration with food for doses over 10 mg to labels or dispensing instructions could easily correct this deviation from recommended practice.
Lower than recommended doses were prescribed in 9.4% of orders for rivaroxaban and 15.2% of orders for apixaban, with dose-deviations often appearing to be a continuation of outpatient doses. Patients 75 years or older were more likely to receive lower than recommended dosing of apixaban. Reductions in apixaban doses from 5 mg twice daily to 2.5 mg twice daily are recommended in patients with non-valvular AF with two of the following criteria: age ≥80 y, weight ≤60 kg, serum creatinine ≥1.5 mg/dL or co-administration of a strong PgP inhibitor to a patient without 2 of the 3 dose reduction criteria. Our study was not designed to determine reasons for under-dosing, but we speculate that clinicians may have considered patients aged 75-79 years to be similar to those 80 years of age or older, or, older and not as healthy as those enrolled in randomized trials.21-25 The median age of our patients with AF receiving apixaban was 75y (interquartile range of 16) vs 70y ( interquartile range 63-76) in the pivotal trial comparing warfarin to apixaban.21 Renal function was also lower with 37% having eCrCL below 50 mL/min compared to 17% in ARISTOTLE. (21). Twenty-six percent of our apixaban-treated AF patients qualified for the lower 2.5 mg twice daily compared to only 5% of ARISTOTLE participants,21 further suggesting differences between patients in our sample compared to randomized trial participants.
Concerns regarding bleeding or falls in older patients, may also have contributed to lower than recommended doses. Recent analyses of patients at risk for falls confirmed that increased risk of falling was associated with more bone fractures, bleeding and all-cause death but not stroke or systemic emboli, and with less severe bleeding with the DOAC edoxaban compared to warfarin.26 While a rationale for personalized or lower than recommended dosing of apixaban may exist in very old patients and those at risk of falls and bleeding, more data are needed to determine outcomes of lower than recommended doses of DOACs before such an approach can be endorsed. Monitoring of anticoagulant effect in patients who receive doses lower than those investigated in clinical trials could provide important information. The assays that measure DOAC effects are likely to be more available because of the use of reversal agents in the setting of bleeding with DOACs.27
We had anticipated higher than recommended dosing for rivaroxaban as recommendations are based on creatinine clearance while laboratories routinely report estimated glomerular filtration rate (eGFR) that can provide higher estimates of renal clearance and estimated DOAC doses in older and smaller individuals.28 Higher than recommended dosing was found in only 3.5% of our sample. In half, eGFR estimates were higher than creatinine clearance estimates. An international postmarketing registry of rivaroxaban use for the prevention of stroke in patients with NVAF, which included outpatients, found that 36% of those with creatinine clearances below 50 mL/min received a dose higher than recommended, and 15% received a dose lower than expected.29 A more recent outpatient registry report on patients with NVAF, in which apixaban, dabigatran, or rivaroxaban was administered, found that overall 9.4% received a dose lower than recommended, and 3.4% were overdosed, with a similar percentage (34%) of rivaroxaban patients with creatinine clearance of 15 to 50 mL/min receiving higher than recommended dosing.30 The lower rate of higher-than-recommended doses that we observed may have been related to the routine measurement of serum creatinine and attention to dosing adjustments for renal function in the inpatient setting compared to the outpatient setting. In addition, renal function data may not be available to outpatient pharmacies, limiting potential input on dosing recommendations. At least one cardiac society recommends monitoring of renal function in patients treated with DOACs, annually in patients with normal estimated creatinine clearance and more frequently (at intervals in months equal to the creatinine clearance divided by 10) in patients with abnormal creatinine clearance.11 A hospital encounter provides an opportunity to assess or reassess renal status to optimize DOAC dosing.
Dabigatran was the first DOAC introduced into use in the United States with the same dose recommended for prevention of stroke in patients with AF or venous thromboembolic disease with reductions for creatinine clearance below 30 mL/min or creatinine clearance between 30 and 50 mL/min and concomitant use of the potent P-glycoprotein inhibitor dronedarone or systemic ketoconazole. The relative simplicity of dosing may have been responsible for the lowest rate of prescribing outside of recommendations observed in this study, but the low dabigatran use limits analyses of contributing factors.
Failure to avoid drug use in combination with use of strong P-glycoprotein inducers or inhibitors was infrequent but should be preventable. Current prescribing recommendations refer to “strong” P-glycoprotein inhibitors and list different specific agents that interact with each DOAC without a standardized definition or classification. Standardized classifications or reference sources would be helpful.
Our primary goal in this study was to compare initial prescribed dosing of DOACs with FDA-approved prescribing directions. However, therapeutic indication data warrant discussion. In our sample, 7.5% of patients with AF had bioprosthetic valves or recent mitral valve repair or replacement. Using the NVAF definition found in the 2014 AHA/ACC/HRS (American Heart Association, American College of Cardiology, Heart Rhythm Society) AF guidelines1—“absence of rheumatic mitral valve disease, a prosthetic heart valve, or mitral valve repair”—these patients would not appear to be candidates for DOACs. However, arguments have been made that a bioprosthetic heart valve or native valve after valve repair does not have a risk profile for thromboembolism that differs from other forms of NVAF and would be equally responsive to DOAC therapy.31 Data are sparse, but retrospective subanalyses of limited numbers of patients with valvular disease (including bioprosthesis and mitral repair patients but excluding mechanical valve patients) enrolled in the pivotal DOAC studies support this conclusion.32 For the first months after biological valve replacement (including catheter-based valve replacement), recent European guidelines recommend vitamin K antagonists but also state, “NOACs probably deliver the same protection.”8 DOACs were also used for management of venous thromboembolic disease (both acute and chronic) in patients with active cancer. Our data predate the most recent American College of Chest Physician guidelines on treatment of venous thromboembolism in patients with cancer, which provide grade 2B recommendations for use of low-molecular-weight heparin (LMWH) over vitamin K antagonists and grade 2C recommendations for use of LMWH over dabigatran, rivaroxaban, apixaban, or edoxaban.33
Our study had several limitations. First, data were from a single US academic medical center, though similar rates of prescribing deviation from recommendations have been reported for rivaroxaban and dabigatran in NVAF patients in other countries.29,34 Second, therapeutic indications may have been misclassified because of errors, incomplete EMR data, or multiple indications. Third, we analyzed the first DOAC order and not dispensing information or subsequent corrections. Therefore, deviations from recommendations should not be interpreted as errors that reached patients. We evaluated dosing based on the measures used at the time of hospital admission, noting that, in a significant fraction of deviations from recommended doses, they represented continuations of outpatient doses when renal function or weight may have differed, and it is unknown whether patients were counseled to take rivaroxaban with food in the outpatient setting. Fourth, the number of patients with acute DVT was small, so firm conclusions cannot be drawn for this specific population. Fifth, our estimates of off-label dosing may have been underestimates, as data on cancer and cancer activity or cardiac valvular disease may not have been complete.
CONCLUSION
Healthcare professionals are prescribing DOACs in ways that differ from recommendations. These differences may reflect the older ages and reduced renal function of clinical populations relative to randomized clinical trial groups, but they could also potentially alter clinical efficacy. Our findings support the need to evaluate the appropriateness and dosing of DOACs at each encounter and to determine the outcomes of patients treated with lower than recommended doses of DOACs and the outcomes of DOAC-treated patients with bioprostheses or active malignancies.
Acknowledgment
The authors thank Tobias Schmelzinger for electronic data extraction and compilation and University of California San Francisco students Eduardo De La Torre Cruz (School of Pharmacy) and Carlos Mikell (School of Medicine) for assistance with data review.
Disclosure
Dr. Schwartz reports receiving personal fees from Bristol-Myers Squibb and Amgen and grants from Bristol-Myers Squibb and Pfizer, outside the submitted work. The other authors have nothing to report.
References
1. January CT, Wann LS, Alpert JS, et al. 2014 AHA/ACC/HRS guideline for the management of patients with atrial fibrillation: executive summary. A report of the American College of Cardiology/American Heart Association Task Force on Practice Guidelines and the Heart Rhythm Society. J Am Coll Cardiol. 2014;64(21):2246-2280. PubMed 2. Saraf K, Morris PD, Garg P, Sheridan P, Storey R. Non–vitamin K antagonist oral anticoagulants (NOACs): clinical evidence and therapeutic considerations. Postgrad Med J. 2014;90(1067):520-528. PubMed 3. Yeh CH, Gross PL, Weitz JI. Evolving use of new oral anticoagulants for treatment of venous thromboembolism. Blood. 2014;124(7):1020-1028. PubMed 4. Pradaxa website. https://www.pradaxa.com. Accessed June 1, 2017. 5. Xarelto website. https://www.xarelto-us.com. Accessed June 1, 2017. 6. Eliquis website. http://www.eliquis.com. Accessed June 1, 2017. 7. Savaysa [prescribing information]. Tokyo, Japan: Daiichi Sankyo; 2015. 8. Kirchhof P, Benussi S, Kotecha D, et al. 2016 ESC guidelines for the management of atrial fibrillation developed in collaboration with EACTS. Eur Heart J. 2016;37(38):2893-2962. PubMed 9. Child C, Turcotte J. Surgery and portal hypertension. In: Child CG, ed. The Liver and Portal Hypertension. Philadelphia, PA: Saunders; 1964:50-64. PubMed 10. Pugh RN, Murray-Lyon IM, Dawson JL, Pietroni MC, Williams R. Transection of the oesophagus for bleeding oesophageal varices. Br J Surg. 1973;60(8):646-649. PubMed 11. Heidbuchel H, Verhamme P, Alings M, et al. Updated European Heart Rhythm Association practical guide on the use of non–vitamin K antagonist anticoagulants in patients with non-valvular atrial fibrillation. Europace. 2015;17(10):1467-1507. PubMed 12. Savaysa website. https://savaysahcp.com. Accessed June 1, 2017. 13. Levey AS, Stevens LA, Schmid CH, et al; CKD-EPI (Chronic Kidney Disease Epidemiology Collaboration). A new equation to estimate glomerular filtration rate. Ann Intern Med. 2009;150(9):604-612. PubMed 14. Cockcroft DW, Gault MH. Prediction of creatinine clearance from serum creatinine. Nephron. 1976;16(1):31-41. PubMed 15. Rose AJ, Reisman JI, Allen AL, Miller DR. Potentially inappropriate prescribing of direct-acting oral anticoagulants in the Veterans Health Administration. Am J Pharm Benefits. 2016;4(4):e75-e80. 16. Stampfuss J, Kubitza D, Becka M, Mueck W. The effect of food on the absorption and pharmacokinetics of rivaroxaban. Int J Clin Pharmacol Ther. 2013;51(7):549-561. PubMed 17. Patel MR, Mahaffey KW, Garg J, et al; ROCKET AF Investigators. Rivaroxaban versus warfarin in nonvalvular atrial fibrillation. N Engl J Med. 2011;365(10):883-891. PubMed 18. EINSTEIN Investigators, Bauersachs R, Berkowitz SD, et al. Oral rivaroxaban for symptomatic venous thromboembolism. N Engl J Med. 2010;363(26):2499-2510. PubMed 19. EINSTEIN-PE Investigators, Büller HR, Prins MH, et al. Oral rivaroxaban for the treatment of symptomatic pulmonary embolism. N Engl J Med. 2012;366(14):1287-1297. PubMed 20. Simon J, Hawes E, Deyo Z, Bryant-Shilliday B. Evaluation of prescribing and patient use of target-specific oral anticoagulants in the outpatient setting. J Clin Pharm Ther. 2015;40(5):525-530. PubMed 21. Granger CB, Alexander JH, McMurray JJ, et al; ARISTOTLE Committees and Investigators. Apixaban versus warfarin in patients with atrial fibrillation. N Engl J Med. 2011;365(11):981-992. PubMed 22. Ruff CT, Giugliano RP, Braunwald E, et al. Comparison of the efficacy and safety of new oral anticoagulants with warfarin in patients with atrial fibrillation: a meta-analysis of randomised trials. Lancet. 2014;383(9921):955-962. PubMed 23. van der Hulle T, Kooiman J, den Exter PL, Dekkers OM, Klok FA, Huisman MV. Effectiveness and safety of novel oral anticoagulants as compared with vitamin K antagonists in the treatment of acute symptomatic venous thromboembolism: a systematic review and meta-analysis. J Thromb Haemost. 2014;12(3):320-328. PubMed 24. Schuh T, Reichardt B, Finsterer J, Stöllberger C. Age-dependency of prescribing patterns of oral anticoagulant drugs in Austria during 2011–2014. J Thromb Thrombolysis. 2016;42(3):447-451. PubMed 25. Stöllberger C, Brooks R, Finsterer J, Pachofszky T. Use of direct-acting oral anticoagulants in nonagenarians: a call for more data. Drugs Aging. 2016;33(5):315-320. PubMed 26. Steffel J, Giugliano RP, Braunwald E, et al. Edoxaban versus warfarin in atrial fibrillation patients at risk of falling: ENGAGE AF-TIMI 48 analysis. J Am Coll Cardiol. 2016;68(11):1169-1178. PubMed 27. Ruff CT, Giugliano RP, Antman EM. Management of bleeding with non–vitamin K antagonist oral anticoagulants in the era of specific reversal agents. Circulation. 2016;134(3):248-261. PubMed 28. Schwartz JB. Potential impact of substituting estimated glomerular filtration rate for estimated creatinine clearance for dosing of direct oral anticoagulants. J Am Geriatr Soc. 2016;64(10):1996-2002. PubMed 29. Camm AJ, Amarenco P, Haas S, et al; XANTUS Investigators. XANTUS: a real-world, prospective, observational study of patients treated with rivaroxaban for stroke prevention in atrial fibrillation. Eur Heart J. 2016;37(14):1145-1153. PubMed 30. Steinberg BA, Shrader P, Thomas L, et al; ORBIT-AF Investigators and Patients. Off-label dosing of non–vitamin K antagonist oral anticoagulants and adverse outcomes: the ORBIT-AF II Registry. J Am Coll Cardiol. 2016;68(24):2597-2604. PubMed 31. Fauchier L, Philippart R, Clementy N, et al. How to define valvular atrial fibrillation? Arch Cardiovasc Dis. 2015;108(10):530-539. PubMed 32. Di Biase L. Use of direct oral anticoagulants in patients with atrial fibrillation and valvular heart lesions. J Am Heart Assoc. 2016;5(2). PubMed 33. Kearon C, Akl EA, Ornelas J, et al. Antithrombotic therapy for VTE disease: CHEST guideline and expert panel report. Chest. 2016;149(2):315-352. PubMed 34. Larock AS, Mullier F, Sennesael AL, et al. Appropriateness of prescribing dabigatran etexilate and rivaroxaban in patients with nonvalvular atrial fibrillation: a prospective study. Ann Pharmacother. 2014;48(10):1258-1268. PubMed
Direct-acting oral anticoagulants (DOACs) have been introduced into clinical use for stroke prevention in patients with nonvalvular atrial fibrillation (NVAF), prevention of venous thrombosis after hip or knee surgery, and treatment of deep vein thrombosis (DVT) and pulmonary embolism (PE).1-7 Advantages of DOACs over warfarin are often stated as fixed dosing, minor drug and food interactions, wider therapeutic index, and no need for laboratory test monitoring.1,8 Yet, recommended DOAC dosages vary by renal function and therapeutic indications. Dosing recommendations for prevention of stroke in patients with NVAF are based on estimated creatinine clearance (dabigatran, rivaroxaban, edoxaban), age (apixaban), weight (apixaban, edoxaban), serum creatinine level (apixaban, edoxaban), and presence of cirrhosis by Child-Pugh class9,10 (apixaban, edoxaban).4-6,11,12 Dosing recommendations based on coadministration of strong CYP34A and P-glycoprotein inhibitors or inducers vary by DOAC. In addition, dabigatran cannot be crushed and must be stored in its original packaging, and rivaroxaban should be taken with food when the dose is over 10 mg.
We studied DOAC prescribing in adults admitted to a large academic medical center by comparing initial prescribed dosing with FDA-approved prescribing information. We hypothesized that the complexity of DOAC dosing may not be recognized by prescribers.
METHODS
Our study protocol was approved by the Committee on Human Research (Institutional Review Board) of the University of California San Francisco.
Data Collection
We used electronic medical records (EMRs) to identify adult inpatients who were prescribed a DOAC (apixaban, dabigatran, edoxaban, or rivaroxaban) at the University of California San Francisco Medical Center, a large academic hospital, between July 1, 2014 and June 30, 2015. Demographic and medical information related to therapeutic indications, contraindications, and indications for dose adjustments were collected and included diagnoses classified by International Classification of Diseases, Ninth Revision (ICD-9) and Tenth Revision (ICD-10) for venous thromboses; phlebitis or thrombophlebitis; PE or venous embolism; atrial arrhythmias; surgical procedures; cirrhosis and/or ascites or liver disease; coagulopathies; artificial heart valves or implanted devices; prior use of medications including parenteral anticoagulants; and laboratory data obtained before the first DOAC order (serum creatinine level, estimated glomerular filtration rate [eGFR] determined by Chronic Kidney Disease Epidemiology Collaboration,13 international normalized ratio, or, if available, activated partial thromboplastin time and bilirubin level). Creatinine clearance was calculated with the Cockcroft-Gault method14 using total body weight, per drug label recommendation. Child-Pugh class was calculated if cirrhosis was diagnosed.10 DOAC dose, frequency, dosing directions, and prescriber medical specialty were determined.
Accuracy of search results was confirmed by review of the first 200 patients’ records. Records were manually reviewed for encounters lacking ICD-9/10 codes and approved DOAC indications (30%) and encounters having multiple coded diagnostic indications (to identify the indication). ICD-9 codes for venous thrombosis were reviewed to differentiate acute from chronic events.
Data Analysis
The main outcome was concordance or discordance between the first DOAC prescribing order and the FDA-approved prescribing information at the time. Initial classification, performed by 2 independent reviewers (a pharmacist and a physician, or 2 pharmacists), was followed by adjudication and individual record review (by 2 independent reviewers) of all initial prescribing orders classified as discordant. A third reviewer adjudicated any disagreement. Records and notes were reviewed to identify stated or potential reasons for dosing variation and pre-admission prescriptions. Data are presented as means and standard deviations (SDs) and as raw numbers and percentages. Differences in patient characteristics by DOAC or therapeutic indication were determined by analysis of variance (ANOVA) with Bonferroni correction for post hoc comparisons. Dosing information was categorized as the same as recommended, lower than recommended, higher than recommended, or avoid drug use (drug–drug or drug–disease interaction), per FDA-approved prescribing information, and χ2 tests were used to determine whether variation in dosing occurred by individual DOAC, therapeutic indication, or prescriber specialty. Relationships between dosing variation and age or renal function were tested by ANOVA with Bonferroni correction for post hoc comparisons.
RESULTS
Table 1There were 635 admissions with apixaban, dabigatran, or rivaroxaban prescribed for 508 patients (Table 1). Edoxaban was not on the formulary and not prescribed during the period studied. The therapeutic indication was prevention of embolic stroke in patients with atrial fibrillation/flutter or AF (465 admissions, or 73%, with valvular disease and/or tissue valve in 35), chronic DVT (67 admissions, or 11%, with active malignancy in 14), acute DVT (32 admissions, with malignancy in 2), chronic PE (23 admissions, with malignancy in 3), acute PE (19 admissions, with malignancy in 4), and DVT prevention after hip or knee surgery (19 admissions). DOACs were prescribed for unapproved indications in 10 admissions, and these were excluded from further analysis (mural thrombus in 3 admissions, low ejection fraction in 2, bedrest immobilization in 2, aortic aneurysm in 1, thrombocytosis in 1, and extensive superficial venous thrombosis in 1) (Table 2).
Table 2
Patients with AF were older with lower creatinine clearance compared to patients with other diagnoses. Mean (SD) patient age was 72.1 (12.7) years for AF, 53.1 (10.9) years for chronic PE, 55.5 (14) years for acute PE, 56.4 (15.9) years for chronic DVT, 57.9 (18.4) years for acute DVT, and 61.4 (11.6) years for DVT prevention after hip or knee surgery (P < 0.0001 for all comparisons). Mean (SD) estimated creatinine clearance was 76.8 (43.5) mL/min for AF, 92.4 (44.4) mL/min for DVT prevention after hip or knee surgery, 111 (53) mL/min for chronic DVT, 118 (55) mL/min for acute DVT, 126 (60) mL/min for chronic PE, and 127 (54) mL/min for acute PE (P < 0.0001 for all comparisons). Differences between patient groups by therapeutic indication were not detected for weight, body mass index, or serum creatinine level.
The most frequent deviation from prescribing recommendations was omission of directions to administer rivaroxaban with food—93% (248/268) of orders—but not for DVT prevention after hip or knee surgery, for which the 10-mg dose is appropriately administered without food. Doses were the same as recommended for 82% of apixaban orders, 84% of rivaroxaban orders, and 93% of initial dabigatran orders (P < 0.05 for differences; Table 3). Dosages not concordant with FDA recommendations were prescribed in 44 (18.1%) of 243 apixaban orders, 41 (14.3%) of 286 rivaroxaban orders, and 7 (7.2%) of 89 initial dabigatran orders. Lower than recommended doses were more common than higher than recommended doses (Table 3, Figure 1): 15.2% versus 2.1% of apixaban orders, 9.4% versus 3.5% of rivaroxaban orders, and 4.2% versus 1.0% of initial dabigatran orders (P < 0.05). Failure to avoid drug use (for potential drug–drug or drug–disease interactions) was uncommon (1%-2%). There were more deviations from recommended doses for patients with AF or DVT prevention after hip or knee surgery than for patients with acute or chronic PE or acute DVT (Table 3). No significant differences were detected between prescribed and recommended doses by prescriber specialty.
Table 3In most cases, a reason for deviating from FDA dosing recommendations was not stated in the EMR. The exception was fluctuating renal function, which was cited in 8 cases.
Figure
For apixaban, patients who were prescribed lower than recommended doses were older than those prescribed recommended doses: mean (SD), 78.1 (12.2) years versus 71 (13.6) years (P = 0.003). Seventy-six percent of those prescribed lower than recommended doses were older than 75. Prescriptions for apixaban at lower than recommended doses were continuations of prior outpatient prescriptions in 20 of 37 cases (almost half), and in 12 cases (one-fourth) antiplatelet drugs were coprescribed (aspirin in 10 cases, clopidogrel in 1, prasugrel in 1). For rivaroxaban, older age was associated with both lower than recommended dosing (P = 0.003) and higher than recommended dosing (P < 0.001). Variations from prescribing recommendations were continuations of outpatient rivaroxaban doses in about two-thirds (26 of 41; 63.4 %) with 13 receiving antiplatelet drugs. For dabigatran, 6 of 7 orders not in agreement with recommendations were continuations of outpatient dosing.
The specific equation used to estimate renal function also had the potential to lead to dosing errors. Among the 41 rivaroxaban patients categorized as receiving doses discordant with recommendations, 8 would have had an inappropriate DOAC dose if eGFR were used instead of eCrCL as recommended. No relationships were detected for other patient variables/measures and dosing deviations from recommendations.
DISCUSSION
We examined initial hospital orders for DOACs in adults admitted to a single academic medical center during 2014-2015. Dabigatran, apixaban and rivaroxaban were prescribed for prevention of stroke in patients with atrial fibrillation/flutter (AF) in three quarters of the encounters similar to national patterns. (15) Prescribing departures from FDA-approved recommendations ranged from failure to prescribe rivaroxaban with food to failure to recognize drug-drug interactions in 1% to 2%. Unexpectedly, lower than recommended dosing was more common than higher than recommended dosing of the three DOACs.
Rivaroxaban bioavailability is dose dependent with the presence of food required to enhance absorption for doses over 10 mg that are used for prevention of stroke in patients with non-valvular AF or treatment of DVT or PE.5,16 Peak rivaroxaban concentrations are 75% higher and the total area under the concentration vs. time curve after dosing is 40% higher when rivaroxaban is administered with high fat high calorie meals compared to the fasting state.16 If rivaroxaban is not administered with food, drug concentrations and pharmacologic effects may be less than in clinical trials that specified co-administration with food.17-19 A small survey of outpatients receiving rivaroxaban found that 23% reported taking it without food.20 With electronic pharmacy systems in almost all hospitals and electronic prescriber order entry in most, automated addition of directions for rivaroxaban administration with food for doses over 10 mg to labels or dispensing instructions could easily correct this deviation from recommended practice.
Lower than recommended doses were prescribed in 9.4% of orders for rivaroxaban and 15.2% of orders for apixaban, with dose-deviations often appearing to be a continuation of outpatient doses. Patients 75 years or older were more likely to receive lower than recommended dosing of apixaban. Reductions in apixaban doses from 5 mg twice daily to 2.5 mg twice daily are recommended in patients with non-valvular AF with two of the following criteria: age ≥80 y, weight ≤60 kg, serum creatinine ≥1.5 mg/dL or co-administration of a strong PgP inhibitor to a patient without 2 of the 3 dose reduction criteria. Our study was not designed to determine reasons for under-dosing, but we speculate that clinicians may have considered patients aged 75-79 years to be similar to those 80 years of age or older, or, older and not as healthy as those enrolled in randomized trials.21-25 The median age of our patients with AF receiving apixaban was 75y (interquartile range of 16) vs 70y ( interquartile range 63-76) in the pivotal trial comparing warfarin to apixaban.21 Renal function was also lower with 37% having eCrCL below 50 mL/min compared to 17% in ARISTOTLE. (21). Twenty-six percent of our apixaban-treated AF patients qualified for the lower 2.5 mg twice daily compared to only 5% of ARISTOTLE participants,21 further suggesting differences between patients in our sample compared to randomized trial participants.
Concerns regarding bleeding or falls in older patients, may also have contributed to lower than recommended doses. Recent analyses of patients at risk for falls confirmed that increased risk of falling was associated with more bone fractures, bleeding and all-cause death but not stroke or systemic emboli, and with less severe bleeding with the DOAC edoxaban compared to warfarin.26 While a rationale for personalized or lower than recommended dosing of apixaban may exist in very old patients and those at risk of falls and bleeding, more data are needed to determine outcomes of lower than recommended doses of DOACs before such an approach can be endorsed. Monitoring of anticoagulant effect in patients who receive doses lower than those investigated in clinical trials could provide important information. The assays that measure DOAC effects are likely to be more available because of the use of reversal agents in the setting of bleeding with DOACs.27
We had anticipated higher than recommended dosing for rivaroxaban as recommendations are based on creatinine clearance while laboratories routinely report estimated glomerular filtration rate (eGFR) that can provide higher estimates of renal clearance and estimated DOAC doses in older and smaller individuals.28 Higher than recommended dosing was found in only 3.5% of our sample. In half, eGFR estimates were higher than creatinine clearance estimates. An international postmarketing registry of rivaroxaban use for the prevention of stroke in patients with NVAF, which included outpatients, found that 36% of those with creatinine clearances below 50 mL/min received a dose higher than recommended, and 15% received a dose lower than expected.29 A more recent outpatient registry report on patients with NVAF, in which apixaban, dabigatran, or rivaroxaban was administered, found that overall 9.4% received a dose lower than recommended, and 3.4% were overdosed, with a similar percentage (34%) of rivaroxaban patients with creatinine clearance of 15 to 50 mL/min receiving higher than recommended dosing.30 The lower rate of higher-than-recommended doses that we observed may have been related to the routine measurement of serum creatinine and attention to dosing adjustments for renal function in the inpatient setting compared to the outpatient setting. In addition, renal function data may not be available to outpatient pharmacies, limiting potential input on dosing recommendations. At least one cardiac society recommends monitoring of renal function in patients treated with DOACs, annually in patients with normal estimated creatinine clearance and more frequently (at intervals in months equal to the creatinine clearance divided by 10) in patients with abnormal creatinine clearance.11 A hospital encounter provides an opportunity to assess or reassess renal status to optimize DOAC dosing.
Dabigatran was the first DOAC introduced into use in the United States with the same dose recommended for prevention of stroke in patients with AF or venous thromboembolic disease with reductions for creatinine clearance below 30 mL/min or creatinine clearance between 30 and 50 mL/min and concomitant use of the potent P-glycoprotein inhibitor dronedarone or systemic ketoconazole. The relative simplicity of dosing may have been responsible for the lowest rate of prescribing outside of recommendations observed in this study, but the low dabigatran use limits analyses of contributing factors.
Failure to avoid drug use in combination with use of strong P-glycoprotein inducers or inhibitors was infrequent but should be preventable. Current prescribing recommendations refer to “strong” P-glycoprotein inhibitors and list different specific agents that interact with each DOAC without a standardized definition or classification. Standardized classifications or reference sources would be helpful.
Our primary goal in this study was to compare initial prescribed dosing of DOACs with FDA-approved prescribing directions. However, therapeutic indication data warrant discussion. In our sample, 7.5% of patients with AF had bioprosthetic valves or recent mitral valve repair or replacement. Using the NVAF definition found in the 2014 AHA/ACC/HRS (American Heart Association, American College of Cardiology, Heart Rhythm Society) AF guidelines1—“absence of rheumatic mitral valve disease, a prosthetic heart valve, or mitral valve repair”—these patients would not appear to be candidates for DOACs. However, arguments have been made that a bioprosthetic heart valve or native valve after valve repair does not have a risk profile for thromboembolism that differs from other forms of NVAF and would be equally responsive to DOAC therapy.31 Data are sparse, but retrospective subanalyses of limited numbers of patients with valvular disease (including bioprosthesis and mitral repair patients but excluding mechanical valve patients) enrolled in the pivotal DOAC studies support this conclusion.32 For the first months after biological valve replacement (including catheter-based valve replacement), recent European guidelines recommend vitamin K antagonists but also state, “NOACs probably deliver the same protection.”8 DOACs were also used for management of venous thromboembolic disease (both acute and chronic) in patients with active cancer. Our data predate the most recent American College of Chest Physician guidelines on treatment of venous thromboembolism in patients with cancer, which provide grade 2B recommendations for use of low-molecular-weight heparin (LMWH) over vitamin K antagonists and grade 2C recommendations for use of LMWH over dabigatran, rivaroxaban, apixaban, or edoxaban.33
Our study had several limitations. First, data were from a single US academic medical center, though similar rates of prescribing deviation from recommendations have been reported for rivaroxaban and dabigatran in NVAF patients in other countries.29,34 Second, therapeutic indications may have been misclassified because of errors, incomplete EMR data, or multiple indications. Third, we analyzed the first DOAC order and not dispensing information or subsequent corrections. Therefore, deviations from recommendations should not be interpreted as errors that reached patients. We evaluated dosing based on the measures used at the time of hospital admission, noting that, in a significant fraction of deviations from recommended doses, they represented continuations of outpatient doses when renal function or weight may have differed, and it is unknown whether patients were counseled to take rivaroxaban with food in the outpatient setting. Fourth, the number of patients with acute DVT was small, so firm conclusions cannot be drawn for this specific population. Fifth, our estimates of off-label dosing may have been underestimates, as data on cancer and cancer activity or cardiac valvular disease may not have been complete.
CONCLUSION
Healthcare professionals are prescribing DOACs in ways that differ from recommendations. These differences may reflect the older ages and reduced renal function of clinical populations relative to randomized clinical trial groups, but they could also potentially alter clinical efficacy. Our findings support the need to evaluate the appropriateness and dosing of DOACs at each encounter and to determine the outcomes of patients treated with lower than recommended doses of DOACs and the outcomes of DOAC-treated patients with bioprostheses or active malignancies.
Acknowledgment
The authors thank Tobias Schmelzinger for electronic data extraction and compilation and University of California San Francisco students Eduardo De La Torre Cruz (School of Pharmacy) and Carlos Mikell (School of Medicine) for assistance with data review.
Disclosure
Dr. Schwartz reports receiving personal fees from Bristol-Myers Squibb and Amgen and grants from Bristol-Myers Squibb and Pfizer, outside the submitted work. The other authors have nothing to report.
References
1. January CT, Wann LS, Alpert JS, et al. 2014 AHA/ACC/HRS guideline for the management of patients with atrial fibrillation: executive summary. A report of the American College of Cardiology/American Heart Association Task Force on Practice Guidelines and the Heart Rhythm Society. J Am Coll Cardiol. 2014;64(21):2246-2280. PubMed 2. Saraf K, Morris PD, Garg P, Sheridan P, Storey R. Non–vitamin K antagonist oral anticoagulants (NOACs): clinical evidence and therapeutic considerations. Postgrad Med J. 2014;90(1067):520-528. PubMed 3. Yeh CH, Gross PL, Weitz JI. Evolving use of new oral anticoagulants for treatment of venous thromboembolism. Blood. 2014;124(7):1020-1028. PubMed 4. Pradaxa website. https://www.pradaxa.com. Accessed June 1, 2017. 5. Xarelto website. https://www.xarelto-us.com. Accessed June 1, 2017. 6. Eliquis website. http://www.eliquis.com. Accessed June 1, 2017. 7. Savaysa [prescribing information]. Tokyo, Japan: Daiichi Sankyo; 2015. 8. Kirchhof P, Benussi S, Kotecha D, et al. 2016 ESC guidelines for the management of atrial fibrillation developed in collaboration with EACTS. Eur Heart J. 2016;37(38):2893-2962. PubMed 9. Child C, Turcotte J. Surgery and portal hypertension. In: Child CG, ed. The Liver and Portal Hypertension. Philadelphia, PA: Saunders; 1964:50-64. PubMed 10. Pugh RN, Murray-Lyon IM, Dawson JL, Pietroni MC, Williams R. Transection of the oesophagus for bleeding oesophageal varices. Br J Surg. 1973;60(8):646-649. PubMed 11. Heidbuchel H, Verhamme P, Alings M, et al. Updated European Heart Rhythm Association practical guide on the use of non–vitamin K antagonist anticoagulants in patients with non-valvular atrial fibrillation. Europace. 2015;17(10):1467-1507. PubMed 12. Savaysa website. https://savaysahcp.com. Accessed June 1, 2017. 13. Levey AS, Stevens LA, Schmid CH, et al; CKD-EPI (Chronic Kidney Disease Epidemiology Collaboration). A new equation to estimate glomerular filtration rate. Ann Intern Med. 2009;150(9):604-612. PubMed 14. Cockcroft DW, Gault MH. Prediction of creatinine clearance from serum creatinine. Nephron. 1976;16(1):31-41. PubMed 15. Rose AJ, Reisman JI, Allen AL, Miller DR. Potentially inappropriate prescribing of direct-acting oral anticoagulants in the Veterans Health Administration. Am J Pharm Benefits. 2016;4(4):e75-e80. 16. Stampfuss J, Kubitza D, Becka M, Mueck W. The effect of food on the absorption and pharmacokinetics of rivaroxaban. Int J Clin Pharmacol Ther. 2013;51(7):549-561. PubMed 17. Patel MR, Mahaffey KW, Garg J, et al; ROCKET AF Investigators. Rivaroxaban versus warfarin in nonvalvular atrial fibrillation. N Engl J Med. 2011;365(10):883-891. PubMed 18. EINSTEIN Investigators, Bauersachs R, Berkowitz SD, et al. Oral rivaroxaban for symptomatic venous thromboembolism. N Engl J Med. 2010;363(26):2499-2510. PubMed 19. EINSTEIN-PE Investigators, Büller HR, Prins MH, et al. Oral rivaroxaban for the treatment of symptomatic pulmonary embolism. N Engl J Med. 2012;366(14):1287-1297. PubMed 20. Simon J, Hawes E, Deyo Z, Bryant-Shilliday B. Evaluation of prescribing and patient use of target-specific oral anticoagulants in the outpatient setting. J Clin Pharm Ther. 2015;40(5):525-530. PubMed 21. Granger CB, Alexander JH, McMurray JJ, et al; ARISTOTLE Committees and Investigators. Apixaban versus warfarin in patients with atrial fibrillation. N Engl J Med. 2011;365(11):981-992. PubMed 22. Ruff CT, Giugliano RP, Braunwald E, et al. Comparison of the efficacy and safety of new oral anticoagulants with warfarin in patients with atrial fibrillation: a meta-analysis of randomised trials. Lancet. 2014;383(9921):955-962. PubMed 23. van der Hulle T, Kooiman J, den Exter PL, Dekkers OM, Klok FA, Huisman MV. Effectiveness and safety of novel oral anticoagulants as compared with vitamin K antagonists in the treatment of acute symptomatic venous thromboembolism: a systematic review and meta-analysis. J Thromb Haemost. 2014;12(3):320-328. PubMed 24. Schuh T, Reichardt B, Finsterer J, Stöllberger C. Age-dependency of prescribing patterns of oral anticoagulant drugs in Austria during 2011–2014. J Thromb Thrombolysis. 2016;42(3):447-451. PubMed 25. Stöllberger C, Brooks R, Finsterer J, Pachofszky T. Use of direct-acting oral anticoagulants in nonagenarians: a call for more data. Drugs Aging. 2016;33(5):315-320. PubMed 26. Steffel J, Giugliano RP, Braunwald E, et al. Edoxaban versus warfarin in atrial fibrillation patients at risk of falling: ENGAGE AF-TIMI 48 analysis. J Am Coll Cardiol. 2016;68(11):1169-1178. PubMed 27. Ruff CT, Giugliano RP, Antman EM. Management of bleeding with non–vitamin K antagonist oral anticoagulants in the era of specific reversal agents. Circulation. 2016;134(3):248-261. PubMed 28. Schwartz JB. Potential impact of substituting estimated glomerular filtration rate for estimated creatinine clearance for dosing of direct oral anticoagulants. J Am Geriatr Soc. 2016;64(10):1996-2002. PubMed 29. Camm AJ, Amarenco P, Haas S, et al; XANTUS Investigators. XANTUS: a real-world, prospective, observational study of patients treated with rivaroxaban for stroke prevention in atrial fibrillation. Eur Heart J. 2016;37(14):1145-1153. PubMed 30. Steinberg BA, Shrader P, Thomas L, et al; ORBIT-AF Investigators and Patients. Off-label dosing of non–vitamin K antagonist oral anticoagulants and adverse outcomes: the ORBIT-AF II Registry. J Am Coll Cardiol. 2016;68(24):2597-2604. PubMed 31. Fauchier L, Philippart R, Clementy N, et al. How to define valvular atrial fibrillation? Arch Cardiovasc Dis. 2015;108(10):530-539. PubMed 32. Di Biase L. Use of direct oral anticoagulants in patients with atrial fibrillation and valvular heart lesions. J Am Heart Assoc. 2016;5(2). PubMed 33. Kearon C, Akl EA, Ornelas J, et al. Antithrombotic therapy for VTE disease: CHEST guideline and expert panel report. Chest. 2016;149(2):315-352. PubMed 34. Larock AS, Mullier F, Sennesael AL, et al. Appropriateness of prescribing dabigatran etexilate and rivaroxaban in patients with nonvalvular atrial fibrillation: a prospective study. Ann Pharmacother. 2014;48(10):1258-1268. PubMed
Return visit (RV) rate is a quality measure commonly used in the emergency department (ED) setting. This metric may represent suboptimal care at the index ED visit.1-5 Although patient- and visit-level factors affecting ED RVs have been evaluated,1,3,4,6-9 hospital-level factors and factors of a hospital’s patient population that may play roles in ED RV rates have not been examined. Identifying the factors associated with increased RVs may allow resources to be designated to areas that improve emergent care for children.10
Hospital readmission rates are a closely followed quality measure and are linked to reimbursement by the federal government, but a recent study found the influence a hospital can have on this marker may be mitigated by the impact of the social determinates of health (SDHs) of the hospital’s patient population.11 That study and others have prompted an ongoing debate about adjusting quality measures for SDHs.12,13 A clearer understanding of these interactions may permit us to focus on factors that can truly lead to improvement in care instead of penalizing practitioners or hospitals that provide care to those most in need.
Prior work has identified several SDHs associated with higher ED RV rates in patient- or visit-level analyses.3,11,14 We conducted a study of hospital-level characteristics and characteristics of a hospital’s patient population to identify potentially mutable factors associated with increased ED RV rates that, once recognized, may allow for improvement in this quality measure.
PATIENTS AND METHODS
This study was not considered human subjects research in accordance with Common Rule 45 CFR§46.104(f) and was evaluated by the Ann and Robert H. Lurie Children’s Hospital and Northwestern University Feinberg School of Medicine Institutional Review Boards and deemed exempt from review.
Study Population and Protocol
Our study had 2 data sources (to be described in detail): the Pediatric Health Information System (PHIS) and a survey of ED medical directors of the hospitals represented within PHIS. Hospitals were eligible for inclusion in the study if their data (1) met PHIS quality control standards for ED patient visits as determined by internal data assurance processes incorporated in PHIS,3,14,15 (2) included data only from an identifiable single main ED, and (3) completed the ED medical director’s survey.
PHIS Database
PHIS, an administrative database managed by Truven Health Analytics, includes data from ED, ambulatory surgery, observation, and inpatient encounters across Children’s Hospital Association member children’s hospitals in North America. Data are subjected to validity checks before being included in the database.16 PHIS assigns unique patient identifiers to track individual patient visits within participating institutions over time.
Hospitals were described by percentages of ED patients in several groups: age (<1, 1-4, 5-9, 10-14, and 15-18 years)17; sex; race/ethnicity; insurance type (commercial, government, other); ED International Classification of Diseases, Ninth Edition (ICD-9) diagnosis code–based severity classification system score (1-2, low severity; 3-5, high severity)18; complex chronic condition presence at ED visits in prior year14,19-21; home postal (Zip) code median household income from 2010 US Census data compared with Federal Poverty Level (<1.5, 1.5-2, 2-3, and >3 × FPL)17; and primary care physician (PCP) density in Federal Health Service Area of patient’s home address as reported by Dartmouth Atlas of Health Care modeled by quartiles.22 Density of PCPs—general pediatricians, family practitioners, general practitioners, and general internists—is calculated as number of PCPs per 100,000 residents. We used PCP density to account for potential care provided by any of the PCPs mentioned. We also assessed, at hospital level, index visit arrival time (8:01 am to 4:00 pm; 4:01 pm to 12:00 am; 12:01 am to 8:00 am) and index visit season.23
ED Medical Director Survey
A web-based survey was constructed in an iterative process based on literature review and expert opinion to assess hospital-level factors that may impact ED RV rates.3,7,24-26 The survey was piloted at 3 institutions to refine its structure and content.
The survey included 15 close-ended or multiple-choice questions on ED environment and operations and 2 open-ended questions, “What is the largest barrier to reducing the number of return visits within 72 hours of discharge from a previous ED visit?” and “In your opinion, what is the best way of reducing the number of the return visits within 72 hours of previous ED visit ?” (questionnaire in Supplemental material). Hospital characteristics from the survey included total clinical time allotment, or full-time equivalent (FTE), among all physicians, pediatric emergency medicine (PEM) fellowship-trained physicians, and all other (non-PEM) physicians. The data were standardized across sites by calculating FTE-per-10,000-visits values for each hospital; median duration of ED visit for admitted and discharged patients; median time from arrival to ED physician evaluation; rate of leaving without being seen; discharge educational material authorship and age specificity; follow-up visit scheduling procedure; and percentage of ED patients for whom English was a second language.
Responses to the 2 open-ended questions were independently categorized by Drs. Pittsenbarger and Alpern. Responses could be placed in more than 1 category if multiple answers to the question were included in the response. Categorizations were compared for consistency, and any inconsistencies were resolved by the consensus of the study investigators.
Outcome Measures From PHIS Database
All ED visits within a 12-month period (July 1, 2013–June 30, 2014) by patients younger than 18 years at time of index ED visit were eligible for inclusion in the study. An index visit was defined as any ED visit without another ED visit within the preceding 72 hours. The 72-hour time frame was used because it is the most widely studied time frame for ED RVs.5 Index ED visits that led to admission, observation status, death, or transfer were excluded.
The 2 primary outcomes of interest were (1) RVs within 72 hours of index ED visit discharge and (2) RVs within 72 hours that resulted in hospital admission or observation status at the next ED visit (RVA).7,9,27-30 For patients with multiple ED revisits within 72 hours, only the first was assessed. There was a 72-hour minimum between index visits for the same patient.
Statistical Analyses
To determine hospital groups based on RV and RVA rates, we adjusted RV and RVA rates using generalized linear mixed-effects models, controlling for clustering and allowing for correlated data (within hospitals), nonconstant variability (across hospitals), and non-normally distributed data, as we did in a study of patient-level factors associated with ED RV and RVA.3 For each calculated rate (RV, RVA), the hospitals were then classified into 3 groups based on whether the hospital’s adjusted RV and RVA rates were outside 2 SDs from the mean, below the 5th or above the 95th percentile, or within that range. These groups were labeled lowest outliers, highest outliers, and average-performing hospitals.
After the groups of hospitals were determined, we returned to using unadjusted data to statistically analyze them. We summarized continuous variables using minimum and maximum values, medians, and interquartile ranges (IQRs). We present categorical variables using counts and percentages. To identify hospital characteristics with the most potential to gain from improvement, we also analyzed associations using 2 collapsed groups: hospitals with RV (or RVA) rates included in the average-performing and lowest outlier groups and hospitals within the highest outlier group. Hospital characteristics and hospital’s patient population characteristics from the surveys are summarized based on RV and RVA rate groups. Differences in distributions among continuous variables were assessed by Kruskal-Wallis 1-way analysis of variance. Chi-square tests were used to evaluate differences in proportions among categorical variables. All statistical analyses were performed with SAS Version 9.4 (SAS Institute); 2-sided P < 0.05 was considered statistically significant.
RESULTS
Return Visit Rates and Hospital ED Site Population Characteristics
Twenty-four of 35 (68%) eligible hospitals that met PHIS quality control standards for ED patient visits responded to the ED medical director survey. The included hospitals that both met quality control standards and completed the survey had a total of 1,456,377 patient visits during the study period. Individual sites had annual volumes ranging from 26,627 to 96,637 ED encounters. The mean RV rate across the institutions was 3.7% (range, 3.0%-4.8%), and the mean RVA rate across the hospitals was 0.7% (range, 0.5%-1.1%) (Figure).
Figure
There were 5 hospitals with RV rates less than 2 SDs of the mean rate, placing them in the lowest outlier group for RV; 13 hospitals with RV rates within 2 SDs of the mean RV rate, placing them in the average-performing group; and 6 hospitals with RV rates above 2 SDs of the mean, placing them in the highest outlier group. Table 1 lists the hospital ED site population characteristics among the 3 RV rate groups. Hospitals in the highest outlier group served populations with higher proportions of patients with insurance from a government payer, lower proportions of patients covered by a commercial insurance plan, and higher proportion of patients with lower median household incomes.
Table 1 In the RVA analysis, there were 6 hospitals with RVA rates less than 2 SDs of the mean RVA rate (lowest outliers); 14 hospitals with RVA rates within 2 SDs of the mean RVA rate (average performers); and 4 hospitals with RVA rates above 2 SDs of the mean RVA rate (highest outliers). When using these groups based on RVA rate, there were no statistically significant differences in hospital ED site population characteristics (Supplemental Table 1).
RV Rates and Hospital-Level Factors Survey Characteristics
Table 2 lists the ED medical director survey hospital-level data among the 3 RV rate groups. There were fewer FTEs by PEM fellowship-trained physicians per 10,000 patient visits at sites with higher RV rates (Table 2). Hospital-level characteristics assessed by the survey were not associated with RVA rates (Supplemental Table 2).
Table 2
Evaluating characteristics of hospitals with the most potential to gain from improvement, hospitals with the highest RV rates (highest outlier group), compared with hospitals in the lowest outlier and average-performing groups collapsed together, persisted in having fewer PEM fellowship-trained physician FTEs per patient visit (Table 3). A similar collapsed analysis of RVA rates demonstrated that hospitals in the highest outlier group had longer-wait-to-physician time (81 minutes; IQR, 51-105 minutes) compared with hospitals in the other 2 groups (30 minutes; IQR, 19-42.5 minutes) (Table 3).
Table 3 In response to the first qualitative question on the ED medial director survey, “In your opinion, what is the largest barrier to reducing the number of return visits within 72 hours of discharge from a previous ED visit?”, 15 directors (62.5%) reported limited access to primary care, 4 (16.6%) reported inadequate discharge instructions and/or education provided, and 3 (12.5%) reported lack of access to specialist care. To the second question, “In your opinion, what is the best way of reducing the number of the return visits within 72 hours of previous ED visit for the same condition?”, they responded that RVs could be reduced by innovations in scheduling primary care or specialty follow-up visits (19, 79%), improving discharge education and instructions (6, 25%), and identifying more case management or care coordination (4, 16.6%).
DISCUSSION
Other studies have identified patient- and visit-level characteristics associated with higher ED RV and RVA rates.3,8,9,31 However, as our goal was to identify possible modifiable institutional features, our study examined factors at hospital and population-served levels (instead of patient or visit level) that may impact ED RV and RVA rates. Interestingly, our sample of tertiary-care pediatric center EDs provided evidence of variability in RV and RVA rates. We identified factors associated with RV rates related to the SDHs of the populations served by the ED, which suggests these factors are not modifiable at an institution level. In addition, we found that the increased availability of PEM providers per patient visit correlated with fewer ED RVs.
Hospitals serving ED populations with more government-insured and fewer commercially insured patients had higher rates of return to the ED. Similarly, hospitals with larger proportions of patients from areas with lower median household incomes had higher RV rates. These factors may indicate that patients with limited resources may have more frequent ED RVs,3,6,32,33 and hospitals that serve them have higher ED RV rates. Our findings complement those of a recent study by Sills et al.,11 who evaluated hospital readmissions and proposed risk adjustment for performance reimbursement. This study found that hospital population-level race, ethnicity, insurance status, and household income were predictors of hospital readmission after discharge.
Of note, our data did not identify similar site-level attributes related to the population served that correlated with RVA rates. We postulate that the need for admission on RV may indicate an inherent clinical urgency or medical need associated with the return to the ED, whereas RV without admission may be related more to patient- or population-level sociodemographic factors than to quality of care and clinical course, which influence ED utilization.1,3,30 EDs treating higher proportions of patients of minority race or ethnicity, those with fewer financial resources, and those in more need of government health insurance are at higher risk for ED revisits.
We observed that increased PEM fellowship-trained physician staffing was associated with decreased RV rates. The availability of specialty-trained physicians in PEM may allow a larger proportion of patients treated by physicians with honed clinical skills for the patient population. Data from a single pediatric center showed PEM fellowship-trained physicians had admission rates lower than those of their counterparts without subspecialty fellowship training.34 The lower RV rate for this group in our study is especially interesting in light of previously reported lower admission rates at index visit in PEM trained physicians. With lower index admission rates, it may have been assumed that visits associated with PEM trained physician care would have an increased (rather than decreased) chance of RV. In addition, we noted the increased RVA rates were associated with longer waits to see a physician. These measures may indicate the effect of institutional access to robust resources (the ability to hire and support more specialty-trained physicians). These novel findings warrant further evaluation, particularly as our sample included only pediatric centers.
Our survey data demonstrated the impact that access to care has on ED RV rates. The ED medical directors indicated that limited access to outpatient appointments with PCPs and specialists was an important factor increasing ED RVs and a potential avenue for interventions. As the 2 open-ended questions addressed barriers and potential solutions, it is interesting that the respondents cited access to care and discharge instructions as the largest barriers and identified innovations in access to care and discharge education as important potential remedies.
This study demonstrated that, at the hospital level, ED RV quality measures are influenced by complex and varied SDHs that primarily reflect the characteristics of the patient populations served. Prior work has similarly highlighted the importance of gaining a rigorous understanding of other quality measures before widespread use, reporting, and dissemination of results.11,35-38 With this in mind, as quality measures are developed and implemented, care should be taken to ensure they accurately and appropriately reflect the quality of care provided to the patient and are not more representative of other factors not directly within institutional control. These findings call into question the usefulness of ED RVs as a quality measure for comparing institutions.
Study Limitations
This study had several limitations. The PHIS dataset tracks only patients within each institution and does not include RVs to other EDs, which may account for a proportion of RVs.39 Our survey response rate was 68% among medical directors, excluding 11 hospitals from analysis, which decreased the study’s power to detect differences that may be present between groups. In addition, the generalizability of our findings may be limited to tertiary-care children’s hospitals, as the PHIS dataset included only these types of healthcare facilities. We also included data only from the sites’ main EDs, and therefore cannot know if our results are applicable to satellite EDs. ED staffing of PEM physicians was analyzed using FTEs. However, number of clinical hours in 1 FTE may vary among sites, leading to imprecision in this hospital characteristic.
CONCLUSION
Hospitals with the highest RV rates served populations with a larger proportion of patients with government insurance and lower household income, and these hospitals had fewer PEM trained physicians. Variation in RV rates among hospitals may be indicative of the SDHs of their unique patient populations. ED revisit rates should be used cautiously in determining the quality of care of hospitals providing care to differing populations.
1. Goldman RD, Kapoor A, Mehta S. Children admitted to the hospital after returning to the emergency department within 72 hours. Pediatr Emerg Care. 2011;27(9):808-811. PubMed 2. Cho CS, Shapiro DJ, Cabana MD, Maselli JH, Hersh AL. A national depiction of children with return visits to the emergency department within 72 hours, 2001–2007. Pediatr Emerg Care. 2012;28(7):606-610. PubMed 3. Akenroye AT, Thurm CW, Neuman MI, et al. Prevalence and predictors of return visits to pediatric emergency departments. J Hosp Med. 2014;9(12):779-787. PubMed 4. Gallagher RA, Porter S, Monuteaux MC, Stack AM. Unscheduled return visits to the emergency department: the impact of language. Pediatr Emerg Care. 2013;29(5):579-583. PubMed 5. Sørup CM, Jacobsen P, Forberg JL. Evaluation of emergency department performance—a systematic review on recommended performance and quality-in-care measures. Scand J Trauma Resusc Emerg Med. 2013;21:62. PubMed 6. Gabayan GZ, Asch SM, Hsia RY, et al. Factors associated with short-term bounce-back admissions after emergency department discharge. Ann Emerg Med. 2013;62(2):136-144.e1. PubMed 7. Ali AB, Place R, Howell J, Malubay SM. Early pediatric emergency department return visits: a prospective patient-centric assessment. Clin Pediatr (Phila). 2012;51(7):651-658. PubMed 8. Alessandrini EA, Lavelle JM, Grenfell SM, Jacobstein CR, Shaw KN. Return visits to a pediatric emergency department. Pediatr Emerg Care. 2004;20(3):166-171. PubMed 9. Goldman RD, Ong M, Macpherson A. Unscheduled return visits to the pediatric emergency department—one-year experience. Pediatr Emerg Care. 2006;22(8):545-549. PubMed 10. Berry JG, Toomey SL, Zaslavsky AM, et al. Pediatric readmission prevalence and variability across hospitals. JAMA. 2013;309(4):372-380. PubMed 11. Sills MR, Hall M, Colvin JD, et al. Association of social determinants with children’s hospitals’ preventable readmissions performance. JAMA Pediatr. 2016;170(4):350-358. PubMed 12. Fiscella K, Burstin HR, Nerenz DR. Quality measures and sociodemographic risk factors: to adjust or not to adjust. JAMA. 2014;312(24):2615-2616. PubMed 13. Lipstein SH, Dunagan WC. The risks of not adjusting performance measures for sociodemographic factors. Ann Intern Med. 2014;161(8):594-596. PubMed 14. Berry JG, Hall DE, Kuo DZ, et al. Hospital utilization and characteristics of patients experiencing recurrent readmissions within children’s hospitals. JAMA. 2011;305(7):682-690. PubMed 15. Bourgeois FT, Monuteaux MC, Stack AM, Neuman MI. Variation in emergency department admission rates in US children’s hospitals. Pediatrics. 2014;134(3):539-545. PubMed 16. Fletcher DM. Achieving data quality. How data from a pediatric health information system earns the trust of its users. J AHIMA. 2004;75(10):22-26. PubMed 17. US Census Bureau. US Census current estimates data. 2014. https://www.census.gov/programs-surveys/popest/data/data-sets.2014.html. Accessed June 2015. 18. Alessandrini EA, Alpern ER, Chamberlain JM, Shea JA, Gorelick MH. A new diagnosis grouping system for child emergency department visits. Acad Emerg Med. 2010;17(2):204-213. PubMed 19. Feudtner C, Levin JE, Srivastava R, et al. How well can hospital readmission be predicted in a cohort of hospitalized children? A retrospective, multicenter study. Pediatrics. 2009;123(1):286-293. PubMed 20. Feinstein JA, Feudtner C, Kempe A. Adverse drug event–related emergency department visits associated with complex chronic conditions. Pediatrics. 2014;133(6):e1575-e1585. PubMed 21. Simon TD, Berry J, Feudtner C, et al. Children with complex chronic conditions in inpatient hospital settings in the United States. Pediatrics. 2010;126(4):647-655. PubMed 22. Dartmouth Medical School, Center for Evaluative Clinical Sciences. The Dartmouth Atlas of Health Care. Chicago, IL: American Hospital Publishing; 2015. 23. Kansagara D, Englander H, Salanitro A, et al. Risk prediction models for hospital readmission: a systematic review. JAMA. 2011;306(15):1688-1698. PubMed 24. Lawrence LM, Jenkins CA, Zhou C, Givens TG. The effect of diagnosis-specific computerized discharge instructions on 72-hour return visits to the pediatric emergency department. Pediatr Emerg Care. 2009;25(11):733-738. PubMed 25. National Quality Forum. National Quality Forum issue brief: strengthening pediatric quality measurement and reporting. J Healthc Qual. 2008;30(3):51-55. PubMed 26. Rising KL, Victor TW, Hollander JE, Carr BG. Patient returns to the emergency department: the time-to-return curve. Acad Emerg Med. 2014;21(8):864-871. PubMed 27. Cho CS, Shapiro DJ, Cabana MD, Maselli JH, Hersh AL. A national depiction of children with return visits to the emergency department within 72 hours, 2001–2007. Pediatr Emerg Care. 2012;28(7):606-610. PubMed 28. Adekoya N. Patients seen in emergency departments who had a prior visit within the previous 72 h—National Hospital Ambulatory Medical Care Survey, 2002. Public Health. 2005;119(10):914-918. PubMed 29. Mittal MK, Zorc JJ, Garcia-Espana JF, Shaw KN. An assessment of clinical performance measures for pediatric emergency physicians. Am J Med Qual. 2013;28(1):33-39. PubMed 30. Depiero AD, Ochsenschlager DW, Chamberlain JM. Analysis of pediatric hospitalizations after emergency department release as a quality improvement tool. Ann Emerg Med. 2002;39(2):159-163. PubMed 31. Sung SF, Liu KE, Chen SC, Lo CL, Lin KC, Hu YH. Predicting factors and risk stratification for return visits to the emergency department within 72 hours in pediatric patients. Pediatr Emerg Care. 2015;31(12):819-824. PubMed 32. Jacobstein CR, Alessandrini EA, Lavelle JM, Shaw KN. Unscheduled revisits to a pediatric emergency department: risk factors for children with fever or infection-related complaints. Pediatr Emerg Care. 2005;21(12):816-821. PubMed 33. Barnett ML, Hsu J, McWilliams J. Patient characteristics and differences in hospital readmission rates. JAMA Intern Med. 2015;175(11):1803-1812. PubMed 34. Gaucher N, Bailey B, Gravel J. Impact of physicians’ characteristics on the admission risk among children visiting a pediatric emergency department. Pediatr Emerg Care. 2012;28(2):120-124. PubMed 35. McHugh M, Neimeyer J, Powell E, Khare RK, Adams JG. An early look at performance on the emergency care measures included in Medicare’s hospital inpatient Value-Based Purchasing Program. Ann Emerg Med. 2013;61(6):616-623.e2. PubMed 36. Axon RN, Williams MV. Hospital readmission as an accountability measure. JAMA. 2011;305(5):504-505. PubMed 37. Adams JG. Ensuring the quality of quality metrics for emergency care. JAMA. 2016;315(7):659-660. PubMed 38. Payne NR, Flood A. Preventing pediatric readmissions: which ones and how? J Pediatr. 2015;166(3):519-520. PubMed 39. Khan A, Nakamura MM, Zaslavsky AM, et al. Same-hospital readmission rates as a measure of pediatric quality of care. JAMA Pediatr. 2015;169(10):905-912. PubMed
Return visit (RV) rate is a quality measure commonly used in the emergency department (ED) setting. This metric may represent suboptimal care at the index ED visit.1-5 Although patient- and visit-level factors affecting ED RVs have been evaluated,1,3,4,6-9 hospital-level factors and factors of a hospital’s patient population that may play roles in ED RV rates have not been examined. Identifying the factors associated with increased RVs may allow resources to be designated to areas that improve emergent care for children.10
Hospital readmission rates are a closely followed quality measure and are linked to reimbursement by the federal government, but a recent study found the influence a hospital can have on this marker may be mitigated by the impact of the social determinates of health (SDHs) of the hospital’s patient population.11 That study and others have prompted an ongoing debate about adjusting quality measures for SDHs.12,13 A clearer understanding of these interactions may permit us to focus on factors that can truly lead to improvement in care instead of penalizing practitioners or hospitals that provide care to those most in need.
Prior work has identified several SDHs associated with higher ED RV rates in patient- or visit-level analyses.3,11,14 We conducted a study of hospital-level characteristics and characteristics of a hospital’s patient population to identify potentially mutable factors associated with increased ED RV rates that, once recognized, may allow for improvement in this quality measure.
PATIENTS AND METHODS
This study was not considered human subjects research in accordance with Common Rule 45 CFR§46.104(f) and was evaluated by the Ann and Robert H. Lurie Children’s Hospital and Northwestern University Feinberg School of Medicine Institutional Review Boards and deemed exempt from review.
Study Population and Protocol
Our study had 2 data sources (to be described in detail): the Pediatric Health Information System (PHIS) and a survey of ED medical directors of the hospitals represented within PHIS. Hospitals were eligible for inclusion in the study if their data (1) met PHIS quality control standards for ED patient visits as determined by internal data assurance processes incorporated in PHIS,3,14,15 (2) included data only from an identifiable single main ED, and (3) completed the ED medical director’s survey.
PHIS Database
PHIS, an administrative database managed by Truven Health Analytics, includes data from ED, ambulatory surgery, observation, and inpatient encounters across Children’s Hospital Association member children’s hospitals in North America. Data are subjected to validity checks before being included in the database.16 PHIS assigns unique patient identifiers to track individual patient visits within participating institutions over time.
Hospitals were described by percentages of ED patients in several groups: age (<1, 1-4, 5-9, 10-14, and 15-18 years)17; sex; race/ethnicity; insurance type (commercial, government, other); ED International Classification of Diseases, Ninth Edition (ICD-9) diagnosis code–based severity classification system score (1-2, low severity; 3-5, high severity)18; complex chronic condition presence at ED visits in prior year14,19-21; home postal (Zip) code median household income from 2010 US Census data compared with Federal Poverty Level (<1.5, 1.5-2, 2-3, and >3 × FPL)17; and primary care physician (PCP) density in Federal Health Service Area of patient’s home address as reported by Dartmouth Atlas of Health Care modeled by quartiles.22 Density of PCPs—general pediatricians, family practitioners, general practitioners, and general internists—is calculated as number of PCPs per 100,000 residents. We used PCP density to account for potential care provided by any of the PCPs mentioned. We also assessed, at hospital level, index visit arrival time (8:01 am to 4:00 pm; 4:01 pm to 12:00 am; 12:01 am to 8:00 am) and index visit season.23
ED Medical Director Survey
A web-based survey was constructed in an iterative process based on literature review and expert opinion to assess hospital-level factors that may impact ED RV rates.3,7,24-26 The survey was piloted at 3 institutions to refine its structure and content.
The survey included 15 close-ended or multiple-choice questions on ED environment and operations and 2 open-ended questions, “What is the largest barrier to reducing the number of return visits within 72 hours of discharge from a previous ED visit?” and “In your opinion, what is the best way of reducing the number of the return visits within 72 hours of previous ED visit ?” (questionnaire in Supplemental material). Hospital characteristics from the survey included total clinical time allotment, or full-time equivalent (FTE), among all physicians, pediatric emergency medicine (PEM) fellowship-trained physicians, and all other (non-PEM) physicians. The data were standardized across sites by calculating FTE-per-10,000-visits values for each hospital; median duration of ED visit for admitted and discharged patients; median time from arrival to ED physician evaluation; rate of leaving without being seen; discharge educational material authorship and age specificity; follow-up visit scheduling procedure; and percentage of ED patients for whom English was a second language.
Responses to the 2 open-ended questions were independently categorized by Drs. Pittsenbarger and Alpern. Responses could be placed in more than 1 category if multiple answers to the question were included in the response. Categorizations were compared for consistency, and any inconsistencies were resolved by the consensus of the study investigators.
Outcome Measures From PHIS Database
All ED visits within a 12-month period (July 1, 2013–June 30, 2014) by patients younger than 18 years at time of index ED visit were eligible for inclusion in the study. An index visit was defined as any ED visit without another ED visit within the preceding 72 hours. The 72-hour time frame was used because it is the most widely studied time frame for ED RVs.5 Index ED visits that led to admission, observation status, death, or transfer were excluded.
The 2 primary outcomes of interest were (1) RVs within 72 hours of index ED visit discharge and (2) RVs within 72 hours that resulted in hospital admission or observation status at the next ED visit (RVA).7,9,27-30 For patients with multiple ED revisits within 72 hours, only the first was assessed. There was a 72-hour minimum between index visits for the same patient.
Statistical Analyses
To determine hospital groups based on RV and RVA rates, we adjusted RV and RVA rates using generalized linear mixed-effects models, controlling for clustering and allowing for correlated data (within hospitals), nonconstant variability (across hospitals), and non-normally distributed data, as we did in a study of patient-level factors associated with ED RV and RVA.3 For each calculated rate (RV, RVA), the hospitals were then classified into 3 groups based on whether the hospital’s adjusted RV and RVA rates were outside 2 SDs from the mean, below the 5th or above the 95th percentile, or within that range. These groups were labeled lowest outliers, highest outliers, and average-performing hospitals.
After the groups of hospitals were determined, we returned to using unadjusted data to statistically analyze them. We summarized continuous variables using minimum and maximum values, medians, and interquartile ranges (IQRs). We present categorical variables using counts and percentages. To identify hospital characteristics with the most potential to gain from improvement, we also analyzed associations using 2 collapsed groups: hospitals with RV (or RVA) rates included in the average-performing and lowest outlier groups and hospitals within the highest outlier group. Hospital characteristics and hospital’s patient population characteristics from the surveys are summarized based on RV and RVA rate groups. Differences in distributions among continuous variables were assessed by Kruskal-Wallis 1-way analysis of variance. Chi-square tests were used to evaluate differences in proportions among categorical variables. All statistical analyses were performed with SAS Version 9.4 (SAS Institute); 2-sided P < 0.05 was considered statistically significant.
RESULTS
Return Visit Rates and Hospital ED Site Population Characteristics
Twenty-four of 35 (68%) eligible hospitals that met PHIS quality control standards for ED patient visits responded to the ED medical director survey. The included hospitals that both met quality control standards and completed the survey had a total of 1,456,377 patient visits during the study period. Individual sites had annual volumes ranging from 26,627 to 96,637 ED encounters. The mean RV rate across the institutions was 3.7% (range, 3.0%-4.8%), and the mean RVA rate across the hospitals was 0.7% (range, 0.5%-1.1%) (Figure).
Figure
There were 5 hospitals with RV rates less than 2 SDs of the mean rate, placing them in the lowest outlier group for RV; 13 hospitals with RV rates within 2 SDs of the mean RV rate, placing them in the average-performing group; and 6 hospitals with RV rates above 2 SDs of the mean, placing them in the highest outlier group. Table 1 lists the hospital ED site population characteristics among the 3 RV rate groups. Hospitals in the highest outlier group served populations with higher proportions of patients with insurance from a government payer, lower proportions of patients covered by a commercial insurance plan, and higher proportion of patients with lower median household incomes.
Table 1 In the RVA analysis, there were 6 hospitals with RVA rates less than 2 SDs of the mean RVA rate (lowest outliers); 14 hospitals with RVA rates within 2 SDs of the mean RVA rate (average performers); and 4 hospitals with RVA rates above 2 SDs of the mean RVA rate (highest outliers). When using these groups based on RVA rate, there were no statistically significant differences in hospital ED site population characteristics (Supplemental Table 1).
RV Rates and Hospital-Level Factors Survey Characteristics
Table 2 lists the ED medical director survey hospital-level data among the 3 RV rate groups. There were fewer FTEs by PEM fellowship-trained physicians per 10,000 patient visits at sites with higher RV rates (Table 2). Hospital-level characteristics assessed by the survey were not associated with RVA rates (Supplemental Table 2).
Table 2
Evaluating characteristics of hospitals with the most potential to gain from improvement, hospitals with the highest RV rates (highest outlier group), compared with hospitals in the lowest outlier and average-performing groups collapsed together, persisted in having fewer PEM fellowship-trained physician FTEs per patient visit (Table 3). A similar collapsed analysis of RVA rates demonstrated that hospitals in the highest outlier group had longer-wait-to-physician time (81 minutes; IQR, 51-105 minutes) compared with hospitals in the other 2 groups (30 minutes; IQR, 19-42.5 minutes) (Table 3).
Table 3 In response to the first qualitative question on the ED medial director survey, “In your opinion, what is the largest barrier to reducing the number of return visits within 72 hours of discharge from a previous ED visit?”, 15 directors (62.5%) reported limited access to primary care, 4 (16.6%) reported inadequate discharge instructions and/or education provided, and 3 (12.5%) reported lack of access to specialist care. To the second question, “In your opinion, what is the best way of reducing the number of the return visits within 72 hours of previous ED visit for the same condition?”, they responded that RVs could be reduced by innovations in scheduling primary care or specialty follow-up visits (19, 79%), improving discharge education and instructions (6, 25%), and identifying more case management or care coordination (4, 16.6%).
DISCUSSION
Other studies have identified patient- and visit-level characteristics associated with higher ED RV and RVA rates.3,8,9,31 However, as our goal was to identify possible modifiable institutional features, our study examined factors at hospital and population-served levels (instead of patient or visit level) that may impact ED RV and RVA rates. Interestingly, our sample of tertiary-care pediatric center EDs provided evidence of variability in RV and RVA rates. We identified factors associated with RV rates related to the SDHs of the populations served by the ED, which suggests these factors are not modifiable at an institution level. In addition, we found that the increased availability of PEM providers per patient visit correlated with fewer ED RVs.
Hospitals serving ED populations with more government-insured and fewer commercially insured patients had higher rates of return to the ED. Similarly, hospitals with larger proportions of patients from areas with lower median household incomes had higher RV rates. These factors may indicate that patients with limited resources may have more frequent ED RVs,3,6,32,33 and hospitals that serve them have higher ED RV rates. Our findings complement those of a recent study by Sills et al.,11 who evaluated hospital readmissions and proposed risk adjustment for performance reimbursement. This study found that hospital population-level race, ethnicity, insurance status, and household income were predictors of hospital readmission after discharge.
Of note, our data did not identify similar site-level attributes related to the population served that correlated with RVA rates. We postulate that the need for admission on RV may indicate an inherent clinical urgency or medical need associated with the return to the ED, whereas RV without admission may be related more to patient- or population-level sociodemographic factors than to quality of care and clinical course, which influence ED utilization.1,3,30 EDs treating higher proportions of patients of minority race or ethnicity, those with fewer financial resources, and those in more need of government health insurance are at higher risk for ED revisits.
We observed that increased PEM fellowship-trained physician staffing was associated with decreased RV rates. The availability of specialty-trained physicians in PEM may allow a larger proportion of patients treated by physicians with honed clinical skills for the patient population. Data from a single pediatric center showed PEM fellowship-trained physicians had admission rates lower than those of their counterparts without subspecialty fellowship training.34 The lower RV rate for this group in our study is especially interesting in light of previously reported lower admission rates at index visit in PEM trained physicians. With lower index admission rates, it may have been assumed that visits associated with PEM trained physician care would have an increased (rather than decreased) chance of RV. In addition, we noted the increased RVA rates were associated with longer waits to see a physician. These measures may indicate the effect of institutional access to robust resources (the ability to hire and support more specialty-trained physicians). These novel findings warrant further evaluation, particularly as our sample included only pediatric centers.
Our survey data demonstrated the impact that access to care has on ED RV rates. The ED medical directors indicated that limited access to outpatient appointments with PCPs and specialists was an important factor increasing ED RVs and a potential avenue for interventions. As the 2 open-ended questions addressed barriers and potential solutions, it is interesting that the respondents cited access to care and discharge instructions as the largest barriers and identified innovations in access to care and discharge education as important potential remedies.
This study demonstrated that, at the hospital level, ED RV quality measures are influenced by complex and varied SDHs that primarily reflect the characteristics of the patient populations served. Prior work has similarly highlighted the importance of gaining a rigorous understanding of other quality measures before widespread use, reporting, and dissemination of results.11,35-38 With this in mind, as quality measures are developed and implemented, care should be taken to ensure they accurately and appropriately reflect the quality of care provided to the patient and are not more representative of other factors not directly within institutional control. These findings call into question the usefulness of ED RVs as a quality measure for comparing institutions.
Study Limitations
This study had several limitations. The PHIS dataset tracks only patients within each institution and does not include RVs to other EDs, which may account for a proportion of RVs.39 Our survey response rate was 68% among medical directors, excluding 11 hospitals from analysis, which decreased the study’s power to detect differences that may be present between groups. In addition, the generalizability of our findings may be limited to tertiary-care children’s hospitals, as the PHIS dataset included only these types of healthcare facilities. We also included data only from the sites’ main EDs, and therefore cannot know if our results are applicable to satellite EDs. ED staffing of PEM physicians was analyzed using FTEs. However, number of clinical hours in 1 FTE may vary among sites, leading to imprecision in this hospital characteristic.
CONCLUSION
Hospitals with the highest RV rates served populations with a larger proportion of patients with government insurance and lower household income, and these hospitals had fewer PEM trained physicians. Variation in RV rates among hospitals may be indicative of the SDHs of their unique patient populations. ED revisit rates should be used cautiously in determining the quality of care of hospitals providing care to differing populations.
Disclosure
Nothing to report.
References
1. Goldman RD, Kapoor A, Mehta S. Children admitted to the hospital after returning to the emergency department within 72 hours. Pediatr Emerg Care. 2011;27(9):808-811. PubMed 2. Cho CS, Shapiro DJ, Cabana MD, Maselli JH, Hersh AL. A national depiction of children with return visits to the emergency department within 72 hours, 2001–2007. Pediatr Emerg Care. 2012;28(7):606-610. PubMed 3. Akenroye AT, Thurm CW, Neuman MI, et al. Prevalence and predictors of return visits to pediatric emergency departments. J Hosp Med. 2014;9(12):779-787. PubMed 4. Gallagher RA, Porter S, Monuteaux MC, Stack AM. Unscheduled return visits to the emergency department: the impact of language. Pediatr Emerg Care. 2013;29(5):579-583. PubMed 5. Sørup CM, Jacobsen P, Forberg JL. Evaluation of emergency department performance—a systematic review on recommended performance and quality-in-care measures. Scand J Trauma Resusc Emerg Med. 2013;21:62. PubMed 6. Gabayan GZ, Asch SM, Hsia RY, et al. Factors associated with short-term bounce-back admissions after emergency department discharge. Ann Emerg Med. 2013;62(2):136-144.e1. PubMed 7. Ali AB, Place R, Howell J, Malubay SM. Early pediatric emergency department return visits: a prospective patient-centric assessment. Clin Pediatr (Phila). 2012;51(7):651-658. PubMed 8. Alessandrini EA, Lavelle JM, Grenfell SM, Jacobstein CR, Shaw KN. Return visits to a pediatric emergency department. Pediatr Emerg Care. 2004;20(3):166-171. PubMed 9. Goldman RD, Ong M, Macpherson A. Unscheduled return visits to the pediatric emergency department—one-year experience. Pediatr Emerg Care. 2006;22(8):545-549. PubMed 10. Berry JG, Toomey SL, Zaslavsky AM, et al. Pediatric readmission prevalence and variability across hospitals. JAMA. 2013;309(4):372-380. PubMed 11. Sills MR, Hall M, Colvin JD, et al. Association of social determinants with children’s hospitals’ preventable readmissions performance. JAMA Pediatr. 2016;170(4):350-358. PubMed 12. Fiscella K, Burstin HR, Nerenz DR. Quality measures and sociodemographic risk factors: to adjust or not to adjust. JAMA. 2014;312(24):2615-2616. PubMed 13. Lipstein SH, Dunagan WC. The risks of not adjusting performance measures for sociodemographic factors. Ann Intern Med. 2014;161(8):594-596. PubMed 14. Berry JG, Hall DE, Kuo DZ, et al. Hospital utilization and characteristics of patients experiencing recurrent readmissions within children’s hospitals. JAMA. 2011;305(7):682-690. PubMed 15. Bourgeois FT, Monuteaux MC, Stack AM, Neuman MI. Variation in emergency department admission rates in US children’s hospitals. Pediatrics. 2014;134(3):539-545. PubMed 16. Fletcher DM. Achieving data quality. How data from a pediatric health information system earns the trust of its users. J AHIMA. 2004;75(10):22-26. PubMed 17. US Census Bureau. US Census current estimates data. 2014. https://www.census.gov/programs-surveys/popest/data/data-sets.2014.html. Accessed June 2015. 18. Alessandrini EA, Alpern ER, Chamberlain JM, Shea JA, Gorelick MH. A new diagnosis grouping system for child emergency department visits. Acad Emerg Med. 2010;17(2):204-213. PubMed 19. Feudtner C, Levin JE, Srivastava R, et al. How well can hospital readmission be predicted in a cohort of hospitalized children? A retrospective, multicenter study. Pediatrics. 2009;123(1):286-293. PubMed 20. Feinstein JA, Feudtner C, Kempe A. Adverse drug event–related emergency department visits associated with complex chronic conditions. Pediatrics. 2014;133(6):e1575-e1585. PubMed 21. Simon TD, Berry J, Feudtner C, et al. Children with complex chronic conditions in inpatient hospital settings in the United States. Pediatrics. 2010;126(4):647-655. PubMed 22. Dartmouth Medical School, Center for Evaluative Clinical Sciences. The Dartmouth Atlas of Health Care. Chicago, IL: American Hospital Publishing; 2015. 23. Kansagara D, Englander H, Salanitro A, et al. Risk prediction models for hospital readmission: a systematic review. JAMA. 2011;306(15):1688-1698. PubMed 24. Lawrence LM, Jenkins CA, Zhou C, Givens TG. The effect of diagnosis-specific computerized discharge instructions on 72-hour return visits to the pediatric emergency department. Pediatr Emerg Care. 2009;25(11):733-738. PubMed 25. National Quality Forum. National Quality Forum issue brief: strengthening pediatric quality measurement and reporting. J Healthc Qual. 2008;30(3):51-55. PubMed 26. Rising KL, Victor TW, Hollander JE, Carr BG. Patient returns to the emergency department: the time-to-return curve. Acad Emerg Med. 2014;21(8):864-871. PubMed 27. Cho CS, Shapiro DJ, Cabana MD, Maselli JH, Hersh AL. A national depiction of children with return visits to the emergency department within 72 hours, 2001–2007. Pediatr Emerg Care. 2012;28(7):606-610. PubMed 28. Adekoya N. Patients seen in emergency departments who had a prior visit within the previous 72 h—National Hospital Ambulatory Medical Care Survey, 2002. Public Health. 2005;119(10):914-918. PubMed 29. Mittal MK, Zorc JJ, Garcia-Espana JF, Shaw KN. An assessment of clinical performance measures for pediatric emergency physicians. Am J Med Qual. 2013;28(1):33-39. PubMed 30. Depiero AD, Ochsenschlager DW, Chamberlain JM. Analysis of pediatric hospitalizations after emergency department release as a quality improvement tool. Ann Emerg Med. 2002;39(2):159-163. PubMed 31. Sung SF, Liu KE, Chen SC, Lo CL, Lin KC, Hu YH. Predicting factors and risk stratification for return visits to the emergency department within 72 hours in pediatric patients. Pediatr Emerg Care. 2015;31(12):819-824. PubMed 32. Jacobstein CR, Alessandrini EA, Lavelle JM, Shaw KN. Unscheduled revisits to a pediatric emergency department: risk factors for children with fever or infection-related complaints. Pediatr Emerg Care. 2005;21(12):816-821. PubMed 33. Barnett ML, Hsu J, McWilliams J. Patient characteristics and differences in hospital readmission rates. JAMA Intern Med. 2015;175(11):1803-1812. PubMed 34. Gaucher N, Bailey B, Gravel J. Impact of physicians’ characteristics on the admission risk among children visiting a pediatric emergency department. Pediatr Emerg Care. 2012;28(2):120-124. PubMed 35. McHugh M, Neimeyer J, Powell E, Khare RK, Adams JG. An early look at performance on the emergency care measures included in Medicare’s hospital inpatient Value-Based Purchasing Program. Ann Emerg Med. 2013;61(6):616-623.e2. PubMed 36. Axon RN, Williams MV. Hospital readmission as an accountability measure. JAMA. 2011;305(5):504-505. PubMed 37. Adams JG. Ensuring the quality of quality metrics for emergency care. JAMA. 2016;315(7):659-660. PubMed 38. Payne NR, Flood A. Preventing pediatric readmissions: which ones and how? J Pediatr. 2015;166(3):519-520. PubMed 39. Khan A, Nakamura MM, Zaslavsky AM, et al. Same-hospital readmission rates as a measure of pediatric quality of care. JAMA Pediatr. 2015;169(10):905-912. PubMed
Ann & Robert H. Lurie Children’s Hospital of Chicago, Division of Emergency Medicine Box #62, 225 E. Chicago Ave, Chicago IL 60611-2991, Telephone: 312-227-6080; Fax: 312-227-9475; E-mail: zpittsenbarger@luriechildrens.org
Content Gating
Gated (full article locked unless allowed per User)
It has been theorized that the physiologic stress that hospitalized patients experience accounts for their transient vulnerability after discharge, or posthospital syndrome.1 Their acute illness and life-habit changes during hospitalization result in continued impairment of physiologic systems after discharge, and this impairment might leave them more susceptible to new health threats.1 However, the theory that the stress experienced after a hospitalization might be associated with readmission has never been investigated.
Four biomarkers of the hypothalamic-pituitary-adrenal (HPA) axis may help quantify posthospitalization stress: (1) midregional pro-adrenomedullin (ADM), a precursor reflecting adrenomedullin activity2; (2) copeptin (the C-terminal part of prepro-vasopressin, produced by the hypothalamus in response to stress3,4), the level of which closely correlates to the vasopressin level but is more stable and lacks circadian rhythm fluctuations5-7; (3) cortisol, released by the adrenal cortex in response to stress; and (4) prolactin, an indicator of HPA axis activity. These 4 stress biomarkers have been related to the severity, complications, or mortality of several diseases.3,5,8-17 Besides explaining the hypothetical association between posthospitalization stress and readmission and death, these biomarkers might be valuable in predicting which patients are at higher risk for readmission. Indeed, many prediction models have been developed to identify those patients, but most of these models underperform, target only very specific populations, or have not been externally validated.18
We hypothesized that the hospitalization stress measured by biomarkers is associated with readmission or death after discharge. In a prospective cohort study, we evaluated the association between 4 stress biomarkers (ADM, copeptin, cortisol, prolactin) and 30-day unplanned readmissions and deaths after an acute-care medical hospitalization, and assessed their additive value to validated readmission prediction scores.
METHODS
Study Design and Population
Our prospective cohort study included all consecutive patients aged ≥50 years and admitted to the department of general internal medicine at Fribourg Cantonal Hospital in Switzerland between April 8, 2013 and September 23, 2013. Exclusion criteria were discharge on day of admission; death before discharge; discharge to another division, another acute-care hospital, a rehabilitation clinic, or a palliative-care clinic; and refusal or inability to give informed consent. In this hypothesis-generating observational study, we collected data on a convenience sample of patients and did not calculate sample size before data collection. The study was approved by the local ethics committee, and all patients gave informed consent.
Outcomes
The primary outcome was the composite of first unplanned readmission (to any division of any acute-care hospital) or death within 30 days after discharge from index admission. We also included deaths that occurred after discharge, hypothesizing that patients who died may have been readmitted had they lived. The secondary outcome was the same as the primary, but the period was 90 days. Planned readmission was defined as scheduled hospitalization for nonemergent treatment (eg, chemotherapy) or investigation (eg, elective coronarography). All patients were called 6 months after discharge, and readmissions and deaths recorded. If a patient could not be reached directly, we called his or her next of kin, primary care physician, or nursing home, depending on availability. Furthermore, we checked electronic health records for any readmission or death recorded within the Fribourg hospital network, which includes all 3 acute-care hospitals (Fribourg, Riaz, Tavel) in the same canton (state).
Independent Variables
Stress biomarkers. We measured serum levels of 4 stress biomarkers (ADM, copeptin, cortisol, prolactin) at 8 am on an empty stomach on both day of admission and day of discharge. For a patient whose discharge decision was made after 8 hours for the same day, a blood sample was collected as soon as discharge was planned.
Clinical data. Collected data included demographics, history of hospitalization within 6 months before index admission, hospitalization diagnosis, and Charlson Comorbidity Index (CCI), which includes a list of medical conditions that are assigned a number of 1, 2, 3, or 6 points, according to their severity, and which has been associated with mortality.19
Causes of Admission, Unplanned Readmission, and Death
Causes of index admission, unplanned readmission, and death were obtained from medical records. We used our consensus opinion and a previous analysis20 to classify these causes by body system, and added 2 categories, cancer and infection (both associated with readmission20). The resulting 9 categories were (1) cancer, (2) respiratory disorder, (3) infectious disorder, (4) neurologic disorder (including dementia, psychiatric disorder, alcohol disorder, and intoxication), (5) gastrointestinal disorder, (6) osteoarticular disorder, (7) renal disorder, (8) cardiovascular disorder (including ischemic disease and heart failure), and (9) other.
Additional Performance With Existing Predictive Models
To better define the explanatory power of biomarkers to predict our outcome, we assessed the performance improvement of 2 validated readmission prediction scores by adding the stress biomarkers. As large effect sizes from additional predictors are needed to increase the power discrimination of a model, a significant performance improvement would further support the biomarkers’ important explanatory power. The 2 prediction scores tested were the LACE index (Length of stay, Admission Acuity, CCI, number of Emergency department visits within preceding 6 months21) and the HOSPITAL score (Hemoglobin level at discharge, discharge from Oncology service, Sodium level at discharge, any Procedure performed during index hospitalization, Index admission Type, number of Admissions within preceding 12 months, Length of stay). As we did not have an oncology service, we replaced “discharge from oncology service” with “active diagnosis of cancer.” “Length of stay” was tailored to the median in Switzerland (8 days instead of 5 days; Supplement Table 1).22,23
Data Analysis
Continuous variables were presented as medians with interquartile ranges (IQRs) because of their non-normal distribution, and categorical variables were presented as frequencies and percentages. We compared medians using the nonparametric K-sample test on the equality of medians, and compared frequencies using the Pearson χ2 test. The discriminatory power of each biomarker in predicting readmission and death was calculated with the area under the receiver operating characteristic (ROC) curve (AUROC), using serum levels at discharge to better reflect the postdischarge period. Cutoff levels were selected by taking the best compromise between sensitivity and specificity according to the ROC curves (point nearest top left corner).24
Univariate logistic regression analysis was used to test the prediction of 30-day and 90-day unplanned readmission or death by each biomarker. We built 2 different multivariate models: one adjusting for age and LACE index points21 and the other adjusting for age and HOSPITAL score.22,23
To explore any association between reduction of stress during hospitalization and postdischarge outcome, we additionally calculated for each biomarker the difference between admission and discharge serum levels and assessed its association with readmission or death by logistic regression analysis. Because of the modification of cortisol serum levels during corticosteroid therapy, we excluded patients who underwent systemic corticosteroid therapy before or during hospitalization for the cortisol analysis (n = 105/346). Patients with a missing biomarker level were excluded from the respective analyses: discharge (ADM, 28 patients; copeptin, 27; cortisol, 24; prolactin, 24) and admission (ADM, 12 patients; copeptin, 15; cortisol, 8; prolactin, 8).
To assess an additional value of the biomarkers to prediction scores, we assessed the accuracy of the HOSPITAL score and LACE index in their original versions21,22 and after adding each biomarker. We used AUROC to assess the discriminatory power and used the method of DeLong et al.25 to compare results with and without adding each biomarker. Calibration was evaluated by comparing Hosmer-Lemeshow goodness-of-fit tests (P > 0.05 indicates good fit). Risk reclassification was assessed by Net Reclassification Improvement (NRI),26 quantifying how appropriately a new model reclassifies patients, compared with an old model. Basically, patients without outcome are assigned +1 if correctly reclassified to a lower risk category or –1 if incorrectly reclassified to a higher risk category. NRInonevent is the sum of all points/numbers of patients. Conversely, patients with outcome are assigned +1 if correctly reclassified to a higher risk category or –1 if incorrectly reclassified to a lower risk category. NRIevent is the sum of all points/numbers of patients. NRIoverall is the sum of NRIevent and NRInonevent ranging from –2 to 2, with a positive value indicating better classification with the new model.
Two-sided P < 0.05 was used for statistical significance. All statistical analyses were performed with Stata Release 13.0 (StataCorp).
Figure
RESULTS
Among the 530 patients admitted to the ward, 184 were excluded (120 meeting exclusion criteria, 64 unable to give consent, Figure). Among the 346 patients included, 11.6% (n = 40) had a 30-day unplanned readmission or death (37 were readmitted, 2 died during readmission, 3 died without readmission). Within 90 days, 26.6% (n = 92) had a readmission or death (84 were readmitted, 10 died during or after readmission, 8 died without readmission).
Table 1
Clinical Characteristics
Table 1 lists the patients’ baseline characteristics. Median age was 73 years (IQR, 64-82 years). Of the 346 patients included, 172 (49.7%) were men. Median CCI was 7 (IQR, 5-9); according to this index, 310 patients (89.6%) had at least 2 comorbidities. Median length of stay was 7 days (IQR, 4-12 days).
Table 2
Primary Diagnoses of Admission, Unplanned Readmission, and Death
The 3 main causes of index admission were cardiovascular disorder (n = 92), infectious disorder (n = 70), and neurologic disorder (n = 66). Table 2 lists the causes of readmissions and deaths. A same-diagnosis category between index admission and readmission was found in 17 (45.9%) of the 37 readmitted patients and in 3 (60%) of the 5 patients who died.
Biomarkers and 30-Day Unplanned Readmission or Death
AUROC was 0.53 (95% confidence interval [CI], 0.43-0.63) for ADM, 0.60 (95% CI, 0.50-0.70) for copeptin, 0.59 (95% CI, 0.44-0.73) for cortisol, and 0.56 (95% CI, 0.45-0.66) for prolactin. The difference between admission and discharge levels was not associated with unplanned readmission or death for any of the biomarkers (Supplemental Table 2).
Table 3
ADM and readmission or death. Median ADM level was not different between patients with and without readmission or death (1.0 nmol/L in each case; P = 1.00). The best cutoff level for ADM was 2 nmol/L (sensitivity, 16.7%; specificity, 91.8%). At this level, ADM was associated with a nonstatistically significant 130% increased odds of 30-day readmission or death (P = 0.09; Table 3, Supplemental Table 3). Conversely, the association with the 90-day outcome was significant (P = 0.02; Table 3, Supplemental Table 4).
Copeptin and readmission or death. Patients with 30-day readmission or death had a higher median copeptin level at discharge than patients without (10.4 pmol/Lvs 7.3 pmol/L; P = 0.03). At a copeptin level higher than 9 pmol/L (to convert to pg/mL, divide by 0.249; sensitivity, 66.7%; specificity, 59.7%), both 30-day readmission or death (adjusted odds ratio [OR], 2.69; 95% CI, 1.29-5.64; P = 0.009) and 90-day readmission or death (adjusted OR, 2.76; 95% CI, 1.56-4.88; P < 0.001) were nearly 3 times as likely (Table 3, Supplemental Tables 3 and 4).
Cortisol and readmission or death. Median cortisol was not statistically different between patients with and without the primary outcome (431 nmol/L vs 465 nmol/L; P = 0.72). At a cortisol level higher than 590 nmol/L (to convert to μg/dL, divide by 27.59; sensitivity, 54.6%; specificity, 76.4%), 30-day outcome was more than 3 times as likely (adjusted OR, 3.43; 95% CI, 1.36-8.65; P = 0.009; Table 3, Supplemental Table 3). At 90 days, only the model that adjusted for age and LACE index points remained statistically significant (P = 0.02; Table 3, Supplemental Table 4).
Prolactin and readmission or death. Median prolactin was not statistically different between patients with and without the primary outcome (15.1 μg/L vs 14.1 μg/L; P = 0.24). The best cutoff level for prolactin was 23 μg/L (to convert to mIU/L, divide by 0.05; sensitivity, 27.8%; specificity, 82.9%). Prolactin was associated with a nonstatistically significant increased odds of 30-day (P = 0.16) and 90-day (P = 0.24) readmission or death (Table 3, Supplemental Tables 3 and 4).
Additive Value of Biomarkers to HOSPITAL Score and LACE Index
The AUROC for the original HOSPITAL score, 0.70 (95% CI, 0.60-0.80), nonsignificantly increased to 0.76 after adding the biomarkers (P > 0.14). For the LACE index, AUROC was 0.59 (95% CI, 0.49-0.68), with a significant 0.10 increase with cortisol (P = 0.04) and a near significant increase with copeptin (P = 0.08). Calibration remained almost unchanged after adding the biomarkers to both models (Supplemental Table 5). NRIoverall was positive for all biomarkers, with statistical significance for copeptin added to the HOSPITAL score (0.47; 95% CI, 0.13-0.79) and for cortisol added to the LACE index (0.62; 95% CI, 0.15-1.06).
DISCUSSION
In this prospective cohort study, 30-day and 90-day unplanned readmission or death was nearly 3 times as likely for patients with high copeptin levels on discharge from an acute-care medical hospitalization, and 30-day readmission or death was more than 3 times as likely for patients with high cortisol levels. High ADM and prolactin levels were not consistently associated with readmission or death. Adding such biomarkers to readmission prediction models improved their performance.
These findings support the theory of posthospital syndrome,1 which describes a period of vulnerability with increased stress after discharge from an acute-care hospitalization, and which may be associated with adverse outcome. The hormones cortisol and copeptin are strongly related to the stress response in humans.4,5 As copeptin level has been associated with adverse prognosis for several disorders affecting a wide range of physiologic systems,3,5,15,27 it may be a valuable biomarker of a stressful condition, even independent of the system affected by the acute illness, and its use may be widely generalizable, in contrast to predictive factors identified in other studies.18,28,29
Although cortisol was independently associated with 30-day readmission or death, and may be an interesting biomarker and less expensive than copeptin, its measurement is limited in patients treated with systemic corticosteroids. Compared with cortisol, copeptin does not undergo diurnal variation, is less affected by corticosteroid therapy, and mirrors stress levels better.5,7,30,31 Our results showed that, contrary to cortisol, copeptin was also associated with longer term outcome. High ADM level was associated with readmission or death at 90 days only; lack of a significant association at 30 days might be attributable to a lack of power (fewer outcomes at 30 days). Conversely, prolactin level was consistently not associated with outcome. Prolactin may be affected by many drugs that act on the dopaminergic system (eg, domperidone), and therefore its levels may be more difficult to interpret.
Levels of biomarkers were similar to those measured in patients without previously studied conditions (eg, myocardial infarction).5,8,10,13,14,16,17 In most previous analyses, levels were measured during a stressful event, whereas we measured them at discharge. Therefore, these biomarkers may constitute sensitive markers of remaining stress at discharge.
Our finding that copeptin level was independently associated with readmission or death supports its relevance as a possible simple measure of the risk of adverse postdischarge outcome, independently of disease type and independently of known predictors. Stress biomarkers may therefore be valuable predictors of which patients are at high risk. All these biomarkers can be measured within 30 minutes, extending their use beyond everyday practice, except for the possible need of an extra blood draw.
The most accurate and validated models are the HOSPITAL score (AUROC range, 0.68-0.7723,32-36) and the LACE index (AUROC range, 0.56-0.6823,34,35,37). Adding biomarkers to these models improved overall performance (up to 0.10 increase in AUROC), which is remarkable given that, once a particular level of discriminatory power is reached, extremely large effect sizes from additional markers are needed to increase AUROC.26 Incremental improvement is objectively supported by positive NRI. Our results suggest biomarkers added to prediction models may improve identification of high-risk patients.
We found that less than 50% of the primary diagnoses belonged to the same diagnosis category at readmission and at index admission. This result is in line with previous findings that readmissions were related to the primary diagnosis at index admission in only 22% to 46% of cases,20,38 and supports our study hypothesis that readmission is related to underlying stress factors often independent of the underlying illness.1
Study Limitations and Strengths
Our study had some limitations. First, it was a single-center study with a limited sample size. However, we found significant results within the sample. Second, we could not adjust for drugs that were acting on the dopaminergic system and might have affected prolactin levels. However, such interactions would limit the use of this biomarker in clinical practice anyway. Third, we used specific cutoffs, which might decrease analytical power, in comparison with continuous analyses. However, we followed a recognized method24 and found a significant association even with categorized levels. Furthermore, the distribution of biomarkers could not be normalized by logarithmic transformation, and cutoff values have the advantage of being integrable into score point systems (eg, HOSPITAL score, LACE index). Fourth, although in 2 models we found consistent associations with several potential confounders, we could not exclude residual confounding. Fifth, this study was not powered to assess the biomarkers’ predictive value for readmission and death, which might explain the lack of significant differences between AUROC with and without the biomarkers. For all these reasons, this study should be considered hypothesis-generating.
Our study also had its strengths. First, to our knowledge, this is the first study of the association between stress biomarkers at discharge and unplanned readmission or death. Second, the quality of our data was high, with a low percentage of missing biomarker levels. Third, we excluded planned readmissions. Fourth, we used an unselected medical patient population, which had the noteworthy advantage of widening the generalizability of results.
CONCLUSION
In this prospective cohort study, high copeptin and cortisol levels at discharge were significantly associated with increased odds, ranging from 2-fold to more than 3-fold, of unplanned readmission or death within 30 days after discharge from an internal medicine ward. This finding supports the theory that a physiologic stress that patients experience during hospitalization makes them more susceptible to new health threats (posthospital syndrome). These biomarkers, copeptin in particular, may help us better identify patients at high risk of early unplanned readmission or death.
Acknowledgment
Biomarker measurement was funded by the research fund of the Department of General Internal Medicine, Fribourg Cantonal Hospital, Fribourg, Switzerland.
1. Krumholz HM. Post-hospital syndrome—an acquired, transient condition of generalized risk. N Engl J Med. 2013;368(2):100-102. PubMed 2. Morgenthaler NG, Struck J, Alonso C, Bergmann A. Measurement of midregional proadrenomedullin in plasma with an immunoluminometric assay. Clin Chem. 2005;51(10):1823-1829. PubMed 3. Dobsa L, Edozien KC. Copeptin and its potential role in diagnosis and prognosis of various diseases. Biochem Med. 2013;23(2):172-190. PubMed 4. Yilman M, Erenler AK, Baydin A. Copeptin: a diagnostic factor for critical patients. Eur Rev Med Pharmacol Sci. 2015;19(16):3030-3036. PubMed 5. Katan M, Christ-Crain M. The stress hormone copeptin: a new prognostic biomarker in acute illness. Swiss Med Wkly. 2010;140:w13101. PubMed 6. Struck J, Morgenthaler NG, Bergmann A. Copeptin, a stable peptide derived from the vasopressin precursor, is elevated in serum of sepsis patients. Peptides. 2005;26(12):2500-2504. PubMed 7. Darzy KH, Dixit KC, Shalet SM, Morgenthaler NG, Brabant G. Circadian secretion pattern of copeptin, the C-terminal vasopressin precursor fragment. Clin Chem. 2010;56(7):1190-1191. PubMed 8. Labad J, Stojanovic-Pérez A, Montalvo I, et al. Stress biomarkers as predictors of transition to psychosis in at-risk mental states: roles for cortisol, prolactin and albumin. J Psychiatr Res. 2015;60:163-169. PubMed 9. Olsson T, Asplund K, Hagg E. Pituitary-thyroid axis, prolactin and growth hormone in patients with acute stroke. J Intern Med. 1990;228(3):287-290. PubMed 10. Parissis JT, Farmakis D, Fountoulaki K, et al. Clinical and neurohormonal correlates and prognostic value of serum prolactin levels in patients with chronic heart failure. Eur J Heart Fail. 2013;15(10):1122-1130. PubMed 11. Theodoropoulou A, Metallinos IC, Elloul J, et al. Prolactin, cortisol secretion and thyroid function in patients with stroke of mild severity. Horm Metab Res. 2006;38(9):587-591. PubMed 12. Vardas K, Apostolou K, Briassouli E, et al. Early response roles for prolactin cortisol and circulating and cellular levels of heat shock proteins 72 and 90α in severe sepsis and SIRS. Biomed Res Int. 2014;2014:803561. PubMed 13. Bahrmann P, Christ M, Hofner B, et al. Prognostic value of different biomarkers for cardiovascular death in unselected older patients in the emergency department. Eur Heart J Acute Cardiovasc Care. 2016;5(8):568-578. PubMed 14. Christ-Crain M, Morgenthaler NG, Stolz D, et al. Pro-adrenomedullin to predict severity and outcome in community-acquired pneumonia [ISRCTN04176397]. Crit Care. 2006;10(3):R96. PubMed 15. Artunc F, Nowak A, Mueller C, et al. Plasma concentrations of the vasoactive peptide fragments mid-regional pro-adrenomedullin, C-terminal pro-endothelin 1 and copeptin in hemodialysis patients: associated factors and prediction of mortality. PLoS One. 2014;9(1):e86148. PubMed 16. Rotman-Pikielny P, Roash V, Chen O, Limor R, Stern N, Gur HG. Serum cortisol levels in patients admitted to the department of medicine: prognostic correlations and effects of age, infection, and comorbidity. Am J Med Sci. 2006;332(2):61-67. PubMed 17. Yamaji M, Tsutamoto T, Kawahara C, et al. Serum cortisol as a useful predictor of cardiac events in patients with chronic heart failure: the impact of oxidative stress. Circ Heart Fail. 2009;2(6):608-615. PubMed 18. Kansagara D, Englander H, Salanitro A, et al. Risk prediction models for hospital readmission: a systematic review. JAMA. 2011;306(15):1688-1698. PubMed 19. Charlson ME, Pompei P, Ales KL, MacKenzie CR. A new method of classifying prognostic comorbidity in longitudinal studies: development and validation. J Chronic Dis. 1987;40(5):373-383. PubMed 20. Donzé J, Lipsitz S, Bates DW, Schnipper JL. Causes and patterns of readmissions in patients with common comorbidities: retrospective cohort study. BMJ. 2013;347:f7171. PubMed 21. van Walraven C, Dhalla IA, Bell C, et al. Derivation and validation of an index to predict early death or unplanned readmission after discharge from hospital to the community. CMAJ. 2010;182(6):551-557. PubMed 22. Donzé J, Aujesky D, Williams D, Schnipper JL. Potentially avoidable 30-day hospital readmissions in medical patients: derivation and validation of a prediction model. JAMA Intern Med. 2013;173(8):632-638. PubMed 23. Aubert CE, Folly A, Mancinetti M, Hayoz D, Donzé J. Prospective validation and adaptation of the HOSPITAL score to predict high risk of unplanned readmission of medical patients. Swiss Med Wkly. 2016;146:w14335. PubMed 24. Zweig MH, Campbell G. Receiver-operating characteristic (ROC) plots: a fundamental evaluation tool in clinical medicine. Clin Chem. 1993;39(4):561-577. PubMed 25. DeLong ER, DeLong DM, Clarke-Pearson DL. Comparing the areas under two or more correlated receiver operating characteristic curves: a nonparametric approach. Biometrics. 1988;44(3):837-845. PubMed 26. Pencina MJ, D’Agostino RB Sr, Demler OV. Novel metrics for evaluating improvement in discrimination: net reclassification and integrated discrimination improvement for normal variables and nested models. Stat Med. 2012;31(2):101-113. PubMed 27. Folli C, Consonni D, Spessot M, et al. Diagnostic role of copeptin in patients presenting with chest pain in the emergency room. Eur J Intern Med. 2013;24(2):189-193. PubMed 28. Aujesky D, Mor MK, Geng M, Stone RA, Fine MJ, Ibrahim SA. Predictors of early hospital readmission after acute pulmonary embolism. Arch Intern Med. 2009;169(3):287-293. PubMed 29. Hammill BG, Curtis LH, Fonarow GC, et al. Incremental value of clinical data beyond claims data in predicting 30-day outcomes after heart failure hospitalization. Circ Cardiovasc Qual Outcomes. 2011;4(1):60-67. PubMed 30. Nickel CH, Bingisser R, Morgenthaler NG. The role of copeptin as a diagnostic and prognostic biomarker for risk stratification in the emergency department. BMC Med. 2012;10:7. PubMed 31. Katan M, Morgenthaler N, Widmer I, et al. Copeptin, a stable peptide derived from the vasopressin precursor, correlates with the individual stress level. Neuro Endocrinol Lett. 2008;29(3):341-346. PubMed 32. Donzé JD, Williams MV, Robinson EJ, et al. International validity of the HOSPITAL score to predict 30-day potentially avoidable hospital readmissions. JAMA Intern Med. 2016;176(4):496-502.PubMed
33. Burke RE, Schnipper JL, Williams MV, et al. The HOSPITAL score predicts potentially preventable 30-day readmissions in conditions targeted by the Hospital Readmissions Reduction Program. Med Care. 2017;55(3):285-290. PubMed 34. Garrison GM, Robelia PM, Pecina JL, Dawson NL. Comparing performance of 30-day readmission risk classifiers among hospitalized primary care patients. J Eval Clin Pract. 2017;23(3):524-529. PubMed 35. Cooksley T, Nanayakkara PW, Nickel CH, et al. Readmissions of medical patients: an external validation of two existing prediction scores. QJM. 2016;109(4):245-248. PubMed 36. Robinson R. The HOSPITAL score as a predictor of 30 day readmission in a retrospective study at a university affiliated community hospital. PeerJ. 2016;4:e2441. PubMed 37. Wang H, Robinson RD, Johnson C, et al. Using the LACE index to predict hospital readmissions in congestive heart failure patients. BMC Cardiovasc Disord. 2014;14:97. PubMed 38. Dunlay SM, Weston SA, Killian JM, Bell MR, Jaffe AS, Roger VL. Thirty-day rehospitalizations after acute myocardial infarction: a cohort study. Ann Intern Med. 2012;157(1):11-18. PubMed
It has been theorized that the physiologic stress that hospitalized patients experience accounts for their transient vulnerability after discharge, or posthospital syndrome.1 Their acute illness and life-habit changes during hospitalization result in continued impairment of physiologic systems after discharge, and this impairment might leave them more susceptible to new health threats.1 However, the theory that the stress experienced after a hospitalization might be associated with readmission has never been investigated.
Four biomarkers of the hypothalamic-pituitary-adrenal (HPA) axis may help quantify posthospitalization stress: (1) midregional pro-adrenomedullin (ADM), a precursor reflecting adrenomedullin activity2; (2) copeptin (the C-terminal part of prepro-vasopressin, produced by the hypothalamus in response to stress3,4), the level of which closely correlates to the vasopressin level but is more stable and lacks circadian rhythm fluctuations5-7; (3) cortisol, released by the adrenal cortex in response to stress; and (4) prolactin, an indicator of HPA axis activity. These 4 stress biomarkers have been related to the severity, complications, or mortality of several diseases.3,5,8-17 Besides explaining the hypothetical association between posthospitalization stress and readmission and death, these biomarkers might be valuable in predicting which patients are at higher risk for readmission. Indeed, many prediction models have been developed to identify those patients, but most of these models underperform, target only very specific populations, or have not been externally validated.18
We hypothesized that the hospitalization stress measured by biomarkers is associated with readmission or death after discharge. In a prospective cohort study, we evaluated the association between 4 stress biomarkers (ADM, copeptin, cortisol, prolactin) and 30-day unplanned readmissions and deaths after an acute-care medical hospitalization, and assessed their additive value to validated readmission prediction scores.
METHODS
Study Design and Population
Our prospective cohort study included all consecutive patients aged ≥50 years and admitted to the department of general internal medicine at Fribourg Cantonal Hospital in Switzerland between April 8, 2013 and September 23, 2013. Exclusion criteria were discharge on day of admission; death before discharge; discharge to another division, another acute-care hospital, a rehabilitation clinic, or a palliative-care clinic; and refusal or inability to give informed consent. In this hypothesis-generating observational study, we collected data on a convenience sample of patients and did not calculate sample size before data collection. The study was approved by the local ethics committee, and all patients gave informed consent.
Outcomes
The primary outcome was the composite of first unplanned readmission (to any division of any acute-care hospital) or death within 30 days after discharge from index admission. We also included deaths that occurred after discharge, hypothesizing that patients who died may have been readmitted had they lived. The secondary outcome was the same as the primary, but the period was 90 days. Planned readmission was defined as scheduled hospitalization for nonemergent treatment (eg, chemotherapy) or investigation (eg, elective coronarography). All patients were called 6 months after discharge, and readmissions and deaths recorded. If a patient could not be reached directly, we called his or her next of kin, primary care physician, or nursing home, depending on availability. Furthermore, we checked electronic health records for any readmission or death recorded within the Fribourg hospital network, which includes all 3 acute-care hospitals (Fribourg, Riaz, Tavel) in the same canton (state).
Independent Variables
Stress biomarkers. We measured serum levels of 4 stress biomarkers (ADM, copeptin, cortisol, prolactin) at 8 am on an empty stomach on both day of admission and day of discharge. For a patient whose discharge decision was made after 8 hours for the same day, a blood sample was collected as soon as discharge was planned.
Clinical data. Collected data included demographics, history of hospitalization within 6 months before index admission, hospitalization diagnosis, and Charlson Comorbidity Index (CCI), which includes a list of medical conditions that are assigned a number of 1, 2, 3, or 6 points, according to their severity, and which has been associated with mortality.19
Causes of Admission, Unplanned Readmission, and Death
Causes of index admission, unplanned readmission, and death were obtained from medical records. We used our consensus opinion and a previous analysis20 to classify these causes by body system, and added 2 categories, cancer and infection (both associated with readmission20). The resulting 9 categories were (1) cancer, (2) respiratory disorder, (3) infectious disorder, (4) neurologic disorder (including dementia, psychiatric disorder, alcohol disorder, and intoxication), (5) gastrointestinal disorder, (6) osteoarticular disorder, (7) renal disorder, (8) cardiovascular disorder (including ischemic disease and heart failure), and (9) other.
Additional Performance With Existing Predictive Models
To better define the explanatory power of biomarkers to predict our outcome, we assessed the performance improvement of 2 validated readmission prediction scores by adding the stress biomarkers. As large effect sizes from additional predictors are needed to increase the power discrimination of a model, a significant performance improvement would further support the biomarkers’ important explanatory power. The 2 prediction scores tested were the LACE index (Length of stay, Admission Acuity, CCI, number of Emergency department visits within preceding 6 months21) and the HOSPITAL score (Hemoglobin level at discharge, discharge from Oncology service, Sodium level at discharge, any Procedure performed during index hospitalization, Index admission Type, number of Admissions within preceding 12 months, Length of stay). As we did not have an oncology service, we replaced “discharge from oncology service” with “active diagnosis of cancer.” “Length of stay” was tailored to the median in Switzerland (8 days instead of 5 days; Supplement Table 1).22,23
Data Analysis
Continuous variables were presented as medians with interquartile ranges (IQRs) because of their non-normal distribution, and categorical variables were presented as frequencies and percentages. We compared medians using the nonparametric K-sample test on the equality of medians, and compared frequencies using the Pearson χ2 test. The discriminatory power of each biomarker in predicting readmission and death was calculated with the area under the receiver operating characteristic (ROC) curve (AUROC), using serum levels at discharge to better reflect the postdischarge period. Cutoff levels were selected by taking the best compromise between sensitivity and specificity according to the ROC curves (point nearest top left corner).24
Univariate logistic regression analysis was used to test the prediction of 30-day and 90-day unplanned readmission or death by each biomarker. We built 2 different multivariate models: one adjusting for age and LACE index points21 and the other adjusting for age and HOSPITAL score.22,23
To explore any association between reduction of stress during hospitalization and postdischarge outcome, we additionally calculated for each biomarker the difference between admission and discharge serum levels and assessed its association with readmission or death by logistic regression analysis. Because of the modification of cortisol serum levels during corticosteroid therapy, we excluded patients who underwent systemic corticosteroid therapy before or during hospitalization for the cortisol analysis (n = 105/346). Patients with a missing biomarker level were excluded from the respective analyses: discharge (ADM, 28 patients; copeptin, 27; cortisol, 24; prolactin, 24) and admission (ADM, 12 patients; copeptin, 15; cortisol, 8; prolactin, 8).
To assess an additional value of the biomarkers to prediction scores, we assessed the accuracy of the HOSPITAL score and LACE index in their original versions21,22 and after adding each biomarker. We used AUROC to assess the discriminatory power and used the method of DeLong et al.25 to compare results with and without adding each biomarker. Calibration was evaluated by comparing Hosmer-Lemeshow goodness-of-fit tests (P > 0.05 indicates good fit). Risk reclassification was assessed by Net Reclassification Improvement (NRI),26 quantifying how appropriately a new model reclassifies patients, compared with an old model. Basically, patients without outcome are assigned +1 if correctly reclassified to a lower risk category or –1 if incorrectly reclassified to a higher risk category. NRInonevent is the sum of all points/numbers of patients. Conversely, patients with outcome are assigned +1 if correctly reclassified to a higher risk category or –1 if incorrectly reclassified to a lower risk category. NRIevent is the sum of all points/numbers of patients. NRIoverall is the sum of NRIevent and NRInonevent ranging from –2 to 2, with a positive value indicating better classification with the new model.
Two-sided P < 0.05 was used for statistical significance. All statistical analyses were performed with Stata Release 13.0 (StataCorp).
Figure
RESULTS
Among the 530 patients admitted to the ward, 184 were excluded (120 meeting exclusion criteria, 64 unable to give consent, Figure). Among the 346 patients included, 11.6% (n = 40) had a 30-day unplanned readmission or death (37 were readmitted, 2 died during readmission, 3 died without readmission). Within 90 days, 26.6% (n = 92) had a readmission or death (84 were readmitted, 10 died during or after readmission, 8 died without readmission).
Table 1
Clinical Characteristics
Table 1 lists the patients’ baseline characteristics. Median age was 73 years (IQR, 64-82 years). Of the 346 patients included, 172 (49.7%) were men. Median CCI was 7 (IQR, 5-9); according to this index, 310 patients (89.6%) had at least 2 comorbidities. Median length of stay was 7 days (IQR, 4-12 days).
Table 2
Primary Diagnoses of Admission, Unplanned Readmission, and Death
The 3 main causes of index admission were cardiovascular disorder (n = 92), infectious disorder (n = 70), and neurologic disorder (n = 66). Table 2 lists the causes of readmissions and deaths. A same-diagnosis category between index admission and readmission was found in 17 (45.9%) of the 37 readmitted patients and in 3 (60%) of the 5 patients who died.
Biomarkers and 30-Day Unplanned Readmission or Death
AUROC was 0.53 (95% confidence interval [CI], 0.43-0.63) for ADM, 0.60 (95% CI, 0.50-0.70) for copeptin, 0.59 (95% CI, 0.44-0.73) for cortisol, and 0.56 (95% CI, 0.45-0.66) for prolactin. The difference between admission and discharge levels was not associated with unplanned readmission or death for any of the biomarkers (Supplemental Table 2).
Table 3
ADM and readmission or death. Median ADM level was not different between patients with and without readmission or death (1.0 nmol/L in each case; P = 1.00). The best cutoff level for ADM was 2 nmol/L (sensitivity, 16.7%; specificity, 91.8%). At this level, ADM was associated with a nonstatistically significant 130% increased odds of 30-day readmission or death (P = 0.09; Table 3, Supplemental Table 3). Conversely, the association with the 90-day outcome was significant (P = 0.02; Table 3, Supplemental Table 4).
Copeptin and readmission or death. Patients with 30-day readmission or death had a higher median copeptin level at discharge than patients without (10.4 pmol/Lvs 7.3 pmol/L; P = 0.03). At a copeptin level higher than 9 pmol/L (to convert to pg/mL, divide by 0.249; sensitivity, 66.7%; specificity, 59.7%), both 30-day readmission or death (adjusted odds ratio [OR], 2.69; 95% CI, 1.29-5.64; P = 0.009) and 90-day readmission or death (adjusted OR, 2.76; 95% CI, 1.56-4.88; P < 0.001) were nearly 3 times as likely (Table 3, Supplemental Tables 3 and 4).
Cortisol and readmission or death. Median cortisol was not statistically different between patients with and without the primary outcome (431 nmol/L vs 465 nmol/L; P = 0.72). At a cortisol level higher than 590 nmol/L (to convert to μg/dL, divide by 27.59; sensitivity, 54.6%; specificity, 76.4%), 30-day outcome was more than 3 times as likely (adjusted OR, 3.43; 95% CI, 1.36-8.65; P = 0.009; Table 3, Supplemental Table 3). At 90 days, only the model that adjusted for age and LACE index points remained statistically significant (P = 0.02; Table 3, Supplemental Table 4).
Prolactin and readmission or death. Median prolactin was not statistically different between patients with and without the primary outcome (15.1 μg/L vs 14.1 μg/L; P = 0.24). The best cutoff level for prolactin was 23 μg/L (to convert to mIU/L, divide by 0.05; sensitivity, 27.8%; specificity, 82.9%). Prolactin was associated with a nonstatistically significant increased odds of 30-day (P = 0.16) and 90-day (P = 0.24) readmission or death (Table 3, Supplemental Tables 3 and 4).
Additive Value of Biomarkers to HOSPITAL Score and LACE Index
The AUROC for the original HOSPITAL score, 0.70 (95% CI, 0.60-0.80), nonsignificantly increased to 0.76 after adding the biomarkers (P > 0.14). For the LACE index, AUROC was 0.59 (95% CI, 0.49-0.68), with a significant 0.10 increase with cortisol (P = 0.04) and a near significant increase with copeptin (P = 0.08). Calibration remained almost unchanged after adding the biomarkers to both models (Supplemental Table 5). NRIoverall was positive for all biomarkers, with statistical significance for copeptin added to the HOSPITAL score (0.47; 95% CI, 0.13-0.79) and for cortisol added to the LACE index (0.62; 95% CI, 0.15-1.06).
DISCUSSION
In this prospective cohort study, 30-day and 90-day unplanned readmission or death was nearly 3 times as likely for patients with high copeptin levels on discharge from an acute-care medical hospitalization, and 30-day readmission or death was more than 3 times as likely for patients with high cortisol levels. High ADM and prolactin levels were not consistently associated with readmission or death. Adding such biomarkers to readmission prediction models improved their performance.
These findings support the theory of posthospital syndrome,1 which describes a period of vulnerability with increased stress after discharge from an acute-care hospitalization, and which may be associated with adverse outcome. The hormones cortisol and copeptin are strongly related to the stress response in humans.4,5 As copeptin level has been associated with adverse prognosis for several disorders affecting a wide range of physiologic systems,3,5,15,27 it may be a valuable biomarker of a stressful condition, even independent of the system affected by the acute illness, and its use may be widely generalizable, in contrast to predictive factors identified in other studies.18,28,29
Although cortisol was independently associated with 30-day readmission or death, and may be an interesting biomarker and less expensive than copeptin, its measurement is limited in patients treated with systemic corticosteroids. Compared with cortisol, copeptin does not undergo diurnal variation, is less affected by corticosteroid therapy, and mirrors stress levels better.5,7,30,31 Our results showed that, contrary to cortisol, copeptin was also associated with longer term outcome. High ADM level was associated with readmission or death at 90 days only; lack of a significant association at 30 days might be attributable to a lack of power (fewer outcomes at 30 days). Conversely, prolactin level was consistently not associated with outcome. Prolactin may be affected by many drugs that act on the dopaminergic system (eg, domperidone), and therefore its levels may be more difficult to interpret.
Levels of biomarkers were similar to those measured in patients without previously studied conditions (eg, myocardial infarction).5,8,10,13,14,16,17 In most previous analyses, levels were measured during a stressful event, whereas we measured them at discharge. Therefore, these biomarkers may constitute sensitive markers of remaining stress at discharge.
Our finding that copeptin level was independently associated with readmission or death supports its relevance as a possible simple measure of the risk of adverse postdischarge outcome, independently of disease type and independently of known predictors. Stress biomarkers may therefore be valuable predictors of which patients are at high risk. All these biomarkers can be measured within 30 minutes, extending their use beyond everyday practice, except for the possible need of an extra blood draw.
The most accurate and validated models are the HOSPITAL score (AUROC range, 0.68-0.7723,32-36) and the LACE index (AUROC range, 0.56-0.6823,34,35,37). Adding biomarkers to these models improved overall performance (up to 0.10 increase in AUROC), which is remarkable given that, once a particular level of discriminatory power is reached, extremely large effect sizes from additional markers are needed to increase AUROC.26 Incremental improvement is objectively supported by positive NRI. Our results suggest biomarkers added to prediction models may improve identification of high-risk patients.
We found that less than 50% of the primary diagnoses belonged to the same diagnosis category at readmission and at index admission. This result is in line with previous findings that readmissions were related to the primary diagnosis at index admission in only 22% to 46% of cases,20,38 and supports our study hypothesis that readmission is related to underlying stress factors often independent of the underlying illness.1
Study Limitations and Strengths
Our study had some limitations. First, it was a single-center study with a limited sample size. However, we found significant results within the sample. Second, we could not adjust for drugs that were acting on the dopaminergic system and might have affected prolactin levels. However, such interactions would limit the use of this biomarker in clinical practice anyway. Third, we used specific cutoffs, which might decrease analytical power, in comparison with continuous analyses. However, we followed a recognized method24 and found a significant association even with categorized levels. Furthermore, the distribution of biomarkers could not be normalized by logarithmic transformation, and cutoff values have the advantage of being integrable into score point systems (eg, HOSPITAL score, LACE index). Fourth, although in 2 models we found consistent associations with several potential confounders, we could not exclude residual confounding. Fifth, this study was not powered to assess the biomarkers’ predictive value for readmission and death, which might explain the lack of significant differences between AUROC with and without the biomarkers. For all these reasons, this study should be considered hypothesis-generating.
Our study also had its strengths. First, to our knowledge, this is the first study of the association between stress biomarkers at discharge and unplanned readmission or death. Second, the quality of our data was high, with a low percentage of missing biomarker levels. Third, we excluded planned readmissions. Fourth, we used an unselected medical patient population, which had the noteworthy advantage of widening the generalizability of results.
CONCLUSION
In this prospective cohort study, high copeptin and cortisol levels at discharge were significantly associated with increased odds, ranging from 2-fold to more than 3-fold, of unplanned readmission or death within 30 days after discharge from an internal medicine ward. This finding supports the theory that a physiologic stress that patients experience during hospitalization makes them more susceptible to new health threats (posthospital syndrome). These biomarkers, copeptin in particular, may help us better identify patients at high risk of early unplanned readmission or death.
Acknowledgment
Biomarker measurement was funded by the research fund of the Department of General Internal Medicine, Fribourg Cantonal Hospital, Fribourg, Switzerland.
Disclosure
Nothing to report.
References
1. Krumholz HM. Post-hospital syndrome—an acquired, transient condition of generalized risk. N Engl J Med. 2013;368(2):100-102. PubMed 2. Morgenthaler NG, Struck J, Alonso C, Bergmann A. Measurement of midregional proadrenomedullin in plasma with an immunoluminometric assay. Clin Chem. 2005;51(10):1823-1829. PubMed 3. Dobsa L, Edozien KC. Copeptin and its potential role in diagnosis and prognosis of various diseases. Biochem Med. 2013;23(2):172-190. PubMed 4. Yilman M, Erenler AK, Baydin A. Copeptin: a diagnostic factor for critical patients. Eur Rev Med Pharmacol Sci. 2015;19(16):3030-3036. PubMed 5. Katan M, Christ-Crain M. The stress hormone copeptin: a new prognostic biomarker in acute illness. Swiss Med Wkly. 2010;140:w13101. PubMed 6. Struck J, Morgenthaler NG, Bergmann A. Copeptin, a stable peptide derived from the vasopressin precursor, is elevated in serum of sepsis patients. Peptides. 2005;26(12):2500-2504. PubMed 7. Darzy KH, Dixit KC, Shalet SM, Morgenthaler NG, Brabant G. Circadian secretion pattern of copeptin, the C-terminal vasopressin precursor fragment. Clin Chem. 2010;56(7):1190-1191. PubMed 8. Labad J, Stojanovic-Pérez A, Montalvo I, et al. Stress biomarkers as predictors of transition to psychosis in at-risk mental states: roles for cortisol, prolactin and albumin. J Psychiatr Res. 2015;60:163-169. PubMed 9. Olsson T, Asplund K, Hagg E. Pituitary-thyroid axis, prolactin and growth hormone in patients with acute stroke. J Intern Med. 1990;228(3):287-290. PubMed 10. Parissis JT, Farmakis D, Fountoulaki K, et al. Clinical and neurohormonal correlates and prognostic value of serum prolactin levels in patients with chronic heart failure. Eur J Heart Fail. 2013;15(10):1122-1130. PubMed 11. Theodoropoulou A, Metallinos IC, Elloul J, et al. Prolactin, cortisol secretion and thyroid function in patients with stroke of mild severity. Horm Metab Res. 2006;38(9):587-591. PubMed 12. Vardas K, Apostolou K, Briassouli E, et al. Early response roles for prolactin cortisol and circulating and cellular levels of heat shock proteins 72 and 90α in severe sepsis and SIRS. Biomed Res Int. 2014;2014:803561. PubMed 13. Bahrmann P, Christ M, Hofner B, et al. Prognostic value of different biomarkers for cardiovascular death in unselected older patients in the emergency department. Eur Heart J Acute Cardiovasc Care. 2016;5(8):568-578. PubMed 14. Christ-Crain M, Morgenthaler NG, Stolz D, et al. Pro-adrenomedullin to predict severity and outcome in community-acquired pneumonia [ISRCTN04176397]. Crit Care. 2006;10(3):R96. PubMed 15. Artunc F, Nowak A, Mueller C, et al. Plasma concentrations of the vasoactive peptide fragments mid-regional pro-adrenomedullin, C-terminal pro-endothelin 1 and copeptin in hemodialysis patients: associated factors and prediction of mortality. PLoS One. 2014;9(1):e86148. PubMed 16. Rotman-Pikielny P, Roash V, Chen O, Limor R, Stern N, Gur HG. Serum cortisol levels in patients admitted to the department of medicine: prognostic correlations and effects of age, infection, and comorbidity. Am J Med Sci. 2006;332(2):61-67. PubMed 17. Yamaji M, Tsutamoto T, Kawahara C, et al. Serum cortisol as a useful predictor of cardiac events in patients with chronic heart failure: the impact of oxidative stress. Circ Heart Fail. 2009;2(6):608-615. PubMed 18. Kansagara D, Englander H, Salanitro A, et al. Risk prediction models for hospital readmission: a systematic review. JAMA. 2011;306(15):1688-1698. PubMed 19. Charlson ME, Pompei P, Ales KL, MacKenzie CR. A new method of classifying prognostic comorbidity in longitudinal studies: development and validation. J Chronic Dis. 1987;40(5):373-383. PubMed 20. Donzé J, Lipsitz S, Bates DW, Schnipper JL. Causes and patterns of readmissions in patients with common comorbidities: retrospective cohort study. BMJ. 2013;347:f7171. PubMed 21. van Walraven C, Dhalla IA, Bell C, et al. Derivation and validation of an index to predict early death or unplanned readmission after discharge from hospital to the community. CMAJ. 2010;182(6):551-557. PubMed 22. Donzé J, Aujesky D, Williams D, Schnipper JL. Potentially avoidable 30-day hospital readmissions in medical patients: derivation and validation of a prediction model. JAMA Intern Med. 2013;173(8):632-638. PubMed 23. Aubert CE, Folly A, Mancinetti M, Hayoz D, Donzé J. Prospective validation and adaptation of the HOSPITAL score to predict high risk of unplanned readmission of medical patients. Swiss Med Wkly. 2016;146:w14335. PubMed 24. Zweig MH, Campbell G. Receiver-operating characteristic (ROC) plots: a fundamental evaluation tool in clinical medicine. Clin Chem. 1993;39(4):561-577. PubMed 25. DeLong ER, DeLong DM, Clarke-Pearson DL. Comparing the areas under two or more correlated receiver operating characteristic curves: a nonparametric approach. Biometrics. 1988;44(3):837-845. PubMed 26. Pencina MJ, D’Agostino RB Sr, Demler OV. Novel metrics for evaluating improvement in discrimination: net reclassification and integrated discrimination improvement for normal variables and nested models. Stat Med. 2012;31(2):101-113. PubMed 27. Folli C, Consonni D, Spessot M, et al. Diagnostic role of copeptin in patients presenting with chest pain in the emergency room. Eur J Intern Med. 2013;24(2):189-193. PubMed 28. Aujesky D, Mor MK, Geng M, Stone RA, Fine MJ, Ibrahim SA. Predictors of early hospital readmission after acute pulmonary embolism. Arch Intern Med. 2009;169(3):287-293. PubMed 29. Hammill BG, Curtis LH, Fonarow GC, et al. Incremental value of clinical data beyond claims data in predicting 30-day outcomes after heart failure hospitalization. Circ Cardiovasc Qual Outcomes. 2011;4(1):60-67. PubMed 30. Nickel CH, Bingisser R, Morgenthaler NG. The role of copeptin as a diagnostic and prognostic biomarker for risk stratification in the emergency department. BMC Med. 2012;10:7. PubMed 31. Katan M, Morgenthaler N, Widmer I, et al. Copeptin, a stable peptide derived from the vasopressin precursor, correlates with the individual stress level. Neuro Endocrinol Lett. 2008;29(3):341-346. PubMed 32. Donzé JD, Williams MV, Robinson EJ, et al. International validity of the HOSPITAL score to predict 30-day potentially avoidable hospital readmissions. JAMA Intern Med. 2016;176(4):496-502.PubMed
33. Burke RE, Schnipper JL, Williams MV, et al. The HOSPITAL score predicts potentially preventable 30-day readmissions in conditions targeted by the Hospital Readmissions Reduction Program. Med Care. 2017;55(3):285-290. PubMed 34. Garrison GM, Robelia PM, Pecina JL, Dawson NL. Comparing performance of 30-day readmission risk classifiers among hospitalized primary care patients. J Eval Clin Pract. 2017;23(3):524-529. PubMed 35. Cooksley T, Nanayakkara PW, Nickel CH, et al. Readmissions of medical patients: an external validation of two existing prediction scores. QJM. 2016;109(4):245-248. PubMed 36. Robinson R. The HOSPITAL score as a predictor of 30 day readmission in a retrospective study at a university affiliated community hospital. PeerJ. 2016;4:e2441. PubMed 37. Wang H, Robinson RD, Johnson C, et al. Using the LACE index to predict hospital readmissions in congestive heart failure patients. BMC Cardiovasc Disord. 2014;14:97. PubMed 38. Dunlay SM, Weston SA, Killian JM, Bell MR, Jaffe AS, Roger VL. Thirty-day rehospitalizations after acute myocardial infarction: a cohort study. Ann Intern Med. 2012;157(1):11-18. PubMed
*Address for correspondence and reprint requests: , Department of General Internal Medicine, Inselspital, Bern University Hospital, University of Bern, Freiburgstrasse, 3010 Bern, Switzerland; Telephone: 41-31-632-2111; Fax: 41-31-632-8885; E-mail: caroleelodie.aubert@insel.ch
Content Gating
Gated (full article locked unless allowed per User)
Communication among healthcare professionals is essential for high-quality patient care. However, communication is difficult in hospitals because of heavy workloads, rapidly evolving plans of care, and geographic dispersion of team members. When hospital-based professionals are not in the same place at the same time, they rely on technology to communicate. Pagers have historically been used to support communication in hospitals, but are limited in their capabilities. Several recent small studies have shown that some physicians have started using standard text messaging on smartphones for patient care–related (PCR) messages.1-3 Although potentially enhancing clinician efficiency, use of standard text messaging for PCR messages raises concern about security risks related to transmission of protected health information. Addressing these concerns are emerging secure mobile messaging applications designed for PCR communication. Although recent studies suggest these applications are well received by users, the adoption rate is largely unknown.4,5
We conducted a study to see if there was a shift in use of hospital-based communication technologies under way. We surveyed a national sample of hospital-based clinicians to characterize current use of communication technologies, assess potential risks and perceptions related to use of standard text messaging for PCR messages, and characterize the adoption of secure mobile messaging applications designed for PCR communication.
METHODS
Study Design
The study was a cross-sectional survey of hospitalists—physicians and advanced practice providers whose primary professional focus is care of hospitalized patients. We studied hospitalists because of their role in coordinating care for complex medical patients and because prior studies identified communication as a major component of their work.6,7 The Northwestern University Institutional Review Board deemed this study exempt.
Survey Instrument
Four investigators (Drs. O’Leary, Liebovitz, Wu, and Reddy) with expertise in interprofessional communication and information technology created a draft survey based in part on results of prior studies assessing clinicians’ use of smartphones and standard text messaging for PCR communication.1,3 In the first section of the survey, we asked respondents which technologies were provided by their organization and which technologies they used for PCR communication. In the second section, we asked respondents about their use and perceptions of standard text messaging for PCR communication. In the third section, we asked about implementation and adoption of secure mobile messaging applications at their hospital. In the fourth and final section, we asked for demographic information.
We randomly selected 8 attendees of the 2015 Midwest Hospital Medicine Conference and invited them to participate in a focus group that would review a paper version of the draft survey and recommend revisions. Using the group’s feedback, we revised the ordinal response scale for questions related to standard text messaging and made other minor edits. We then created an Internet-based version of the survey and pilot-tested it with 8 hospitalists from 4 diverse hospitalist groups within the Northwestern Medicine Health System. We made additional minor edits based on pilot-test feedback.
Sampling Strategy
We used the largest hospitalist database maintained by the Society of Hospital Medicine (SHM). This database includes information on more than 28,000 individuals, representing SHM members and nonmembers who had participated in organizational events. In addition to clinically active hospitalists, the database includes non-hospitalists and clinically inactive hospitalists. We used this database to try to capture the largest possible number of potentially eligible hospitalists.
Survey Administration
We administered the survey in collaboration with SHM staff. E-mails that included a link to the survey on the Survey Monkey website were sent by SHM staff to individuals within the database. These e-mails were sent through Real Magnet, an e-mail marketing platform8 that allowed the SHM staff to determine the number of individuals who received and opened the e-mail and the number who clicked on the survey link. To try to promote participation, we offered respondents the chance to enter a lottery to win one of four $50 gift certificates. The initial e-mail was sent in April 2016, a reminder in May 2016, and a final reminder in July 2016.
Data Analysis
We calculated descriptive statistics of participants’ demographic characteristics. We estimated nonresponse bias by comparing demographic characteristics across waves of respondents using analysis of variance, t tests, and χ2 tests. This method is based on the finding that characteristics of late respondents often resemble those of nonrespondents.9 We collapsed response categories for communication technologies to simplify interpretation. For example, numeric pagers, alphanumeric pagers, and 2-way pagers were collapsed into a pagers category. We used t tests and χ2 tests to assess for associations between receipt of standard text messages for PCR communication and respondents’ age, sex, race, professional type, hospital size, practice location, and hospital teaching status. Similarly, we used t tests and χ2 tests to explore associations between implementation of secure mobile messaging application and respondents’ age, sex, race, professional type, hospital size, practice location, and hospital teaching status. All statistical analyses were performed with Stata Release 11.2 (StataCorp).
RESULTS
Participant Characteristics
Overall, the survey link was sent to 28,870 e-mail addresses. Addresses for which e-mails were undeliverable or for which the e-mail was never opened were excluded, yielding a total of 5,786 eligible respondents in the sample. After rejecting 42 clinically inactive individuals, 70 individuals who responded to only the initial item, and 27 duplicates, a total of 620 participant surveys were included in the final analysis. The adjusted response rate was 11.0%.
Table 1
As shown in Table 1, mean (SD) respondent age was 42.9 (10.0) years, nearly half of the respondents were female, nearly a third were of nonwhite race, an overwhelming majority were physicians, and workplaces were in a variety of hospital settings. The sample size used to calculate demographic characteristics varied from 538 to 549 because of missing data for these items. We found no significant differences in demographic characteristics of respondents across the 3 survey waves, suggesting a lack of survey response bias (Supplemental Table).
Provision and Use of Communication Technologies for PCR Communication
Pagers were provided to the majority of respondents by their hospitals (79.8%, 495/620). Other devices were provided much less frequently, with 21.0% (130/620) reporting their organization provided a smartphone, 20.2% (125/620) a mobile phone, and 4.4% (27/620) a hands-free communication device. Organizations provided no device to 8.2% (51/620) of respondents and an “other” device to 5.5% (34/620).
Table 2
An overwhelming majority used multiple technologies to receive PCR communication, with 17.7% (110/620) of respondents indicating use of 2 technologies, 22.7% (141/620) use of 3 technologies, and 49.4% (306/620) use of more than 3 technologies. The distribution of the most common ways respondents received PCR communication is shown in Table 2. Pagers were the most common form of technology, with 49.0% (304/620) indicating this was the primary way they received PCR communication. Being called on a mobile phone provided by the organization was the second most common form of receiving PCR communication (11.0%, 68/620), followed by standard text messaging (9.5%, 59/620) and mobile secure messaging using an application approved by the organization (9.0%, 56/620).
Participants’ Experiences With Standard Text Messaging for PCR Communication
Table 3
Participants’ experiences with standard text messaging for PCR communication are summarized in Table 3. Overall, 65.1% (369/ 567) of respondents reported receiving standard text messages for PCR communication at least once per week when on clinical duty, and 52.9% (300/567) received standard text messages at least once per day.
Overall, 21.5% (122/567) of respondents received standard text messages that included individually identifiable information at least once per day, and 41.3% (234/567) received messages that included some identifiable information (eg, patient initials, room number) at least once per day. About one-fifth of respondents (21.0%, 119/567) indicated receiving standard text messages for urgent clinical issues at least once per day. Receipt of standard text messages for a patient for whom the respondent was no longer providing care, delays in receipt of messages, messages missed because smartphones were set to vibrate, and receipt of messages when not on clinical duty occurred, but less frequently. We found no significant associations between receipt of PCR standard text messages once or more per day and respondents’ age, sex, race, professional type, hospital size, or hospital teaching status. A higher percentage of respondents in the South (63.2%, 96/152) and West (57.9%, 70/121) reported receipt of at least 1 PCR standard text message per day, compared with respondents in the Northeast (51.9%, 54/104), Midwest (45.2%, 61/135), and other (25.0%, 4/16) (P = 0.003).
Senders of PCR standard text messages. Of respondents who received standard text messages for PCR communication at least once per week, a majority reported receiving messages from physicians in the same specialty (88.6%, 327/369) and from physicians in other specialties (71.3%, 263/369). A minority of respondents reported receiving messages from nurses (35.0%, 129/369), social workers (30.6%, 113/369), and pharmacists (27.9%, 103/369).
Perceptions among users.Ofrespondents who received standard text messages for PCR communication at least once per week, an overwhelming majority agreed or strongly agreed that use of standard text messaging allowed them to provide better care (81.7%, 295/361) and made them more efficient (87.3%, 315/361). A majority also agreed or strongly agreed that standard text messaging posed a risk to the privacy and confidentiality of patient information (56.4%, 203/360), and nearly a third indicated that standard text messaging posed a risk to the timely receipt of messages by the correct individual (27.6%, 100/362). Overall, a large majority agreed or strongly agreed that the benefits of using standard text messaging for PCR communication outweighed the risks (85.0%, 306/360).
Figure
Adoption of Organization-Approved Secure Mobile Messaging Applications
Participants’ reported adoption of organization-approved secure mobile messaging applications is shown in the Figure. About one-fourth (26.6%, 146/549) of respondents reported that their organization had implemented a secure messaging application and that some clinicians were using it, whereas relatively few (7.3%, 40/549) reported that their organization had implemented an application that was being used by most clinicians. A substantial portion of respondents (21.3%, 117/549) were not sure whether their organization was planning to implement a secure mobile messaging application for PCR communication. We found no significant associations between partial or nearly full implementation of a secure mobile messaging application and respondents’ age, sex, race, professional type, hospital size, or practice location. A lower percentage of respondents in major teaching hospitals (28.0%, 67/239) reported partial or nearly full implementation of a secure mobile messaging application, compared with respondents from teaching hospitals (39.6%, 74/187) and nonteaching hospitals (39.2%, 40/102) (P = 0.02).
DISCUSSION
We found that pagers were the technology most commonly used by hospital-based clinicians, but also that a majority have used standard text messaging for PCR communication, and that relatively few hospitals had fully implemented secure mobile messaging applications. Our findings reveal a wide range of technology use and suggest an evolution to support communication among healthcare professionals.
The persistence of pagers as the technology most commonly provided by hospitals and used by clinicians for communication is noteworthy in that pagers are limited in their capabilities, typically not allowing a response to the message sender or the ability to forward a message, and often not allowing the ability to send messages to multiple recipients. The continued heavy use of pagers may be explained by their relatively low cost, especially compared with investment in new technologies, and reliable receipt of messages, even in areas with no cell phone service or WiFi signal. Furthermore, hospitals’ providing pagers allows for oversight, directory creation, and the potential for integration into other information systems. In 2 recent studies, inpatient paging communication was evaluated in depth. Carlile et al.10 found that the majority of pages requested a response, requiring an interruption in physician workflow to initiate a callback. Kummerow Broman et al.11 similarly found that a majority of pages requested a callback; they also found a high volume of nonurgent messages. With pager use, a high volume of messages, many of which require a response but are nonurgent, makes for a highly interruptive workflow.
That more than half of our hospital-based clinicians received standard text messages for PCR communication once or more per day is consistent with other, smaller studies. Kuhlmann et al.1 surveyed 97 pediatric hospitalists and found that a majority sent and received work-related text messages. Prochaska et al.2 surveyed 131 residents and found that standard text messaging was the communication method preferred by the majority of residents. Similar to these studies, our study found that receipt of standard text messages that included protected health information was fairly common. However, we identified additional risks related to standard text messaging. One-fifth of our respondents received standard text messages for urgent clinical issues once or more per day, and many respondents reported occasional receipt of messages regarding a patient for whom they were no longer providing care and receipt of messages when not on clinical duty. The usual inability to automate forwarding of standard text messages to another clinician creates the potential for clinically important messages to be delayed or missed. These risks have not been reported in the literature, and we think healthcare systems may not be fully aware of them. Our findings suggest that many clinicians have migrated from pagers to standard text messaging for the enhanced efficiency, and they perceive that the benefit of improved efficiency outweighs the risks to protected health information and the delay in receipt of clinically important messages by the correct individual.
Secure mobile messaging applications seem to address the limitations of both pagers and standard text messaging. Secure mobile messaging applications typically allow message response, message forwarding, multiple recipients, directory creation, the potential to create escalation schemes for nonresponse, and integration with other information systems, including electronic health records. Although several hospitals have developed their own systems,4,12,13 most hospitals likely will purchase a vendor-based system. We found that a minority of hospitals had implemented a secure messaging application, and even fewer had most of their clinicians using it. Although little research has been conducted on these applications, studies suggest they are well received by users.4,5 Given that paging communication studies have found a large portion of pages are sent by nurses and other non-physician team members, secure mobile messaging applications should allow for direct message exchange with all professionals caring for a patient.10,11 Furthermore, hospitals will need to ensure adequate cell phone and WiFi signal strength throughout their facilities to ensure reliable and timely delivery of messages.
Our study had several limitations. We used a large database to conduct a national survey but had a low response rate and some drop-off of responses within surveys. Our sample reflected respondent diversity, and our analyses of demographic characteristics found no significant differences across survey response waves. Unfortunately, we did not have nonrespondents’ characteristics and therefore could not compare them with respondents’. It is possible that nonrespondents may have had different practices related to use of communication technology, especially in light of the fact that the survey was conducted by e-mail. However, given our finding that use of standard text messaging was comparable to that in other studies,1,2 and given the similarity of respondents’ characteristics across response waves, our findings likely were not affected by nonresponse bias.9 Last, we used a survey that had not been validated. However, this survey was created by experts in interprofessional collaboration and information technology, was informed by prior studies, and was iteratively refined during pretesting and pilot testing.
CONCLUSION
Pagers remain the technology most commonly used by hospital-based clinicians, but a majority also use standard text messaging for PCR communication, and relatively few hospitals have fully implemented secure mobile messaging applications. The wide range of technologies used suggests an evolution of methods to support communication among healthcare professionals. An optimized system will improve communication efficiency while ensuring the security of their patients’ information and the timely receipt of that information by the intended clinician.
Acknowledgment
The authors thank the Society of Hospital Medicine and the society staff who helped administer the survey, especially Mr. Ethan Gray.
1. Kuhlmann S, Ahlers-Schmidt CR, Steinberger E. TXT@WORK: pediatric hospitalists and text messaging. Telemed J E Health. 2014;20(7):647-652. PubMed 2. Prochaska MT, Bird AN, Chadaga A, Arora VM. Resident use of text messaging for patient care: ease of use or breach of privacy? JMIR Med Inform. 2015;3(4):e37. PubMed 3. Tran K, Morra D, Lo V, Quan SD, Abrams H, Wu RC. Medical students and personal smartphones in the clinical environment: the impact on confidentiality of personal health information and professionalism. J Med Internet Res. 2014;16(5):e132. PubMed 4. Patel N, Siegler JE, Stromberg N, Ravitz N, Hanson CW. Perfect storm of inpatient communication needs and an innovative solution utilizing smartphones and secured messaging. Appl Clin Inform. 2016;7(3):777-789. PubMed 5. Przybylo JA, Wang A, Loftus P, Evans KH, Chu I, Shieh L. Smarter hospital communication: secure smartphone text messaging improves provider satisfaction and perception of efficacy, workflow. J Hosp Med. 2014;9(9):573-578. PubMed 6. O’Leary KJ, Liebovitz DM, Baker DW. How hospitalists spend their time: insights on efficiency and safety. J Hosp Med. 2006;1(2):88-93. PubMed 7. Tipping MD, Forth VE, O’Leary KJ, et al. Where did the day go?—a time-motion study of hospitalists. J Hosp Med. 2010;5(6):323-328. PubMed 8. Real Magnet. http://www.realmagnet.com. Accessed December 20, 2016. 9. Armstrong JS, Overton T. Estimating nonresponse bias in mail surveys. J Mark Res. 1977;14(3):396-402. 10. Carlile N, Rhatigan JJ, Bates DW. Why do we still page each other? Examining the frequency, types and senders of pages in academic medical services. BMJ Qual Saf. 2017;26(1):24-29. PubMed 11. Kummerow Broman K, Kensinger C, Phillips C, et al. Characterizing the clamor: an in-depth analysis of inpatient paging communication. Acad Med. 2016;91(7):1015-1021. PubMed 12. Dalal AK, Schnipper J, Massaro A, et al. A web-based and mobile patient-centered “microblog” messaging platform to improve care team communication in acute care. J Am Med Inform Assoc. 2017;24(e1):e178-e184. PubMed 13. Wu R, Lo V, Morra D, et al. A smartphone-enabled communication system to improve hospital communication: usage and perceptions of medical trainees and nurses on general internal medicine wards. J Hosp Med. 2015;10(2):83-89. PubMed
Communication among healthcare professionals is essential for high-quality patient care. However, communication is difficult in hospitals because of heavy workloads, rapidly evolving plans of care, and geographic dispersion of team members. When hospital-based professionals are not in the same place at the same time, they rely on technology to communicate. Pagers have historically been used to support communication in hospitals, but are limited in their capabilities. Several recent small studies have shown that some physicians have started using standard text messaging on smartphones for patient care–related (PCR) messages.1-3 Although potentially enhancing clinician efficiency, use of standard text messaging for PCR messages raises concern about security risks related to transmission of protected health information. Addressing these concerns are emerging secure mobile messaging applications designed for PCR communication. Although recent studies suggest these applications are well received by users, the adoption rate is largely unknown.4,5
We conducted a study to see if there was a shift in use of hospital-based communication technologies under way. We surveyed a national sample of hospital-based clinicians to characterize current use of communication technologies, assess potential risks and perceptions related to use of standard text messaging for PCR messages, and characterize the adoption of secure mobile messaging applications designed for PCR communication.
METHODS
Study Design
The study was a cross-sectional survey of hospitalists—physicians and advanced practice providers whose primary professional focus is care of hospitalized patients. We studied hospitalists because of their role in coordinating care for complex medical patients and because prior studies identified communication as a major component of their work.6,7 The Northwestern University Institutional Review Board deemed this study exempt.
Survey Instrument
Four investigators (Drs. O’Leary, Liebovitz, Wu, and Reddy) with expertise in interprofessional communication and information technology created a draft survey based in part on results of prior studies assessing clinicians’ use of smartphones and standard text messaging for PCR communication.1,3 In the first section of the survey, we asked respondents which technologies were provided by their organization and which technologies they used for PCR communication. In the second section, we asked respondents about their use and perceptions of standard text messaging for PCR communication. In the third section, we asked about implementation and adoption of secure mobile messaging applications at their hospital. In the fourth and final section, we asked for demographic information.
We randomly selected 8 attendees of the 2015 Midwest Hospital Medicine Conference and invited them to participate in a focus group that would review a paper version of the draft survey and recommend revisions. Using the group’s feedback, we revised the ordinal response scale for questions related to standard text messaging and made other minor edits. We then created an Internet-based version of the survey and pilot-tested it with 8 hospitalists from 4 diverse hospitalist groups within the Northwestern Medicine Health System. We made additional minor edits based on pilot-test feedback.
Sampling Strategy
We used the largest hospitalist database maintained by the Society of Hospital Medicine (SHM). This database includes information on more than 28,000 individuals, representing SHM members and nonmembers who had participated in organizational events. In addition to clinically active hospitalists, the database includes non-hospitalists and clinically inactive hospitalists. We used this database to try to capture the largest possible number of potentially eligible hospitalists.
Survey Administration
We administered the survey in collaboration with SHM staff. E-mails that included a link to the survey on the Survey Monkey website were sent by SHM staff to individuals within the database. These e-mails were sent through Real Magnet, an e-mail marketing platform8 that allowed the SHM staff to determine the number of individuals who received and opened the e-mail and the number who clicked on the survey link. To try to promote participation, we offered respondents the chance to enter a lottery to win one of four $50 gift certificates. The initial e-mail was sent in April 2016, a reminder in May 2016, and a final reminder in July 2016.
Data Analysis
We calculated descriptive statistics of participants’ demographic characteristics. We estimated nonresponse bias by comparing demographic characteristics across waves of respondents using analysis of variance, t tests, and χ2 tests. This method is based on the finding that characteristics of late respondents often resemble those of nonrespondents.9 We collapsed response categories for communication technologies to simplify interpretation. For example, numeric pagers, alphanumeric pagers, and 2-way pagers were collapsed into a pagers category. We used t tests and χ2 tests to assess for associations between receipt of standard text messages for PCR communication and respondents’ age, sex, race, professional type, hospital size, practice location, and hospital teaching status. Similarly, we used t tests and χ2 tests to explore associations between implementation of secure mobile messaging application and respondents’ age, sex, race, professional type, hospital size, practice location, and hospital teaching status. All statistical analyses were performed with Stata Release 11.2 (StataCorp).
RESULTS
Participant Characteristics
Overall, the survey link was sent to 28,870 e-mail addresses. Addresses for which e-mails were undeliverable or for which the e-mail was never opened were excluded, yielding a total of 5,786 eligible respondents in the sample. After rejecting 42 clinically inactive individuals, 70 individuals who responded to only the initial item, and 27 duplicates, a total of 620 participant surveys were included in the final analysis. The adjusted response rate was 11.0%.
Table 1
As shown in Table 1, mean (SD) respondent age was 42.9 (10.0) years, nearly half of the respondents were female, nearly a third were of nonwhite race, an overwhelming majority were physicians, and workplaces were in a variety of hospital settings. The sample size used to calculate demographic characteristics varied from 538 to 549 because of missing data for these items. We found no significant differences in demographic characteristics of respondents across the 3 survey waves, suggesting a lack of survey response bias (Supplemental Table).
Provision and Use of Communication Technologies for PCR Communication
Pagers were provided to the majority of respondents by their hospitals (79.8%, 495/620). Other devices were provided much less frequently, with 21.0% (130/620) reporting their organization provided a smartphone, 20.2% (125/620) a mobile phone, and 4.4% (27/620) a hands-free communication device. Organizations provided no device to 8.2% (51/620) of respondents and an “other” device to 5.5% (34/620).
Table 2
An overwhelming majority used multiple technologies to receive PCR communication, with 17.7% (110/620) of respondents indicating use of 2 technologies, 22.7% (141/620) use of 3 technologies, and 49.4% (306/620) use of more than 3 technologies. The distribution of the most common ways respondents received PCR communication is shown in Table 2. Pagers were the most common form of technology, with 49.0% (304/620) indicating this was the primary way they received PCR communication. Being called on a mobile phone provided by the organization was the second most common form of receiving PCR communication (11.0%, 68/620), followed by standard text messaging (9.5%, 59/620) and mobile secure messaging using an application approved by the organization (9.0%, 56/620).
Participants’ Experiences With Standard Text Messaging for PCR Communication
Table 3
Participants’ experiences with standard text messaging for PCR communication are summarized in Table 3. Overall, 65.1% (369/ 567) of respondents reported receiving standard text messages for PCR communication at least once per week when on clinical duty, and 52.9% (300/567) received standard text messages at least once per day.
Overall, 21.5% (122/567) of respondents received standard text messages that included individually identifiable information at least once per day, and 41.3% (234/567) received messages that included some identifiable information (eg, patient initials, room number) at least once per day. About one-fifth of respondents (21.0%, 119/567) indicated receiving standard text messages for urgent clinical issues at least once per day. Receipt of standard text messages for a patient for whom the respondent was no longer providing care, delays in receipt of messages, messages missed because smartphones were set to vibrate, and receipt of messages when not on clinical duty occurred, but less frequently. We found no significant associations between receipt of PCR standard text messages once or more per day and respondents’ age, sex, race, professional type, hospital size, or hospital teaching status. A higher percentage of respondents in the South (63.2%, 96/152) and West (57.9%, 70/121) reported receipt of at least 1 PCR standard text message per day, compared with respondents in the Northeast (51.9%, 54/104), Midwest (45.2%, 61/135), and other (25.0%, 4/16) (P = 0.003).
Senders of PCR standard text messages. Of respondents who received standard text messages for PCR communication at least once per week, a majority reported receiving messages from physicians in the same specialty (88.6%, 327/369) and from physicians in other specialties (71.3%, 263/369). A minority of respondents reported receiving messages from nurses (35.0%, 129/369), social workers (30.6%, 113/369), and pharmacists (27.9%, 103/369).
Perceptions among users.Ofrespondents who received standard text messages for PCR communication at least once per week, an overwhelming majority agreed or strongly agreed that use of standard text messaging allowed them to provide better care (81.7%, 295/361) and made them more efficient (87.3%, 315/361). A majority also agreed or strongly agreed that standard text messaging posed a risk to the privacy and confidentiality of patient information (56.4%, 203/360), and nearly a third indicated that standard text messaging posed a risk to the timely receipt of messages by the correct individual (27.6%, 100/362). Overall, a large majority agreed or strongly agreed that the benefits of using standard text messaging for PCR communication outweighed the risks (85.0%, 306/360).
Figure
Adoption of Organization-Approved Secure Mobile Messaging Applications
Participants’ reported adoption of organization-approved secure mobile messaging applications is shown in the Figure. About one-fourth (26.6%, 146/549) of respondents reported that their organization had implemented a secure messaging application and that some clinicians were using it, whereas relatively few (7.3%, 40/549) reported that their organization had implemented an application that was being used by most clinicians. A substantial portion of respondents (21.3%, 117/549) were not sure whether their organization was planning to implement a secure mobile messaging application for PCR communication. We found no significant associations between partial or nearly full implementation of a secure mobile messaging application and respondents’ age, sex, race, professional type, hospital size, or practice location. A lower percentage of respondents in major teaching hospitals (28.0%, 67/239) reported partial or nearly full implementation of a secure mobile messaging application, compared with respondents from teaching hospitals (39.6%, 74/187) and nonteaching hospitals (39.2%, 40/102) (P = 0.02).
DISCUSSION
We found that pagers were the technology most commonly used by hospital-based clinicians, but also that a majority have used standard text messaging for PCR communication, and that relatively few hospitals had fully implemented secure mobile messaging applications. Our findings reveal a wide range of technology use and suggest an evolution to support communication among healthcare professionals.
The persistence of pagers as the technology most commonly provided by hospitals and used by clinicians for communication is noteworthy in that pagers are limited in their capabilities, typically not allowing a response to the message sender or the ability to forward a message, and often not allowing the ability to send messages to multiple recipients. The continued heavy use of pagers may be explained by their relatively low cost, especially compared with investment in new technologies, and reliable receipt of messages, even in areas with no cell phone service or WiFi signal. Furthermore, hospitals’ providing pagers allows for oversight, directory creation, and the potential for integration into other information systems. In 2 recent studies, inpatient paging communication was evaluated in depth. Carlile et al.10 found that the majority of pages requested a response, requiring an interruption in physician workflow to initiate a callback. Kummerow Broman et al.11 similarly found that a majority of pages requested a callback; they also found a high volume of nonurgent messages. With pager use, a high volume of messages, many of which require a response but are nonurgent, makes for a highly interruptive workflow.
That more than half of our hospital-based clinicians received standard text messages for PCR communication once or more per day is consistent with other, smaller studies. Kuhlmann et al.1 surveyed 97 pediatric hospitalists and found that a majority sent and received work-related text messages. Prochaska et al.2 surveyed 131 residents and found that standard text messaging was the communication method preferred by the majority of residents. Similar to these studies, our study found that receipt of standard text messages that included protected health information was fairly common. However, we identified additional risks related to standard text messaging. One-fifth of our respondents received standard text messages for urgent clinical issues once or more per day, and many respondents reported occasional receipt of messages regarding a patient for whom they were no longer providing care and receipt of messages when not on clinical duty. The usual inability to automate forwarding of standard text messages to another clinician creates the potential for clinically important messages to be delayed or missed. These risks have not been reported in the literature, and we think healthcare systems may not be fully aware of them. Our findings suggest that many clinicians have migrated from pagers to standard text messaging for the enhanced efficiency, and they perceive that the benefit of improved efficiency outweighs the risks to protected health information and the delay in receipt of clinically important messages by the correct individual.
Secure mobile messaging applications seem to address the limitations of both pagers and standard text messaging. Secure mobile messaging applications typically allow message response, message forwarding, multiple recipients, directory creation, the potential to create escalation schemes for nonresponse, and integration with other information systems, including electronic health records. Although several hospitals have developed their own systems,4,12,13 most hospitals likely will purchase a vendor-based system. We found that a minority of hospitals had implemented a secure messaging application, and even fewer had most of their clinicians using it. Although little research has been conducted on these applications, studies suggest they are well received by users.4,5 Given that paging communication studies have found a large portion of pages are sent by nurses and other non-physician team members, secure mobile messaging applications should allow for direct message exchange with all professionals caring for a patient.10,11 Furthermore, hospitals will need to ensure adequate cell phone and WiFi signal strength throughout their facilities to ensure reliable and timely delivery of messages.
Our study had several limitations. We used a large database to conduct a national survey but had a low response rate and some drop-off of responses within surveys. Our sample reflected respondent diversity, and our analyses of demographic characteristics found no significant differences across survey response waves. Unfortunately, we did not have nonrespondents’ characteristics and therefore could not compare them with respondents’. It is possible that nonrespondents may have had different practices related to use of communication technology, especially in light of the fact that the survey was conducted by e-mail. However, given our finding that use of standard text messaging was comparable to that in other studies,1,2 and given the similarity of respondents’ characteristics across response waves, our findings likely were not affected by nonresponse bias.9 Last, we used a survey that had not been validated. However, this survey was created by experts in interprofessional collaboration and information technology, was informed by prior studies, and was iteratively refined during pretesting and pilot testing.
CONCLUSION
Pagers remain the technology most commonly used by hospital-based clinicians, but a majority also use standard text messaging for PCR communication, and relatively few hospitals have fully implemented secure mobile messaging applications. The wide range of technologies used suggests an evolution of methods to support communication among healthcare professionals. An optimized system will improve communication efficiency while ensuring the security of their patients’ information and the timely receipt of that information by the intended clinician.
Acknowledgment
The authors thank the Society of Hospital Medicine and the society staff who helped administer the survey, especially Mr. Ethan Gray.
Disclosure
Nothing to report.
References
1. Kuhlmann S, Ahlers-Schmidt CR, Steinberger E. TXT@WORK: pediatric hospitalists and text messaging. Telemed J E Health. 2014;20(7):647-652. PubMed 2. Prochaska MT, Bird AN, Chadaga A, Arora VM. Resident use of text messaging for patient care: ease of use or breach of privacy? JMIR Med Inform. 2015;3(4):e37. PubMed 3. Tran K, Morra D, Lo V, Quan SD, Abrams H, Wu RC. Medical students and personal smartphones in the clinical environment: the impact on confidentiality of personal health information and professionalism. J Med Internet Res. 2014;16(5):e132. PubMed 4. Patel N, Siegler JE, Stromberg N, Ravitz N, Hanson CW. Perfect storm of inpatient communication needs and an innovative solution utilizing smartphones and secured messaging. Appl Clin Inform. 2016;7(3):777-789. PubMed 5. Przybylo JA, Wang A, Loftus P, Evans KH, Chu I, Shieh L. Smarter hospital communication: secure smartphone text messaging improves provider satisfaction and perception of efficacy, workflow. J Hosp Med. 2014;9(9):573-578. PubMed 6. O’Leary KJ, Liebovitz DM, Baker DW. How hospitalists spend their time: insights on efficiency and safety. J Hosp Med. 2006;1(2):88-93. PubMed 7. Tipping MD, Forth VE, O’Leary KJ, et al. Where did the day go?—a time-motion study of hospitalists. J Hosp Med. 2010;5(6):323-328. PubMed 8. Real Magnet. http://www.realmagnet.com. Accessed December 20, 2016. 9. Armstrong JS, Overton T. Estimating nonresponse bias in mail surveys. J Mark Res. 1977;14(3):396-402. 10. Carlile N, Rhatigan JJ, Bates DW. Why do we still page each other? Examining the frequency, types and senders of pages in academic medical services. BMJ Qual Saf. 2017;26(1):24-29. PubMed 11. Kummerow Broman K, Kensinger C, Phillips C, et al. Characterizing the clamor: an in-depth analysis of inpatient paging communication. Acad Med. 2016;91(7):1015-1021. PubMed 12. Dalal AK, Schnipper J, Massaro A, et al. A web-based and mobile patient-centered “microblog” messaging platform to improve care team communication in acute care. J Am Med Inform Assoc. 2017;24(e1):e178-e184. PubMed 13. Wu R, Lo V, Morra D, et al. A smartphone-enabled communication system to improve hospital communication: usage and perceptions of medical trainees and nurses on general internal medicine wards. J Hosp Med. 2015;10(2):83-89. PubMed
In 2014, the United States spent $3 trillion on healthcare; hospitalization consumed 32% of these expenditures.1 Today, Medicare patients account for over 50% of hospital days and over 30% of all hospital discharges in the United States.2 Despite this staggering financial burden, hospitalization of older adults often results in poor patient outcomes.3-6 The exponential growth of the hospitalist movement, from 350 hospitalists nationwide in 1995 to over 44,000 in 2014, has become the key strategy for providing care to hospitalized geriatric patients.7-10 Most of these hospitalists have not received geriatric training.11-15
There is growing evidence that a geriatric approach, emphasizing multidisciplinary management of the complex needs of older patients, leads to improved outcomes. Geriatric Evaluation and Management Units (GEMUs), such as Acute Care for Elderly (ACE) models, have demonstrated significant decreases in functional decline, institutionalization, and death in randomized controlled trials.16,17 Multidisciplinary, nonunit based efforts, such as the mobile acute care of elderly (MACE), proactive consultation models (Sennour/Counsell), and the Hospital Elder Life Program (HELP), have demonstrated success in preventing adverse events and decreasing length of stay (LOS).17-20
However, these models have not been systematically implemented due to challenges in generalizability and replicability in diverse settings. To address this concern, an alternative approach must be developed to widely “generalize” geriatric expertise throughout hospitals, regardless of their location, size, and resources. This initiative will require systematic integration of evidence-based decision support tools for the standardization of clinical management in hospitalized older adults.21
The 1998 Assessing Care of Vulnerable Elders (ACOVE) project developed a standardized tool to measure and evaluate the quality of care by using a comprehensive set of quality indicators (QIs) to improve the care of “vulnerable elders” (VEs) at a high risk for functional and cognitive decline and death.22-24The latest systematic review concludes that, although many studies have used ACOVE as an assessmenttool of quality, there has been a dearth of studies investigating the ACOVE QIs as an intervention to improve patient care.25
Our study investigated the role of ACOVE as an intervention by using the QIs as a standardized checklist in the acute care setting. We selected the 4 most commonly encountered QIs in the hospital setting, namely venous thrombosis prophylaxis (VTE), indwelling bladder catheter, mobilization, and delirium evaluation, in order to test the feasibility and impact of systematically implementing these ACOVE QIs as a therapeutic intervention for all hospitalized older adults.
METHODS
This study (IRB #13-644B) was conducted using a prospective intervention with a nonequivalent control group design comprised of retrospective chart data from May 1, 2014, to June 30, 2015. Process and outcome variables were extracted from electronic medical records ([EMR], Sunrise Clinical Manager [SCM]) of 2,396 patients, with 530 patients in the intervention unit and 1,866 on the control units, at a large academic tertiary center operating in the greater New York metropolitan area. Our study investigated the role of ACOVE as an intervention to improve patient care by using selected QIs as a standardized checklist tool in the acute care setting. Of the original 30 hospital-specific QIs, our study focused on the care of older adults admitted to the medicine service.26 We selected commonly encountered QIs, with the objective of testing the feasibility and impact of implementing the ACOVE QIs as an intervention to improve care of hospitalized older adults. This intervention consisted of applying the checklist tool, constructed with 4 selected ACOVE QIs and administered daily during interdisciplinary rounds, namely: 2 general “medical” indicators, VTE prophylaxis and indwelling bladder catheters, and 2 “geriatric”-focused indicators, mobilization and delirium evaluation.
Table 1
Subject matter experts (hospitalists, geriatricians, researchers, administrators, and nurses) reviewed the ACOVE QIs and agreed upon the adaptation of the QIs from a quality measure assessment into a feasible and acceptable intervention checklist tool (Table 1). The checklist was reviewed during daily interdisciplinary rounds for all patients 75 years and older. While ACOVE defined vulnerable elders by using the Vulnerable Elder Screen (VES), we wanted to apply this intervention more broadly to all hospitalized older adults who are most at risk for poor outcomes.27 Patients admitted to the intensive care unit, inpatient psychiatry, inpatient leukemia/lymphoma, and surgical services were excluded.
Daily interdisciplinary rounds are held on every one of the five 40-bed medical units; they last approximately 1 hour, and consist of a lead hospitalist, nurse manager, nurse practitioners, case managers, and the nursing staff. During interdisciplinary rounds, nurses present the case to the team members who then discuss the care plan. These 5 medical units did not differ in terms of patient characteristics or staffing patterns; the intervention unit was chosen simply for logistical reasons, in that the principal investigator (PI) had been assigned to this unit prior to study start-up.
Prior to the intervention, LS held an education session for staff on the intervention unit staff (who participated on interdisciplinary rounds) to explain the concept of the ACOVE QI initiative and describe the four QIs selected for the study. Three subsequent educational sessions were held during the first week of the intervention, with new incoming staff receiving a brief individual educational session. The staff demonstrated significant knowledge improvement after session completion (pre/post mean score 70.6% vs 90.0%; P < .0001).
The Clinical Information System for the Health System EMR, The Eclipsys SCM, has alerts with different levels of severity from “soft” (user must acknowledge a recommendation) to “hard” (requires an action in order to proceed).
To measure compliance of the quality indicators, we collected the following variables:
QI 1: VTE prophylaxis
Through SCM, we collected type of VTE prophylaxis ordered (pharmacologic and/or mechanical) as well as start and stop dates for all agents. International normalized ratio levels were checked for patients receiving warfarin. Days of compliance were calculated.
QI 2: Indwelling Bladder Catheters
SCM data were collected on catheter entry and discontinuation dates, the presence of an indication, and order renewal for bladder catheter at least every 3 days.
QI 3: Mobilization
Ambulation status prior to admission was extracted from nursing documentation completed on admission to the medical ward. Patients documented as bedfast were categorized as nonambulatory prior to admission. Nursing documentation of activity level and amount of feet ambulated per nursing shift were collected. In addition, hospital day of physical therapy (PT) order and hospital days with PT performed were charted. Compliance with QI 3 in patients documented as ambulatory prior to hospital admission was recorded as present if there was a PT order within 48 hours of admission.
QI 4: Delirium Evaluation
During daily rounds, the hospitalist (PI) questioned nurses about delirium evaluation, using the first feature of the Confusion Assessment Method (CAM) as well as the “single question in delirium,” namely, “Is there evidence of an acute change in mental status from the patient’s baseline?” and “Do you think [name of patient] has been more confused lately?”28,29 Because EMR does not contain a specified field for delirium screening and documentation, and patients are not routinely included in rounds, documentation with QI 4 was recorded using the “key words” method as described in the work by Puelle et al.30 To extract SCM key words, nursing documentation of the “cognitive/perceptual/neurological exam” section of the EMR on admission and on all subsequent documentation (once per shift) was retrieved to identify acute changes in mental status (eg, “altered mental status, delirium/delirious, alert and oriented X 3, confused/confusion, disoriented, lethargy/lethargic”).30 In addition, nurses were asked to activate an SCM parameter, “Acute Confusion” SCM parameter, in the nursing documentation section, which includes potential risk factors for confusion.
In addition to QI compliance, we collected LOS, discharge disposition, and 30-day readmission data.
Generalized linear mixed models (GLMM) for binary clustered (ie, hierarchical) data were used to estimate compliance rates (ie, nurse adherence) for each group (intervention group or control group) in the postintervention period, along with their corresponding 95% confidence intervals. GLMM was used to account for the hierarchical structure of the data: nursing units within a hospital. In order to calculate the Charlson Comorbidity Index, we extracted past medical history from the EMR.31
Subjects (N = 2,396) were included in the comparison of the intervention group vs control group for each of the following 4 ACOVE QI compliance measures: DVT, mobilization, bladder catheter, and delirium.
Table 2
RESULTS
Of the 2,396 patient admissions, 530 were in the intervention unit and 1,866 were in the control unit. In the intervention group, the average age was 84.65 years, 75.58% were white and 47.21% were married. There was no difference in patient demographics between groups (Table 2).
QI 1: VTE Prophylaxis
Compliance with VTE prophylaxis was met in 78.3% of the intervention subjects and 76.5% of the controls (P < .4371) (Table 3). Of note, the rate of VTE prophylaxis was 57% in the intervention vs 39% in the control group (P < .0056), in the 554 patients for whom compliance was not met. Mechanical prophylaxis was used in 35.6% of intervention subjects vs 30.6 in the control (P = .048). Patients who received no form of prophylaxis were 0.5% in the intervention and 3% in the control (P = .027).
Table 3
QI 2: Indwelling Bladder Catheters
Out of 2,396 subjects, 406 had an indwelling bladder catheter (16.9%). Compliance with the catheter was met in 72.2% of the intervention group vs 54.4% in the control group (P = .1061). An indication for indwelling bladder catheters was documented in 100% of the subjects. The average number of catheter days was 5.16 in the intervention vs 5.88 in the control (P < .2284). There was statistical significance in catheter compliance in the longer stay (>15 days) subjects, decreasing to 23.32% in the control group while staying constant in the intervention group 71.5% (P = .0006).
QI 3: Mobilization
Of the 2,396 patients, 1,991 (83.1%) were reported as ambulatory prior to admission. In the intervention vs control group, 74 (14%) vs 297 (15.7%), respectively, were nonambulatory. Overall compliance with Q3 was 62.9% in the intervention vs 48.2% in the control (P < .0001). More specifically, the average time to PT order in the intervention group was 1.83 days vs 2.22 days in the control group (P < .0051) and the time to PT evaluation was 2.14 days vs 2.42 days, respectively (P < .0108). In the intervention group, 84 patients (15.8%) did not have a PT consult vs 511 (27%) in the control group (P < .0001). The average times per subject in which the nurses documented the approximate number of feet ambulated was 6.48 in the intervention group vs 0.11 in the control group.
QI 4: Delirium Evaluation
In terms of nursing documentation indicating the presence of an acute confusional state, the intervention group had 148 out of 530 nursing notes (27.9%) vs 405 out of 1,866 in the control group (21.7%; P = .0027). However, utilization of the “acute confusion” parameter with documentation of a risk factor did not differ between the groups (5.8% in the intervention group vs 5.6% in the control group, P < .94).
LOS, Discharge Disposition, and 30-Day Readmissions
LOS did not differ between intervention and control groups (6.37 days vs 6.27 days, respectively), with a median of 5 days (P = .877). Discharge disposition in the 2 groups included the following: home/home with services (71.32% vs 68.7%), skilled nursing facility/assisted living/long-term care (24.34 versus 25.83), inpatient hospice/home hospice (2.64 vs 2.25), and expired (1.13 vs 1.77; P < .3282). In addition, 30-day readmissions did not differ (21% vs 20%, respectively, P = .41).
DISCUSSION
Our goal was to explore an evidence-based, standardized approach to improve the care of hospitalized older adults. This approach leverages existing automated EMR alert functions with an additional level of decision support for VEs, integrated into daily multidisciplinary rounds. The use of a daily checklist-based tool offers a cost-effective and practical pathway to distribute the burden of compliance responsibility amongst team members.
As we anticipated and similar to study findings in hospitalized medicine, geriatric trauma, and primary care, compliance with general care QIs was better than geriatric-focused QIs.27,32 Wenger et al33 demonstrated significant improvements with screening for falls and incontinence; however, screening for cognitive impairment did not improve in the outpatient setting by imbedding ACOVE QIs into routine physician practice.
Increased compliance with VTE prophylaxis and indwelling bladder catheters may be explained by national financial incentives for widespread implementation of EMR alert systems. Conversely, mobilization, delirium assessment, and management in hospitalized older adults don’t benefit from similar incentives.
VTE Prophylaxis
The American College of Chest Physicians (ACCP) supports the use of VTE prophylaxis, especially in hospitalized older adults with decreased mobility.34 While greater adoption of EMR has already increased adherence, our intervention resulted in an even higher rate of compliance with the use of pharmacologic VTE prophylaxis.35 In the future, validated scores for risk of thrombosis and bleeding may be integrated into our QI-based checklist.
Indwelling Bladder Catheters
The potential harms of catheters have been described for over 50 years, yet remain frequently used.36,37 Previous studies have shown success in decreasing catheter days with computer-based and multidisciplinary protocols.36-39
Our health system’s EMR has built-in “soft” and “hard” alerts for indwelling bladder catheters, so we did not expect intervention-associated changes in compliance.
Mobilization
Hospitalization in older adults frequently results in functional decline.4,5,40 In response, the mobilization QI recommends an ambulation plan within 48 hours for those patients who were ambulatory prior to admission; it does not specifically define the components of the plan.26 There are several multicomponent interventions that have demonstrated improvement in functional decline, yet they require skilled providers.41,42 Our intervention implemented specific ambulation plan components: daily ambulation and documentation reminders and early PT evaluation.
While functional status measures have existed for decades, most are primarily geared to assess community-residing individuals and not designed to measure changes in function during hospitalization.43,44 Furthermore, performance-based hospital measures are difficult to integrate into the daily nursing workflow as they are time consuming.45,46 In practice, nurses routinely use free text to document functional status in the hospital setting, rendering comparative analysis problematic. Yet, we demonstrated that nurses were more engaged in reporting mobilization (increased documentation of ambulation distance and a decrease in time to PT). Future research should focus on the development of a standardized tool, integrated into the EMR, to accurately measure function in the acute care setting.
Delirium Evaluation
Delirium evaluation remains one of the most difficult clinical challenges for healthcare providers in hospitalized individuals, and our study reiterated these concerns. Previous research has consistently demonstrated that the diagnosis of delirium is missed by up to 75% of clinicians.47,48 Indeed, our study, which exclusively examined nursing documentation of the delirium evaluation QI, found that both groups showed strikingly low compliance rates. This may have been due to the fact that we only evaluated nursing documentation of suspected or definite diagnosis of delirium and a documented attempt to attribute the altered mental state to a potential etiology.31 By utilizing the concept of “key words,” as developed by Puelle et al.30, we were able to demonstrate a statistically significant improvement in nursing delirium documentation in the intervention group. This result should be interpreted with caution, as this approach is not validated. Furthermore, our operational definition of delirium compliance (ie, nurse documentation of delirium, requiring the launching of a separate parameter) may have been simply too cumbersome to readily integrate into the daily workflow. Future research should study the efficacy of a sensitive EMR-integrated screening tool that facilitates recognition, by all team members, of acute changes in cognition.
Although a number of QI improved for the intervention group, acute care utilization measures such as LOS, discharge disposition, and 30-day readmissions did not differ between groups. It may well be that improving quality for this very frail, vulnerable population may simply not result in decreased utilization. Our ability to further decrease LOS and readmission rates may be limited due to restriction of range in this complex patient population (eg, median LOS value of 5 days).
Limitations
Although our study had a large sample size, data were only collected from a single-center and thus require further exploration in different settings to ensure generalizability. In addition, QI observance was based on the medical record, which was problematic for some indicators, notably delirium identification. While prior literature highlights the difficulty in identifying delirium, especially during clinical practice without specialized training, our compliance was strikingly low.47 While validated measures such as CAM may have been included as part of the assessment, there is currently no EMR documentation of such measures and therefore, these data could not be obtained.
CONCLUSION
In summary, our study demonstrates the successful integration of the established ACOVE QIs as an intervention, rather than as an assessment method, for improving care of hospitalized older patients. By utilizing a checklist-based tool at the bedside allows the multidisciplinary team to implement evidence-based practices with the ultimate goal of standardizing care, not only for VEs, but potentially for other high-risk populations with multimorbidity.49 This innovative approach provides a much-needed direction to healthcare providers in the ever increasing stressful conditions of today’s acute care environment and for the ultimate benefit and safety of our older patients.
Disclosure
The authors declare no conflicts of interest. This study was supported by New York State Empire Clinical Research Investigators Program (ECRIP). The sponsor had no role in the conception, study design, data collection, data analysis, interpretation of data, manuscript preparation, or the decision to submit the manuscript for publication.
References
1. National Center for Health Statistics (US). Health, United States, 2015: With Special Feature on Racial and Ethnic Health Disparities. Hyattsville, MD: National Center for Health Statistics (US); 2016. http://www.ncbi.nlm.nih.gov/books/NBK367640/. Accessed November 2, 2016. 2. Weiss AJ, Elixhauser A. Overview of Hospital Stays in the United States, 2012: Statistical Brief #180. In: Healthcare Cost and Utilization Project (HCUP) Statistical Briefs. Rockville (MD): Agency for Healthcare Research and Quality (US); 2006. http://www.ncbi.nlm.nih.gov/books/NBK259100/. Accessed November 2, 2016. 3. Jencks SF, Cuerdon T, Burwen DR, et al. Quality of medical care delivered to medicare beneficiaries: A profile at state and national levels. JAMA. 2000;284(13):1670-1676. PubMed 4. Covinsky KE, Pierluissi E, Johnston C. Hospitalization-associated disability: “She was probably able to ambulate, but I’m not sure.” JAMA. 2011;306(16):1782-1793. PubMed 5. Creditor MC. Hazards of Hospitalization of the Elderly. Ann Intern Med. 1993;118(3):219-223. PubMed 6. Graf C. Functional decline in hospitalized older adults. Am J Nurs. 2006;106(1):58-67, NaN-68. PubMed 7. Wachter RM, Goldman L. The emerging role of “hospitalists” in the American health care system. N Engl J Med. 1996;335(7):514-517. PubMed 8. Lindenauer PK, Pantilat SZ, Katz PP, Wachter RM. Hospitalists and the practice of inpatient medicine: results of a survey of the National Association of Inpatient Physicians. Ann Intern Med. 1999;130(4 Pt 2):343-349. PubMed 9. Wachter RM. The hospitalist movement 5 years later. JAMA. 2002;287(4):487. PubMed 10. Shank B. 2016: Celebrating 20 years of hospital medicine and looking toward a bright future. Hosp Natl Assoc Inpatient Physicians. 2016. http://www.the-hospitalist.org/hospitalist/article/121925/2016-celebrating-20-years-hospital-medicine-and-looking-toward-bright. Accessed June 2, 2017. 11. Retooling for an Aging America: Building the Health Care Workforce. Washington, DC.: National Academies Press; 2008. http://www.nap.edu/catalog/12089. Accessed November 2, 2016. 12. Boult C, Counsell SR, Leipzig RM, Berenson RA. The urgency of preparing primary care physicians to care for older people with chronic illnesses. Health Aff Proj Hope. 2010;29(5):811-818. PubMed 13. Warshaw GA, Bragg EJ, Thomas DC, Ho ML, Brewer DE, Association of Directors of Geriatric Academic Programs. Are internal medicine residency programs adequately preparing physicians to care for the baby boomers? A national survey from the Association of Directors of Geriatric Academic Programs Status of Geriatrics Workforce Study. J Am Geriatr Soc. 2006;54(10):1603-1609. PubMed 14. Tanner CE, Eckstrom E, Desai SS, Joseph CL, Ririe MR, Bowen JL. Uncovering frustrations: A qualitative needs assessment of academic general internists as geriatric care providers and teachers. J Gen Intern Med. 2006;21(1):51-55. PubMed 15. Warshaw GA, Bragg EJ, Brewer DE, Meganathan K, Ho M. The development of academic geriatric medicine: progress toward preparing the nation’s physicians to care for an aging population. J Am Geriatr Soc. 2007;55(12):2075-2082. PubMed 16. Fox MT, Sidani S, Persaud M, et al. Acute care for elders components of acute geriatric unit care: Systematic descriptive review. J Am Geriatr Soc. 2013;61(6):939-946. PubMed 17. Palmer RM, Landefeld CS, Kresevic D, Kowal J. A medical unit for the acute care of the elderly. J Am Geriatr Soc. 1994;42(5):545-552. 18. Hung WW, Ross JS, Farber J, Siu AL. Evaluation of the Mobile Acute Care of the Elderly (MACE) service. JAMA Intern Med. 2013;173(11):990-996. PubMed 19. Sennour Y, Counsell SR, Jones J, Weiner M. Development and implementation of a proactive geriatrics consultation model in collaboration with hospitalists. J Am Geriatr Soc. 2009;57(11):2139-2145. PubMed 20. Ellis G, Whitehead MA, O’Neill D, Langhorne P, Robinson D. Comprehensive geriatric assessment for older adults admitted to hospital. Cochrane Database Syst Rev. 2011;(7):CD006211. PubMed 21. Mattison MLP, Catic A, Davis RB, et al. A standardized, bundled approach to providing geriatric-focused acute care. J Am Geriatr Soc. 2014;62(5):936-942. doi:10.1111/jgs.12780. PubMed 22. Wenger NS, Shekelle PG. Assessing care of vulnerable elders: ACOVE project overview. Ann Intern Med. 2001;135(8 Pt 2):642-646. PubMed 23. Wenger NS, Roth CP, Shekelle P, ACOVE Investigators. Introduction to the assessing care of vulnerable elders-3 quality indicator measurement set. J Am Geriatr Soc. 2007;55 Suppl 2:S247-S252. PubMed 24. Reuben DB, Roth C, Kamberg C, Wenger NS. Restructuring primary care practices to manage geriatric syndromes: the ACOVE-2 intervention. J Am Geriatr Soc. 2003;51(12):1787-1793. PubMed 25. Askari M, Wierenga PC, Eslami S, Medlock S, De Rooij SE, Abu-Hanna A. Studies pertaining to the ACOVE quality criteria: a systematic review. Int J Qual Health Care. 2012;24(1):80-87. PubMed 26. Arora VM, McGory ML, Fung CH. Quality indicators for hospitalization and surgery in vulnerable elders. J Am Geriatr Soc. 2007;55 Suppl 2:S347-S358. PubMed 27. Arora VM, Johnson M, Olson J, et al. Using assessing care of vulnerable elders quality indicators to measure quality of hospital care for vulnerable elders. J Am Geriatr Soc. 2007;55(11):1705-1711. PubMed 28. Sands M, Dantoc B, Hartshorn A, Ryan C, Lujic S. Single Question in Delirium (SQiD): testing its efficacy against psychiatrist interview, the Confusion Assessment Method and the Memorial Delirium Assessment Scale. Palliat Med. 2010;24(6):561-565. PubMed 29. Inouye SK, van Dyck CH, Alessi CA, Balkin S, Siegal AP, Horwitz RI. Clarifying confusion: the confusion assessment method. A new method for detection of delirium. Ann Intern Med. 1990;113(12):941-948. PubMed 30. Puelle MR, Kosar CM, Xu G, et al. The language of delirium: Keywords for identifying delirium from medical records. J Gerontol Nurs. 2015;41(8):34-42. PubMed 31. Quan H, Sundararajan V, Halfon P, et al. Coding algorithms for defining comorbidities in ICD-9-CM and ICD-10 administrative data. Med Care. 2005;43(11):1130-1139. PubMed 32. Boult C, Boult L, Morishita L, Smith SL, Kane RL. Outpatient geriatric evaluation and management. J Am Geriatr Soc. 1998;46(3):296-302.33. Wenger NS, Roth CP, Shekelle PG, et al. A practice-based intervention to improve primary care for falls, urinary incontinence, and dementia. J Am Geriatr Soc. 2009;57(3):547-555. PubMed 34. Geerts WH. Prevention of Venous Thromboembolism: American College of Chest Physicians Evidence-Based Clinical Practice Guidelines (8th Edition). Chest J. 2008;133(6_suppl):381S. 35. Rosenman M, Liu X, Phatak H, et al. Pharmacological prophylaxis for venous thromboembolism among hospitalized patients with acute medical illness: An electronic medical records study. Am J Ther. 2016;23(2):e328-e335. PubMed 36. Ghanem A, Artime C, Moser M, Caceres L, Basconcillo A. Holy moley! Take out that foley! Measuring compliance with a nurse driven protocol for foley catheter removal to decrease utilization. Am J Infect Control. 2015;43(6):S51. 37. Cornia PB, Amory JK, Fraser S, Saint S, Lipsky BA. Computer-based order entry decreases duration of indwelling urinary catheterization in hospitalized patients. Am J Med. 2003;114(5):404-407. PubMed 38. Huang W-C, Wann S-R, Lin S-L, et al. Catheter-associated urinary tract infections in intensive care units can be reduced by prompting physicians to remove unnecessary catheters. Infect Control Hosp Epidemiol. 2004;25(11):974-978. PubMed 39. Topal J, Conklin S, Camp K, Morris V, Balcezak T, Herbert P. Prevention of nosocomial catheter-associated urinary tract infections through computerized feedback to physicians and a nurse-directed protocol. Am J Med Qual. 2005;20(3):121-126. PubMed 40. Zisberg A, Shadmi E, Gur-Yaish N, Tonkikh O, Sinoff G. Hospital-associated functional decline: the role of hospitalization processes beyond individual risk factors. J Am Geriatr Soc. 2015;63(1):55-62. PubMed 41. Inouye SK, Bogardus ST, Baker DI, Leo-Summers L, Cooney LM. The Hospital Elder Life Program: a model of care to prevent cognitive and functional decline in older hospitalized patients. Hospital Elder Life Program. J Am Geriatr Soc. 2000;48(12):1697-1706. PubMed 42. Hoyer EH, Friedman M, Lavezza A, et al. Promoting mobility and reducing length of stay in hospitalized general medicine patients: A quality-improvement project. J Hosp Med. 2016;11(5):341-347. PubMed 43. Mahoney FI, Barthel DW. Functional evaluation: the barthel index. Md State Med J. 1965;14:61-65. PubMed 44. Katz S, Ford AB, Moskowitz RW, Jackson BA, Jaffe MW. Studies of illness in the aged. the index of adl: a standardized measure of biological and psychosocial function. JAMA. 1963;185:914-919. PubMed 45. Tinetti ME. Performance-oriented assessment of mobility problems in elderly patients. J Am Geriatr Soc. 1986;34(2):119-126. PubMed 46. Smith R. Validation and Reliability of the Elderly Mobility Scale. Physiotherapy. 1994;80(11):744-747. 47. Inouye SK, Foreman MD, Mion LC, Katz KH, Cooney LM. Nurses’ recognition of delirium and its symptoms: comparison of nurse and researcher ratings. Arch Intern Med. 2001;161(20):2467-2473. PubMed 48. Gustafson Y, Brännström B, Norberg A, Bucht G, Winblad B. Underdiagnosis and poor documentation of acute confusional states in elderly hip fracture patients. J Am Geriatr Soc. 1991;39(8):760-765. PubMed 49. Brenner SK, Kaushal R, Grinspan Z, et al. Effects of health information technology on patient outcomes: a systematic review. J Am Med Inform Assoc. 2016;23(5):1016-1036. PubMed
In 2014, the United States spent $3 trillion on healthcare; hospitalization consumed 32% of these expenditures.1 Today, Medicare patients account for over 50% of hospital days and over 30% of all hospital discharges in the United States.2 Despite this staggering financial burden, hospitalization of older adults often results in poor patient outcomes.3-6 The exponential growth of the hospitalist movement, from 350 hospitalists nationwide in 1995 to over 44,000 in 2014, has become the key strategy for providing care to hospitalized geriatric patients.7-10 Most of these hospitalists have not received geriatric training.11-15
There is growing evidence that a geriatric approach, emphasizing multidisciplinary management of the complex needs of older patients, leads to improved outcomes. Geriatric Evaluation and Management Units (GEMUs), such as Acute Care for Elderly (ACE) models, have demonstrated significant decreases in functional decline, institutionalization, and death in randomized controlled trials.16,17 Multidisciplinary, nonunit based efforts, such as the mobile acute care of elderly (MACE), proactive consultation models (Sennour/Counsell), and the Hospital Elder Life Program (HELP), have demonstrated success in preventing adverse events and decreasing length of stay (LOS).17-20
However, these models have not been systematically implemented due to challenges in generalizability and replicability in diverse settings. To address this concern, an alternative approach must be developed to widely “generalize” geriatric expertise throughout hospitals, regardless of their location, size, and resources. This initiative will require systematic integration of evidence-based decision support tools for the standardization of clinical management in hospitalized older adults.21
The 1998 Assessing Care of Vulnerable Elders (ACOVE) project developed a standardized tool to measure and evaluate the quality of care by using a comprehensive set of quality indicators (QIs) to improve the care of “vulnerable elders” (VEs) at a high risk for functional and cognitive decline and death.22-24The latest systematic review concludes that, although many studies have used ACOVE as an assessmenttool of quality, there has been a dearth of studies investigating the ACOVE QIs as an intervention to improve patient care.25
Our study investigated the role of ACOVE as an intervention by using the QIs as a standardized checklist in the acute care setting. We selected the 4 most commonly encountered QIs in the hospital setting, namely venous thrombosis prophylaxis (VTE), indwelling bladder catheter, mobilization, and delirium evaluation, in order to test the feasibility and impact of systematically implementing these ACOVE QIs as a therapeutic intervention for all hospitalized older adults.
METHODS
This study (IRB #13-644B) was conducted using a prospective intervention with a nonequivalent control group design comprised of retrospective chart data from May 1, 2014, to June 30, 2015. Process and outcome variables were extracted from electronic medical records ([EMR], Sunrise Clinical Manager [SCM]) of 2,396 patients, with 530 patients in the intervention unit and 1,866 on the control units, at a large academic tertiary center operating in the greater New York metropolitan area. Our study investigated the role of ACOVE as an intervention to improve patient care by using selected QIs as a standardized checklist tool in the acute care setting. Of the original 30 hospital-specific QIs, our study focused on the care of older adults admitted to the medicine service.26 We selected commonly encountered QIs, with the objective of testing the feasibility and impact of implementing the ACOVE QIs as an intervention to improve care of hospitalized older adults. This intervention consisted of applying the checklist tool, constructed with 4 selected ACOVE QIs and administered daily during interdisciplinary rounds, namely: 2 general “medical” indicators, VTE prophylaxis and indwelling bladder catheters, and 2 “geriatric”-focused indicators, mobilization and delirium evaluation.
Table 1
Subject matter experts (hospitalists, geriatricians, researchers, administrators, and nurses) reviewed the ACOVE QIs and agreed upon the adaptation of the QIs from a quality measure assessment into a feasible and acceptable intervention checklist tool (Table 1). The checklist was reviewed during daily interdisciplinary rounds for all patients 75 years and older. While ACOVE defined vulnerable elders by using the Vulnerable Elder Screen (VES), we wanted to apply this intervention more broadly to all hospitalized older adults who are most at risk for poor outcomes.27 Patients admitted to the intensive care unit, inpatient psychiatry, inpatient leukemia/lymphoma, and surgical services were excluded.
Daily interdisciplinary rounds are held on every one of the five 40-bed medical units; they last approximately 1 hour, and consist of a lead hospitalist, nurse manager, nurse practitioners, case managers, and the nursing staff. During interdisciplinary rounds, nurses present the case to the team members who then discuss the care plan. These 5 medical units did not differ in terms of patient characteristics or staffing patterns; the intervention unit was chosen simply for logistical reasons, in that the principal investigator (PI) had been assigned to this unit prior to study start-up.
Prior to the intervention, LS held an education session for staff on the intervention unit staff (who participated on interdisciplinary rounds) to explain the concept of the ACOVE QI initiative and describe the four QIs selected for the study. Three subsequent educational sessions were held during the first week of the intervention, with new incoming staff receiving a brief individual educational session. The staff demonstrated significant knowledge improvement after session completion (pre/post mean score 70.6% vs 90.0%; P < .0001).
The Clinical Information System for the Health System EMR, The Eclipsys SCM, has alerts with different levels of severity from “soft” (user must acknowledge a recommendation) to “hard” (requires an action in order to proceed).
To measure compliance of the quality indicators, we collected the following variables:
QI 1: VTE prophylaxis
Through SCM, we collected type of VTE prophylaxis ordered (pharmacologic and/or mechanical) as well as start and stop dates for all agents. International normalized ratio levels were checked for patients receiving warfarin. Days of compliance were calculated.
QI 2: Indwelling Bladder Catheters
SCM data were collected on catheter entry and discontinuation dates, the presence of an indication, and order renewal for bladder catheter at least every 3 days.
QI 3: Mobilization
Ambulation status prior to admission was extracted from nursing documentation completed on admission to the medical ward. Patients documented as bedfast were categorized as nonambulatory prior to admission. Nursing documentation of activity level and amount of feet ambulated per nursing shift were collected. In addition, hospital day of physical therapy (PT) order and hospital days with PT performed were charted. Compliance with QI 3 in patients documented as ambulatory prior to hospital admission was recorded as present if there was a PT order within 48 hours of admission.
QI 4: Delirium Evaluation
During daily rounds, the hospitalist (PI) questioned nurses about delirium evaluation, using the first feature of the Confusion Assessment Method (CAM) as well as the “single question in delirium,” namely, “Is there evidence of an acute change in mental status from the patient’s baseline?” and “Do you think [name of patient] has been more confused lately?”28,29 Because EMR does not contain a specified field for delirium screening and documentation, and patients are not routinely included in rounds, documentation with QI 4 was recorded using the “key words” method as described in the work by Puelle et al.30 To extract SCM key words, nursing documentation of the “cognitive/perceptual/neurological exam” section of the EMR on admission and on all subsequent documentation (once per shift) was retrieved to identify acute changes in mental status (eg, “altered mental status, delirium/delirious, alert and oriented X 3, confused/confusion, disoriented, lethargy/lethargic”).30 In addition, nurses were asked to activate an SCM parameter, “Acute Confusion” SCM parameter, in the nursing documentation section, which includes potential risk factors for confusion.
In addition to QI compliance, we collected LOS, discharge disposition, and 30-day readmission data.
Generalized linear mixed models (GLMM) for binary clustered (ie, hierarchical) data were used to estimate compliance rates (ie, nurse adherence) for each group (intervention group or control group) in the postintervention period, along with their corresponding 95% confidence intervals. GLMM was used to account for the hierarchical structure of the data: nursing units within a hospital. In order to calculate the Charlson Comorbidity Index, we extracted past medical history from the EMR.31
Subjects (N = 2,396) were included in the comparison of the intervention group vs control group for each of the following 4 ACOVE QI compliance measures: DVT, mobilization, bladder catheter, and delirium.
Table 2
RESULTS
Of the 2,396 patient admissions, 530 were in the intervention unit and 1,866 were in the control unit. In the intervention group, the average age was 84.65 years, 75.58% were white and 47.21% were married. There was no difference in patient demographics between groups (Table 2).
QI 1: VTE Prophylaxis
Compliance with VTE prophylaxis was met in 78.3% of the intervention subjects and 76.5% of the controls (P < .4371) (Table 3). Of note, the rate of VTE prophylaxis was 57% in the intervention vs 39% in the control group (P < .0056), in the 554 patients for whom compliance was not met. Mechanical prophylaxis was used in 35.6% of intervention subjects vs 30.6 in the control (P = .048). Patients who received no form of prophylaxis were 0.5% in the intervention and 3% in the control (P = .027).
Table 3
QI 2: Indwelling Bladder Catheters
Out of 2,396 subjects, 406 had an indwelling bladder catheter (16.9%). Compliance with the catheter was met in 72.2% of the intervention group vs 54.4% in the control group (P = .1061). An indication for indwelling bladder catheters was documented in 100% of the subjects. The average number of catheter days was 5.16 in the intervention vs 5.88 in the control (P < .2284). There was statistical significance in catheter compliance in the longer stay (>15 days) subjects, decreasing to 23.32% in the control group while staying constant in the intervention group 71.5% (P = .0006).
QI 3: Mobilization
Of the 2,396 patients, 1,991 (83.1%) were reported as ambulatory prior to admission. In the intervention vs control group, 74 (14%) vs 297 (15.7%), respectively, were nonambulatory. Overall compliance with Q3 was 62.9% in the intervention vs 48.2% in the control (P < .0001). More specifically, the average time to PT order in the intervention group was 1.83 days vs 2.22 days in the control group (P < .0051) and the time to PT evaluation was 2.14 days vs 2.42 days, respectively (P < .0108). In the intervention group, 84 patients (15.8%) did not have a PT consult vs 511 (27%) in the control group (P < .0001). The average times per subject in which the nurses documented the approximate number of feet ambulated was 6.48 in the intervention group vs 0.11 in the control group.
QI 4: Delirium Evaluation
In terms of nursing documentation indicating the presence of an acute confusional state, the intervention group had 148 out of 530 nursing notes (27.9%) vs 405 out of 1,866 in the control group (21.7%; P = .0027). However, utilization of the “acute confusion” parameter with documentation of a risk factor did not differ between the groups (5.8% in the intervention group vs 5.6% in the control group, P < .94).
LOS, Discharge Disposition, and 30-Day Readmissions
LOS did not differ between intervention and control groups (6.37 days vs 6.27 days, respectively), with a median of 5 days (P = .877). Discharge disposition in the 2 groups included the following: home/home with services (71.32% vs 68.7%), skilled nursing facility/assisted living/long-term care (24.34 versus 25.83), inpatient hospice/home hospice (2.64 vs 2.25), and expired (1.13 vs 1.77; P < .3282). In addition, 30-day readmissions did not differ (21% vs 20%, respectively, P = .41).
DISCUSSION
Our goal was to explore an evidence-based, standardized approach to improve the care of hospitalized older adults. This approach leverages existing automated EMR alert functions with an additional level of decision support for VEs, integrated into daily multidisciplinary rounds. The use of a daily checklist-based tool offers a cost-effective and practical pathway to distribute the burden of compliance responsibility amongst team members.
As we anticipated and similar to study findings in hospitalized medicine, geriatric trauma, and primary care, compliance with general care QIs was better than geriatric-focused QIs.27,32 Wenger et al33 demonstrated significant improvements with screening for falls and incontinence; however, screening for cognitive impairment did not improve in the outpatient setting by imbedding ACOVE QIs into routine physician practice.
Increased compliance with VTE prophylaxis and indwelling bladder catheters may be explained by national financial incentives for widespread implementation of EMR alert systems. Conversely, mobilization, delirium assessment, and management in hospitalized older adults don’t benefit from similar incentives.
VTE Prophylaxis
The American College of Chest Physicians (ACCP) supports the use of VTE prophylaxis, especially in hospitalized older adults with decreased mobility.34 While greater adoption of EMR has already increased adherence, our intervention resulted in an even higher rate of compliance with the use of pharmacologic VTE prophylaxis.35 In the future, validated scores for risk of thrombosis and bleeding may be integrated into our QI-based checklist.
Indwelling Bladder Catheters
The potential harms of catheters have been described for over 50 years, yet remain frequently used.36,37 Previous studies have shown success in decreasing catheter days with computer-based and multidisciplinary protocols.36-39
Our health system’s EMR has built-in “soft” and “hard” alerts for indwelling bladder catheters, so we did not expect intervention-associated changes in compliance.
Mobilization
Hospitalization in older adults frequently results in functional decline.4,5,40 In response, the mobilization QI recommends an ambulation plan within 48 hours for those patients who were ambulatory prior to admission; it does not specifically define the components of the plan.26 There are several multicomponent interventions that have demonstrated improvement in functional decline, yet they require skilled providers.41,42 Our intervention implemented specific ambulation plan components: daily ambulation and documentation reminders and early PT evaluation.
While functional status measures have existed for decades, most are primarily geared to assess community-residing individuals and not designed to measure changes in function during hospitalization.43,44 Furthermore, performance-based hospital measures are difficult to integrate into the daily nursing workflow as they are time consuming.45,46 In practice, nurses routinely use free text to document functional status in the hospital setting, rendering comparative analysis problematic. Yet, we demonstrated that nurses were more engaged in reporting mobilization (increased documentation of ambulation distance and a decrease in time to PT). Future research should focus on the development of a standardized tool, integrated into the EMR, to accurately measure function in the acute care setting.
Delirium Evaluation
Delirium evaluation remains one of the most difficult clinical challenges for healthcare providers in hospitalized individuals, and our study reiterated these concerns. Previous research has consistently demonstrated that the diagnosis of delirium is missed by up to 75% of clinicians.47,48 Indeed, our study, which exclusively examined nursing documentation of the delirium evaluation QI, found that both groups showed strikingly low compliance rates. This may have been due to the fact that we only evaluated nursing documentation of suspected or definite diagnosis of delirium and a documented attempt to attribute the altered mental state to a potential etiology.31 By utilizing the concept of “key words,” as developed by Puelle et al.30, we were able to demonstrate a statistically significant improvement in nursing delirium documentation in the intervention group. This result should be interpreted with caution, as this approach is not validated. Furthermore, our operational definition of delirium compliance (ie, nurse documentation of delirium, requiring the launching of a separate parameter) may have been simply too cumbersome to readily integrate into the daily workflow. Future research should study the efficacy of a sensitive EMR-integrated screening tool that facilitates recognition, by all team members, of acute changes in cognition.
Although a number of QI improved for the intervention group, acute care utilization measures such as LOS, discharge disposition, and 30-day readmissions did not differ between groups. It may well be that improving quality for this very frail, vulnerable population may simply not result in decreased utilization. Our ability to further decrease LOS and readmission rates may be limited due to restriction of range in this complex patient population (eg, median LOS value of 5 days).
Limitations
Although our study had a large sample size, data were only collected from a single-center and thus require further exploration in different settings to ensure generalizability. In addition, QI observance was based on the medical record, which was problematic for some indicators, notably delirium identification. While prior literature highlights the difficulty in identifying delirium, especially during clinical practice without specialized training, our compliance was strikingly low.47 While validated measures such as CAM may have been included as part of the assessment, there is currently no EMR documentation of such measures and therefore, these data could not be obtained.
CONCLUSION
In summary, our study demonstrates the successful integration of the established ACOVE QIs as an intervention, rather than as an assessment method, for improving care of hospitalized older patients. By utilizing a checklist-based tool at the bedside allows the multidisciplinary team to implement evidence-based practices with the ultimate goal of standardizing care, not only for VEs, but potentially for other high-risk populations with multimorbidity.49 This innovative approach provides a much-needed direction to healthcare providers in the ever increasing stressful conditions of today’s acute care environment and for the ultimate benefit and safety of our older patients.
Disclosure
The authors declare no conflicts of interest. This study was supported by New York State Empire Clinical Research Investigators Program (ECRIP). The sponsor had no role in the conception, study design, data collection, data analysis, interpretation of data, manuscript preparation, or the decision to submit the manuscript for publication.
References
1. National Center for Health Statistics (US). Health, United States, 2015: With Special Feature on Racial and Ethnic Health Disparities. Hyattsville, MD: National Center for Health Statistics (US); 2016. http://www.ncbi.nlm.nih.gov/books/NBK367640/. Accessed November 2, 2016. 2. Weiss AJ, Elixhauser A. Overview of Hospital Stays in the United States, 2012: Statistical Brief #180. In: Healthcare Cost and Utilization Project (HCUP) Statistical Briefs. Rockville (MD): Agency for Healthcare Research and Quality (US); 2006. http://www.ncbi.nlm.nih.gov/books/NBK259100/. Accessed November 2, 2016. 3. Jencks SF, Cuerdon T, Burwen DR, et al. Quality of medical care delivered to medicare beneficiaries: A profile at state and national levels. JAMA. 2000;284(13):1670-1676. PubMed 4. Covinsky KE, Pierluissi E, Johnston C. Hospitalization-associated disability: “She was probably able to ambulate, but I’m not sure.” JAMA. 2011;306(16):1782-1793. PubMed 5. Creditor MC. Hazards of Hospitalization of the Elderly. Ann Intern Med. 1993;118(3):219-223. PubMed 6. Graf C. Functional decline in hospitalized older adults. Am J Nurs. 2006;106(1):58-67, NaN-68. PubMed 7. Wachter RM, Goldman L. The emerging role of “hospitalists” in the American health care system. N Engl J Med. 1996;335(7):514-517. PubMed 8. Lindenauer PK, Pantilat SZ, Katz PP, Wachter RM. Hospitalists and the practice of inpatient medicine: results of a survey of the National Association of Inpatient Physicians. Ann Intern Med. 1999;130(4 Pt 2):343-349. PubMed 9. Wachter RM. The hospitalist movement 5 years later. JAMA. 2002;287(4):487. PubMed 10. Shank B. 2016: Celebrating 20 years of hospital medicine and looking toward a bright future. Hosp Natl Assoc Inpatient Physicians. 2016. http://www.the-hospitalist.org/hospitalist/article/121925/2016-celebrating-20-years-hospital-medicine-and-looking-toward-bright. Accessed June 2, 2017. 11. Retooling for an Aging America: Building the Health Care Workforce. Washington, DC.: National Academies Press; 2008. http://www.nap.edu/catalog/12089. Accessed November 2, 2016. 12. Boult C, Counsell SR, Leipzig RM, Berenson RA. The urgency of preparing primary care physicians to care for older people with chronic illnesses. Health Aff Proj Hope. 2010;29(5):811-818. PubMed 13. Warshaw GA, Bragg EJ, Thomas DC, Ho ML, Brewer DE, Association of Directors of Geriatric Academic Programs. Are internal medicine residency programs adequately preparing physicians to care for the baby boomers? A national survey from the Association of Directors of Geriatric Academic Programs Status of Geriatrics Workforce Study. J Am Geriatr Soc. 2006;54(10):1603-1609. PubMed 14. Tanner CE, Eckstrom E, Desai SS, Joseph CL, Ririe MR, Bowen JL. Uncovering frustrations: A qualitative needs assessment of academic general internists as geriatric care providers and teachers. J Gen Intern Med. 2006;21(1):51-55. PubMed 15. Warshaw GA, Bragg EJ, Brewer DE, Meganathan K, Ho M. The development of academic geriatric medicine: progress toward preparing the nation’s physicians to care for an aging population. J Am Geriatr Soc. 2007;55(12):2075-2082. PubMed 16. Fox MT, Sidani S, Persaud M, et al. Acute care for elders components of acute geriatric unit care: Systematic descriptive review. J Am Geriatr Soc. 2013;61(6):939-946. PubMed 17. Palmer RM, Landefeld CS, Kresevic D, Kowal J. A medical unit for the acute care of the elderly. J Am Geriatr Soc. 1994;42(5):545-552. 18. Hung WW, Ross JS, Farber J, Siu AL. Evaluation of the Mobile Acute Care of the Elderly (MACE) service. JAMA Intern Med. 2013;173(11):990-996. PubMed 19. Sennour Y, Counsell SR, Jones J, Weiner M. Development and implementation of a proactive geriatrics consultation model in collaboration with hospitalists. J Am Geriatr Soc. 2009;57(11):2139-2145. PubMed 20. Ellis G, Whitehead MA, O’Neill D, Langhorne P, Robinson D. Comprehensive geriatric assessment for older adults admitted to hospital. Cochrane Database Syst Rev. 2011;(7):CD006211. PubMed 21. Mattison MLP, Catic A, Davis RB, et al. A standardized, bundled approach to providing geriatric-focused acute care. J Am Geriatr Soc. 2014;62(5):936-942. doi:10.1111/jgs.12780. PubMed 22. Wenger NS, Shekelle PG. Assessing care of vulnerable elders: ACOVE project overview. Ann Intern Med. 2001;135(8 Pt 2):642-646. PubMed 23. Wenger NS, Roth CP, Shekelle P, ACOVE Investigators. Introduction to the assessing care of vulnerable elders-3 quality indicator measurement set. J Am Geriatr Soc. 2007;55 Suppl 2:S247-S252. PubMed 24. Reuben DB, Roth C, Kamberg C, Wenger NS. Restructuring primary care practices to manage geriatric syndromes: the ACOVE-2 intervention. J Am Geriatr Soc. 2003;51(12):1787-1793. PubMed 25. Askari M, Wierenga PC, Eslami S, Medlock S, De Rooij SE, Abu-Hanna A. Studies pertaining to the ACOVE quality criteria: a systematic review. Int J Qual Health Care. 2012;24(1):80-87. PubMed 26. Arora VM, McGory ML, Fung CH. Quality indicators for hospitalization and surgery in vulnerable elders. J Am Geriatr Soc. 2007;55 Suppl 2:S347-S358. PubMed 27. Arora VM, Johnson M, Olson J, et al. Using assessing care of vulnerable elders quality indicators to measure quality of hospital care for vulnerable elders. J Am Geriatr Soc. 2007;55(11):1705-1711. PubMed 28. Sands M, Dantoc B, Hartshorn A, Ryan C, Lujic S. Single Question in Delirium (SQiD): testing its efficacy against psychiatrist interview, the Confusion Assessment Method and the Memorial Delirium Assessment Scale. Palliat Med. 2010;24(6):561-565. PubMed 29. Inouye SK, van Dyck CH, Alessi CA, Balkin S, Siegal AP, Horwitz RI. Clarifying confusion: the confusion assessment method. A new method for detection of delirium. Ann Intern Med. 1990;113(12):941-948. PubMed 30. Puelle MR, Kosar CM, Xu G, et al. The language of delirium: Keywords for identifying delirium from medical records. J Gerontol Nurs. 2015;41(8):34-42. PubMed 31. Quan H, Sundararajan V, Halfon P, et al. Coding algorithms for defining comorbidities in ICD-9-CM and ICD-10 administrative data. Med Care. 2005;43(11):1130-1139. PubMed 32. Boult C, Boult L, Morishita L, Smith SL, Kane RL. Outpatient geriatric evaluation and management. J Am Geriatr Soc. 1998;46(3):296-302.33. Wenger NS, Roth CP, Shekelle PG, et al. A practice-based intervention to improve primary care for falls, urinary incontinence, and dementia. J Am Geriatr Soc. 2009;57(3):547-555. PubMed 34. Geerts WH. Prevention of Venous Thromboembolism: American College of Chest Physicians Evidence-Based Clinical Practice Guidelines (8th Edition). Chest J. 2008;133(6_suppl):381S. 35. Rosenman M, Liu X, Phatak H, et al. Pharmacological prophylaxis for venous thromboembolism among hospitalized patients with acute medical illness: An electronic medical records study. Am J Ther. 2016;23(2):e328-e335. PubMed 36. Ghanem A, Artime C, Moser M, Caceres L, Basconcillo A. Holy moley! Take out that foley! Measuring compliance with a nurse driven protocol for foley catheter removal to decrease utilization. Am J Infect Control. 2015;43(6):S51. 37. Cornia PB, Amory JK, Fraser S, Saint S, Lipsky BA. Computer-based order entry decreases duration of indwelling urinary catheterization in hospitalized patients. Am J Med. 2003;114(5):404-407. PubMed 38. Huang W-C, Wann S-R, Lin S-L, et al. Catheter-associated urinary tract infections in intensive care units can be reduced by prompting physicians to remove unnecessary catheters. Infect Control Hosp Epidemiol. 2004;25(11):974-978. PubMed 39. Topal J, Conklin S, Camp K, Morris V, Balcezak T, Herbert P. Prevention of nosocomial catheter-associated urinary tract infections through computerized feedback to physicians and a nurse-directed protocol. Am J Med Qual. 2005;20(3):121-126. PubMed 40. Zisberg A, Shadmi E, Gur-Yaish N, Tonkikh O, Sinoff G. Hospital-associated functional decline: the role of hospitalization processes beyond individual risk factors. J Am Geriatr Soc. 2015;63(1):55-62. PubMed 41. Inouye SK, Bogardus ST, Baker DI, Leo-Summers L, Cooney LM. The Hospital Elder Life Program: a model of care to prevent cognitive and functional decline in older hospitalized patients. Hospital Elder Life Program. J Am Geriatr Soc. 2000;48(12):1697-1706. PubMed 42. Hoyer EH, Friedman M, Lavezza A, et al. Promoting mobility and reducing length of stay in hospitalized general medicine patients: A quality-improvement project. J Hosp Med. 2016;11(5):341-347. PubMed 43. Mahoney FI, Barthel DW. Functional evaluation: the barthel index. Md State Med J. 1965;14:61-65. PubMed 44. Katz S, Ford AB, Moskowitz RW, Jackson BA, Jaffe MW. Studies of illness in the aged. the index of adl: a standardized measure of biological and psychosocial function. JAMA. 1963;185:914-919. PubMed 45. Tinetti ME. Performance-oriented assessment of mobility problems in elderly patients. J Am Geriatr Soc. 1986;34(2):119-126. PubMed 46. Smith R. Validation and Reliability of the Elderly Mobility Scale. Physiotherapy. 1994;80(11):744-747. 47. Inouye SK, Foreman MD, Mion LC, Katz KH, Cooney LM. Nurses’ recognition of delirium and its symptoms: comparison of nurse and researcher ratings. Arch Intern Med. 2001;161(20):2467-2473. PubMed 48. Gustafson Y, Brännström B, Norberg A, Bucht G, Winblad B. Underdiagnosis and poor documentation of acute confusional states in elderly hip fracture patients. J Am Geriatr Soc. 1991;39(8):760-765. PubMed 49. Brenner SK, Kaushal R, Grinspan Z, et al. Effects of health information technology on patient outcomes: a systematic review. J Am Med Inform Assoc. 2016;23(5):1016-1036. PubMed
*Address for correspondence and reprint requests: Andrzej Kozikowski, Northwell Health, 175 Community Drive, Second Floor, Great Neck, NY 11021; Telephone: (516) 465-3211; Fax: (516) 465-2699; E-mail: akozikowski@northwell.edu
Content Gating
Gated (full article locked unless allowed per User)
Fever in hospitalized patients is a nonspecific finding with many potential causes. Blood cultures (BC) are commonly obtained prior to commencing parenteral antibiotics in febrile patients. However, as many as 35% to 50% of positive BCs represent a contamination with organisms inoculated from the skin into culture bottles at the time of sample collection.1-3 Such results represent false-positive BCs that can lead to unnecessary investigations and treatment.
Recently, Coburn et al. reviewed the severity of chills (graded on an ordinal scale) as the most useful predictor of true bacteremia (positive likelihood ratio [LR], 4.7; 95% confidence interval [CI], 3.0–7.2),4-6 and the lack of the systemic inflammatory response syndrome (SIRS) criteria as the best negative indicator of true bacteremia with a negative LR of 0.09 (95% CI, 0.03-0.3).6,7 We have also previously reported normal food consumption as a negative indicator of true bacteremia, with a 98.3% negative predictive value.8 Henderson’s Basic Principles of Nursing Care emphasizes the importance of evaluating whether a patient can eat and drink adequately,9 and the evaluation of a patient’s food consumption is a routine nursing staff practice, which is treated as vital sign in Japan, in contrast to nursing practices in the United States.
However, these data were the result of a single-center retrospective study using the nursing staff’s assessment of food consumption, and they cannot be generalized to larger patient populations. Therefore, the aim of this prospective, multicenter study was to measure the accuracy of food consumption and shaking chills as predictive factors for true bacteremia.
METHODS
Study Design
This was a prospective multicenter observational study (UMIN ID: R000013768) involving 3 hospitals in Tokyo, Japan, that enrolled consecutive patients who had BCs obtained. This study was approved by the ethical committee at Juntendo University Nerima Hospital and each of the participating centers, and the study was conducted in accordance with the Declaration of Helsinki 1971, as revised in 1983. We evaluated 2,792 consecutive hospitalized patients (mean age, 68.9 ± 17.1 years; 55.3% men) who had BCs obtained between April 2013 and August 2014, inclusive. The indication for BC acquisition was at the discretion of the treating physician. The study protocol and the indication for BCs are described in detail elsewhere.8 We excluded patients with anorexia-inducing conditions such as gastrointestinal disease, including gastrointestinal bleeding, enterocolitis, gastric ulceration, peritonitis, appendicitis, cholangitis, pancreatitis, diverticulitis, and ischemic colitis. We also excluded patients receiving chemotherapy for malignancy. In this study, true bacteremia was defined as identical organisms isolated from 2 sets of blood cultures (a set refers to one aerobic bottle and one anaerobic bottle). Moreover, even if only one set of blood cultures was acquired, when the identified pathogen could account for the clinical presentation, we also defined this as true bacteremia. Briefly, contaminants were defined as organisms common to skin flora, including Bacillus species, coagulase-negative Staphylococcus, Corynebacterium species, and Micrococcus species, without isolation of an identical organism with the same antibiotic susceptibilities from another potentially infected site in a patient with incompatible clinical features and no risk factors for infection with the isolated organism. Single BCs that were positive for organisms that were unlikely to explain the patient’s symptoms were also considered as contaminants. Patients with contaminated BCs were excluded from the analyses.
Structure of Reliability Study Procedures
Nurses in the 3 different hospitals performed daily independent food consumption ratings during each patient’s stay. Interrater reliability assessments were conducted in the morning or afternoon, and none of the raters had access to the other nurses’ scores at any time. The study nurses performed simultaneous ratings during these assessments (one interacted with and rated the patient while the other observed and rated the same patient).
Prediction Variables of True Bacteremia
1. Food consumption. Assessment of food consumption has been previously described in detail.8 Briefly, we characterized the patients’ oral intake based on the meal taken immediately prior to the BCs. For example, if a fever developed at 2 pm, lunch consumption was evaluated. If a fever developed at 2 am, dinner consumption was evaluated. We categorized the patients into 3 groups: low food consumption (<50% consumed), moderate food consumption (>50% to <80% consumed), and high food consumption (>80% consumed). To simplify our prediction rule, we subsequently divided food consumption into just 2 groups: high food consumption, referred to as the “normal food consumption group,” and the combination of low and moderate food consumption, referred to as the “poor food consumption group.”
2.Chills.As done previously, the physician evaluated the patient for a history of chills at the time of BCs and classified the patients into 1 of 4 grades4,5: “no chills,” the absence of any chills; “mild chills,” feeling cold, equivalent to needing an outer jacket; “moderate chills,” feeling very cold, equivalent to needing a thick blanket; and “shaking chills,” feeling extremely cold with rigors and generalized bodily shaking, even under a thick blanket. To distinguish between those patients who had shaking chills and those who did not, we divided the patients into 2 groups: the “shaking chills group” and the combination of none, mild, and moderate chills, referred to as the “negative shaking chills group.”
3. Other predictive variables.We considered the following additional predictive variables: age, gender, axillary body temperature (BT), heart rate (HR), systolic blood pressure (SBP), respiratory rate (RR), white blood cell count (WBC), and serum C-reactive protein level (CRP). These predictive variables were obtained immediately prior to the BCs. We defined SIRS based on standard criteria (HR >90 beats/m, RR >20/m, BT <36°C or >38°C, and a WBC <4 × 10³ WBC/μL or >12 × 103 WBC/μL). Patients were subcategorized by age into 2 groups (≤69 years and >70 years). CRP levels were dichotomized as >10.0 mg/dL or ≤10.0 mg/dL. We reviewed the patients’ charts to determine whether they had received antibiotics. In the case of walk-in patients, we interviewed the patients regarding whether they had visited a clinic; if they had, they were questioned as to whether any antibiotic therapy had been prescribed.
Statistical Analysis
Table 1
Continuous variables are presented as the mean with the associated standard deviation (SD). All potential variables predictive of true bacteremia are shown in Table 1. The variables were dichotomized by clinically meaningful thresholds and used as potential risk-adjusted variables. We calculated the sensitivity and specificity and positive and negative predictive value for each criterion. Multiple logistic regression analysis was used to select components that were significantly associated with true bacteremia (the level of statistical significance determined with maximum likelihood methods was set at P < .05). To visualize and quantify other aspects in the prediction of true bacteremia, a recursive partitioning analysis (RPA) was used to make a decision tree model for true bacteremia. This nonparametric regression method produces a classification tree following a series of nonsequential top-down binary splits. The tree-building process starts by considering a set of predictive variables and selects the variable that produces 2 subsets of participants with the greatest purity. Two factors are considered when splitting a node into its daughter nodes: the goodness of the split and the amount of impurity in the daughter nodes. The splitting process is repeated until further partitioning is no longer possible and the terminal nodes have been reached. Details on this method are discussed in Monte Carlo Calibration of Distributions of Partition Statistics (www.jmp.com).
Probability was considered significant at a value of P < .05. All statistical tests were 2-tailed. Statistical analyses were conducted by a physician (KI) and an independent statistician (JM) with the use of the SPSS® v.16.0 software package (SPSS Inc., Chicago, IL) and JMP® version 8.0.2 (SAS Institute, Cary, NC).
RESULTS
Patients Characteristics
Figure 1
Two thousand seven hundred and ninety-two patients met the inclusion criteria for our study, from which 849 were excluded (see Figure 1 for flow diagram). Among the remaining 1,943 patients, there were 317 patients with positive BCs, of which 221 patients (69.7%) were considered to have true-positive BCs and 96 (30.3%) were considered to have contaminated BCs. After excluding these 96 patients, 221 patients with true bacteremia (true bacteremic group) were compared with 1,626 nonbacteremic patients (nonbacteremic group; Figure 1). The baseline characteristics of the subjects are shown in Table 1. The mean BT was 38.4 ± 1.2°C in the true bacteremic group and 37.9 ± 1.0°C in the nonbacteremic group. The mean serum CRP level was 11.6 ± 9.6 mg/dL in the true bacteremic group and 7.3 ± 6.9 mg/dL in the nonbacteremic group. In the true bacteremic group, there were 6 afebrile patients, and 27 patients without leukocytosis. The pathogens identified from the true-positive BCs were Escherichia coli (n = 59, 26.7%), including extended-spectrum beta-lactamase producing species, Staphylococcus aureus (n = 36, 16.3%), including methicillin-resistant Staphylococcus aureus, and Klebsiella pneumoniae (n = 22, 10.0%; Supplemental Table 1).
The underlying clinical diagnoses in the true bacteremic group included urinary tract infection (UTI), pneumonia, abscess, catheter-related bloodstream infection (CRBSI), cellulitis, osteomyelitis, infective endocarditis (IE), chorioamnionitis, iatrogenic infection at hemodialysis puncture sites, bacterial meningitis, septic arthritis, and infection of unknown cause (Supplemental Table 2).
Interrater Reliability Testing of Food Consumption
Patients were evaluated during their hospital stays. The interrater reliability of the evaluation of food consumption was very high across all participating hospitals (Supplemental Table 3). To assess the reliability of the evaluations of food consumption, patients (separate from this main study) were selected randomly and evaluated independently by 2 nurses in 3 different hospitals. The kappa scores of agreement between the nurses at the 3 different hospitals were 0.83 (95% CI, 0.63-0.88), 0.90 (95% CI, 0.80-0.99), and 0.80 (95% CI, 0.67-0.99), respectively. The interrater reliability of food consumption evaluation by the nurses was very high at all participating hospitals.
Food Consumption
The low, moderate, and high food consumption groups consisted of 964 (52.1%), 306 (16.6%), and 577 (31.2%) patients, respectively (Table 1). Of these, 174 (18.0%), 33 (10.8%), and 14 (2.4%) patients, respectively, had true bacteremia. The presence of poor food consumption had a sensitivity of 93.7% (95% CI, 89.4%-97.9%), specificity of 34.6% (95% CI, 33.0%-36.2%), and a positive LR of 1.43 (95% CI, 1.37-1.50) for predicting true bacteremia. Conversely, the absence of poor food consumption (ie, normal food consumption) had a negative LR of 0.18 (95% CI, 0.17-0.19).
Chills
The no, mild, moderate, and shaking chills groups consisted of 1,514 (82.0%), 148 (8.0%), 53 (2.9%), and 132 (7.1%) patients, respectively (Table 1). Of these, 136 (9.0%), 25 (16.9%), 8 (15.1%), and 52 (39.4%) patients, respectively, had true bacteremia. The presence of shaking chills had a sensitivity of 23.5% (95% CI, 22.5%-24.6%), a specificity of 95.1% (95% CI, 90.7%-99.4%), and a positive LR of 4.78 (95% CI, 4.56–5.00) for predicting true bacteremia. Conversely, the absence of shaking chills had a negative LR of 0.80 (95% CI, 0.77-0.84).
Prediction Model for True Bacteremia
Table 2
The components identified as significantly related to true bacteremia by multiple logistic regression analysis are indicated in Table 2. The significant predictors of true bacteremia were shaking chills (odds ratio [OR], 5.6; 95% CI, 3.6-8.6; P < .01), SBP <90 mmHg (OR, 3.1; 95% CI, 1.6-5.7; P < 01), CRP levels >10.0 mg/dL (OR, 2.2; 95% CI, 1.6-3.1; P < .01), BT <36°C or >38°C (OR, 1.8; 95% CI, 1.3-2.6; P < .01), WBC <4 × 10³/μL or >12 × 103/μL (OR, 1.6; 95% CI, 1.2-2.3; P = .003), HR >90 bpm (OR, 1.5; 95% CI, 1.1-2.1; P = .021), and female (OR, 1.4; 95% CI, 1.0-1.9; P = .036). An RPA to create an ideal prediction model for patients with true bacteremia or nonbacteremia is shown in Figure 2. The original group consisted of 1,847 patients, including 221 patients with true bacteremia. The pretest probability of true bacteremia was 2.4% (14/577) for those with normal food consumption (Group 1) and 2.4% (13/552) for those with both normal food consumption and the absence of shaking chills (Group 2). Conversely, the pretest probability of true bacteremia was 16.3% (207/1270) for those with poor food consumption and 47.7% (51/107) for those with both poor food consumption and shaking chills. The patients with true bacteremia with normal food consumption and without shaking chills consisted of 4 cases of CRBSI and UTI, 2 cases of osteomyelitis, 1 case of IE, 1 case of chorioamnionitis, and 1 case for which the focus was unknown (Supplemental Table 4).
Figure 2
DISCUSSION
In this observational study, we evaluated if a simple algorithm using food consumption and shaking chills was useful for assessing whether a patient had true bacteremia. A 2-item screening checklist (nursing assessment of food consumption and shaking chills) had excellent statistical properties as a brief screening instrument for true bacteremia.
We have prospectively validated that food consumption, as assessed by nurses, is a reliable predictor of true bacteremia.8 A previous single-center retrospective study showed similar findings, but these could not be generalized across all institutions because of the limited nature of the study. In this multicenter study, we used 2 statistical methods to reduce selection bias. First, we performed a kappa analysis across the hospitals to evaluate the interrater reliability of the evaluation of food consumption. Second, we used an RPA (Figure 2), also known as a decision tree model. RPA is a step-by-step process by which a decision tree is constructed by either splitting or not splitting each node on the tree into 2 daughter nodes.10 By using this method, we successfully generated an ideal approach to predict true bacteremia using food consumption and shaking chills. After adjusting for food consumption and shaking chills, groups 1 to 2 had sequentially decreasing diagnoses of true bacteremia, varying from 221 patients to only 13 patients.
Appetite is influenced by many factors that are integrated by the brain, most importantly within the hypothalamus. Signals that impinge on the hypothalamic center include neural afferents, hormones, cytokines, and metabolites.11 These factors elicit “sickness behavior,” which includes a decrease in food-motivated behavior.12 Furthermore, exposure to pathogenic bacteria increases serotonin, which has been shown to decrease metabolism in amphid neurons by transcriptional and post-transcriptional mechanisms.13 Therefore, nonbacteremic patients retain their appetites. Shaking chills are a well-known predictor of true bacteremia.4,5 Several cytokines, including tumor necrosis factor-alpha and interleukins 6 and 10, may be related to shaking chills.14 Coburn et al. reviewed that shaking chills appear to be useful for identifying true bacteremia (positive LR, 4.7; 95% CI, 3.0-7.2),5,6 similar to our study. In our study, the pretest probability of true bacteremia was the same whether shaking chills was included or not (ie, 2.4% for normal food consumption and 2.4% for normal food consumption plus absence of shaking chills). This would seem to imply that the assessment of shaking chills does not appear to add anything over food assessment alone when trying to rule out bacteremia. Rather, shaking chills seem more important for ruling in bacteremia rather than ruling it out. Moreover, the recent retrospective study revealed that age >60 years (OR = 2.75, 95% CI, 1.23-6.48, P = .015), female sex (OR = 2.21, 95% CI, 1.07- 4.67, P = .038), heart rate >90 bpm (OR = 5.18, 95% CI, 2.25-12.48, P < .001) and neutrophil percentage >80% (OR = 3.61, 95% CI, 1.71- 8.00, P = .001) were independent risk factors for true bacteremia.15 Conversely, the lack of the SIRS criteria was reported as the best negative indicator of true bacteremia with a negative LR of 0.09 (95% CI, 0.03-0.3).6,7 However, the evaluation of SIRS criteria requires the acquisition of laboratory data. To our knowledge, no previous prospective studies have evaluated food consumption in terms of a risk prediction for true bacteremia. This extremely simple model can enable a physician to make a rapid bedside estimation of the risk of true bacteremia.
The strengths of this study include its relatively large sample size, multicenter design, uniformity of data collection across sites, and completeness of data collection from study participants. All of these factors allowed for a robust analysis.
However, there are several limitations of this study. First, the physicians or nurses asked the patients about the presence of shaking chills when they obtained the BCs. It may be difficult for patients, especially elderly patients, to provide this information promptly and accurately. Some patients did not call the nurse when they had shaking chills, and the chills were not witnessed by a healthcare provider. However, we used a more specific definition for shaking chills: a feeling of being extremely cold with rigors and generalized bodily shaking, even under a thick blanket. Second, this algorithm is not applicable to patients with immunosuppressed states because none of the hospitals involved in this study perform bone marrow or organ transplantation. Third, although we included patients with dementia in our cohort, we did not specifically evaluate performance of the algorithm in patients with this medical condition. It is possible that the algorithm would not perform well in this subset of patients owing to their unreliable appetite and food intake. Fourth, some medications may affect appetite, leading to reduced food consumption. Although we have not considered the details of medications in this study, we found that the pretest probability of true bacteremia was low for those patients with normal food consumption regardless of whether the medication affected their appetites or not. However, the question of whether medications truly affect patients’ appetites concurrently with bacteremia would need to be specifically addressed in a future study.
CONCLUSION
In conclusion, we have established a simple algorithm to identify patients with suspected true bacteremia who require the acquisition of blood cultures. This extremely simple model can enable physicians to make a rapid bedside estimation of the risk of true bacteremia.
Acknowledgment
The authors thank Drs. H. Honda and S. Saint, and Ms. A. Okada for their helpful discussions with regard to this study; Ms. M. Takigawa for the collection of data; and Ms. T. Oguri for providing infectious disease consultation on the pathogenicity of the identified organisms.
Disclosure
This work was supported by JSPS KAKENHI Grant Number 15K19294 (to TK) and 20590840 (to KI) from the Japan Society for the Promotion of Science. The authors report no potential conflicts of interest relevant to this article.
1. Weinstein MP, Towns ML, Quartey SM et al.The clinical significance of positive blood cultures in the 1990s: a prospective comprehensive evaluation of the microbiology, epidemiology, and outcome of bacteremia and fungemia in adults. Clin Infect Dis. 1997;24:584-602. PubMed 2. Strand CL, Wajsbort RR, Sturmann K.Effect of iodophor vs iodine tincture skin preparation on blood culture contamination rate. JAMA. 1993;269:1004-1006. PubMed 3. Bates DW, Goldman L, Lee TH.Contaminant blood cultures and resource utilization. The true consequences of false-positive results. JAMA. 1991;265:365-369. PubMed 4. Tokuda Y, Miyasato H, Stein GH.A simple prediction algorithm for bacteraemia in patients with acute febrile illness. QJM. 2005;98:813-820. PubMed 5. Tokuda Y, Miyasato H, Stein GH, Kishaba T.The degree of chills for risk of bacteremia in acute febrile illness. Am J Med. 2005;118:1417. PubMed 6. Coburn B, Morris AM, Tomlinson G, Detsky AS.Does this adult patient with suspected bacteremia require blood cultures? JAMA. 2012;308:502-511. PubMed 7. Shapiro NI, Wolfe RE, Wright SB, Moore R, Bates DW.Who needs a blood culture? A prospectively derived and validated prediction rule. J Emerg Med. 2008;35:255-264. PubMed 8. Komatsu T, Onda T, Murayama G, et al.Predicting bacteremia based on nurse-assessed food consumption at the time of blood culture. J Hosp Med. 2012;7:702-705. PubMed 9. Henderson V. Basic Principles of Nursing Care. 2nd ed. Silver Spring, MD: American Nurses Association; 1969. 10. Therneau T, Atkinson, EJ.An Introduction to Recursive Partitioning using the RPART Routines. Mayo Foundation 2017. https://cran.r-project.org/web/packages/rpart/vignettes/longintro.pdf. Accessed May 5, 2017. 11. Pavlov VA, Wang H, Czura CJ, Friedman SG, Tracey KJ.The cholinergic anti-inflammatory pathway: a missing link in neuroimmunomodulation. Mol Med .2003;9:125-134. PubMed 12. Hansen MK, Nguyen KT, Fleshner M, et al.Effects of vagotomy on serum endotoxin, cytokines, and corticosterone after intraperitoneal lipopolysaccharide. Am J Physiol Regul Integr Comp Physiol. 2000;278:R331-336. PubMed 13. Zhang Y, Lu H, Bargmann CI.Pathogenic bacteria induce aversive olfactory learning in Caenorhabditis elegans. Nature 2005;438:179-84. PubMed 14. Van Dissel JT, Schijf V, Vogtlander N, Hoogendoorn M, van’t Wout J.Implications of chills. Lancet 1998;352:374. PubMed 15. Fukui S, Uehara Y, Fujibayashi K, et al. Bacteraemia predictive factors among general medical inpatients: a retrospective cross-sectional survey in a Japanese university hospital. BMJ Open 2016;6:e010527. PubMed
Fever in hospitalized patients is a nonspecific finding with many potential causes. Blood cultures (BC) are commonly obtained prior to commencing parenteral antibiotics in febrile patients. However, as many as 35% to 50% of positive BCs represent a contamination with organisms inoculated from the skin into culture bottles at the time of sample collection.1-3 Such results represent false-positive BCs that can lead to unnecessary investigations and treatment.
Recently, Coburn et al. reviewed the severity of chills (graded on an ordinal scale) as the most useful predictor of true bacteremia (positive likelihood ratio [LR], 4.7; 95% confidence interval [CI], 3.0–7.2),4-6 and the lack of the systemic inflammatory response syndrome (SIRS) criteria as the best negative indicator of true bacteremia with a negative LR of 0.09 (95% CI, 0.03-0.3).6,7 We have also previously reported normal food consumption as a negative indicator of true bacteremia, with a 98.3% negative predictive value.8 Henderson’s Basic Principles of Nursing Care emphasizes the importance of evaluating whether a patient can eat and drink adequately,9 and the evaluation of a patient’s food consumption is a routine nursing staff practice, which is treated as vital sign in Japan, in contrast to nursing practices in the United States.
However, these data were the result of a single-center retrospective study using the nursing staff’s assessment of food consumption, and they cannot be generalized to larger patient populations. Therefore, the aim of this prospective, multicenter study was to measure the accuracy of food consumption and shaking chills as predictive factors for true bacteremia.
METHODS
Study Design
This was a prospective multicenter observational study (UMIN ID: R000013768) involving 3 hospitals in Tokyo, Japan, that enrolled consecutive patients who had BCs obtained. This study was approved by the ethical committee at Juntendo University Nerima Hospital and each of the participating centers, and the study was conducted in accordance with the Declaration of Helsinki 1971, as revised in 1983. We evaluated 2,792 consecutive hospitalized patients (mean age, 68.9 ± 17.1 years; 55.3% men) who had BCs obtained between April 2013 and August 2014, inclusive. The indication for BC acquisition was at the discretion of the treating physician. The study protocol and the indication for BCs are described in detail elsewhere.8 We excluded patients with anorexia-inducing conditions such as gastrointestinal disease, including gastrointestinal bleeding, enterocolitis, gastric ulceration, peritonitis, appendicitis, cholangitis, pancreatitis, diverticulitis, and ischemic colitis. We also excluded patients receiving chemotherapy for malignancy. In this study, true bacteremia was defined as identical organisms isolated from 2 sets of blood cultures (a set refers to one aerobic bottle and one anaerobic bottle). Moreover, even if only one set of blood cultures was acquired, when the identified pathogen could account for the clinical presentation, we also defined this as true bacteremia. Briefly, contaminants were defined as organisms common to skin flora, including Bacillus species, coagulase-negative Staphylococcus, Corynebacterium species, and Micrococcus species, without isolation of an identical organism with the same antibiotic susceptibilities from another potentially infected site in a patient with incompatible clinical features and no risk factors for infection with the isolated organism. Single BCs that were positive for organisms that were unlikely to explain the patient’s symptoms were also considered as contaminants. Patients with contaminated BCs were excluded from the analyses.
Structure of Reliability Study Procedures
Nurses in the 3 different hospitals performed daily independent food consumption ratings during each patient’s stay. Interrater reliability assessments were conducted in the morning or afternoon, and none of the raters had access to the other nurses’ scores at any time. The study nurses performed simultaneous ratings during these assessments (one interacted with and rated the patient while the other observed and rated the same patient).
Prediction Variables of True Bacteremia
1. Food consumption. Assessment of food consumption has been previously described in detail.8 Briefly, we characterized the patients’ oral intake based on the meal taken immediately prior to the BCs. For example, if a fever developed at 2 pm, lunch consumption was evaluated. If a fever developed at 2 am, dinner consumption was evaluated. We categorized the patients into 3 groups: low food consumption (<50% consumed), moderate food consumption (>50% to <80% consumed), and high food consumption (>80% consumed). To simplify our prediction rule, we subsequently divided food consumption into just 2 groups: high food consumption, referred to as the “normal food consumption group,” and the combination of low and moderate food consumption, referred to as the “poor food consumption group.”
2.Chills.As done previously, the physician evaluated the patient for a history of chills at the time of BCs and classified the patients into 1 of 4 grades4,5: “no chills,” the absence of any chills; “mild chills,” feeling cold, equivalent to needing an outer jacket; “moderate chills,” feeling very cold, equivalent to needing a thick blanket; and “shaking chills,” feeling extremely cold with rigors and generalized bodily shaking, even under a thick blanket. To distinguish between those patients who had shaking chills and those who did not, we divided the patients into 2 groups: the “shaking chills group” and the combination of none, mild, and moderate chills, referred to as the “negative shaking chills group.”
3. Other predictive variables.We considered the following additional predictive variables: age, gender, axillary body temperature (BT), heart rate (HR), systolic blood pressure (SBP), respiratory rate (RR), white blood cell count (WBC), and serum C-reactive protein level (CRP). These predictive variables were obtained immediately prior to the BCs. We defined SIRS based on standard criteria (HR >90 beats/m, RR >20/m, BT <36°C or >38°C, and a WBC <4 × 10³ WBC/μL or >12 × 103 WBC/μL). Patients were subcategorized by age into 2 groups (≤69 years and >70 years). CRP levels were dichotomized as >10.0 mg/dL or ≤10.0 mg/dL. We reviewed the patients’ charts to determine whether they had received antibiotics. In the case of walk-in patients, we interviewed the patients regarding whether they had visited a clinic; if they had, they were questioned as to whether any antibiotic therapy had been prescribed.
Statistical Analysis
Table 1
Continuous variables are presented as the mean with the associated standard deviation (SD). All potential variables predictive of true bacteremia are shown in Table 1. The variables were dichotomized by clinically meaningful thresholds and used as potential risk-adjusted variables. We calculated the sensitivity and specificity and positive and negative predictive value for each criterion. Multiple logistic regression analysis was used to select components that were significantly associated with true bacteremia (the level of statistical significance determined with maximum likelihood methods was set at P < .05). To visualize and quantify other aspects in the prediction of true bacteremia, a recursive partitioning analysis (RPA) was used to make a decision tree model for true bacteremia. This nonparametric regression method produces a classification tree following a series of nonsequential top-down binary splits. The tree-building process starts by considering a set of predictive variables and selects the variable that produces 2 subsets of participants with the greatest purity. Two factors are considered when splitting a node into its daughter nodes: the goodness of the split and the amount of impurity in the daughter nodes. The splitting process is repeated until further partitioning is no longer possible and the terminal nodes have been reached. Details on this method are discussed in Monte Carlo Calibration of Distributions of Partition Statistics (www.jmp.com).
Probability was considered significant at a value of P < .05. All statistical tests were 2-tailed. Statistical analyses were conducted by a physician (KI) and an independent statistician (JM) with the use of the SPSS® v.16.0 software package (SPSS Inc., Chicago, IL) and JMP® version 8.0.2 (SAS Institute, Cary, NC).
RESULTS
Patients Characteristics
Figure 1
Two thousand seven hundred and ninety-two patients met the inclusion criteria for our study, from which 849 were excluded (see Figure 1 for flow diagram). Among the remaining 1,943 patients, there were 317 patients with positive BCs, of which 221 patients (69.7%) were considered to have true-positive BCs and 96 (30.3%) were considered to have contaminated BCs. After excluding these 96 patients, 221 patients with true bacteremia (true bacteremic group) were compared with 1,626 nonbacteremic patients (nonbacteremic group; Figure 1). The baseline characteristics of the subjects are shown in Table 1. The mean BT was 38.4 ± 1.2°C in the true bacteremic group and 37.9 ± 1.0°C in the nonbacteremic group. The mean serum CRP level was 11.6 ± 9.6 mg/dL in the true bacteremic group and 7.3 ± 6.9 mg/dL in the nonbacteremic group. In the true bacteremic group, there were 6 afebrile patients, and 27 patients without leukocytosis. The pathogens identified from the true-positive BCs were Escherichia coli (n = 59, 26.7%), including extended-spectrum beta-lactamase producing species, Staphylococcus aureus (n = 36, 16.3%), including methicillin-resistant Staphylococcus aureus, and Klebsiella pneumoniae (n = 22, 10.0%; Supplemental Table 1).
The underlying clinical diagnoses in the true bacteremic group included urinary tract infection (UTI), pneumonia, abscess, catheter-related bloodstream infection (CRBSI), cellulitis, osteomyelitis, infective endocarditis (IE), chorioamnionitis, iatrogenic infection at hemodialysis puncture sites, bacterial meningitis, septic arthritis, and infection of unknown cause (Supplemental Table 2).
Interrater Reliability Testing of Food Consumption
Patients were evaluated during their hospital stays. The interrater reliability of the evaluation of food consumption was very high across all participating hospitals (Supplemental Table 3). To assess the reliability of the evaluations of food consumption, patients (separate from this main study) were selected randomly and evaluated independently by 2 nurses in 3 different hospitals. The kappa scores of agreement between the nurses at the 3 different hospitals were 0.83 (95% CI, 0.63-0.88), 0.90 (95% CI, 0.80-0.99), and 0.80 (95% CI, 0.67-0.99), respectively. The interrater reliability of food consumption evaluation by the nurses was very high at all participating hospitals.
Food Consumption
The low, moderate, and high food consumption groups consisted of 964 (52.1%), 306 (16.6%), and 577 (31.2%) patients, respectively (Table 1). Of these, 174 (18.0%), 33 (10.8%), and 14 (2.4%) patients, respectively, had true bacteremia. The presence of poor food consumption had a sensitivity of 93.7% (95% CI, 89.4%-97.9%), specificity of 34.6% (95% CI, 33.0%-36.2%), and a positive LR of 1.43 (95% CI, 1.37-1.50) for predicting true bacteremia. Conversely, the absence of poor food consumption (ie, normal food consumption) had a negative LR of 0.18 (95% CI, 0.17-0.19).
Chills
The no, mild, moderate, and shaking chills groups consisted of 1,514 (82.0%), 148 (8.0%), 53 (2.9%), and 132 (7.1%) patients, respectively (Table 1). Of these, 136 (9.0%), 25 (16.9%), 8 (15.1%), and 52 (39.4%) patients, respectively, had true bacteremia. The presence of shaking chills had a sensitivity of 23.5% (95% CI, 22.5%-24.6%), a specificity of 95.1% (95% CI, 90.7%-99.4%), and a positive LR of 4.78 (95% CI, 4.56–5.00) for predicting true bacteremia. Conversely, the absence of shaking chills had a negative LR of 0.80 (95% CI, 0.77-0.84).
Prediction Model for True Bacteremia
Table 2
The components identified as significantly related to true bacteremia by multiple logistic regression analysis are indicated in Table 2. The significant predictors of true bacteremia were shaking chills (odds ratio [OR], 5.6; 95% CI, 3.6-8.6; P < .01), SBP <90 mmHg (OR, 3.1; 95% CI, 1.6-5.7; P < 01), CRP levels >10.0 mg/dL (OR, 2.2; 95% CI, 1.6-3.1; P < .01), BT <36°C or >38°C (OR, 1.8; 95% CI, 1.3-2.6; P < .01), WBC <4 × 10³/μL or >12 × 103/μL (OR, 1.6; 95% CI, 1.2-2.3; P = .003), HR >90 bpm (OR, 1.5; 95% CI, 1.1-2.1; P = .021), and female (OR, 1.4; 95% CI, 1.0-1.9; P = .036). An RPA to create an ideal prediction model for patients with true bacteremia or nonbacteremia is shown in Figure 2. The original group consisted of 1,847 patients, including 221 patients with true bacteremia. The pretest probability of true bacteremia was 2.4% (14/577) for those with normal food consumption (Group 1) and 2.4% (13/552) for those with both normal food consumption and the absence of shaking chills (Group 2). Conversely, the pretest probability of true bacteremia was 16.3% (207/1270) for those with poor food consumption and 47.7% (51/107) for those with both poor food consumption and shaking chills. The patients with true bacteremia with normal food consumption and without shaking chills consisted of 4 cases of CRBSI and UTI, 2 cases of osteomyelitis, 1 case of IE, 1 case of chorioamnionitis, and 1 case for which the focus was unknown (Supplemental Table 4).
Figure 2
DISCUSSION
In this observational study, we evaluated if a simple algorithm using food consumption and shaking chills was useful for assessing whether a patient had true bacteremia. A 2-item screening checklist (nursing assessment of food consumption and shaking chills) had excellent statistical properties as a brief screening instrument for true bacteremia.
We have prospectively validated that food consumption, as assessed by nurses, is a reliable predictor of true bacteremia.8 A previous single-center retrospective study showed similar findings, but these could not be generalized across all institutions because of the limited nature of the study. In this multicenter study, we used 2 statistical methods to reduce selection bias. First, we performed a kappa analysis across the hospitals to evaluate the interrater reliability of the evaluation of food consumption. Second, we used an RPA (Figure 2), also known as a decision tree model. RPA is a step-by-step process by which a decision tree is constructed by either splitting or not splitting each node on the tree into 2 daughter nodes.10 By using this method, we successfully generated an ideal approach to predict true bacteremia using food consumption and shaking chills. After adjusting for food consumption and shaking chills, groups 1 to 2 had sequentially decreasing diagnoses of true bacteremia, varying from 221 patients to only 13 patients.
Appetite is influenced by many factors that are integrated by the brain, most importantly within the hypothalamus. Signals that impinge on the hypothalamic center include neural afferents, hormones, cytokines, and metabolites.11 These factors elicit “sickness behavior,” which includes a decrease in food-motivated behavior.12 Furthermore, exposure to pathogenic bacteria increases serotonin, which has been shown to decrease metabolism in amphid neurons by transcriptional and post-transcriptional mechanisms.13 Therefore, nonbacteremic patients retain their appetites. Shaking chills are a well-known predictor of true bacteremia.4,5 Several cytokines, including tumor necrosis factor-alpha and interleukins 6 and 10, may be related to shaking chills.14 Coburn et al. reviewed that shaking chills appear to be useful for identifying true bacteremia (positive LR, 4.7; 95% CI, 3.0-7.2),5,6 similar to our study. In our study, the pretest probability of true bacteremia was the same whether shaking chills was included or not (ie, 2.4% for normal food consumption and 2.4% for normal food consumption plus absence of shaking chills). This would seem to imply that the assessment of shaking chills does not appear to add anything over food assessment alone when trying to rule out bacteremia. Rather, shaking chills seem more important for ruling in bacteremia rather than ruling it out. Moreover, the recent retrospective study revealed that age >60 years (OR = 2.75, 95% CI, 1.23-6.48, P = .015), female sex (OR = 2.21, 95% CI, 1.07- 4.67, P = .038), heart rate >90 bpm (OR = 5.18, 95% CI, 2.25-12.48, P < .001) and neutrophil percentage >80% (OR = 3.61, 95% CI, 1.71- 8.00, P = .001) were independent risk factors for true bacteremia.15 Conversely, the lack of the SIRS criteria was reported as the best negative indicator of true bacteremia with a negative LR of 0.09 (95% CI, 0.03-0.3).6,7 However, the evaluation of SIRS criteria requires the acquisition of laboratory data. To our knowledge, no previous prospective studies have evaluated food consumption in terms of a risk prediction for true bacteremia. This extremely simple model can enable a physician to make a rapid bedside estimation of the risk of true bacteremia.
The strengths of this study include its relatively large sample size, multicenter design, uniformity of data collection across sites, and completeness of data collection from study participants. All of these factors allowed for a robust analysis.
However, there are several limitations of this study. First, the physicians or nurses asked the patients about the presence of shaking chills when they obtained the BCs. It may be difficult for patients, especially elderly patients, to provide this information promptly and accurately. Some patients did not call the nurse when they had shaking chills, and the chills were not witnessed by a healthcare provider. However, we used a more specific definition for shaking chills: a feeling of being extremely cold with rigors and generalized bodily shaking, even under a thick blanket. Second, this algorithm is not applicable to patients with immunosuppressed states because none of the hospitals involved in this study perform bone marrow or organ transplantation. Third, although we included patients with dementia in our cohort, we did not specifically evaluate performance of the algorithm in patients with this medical condition. It is possible that the algorithm would not perform well in this subset of patients owing to their unreliable appetite and food intake. Fourth, some medications may affect appetite, leading to reduced food consumption. Although we have not considered the details of medications in this study, we found that the pretest probability of true bacteremia was low for those patients with normal food consumption regardless of whether the medication affected their appetites or not. However, the question of whether medications truly affect patients’ appetites concurrently with bacteremia would need to be specifically addressed in a future study.
CONCLUSION
In conclusion, we have established a simple algorithm to identify patients with suspected true bacteremia who require the acquisition of blood cultures. This extremely simple model can enable physicians to make a rapid bedside estimation of the risk of true bacteremia.
Acknowledgment
The authors thank Drs. H. Honda and S. Saint, and Ms. A. Okada for their helpful discussions with regard to this study; Ms. M. Takigawa for the collection of data; and Ms. T. Oguri for providing infectious disease consultation on the pathogenicity of the identified organisms.
Disclosure
This work was supported by JSPS KAKENHI Grant Number 15K19294 (to TK) and 20590840 (to KI) from the Japan Society for the Promotion of Science. The authors report no potential conflicts of interest relevant to this article.
References
1. Weinstein MP, Towns ML, Quartey SM et al.The clinical significance of positive blood cultures in the 1990s: a prospective comprehensive evaluation of the microbiology, epidemiology, and outcome of bacteremia and fungemia in adults. Clin Infect Dis. 1997;24:584-602. PubMed 2. Strand CL, Wajsbort RR, Sturmann K.Effect of iodophor vs iodine tincture skin preparation on blood culture contamination rate. JAMA. 1993;269:1004-1006. PubMed 3. Bates DW, Goldman L, Lee TH.Contaminant blood cultures and resource utilization. The true consequences of false-positive results. JAMA. 1991;265:365-369. PubMed 4. Tokuda Y, Miyasato H, Stein GH.A simple prediction algorithm for bacteraemia in patients with acute febrile illness. QJM. 2005;98:813-820. PubMed 5. Tokuda Y, Miyasato H, Stein GH, Kishaba T.The degree of chills for risk of bacteremia in acute febrile illness. Am J Med. 2005;118:1417. PubMed 6. Coburn B, Morris AM, Tomlinson G, Detsky AS.Does this adult patient with suspected bacteremia require blood cultures? JAMA. 2012;308:502-511. PubMed 7. Shapiro NI, Wolfe RE, Wright SB, Moore R, Bates DW.Who needs a blood culture? A prospectively derived and validated prediction rule. J Emerg Med. 2008;35:255-264. PubMed 8. Komatsu T, Onda T, Murayama G, et al.Predicting bacteremia based on nurse-assessed food consumption at the time of blood culture. J Hosp Med. 2012;7:702-705. PubMed 9. Henderson V. Basic Principles of Nursing Care. 2nd ed. Silver Spring, MD: American Nurses Association; 1969. 10. Therneau T, Atkinson, EJ.An Introduction to Recursive Partitioning using the RPART Routines. Mayo Foundation 2017. https://cran.r-project.org/web/packages/rpart/vignettes/longintro.pdf. Accessed May 5, 2017. 11. Pavlov VA, Wang H, Czura CJ, Friedman SG, Tracey KJ.The cholinergic anti-inflammatory pathway: a missing link in neuroimmunomodulation. Mol Med .2003;9:125-134. PubMed 12. Hansen MK, Nguyen KT, Fleshner M, et al.Effects of vagotomy on serum endotoxin, cytokines, and corticosterone after intraperitoneal lipopolysaccharide. Am J Physiol Regul Integr Comp Physiol. 2000;278:R331-336. PubMed 13. Zhang Y, Lu H, Bargmann CI.Pathogenic bacteria induce aversive olfactory learning in Caenorhabditis elegans. Nature 2005;438:179-84. PubMed 14. Van Dissel JT, Schijf V, Vogtlander N, Hoogendoorn M, van’t Wout J.Implications of chills. Lancet 1998;352:374. PubMed 15. Fukui S, Uehara Y, Fujibayashi K, et al. Bacteraemia predictive factors among general medical inpatients: a retrospective cross-sectional survey in a Japanese university hospital. BMJ Open 2016;6:e010527. PubMed
*Address for correspondence and reprint requests: Kenji Inoue, Department of Cardiology, Juntendo University Nerima Hospital, 3-1-10, Takanodai, Nerimaku, Tokyo, 177-0033, Japan; Telephone: +81-3-5923-3111; Fax: +81-3-5923-3217; E-mail: inouelsbm@gmail.com
Content Gating
Gated (full article locked unless allowed per User)
Implantable cardioverter-defibrillators (ICDs) offer lifesaving therapies to many patients and have been implanted in hundreds of thousands of patients.1 The population of patients with ICDs is growing rapidly, and the national ICD Registry reports over 12,000 devices are implanted monthly.2 This population includes patients with congenital heart disease, ischemic cardiomyopathy, and idiopathic arrhythmias. If these patients experience ventricular tachycardia or fibrillation, an ICD attempts to restore sinus rhythm and prevent death. While a shock from an ICD may be lifesaving, it can be a traumatic and startling experience for the patient and perhaps distressful for families to witness.3,4
Although ICDs are intended to save lives, they do not slow the progress of the patient’s underlying cardiac and noncardiac comorbidities. All these patients will eventually die, whether from their cardiac disease or another condition. The literature includes many anecdotes about patients shocked multiple times by their defibrillator while actively dying.4 These situations could be prevented with preemptive ICD deactivation. (ICDs can function not only as cardioverters and defibrillators, as implied by their name, but also as pacemakers. “Deactivation” as used in this paper refers only to disabling the tachycardia therapies. No distinction was made between defibrillation with a shock and anti-tachycardia pacing.) Therefore, research on ICD deactivation has emphasized patients who are acutely terminally ill, while less emphasis has been placed on patients who are not actively dying.4–8
Patients may, for a variety of reasons, request a do-not-resuscitate/do-not-intubate (DNR/DNI) order as their code status. However, it is not necessarily clear what a DNR/DNI order implies for ICD management. One survey of attending physicians found that 19% of respondents felt a DNR/DNI order was equivalent to requesting ICD deactivation.9 On the other hand, patients are split on whether they would want their device deactivated while in hospice or even at the very end of life.6 Heart Rhythm Society (HRS) guidelines favor a nuanced approach to ICD deactivation in DNR/DNI patients that emphasizes the individual patient’s comorbidities and goals.10 A patient’s individual circumstances might justify a choice to be DNR/DNI without deactivating the ICD. Decision-making in these circumstances requires a careful conversation between the patient and clinician. It is important to identify barriers that might prevent optimal shared decision-making.
Clinicians have been surveyed on ICD management at the end of life, but these studies have generally focused on attending physicians.5,9,11 However, physician trainees (ie, residents and fellows) as well as advanced practice providers (ie, physician assistants and nurse practitioners) are responsible for much of the clinical care provided to hospitalized patients. In particular, they are often the clinicians to discuss code status with patients. Different specialties (eg, cardiology, general medicine, and geriatrics) manage different sets of patients, which might affect clinicians’ opinions on ICD management. We therefore designed a survey to assess clinician attitudes and beliefs regarding ICD deactivation, including in non-terminally ill patients, and to evaluate for differences according to training level and specialty.
METHODS
Case-based and Likert-scale questions were considered for this survey, with the latter being chosen for ease of completion by respondents. An online survey tool (SurveyMonkey; San Mateo, CA) was used for data collection; no identifying data were collected. E-mail invitations to participate were sent to a combination of mailing lists and individual addresses for residents, fellows, advanced practice providers, and attending physicians in general internal medicine, cardiology, electrophysiology, and geriatrics. The survey remained open for 2.5 weeks. It was conducted 5 months into the academic year, thus trainees were well-established in their current roles. Two $25 gift cards were offered to respondents who entered their e-mail into a drawing; responses were not tied to e-mail addresses. Approval for the study was obtained from the University of Michigan Institutional Review Board.
The survey posed 12 questions assessing general attitudes about ICDs as well as individual beliefs and behaviors relating to ICD deactivation. Answers were on a Likert scale of 1 to 5 with 1 representing “strongly disagree” and 5 representing “strongly agree.” A score of 3 indicated “unsure or neutral.” The first 3 questions appeared together on the first page and were prefaced with “Please respond to the following statements about ICD shocks.” The next 9 were likewise grouped on the next page and were prefaced with “Please respond to the following statements about ICD deactivation.” All 12 questions are shown in Figures 1 and 2. Respondents could easily return to previous questions and change their answers. The survey ended with a third page showing 3 multiple choice demographic questions. The demographic questions were about clinical role (first-, second-, third-, or fourth-year resident, fellow, advanced practice provider, and attending), specialty, and number of ICD deactivations the respondent had been directly involved in (0, 1 to 5, 5 to 10, and more than 10). Specialty options were internal medicine resident, inpatient general medicine, outpatient general medicine, cardiology, electrophysiology, and geriatrics.
Likert scale answers of “agree” or “strongly agree” were grouped together as an affirmative response, while all other answers were grouped together as a nonaffirmative response. For analysis, residents were grouped together and their responses compared with attending physicians as a group. Additional analysis was done comparing attending physicians stratified by clinical specialty. Given the small number of responses from attending electrophysiologists, they were grouped with attending cardiologists for analysis. Due to the limited number of fellows and advanced practice providers who responded, further evaluation of these groups was not performed. Finally, the number of ICD deactivations respondents had been involved in was stratified by training level. All comparisons were performed using the two-tailed Pearson’s chi-squared test.
Table
RESULTS
A total of 170 responses were collected from 508 individuals on the e-mail lists. Two responses were from registered nurses who were not part of the intended study sample and 7 responses were incomplete, having only answered the first 3 questions. These 9 responses were excluded from further analysis, yielding an overall response rate of 32%. The demographics of the remaining 161 respondents are shown in Table 1. Figure 1 shows overall responses to each question.
Figure 1
When comparing residents to attending physicians, there were no statistically significant between-differences except on questions 5 and 6. Specifically, residents were less comfortable than attending physicians discussing ICD deactivation and did so with less regularity (P < .001 and P = .018, respectively; Figure 2). Comfort levels improved markedly with experience: 29.2% of interns expressed comfort asking about ICD deactivation as compared with 60.7% of third- and-fourth year residents and 78.8% of attending physicians. Furthermore, comfort level seemed to parallel the regularity with which respondents asked about ICD deactivation: 4.2% of interns routinely asked about ICD deactivation as compared with 21.4% of third- and fourth-year residents and 34.8% of attending physicians.
Figure 2 The only statistically significant difference when comparing attending physicians by specialty was on question 6 of the survey with the groups being unequal in their reliability at asking about ICD deactivation during code status discussions (P < .001; Figure 2). Of cardiologists and electrophysiologists, 73.3% said they routinely ask about ICD deactivation, as well as 83.3% of geriatricians. By contrast, only 19.2% of outpatient general internists and 10.5% of inpatient general internists (ie, hospitalists) said they routinely ask about ICD deactivation.
There were no differences between groups when asked whether ICD deactivation was part of a DNR/DNI order (question 8), or if an ICD should be deactivated in DNR/DNI patients (questions 9 and 10). As shown in Figure 1, 21.1% of respondents felt that a DNR/DNI order is equivalent to requesting ICD deactivation, 60.2% felt that terminally ill DNR/DNI patients should have their device deactivated, and 28% felt that non-terminally ill DNR/DNI patients should have their device deactivated.
Figure 3 Groups were unequal with respect to the number of ICD deactivations in which they had been directly involved (Figure 3; P < .001). Over half of interns had not been involved in any ICD deactivations as compared with only 10.7% of third- or fourth-year residents. Of the 20 geriatricians, cardiologists, and electrophysiologists, 45% had been involved in at least 5 ICD deactivations. Of note, although 77.8% of fellows reported being involved in more than 10 ICD deactivations, these 9 respondents were all in cardiology or electrophysiology.
DISCUSSION
Overall, our major findings were (1) residents, who provide much of the clinical care in a teaching hospital, are remarkably uncomfortable discussing ICD deactivation, (2) general internists and residents ask about ICD deactivation infrequently compared to geriatricians and cardiologists, and (3) about one fifth of our respondents believe ICD deactivation is automatically part of a DNR/DNI order.
Although the majority of respondents did not routinely address ICD deactivation in conjunction with code status, there was significant variability among subgroups. For example, 83.3% of geriatricians routinely discussed ICD deactivation as part of code status compared with only 4% of first-year residents and 10.5% of inpatient general internists. This finding is interesting because 90.7% of all respondents believed that discussions of code status should address preferences on ICD deactivation. This apparent discrepancy could be explained by the relatively small number of patients admitted to the hospital who have both an ICD and a request to be DNR/DNI. Residents and inpatient general internists see a very broad spectrum of patients; ICD deactivation is frequently irrelevant in the cases these physicians manage. The subset of patients seen in consultation by cardiologists and geriatricians, by contrast, is expected to include a larger proportion of patients with ICDs. Therefore, discussing ICD deactivation will be more relevant to their daily practice. Fear of alienating patients was not a reason for our findings, as our respondents did not express concern that recommending ICD deactivation would harm the patient-clinician relationship.
There are several possible reasons that residents, particularly interns, are uncomfortable discussing ICD deactivation. A lack of exposure to ICD deactivation is probably a key contributor. Over half of interns had never been involved in any ICD deactivations. Residents and hospitalists may also feel as if they are overstepping their boundaries to discuss deactivating ICD therapies. Their feelings may not be misplaced, as one survey of ICD patients found that over 75% thought responsibility for discussing ICD deactivation, at least at the end of life, rests with cardiologists or electrophysiologists.6
The HRS guidelines call for individualized decisions regarding ICD deactivation, even if a patient is DNR/DNI. However, our respondents frequently felt a standardized approach was indicated, with 21% believing that a DNR/DNI order included ICD deactivation. Additionally, 28% agreed that even non-terminally ill DNR/DNI patients should have their device deactivated. This is relevant because it is the role of clinicians to engage in shared decision-making with their patients. If the clinician holds the fixed belief that a DNR/DNI order, regardless of the precise clinical scenario, should include ICD deactivation, they may pressure a patient to have their device deactivated even if it could still benefit them.
In 2009, Kelley et al published results of a survey on ICD deactivation at the end of life.9 They contacted 4,876 attending physicians in cardiology, electrophysiology, geriatrics, and general medicine, receiving 558 responses. The survey included Likert-scale questions assessing attitudes and knowledge about ICD functionality. Demographic information was also collected, including how many patients in their practice had ICDs and how often they had previously discussed ICD deactivation.
There are some interesting comparisons between Kelley et al’s findings and ours, although we included trainees and the precise wording of questions was different. The specific questions used by Kelley et al to ask whether ICD shocks were painful or distressing and to ask if ICD deactivation is part of a DNR order were: “The shock from an ICD is very painful for most patients.” “The shock of an ICD at the end of life is distressing to a patient and their loved ones.” “A DNR order is equivalent to deactivation of an ICD.”
Only 47% of general internists in the Kelley et al survey thought that ICD shocks were painful, compared with 83% of electrophysiologists. In addition, 65% of general internists and 85% of electrophysiologists viewed shocks at the end of life to be distressing to patients and families. By contrast, our respondents were nearly unanimous in believing shocks to be painful and distressing. This discrepancy may be due to the growing prevalence of ICDs over the past several years as well as the growing body of literature on unnecessary shocks at the end of life. In line with our study, 19% of their respondents believed a DNR order was equivalent to ICD deactivation.9
Taken together, our findings indicate that additional education for clinicians of all levels could be helpful. Didactic lessons cannot replace experience, and it is important for residents to be exposed to discussions of ICD deactivation. However, lessons about ICD therapies and practical examples of how to broach the topic of deactivation could be beneficial, especially for interns whose responsibility includes discussions of code status. Within the context of an internal medicine residency, the fundamentals of ICD functionality could be covered during rotations on cardiology or palliative care services. Additionally, the recommendations of the HRS for device management can be covered in didactic sessions. Similar opportunities could be built into continuing medical education for practicing physicians and the training of advanced practice providers.
There are limitations to this survey, most notably the fact that it was restricted to a single academic medical center, the patient population and practices of which may not be generalizable to medical practice at large. Selection bias is also a distinct possibility given the 32% overall response rate; those who responded may feel more strongly about the survey topic. Our study subgroups may have interpreted questions differently because of their particular area of clinical practice. The small sample size also precluded an effective analysis of fellows and advanced practice practitioners due to lack of power. A major strength of this survey was the inclusion of a large number of residents upon whom the majority of inpatient contact rests. Future work could include expanding the survey to multiple medical centers, which would enhance generalizability and improve the ability to recruit sufficient fellows and advanced practice providers.
CONCLUSION
In summary, we conducted a single-center survey of residents, fellows, advanced practice providers, and attending physicians on their attitudes and beliefs about ICD deactivation in DNR/DNI patients. Residents are particularly uncomfortable discussing ICD deactivation with patients, which is an important finding because of their crucial role in providing patient care. Additionally, residents and hospitalists do not broach the topic of deactivation regularly, especially when compared to geriatricians and cardiologists. Despite HRS guidelines to the contrary, a fifth of our respondents believed that DNR/DNI orders include ICD deactivation. Overall, ICD deactivation in DNR/DNI patients is a topic that needs further attention in clinical education so that patients receive care that respects their individual wishes.
Disclosure
Nothing to report.
References
1. Freeman JV, Wang Y, Curtis JP, Heidenreich PA, Hlatky MA. Physician procedure volume and complications of cardioverter-defibrillator implantation. Circulation. 2012;125(1):57-64. doi:10.1161/CIRCULATIONAHA.111.046995. PubMed 2. Kremers MS, Hammill SC, Berul CI, et al. The National ICD Registry Report: Version 2.1 including leads and pediatrics for years 2010 and 2011. Hear Rhythm. 2013;10(4):e59-e65. doi:10.1016/j.hrthm.2013.01.035. PubMed 3. Goldstein NE, Mehta D, Siddiqui S, et al. “That’s like an act of suicide” patients’ attitudes toward deactivation of implantable defibrillators. J Gen Intern Med. 2008;23 Suppl 1:7-12. PubMed 4. Goldstein NE, Lampert R, Bradley E, Lynn J, Krumholz HM. Management of implantable cardioverter defibrillators in end-of-life care. Ann Intern Med. 2004;141(11):835-838. http://annals.org/article.aspx?articleid=717985&issueno=11. Accessed October 23, 2013. 5. Sherazi S, Daubert JP, Block RC, et al. Physicians’ preferences and attitudes about end-of-life care in patients with an implantable cardioverter-defibrillator. Mayo Clin Proc. 2008;83(10):1139-1141. doi:10.4065/83.10.1139. PubMed 6. Kirkpatrick JN, Gottlieb M, Sehgal P, Patel R, Verdino RJ. Deactivation of implantable cardioverter defibrillators in terminal illness and end of life care. Am J Cardiol. 2012;109(1):91-94. doi:10.1016/j.amjcard.2011.08.011. PubMed 7. Marinskis G, van Erven L. Deactivation of implanted cardioverter-defibrillators at the end of life: results of the EHRA survey. Europace. 2010;12(8):1176-1177. doi:10.1093/europace/euq272. PubMed 8. Mueller PS, Jenkins SM, Bramstedt KA, Hayes DL. Deactivating implanted cardiac devices in terminally ill patients: practices and attitudes. Pacing Clin Electrophysiol. 2008;31(5):560-568. doi:10.1111/j.1540-8159.2008.01041.x. PubMed 9. Kelley AS, Reid MC, Miller DH, Fins JJ, Lachs MS. Implantable cardioverter-defibrillator deactivation at the end of life: a physician survey. Am Heart J. 2009;157(4):702-8.e1. doi:10.1016/j.ahj.2008.12.011. PubMed 10. Lampert R, Hayes DL, Annas GJ, et al. HRS Expert Consensus Statement on the Management of Cardiovascular Implantable Electronic Devices (CIEDs) in patients nearing end of life or requesting withdrawal of therapy. Hear Rhythm. 2010;7(7):1008-1026. doi:10.1016/j.hrthm.2010.04.033.PubMed 11. Kelley AS, Mehta SS, Reid MC. Management of patients with ICDs at the end of life (EOL): a qualitative study. Am J Hosp Palliat Care. 2008;25(6):440-446. doi:10.1177/1049909108320885. PubMed
Implantable cardioverter-defibrillators (ICDs) offer lifesaving therapies to many patients and have been implanted in hundreds of thousands of patients.1 The population of patients with ICDs is growing rapidly, and the national ICD Registry reports over 12,000 devices are implanted monthly.2 This population includes patients with congenital heart disease, ischemic cardiomyopathy, and idiopathic arrhythmias. If these patients experience ventricular tachycardia or fibrillation, an ICD attempts to restore sinus rhythm and prevent death. While a shock from an ICD may be lifesaving, it can be a traumatic and startling experience for the patient and perhaps distressful for families to witness.3,4
Although ICDs are intended to save lives, they do not slow the progress of the patient’s underlying cardiac and noncardiac comorbidities. All these patients will eventually die, whether from their cardiac disease or another condition. The literature includes many anecdotes about patients shocked multiple times by their defibrillator while actively dying.4 These situations could be prevented with preemptive ICD deactivation. (ICDs can function not only as cardioverters and defibrillators, as implied by their name, but also as pacemakers. “Deactivation” as used in this paper refers only to disabling the tachycardia therapies. No distinction was made between defibrillation with a shock and anti-tachycardia pacing.) Therefore, research on ICD deactivation has emphasized patients who are acutely terminally ill, while less emphasis has been placed on patients who are not actively dying.4–8
Patients may, for a variety of reasons, request a do-not-resuscitate/do-not-intubate (DNR/DNI) order as their code status. However, it is not necessarily clear what a DNR/DNI order implies for ICD management. One survey of attending physicians found that 19% of respondents felt a DNR/DNI order was equivalent to requesting ICD deactivation.9 On the other hand, patients are split on whether they would want their device deactivated while in hospice or even at the very end of life.6 Heart Rhythm Society (HRS) guidelines favor a nuanced approach to ICD deactivation in DNR/DNI patients that emphasizes the individual patient’s comorbidities and goals.10 A patient’s individual circumstances might justify a choice to be DNR/DNI without deactivating the ICD. Decision-making in these circumstances requires a careful conversation between the patient and clinician. It is important to identify barriers that might prevent optimal shared decision-making.
Clinicians have been surveyed on ICD management at the end of life, but these studies have generally focused on attending physicians.5,9,11 However, physician trainees (ie, residents and fellows) as well as advanced practice providers (ie, physician assistants and nurse practitioners) are responsible for much of the clinical care provided to hospitalized patients. In particular, they are often the clinicians to discuss code status with patients. Different specialties (eg, cardiology, general medicine, and geriatrics) manage different sets of patients, which might affect clinicians’ opinions on ICD management. We therefore designed a survey to assess clinician attitudes and beliefs regarding ICD deactivation, including in non-terminally ill patients, and to evaluate for differences according to training level and specialty.
METHODS
Case-based and Likert-scale questions were considered for this survey, with the latter being chosen for ease of completion by respondents. An online survey tool (SurveyMonkey; San Mateo, CA) was used for data collection; no identifying data were collected. E-mail invitations to participate were sent to a combination of mailing lists and individual addresses for residents, fellows, advanced practice providers, and attending physicians in general internal medicine, cardiology, electrophysiology, and geriatrics. The survey remained open for 2.5 weeks. It was conducted 5 months into the academic year, thus trainees were well-established in their current roles. Two $25 gift cards were offered to respondents who entered their e-mail into a drawing; responses were not tied to e-mail addresses. Approval for the study was obtained from the University of Michigan Institutional Review Board.
The survey posed 12 questions assessing general attitudes about ICDs as well as individual beliefs and behaviors relating to ICD deactivation. Answers were on a Likert scale of 1 to 5 with 1 representing “strongly disagree” and 5 representing “strongly agree.” A score of 3 indicated “unsure or neutral.” The first 3 questions appeared together on the first page and were prefaced with “Please respond to the following statements about ICD shocks.” The next 9 were likewise grouped on the next page and were prefaced with “Please respond to the following statements about ICD deactivation.” All 12 questions are shown in Figures 1 and 2. Respondents could easily return to previous questions and change their answers. The survey ended with a third page showing 3 multiple choice demographic questions. The demographic questions were about clinical role (first-, second-, third-, or fourth-year resident, fellow, advanced practice provider, and attending), specialty, and number of ICD deactivations the respondent had been directly involved in (0, 1 to 5, 5 to 10, and more than 10). Specialty options were internal medicine resident, inpatient general medicine, outpatient general medicine, cardiology, electrophysiology, and geriatrics.
Likert scale answers of “agree” or “strongly agree” were grouped together as an affirmative response, while all other answers were grouped together as a nonaffirmative response. For analysis, residents were grouped together and their responses compared with attending physicians as a group. Additional analysis was done comparing attending physicians stratified by clinical specialty. Given the small number of responses from attending electrophysiologists, they were grouped with attending cardiologists for analysis. Due to the limited number of fellows and advanced practice providers who responded, further evaluation of these groups was not performed. Finally, the number of ICD deactivations respondents had been involved in was stratified by training level. All comparisons were performed using the two-tailed Pearson’s chi-squared test.
Table
RESULTS
A total of 170 responses were collected from 508 individuals on the e-mail lists. Two responses were from registered nurses who were not part of the intended study sample and 7 responses were incomplete, having only answered the first 3 questions. These 9 responses were excluded from further analysis, yielding an overall response rate of 32%. The demographics of the remaining 161 respondents are shown in Table 1. Figure 1 shows overall responses to each question.
Figure 1
When comparing residents to attending physicians, there were no statistically significant between-differences except on questions 5 and 6. Specifically, residents were less comfortable than attending physicians discussing ICD deactivation and did so with less regularity (P < .001 and P = .018, respectively; Figure 2). Comfort levels improved markedly with experience: 29.2% of interns expressed comfort asking about ICD deactivation as compared with 60.7% of third- and-fourth year residents and 78.8% of attending physicians. Furthermore, comfort level seemed to parallel the regularity with which respondents asked about ICD deactivation: 4.2% of interns routinely asked about ICD deactivation as compared with 21.4% of third- and fourth-year residents and 34.8% of attending physicians.
Figure 2 The only statistically significant difference when comparing attending physicians by specialty was on question 6 of the survey with the groups being unequal in their reliability at asking about ICD deactivation during code status discussions (P < .001; Figure 2). Of cardiologists and electrophysiologists, 73.3% said they routinely ask about ICD deactivation, as well as 83.3% of geriatricians. By contrast, only 19.2% of outpatient general internists and 10.5% of inpatient general internists (ie, hospitalists) said they routinely ask about ICD deactivation.
There were no differences between groups when asked whether ICD deactivation was part of a DNR/DNI order (question 8), or if an ICD should be deactivated in DNR/DNI patients (questions 9 and 10). As shown in Figure 1, 21.1% of respondents felt that a DNR/DNI order is equivalent to requesting ICD deactivation, 60.2% felt that terminally ill DNR/DNI patients should have their device deactivated, and 28% felt that non-terminally ill DNR/DNI patients should have their device deactivated.
Figure 3 Groups were unequal with respect to the number of ICD deactivations in which they had been directly involved (Figure 3; P < .001). Over half of interns had not been involved in any ICD deactivations as compared with only 10.7% of third- or fourth-year residents. Of the 20 geriatricians, cardiologists, and electrophysiologists, 45% had been involved in at least 5 ICD deactivations. Of note, although 77.8% of fellows reported being involved in more than 10 ICD deactivations, these 9 respondents were all in cardiology or electrophysiology.
DISCUSSION
Overall, our major findings were (1) residents, who provide much of the clinical care in a teaching hospital, are remarkably uncomfortable discussing ICD deactivation, (2) general internists and residents ask about ICD deactivation infrequently compared to geriatricians and cardiologists, and (3) about one fifth of our respondents believe ICD deactivation is automatically part of a DNR/DNI order.
Although the majority of respondents did not routinely address ICD deactivation in conjunction with code status, there was significant variability among subgroups. For example, 83.3% of geriatricians routinely discussed ICD deactivation as part of code status compared with only 4% of first-year residents and 10.5% of inpatient general internists. This finding is interesting because 90.7% of all respondents believed that discussions of code status should address preferences on ICD deactivation. This apparent discrepancy could be explained by the relatively small number of patients admitted to the hospital who have both an ICD and a request to be DNR/DNI. Residents and inpatient general internists see a very broad spectrum of patients; ICD deactivation is frequently irrelevant in the cases these physicians manage. The subset of patients seen in consultation by cardiologists and geriatricians, by contrast, is expected to include a larger proportion of patients with ICDs. Therefore, discussing ICD deactivation will be more relevant to their daily practice. Fear of alienating patients was not a reason for our findings, as our respondents did not express concern that recommending ICD deactivation would harm the patient-clinician relationship.
There are several possible reasons that residents, particularly interns, are uncomfortable discussing ICD deactivation. A lack of exposure to ICD deactivation is probably a key contributor. Over half of interns had never been involved in any ICD deactivations. Residents and hospitalists may also feel as if they are overstepping their boundaries to discuss deactivating ICD therapies. Their feelings may not be misplaced, as one survey of ICD patients found that over 75% thought responsibility for discussing ICD deactivation, at least at the end of life, rests with cardiologists or electrophysiologists.6
The HRS guidelines call for individualized decisions regarding ICD deactivation, even if a patient is DNR/DNI. However, our respondents frequently felt a standardized approach was indicated, with 21% believing that a DNR/DNI order included ICD deactivation. Additionally, 28% agreed that even non-terminally ill DNR/DNI patients should have their device deactivated. This is relevant because it is the role of clinicians to engage in shared decision-making with their patients. If the clinician holds the fixed belief that a DNR/DNI order, regardless of the precise clinical scenario, should include ICD deactivation, they may pressure a patient to have their device deactivated even if it could still benefit them.
In 2009, Kelley et al published results of a survey on ICD deactivation at the end of life.9 They contacted 4,876 attending physicians in cardiology, electrophysiology, geriatrics, and general medicine, receiving 558 responses. The survey included Likert-scale questions assessing attitudes and knowledge about ICD functionality. Demographic information was also collected, including how many patients in their practice had ICDs and how often they had previously discussed ICD deactivation.
There are some interesting comparisons between Kelley et al’s findings and ours, although we included trainees and the precise wording of questions was different. The specific questions used by Kelley et al to ask whether ICD shocks were painful or distressing and to ask if ICD deactivation is part of a DNR order were: “The shock from an ICD is very painful for most patients.” “The shock of an ICD at the end of life is distressing to a patient and their loved ones.” “A DNR order is equivalent to deactivation of an ICD.”
Only 47% of general internists in the Kelley et al survey thought that ICD shocks were painful, compared with 83% of electrophysiologists. In addition, 65% of general internists and 85% of electrophysiologists viewed shocks at the end of life to be distressing to patients and families. By contrast, our respondents were nearly unanimous in believing shocks to be painful and distressing. This discrepancy may be due to the growing prevalence of ICDs over the past several years as well as the growing body of literature on unnecessary shocks at the end of life. In line with our study, 19% of their respondents believed a DNR order was equivalent to ICD deactivation.9
Taken together, our findings indicate that additional education for clinicians of all levels could be helpful. Didactic lessons cannot replace experience, and it is important for residents to be exposed to discussions of ICD deactivation. However, lessons about ICD therapies and practical examples of how to broach the topic of deactivation could be beneficial, especially for interns whose responsibility includes discussions of code status. Within the context of an internal medicine residency, the fundamentals of ICD functionality could be covered during rotations on cardiology or palliative care services. Additionally, the recommendations of the HRS for device management can be covered in didactic sessions. Similar opportunities could be built into continuing medical education for practicing physicians and the training of advanced practice providers.
There are limitations to this survey, most notably the fact that it was restricted to a single academic medical center, the patient population and practices of which may not be generalizable to medical practice at large. Selection bias is also a distinct possibility given the 32% overall response rate; those who responded may feel more strongly about the survey topic. Our study subgroups may have interpreted questions differently because of their particular area of clinical practice. The small sample size also precluded an effective analysis of fellows and advanced practice practitioners due to lack of power. A major strength of this survey was the inclusion of a large number of residents upon whom the majority of inpatient contact rests. Future work could include expanding the survey to multiple medical centers, which would enhance generalizability and improve the ability to recruit sufficient fellows and advanced practice providers.
CONCLUSION
In summary, we conducted a single-center survey of residents, fellows, advanced practice providers, and attending physicians on their attitudes and beliefs about ICD deactivation in DNR/DNI patients. Residents are particularly uncomfortable discussing ICD deactivation with patients, which is an important finding because of their crucial role in providing patient care. Additionally, residents and hospitalists do not broach the topic of deactivation regularly, especially when compared to geriatricians and cardiologists. Despite HRS guidelines to the contrary, a fifth of our respondents believed that DNR/DNI orders include ICD deactivation. Overall, ICD deactivation in DNR/DNI patients is a topic that needs further attention in clinical education so that patients receive care that respects their individual wishes.
Disclosure
Nothing to report.
References
1. Freeman JV, Wang Y, Curtis JP, Heidenreich PA, Hlatky MA. Physician procedure volume and complications of cardioverter-defibrillator implantation. Circulation. 2012;125(1):57-64. doi:10.1161/CIRCULATIONAHA.111.046995. PubMed 2. Kremers MS, Hammill SC, Berul CI, et al. The National ICD Registry Report: Version 2.1 including leads and pediatrics for years 2010 and 2011. Hear Rhythm. 2013;10(4):e59-e65. doi:10.1016/j.hrthm.2013.01.035. PubMed 3. Goldstein NE, Mehta D, Siddiqui S, et al. “That’s like an act of suicide” patients’ attitudes toward deactivation of implantable defibrillators. J Gen Intern Med. 2008;23 Suppl 1:7-12. PubMed 4. Goldstein NE, Lampert R, Bradley E, Lynn J, Krumholz HM. Management of implantable cardioverter defibrillators in end-of-life care. Ann Intern Med. 2004;141(11):835-838. http://annals.org/article.aspx?articleid=717985&issueno=11. Accessed October 23, 2013. 5. Sherazi S, Daubert JP, Block RC, et al. Physicians’ preferences and attitudes about end-of-life care in patients with an implantable cardioverter-defibrillator. Mayo Clin Proc. 2008;83(10):1139-1141. doi:10.4065/83.10.1139. PubMed 6. Kirkpatrick JN, Gottlieb M, Sehgal P, Patel R, Verdino RJ. Deactivation of implantable cardioverter defibrillators in terminal illness and end of life care. Am J Cardiol. 2012;109(1):91-94. doi:10.1016/j.amjcard.2011.08.011. PubMed 7. Marinskis G, van Erven L. Deactivation of implanted cardioverter-defibrillators at the end of life: results of the EHRA survey. Europace. 2010;12(8):1176-1177. doi:10.1093/europace/euq272. PubMed 8. Mueller PS, Jenkins SM, Bramstedt KA, Hayes DL. Deactivating implanted cardiac devices in terminally ill patients: practices and attitudes. Pacing Clin Electrophysiol. 2008;31(5):560-568. doi:10.1111/j.1540-8159.2008.01041.x. PubMed 9. Kelley AS, Reid MC, Miller DH, Fins JJ, Lachs MS. Implantable cardioverter-defibrillator deactivation at the end of life: a physician survey. Am Heart J. 2009;157(4):702-8.e1. doi:10.1016/j.ahj.2008.12.011. PubMed 10. Lampert R, Hayes DL, Annas GJ, et al. HRS Expert Consensus Statement on the Management of Cardiovascular Implantable Electronic Devices (CIEDs) in patients nearing end of life or requesting withdrawal of therapy. Hear Rhythm. 2010;7(7):1008-1026. doi:10.1016/j.hrthm.2010.04.033.PubMed 11. Kelley AS, Mehta SS, Reid MC. Management of patients with ICDs at the end of life (EOL): a qualitative study. Am J Hosp Palliat Care. 2008;25(6):440-446. doi:10.1177/1049909108320885. PubMed
*Address for correspondence and reprint requests: Andrew J. Bradley, Division of Cardiology, George Washington University, 2150 Pennsylvania Avenue NW, Washington, D.C. 20037; Telephone: 202-741-2323; Fax: 202-741-2324; E-mail: ajbrad@email.gwu.edu
Content Gating
Gated (full article locked unless allowed per User)

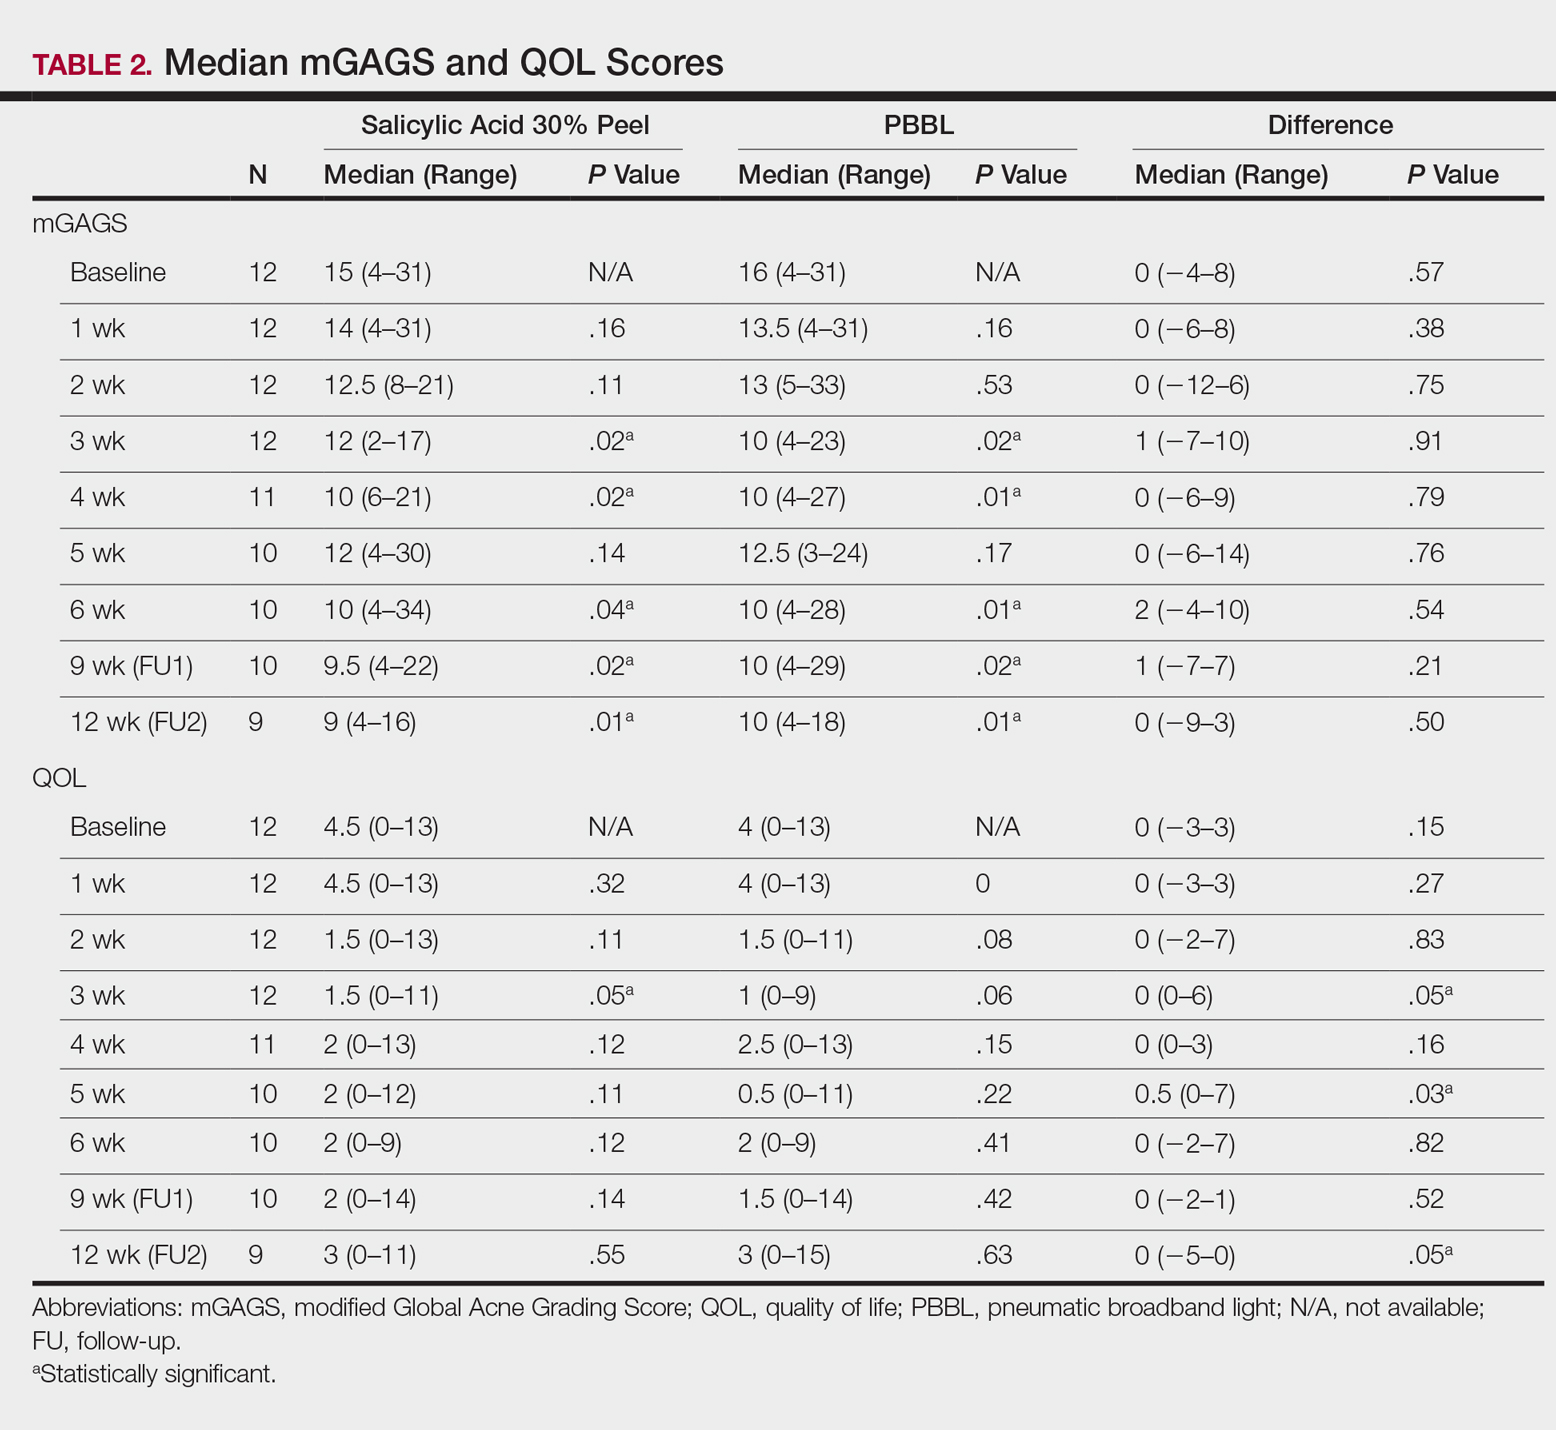

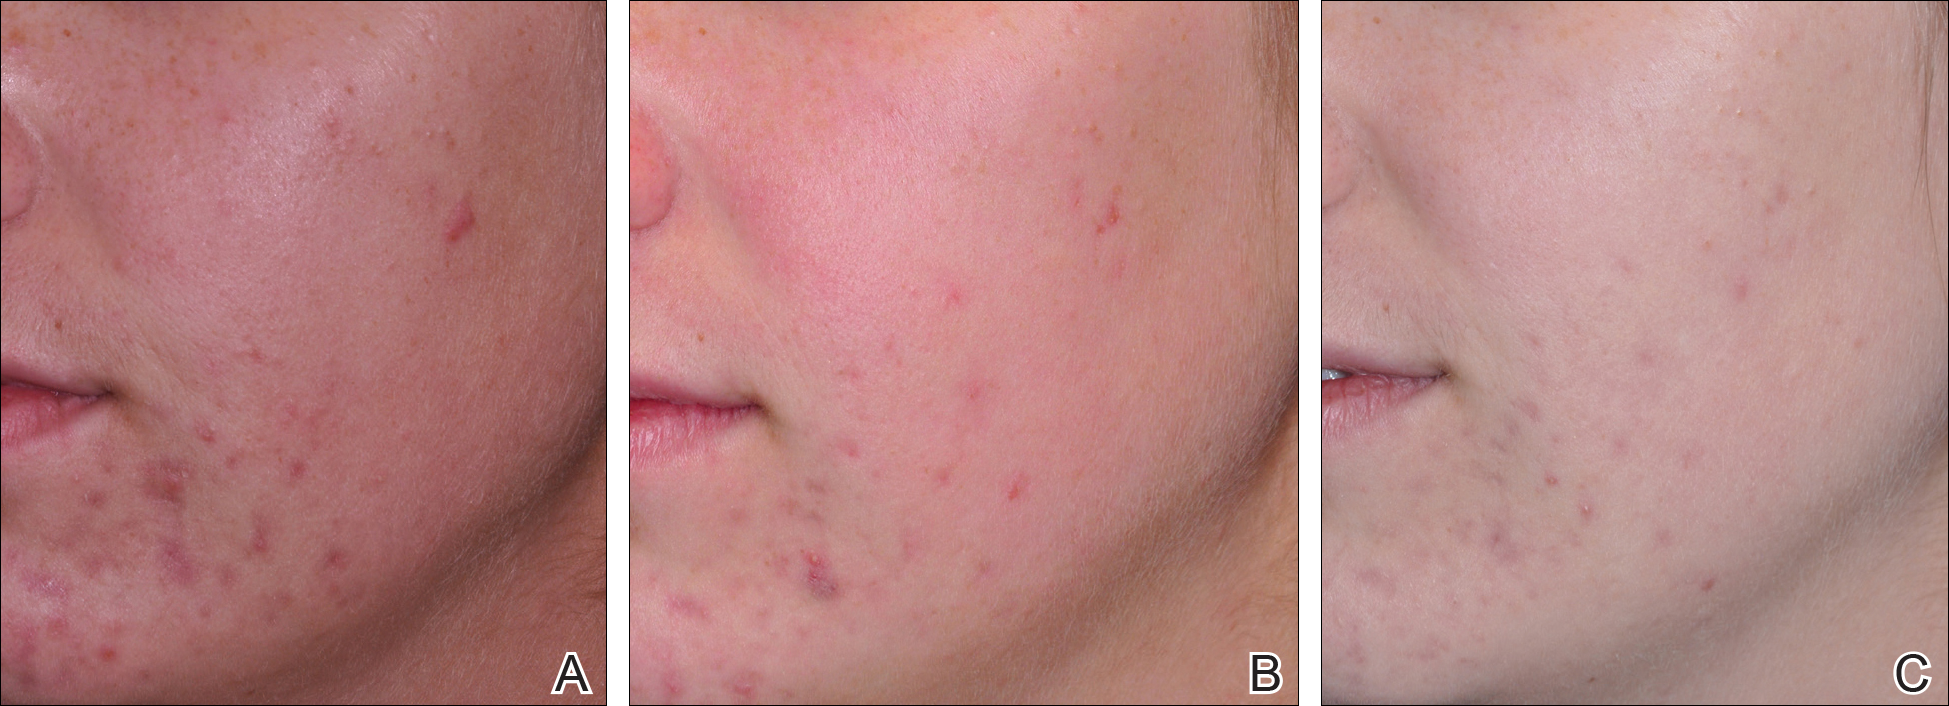


 and Return Visit Rates")


")


