User login
Use of simulation to assess incoming interns’ recognition of opportunities to choose wisely
In recent years, the American Board of Internal Medicine (ABIM) Foundation’s Choosing Wisely™ campaign has advanced the dialogue on cost-consciousness by identifying potential examples of overuse in clinical practice.1 Eliminating low-value care can decrease costs, improve quality, and potentially decrease patient harm.2 In fact, there is growing consensus among health leaders and educators on the need for a physician workforce that is conscious of high-value care.3,4 The Institute of Medicine has issued a call-to-action for graduate medical education (GME) to emphasize value-based care,5 and the Accreditation Council for Graduate Medical Education has outlined expectations that residents receive formal and experiential training on overuse as a part of its Clinical Learning Environment Review.6
However, recent reports highlight a lack of emphasis on value-based care in medical education.7 For example, few residency program directors believe that residents are prepared to incorporate value and cost into their medical decisions.8 In 2012, only 15% of medicine residencies reported having formal curricula addressing value, although many were developing one.8 Of the curricula reported, most were didactic in nature and did not include an assessment component.8
Experiential learning through simulation is one promising method to teach clinicians-in-training to practice value-based care. Simulation-based training promotes situational awareness (defined as being cognizant of one’s working environment), a concept that is crucial for recognizing both low-value and unsafe care.9,10 Simulated training exercises are often included in GME orientation “boot-camps,” which have typically addressed safety.11 The incorporation of value into existing GME boot-camp exercises could provide a promising model for the addition of value-based training to GME.
At the University of Chicago, we had successfully implemented the “Room of Horrors,” a simulation for entering interns to promote the detection of patient safety hazards.11 Here, we describe a modification to this simulation to embed low-value hazards in addition to traditional patient safety hazards. The aim of this study is to assess the entering interns’ recognition of low-value care and their ability to recognize unsafe care in a simulation designed to promote situational awareness.
METHODS
Setting and Participants
The simulation was conducted during GME orientation at a large, urban academic medical institution. One hundred and twenty-five entering postgraduate year one (PGY1) interns participated in the simulation, which was a required component of a multiday orientation “boot-camp” experience. All eligible interns participated in the simulation, representing 13 specialty programs and 60 medical schools. Interns entering into pathology were excluded because of infrequent patient contact. Participating interns were divided into 7 specialty groups for analysis in order to preserve the anonymity of interns in smaller residency programs (surgical subspecialties combined with general surgery, medicine-pediatrics grouped with internal medicine). The University of Chicago Institutional Review Board deemed this study exempt from review.
Program Description
A simulation of an inpatient hospital room, known as the “Room of Horrors,” was constructed in collaboration with the University of Chicago Simulation Center and adapted from a previous version of the exercise.11 The simulation consisted of a mock door chart highlighting the patient had been admitted for diarrhea (Clostridium difficile positive) following a recent hospitalization for pneumonia. A clinical scenario was constructed by using a patient mannequin and an accompanying door chart that listed information on the patient’s hospital course, allergies, and medications. In addition to the 8 patient safety hazards utilized in the prior version, our team selected 4 low-value hazards to be included in the simulation.

The 8 safety hazards have been detailed in a prior study and were previously selected from Medicare’s Hospital-Acquired Conditions (HAC) Reduction Program and Agency for Healthcare Research and Quality (AHRQ) Patient Safety Indicators.11-13 Each of the hazards was represented either physically in the simulation room and/or was indicated on the patient’s chart. For example, the latex allergy hazard was represented by latex gloves at the bedside despite an allergy indicated on the patient’s chart and wristband. A complete list of the 8 safety hazards and their representations in the simulation is shown in Table 1.
The Choosing Wisely™ lists were reviewed to identify low-value hazards for addition to the simulation.14 Our team selected 3 low-value hazards from the Society of Hospital Medicine (SHM) list,15 including (1) arbitrary blood transfusion despite the patient’s stable hemoglobin level of 8.0 g/dL and absence of cardiac symptoms,16 (2) addition of a proton pump inhibitor (PPI) for stress ulcer prophylaxis in a patient without high risk for gastrointestinal (GI) complications who was not on a PPI prior to admission, and (3) placement of a urinary catheter without medical indication. We had originally selected continuous telemetry monitoring as a fourth hazard from the SHM list, but were unable to operationalize, as it was difficult to simulate continuous telemetry on a mannequin. Because many inpatients are older than 65 years, we reviewed the American Geriatrics Society list17 and selected our fourth low-value hazard: (4) unnecessary use of physical restraints to manage behavioral symptoms in a hospitalized patient with delirium. Several of these hazards were also quality and safety priorities at our institution, including the overuse of urinary catheters, physical restraints, and blood transfusions. All 4 low-value hazards were referenced in the patient’s door chart, and 3 were also physically represented in the room via presence of a hanging unit of blood, Foley catheter, and upper-arm restraints (Table 1). See Appendix for a photograph of the simulation setup.
Each intern was allowed 10 minutes inside the simulation room. During this time, they were instructed to read the 1-page door chart, inspect the simulation room, and write down as many potential low-value and safety hazards as they could identify on a free-response form (see Appendix). Upon exiting the room, they were allotted 5 additional minutes to complete their free-response answers and provide written feedback on the simulation. The simulation was conducted in 3 simulated hospital rooms over the course of 2 days, and the correct answers were provided via e-mail after all interns had completed the exercise.
To assess prior training and safety knowledge, interns were asked to complete a 3-question preassessment on a ScanTronTM (Tustin, CA) form. The preassessment asked interns whether they had received training on hospital safety during medical school (yes, no, or unsure), if they were satisfied with the hospital safety training they received during medical school (strongly disagree to strongly agree on a Likert scale), and if they were confident in their ability to identify potential hazards in a hospital setting (strongly disagree to strongly agree). Interns were also given the opportunity to provide feedback on the simulation experience on the ScanTronTM (Tustin, CA) form.
One month after participating in the simulation, interns were asked to complete an online follow-up survey on MedHubTM (Ann Arbor, MI), which included 2 Likert-scale questions (strongly disagree to strongly agree) assessing the simulation’s impact on their experience mitigating hospital hazards during the first month of internship.
Data Analysis
Interns’ free-response answers were manually coded, and descriptive statistics were used to summarize the mean percent correct for each hazard. A paired t test was used to compare intern identification of low-value vs safety hazards. T tests were used to compare hazard identification for interns entering highly procedural-intensive specialties (ie, surgical specialties, emergency medicine, anesthesia, obstetrics/gynecology) and those entering less procedural-intensive specialties (ie, internal medicine, pediatrics, psychiatry), as well as among those graduating from “Top 30” medical schools (based on US News & World Report Medical School Rankings18) and our own institution. One-way analysis of variance (ANOVA) calculations were used to test for differences in hazard identification based on interns’ prior hospital safety training, with interns who rated their satisfaction with prior training or confidence in identifying hazards as a “4” or a “5” considered “satisfied” and “confident,” respectively. Responses to the MedHubTM (Ann Arbor, MI) survey were dichotomized with “strongly agree” and “agree” considered positive responses. Statistical significance was defined at P < .05. All data analysis was conducted using Stata 14TM software (College Station, TX).
RESULTS
Intern Characteristics

One hundred twenty-five entering PGY1 interns participated in the simulation, representing 60 medical schools and 7 different specialty groups (Table 2). Thirty-five percent (44/125) were graduates from “Top 30” medical schools, and 8.8% (11/125) graduated from our own institution. Seventy-four percent (89/121) had received prior hospital safety training during medical school, and 62.9% (56/89) were satisfied with their training. A majority of interns (64.2%, 79/123) felt confident in their ability to identify potential hazards in a hospital setting, although confidence was much higher among those with prior safety training (71.9%, 64/89) compared to those without prior training or who were unsure about their training (40.6%, 13/32; P = .09, t test).

Identification of Hazards
The mean percentage of hazards correctly identified by interns during the simulation was 50.4% (standard deviation [SD] 11.8%), with a normal distribution (Figure 1). Interns identified a significantly lower percentage of low-value hazards than safety hazards in the simulation (mean 19.2% [SD 18.6%] vs 66.0% [SD 16.0%], respectively; P < .001, paired t test). Interns also identified significantly more room-based errors than chart-based errors (mean 58.6% [SD 13.4%] vs 9.6% [SD 19.8%], respectively; P < .001, paired t test). The 3 most commonly identified hazards were unavailability of hand hygiene (120/125, 96.0%), presence of latex gloves despite the patient’s allergy (111/125, 88.8%), and fall risk due to the lowered bed rail (107/125, 85.6%). More than half of interns identified the incorrect name on the patient’s wristband and IV bag (91/125, 72.8%), a lack of isolation precautions (90/125, 72.0%), administration of penicillin despite the patient’s allergy (67/125, 53.6%), and unnecessary restraints (64/125, 51.2%). Less than half of interns identified the wrong medication being administered (50/125, 40.0%), unnecessary Foley catheter (25/125, 20.0%), and absence of venous thromboembolism (VTE) prophylaxis (24/125, 19.2%). Few interns identified the unnecessary blood transfusion (7/125, 5.6%), and no one identified the unnecessary stress ulcer prophylaxis (0/125, 0.0%; Figure 2).
. N = 125.")
Predictors of Hazard Identification
Interns who self-reported as confident in their ability to identify hazards were not any more likely to correctly identify hazards than those who were not confident (50.9% overall hazard identification vs 49.6%, respectively; P = .56, t test). Interns entering into less procedural-intensive specialties identified significantly more safety hazards than those entering highly procedural-intensive specialties (mean 69.1% [SD 16.9%] vs 61.8% [SD 13.7%], respectively; P = .01, t test). However, there was no statistically significant difference in their identification of low-value hazards (mean 19.8% [SD 18.3%] for less procedural-intensive vs 18.4% [SD 19.1%] for highly procedural-intensive; P = .68, t test). There was no statistically significant difference in hazard identification among graduates of “Top 30” medical schools or graduates of our own institution. Prior hospital safety training had no significant impact on interns’ ability to identify safety or low-value hazards. Overall, interns who were satisfied with their prior training identified a mean of 51.8% of hazards present (SD 11.8%), interns who were not satisfied with their prior training identified 51.5% (SD 12.7%), interns with no prior training identified 48.7% (SD 11.7%), and interns who were unsure about their prior training identified 47.4% (SD 11.5%) [F(3,117) = .79; P = .51, ANOVA]. There was also no significant association between prior training and the identification of any one of the 12 specific hazards (chi-square tests, all P values > .1).
Intern Feedback and Follow-Up Survey
Debriefing revealed that most interns passively assumed the patient’s chart was correct and did not think they should question the patient’s current care regimen. For example, many interns commented that they did not think to consider the patient’s blood transfusion as unnecessary, even though they were aware of the recommended hemoglobin cutoffs for stable patients.
Interns also provided formal feedback on the simulation through open-ended comments on their ScanTronTM (Tustin, CA) form. For example, one intern wrote that they would “inherently approach every patient room ‘looking’ for safety issues, probably directly because of this exercise.” Another commented that the simulation was “more difficult than I expected, but very necessary to facilitate discussion and learning.” One intern wrote that “I wish I had done this earlier in my career.”
Ninety-six percent of participating interns (120/125) completed an online follow-up survey 1 month after beginning internship. In the survey, 68.9% (82/119) of interns indicated they were more aware of how to identify potential hazards facing hospitalized patients as a result of the simulation. Furthermore, 52.1% (62/119) of interns had taken action during internship to reduce a potential hazard that was present in the simulation.
DISCUSSION
While many GME orientations include simulation and safety training, this study is the first of its kind to incorporate low-value care from Choosing Wisely™ recommendations into simulated training. It is concerning that interns identified significantly fewer low-value hazards than safety hazards in the simulation. In some cases, no interns identified the low-value hazard. For example, while almost all interns identified the hand hygiene hazard, not one could identify the unnecessary stress ulcer prophylaxis. Furthermore, interns who self-reported as confident in their ability to identify hazards did not perform any better in the simulation. Interns entering less procedural-intensive specialties identified more safety hazards overall.
The simulation was well received by interns. Many commented that the experience was engaging, challenging, and effective in cultivating situational awareness towards low-value care. Our follow-up survey demonstrated the majority of interns reported taking action during their first month of internship to reduce a hazard included in the simulation. Most interns also reported a greater awareness of how to identify hospital hazards as a result of the simulation. These findings suggest that a brief simulation-based experience has the potential to create a lasting retention of situational awareness and behavior change.
It is worth exploring why interns identified significantly fewer low-value hazards than safety hazards in the simulation. One hypothesis is that interns were less attuned to low-value hazards, which may reflect a lacking emphasis on value-based care in undergraduate medical education (UME). It is especially concerning that so few interns identified the catheter-associated urinary tract infection (CAUTI) risk, as interns are primarily responsible for recognizing and removing an unnecessary catheter. Although the risks of low-value care should be apparent to most trainees, the process of recognizing and deliberately stopping or avoiding low-value care can be challenging for young clinicians.19 To promote value-based thinking among entering residents, UME programs should teach students to question the utility of the interventions their patients are receiving. One promising framework for doing so is the Subjective, Objective, Assessment, Plan- (SOAP)-V, in which a V for “Value” is added to the traditional SOAP note.20 SOAP-V notes serve as a cognitive forcing function that requires students to pause and assess the value and cost-consciousness of their patients’ care.20
The results from the “Room of Horrors” simulation can also guide health leaders and educators in identifying institutional areas of focus towards providing high-value and safe care. For example, at the University of Chicago we launched an initiative to improve the inappropriate use of urinary catheters after learning that few of our incoming interns recognized this during the simulation. Institutions could use this model to raise awareness of initiatives and redirect resources from areas that trainees perform well in (eg, hand hygiene) to areas that need improvement (eg, recognition of low-value care). Given the simulation’s low cost and minimal material requirements, it could be easily integrated into existing training programs with the support of an institution’s simulation center.
This study’s limitations include its conduction at single-institution, although the participants represented graduates of 60 different institutions. Furthermore, while the 12 hazards included in the simulation represent patient safety and value initiatives from a wide array of medical societies, they were not intended to be comprehensive and were not tailored to specific specialties. The simulation included only 4 low-value hazards, and future iterations of this exercise should aim to include an equal number of safety and low-value hazards. Furthermore, the evaluation of interns’ prior hospital safety training relied on self-reporting, and the specific context and content of each interns’ training was not examined. Finally, at this point we are unable to provide objective longitudinal data assessing the simulation’s impact on clinical practice and patient outcomes. Subsequent work will assess the sustained impact of the simulation by correlating with institutional data on measurable occurrences of low-value care.
In conclusion, interns identified significantly fewer low-value hazards than safety hazards in an inpatient simulation designed to promote situational awareness. Our results suggest that interns are on the lookout for errors of omission (eg, absence of hand hygiene, absence of isolation precautions) but are often blinded to errors of commission, such that when patients are started on therapies there is an assumption that the therapies are correct and necessary (eg, blood transfusions, stress ulcer prophylaxis). These findings suggest poor awareness of low-value care among incoming interns and highlight the need for additional training in both UME and GME to place a greater emphasis on preventing low-value care.
Disclosure
Dr. Arora is a member of the American Board of Medicine Board of Directors and has received grant funding from ABIM Foundation via Costs of Care for the Teaching Value Choosing Wisely™ Challenge. Dr. Farnan, Dr. Arora, and Ms. Hirsch receive grant funds from Accreditation Council of Graduate Medical Education as part of the Pursuing Excellence Initiative. Dr. Arora and Dr. Farnan also receive grant funds from the American Medical Association Accelerating Change in Medical Education initiative. Kathleen Wiest and Lukas Matern were funded through matching funds of the Pritzker Summer Research Program for NIA T35AG029795.
1. Colla CH, Morden NE, Sequist TD, Schpero WL, Rosenthal MB. Choosing wisely: prevalence and correlates of low-value health care services in the United States. J Gen Intern Med. 2015;30(2):221-228. doi:10.1007/s11606-014-3070-z. PubMed
2. Elshaug AG, McWilliams JM, Landon BE. The value of low-value lists. JAMA. 2013;309(8):775-776. doi:10.1001/jama.2013.828. PubMed
3. Cooke M. Cost consciousness in patient care--what is medical education’s responsibility? N Engl J Med. 2010;362(14):1253-1255. doi:10.1056/NEJMp0911502. PubMed
4. Weinberger SE. Providing high-value, cost-conscious care: a critical seventh general competency for physicians. Ann Intern Med. 2011;155(6):386-388. doi:10.7326/0003-4819-155-6-201109200-00007. PubMed
5. Graduate Medical Education That Meets the Nation’s Health Needs. Institute of Medicine. http://www.nationalacademies.org/hmd/Reports/2014/Graduate-Medical-Education-That-Meets-the-Nations-Health-Needs.aspx. Accessed May 25, 2016.
6. Accreditation Council for Graduate Medical Education. CLER Pathways to Excellence. https://www.acgme.org/acgmeweb/Portals/0/PDFs/CLER/CLER_Brochure.pdf. Accessed July 15, 2015.
7. Varkey P, Murad MH, Braun C, Grall KJH, Saoji V. A review of cost-effectiveness, cost-containment and economics curricula in graduate medical education. J Eval Clin Pract. 2010;16(6):1055-1062. doi:10.1111/j.1365-2753.2009.01249.x. PubMed
8. Patel MS, Reed DA, Loertscher L, McDonald FS, Arora VM. Teaching residents to provide cost-conscious care: a national survey of residency program directors. JAMA Intern Med. 2014;174(3):470-472. doi:10.1001/jamainternmed.2013.13222. PubMed
9. Cohen NL. Using the ABCs of situational awareness for patient safety. Nursing. 2013;43(4):64-65. doi:10.1097/01.NURSE.0000428332.23978.82. PubMed
10. Varkey P, Karlapudi S, Rose S, Swensen S. A patient safety curriculum for graduate medical education: results from a needs assessment of educators and patient safety experts. Am J Med Qual. 2009;24(3):214-221. doi:10.1177/1062860609332905. PubMed
11. Farnan JM, Gaffney S, Poston JT, et al. Patient safety room of horrors: a novel method to assess medical students and entering residents’ ability to identify hazards of hospitalisation. BMJ Qual Saf. 2016;25(3):153-158. doi:10.1136/bmjqs-2015-004621. PubMed
12. Centers for Medicare and Medicaid Services Hospital-acquired condition reduction program. Medicare.gov. https://www.medicare.gov/hospitalcompare/HAC-reduction-program.html. Accessed August 1, 2015.
13. Agency for Healthcare Research and Quality. Patient Safety Indicators Overview. http://www. qualityindicators.ahrq.gov/modules/psi_overview.aspx. Accessed August 20, 2015.
14. ABIM Foundation. Choosing Wisely. http://www.choosingwisely.org. Accessed August 21, 2015.
15. ABIM Foundation. Society of Hospital Medicine – Adult Hospital Medicine List. Choosing Wisely. http://www.choosingwisely.org/societies/ society-of-hospital-medicine-adult/. Accessed August 21, 2015.
16. Carson JL, Grossman BJ, Kleinman S, et al. Red blood cell transfusion: A clinical practice guideline from the AABB*. Ann Intern Med. 2012;157(1):49-58. PubMed
17. ABIM Foundation. American Geriatrics Society List. Choosing Wisely. http://www.choosingwisely.org/societies/american-geriatrics-society/. Accessed August 21, 2015.
18. The Best Medical Schools for Research, Ranked. http://grad-schools.usnews.rankingsandreviews.com/best-graduate-schools/top-medical-schools/research-rankings?int=af3309&int=b3b50a&int=b14409. Accessed June 7, 2016.
19. Roman BR, Asch DA. Faded promises: The challenge of deadopting low-value care. Ann Intern Med. 2014;161(2):149-150. doi:10.7326/M14-0212. PubMed
20. Moser EM, Huang GC, Packer CD, et al. SOAP-V: Introducing a method to empower medical students to be change agents in bending the cost curve. J Hosp Med. 2016;11(3):217-220. doi:10.1002/jhm.2489. PubMed
In recent years, the American Board of Internal Medicine (ABIM) Foundation’s Choosing Wisely™ campaign has advanced the dialogue on cost-consciousness by identifying potential examples of overuse in clinical practice.1 Eliminating low-value care can decrease costs, improve quality, and potentially decrease patient harm.2 In fact, there is growing consensus among health leaders and educators on the need for a physician workforce that is conscious of high-value care.3,4 The Institute of Medicine has issued a call-to-action for graduate medical education (GME) to emphasize value-based care,5 and the Accreditation Council for Graduate Medical Education has outlined expectations that residents receive formal and experiential training on overuse as a part of its Clinical Learning Environment Review.6
However, recent reports highlight a lack of emphasis on value-based care in medical education.7 For example, few residency program directors believe that residents are prepared to incorporate value and cost into their medical decisions.8 In 2012, only 15% of medicine residencies reported having formal curricula addressing value, although many were developing one.8 Of the curricula reported, most were didactic in nature and did not include an assessment component.8
Experiential learning through simulation is one promising method to teach clinicians-in-training to practice value-based care. Simulation-based training promotes situational awareness (defined as being cognizant of one’s working environment), a concept that is crucial for recognizing both low-value and unsafe care.9,10 Simulated training exercises are often included in GME orientation “boot-camps,” which have typically addressed safety.11 The incorporation of value into existing GME boot-camp exercises could provide a promising model for the addition of value-based training to GME.
At the University of Chicago, we had successfully implemented the “Room of Horrors,” a simulation for entering interns to promote the detection of patient safety hazards.11 Here, we describe a modification to this simulation to embed low-value hazards in addition to traditional patient safety hazards. The aim of this study is to assess the entering interns’ recognition of low-value care and their ability to recognize unsafe care in a simulation designed to promote situational awareness.
METHODS
Setting and Participants
The simulation was conducted during GME orientation at a large, urban academic medical institution. One hundred and twenty-five entering postgraduate year one (PGY1) interns participated in the simulation, which was a required component of a multiday orientation “boot-camp” experience. All eligible interns participated in the simulation, representing 13 specialty programs and 60 medical schools. Interns entering into pathology were excluded because of infrequent patient contact. Participating interns were divided into 7 specialty groups for analysis in order to preserve the anonymity of interns in smaller residency programs (surgical subspecialties combined with general surgery, medicine-pediatrics grouped with internal medicine). The University of Chicago Institutional Review Board deemed this study exempt from review.
Program Description
A simulation of an inpatient hospital room, known as the “Room of Horrors,” was constructed in collaboration with the University of Chicago Simulation Center and adapted from a previous version of the exercise.11 The simulation consisted of a mock door chart highlighting the patient had been admitted for diarrhea (Clostridium difficile positive) following a recent hospitalization for pneumonia. A clinical scenario was constructed by using a patient mannequin and an accompanying door chart that listed information on the patient’s hospital course, allergies, and medications. In addition to the 8 patient safety hazards utilized in the prior version, our team selected 4 low-value hazards to be included in the simulation.
The 8 safety hazards have been detailed in a prior study and were previously selected from Medicare’s Hospital-Acquired Conditions (HAC) Reduction Program and Agency for Healthcare Research and Quality (AHRQ) Patient Safety Indicators.11-13 Each of the hazards was represented either physically in the simulation room and/or was indicated on the patient’s chart. For example, the latex allergy hazard was represented by latex gloves at the bedside despite an allergy indicated on the patient’s chart and wristband. A complete list of the 8 safety hazards and their representations in the simulation is shown in Table 1.
The Choosing Wisely™ lists were reviewed to identify low-value hazards for addition to the simulation.14 Our team selected 3 low-value hazards from the Society of Hospital Medicine (SHM) list,15 including (1) arbitrary blood transfusion despite the patient’s stable hemoglobin level of 8.0 g/dL and absence of cardiac symptoms,16 (2) addition of a proton pump inhibitor (PPI) for stress ulcer prophylaxis in a patient without high risk for gastrointestinal (GI) complications who was not on a PPI prior to admission, and (3) placement of a urinary catheter without medical indication. We had originally selected continuous telemetry monitoring as a fourth hazard from the SHM list, but were unable to operationalize, as it was difficult to simulate continuous telemetry on a mannequin. Because many inpatients are older than 65 years, we reviewed the American Geriatrics Society list17 and selected our fourth low-value hazard: (4) unnecessary use of physical restraints to manage behavioral symptoms in a hospitalized patient with delirium. Several of these hazards were also quality and safety priorities at our institution, including the overuse of urinary catheters, physical restraints, and blood transfusions. All 4 low-value hazards were referenced in the patient’s door chart, and 3 were also physically represented in the room via presence of a hanging unit of blood, Foley catheter, and upper-arm restraints (Table 1). See Appendix for a photograph of the simulation setup.
Each intern was allowed 10 minutes inside the simulation room. During this time, they were instructed to read the 1-page door chart, inspect the simulation room, and write down as many potential low-value and safety hazards as they could identify on a free-response form (see Appendix). Upon exiting the room, they were allotted 5 additional minutes to complete their free-response answers and provide written feedback on the simulation. The simulation was conducted in 3 simulated hospital rooms over the course of 2 days, and the correct answers were provided via e-mail after all interns had completed the exercise.
To assess prior training and safety knowledge, interns were asked to complete a 3-question preassessment on a ScanTronTM (Tustin, CA) form. The preassessment asked interns whether they had received training on hospital safety during medical school (yes, no, or unsure), if they were satisfied with the hospital safety training they received during medical school (strongly disagree to strongly agree on a Likert scale), and if they were confident in their ability to identify potential hazards in a hospital setting (strongly disagree to strongly agree). Interns were also given the opportunity to provide feedback on the simulation experience on the ScanTronTM (Tustin, CA) form.
One month after participating in the simulation, interns were asked to complete an online follow-up survey on MedHubTM (Ann Arbor, MI), which included 2 Likert-scale questions (strongly disagree to strongly agree) assessing the simulation’s impact on their experience mitigating hospital hazards during the first month of internship.
Data Analysis
Interns’ free-response answers were manually coded, and descriptive statistics were used to summarize the mean percent correct for each hazard. A paired t test was used to compare intern identification of low-value vs safety hazards. T tests were used to compare hazard identification for interns entering highly procedural-intensive specialties (ie, surgical specialties, emergency medicine, anesthesia, obstetrics/gynecology) and those entering less procedural-intensive specialties (ie, internal medicine, pediatrics, psychiatry), as well as among those graduating from “Top 30” medical schools (based on US News & World Report Medical School Rankings18) and our own institution. One-way analysis of variance (ANOVA) calculations were used to test for differences in hazard identification based on interns’ prior hospital safety training, with interns who rated their satisfaction with prior training or confidence in identifying hazards as a “4” or a “5” considered “satisfied” and “confident,” respectively. Responses to the MedHubTM (Ann Arbor, MI) survey were dichotomized with “strongly agree” and “agree” considered positive responses. Statistical significance was defined at P < .05. All data analysis was conducted using Stata 14TM software (College Station, TX).
RESULTS
Intern Characteristics
One hundred twenty-five entering PGY1 interns participated in the simulation, representing 60 medical schools and 7 different specialty groups (Table 2). Thirty-five percent (44/125) were graduates from “Top 30” medical schools, and 8.8% (11/125) graduated from our own institution. Seventy-four percent (89/121) had received prior hospital safety training during medical school, and 62.9% (56/89) were satisfied with their training. A majority of interns (64.2%, 79/123) felt confident in their ability to identify potential hazards in a hospital setting, although confidence was much higher among those with prior safety training (71.9%, 64/89) compared to those without prior training or who were unsure about their training (40.6%, 13/32; P = .09, t test).
Identification of Hazards
The mean percentage of hazards correctly identified by interns during the simulation was 50.4% (standard deviation [SD] 11.8%), with a normal distribution (Figure 1). Interns identified a significantly lower percentage of low-value hazards than safety hazards in the simulation (mean 19.2% [SD 18.6%] vs 66.0% [SD 16.0%], respectively; P < .001, paired t test). Interns also identified significantly more room-based errors than chart-based errors (mean 58.6% [SD 13.4%] vs 9.6% [SD 19.8%], respectively; P < .001, paired t test). The 3 most commonly identified hazards were unavailability of hand hygiene (120/125, 96.0%), presence of latex gloves despite the patient’s allergy (111/125, 88.8%), and fall risk due to the lowered bed rail (107/125, 85.6%). More than half of interns identified the incorrect name on the patient’s wristband and IV bag (91/125, 72.8%), a lack of isolation precautions (90/125, 72.0%), administration of penicillin despite the patient’s allergy (67/125, 53.6%), and unnecessary restraints (64/125, 51.2%). Less than half of interns identified the wrong medication being administered (50/125, 40.0%), unnecessary Foley catheter (25/125, 20.0%), and absence of venous thromboembolism (VTE) prophylaxis (24/125, 19.2%). Few interns identified the unnecessary blood transfusion (7/125, 5.6%), and no one identified the unnecessary stress ulcer prophylaxis (0/125, 0.0%; Figure 2).
Predictors of Hazard Identification
Interns who self-reported as confident in their ability to identify hazards were not any more likely to correctly identify hazards than those who were not confident (50.9% overall hazard identification vs 49.6%, respectively; P = .56, t test). Interns entering into less procedural-intensive specialties identified significantly more safety hazards than those entering highly procedural-intensive specialties (mean 69.1% [SD 16.9%] vs 61.8% [SD 13.7%], respectively; P = .01, t test). However, there was no statistically significant difference in their identification of low-value hazards (mean 19.8% [SD 18.3%] for less procedural-intensive vs 18.4% [SD 19.1%] for highly procedural-intensive; P = .68, t test). There was no statistically significant difference in hazard identification among graduates of “Top 30” medical schools or graduates of our own institution. Prior hospital safety training had no significant impact on interns’ ability to identify safety or low-value hazards. Overall, interns who were satisfied with their prior training identified a mean of 51.8% of hazards present (SD 11.8%), interns who were not satisfied with their prior training identified 51.5% (SD 12.7%), interns with no prior training identified 48.7% (SD 11.7%), and interns who were unsure about their prior training identified 47.4% (SD 11.5%) [F(3,117) = .79; P = .51, ANOVA]. There was also no significant association between prior training and the identification of any one of the 12 specific hazards (chi-square tests, all P values > .1).
Intern Feedback and Follow-Up Survey
Debriefing revealed that most interns passively assumed the patient’s chart was correct and did not think they should question the patient’s current care regimen. For example, many interns commented that they did not think to consider the patient’s blood transfusion as unnecessary, even though they were aware of the recommended hemoglobin cutoffs for stable patients.
Interns also provided formal feedback on the simulation through open-ended comments on their ScanTronTM (Tustin, CA) form. For example, one intern wrote that they would “inherently approach every patient room ‘looking’ for safety issues, probably directly because of this exercise.” Another commented that the simulation was “more difficult than I expected, but very necessary to facilitate discussion and learning.” One intern wrote that “I wish I had done this earlier in my career.”
Ninety-six percent of participating interns (120/125) completed an online follow-up survey 1 month after beginning internship. In the survey, 68.9% (82/119) of interns indicated they were more aware of how to identify potential hazards facing hospitalized patients as a result of the simulation. Furthermore, 52.1% (62/119) of interns had taken action during internship to reduce a potential hazard that was present in the simulation.
DISCUSSION
While many GME orientations include simulation and safety training, this study is the first of its kind to incorporate low-value care from Choosing Wisely™ recommendations into simulated training. It is concerning that interns identified significantly fewer low-value hazards than safety hazards in the simulation. In some cases, no interns identified the low-value hazard. For example, while almost all interns identified the hand hygiene hazard, not one could identify the unnecessary stress ulcer prophylaxis. Furthermore, interns who self-reported as confident in their ability to identify hazards did not perform any better in the simulation. Interns entering less procedural-intensive specialties identified more safety hazards overall.
The simulation was well received by interns. Many commented that the experience was engaging, challenging, and effective in cultivating situational awareness towards low-value care. Our follow-up survey demonstrated the majority of interns reported taking action during their first month of internship to reduce a hazard included in the simulation. Most interns also reported a greater awareness of how to identify hospital hazards as a result of the simulation. These findings suggest that a brief simulation-based experience has the potential to create a lasting retention of situational awareness and behavior change.
It is worth exploring why interns identified significantly fewer low-value hazards than safety hazards in the simulation. One hypothesis is that interns were less attuned to low-value hazards, which may reflect a lacking emphasis on value-based care in undergraduate medical education (UME). It is especially concerning that so few interns identified the catheter-associated urinary tract infection (CAUTI) risk, as interns are primarily responsible for recognizing and removing an unnecessary catheter. Although the risks of low-value care should be apparent to most trainees, the process of recognizing and deliberately stopping or avoiding low-value care can be challenging for young clinicians.19 To promote value-based thinking among entering residents, UME programs should teach students to question the utility of the interventions their patients are receiving. One promising framework for doing so is the Subjective, Objective, Assessment, Plan- (SOAP)-V, in which a V for “Value” is added to the traditional SOAP note.20 SOAP-V notes serve as a cognitive forcing function that requires students to pause and assess the value and cost-consciousness of their patients’ care.20
The results from the “Room of Horrors” simulation can also guide health leaders and educators in identifying institutional areas of focus towards providing high-value and safe care. For example, at the University of Chicago we launched an initiative to improve the inappropriate use of urinary catheters after learning that few of our incoming interns recognized this during the simulation. Institutions could use this model to raise awareness of initiatives and redirect resources from areas that trainees perform well in (eg, hand hygiene) to areas that need improvement (eg, recognition of low-value care). Given the simulation’s low cost and minimal material requirements, it could be easily integrated into existing training programs with the support of an institution’s simulation center.
This study’s limitations include its conduction at single-institution, although the participants represented graduates of 60 different institutions. Furthermore, while the 12 hazards included in the simulation represent patient safety and value initiatives from a wide array of medical societies, they were not intended to be comprehensive and were not tailored to specific specialties. The simulation included only 4 low-value hazards, and future iterations of this exercise should aim to include an equal number of safety and low-value hazards. Furthermore, the evaluation of interns’ prior hospital safety training relied on self-reporting, and the specific context and content of each interns’ training was not examined. Finally, at this point we are unable to provide objective longitudinal data assessing the simulation’s impact on clinical practice and patient outcomes. Subsequent work will assess the sustained impact of the simulation by correlating with institutional data on measurable occurrences of low-value care.
In conclusion, interns identified significantly fewer low-value hazards than safety hazards in an inpatient simulation designed to promote situational awareness. Our results suggest that interns are on the lookout for errors of omission (eg, absence of hand hygiene, absence of isolation precautions) but are often blinded to errors of commission, such that when patients are started on therapies there is an assumption that the therapies are correct and necessary (eg, blood transfusions, stress ulcer prophylaxis). These findings suggest poor awareness of low-value care among incoming interns and highlight the need for additional training in both UME and GME to place a greater emphasis on preventing low-value care.
Disclosure
Dr. Arora is a member of the American Board of Medicine Board of Directors and has received grant funding from ABIM Foundation via Costs of Care for the Teaching Value Choosing Wisely™ Challenge. Dr. Farnan, Dr. Arora, and Ms. Hirsch receive grant funds from Accreditation Council of Graduate Medical Education as part of the Pursuing Excellence Initiative. Dr. Arora and Dr. Farnan also receive grant funds from the American Medical Association Accelerating Change in Medical Education initiative. Kathleen Wiest and Lukas Matern were funded through matching funds of the Pritzker Summer Research Program for NIA T35AG029795.
1. Colla CH, Morden NE, Sequist TD, Schpero WL, Rosenthal MB. Choosing wisely: prevalence and correlates of low-value health care services in the United States. J Gen Intern Med. 2015;30(2):221-228. doi:10.1007/s11606-014-3070-z. PubMed
2. Elshaug AG, McWilliams JM, Landon BE. The value of low-value lists. JAMA. 2013;309(8):775-776. doi:10.1001/jama.2013.828. PubMed
3. Cooke M. Cost consciousness in patient care--what is medical education’s responsibility? N Engl J Med. 2010;362(14):1253-1255. doi:10.1056/NEJMp0911502. PubMed
4. Weinberger SE. Providing high-value, cost-conscious care: a critical seventh general competency for physicians. Ann Intern Med. 2011;155(6):386-388. doi:10.7326/0003-4819-155-6-201109200-00007. PubMed
5. Graduate Medical Education That Meets the Nation’s Health Needs. Institute of Medicine. http://www.nationalacademies.org/hmd/Reports/2014/Graduate-Medical-Education-That-Meets-the-Nations-Health-Needs.aspx. Accessed May 25, 2016.
6. Accreditation Council for Graduate Medical Education. CLER Pathways to Excellence. https://www.acgme.org/acgmeweb/Portals/0/PDFs/CLER/CLER_Brochure.pdf. Accessed July 15, 2015.
7. Varkey P, Murad MH, Braun C, Grall KJH, Saoji V. A review of cost-effectiveness, cost-containment and economics curricula in graduate medical education. J Eval Clin Pract. 2010;16(6):1055-1062. doi:10.1111/j.1365-2753.2009.01249.x. PubMed
8. Patel MS, Reed DA, Loertscher L, McDonald FS, Arora VM. Teaching residents to provide cost-conscious care: a national survey of residency program directors. JAMA Intern Med. 2014;174(3):470-472. doi:10.1001/jamainternmed.2013.13222. PubMed
9. Cohen NL. Using the ABCs of situational awareness for patient safety. Nursing. 2013;43(4):64-65. doi:10.1097/01.NURSE.0000428332.23978.82. PubMed
10. Varkey P, Karlapudi S, Rose S, Swensen S. A patient safety curriculum for graduate medical education: results from a needs assessment of educators and patient safety experts. Am J Med Qual. 2009;24(3):214-221. doi:10.1177/1062860609332905. PubMed
11. Farnan JM, Gaffney S, Poston JT, et al. Patient safety room of horrors: a novel method to assess medical students and entering residents’ ability to identify hazards of hospitalisation. BMJ Qual Saf. 2016;25(3):153-158. doi:10.1136/bmjqs-2015-004621. PubMed
12. Centers for Medicare and Medicaid Services Hospital-acquired condition reduction program. Medicare.gov. https://www.medicare.gov/hospitalcompare/HAC-reduction-program.html. Accessed August 1, 2015.
13. Agency for Healthcare Research and Quality. Patient Safety Indicators Overview. http://www. qualityindicators.ahrq.gov/modules/psi_overview.aspx. Accessed August 20, 2015.
14. ABIM Foundation. Choosing Wisely. http://www.choosingwisely.org. Accessed August 21, 2015.
15. ABIM Foundation. Society of Hospital Medicine – Adult Hospital Medicine List. Choosing Wisely. http://www.choosingwisely.org/societies/ society-of-hospital-medicine-adult/. Accessed August 21, 2015.
16. Carson JL, Grossman BJ, Kleinman S, et al. Red blood cell transfusion: A clinical practice guideline from the AABB*. Ann Intern Med. 2012;157(1):49-58. PubMed
17. ABIM Foundation. American Geriatrics Society List. Choosing Wisely. http://www.choosingwisely.org/societies/american-geriatrics-society/. Accessed August 21, 2015.
18. The Best Medical Schools for Research, Ranked. http://grad-schools.usnews.rankingsandreviews.com/best-graduate-schools/top-medical-schools/research-rankings?int=af3309&int=b3b50a&int=b14409. Accessed June 7, 2016.
19. Roman BR, Asch DA. Faded promises: The challenge of deadopting low-value care. Ann Intern Med. 2014;161(2):149-150. doi:10.7326/M14-0212. PubMed
20. Moser EM, Huang GC, Packer CD, et al. SOAP-V: Introducing a method to empower medical students to be change agents in bending the cost curve. J Hosp Med. 2016;11(3):217-220. doi:10.1002/jhm.2489. PubMed
© 2017 Society of Hospital Medicine
Evaluation of Patch Test Reactivities in Patients With Chronic Idiopathic Urticaria
Chronic urticaria (CU) is clinically defined as the daily or almost daily presence of wheals on the skin for at least 6 weeks.1 Chronic urticaria severely affects patients’ quality of life and can cause emotional disability and distress.2 In clinical practice, CU is one of the most common and challenging conditions for general practitioners, dermatologists, and allergists. It can be provoked by a wide variety of different causes or may be the clinical presentation of certain systemic diseases3,4; thus, CU often requires a detailed and time-consuming diagnostic procedure that includes screening for allergies, autoimmune diseases, parasites, malignancies, infections, and metabolic disorders.5,6 In many patients (up to 50% in some case series), the cause or pathogenic mechanism cannot be identified, and the disease is then classified as chronic idiopathic urticaria (CIU).7
It has previously been shown that contact sensitization could have some relation with CIU,8 which was further explored in this study. This study sought to evaluate if contact allergy may play a role in disease development in CIU patients in Saudi Arabia and if patch testing should be routinely performed for CIU patients to determine if any allergens can be avoided.
Methods
This prospective study was conducted at the King Khalid University Hospital Allergy Clinic (Riyadh, Saudi Arabia) in patients aged 18 to 60 years who had CU for more than 6 weeks. It was a clinic-based study conducted over a period of 2 years (March 2010 to February 2012). The study protocol was approved by the local ethics committee at King Khalid University Hospital. Valid written consent was obtained from each patient.
Patients were excluded if they had CU caused by physical factors (eg, hot or cold temperature, water, physical contact) or drug reactions that were possible causative factors or if they had taken oral prednisolone or other oral immunosuppressive drugs (eg, azathioprine, cyclosporine) in the last month. However, patients taking antihistamines were not excluded because it was impossible for the patients to discontinue their urticaria treatment. Other exclusion criteria included CU associated with any systemic disease, thyroid disease, diabetes mellitus, autoimmune disorder, or atopic dermatitis. Pregnant and lactating women were not included in this study.
All new adult CU patients (ie, disease duration >6 weeks) were worked up using the routine diagnostic tests that are typically performed for any new CU patient, including complete blood cell count with differential, erythrocyte sedimentation rate, liver function tests, urine analysis, and hepatitis B and C screenings. Further diagnostic tests also were carried out when appropriate according to the patient’s history and physical examination, including levels of urea, electrolytes, thyrotropin, thyroid antibodies (antithyroglobulin and antimicrosomal), and antinuclear antibodies, as well as a Helicobacter pylori test.
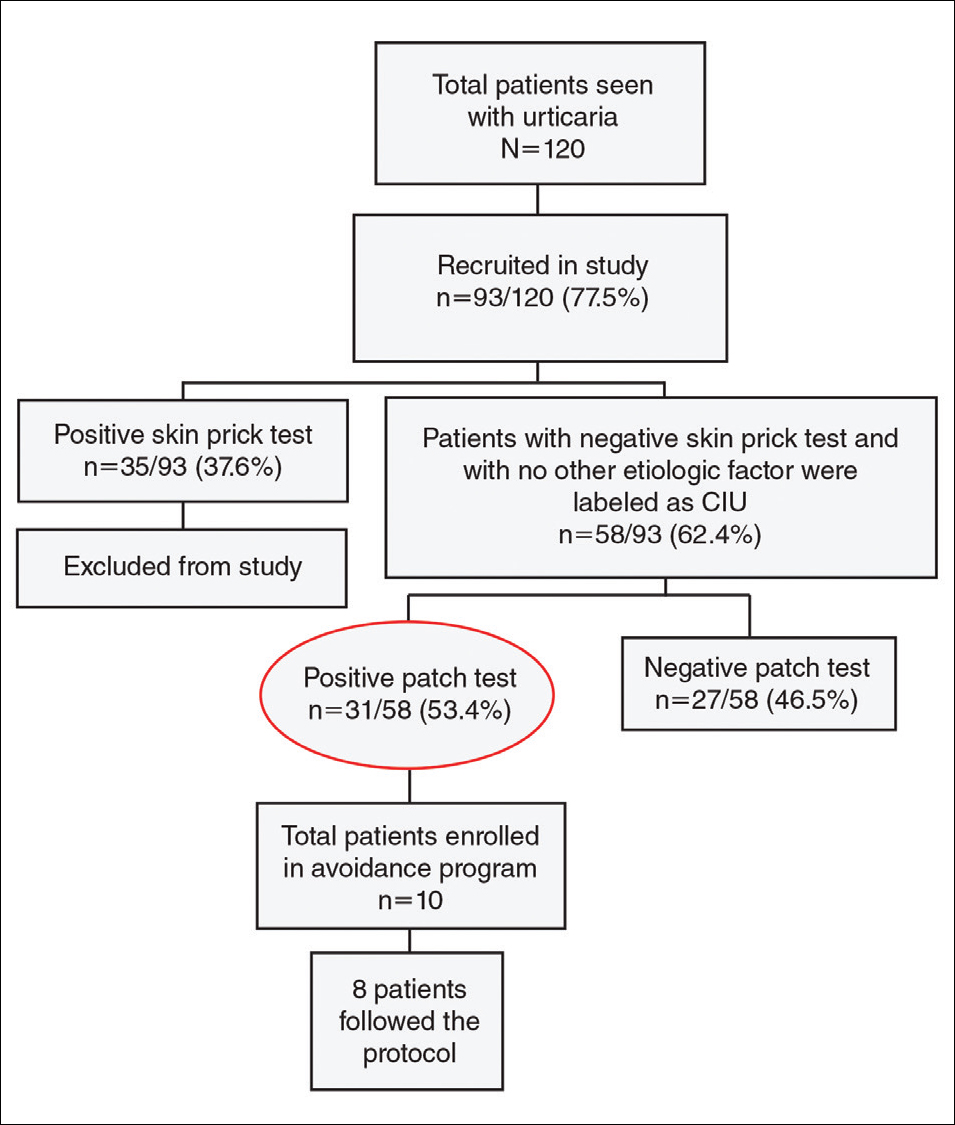
All of the patients enrolled in the study were evaluated by skin prick testing to establish the link between CU and its cause. Patch testing was performed in patients who were negative on skin prick testing.
Skin Prick Testing
All patients were advised to temporarily discontinue the use of antihistamines and corticosteroids 5 to 6 days prior to testing.
Patch Testing
Patch tests were carried out using a ready-to-use epicutaneous patch test system for the diagnosis of allergic contact dermatitis (ACD).10 A European standard series was used with the addition of 4 allergens of local relevance: black seed oil, local perfume mix, henna, and myrrh (a topical herbal medicine used to promote healing).
Assessment of Improvement
Assessment of urticaria severity using the Chronic Urticaria Severity Score (CUSS), a simple semiquantitative assessment of disease activity, was calculated as the sum of the number of wheals and the degree of itch severity graded from 0 (none) to 3 (severe), according to the guidelines established by the Dermatology Section of the European Academy of Allergology and Clinical Immunology, the Global Allergy and Asthma European Network, the European Dermatology Forum, and the World Allergy Organization.11 The avoidance group of patients was assessed at baseline and after 1 month to evaluate changes in their CUSS after allergen avoidance for 8 weeks.
Statistical Analysis
All of the statistical analyses were carried out using SPSS software version 16. Results were presented as the median with the range or the mean (SD).
Results
During the study period, a total of 120 CU patients were seen at the clinic. Ninety-three patients with CU met our selection criteria (77.5%) and were enrolled in the study. The mean age (SD) of the patients was 34.7 (12.4) years. Women comprised 68.8% (64/93) of the study population (Table 1).
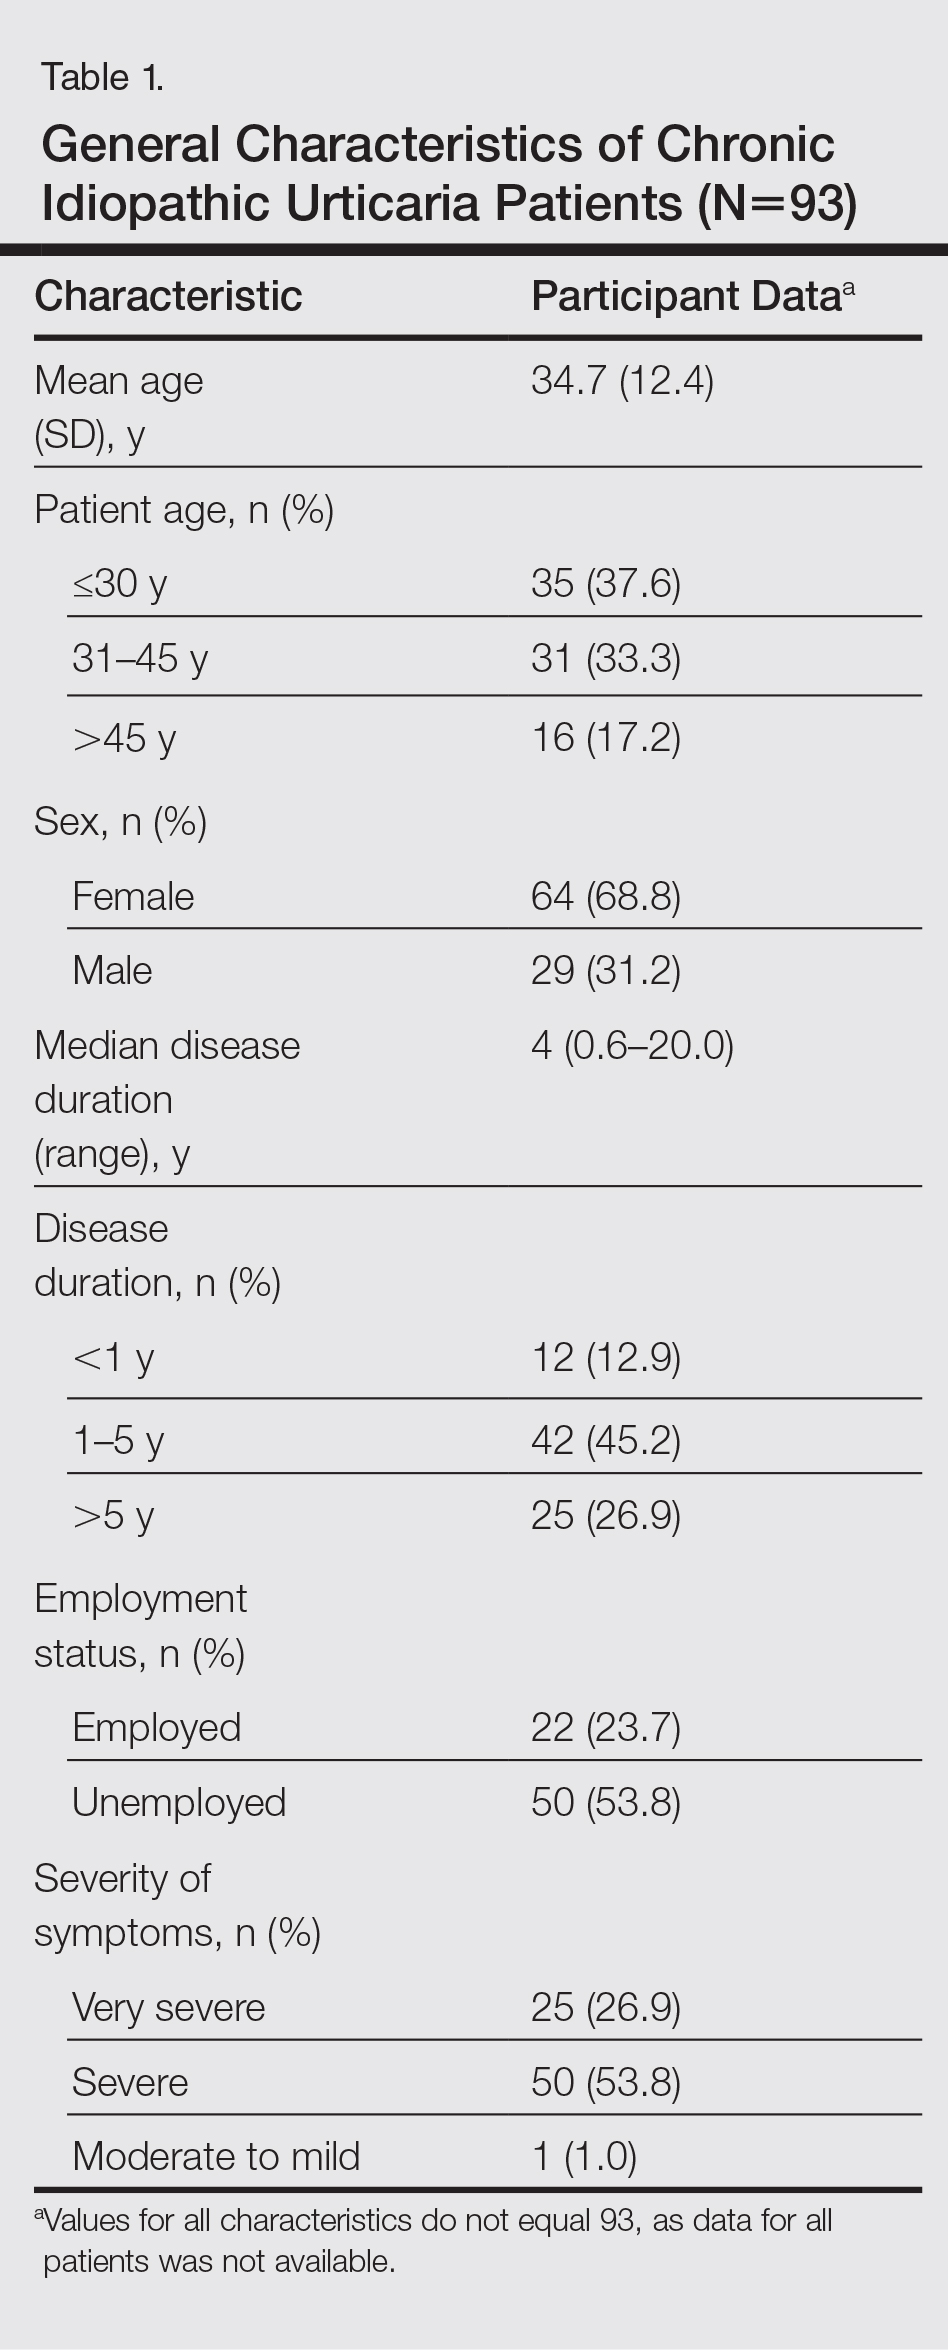
The duration of urticaria ranged from 0.6 to 20 years, with a median duration of 4 years. Approximately half of the patients (50/93) experienced severe symptoms of urticaria, but only 26.9% (25/93) had graded their urticaria as very severe.
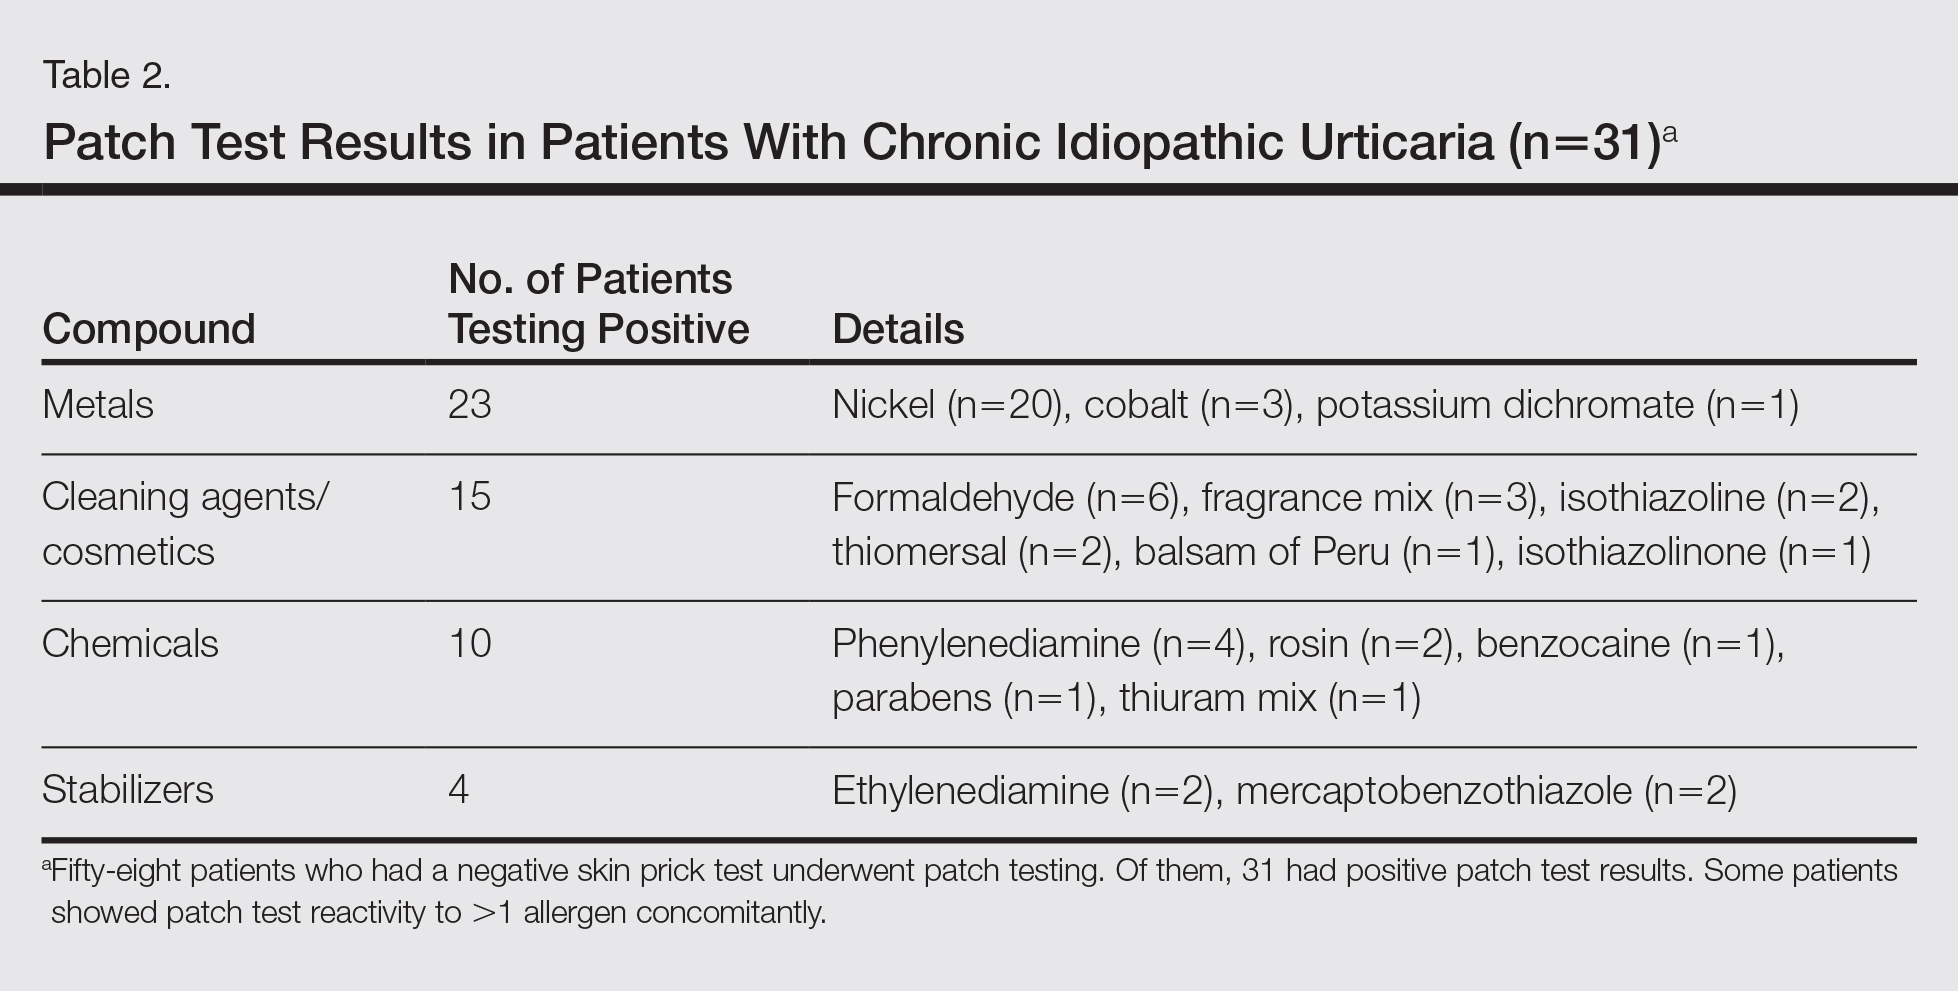
Negative results from the skin prick test were reported in 62.4% (58/93) of patients and were subsequently patch tested. These patients also had no other etiologic factors (eg, infection; thyroid, autoimmune, or metabolic disease). Patients who had positive skin prick test results (35/93 [37.6%]) were not considered to be cases of CIU, according to diagnostic recommendations.12 Of the 58 CIU patients who were patch tested, 31 (53.4%) had positive results and 27 (46.5%) had negative results to both skin prick and patch tests (Figure).
Univariate analysis revealed significant associations between age, gender, and duration of urticaria and patch test positivity (χ2 test, P<.05). T
Of the 31 patients with positive patch tests, there were 20 positive reactions to nickel, 6 to formaldehyde, 4 to phenylenediamine, 3 to cobalt, and 3 to a fragrance mix (Table 2). Some patients showed patch test reactivity to more than 1 allergen concomitantly. Overall, these 31 patients had positive reactions to 16 allergens. None of the patients showed actual signs of contact dermatitis (Table 2).
Of
Comment
Chronic idiopathic urticaria is the diagnosis given when urticarial vasculitis, physical urticaria, and all other possible etiologic factors have been excluded in patients with CU. Our study was designed to assess patch test reactivity in patients with CU without any identifiable systemic etiologic factor after detailed laboratory testing and negative skin prick tests.
Chronic idiopathic urticaria can be an extremely disabling and difficult-to-treat condition. Because the cause is unknown, the management of CIU often is frustrating. The
Patch testing is commonly performed to diagnose ACD, and if contact allergens are found via patch testing, patients can often be cured of their dermatitis by avoiding these agents. However, patch testing is not routinely performed in the evaluation of patients with CIU. It is a relatively inexpensive and safe procedure to determine a causal link between sensitization to a specific agent and ACD. In patch test clinics, agents often are tested in standard and screening series. Sensitization that is not suspected from the patient’s history and/or clinical examination can be detected in this manner. Requirements for the inclusion of a chemical in a standard series have been formulated by Bruze et al.13 In addition, ready-to-use materials relevant to the specific leisure activities and working conditions also can be selected for patch testing.
A study conducted in Saudi Arabia showed that the European standard series is suitable for patch testing patients in this community14; however, 3 allergens of local relevance were added in our study: black seed oil, local perfume mix, and henna. Moreover, in our study we added a local allergen known as myrrh, which is a topical herbal medicine used to promote healing that has been reported to cause ACD in some cases.15 We sought to determine if contact allergens can be identified with patch testing in patients with CU and if avoiding these contact allergens would resolve the CU.
Urticaria was once considered an IgE-mediated hypersensitivity reaction, but recent studies have demonstrated the existence of different subgroupsof urticaria, some with an autoimmune mechanism.1-4,11 In CU, skin prick tests are recommended for etiologic workup, while patch testing generally is not recommended.16
It has been observed in clinical practice that a substantial number of patients with CU are positive to patch tests, even without a clear clinical history or signs of contact dermatitis.17 In 2007, Guerra et al17 reported that of 121 patients with CU, 50 (41.3%) tested positive for contact allergens. In all of the patch test–positive patients, avoidance measures led to complete remission within 10 days to 1 month. Therefore, this result suggested that testing for contact sensitization could be helpful in the management of CU. Patients with nickel sensitivity were subsequently allowed to ingest small amounts of nickel-containing foods after 8 weeks of a completely nickel-free diet, and remission persisted.17
Contact dermatitis affects approximately 20% of the general population18; however, there has been little investigation (limited to nickel) into the relationship between contact allergens and CU,19,20 and the underlying mechanisms of the disease are unknown. It has been hypothesized that small amounts of the substances are absorbed through the skin or the digestive tract into the bloodstream over the long-term and are delivered to antigen-presenting cells in the skin, which provide the necessary signals for mast cell activation. Nonetheless, the reasons for a selectively cutaneous localization of the reaction remain largely unclear.
Management of CU is debated among physicians, and several diagnostic flowcharts have been proposed.1,2 In general, patch tests for contact dermatitis are not recommended as a fundamental part of the diagnostic procedure, but Guerra et al17 suggested that contact allergy often plays a role in CU.
There have been inadequate reports of CU found to be caused by common contact sensitizers.21-24 Interestingly, no signs of contact allergy were demonstrated in CU patients before urticarial attack.
Our findings supported our patient selection criteria and also confirmed that contact sensitization may be one of the many possible mechanisms involved in the etiology of CU. Urticaria may have a delayed-type hypersensitivity reaction element, and patients with CU without an obvious causal factor can have positive patch test results.
The
The main findings of our study were that 53.4% of patients with CIU had positive patch test results and that avoidance of the sensitizing substance was effective in 5 of 8 patients who completed an avoidance program. Almost all of the patients showed notable remission of symptoms after limiting their exposure to the offending allergens. This study clearly showed that a cause or pathogenesis for CIU could be identified, thus showing that CIU occurs less frequently than is usually assumed.
Our study had limitations. The first is our lack of a controlled challenge test, which is important to confirm an allergen as a cause of CIU.26 Nonetheless, avoidance of the revealed contact allergen was associated with comparable improvement of CIU severity after 1 month in 5 of 8 patients, though such measures were not tested in all 31 of 58 CIU patients who had positive patch test results.
Conclusion
We propose that patch tests should be performed while investigating CU because they give effective diagnostic and therapeutic results in a substantial number of patients. Urticaria, or at least a subgroup of the disease, may have a delayed-type reaction element, which may explain the disease etiology for many CIU patients. Patients with CU without a detectable underlying etiologic factor can have positive patch test results.
- Zuberbier T, Bindslev-Jensen C, Canonica W, et al. Guidelines, definition, classification and diagnosis of urticaria. Allergy. 2006;61:316-331.
- Kaplan AP. Chronic urticaria: pathogenesis and treatment. J Allergy Clin Immunol. 2004;114:465-474.
- Champion RH. Urticaria: then and now. Br J Dermatol. 1988;119:427-436.
- Green GA, Koelsche GA, Kierland R. Etiology and pathogenesis of chronic urticaria. Ann Allergy. 1965;23:30-36.
- Kaplan AP. Chronic urticaria and angioedema. N Engl J Med. 2002;346:175-179.
- Dreskin SC, Andrews KY. The thyroid and urticaria. Curr Opin Allergy Clin Immunol. 2005;5:408-412.
- Greaves M. Chronic urticaria. J Allergy Clin Immunol. 2000;105:664-672.
- Sharma AD. Use of patch testing for identifying allergen causing chronic urticaria. Indian J Dermatol Venereol Leprol. 2008;74:114-117.
- Li JT, Andrist D, Bamlet WR, et al. Accuracy of patient prediction of allergy skin test results. Ann Allergy Asthma Immunol. 2000;85:382-384.
- Nelson JL, Mowad CM. Allergic contact dermatitis: patch testing beyond the TRUE test. J Clin Aesthet Dermatol. 2010;3:36-41.
- Zuberbier T, Asero R, Bindslev-Jensen C, et al; Dermatology Section of the European Academy of Allergology and Clinical Immunology; Global Allergy and Asthma European Network; European Dermatology Forum; World Allergy Organization. EAACI/GA(2)LEN/EDF/WAO guideline: definition, classification and diagnosis of urticaria. Allergy. 2009;64:1417-1426.
- Bindslev-Jensen C, Finzi A, Greaves M, et al. Chronic urticaria: diagnostic recommendations. Eur Acad Dermatol Venereol. 2000;14:175-180.
- Bruze M, Conde-Slazar L, Goossens A, et al. Thoughts on sensitizers in a standard patch test series. Contact Dermatitis. 1999;41:241-250.
- Al-Sheikh OA, Gad El-Rab MO. Allergic contact dermatitis: clinical features and profile of sensitizing allergens in Riyadh, Saudi Arabia. Int J Dermatol. 1996;35:493-497.
- Al-Suwaidan SN, Gad El Rab MO, Al-Fakhiry S, et al. Allergic contact dermatitis from myrrh, a topical herbal medicine used to promote healing. Contact Dermatitis. 1998;39:137.
- Henz BM, Zuberbier T. Causes of urticaria. In: Henz B, Zuberbier T, Grabbe J, et al, eds. Urticaria: Clinical Diagnostic and Therapeutic Aspects. Berlin, Germany: Springer; 1998:19.
- Guerra L, Rogkakou A, Massacane P, et al. Role of contact sensitization in chronic urticaria. J Am Acad Dermatol. 2007;56:88-90.
- Thyssen JP, Linneberg A, Menné T, et al. The epidemiology of contact allergy in the general population—prevalence and main findings. Contact Dermatitis. 2007;57:287-299.
- Smart GA, Sherlock JC. Nickel in foods and the diet. Food Addit Contam. 1987;4:61-71.
- Abeck D, Traenckner I, Steinkraus V, et al. Chronic urticaria due to nickel intake. Acta Derm Venereol. 1993;73:438-439.
- Moneret-Vautrin DA. Allergic and pseudo-allergic reactions to foods in chronic urticaria [in French]. Ann Dermatol Venereol. 2003;130(Spec No 1):1S35-1S42.
- Wedi B, Raap U, Kapp A. Chronic urticaria and infections. Curr Opin Allergy Clin Immunol. 2004;4:387-396.
- Foti C, Nettis E, Cassano N, et al. Acute allergic reactions to Anisakis simplex after ingestion of anchovies. Acta Derm Venerol. 2002;82:121-123.
- Uter W, Hegewald J, Aberer W, et al. The European standard series in 9 European countries, 2002/2003: first results of the European Surveillance System on Contact Allergies. Contact Dermatitis. 2005;53:136-145.
- Magen E, Mishal J, Menachem S. Impact of contact sensitization in chronic spontaneous urticaria. Am J Med Sci. 2011;341:202-206.
- Antico A, Soana R. Chronic allergic-like dermatopathies in nickel sensitive patients: results of dietary restrictions and challenge with nickel salts. Allergy Asthma Proc. 1999;20:235-242.
Chronic urticaria (CU) is clinically defined as the daily or almost daily presence of wheals on the skin for at least 6 weeks.1 Chronic urticaria severely affects patients’ quality of life and can cause emotional disability and distress.2 In clinical practice, CU is one of the most common and challenging conditions for general practitioners, dermatologists, and allergists. It can be provoked by a wide variety of different causes or may be the clinical presentation of certain systemic diseases3,4; thus, CU often requires a detailed and time-consuming diagnostic procedure that includes screening for allergies, autoimmune diseases, parasites, malignancies, infections, and metabolic disorders.5,6 In many patients (up to 50% in some case series), the cause or pathogenic mechanism cannot be identified, and the disease is then classified as chronic idiopathic urticaria (CIU).7
It has previously been shown that contact sensitization could have some relation with CIU,8 which was further explored in this study. This study sought to evaluate if contact allergy may play a role in disease development in CIU patients in Saudi Arabia and if patch testing should be routinely performed for CIU patients to determine if any allergens can be avoided.
Methods
This prospective study was conducted at the King Khalid University Hospital Allergy Clinic (Riyadh, Saudi Arabia) in patients aged 18 to 60 years who had CU for more than 6 weeks. It was a clinic-based study conducted over a period of 2 years (March 2010 to February 2012). The study protocol was approved by the local ethics committee at King Khalid University Hospital. Valid written consent was obtained from each patient.
Patients were excluded if they had CU caused by physical factors (eg, hot or cold temperature, water, physical contact) or drug reactions that were possible causative factors or if they had taken oral prednisolone or other oral immunosuppressive drugs (eg, azathioprine, cyclosporine) in the last month. However, patients taking antihistamines were not excluded because it was impossible for the patients to discontinue their urticaria treatment. Other exclusion criteria included CU associated with any systemic disease, thyroid disease, diabetes mellitus, autoimmune disorder, or atopic dermatitis. Pregnant and lactating women were not included in this study.
All new adult CU patients (ie, disease duration >6 weeks) were worked up using the routine diagnostic tests that are typically performed for any new CU patient, including complete blood cell count with differential, erythrocyte sedimentation rate, liver function tests, urine analysis, and hepatitis B and C screenings. Further diagnostic tests also were carried out when appropriate according to the patient’s history and physical examination, including levels of urea, electrolytes, thyrotropin, thyroid antibodies (antithyroglobulin and antimicrosomal), and antinuclear antibodies, as well as a Helicobacter pylori test.
All of the patients enrolled in the study were evaluated by skin prick testing to establish the link between CU and its cause. Patch testing was performed in patients who were negative on skin prick testing.
Skin Prick Testing
All patients were advised to temporarily discontinue the use of antihistamines and corticosteroids 5 to 6 days prior to testing.
Patch Testing
Patch tests were carried out using a ready-to-use epicutaneous patch test system for the diagnosis of allergic contact dermatitis (ACD).10 A European standard series was used with the addition of 4 allergens of local relevance: black seed oil, local perfume mix, henna, and myrrh (a topical herbal medicine used to promote healing).
Assessment of Improvement
Assessment of urticaria severity using the Chronic Urticaria Severity Score (CUSS), a simple semiquantitative assessment of disease activity, was calculated as the sum of the number of wheals and the degree of itch severity graded from 0 (none) to 3 (severe), according to the guidelines established by the Dermatology Section of the European Academy of Allergology and Clinical Immunology, the Global Allergy and Asthma European Network, the European Dermatology Forum, and the World Allergy Organization.11 The avoidance group of patients was assessed at baseline and after 1 month to evaluate changes in their CUSS after allergen avoidance for 8 weeks.
Statistical Analysis
All of the statistical analyses were carried out using SPSS software version 16. Results were presented as the median with the range or the mean (SD).
Results
During the study period, a total of 120 CU patients were seen at the clinic. Ninety-three patients with CU met our selection criteria (77.5%) and were enrolled in the study. The mean age (SD) of the patients was 34.7 (12.4) years. Women comprised 68.8% (64/93) of the study population (Table 1).
The duration of urticaria ranged from 0.6 to 20 years, with a median duration of 4 years. Approximately half of the patients (50/93) experienced severe symptoms of urticaria, but only 26.9% (25/93) had graded their urticaria as very severe.
Negative results from the skin prick test were reported in 62.4% (58/93) of patients and were subsequently patch tested. These patients also had no other etiologic factors (eg, infection; thyroid, autoimmune, or metabolic disease). Patients who had positive skin prick test results (35/93 [37.6%]) were not considered to be cases of CIU, according to diagnostic recommendations.12 Of the 58 CIU patients who were patch tested, 31 (53.4%) had positive results and 27 (46.5%) had negative results to both skin prick and patch tests (Figure).
Univariate analysis revealed significant associations between age, gender, and duration of urticaria and patch test positivity (χ2 test, P<.05). T
Of the 31 patients with positive patch tests, there were 20 positive reactions to nickel, 6 to formaldehyde, 4 to phenylenediamine, 3 to cobalt, and 3 to a fragrance mix (Table 2). Some patients showed patch test reactivity to more than 1 allergen concomitantly. Overall, these 31 patients had positive reactions to 16 allergens. None of the patients showed actual signs of contact dermatitis (Table 2).
Of
Comment
Chronic idiopathic urticaria is the diagnosis given when urticarial vasculitis, physical urticaria, and all other possible etiologic factors have been excluded in patients with CU. Our study was designed to assess patch test reactivity in patients with CU without any identifiable systemic etiologic factor after detailed laboratory testing and negative skin prick tests.
Chronic idiopathic urticaria can be an extremely disabling and difficult-to-treat condition. Because the cause is unknown, the management of CIU often is frustrating. The
Patch testing is commonly performed to diagnose ACD, and if contact allergens are found via patch testing, patients can often be cured of their dermatitis by avoiding these agents. However, patch testing is not routinely performed in the evaluation of patients with CIU. It is a relatively inexpensive and safe procedure to determine a causal link between sensitization to a specific agent and ACD. In patch test clinics, agents often are tested in standard and screening series. Sensitization that is not suspected from the patient’s history and/or clinical examination can be detected in this manner. Requirements for the inclusion of a chemical in a standard series have been formulated by Bruze et al.13 In addition, ready-to-use materials relevant to the specific leisure activities and working conditions also can be selected for patch testing.
A study conducted in Saudi Arabia showed that the European standard series is suitable for patch testing patients in this community14; however, 3 allergens of local relevance were added in our study: black seed oil, local perfume mix, and henna. Moreover, in our study we added a local allergen known as myrrh, which is a topical herbal medicine used to promote healing that has been reported to cause ACD in some cases.15 We sought to determine if contact allergens can be identified with patch testing in patients with CU and if avoiding these contact allergens would resolve the CU.
Urticaria was once considered an IgE-mediated hypersensitivity reaction, but recent studies have demonstrated the existence of different subgroupsof urticaria, some with an autoimmune mechanism.1-4,11 In CU, skin prick tests are recommended for etiologic workup, while patch testing generally is not recommended.16
It has been observed in clinical practice that a substantial number of patients with CU are positive to patch tests, even without a clear clinical history or signs of contact dermatitis.17 In 2007, Guerra et al17 reported that of 121 patients with CU, 50 (41.3%) tested positive for contact allergens. In all of the patch test–positive patients, avoidance measures led to complete remission within 10 days to 1 month. Therefore, this result suggested that testing for contact sensitization could be helpful in the management of CU. Patients with nickel sensitivity were subsequently allowed to ingest small amounts of nickel-containing foods after 8 weeks of a completely nickel-free diet, and remission persisted.17
Contact dermatitis affects approximately 20% of the general population18; however, there has been little investigation (limited to nickel) into the relationship between contact allergens and CU,19,20 and the underlying mechanisms of the disease are unknown. It has been hypothesized that small amounts of the substances are absorbed through the skin or the digestive tract into the bloodstream over the long-term and are delivered to antigen-presenting cells in the skin, which provide the necessary signals for mast cell activation. Nonetheless, the reasons for a selectively cutaneous localization of the reaction remain largely unclear.
Management of CU is debated among physicians, and several diagnostic flowcharts have been proposed.1,2 In general, patch tests for contact dermatitis are not recommended as a fundamental part of the diagnostic procedure, but Guerra et al17 suggested that contact allergy often plays a role in CU.
There have been inadequate reports of CU found to be caused by common contact sensitizers.21-24 Interestingly, no signs of contact allergy were demonstrated in CU patients before urticarial attack.
Our findings supported our patient selection criteria and also confirmed that contact sensitization may be one of the many possible mechanisms involved in the etiology of CU. Urticaria may have a delayed-type hypersensitivity reaction element, and patients with CU without an obvious causal factor can have positive patch test results.
The
The main findings of our study were that 53.4% of patients with CIU had positive patch test results and that avoidance of the sensitizing substance was effective in 5 of 8 patients who completed an avoidance program. Almost all of the patients showed notable remission of symptoms after limiting their exposure to the offending allergens. This study clearly showed that a cause or pathogenesis for CIU could be identified, thus showing that CIU occurs less frequently than is usually assumed.
Our study had limitations. The first is our lack of a controlled challenge test, which is important to confirm an allergen as a cause of CIU.26 Nonetheless, avoidance of the revealed contact allergen was associated with comparable improvement of CIU severity after 1 month in 5 of 8 patients, though such measures were not tested in all 31 of 58 CIU patients who had positive patch test results.
Conclusion
We propose that patch tests should be performed while investigating CU because they give effective diagnostic and therapeutic results in a substantial number of patients. Urticaria, or at least a subgroup of the disease, may have a delayed-type reaction element, which may explain the disease etiology for many CIU patients. Patients with CU without a detectable underlying etiologic factor can have positive patch test results.
- Zuberbier T, Bindslev-Jensen C, Canonica W, et al. Guidelines, definition, classification and diagnosis of urticaria. Allergy. 2006;61:316-331.
- Kaplan AP. Chronic urticaria: pathogenesis and treatment. J Allergy Clin Immunol. 2004;114:465-474.
- Champion RH. Urticaria: then and now. Br J Dermatol. 1988;119:427-436.
- Green GA, Koelsche GA, Kierland R. Etiology and pathogenesis of chronic urticaria. Ann Allergy. 1965;23:30-36.
- Kaplan AP. Chronic urticaria and angioedema. N Engl J Med. 2002;346:175-179.
- Dreskin SC, Andrews KY. The thyroid and urticaria. Curr Opin Allergy Clin Immunol. 2005;5:408-412.
- Greaves M. Chronic urticaria. J Allergy Clin Immunol. 2000;105:664-672.
- Sharma AD. Use of patch testing for identifying allergen causing chronic urticaria. Indian J Dermatol Venereol Leprol. 2008;74:114-117.
- Li JT, Andrist D, Bamlet WR, et al. Accuracy of patient prediction of allergy skin test results. Ann Allergy Asthma Immunol. 2000;85:382-384.
- Nelson JL, Mowad CM. Allergic contact dermatitis: patch testing beyond the TRUE test. J Clin Aesthet Dermatol. 2010;3:36-41.
- Zuberbier T, Asero R, Bindslev-Jensen C, et al; Dermatology Section of the European Academy of Allergology and Clinical Immunology; Global Allergy and Asthma European Network; European Dermatology Forum; World Allergy Organization. EAACI/GA(2)LEN/EDF/WAO guideline: definition, classification and diagnosis of urticaria. Allergy. 2009;64:1417-1426.
- Bindslev-Jensen C, Finzi A, Greaves M, et al. Chronic urticaria: diagnostic recommendations. Eur Acad Dermatol Venereol. 2000;14:175-180.
- Bruze M, Conde-Slazar L, Goossens A, et al. Thoughts on sensitizers in a standard patch test series. Contact Dermatitis. 1999;41:241-250.
- Al-Sheikh OA, Gad El-Rab MO. Allergic contact dermatitis: clinical features and profile of sensitizing allergens in Riyadh, Saudi Arabia. Int J Dermatol. 1996;35:493-497.
- Al-Suwaidan SN, Gad El Rab MO, Al-Fakhiry S, et al. Allergic contact dermatitis from myrrh, a topical herbal medicine used to promote healing. Contact Dermatitis. 1998;39:137.
- Henz BM, Zuberbier T. Causes of urticaria. In: Henz B, Zuberbier T, Grabbe J, et al, eds. Urticaria: Clinical Diagnostic and Therapeutic Aspects. Berlin, Germany: Springer; 1998:19.
- Guerra L, Rogkakou A, Massacane P, et al. Role of contact sensitization in chronic urticaria. J Am Acad Dermatol. 2007;56:88-90.
- Thyssen JP, Linneberg A, Menné T, et al. The epidemiology of contact allergy in the general population—prevalence and main findings. Contact Dermatitis. 2007;57:287-299.
- Smart GA, Sherlock JC. Nickel in foods and the diet. Food Addit Contam. 1987;4:61-71.
- Abeck D, Traenckner I, Steinkraus V, et al. Chronic urticaria due to nickel intake. Acta Derm Venereol. 1993;73:438-439.
- Moneret-Vautrin DA. Allergic and pseudo-allergic reactions to foods in chronic urticaria [in French]. Ann Dermatol Venereol. 2003;130(Spec No 1):1S35-1S42.
- Wedi B, Raap U, Kapp A. Chronic urticaria and infections. Curr Opin Allergy Clin Immunol. 2004;4:387-396.
- Foti C, Nettis E, Cassano N, et al. Acute allergic reactions to Anisakis simplex after ingestion of anchovies. Acta Derm Venerol. 2002;82:121-123.
- Uter W, Hegewald J, Aberer W, et al. The European standard series in 9 European countries, 2002/2003: first results of the European Surveillance System on Contact Allergies. Contact Dermatitis. 2005;53:136-145.
- Magen E, Mishal J, Menachem S. Impact of contact sensitization in chronic spontaneous urticaria. Am J Med Sci. 2011;341:202-206.
- Antico A, Soana R. Chronic allergic-like dermatopathies in nickel sensitive patients: results of dietary restrictions and challenge with nickel salts. Allergy Asthma Proc. 1999;20:235-242.
Practice Points
- Patients with chronic urticaria (CU) without a detectable underlying etiologic factor can have positive patch test results.
- Avoidance of the sensitizing substance can be effective in CU patients and remission of symptoms can be possible after limiting their exposure to the offending allergens.
Multimodality Approach to a Stener Lesion: Radiographic, Ultrasound, Magnetic Resonance Imaging, and Surgical Correlation
Take-Home Points
- Torn, displaced, and entrapped UCL is a Stener lesion.
- Hyperabduction injury with pain and joint laxity on examination.
- MRI and ultrasound are useful in evaluating UCL tears.
- Ultrasound offers dynamic evaluation.
- Must be treated appropriately to avoid pain, instability, and osteoarthritis.
In the literature, hyperabduction injuries to the thumb metacarpophalangeal (MCP) joint have been referred to interchangeably as gamekeeper’s thumb and skier’s thumb. Historically, though, gamekeeper’s thumb was initially described in hunters with chronic injury to the ulnar collateral ligament (UCL),1 and skier’s thumb typically has been described as an acute hyperabduction injury of the UCL.2-5 The proximal portion of a torn UCL may retract with further abduction and displace dorsally, becoming entrapped by the adductor pollicis aponeurosis insertion, known as a Stener lesion.6
The first MCP joint is stabilized by static and dynamic structures that contribute in varying degrees in flexion and extension of the joint. The static stabilizers include the proper and accessory radial and UCLs, the palmar plate, and the dorsal capsule. The UCL originates at the dorsal ulnar aspect of the first metacarpal head at the metacarpal tubercle about 5 mm proximal to the articular surface. The UCL courses distally in the palmar direction to insert volar and proximal to the medial tubercle of the proximal phalanx about 3 mm distal to the articular surface.7 In flexion, the proper collateral ligament is taut and is the primary static stabilizer. In extension, the accessory collateral ligament, which inserts on the palmar plate, is taut and is the primary static stabilizer.8-11
The dynamic stabilizers include the extrinsic muscles (flexor pollicis longus, extensor pollicis longus and brevis) and the intrinsic muscles (abductor pollicis brevis, adductor pollicis, flexor pollicis brevis) inserting on the thumb at the distal phalanx and proximal phalanx and at the base of the first metacarpal.8-10 

We report the case of an acute hyperabduction injury of the thumb MCP joint with radiographic, ultrasound, and magnetic resonance imaging (MRI) findings consistent with a Stener lesion and subsequently confirmed with intraoperative photographs. The patient provided written informed consent for print and electronic publication of this case report.
Clinical Findings
A 33-year-old healthy man had persistent left hand pain and grip weakness after performing a handstand. He presented to the orthopedic hand clinic 20 days after injury, having failed nonoperative management (use of nonsteroidal anti-inflammatory drugs and soft thumb spica splint). Physical examination revealed soft-tissue swelling and focal tenderness to palpation at the ulnar aspect of the thumb MCP joint. Despite bilateral first MCP joint laxity on varus and valgus stress without identification of a firm endpoint, pain was elicited only on valgus stress of the left first MCP joint. Given the laxity and the left thumb soft-tissue swelling with pain, plain radiographs, ultrasound, and MRI were used to evaluate for severity of presumed left thumb UCL injury.
Imaging Findings
Plain radiographs showed normal bony anatomy without fracture, normal joint space, and mild soft-tissue swelling at the left thumb MCP level (Figures 3A, 3B). 

Surgical Findings
Given laxity with pain at the UCL on stress testing, MRI and ultrasound findings, and continued pain and instability of the thumb with pinching and grasping during activities of daily living, the patient and orthopedic hand surgeon proceeded with surgical intervention. Preoperative examination under anesthesia confirmed significant laxity on valgus stress without a palpable endpoint (Figures 5A, 5B).
Discussion
Hyperabduction injuries to the thumb may rupture the UCL of the MCP joint of the thumb or cause a bony avulsion of the base of the proximal phalanx. Injury to the UCL, most often at its distal portion,4,14,15 may result in a sprain or full-thickness tear of the ligament. 
It is vital for the radiologist to identify a Stener lesion because a nondisplaced tear of the UCL is often treated nonsurgically, but UCL tears displaced more than 3 mm and Stener lesions usually must be operated on to avoid chronic instability, pain, and osteoarthritis.2-5,8,12-23 Sensitivity and specificity of MRI in evaluating UCL injuries are reported to be almost 100%, with resolution of 1 mm using current surface coils.23 There are various UCL injury patterns, including partial tears, displaced and nondisplaced complete tears, and even complex injuries, such as an incomplete tear with the torn portion retracted as a Stener lesion.22 MRI is needed to establish the extent of injury, as 90% of complete tears that are displaced at least 3 mm, and all tears with retraction proximal and superficial to the aponeurosis (true Stener lesions), failed immobilization and required surgical treatment.23Although they vary in the literature, mean sensitivity and specificity of ultrasound in detecting UCL tears in level I studies have been reported as 76% and 81%, respectively.24 When Melville and colleagues21 applied their ultrasound criteria—including absence of normal UCL fibers traversing the first MCP joint as well as heterogeneous masslike tissue at least partially proximal to the apex of the metacarpal lateral tubercle—they were able to distinguish displaced full-thickness tears from nondisplaced full-thickness tears with 100% accuracy. Hergan and colleagues25 found that the diagnostic accuracy of MRI was superior to that of ultrasound; while MRI accuracy was perfect, 12% of patients were incorrectly diagnosed with ultrasound, with false-positive or false-negative tendon-edge displacement. In our experience, ultrasound is uniquely useful in its ability to characterize the real-time dynamic interaction of the UCL with the adductor aponeurosis. It has been observed that passive flexion of the first interphalangeal joint moves the adductor aponeurosis in isolation, allowing differentiation from the subjacent UCL.21 Had a partial tear been in the differential diagnosis of our patient’s Stener lesion, such a maneuver under ultrasound visualization would have solved the dilemma. In addition, ultrasound allows for comparison with the contralateral ligament at the time of examination should a diagnostic dilemma arise.
As many have reported both bony avulsion of the base of the proximal phalanx and concomitant injury to the UCL, identification of a bony avulsion does not exclude a ligamentous injury and the possibility of a Stener lesion (Figure 7).16,19
Conclusion
A Stener lesion—retraction of a completely torn UCL becoming entrapped dorsally and proximally to the adductor insertion—can cause pain, instability, and ultimately osteoarthritis if not treated appropriately. The orthopedic surgeon should have a high index of suspicion for a Stener lesion in the appropriate clinical scenario and consider all imaging modalities for diagnosis. Likewise, it is of utmost importance for the radiologist to identify imaging findings of a Stener lesion, as physical examination alone may be limited in its ability to characterize injury severity. Both MRI and ultrasound are useful in evaluating UCL tears, and ultrasound provides the additional benefit of dynamic visualization and comparison with the contralateral side.
Am J Orthop. 2017;46(3):E195-E199. Copyright Frontline Medical Communications Inc. 2017. All rights reserved.
1. Campbell CS. Gamekeeper’s thumb. J Bone Joint Surg Br. 1955;37(1):148-149.
2. Anderson D. Skier’s thumb. Aust Family Physician. 2010;39(8):575-577.
3. Heim D. The skier’s thumb. Acta Orthop Belg. 1999;65(4):440-446.
4. Lohman M, Vasenius J, Kivisaari A, Kivisaari L. MR imaging in chronic rupture of the ulnar collateral ligament of the thumb. Acta Radiol. 2001;42(1):10-14.
5. Kundu N, Asfaw S, Polster J, Lohman R. The Stener lesion. Eplasty. 2012;12:ic11.
6. Stener B. Displacement of the ruptured ulnar collateral ligament of the metacarpophalangeal joint of the thumb. J Bone Joint Surg Br. 1962;44:869-879.
7. Carlson MG, Warner KK, Meyers KN, Hearns KA, Kok PL. Anatomy of the thumb metacarpophalangeal ulnar and radial collateral ligaments. J Hand Surg Am. 2012;37(10):2021-2026.
8. Heyman P. Injuries to the ulnar collateral ligament of the thumb metacarpophalangeal joint. J Am Acad Orthop Surg. 1997;5(4):224-229.
9. Minami A, An KN, Cooney WP 3rd, Linscheid RL, Chao EY. Ligamentous structures of the metacarpophalangeal joint: a quantitative anatomic study. J Orthop Res. 1984;1(4):361-368.
10. Heyman P, Gelberman RH, Duncan K, Hipp JA. Injuries of the ulnar collateral ligament of the thumb metacarpophalangeal joint. Biomechanical and prospective clinical studies on the usefulness of valgus stress testing. Clin Orthop Relat Res. 1993;(292):165-171.
11. Patel S, Potty A, Taylor EJ, Sorene ED. Collateral ligament injuries of the metacarpophalangeal joint of the thumb: a treatment algorithm. Strategies Trauma Limb Reconstr. 2010;5(1):1-10.
12. O’Callaghan BI, Kohut G, Hoogewoud HM. Gamekeeper thumb: identification of the Stener lesion with US. Radiology. 1994;192(2):477-480.
13. Ebrahim FS, De Maeseneer M, Jager T, Marcelis S, Jamadar DA, Jacobson JA. US diagnosis of UCL tears of the thumb and Stener lesions: technique, pattern-based approach, and differential diagnosis. Radiographics. 2006;26(4):1007-1020.
14. Haramati N, Hiller N, Dowdle J, et al. MRI of the Stener lesion. Skeletal Radiol. 1995;24(7):515-518.
15. Shinohara T, Horii E, Majima M, et al. Sonographic diagnosis of acute injuries of the ulnar collateral ligament of the metacarpophalangeal joint of the thumb. J Clin Ultrasound. 2007;35(2):73-77.
16. Giele H, Martin J. The two-level ulnar collateral ligament injury of the metacarpophalangeal joint of the thumb. J Hand Surg Br. 2003;28(1):92-93.
17. Kaplan SJ. The Stener lesion revisited: a case report. J Hand Surg Am. 1998;23(5):833-836.
18. Thirkannad S, Wolff TW. The “two fleck sign” for an occult Stener lesion. J Hand Surg Eur Vol. 2008;33(2):208-211.
19. Badawi RA, Hussain S, Compson JP. Two in one: a variant of the Stener lesion. Injury. 2002;33(4):379-380.
20. McKeon KE, Gelberman RH, Calfee RP. Ulnar collateral ligament injuries of the thumb: phalangeal translation during valgus stress in human cadavera. J Bone Joint Surg Am. 2013;95(10):881-887.
21. Melville D, Jacobson JA, Haase S, Brandon C, Brigido MK, Fessell D. Ultrasound of displaced ulnar collateral ligament tears of the thumb: the Stener lesion revisited. Skeletal Radiol. 2013;42(5):667-673.
22. Romano WM, Garvin G, Bhayana D, Chaudhary O. The spectrum of ulnar collateral ligament injuries as viewed on magnetic resonance imaging of the metacarpophalangeal joint of the thumb. Can Assoc Radiol J. 2003;54(4):243-248.
23. Milner CS, Manon-Matos Y, Thirkannad SM. Gamekeeper’s thumb—a treatment-oriented magnetic resonance imaging classification. J Hand Surg Am. 2015;40(1):90-95.
24. Papandrea RF, Fowler T. Injury at the thumb UCL: is there a Stener lesion? J Hand Surg Am. 2008;33(10):1882-1884.
25. Hergan K, Mittler C, Oser W. Ulnar collateral ligament: differentiation of displaced and nondisplaced tears with US and MR imaging. Radiology. 1995;194(1):65-71.
Take-Home Points
- Torn, displaced, and entrapped UCL is a Stener lesion.
- Hyperabduction injury with pain and joint laxity on examination.
- MRI and ultrasound are useful in evaluating UCL tears.
- Ultrasound offers dynamic evaluation.
- Must be treated appropriately to avoid pain, instability, and osteoarthritis.
In the literature, hyperabduction injuries to the thumb metacarpophalangeal (MCP) joint have been referred to interchangeably as gamekeeper’s thumb and skier’s thumb. Historically, though, gamekeeper’s thumb was initially described in hunters with chronic injury to the ulnar collateral ligament (UCL),1 and skier’s thumb typically has been described as an acute hyperabduction injury of the UCL.2-5 The proximal portion of a torn UCL may retract with further abduction and displace dorsally, becoming entrapped by the adductor pollicis aponeurosis insertion, known as a Stener lesion.6
The first MCP joint is stabilized by static and dynamic structures that contribute in varying degrees in flexion and extension of the joint. The static stabilizers include the proper and accessory radial and UCLs, the palmar plate, and the dorsal capsule. The UCL originates at the dorsal ulnar aspect of the first metacarpal head at the metacarpal tubercle about 5 mm proximal to the articular surface. The UCL courses distally in the palmar direction to insert volar and proximal to the medial tubercle of the proximal phalanx about 3 mm distal to the articular surface.7 In flexion, the proper collateral ligament is taut and is the primary static stabilizer. In extension, the accessory collateral ligament, which inserts on the palmar plate, is taut and is the primary static stabilizer.8-11
The dynamic stabilizers include the extrinsic muscles (flexor pollicis longus, extensor pollicis longus and brevis) and the intrinsic muscles (abductor pollicis brevis, adductor pollicis, flexor pollicis brevis) inserting on the thumb at the distal phalanx and proximal phalanx and at the base of the first metacarpal.8-10
We report the case of an acute hyperabduction injury of the thumb MCP joint with radiographic, ultrasound, and magnetic resonance imaging (MRI) findings consistent with a Stener lesion and subsequently confirmed with intraoperative photographs. The patient provided written informed consent for print and electronic publication of this case report.
Clinical Findings
A 33-year-old healthy man had persistent left hand pain and grip weakness after performing a handstand. He presented to the orthopedic hand clinic 20 days after injury, having failed nonoperative management (use of nonsteroidal anti-inflammatory drugs and soft thumb spica splint). Physical examination revealed soft-tissue swelling and focal tenderness to palpation at the ulnar aspect of the thumb MCP joint. Despite bilateral first MCP joint laxity on varus and valgus stress without identification of a firm endpoint, pain was elicited only on valgus stress of the left first MCP joint. Given the laxity and the left thumb soft-tissue swelling with pain, plain radiographs, ultrasound, and MRI were used to evaluate for severity of presumed left thumb UCL injury.
Imaging Findings
Plain radiographs showed normal bony anatomy without fracture, normal joint space, and mild soft-tissue swelling at the left thumb MCP level (Figures 3A, 3B).
Surgical Findings
Given laxity with pain at the UCL on stress testing, MRI and ultrasound findings, and continued pain and instability of the thumb with pinching and grasping during activities of daily living, the patient and orthopedic hand surgeon proceeded with surgical intervention. Preoperative examination under anesthesia confirmed significant laxity on valgus stress without a palpable endpoint (Figures 5A, 5B).
Discussion
Hyperabduction injuries to the thumb may rupture the UCL of the MCP joint of the thumb or cause a bony avulsion of the base of the proximal phalanx. Injury to the UCL, most often at its distal portion,4,14,15 may result in a sprain or full-thickness tear of the ligament.
It is vital for the radiologist to identify a Stener lesion because a nondisplaced tear of the UCL is often treated nonsurgically, but UCL tears displaced more than 3 mm and Stener lesions usually must be operated on to avoid chronic instability, pain, and osteoarthritis.2-5,8,12-23 Sensitivity and specificity of MRI in evaluating UCL injuries are reported to be almost 100%, with resolution of 1 mm using current surface coils.23 There are various UCL injury patterns, including partial tears, displaced and nondisplaced complete tears, and even complex injuries, such as an incomplete tear with the torn portion retracted as a Stener lesion.22 MRI is needed to establish the extent of injury, as 90% of complete tears that are displaced at least 3 mm, and all tears with retraction proximal and superficial to the aponeurosis (true Stener lesions), failed immobilization and required surgical treatment.23Although they vary in the literature, mean sensitivity and specificity of ultrasound in detecting UCL tears in level I studies have been reported as 76% and 81%, respectively.24 When Melville and colleagues21 applied their ultrasound criteria—including absence of normal UCL fibers traversing the first MCP joint as well as heterogeneous masslike tissue at least partially proximal to the apex of the metacarpal lateral tubercle—they were able to distinguish displaced full-thickness tears from nondisplaced full-thickness tears with 100% accuracy. Hergan and colleagues25 found that the diagnostic accuracy of MRI was superior to that of ultrasound; while MRI accuracy was perfect, 12% of patients were incorrectly diagnosed with ultrasound, with false-positive or false-negative tendon-edge displacement. In our experience, ultrasound is uniquely useful in its ability to characterize the real-time dynamic interaction of the UCL with the adductor aponeurosis. It has been observed that passive flexion of the first interphalangeal joint moves the adductor aponeurosis in isolation, allowing differentiation from the subjacent UCL.21 Had a partial tear been in the differential diagnosis of our patient’s Stener lesion, such a maneuver under ultrasound visualization would have solved the dilemma. In addition, ultrasound allows for comparison with the contralateral ligament at the time of examination should a diagnostic dilemma arise.
As many have reported both bony avulsion of the base of the proximal phalanx and concomitant injury to the UCL, identification of a bony avulsion does not exclude a ligamentous injury and the possibility of a Stener lesion (Figure 7).16,19
Conclusion
A Stener lesion—retraction of a completely torn UCL becoming entrapped dorsally and proximally to the adductor insertion—can cause pain, instability, and ultimately osteoarthritis if not treated appropriately. The orthopedic surgeon should have a high index of suspicion for a Stener lesion in the appropriate clinical scenario and consider all imaging modalities for diagnosis. Likewise, it is of utmost importance for the radiologist to identify imaging findings of a Stener lesion, as physical examination alone may be limited in its ability to characterize injury severity. Both MRI and ultrasound are useful in evaluating UCL tears, and ultrasound provides the additional benefit of dynamic visualization and comparison with the contralateral side.
Am J Orthop. 2017;46(3):E195-E199. Copyright Frontline Medical Communications Inc. 2017. All rights reserved.
1. Campbell CS. Gamekeeper’s thumb. J Bone Joint Surg Br. 1955;37(1):148-149.
2. Anderson D. Skier’s thumb. Aust Family Physician. 2010;39(8):575-577.
3. Heim D. The skier’s thumb. Acta Orthop Belg. 1999;65(4):440-446.
4. Lohman M, Vasenius J, Kivisaari A, Kivisaari L. MR imaging in chronic rupture of the ulnar collateral ligament of the thumb. Acta Radiol. 2001;42(1):10-14.
5. Kundu N, Asfaw S, Polster J, Lohman R. The Stener lesion. Eplasty. 2012;12:ic11.
6. Stener B. Displacement of the ruptured ulnar collateral ligament of the metacarpophalangeal joint of the thumb. J Bone Joint Surg Br. 1962;44:869-879.
7. Carlson MG, Warner KK, Meyers KN, Hearns KA, Kok PL. Anatomy of the thumb metacarpophalangeal ulnar and radial collateral ligaments. J Hand Surg Am. 2012;37(10):2021-2026.
8. Heyman P. Injuries to the ulnar collateral ligament of the thumb metacarpophalangeal joint. J Am Acad Orthop Surg. 1997;5(4):224-229.
9. Minami A, An KN, Cooney WP 3rd, Linscheid RL, Chao EY. Ligamentous structures of the metacarpophalangeal joint: a quantitative anatomic study. J Orthop Res. 1984;1(4):361-368.
10. Heyman P, Gelberman RH, Duncan K, Hipp JA. Injuries of the ulnar collateral ligament of the thumb metacarpophalangeal joint. Biomechanical and prospective clinical studies on the usefulness of valgus stress testing. Clin Orthop Relat Res. 1993;(292):165-171.
11. Patel S, Potty A, Taylor EJ, Sorene ED. Collateral ligament injuries of the metacarpophalangeal joint of the thumb: a treatment algorithm. Strategies Trauma Limb Reconstr. 2010;5(1):1-10.
12. O’Callaghan BI, Kohut G, Hoogewoud HM. Gamekeeper thumb: identification of the Stener lesion with US. Radiology. 1994;192(2):477-480.
13. Ebrahim FS, De Maeseneer M, Jager T, Marcelis S, Jamadar DA, Jacobson JA. US diagnosis of UCL tears of the thumb and Stener lesions: technique, pattern-based approach, and differential diagnosis. Radiographics. 2006;26(4):1007-1020.
14. Haramati N, Hiller N, Dowdle J, et al. MRI of the Stener lesion. Skeletal Radiol. 1995;24(7):515-518.
15. Shinohara T, Horii E, Majima M, et al. Sonographic diagnosis of acute injuries of the ulnar collateral ligament of the metacarpophalangeal joint of the thumb. J Clin Ultrasound. 2007;35(2):73-77.
16. Giele H, Martin J. The two-level ulnar collateral ligament injury of the metacarpophalangeal joint of the thumb. J Hand Surg Br. 2003;28(1):92-93.
17. Kaplan SJ. The Stener lesion revisited: a case report. J Hand Surg Am. 1998;23(5):833-836.
18. Thirkannad S, Wolff TW. The “two fleck sign” for an occult Stener lesion. J Hand Surg Eur Vol. 2008;33(2):208-211.
19. Badawi RA, Hussain S, Compson JP. Two in one: a variant of the Stener lesion. Injury. 2002;33(4):379-380.
20. McKeon KE, Gelberman RH, Calfee RP. Ulnar collateral ligament injuries of the thumb: phalangeal translation during valgus stress in human cadavera. J Bone Joint Surg Am. 2013;95(10):881-887.
21. Melville D, Jacobson JA, Haase S, Brandon C, Brigido MK, Fessell D. Ultrasound of displaced ulnar collateral ligament tears of the thumb: the Stener lesion revisited. Skeletal Radiol. 2013;42(5):667-673.
22. Romano WM, Garvin G, Bhayana D, Chaudhary O. The spectrum of ulnar collateral ligament injuries as viewed on magnetic resonance imaging of the metacarpophalangeal joint of the thumb. Can Assoc Radiol J. 2003;54(4):243-248.
23. Milner CS, Manon-Matos Y, Thirkannad SM. Gamekeeper’s thumb—a treatment-oriented magnetic resonance imaging classification. J Hand Surg Am. 2015;40(1):90-95.
24. Papandrea RF, Fowler T. Injury at the thumb UCL: is there a Stener lesion? J Hand Surg Am. 2008;33(10):1882-1884.
25. Hergan K, Mittler C, Oser W. Ulnar collateral ligament: differentiation of displaced and nondisplaced tears with US and MR imaging. Radiology. 1995;194(1):65-71.
Views of Primary Care Physicians Regarding the Promotion of Healthy Lifestyles and Weight Management Among Their Patients
From the University of Florida (Dr. Tucker, Ms. Ukonu, Ms. Kang, Ms. Good), Gainesville, FL; the University of Florida–Jacksonville (Dr. Shah, Dr. Bilello), Jacksonville, FL; and Ball State University (Dr. Arthur), Muncie, IN.
Abstracts
- Objective: To assess primary care physicians’ practices, knowledge, and beliefs regarding their efforts to promote healthy lifestyles and weight management among their patients.
- Methods: Study participants consisted of 25 primary care physicians from a regional primary care practice-based research network that includes 37 university-affiliated patient-centered medical homes and 2 nearby unaffiliated primary care sites. Participating physicians completed an online modified version of the Physician Survey of Practices on Diet, Physical Activity, and Weight Control–Adult Questionnaire.
- Results: The majority (88%) of participating physicians strongly believed it was their responsibility to promote a healthy diet, physical activity, and healthy weight loss and weight maintenance among patients. The 3 most commonly endorsed barriers were (a) not enough time, (b) minimal patient interest in improving his/her weight, and (c) lack of adequate weight-loss referral resources. The top 3 physician-perceived practice improvements that would be helpful with these practices were (a) better tools to communicate diet, physical activity, or weight problems to patients or family; (b) better mechanisms to connect patients to weight-loss referral resources; and (c) better counseling tools to guide patients regarding lifestyle modifications. 76% of the participating physicians correctly identified the BMI cutoff ranges for adult obesity, but only 32% did so for childhood obesity.
- Conclusion: It is important to provide primary care physicians with knowledge, effective tools, and resources to promote healthy lifestyles and weight loss and weight management among their patients.
Key words: obesity; primary care physicians; weight loss; weight management.
More than two-thirds of adults in the United States are overweight, with approximately 35% considered obese (defined as a body mass index ≥ 30) [1]. Obesity is associated with many of the leading causes of death in the United States (ie, diabetes, heart disease, stroke, and some types of cancer) and with poor mental health outcomes and reduced quality of life [2]. Racial/ethnic minorities and individuals with low incomes are disproportionately impacted by obesity and obesity-related diseases and negative health outcomes [3–5].
The US Preventive Services Task Force (USPSTF) recommends screening for obesity and intensive behavioral counseling, which are often the responsibilities of primary care providers [6]. Despite these recommendations, research suggests that primary care providers rarely screen their patients for obesity or refer them for intensive behavioral counseling despite evidence that doing so would improve patient health outcomes [5–7]. Lack of time to address weight issues during clinical visits, lack of training in weight management counseling, and lack of availability of intensive weight loss programs to which they can refer their patients are some of the reasons cited for not counseling patients about weight management [8].
Primary care providers deliver more hours of patient care than other providers, yet these providers have been unable to deliver medical interventions capable of producing even modest weight loss [10]. Obesity treatment options delivered in primary care settings have limited success, likely due to the low intensity of these treatment options. Many studies have shown that most obesity treatments in health care settings typically consist of scheduled monthly or quarterly visits that are 10 to 15 minutes in duration [11], despite evidence that more intense treatments are needed. Specifically, a systematic review of the obesity treatment literature performed by the USPSTF revealed that high-intensity, multicomponent behavioral interventions that include face-to-face counseling on diet and physical activity and behavioral therapy more than once a month for 3 months are needed to produce significant weight loss (8–15 lb) among adult patients in primary care settings [12].
Since many of the characteristics of multicomponent behavioral interventions for treating obesity are both patient-centered and involve self-management, the patient-centered medical home (PCMH) seems to be the ideal setting to deliver these interventions [13]. Specifically, PCMHs provide patient-centered care that is wide-ranging, team-based, and coordinated across all elements of the health care system and the patient’s community [14]. These sites specifically provide primary care, which is the type of care that obesity disparity patient groups such as racial/ethnic minorities, sexual minorities, groups with low incomes, and the medically underserved are more likely to utilize [15].
Providing multicomponent behavioral interventions for obesity in PCMHs and other primary care sites will increase the likelihood of participation among the aforementioned obesity disparity groups. Despite the potential benefits of obesity treatment interventions offered in primary care settings, particularly for obesity disparity groups, the role of primary care providers in providing such treatment interventions is not clear [16]. We surveyed primary care physicians who primarily worked in PCMHs to assess their practices, knowledge, views/beliefs, perceived barriers, and perceived needed clinic practice improvements relative to promoting healthy lifestyles and weight management among their patients.
Methods
Participants
Primary care physicians were recruited from among a regional primary care practice-based research network that includes 37 PCMHs affiliated with an academic health center and 2 nearby primary care sites not affiliated with an academic health center. Fifty-two physicians at these centers received an invitation via email to participate in our online survey study. The invitation email included (a) a study endorsement note from the chair of the Community Health and Family Medicine Department affiliated with the PCMHs, (b) instructions about how to participate in the study, and (c) a link to the study. Participation inclusion criteria specified in the online informed consent form were: (a) working as a physician affiliated with the practice-based research network, (b) having access to a computer with internet connection, (c) being able to communicate in written English, and (d) providing written consent to participate in the study. Physicians were not provided compensation for participating in the study.
Survey Instrument
To assess physicians’ views and practices, we used a modified version of the Physician Survey of Practices on Diet, Physical Activity, and Weight Control–Adult Questionnaire [17]. The survey was sponsored by the National Cancer Institute in collaboration with several other NIH institutes and the CDC for evaluating current clinical practices among physicians, including the degree to which physicians evaluate their patients for obesity and offer them guidance designed to increase adherence to a health-promoting lifestyle (eg, recommendations on diet, weight, and physical activity). Additionally, the questionnaire assesses physicians’ perceived barriers to patient assessment, evaluation, and management. It also includes questions about physicians’ healthy lifestyle–related knowledge. In 2010, Smith and colleagues utilized the questionnaire with a nationally representative sample of primary care physicians (n = 1211) to investigate primary care physicians’ clinical practices in relation to overweight and obesity [18]. To our knowledge, no other physician survey has been developed to assess current engagement in recommended clinical practices, barriers to engaging in recommended practices, as well as beliefs and knowledge regarding helping patients follow a health-promoting lifestyle. The original survey also includes questions regarding the physicians’ personal health status and health behaviors.
For our study, we modified the survey by removing questions regarding the physicians’ (a) perceived general health and well-being, (b) current dietary practices, (c) current level of engagement in physical activity, and (d) current engagement in professional activities unrelated to patient care (eg, research, teaching). Our modified survey included 7 questions asking about current practices regarding screening for obesity and referral of patients to weight management interventions. Two questions asked about physicians’ perceived barriers to helping patients adhere to a health-promoting lifestyle and maintain a healthy weight. Physicians were asked to rate their top 3 barriers from among a list of 11 pre-identified barriers and to rate their top 3 desired practice-related improvements from among a list of 10 pre-identified improvements. Physicians were given the option to provide additional barriers or improvements that were not already pre-identified. Seven questions assessed physicians’ views/beliefs related to helping patients achieve and maintain a health-promoting lifestyle and a healthy weight. These questions utilize a rating scale where 1 = strongly agree, 2 = agree somewhat, 3 = neither agree nor disagree, 4 = disagree somewhat, and 5 = strongly disagree. Four questions assessed physicians’ healthy lifestyle–related knowledge (BMI ranges/percentiles for adults/children, diet and exercise guideline recommendations [recommended amounts of moderate physical activity and servings of fruits and vegetables for adults]) and 11 questions ask about the physician (height, weight, demographics, and practice population).
Survey Administration
The survey was administered anonymously through Qualtrics, a secure, online survey platform. The survey was administered online to increase anonymity, increase response rate, and diminish potential physician-perceived barriers to participating in the study. The participating physicians were provided with a link that enabled them to access the survey. The survey excluded questions that required disclosure of identifying information. Survey data from Qualtrics were exported to an SPSS file that was stored on a password protected, secured computer in the research lab of the principal investigator for this study.
Data Analysis
Frequency analyses were applied to survey responses to determine the participating physicians’ endorsed barriers to and views regarding evaluating and managing patients’ weight, healthy eating, and physical activity; physicians’ views related to helping patients achieve and maintain a health-promoting lifestyle and a healthy weight; and physicians’ healthy lifestyle–related knowledge. Nonparametric t tests were conducted to examine differences in survey responses of the participating physicians in association with their sex (male or female), race (Asian vs. white/Caucasian), and BMI (BMI < 25 and BMI ≥ 25).
Approval for the study was obtained through the institutional review board of the University of Florida Health Science Center.
Results
Participants
Twenty-five physicians out of 52 invited completed the survey (48% response rate). The vast majority of the study participants were PCMH-affiliated (92%–96%). Participating physicians ranged in age from 29 to 67 years old. Sixteen (64%) participating physicians identified as female, 7 (28%) participating physicians identified as male, and 2 (8%) participating physicians did not indicate a sex. Twenty (80%) participating physicians identified as being white, 3 (12%) participating physicians identified as being Asian/Asian American, and 2 (8%) did not indicate a race or ethnicity. Twenty-two (88%) participating physicians were employees of a large medical group affiliated with an academic medical center, 1 (4%) was employed in a physician-owned practice, and 2 (8%) did not indicate their main primary care practice location. Table 1 provides additional demographic data.
Approximately 88% of the participating physicians agreed that patients were more likely to adopt healthier lifestyles if their health care providers counseled them to do so (44% strongly agreed, 44% agreed somewhat). A majority of participating physicians endorsed the view that there are effective strategies and/or tools to (a) help patients eat a healthy diet (56% strongly agreed, 24% agreed somewhat), (b) engage in adequate amounts of physical activity (56% strongly agreed, 20% agreed somewhat), and (c) maintain a healthy weight or lose weight (48% strongly agreed, 
Many participating physicians expressed confidence in their ability to counsel their patients to (a) eat a healthy diet (64% strongly agreed, 28% agreed somewhat), (b) engage in adequate amounts of physical activity (68% strongly agreed, 24% agreed somewhat), and (c) maintain a healthy weight or lose weight (60% strongly agreed, 32% agreed somewhat). Most participating physicians at least somewhat agreed that they were effective at helping their patients (a) eat a healthy diet (24% strongly agreed, 52% agreed somewhat), (b) engage in adequate amounts of physical activity (20% strongly agreed, 56% agreed somewhat), and (c) maintain a healthy weight or lose weight (16% strongly agreed, 48% agreed somewhat). Some participating physicians expressed ambivalence about whether or not they were effective at helping their patients (a) eat a healthy diet (16% neither agreed nor disagreed), (b) engage in adequate amounts of physical activity (12% neither agreed nor disagreed), and (c) maintain a healthy weight or lose weight (20% neither agreed nor disagreed). A total of 8% of participating physicians did not endorse the belief that they were effective at helping their patients maintain a healthy weight or lose weight.
Most participating physicians at least somewhat agreed that they were effective in encouraging patients to engage in health-promoting activities (44% strongly agreed, and 44% agreed somewhat), whereas 4% neither agreed nor disagreed that they were effective in providing this encouragement. Interestingly, many participating physicians endorsed the view that they would be able to provide more credible and effective counseling to patients if they (the physicians themselves) ate a healthy diet (68% strongly agreed, 20% agreed somewhat) and engaged in adequate amounts of physical activity (68% strongly agreed, 20% agreed somewhat). A minority of participating physicians (4%) neither agreed or disagreed with this perspective.
In regards to participating physicians’ healthy lifestyle–related knowledge about current BMI ranges for adults or percentile ranges for children, most participating physicians were able to accurately identify the correct BMI cutoff ranges for overweight (80%) and obese (76%) adults. However, only 32% of participating physicians were able to correctly identify BMI percentile ranges for children; however, nearly all of the participating physicians saw mainly adult patients. Lastly, 76% of participating physicians were able to correctly identify the recommended amounts of moderate physical activity for adults 18 years of age and older, and only 56% were able to correctly identify the recommended amount of servings of fruits and vegetables.
There were no significant race-related differences in participating physicians views/beliefs, healthy lifestyle–related knowledge, and perceived barriers to helping patients engage in health promoting behaviors and weight management. There were no significant sex-related differences in these variables with the exception that women were more likely to respond that they did not know the BMI percentile range at which children or adolescents were considered to have a healthy weight (37.5% of women vs. 0% of men, P = 0.03). A similar percentage of men (66.7%) and women (64.7%) who chose among the 4 percentile range options (rather than endorsing “Don’t know”) chose an incorrect answer. Lastly, there were no significant self-reported BMI-related differences in participating physicians’ views/beliefs, healthy lifestyle–related knowledge, and perceived barriers to helping patients engage in health-promoting behaviors and weight management.
Discussion
Given the high percentage of adults in the United States who are overweight or obese and the associated health risks, it is paramount that primary care physicians advise their patients to manage their weight and adopt a health-promoting lifestyle. Research studies indicate that such advice is effective [18,19]. Furthermore, it has been found that most overweight and obese patients want more assistance with weight management than they are receiving from their primary care physicians [21]. This study thus explored primary care physicians’ knowledge, beliefs, and perceived barriers that may prevent them from providing such assistance. The primary care setting is the site where obesity disparity groups (eg, racial/ethnic minorities, groups with low household incomes) are most likely to receive care [22,23].
Most of the PCMH-affiliated physicians in this study agreed that they had the responsibility to promote weight-loss/management and healthy lifestyles among their patients. Consistent with prior research [9], the majority of the physicians in this study felt they were effective in their ability to counsel patients to eat a healthy diet and engage in physical activity. To illustrate, in a prior study [9], 77% of primary care providers thought that they could provide useful dieting tips to patients, and in this study, 80% believed they were effective in helping patients eat a healthy diet. However, despite this confidence in their ability to provide advice about healthy diets and physical activity, the providers in both this and in another prior study [25] were less confident in their ability to actually help patients lose weight. Only 64% of the providers in the present study felt they could be effective in assisting patients with losing weight or maintaining a healthy weight. Although this percentage is higher than the 44% of physicians found in a prior study [25] who felt confident in their ability to treat obesity, both studies clearly point to a need to decrease barriers that physicians face in helping clients lose weight.
A key finding of this study was the consensus among the participating physicians regarding what they perceived to be the common barriers to helping patients adhere to a health-promoting lifestyle. Consistent with past research [8,9], the 3 most common barriers cited by the participating physicians were that they did not have enough time, patients were not interested in improving their weight, and adequate referrals for diet, physical activity, and weight were lacking. Additional barriers endorsed included a lack of effective tools and information to give patients, and a fear of offending patients. Another barrier identified by the participating physicians is the perception that patients had difficulty in changing behaviors necessary for maintaining a healthier lifestyle.
When asked what would facilitate conversations with patients, the top 3 responses given were better tools to communicate diet, physical activity, or weight problems to patients or family members; better mechanisms to connect patients to specific referral sources; and better counseling tools to guide patients towards engagement in healthy lifestyles. Of note is the significant overlap between the perceived barriers and the needed facilitation tools. The clearest example of this overlap is that physicians noted a lack of adequate referral sources to be a barrier and that better mechanisms to connect patients to specific referral sources would facilitate their treatment of patients. Weight management referrals for patients in rural areas and for non-Hispanic black adults and Hispanic adults, among whom obesity is most prevalent in the United States [3,25], are particularly needed. Addressing this need is consistent with national calls to reduce/eliminate obesity and other disparities that plague the U.S. health care system. One promising avenue to facilitate weight management referrals is the development, evaluation, and wide dissemination of remote weight-loss support interventions, particularly in rural, racial/ethnic minority, and low-income communities. Indeed, several recent articles demonstrate the success of such weight management programs across diverse patient populations [27–29].
Many of the physicians who participated in the study (72%) endorsed lack of time as a significant barrier to discussing weight and weight-related behaviors with their patients. Therefore, finding time-efficient strategies to involve physicians in weight management interventions may prove particularly beneficial. One such evidence-based behavioral counseling framework—the 5As framework—has been endorsed by the Centers for Medicare and Medicaid Services and the USPSTF for use with obese patients during a typical 20-minute visit [28].
The second highest-rated barrier, perceived patient lack of motivation, warrants additional discussion. Despite over half of the physicians surveyed citing this as a barrier, previous studies have shown that the majority of overweight patients believe they should lose weight and are interested in losing weight [21]. This study highlights a potential discrepancy between physicians’ perceptions of patients’ interest in weight-loss and their patients’ actual interest. It is possible that this discrepancy can be avoided by training physicians on how to be culturally sensitive when addressing weight with their patients. Moreover, such cultural sensitivity training may be of great use, given that 12% of physicians in this study were apprehensive about discussing weight with their patients due to fear of offending them. Such training typically involves teaching physicians how to talk with patients in ways that enable patients to feel comfortable, trusting, and respectful in patient-physician/provider interactions [29].
Two other findings pertaining to providers deserve mention. Specifically, 88% of physicians believed that effectively encouraging patients to adhere to a healthy lifestyle included personally engaging in health-promoting activities. However, of the physicians surveyed, 64% were overweight/obese. Given the high percentage of physicians in this study that were overweight/obese and these physicians’ belief that their personal engagement in health-promoting activities is important to encourage patient engagement in a healthy lifestyle, it seems that future efforts are needed to facilitate health-promoting behaviors among physicians—efforts that may in turn aid them in encouraging their patients to adhere to a healthy lifestyle.
Finally, this study assessed physicians’ healthy lifestyle–related knowledge about current BMI ranges for adults and BMI percentile ranges for children, and recommended amounts of moderate physical activity and servings of fruits and vegetables for adults. Most physicians were able to correctly identify the adult BMI cutoff ranges for overweight and obesity and to identify the correct answers to questions about physical activity and fruits and vegetable consumption guidelines for adults. However, only 32% of physicians were able to correctly identify BMI percentile ranges for children and/or adolescents. This is understandable given that most of the physicians in this study provide care to adult patients. However, considering that in 2012 more than one-third of children and adolescents were overweight or obese [1], it is important that all physicians have knowledge of BMI percentile ranges for children and adolescents so that minimally they can convey this information to their adult patients who are parents. The USPSTF defines children and adolescent overweight as an age- and gender-specific BMI between the 85th and 94th percentiles, and children and adolescent obesity as an age- and gender-specific BMI ≥ 95th percentile [31]. Such knowledge of BMI cutoffs is needed in order for providers to comply with the USPSTF recommendation to screen all adults and children aged 6 years and older for obesity, and then offer or refer those with an obesity diagnosis to intensive multicomponent behavioral interventions [31–33].
While novel, the study also had several limitations. First, due to self-selection of participants, physicians who felt more confident in their abilities to address overweight or obesity with their patients might have been more likely to respond. Second, participating physicians may have given socially desirable responses to questions (ie, responses that present a favorable image of themselves) rather than true/accurate responses. Future studies could incorporate a social desirability scale in order to detect and control for any socially desirable responding [33]. Another limitation was the small sample size and the limited variability in geographic location of the participating physicians. Thus, the experiences of these physicians may not be generalizable to physicians in other geographic regions. Future similar studies to the present study are needed and such studies should use a larger and randomly selected sample of physicians that is racially/ethnically diverse. Finally, a limitation of this study is the 48% participation rate. Factors that may have contributed to this participation rate include lack of compensation for physicians and the likelihood that physicians may have extremely busy schedules that may discourage them from participating. However, it is important to note that the 48% participation rate of this study is better than the 25.6% participation rate in another similar study [25]. Future similar studies to the present study likely need to include strong incentives for physicians to be study participants.
Conclusion
Our study indicates that many primary care physicians may not talk with their patients about engaging in healthy eating, physical activity, and weight management because of perceived barriers that prevent them from doing so, rather than because of a lack of perceived responsibility to do so or a perception that counseling patients on these issues would be ineffective. This finding highlights the importance of providing physicians with the tools and resources needed to overcome the aforementioned barriers to fostering health-promoting lifestyles and a healthy weight among their patients and the importance of involving physicians in identifying these barriers and ways to overcome them.
Acknowledgement. We thank the patients and health care providers at the participating medical homes affiliated with University of Florida Health in Jacksonville, Florida, for making this research possible.
Corresponding author: Carolyn M. Tucker, PhD, University of Florida, cmtucker@ufl.edu.
Funding/support: Support for this research was provided by the Office of Research at UF–Gainesville, Florida, and by the National Institutes of Health and National Center for Research Resources CTSA grant UL1 TR000064.
Financial disclosures: None.
1. Ogden CL, Carroll MD, Kit BK, Flegal KM. Prevalence of childhood and adult obesity in the United States, 2011–2012. JAMA 2014;311:806–14.
2. Centers for Disease Control and Prevention. Adult obesity causes and consequences, 2016. Accessed 30 Apr 2017 at www.cdc.gov/obesity/adult/causes.html.
3. Centers for Disease Control and Prevention. CDC health disparities and inequalities report —United States, 2013. Accessed 30 Apr 2017 at www.cdc.gov/mmwr/pdf/other/su6203.pdf.
4. Wang Y, Beydoun MA. The obesity epidemic in the United States – gender, age, socioeconomic, racial/ethnic, and geographic characteristics: A systematic review and meta-regression analysis. Epidemiol Rev 2007;29:6–28.
5. Levine, JA. Poverty and obesity in the US. Diabetes 2011;60:2667–8.
6. Moyer VA. Screening for and management of obesity in adults: U.S. Preventive Services Task Force recommendation statement. Ann Intern Med 2012;157:373–8.
7. Aveyard P, Lewis A, Tearne S, et al. Screening and brief intervention for obesity in primary care: a parallel, two-arm, randomised trial. Lancet 2016;388:2492–500.
8. Jay M, Chintapalli S, Squires A, et al. Barriers and facilitators to providing primary care-based weight management services in a patient centered medical home for Veterans: a qualitative study. BMC Fam Pract 2015;16:167.
9. Ruelaz AR, Diefenbach, Simon B, et al. Perceived barriers to weight management. J Gen Intern Med 2007;22:518–22.
10. Carvajal R, Wadden TA, Tsai AG, et al. Managing obesity in primary care practice: A narrative review. Ann N Y Acad Sci 2013;1281:191–206.
11. Wadden TA, Neiberg RH, Wing RR, et al; Look AHEAD Research Group. Four-year weight-losses in the Look AHEAD study: factors associated with long-term success. Obesity (Silver Spring) 2011;19:1987–98.
12. LeBlanc ES, O’Connor, Whitlock EP, et al. Effectiveness of primary care-relevant treatments for obesity in adults: a systematic evidence review for the U.S. Preventive Services Task Force. Ann Intern Med 2011;155:434–47.
13. Rittenhouse DR, Shortell SM. The patient-centered medical home: will it stand the test of health reform? JAMA 2009;301:2038–40.
14. Scholle S, Torda P, Peikes D, et al. Engaging patients and families in the medical home (prepared by Mathematica Policy Research under contract no. HHSA290200900019ITO2.) AHRQ Pub No. 10-0083-EF. Rockville, MD: Agency for Healthcare Research and Quality; June 2010.
15. US Department of Health and Human Services. HHS action plan to reduce racial and ethnic health disparities: A nation free of disparities in health and health care. 2011.
16. Ard J. Obesity in the US: what is the best role for primary care? BMJ 2015;350:1–10.
17. National Cancer Institute. Physcian survey of practices on diet, physical activity, and weight control. 2010. Accessed 30 Apr 2017 at https://healthcaredelivery.cancer.gov/energy_balance/phys_pract_q_adult.pdf.
18. Smith AW, Borowski LA, Liu B, et al. US primary care physicians’ diet-, physical activity–, and weight-related care of adult patients. Am J Prev Med 2011;41:33–42.
19. Simons-Morton DG, Calfas KJ, et al. Effects of interventions in health care settings on physical activity or cardiorespiratory fitness. Am J Prev Med 1998;15:413–30.
20. Bowerman S, Bellman M, Saltsman P, et al. Implementation of a primary care physician network obesity management program. Obes Res 2001;9 Suppl 4:321S–5S.
21. Potter MB, Vu JD, Croughan-Minihane M. Weight management: what patients want from their primary care physician. J Fam Pract 2001;50:513–8.
22. National Association of Community Health Centers. Community health centers: The local prescription for better quality and lower costs. March 2011. Accessed at www.nachc.org.
23. Institute of Medicine. Unequal treatment: confronting racial and ethnic disparities in healthcare. Washington, DC: National Academy of Sciences Press; 2003.
24. Flegal KM, Carroll MD, Kit BK, Ogden CL. Prevalence of obesity and trends in the distribution of body mass index among US adults, 1999–2010. JAMA 2012;307:491–7.
25. Bleich SN, Bennett WL, Gudzune KA, Cooper LA. National survey of US primary care physicians’ perspectives about causes of obesity and solutions to improve care. BMJ Open 2012;2(6).
26. Patterson PD, Moore CG, Probst JC, Shinogle JA. Obesity and physical inactivity in rural America. J Rural Health 2004;20:151–9.
27. Shaikh U, Cole SL, Marcin JP, Nesbitt TS. Clinical management and patient outcomes among children and adolescents receiving telemedicine consultations for obesity. Telemed e-Health 2008;14:434–40.
28. Schlair S, Moore S, Mcmacken M, Jay M. How to deliver high-quality obesity counseling in primary care using the 5As framework. J Clin Outcomes Manag 2012;19:221–9.
29. Tucker CM, Arthur TM, Roncoroni J, et al. Patient-centered culturally sensitive health care. Am J Lifestyle Med 2013;9:63–77.
30. Ma J, Yank V, Xiao L, et al. Translating the diabetes prevention program lifestyle intervention for weight loss into primary care. JAMA Intern Med 2013;173:113–21.
31. U.S. Preventive Services Task Force. Screening for obesity in children and adolescents: U.S. Preventive Services Task Force recommendation statement. Pediatrics 2010;125:361–7.
32. Final recommendation statement: obesity in adults: screening and management. US Preventive Services Task Force. Oct 2014. Accessed at www.uspreventiveservicestaskforce.org.
33. van de Mortel, TF. Faking it: social desirability response bias in self-report research. Aust J Advanced Nurs 2008:25:40–8.
From the University of Florida (Dr. Tucker, Ms. Ukonu, Ms. Kang, Ms. Good), Gainesville, FL; the University of Florida–Jacksonville (Dr. Shah, Dr. Bilello), Jacksonville, FL; and Ball State University (Dr. Arthur), Muncie, IN.
Abstracts
- Objective: To assess primary care physicians’ practices, knowledge, and beliefs regarding their efforts to promote healthy lifestyles and weight management among their patients.
- Methods: Study participants consisted of 25 primary care physicians from a regional primary care practice-based research network that includes 37 university-affiliated patient-centered medical homes and 2 nearby unaffiliated primary care sites. Participating physicians completed an online modified version of the Physician Survey of Practices on Diet, Physical Activity, and Weight Control–Adult Questionnaire.
- Results: The majority (88%) of participating physicians strongly believed it was their responsibility to promote a healthy diet, physical activity, and healthy weight loss and weight maintenance among patients. The 3 most commonly endorsed barriers were (a) not enough time, (b) minimal patient interest in improving his/her weight, and (c) lack of adequate weight-loss referral resources. The top 3 physician-perceived practice improvements that would be helpful with these practices were (a) better tools to communicate diet, physical activity, or weight problems to patients or family; (b) better mechanisms to connect patients to weight-loss referral resources; and (c) better counseling tools to guide patients regarding lifestyle modifications. 76% of the participating physicians correctly identified the BMI cutoff ranges for adult obesity, but only 32% did so for childhood obesity.
- Conclusion: It is important to provide primary care physicians with knowledge, effective tools, and resources to promote healthy lifestyles and weight loss and weight management among their patients.
Key words: obesity; primary care physicians; weight loss; weight management.
More than two-thirds of adults in the United States are overweight, with approximately 35% considered obese (defined as a body mass index ≥ 30) [1]. Obesity is associated with many of the leading causes of death in the United States (ie, diabetes, heart disease, stroke, and some types of cancer) and with poor mental health outcomes and reduced quality of life [2]. Racial/ethnic minorities and individuals with low incomes are disproportionately impacted by obesity and obesity-related diseases and negative health outcomes [3–5].
The US Preventive Services Task Force (USPSTF) recommends screening for obesity and intensive behavioral counseling, which are often the responsibilities of primary care providers [6]. Despite these recommendations, research suggests that primary care providers rarely screen their patients for obesity or refer them for intensive behavioral counseling despite evidence that doing so would improve patient health outcomes [5–7]. Lack of time to address weight issues during clinical visits, lack of training in weight management counseling, and lack of availability of intensive weight loss programs to which they can refer their patients are some of the reasons cited for not counseling patients about weight management [8].
Primary care providers deliver more hours of patient care than other providers, yet these providers have been unable to deliver medical interventions capable of producing even modest weight loss [10]. Obesity treatment options delivered in primary care settings have limited success, likely due to the low intensity of these treatment options. Many studies have shown that most obesity treatments in health care settings typically consist of scheduled monthly or quarterly visits that are 10 to 15 minutes in duration [11], despite evidence that more intense treatments are needed. Specifically, a systematic review of the obesity treatment literature performed by the USPSTF revealed that high-intensity, multicomponent behavioral interventions that include face-to-face counseling on diet and physical activity and behavioral therapy more than once a month for 3 months are needed to produce significant weight loss (8–15 lb) among adult patients in primary care settings [12].
Since many of the characteristics of multicomponent behavioral interventions for treating obesity are both patient-centered and involve self-management, the patient-centered medical home (PCMH) seems to be the ideal setting to deliver these interventions [13]. Specifically, PCMHs provide patient-centered care that is wide-ranging, team-based, and coordinated across all elements of the health care system and the patient’s community [14]. These sites specifically provide primary care, which is the type of care that obesity disparity patient groups such as racial/ethnic minorities, sexual minorities, groups with low incomes, and the medically underserved are more likely to utilize [15].
Providing multicomponent behavioral interventions for obesity in PCMHs and other primary care sites will increase the likelihood of participation among the aforementioned obesity disparity groups. Despite the potential benefits of obesity treatment interventions offered in primary care settings, particularly for obesity disparity groups, the role of primary care providers in providing such treatment interventions is not clear [16]. We surveyed primary care physicians who primarily worked in PCMHs to assess their practices, knowledge, views/beliefs, perceived barriers, and perceived needed clinic practice improvements relative to promoting healthy lifestyles and weight management among their patients.
Methods
Participants
Primary care physicians were recruited from among a regional primary care practice-based research network that includes 37 PCMHs affiliated with an academic health center and 2 nearby primary care sites not affiliated with an academic health center. Fifty-two physicians at these centers received an invitation via email to participate in our online survey study. The invitation email included (a) a study endorsement note from the chair of the Community Health and Family Medicine Department affiliated with the PCMHs, (b) instructions about how to participate in the study, and (c) a link to the study. Participation inclusion criteria specified in the online informed consent form were: (a) working as a physician affiliated with the practice-based research network, (b) having access to a computer with internet connection, (c) being able to communicate in written English, and (d) providing written consent to participate in the study. Physicians were not provided compensation for participating in the study.
Survey Instrument
To assess physicians’ views and practices, we used a modified version of the Physician Survey of Practices on Diet, Physical Activity, and Weight Control–Adult Questionnaire [17]. The survey was sponsored by the National Cancer Institute in collaboration with several other NIH institutes and the CDC for evaluating current clinical practices among physicians, including the degree to which physicians evaluate their patients for obesity and offer them guidance designed to increase adherence to a health-promoting lifestyle (eg, recommendations on diet, weight, and physical activity). Additionally, the questionnaire assesses physicians’ perceived barriers to patient assessment, evaluation, and management. It also includes questions about physicians’ healthy lifestyle–related knowledge. In 2010, Smith and colleagues utilized the questionnaire with a nationally representative sample of primary care physicians (n = 1211) to investigate primary care physicians’ clinical practices in relation to overweight and obesity [18]. To our knowledge, no other physician survey has been developed to assess current engagement in recommended clinical practices, barriers to engaging in recommended practices, as well as beliefs and knowledge regarding helping patients follow a health-promoting lifestyle. The original survey also includes questions regarding the physicians’ personal health status and health behaviors.
For our study, we modified the survey by removing questions regarding the physicians’ (a) perceived general health and well-being, (b) current dietary practices, (c) current level of engagement in physical activity, and (d) current engagement in professional activities unrelated to patient care (eg, research, teaching). Our modified survey included 7 questions asking about current practices regarding screening for obesity and referral of patients to weight management interventions. Two questions asked about physicians’ perceived barriers to helping patients adhere to a health-promoting lifestyle and maintain a healthy weight. Physicians were asked to rate their top 3 barriers from among a list of 11 pre-identified barriers and to rate their top 3 desired practice-related improvements from among a list of 10 pre-identified improvements. Physicians were given the option to provide additional barriers or improvements that were not already pre-identified. Seven questions assessed physicians’ views/beliefs related to helping patients achieve and maintain a health-promoting lifestyle and a healthy weight. These questions utilize a rating scale where 1 = strongly agree, 2 = agree somewhat, 3 = neither agree nor disagree, 4 = disagree somewhat, and 5 = strongly disagree. Four questions assessed physicians’ healthy lifestyle–related knowledge (BMI ranges/percentiles for adults/children, diet and exercise guideline recommendations [recommended amounts of moderate physical activity and servings of fruits and vegetables for adults]) and 11 questions ask about the physician (height, weight, demographics, and practice population).
Survey Administration
The survey was administered anonymously through Qualtrics, a secure, online survey platform. The survey was administered online to increase anonymity, increase response rate, and diminish potential physician-perceived barriers to participating in the study. The participating physicians were provided with a link that enabled them to access the survey. The survey excluded questions that required disclosure of identifying information. Survey data from Qualtrics were exported to an SPSS file that was stored on a password protected, secured computer in the research lab of the principal investigator for this study.
Data Analysis
Frequency analyses were applied to survey responses to determine the participating physicians’ endorsed barriers to and views regarding evaluating and managing patients’ weight, healthy eating, and physical activity; physicians’ views related to helping patients achieve and maintain a health-promoting lifestyle and a healthy weight; and physicians’ healthy lifestyle–related knowledge. Nonparametric t tests were conducted to examine differences in survey responses of the participating physicians in association with their sex (male or female), race (Asian vs. white/Caucasian), and BMI (BMI < 25 and BMI ≥ 25).
Approval for the study was obtained through the institutional review board of the University of Florida Health Science Center.
Results
Participants
Twenty-five physicians out of 52 invited completed the survey (48% response rate). The vast majority of the study participants were PCMH-affiliated (92%–96%). Participating physicians ranged in age from 29 to 67 years old. Sixteen (64%) participating physicians identified as female, 7 (28%) participating physicians identified as male, and 2 (8%) participating physicians did not indicate a sex. Twenty (80%) participating physicians identified as being white, 3 (12%) participating physicians identified as being Asian/Asian American, and 2 (8%) did not indicate a race or ethnicity. Twenty-two (88%) participating physicians were employees of a large medical group affiliated with an academic medical center, 1 (4%) was employed in a physician-owned practice, and 2 (8%) did not indicate their main primary care practice location. Table 1 provides additional demographic data.
Approximately 88% of the participating physicians agreed that patients were more likely to adopt healthier lifestyles if their health care providers counseled them to do so (44% strongly agreed, 44% agreed somewhat). A majority of participating physicians endorsed the view that there are effective strategies and/or tools to (a) help patients eat a healthy diet (56% strongly agreed, 24% agreed somewhat), (b) engage in adequate amounts of physical activity (56% strongly agreed, 20% agreed somewhat), and (c) maintain a healthy weight or lose weight (48% strongly agreed,
Many participating physicians expressed confidence in their ability to counsel their patients to (a) eat a healthy diet (64% strongly agreed, 28% agreed somewhat), (b) engage in adequate amounts of physical activity (68% strongly agreed, 24% agreed somewhat), and (c) maintain a healthy weight or lose weight (60% strongly agreed, 32% agreed somewhat). Most participating physicians at least somewhat agreed that they were effective at helping their patients (a) eat a healthy diet (24% strongly agreed, 52% agreed somewhat), (b) engage in adequate amounts of physical activity (20% strongly agreed, 56% agreed somewhat), and (c) maintain a healthy weight or lose weight (16% strongly agreed, 48% agreed somewhat). Some participating physicians expressed ambivalence about whether or not they were effective at helping their patients (a) eat a healthy diet (16% neither agreed nor disagreed), (b) engage in adequate amounts of physical activity (12% neither agreed nor disagreed), and (c) maintain a healthy weight or lose weight (20% neither agreed nor disagreed). A total of 8% of participating physicians did not endorse the belief that they were effective at helping their patients maintain a healthy weight or lose weight.
Most participating physicians at least somewhat agreed that they were effective in encouraging patients to engage in health-promoting activities (44% strongly agreed, and 44% agreed somewhat), whereas 4% neither agreed nor disagreed that they were effective in providing this encouragement. Interestingly, many participating physicians endorsed the view that they would be able to provide more credible and effective counseling to patients if they (the physicians themselves) ate a healthy diet (68% strongly agreed, 20% agreed somewhat) and engaged in adequate amounts of physical activity (68% strongly agreed, 20% agreed somewhat). A minority of participating physicians (4%) neither agreed or disagreed with this perspective.
In regards to participating physicians’ healthy lifestyle–related knowledge about current BMI ranges for adults or percentile ranges for children, most participating physicians were able to accurately identify the correct BMI cutoff ranges for overweight (80%) and obese (76%) adults. However, only 32% of participating physicians were able to correctly identify BMI percentile ranges for children; however, nearly all of the participating physicians saw mainly adult patients. Lastly, 76% of participating physicians were able to correctly identify the recommended amounts of moderate physical activity for adults 18 years of age and older, and only 56% were able to correctly identify the recommended amount of servings of fruits and vegetables.
There were no significant race-related differences in participating physicians views/beliefs, healthy lifestyle–related knowledge, and perceived barriers to helping patients engage in health promoting behaviors and weight management. There were no significant sex-related differences in these variables with the exception that women were more likely to respond that they did not know the BMI percentile range at which children or adolescents were considered to have a healthy weight (37.5% of women vs. 0% of men, P = 0.03). A similar percentage of men (66.7%) and women (64.7%) who chose among the 4 percentile range options (rather than endorsing “Don’t know”) chose an incorrect answer. Lastly, there were no significant self-reported BMI-related differences in participating physicians’ views/beliefs, healthy lifestyle–related knowledge, and perceived barriers to helping patients engage in health-promoting behaviors and weight management.
Discussion
Given the high percentage of adults in the United States who are overweight or obese and the associated health risks, it is paramount that primary care physicians advise their patients to manage their weight and adopt a health-promoting lifestyle. Research studies indicate that such advice is effective [18,19]. Furthermore, it has been found that most overweight and obese patients want more assistance with weight management than they are receiving from their primary care physicians [21]. This study thus explored primary care physicians’ knowledge, beliefs, and perceived barriers that may prevent them from providing such assistance. The primary care setting is the site where obesity disparity groups (eg, racial/ethnic minorities, groups with low household incomes) are most likely to receive care [22,23].
Most of the PCMH-affiliated physicians in this study agreed that they had the responsibility to promote weight-loss/management and healthy lifestyles among their patients. Consistent with prior research [9], the majority of the physicians in this study felt they were effective in their ability to counsel patients to eat a healthy diet and engage in physical activity. To illustrate, in a prior study [9], 77% of primary care providers thought that they could provide useful dieting tips to patients, and in this study, 80% believed they were effective in helping patients eat a healthy diet. However, despite this confidence in their ability to provide advice about healthy diets and physical activity, the providers in both this and in another prior study [25] were less confident in their ability to actually help patients lose weight. Only 64% of the providers in the present study felt they could be effective in assisting patients with losing weight or maintaining a healthy weight. Although this percentage is higher than the 44% of physicians found in a prior study [25] who felt confident in their ability to treat obesity, both studies clearly point to a need to decrease barriers that physicians face in helping clients lose weight.
A key finding of this study was the consensus among the participating physicians regarding what they perceived to be the common barriers to helping patients adhere to a health-promoting lifestyle. Consistent with past research [8,9], the 3 most common barriers cited by the participating physicians were that they did not have enough time, patients were not interested in improving their weight, and adequate referrals for diet, physical activity, and weight were lacking. Additional barriers endorsed included a lack of effective tools and information to give patients, and a fear of offending patients. Another barrier identified by the participating physicians is the perception that patients had difficulty in changing behaviors necessary for maintaining a healthier lifestyle.
When asked what would facilitate conversations with patients, the top 3 responses given were better tools to communicate diet, physical activity, or weight problems to patients or family members; better mechanisms to connect patients to specific referral sources; and better counseling tools to guide patients towards engagement in healthy lifestyles. Of note is the significant overlap between the perceived barriers and the needed facilitation tools. The clearest example of this overlap is that physicians noted a lack of adequate referral sources to be a barrier and that better mechanisms to connect patients to specific referral sources would facilitate their treatment of patients. Weight management referrals for patients in rural areas and for non-Hispanic black adults and Hispanic adults, among whom obesity is most prevalent in the United States [3,25], are particularly needed. Addressing this need is consistent with national calls to reduce/eliminate obesity and other disparities that plague the U.S. health care system. One promising avenue to facilitate weight management referrals is the development, evaluation, and wide dissemination of remote weight-loss support interventions, particularly in rural, racial/ethnic minority, and low-income communities. Indeed, several recent articles demonstrate the success of such weight management programs across diverse patient populations [27–29].
Many of the physicians who participated in the study (72%) endorsed lack of time as a significant barrier to discussing weight and weight-related behaviors with their patients. Therefore, finding time-efficient strategies to involve physicians in weight management interventions may prove particularly beneficial. One such evidence-based behavioral counseling framework—the 5As framework—has been endorsed by the Centers for Medicare and Medicaid Services and the USPSTF for use with obese patients during a typical 20-minute visit [28].
The second highest-rated barrier, perceived patient lack of motivation, warrants additional discussion. Despite over half of the physicians surveyed citing this as a barrier, previous studies have shown that the majority of overweight patients believe they should lose weight and are interested in losing weight [21]. This study highlights a potential discrepancy between physicians’ perceptions of patients’ interest in weight-loss and their patients’ actual interest. It is possible that this discrepancy can be avoided by training physicians on how to be culturally sensitive when addressing weight with their patients. Moreover, such cultural sensitivity training may be of great use, given that 12% of physicians in this study were apprehensive about discussing weight with their patients due to fear of offending them. Such training typically involves teaching physicians how to talk with patients in ways that enable patients to feel comfortable, trusting, and respectful in patient-physician/provider interactions [29].
Two other findings pertaining to providers deserve mention. Specifically, 88% of physicians believed that effectively encouraging patients to adhere to a healthy lifestyle included personally engaging in health-promoting activities. However, of the physicians surveyed, 64% were overweight/obese. Given the high percentage of physicians in this study that were overweight/obese and these physicians’ belief that their personal engagement in health-promoting activities is important to encourage patient engagement in a healthy lifestyle, it seems that future efforts are needed to facilitate health-promoting behaviors among physicians—efforts that may in turn aid them in encouraging their patients to adhere to a healthy lifestyle.
Finally, this study assessed physicians’ healthy lifestyle–related knowledge about current BMI ranges for adults and BMI percentile ranges for children, and recommended amounts of moderate physical activity and servings of fruits and vegetables for adults. Most physicians were able to correctly identify the adult BMI cutoff ranges for overweight and obesity and to identify the correct answers to questions about physical activity and fruits and vegetable consumption guidelines for adults. However, only 32% of physicians were able to correctly identify BMI percentile ranges for children and/or adolescents. This is understandable given that most of the physicians in this study provide care to adult patients. However, considering that in 2012 more than one-third of children and adolescents were overweight or obese [1], it is important that all physicians have knowledge of BMI percentile ranges for children and adolescents so that minimally they can convey this information to their adult patients who are parents. The USPSTF defines children and adolescent overweight as an age- and gender-specific BMI between the 85th and 94th percentiles, and children and adolescent obesity as an age- and gender-specific BMI ≥ 95th percentile [31]. Such knowledge of BMI cutoffs is needed in order for providers to comply with the USPSTF recommendation to screen all adults and children aged 6 years and older for obesity, and then offer or refer those with an obesity diagnosis to intensive multicomponent behavioral interventions [31–33].
While novel, the study also had several limitations. First, due to self-selection of participants, physicians who felt more confident in their abilities to address overweight or obesity with their patients might have been more likely to respond. Second, participating physicians may have given socially desirable responses to questions (ie, responses that present a favorable image of themselves) rather than true/accurate responses. Future studies could incorporate a social desirability scale in order to detect and control for any socially desirable responding [33]. Another limitation was the small sample size and the limited variability in geographic location of the participating physicians. Thus, the experiences of these physicians may not be generalizable to physicians in other geographic regions. Future similar studies to the present study are needed and such studies should use a larger and randomly selected sample of physicians that is racially/ethnically diverse. Finally, a limitation of this study is the 48% participation rate. Factors that may have contributed to this participation rate include lack of compensation for physicians and the likelihood that physicians may have extremely busy schedules that may discourage them from participating. However, it is important to note that the 48% participation rate of this study is better than the 25.6% participation rate in another similar study [25]. Future similar studies to the present study likely need to include strong incentives for physicians to be study participants.
Conclusion
Our study indicates that many primary care physicians may not talk with their patients about engaging in healthy eating, physical activity, and weight management because of perceived barriers that prevent them from doing so, rather than because of a lack of perceived responsibility to do so or a perception that counseling patients on these issues would be ineffective. This finding highlights the importance of providing physicians with the tools and resources needed to overcome the aforementioned barriers to fostering health-promoting lifestyles and a healthy weight among their patients and the importance of involving physicians in identifying these barriers and ways to overcome them.
Acknowledgement. We thank the patients and health care providers at the participating medical homes affiliated with University of Florida Health in Jacksonville, Florida, for making this research possible.
Corresponding author: Carolyn M. Tucker, PhD, University of Florida, cmtucker@ufl.edu.
Funding/support: Support for this research was provided by the Office of Research at UF–Gainesville, Florida, and by the National Institutes of Health and National Center for Research Resources CTSA grant UL1 TR000064.
Financial disclosures: None.
1. Ogden CL, Carroll MD, Kit BK, Flegal KM. Prevalence of childhood and adult obesity in the United States, 2011–2012. JAMA 2014;311:806–14.
2. Centers for Disease Control and Prevention. Adult obesity causes and consequences, 2016. Accessed 30 Apr 2017 at www.cdc.gov/obesity/adult/causes.html.
3. Centers for Disease Control and Prevention. CDC health disparities and inequalities report —United States, 2013. Accessed 30 Apr 2017 at www.cdc.gov/mmwr/pdf/other/su6203.pdf.
4. Wang Y, Beydoun MA. The obesity epidemic in the United States – gender, age, socioeconomic, racial/ethnic, and geographic characteristics: A systematic review and meta-regression analysis. Epidemiol Rev 2007;29:6–28.
5. Levine, JA. Poverty and obesity in the US. Diabetes 2011;60:2667–8.
6. Moyer VA. Screening for and management of obesity in adults: U.S. Preventive Services Task Force recommendation statement. Ann Intern Med 2012;157:373–8.
7. Aveyard P, Lewis A, Tearne S, et al. Screening and brief intervention for obesity in primary care: a parallel, two-arm, randomised trial. Lancet 2016;388:2492–500.
8. Jay M, Chintapalli S, Squires A, et al. Barriers and facilitators to providing primary care-based weight management services in a patient centered medical home for Veterans: a qualitative study. BMC Fam Pract 2015;16:167.
9. Ruelaz AR, Diefenbach, Simon B, et al. Perceived barriers to weight management. J Gen Intern Med 2007;22:518–22.
10. Carvajal R, Wadden TA, Tsai AG, et al. Managing obesity in primary care practice: A narrative review. Ann N Y Acad Sci 2013;1281:191–206.
11. Wadden TA, Neiberg RH, Wing RR, et al; Look AHEAD Research Group. Four-year weight-losses in the Look AHEAD study: factors associated with long-term success. Obesity (Silver Spring) 2011;19:1987–98.
12. LeBlanc ES, O’Connor, Whitlock EP, et al. Effectiveness of primary care-relevant treatments for obesity in adults: a systematic evidence review for the U.S. Preventive Services Task Force. Ann Intern Med 2011;155:434–47.
13. Rittenhouse DR, Shortell SM. The patient-centered medical home: will it stand the test of health reform? JAMA 2009;301:2038–40.
14. Scholle S, Torda P, Peikes D, et al. Engaging patients and families in the medical home (prepared by Mathematica Policy Research under contract no. HHSA290200900019ITO2.) AHRQ Pub No. 10-0083-EF. Rockville, MD: Agency for Healthcare Research and Quality; June 2010.
15. US Department of Health and Human Services. HHS action plan to reduce racial and ethnic health disparities: A nation free of disparities in health and health care. 2011.
16. Ard J. Obesity in the US: what is the best role for primary care? BMJ 2015;350:1–10.
17. National Cancer Institute. Physcian survey of practices on diet, physical activity, and weight control. 2010. Accessed 30 Apr 2017 at https://healthcaredelivery.cancer.gov/energy_balance/phys_pract_q_adult.pdf.
18. Smith AW, Borowski LA, Liu B, et al. US primary care physicians’ diet-, physical activity–, and weight-related care of adult patients. Am J Prev Med 2011;41:33–42.
19. Simons-Morton DG, Calfas KJ, et al. Effects of interventions in health care settings on physical activity or cardiorespiratory fitness. Am J Prev Med 1998;15:413–30.
20. Bowerman S, Bellman M, Saltsman P, et al. Implementation of a primary care physician network obesity management program. Obes Res 2001;9 Suppl 4:321S–5S.
21. Potter MB, Vu JD, Croughan-Minihane M. Weight management: what patients want from their primary care physician. J Fam Pract 2001;50:513–8.
22. National Association of Community Health Centers. Community health centers: The local prescription for better quality and lower costs. March 2011. Accessed at www.nachc.org.
23. Institute of Medicine. Unequal treatment: confronting racial and ethnic disparities in healthcare. Washington, DC: National Academy of Sciences Press; 2003.
24. Flegal KM, Carroll MD, Kit BK, Ogden CL. Prevalence of obesity and trends in the distribution of body mass index among US adults, 1999–2010. JAMA 2012;307:491–7.
25. Bleich SN, Bennett WL, Gudzune KA, Cooper LA. National survey of US primary care physicians’ perspectives about causes of obesity and solutions to improve care. BMJ Open 2012;2(6).
26. Patterson PD, Moore CG, Probst JC, Shinogle JA. Obesity and physical inactivity in rural America. J Rural Health 2004;20:151–9.
27. Shaikh U, Cole SL, Marcin JP, Nesbitt TS. Clinical management and patient outcomes among children and adolescents receiving telemedicine consultations for obesity. Telemed e-Health 2008;14:434–40.
28. Schlair S, Moore S, Mcmacken M, Jay M. How to deliver high-quality obesity counseling in primary care using the 5As framework. J Clin Outcomes Manag 2012;19:221–9.
29. Tucker CM, Arthur TM, Roncoroni J, et al. Patient-centered culturally sensitive health care. Am J Lifestyle Med 2013;9:63–77.
30. Ma J, Yank V, Xiao L, et al. Translating the diabetes prevention program lifestyle intervention for weight loss into primary care. JAMA Intern Med 2013;173:113–21.
31. U.S. Preventive Services Task Force. Screening for obesity in children and adolescents: U.S. Preventive Services Task Force recommendation statement. Pediatrics 2010;125:361–7.
32. Final recommendation statement: obesity in adults: screening and management. US Preventive Services Task Force. Oct 2014. Accessed at www.uspreventiveservicestaskforce.org.
33. van de Mortel, TF. Faking it: social desirability response bias in self-report research. Aust J Advanced Nurs 2008:25:40–8.
Does Preoperative Pneumonia Affect Complications of Geriatric Hip Fracture Surgery?
Take-Home Points
- The prevalence of preoperative pneumonia is 1.2% among hip fracture patients aged >65 years.
- Preoperative pneumonia is an independent risk factor for mortality and adverse events including renal failure, prolonged ventilator dependence, and prolonged altered mental status after geriatric hip fracture surgery.
- Underweight BMI (<18.5 kg/m2) was associated with higher mortality within 30 days among hip fracture patients admitted with pneumonia.
- The mortality rate normalized to that of patients without pneumonia within 2 weeks of hip fracture surgery.
- Time from admission to surgery was not associated with adverse events or mortality among hip fracture patients admitted with pneumonia.
Preoperative pneumonia remains relatively unexplored as a risk factor for adverse outcomes in geriatric hip fracture surgery. Dated studies report a 0.3% to 3.2% prevalence of “recent pneumonia” in patients presenting with hip fracture but provide neither a definition of pneumonia based on clinical criteria nor a subset analysis of outcomes in the pneumonia group.1-3 Although active pneumonia has been identified as a preoperative optimization target in the management guidelines for geriatric hip fracture,4 we are unaware of any studies that have reported on differences in demographics, comorbidities, delay to surgery, or adverse outcomes between hip fracture patients with and without preoperative pneumonia.
This paucity of information on the effect of preoperative pneumonia in the hip fracture population may be related to low prevalence of preoperative pneumonia and a cadre of variable definitions, which limit identification of a cohort of patients with preoperative pneumonia large enough from which to draw meaningful results. Database studies, especially those using surgical registries rather than administrative or reimbursement data, offer particular advantages for investigation of such rare clinical entities.5Medical care of patients with pneumonia alone is known to be facilitated by assessments of mortality risk from clinical and laboratory data. The modified British Thoracic Society rule/CURB-65 (confusion, urea, respiratory rate, blood pressure) score is strongly predictive of mortality in hospitalized adults with pneumonia (odds ratio [OR], 4.59; 95% confidence interval [CI], 1.42-14.85; P = .011) and may guide antibiotic therapy, laboratory investigations, and the decision to intubate in a patient with pneumonia.6-8 This score is predictive of adverse events (AEs), hospital length of stay, and use of intensive care services.6,7,9-13 We hypothesized that preoperative clinical indicators assessed by pneumonia severity scores as well as patient demographics and baseline comorbidities may also have prognostic value for risk of AEs in a cohort of geriatric hip fracture surgery patients with preoperative pneumonia.
In this article, we first describe the prevalence of preoperative pneumonia in geriatric hip fracture surgery patients as well as demographic and operative differences between patients with and without the disease. We then ask 3 questions: Is preoperative pneumonia an independent risk factor for mortality and adverse outcomes in geriatric hip fracture surgery? Is there a postoperative interval during which the unadjusted mortality rate is higher among patients with preoperative pneumonia? In patients with preoperative pneumonia, what are the predictors of morbidity and mortality?
Methods
Yale University’s Human Investigations Committee approved this retrospective cohort study, which used the American College of Surgeons (ACS) National Surgical Quality Improvement Program (NSQIP) database for the period 2005 to 2012. ACS-NSQIP is a prospective, multi-institutional outcomes program that collects data on preoperative comorbidities, intraoperative variables, and 30-day postoperative outcomes for patients undergoing surgical procedures in inpatient and outpatient settings.14
Unlike administrative databases, which are based on reimbursement data, ACS-NSQIP data are collected by trained surgical clinical reviewers for the purposes of quality improvement and clinical research, and data quality is ensured with routine auditing.15 The program has gained a high degree of respect as a powerful and valid data source in both general16 and orthopedic17 surgery literature. The database offers a particular advantage with respect to the study of preoperative pneumonia: Only patients with new or recently diagnosed pneumonia on antibiotic therapy who meet strict criteria for characteristic findings on chest radiography, clinical signs and symptoms of respiratory illness, and positive cultures are coded as having actively treated pneumonia at time of surgery.15
To identify hip fracture patients over the age of 65 years who underwent operative fixation of a hip fracture, we used Current Procedural Terminology (CPT) hip fracture codes, including 27235 (percutaneous screw fixation), 27236 or 27244 (plate-and-screw fixation), and 27245 (intramedullary device), as well as 27125 (hemiarthroplasty) and 27130 (arthroplasty) for patients with a postoperative International Classification of Disease, Ninth Revision (ICD-9) diagnosis code (820.x, 820.2x, or 820.8) consistent with acute hip fracture.18,19 Procedure type, anesthesia type, and delay from admission to surgery were captured for all procedures.
Preoperative demographics included age, sex, transfer origin, functional status, and body mass index (BMI) category. Binary comorbidities were classified as preoperative anemia (hematocrit, <0.41 for men, <0.36 for women), confusion, dyspnea at rest, uremia (blood urea nitrogen, >6.8 mmol/L), history of cardiovascular disease (congestive heart failure, myocardial infarction, percutaneous coronary intervention, angina pectoris, medically treated hypertension, peripheral vascular disease, or resting claudication), chronic obstructive pulmonary disease, diabetes, renal disease (renal failure or dialysis), and cigarette use in preceding 12 months.20,21 Although preoperative hypotension and respiratory rate are often considered in patients with pneumonia, these variables were not available from the ACS-NSQIP data.6,22Pearson χ2 test for categorical variables was used to compare baseline demographics and operative characteristics between patients with and without pneumonia, and Student t test was used to compare intervals from hospital admission to hip fracture surgery, surgery start to surgery stop, and surgery to discharge between patients with and without preoperative pneumonia.
Binary outcome measures were compared between patients with and without preoperative pneumonia. “Any AE” included any serious AE (SAE) or any minor AE. SAEs included death, acute renal failure, ventilator use >48 hours, unplanned intubation, septic shock, sepsis, return to operating room, coma >24 hours, cardiac arrest requiring cardiopulmonary resuscitation, myocardial infarction, thromboembolic event (deep vein thrombosis or pulmonary embolism), and stroke/cerebrovascular accident. Minor AEs included progressive renal insufficiency, urinary tract infection, organ/space infection, superficial surgical-site infection, deep surgical-site infection, and wound dehiscence. Other binary outcome measures included discharge destination and unplanned readmission within 30 days after hip fracture surgery.23Poisson regression with robust error variance as described by Zou24 was used to compare the rates of any, minor, and individual AEs, and any SAEs, between patients with and without pneumonia. Multivariate analysis accounted for the baseline variables in Table 1. AEs that occurred more than once in each group were included in the analyses.
Kaplan-Meier survival analysis was performed for postoperative mortality within 30 days. Within the preoperative pneumonia group, covariates from Table 1 were identified as predictors of any AE, SAE, or death within 30 days after hip fracture surgery by stepwise multivariate Poisson regression with robust error variance. When interval from admission to surgery was longer than 24, 48, 72, or 96 hours, it was also included as a covariate. Variables that did not show an association with AEs at the P < .20 level were not included in the final regression model. All analyses were performed with Stata/SE Version 12.0 statistical software (StataCorp).
Results
Of the 7128 geriatric hip fracture patients in this study, 82 (1.2%) had active pneumonia at time of surgery (Table 1). Age, BMI, preoperative uremia, history of cardiovascular disease, diabetes, renal disease, and smoking were similar between groups. In addition, there was no difference in anesthesia type or fixation procedure between the pneumonia and no-pneumonia groups. Patients with preoperative pneumonia differed significantly with respect to sex, transfer from facility, preoperative functional dependence, anemia, confusion, dyspnea at rest, and history of chronic obstructive pulmonary disease (Table 1).
Interval from admission to surgery was longer (P < .001) for geriatric hip fracture patients with preoperative pneumonia (mean, 6.8 days; 95% CI, 2.5-11.1 days) than for those without pneumonia (mean, 1.5 days; CI, 1.4-1.5 days). There was no difference (P = .124) in operative time between the pneumonia group (mean, 72.8 min; CI, 64.0-81.5 min) and the no-pneumonia group (mean, 66.1 min; CI, 61.2-67.0 min). Interval from surgery to discharge was longer (P < .001) for patients with preoperative pneumonia (mean, 10.1 days; CI, 6.9-13.4 days) than for those without pneumonia (mean, 6.3 days; CI, 6.1-6.4 days).
Adverse outcomes of geriatric hip fracture surgery are listed in Table 2. In the multivariate analysis, preoperative pneumonia was significantly associated with any AE (relative risk [RR]) = 1.44) and any SAE (RR = 1.79). 
Survival patterns diverged between patients with and without preoperative pneumonia (Figure). The unadjusted mortality rate was qualitatively higher in patients with preoperative pneumonia than in patients without pneumonia during the first days after hip fracture (slopes of unadjusted mortality curves in Figure). Of note, no patient under age 75 years with pneumonia at time of surgery died within the 30-day study period.
Among geriatric hip fracture patients with preoperative pneumonia, multivariate analyses revealed no significant association of any preoperative comorbidity with any AE or any SAE. Given the gravity of the death complication, however, death within 30 days after surgery was analyzed separately, and was found to be significantly associated (RR = 4.67) with being underweight (BMI, <18.5 kg/m2) (Table 3). Admission-to-surgery interval longer than 24, 48, 72, or 96 hours did not reach significance at the P < 0.2 level in the stepwise regressions and therefore was not associated with a higher or lower risk of any AE, SAE, or death.
Discussion
In the general US population, pneumonia accounts for 1.4% of deaths in people 65 years to 74 years old, 2.1% in people 75 years to 84 years, and 3.1% in people 85 years or older. In total, 3.4% of hospital inpatient deaths are attributed to pneumonia.25 In hospitalized general orthopedic surgical patients as well as hip fracture patients, pneumonia is strongly associated with increased mortality.26,27
We identified a preoperative pneumonia prevalence of 1.2%, which is comparable to the rates reported in the literature (0.3%-3.2%).1-3 To our knowledge, our study represents the largest series of patients with preoperative pneumonia at time of hip fracture repair, and the first to independently associate preoperative pneumonia with increased incidence of AEs, including death.
This study had its limitations. First, the ACS-NSQIP morbidity and mortality data, which are limited to the first 30 postoperative days, may be skewed because AEs that occurred after that interval are not captured. Second, coding of pneumonia in ACS-NSQIP does not convey specific information about the disease and its severity—infectious organism(s) responsible; acquisition setting (healthcare or community); treatment given, including antibiotic(s) selection, steroid use, dosing, and duration; and measures of treatment efficacy—limiting interpretation of the difference in delay to surgery. We cannot say whether the longer interval in patients with pneumonia reflects medical optimization, or whether the delay itself or any interventions during that time positively or negatively affected outcomes. In addition, despite using a large national database, we obtained a relatively small sample of patients (82) who had pneumonia before surgical hip fracture repair.
Multivariate analysis controlling for baseline demographics and comorbidities revealed that multiple SAEs were independently associated with preoperative pneumonia (overall SAE, RR = 1.79). Postoperative use of ventilator support for longer than 48 hours (RR = 6.48) and coma longer than 24 hours (RR = 7.31) are expected given the severity of pulmonary compromise in the study cohort.28,29 Acute renal failure (RR = 14.61) can occur in both hip fracture patients and community-acquired pneumonia patients and may be a multifactorial complication of the pulmonary infection, of the anesthesia, or of the surgical intervention in this cohort.30-32Unadjusted mortality in hip fracture takes months to a year to normalize to that of age-matched controls.32-34 In our series, the unadjusted death rate in the pneumonia cohort (Figure) was transiently elevated during the first weeks after surgery but then drew nearer the rate in the nondiseased hip fracture cohort by the end of the first month. Early death in the pneumonia group likely was multifactorial, potentially influenced by the increased burden of comorbidities in the pneumonia group at baseline, and the longer delay to surgery,35-38 as well as by the natural history of treated pneumonia in hospital patients, who, compared with age-matched hospitalized controls, also exhibit higher mortality during only the first 2 to 4 months of hospitalization for pneumonia.39 We regret that quality improvement strategies in the treatment of geriatric hip fracture surgery with pneumonia cannot be extrapolated from these results.
Similarly, the utility of BMI <18.5 kg/m2 as an actionable preoperative finding cannot be assessed from these results. However, we propose that underweight geriatric hip fracture patients with pneumonia may benefit from more aggressive preoperative optimization that does not delay surgery. Higher acuity of postoperative care, including more intensive nursing care and early coordination of care with respiratory therapists and medical comanagement teams, may also be beneficial.
Anesthesia type did not differ between patients with and without preoperative pneumonia and was not associated with AEs in patients with preoperative pneumonia. Consistent with our findings, multiple studies have reported no significant differences in short-term outcomes of hip fracture repair between general and spinal anesthesia, though no other study has compared the benefits of general and spinal anesthesia for patients with preoperative pneumonia.40-44 Although spinal anesthesia (relative to general anesthesia) has been reported to have benefits in hip and knee arthroplasty, these benefits appear not to translate to hip fracture repair.45-50 The results of the present study suggest that general and spinal anesthesia may be equivalent in terms of risk for the geriatric hip fracture patient with preoperative pneumonia.43,44Our attempt to evaluate the CURB-65 pneumonia severity score as a prognosticator of AEs was thwarted by the absence of required variables in the ACS-NSQIP dataset (confusion, uremia, dyspnea, and age were available; hypotension and blood pressure were not). In our analysis, we did include, individually, variables previously found to predict AEs in the medical pneumonia population (confusion, uremia, dyspnea at rest, anemia).9-11,32 However, these clinical findings are nonspecific in hip fracture patients, who may become anemic, confused, dyspneic, or uremic from a multitude of factors related to their injury and unrelated to pneumonia, including but not limited to hemorrhage, muscle damage, renal injury, and pulmonary embolism. It is not surprising that confusion, uremia, dyspnea at rest, and anemia were not individually predictive of AEs or death within 30 days after surgery in the cohort of geriatric hip fracture patients with pneumonia.
There is no literature that argues for or against delaying hip fracture surgery in geriatric hip fracture patients with pneumonia. The surgical delay observed in this population is ostensibly related to medical optimization of the pneumonia and/or underlying comorbidities. However, we did not find a morbidity or mortality detriment or benefit in delaying surgery by 1 to 4 days in this population. Delay of surgery is a poor covariate, given extensive confounding by medical management and preoperative optimizing of comorbid conditions (reflected in our independent variable and covariates) as well as institutional and surgeon variations in policy and behavior and other unaccounted influences. Although some authors have found no difference in mortality or major AEs between hip fracture patients who had a surgical delay and those who did not,31,51-53 other series and meta-analyses have suggested a mortality detriment in a surgical delay of more than 2 days36,54 or 4 days55 from admission. Given our data, we cannot recommend against immediate hip fracture repair in the subpopulation of geriatric hip fracture patients with pneumonia.
Our study findings suggest that preoperative pneumonia is a rare independent risk factor for AEs after hip fracture surgery in geriatric patients. Underweight BMI is predictive of death in geriatric hip fracture surgery patients who present with pneumonia, whereas early surgical repair appears not to be associated with adverse outcomes. Further investigation is warranted to determine if such patients benefit from specific preoperative and postoperative strategies for optimizing medical and surgical care based on these findings.
Am J Orthop. 2017;46(3):E177-E185. Copyright Frontline Medical Communications Inc. 2017. All rights reserved.
1. Sexson SB, Lehner JT. Factors affecting hip fracture mortality. J Orthop Trauma. 1987;1(4):298-305.
2. Mullen JO, Mullen NL. Hip fracture mortality: a prospective, multifactorial study to predict and minimize death risk. Clin Orthop Relat Res. 1992;(280):214-222.
3. Kenzora JE, McCarthy RE, Lowell JD, Sledge CB. Hip fracture mortality. Relation to age, treatment, preoperative illness, time of surgery, and complications. Clin Orthop Relat Res. 1984;(186):45-56.
4. Auron-Gomez M, Michota F. Medical management of hip fracture. Clin Geriatr Med. 2008;24(4):701-719.
5. Bohl DD, Basques BA, Golinvaux NS, Baumgaertner MR, Grauer JN. Nationwide Inpatient Sample and National Surgical Quality Improvement Program give different results in hip fracture studies. Clin Orthop Relat Res. 2014;472(6):1672-1680.
6. Lim WS, van der Eerden MM, Laing R, et al. Defining community acquired pneumonia severity on presentation to hospital: an international derivation and validation study. Thorax. 2003;58(5):377-382.
7. Myint PK, Kamath AV, Vowler SL, Maisey DN, Harrison BDW. The CURB (confusion, urea, respiratory rate and blood pressure) criteria in community-acquired pneumonia (CAP) in hospitalised elderly patients aged 65 years and over: a prospective observational cohort study. Age Ageing. 2005;34(1):75-77.
8. Wilkinson M, Woodhead MA. Guidelines for community-acquired pneumonia in the ICU. Curr Opin Crit Care. 2004;10(1):59-64.
9. Buising K, Thursky K, Black J, et al. A prospective comparison of severity scores for identifying patients with severe community acquired pneumonia: reconsidering what is meant by severe pneumonia. Thorax. 2006;61(5):419-424.
10. Ewig S, De Roux A, Bauer T, et al. Validation of predictive rules and indices of severity for community acquired pneumonia. Thorax. 2004;59(5):421-427.
11. Yandiola PP, Capelastegui A, Quintana J, et al. Prospective comparison of severity scores for predicting clinically relevant outcomes for patients hospitalized with community-acquired pneumonia. Chest. 2009;135(6):1572-1579.
12. Lim WS, Lewis S, Macfarlane JT. Severity prediction rules in community acquired pneumonia: a validation study. Thorax. 2000;55(3):219-223.
13. Bauer TT, Ewig S, Marre R, Suttorp N, Welte T; CAPNETZ Study Group. CRB‐65 predicts death from community‐acquired pneumonia. J Intern Med. 2006;260(1):93-101.
14. Khuri SF. The NSQIP: a new frontier in surgery. Surgery. 2005;138(5):837-843.
15. American College of Surgeons. User Guide for the 2012 ACS NSQIP Participant Use Data File: American College of Surgeons National Surgical Quality Improvement Program. https://www.facs.org/~/media/files/quality%20programs/nsqip/ug12.ashx. Published October 2013. Accessed October 8, 2014.
16. Ingraham AM, Richards KE, Hall BL, Ko CY. Quality improvement in surgery: the American College of Surgeons National Surgical Quality Improvement Program approach. Adv Surg. 2010;44(1):251-267.
17. Schilling PL, Hallstrom BR, Birkmeyer JD, Carpenter JE. Prioritizing perioperative quality improvement in orthopaedic surgery. J Bone Joint Surg Am. 2010;92(9):1884-1889.
18. Radcliff TA, Henderson WG, Stoner TJ, Khuri SF, Dohm M, Hutt E. Patient risk factors, operative care, and outcomes among older community-dwelling male veterans with hip fracture. J Bone Joint Surg Am. 2008;90(1):34-42.
19. Katzan I, Cebul R, Husak S, Dawson N, Baker D. The effect of pneumonia on mortality among patients hospitalized for acute stroke. Neurology. 2003;60(4):620-625.
20. Fisher MA, Matthei JD, Obirieze A, et al. Open reduction internal fixation versus hemiarthroplasty versus total hip arthroplasty in the elderly: a review of the National Surgical Quality Improvement Program database. J Surg Res. 2013;181(2):193-198.
21. Pugely AJ, Martin CT, Gao Y, Klocke NF, Callaghan JJ, Marsh JL. A risk calculator for short-term morbidity and mortality after hip fracture surgery. J Orthop Trauma. 2014;28(2):63-69.
22. Fine MJ, Smith MA, Carson CA, et al. Prognosis and outcomes of patients with community-acquired pneumonia: a meta-analysis. JAMA. 1996;275(2):134-141.
23. Donegan DJ, Gay AN, Baldwin K, Morales EE, Esterhai JL Jr, Mehta S. Use of medical comorbidities to predict complications after hip fracture surgery in the elderly. J Bone Joint Surg Am. 2010;92(4):807-813.
24. Zou G. A modified poisson regression approach to prospective studies with binary data. Am J Epidemiol. 2004:159(7):702-706.
25. Murphy SL, Xu J, Kochanek KD. Deaths: final data for 2010. Natl Vital Stat Rep. 20138;61(4):1-117.
26. Bhattacharyya T, Iorio R, Healy WL. Rate of and risk factors for acute inpatient mortality after orthopaedic surgery. J Bone Joint Surg Am. 2002;84(4):562-572.
27. Myers AH, Robinson EG, Van Natta ML, Michelson JD, Collins K, Baker SP. Hip fractures among the elderly: factors associated with in-hospital mortality. Am J Epidemiol. 1991;134(10):1128-1137.
28. Mandell LA, Wunderink RG, Anzueto A, et al; Infectious Diseases Society of America; American Thoracic Society. Infectious Diseases Society of America/American Thoracic Society consensus guidelines on the management of community-acquired pneumonia in adults. Clin Infect Dis. 2007;44(suppl 2):S27-S72.
29. Leroy O, Santre C, Beuscart C, et al. A five-year study of severe community-acquired pneumonia with emphasis on prognosis in patients admitted to an intensive care unit. Intensive Care Med. 1995;21(1):24-31.
30. Urwin S, Parker M, Griffiths R. General versus regional anaesthesia for hip fracture surgery: a meta-analysis of randomized trials. Br J Anaesth. 2000;84(4):450-455.
31. Orosz GM, Magaziner J, Hannan EL, et al. Association of timing of surgery for hip fracture and patient outcomes. JAMA. 2004;291(14):1738-1743.
32. Niederman MS, Mandell LA, Anzueto A, et al; American Thoracic Society. Guidelines for the management of adults with community-acquired pneumonia: diagnosis, assessment of severity, antimicrobial therapy, and prevention. Am J Respir Crit Care Med. 2001;163(7):1730-1754.
33. Koval KJ, Skovron ML, Aharonoff GB, Zuckerman JD. Predictors of functional recovery after hip fracture in the elderly. Clin Orthop Relat Res. 1998;(348):22-28.
34. Doruk H, Mas MR, Yildiz C, Sonmez A, Kýrdemir V. The effect of the timing of hip fracture surgery on the activity of daily living and mortality in elderly. Arch Gerontol Geriatr. 2004;39(2):179-185.
35. George GH, Patel S. Secondary prevention of hip fracture. Rheumatology. 2000;39(4):346-349.
36. Bottle A, Aylin P. Mortality associated with delay in operation after hip fracture: observational study. BMJ. 2006;332(7547):947-951.
37. Grimes JP, Gregory PM, Noveck H, Butler MS, Carson JL. The effects of time-to-surgery on mortality and morbidity in patients following hip fracture. Am J Med. 2002;112(9):702-709.
38. Simunovic N, Devereaux P, Sprague S, et al. Effect of early surgery after hip fracture on mortality and complications: systematic review and meta-analysis. CMAJ. 2010;182(15):1609-1616.
39. Kaplan V, Clermont G, Griffin MF, et al. Pneumonia: still the old man’s friend? Arch Intern Med. 2003;163(3):317-323.
40. Parker MJ, Handoll HH, Griffiths R. Anaesthesia for hip fracture surgery in adults. Cochrane Database Syst Rev. 2004;(4):CD000521.
41. Chakladar A, White SM. Cost estimates of spinal versus general anaesthesia for fractured neck of femur surgery. Anaesthesia. 2010;65(8):810-814.
42. White SM, Moppett IK, Griffiths R. Outcome by mode of anaesthesia for hip fracture surgery. An observational audit of 65 535 patients in a national dataset. Anaesthesia. 2014;69(3):224-230.
43. Gilbert TB, Hawkes WG, Hebel JR, et al. Spinal anesthesia versus general anesthesia for hip fracture repair: a longitudinal observation of 741 elderly patients during 2-year follow-up. Am J Orthop. 2000;29(1):25-35.
44. O’Hara DA, Duff A, Berlin JA, et al. The effect of anesthetic technique on postoperative outcomes in hip fracture repair. Anesthesiology. 2000;92(4):947-957.
45. Hole A, Terjesen T, Breivik H. Epidural versus general anaesthesia for total hip arthroplasty in elderly patients. Acta Anaesthesiol Scand. 1980;24(4):279-287.
46. Rashiq S, Finegan BA. The effect of spinal anesthesia on blood transfusion rate in total joint arthroplasty. Can J Surg. 2006;49(6):391-396.
47. Chang CC, Lin HC, Lin HW, Lin HC. Anesthetic management and surgical site infections in total hip or knee replacement: a population-based study. Anesthesiology. 2010;113(2):279-284.
48. Mauermann WJ, Shilling AM, Zuo Z. A comparison of neuraxial block versus general anesthesia for elective total hip replacement: a meta-analysis. Anesth Analg. 2006;103(4):1018-1025.
49. Hu S, Zhang ZY, Hua YQ, Li J, Cai ZD. A comparison of regional and general anaesthesia for total replacement of the hip or knee: a meta-analysis. J Bone Joint Surg Br. 2009;91(7):935-942.
50. Pugely AJ, Martin CT, Gao Y, Mendoza-Lattes S, Callaghan JJ. Differences in short-term complications between spinal and general anesthesia for primary total knee arthroplasty. J Bone Joint Surg Am. 2013;95(3):193-199.
51. Khan SK, Kalra S, Khanna A, Thiruvengada MM, Parker MJ. Timing of surgery for hip fractures: a systematic review of 52 published studies involving 291,413 patients. Injury. 2009;40(7):692-697.
52. Majumdar SR, Beaupre LA, Johnston DW, Dick DA, Cinats JG, Jiang HX. Lack of association between mortality and timing of surgical fixation in elderly patients with hip fracture: results of a retrospective population-based cohort study. Med Care. 2006;44(6):552-559.
53. Moran CG, Wenn RT, Sikand M, Taylor AM. Early mortality after hip fracture: is delay before surgery important? J Bone Joint Surg Am. 2005;87(3):483-489.
54. Shiga T, Wajima Zi, Ohe Y. Is operative delay associated with increased mortality of hip fracture patients? Systematic review, meta-analysis, and meta-regression. Can J Anesth. 2008;55(3):146-154.
55. Streubel P, Ricci W, Wong A, Gardner M. Mortality after distal femur fractures in elderly patients. Clin Orthop Relat Res. 2011;469(4):1188-1196.
Take-Home Points
- The prevalence of preoperative pneumonia is 1.2% among hip fracture patients aged >65 years.
- Preoperative pneumonia is an independent risk factor for mortality and adverse events including renal failure, prolonged ventilator dependence, and prolonged altered mental status after geriatric hip fracture surgery.
- Underweight BMI (<18.5 kg/m2) was associated with higher mortality within 30 days among hip fracture patients admitted with pneumonia.
- The mortality rate normalized to that of patients without pneumonia within 2 weeks of hip fracture surgery.
- Time from admission to surgery was not associated with adverse events or mortality among hip fracture patients admitted with pneumonia.
Preoperative pneumonia remains relatively unexplored as a risk factor for adverse outcomes in geriatric hip fracture surgery. Dated studies report a 0.3% to 3.2% prevalence of “recent pneumonia” in patients presenting with hip fracture but provide neither a definition of pneumonia based on clinical criteria nor a subset analysis of outcomes in the pneumonia group.1-3 Although active pneumonia has been identified as a preoperative optimization target in the management guidelines for geriatric hip fracture,4 we are unaware of any studies that have reported on differences in demographics, comorbidities, delay to surgery, or adverse outcomes between hip fracture patients with and without preoperative pneumonia.
This paucity of information on the effect of preoperative pneumonia in the hip fracture population may be related to low prevalence of preoperative pneumonia and a cadre of variable definitions, which limit identification of a cohort of patients with preoperative pneumonia large enough from which to draw meaningful results. Database studies, especially those using surgical registries rather than administrative or reimbursement data, offer particular advantages for investigation of such rare clinical entities.5Medical care of patients with pneumonia alone is known to be facilitated by assessments of mortality risk from clinical and laboratory data. The modified British Thoracic Society rule/CURB-65 (confusion, urea, respiratory rate, blood pressure) score is strongly predictive of mortality in hospitalized adults with pneumonia (odds ratio [OR], 4.59; 95% confidence interval [CI], 1.42-14.85; P = .011) and may guide antibiotic therapy, laboratory investigations, and the decision to intubate in a patient with pneumonia.6-8 This score is predictive of adverse events (AEs), hospital length of stay, and use of intensive care services.6,7,9-13 We hypothesized that preoperative clinical indicators assessed by pneumonia severity scores as well as patient demographics and baseline comorbidities may also have prognostic value for risk of AEs in a cohort of geriatric hip fracture surgery patients with preoperative pneumonia.
In this article, we first describe the prevalence of preoperative pneumonia in geriatric hip fracture surgery patients as well as demographic and operative differences between patients with and without the disease. We then ask 3 questions: Is preoperative pneumonia an independent risk factor for mortality and adverse outcomes in geriatric hip fracture surgery? Is there a postoperative interval during which the unadjusted mortality rate is higher among patients with preoperative pneumonia? In patients with preoperative pneumonia, what are the predictors of morbidity and mortality?
Methods
Yale University’s Human Investigations Committee approved this retrospective cohort study, which used the American College of Surgeons (ACS) National Surgical Quality Improvement Program (NSQIP) database for the period 2005 to 2012. ACS-NSQIP is a prospective, multi-institutional outcomes program that collects data on preoperative comorbidities, intraoperative variables, and 30-day postoperative outcomes for patients undergoing surgical procedures in inpatient and outpatient settings.14
Unlike administrative databases, which are based on reimbursement data, ACS-NSQIP data are collected by trained surgical clinical reviewers for the purposes of quality improvement and clinical research, and data quality is ensured with routine auditing.15 The program has gained a high degree of respect as a powerful and valid data source in both general16 and orthopedic17 surgery literature. The database offers a particular advantage with respect to the study of preoperative pneumonia: Only patients with new or recently diagnosed pneumonia on antibiotic therapy who meet strict criteria for characteristic findings on chest radiography, clinical signs and symptoms of respiratory illness, and positive cultures are coded as having actively treated pneumonia at time of surgery.15
To identify hip fracture patients over the age of 65 years who underwent operative fixation of a hip fracture, we used Current Procedural Terminology (CPT) hip fracture codes, including 27235 (percutaneous screw fixation), 27236 or 27244 (plate-and-screw fixation), and 27245 (intramedullary device), as well as 27125 (hemiarthroplasty) and 27130 (arthroplasty) for patients with a postoperative International Classification of Disease, Ninth Revision (ICD-9) diagnosis code (820.x, 820.2x, or 820.8) consistent with acute hip fracture.18,19 Procedure type, anesthesia type, and delay from admission to surgery were captured for all procedures.
Preoperative demographics included age, sex, transfer origin, functional status, and body mass index (BMI) category. Binary comorbidities were classified as preoperative anemia (hematocrit, <0.41 for men, <0.36 for women), confusion, dyspnea at rest, uremia (blood urea nitrogen, >6.8 mmol/L), history of cardiovascular disease (congestive heart failure, myocardial infarction, percutaneous coronary intervention, angina pectoris, medically treated hypertension, peripheral vascular disease, or resting claudication), chronic obstructive pulmonary disease, diabetes, renal disease (renal failure or dialysis), and cigarette use in preceding 12 months.20,21 Although preoperative hypotension and respiratory rate are often considered in patients with pneumonia, these variables were not available from the ACS-NSQIP data.6,22Pearson χ2 test for categorical variables was used to compare baseline demographics and operative characteristics between patients with and without pneumonia, and Student t test was used to compare intervals from hospital admission to hip fracture surgery, surgery start to surgery stop, and surgery to discharge between patients with and without preoperative pneumonia.
Binary outcome measures were compared between patients with and without preoperative pneumonia. “Any AE” included any serious AE (SAE) or any minor AE. SAEs included death, acute renal failure, ventilator use >48 hours, unplanned intubation, septic shock, sepsis, return to operating room, coma >24 hours, cardiac arrest requiring cardiopulmonary resuscitation, myocardial infarction, thromboembolic event (deep vein thrombosis or pulmonary embolism), and stroke/cerebrovascular accident. Minor AEs included progressive renal insufficiency, urinary tract infection, organ/space infection, superficial surgical-site infection, deep surgical-site infection, and wound dehiscence. Other binary outcome measures included discharge destination and unplanned readmission within 30 days after hip fracture surgery.23Poisson regression with robust error variance as described by Zou24 was used to compare the rates of any, minor, and individual AEs, and any SAEs, between patients with and without pneumonia. Multivariate analysis accounted for the baseline variables in Table 1. AEs that occurred more than once in each group were included in the analyses.
Kaplan-Meier survival analysis was performed for postoperative mortality within 30 days. Within the preoperative pneumonia group, covariates from Table 1 were identified as predictors of any AE, SAE, or death within 30 days after hip fracture surgery by stepwise multivariate Poisson regression with robust error variance. When interval from admission to surgery was longer than 24, 48, 72, or 96 hours, it was also included as a covariate. Variables that did not show an association with AEs at the P < .20 level were not included in the final regression model. All analyses were performed with Stata/SE Version 12.0 statistical software (StataCorp).
Results
Of the 7128 geriatric hip fracture patients in this study, 82 (1.2%) had active pneumonia at time of surgery (Table 1). Age, BMI, preoperative uremia, history of cardiovascular disease, diabetes, renal disease, and smoking were similar between groups. In addition, there was no difference in anesthesia type or fixation procedure between the pneumonia and no-pneumonia groups. Patients with preoperative pneumonia differed significantly with respect to sex, transfer from facility, preoperative functional dependence, anemia, confusion, dyspnea at rest, and history of chronic obstructive pulmonary disease (Table 1).
Interval from admission to surgery was longer (P < .001) for geriatric hip fracture patients with preoperative pneumonia (mean, 6.8 days; 95% CI, 2.5-11.1 days) than for those without pneumonia (mean, 1.5 days; CI, 1.4-1.5 days). There was no difference (P = .124) in operative time between the pneumonia group (mean, 72.8 min; CI, 64.0-81.5 min) and the no-pneumonia group (mean, 66.1 min; CI, 61.2-67.0 min). Interval from surgery to discharge was longer (P < .001) for patients with preoperative pneumonia (mean, 10.1 days; CI, 6.9-13.4 days) than for those without pneumonia (mean, 6.3 days; CI, 6.1-6.4 days).
Adverse outcomes of geriatric hip fracture surgery are listed in Table 2. In the multivariate analysis, preoperative pneumonia was significantly associated with any AE (relative risk [RR]) = 1.44) and any SAE (RR = 1.79).
Survival patterns diverged between patients with and without preoperative pneumonia (Figure). The unadjusted mortality rate was qualitatively higher in patients with preoperative pneumonia than in patients without pneumonia during the first days after hip fracture (slopes of unadjusted mortality curves in Figure). Of note, no patient under age 75 years with pneumonia at time of surgery died within the 30-day study period.
Among geriatric hip fracture patients with preoperative pneumonia, multivariate analyses revealed no significant association of any preoperative comorbidity with any AE or any SAE. Given the gravity of the death complication, however, death within 30 days after surgery was analyzed separately, and was found to be significantly associated (RR = 4.67) with being underweight (BMI, <18.5 kg/m2) (Table 3). Admission-to-surgery interval longer than 24, 48, 72, or 96 hours did not reach significance at the P < 0.2 level in the stepwise regressions and therefore was not associated with a higher or lower risk of any AE, SAE, or death.
Discussion
In the general US population, pneumonia accounts for 1.4% of deaths in people 65 years to 74 years old, 2.1% in people 75 years to 84 years, and 3.1% in people 85 years or older. In total, 3.4% of hospital inpatient deaths are attributed to pneumonia.25 In hospitalized general orthopedic surgical patients as well as hip fracture patients, pneumonia is strongly associated with increased mortality.26,27
We identified a preoperative pneumonia prevalence of 1.2%, which is comparable to the rates reported in the literature (0.3%-3.2%).1-3 To our knowledge, our study represents the largest series of patients with preoperative pneumonia at time of hip fracture repair, and the first to independently associate preoperative pneumonia with increased incidence of AEs, including death.
This study had its limitations. First, the ACS-NSQIP morbidity and mortality data, which are limited to the first 30 postoperative days, may be skewed because AEs that occurred after that interval are not captured. Second, coding of pneumonia in ACS-NSQIP does not convey specific information about the disease and its severity—infectious organism(s) responsible; acquisition setting (healthcare or community); treatment given, including antibiotic(s) selection, steroid use, dosing, and duration; and measures of treatment efficacy—limiting interpretation of the difference in delay to surgery. We cannot say whether the longer interval in patients with pneumonia reflects medical optimization, or whether the delay itself or any interventions during that time positively or negatively affected outcomes. In addition, despite using a large national database, we obtained a relatively small sample of patients (82) who had pneumonia before surgical hip fracture repair.
Multivariate analysis controlling for baseline demographics and comorbidities revealed that multiple SAEs were independently associated with preoperative pneumonia (overall SAE, RR = 1.79). Postoperative use of ventilator support for longer than 48 hours (RR = 6.48) and coma longer than 24 hours (RR = 7.31) are expected given the severity of pulmonary compromise in the study cohort.28,29 Acute renal failure (RR = 14.61) can occur in both hip fracture patients and community-acquired pneumonia patients and may be a multifactorial complication of the pulmonary infection, of the anesthesia, or of the surgical intervention in this cohort.30-32Unadjusted mortality in hip fracture takes months to a year to normalize to that of age-matched controls.32-34 In our series, the unadjusted death rate in the pneumonia cohort (Figure) was transiently elevated during the first weeks after surgery but then drew nearer the rate in the nondiseased hip fracture cohort by the end of the first month. Early death in the pneumonia group likely was multifactorial, potentially influenced by the increased burden of comorbidities in the pneumonia group at baseline, and the longer delay to surgery,35-38 as well as by the natural history of treated pneumonia in hospital patients, who, compared with age-matched hospitalized controls, also exhibit higher mortality during only the first 2 to 4 months of hospitalization for pneumonia.39 We regret that quality improvement strategies in the treatment of geriatric hip fracture surgery with pneumonia cannot be extrapolated from these results.
Similarly, the utility of BMI <18.5 kg/m2 as an actionable preoperative finding cannot be assessed from these results. However, we propose that underweight geriatric hip fracture patients with pneumonia may benefit from more aggressive preoperative optimization that does not delay surgery. Higher acuity of postoperative care, including more intensive nursing care and early coordination of care with respiratory therapists and medical comanagement teams, may also be beneficial.
Anesthesia type did not differ between patients with and without preoperative pneumonia and was not associated with AEs in patients with preoperative pneumonia. Consistent with our findings, multiple studies have reported no significant differences in short-term outcomes of hip fracture repair between general and spinal anesthesia, though no other study has compared the benefits of general and spinal anesthesia for patients with preoperative pneumonia.40-44 Although spinal anesthesia (relative to general anesthesia) has been reported to have benefits in hip and knee arthroplasty, these benefits appear not to translate to hip fracture repair.45-50 The results of the present study suggest that general and spinal anesthesia may be equivalent in terms of risk for the geriatric hip fracture patient with preoperative pneumonia.43,44Our attempt to evaluate the CURB-65 pneumonia severity score as a prognosticator of AEs was thwarted by the absence of required variables in the ACS-NSQIP dataset (confusion, uremia, dyspnea, and age were available; hypotension and blood pressure were not). In our analysis, we did include, individually, variables previously found to predict AEs in the medical pneumonia population (confusion, uremia, dyspnea at rest, anemia).9-11,32 However, these clinical findings are nonspecific in hip fracture patients, who may become anemic, confused, dyspneic, or uremic from a multitude of factors related to their injury and unrelated to pneumonia, including but not limited to hemorrhage, muscle damage, renal injury, and pulmonary embolism. It is not surprising that confusion, uremia, dyspnea at rest, and anemia were not individually predictive of AEs or death within 30 days after surgery in the cohort of geriatric hip fracture patients with pneumonia.
There is no literature that argues for or against delaying hip fracture surgery in geriatric hip fracture patients with pneumonia. The surgical delay observed in this population is ostensibly related to medical optimization of the pneumonia and/or underlying comorbidities. However, we did not find a morbidity or mortality detriment or benefit in delaying surgery by 1 to 4 days in this population. Delay of surgery is a poor covariate, given extensive confounding by medical management and preoperative optimizing of comorbid conditions (reflected in our independent variable and covariates) as well as institutional and surgeon variations in policy and behavior and other unaccounted influences. Although some authors have found no difference in mortality or major AEs between hip fracture patients who had a surgical delay and those who did not,31,51-53 other series and meta-analyses have suggested a mortality detriment in a surgical delay of more than 2 days36,54 or 4 days55 from admission. Given our data, we cannot recommend against immediate hip fracture repair in the subpopulation of geriatric hip fracture patients with pneumonia.
Our study findings suggest that preoperative pneumonia is a rare independent risk factor for AEs after hip fracture surgery in geriatric patients. Underweight BMI is predictive of death in geriatric hip fracture surgery patients who present with pneumonia, whereas early surgical repair appears not to be associated with adverse outcomes. Further investigation is warranted to determine if such patients benefit from specific preoperative and postoperative strategies for optimizing medical and surgical care based on these findings.
Am J Orthop. 2017;46(3):E177-E185. Copyright Frontline Medical Communications Inc. 2017. All rights reserved.
1. Sexson SB, Lehner JT. Factors affecting hip fracture mortality. J Orthop Trauma. 1987;1(4):298-305.
2. Mullen JO, Mullen NL. Hip fracture mortality: a prospective, multifactorial study to predict and minimize death risk. Clin Orthop Relat Res. 1992;(280):214-222.
3. Kenzora JE, McCarthy RE, Lowell JD, Sledge CB. Hip fracture mortality. Relation to age, treatment, preoperative illness, time of surgery, and complications. Clin Orthop Relat Res. 1984;(186):45-56.
4. Auron-Gomez M, Michota F. Medical management of hip fracture. Clin Geriatr Med. 2008;24(4):701-719.
5. Bohl DD, Basques BA, Golinvaux NS, Baumgaertner MR, Grauer JN. Nationwide Inpatient Sample and National Surgical Quality Improvement Program give different results in hip fracture studies. Clin Orthop Relat Res. 2014;472(6):1672-1680.
6. Lim WS, van der Eerden MM, Laing R, et al. Defining community acquired pneumonia severity on presentation to hospital: an international derivation and validation study. Thorax. 2003;58(5):377-382.
7. Myint PK, Kamath AV, Vowler SL, Maisey DN, Harrison BDW. The CURB (confusion, urea, respiratory rate and blood pressure) criteria in community-acquired pneumonia (CAP) in hospitalised elderly patients aged 65 years and over: a prospective observational cohort study. Age Ageing. 2005;34(1):75-77.
8. Wilkinson M, Woodhead MA. Guidelines for community-acquired pneumonia in the ICU. Curr Opin Crit Care. 2004;10(1):59-64.
9. Buising K, Thursky K, Black J, et al. A prospective comparison of severity scores for identifying patients with severe community acquired pneumonia: reconsidering what is meant by severe pneumonia. Thorax. 2006;61(5):419-424.
10. Ewig S, De Roux A, Bauer T, et al. Validation of predictive rules and indices of severity for community acquired pneumonia. Thorax. 2004;59(5):421-427.
11. Yandiola PP, Capelastegui A, Quintana J, et al. Prospective comparison of severity scores for predicting clinically relevant outcomes for patients hospitalized with community-acquired pneumonia. Chest. 2009;135(6):1572-1579.
12. Lim WS, Lewis S, Macfarlane JT. Severity prediction rules in community acquired pneumonia: a validation study. Thorax. 2000;55(3):219-223.
13. Bauer TT, Ewig S, Marre R, Suttorp N, Welte T; CAPNETZ Study Group. CRB‐65 predicts death from community‐acquired pneumonia. J Intern Med. 2006;260(1):93-101.
14. Khuri SF. The NSQIP: a new frontier in surgery. Surgery. 2005;138(5):837-843.
15. American College of Surgeons. User Guide for the 2012 ACS NSQIP Participant Use Data File: American College of Surgeons National Surgical Quality Improvement Program. https://www.facs.org/~/media/files/quality%20programs/nsqip/ug12.ashx. Published October 2013. Accessed October 8, 2014.
16. Ingraham AM, Richards KE, Hall BL, Ko CY. Quality improvement in surgery: the American College of Surgeons National Surgical Quality Improvement Program approach. Adv Surg. 2010;44(1):251-267.
17. Schilling PL, Hallstrom BR, Birkmeyer JD, Carpenter JE. Prioritizing perioperative quality improvement in orthopaedic surgery. J Bone Joint Surg Am. 2010;92(9):1884-1889.
18. Radcliff TA, Henderson WG, Stoner TJ, Khuri SF, Dohm M, Hutt E. Patient risk factors, operative care, and outcomes among older community-dwelling male veterans with hip fracture. J Bone Joint Surg Am. 2008;90(1):34-42.
19. Katzan I, Cebul R, Husak S, Dawson N, Baker D. The effect of pneumonia on mortality among patients hospitalized for acute stroke. Neurology. 2003;60(4):620-625.
20. Fisher MA, Matthei JD, Obirieze A, et al. Open reduction internal fixation versus hemiarthroplasty versus total hip arthroplasty in the elderly: a review of the National Surgical Quality Improvement Program database. J Surg Res. 2013;181(2):193-198.
21. Pugely AJ, Martin CT, Gao Y, Klocke NF, Callaghan JJ, Marsh JL. A risk calculator for short-term morbidity and mortality after hip fracture surgery. J Orthop Trauma. 2014;28(2):63-69.
22. Fine MJ, Smith MA, Carson CA, et al. Prognosis and outcomes of patients with community-acquired pneumonia: a meta-analysis. JAMA. 1996;275(2):134-141.
23. Donegan DJ, Gay AN, Baldwin K, Morales EE, Esterhai JL Jr, Mehta S. Use of medical comorbidities to predict complications after hip fracture surgery in the elderly. J Bone Joint Surg Am. 2010;92(4):807-813.
24. Zou G. A modified poisson regression approach to prospective studies with binary data. Am J Epidemiol. 2004:159(7):702-706.
25. Murphy SL, Xu J, Kochanek KD. Deaths: final data for 2010. Natl Vital Stat Rep. 20138;61(4):1-117.
26. Bhattacharyya T, Iorio R, Healy WL. Rate of and risk factors for acute inpatient mortality after orthopaedic surgery. J Bone Joint Surg Am. 2002;84(4):562-572.
27. Myers AH, Robinson EG, Van Natta ML, Michelson JD, Collins K, Baker SP. Hip fractures among the elderly: factors associated with in-hospital mortality. Am J Epidemiol. 1991;134(10):1128-1137.
28. Mandell LA, Wunderink RG, Anzueto A, et al; Infectious Diseases Society of America; American Thoracic Society. Infectious Diseases Society of America/American Thoracic Society consensus guidelines on the management of community-acquired pneumonia in adults. Clin Infect Dis. 2007;44(suppl 2):S27-S72.
29. Leroy O, Santre C, Beuscart C, et al. A five-year study of severe community-acquired pneumonia with emphasis on prognosis in patients admitted to an intensive care unit. Intensive Care Med. 1995;21(1):24-31.
30. Urwin S, Parker M, Griffiths R. General versus regional anaesthesia for hip fracture surgery: a meta-analysis of randomized trials. Br J Anaesth. 2000;84(4):450-455.
31. Orosz GM, Magaziner J, Hannan EL, et al. Association of timing of surgery for hip fracture and patient outcomes. JAMA. 2004;291(14):1738-1743.
32. Niederman MS, Mandell LA, Anzueto A, et al; American Thoracic Society. Guidelines for the management of adults with community-acquired pneumonia: diagnosis, assessment of severity, antimicrobial therapy, and prevention. Am J Respir Crit Care Med. 2001;163(7):1730-1754.
33. Koval KJ, Skovron ML, Aharonoff GB, Zuckerman JD. Predictors of functional recovery after hip fracture in the elderly. Clin Orthop Relat Res. 1998;(348):22-28.
34. Doruk H, Mas MR, Yildiz C, Sonmez A, Kýrdemir V. The effect of the timing of hip fracture surgery on the activity of daily living and mortality in elderly. Arch Gerontol Geriatr. 2004;39(2):179-185.
35. George GH, Patel S. Secondary prevention of hip fracture. Rheumatology. 2000;39(4):346-349.
36. Bottle A, Aylin P. Mortality associated with delay in operation after hip fracture: observational study. BMJ. 2006;332(7547):947-951.
37. Grimes JP, Gregory PM, Noveck H, Butler MS, Carson JL. The effects of time-to-surgery on mortality and morbidity in patients following hip fracture. Am J Med. 2002;112(9):702-709.
38. Simunovic N, Devereaux P, Sprague S, et al. Effect of early surgery after hip fracture on mortality and complications: systematic review and meta-analysis. CMAJ. 2010;182(15):1609-1616.
39. Kaplan V, Clermont G, Griffin MF, et al. Pneumonia: still the old man’s friend? Arch Intern Med. 2003;163(3):317-323.
40. Parker MJ, Handoll HH, Griffiths R. Anaesthesia for hip fracture surgery in adults. Cochrane Database Syst Rev. 2004;(4):CD000521.
41. Chakladar A, White SM. Cost estimates of spinal versus general anaesthesia for fractured neck of femur surgery. Anaesthesia. 2010;65(8):810-814.
42. White SM, Moppett IK, Griffiths R. Outcome by mode of anaesthesia for hip fracture surgery. An observational audit of 65 535 patients in a national dataset. Anaesthesia. 2014;69(3):224-230.
43. Gilbert TB, Hawkes WG, Hebel JR, et al. Spinal anesthesia versus general anesthesia for hip fracture repair: a longitudinal observation of 741 elderly patients during 2-year follow-up. Am J Orthop. 2000;29(1):25-35.
44. O’Hara DA, Duff A, Berlin JA, et al. The effect of anesthetic technique on postoperative outcomes in hip fracture repair. Anesthesiology. 2000;92(4):947-957.
45. Hole A, Terjesen T, Breivik H. Epidural versus general anaesthesia for total hip arthroplasty in elderly patients. Acta Anaesthesiol Scand. 1980;24(4):279-287.
46. Rashiq S, Finegan BA. The effect of spinal anesthesia on blood transfusion rate in total joint arthroplasty. Can J Surg. 2006;49(6):391-396.
47. Chang CC, Lin HC, Lin HW, Lin HC. Anesthetic management and surgical site infections in total hip or knee replacement: a population-based study. Anesthesiology. 2010;113(2):279-284.
48. Mauermann WJ, Shilling AM, Zuo Z. A comparison of neuraxial block versus general anesthesia for elective total hip replacement: a meta-analysis. Anesth Analg. 2006;103(4):1018-1025.
49. Hu S, Zhang ZY, Hua YQ, Li J, Cai ZD. A comparison of regional and general anaesthesia for total replacement of the hip or knee: a meta-analysis. J Bone Joint Surg Br. 2009;91(7):935-942.
50. Pugely AJ, Martin CT, Gao Y, Mendoza-Lattes S, Callaghan JJ. Differences in short-term complications between spinal and general anesthesia for primary total knee arthroplasty. J Bone Joint Surg Am. 2013;95(3):193-199.
51. Khan SK, Kalra S, Khanna A, Thiruvengada MM, Parker MJ. Timing of surgery for hip fractures: a systematic review of 52 published studies involving 291,413 patients. Injury. 2009;40(7):692-697.
52. Majumdar SR, Beaupre LA, Johnston DW, Dick DA, Cinats JG, Jiang HX. Lack of association between mortality and timing of surgical fixation in elderly patients with hip fracture: results of a retrospective population-based cohort study. Med Care. 2006;44(6):552-559.
53. Moran CG, Wenn RT, Sikand M, Taylor AM. Early mortality after hip fracture: is delay before surgery important? J Bone Joint Surg Am. 2005;87(3):483-489.
54. Shiga T, Wajima Zi, Ohe Y. Is operative delay associated with increased mortality of hip fracture patients? Systematic review, meta-analysis, and meta-regression. Can J Anesth. 2008;55(3):146-154.
55. Streubel P, Ricci W, Wong A, Gardner M. Mortality after distal femur fractures in elderly patients. Clin Orthop Relat Res. 2011;469(4):1188-1196.
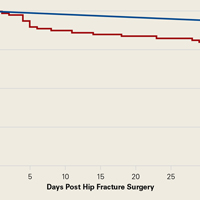
Narrowband UVB Treatment Increases Serum 25-Hydroxyvitamin D Levels in Patients With Chronic Plaque Psoriasis
Psoriasis is a chronic, inflammatory, T-cell–mediated skin disease. Phototherapy, which consists of light used at various wavelengths, is a well-established treatment method for psoriasis vulgaris. Although successful results have been obtained with phototherapy in psoriasis, its mechanism of action is not fully understood. UV light has been shown to have an effect on T-lymphocyte function as well as various components of the natural and acquired immune response. It also has a suppressive effect on the immune system caused by many independent effects.1 Phototherapy currently is available using broadband UVB (290–320 nm), narrowband UVB (NB-UVB)(311–313 nm), 308-nm excimer laser, UVA1 (340–400 nm), psoralen plus UVA, and photopheresis.2 Narrowband UVB treatment with light sources that peak at 311 to 313 nm have been used with high efficacy and a low side-effect profile, becoming the standard phototherapy method for chronic plaque-type psoriasis.3
More than 90% of vitamin D synthesis is formed in the skin following UV exposure, and the wavelengths and the solar spectrum that stimulate vitamin D synthesis have been a focus of research.4 7-Dehydrocholesterol (provitamin D3) is first converted to previtamin D3. Although the necessary UV wavelength for previtamin D3 synthesis is 295 to 300 nm, it is known that production stops below 260 nm and above 315 nm.4-6 Previtamin D3 is unstable and is quickly converted to vitamin D3 in the skinand then to the biologically active form of 1,25-dihydroxyvitamin D3 (calcitriol) following hydroxylation in the liver and kidneys. Calcitriol shows its effect by binding to the special nuclear receptor for vitamin D.7 Many tissues including the keratinocytes, dendritic cells, melanocytes, and sebocytes in the skin have been shown to possess the enzymatic mechanism necessary for 1,25-dihydroxyvitamin D3 production. Vitamin D also is known to have paracrine, autocrine, and intracrine effects on immunomodulation, cell proliferation, differentiation, and apoptosis, in addition to its role in calcium metabolism.5-9 Topical vitamin D and its analogues are used effectively and safely in psoriasis treatment with these effects.10 A correlation between low serum vitamin D levels and chronic inflammation severity has been shown in psoriasis patients in some studies.11,12
In this study, we sought to evaluate the effect of NB-UVB on vitamin D status and related metabolic markers in patients with psoriasis.
Methods
This prospective, single-center study included patients living in or around Eskisehir, Turkey, who were 18 years of age or older and had been diagnosed with chronic plaque psoriasis with a psoriasis area and severity index (PASI) score of 5 or higher. Permission was granted by the local ethics committee. Patients provided written informed consent prior to enrollment. Patients were excluded if they were younger than 18 years; were pregnant or breastfeeding; stayed in open environments for more than 2 hours per day during the summer months (May through September); used drugs affecting calcium metabolism in the last 8 weeks (eg, barbiturates, anticonvulsants, corticosteroids, vitamin D supplements, bisphosphonates); used systemic treatment for psoriasis in the last 8 weeks; used phototherapy or sunbathing in the last 8 weeks; used topical vitamin D analogues in the last 4 weeks; or had a history of psoriatic arthritis and other inflammatory disorders, renal disease, known calcium metabolism disorders, granulomatous disorders, thyroid disease, diabetes mellitus, skin cancer, or abnormal photosensitivity and known lack of response or hypersensitivity to phototherapy.
Clinical Evaluation and Laboratory Studies
The participants’ age, gender, Fitzpatrick skin type, disease duration, dairy intake and vitamin supplement levels, hours of sun exposure per week, detailed medical history, and medications were obtained and documented in the medical records.
Serum 25(OH)D levels were measured using high-performance liquid chromatography/mass spectrometry, serum calcium and phosphorus levels using colorimetric analysis, serum alkaline phosphatase (ALP) levels using the enzymatic colorimetric method, and serum parathyroid hormone (PTH) levels using electrochemiluminescence at baseline and after PASI 75 was achieved with treatment. Vitamin D levels were classified in 3 groups: (1) deficient (<20 ng/mL); (2) inadequate (20–30 ng/mL); and (3) adequate (>30 ng/mL). The PASI scores at baseline and posttreatment were calculated by the same dermatologist (S.S.).
Treatment Protocol and Patient Follow-up
Narrowband UVB treatment was started at 70% of the minimal erythema dose (MED). Phototherapy was administered 3 times weekly for 6 months or until PASI 75 response was achieved. An increase of 20% to 30% from the prior dose was made according to the participants’ clinical status at each treatment session, and the dose was stabilized once the maximum dose was achieved according to skin type—up to 2000 mJ/cm2 for Fitzpatrick skin types I and II, 3000 mJ/cm2 for skin types III and IV, and 5000 mJ/cm2 for skin types V and VI. Participants were allowed to use low- and moderate-potency topical corticosteroids and moisturizers containing urea during the course of treatment. The study physician (S.S.) clinically evaluated participants every 4 weeks for 6 months or until PASI 75 was achieved, and the clinical improvement was calculated as the percentage decrease in PASI score.
Statistical Analysis
The Shapiro-Wilk normalcy test was used for the continuous variables in the study. Variables with a normal distribution were analyzed with the paired t test and 1-way analysis of variance test and presented as mean (SD). Variables without a normal distribution were analyzed with the Wilcoxon t test and the Kruskal-Wallis test and presented as the median and 25th and 75th quartiles. The serum 25(OH)D levels were evaluated according to the seasons with the Kruskal-Wallis test. Categorical variables were expressed as frequency and percentages. The Pearson and Spearman correlation analysis and regression analysis were used to show the relationship between the variables (ie, age, Fitzpatrick skin type, PASI score, maximum NB-UVB dose, and number of sessions). The statistical significance level was set at P≤.05. Statistical analyses were performed using SPSS software version 21.
Results
A total of 49 participants (30 [61.22%] males; 19 [38.78%] females) were included in the study. The mean age (SD) was 40.27 (14.62) years (range, 19–74 years). Three (6.12%) participants were Fitzpatrick skin type I, 15 (30.61%) were skin type II, and 31 (63.27%) were skin type III.
The baseline median PASI score for the 49 participants was 10.20 (7.85–13.65). Baseline serum 25(OH)D levels were noted to be deficient in 40 participants (81.63%) and inadequate in 9 participants (18.37%). The distribution of the serum 25(OH)D levels of the participants according to the season was evaluated with the Kruskal-Wallis test and no association was found between serum 25(OH)D levels and seasonal changes (P=.685). Comparison of 25(OH)D basal values with Fitzpatrick skin type revealed a statistically significant relationship between skin type and vitamin D level (P=.024). The basal serum 25(OH)D levels were significantly lower in Fitzpatrick skin type II versus skin type I (P=.039).
Thirty-two (65.31%) participants achieved PASI 75 by the end of treatment. The baseline median PASI score (25th-75th quartiles) for the 32 patients was 10.45 (8.20-13.83) and the posttreatment PASI score was 1.95 (1.20-3.55), a statistically significant decrease following treatment (P<.001)(Table 1). Mean (SD) baseline serum 25(OH)D levels were 14.14 (6.70) ng/mL and posttreatment levels were 46.42 (15.51) ng/mL in these participants, which demonstrated a statistically significant increase during NB-UVB treatment (P<.001). None of the participants reached the toxicity levels (>80 ng/mL) for serum 25(OH)D. There were no significant changes in serum calcium or phosphorus levels posttreatment (Table 1), but statistically significant decreases in serum ALP and PTH levels were noted (P=.001 and P=.019, respectively)(Table 1).
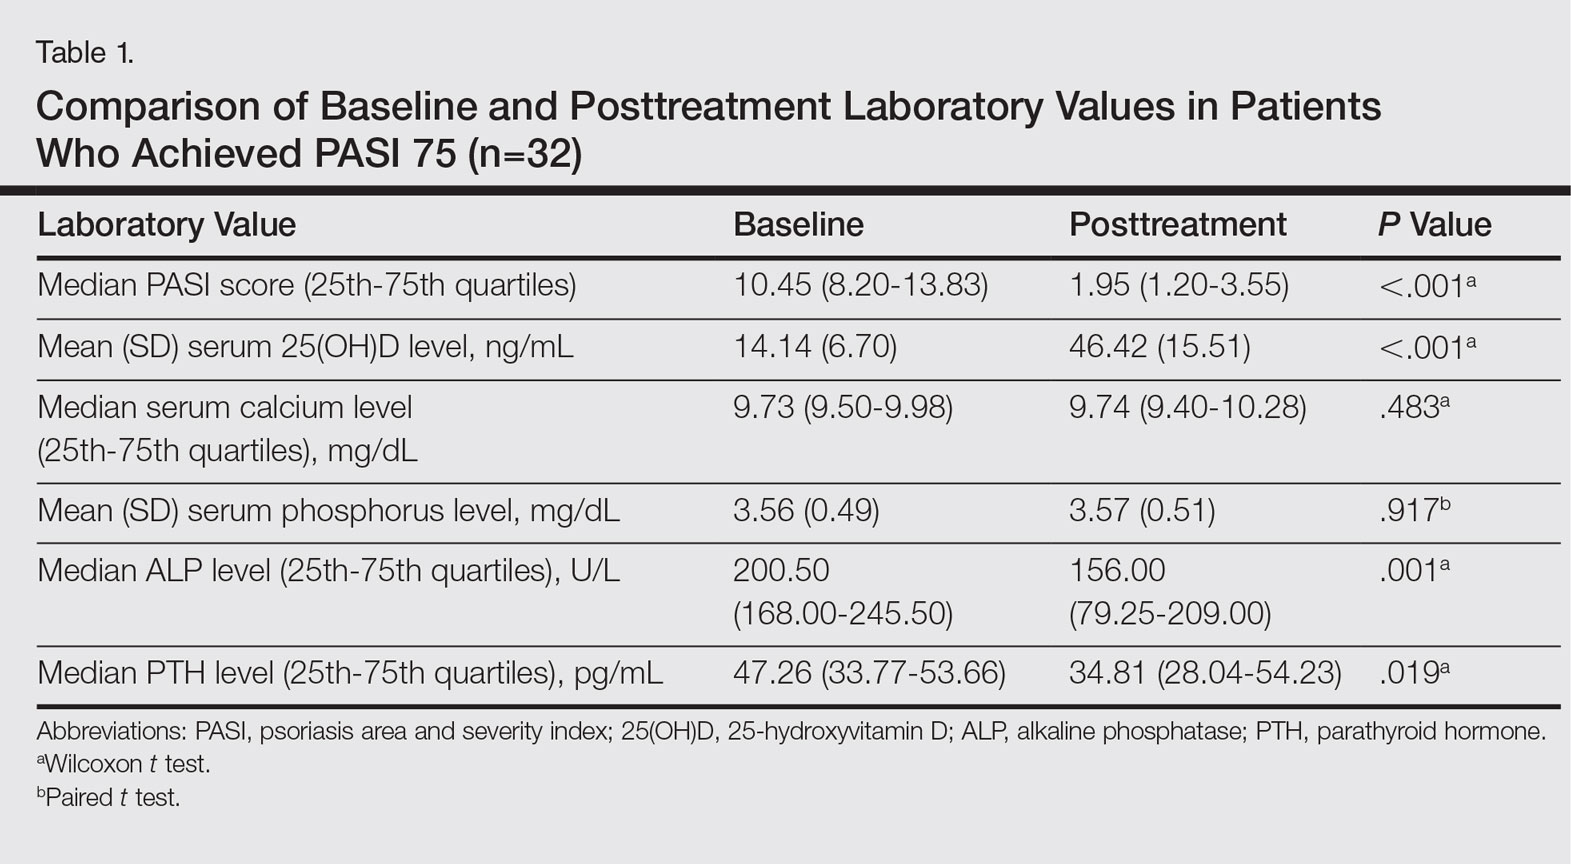
Participants who completed the study (n=32) received an average (SD) of 30.09 (7.53) sessions of NB-UVB treatment and the mean (SD) MED was 611.88 (240.14) mJ/cm2. The mean (SD) maximum dose was 2090.09 (341.78) mJ/cm2 (Table 2).
Posttreatment serum 25(OH)D levels were compared with the number of NB-UVB phototherapy sessions and the maximum dose values. We found that the posttreatment serum 25(OH)D levels correlated with the number of sessions (P=.031) but not with the maximum dose (P=.498).
Using regression analysis, we also evaluated the effect of the increase in vitamin D levels—posttreatment serum 25(OH)D level minus baseline serum 25(OH)D levels—on the decrease in PASI scores—baseline PASI score minus posttreatment PASI score—and found no effect of serum 25(OH)D level increase on PASI decrease (P=.530). There was no correlation between increased serum 25(OH)D levels and age, Fitzpatrick skin type, or baseline PASI score.
Comment
The most effective UV wavelength for vitamin D synthesis is 295 to 300 nm, and therefore broadband UVB is frequently studied when determining the relationship between phototherapy and serum vitamin D levels.4 The current study demonstrated a statistically significant increase in serum 25(OH)D levels following NB-UVB treatment in patients with moderate to severe chronic plaque psoriasis (P<.001). This result supports other studies reporting that NB-UVB treatment in psoriasis patients increases serum 25(OH)D levels.13-18
The main factor in the effective UVB level for vitamin D synthesis is the angle at which solar radiation reaches the earth, which is affected by the longitude, latitude, and time of day.19 For this reason, we planned to perform our study at a single center. Patients who stayed in open areas for more than 2 hours per day during the summer months (May through September) were excluded from the study to decrease the effect of seasonal changes on vitamin D levels. We evaluated the seasonal variation of vitamin D levels and found no relationship between seasonal changes and serum 25(OH)D levels. Therefore, the potential effect of seasonal changes on the vitamin D levels of study participants was excluded from the study.
The response to UV radiation changes according to age and Fitzpatrick skin type because 7-dehydrocholesterol levels decrease with age and melanin prevents the access of UVB photons to 7-dehydrocholesterol.20 The basal serum 25(OH)D levels were deficient in 81.63% of participants and inadequate in 18.37%. In this study, we also observed that the basal serum 25(OH)D levels were significantly lower in patients with Fitzpatrick skin type II than in Fitzpatrick skin type I (P=.039). The mean (SD) serum 25(OH)D level at baseline was 14.14 (6.70) ng/mL and posttreatment was 46.42 (15.51) ng/mL in the 32 patients who completed the study. Serum 25(OH)D levels showed a statistically significant increase after NB-UVB treatment (P<.001). The increased serum 25(OH)D levels after NB-UVB phototherapy were not associated with Fitzpatrick skin type, which was consistent with the results of Osmancevic et al.17 The adjusted NB-UVB doses according to the different skin types might be responsible for this result in our study.
Participant age did not have a significant effect on serum 25(OH)D levels, similar to other studies in the literature.13,17 We believe that artificial UVB radiation at high doses can compensate for the 7-dehydrocholesterol that decreases in the skin with aging.
We observed no significant change in the serum calcium and phosphorus levels with NB-UVB treatment in our study. None of the participants had a metabolic disorder related to increased 25(OH)D levels. The serum ALP and PTH levels decreased significantly following treatment (P=.001 and P=.019, respectively), which may have been secondary to increased serum 25(OH)D levels.
Posttreatment serum 25(OH)D levels were compared with the number of NB-UVB phototherapy sessions and maximum dose values. The posttreatment serum 25(OH)D levels were found to be related to the number of sessions received, but this value was not correlated with the maximum dose received. The MED and maximum dose were determined according to the Fitzpatrick skin type of the participants. Therefore, increased serum 25(OH)D levels with an increased number of sessions was an expected result. Our observation is in accordance with the finding described by Ryan et al.14 On the other hand, an in vitro study conducted by Olds et al21 reported that the relationship between UV light and cholecalciferol synthesis was not linear.
We found that increased serum 25(OH)D levels after treatment were not correlated with the decrease in PASI score, similar to studies by Romaní et al18 and Ryan et al.14 These results suggest that the clinical improvement following NB-UVB treatment is independent of the increased serum 25(OH)D levels in psoriasis patients.
Conclusion
In conclusion, we found that the serum 25(OH)D levels that increase as a result of NB-UVB therapy for the treatment of chronic plaque psoriasis has no statistically significant relationship with the age, Fitzpatrick skin type, baseline PASI score, changes in PASI, or maximum dose, while a positive relationship is present between the serum 25(OH)D levels and the number of sessions of NB-UVB.
- Şavk E. Immunology of Photo(chemo)therapy. Turkderm. 2010;44(suppl 2):62-66.
- Ferahbaş A. Phototherapy modalities and protocols. Turkderm. 2010;44(suppl 2):67-72.
- Ibbotson SH, Bilsland D, Cox NH, et al. An update and guidance on narrowband ultraviolet B phototherapy: a British Photodermatology Group Workshop report. Br J Dermatol. 2004;151:283-297.
- Norval M, Björn LO, de Gruijl FR. Is the action spectrum for the UV-induced production of previtamin D3 in human skin correct? Photochem Photobiol Sci. 2010;9:11-17.
- Holick MF. Vitamin D deficiency. N Engl J Med. 2007;357:266-281.
- McKenzie RL, Liley JB, Björn LO. UV radiation: balancing risks and benefits. Photochem Photobiol. 2009;85:88-98.
- Holick MF. High prevalence of vitamin D inadequacy and implications for health. Mayo Clin Proc. 2006;81:353-373.
- May E, Asadullah K, Zügel U. Immunoregulation through 1,25-dihydroxyvitamin D3 and its analogs. Curr Drug Targets Inflamm Allergy. 2004;3:377-393.
- Reichrath J. Vitamin D and the skin: an ancient friend, revisited. Exp Dermatol. 2007;16:618-625.
- Fu LW, Vender R. Systemic role for vitamin D in the treatment of psoriasis and metabolic syndrome. Dermatol Res Pract. 2011;2011:276079.
- Gisondi P, Rossini M, Di Cesare A, et al. Vitamin D status in patients with chronic plaque psoriasis. Br J Dermatol. 2012;166:505-510.
- Orgaz-Molina J, Buendía-Eisman A, Arrabal-Polo MA, et al. Deficiency of serum concentration of 25-hydroxyvitamin D in psoriatic patients: a case-control study. J Am Acad Dermatol. 2012;67:931-938.
- Osmancevic A, Landin-Wilhelmsen K, Larkö O, et al. UVB therapy increases 25 (OH) vitamin D syntheses in postmenopausal women with psoriasis. Photodermatol Photoimmunol Photomed. 2007;23:172-178.
- Ryan C, Moran B, McKenna MJ, et al. The effect of narrowband UV-B treatment for psoriasis on vitamin D status during wintertime in Ireland. Arch Dermatol. 2010;146:836-842.
- Vahavihu K, Ala-Houhala M, Peric M, et al. Narrowband ultraviolet B treatment improves vitamin D balance and alters antimicrobial peptide expression in skin lesions of psoriasis and atopic dermatitis. Br J Dermatol. 2010;163:321-328.
- Lesiak A, Narbutt J, Pawlaczyk M, et al. Vitamin D serum level changes in psoriatic patients treated with narrowband ultraviolet B phototherapy are related to the season of the irradiation. Photodermatol Photoimmunol Photomed. 2011;27:304-310.
- Osmancevic A, Landin-Wilhelmsen K, Larko O, et al.Vitamin D production in psoriasis patients increases less with narrowband than with broadband ultraviolet B phototherapy. Photodermatol Photoimmunol Photomed. 2009;25:119-123.
- Romaní J, Caixàs A, Carrascosa JM, et al. Effect of narrowband ultraviolet B therapy on inflammatory markers and body fat composition in moderate to severe psoriasis. Br J Dermatol. 2012;166:1237-1244.
- Diehl JW, Chiu MW. Effects of ambient sunlight and photoprotection on vitamin D status. Dermatol Ther. 2010;23:48-60.
- Armas LA, Dowell S, Akhter M, et al. Ultraviolet-B radiation increases serum 25-hydroxyvitamin D levels: the effect of UVB dose and skin color. J Am Acad Dermatol. 2007;57:588-593.
- Olds WJ, McKinley AR, Moore MR, et al. In vitro model of vitamin D3 (cholecalciferol) synthesis by UV radiation: dose-response relationships. J Photochem Photobiol B. 2008;93:88-93.
Psoriasis is a chronic, inflammatory, T-cell–mediated skin disease. Phototherapy, which consists of light used at various wavelengths, is a well-established treatment method for psoriasis vulgaris. Although successful results have been obtained with phototherapy in psoriasis, its mechanism of action is not fully understood. UV light has been shown to have an effect on T-lymphocyte function as well as various components of the natural and acquired immune response. It also has a suppressive effect on the immune system caused by many independent effects.1 Phototherapy currently is available using broadband UVB (290–320 nm), narrowband UVB (NB-UVB)(311–313 nm), 308-nm excimer laser, UVA1 (340–400 nm), psoralen plus UVA, and photopheresis.2 Narrowband UVB treatment with light sources that peak at 311 to 313 nm have been used with high efficacy and a low side-effect profile, becoming the standard phototherapy method for chronic plaque-type psoriasis.3
More than 90% of vitamin D synthesis is formed in the skin following UV exposure, and the wavelengths and the solar spectrum that stimulate vitamin D synthesis have been a focus of research.4 7-Dehydrocholesterol (provitamin D3) is first converted to previtamin D3. Although the necessary UV wavelength for previtamin D3 synthesis is 295 to 300 nm, it is known that production stops below 260 nm and above 315 nm.4-6 Previtamin D3 is unstable and is quickly converted to vitamin D3 in the skinand then to the biologically active form of 1,25-dihydroxyvitamin D3 (calcitriol) following hydroxylation in the liver and kidneys. Calcitriol shows its effect by binding to the special nuclear receptor for vitamin D.7 Many tissues including the keratinocytes, dendritic cells, melanocytes, and sebocytes in the skin have been shown to possess the enzymatic mechanism necessary for 1,25-dihydroxyvitamin D3 production. Vitamin D also is known to have paracrine, autocrine, and intracrine effects on immunomodulation, cell proliferation, differentiation, and apoptosis, in addition to its role in calcium metabolism.5-9 Topical vitamin D and its analogues are used effectively and safely in psoriasis treatment with these effects.10 A correlation between low serum vitamin D levels and chronic inflammation severity has been shown in psoriasis patients in some studies.11,12
In this study, we sought to evaluate the effect of NB-UVB on vitamin D status and related metabolic markers in patients with psoriasis.
Methods
This prospective, single-center study included patients living in or around Eskisehir, Turkey, who were 18 years of age or older and had been diagnosed with chronic plaque psoriasis with a psoriasis area and severity index (PASI) score of 5 or higher. Permission was granted by the local ethics committee. Patients provided written informed consent prior to enrollment. Patients were excluded if they were younger than 18 years; were pregnant or breastfeeding; stayed in open environments for more than 2 hours per day during the summer months (May through September); used drugs affecting calcium metabolism in the last 8 weeks (eg, barbiturates, anticonvulsants, corticosteroids, vitamin D supplements, bisphosphonates); used systemic treatment for psoriasis in the last 8 weeks; used phototherapy or sunbathing in the last 8 weeks; used topical vitamin D analogues in the last 4 weeks; or had a history of psoriatic arthritis and other inflammatory disorders, renal disease, known calcium metabolism disorders, granulomatous disorders, thyroid disease, diabetes mellitus, skin cancer, or abnormal photosensitivity and known lack of response or hypersensitivity to phototherapy.
Clinical Evaluation and Laboratory Studies
The participants’ age, gender, Fitzpatrick skin type, disease duration, dairy intake and vitamin supplement levels, hours of sun exposure per week, detailed medical history, and medications were obtained and documented in the medical records.
Serum 25(OH)D levels were measured using high-performance liquid chromatography/mass spectrometry, serum calcium and phosphorus levels using colorimetric analysis, serum alkaline phosphatase (ALP) levels using the enzymatic colorimetric method, and serum parathyroid hormone (PTH) levels using electrochemiluminescence at baseline and after PASI 75 was achieved with treatment. Vitamin D levels were classified in 3 groups: (1) deficient (<20 ng/mL); (2) inadequate (20–30 ng/mL); and (3) adequate (>30 ng/mL). The PASI scores at baseline and posttreatment were calculated by the same dermatologist (S.S.).
Treatment Protocol and Patient Follow-up
Narrowband UVB treatment was started at 70% of the minimal erythema dose (MED). Phototherapy was administered 3 times weekly for 6 months or until PASI 75 response was achieved. An increase of 20% to 30% from the prior dose was made according to the participants’ clinical status at each treatment session, and the dose was stabilized once the maximum dose was achieved according to skin type—up to 2000 mJ/cm2 for Fitzpatrick skin types I and II, 3000 mJ/cm2 for skin types III and IV, and 5000 mJ/cm2 for skin types V and VI. Participants were allowed to use low- and moderate-potency topical corticosteroids and moisturizers containing urea during the course of treatment. The study physician (S.S.) clinically evaluated participants every 4 weeks for 6 months or until PASI 75 was achieved, and the clinical improvement was calculated as the percentage decrease in PASI score.
Statistical Analysis
The Shapiro-Wilk normalcy test was used for the continuous variables in the study. Variables with a normal distribution were analyzed with the paired t test and 1-way analysis of variance test and presented as mean (SD). Variables without a normal distribution were analyzed with the Wilcoxon t test and the Kruskal-Wallis test and presented as the median and 25th and 75th quartiles. The serum 25(OH)D levels were evaluated according to the seasons with the Kruskal-Wallis test. Categorical variables were expressed as frequency and percentages. The Pearson and Spearman correlation analysis and regression analysis were used to show the relationship between the variables (ie, age, Fitzpatrick skin type, PASI score, maximum NB-UVB dose, and number of sessions). The statistical significance level was set at P≤.05. Statistical analyses were performed using SPSS software version 21.
Results
A total of 49 participants (30 [61.22%] males; 19 [38.78%] females) were included in the study. The mean age (SD) was 40.27 (14.62) years (range, 19–74 years). Three (6.12%) participants were Fitzpatrick skin type I, 15 (30.61%) were skin type II, and 31 (63.27%) were skin type III.
The baseline median PASI score for the 49 participants was 10.20 (7.85–13.65). Baseline serum 25(OH)D levels were noted to be deficient in 40 participants (81.63%) and inadequate in 9 participants (18.37%). The distribution of the serum 25(OH)D levels of the participants according to the season was evaluated with the Kruskal-Wallis test and no association was found between serum 25(OH)D levels and seasonal changes (P=.685). Comparison of 25(OH)D basal values with Fitzpatrick skin type revealed a statistically significant relationship between skin type and vitamin D level (P=.024). The basal serum 25(OH)D levels were significantly lower in Fitzpatrick skin type II versus skin type I (P=.039).
Thirty-two (65.31%) participants achieved PASI 75 by the end of treatment. The baseline median PASI score (25th-75th quartiles) for the 32 patients was 10.45 (8.20-13.83) and the posttreatment PASI score was 1.95 (1.20-3.55), a statistically significant decrease following treatment (P<.001)(Table 1). Mean (SD) baseline serum 25(OH)D levels were 14.14 (6.70) ng/mL and posttreatment levels were 46.42 (15.51) ng/mL in these participants, which demonstrated a statistically significant increase during NB-UVB treatment (P<.001). None of the participants reached the toxicity levels (>80 ng/mL) for serum 25(OH)D. There were no significant changes in serum calcium or phosphorus levels posttreatment (Table 1), but statistically significant decreases in serum ALP and PTH levels were noted (P=.001 and P=.019, respectively)(Table 1).
Participants who completed the study (n=32) received an average (SD) of 30.09 (7.53) sessions of NB-UVB treatment and the mean (SD) MED was 611.88 (240.14) mJ/cm2. The mean (SD) maximum dose was 2090.09 (341.78) mJ/cm2 (Table 2).
Posttreatment serum 25(OH)D levels were compared with the number of NB-UVB phototherapy sessions and the maximum dose values. We found that the posttreatment serum 25(OH)D levels correlated with the number of sessions (P=.031) but not with the maximum dose (P=.498).
Using regression analysis, we also evaluated the effect of the increase in vitamin D levels—posttreatment serum 25(OH)D level minus baseline serum 25(OH)D levels—on the decrease in PASI scores—baseline PASI score minus posttreatment PASI score—and found no effect of serum 25(OH)D level increase on PASI decrease (P=.530). There was no correlation between increased serum 25(OH)D levels and age, Fitzpatrick skin type, or baseline PASI score.
Comment
The most effective UV wavelength for vitamin D synthesis is 295 to 300 nm, and therefore broadband UVB is frequently studied when determining the relationship between phototherapy and serum vitamin D levels.4 The current study demonstrated a statistically significant increase in serum 25(OH)D levels following NB-UVB treatment in patients with moderate to severe chronic plaque psoriasis (P<.001). This result supports other studies reporting that NB-UVB treatment in psoriasis patients increases serum 25(OH)D levels.13-18
The main factor in the effective UVB level for vitamin D synthesis is the angle at which solar radiation reaches the earth, which is affected by the longitude, latitude, and time of day.19 For this reason, we planned to perform our study at a single center. Patients who stayed in open areas for more than 2 hours per day during the summer months (May through September) were excluded from the study to decrease the effect of seasonal changes on vitamin D levels. We evaluated the seasonal variation of vitamin D levels and found no relationship between seasonal changes and serum 25(OH)D levels. Therefore, the potential effect of seasonal changes on the vitamin D levels of study participants was excluded from the study.
The response to UV radiation changes according to age and Fitzpatrick skin type because 7-dehydrocholesterol levels decrease with age and melanin prevents the access of UVB photons to 7-dehydrocholesterol.20 The basal serum 25(OH)D levels were deficient in 81.63% of participants and inadequate in 18.37%. In this study, we also observed that the basal serum 25(OH)D levels were significantly lower in patients with Fitzpatrick skin type II than in Fitzpatrick skin type I (P=.039). The mean (SD) serum 25(OH)D level at baseline was 14.14 (6.70) ng/mL and posttreatment was 46.42 (15.51) ng/mL in the 32 patients who completed the study. Serum 25(OH)D levels showed a statistically significant increase after NB-UVB treatment (P<.001). The increased serum 25(OH)D levels after NB-UVB phototherapy were not associated with Fitzpatrick skin type, which was consistent with the results of Osmancevic et al.17 The adjusted NB-UVB doses according to the different skin types might be responsible for this result in our study.
Participant age did not have a significant effect on serum 25(OH)D levels, similar to other studies in the literature.13,17 We believe that artificial UVB radiation at high doses can compensate for the 7-dehydrocholesterol that decreases in the skin with aging.
We observed no significant change in the serum calcium and phosphorus levels with NB-UVB treatment in our study. None of the participants had a metabolic disorder related to increased 25(OH)D levels. The serum ALP and PTH levels decreased significantly following treatment (P=.001 and P=.019, respectively), which may have been secondary to increased serum 25(OH)D levels.
Posttreatment serum 25(OH)D levels were compared with the number of NB-UVB phototherapy sessions and maximum dose values. The posttreatment serum 25(OH)D levels were found to be related to the number of sessions received, but this value was not correlated with the maximum dose received. The MED and maximum dose were determined according to the Fitzpatrick skin type of the participants. Therefore, increased serum 25(OH)D levels with an increased number of sessions was an expected result. Our observation is in accordance with the finding described by Ryan et al.14 On the other hand, an in vitro study conducted by Olds et al21 reported that the relationship between UV light and cholecalciferol synthesis was not linear.
We found that increased serum 25(OH)D levels after treatment were not correlated with the decrease in PASI score, similar to studies by Romaní et al18 and Ryan et al.14 These results suggest that the clinical improvement following NB-UVB treatment is independent of the increased serum 25(OH)D levels in psoriasis patients.
Conclusion
In conclusion, we found that the serum 25(OH)D levels that increase as a result of NB-UVB therapy for the treatment of chronic plaque psoriasis has no statistically significant relationship with the age, Fitzpatrick skin type, baseline PASI score, changes in PASI, or maximum dose, while a positive relationship is present between the serum 25(OH)D levels and the number of sessions of NB-UVB.
- Şavk E. Immunology of Photo(chemo)therapy. Turkderm. 2010;44(suppl 2):62-66.
- Ferahbaş A. Phototherapy modalities and protocols. Turkderm. 2010;44(suppl 2):67-72.
- Ibbotson SH, Bilsland D, Cox NH, et al. An update and guidance on narrowband ultraviolet B phototherapy: a British Photodermatology Group Workshop report. Br J Dermatol. 2004;151:283-297.
- Norval M, Björn LO, de Gruijl FR. Is the action spectrum for the UV-induced production of previtamin D3 in human skin correct? Photochem Photobiol Sci. 2010;9:11-17.
- Holick MF. Vitamin D deficiency. N Engl J Med. 2007;357:266-281.
- McKenzie RL, Liley JB, Björn LO. UV radiation: balancing risks and benefits. Photochem Photobiol. 2009;85:88-98.
- Holick MF. High prevalence of vitamin D inadequacy and implications for health. Mayo Clin Proc. 2006;81:353-373.
- May E, Asadullah K, Zügel U. Immunoregulation through 1,25-dihydroxyvitamin D3 and its analogs. Curr Drug Targets Inflamm Allergy. 2004;3:377-393.
- Reichrath J. Vitamin D and the skin: an ancient friend, revisited. Exp Dermatol. 2007;16:618-625.
- Fu LW, Vender R. Systemic role for vitamin D in the treatment of psoriasis and metabolic syndrome. Dermatol Res Pract. 2011;2011:276079.
- Gisondi P, Rossini M, Di Cesare A, et al. Vitamin D status in patients with chronic plaque psoriasis. Br J Dermatol. 2012;166:505-510.
- Orgaz-Molina J, Buendía-Eisman A, Arrabal-Polo MA, et al. Deficiency of serum concentration of 25-hydroxyvitamin D in psoriatic patients: a case-control study. J Am Acad Dermatol. 2012;67:931-938.
- Osmancevic A, Landin-Wilhelmsen K, Larkö O, et al. UVB therapy increases 25 (OH) vitamin D syntheses in postmenopausal women with psoriasis. Photodermatol Photoimmunol Photomed. 2007;23:172-178.
- Ryan C, Moran B, McKenna MJ, et al. The effect of narrowband UV-B treatment for psoriasis on vitamin D status during wintertime in Ireland. Arch Dermatol. 2010;146:836-842.
- Vahavihu K, Ala-Houhala M, Peric M, et al. Narrowband ultraviolet B treatment improves vitamin D balance and alters antimicrobial peptide expression in skin lesions of psoriasis and atopic dermatitis. Br J Dermatol. 2010;163:321-328.
- Lesiak A, Narbutt J, Pawlaczyk M, et al. Vitamin D serum level changes in psoriatic patients treated with narrowband ultraviolet B phototherapy are related to the season of the irradiation. Photodermatol Photoimmunol Photomed. 2011;27:304-310.
- Osmancevic A, Landin-Wilhelmsen K, Larko O, et al.Vitamin D production in psoriasis patients increases less with narrowband than with broadband ultraviolet B phototherapy. Photodermatol Photoimmunol Photomed. 2009;25:119-123.
- Romaní J, Caixàs A, Carrascosa JM, et al. Effect of narrowband ultraviolet B therapy on inflammatory markers and body fat composition in moderate to severe psoriasis. Br J Dermatol. 2012;166:1237-1244.
- Diehl JW, Chiu MW. Effects of ambient sunlight and photoprotection on vitamin D status. Dermatol Ther. 2010;23:48-60.
- Armas LA, Dowell S, Akhter M, et al. Ultraviolet-B radiation increases serum 25-hydroxyvitamin D levels: the effect of UVB dose and skin color. J Am Acad Dermatol. 2007;57:588-593.
- Olds WJ, McKinley AR, Moore MR, et al. In vitro model of vitamin D3 (cholecalciferol) synthesis by UV radiation: dose-response relationships. J Photochem Photobiol B. 2008;93:88-93.
Practice Points
- The 25-hydroxyvitamin D (25[OH]D) levels are increased by narrowband UVB (NB-UVB) treatment in psoriasis patients.
- The number of sessions of NB-UVB is associated with increased 25(OH)D levels.

Prognostic value of Braden Activity subscale for mobility status in hospitalized older adults
In-hospital mobility (walking and transferring) is an important modifiable factor for posthospital functional outcomes and mortality among older adults.1-4 In fact, daily mobility assessment has been considered for a standard clinical evaluation of the hospitalized older adult.5,6 This would provide a ready source for targeting patients at risk for mobility impairment and identifying strategies to prevent in-hospital mobility limitation and posthospital functional decline. Despite their potential importance, mobility assessment tools have not been readily adopted in the hospital setting.
There are various ways to assess mobility in hospital settings. Mobility tracking technology (radar and accelerometers) has demonstrated older adults have extremely low mobility during hospitalization. Although these objective methods provide an unbiased way to monitor physical activity level and track in-hospital mobility change,6-8 and have provided important information about mobility in the hospital, they are largely impractical in real-world settings.
While mobility technology appears to be advancing, there is a potential to assess in-hospital mobility using commonly administered and inexpensive tools. Many hospitals ask staff to regularly rate physical function (Braden and Morse score) as part of their standard-of-care procedures. The rating scales used have the potential to provide valuable information about mobility variations without using special equipment or burdening patients. The Braden Scale for Predicting Pressure Sore Risk is a good example of a validated assessment instrument that is better than nurses’ judgment, which is often confounded by nursing experience.9 This scale, which has 6 subscales (Sensory Perception, Moisture, Activity, Mobility, Nutrition, Friction and Shear), has shown high sensitivity in detecting patient condition changes in the clinical setting.10 The scale typically is used holistically to evaluate pressure ulcer risk, but the Activity subscale, which assesses mobility, could serve as a useful tool for predicting posthospital recovery and identifying needs for posthospital mobility interventions.
We conducted a study to evaluate the prognostic value of using the Braden Activity subscale (BAS) to identify in-hospital incident mobility impairment and recovery for predicting mortality and discharge status among hospitalized older adults.
METHODS
The University of Florida Gainesville Health Science Center Institutional Review Board reviewed and approved the study protocol as exempt from human subjects’ research.
Design and Setting
The design followed a retrospective cohort study in which hospitalized patients were evaluated at admission (baseline) and assessed throughout their stay for incident mobility impairment and recovery. Data were collected in older adults (≥65 years old) hospitalized at UF Health Shands Hospital (University of Florida), an 852-bed level I trauma center in Gainesville, Florida.
Data Sources
Patient data from electronic medical records were warehoused in an integrated data repository (IDR) between January 1, 2009 and April 20, 2014. The IDR aggregates clinical and administrative system data, which can subsequently be used for research. The data were compiled in a de-identified longitudinal dataset that included demographics, Charlson Comorbidity Index,11 hospital length of stay, BAS scores (at admission, during hospitalization, at discharge), discharge disposition (including in-hospital death), and mortality after hospitalization (from the national Social Security Death Index).
Patients
The study population consisted of 19,769 older adults (≥65 years old) hospitalized between January 1, 2009 and April 20, 2014.
Outcomes
The major outcomes were patients’ primary discharge disposition and posthospital mortality over 4.5-year follow-up. Discharge dispositions were divided into 9 categories: expired in hospital, other hospital admission, home, home care, hospice, rehabilitation, skilled nursing home, healthcare facility, or other, which included psychiatric facilities, court, or law enforcement.
Predictors
The BAS was used to identify incident mobility impairment and incident mobility recovery during hospitalization and subsequently was used to predict discharge disposition and mortality. The Braden scale,12 which is commonly administered to predict pressure sores, has 6 subscales: Sensory Perception, Moisture, Activity, Mobility, Nutrition, and Friction and Shear. Each subscale has a score of 1 to 4, with higher scores representing higher activity levels. In particular, the BAS measures the mobility (walking and transferring) level of the hospitalized patient with a score of 1 (“patient is confined to bed”), 2 (“severely limited or nonexistent ability to walk; patient cannot bear his own weight and/or must be assisted into chair or wheelchair”), 3 (“patient walks occasionally during the day, but for very short distances, with or without assistance; he spends majority of each shift in bed or chair”), or 4 (“patient walks outside the room at least twice a day and inside the room at least once every 2 hours during waking hours”). The BAS is correlated with the total Braden scale10 and has shown excellent interrater reliability (interclass correlation coefficient, 0.96) among hospital staff.13 Analysis of the current dataset revealed excellent rater agreement across 3 working shifts (κ = 0.76 for first day of hospitalization in those hospitalized <3 days; κ = 0.70 for first day in those hospitalized ≥3 days).
UF Health Shands Hospital nursing staff administered the BAS at each shift change during a hospital stay (~3 times/d). Mobility scores were averaged across an entire day to reduce potential interrater variation. A daily average BAS score cutpoint was chosen to capture an absorbing mobility state. Average BAS score ≥3 was selected, as it indicates a patient is mobile most of the day, whereas average BAS score <3 indicates significant mobility impairment most of the day. The average daily score was calculated with a minimum of 3 determinations per day. Incident mobility impairment was defined as first transition from “being able to walk occasionally or twice a day outside or at least once every 2 hours during waking hours” to “severely limited or nonexistent ability to walk or confined to bed.” Numerically speaking, daily average BAS score transition from ≥3 at admission to <3 during hospitalization constituted a mobility impairment event. Incident mobility recovery was evaluated in those patient hospital observations that were “severely limited or nonexistent ability to walk or confined to bed” at admission. Incident mobility recovery was defined as first transition to “ability to walk occasionally or twice a day outside or at least once every 2 hours during waking hours.” A mobility recovery event was operationally defined as daily average BAS score transition from <3 at admission to daily average of ≥3 during hospitalization.
Data Analysis

RESULTS
Table 1 lists the baseline characteristics of the hospitalized patients: 10,717 (54%) with normal mobility at admission and 9052 (46%) admitted with impaired mobility. Compared with patients admitted with normal mobility, those with impaired mobility at admission were older, mean (SD) 75.73 (7.84) years versus 73.73 (7.00) years; spent more days in the hospital, median 5 days versus 3 days; and had a higher Charlson Comorbidity Index, mean (SD) 2.59 (2.34) versus 2.22 (2.31). Patients with impaired mobility at admission had a significantly higher prevalence of myocardial infarction, congestive heart failure, peripheral vascular disease, cerebrovascular disease, dementia, and diabetes. However, cancer was significantly more prevalent among patients admitted with normal mobility compared with those admitted with impaired mobility.

Of the 10,717 patients with normal mobility at admission, 2218 (20.7%) had incident mobility impairment over a median follow-up of 3 days (interquartile range, 2-5 days). Of the 9052 patients admitted with impaired mobility, 4734 (52.3%) recovered from their impairment over a median follow-up of 5 days (interquartile range, 3-9 days).
 between patients with and without incident mobility impairment during hospitalization and (B) between patients with and without incident mobility recovery during hospitalization.")
The Kaplan-Meier curves in Figure 1 show survival probability between patients who did and did not develop incident mobility impairment during hospitalization, as well as between patients who did and did not recover incident mobility. Table 2 lists the odds ratios (ORs) and restricted mean survival times for patients who developed impairment and patients who recovered. The results are provided for the entire follow-up period and for before and after 6 months of follow-up. Older adults who became mobility impaired in the hospital had an odds of death higher than that of those who remained mobile (OR, 1.23; 95% confidence interval [CI], 1.08-1.39). This effect predominately occurred within the first 6 follow-up months (OR, 1.67; 95% CI, 1.40-1.96). Older adults who recovered from mobility impairment had an odds of death lower than that of those who did not recover mobility in the hospital (OR, 0.54; 95% CI, 0.49-0.59). This effect was slightly stronger within the first 6 months after hospitalization but remained significant after 6 months. Figure 2 shows the percentages of different discharge dispositions for mobility impairment and recovery. Older adults with mobility impairment were more likely to die in the hospital or to be discharged to hospice. Otherwise, patients who recovered their mobility during hospitalization were more likely to be discharged home and to home care.
 incident mobility impairment and (B) incident mobility recovery during hospitalization.")
DISCUSSION
In this study, we evaluated the predictive value of the BAS in assessing incident mobility impairment and recovery during hospitalization among older adults. Patients admitted with impaired mobility were older, spent more days in the hospital, and had more comorbidities than those admitted with normal mobility. Compared with older adults who did not develop incident mobility impairment during hospitalization, those who became mobility impaired had a higher posthospital mortality risk and a higher prevalence of in-hospital death and hospice discharge. In addition, compared with older adults who did not recover mobility in the hospital, those who recovered mobility had a lower posthospital mortality risk and a higher prevalence of home discharge. It is interesting that incident in the hospital appears to have a finite effect. The association was largely erased 6 months after discharge. This was also observed in patients who recovered their mobility in the hospital, but to a lesser extent. Overall, the results suggest that developing mobility impairment or recovering from mobility impairment in the hospital is an important predictor of discharge status and posthospital mortality.
The large number of patient observations and repeated evaluation of in-hospital mobility made this analysis possible. To our knowledge, this is the first large-scale study to evaluate the predictive value of the BAS in assessing mobility impairment and recovery during hospitalization among older adults. Such a test provides a simple and efficient assessment of in-hospital mobility changes that are sensitive to discharge locations and posthospital mortality risk.
Poor mobility in the hospital is associated with higher posthospital mortality. Kasotakis et al.18 evaluated the predictive value of a nursing staff–assessed clinical mobility score for surgical critically ill patients whose functional mobility was unimpaired on presentation. The Surgical Intensive Care Unit Optimal Mobility Score has been shown to be a reliable and valid tool for predicting mortality in a relatively young population (average age, 60 years). Using accelerometer technology with older adults, Ostir et al.7 found that each 100-step increase was associated with 2% and 3% lower risk of death over 2 years in the first and last 24 hours of hospitalization, respectively. The present mortality results show that mobility patterns in the hospital are crucially important for patients’ health the first 6 months after discharge. This finding suggests that developing mobility impairment in the hospital is a sign for significant and rapid health decline. It also suggests that interventions need to be started relatively early in order to reduce the risk of death. In contrast, patients who recover mobility in the hospital obtain a substantial mortality risk reduction. In-hospital interventions to enhance mobility recovery and prevent mobility impairment could have a large impact on posthospital adverse events, particularly for older patients, who are susceptible to disease complications.
Regarding discharge disposition, Sommerfeld and von Arbin19 found that the ability to rise from a chair (a component of mobility) during hospitalization was a strong predictor of early discharge home. Similarly, Vochteloo et al.20 found that limited mobility as assessed with a questionnaire was associated with discharge to a location other than home among patients with hip fracture. We utilized existing information, collected at a relatively high resolution (3 times per day) that is often readily available without added patient burden. This is particularly important in the hospital setting, where added assessments in frail older adults and in those with multimorbid conditions is challenging. Although our approach is appealing, we should note that BAS scores were modified to reduce interrater variation and capture more absorbing mobility states over a hospitalized day, and that a similar approach would be required to replicate these results and provide clinical value to the BAS as a prognostic indicator of posthospital mortality.
Despite the strengths of this study, it had notable limitations. Pooling BAS scores could have modified the interpretation and clinical implications of the results. Although we had a large number of patient observations, this retrospective analysis may have had biases that were not completely considered. In addition, the results of this single-center study cannot be generalized across all hospital systems. The Braden activity sub score has demonstrated good validity and reliability for activity changes13, but this measure was not objectively ascertained as demonstrated by others using accelerometers6-7. Moreover, the medical records used did not provide prehospital patient mobility status, limiting adjustments for prehospital mobility function. Despite these limitations, this study represents an important initial step in validating a simple and efficient clinical tool for identifying in-hospital mobility impairment and recovery and predicting posthospital adverse outcomes.
BAS assessment of incident mobility impairment and recovery in the hospital setting has prognostic value in predicting discharge disposition, in-hospital death, and posthospital mortality risk. That the majority of the effect appears to occur within the first 6 months after discharge suggests that interventions to improve mobility should be started during hospitalization or expeditiously after discharge. Overall, this study’s results showed that a simple and efficient mobility status assessment can become a valuable clinical and administrative tool for targeting and improving mobility in the hospital and after discharge in older adults.
Acknowledgments
This work was supported by the National Institutes of Health and the National Center for Advancing Translational Sciences (NIH/NCATS) Clinical and Translational Science Award to the University of Florida (UL1 TR000064) and by the University of Florida’s Claude D. Pepper Center (P30AG028740-R6, significant contributions from the Data and Applied Science Core and Biostatistical Core).
Disclosure
Nothing to report.
1. Zisberg A, Shadmi E, Gur-Yaish N, Tonkikh O, Sinoff G. Hospital-associated functional decline: the role of hospitalization processes beyond individual risk factors. J Am Geriatr Soc. 2015;63(1):55-62. PubMed
2. Covinsky KE, Palmer RM, Fortinsky RH, et al. Loss of independence in activities of daily living in older adults hospitalized with medical illnesses: increased vulnerability with age. J Am Geriatr Soc. 2003;51(4):451-458. PubMed
3. Hirsch CH, Sommers L, Olsen A, Mullen L, Winograd CH. The natural history of functional morbidity in hospitalized older patients. J Am Geriatr Soc. 1990;38(12):1296-1303. PubMed
4. Inouye SK, Peduzzi PN, Robison JT, Hughes JS, Horwitz RI, Concato J. Importance of functional measures in predicting mortality among older hospitalized patients. JAMA. 1998;279(15):1187-1193. PubMed
5. Zisberg A, Shadmi E, Sinoff G, Gur-Yaish N, Srulovici E, Admi H. Low mobility during hospitalization and functional decline in older adults. J Am Geriatr Soc. 2011;59(2):266-273. PubMed
6. Brown CJ, Redden DT, Flood KL, Allman RM. The underrecognized epidemic of low mobility during hospitalization of older adults. J Am Geriatr Soc. 2009;57(9):1660-1665. PubMed
7. Ostir GV, Berges IM, Kuo YF, Goodwin JS, Fisher SR, Guralnik JM. Mobility activity and its value as a prognostic indicator of survival in hospitalized older adults. J Am Geriatr Soc. 2013;61(4):551-557. PubMed
8. Fisher SR, Graham JE, Brown CJ, et al. Factors that differentiate level of ambulation in hospitalised older adults. Age Ageing. 2012;41(1):107-111. PubMed
9. Pancorbo-Hidalgo PL, Garcia-Fernandez FP, Lopez-Medina IM, Alvarez-Nieto C. Risk assessment scales for pressure ulcer prevention: a systematic review. J Adv Nurs. 2006;54(1):94-110. PubMed
10. Sardo P, Simões C, Alvarelhão J, et al. Pressure ulcer risk assessment: retrospective analysis of Braden scale scores in Portuguese hospitalised adult patients. J Clin Nurs. 2015;24(21-22):3165-3176. PubMed
11. Charlson ME, Pompei P, Ales KL, MacKenzie CR. A new method of classifying prognostic comorbidity in longitudinal studies: development and validation. J Chronic Dis. 1987;40(5):373-383. PubMed
12. Bergstrom N, Braden BJ, Laguzza A, Holman V. The Braden Scale for Predicting Pressure Sore Risk. Nurs Res. 1987;36(4):205-210. PubMed
13. Wang LH, Chen HL, Yan HY, et al. Inter-rater reliability of three most commonly used pressure ulcer risk assessment scales in clinical practice. Int Wound J. 2015;12(5):590-594. PubMed
14. Royston, Parmar MK. The use of restricted mean survival time to estimate the treatment effect in randomized clinical trials when the proportional hazards assumption is in doubt. Stat Med. 2011;30(19):2409-2421. PubMed
15. Royston P, Parmar MK. Restricted mean survival time: an alternative to the hazard ratio for the design and analysis of randomized trials with a time-to-event outcome. BMC Med Res Methodol. 2013;13:152. PubMed
16. Zhao L, Claggett B, Tian L, et al. On the restricted mean survival time curve in survival analysis. Biometrics. 2016;72(1):215-221. PubMed
17. R Core Team. R: A Language and Environment for Statistical Computing. Vienna, Austria: R Foundation for Statistical Computing; 2014. http://www.R-project.org. Published 2014. Accessed April 25, 2017.
18. Kasotakis G, Schmidt U, Perry D, et al. The Surgical Intensive Care Unit Optimal Mobility Score predicts mortality and length of stay. Crit Care Med. 2012;40(4):1122-1128. PubMed
19. Sommerfeld DK, von Arbin MH. Disability test 10 days after acute stroke to predict early discharge home in patients 65 years and older. Clin Rehabil. 2001;15(5):528-534. PubMed
20. Vochteloo AJ, Tuinebreijer WE, Maier AB, Nelissen RG, Bloem RM, Pilot P. Predicting discharge location of hip fracture patients; the new discharge of hip fracture patients score. Int Orthop. 2012;36(8):1709-1714. PubMed
In-hospital mobility (walking and transferring) is an important modifiable factor for posthospital functional outcomes and mortality among older adults.1-4 In fact, daily mobility assessment has been considered for a standard clinical evaluation of the hospitalized older adult.5,6 This would provide a ready source for targeting patients at risk for mobility impairment and identifying strategies to prevent in-hospital mobility limitation and posthospital functional decline. Despite their potential importance, mobility assessment tools have not been readily adopted in the hospital setting.
There are various ways to assess mobility in hospital settings. Mobility tracking technology (radar and accelerometers) has demonstrated older adults have extremely low mobility during hospitalization. Although these objective methods provide an unbiased way to monitor physical activity level and track in-hospital mobility change,6-8 and have provided important information about mobility in the hospital, they are largely impractical in real-world settings.
While mobility technology appears to be advancing, there is a potential to assess in-hospital mobility using commonly administered and inexpensive tools. Many hospitals ask staff to regularly rate physical function (Braden and Morse score) as part of their standard-of-care procedures. The rating scales used have the potential to provide valuable information about mobility variations without using special equipment or burdening patients. The Braden Scale for Predicting Pressure Sore Risk is a good example of a validated assessment instrument that is better than nurses’ judgment, which is often confounded by nursing experience.9 This scale, which has 6 subscales (Sensory Perception, Moisture, Activity, Mobility, Nutrition, Friction and Shear), has shown high sensitivity in detecting patient condition changes in the clinical setting.10 The scale typically is used holistically to evaluate pressure ulcer risk, but the Activity subscale, which assesses mobility, could serve as a useful tool for predicting posthospital recovery and identifying needs for posthospital mobility interventions.
We conducted a study to evaluate the prognostic value of using the Braden Activity subscale (BAS) to identify in-hospital incident mobility impairment and recovery for predicting mortality and discharge status among hospitalized older adults.
METHODS
The University of Florida Gainesville Health Science Center Institutional Review Board reviewed and approved the study protocol as exempt from human subjects’ research.
Design and Setting
The design followed a retrospective cohort study in which hospitalized patients were evaluated at admission (baseline) and assessed throughout their stay for incident mobility impairment and recovery. Data were collected in older adults (≥65 years old) hospitalized at UF Health Shands Hospital (University of Florida), an 852-bed level I trauma center in Gainesville, Florida.
Data Sources
Patient data from electronic medical records were warehoused in an integrated data repository (IDR) between January 1, 2009 and April 20, 2014. The IDR aggregates clinical and administrative system data, which can subsequently be used for research. The data were compiled in a de-identified longitudinal dataset that included demographics, Charlson Comorbidity Index,11 hospital length of stay, BAS scores (at admission, during hospitalization, at discharge), discharge disposition (including in-hospital death), and mortality after hospitalization (from the national Social Security Death Index).
Patients
The study population consisted of 19,769 older adults (≥65 years old) hospitalized between January 1, 2009 and April 20, 2014.
Outcomes
The major outcomes were patients’ primary discharge disposition and posthospital mortality over 4.5-year follow-up. Discharge dispositions were divided into 9 categories: expired in hospital, other hospital admission, home, home care, hospice, rehabilitation, skilled nursing home, healthcare facility, or other, which included psychiatric facilities, court, or law enforcement.
Predictors
The BAS was used to identify incident mobility impairment and incident mobility recovery during hospitalization and subsequently was used to predict discharge disposition and mortality. The Braden scale,12 which is commonly administered to predict pressure sores, has 6 subscales: Sensory Perception, Moisture, Activity, Mobility, Nutrition, and Friction and Shear. Each subscale has a score of 1 to 4, with higher scores representing higher activity levels. In particular, the BAS measures the mobility (walking and transferring) level of the hospitalized patient with a score of 1 (“patient is confined to bed”), 2 (“severely limited or nonexistent ability to walk; patient cannot bear his own weight and/or must be assisted into chair or wheelchair”), 3 (“patient walks occasionally during the day, but for very short distances, with or without assistance; he spends majority of each shift in bed or chair”), or 4 (“patient walks outside the room at least twice a day and inside the room at least once every 2 hours during waking hours”). The BAS is correlated with the total Braden scale10 and has shown excellent interrater reliability (interclass correlation coefficient, 0.96) among hospital staff.13 Analysis of the current dataset revealed excellent rater agreement across 3 working shifts (κ = 0.76 for first day of hospitalization in those hospitalized <3 days; κ = 0.70 for first day in those hospitalized ≥3 days).
UF Health Shands Hospital nursing staff administered the BAS at each shift change during a hospital stay (~3 times/d). Mobility scores were averaged across an entire day to reduce potential interrater variation. A daily average BAS score cutpoint was chosen to capture an absorbing mobility state. Average BAS score ≥3 was selected, as it indicates a patient is mobile most of the day, whereas average BAS score <3 indicates significant mobility impairment most of the day. The average daily score was calculated with a minimum of 3 determinations per day. Incident mobility impairment was defined as first transition from “being able to walk occasionally or twice a day outside or at least once every 2 hours during waking hours” to “severely limited or nonexistent ability to walk or confined to bed.” Numerically speaking, daily average BAS score transition from ≥3 at admission to <3 during hospitalization constituted a mobility impairment event. Incident mobility recovery was evaluated in those patient hospital observations that were “severely limited or nonexistent ability to walk or confined to bed” at admission. Incident mobility recovery was defined as first transition to “ability to walk occasionally or twice a day outside or at least once every 2 hours during waking hours.” A mobility recovery event was operationally defined as daily average BAS score transition from <3 at admission to daily average of ≥3 during hospitalization.
Data Analysis
RESULTS
Table 1 lists the baseline characteristics of the hospitalized patients: 10,717 (54%) with normal mobility at admission and 9052 (46%) admitted with impaired mobility. Compared with patients admitted with normal mobility, those with impaired mobility at admission were older, mean (SD) 75.73 (7.84) years versus 73.73 (7.00) years; spent more days in the hospital, median 5 days versus 3 days; and had a higher Charlson Comorbidity Index, mean (SD) 2.59 (2.34) versus 2.22 (2.31). Patients with impaired mobility at admission had a significantly higher prevalence of myocardial infarction, congestive heart failure, peripheral vascular disease, cerebrovascular disease, dementia, and diabetes. However, cancer was significantly more prevalent among patients admitted with normal mobility compared with those admitted with impaired mobility.
Of the 10,717 patients with normal mobility at admission, 2218 (20.7%) had incident mobility impairment over a median follow-up of 3 days (interquartile range, 2-5 days). Of the 9052 patients admitted with impaired mobility, 4734 (52.3%) recovered from their impairment over a median follow-up of 5 days (interquartile range, 3-9 days).
The Kaplan-Meier curves in Figure 1 show survival probability between patients who did and did not develop incident mobility impairment during hospitalization, as well as between patients who did and did not recover incident mobility. Table 2 lists the odds ratios (ORs) and restricted mean survival times for patients who developed impairment and patients who recovered. The results are provided for the entire follow-up period and for before and after 6 months of follow-up. Older adults who became mobility impaired in the hospital had an odds of death higher than that of those who remained mobile (OR, 1.23; 95% confidence interval [CI], 1.08-1.39). This effect predominately occurred within the first 6 follow-up months (OR, 1.67; 95% CI, 1.40-1.96). Older adults who recovered from mobility impairment had an odds of death lower than that of those who did not recover mobility in the hospital (OR, 0.54; 95% CI, 0.49-0.59). This effect was slightly stronger within the first 6 months after hospitalization but remained significant after 6 months. Figure 2 shows the percentages of different discharge dispositions for mobility impairment and recovery. Older adults with mobility impairment were more likely to die in the hospital or to be discharged to hospice. Otherwise, patients who recovered their mobility during hospitalization were more likely to be discharged home and to home care.
DISCUSSION
In this study, we evaluated the predictive value of the BAS in assessing incident mobility impairment and recovery during hospitalization among older adults. Patients admitted with impaired mobility were older, spent more days in the hospital, and had more comorbidities than those admitted with normal mobility. Compared with older adults who did not develop incident mobility impairment during hospitalization, those who became mobility impaired had a higher posthospital mortality risk and a higher prevalence of in-hospital death and hospice discharge. In addition, compared with older adults who did not recover mobility in the hospital, those who recovered mobility had a lower posthospital mortality risk and a higher prevalence of home discharge. It is interesting that incident in the hospital appears to have a finite effect. The association was largely erased 6 months after discharge. This was also observed in patients who recovered their mobility in the hospital, but to a lesser extent. Overall, the results suggest that developing mobility impairment or recovering from mobility impairment in the hospital is an important predictor of discharge status and posthospital mortality.
The large number of patient observations and repeated evaluation of in-hospital mobility made this analysis possible. To our knowledge, this is the first large-scale study to evaluate the predictive value of the BAS in assessing mobility impairment and recovery during hospitalization among older adults. Such a test provides a simple and efficient assessment of in-hospital mobility changes that are sensitive to discharge locations and posthospital mortality risk.
Poor mobility in the hospital is associated with higher posthospital mortality. Kasotakis et al.18 evaluated the predictive value of a nursing staff–assessed clinical mobility score for surgical critically ill patients whose functional mobility was unimpaired on presentation. The Surgical Intensive Care Unit Optimal Mobility Score has been shown to be a reliable and valid tool for predicting mortality in a relatively young population (average age, 60 years). Using accelerometer technology with older adults, Ostir et al.7 found that each 100-step increase was associated with 2% and 3% lower risk of death over 2 years in the first and last 24 hours of hospitalization, respectively. The present mortality results show that mobility patterns in the hospital are crucially important for patients’ health the first 6 months after discharge. This finding suggests that developing mobility impairment in the hospital is a sign for significant and rapid health decline. It also suggests that interventions need to be started relatively early in order to reduce the risk of death. In contrast, patients who recover mobility in the hospital obtain a substantial mortality risk reduction. In-hospital interventions to enhance mobility recovery and prevent mobility impairment could have a large impact on posthospital adverse events, particularly for older patients, who are susceptible to disease complications.
Regarding discharge disposition, Sommerfeld and von Arbin19 found that the ability to rise from a chair (a component of mobility) during hospitalization was a strong predictor of early discharge home. Similarly, Vochteloo et al.20 found that limited mobility as assessed with a questionnaire was associated with discharge to a location other than home among patients with hip fracture. We utilized existing information, collected at a relatively high resolution (3 times per day) that is often readily available without added patient burden. This is particularly important in the hospital setting, where added assessments in frail older adults and in those with multimorbid conditions is challenging. Although our approach is appealing, we should note that BAS scores were modified to reduce interrater variation and capture more absorbing mobility states over a hospitalized day, and that a similar approach would be required to replicate these results and provide clinical value to the BAS as a prognostic indicator of posthospital mortality.
Despite the strengths of this study, it had notable limitations. Pooling BAS scores could have modified the interpretation and clinical implications of the results. Although we had a large number of patient observations, this retrospective analysis may have had biases that were not completely considered. In addition, the results of this single-center study cannot be generalized across all hospital systems. The Braden activity sub score has demonstrated good validity and reliability for activity changes13, but this measure was not objectively ascertained as demonstrated by others using accelerometers6-7. Moreover, the medical records used did not provide prehospital patient mobility status, limiting adjustments for prehospital mobility function. Despite these limitations, this study represents an important initial step in validating a simple and efficient clinical tool for identifying in-hospital mobility impairment and recovery and predicting posthospital adverse outcomes.
BAS assessment of incident mobility impairment and recovery in the hospital setting has prognostic value in predicting discharge disposition, in-hospital death, and posthospital mortality risk. That the majority of the effect appears to occur within the first 6 months after discharge suggests that interventions to improve mobility should be started during hospitalization or expeditiously after discharge. Overall, this study’s results showed that a simple and efficient mobility status assessment can become a valuable clinical and administrative tool for targeting and improving mobility in the hospital and after discharge in older adults.
Acknowledgments
This work was supported by the National Institutes of Health and the National Center for Advancing Translational Sciences (NIH/NCATS) Clinical and Translational Science Award to the University of Florida (UL1 TR000064) and by the University of Florida’s Claude D. Pepper Center (P30AG028740-R6, significant contributions from the Data and Applied Science Core and Biostatistical Core).
Disclosure
Nothing to report.
1. Zisberg A, Shadmi E, Gur-Yaish N, Tonkikh O, Sinoff G. Hospital-associated functional decline: the role of hospitalization processes beyond individual risk factors. J Am Geriatr Soc. 2015;63(1):55-62. PubMed
2. Covinsky KE, Palmer RM, Fortinsky RH, et al. Loss of independence in activities of daily living in older adults hospitalized with medical illnesses: increased vulnerability with age. J Am Geriatr Soc. 2003;51(4):451-458. PubMed
3. Hirsch CH, Sommers L, Olsen A, Mullen L, Winograd CH. The natural history of functional morbidity in hospitalized older patients. J Am Geriatr Soc. 1990;38(12):1296-1303. PubMed
4. Inouye SK, Peduzzi PN, Robison JT, Hughes JS, Horwitz RI, Concato J. Importance of functional measures in predicting mortality among older hospitalized patients. JAMA. 1998;279(15):1187-1193. PubMed
5. Zisberg A, Shadmi E, Sinoff G, Gur-Yaish N, Srulovici E, Admi H. Low mobility during hospitalization and functional decline in older adults. J Am Geriatr Soc. 2011;59(2):266-273. PubMed
6. Brown CJ, Redden DT, Flood KL, Allman RM. The underrecognized epidemic of low mobility during hospitalization of older adults. J Am Geriatr Soc. 2009;57(9):1660-1665. PubMed
7. Ostir GV, Berges IM, Kuo YF, Goodwin JS, Fisher SR, Guralnik JM. Mobility activity and its value as a prognostic indicator of survival in hospitalized older adults. J Am Geriatr Soc. 2013;61(4):551-557. PubMed
8. Fisher SR, Graham JE, Brown CJ, et al. Factors that differentiate level of ambulation in hospitalised older adults. Age Ageing. 2012;41(1):107-111. PubMed
9. Pancorbo-Hidalgo PL, Garcia-Fernandez FP, Lopez-Medina IM, Alvarez-Nieto C. Risk assessment scales for pressure ulcer prevention: a systematic review. J Adv Nurs. 2006;54(1):94-110. PubMed
10. Sardo P, Simões C, Alvarelhão J, et al. Pressure ulcer risk assessment: retrospective analysis of Braden scale scores in Portuguese hospitalised adult patients. J Clin Nurs. 2015;24(21-22):3165-3176. PubMed
11. Charlson ME, Pompei P, Ales KL, MacKenzie CR. A new method of classifying prognostic comorbidity in longitudinal studies: development and validation. J Chronic Dis. 1987;40(5):373-383. PubMed
12. Bergstrom N, Braden BJ, Laguzza A, Holman V. The Braden Scale for Predicting Pressure Sore Risk. Nurs Res. 1987;36(4):205-210. PubMed
13. Wang LH, Chen HL, Yan HY, et al. Inter-rater reliability of three most commonly used pressure ulcer risk assessment scales in clinical practice. Int Wound J. 2015;12(5):590-594. PubMed
14. Royston, Parmar MK. The use of restricted mean survival time to estimate the treatment effect in randomized clinical trials when the proportional hazards assumption is in doubt. Stat Med. 2011;30(19):2409-2421. PubMed
15. Royston P, Parmar MK. Restricted mean survival time: an alternative to the hazard ratio for the design and analysis of randomized trials with a time-to-event outcome. BMC Med Res Methodol. 2013;13:152. PubMed
16. Zhao L, Claggett B, Tian L, et al. On the restricted mean survival time curve in survival analysis. Biometrics. 2016;72(1):215-221. PubMed
17. R Core Team. R: A Language and Environment for Statistical Computing. Vienna, Austria: R Foundation for Statistical Computing; 2014. http://www.R-project.org. Published 2014. Accessed April 25, 2017.
18. Kasotakis G, Schmidt U, Perry D, et al. The Surgical Intensive Care Unit Optimal Mobility Score predicts mortality and length of stay. Crit Care Med. 2012;40(4):1122-1128. PubMed
19. Sommerfeld DK, von Arbin MH. Disability test 10 days after acute stroke to predict early discharge home in patients 65 years and older. Clin Rehabil. 2001;15(5):528-534. PubMed
20. Vochteloo AJ, Tuinebreijer WE, Maier AB, Nelissen RG, Bloem RM, Pilot P. Predicting discharge location of hip fracture patients; the new discharge of hip fracture patients score. Int Orthop. 2012;36(8):1709-1714. PubMed
© 2017 Society of Hospital Medicine
Does provider self-reporting of etiquette behaviors improve patient experience? A randomized controlled trial
Physicians have historically had limited adoption of strategies to improve patient experience and often cite suboptimal data and lack of evidence-driven strategies. 1,2 However, public reporting of hospital-level physician domain Hospital Consumer Assessment of Healthcare Providers and Systems (HCAHPS) experience scores, and more recent linking of payments to performance on patient experience metrics, have been associated with significant increases in physician domain scores for most of the hospitals. 3 Hospitals and healthcare organizations have deployed a broad range of strategies to engage physicians. These include emphasizing the relationship between patient experience and patient compliance, complaints, and malpractice lawsuits; appealing to physicians’ sense of competitiveness by publishing individual provider experience scores; educating physicians on HCAHPS and providing them with regularly updated data; and development of specific techniques for improving patient-physician interaction. 4-8
Studies show that educational curricula on improving etiquette and communication skills for physicians lead to improvement in patient experience, and many such training programs are available to hospitals for a significant cost.9-15 Other studies that have focused on providing timely and individual feedback to physicians using tools other than HCAHPS have shown improvement in experience in some instances. 16,17 However, these strategies are resource intensive, require the presence of an independent observer in each patient room, and may not be practical in many settings. Further, long-term sustainability may be problematic.
Since the goal of any educational intervention targeting physicians is routinizing best practices, and since resource-intensive strategies of continuous assessment and feedback may not be practical, we sought to test the impact of periodic physician self-reporting of their etiquette-based behavior on their patient experience scores.
METHODS
Subjects
Hospitalists from 4 hospitals (2 community and 2 academic) that are part of the same healthcare system were the study subjects. Hospitalists who had at least 15 unique patients responding to the routinely administered Press Ganey experience survey during the baseline period were considered eligible. Eligible hospitalists were invited to enroll in the study if their site director confirmed that the provider was likely to stay with the group for the subsequent 12-month study period.

Randomization, Intervention and Control Group
Hospitalists were randomized to the study arm or control arm (1:1 randomization). Study arm participants received biweekly etiquette behavior (EB) surveys and were asked to report how frequently they performed 7 best-practice bedside etiquette behaviors during the previous 2-week period (Table 1). These behaviors were pre-defined by a consensus group of investigators as being amenable to self-report and commonly considered best practice as described in detail below. Control-arm participants received similarly worded survey on quality improvement behaviors (QIB) that would not be expected to impact patient experience (such as reviewing medications to ensure that antithrombotic prophylaxis was prescribed, Table 1).
Baseline and Study Periods
A 12-month period prior to the enrollment of each hospitalist was considered the baseline period for that individual. Hospitalist eligibility was assessed based on number of unique patients for each hospitalist who responded to the survey during this baseline period. Once enrolled, baseline provider-level patient experience scores were calculated based on the survey responses during this 12-month baseline period. Baseline etiquette behavior performance of the study was calculated from the first survey. After the initial survey, hospitalists received biweekly surveys (EB or QIB) for the 12-month study period for a total of 26 surveys (including the initial survey).
Survey Development, Nature of Survey, Survey Distribution Methods
The EB and QIB physician self-report surveys were developed through an iterative process by the study team. The EB survey included elements from an etiquette-based medicine checklist for hospitalized patients described by Kahn et al. 18 We conducted a review of literature to identify evidence-based practices.19-22 Research team members contributed items on best practices in etiquette-based medicine from their experience. Specifically, behaviors were selected if they met the following 4 criteria: 1) performing the behavior did not lead to significant increase in workload and was relatively easy to incorporate in the work flow; 2) occurrence of the behavior would be easy to note for any outside observer or the providers themselves; 3) the practice was considered to be either an evidence-based or consensus-based best-practice; 4) there was consensus among study team members on including the item. The survey was tested for understandability by hospitalists who were not eligible for the study.
The EB survey contained 7 items related to behaviors that were expected to impact patient experience. The QIB survey contained 4 items related to behaviors that were expected to improve quality (Table 1). The initial survey also included questions about demographic characteristics of the participants.
Survey questionnaires were sent via email every 2 weeks for a period of 12 months. The survey questionnaire became available every other week, between Friday morning and Tuesday midnight, during the study period. Hospitalists received daily email reminders on each of these days with a link to the survey website if they did not complete the survey. They had the opportunity to report that they were not on service in the prior week and opt out of the survey for the specific 2-week period. The survey questions were available online as well as on a mobile device format.
Provider Level Patient Experience Scores
Provider-level patient experience scores were calculated from the physician domain Press Ganey survey items, which included the time that the physician spent with patients, the physician addressed questions/worries, the physician kept patients informed, the friendliness/courtesy of physician, and the skill of physician. Press Ganey responses were scored from 1 to 5 based on the Likert scale responses on the survey such that a response “very good” was scored 5 and a response “very poor” was scored 1. Additionally, physician domain HCAHPS item (doctors treat with courtesy/respect, doctors listen carefully, doctors explain in way patients understand) responses were utilized to calculate another set of HCAHPS provider level experience scores. The responses were scored as 1 for “always” response and “0” for any other response, consistent with CMS dichotomization of these results for public reporting. Weighted scores were calculated for individual hospitalists based on the proportion of days each hospitalist billed for the hospitalization so that experience scores of patients who were cared for by multiple providers were assigned to each provider in proportion to the percent of care delivered.23 Separate composite physician scores were generated from the 5 Press Ganey and for the 3 HCAHPS physician items. Each item was weighted equally, with the maximum possible for Press Ganey composite score of 25 (sum of the maximum possible score of 5 on each of the 5 Press Ganey items) and the HCAHPS possible total was 3 (sum of the maximum possible score of 1 on each of the 3 HCAHPS items).
ANALYSIS AND STATISTICAL METHODS
We analyzed the data to assess for changes in frequency of self-reported behavior over the study period, changes in provider-level patient experience between baseline and study period, and the association between the these 2 outcomes. The self-reported etiquette-based behavior responses were scored as 1 for the lowest response (never) to 4 as the highest (always). With 7 questions, the maximum attainable score was 28. The maximum score was normalized to 100 for ease of interpretation (corresponding to percentage of time etiquette behaviors were employed, by self-report). Similarly, the maximum attainable self-reported QIB-related behavior score on the 4 questions was 16. This was also converted to 0-100 scale for ease of comparison.
Two additional sets of analyses were performed to evaluate changes in patient experience during the study period. First, the mean 12-month provider level patient experience composite score in the baseline period was compared with the 12-month composite score during the 12-month study period for the study group and the control group. These were assessed with and without adjusting for age, sex, race, and U.S. medical school graduate (USMG) status. In the second set of unadjusted and adjusted analyses, changes in biweekly composite scores during the study period were compared between the intervention and the control groups while accounting for correlation between observations from the same physician using mixed linear models. Linear mixed models were used to accommodate correlations among multiple observations made on the same physician by including random effects within each regression model. Furthermore, these models allowed us to account for unbalanced design in our data when not all physicians had an equal number of observations and data elements were collected asynchronously.24 Analyses were performed in R version 3.2.2 (The R Project for Statistical Computing, Vienna, Austria); linear mixed models were performed using the ‘nlme’ package.25
We hypothesized that self-reporting on biweekly surveys would result in increases in the frequency of the reported behavior in each arm. We also hypothesized that, because of biweekly reflection and self-reporting on etiquette-based bedside behavior, patient experience scores would increase in the study arm.
RESULTS
Of the 80 hospitalists approached to participate in the study, 64 elected to participate (80% participation rate). The mean response rate to the survey was 57.4% for the intervention arm and 85.7% for the control arm. Higher response rates were not associated with improved patient experience scores. Of the respondents, 43.1% were younger than 35 years of age, 51.5% practiced in academic settings, and 53.1% were female. There was no statistical difference between hospitalists’ baseline composite experience scores based on gender, age, academic hospitalist status, USMG status, and English as a second language status. Similarly, there were no differences in poststudy composite experience scores based on physician characteristics.
Physicians reported high rates of etiquette-based behavior at baseline (mean score, 83.9+/-3.3), and this showed moderate improvement over the study period (5.6 % [3.9%-7.3%, P < 0.0001]). Similarly, there was a moderate increase in frequency of self-reported behavior in the control arm (6.8% [3.5%-10.1%, P < 0.0001]). Hospitalists reported on 80.7% (77.6%-83.4%) of the biweekly surveys that they “almost always” wrapped up by asking, “Do you have any other questions or concerns” or something similar. In contrast, hospitalists reported on only 27.9% (24.7%-31.3%) of the biweekly survey that they “almost always” sat down in the patient room.
The composite physician domain Press Ganey experience scores were no different for the intervention arm and the control arm during the 12-month baseline period (21.8 vs. 21.7; P = 0.90) and the 12-month intervention period (21.6 vs. 21.5; P = 0.75). Baseline self-reported behaviors were not associated with baseline experience scores. Similarly, there were no differences between the arms on composite physician domain HCAHPS experience scores during baseline (2.1 vs. 2.3; P = 0.13) and intervention periods (2.2 vs. 2.1; P = 0.33).
The difference in difference analysis of the baseline and postintervention composite between the intervention arm and the control arm was not statistically significant for Press Ganey composite physician experience scores (-0.163 vs. -0.322; P = 0.71) or HCAHPS composite physician scores (-0.162 vs. -0.071; P = 0.06). The results did not change when controlled for survey response rate (percentage biweekly surveys completed by the hospitalist), age, gender, USMG status, English as a second language status, or percent clinical effort. The difference in difference analysis of the individual Press Ganey and HCAHPS physician domain items that were used to calculate the composite score was also not statistically significant (Table 2).

Changes in self-reported etiquette-based behavior were not associated with any changes in composite Press Ganey and HCAHPS experience score or individual items of the composite experience scores between baseline and intervention period. Similarly, biweekly self-reported etiquette behaviors were not associated with composite and individual item experience scores derived from responses of the patients discharged during the same 2-week reporting period. The intra-class correlation between observations from the same physician was only 0.02%, suggesting that most of the variation in scores was likely due to patient factors and did not result from differences between physicians.
DISCUSSION
This 12-month randomized multicenter study of hospitalists showed that repeated self-reporting of etiquette-based behavior results in modest reported increases in performance of these behaviors. However, there was no associated increase in provider level patient experience scores at the end of the study period when compared to baseline scores of the same physicians or when compared to the scores of the control group. The study demonstrated feasibility of self-reporting of behaviors by physicians with high participation when provided modest incentives.
Educational and feedback strategies used to improve patient experience are very resource intensive. Training sessions provided at some hospitals may take hours, and sustained effects are unproved. The presence of an independent observer in patient rooms to generate feedback for providers is not scalable and sustainable outside of a research study environment.9-11,15,17,26-29 We attempted to use physician repeated self-reporting to reinforce the important and easy to adopt components of etiquette-based behavior to develop a more easily sustainable strategy. This may have failed for several reasons.
When combining “always” and “usually” responses, the physicians in our study reported a high level of etiquette behavior at baseline. If physicians believe that they are performing well at baseline, they would not consider this to be an area in need of improvement. Bigger changes in behavior may have been possible had the physicians rated themselves less favorably at baseline. Inflated or high baseline self-assessment of performance might also have led to limited success of other types of educational interventions had they been employed.
Studies published since the rollout of our study have shown that physicians significantly overestimate how frequently they perform these etiquette behaviors.30,31 It is likely that was the case in our study subjects. This may, at best, indicate that a much higher change in the level of self-reported performance would be needed to result in meaningful actual changes, or worse, may render self-reported etiquette behavior entirely unreliable. Interventions designed to improve etiquette-based behavior might need to provide feedback about performance.
A program that provides education on the importance of etiquette-based behaviors, obtains objective measures of performance of these behaviors, and offers individualized feedback may be more likely to increase the desired behaviors. This is a limitation of our study. However, we aimed to test a method that required limited resources. Additionally, our method for attributing HCAHPS scores to an individual physician, based on weighted scores that were calculated according to the proportion of days each hospitalist billed for the hospitalization, may be inaccurate. It is possible that each interaction does not contribute equally to the overall score. A team-based intervention and experience measurements could overcome this limitation.
CONCLUSION
This randomized trial demonstrated the feasibility of self-assessment of bedside etiquette behaviors by hospitalists but failed to demonstrate a meaningful impact on patient experience through self-report. These findings suggest that more intensive interventions, perhaps involving direct observation, peer-to-peer mentoring, or other techniques may be required to impact significantly physician etiquette behaviors.
Disclosure
Johns Hopkins Hospitalist Scholars Program provided funding support. Dr. Qayyum is a consultant for Sunovion. The other authors have nothing to report.
1. Blumenthal D, Kilo CM. A report card on continuous quality improvement. Milbank Q. 1998;76(4):625-648. PubMed
2. Shortell SM, Bennett CL, Byck GR. Assessing the impact of continuous quality improvement on clinical practice: What it will take to accelerate progress. Milbank Q. 1998;76(4):593-624. PubMed
3. Mann RK, Siddiqui Z, Kurbanova N, Qayyum R. Effect of HCAHPS reporting on patient satisfaction with physician communication. J Hosp Med. 2015;11(2):105-110. PubMed
4. Rivers PA, Glover SH. Health care competition, strategic mission, and patient satisfaction: research model and propositions. J Health Organ Manag. 2008;22(6):627-641. PubMed
5. Kim SS, Kaplowitz S, Johnston MV. The effects of physician empathy on patient satisfaction and compliance. Eval Health Prof. 2004;27(3):237-251. PubMed
6. Stelfox HT, Gandhi TK, Orav EJ, Gustafson ML. The relation of patient satisfaction with complaints against physicians and malpractice lawsuits. Am J Med. 2005;118(10):1126-1133. PubMed
7. Rodriguez HP, Rodday AM, Marshall RE, Nelson KL, Rogers WH, Safran DG. Relation of patients’ experiences with individual physicians to malpractice risk. Int J Qual Health Care. 2008;20(1):5-12. PubMed
8. Cydulka RK, Tamayo-Sarver J, Gage A, Bagnoli D. Association of patient satisfaction with complaints and risk management among emergency physicians. J Emerg Med. 2011;41(4):405-411. PubMed
9. Windover AK, Boissy A, Rice TW, Gilligan T, Velez VJ, Merlino J. The REDE model of healthcare communication: Optimizing relationship as a therapeutic agent. Journal of Patient Experience. 2014;1(1):8-13.
10. Chou CL, Hirschmann K, Fortin AH 6th, Lichstein PR. The impact of a faculty learning community on professional and personal development: the facilitator training program of the American Academy on Communication in Healthcare. Acad Med. 2014;89(7):1051-1056. PubMed
11. Kennedy M, Denise M, Fasolino M, John P, Gullen M, David J. Improving the patient experience through provider communication skills building. Patient Experience Journal. 2014;1(1):56-60.
12. Braverman AM, Kunkel EJ, Katz L, et al. Do I buy it? How AIDET™ training changes residents’ values about patient care. Journal of Patient Experience. 2015;2(1):13-20.
13. Riess H, Kelley JM, Bailey RW, Dunn EJ, Phillips M. Empathy training for resident physicians: a randomized controlled trial of a neuroscience-informed curriculum. J Gen Intern Med. 2012;27(10):1280-1286. PubMed
14. Rothberg MB, Steele JR, Wheeler J, Arora A, Priya A, Lindenauer PK. The relationship between time spent communicating and communication outcomes on a hospital medicine service. J Gen Internl Med. 2012;27(2):185-189. PubMed
15. O’Leary KJ, Cyrus RM. Improving patient satisfaction: timely feedback to specific physicians is essential for success. J Hosp Med. 2015;10(8):555-556. PubMed
16. Indovina K, Keniston A, Reid M, et al. Real‐time patient experience surveys of hospitalized medical patients. J Hosp Med. 2016;10(8):497-502. PubMed
17. Banka G, Edgington S, Kyulo N, et al. Improving patient satisfaction through physician education, feedback, and incentives. J Hosp Med. 2015;10(8):497-502. PubMed
18. Kahn MW. Etiquette-based medicine. N Engl J Med. 2008;358(19):1988-1989. PubMed
19. Arora V, Gangireddy S, Mehrotra A, Ginde R, Tormey M, Meltzer D. Ability of hospitalized patients to identify their in-hospital physicians. Arch Intern Med. 2009;169(2):199-201. PubMed
20. Francis JJ, Pankratz VS, Huddleston JM. Patient satisfaction associated with correct identification of physicians’ photographs. Mayo Clin Proc. 2001;76(6):604-608. PubMed
21. Strasser F, Palmer JL, Willey J, et al. Impact of physician sitting versus standing during inpatient oncology consultations: patients’ preference and perception of compassion and duration. A randomized controlled trial. J Pain Symptom Manage. 2005;29(5):489-497. PubMed
22. Dudas RA, Lemerman H, Barone M, Serwint JR. PHACES (Photographs of Academic Clinicians and Their Educational Status): a tool to improve delivery of family-centered care. Acad Pediatr. 2010;10(2):138-145. PubMed
23. Herzke C, Michtalik H, Durkin N, et al. A method for attributing patient-level metrics to rotating providers in an inpatient setting. J Hosp Med. Under revision.
24. Holden JE, Kelley K, Agarwal R. Analyzing change: a primer on multilevel models with applications to nephrology. Am J Nephrol. 2008;28(5):792-801. PubMed
25. Pinheiro J, Bates D, DebRoy S, Sarkar D. Linear and nonlinear mixed effects models. R package version. 2007;3:57.
26. Braverman AM, Kunkel EJ, Katz L, et al. Do I buy it? How AIDET™ training changes residents’ values about patient care. Journal of Patient Experience. 2015;2(1):13-20.
27. Riess H, Kelley JM, Bailey RW, Dunn EJ, Phillips M. Empathy training for resident physicians: A randomized controlled trial of a neuroscience-informed curriculum. J Gen Intern Med. 2012;27(10):1280-1286. PubMed
28. Raper SE, Gupta M, Okusanya O, Morris JB. Improving communication skills: A course for academic medical center surgery residents and faculty. J Surg Educ. 2015;72(6):e202-e211. PubMed
29. Indovina K, Keniston A, Reid M, et al. Real‐time patient experience surveys of hospitalized medical patients. J Hosp Med. 2016;11(4):251-256. PubMed
30. Block L, Hutzler L, Habicht R, et al. Do internal medicine interns practice etiquette‐based communication? A critical look at the inpatient encounter. J Hosp Med. 2013;8(11):631-634. PubMed
31. Tackett S, Tad-y D, Rios R, Kisuule F, Wright S. Appraising the practice of etiquette-based medicine in the inpatient setting. J Gen Intern Med. 2013;28(7):908-913. PubMed
Physicians have historically had limited adoption of strategies to improve patient experience and often cite suboptimal data and lack of evidence-driven strategies. 1,2 However, public reporting of hospital-level physician domain Hospital Consumer Assessment of Healthcare Providers and Systems (HCAHPS) experience scores, and more recent linking of payments to performance on patient experience metrics, have been associated with significant increases in physician domain scores for most of the hospitals. 3 Hospitals and healthcare organizations have deployed a broad range of strategies to engage physicians. These include emphasizing the relationship between patient experience and patient compliance, complaints, and malpractice lawsuits; appealing to physicians’ sense of competitiveness by publishing individual provider experience scores; educating physicians on HCAHPS and providing them with regularly updated data; and development of specific techniques for improving patient-physician interaction. 4-8
Studies show that educational curricula on improving etiquette and communication skills for physicians lead to improvement in patient experience, and many such training programs are available to hospitals for a significant cost.9-15 Other studies that have focused on providing timely and individual feedback to physicians using tools other than HCAHPS have shown improvement in experience in some instances. 16,17 However, these strategies are resource intensive, require the presence of an independent observer in each patient room, and may not be practical in many settings. Further, long-term sustainability may be problematic.
Since the goal of any educational intervention targeting physicians is routinizing best practices, and since resource-intensive strategies of continuous assessment and feedback may not be practical, we sought to test the impact of periodic physician self-reporting of their etiquette-based behavior on their patient experience scores.
METHODS
Subjects
Hospitalists from 4 hospitals (2 community and 2 academic) that are part of the same healthcare system were the study subjects. Hospitalists who had at least 15 unique patients responding to the routinely administered Press Ganey experience survey during the baseline period were considered eligible. Eligible hospitalists were invited to enroll in the study if their site director confirmed that the provider was likely to stay with the group for the subsequent 12-month study period.
Randomization, Intervention and Control Group
Hospitalists were randomized to the study arm or control arm (1:1 randomization). Study arm participants received biweekly etiquette behavior (EB) surveys and were asked to report how frequently they performed 7 best-practice bedside etiquette behaviors during the previous 2-week period (Table 1). These behaviors were pre-defined by a consensus group of investigators as being amenable to self-report and commonly considered best practice as described in detail below. Control-arm participants received similarly worded survey on quality improvement behaviors (QIB) that would not be expected to impact patient experience (such as reviewing medications to ensure that antithrombotic prophylaxis was prescribed, Table 1).
Baseline and Study Periods
A 12-month period prior to the enrollment of each hospitalist was considered the baseline period for that individual. Hospitalist eligibility was assessed based on number of unique patients for each hospitalist who responded to the survey during this baseline period. Once enrolled, baseline provider-level patient experience scores were calculated based on the survey responses during this 12-month baseline period. Baseline etiquette behavior performance of the study was calculated from the first survey. After the initial survey, hospitalists received biweekly surveys (EB or QIB) for the 12-month study period for a total of 26 surveys (including the initial survey).
Survey Development, Nature of Survey, Survey Distribution Methods
The EB and QIB physician self-report surveys were developed through an iterative process by the study team. The EB survey included elements from an etiquette-based medicine checklist for hospitalized patients described by Kahn et al. 18 We conducted a review of literature to identify evidence-based practices.19-22 Research team members contributed items on best practices in etiquette-based medicine from their experience. Specifically, behaviors were selected if they met the following 4 criteria: 1) performing the behavior did not lead to significant increase in workload and was relatively easy to incorporate in the work flow; 2) occurrence of the behavior would be easy to note for any outside observer or the providers themselves; 3) the practice was considered to be either an evidence-based or consensus-based best-practice; 4) there was consensus among study team members on including the item. The survey was tested for understandability by hospitalists who were not eligible for the study.
The EB survey contained 7 items related to behaviors that were expected to impact patient experience. The QIB survey contained 4 items related to behaviors that were expected to improve quality (Table 1). The initial survey also included questions about demographic characteristics of the participants.
Survey questionnaires were sent via email every 2 weeks for a period of 12 months. The survey questionnaire became available every other week, between Friday morning and Tuesday midnight, during the study period. Hospitalists received daily email reminders on each of these days with a link to the survey website if they did not complete the survey. They had the opportunity to report that they were not on service in the prior week and opt out of the survey for the specific 2-week period. The survey questions were available online as well as on a mobile device format.
Provider Level Patient Experience Scores
Provider-level patient experience scores were calculated from the physician domain Press Ganey survey items, which included the time that the physician spent with patients, the physician addressed questions/worries, the physician kept patients informed, the friendliness/courtesy of physician, and the skill of physician. Press Ganey responses were scored from 1 to 5 based on the Likert scale responses on the survey such that a response “very good” was scored 5 and a response “very poor” was scored 1. Additionally, physician domain HCAHPS item (doctors treat with courtesy/respect, doctors listen carefully, doctors explain in way patients understand) responses were utilized to calculate another set of HCAHPS provider level experience scores. The responses were scored as 1 for “always” response and “0” for any other response, consistent with CMS dichotomization of these results for public reporting. Weighted scores were calculated for individual hospitalists based on the proportion of days each hospitalist billed for the hospitalization so that experience scores of patients who were cared for by multiple providers were assigned to each provider in proportion to the percent of care delivered.23 Separate composite physician scores were generated from the 5 Press Ganey and for the 3 HCAHPS physician items. Each item was weighted equally, with the maximum possible for Press Ganey composite score of 25 (sum of the maximum possible score of 5 on each of the 5 Press Ganey items) and the HCAHPS possible total was 3 (sum of the maximum possible score of 1 on each of the 3 HCAHPS items).
ANALYSIS AND STATISTICAL METHODS
We analyzed the data to assess for changes in frequency of self-reported behavior over the study period, changes in provider-level patient experience between baseline and study period, and the association between the these 2 outcomes. The self-reported etiquette-based behavior responses were scored as 1 for the lowest response (never) to 4 as the highest (always). With 7 questions, the maximum attainable score was 28. The maximum score was normalized to 100 for ease of interpretation (corresponding to percentage of time etiquette behaviors were employed, by self-report). Similarly, the maximum attainable self-reported QIB-related behavior score on the 4 questions was 16. This was also converted to 0-100 scale for ease of comparison.
Two additional sets of analyses were performed to evaluate changes in patient experience during the study period. First, the mean 12-month provider level patient experience composite score in the baseline period was compared with the 12-month composite score during the 12-month study period for the study group and the control group. These were assessed with and without adjusting for age, sex, race, and U.S. medical school graduate (USMG) status. In the second set of unadjusted and adjusted analyses, changes in biweekly composite scores during the study period were compared between the intervention and the control groups while accounting for correlation between observations from the same physician using mixed linear models. Linear mixed models were used to accommodate correlations among multiple observations made on the same physician by including random effects within each regression model. Furthermore, these models allowed us to account for unbalanced design in our data when not all physicians had an equal number of observations and data elements were collected asynchronously.24 Analyses were performed in R version 3.2.2 (The R Project for Statistical Computing, Vienna, Austria); linear mixed models were performed using the ‘nlme’ package.25
We hypothesized that self-reporting on biweekly surveys would result in increases in the frequency of the reported behavior in each arm. We also hypothesized that, because of biweekly reflection and self-reporting on etiquette-based bedside behavior, patient experience scores would increase in the study arm.
RESULTS
Of the 80 hospitalists approached to participate in the study, 64 elected to participate (80% participation rate). The mean response rate to the survey was 57.4% for the intervention arm and 85.7% for the control arm. Higher response rates were not associated with improved patient experience scores. Of the respondents, 43.1% were younger than 35 years of age, 51.5% practiced in academic settings, and 53.1% were female. There was no statistical difference between hospitalists’ baseline composite experience scores based on gender, age, academic hospitalist status, USMG status, and English as a second language status. Similarly, there were no differences in poststudy composite experience scores based on physician characteristics.
Physicians reported high rates of etiquette-based behavior at baseline (mean score, 83.9+/-3.3), and this showed moderate improvement over the study period (5.6 % [3.9%-7.3%, P < 0.0001]). Similarly, there was a moderate increase in frequency of self-reported behavior in the control arm (6.8% [3.5%-10.1%, P < 0.0001]). Hospitalists reported on 80.7% (77.6%-83.4%) of the biweekly surveys that they “almost always” wrapped up by asking, “Do you have any other questions or concerns” or something similar. In contrast, hospitalists reported on only 27.9% (24.7%-31.3%) of the biweekly survey that they “almost always” sat down in the patient room.
The composite physician domain Press Ganey experience scores were no different for the intervention arm and the control arm during the 12-month baseline period (21.8 vs. 21.7; P = 0.90) and the 12-month intervention period (21.6 vs. 21.5; P = 0.75). Baseline self-reported behaviors were not associated with baseline experience scores. Similarly, there were no differences between the arms on composite physician domain HCAHPS experience scores during baseline (2.1 vs. 2.3; P = 0.13) and intervention periods (2.2 vs. 2.1; P = 0.33).
The difference in difference analysis of the baseline and postintervention composite between the intervention arm and the control arm was not statistically significant for Press Ganey composite physician experience scores (-0.163 vs. -0.322; P = 0.71) or HCAHPS composite physician scores (-0.162 vs. -0.071; P = 0.06). The results did not change when controlled for survey response rate (percentage biweekly surveys completed by the hospitalist), age, gender, USMG status, English as a second language status, or percent clinical effort. The difference in difference analysis of the individual Press Ganey and HCAHPS physician domain items that were used to calculate the composite score was also not statistically significant (Table 2).
Changes in self-reported etiquette-based behavior were not associated with any changes in composite Press Ganey and HCAHPS experience score or individual items of the composite experience scores between baseline and intervention period. Similarly, biweekly self-reported etiquette behaviors were not associated with composite and individual item experience scores derived from responses of the patients discharged during the same 2-week reporting period. The intra-class correlation between observations from the same physician was only 0.02%, suggesting that most of the variation in scores was likely due to patient factors and did not result from differences between physicians.
DISCUSSION
This 12-month randomized multicenter study of hospitalists showed that repeated self-reporting of etiquette-based behavior results in modest reported increases in performance of these behaviors. However, there was no associated increase in provider level patient experience scores at the end of the study period when compared to baseline scores of the same physicians or when compared to the scores of the control group. The study demonstrated feasibility of self-reporting of behaviors by physicians with high participation when provided modest incentives.
Educational and feedback strategies used to improve patient experience are very resource intensive. Training sessions provided at some hospitals may take hours, and sustained effects are unproved. The presence of an independent observer in patient rooms to generate feedback for providers is not scalable and sustainable outside of a research study environment.9-11,15,17,26-29 We attempted to use physician repeated self-reporting to reinforce the important and easy to adopt components of etiquette-based behavior to develop a more easily sustainable strategy. This may have failed for several reasons.
When combining “always” and “usually” responses, the physicians in our study reported a high level of etiquette behavior at baseline. If physicians believe that they are performing well at baseline, they would not consider this to be an area in need of improvement. Bigger changes in behavior may have been possible had the physicians rated themselves less favorably at baseline. Inflated or high baseline self-assessment of performance might also have led to limited success of other types of educational interventions had they been employed.
Studies published since the rollout of our study have shown that physicians significantly overestimate how frequently they perform these etiquette behaviors.30,31 It is likely that was the case in our study subjects. This may, at best, indicate that a much higher change in the level of self-reported performance would be needed to result in meaningful actual changes, or worse, may render self-reported etiquette behavior entirely unreliable. Interventions designed to improve etiquette-based behavior might need to provide feedback about performance.
A program that provides education on the importance of etiquette-based behaviors, obtains objective measures of performance of these behaviors, and offers individualized feedback may be more likely to increase the desired behaviors. This is a limitation of our study. However, we aimed to test a method that required limited resources. Additionally, our method for attributing HCAHPS scores to an individual physician, based on weighted scores that were calculated according to the proportion of days each hospitalist billed for the hospitalization, may be inaccurate. It is possible that each interaction does not contribute equally to the overall score. A team-based intervention and experience measurements could overcome this limitation.
CONCLUSION
This randomized trial demonstrated the feasibility of self-assessment of bedside etiquette behaviors by hospitalists but failed to demonstrate a meaningful impact on patient experience through self-report. These findings suggest that more intensive interventions, perhaps involving direct observation, peer-to-peer mentoring, or other techniques may be required to impact significantly physician etiquette behaviors.
Disclosure
Johns Hopkins Hospitalist Scholars Program provided funding support. Dr. Qayyum is a consultant for Sunovion. The other authors have nothing to report.
1. Blumenthal D, Kilo CM. A report card on continuous quality improvement. Milbank Q. 1998;76(4):625-648. PubMed
2. Shortell SM, Bennett CL, Byck GR. Assessing the impact of continuous quality improvement on clinical practice: What it will take to accelerate progress. Milbank Q. 1998;76(4):593-624. PubMed
3. Mann RK, Siddiqui Z, Kurbanova N, Qayyum R. Effect of HCAHPS reporting on patient satisfaction with physician communication. J Hosp Med. 2015;11(2):105-110. PubMed
4. Rivers PA, Glover SH. Health care competition, strategic mission, and patient satisfaction: research model and propositions. J Health Organ Manag. 2008;22(6):627-641. PubMed
5. Kim SS, Kaplowitz S, Johnston MV. The effects of physician empathy on patient satisfaction and compliance. Eval Health Prof. 2004;27(3):237-251. PubMed
6. Stelfox HT, Gandhi TK, Orav EJ, Gustafson ML. The relation of patient satisfaction with complaints against physicians and malpractice lawsuits. Am J Med. 2005;118(10):1126-1133. PubMed
7. Rodriguez HP, Rodday AM, Marshall RE, Nelson KL, Rogers WH, Safran DG. Relation of patients’ experiences with individual physicians to malpractice risk. Int J Qual Health Care. 2008;20(1):5-12. PubMed
8. Cydulka RK, Tamayo-Sarver J, Gage A, Bagnoli D. Association of patient satisfaction with complaints and risk management among emergency physicians. J Emerg Med. 2011;41(4):405-411. PubMed
9. Windover AK, Boissy A, Rice TW, Gilligan T, Velez VJ, Merlino J. The REDE model of healthcare communication: Optimizing relationship as a therapeutic agent. Journal of Patient Experience. 2014;1(1):8-13.
10. Chou CL, Hirschmann K, Fortin AH 6th, Lichstein PR. The impact of a faculty learning community on professional and personal development: the facilitator training program of the American Academy on Communication in Healthcare. Acad Med. 2014;89(7):1051-1056. PubMed
11. Kennedy M, Denise M, Fasolino M, John P, Gullen M, David J. Improving the patient experience through provider communication skills building. Patient Experience Journal. 2014;1(1):56-60.
12. Braverman AM, Kunkel EJ, Katz L, et al. Do I buy it? How AIDET™ training changes residents’ values about patient care. Journal of Patient Experience. 2015;2(1):13-20.
13. Riess H, Kelley JM, Bailey RW, Dunn EJ, Phillips M. Empathy training for resident physicians: a randomized controlled trial of a neuroscience-informed curriculum. J Gen Intern Med. 2012;27(10):1280-1286. PubMed
14. Rothberg MB, Steele JR, Wheeler J, Arora A, Priya A, Lindenauer PK. The relationship between time spent communicating and communication outcomes on a hospital medicine service. J Gen Internl Med. 2012;27(2):185-189. PubMed
15. O’Leary KJ, Cyrus RM. Improving patient satisfaction: timely feedback to specific physicians is essential for success. J Hosp Med. 2015;10(8):555-556. PubMed
16. Indovina K, Keniston A, Reid M, et al. Real‐time patient experience surveys of hospitalized medical patients. J Hosp Med. 2016;10(8):497-502. PubMed
17. Banka G, Edgington S, Kyulo N, et al. Improving patient satisfaction through physician education, feedback, and incentives. J Hosp Med. 2015;10(8):497-502. PubMed
18. Kahn MW. Etiquette-based medicine. N Engl J Med. 2008;358(19):1988-1989. PubMed
19. Arora V, Gangireddy S, Mehrotra A, Ginde R, Tormey M, Meltzer D. Ability of hospitalized patients to identify their in-hospital physicians. Arch Intern Med. 2009;169(2):199-201. PubMed
20. Francis JJ, Pankratz VS, Huddleston JM. Patient satisfaction associated with correct identification of physicians’ photographs. Mayo Clin Proc. 2001;76(6):604-608. PubMed
21. Strasser F, Palmer JL, Willey J, et al. Impact of physician sitting versus standing during inpatient oncology consultations: patients’ preference and perception of compassion and duration. A randomized controlled trial. J Pain Symptom Manage. 2005;29(5):489-497. PubMed
22. Dudas RA, Lemerman H, Barone M, Serwint JR. PHACES (Photographs of Academic Clinicians and Their Educational Status): a tool to improve delivery of family-centered care. Acad Pediatr. 2010;10(2):138-145. PubMed
23. Herzke C, Michtalik H, Durkin N, et al. A method for attributing patient-level metrics to rotating providers in an inpatient setting. J Hosp Med. Under revision.
24. Holden JE, Kelley K, Agarwal R. Analyzing change: a primer on multilevel models with applications to nephrology. Am J Nephrol. 2008;28(5):792-801. PubMed
25. Pinheiro J, Bates D, DebRoy S, Sarkar D. Linear and nonlinear mixed effects models. R package version. 2007;3:57.
26. Braverman AM, Kunkel EJ, Katz L, et al. Do I buy it? How AIDET™ training changes residents’ values about patient care. Journal of Patient Experience. 2015;2(1):13-20.
27. Riess H, Kelley JM, Bailey RW, Dunn EJ, Phillips M. Empathy training for resident physicians: A randomized controlled trial of a neuroscience-informed curriculum. J Gen Intern Med. 2012;27(10):1280-1286. PubMed
28. Raper SE, Gupta M, Okusanya O, Morris JB. Improving communication skills: A course for academic medical center surgery residents and faculty. J Surg Educ. 2015;72(6):e202-e211. PubMed
29. Indovina K, Keniston A, Reid M, et al. Real‐time patient experience surveys of hospitalized medical patients. J Hosp Med. 2016;11(4):251-256. PubMed
30. Block L, Hutzler L, Habicht R, et al. Do internal medicine interns practice etiquette‐based communication? A critical look at the inpatient encounter. J Hosp Med. 2013;8(11):631-634. PubMed
31. Tackett S, Tad-y D, Rios R, Kisuule F, Wright S. Appraising the practice of etiquette-based medicine in the inpatient setting. J Gen Intern Med. 2013;28(7):908-913. PubMed
© 2017 Society of Hospital Medicine
Prospective cohort study of hospitalized adults with advanced cancer: Associations between complications, comorbidity, and utilization
Of the major chronic conditions that affect adult patients in the United States, cancer accounts for the highest levels of per capita spending.1 Cost growth for cancer treatment has been substantial and persistent, from $72 billion in 2004 to $125 billion in 2010, and is projected to increase to $173 billion by 2020.2 Thirty-five percent of US direct medical cancer costs are attributable to inpatient hospital stays.3 Policy responses that can provide financially sustainable, high-quality models of care for patients with advanced cancer and other serious illness are urgently sought.4-7
Patterns and levels of resource utilization in providing healthcare to patients with serious illness reflect not only treatment choices but a complex set of relationships among demographic, clinical, and system factors.8-10 Patient-level factors previously identified as potentially significant drivers of resource utilization among cancer populations specifically include age,11 sex,12 primary diagnosis,13 and comorbidities.11 Among end-of-life populations, significant associations have been found between cost and ethnicity,14 socioeconomic status,15 advance directive status,16 insurance status,16 and functional status.17
Evidence on factors strongly associated with cost of hospital admission for patients with advanced cancer can therefore inform provision and planning of healthcare. For example, when a specific diagnosis or clinical condition is found to be associated with high cost, then improving coordination and provision of care for this patient group may reduce avoidable utilization. Determining associations between sociodemographics and hospital care cost can help in identifying possible disparities in care, such as those that might occur when care differs by race, class, or insurance status.
We conducted the Palliative Care for Cancer (PC4C) study, a prospective multisite cohort study of the palliative care consultation team intervention for hospitalized adults with advanced cancer.18,19 In our primary analysis, we controlled for receipt of palliative care and analyzed a rich patient-reported dataset to examine associations between hospital care cost, and sociodemographic factors, clinical variables, and prior healthcare utilization. The results provide evidence regarding the factors most associated with the cost of hospital-based cancer care.
METHODS
Design, Setting, Participants, Data Sources
The PC4C study has been described in detail by authors who estimated the impact of specialist palliative care consultation teams on hospitalization cost.19-21 We prospectively collected sociodemographic, clinical, prior utilization, and cost data for adult patients with a primary diagnosis of advanced cancer admitted to 4 large US hospitals between 2007 and 2011.
All 4 of these high-volume tertiary-care medical centers were selected for their high patient volume (to facilitate sample size) and research capacity (to facilitate proficient recruitment and data collection). Before the study was initiated, it was approved by the institutional review board of each facility. In addition, approval was sought from each attending physician at each hospital site; patients whose physician did not grant approval were not considered for enrollment. More than 95% of physicians gave their approval.
Patients were at least 18 years old and had a primary diagnosis of metastatic solid tumor; central nervous system malignancy; locally advanced head, neck, or pancreas cancer; metastatic melanoma; or transplant-ineligible lymphoma or multiple myeloma. Patients were excluded if they did not speak English, had a diagnosis of dementia, were unresponsive or nonverbal, had been admitted for routine chemotherapy, died or were discharged within 48 hours of admission, or had had a previous palliative care consultation.
Eligible patients were identified through daily review of admissions records and administrative databases. For each potential study patient identified, that patient’s bedside nurse inquired about willingness to participate in the study. Then, for each willing patient, a trained clinical interviewer approached to explain the study and obtain informed consent. With the patient’s consent, family members were also approached and enrolled with written informed consent.
Quantitative Variables
Independent variables. In the dataset, we identified 17 patient-level variables we hypothesized could be significantly associated with hospitalization cost. These variables covered 4 domains:
- Demographics: age, sex, race.
- Socioeconomics/systems: education level, insurance status, presence of advance directive (living will or healthcare proxy).
- Clinical care: primary cancer diagnosis, admitting diagnosis, comorbidities (Elixhauser index22), symptom burden and severity (Condensed Memorial Symptom Assessment Scale [CMSAS]23), and activities of daily living24 or presence of a hospital-acquired condition or complication.25
- Prior utilization: visiting homecare nurse and home health aide within 2 weeks before admission, and analgesic use in morphine sulfate equivalents within week before admission.
")
Data were collected through a combination of medical record review (age, sex, diagnoses, comorbidities, complications), patient interview (race, education, advance directive, CMSAS, activities of daily living, prior utilization), and hospital administrative databases (insurance). For use in regression, variables were divided into categories when appropriate. Table 1 lists these predictors and their prevalence in the analytic sample.
Dependent variable. The outcome of interest in this analysis was total direct cost of hospital stay. Direct costs are those attributable to the care of a specific patient, as distinct from indirect costs, the shared overhead costs of running a hospital.26 Cost data were extracted from hospital accounting databases and therefore reflect actual costs, the US dollar cost to the hospitals of care provided, also known as direct measurement.27 Costs were standardized for geographical region using the Medicare Wage Index28 and year using the Consumer Price Index29 and are presented here in US dollars for 2011, the final year of data collection.
Statistical Methods
Primary analyses. We regressed total direct hospital costs against all predictors listed in Table 1. To control for receipt of palliative care, we used additional independent variables—a fixed-effects variable for each of 3 hospitals (the fourth hospital was used as the reference case) and a binary treatment variable (whether or not the patient was seen by a palliative care consultation team within 2 days of hospital admission).19,20
Associations between cost and patient-level covariates were derived with use of a generalized linear model with a γ distribution and a log link,30 selected after comparative evaluation of performance for multiple linear and nonlinear modeling options.31
For each patient-level covariate, we estimated average marginal effects. For continuous variables, we estimated the marginal increase in cost associated with a 1-unit increase in the variable. For binary variables, we estimated the average incremental effect, the increase in cost associated with a move from the reference group, holding all other covariates to their original values. All analyses were performed with Stata Version 12.32
Secondary analyses. Primary analyses showed that number of patient comorbidities (Elixhauser index) was strongly associated with complications and comorbidity count. Prior analyses with these data have shown that palliative care had a larger cost-saving effect for patients with a larger number of comorbidities.20 Additional analyses were therefore performed to examine associations between complications, utilization, and palliative care. First, we cross-tabulated the sample by complications status (none; minor or major) and receipt of timely palliative care, and we present their summary utilization data. Second, we estimated the effect for each complications stratum (none; minor or major) of receiving timely palliative care on cost. These estimates are calculated consistent with prior work with these data: We used propensity scores to balance patients who received the treatment (palliative care) with patients who did not (usual care only),33,34 and we used a generalized linear model with a γ distribution and a log link to regress the direct hospital care cost on the binary treatment variable and all predictors listed in Table 1.19-21
")
RESULTS
Participants
We have previously detailed that in our study there were 1023 patients eligible for cost analysis,19 of whom three were missing data in a field in Table 1 and excluded from this paper. The final analytic sample (N = 1020) is presented according to baseline covariates in Table 1 and according to summary utilization measures in Table 2.
Main Results
The results of the primary analysis, estimating the association between patient-level factors and cost of hospitalization, are presented in Table 3.
")
These results show the evidence of an association with cost is strongest for 3 clinical factors: a major complication (+$8267; 95% confidence interval [CI], $4509-$12,025), a minor but not a major complication (+$5289; CI, $3480-$7097), and number of comorbidities (+$852; CI, $550-$1153). In addition, there is evidence of associations between lower cost and admitting diagnosis of electrolyte disorders (–$4759; CI, –$7928 to –$1590) and older age (–$53; CI, –$99 to –$6). There is no significant association between primary diagnosis, symptom burden or other clinical factors, sociodemographic factors or healthcare utilization prior to admission and direct hospitalization costs.
Results of the secondary analyses of associations between complications, utilization, and palliative care are listed in Table 4. Patients are stratified by complication (none; major | minor) and their direct cost of hospital care and hospital length of stay (LOS) presented by treatment group (palliative care; usual care only). The data show that within each strata patients who received palliative care had lower costs and LOS than those who received usual care only. Estimated effects of palliative care on utilization is found to be statistically significant in all four quadrants, with a larger cost-effect in the complications stratum than the non-complications stratum.
")
Sensitivity Analysis
Fifty-one patients died during admission. After removing these cases, because of concerns about possible unobserved heterogeneity,35 we checked our primary (Table 3) and secondary (Table 4) results. Patients discharged alive had results substantively similar to those of the entire sample.
DISCUSSION
Results from our primary analysis (Table 3) suggest that complications and number of comorbidities are the key drivers of hospitalization cost for adults with advanced cancer. Hospitalization for electrolyte disorders and age are both negatively associated with cost.
The association found between higher cost and hospital-acquired complications (HACs) is consistent with other studies’ finding that HACs often result in higher cost, longer LOS, and increased inhospital mortality.36 Since those studies were reported, policy attention has been increasingly focused on HACs.37 Our findings are notable in that, though prior evidence has also suggested high hospital cost is multifactorial, driven by a diversity of demographic, socioeconomic, and clinical factors, this rich patient-reported dataset suggests that, compared with other variables, HACs are emphatically the largest driver of cost. Moreover, cancer patients typically are a vulnerable population, more prone to complications and thus also to potentially avoidable treatments and higher cost. Our prior work suggested earlier palliative care consultation can reduce cost, in part by shortening LOS and reducing the opportunity for HACs to develop19,20; our secondary analysis (Table 4) suggested a palliative care team’s involvement in HAC treatment can significantly reduce cost of care as well. These associations possibly derive from changed treatment choices and shorter LOS. Further work is needed to better elucidate the role of palliative care in the prevention of HACs in seriously ill patients.
That the number of comorbidities was found to be a key driver of hospitalization cost is consistent with recent findings that high spending on seriously ill patients is associated with having multiple chronic conditions rather than any specific primary diagnosis.38,39 It is important to note that, unlike impending complications, serious chronic conditions generally are known at admission and can be addressed prospectively through provision and policy. A prior analysis with these data found that palliative care consultation was more cost-effective for patients with a larger number of comorbidities.20 Our 2 studies together suggest that, notwithstanding the preferable alternative of avoiding hospitalization entirely, palliative care and other skilled coordination of care services ought to be prioritized for inpatients with multiple serious illnesses and the highest medical complexity. This patient group has both the highest costs and the greatest amenability to skilled transdisciplinary intervention, possibly because multiple chronic conditions affect patients interactively, complicating identification of appropriate polypharmacy responses and prioritization of treatments.
Our findings also may help direct appropriate use of palliative care services. The recently published American Society of Clinical Oncology palliative care guidelines note that all patients with advanced cancer (eg, those enrolled in our study) should receive dedicated palliative care services, early in the disease course, concurrent with active treatment.40 Workforce estimates suggest that the current and future numbers of palliative care practitioners will be unable to meet the ASCO recommendations alone never mind patients with other serious illnesses (eg, advanced heart failure, COPD, CKD).41 As such, specialized palliative care services will need to be targeted to the patient populations that can benefit most from these services. Whereas cost should not be the principle driver specialized palliative care provision, it will likely be an important component due to both the necessity of allocating scarce resources in the most effective way and the evidence that in care of the seriously-ill lower costs are often a proxy for improved patient experience.
These findings also have implications for research: Different conditions and presumably different combinations of conditions have very different implications for hospital care costs for a cohort of adults with advanced cancer. Given the increasing number of co-occurring conditions among seriously ill patients, and the increasing costs of cancer care and of treating multimorbidity cases, it is essential to further our understanding of the relationship between comorbidities and costs in order to plan and finance care for advanced cancer patients.
Limitations and Generalizability
In this observational study, reported associations may be attributable to unobserved confounding that our analyses failed to control.
Our results reflect associations in a prospective multisite study of advanced cancer patients hospitalized in the United States. It is not clear how generalizable our findings are to patients without cancer, to patients in nonhospital settings, and to patients in other health systems and countries. Analyzing cost from the hospital perspective does not take into account that the most impactful way to reduce cost is to avoid hospitalization entirely.
Results of our secondary analysis will not necessarily be robust to patient groups, as specific weights likely will vary by sample. The idea that costs vary by condition, however, is important nevertheless. Elixhauser total was derived with use of the enhanced ICD-9-CM (International Classification of Diseases, Ninth Revision, Clinical Modification) algorithm from Quan et al.42 and does not include subsequent Elixhauser Comorbidity Software updates recommended by the Healthcare Cost and Utilization Project (HCUP; Agency for Healthcare Research and Quality).43 The Elixhauser index is recommended over Charlson and other comorbidity indices by both HCUP45 and a recent systematic review.44
One possible unobserved factor is prior chemotherapy, which is associated with increased hospitalization risk. Related factors that are somewhat controlled for in the study include cancer stage (advanced cancer was an eligibility criterion) and receipt of analgesics within the week before admission (patients admitted for routine chemotherapy were excluded from analyses at the outset).
CONCLUSION
Other studies have identified a wide range of sociodemographic, clinical, and health system factors associated with healthcare utilization. Our results suggest that, for cost of hospital admission among adults with advanced cancer, the most important drivers of utilization are complications and comorbidities. Hospital costs for patients with advanced cancer constitute a major part of US healthcare spending, and these results suggest the need to prioritize high-quality, cost-effective care for patients with multiple serious illnesses.
Acknowledgments
The authors thank Robert Arnold, Phil Santa Emma, Mary Beth Happ, Tim Smith, and David Weissman for contributing to the Palliative Care for Cancer (PC4C) project.
Disclosure
The study was funded by grant R01 CA116227 from the National Cancer Institute and the National Institute of Nursing Research. The study sponsors had no role in design or conduct of the study; collection, management, analysis, or interpretation of the data; or preparation, review, or approval of the manuscript. The views expressed in this article are those of the authors and do not necessarily reflect the position or policy of the US Department of Veterans Affairs or the US government. All authors are independent of the study sponsors. Dr. May was supported by a HRB/NCI Health Economics Fellowship during this work. Dr. Garrido is supported by a Veterans Affairs HSR&D career development award (CDA 11-201/CDP 12-255). Dr. Kelley’s time was funded by the National Institute on Aging (1K23AG040774-01A1) and the American Federation for Aging. Dr. Smith is funded by the NCI Core Grant P 30 006973, 1-R01 CA177562-01A1, 1-R01 NR014050 01, and the Harry J. Duffey Family Endowment for Palliative Care. Dr. Morrison was the recipient of a Midcareer Investigator Award in Patient-Oriented Research (5K24AG022345) during the course of this work. This work was supported by the NIA, Claude D. Pepper Older Americans Independence Center at the Icahn School of Medicine at Mount Sinai [5P30AG028741], and the National Palliative Care Research Center.
1. Soni A. Top 10 Most Costly Conditions Among Men and Women, 2008: Estimates for the U.S. Civilian Noninstitutionalized Adult Population, Age 18 and Older. Rockville, MD: Agency for Healthcare Research and Quality; 2011.
2. Mariotto AB, Yabroff KR, Shao Y, Feuer EJ, Brown ML. Projections of the cost of cancer care in the United States: 2010-2020. J Natl Cancer Inst. 2011;103(2):117-128. PubMed
3. American Cancer Society. Cancer Facts and Figures 2015. Atlanta, GA: American Cancer Society; 2015.
4. Smith TJ, Hillner BE. Bending the cost curve in cancer care. N Engl J Med. 2011;364(21):2060-2065. PubMed
5. Levit L, Balogh E, Nass S, Ganz PA, eds. Delivering High-Quality Cancer Care: Charting a New Course for a System in Crisis. Washington, DC: Institute of Medicine/National Academies Press; 2013. PubMed
7. Anderson GF. Chronic Care: Making the Case for Ongoing Care. Princeton, NJ: Robert Wood Johnson Foundation; 2010.
8. Tibi-Levy Y, Le Vaillant M, de Pouvourville G. Determinants of resource utilization in four palliative care units. Palliat Med. 2006;20(2):95-106. PubMed
9. Simoens S, Kutten B, Keirse E, et al. The costs of treating terminal patients. J Pain Symptom Manage. 2010;40(3):436-448. PubMed
10. Groeneveld I, Murtagh F, Kaloki Y, Bausewein C, Higginson I. Determinants of healthcare costs in the last year of life. Annual Assembly of American Academy of Hospice and Palliative Medicine & Hospice and Palliative Nurses Association; March 14, 2013; New Orleans, LA.
11. Shugarman LR, Bird CE, Schuster CR, Lynn J. Age and gender differences in Medicare expenditures at the end of life for colorectal cancer decedents. J Womens Health. 2007;16(2):214-227. PubMed
12. Shugarman LR, Bird CE, Schuster CR, Lynn J. Age and gender differences in Medicare expenditures and service utilization at the end of life for lung cancer decedents. Womens Health Issues. 2008;18(3):199-209. PubMed
13. Walker H, Anderson M, Farahati F, et al. Resource use and costs of end-of-life/palliative care: Ontario adult cancer patients dying during 2002 and 2003. J Palliat Care. 2011;27(2):79-88. PubMed
14. Hanchate A, Kronman AC, Young-Xu Y, Ash AS, Emanuel E. Racial and ethnic differences in end-of-life costs: why do minorities cost more than whites? Arch Intern Med. 2009;169(5):493-501. PubMed
15. Hanratty B, Burstrom B, Walander A, Whitehead M. Inequality in the face of death? Public expenditure on health care for different socioeconomic groups in the last year of life. J Health Serv Res Policy. 2007;12(2):90-94. PubMed
16. Kelley AS, Ettner SL, Morrison RS, Du Q, Wenger NS, Sarkisian CA. Determinants of medical expenditures in the last 6 months of life. Ann Intern Med. 2011;154(4):235-242. PubMed
17. Guerriere DN, Zagorski B, Fassbender K, Masucci L, Librach L, Coyte PC. Cost variations in ambulatory and home-based palliative care. Palliat Med. 2010;24(5):523-532. PubMed
18. US Department of Health and Human Services, National Institutes of Health. Palliative Care for Hospitalized Cancer Patients [project information]. Bethesda, MD: US Dept of Health and Human Services, National Institutes of Health; 2006. Project 5R01CA116227-04. https://projectreporter.nih.gov/project_info_description.cfm?projectnumber=5R01CA116227-04. Published 2006. Accessed August 1, 2015.
19. May P, Garrido MM, Cassel JB, et al. Prospective cohort study of hospital palliative care teams for inpatients with advanced cancer: earlier consultation is associated with larger cost-saving effect. J Clin Oncol. 2015;33(25):2745-2752. PubMed
20. May P, Garrido MM, Cassel JB, et al. Palliative care teams’ cost-saving effect is larger for cancer patients with higher numbers of comorbidities. Health Aff. 2016;35(1):44-53. PubMed
21. May P, Garrido MM, Cassel JB, Morrison RS, Normand C. Using length of stay to control for unobserved heterogeneity when estimating treatment effect on hospital costs with observational data: issues of reliability, robustness and usefulness. Health Serv Res. 2016;51(5):2020-2043. PubMed
22. Elixhauser A, Steiner C, Harris DR, Coffey RM. Comorbidity measures for use with administrative data. Med Care. 1998;36(1):8-27. PubMed
23. Chang VT, Hwang SS, Kasimis B, Thaler HT. Shorter symptom assessment instruments: the Condensed Memorial Symptom Assessment Scale (CMSAS). Cancer Invest. 2004;22(4):526-536. PubMed
24. Katz S, Ford A, Moskowitz R, Jackson B, Jaffe M. The index of ADL: a standardized measure of biological and psychological function. JAMA. 1963;185(12):914-919. PubMed
25. McLaughlin MA, Orosz GM, Magaziner J, et al. Preoperative status and risk of complications in patients with hip fracture. J Gen Intern Med. 2006;21(3):219-225. PubMed
26. Taheri PA, Butz D, Griffes LC, Morlock DR, Greenfield LJ. Physician impact on the total cost of care. Ann Surg. 2000;231(3):432-435. PubMed
27. US Department of Veterans Affairs, Health Economics Resource Center. Determining costs. Washington, DC: US Dept of Veterans Affairs, Health Economics Resource Center; 2016. http://www.herc.research.va.gov/include/page.asp?id=determining-costs. Published 2016. Accessed September 7, 2016.
28. US Department of Health and Human Services, Center for Medicare & Medicaid Services. FY 2011 Wage Index [Table 2]. Baltimore, MD: US Dept of Health and Human Services, Center for Medicare & Medicaid Services; 2011. http://www.cms.gov/Medicare/Medicare-Fee-for-Service-Payment/AcuteInpatientPPS/Wage-Index-Files-Items/CMS1234173.html. Published 2011. Accessed September 2, 2014.
29. US Department of Labor, Bureau of Labor Statistics. All Urban Consumers (Current Series) [Consumer Price Index database]. US Dept of Labor, Bureau of Labor Statistics; 2015. http://www.bls.gov/cpi/data.htm. Published 2015. Accessed August 15, 2016.
30. Manning WG, Basu A, Mullahy J. Generalized modeling approaches to risk adjustment of skewed outcomes data. J Health Econ. 2005;24(3):465-488. PubMed
31. Jones AM, Rice N, Bago d’Uva T, Balia S. Applied Health Economics. 2nd ed. Oxford, England: Routledge; 2013.
32. Stata [computer program]. Version 12. College Station, TX: StataCorp; 2011.
33. Garrido MM, Kelley AS, Paris J, et al. Methods for constructing and assessing
propensity scores. Health Serv Res. 2014;49(5):1701-1720. PubMed
34. R Core Team. R: A Language and Environment for Statistical Computing. Vienna,
Austria: R Foundation for Statistical Computing; 2016.
35. Cassel JB, Kerr K, Pantilat S, Smith TJ. Palliative care consultation and hospital
length of stay. J Palliat Med. 2010;13(6):761-767. PubMed
36. US Department of Health and Human Services, Agency for Healthcare Research
and Quality. Efforts to Improve Patient Safety Result in 1.3 Million Fewer Patient
Harms: Interim Update on 2013 Annual Hospital-Acquired Condition Rate and
Estimates of Cost Savings and Deaths Averted From 2010 to 2013. Rockville,
MD: US Dept of Health and Human Services, Agency for Healthcare Research
and Quality; 2015. http://www.ahrq.gov/professionals/quality-patient-safety/pfp/
interimhacrate2013.html. Published 2015. Updated November 2015. Accessed
November 18, 2016.
37. Cassidy A. Health Policy Brief: Medicare’s Hospital-Acquired Condition Reduction
Program. http://www.healthaffairs.org/healthpolicybriefs/brief.php?brief_
id=142. Published August 6, 2015. Accessed April 24, 2017.
38. Davis MA, Nallamothu BK, Banerjee M, Bynum JP. Identification of four unique
spending patterns among older adults in the last year of life challenges standard
assumptions. Health Aff. 2016;35(7):1316-1323. PubMed
39. Aldridge MD, Kelley AS. The myth regarding the high cost of end-of-life care.
Am J Public Health. 2015;105(12):2411-2415. PubMed
40. Ferrell BR, Temel JS, Temin S, et al. Integration of palliative care into standard
oncology care: American Society of Clinical Oncology clinical practice guideline
update. J Clin Oncol. 2017;35(1):96-112. PubMed
41. Spetz J, Dudley N, Trupin L, Rogers M, Meier DE, Dumanovsky T. Few hospital
palliative care programs meet national staffing recommendations. Health Aff.
2016;35(9):1690-1697. PubMed
42. Quan H, Sundararajan V, Halfon P, et al. Coding algorithms for defining comorbidities
in ICD-9-CM and ICD-10 administrative data. Med Care. 2005;43(11):1130-1139. PubMed
43. HCUP [Healthcare Cost and Utilization Project] Elixhauser Comorbidity Software
[computer program]. Version 3.7. Rockville, MD: Agency for Healthcare
Research and Quality; 2016. https://www.hcup-us.ahrq.gov/toolssoftware/comorbidity/
comorbidity.jsp. Published 2016. Accessed November 9, 2016.
44. Sharabiani MT, Aylin P, Bottle A. Systematic review of comorbidity indices for
administrative data. Med Care. 2012;50(12):1109-1118. PubMed
Of the major chronic conditions that affect adult patients in the United States, cancer accounts for the highest levels of per capita spending.1 Cost growth for cancer treatment has been substantial and persistent, from $72 billion in 2004 to $125 billion in 2010, and is projected to increase to $173 billion by 2020.2 Thirty-five percent of US direct medical cancer costs are attributable to inpatient hospital stays.3 Policy responses that can provide financially sustainable, high-quality models of care for patients with advanced cancer and other serious illness are urgently sought.4-7
Patterns and levels of resource utilization in providing healthcare to patients with serious illness reflect not only treatment choices but a complex set of relationships among demographic, clinical, and system factors.8-10 Patient-level factors previously identified as potentially significant drivers of resource utilization among cancer populations specifically include age,11 sex,12 primary diagnosis,13 and comorbidities.11 Among end-of-life populations, significant associations have been found between cost and ethnicity,14 socioeconomic status,15 advance directive status,16 insurance status,16 and functional status.17
Evidence on factors strongly associated with cost of hospital admission for patients with advanced cancer can therefore inform provision and planning of healthcare. For example, when a specific diagnosis or clinical condition is found to be associated with high cost, then improving coordination and provision of care for this patient group may reduce avoidable utilization. Determining associations between sociodemographics and hospital care cost can help in identifying possible disparities in care, such as those that might occur when care differs by race, class, or insurance status.
We conducted the Palliative Care for Cancer (PC4C) study, a prospective multisite cohort study of the palliative care consultation team intervention for hospitalized adults with advanced cancer.18,19 In our primary analysis, we controlled for receipt of palliative care and analyzed a rich patient-reported dataset to examine associations between hospital care cost, and sociodemographic factors, clinical variables, and prior healthcare utilization. The results provide evidence regarding the factors most associated with the cost of hospital-based cancer care.
METHODS
Design, Setting, Participants, Data Sources
The PC4C study has been described in detail by authors who estimated the impact of specialist palliative care consultation teams on hospitalization cost.19-21 We prospectively collected sociodemographic, clinical, prior utilization, and cost data for adult patients with a primary diagnosis of advanced cancer admitted to 4 large US hospitals between 2007 and 2011.
All 4 of these high-volume tertiary-care medical centers were selected for their high patient volume (to facilitate sample size) and research capacity (to facilitate proficient recruitment and data collection). Before the study was initiated, it was approved by the institutional review board of each facility. In addition, approval was sought from each attending physician at each hospital site; patients whose physician did not grant approval were not considered for enrollment. More than 95% of physicians gave their approval.
Patients were at least 18 years old and had a primary diagnosis of metastatic solid tumor; central nervous system malignancy; locally advanced head, neck, or pancreas cancer; metastatic melanoma; or transplant-ineligible lymphoma or multiple myeloma. Patients were excluded if they did not speak English, had a diagnosis of dementia, were unresponsive or nonverbal, had been admitted for routine chemotherapy, died or were discharged within 48 hours of admission, or had had a previous palliative care consultation.
Eligible patients were identified through daily review of admissions records and administrative databases. For each potential study patient identified, that patient’s bedside nurse inquired about willingness to participate in the study. Then, for each willing patient, a trained clinical interviewer approached to explain the study and obtain informed consent. With the patient’s consent, family members were also approached and enrolled with written informed consent.
Quantitative Variables
Independent variables. In the dataset, we identified 17 patient-level variables we hypothesized could be significantly associated with hospitalization cost. These variables covered 4 domains:
- Demographics: age, sex, race.
- Socioeconomics/systems: education level, insurance status, presence of advance directive (living will or healthcare proxy).
- Clinical care: primary cancer diagnosis, admitting diagnosis, comorbidities (Elixhauser index22), symptom burden and severity (Condensed Memorial Symptom Assessment Scale [CMSAS]23), and activities of daily living24 or presence of a hospital-acquired condition or complication.25
- Prior utilization: visiting homecare nurse and home health aide within 2 weeks before admission, and analgesic use in morphine sulfate equivalents within week before admission.
Data were collected through a combination of medical record review (age, sex, diagnoses, comorbidities, complications), patient interview (race, education, advance directive, CMSAS, activities of daily living, prior utilization), and hospital administrative databases (insurance). For use in regression, variables were divided into categories when appropriate. Table 1 lists these predictors and their prevalence in the analytic sample.
Dependent variable. The outcome of interest in this analysis was total direct cost of hospital stay. Direct costs are those attributable to the care of a specific patient, as distinct from indirect costs, the shared overhead costs of running a hospital.26 Cost data were extracted from hospital accounting databases and therefore reflect actual costs, the US dollar cost to the hospitals of care provided, also known as direct measurement.27 Costs were standardized for geographical region using the Medicare Wage Index28 and year using the Consumer Price Index29 and are presented here in US dollars for 2011, the final year of data collection.
Statistical Methods
Primary analyses. We regressed total direct hospital costs against all predictors listed in Table 1. To control for receipt of palliative care, we used additional independent variables—a fixed-effects variable for each of 3 hospitals (the fourth hospital was used as the reference case) and a binary treatment variable (whether or not the patient was seen by a palliative care consultation team within 2 days of hospital admission).19,20
Associations between cost and patient-level covariates were derived with use of a generalized linear model with a γ distribution and a log link,30 selected after comparative evaluation of performance for multiple linear and nonlinear modeling options.31
For each patient-level covariate, we estimated average marginal effects. For continuous variables, we estimated the marginal increase in cost associated with a 1-unit increase in the variable. For binary variables, we estimated the average incremental effect, the increase in cost associated with a move from the reference group, holding all other covariates to their original values. All analyses were performed with Stata Version 12.32
Secondary analyses. Primary analyses showed that number of patient comorbidities (Elixhauser index) was strongly associated with complications and comorbidity count. Prior analyses with these data have shown that palliative care had a larger cost-saving effect for patients with a larger number of comorbidities.20 Additional analyses were therefore performed to examine associations between complications, utilization, and palliative care. First, we cross-tabulated the sample by complications status (none; minor or major) and receipt of timely palliative care, and we present their summary utilization data. Second, we estimated the effect for each complications stratum (none; minor or major) of receiving timely palliative care on cost. These estimates are calculated consistent with prior work with these data: We used propensity scores to balance patients who received the treatment (palliative care) with patients who did not (usual care only),33,34 and we used a generalized linear model with a γ distribution and a log link to regress the direct hospital care cost on the binary treatment variable and all predictors listed in Table 1.19-21
RESULTS
Participants
We have previously detailed that in our study there were 1023 patients eligible for cost analysis,19 of whom three were missing data in a field in Table 1 and excluded from this paper. The final analytic sample (N = 1020) is presented according to baseline covariates in Table 1 and according to summary utilization measures in Table 2.
Main Results
The results of the primary analysis, estimating the association between patient-level factors and cost of hospitalization, are presented in Table 3.
These results show the evidence of an association with cost is strongest for 3 clinical factors: a major complication (+$8267; 95% confidence interval [CI], $4509-$12,025), a minor but not a major complication (+$5289; CI, $3480-$7097), and number of comorbidities (+$852; CI, $550-$1153). In addition, there is evidence of associations between lower cost and admitting diagnosis of electrolyte disorders (–$4759; CI, –$7928 to –$1590) and older age (–$53; CI, –$99 to –$6). There is no significant association between primary diagnosis, symptom burden or other clinical factors, sociodemographic factors or healthcare utilization prior to admission and direct hospitalization costs.
Results of the secondary analyses of associations between complications, utilization, and palliative care are listed in Table 4. Patients are stratified by complication (none; major | minor) and their direct cost of hospital care and hospital length of stay (LOS) presented by treatment group (palliative care; usual care only). The data show that within each strata patients who received palliative care had lower costs and LOS than those who received usual care only. Estimated effects of palliative care on utilization is found to be statistically significant in all four quadrants, with a larger cost-effect in the complications stratum than the non-complications stratum.
Sensitivity Analysis
Fifty-one patients died during admission. After removing these cases, because of concerns about possible unobserved heterogeneity,35 we checked our primary (Table 3) and secondary (Table 4) results. Patients discharged alive had results substantively similar to those of the entire sample.
DISCUSSION
Results from our primary analysis (Table 3) suggest that complications and number of comorbidities are the key drivers of hospitalization cost for adults with advanced cancer. Hospitalization for electrolyte disorders and age are both negatively associated with cost.
The association found between higher cost and hospital-acquired complications (HACs) is consistent with other studies’ finding that HACs often result in higher cost, longer LOS, and increased inhospital mortality.36 Since those studies were reported, policy attention has been increasingly focused on HACs.37 Our findings are notable in that, though prior evidence has also suggested high hospital cost is multifactorial, driven by a diversity of demographic, socioeconomic, and clinical factors, this rich patient-reported dataset suggests that, compared with other variables, HACs are emphatically the largest driver of cost. Moreover, cancer patients typically are a vulnerable population, more prone to complications and thus also to potentially avoidable treatments and higher cost. Our prior work suggested earlier palliative care consultation can reduce cost, in part by shortening LOS and reducing the opportunity for HACs to develop19,20; our secondary analysis (Table 4) suggested a palliative care team’s involvement in HAC treatment can significantly reduce cost of care as well. These associations possibly derive from changed treatment choices and shorter LOS. Further work is needed to better elucidate the role of palliative care in the prevention of HACs in seriously ill patients.
That the number of comorbidities was found to be a key driver of hospitalization cost is consistent with recent findings that high spending on seriously ill patients is associated with having multiple chronic conditions rather than any specific primary diagnosis.38,39 It is important to note that, unlike impending complications, serious chronic conditions generally are known at admission and can be addressed prospectively through provision and policy. A prior analysis with these data found that palliative care consultation was more cost-effective for patients with a larger number of comorbidities.20 Our 2 studies together suggest that, notwithstanding the preferable alternative of avoiding hospitalization entirely, palliative care and other skilled coordination of care services ought to be prioritized for inpatients with multiple serious illnesses and the highest medical complexity. This patient group has both the highest costs and the greatest amenability to skilled transdisciplinary intervention, possibly because multiple chronic conditions affect patients interactively, complicating identification of appropriate polypharmacy responses and prioritization of treatments.
Our findings also may help direct appropriate use of palliative care services. The recently published American Society of Clinical Oncology palliative care guidelines note that all patients with advanced cancer (eg, those enrolled in our study) should receive dedicated palliative care services, early in the disease course, concurrent with active treatment.40 Workforce estimates suggest that the current and future numbers of palliative care practitioners will be unable to meet the ASCO recommendations alone never mind patients with other serious illnesses (eg, advanced heart failure, COPD, CKD).41 As such, specialized palliative care services will need to be targeted to the patient populations that can benefit most from these services. Whereas cost should not be the principle driver specialized palliative care provision, it will likely be an important component due to both the necessity of allocating scarce resources in the most effective way and the evidence that in care of the seriously-ill lower costs are often a proxy for improved patient experience.
These findings also have implications for research: Different conditions and presumably different combinations of conditions have very different implications for hospital care costs for a cohort of adults with advanced cancer. Given the increasing number of co-occurring conditions among seriously ill patients, and the increasing costs of cancer care and of treating multimorbidity cases, it is essential to further our understanding of the relationship between comorbidities and costs in order to plan and finance care for advanced cancer patients.
Limitations and Generalizability
In this observational study, reported associations may be attributable to unobserved confounding that our analyses failed to control.
Our results reflect associations in a prospective multisite study of advanced cancer patients hospitalized in the United States. It is not clear how generalizable our findings are to patients without cancer, to patients in nonhospital settings, and to patients in other health systems and countries. Analyzing cost from the hospital perspective does not take into account that the most impactful way to reduce cost is to avoid hospitalization entirely.
Results of our secondary analysis will not necessarily be robust to patient groups, as specific weights likely will vary by sample. The idea that costs vary by condition, however, is important nevertheless. Elixhauser total was derived with use of the enhanced ICD-9-CM (International Classification of Diseases, Ninth Revision, Clinical Modification) algorithm from Quan et al.42 and does not include subsequent Elixhauser Comorbidity Software updates recommended by the Healthcare Cost and Utilization Project (HCUP; Agency for Healthcare Research and Quality).43 The Elixhauser index is recommended over Charlson and other comorbidity indices by both HCUP45 and a recent systematic review.44
One possible unobserved factor is prior chemotherapy, which is associated with increased hospitalization risk. Related factors that are somewhat controlled for in the study include cancer stage (advanced cancer was an eligibility criterion) and receipt of analgesics within the week before admission (patients admitted for routine chemotherapy were excluded from analyses at the outset).
CONCLUSION
Other studies have identified a wide range of sociodemographic, clinical, and health system factors associated with healthcare utilization. Our results suggest that, for cost of hospital admission among adults with advanced cancer, the most important drivers of utilization are complications and comorbidities. Hospital costs for patients with advanced cancer constitute a major part of US healthcare spending, and these results suggest the need to prioritize high-quality, cost-effective care for patients with multiple serious illnesses.
Acknowledgments
The authors thank Robert Arnold, Phil Santa Emma, Mary Beth Happ, Tim Smith, and David Weissman for contributing to the Palliative Care for Cancer (PC4C) project.
Disclosure
The study was funded by grant R01 CA116227 from the National Cancer Institute and the National Institute of Nursing Research. The study sponsors had no role in design or conduct of the study; collection, management, analysis, or interpretation of the data; or preparation, review, or approval of the manuscript. The views expressed in this article are those of the authors and do not necessarily reflect the position or policy of the US Department of Veterans Affairs or the US government. All authors are independent of the study sponsors. Dr. May was supported by a HRB/NCI Health Economics Fellowship during this work. Dr. Garrido is supported by a Veterans Affairs HSR&D career development award (CDA 11-201/CDP 12-255). Dr. Kelley’s time was funded by the National Institute on Aging (1K23AG040774-01A1) and the American Federation for Aging. Dr. Smith is funded by the NCI Core Grant P 30 006973, 1-R01 CA177562-01A1, 1-R01 NR014050 01, and the Harry J. Duffey Family Endowment for Palliative Care. Dr. Morrison was the recipient of a Midcareer Investigator Award in Patient-Oriented Research (5K24AG022345) during the course of this work. This work was supported by the NIA, Claude D. Pepper Older Americans Independence Center at the Icahn School of Medicine at Mount Sinai [5P30AG028741], and the National Palliative Care Research Center.
1. Soni A. Top 10 Most Costly Conditions Among Men and Women, 2008: Estimates for the U.S. Civilian Noninstitutionalized Adult Population, Age 18 and Older. Rockville, MD: Agency for Healthcare Research and Quality; 2011.
2. Mariotto AB, Yabroff KR, Shao Y, Feuer EJ, Brown ML. Projections of the cost of cancer care in the United States: 2010-2020. J Natl Cancer Inst. 2011;103(2):117-128. PubMed
3. American Cancer Society. Cancer Facts and Figures 2015. Atlanta, GA: American Cancer Society; 2015.
4. Smith TJ, Hillner BE. Bending the cost curve in cancer care. N Engl J Med. 2011;364(21):2060-2065. PubMed
5. Levit L, Balogh E, Nass S, Ganz PA, eds. Delivering High-Quality Cancer Care: Charting a New Course for a System in Crisis. Washington, DC: Institute of Medicine/National Academies Press; 2013. PubMed
7. Anderson GF. Chronic Care: Making the Case for Ongoing Care. Princeton, NJ: Robert Wood Johnson Foundation; 2010.
8. Tibi-Levy Y, Le Vaillant M, de Pouvourville G. Determinants of resource utilization in four palliative care units. Palliat Med. 2006;20(2):95-106. PubMed
9. Simoens S, Kutten B, Keirse E, et al. The costs of treating terminal patients. J Pain Symptom Manage. 2010;40(3):436-448. PubMed
10. Groeneveld I, Murtagh F, Kaloki Y, Bausewein C, Higginson I. Determinants of healthcare costs in the last year of life. Annual Assembly of American Academy of Hospice and Palliative Medicine & Hospice and Palliative Nurses Association; March 14, 2013; New Orleans, LA.
11. Shugarman LR, Bird CE, Schuster CR, Lynn J. Age and gender differences in Medicare expenditures at the end of life for colorectal cancer decedents. J Womens Health. 2007;16(2):214-227. PubMed
12. Shugarman LR, Bird CE, Schuster CR, Lynn J. Age and gender differences in Medicare expenditures and service utilization at the end of life for lung cancer decedents. Womens Health Issues. 2008;18(3):199-209. PubMed
13. Walker H, Anderson M, Farahati F, et al. Resource use and costs of end-of-life/palliative care: Ontario adult cancer patients dying during 2002 and 2003. J Palliat Care. 2011;27(2):79-88. PubMed
14. Hanchate A, Kronman AC, Young-Xu Y, Ash AS, Emanuel E. Racial and ethnic differences in end-of-life costs: why do minorities cost more than whites? Arch Intern Med. 2009;169(5):493-501. PubMed
15. Hanratty B, Burstrom B, Walander A, Whitehead M. Inequality in the face of death? Public expenditure on health care for different socioeconomic groups in the last year of life. J Health Serv Res Policy. 2007;12(2):90-94. PubMed
16. Kelley AS, Ettner SL, Morrison RS, Du Q, Wenger NS, Sarkisian CA. Determinants of medical expenditures in the last 6 months of life. Ann Intern Med. 2011;154(4):235-242. PubMed
17. Guerriere DN, Zagorski B, Fassbender K, Masucci L, Librach L, Coyte PC. Cost variations in ambulatory and home-based palliative care. Palliat Med. 2010;24(5):523-532. PubMed
18. US Department of Health and Human Services, National Institutes of Health. Palliative Care for Hospitalized Cancer Patients [project information]. Bethesda, MD: US Dept of Health and Human Services, National Institutes of Health; 2006. Project 5R01CA116227-04. https://projectreporter.nih.gov/project_info_description.cfm?projectnumber=5R01CA116227-04. Published 2006. Accessed August 1, 2015.
19. May P, Garrido MM, Cassel JB, et al. Prospective cohort study of hospital palliative care teams for inpatients with advanced cancer: earlier consultation is associated with larger cost-saving effect. J Clin Oncol. 2015;33(25):2745-2752. PubMed
20. May P, Garrido MM, Cassel JB, et al. Palliative care teams’ cost-saving effect is larger for cancer patients with higher numbers of comorbidities. Health Aff. 2016;35(1):44-53. PubMed
21. May P, Garrido MM, Cassel JB, Morrison RS, Normand C. Using length of stay to control for unobserved heterogeneity when estimating treatment effect on hospital costs with observational data: issues of reliability, robustness and usefulness. Health Serv Res. 2016;51(5):2020-2043. PubMed
22. Elixhauser A, Steiner C, Harris DR, Coffey RM. Comorbidity measures for use with administrative data. Med Care. 1998;36(1):8-27. PubMed
23. Chang VT, Hwang SS, Kasimis B, Thaler HT. Shorter symptom assessment instruments: the Condensed Memorial Symptom Assessment Scale (CMSAS). Cancer Invest. 2004;22(4):526-536. PubMed
24. Katz S, Ford A, Moskowitz R, Jackson B, Jaffe M. The index of ADL: a standardized measure of biological and psychological function. JAMA. 1963;185(12):914-919. PubMed
25. McLaughlin MA, Orosz GM, Magaziner J, et al. Preoperative status and risk of complications in patients with hip fracture. J Gen Intern Med. 2006;21(3):219-225. PubMed
26. Taheri PA, Butz D, Griffes LC, Morlock DR, Greenfield LJ. Physician impact on the total cost of care. Ann Surg. 2000;231(3):432-435. PubMed
27. US Department of Veterans Affairs, Health Economics Resource Center. Determining costs. Washington, DC: US Dept of Veterans Affairs, Health Economics Resource Center; 2016. http://www.herc.research.va.gov/include/page.asp?id=determining-costs. Published 2016. Accessed September 7, 2016.
28. US Department of Health and Human Services, Center for Medicare & Medicaid Services. FY 2011 Wage Index [Table 2]. Baltimore, MD: US Dept of Health and Human Services, Center for Medicare & Medicaid Services; 2011. http://www.cms.gov/Medicare/Medicare-Fee-for-Service-Payment/AcuteInpatientPPS/Wage-Index-Files-Items/CMS1234173.html. Published 2011. Accessed September 2, 2014.
29. US Department of Labor, Bureau of Labor Statistics. All Urban Consumers (Current Series) [Consumer Price Index database]. US Dept of Labor, Bureau of Labor Statistics; 2015. http://www.bls.gov/cpi/data.htm. Published 2015. Accessed August 15, 2016.
30. Manning WG, Basu A, Mullahy J. Generalized modeling approaches to risk adjustment of skewed outcomes data. J Health Econ. 2005;24(3):465-488. PubMed
31. Jones AM, Rice N, Bago d’Uva T, Balia S. Applied Health Economics. 2nd ed. Oxford, England: Routledge; 2013.
32. Stata [computer program]. Version 12. College Station, TX: StataCorp; 2011.
33. Garrido MM, Kelley AS, Paris J, et al. Methods for constructing and assessing
propensity scores. Health Serv Res. 2014;49(5):1701-1720. PubMed
34. R Core Team. R: A Language and Environment for Statistical Computing. Vienna,
Austria: R Foundation for Statistical Computing; 2016.
35. Cassel JB, Kerr K, Pantilat S, Smith TJ. Palliative care consultation and hospital
length of stay. J Palliat Med. 2010;13(6):761-767. PubMed
36. US Department of Health and Human Services, Agency for Healthcare Research
and Quality. Efforts to Improve Patient Safety Result in 1.3 Million Fewer Patient
Harms: Interim Update on 2013 Annual Hospital-Acquired Condition Rate and
Estimates of Cost Savings and Deaths Averted From 2010 to 2013. Rockville,
MD: US Dept of Health and Human Services, Agency for Healthcare Research
and Quality; 2015. http://www.ahrq.gov/professionals/quality-patient-safety/pfp/
interimhacrate2013.html. Published 2015. Updated November 2015. Accessed
November 18, 2016.
37. Cassidy A. Health Policy Brief: Medicare’s Hospital-Acquired Condition Reduction
Program. http://www.healthaffairs.org/healthpolicybriefs/brief.php?brief_
id=142. Published August 6, 2015. Accessed April 24, 2017.
38. Davis MA, Nallamothu BK, Banerjee M, Bynum JP. Identification of four unique
spending patterns among older adults in the last year of life challenges standard
assumptions. Health Aff. 2016;35(7):1316-1323. PubMed
39. Aldridge MD, Kelley AS. The myth regarding the high cost of end-of-life care.
Am J Public Health. 2015;105(12):2411-2415. PubMed
40. Ferrell BR, Temel JS, Temin S, et al. Integration of palliative care into standard
oncology care: American Society of Clinical Oncology clinical practice guideline
update. J Clin Oncol. 2017;35(1):96-112. PubMed
41. Spetz J, Dudley N, Trupin L, Rogers M, Meier DE, Dumanovsky T. Few hospital
palliative care programs meet national staffing recommendations. Health Aff.
2016;35(9):1690-1697. PubMed
42. Quan H, Sundararajan V, Halfon P, et al. Coding algorithms for defining comorbidities
in ICD-9-CM and ICD-10 administrative data. Med Care. 2005;43(11):1130-1139. PubMed
43. HCUP [Healthcare Cost and Utilization Project] Elixhauser Comorbidity Software
[computer program]. Version 3.7. Rockville, MD: Agency for Healthcare
Research and Quality; 2016. https://www.hcup-us.ahrq.gov/toolssoftware/comorbidity/
comorbidity.jsp. Published 2016. Accessed November 9, 2016.
44. Sharabiani MT, Aylin P, Bottle A. Systematic review of comorbidity indices for
administrative data. Med Care. 2012;50(12):1109-1118. PubMed
© 2017 Society of Hospital Medicine
Quality of care of hospitalized infective endocarditis patients: Report from a tertiary medical center
Infective endocarditis (IE) affected an estimated 46,800 Americans in 2011, and its incidence is increasing due to greater numbers of invasive procedures and prevalence of IE risk factors.1-3 Despite recent advances in the treatment of IE, morbidity and mortality remain high: in-hospital mortality in IE patients is 15% to 20%, and the 1-year mortality rate is approximately 40%.2,4,5
Poor IE outcomes may be the result of difficulty in diagnosing IE and identifying its optimal treatments. The American Heart Association (AHA), the American College of Cardiology (ACC), and the European Society of Cardiology (ESC) have published guidelines to address these challenges. Recent guidelines recommend a multidisciplinary approach that includes cardiology, cardiac surgery, and infectious disease (ID) specialty involvement in decision-making.5,6
In the absence of published quality measures for IE management, guidelines can be used to evaluate the quality of care of IE. Studies have showed poor concordance with guideline recommendations but did not examine agreement with more recently published guidelines.7,8 Furthermore, few studies have examined the management, outcomes, and quality of care received by IE patients. Therefore, we aimed to describe a modern cohort of patients with IE admitted to a tertiary medical center over a 4-year period. In particular, we aimed to assess quality of care received by this cohort, as measured by concordance with AHA and ACC guidelines to identify gaps in care and spur quality improvement (QI) efforts.
METHODS
Design and Study Population
We conducted a retrospective cohort study of adult IE patients admitted to Baystate Medical Center (BMC), a 716-bed tertiary academic center that covers a population of 800,000 people throughout western New England. We used the International Classification of Diseases (ICD)–Ninth Revision, to identify IE patients discharged with a principal or secondary diagnosis of IE between 2007 and 2011 (codes 421.0, 421.1, 421.9, 424.9, 424.90, and 424.91). Three co-authors confirmed the diagnosis by conducting a review of the electronic health records.
We included only patients who met modified Duke criteria for definite or possible IE.5 Definite IE defines patients with pathological criteria (microorganisms demonstrated by culture or histologic examination or a histologic examination showing active endocarditis); or patients with 2 major criteria (positive blood culture and evidence of endocardial involvement by echocardiogram), 1 major criterion and 3 minor criteria (minor criteria: predisposing heart conditions or intravenous drug (IVD) use, fever, vascular phenomena, immunologic phenomena, and microbiologic evidence that do not meet the major criteria) or 5 minor criteria. Possible IE defines patients with 1 major and 1 minor criterion or 3 minor criteria.5
Data Collection
We used billing and clinical databases to collect demographics, comorbidities, antibiotic treatment, 6-month readmission and 1-year mortality. Comorbid conditions were classified into Elixhauser comorbidities using software provided by the Healthcare Costs and Utilization Project of the Agency for Healthcare Research and Quality.9,10
We obtained all other data through electronic health record abstraction. These included microbiology, type of endocarditis (native valve endocarditis [NVE] or prosthetic valve endocarditis [PVE]), echocardiographic location of the vegetation, and complications involving the valve (eg, valve perforation, ruptured chorda, perivalvular abscess, or valvular insufficiency).
Using 2006 AHA/ACC guidelines,11 we identified quality metrics, including the presence of at least 2 sets of blood cultures prior to start of antibiotics and use of transthoracic echocardiogram (TTE) and transesophageal echocardiogram (TEE). Guidelines recommend using TTE as first-line to detect valvular vegetations and assess IE complications. TEE is recommended if TTE is nondiagnostic and also as first-line to diagnose PVE. We assessed the rate of consultation with ID, cardiology, and cardiac surgery specialties. While these consultations were not explicitly emphasized in the 2006 AHA/ACC guidelines, there is a class I recommendation in 2014 AHA/ACC guidelines5 to manage IE patients with consultation of all these specialties.
We reported the number of patients with intracardiac leads (pacemaker or defibrillator) who had documentation of intracardiac lead removal. Complete removal of intracardiac leads is indicated in IE patients with infection of leads or device (class I) and suggested for IE caused by Staphylococcus aureus or fungi (even without evidence of device or lead infection), and for patients undergoing valve surgery (class IIa).5 We entered abstracted data elements into a RedCap database, hosted by Tufts Clinical and Translational Science Institute.12
Outcomes
Outcomes included embolic events, strokes, need for cardiac surgery, LOS, inhospital mortality, 6-month readmission, and 1-year mortality. We identified embolic events using documentation of clinical or imaging evidence of an embolic event to the cerebral, coronary, peripheral arterial, renal, splenic, or pulmonary vasculature. We used record extraction to identify incidence of valve surgery. Nearly all patients who require surgery at BMC have it done onsite. We compared outcomes among patients who received less than 3 vs. 3 consultations provided by ID, cardiology, and cardiac surgery specialties. We also compared outcomes among patients who received 0, 1, 2, or 3 consultations to look for a trend.
Statistical Analysis
We divided the cohort into patients with NVE and PVE because there are differences in pathophysiology, treatment, and outcomes of these groups. We calculated descriptive statistics, including means/standard deviation (SD) and n (%). We conducted univariable analyses using Fisher exact (categorical), unpaired t tests (Gaussian), or Kruskal-Wallis equality-of-populations rank test (non-Gaussian). Common language effect sizes were also calculated to quantify group differences without respect to sample size.13,14 Analyses were performed using Stata 14.1. (StataCorp LLC, College Station, Texas). The BMC Institutional Review Board approved the protocol.
RESULTS
We identified a total of 317 hospitalizations at BMC meeting criteria for IE. Of these, 147 hospitalizations were readmissions or did not meet the clinical criteria of definite or possible IE. Thus, we included a total of 170 patients in the final analysis. Definite IE was present in 135 (79.4%) and possible IE in 35 (20.6%) patients.
Patient Characteristics
Of 170 patients, 127 (74.7%) had NVE and 43 (25.3%) had PVE. Mean ± SD age was 60.0 ± 17.9 years, 66.5% (n = 113) of patients were male, and 79.4% (n = 135) were white (Table 1). Hypertension and chronic kidney disease were the most common comorbidities. The median Gagne score15 was 4, corresponding to a 1-year mortality risk of 15%. Predisposing factors for IE included previous history of IE (n = 14 or 8.2%), IVD use (n = 23 or 13.5%), and presence of long-term venous catheters (n = 19 or 11.2%). Intracardiac leads were present in 17.1% (n = 29) of patients. Bicuspid aortic valve was reported in 6.5% (n = 11) of patients with NVE. Patients with PVE were older (+11.5 years, 95% confidence interval [CI] 5.5, 17.5) and more likely to have intracardiac leads (44.2% vs. 7.9%; P < 0.001; Table 1).
Microbiology and Antibiotics
Staphylococcus aureus was isolated in 40.0% of patients (methicillin-sensitive: 21.2%, n = 36; methicillin-resistant: 18.8%, n = 32) and vancomycin (88.2%, n = 150) was the most common initial antibiotic used. Nearly half (44.7%, n = 76) of patients received gentamicin as part of their initial antibiotic regimen. Appendix 1 provides information on final blood culture results, prosthetic versus native valve IE, and antimicrobial agents that each patient received. PVE patients were more likely to receive gentamicin as their initial antibiotic regimen than NVE (58.1% vs. 40.2%; P = 0.051; Table 1).
Echocardiography and Affected Valves
As per study inclusion criteria, all patients received echocardiography (either TTE, TEE, or both). Overall, the most common infected valve was mitral (41.3%), n = 59), followed by aortic valve (28.7%), n = 41). Patients in whom the location of infected valve could not be determined (15.9%, n = 27) had echocardiographic features of intracardiac device infection or intracardiac mass (Table 1).
Quality of Care
Nearly all (n = 165, 97.1%) of patients had at least 2 sets of blood cultures drawn, most on the first day of admission (71.2%). The vast majority of patients (n = 152, 89.4%) also received their first dose of antibiotics on the day of admission. Ten (5.9%) patients did not receive any consults, and 160 (94.1%) received at least 1 consultation. An ID consultation was obtained for most (147, 86.5%) patients; cardiac surgery consultation was obtained for about half of patients (92, 54.1%), and cardiology consultation was also obtained for nearly half of patients (80, 47.1%). One-third (53, 31.2%) did not receive a cardiology or cardiac surgery consult, two-thirds (117, 68.8%) received either a cardiology or a cardiac surgery consult, and one-third (55, 32.4%) received both.
Of the 29 patients who had an intracardiac lead, 6 patients had documentation of the device removal during the index hospitalization (5 or 50.0% of patients with NVE and 1 or 5.3% of patients with PVE; P = 0.02; Table 2).

Outcomes
Evidence of any embolic events was seen in 27.7% (n = 47) of patients, including stroke in 17.1% (n = 29). Median LOS for all patients was 13.5 days, and 6-month readmission among patients who survived their index admission was 51.0% (n = 74/145; 95% CI, 45.9%-62.7%). Inhospital mortality was 14.7% (n = 25; 95% CI: 10.1%-20.9%) and 12-month mortality was 22.4% (n = 38; 95% CI, 16.7%-29.3%). Inhospital mortality was more frequent among patients with PVE than NVE (20.9% vs. 12.6%; P = 0.21), although this difference was not statistically significant. Complications were more common in NVE than PVE (any embolic event: 32.3% vs. 14.0%, P = 0.03; stroke, 20.5% vs. 7.0%, P = 0.06; Table 3).

Although there was a trend toward reduction in 6-month readmission and 12-month mortality with incremental increase in the number of specialties consulted (ID, cardiology and cardiac surgery), the difference was not statistically significant (Figure). In addition, comparing outcomes of embolic events, stroke, 6-month readmission, and 12-month mortality between those who received 3 consults (28.8%, n = 49) to those with fewer than 3 (71.2%, n = 121) did not show statistically significant differences.

Of 92 patients who received a cardiac surgery consult, 73 had NVE and 19 had PVE. Of these, 47 underwent valve surgery, 39 (of 73) with NVE (53.42%) and 8 (of 19) with PVE (42.1%). Most of the NVE patients (73.2%) had more than 1 indication for surgery. The most common indications for surgery among NVE patients were significant valvular dysfunction resulting in heart failure (65.9%), followed by mobile vegetation (56.1%) and recurrent embolic events (26.8%). The most common indication for surgery in PVE was persistent bacteremia or recurrent embolic events (75.0%).
DISCUSSION
In this study, we described the management, quality of care, and outcomes of IE patients in a tertiary medical center. We found that the majority of hospitalized patients with IE were older white men with comorbidities and IE risk factors. The complication rate was high (27.7% with embolic events) and the inhospital mortality rate was in the lower range reported by prior studies [14.7% vs. 15%-20%].5 Nearly one-third of patients (n = 47, 27.7%) received valve surgery. Quality of care received was generally good, with most patients receiving early blood cultures, echocardiograms, early antibiotics, and timely ID consultation. We identified important gaps in care, including a failure to consult cardiac surgery in nearly half of patients and failure to consult cardiology in more than half of patients.
Our findings support work suggesting that IE is no longer primarily a chronic or subacute disease of younger patients with IVD use, positive human immunodeficiency virus status, or bicuspid aortic valves.1,4,16,17 The International Collaboration on Endocarditis-Prospective Cohort Study,4 a multinational prospective cohort study (2000-2005) of 2781 adults with IE, reported a higher prevalence of patients with diabetes or on hemodialysis, IVD users, and patients with long-term venous catheter and intracardiac leads than we found. Yet both studies suggest that the demographics of IE are changing. This may partially explain why IE mortality has not improved in recent years:2,3 patients with older age and higher comorbidity burden may not be considered good surgical candidates.
This study is among the first to contribute information on concordance with IE guidelines in a cohort of U.S. patients. Our findings suggest that most patients received timely blood culture, same-day administration of empiric antibiotics, and ID consultation, which is similar to European studies.7,18 Guideline concordance could be improved in some areas. Overall documentation of the management plan regarding the intracardiac leads could be improved. Only 6 of 29 patients with intracardiac leads had documentation of their removal during the index hospitalization.
The 2014 AHA/ACC guidelines5 and the ESC guidelines6 emphasized the importance of multidisciplinary management of IE. As part of the Heart Valve Team at BMC, cardiologists provide expertise in diagnosis, imaging and clinical management of IE, and cardiac surgeons provide consultation on whether to pursue surgery and optimal timing of surgery. Early discussion with surgical team is considered mandatory in all complicated cases of IE.6,18 Infectious disease consultation has been shown to improve the rate of IE diagnosis, reduce the 6-month relapse rate,19 and improve outcomes in patients with S aureus bacteremia.20 In our study 86.5% of patients had documentation of an ID consultation; cardiac surgery consultation was obtained in 54.1% and cardiology consultation in 47.1% of patients.
We observed a trend towards lower rates of 6-month readmission and 12-month mortality among patients who received all 3 consults (Figure 1), despite the fact that rates of embolic events and stroke were higher in patients with 3 consults compared to those with fewer than 3. Obviously, the lack of confounder adjustment and lack of power limits our ability to make inferences about this association, but it generates hypotheses for future work. Because subjects in our study were cared for prior to 2014, multidisciplinary management of IE with involvement of cardiology, cardiac surgery, and ID physicians was observed in only one-third of patients. However, 117 (68.8%) patients received either cardiology or cardiac surgery consults. It is possible that some physicians considered involving both cardiology and cardiac surgery consultants as unnecessary and, therefore, did not consult both specialties. We will focus future QI efforts in our institution on educating physicians about the benefits of multidisciplinary care and the importance of fully implementing the 2014 AHA/ACC guidelines.
Our findings around quality of care should be placed in the context of 2 studies by González de Molina et al8 and Delahaye et al7 These studies described considerable discordance between guideline recommendations and real-world IE care. However, these studies were performed more than a decade ago and were conducted before current recommendations to consult cardiology and cardiac surgery were published.
In the 2014 AHA/ACC guidelines, surgery prior to completion of antibiotics is indicated in patients with valve dysfunction resulting in heart failure; left-sided IE caused by highly resistant organisms (including fungus or S aureus); IE complicated by heart block, aortic abscess, or penetrating lesions; and presence of persistent infection (bacteremia or fever lasting longer than 5 to 7 days) after onset of appropriate antimicrobial therapy. In addition, there is a Class IIa indication of early surgery in patients with recurrent emboli and persistent vegetation despite appropriate antibiotic therapy and a Class IIb indication of early surgery in patients with NVE with mobile vegetation greater than 10 mm in length. Surgery is recommended for patients with PVE and relapsing infection.
It is recommended that IE patients be cared for in centers with immediate access to cardiac surgery because the urgent need for surgical intervention can arise rapidly.5 We found that nearly one-third of included patients underwent surgery. Although we did not collect data on indications for surgery in patients who did not receive surgery, we observed that 50% had a surgery consult, suggesting the presence of 1 or more surgical indications. Of these, half underwent valve surgery. Most of the NVE patients who underwent surgery had more than 1 indication for surgery. Our surgical rate is similar to a study from Italy3 and overall in the lower range of reported surgical rate (25%-50%) from other studies.21 The low rate of surgery at our center may be related to the fact that the use of surgery for IE has been hotly debated in the literature,21 and may also be due to the low rate of cardiac surgery consultation.
Our study has several limitations. We identified eligible patients using a discharge ICD-9 coding of IE and then confirmed the presence of Duke criteria using record review. Using discharge diagnosis codes for endocarditis has been validated, and our additional manual chart review to confirm Duke criteria likely improved the specificity significantly. However, by excluding patients who did not have documented evidence of Duke criteria, we may have missed some cases, lowering sensitivity. The performance on selected quality metrics may also have been affected by our inclusion criteria. Because we included only patients who met Duke criteria, we tended to include patients who had received blood cultures and echocardiograms, which are part of the criteria. Thus, we cannot comment on use of diagnostic testing or specialty consultation in patients with suspected IE. This was a single-center study and may not represent patients or current practices seen in other institutions. We did not collect data on some of the predisposing factors to NVE (for example, baseline rheumatic heart disease or preexisting valvular heart disease) because it is estimated that less than 5% of IE in the U.S. is superimposed on rheumatic heart disease.4 We likely underestimated 12-month mortality rate because we did not cross-reference our findings again the National Death Index; however, this should not affect the comparison of this outcome between groups.
CONCLUSION
Our study confirms reports that IE epidemiology has changed significantly in recent years. It also suggests that concordance with guideline recommendations is good for some aspects of care (eg, echocardiogram, blood cultures), but can be improved in other areas, particularly in use of specialty consultation during the hospitalization. Future QI efforts should emphasize the role of the heart valve team or endocarditis team that consists of an internist, ID physician, cardiologist, cardiac surgeon, and nursing. Finally, efforts should be made to develop strategies for community hospitals that do not have access to all of these specialists (eg, early transfer, telehealth).
Disclosure
Nothing to report.
1. Pant S, Patel NJ, Deshmukh A, Golwala H, Patel N, Badheka A, et al. Trends in infective endocarditis incidence, microbiology, and valve replacement in the United States from 2000 to 2011. J Am Coll Cardiol. 2015;65(19):2070-2076. PubMed
2. Bor DH, Woolhandler S, Nardin R, Brusch J, Himmelstein DU. Infective endocarditis in the U.S., 1998-2009: a nationwide study. PloS One. 2013;8(3):e60033. PubMed
3. Fedeli U, Schievano E, Buonfrate D, Pellizzer G, Spolaore P. Increasing incidence and mortality of infective endocarditis: a population-based study through a record-linkage system. BMC Infect Dis. 2011;11:48. PubMed
4. Murdoch DR, Corey GR, Hoen B, Miró JM, Fowler VG, Bayer AS, et al. Clinical presentation, etiology, and outcome of infective endocarditis in the 21st century: the International Collaboration on Endocarditis-Prospective Cohort Study. Arch Intern Med. 2009;169(5):463-473. PubMed
5. Nishimura RA, Otto CM, Bonow RO, Carabello BA, Erwin JP, Guyton RA, et al. 2014 AHA/ACC guideline for the management of patients with valvular heart disease: executive summary: a report of the American College of Cardiology/American Heart Association Task Force on Practice Guidelines. J Am Coll Cardiol. 2014;63(22):2438-2488. PubMed
6. Habib G, Lancellotti P, Antunes MJ, Bongiorni MG, Casalta J-P, Del Zotti F, et al. 2015 ESC Guidelines for the management of infective endocarditis: The Task Force for the Management of Infective Endocarditis of the European Society of Cardiology (ESC). Endorsed by: European Association for Cardio-Thoracic Surgery (EACTS), the European Association of Nuclear Medicine (EANM). Eur Heart J. 2015;36(44):3075-3128. PubMed
7. Delahaye F, Rial MO, de Gevigney G, Ecochard R, Delaye J. A critical appraisal of the quality of the management of infective endocarditis. J Am Coll Cardiol. 1999;33(3):788-793. PubMed
8. González De Molina M, Fernández-Guerrero JC, Azpitarte J. [Infectious endocarditis: degree of discordance between clinical guidelines recommendations and clinical practice]. Rev Esp Cardiol. 2002;55(8):793-800. PubMed
9. Elixhauser A, Steiner C, Harris DR, Coffey RM. Comorbidity measures for use with administrative data. Med Care. 1998;36(1):8-27. PubMed
10. Quan H, Parsons GA, Ghali WA. Validity of information on comorbidity derived rom ICD-9-CCM administrative data. Med Care. 2002;40(8):675-685. PubMed
11. American College of Cardiology/American Heart Association Task Force on Practice Guidelines, Society of Cardiovascular Anesthesiologists, Society for Cardiovascular Angiography and Interventions, Society of Thoracic Surgeons, Bonow RO, Carabello BA, Kanu C, deLeon AC Jr, Faxon DP, Freed MD, et al. ACC/AHA 2006 guidelines for the management of patients with valvular heart disease: a report of the American College of Cardiology/American Heart Association Task Force on Practice Guidelines (writing committee to revise the 1998 Guidelines for the Management of Patients With Valvular Heart Disease): developed in collaboration with the Society of Cardiovascular Anesthesiologists: endorsed by the Society for Cardiovascular Angiography and Interventions and the Society of Thoracic Surgeons. Circulation. 2006;114(5):e84-e231.
12. REDCap [Internet]. [cited 2016 May 14]. Available from: https://collaborate.tuftsctsi.org/redcap/.
13. McGraw KO, Wong SP. A common language effect-size statistic. Psychol Bull. 1992;111:361-365.
14. Cohen J. The statistical power of abnormal-social psychological research: a review. J Abnorm Soc Psychol. 1962;65:145-153. PubMed
15. Gagne JJ, Glynn RJ, Avorn J, Levin R, Schneeweiss S. A combined comorbidity score predicted mortality in elderly patients better than existing scores. J Clin Epidemiol. 2011;64(7):749-759. PubMed
16. Baddour LM, Wilson WR, Bayer AS, Fowler VG Jr, Tleyjeh IM, Rybak MJ, et al. Infective endocarditis in adults: Diagnosis, antimicrobial therapy, and management of complications: A scientific statement for healthcare professionals from the American Heart Association. Circulation. 2015;132(15):1435-1486. PubMed
17. Cecchi E, Chirillo F, Castiglione A, Faggiano P, Cecconi M, Moreo A, et al. Clinical epidemiology in Italian Registry of Infective Endocarditis (RIEI): Focus on age, intravascular devices and enterococci. Int J Cardiol. 2015;190:151-156. PubMed
18. Tornos P, Iung B, Permanyer-Miralda G, Baron G, Delahaye F, Gohlke-Bärwolf Ch, et al. Infective endocarditis in Europe: lessons from the Euro heart survey. Heart. 2005;91(5):571-575. PubMed
19. Yamamoto S, Hosokawa N, Sogi M, Inakaku M, Imoto K, Ohji G, et al. Impact of infectious diseases service consultation on diagnosis of infective endocarditis. Scand J Infect Dis. 2012;44(4):270-275. PubMed
20. Rieg S, Küpper MF. Infectious diseases consultations can make the difference: a brief review and a plea for more infectious diseases specialists in Germany. Infection. 2016;(2):159-166. PubMed
21. Prendergast BD, Tornos P. Surgery for infective endocarditis: who and when? Circulation. 2010;121(9):11411152. PubMed
Infective endocarditis (IE) affected an estimated 46,800 Americans in 2011, and its incidence is increasing due to greater numbers of invasive procedures and prevalence of IE risk factors.1-3 Despite recent advances in the treatment of IE, morbidity and mortality remain high: in-hospital mortality in IE patients is 15% to 20%, and the 1-year mortality rate is approximately 40%.2,4,5
Poor IE outcomes may be the result of difficulty in diagnosing IE and identifying its optimal treatments. The American Heart Association (AHA), the American College of Cardiology (ACC), and the European Society of Cardiology (ESC) have published guidelines to address these challenges. Recent guidelines recommend a multidisciplinary approach that includes cardiology, cardiac surgery, and infectious disease (ID) specialty involvement in decision-making.5,6
In the absence of published quality measures for IE management, guidelines can be used to evaluate the quality of care of IE. Studies have showed poor concordance with guideline recommendations but did not examine agreement with more recently published guidelines.7,8 Furthermore, few studies have examined the management, outcomes, and quality of care received by IE patients. Therefore, we aimed to describe a modern cohort of patients with IE admitted to a tertiary medical center over a 4-year period. In particular, we aimed to assess quality of care received by this cohort, as measured by concordance with AHA and ACC guidelines to identify gaps in care and spur quality improvement (QI) efforts.
METHODS
Design and Study Population
We conducted a retrospective cohort study of adult IE patients admitted to Baystate Medical Center (BMC), a 716-bed tertiary academic center that covers a population of 800,000 people throughout western New England. We used the International Classification of Diseases (ICD)–Ninth Revision, to identify IE patients discharged with a principal or secondary diagnosis of IE between 2007 and 2011 (codes 421.0, 421.1, 421.9, 424.9, 424.90, and 424.91). Three co-authors confirmed the diagnosis by conducting a review of the electronic health records.
We included only patients who met modified Duke criteria for definite or possible IE.5 Definite IE defines patients with pathological criteria (microorganisms demonstrated by culture or histologic examination or a histologic examination showing active endocarditis); or patients with 2 major criteria (positive blood culture and evidence of endocardial involvement by echocardiogram), 1 major criterion and 3 minor criteria (minor criteria: predisposing heart conditions or intravenous drug (IVD) use, fever, vascular phenomena, immunologic phenomena, and microbiologic evidence that do not meet the major criteria) or 5 minor criteria. Possible IE defines patients with 1 major and 1 minor criterion or 3 minor criteria.5
Data Collection
We used billing and clinical databases to collect demographics, comorbidities, antibiotic treatment, 6-month readmission and 1-year mortality. Comorbid conditions were classified into Elixhauser comorbidities using software provided by the Healthcare Costs and Utilization Project of the Agency for Healthcare Research and Quality.9,10
We obtained all other data through electronic health record abstraction. These included microbiology, type of endocarditis (native valve endocarditis [NVE] or prosthetic valve endocarditis [PVE]), echocardiographic location of the vegetation, and complications involving the valve (eg, valve perforation, ruptured chorda, perivalvular abscess, or valvular insufficiency).
Using 2006 AHA/ACC guidelines,11 we identified quality metrics, including the presence of at least 2 sets of blood cultures prior to start of antibiotics and use of transthoracic echocardiogram (TTE) and transesophageal echocardiogram (TEE). Guidelines recommend using TTE as first-line to detect valvular vegetations and assess IE complications. TEE is recommended if TTE is nondiagnostic and also as first-line to diagnose PVE. We assessed the rate of consultation with ID, cardiology, and cardiac surgery specialties. While these consultations were not explicitly emphasized in the 2006 AHA/ACC guidelines, there is a class I recommendation in 2014 AHA/ACC guidelines5 to manage IE patients with consultation of all these specialties.
We reported the number of patients with intracardiac leads (pacemaker or defibrillator) who had documentation of intracardiac lead removal. Complete removal of intracardiac leads is indicated in IE patients with infection of leads or device (class I) and suggested for IE caused by Staphylococcus aureus or fungi (even without evidence of device or lead infection), and for patients undergoing valve surgery (class IIa).5 We entered abstracted data elements into a RedCap database, hosted by Tufts Clinical and Translational Science Institute.12
Outcomes
Outcomes included embolic events, strokes, need for cardiac surgery, LOS, inhospital mortality, 6-month readmission, and 1-year mortality. We identified embolic events using documentation of clinical or imaging evidence of an embolic event to the cerebral, coronary, peripheral arterial, renal, splenic, or pulmonary vasculature. We used record extraction to identify incidence of valve surgery. Nearly all patients who require surgery at BMC have it done onsite. We compared outcomes among patients who received less than 3 vs. 3 consultations provided by ID, cardiology, and cardiac surgery specialties. We also compared outcomes among patients who received 0, 1, 2, or 3 consultations to look for a trend.
Statistical Analysis
We divided the cohort into patients with NVE and PVE because there are differences in pathophysiology, treatment, and outcomes of these groups. We calculated descriptive statistics, including means/standard deviation (SD) and n (%). We conducted univariable analyses using Fisher exact (categorical), unpaired t tests (Gaussian), or Kruskal-Wallis equality-of-populations rank test (non-Gaussian). Common language effect sizes were also calculated to quantify group differences without respect to sample size.13,14 Analyses were performed using Stata 14.1. (StataCorp LLC, College Station, Texas). The BMC Institutional Review Board approved the protocol.
RESULTS
We identified a total of 317 hospitalizations at BMC meeting criteria for IE. Of these, 147 hospitalizations were readmissions or did not meet the clinical criteria of definite or possible IE. Thus, we included a total of 170 patients in the final analysis. Definite IE was present in 135 (79.4%) and possible IE in 35 (20.6%) patients.
Patient Characteristics
Of 170 patients, 127 (74.7%) had NVE and 43 (25.3%) had PVE. Mean ± SD age was 60.0 ± 17.9 years, 66.5% (n = 113) of patients were male, and 79.4% (n = 135) were white (Table 1). Hypertension and chronic kidney disease were the most common comorbidities. The median Gagne score15 was 4, corresponding to a 1-year mortality risk of 15%. Predisposing factors for IE included previous history of IE (n = 14 or 8.2%), IVD use (n = 23 or 13.5%), and presence of long-term venous catheters (n = 19 or 11.2%). Intracardiac leads were present in 17.1% (n = 29) of patients. Bicuspid aortic valve was reported in 6.5% (n = 11) of patients with NVE. Patients with PVE were older (+11.5 years, 95% confidence interval [CI] 5.5, 17.5) and more likely to have intracardiac leads (44.2% vs. 7.9%; P < 0.001; Table 1).
Microbiology and Antibiotics
Staphylococcus aureus was isolated in 40.0% of patients (methicillin-sensitive: 21.2%, n = 36; methicillin-resistant: 18.8%, n = 32) and vancomycin (88.2%, n = 150) was the most common initial antibiotic used. Nearly half (44.7%, n = 76) of patients received gentamicin as part of their initial antibiotic regimen. Appendix 1 provides information on final blood culture results, prosthetic versus native valve IE, and antimicrobial agents that each patient received. PVE patients were more likely to receive gentamicin as their initial antibiotic regimen than NVE (58.1% vs. 40.2%; P = 0.051; Table 1).
Echocardiography and Affected Valves
As per study inclusion criteria, all patients received echocardiography (either TTE, TEE, or both). Overall, the most common infected valve was mitral (41.3%), n = 59), followed by aortic valve (28.7%), n = 41). Patients in whom the location of infected valve could not be determined (15.9%, n = 27) had echocardiographic features of intracardiac device infection or intracardiac mass (Table 1).
Quality of Care
Nearly all (n = 165, 97.1%) of patients had at least 2 sets of blood cultures drawn, most on the first day of admission (71.2%). The vast majority of patients (n = 152, 89.4%) also received their first dose of antibiotics on the day of admission. Ten (5.9%) patients did not receive any consults, and 160 (94.1%) received at least 1 consultation. An ID consultation was obtained for most (147, 86.5%) patients; cardiac surgery consultation was obtained for about half of patients (92, 54.1%), and cardiology consultation was also obtained for nearly half of patients (80, 47.1%). One-third (53, 31.2%) did not receive a cardiology or cardiac surgery consult, two-thirds (117, 68.8%) received either a cardiology or a cardiac surgery consult, and one-third (55, 32.4%) received both.
Of the 29 patients who had an intracardiac lead, 6 patients had documentation of the device removal during the index hospitalization (5 or 50.0% of patients with NVE and 1 or 5.3% of patients with PVE; P = 0.02; Table 2).
Outcomes
Evidence of any embolic events was seen in 27.7% (n = 47) of patients, including stroke in 17.1% (n = 29). Median LOS for all patients was 13.5 days, and 6-month readmission among patients who survived their index admission was 51.0% (n = 74/145; 95% CI, 45.9%-62.7%). Inhospital mortality was 14.7% (n = 25; 95% CI: 10.1%-20.9%) and 12-month mortality was 22.4% (n = 38; 95% CI, 16.7%-29.3%). Inhospital mortality was more frequent among patients with PVE than NVE (20.9% vs. 12.6%; P = 0.21), although this difference was not statistically significant. Complications were more common in NVE than PVE (any embolic event: 32.3% vs. 14.0%, P = 0.03; stroke, 20.5% vs. 7.0%, P = 0.06; Table 3).
Although there was a trend toward reduction in 6-month readmission and 12-month mortality with incremental increase in the number of specialties consulted (ID, cardiology and cardiac surgery), the difference was not statistically significant (Figure). In addition, comparing outcomes of embolic events, stroke, 6-month readmission, and 12-month mortality between those who received 3 consults (28.8%, n = 49) to those with fewer than 3 (71.2%, n = 121) did not show statistically significant differences.
Of 92 patients who received a cardiac surgery consult, 73 had NVE and 19 had PVE. Of these, 47 underwent valve surgery, 39 (of 73) with NVE (53.42%) and 8 (of 19) with PVE (42.1%). Most of the NVE patients (73.2%) had more than 1 indication for surgery. The most common indications for surgery among NVE patients were significant valvular dysfunction resulting in heart failure (65.9%), followed by mobile vegetation (56.1%) and recurrent embolic events (26.8%). The most common indication for surgery in PVE was persistent bacteremia or recurrent embolic events (75.0%).
DISCUSSION
In this study, we described the management, quality of care, and outcomes of IE patients in a tertiary medical center. We found that the majority of hospitalized patients with IE were older white men with comorbidities and IE risk factors. The complication rate was high (27.7% with embolic events) and the inhospital mortality rate was in the lower range reported by prior studies [14.7% vs. 15%-20%].5 Nearly one-third of patients (n = 47, 27.7%) received valve surgery. Quality of care received was generally good, with most patients receiving early blood cultures, echocardiograms, early antibiotics, and timely ID consultation. We identified important gaps in care, including a failure to consult cardiac surgery in nearly half of patients and failure to consult cardiology in more than half of patients.
Our findings support work suggesting that IE is no longer primarily a chronic or subacute disease of younger patients with IVD use, positive human immunodeficiency virus status, or bicuspid aortic valves.1,4,16,17 The International Collaboration on Endocarditis-Prospective Cohort Study,4 a multinational prospective cohort study (2000-2005) of 2781 adults with IE, reported a higher prevalence of patients with diabetes or on hemodialysis, IVD users, and patients with long-term venous catheter and intracardiac leads than we found. Yet both studies suggest that the demographics of IE are changing. This may partially explain why IE mortality has not improved in recent years:2,3 patients with older age and higher comorbidity burden may not be considered good surgical candidates.
This study is among the first to contribute information on concordance with IE guidelines in a cohort of U.S. patients. Our findings suggest that most patients received timely blood culture, same-day administration of empiric antibiotics, and ID consultation, which is similar to European studies.7,18 Guideline concordance could be improved in some areas. Overall documentation of the management plan regarding the intracardiac leads could be improved. Only 6 of 29 patients with intracardiac leads had documentation of their removal during the index hospitalization.
The 2014 AHA/ACC guidelines5 and the ESC guidelines6 emphasized the importance of multidisciplinary management of IE. As part of the Heart Valve Team at BMC, cardiologists provide expertise in diagnosis, imaging and clinical management of IE, and cardiac surgeons provide consultation on whether to pursue surgery and optimal timing of surgery. Early discussion with surgical team is considered mandatory in all complicated cases of IE.6,18 Infectious disease consultation has been shown to improve the rate of IE diagnosis, reduce the 6-month relapse rate,19 and improve outcomes in patients with S aureus bacteremia.20 In our study 86.5% of patients had documentation of an ID consultation; cardiac surgery consultation was obtained in 54.1% and cardiology consultation in 47.1% of patients.
We observed a trend towards lower rates of 6-month readmission and 12-month mortality among patients who received all 3 consults (Figure 1), despite the fact that rates of embolic events and stroke were higher in patients with 3 consults compared to those with fewer than 3. Obviously, the lack of confounder adjustment and lack of power limits our ability to make inferences about this association, but it generates hypotheses for future work. Because subjects in our study were cared for prior to 2014, multidisciplinary management of IE with involvement of cardiology, cardiac surgery, and ID physicians was observed in only one-third of patients. However, 117 (68.8%) patients received either cardiology or cardiac surgery consults. It is possible that some physicians considered involving both cardiology and cardiac surgery consultants as unnecessary and, therefore, did not consult both specialties. We will focus future QI efforts in our institution on educating physicians about the benefits of multidisciplinary care and the importance of fully implementing the 2014 AHA/ACC guidelines.
Our findings around quality of care should be placed in the context of 2 studies by González de Molina et al8 and Delahaye et al7 These studies described considerable discordance between guideline recommendations and real-world IE care. However, these studies were performed more than a decade ago and were conducted before current recommendations to consult cardiology and cardiac surgery were published.
In the 2014 AHA/ACC guidelines, surgery prior to completion of antibiotics is indicated in patients with valve dysfunction resulting in heart failure; left-sided IE caused by highly resistant organisms (including fungus or S aureus); IE complicated by heart block, aortic abscess, or penetrating lesions; and presence of persistent infection (bacteremia or fever lasting longer than 5 to 7 days) after onset of appropriate antimicrobial therapy. In addition, there is a Class IIa indication of early surgery in patients with recurrent emboli and persistent vegetation despite appropriate antibiotic therapy and a Class IIb indication of early surgery in patients with NVE with mobile vegetation greater than 10 mm in length. Surgery is recommended for patients with PVE and relapsing infection.
It is recommended that IE patients be cared for in centers with immediate access to cardiac surgery because the urgent need for surgical intervention can arise rapidly.5 We found that nearly one-third of included patients underwent surgery. Although we did not collect data on indications for surgery in patients who did not receive surgery, we observed that 50% had a surgery consult, suggesting the presence of 1 or more surgical indications. Of these, half underwent valve surgery. Most of the NVE patients who underwent surgery had more than 1 indication for surgery. Our surgical rate is similar to a study from Italy3 and overall in the lower range of reported surgical rate (25%-50%) from other studies.21 The low rate of surgery at our center may be related to the fact that the use of surgery for IE has been hotly debated in the literature,21 and may also be due to the low rate of cardiac surgery consultation.
Our study has several limitations. We identified eligible patients using a discharge ICD-9 coding of IE and then confirmed the presence of Duke criteria using record review. Using discharge diagnosis codes for endocarditis has been validated, and our additional manual chart review to confirm Duke criteria likely improved the specificity significantly. However, by excluding patients who did not have documented evidence of Duke criteria, we may have missed some cases, lowering sensitivity. The performance on selected quality metrics may also have been affected by our inclusion criteria. Because we included only patients who met Duke criteria, we tended to include patients who had received blood cultures and echocardiograms, which are part of the criteria. Thus, we cannot comment on use of diagnostic testing or specialty consultation in patients with suspected IE. This was a single-center study and may not represent patients or current practices seen in other institutions. We did not collect data on some of the predisposing factors to NVE (for example, baseline rheumatic heart disease or preexisting valvular heart disease) because it is estimated that less than 5% of IE in the U.S. is superimposed on rheumatic heart disease.4 We likely underestimated 12-month mortality rate because we did not cross-reference our findings again the National Death Index; however, this should not affect the comparison of this outcome between groups.
CONCLUSION
Our study confirms reports that IE epidemiology has changed significantly in recent years. It also suggests that concordance with guideline recommendations is good for some aspects of care (eg, echocardiogram, blood cultures), but can be improved in other areas, particularly in use of specialty consultation during the hospitalization. Future QI efforts should emphasize the role of the heart valve team or endocarditis team that consists of an internist, ID physician, cardiologist, cardiac surgeon, and nursing. Finally, efforts should be made to develop strategies for community hospitals that do not have access to all of these specialists (eg, early transfer, telehealth).
Disclosure
Nothing to report.
1. Pant S, Patel NJ, Deshmukh A, Golwala H, Patel N, Badheka A, et al. Trends in infective endocarditis incidence, microbiology, and valve replacement in the United States from 2000 to 2011. J Am Coll Cardiol. 2015;65(19):2070-2076. PubMed
2. Bor DH, Woolhandler S, Nardin R, Brusch J, Himmelstein DU. Infective endocarditis in the U.S., 1998-2009: a nationwide study. PloS One. 2013;8(3):e60033. PubMed
3. Fedeli U, Schievano E, Buonfrate D, Pellizzer G, Spolaore P. Increasing incidence and mortality of infective endocarditis: a population-based study through a record-linkage system. BMC Infect Dis. 2011;11:48. PubMed
4. Murdoch DR, Corey GR, Hoen B, Miró JM, Fowler VG, Bayer AS, et al. Clinical presentation, etiology, and outcome of infective endocarditis in the 21st century: the International Collaboration on Endocarditis-Prospective Cohort Study. Arch Intern Med. 2009;169(5):463-473. PubMed
5. Nishimura RA, Otto CM, Bonow RO, Carabello BA, Erwin JP, Guyton RA, et al. 2014 AHA/ACC guideline for the management of patients with valvular heart disease: executive summary: a report of the American College of Cardiology/American Heart Association Task Force on Practice Guidelines. J Am Coll Cardiol. 2014;63(22):2438-2488. PubMed
6. Habib G, Lancellotti P, Antunes MJ, Bongiorni MG, Casalta J-P, Del Zotti F, et al. 2015 ESC Guidelines for the management of infective endocarditis: The Task Force for the Management of Infective Endocarditis of the European Society of Cardiology (ESC). Endorsed by: European Association for Cardio-Thoracic Surgery (EACTS), the European Association of Nuclear Medicine (EANM). Eur Heart J. 2015;36(44):3075-3128. PubMed
7. Delahaye F, Rial MO, de Gevigney G, Ecochard R, Delaye J. A critical appraisal of the quality of the management of infective endocarditis. J Am Coll Cardiol. 1999;33(3):788-793. PubMed
8. González De Molina M, Fernández-Guerrero JC, Azpitarte J. [Infectious endocarditis: degree of discordance between clinical guidelines recommendations and clinical practice]. Rev Esp Cardiol. 2002;55(8):793-800. PubMed
9. Elixhauser A, Steiner C, Harris DR, Coffey RM. Comorbidity measures for use with administrative data. Med Care. 1998;36(1):8-27. PubMed
10. Quan H, Parsons GA, Ghali WA. Validity of information on comorbidity derived rom ICD-9-CCM administrative data. Med Care. 2002;40(8):675-685. PubMed
11. American College of Cardiology/American Heart Association Task Force on Practice Guidelines, Society of Cardiovascular Anesthesiologists, Society for Cardiovascular Angiography and Interventions, Society of Thoracic Surgeons, Bonow RO, Carabello BA, Kanu C, deLeon AC Jr, Faxon DP, Freed MD, et al. ACC/AHA 2006 guidelines for the management of patients with valvular heart disease: a report of the American College of Cardiology/American Heart Association Task Force on Practice Guidelines (writing committee to revise the 1998 Guidelines for the Management of Patients With Valvular Heart Disease): developed in collaboration with the Society of Cardiovascular Anesthesiologists: endorsed by the Society for Cardiovascular Angiography and Interventions and the Society of Thoracic Surgeons. Circulation. 2006;114(5):e84-e231.
12. REDCap [Internet]. [cited 2016 May 14]. Available from: https://collaborate.tuftsctsi.org/redcap/.
13. McGraw KO, Wong SP. A common language effect-size statistic. Psychol Bull. 1992;111:361-365.
14. Cohen J. The statistical power of abnormal-social psychological research: a review. J Abnorm Soc Psychol. 1962;65:145-153. PubMed
15. Gagne JJ, Glynn RJ, Avorn J, Levin R, Schneeweiss S. A combined comorbidity score predicted mortality in elderly patients better than existing scores. J Clin Epidemiol. 2011;64(7):749-759. PubMed
16. Baddour LM, Wilson WR, Bayer AS, Fowler VG Jr, Tleyjeh IM, Rybak MJ, et al. Infective endocarditis in adults: Diagnosis, antimicrobial therapy, and management of complications: A scientific statement for healthcare professionals from the American Heart Association. Circulation. 2015;132(15):1435-1486. PubMed
17. Cecchi E, Chirillo F, Castiglione A, Faggiano P, Cecconi M, Moreo A, et al. Clinical epidemiology in Italian Registry of Infective Endocarditis (RIEI): Focus on age, intravascular devices and enterococci. Int J Cardiol. 2015;190:151-156. PubMed
18. Tornos P, Iung B, Permanyer-Miralda G, Baron G, Delahaye F, Gohlke-Bärwolf Ch, et al. Infective endocarditis in Europe: lessons from the Euro heart survey. Heart. 2005;91(5):571-575. PubMed
19. Yamamoto S, Hosokawa N, Sogi M, Inakaku M, Imoto K, Ohji G, et al. Impact of infectious diseases service consultation on diagnosis of infective endocarditis. Scand J Infect Dis. 2012;44(4):270-275. PubMed
20. Rieg S, Küpper MF. Infectious diseases consultations can make the difference: a brief review and a plea for more infectious diseases specialists in Germany. Infection. 2016;(2):159-166. PubMed
21. Prendergast BD, Tornos P. Surgery for infective endocarditis: who and when? Circulation. 2010;121(9):11411152. PubMed
© 2017 Society of Hospital Medicine