User login
Do HCAHPS doctor communication scores reflect the communication skills of the attending on record? A cautionary tale from a tertiary-care medical service
Communication is the foundation of medical care.1 Effective communication can improve health outcomes, safety, adherence, satisfaction, trust, and enable genuine informed consent and decision-making.2-9 Furthermore, high-quality communication increases provider engagement and workplace satisfaction, while reducing stress and malpractice risk.10-15
Direct measurement of communication in the healthcare setting can be challenging. The “Four Habits Model,” which is derived from a synthesis of empiric studies8,16-20 and theoretical models21-24 of communication, offers 1 framework for assessing healthcare communication. The conceptual model underlying the 4 habits has been validated in studies of physician and patient satisfaction.1,4,25-27 The 4 habits are: investing in the beginning, eliciting the patient’s perspective, demonstrating empathy, and investing in the end. Each habit is divided into several identifiable tasks or skill sets, which can be reliably measured using validated tools and checklists.28 One such instrument, the Four Habits Coding Scheme (4HCS), has been evaluated against other tools and demonstrated overall satisfactory inter-rater reliability and validity.29,30
The Hospital Consumer Assessment of Healthcare Providers and Systems (HCAHPS) survey, developed under the direction of the Centers for Medicare and Medicaid Services (CMS) and the Agency for Healthcare Research and Quality, is an established national standard for measuring patient perceptions of care. HCAHPS retrospectively measures global perceptions of communication, support and empathy from physicians and staff, processes of care, and the overall patient experience. HCAHPS scores were first collected nationally in 2006 and have been publicly reported since 2008.31 With the introduction of value-based purchasing in 2012, health system revenues are now tied to HCAHPS survey performance.32 As a result, hospitals are financially motivated to improve HCAHPS scores but lack evidence-based methods for doing so. Some healthcare organizations have invested in communication training programs based on the available literature and best practices.2,33-35 However, it is not known how, if at all, HCAHPS scores relate to physicians’ real-time observed communication skills.
To examine the relationship between physician communication, as reported by global HCAHPS scores, and the quality of physician communication skills in specific encounters, we observed hospitalist physicians during inpatient bedside rounds and measured their communication skills using the 4HCS.
METHODS
Study Design
The study utilized a cross sectional design; physicians who consented were observed on rounds during 3 separate encounters, and we compared hospitalists’ 4HCS scores to their HCAHPS scores to assess the correlation. The study was approved by the Institutional Review Board of the Cleveland Clinic.
Population
The study was conducted at the main campus of the Cleveland Clinic. All physicians specializing in hospital medicine who had received 10 or more completed HCAHPS survey responses while rounding on a medicine service in the past year were invited to participate in the study. Participation was voluntary; night hospitalists were excluded. A research nurse was trained in the Four Habits Model28 and in the use of the 4HCS coding scheme by the principal investigator. The nurse observed each physician and ascertained the presence of communication behaviors using the 4HCS tool. Physicians were observed between August 2013 and August 2014. Multiple observations per physician could occur on the same day, but only 1 observation per patient was used for analysis. Observations consisted of a physician’s first encounter with a hospitalized patient, with the patient’s consent. Observations were conducted during encounters with English-speaking and cognitively intact patients only. Resident physicians were permitted to stay and conduct rounds per their normal routine. Patient information was not collected as part of the study.
Measures
HCAHPS. For each physician, we extracted all HCAHPS scores that were collected from our hospital’s Press Ganey database. The HCAHPS survey contains 22 core questions divided into 7 themes or domains, 1 of which is doctor communication. The survey uses frequency-based questions with possible answers fixed on a 4-point scale (4=always, 3=usually, 2=sometimes, 1=never). Our primary outcome was the doctor communication domain, which comprises 3 questions: 1) During this hospital stay, how often did the doctors treat you with respect? 2) During this hospital stay, how often did the doctors listen to you? and 3) During this hospital stay, how often did the doctors explain things in a language you can understand? Because CMS counts only the percentage of responses that are graded “always,” so-called “top box” scoring, we used the same measure.
The HCAHPS scores are always attributed to the physician at the time of discharge even if he may not have been responsible for the care of the patient during the entire hospital course. To mitigate contamination from patients seen by multiple providers, we cross-matched length of stay (LOS) data with billing data to determine the proportion of days a patient was seen by a single provider during the entire length of stay. We stratified patients seen by the attending providers to less than 50%, 50% to less than 100%, and at 100% of the LOS. However, we were unable to identify which patients were seen by other consultants or by residents due to limitations in data gathering and the nature of the database.

The Four Habits. The Four Habits are: invest in the beginning, elicit the patient’s perspective, demonstrate empathy, and invest in the end (Figure 1). Specific behaviors for Habits 1 to 4 are outlined in the Appendix, but we will briefly describe the themes as follows. Habit 1, invest in the beginning, describes the ability of the physician to set a welcoming environment for the patient, establish rapport, and collaborate on an agenda for the visit. Habit 2, elicit the patient’s perspective, describes the ability of the physician to explore the patients’ worries, ideas, expectations, and the impact of the illness on their lifestyle. Habit 3, demonstrate empathy, describes the physician’s openness to the patient’s emotions as well as the ability to explore, validate; express curiosity, and openly accept these feelings. Habit 4, invest in the end, is a measure of the physician’s ability to counsel patients in a language built around their original concerns or worries, as well as the ability to check the patients’ understanding of the plan.2,29-30
4HCS. The 4HCS tool (Appendix) measures discreet behaviors and phrases based on each of the Four Habits (Figure 1). With a scoring range from a low of 4 to a high of 20, the rater at bedside assigns a range of points on a scale of 1 to 5 for each habit. It is an instrument based on a teaching model used widely throughout Kaiser Permanente to improve clinicians’ communication skills. The 4HCS was first tested for interrater reliability and validity against the Roter Interaction Analysis System using 100 videotaped primary care physician encounters.29 It was further evaluated in a randomized control trial. Videotapes from 497 hospital encounters involving 71 doctors from a variety of clinical specialties were rated by 4 trained raters using the coding scheme. The total score Pearson’s R and intraclass correlation coefficient (ICC) exceeded 0.70 for all pairs of raters, and the interrater reliability was satisfactory for the 4HCS as applied to heterogeneous material.30
STATISTICAL ANALYSIS
Physician characteristics were summarized with standard descriptive statistics. Pearson correlation coefficients were computed between HCAHPS and 4HCS scores. All analyses were performed with RStudio (Boston, MA). The Pearson correlation between the averaged HCAHPS and 4HCS scores was also computed. A correlation with a P value less than 0.05 was considered statistically significant. With 28 physicians, the study had a power of 88% to detect a moderate correlation (greater than 0.50) with a 2-sided alpha of 0.05. We also computed the correlations based on the subgroups of data with patients seen by providers for less than 50%, 50% to less than 100%, and 100% of LOS. All analyses were conducted in SAS 9.2 (SAS Institute Inc., Cary, NC).36
RESULTS
There were 31 physicians who met our inclusion criteria. Of 29 volunteers, 28 were observed during 3 separate inpatient encounters and made up the final sample. A total of 1003 HCAHPS survey responses were available for these physicians. Participants were predominantly female (60.7%), with an average age of 39 years. They were in practice for an average of 4 years (12 were in practice more than 5 years), and 9 were observed on a teaching rotation.

The means of the overall 4HCS scores per observation were 17.39 ± 2.33 for the first, 17.00 ± 2.37 for the second, and 17.43 ± 2.36 for third bedside observation. The mean 4HCS scores per observation, broken down by habit, appear in Table 1. The ICC among the repeated scores within the same physician was 0.81. The median number of HCAHPS survey returns was 32 (range = [8, 85], with mean = 35.8, interquartile range = [16, 54]). The median overall HCAHPS doctor communication score was 89.6 (range = 80.9-93.7). Participants scored the highest in the respect subdomain and the lowest in the explain subdomain. Median HCAHPS scores and ranges appear in Table 2.
Because there were no significant associations between 4HCS scores or HCAHPS scores and physician age, sex, years in practice, or teaching site, correlations were not adjusted. Figure 2A and 2B show the association between mean 4HCS scores and HCAHPS scores by physician. There was no significant correlation between overall 4HCS and HCAHPS doctor communication scores (Pearson correlation coefficient 0.098; 95% confidence interval [CI], -0.285, 0.455). The individual habits also were not correlated with overall HCAHPS scores or with their corresponding HCAHPS domain (Table 3).

For 325 patients, 1 hospitalist was present for the entire LOS. In sensitivity analysis limiting observations to these patients (Figure 2C, Figure 2D, Table 3), we found a moderate correlation between habit 3 and the HCAHPS respect score (Pearson correlation coefficient 0.515; 95% CI, 0.176, 0.745; P = 0.005), and a weaker correlation between habit 3 and the HCAHPS overall doctor communication score (0.442; 95% CI, 0.082, 0.7; P = 0.019). There were no other significant correlations between specific habits and HCAHPS scores.

DISCUSSION
In this observational study of hospitalist physicians at a large tertiary care center, we found that communication skills, as measured by the 4HCS, varied substantially among physicians but were highly correlated within patients of the same physician. However, there was virtually no correlation between the attending physician of record’s 4HCS scores and their HCAHPS communication scores. When we limited our analysis to patients who saw only 1 hospitalist throughout their stay, there were moderate correlations between demonstration of empathy and both the HCAHPS respect score and overall doctor communication score. There were no trends across the strata of hospitalist involvement. It is important to note that the addition of even 1 different hospitalist to the LOS removes any association. Habits 1 and 2 are close to significance in the 100% subgroup, with a weak correlation. Interestingly, Habit 4, which focuses on creating a plan with the patient, showed no correlation at all with patients reporting that doctors explained things in language they could understand.
Development and testing of the HCAHPS survey began in 2002, commissioned by CMS and the Agency for Healthcare Research and Quality for the purpose of measuring patient experience in the hospital. The HCAHPS survey was endorsed by the National Quality Forum in 2005, with final approval of the national implementation granted by the Office of Management and Budget later that year. The CMS began implementation of the HCAHPS survey in 2006, with the first required public reporting of all hospitals taking place in March 2008.37-41 Based on CMS’ value-based purchasing initiative, hospitals with low HCAHPS scores have faced substantial penalties since 2012. Under these circumstances, it is important that the HCAHPS measures what it purports to measure. Because HCAHPS was designed to compare hospitals, testing was limited to assessment of internal reliability, hospital-level reliability, and construct validity. External validation with known measures of physician communication was not performed.41 Our study appears to be the first to compare HCAHPS scores to directly observed measures of physician communication skills. The lack of association between the 2 should sound a cautionary note to hospitals who seek to tie individual compensation to HCAHPS scores to improve them. In particular, the survey asks for a rating for all the patient’s doctors, not just the primary hospitalist. We found that, for hospital stays with just 1 hospitalist, the HCAHPS score reflected observed expression of empathy, although the correlation was only moderate, and HCAHPS were not correlated with other communication skills. Of all communication skills, empathy may be most important. Almost the entire body of research on physician communication cites empathy as a central skill. Empathy improves patient outcomes1-9,13-14,16-18,42 such as adherence to treatment, loyalty, and perception of care; and provider outcomes10-12,15 such as reduced burnout and a decreased likelihood of malpractice litigation.
It is less clear why other communication skills did not correlate with HCAHPS, but several differences in the measures themselves and how they were obtained might be responsible. It is possible that HCAHPS measures something broader than physician communication. In addition, the 4HCS was developed and normed on outpatient encounters as is true for virtually all doctor-patient coding schemes.43 Little is known about inpatient communication best practices. The timing of HCAHPS may also degrade the relationship between observed and reported communication. The HCAHPS questionnaires, collected after discharge, are retrospective reconstructions that are subject to recall bias and recency effects.44,45 In contrast, our observations took place in real time and were specific to the face-to-face interactions that take place when physicians engage patients at the bedside. Third, the response rate for HCAHPS surveys is only 30%, leading to potential sample bias.46 Respondents represent discharged patients who are willing and able to answer surveys, and may not be representative of all hospitalized patients. Finally, as with all global questions, the meaning any individual patient assigns to terms like “respect” may vary.
Our study has several limitations. The HCAHPS and 4HCS scores were not obtained from the same sample of patients. It is possible that the patients who were observed were not representative of the patients who completed the HCAHPS surveys. In addition, the only type of encounter observed was the initial visit between the hospitalist and the patient, and did not include communication during follow-up visits or on the day of discharge. However, there was a strong ICC among the 4HCS scores, implying that the 4HCS measures an inherent physician skill, which should be consistent across patients and encounters. Coding bias of the habits by a single observer could not be excluded. High intra-class correlation could be due in part to observer preferences for particular communication styles. Our sample included only 28 physicians. Although our study was powered to rule out a moderate correlation between 4HCS scores and HCAHPS scores (Pearson correlation coefficient greater than 0.5), we cannot exclude weaker correlations. Most correlations that we observed were so small that they would not be clinically meaningful, even in a much larger sample.
CONCLUSIONS
Our findings that HCAHPS scores did not correlate with the communication skills of the attending of record have some important implications. In an environment of value-based purchasing, most hospital systems are interested in identifying modifiable provider behaviors that optimize efficiency and payment structures. This study shows that directly measured communication skills do not correlate with HCAHPS scores as generally reported, indicating that HCAHPS may be measuring a broader domain than only physician communication skills. Better attribution based on the proportion of care provided by an individual physician could make the scores more useful for individual comparisons, but most institutions do not report their data in this way. Given this limitation, hospitals should refrain from comparing and incentivizing individual physicians based on their HCAHPS scores, because this measure was not designed for this purpose and does not appear to reflect an individual’s skills. This is important in the current environment in which hospitals face substantial penalties for underperformance but lack specific tools to improve their scores. Furthermore, there is concern that this type of measurement creates perverse incentives that may adversely alter clinical practice with the aim of improving scores.46
Training clinicians in communication and teaming skills is one potential means of increasing overall scores.15 Improving doctor-patient and team relationships is also the right thing to do. It is increasingly being demanded by patients and has always been a deep source of satisfaction for physicians.15,47 Moreover, there is an increasingly robust literature that relates face-to-face communication to biomedical and psychosocial outcomes of care.48 Identifying individual physicians who need help with communication skills is a worthwhile goal. Unfortunately, the HCAHPS survey does not appear to be the appropriate tool for this purpose.
Disclosure
The Cleveland Clinic Foundation, Division of Clinical Research, Research Programs Committees provided funding support. No funding source had any role in the study design; in the collection, analysis, and interpretation of data; in the writing of the report; or in the decision to submit the article for publication. The authors have no conflicts of interest for this study.
1. Glass RM. The patient-physician relationship. JAMA focuses on the center of medicine. JAMA. 1996;275(2):147-148. PubMed
2. Stein T, Frankel RM, Krupat E. Enhancing clinician communication skills in a large healthcare organization: a longitudinal case study. Patient Educ Couns. 2005;58(1):4-12. PubMed
3. Stewart M, Brown JB, Donner A, et al. The impact of patient-centered care on outcomes. J Fam Pract. 2000;49(9):796-804. PubMed
4. Safran DG, Taira DA, Rogers WH, Kosinski M, Ware JE, Tarlov AR. Linking primary care performance to outcomes of care. J Fam Pract. 1998;47(3):213-220. PubMed
5. Like R, Zyzanski SJ. Patient satisfaction with the clinical encounter: social psychological determinants. Soc Sci Med. 1987;24(4):351-357. PubMed
6. Williams S, Weinman J, Dale J. Doctor-patient communication and patient satisfaction: a review. Fam Pract. 1998;15(5):480-492. PubMed
7. Ciechanowski P, Katon WJ. The interpersonal experience of health care through the eyes of patients with diabetes. Soc Sci Med. 2006;63(12):3067-3079. PubMed
8. Stewart MA. Effective physician-patient communication and health outcomes: a review. CMAJ. 1995;152(9):1423-1433. PubMed
9. Hojat M, Louis DZ, Markham FW, Wender R, Rabinowitz C, Gonnella JS. Physicians’ empathy and clinical outcomes for diabetic patients. Acad Med. 2011;86(3):359-364. PubMed
10. Levinson W, Roter DL, Mullooly JP, Dull VT, Frankel RM. Physician-patient communication. The relationship with malpractice claims among primary care physicians and surgeons. JAMA. 1997;277(7):553-559. PubMed
11. Ambady N, Laplante D, Nguyen T, Rosenthal R, Chaumeton N, Levinson W. Surgeons’ tone of voice: a clue to malpractice history. Surgery. 2002;132(1):5-9. PubMed
12. Weng HC, Hung CM, Liu YT, et al. Associations between emotional intelligence and doctor burnout, job satisfaction and patient satisfaction. Med Educ. 2011;45(8):835-842. PubMed
13. Mauksch LB, Dugdale DC, Dodson S, Epstein R. Relationship, communication, and efficiency in the medical encounter: creating a clinical model from a literature review. Arch Intern Med. 2008;168(13):1387-1395. PubMed
14. Suchman AL, Roter D, Green M, Lipkin M Jr. Physician satisfaction with primary care office visits. Collaborative Study Group of the American Academy on Physician and Patient. Med Care. 1993;31(12):1083-1092. PubMed
15. Boissy A, Windover AK, Bokar D, et al. Communication skills training for physicians improves patient satisfaction. J Gen Intern Med. 2016;31(7):755-761. PubMed
16. Brody DS, Miller SM, Lerman CE, Smith DG, Lazaro CG, Blum MJ. The relationship between patients’ satisfaction with their physicians and perceptions about interventions they desired and received. Med Care. 1989;27(11):1027-1035. PubMed
17. Wasserman RC, Inui TS, Barriatua RD, Carter WB, Lippincott P. Pediatric clinicians’ support for parents makes a difference: an outcome-based analysis of clinician-parent interaction. Pediatrics. 1984;74(6):1047-1053. PubMed
18. Greenfield S, Kaplan S, Ware JE Jr. Expanding patient involvement in care. Effects on patient outcomes. Ann Intern Med. 1985;102(4):520-528. PubMed
19. Inui TS, Carter WB. Problems and prospects for health services research on provider-patient communication. Med Care. 1985;23(5):521-538. PubMed
20. Beckman H, Frankel R, Kihm J, Kulesza G, Geheb M. Measurement and improvement of humanistic skills in first-year trainees. J Gen Intern Med. 1990;5(1):42-45. PubMed
21. Keller S, O’Malley AJ, Hays RD, et al. Methods used to streamline the CAHPS Hospital Survey. Health Serv Res. 2005;40(6 pt 2):2057-2077. PubMed
22. Engel GL. The clinical application of the biopsychosocial model. Am J Psychiatry. 1980;137(5):535-544. PubMed
23. Lazare A, Eisenthal S, Wasserman L. The customer approach to patienthood. Attending to patient requests in a walk-in clinic. Arch Gen Psychiatry. 1975;32(5):553-558. PubMed
24. Eisenthal S, Lazare A. Evaluation of the initial interview in a walk-in clinic. The clinician’s perspective on a “negotiated approach”. J Nerv Ment Dis. 1977;164(1):30-35. PubMed
25. Kravitz RL, Callahan EJ, Paterniti D, Antonius D, Dunham M, Lewis CE. Prevalence and sources of patients’ unmet expectations for care. Ann Intern Med. 1996;125(9):730-737. PubMed
26. Froehlich GW, Welch HG. Meeting walk-in patients’ expectations for testing. Effects on satisfaction. J Gen Intern Med. 1996;11(8):470-474. PubMed
27. DiMatteo MR, Taranta A, Friedman HS, Prince LM. Predicting patient satisfaction from physicians’ nonverbal communication skills. Med Care. 1980;18(4):376-387. PubMed
28. Frankel RM, Stein T. Getting the most out of the clinical encounter: the four habits model. J Med Pract Manage. 2001;16(4):184-191. PubMed
29. Krupat E, Frankel R, Stein T, Irish J. The Four Habits Coding Scheme: validation of an instrument to assess clinicians’ communication behavior. Patient Educ Couns. 2006;62(1):38-45. PubMed
30. Fossli Jensen B, Gulbrandsen P, Benth JS, Dahl FA, Krupat E, Finset A. Interrater reliability for the Four Habits Coding Scheme as part of a randomized controlled trial. Patient Educ Couns. 2010;80(3):405-409. PubMed
31. Giordano LA, Elliott MN, Goldstein E, Lehrman WG, Spencer PA. Development, implementation, and public reporting of the HCAHPS survey. Med Care Res Rev. 2010;67(1):27-37. PubMed
32. Anonymous. CMS continues to shift emphasis to quality of care. Hosp Case Manag. 2012;20(10):150-151. PubMed
33. The R.E.D.E. Model 2015. Cleveland Clinic Center for Excellence in Healthcare
Communication. http://healthcarecommunication.info/. Accessed April 3 2016.
34. Empathetics, Inc. A Boston-based empathy training firm raises $1.5 million in
Series A Financing 2015. Empathetics Inc. http://www.prnewswire.com/news-releases/
empathetics-inc----a-boston-based-empathy-training-firm-raises-15-million-
in-series-a-financing-300072696.html). Accessed April 3, 2016.
35. Intensive Communication Skills 2016. Institute for Healthcare Communication.
http://healthcarecomm.org/. Accessed April 3, 2016.
36. Hu B, Palta M, Shao J. Variability explained by covariates in linear mixed-effect
models for longitudinal data. Canadian Journal of Statistics. 2010;38:352-368.
37. O’Malley AJ, Zaslavsky AM, Elliott MN, Zaborski L, Cleary PD. Case-mix adjustment
of the CAHPS Hospital Survey. Health Serv Res. 2005;40(6 pt 2):2162-2181. PubMed
38. O’Malley AJ, Zaslavsky AM, Hays RD, Hepner KA, Keller S, Cleary PD. Exploratory
factor analyses of the CAHPS Hospital Pilot Survey responses across
and within medical, surgical, and obstetric services. Health Serv Res. 2005;40(6 pt
2):2078-2095. PubMed
39. Goldstein E, Farquhar M, Crofton C, Darby C, Garfinkel S. Measuring hospital
care from the patients’ perspective: an overview of the CAHPS Hospital Survey
development process. Health Serv Res. 2005;40(6 pt 2):1977-1995. PubMed
40. Darby C, Hays RD, Kletke P. Development and evaluation of the CAHPS hospital
survey. Health Serv Res. 2005;40(6 pt 2):1973-1976. PubMed
41. Keller VF, Carroll JG. A new model for physician-patient communication. Patient
Educ Couns. 1994;23(2):131-140. PubMed
42. Quirk M, Mazor K, Haley HL, et al. How patients perceive a doctor’s caring attitude.
Patient Educ Couns. 2008;72(3):359-366. PubMed
43. Frankel RM, Levinson W. Back to the future: Can conversation analysis be used
to judge physicians’ malpractice history? Commun Med. 2014;11(1):27-39. PubMed
44. Furnham A. Response bias, social desirability and dissimulation. Personality and
individual differences 1986;7(3):385-400.
45. Shteingart H, Neiman T, Loewenstein Y. The role of first impression in operant
learning. J Exp Psychol Gen. 2013;142(2):476-488. PubMed
46. Tefera L, Lehrman WG, Conway P. Measurement of the patient experience: clarifying
facts, myths, and approaches. JAMA. 2016;315(2):2167-2168. PubMed
47. Horowitz CR, Suchman AL, Branch WT Jr, Frankel RM. What do doctors find
meaningful about their work? Ann Intern Med. 2003;138(9):772-775. PubMed
48. Rao JK, Anderson LA, Inui TS, Frankel RM. Communication interventions make
a difference in conversations between physicians and patients: a systematic review
of the evidence. Med Care. 2007;45(4):340-349. PubMed
Communication is the foundation of medical care.1 Effective communication can improve health outcomes, safety, adherence, satisfaction, trust, and enable genuine informed consent and decision-making.2-9 Furthermore, high-quality communication increases provider engagement and workplace satisfaction, while reducing stress and malpractice risk.10-15
Direct measurement of communication in the healthcare setting can be challenging. The “Four Habits Model,” which is derived from a synthesis of empiric studies8,16-20 and theoretical models21-24 of communication, offers 1 framework for assessing healthcare communication. The conceptual model underlying the 4 habits has been validated in studies of physician and patient satisfaction.1,4,25-27 The 4 habits are: investing in the beginning, eliciting the patient’s perspective, demonstrating empathy, and investing in the end. Each habit is divided into several identifiable tasks or skill sets, which can be reliably measured using validated tools and checklists.28 One such instrument, the Four Habits Coding Scheme (4HCS), has been evaluated against other tools and demonstrated overall satisfactory inter-rater reliability and validity.29,30
The Hospital Consumer Assessment of Healthcare Providers and Systems (HCAHPS) survey, developed under the direction of the Centers for Medicare and Medicaid Services (CMS) and the Agency for Healthcare Research and Quality, is an established national standard for measuring patient perceptions of care. HCAHPS retrospectively measures global perceptions of communication, support and empathy from physicians and staff, processes of care, and the overall patient experience. HCAHPS scores were first collected nationally in 2006 and have been publicly reported since 2008.31 With the introduction of value-based purchasing in 2012, health system revenues are now tied to HCAHPS survey performance.32 As a result, hospitals are financially motivated to improve HCAHPS scores but lack evidence-based methods for doing so. Some healthcare organizations have invested in communication training programs based on the available literature and best practices.2,33-35 However, it is not known how, if at all, HCAHPS scores relate to physicians’ real-time observed communication skills.
To examine the relationship between physician communication, as reported by global HCAHPS scores, and the quality of physician communication skills in specific encounters, we observed hospitalist physicians during inpatient bedside rounds and measured their communication skills using the 4HCS.
METHODS
Study Design
The study utilized a cross sectional design; physicians who consented were observed on rounds during 3 separate encounters, and we compared hospitalists’ 4HCS scores to their HCAHPS scores to assess the correlation. The study was approved by the Institutional Review Board of the Cleveland Clinic.
Population
The study was conducted at the main campus of the Cleveland Clinic. All physicians specializing in hospital medicine who had received 10 or more completed HCAHPS survey responses while rounding on a medicine service in the past year were invited to participate in the study. Participation was voluntary; night hospitalists were excluded. A research nurse was trained in the Four Habits Model28 and in the use of the 4HCS coding scheme by the principal investigator. The nurse observed each physician and ascertained the presence of communication behaviors using the 4HCS tool. Physicians were observed between August 2013 and August 2014. Multiple observations per physician could occur on the same day, but only 1 observation per patient was used for analysis. Observations consisted of a physician’s first encounter with a hospitalized patient, with the patient’s consent. Observations were conducted during encounters with English-speaking and cognitively intact patients only. Resident physicians were permitted to stay and conduct rounds per their normal routine. Patient information was not collected as part of the study.
Measures
HCAHPS. For each physician, we extracted all HCAHPS scores that were collected from our hospital’s Press Ganey database. The HCAHPS survey contains 22 core questions divided into 7 themes or domains, 1 of which is doctor communication. The survey uses frequency-based questions with possible answers fixed on a 4-point scale (4=always, 3=usually, 2=sometimes, 1=never). Our primary outcome was the doctor communication domain, which comprises 3 questions: 1) During this hospital stay, how often did the doctors treat you with respect? 2) During this hospital stay, how often did the doctors listen to you? and 3) During this hospital stay, how often did the doctors explain things in a language you can understand? Because CMS counts only the percentage of responses that are graded “always,” so-called “top box” scoring, we used the same measure.
The HCAHPS scores are always attributed to the physician at the time of discharge even if he may not have been responsible for the care of the patient during the entire hospital course. To mitigate contamination from patients seen by multiple providers, we cross-matched length of stay (LOS) data with billing data to determine the proportion of days a patient was seen by a single provider during the entire length of stay. We stratified patients seen by the attending providers to less than 50%, 50% to less than 100%, and at 100% of the LOS. However, we were unable to identify which patients were seen by other consultants or by residents due to limitations in data gathering and the nature of the database.
The Four Habits. The Four Habits are: invest in the beginning, elicit the patient’s perspective, demonstrate empathy, and invest in the end (Figure 1). Specific behaviors for Habits 1 to 4 are outlined in the Appendix, but we will briefly describe the themes as follows. Habit 1, invest in the beginning, describes the ability of the physician to set a welcoming environment for the patient, establish rapport, and collaborate on an agenda for the visit. Habit 2, elicit the patient’s perspective, describes the ability of the physician to explore the patients’ worries, ideas, expectations, and the impact of the illness on their lifestyle. Habit 3, demonstrate empathy, describes the physician’s openness to the patient’s emotions as well as the ability to explore, validate; express curiosity, and openly accept these feelings. Habit 4, invest in the end, is a measure of the physician’s ability to counsel patients in a language built around their original concerns or worries, as well as the ability to check the patients’ understanding of the plan.2,29-30
4HCS. The 4HCS tool (Appendix) measures discreet behaviors and phrases based on each of the Four Habits (Figure 1). With a scoring range from a low of 4 to a high of 20, the rater at bedside assigns a range of points on a scale of 1 to 5 for each habit. It is an instrument based on a teaching model used widely throughout Kaiser Permanente to improve clinicians’ communication skills. The 4HCS was first tested for interrater reliability and validity against the Roter Interaction Analysis System using 100 videotaped primary care physician encounters.29 It was further evaluated in a randomized control trial. Videotapes from 497 hospital encounters involving 71 doctors from a variety of clinical specialties were rated by 4 trained raters using the coding scheme. The total score Pearson’s R and intraclass correlation coefficient (ICC) exceeded 0.70 for all pairs of raters, and the interrater reliability was satisfactory for the 4HCS as applied to heterogeneous material.30
STATISTICAL ANALYSIS
Physician characteristics were summarized with standard descriptive statistics. Pearson correlation coefficients were computed between HCAHPS and 4HCS scores. All analyses were performed with RStudio (Boston, MA). The Pearson correlation between the averaged HCAHPS and 4HCS scores was also computed. A correlation with a P value less than 0.05 was considered statistically significant. With 28 physicians, the study had a power of 88% to detect a moderate correlation (greater than 0.50) with a 2-sided alpha of 0.05. We also computed the correlations based on the subgroups of data with patients seen by providers for less than 50%, 50% to less than 100%, and 100% of LOS. All analyses were conducted in SAS 9.2 (SAS Institute Inc., Cary, NC).36
RESULTS
There were 31 physicians who met our inclusion criteria. Of 29 volunteers, 28 were observed during 3 separate inpatient encounters and made up the final sample. A total of 1003 HCAHPS survey responses were available for these physicians. Participants were predominantly female (60.7%), with an average age of 39 years. They were in practice for an average of 4 years (12 were in practice more than 5 years), and 9 were observed on a teaching rotation.
The means of the overall 4HCS scores per observation were 17.39 ± 2.33 for the first, 17.00 ± 2.37 for the second, and 17.43 ± 2.36 for third bedside observation. The mean 4HCS scores per observation, broken down by habit, appear in Table 1. The ICC among the repeated scores within the same physician was 0.81. The median number of HCAHPS survey returns was 32 (range = [8, 85], with mean = 35.8, interquartile range = [16, 54]). The median overall HCAHPS doctor communication score was 89.6 (range = 80.9-93.7). Participants scored the highest in the respect subdomain and the lowest in the explain subdomain. Median HCAHPS scores and ranges appear in Table 2.
Because there were no significant associations between 4HCS scores or HCAHPS scores and physician age, sex, years in practice, or teaching site, correlations were not adjusted. Figure 2A and 2B show the association between mean 4HCS scores and HCAHPS scores by physician. There was no significant correlation between overall 4HCS and HCAHPS doctor communication scores (Pearson correlation coefficient 0.098; 95% confidence interval [CI], -0.285, 0.455). The individual habits also were not correlated with overall HCAHPS scores or with their corresponding HCAHPS domain (Table 3).
For 325 patients, 1 hospitalist was present for the entire LOS. In sensitivity analysis limiting observations to these patients (Figure 2C, Figure 2D, Table 3), we found a moderate correlation between habit 3 and the HCAHPS respect score (Pearson correlation coefficient 0.515; 95% CI, 0.176, 0.745; P = 0.005), and a weaker correlation between habit 3 and the HCAHPS overall doctor communication score (0.442; 95% CI, 0.082, 0.7; P = 0.019). There were no other significant correlations between specific habits and HCAHPS scores.
DISCUSSION
In this observational study of hospitalist physicians at a large tertiary care center, we found that communication skills, as measured by the 4HCS, varied substantially among physicians but were highly correlated within patients of the same physician. However, there was virtually no correlation between the attending physician of record’s 4HCS scores and their HCAHPS communication scores. When we limited our analysis to patients who saw only 1 hospitalist throughout their stay, there were moderate correlations between demonstration of empathy and both the HCAHPS respect score and overall doctor communication score. There were no trends across the strata of hospitalist involvement. It is important to note that the addition of even 1 different hospitalist to the LOS removes any association. Habits 1 and 2 are close to significance in the 100% subgroup, with a weak correlation. Interestingly, Habit 4, which focuses on creating a plan with the patient, showed no correlation at all with patients reporting that doctors explained things in language they could understand.
Development and testing of the HCAHPS survey began in 2002, commissioned by CMS and the Agency for Healthcare Research and Quality for the purpose of measuring patient experience in the hospital. The HCAHPS survey was endorsed by the National Quality Forum in 2005, with final approval of the national implementation granted by the Office of Management and Budget later that year. The CMS began implementation of the HCAHPS survey in 2006, with the first required public reporting of all hospitals taking place in March 2008.37-41 Based on CMS’ value-based purchasing initiative, hospitals with low HCAHPS scores have faced substantial penalties since 2012. Under these circumstances, it is important that the HCAHPS measures what it purports to measure. Because HCAHPS was designed to compare hospitals, testing was limited to assessment of internal reliability, hospital-level reliability, and construct validity. External validation with known measures of physician communication was not performed.41 Our study appears to be the first to compare HCAHPS scores to directly observed measures of physician communication skills. The lack of association between the 2 should sound a cautionary note to hospitals who seek to tie individual compensation to HCAHPS scores to improve them. In particular, the survey asks for a rating for all the patient’s doctors, not just the primary hospitalist. We found that, for hospital stays with just 1 hospitalist, the HCAHPS score reflected observed expression of empathy, although the correlation was only moderate, and HCAHPS were not correlated with other communication skills. Of all communication skills, empathy may be most important. Almost the entire body of research on physician communication cites empathy as a central skill. Empathy improves patient outcomes1-9,13-14,16-18,42 such as adherence to treatment, loyalty, and perception of care; and provider outcomes10-12,15 such as reduced burnout and a decreased likelihood of malpractice litigation.
It is less clear why other communication skills did not correlate with HCAHPS, but several differences in the measures themselves and how they were obtained might be responsible. It is possible that HCAHPS measures something broader than physician communication. In addition, the 4HCS was developed and normed on outpatient encounters as is true for virtually all doctor-patient coding schemes.43 Little is known about inpatient communication best practices. The timing of HCAHPS may also degrade the relationship between observed and reported communication. The HCAHPS questionnaires, collected after discharge, are retrospective reconstructions that are subject to recall bias and recency effects.44,45 In contrast, our observations took place in real time and were specific to the face-to-face interactions that take place when physicians engage patients at the bedside. Third, the response rate for HCAHPS surveys is only 30%, leading to potential sample bias.46 Respondents represent discharged patients who are willing and able to answer surveys, and may not be representative of all hospitalized patients. Finally, as with all global questions, the meaning any individual patient assigns to terms like “respect” may vary.
Our study has several limitations. The HCAHPS and 4HCS scores were not obtained from the same sample of patients. It is possible that the patients who were observed were not representative of the patients who completed the HCAHPS surveys. In addition, the only type of encounter observed was the initial visit between the hospitalist and the patient, and did not include communication during follow-up visits or on the day of discharge. However, there was a strong ICC among the 4HCS scores, implying that the 4HCS measures an inherent physician skill, which should be consistent across patients and encounters. Coding bias of the habits by a single observer could not be excluded. High intra-class correlation could be due in part to observer preferences for particular communication styles. Our sample included only 28 physicians. Although our study was powered to rule out a moderate correlation between 4HCS scores and HCAHPS scores (Pearson correlation coefficient greater than 0.5), we cannot exclude weaker correlations. Most correlations that we observed were so small that they would not be clinically meaningful, even in a much larger sample.
CONCLUSIONS
Our findings that HCAHPS scores did not correlate with the communication skills of the attending of record have some important implications. In an environment of value-based purchasing, most hospital systems are interested in identifying modifiable provider behaviors that optimize efficiency and payment structures. This study shows that directly measured communication skills do not correlate with HCAHPS scores as generally reported, indicating that HCAHPS may be measuring a broader domain than only physician communication skills. Better attribution based on the proportion of care provided by an individual physician could make the scores more useful for individual comparisons, but most institutions do not report their data in this way. Given this limitation, hospitals should refrain from comparing and incentivizing individual physicians based on their HCAHPS scores, because this measure was not designed for this purpose and does not appear to reflect an individual’s skills. This is important in the current environment in which hospitals face substantial penalties for underperformance but lack specific tools to improve their scores. Furthermore, there is concern that this type of measurement creates perverse incentives that may adversely alter clinical practice with the aim of improving scores.46
Training clinicians in communication and teaming skills is one potential means of increasing overall scores.15 Improving doctor-patient and team relationships is also the right thing to do. It is increasingly being demanded by patients and has always been a deep source of satisfaction for physicians.15,47 Moreover, there is an increasingly robust literature that relates face-to-face communication to biomedical and psychosocial outcomes of care.48 Identifying individual physicians who need help with communication skills is a worthwhile goal. Unfortunately, the HCAHPS survey does not appear to be the appropriate tool for this purpose.
Disclosure
The Cleveland Clinic Foundation, Division of Clinical Research, Research Programs Committees provided funding support. No funding source had any role in the study design; in the collection, analysis, and interpretation of data; in the writing of the report; or in the decision to submit the article for publication. The authors have no conflicts of interest for this study.
1. Glass RM. The patient-physician relationship. JAMA focuses on the center of medicine. JAMA. 1996;275(2):147-148. PubMed
2. Stein T, Frankel RM, Krupat E. Enhancing clinician communication skills in a large healthcare organization: a longitudinal case study. Patient Educ Couns. 2005;58(1):4-12. PubMed
3. Stewart M, Brown JB, Donner A, et al. The impact of patient-centered care on outcomes. J Fam Pract. 2000;49(9):796-804. PubMed
4. Safran DG, Taira DA, Rogers WH, Kosinski M, Ware JE, Tarlov AR. Linking primary care performance to outcomes of care. J Fam Pract. 1998;47(3):213-220. PubMed
5. Like R, Zyzanski SJ. Patient satisfaction with the clinical encounter: social psychological determinants. Soc Sci Med. 1987;24(4):351-357. PubMed
6. Williams S, Weinman J, Dale J. Doctor-patient communication and patient satisfaction: a review. Fam Pract. 1998;15(5):480-492. PubMed
7. Ciechanowski P, Katon WJ. The interpersonal experience of health care through the eyes of patients with diabetes. Soc Sci Med. 2006;63(12):3067-3079. PubMed
8. Stewart MA. Effective physician-patient communication and health outcomes: a review. CMAJ. 1995;152(9):1423-1433. PubMed
9. Hojat M, Louis DZ, Markham FW, Wender R, Rabinowitz C, Gonnella JS. Physicians’ empathy and clinical outcomes for diabetic patients. Acad Med. 2011;86(3):359-364. PubMed
10. Levinson W, Roter DL, Mullooly JP, Dull VT, Frankel RM. Physician-patient communication. The relationship with malpractice claims among primary care physicians and surgeons. JAMA. 1997;277(7):553-559. PubMed
11. Ambady N, Laplante D, Nguyen T, Rosenthal R, Chaumeton N, Levinson W. Surgeons’ tone of voice: a clue to malpractice history. Surgery. 2002;132(1):5-9. PubMed
12. Weng HC, Hung CM, Liu YT, et al. Associations between emotional intelligence and doctor burnout, job satisfaction and patient satisfaction. Med Educ. 2011;45(8):835-842. PubMed
13. Mauksch LB, Dugdale DC, Dodson S, Epstein R. Relationship, communication, and efficiency in the medical encounter: creating a clinical model from a literature review. Arch Intern Med. 2008;168(13):1387-1395. PubMed
14. Suchman AL, Roter D, Green M, Lipkin M Jr. Physician satisfaction with primary care office visits. Collaborative Study Group of the American Academy on Physician and Patient. Med Care. 1993;31(12):1083-1092. PubMed
15. Boissy A, Windover AK, Bokar D, et al. Communication skills training for physicians improves patient satisfaction. J Gen Intern Med. 2016;31(7):755-761. PubMed
16. Brody DS, Miller SM, Lerman CE, Smith DG, Lazaro CG, Blum MJ. The relationship between patients’ satisfaction with their physicians and perceptions about interventions they desired and received. Med Care. 1989;27(11):1027-1035. PubMed
17. Wasserman RC, Inui TS, Barriatua RD, Carter WB, Lippincott P. Pediatric clinicians’ support for parents makes a difference: an outcome-based analysis of clinician-parent interaction. Pediatrics. 1984;74(6):1047-1053. PubMed
18. Greenfield S, Kaplan S, Ware JE Jr. Expanding patient involvement in care. Effects on patient outcomes. Ann Intern Med. 1985;102(4):520-528. PubMed
19. Inui TS, Carter WB. Problems and prospects for health services research on provider-patient communication. Med Care. 1985;23(5):521-538. PubMed
20. Beckman H, Frankel R, Kihm J, Kulesza G, Geheb M. Measurement and improvement of humanistic skills in first-year trainees. J Gen Intern Med. 1990;5(1):42-45. PubMed
21. Keller S, O’Malley AJ, Hays RD, et al. Methods used to streamline the CAHPS Hospital Survey. Health Serv Res. 2005;40(6 pt 2):2057-2077. PubMed
22. Engel GL. The clinical application of the biopsychosocial model. Am J Psychiatry. 1980;137(5):535-544. PubMed
23. Lazare A, Eisenthal S, Wasserman L. The customer approach to patienthood. Attending to patient requests in a walk-in clinic. Arch Gen Psychiatry. 1975;32(5):553-558. PubMed
24. Eisenthal S, Lazare A. Evaluation of the initial interview in a walk-in clinic. The clinician’s perspective on a “negotiated approach”. J Nerv Ment Dis. 1977;164(1):30-35. PubMed
25. Kravitz RL, Callahan EJ, Paterniti D, Antonius D, Dunham M, Lewis CE. Prevalence and sources of patients’ unmet expectations for care. Ann Intern Med. 1996;125(9):730-737. PubMed
26. Froehlich GW, Welch HG. Meeting walk-in patients’ expectations for testing. Effects on satisfaction. J Gen Intern Med. 1996;11(8):470-474. PubMed
27. DiMatteo MR, Taranta A, Friedman HS, Prince LM. Predicting patient satisfaction from physicians’ nonverbal communication skills. Med Care. 1980;18(4):376-387. PubMed
28. Frankel RM, Stein T. Getting the most out of the clinical encounter: the four habits model. J Med Pract Manage. 2001;16(4):184-191. PubMed
29. Krupat E, Frankel R, Stein T, Irish J. The Four Habits Coding Scheme: validation of an instrument to assess clinicians’ communication behavior. Patient Educ Couns. 2006;62(1):38-45. PubMed
30. Fossli Jensen B, Gulbrandsen P, Benth JS, Dahl FA, Krupat E, Finset A. Interrater reliability for the Four Habits Coding Scheme as part of a randomized controlled trial. Patient Educ Couns. 2010;80(3):405-409. PubMed
31. Giordano LA, Elliott MN, Goldstein E, Lehrman WG, Spencer PA. Development, implementation, and public reporting of the HCAHPS survey. Med Care Res Rev. 2010;67(1):27-37. PubMed
32. Anonymous. CMS continues to shift emphasis to quality of care. Hosp Case Manag. 2012;20(10):150-151. PubMed
33. The R.E.D.E. Model 2015. Cleveland Clinic Center for Excellence in Healthcare
Communication. http://healthcarecommunication.info/. Accessed April 3 2016.
34. Empathetics, Inc. A Boston-based empathy training firm raises $1.5 million in
Series A Financing 2015. Empathetics Inc. http://www.prnewswire.com/news-releases/
empathetics-inc----a-boston-based-empathy-training-firm-raises-15-million-
in-series-a-financing-300072696.html). Accessed April 3, 2016.
35. Intensive Communication Skills 2016. Institute for Healthcare Communication.
http://healthcarecomm.org/. Accessed April 3, 2016.
36. Hu B, Palta M, Shao J. Variability explained by covariates in linear mixed-effect
models for longitudinal data. Canadian Journal of Statistics. 2010;38:352-368.
37. O’Malley AJ, Zaslavsky AM, Elliott MN, Zaborski L, Cleary PD. Case-mix adjustment
of the CAHPS Hospital Survey. Health Serv Res. 2005;40(6 pt 2):2162-2181. PubMed
38. O’Malley AJ, Zaslavsky AM, Hays RD, Hepner KA, Keller S, Cleary PD. Exploratory
factor analyses of the CAHPS Hospital Pilot Survey responses across
and within medical, surgical, and obstetric services. Health Serv Res. 2005;40(6 pt
2):2078-2095. PubMed
39. Goldstein E, Farquhar M, Crofton C, Darby C, Garfinkel S. Measuring hospital
care from the patients’ perspective: an overview of the CAHPS Hospital Survey
development process. Health Serv Res. 2005;40(6 pt 2):1977-1995. PubMed
40. Darby C, Hays RD, Kletke P. Development and evaluation of the CAHPS hospital
survey. Health Serv Res. 2005;40(6 pt 2):1973-1976. PubMed
41. Keller VF, Carroll JG. A new model for physician-patient communication. Patient
Educ Couns. 1994;23(2):131-140. PubMed
42. Quirk M, Mazor K, Haley HL, et al. How patients perceive a doctor’s caring attitude.
Patient Educ Couns. 2008;72(3):359-366. PubMed
43. Frankel RM, Levinson W. Back to the future: Can conversation analysis be used
to judge physicians’ malpractice history? Commun Med. 2014;11(1):27-39. PubMed
44. Furnham A. Response bias, social desirability and dissimulation. Personality and
individual differences 1986;7(3):385-400.
45. Shteingart H, Neiman T, Loewenstein Y. The role of first impression in operant
learning. J Exp Psychol Gen. 2013;142(2):476-488. PubMed
46. Tefera L, Lehrman WG, Conway P. Measurement of the patient experience: clarifying
facts, myths, and approaches. JAMA. 2016;315(2):2167-2168. PubMed
47. Horowitz CR, Suchman AL, Branch WT Jr, Frankel RM. What do doctors find
meaningful about their work? Ann Intern Med. 2003;138(9):772-775. PubMed
48. Rao JK, Anderson LA, Inui TS, Frankel RM. Communication interventions make
a difference in conversations between physicians and patients: a systematic review
of the evidence. Med Care. 2007;45(4):340-349. PubMed
© 2017 Society of Hospital Medicine
Association between opioid and benzodiazepine use and clinical deterioration in ward patients
Chronic opioid and benzodiazepine use is common and increasing.1-5 Outpatient use of these medications has been associated with hospital readmission and death,6-12 with concurrent use associated with particularly increased risk.13,14 Less is known about outcomes for hospitalized patients receiving these medications.
More than half of hospital inpatients in the United States receive opioids,15 many of which are new prescriptions rather than continuation of chronic therapy.16,17 Less is known about inpatient benzodiazepine administration, but the prevalence may exceed 10% among elderly populations.18 Hospitalized patients often have comorbidities or physiological disturbances that might increase their risk related to use of these medications. Opioids can cause central and obstructive sleep apneas,19-21 and benzodiazepines contribute to respiratory depression and airway relaxation.22 Benzodiazepines also impair psychomotor function and recall,23 which could mediate the recognized risk for delirium and falls in the hospital.24,25 These findings suggest pathways by which these medications might contribute to clinical deterioration.
Most studies in hospitalized patients have been limited to specific populations15,26-28 and have not explicitly controlled for severity of illness over time. It remains unclear whether associations identified within particular groups of patients hold true for the broader population of general ward inpatients. Therefore, we aimed to determine the independent association between opioid and benzodiazepine administration and clinical deterioration in ward patients.
MATERIALS AND METHODS
Setting and Study Population
We performed an observational cohort study at a 500-bed urban academic hospital. Data were obtained from all adults hospitalized on the wards between November 1, 2008, and January 21, 2016. The study protocol was approved by the University of Chicago Institutional Review Board (IRB#15-0195).
Data Collection
The study utilized de-identified data from the electronic health record (EHR; Epic Systems Corporation, Verona, Wisconsin) and administrative databases collected by the University of Chicago Clinical Research Data Warehouse. Patient age, sex, race, body mass index (BMI), and ward admission source (ie, emergency department (ED), transferred from the intensive care unit (ICU), or directly admitted to the wards) were collected. International Classification of Diseases, 9th Revision, Clinical Modification (ICD-9-CM) codes were used to identify Elixhauser Comorbidity Index categories.29,30 Because patients with similar diagnoses (eg, active cancer) are cohorted within particular areas in our hospital, we obtained the ward unit for all patients. Patients who underwent surgery were identified using the hospital’s admission-transfer-discharge database.
To determine severity of illness, routinely collected vital signs and laboratory values were utilized to calculate the electronic cardiac arrest risk triage (eCART) score, an accurate risk score we previously developed and validated for predicting adverse events among ward patients.31 If any vital sign or laboratory value was missing, the next available measurement was carried forward. If any value remained missing after this change, the median value for that location (ie, wards, ICU, or ED) was imputed.32,33 Additionally, patient-reported pain scores at the time of opioid administration were extracted from nursing flowsheets. If no pain score was present at the time of opioid administration, the patient’s previous score was carried forward.
We excluded patients with sickle-cell disease or seizure history and admissions with diagnoses of alcohol withdrawal from the analysis, because these diagnoses were expected to be associated with different medication administration practices compared to other inpatients. We also excluded patients with a tracheostomy because we expected their respiratory monitoring to differ from the other patients in our cohort. Finally, because ward deaths resulting from a comfort care scenario often involve opioids and/or benzodiazepines, ward segments involving comfort care deaths (defined as death without attempted resuscitation) were excluded from the analysis (Supplemental Figure 1). Patients with sickle-cell disease were identified using ICD-9 codes, and encounters during which a seizure may have occurred were identified using a combination of ICD-9 codes and receipt of anti-epileptic medication (Supplemental Table 1). Patients at risk for alcohol withdrawal were identified by the presence of any Clinical Institute Withdrawal Assessment for Alcohol score within nursing flowsheets, and patients with tracheostomies were identified using documentation of ventilator support within their first 12 hours on the wards. In addition to these exclusion criteria, patients with obstructive sleep apnea (OSA) were identified by the following ICD-9 codes: 278.03, 327.23, 780.51, 780.53, and 780.57.
Medications
Ward administrations of opioids and benzodiazepines—dose, route, and administration time—were collected from the EHR. We excluded all administrations in nonward locations such as the ED, ICU, operating room, or procedure suite. Additionally, because patients emergently intubated may receive sedative and analgesic medications to facilitate intubation, and because patients experiencing cardiac arrest are frequently intubated periresuscitation, we a priori excluded all administrations within 15 minutes of a ward cardiac arrest or an intubation.
For consistent comparisons, opioid doses were converted to oral morphine equivalents34 and adjusted by a factor of 15 to reflect the smallest routinely available oral morphine tablet in our hospital (Supplemental Table 2). Benzodiazepine doses were converted to oral lorazepam equivalents (Supplemental Table 2).34 Thus, the independent variables were oral morphine or lorazepam equivalents administered within each 6-hour window. We a priori presumed opioid doses greater than the 99th percentile (1200 mg) or benzodiazepine doses greater than 10 mg oral lorazepam equivalents within a 6-hour window to be erroneous entries, and replaced these outlier values with the median value for each medication category.
Outcomes
The primary outcome was the composite of ICU transfer or cardiac arrest (loss of pulse with attempted resuscitation) on the wards, with individual outcomes investigated secondarily. An ICU transfer (patient movement from a ward directly to the ICU) was identified using the hospital’s admission-transfer-discharge database. Cardiac arrests were identified using a prospectively validated quality improvement database.35
Because deaths on the wards resulted either from cardiac arrest or from a comfort care scenario, mortality was not studied as an outcome.
Statistical Analysis
Patient characteristics were compared using Student t tests, Wilcoxon rank sum tests, and chi-squared statistics, as appropriate. Unadjusted and adjusted models were created using discrete-time survival analysis,36-39 which involved dividing time into discrete 6-hour intervals and employing the predictor variables chronologically closest to the beginning of each time window to forecast whether the outcome occurred within each interval. Predictor variables in the adjusted model included patient characteristics (age, sex, BMI, and Elixhauser Agency for Healthcare Research and Quality-Web comorbidities30 [a priori excluding comorbidities recorded for fewer than 1000 admissions from the model]), ward unit, surgical status, prior ICU admission during the hospitalization, cumulative opioid or benzodiazepine dose during the previous 24 hours, and severity of illness (measured by eCART score). The adjusted model for opioids also included the patient’s pain score. Age, eCART score, and pain score were entered linearly while race, BMI (underweight, less than 18.5 kg/m2; normal, 18.5-24.9 kg/m2; overweight, 25.0-29.9 kg/m2; obese, 30-39.9 kg/m2; and severely obese, 40 mg/m2 or greater), and ward unit were modeled as categorical variables.
Since repeat hospitalization could confound the results of our study, we performed a sensitivity analysis including only 1 randomly selected hospital admission per patient. We also performed a sensitivity analysis including receipt of both opioids and benzodiazepines, and an interaction term within each ward segment, as well as an analysis in which zolpidem—the most commonly administered nonbenzodiazepine hypnotic medication in our hospital—was included along with both opioids and benzodiazepines. Finally, we performed a sensitivity analysis replacing missing pain scores with imputed values ranging from 0 to the median ward pain score.
We also performed subgroup analyses of adjusted models across age quartiles and for each BMI category, as well as for surgical status, OSA status, gender, time of medication administration, and route of administration (intravenous vs. oral). We also performed an analysis across pain score severity40 to determine whether these medications produce differential effects at various levels of pain.
All tests of significance used a 2-sided P value less than 0.05. Statistical analyses were completed using Stata version 14.1 (StataCorp, LLC, College Station, Texas).

RESULTS
Patient Characteristics
A total of 144,895 admissions, from 75,369 patients, had ward vital signs or laboratory values documented during the study period. Ward segments from 634 admissions were excluded due to comfort care status, which resulted in exclusion of 479 complete patient admissions. Additionally, 139 patients with tracheostomies were excluded. Furthermore, 2934 patient admissions with a sickle-cell diagnosis were excluded, of which 95% (n = 2791) received an opioid and 11% (n = 310) received a benzodiazepine. Another 14,029 admissions associated with seizures, 6134 admissions involving alcohol withdrawal, and 1332 with both were excluded, of which 66% (n = 14,174) received an opioid and 35% (n = 7504) received a benzodiazepine. After exclusions, 120,518 admissions were included in the final analysis, with 67% (n = 80,463) associated with at least 1 administration of an opioid and 21% (n = 25,279) associated with at least 1 benzodiazepine administration.
In total, there were 672,851 intervals when an opioid was administered during the study, with a median dose of 12 mg oral morphine equivalents (interquartile range, 8-30). Of these, 21,634 doses were replaced due to outlier status outside the 99th percentile. Patients receiving opioids were younger (median age 56 vs 61 years), less likely to be African American (48% vs 59%), more likely to have undergone surgery (18% vs 6%), and less likely to have most noncancer medical comorbidities than those who never received an opioid (all P < 0.001) (Table 1).
Additionally, there were a total of 98,286 6-hour intervals in which a benzodiazepine was administered in the study, with a median dose of 1 mg oral lorazepam (interquartile range, 0.5-1). A total of 790 doses of benzodiazepines (less than 1%) were replaced due to outlier status. Patients who received benzodiazepines were more likely to be male (49% vs. 41%), less likely to be African-American, less likely to be obese or morbidly obese (33% vs. 39%), and more likely to have medical comorbidities compared to patients who never received a benzodiazepine (all P < 0.001) (Table 1).
The eCART scores were similar between all patient groups. The frequency of missing variables differed by data type, with vital signs rarely missing (all less than 1.1% except AVPU [10%]), followed by hematology labs (8%-9%), electrolytes and renal function results (12%-15%), and hepatic function tests (40%-45%). In addition to imputed data for missing vital signs and laboratory values, our model omitted human immunodeficiency virus/acquired immune deficiency syndrome and peptic ulcer disease from the adjusted models on the basis of fewer than 1000 admissions with these diagnoses listed.

Patient Outcomes
The incidence of the composite outcome was higher in admissions with at least 1 opioid medication than those without an opioid (7% vs. 4%, P < 0.001), and in admissions with at least 1 dose of benzodiazepines compared to those without a benzodiazepine (11% vs. 4%, P < 0.001) (Table 2).
Within 6-hour segments, increasing doses of opioids were associated with an initial decrease in the frequency of the composite outcome followed by a dose-related increase in the frequency of the composite outcome with morphine equivalents greater than 45 mg. By contrast, the frequency of the composite outcome increased with additional benzodiazepine equivalents (Figure).
In the adjusted model, opioid administration was associated with increased risk for the composite outcome (Table 3) in a dose-dependent fashion, with each 15 mg oral morphine equivalent associated with a 1.9% increase in the odds of ICU transfer or cardiac arrest within the subsequent 6-hour time interval (odds ratio [OR], 1.019; 95% confidence interval [CI], 1.013-1.026; P < 0.001).

Similarly, benzodiazepine administration was also associated with increased adjusted risk for the composite outcome within 6 hours in a dose-dependent manner. Each 1 mg oral lorazepam equivalent was associated with a 29% increase in the odds of ward cardiac arrest or ICU transfer (OR, 1.29; 95% CI, 1.16-1.44; P < 0.001) (Table 3).
Sensitivity Analyses
A sensitivity analysis including 1 randomly selected hospitalization per patient involved 67,097 admissions and found results similar to the primary analysis, with each 15 mg oral morphine equivalent associated with a 1.9% increase in the odds of the composite outcome (OR, 1.019; 95% CI, 1.011-1.028; P < 0.001) and each 1 mg oral lorazepam equivalent associated with a 41% increase in the odds of the composite outcome (OR, 1.41; 95% CI, 1.21-1.65; P < 0.001). Inclusion of both opioids and benzodiazepines in the adjusted model again yielded results similar to the main analysis for both opioids (OR, 1.020; 95% CI, 1.013-1.026; P < 0.001) and benzodiazepines (OR, 1.35; 95% CI, 1.18-1.54; P < 0.001), without a significant interaction detected (P = 0.09). These results were unchanged with the addition of zolpidem to the model as an additional potential confounder, and zolpidem did not increase the risk of the study outcomes (P = 0.2).
A final sensitivity analysis for the opioid model involved replacing missing pain scores with imputed values ranging from 0 to the median ward score, which was 5. The results of these analyses did not differ from the primary model and were consistent regardless of imputation value (OR, 1.018; 95% CI, 1.012-1.023; P < 0.001).
Subgroup Analyses
Analyses of opioid administration by subgroup (sex, age quartiles, BMI categories, OSA diagnosis, surgical status, daytime/nighttime medication administration, IV/PO administration, and pain severity) yielded similar results to the overall analysis (Supplemental Figure 2). Subgroup analysis of patients receiving benzodiazepines revealed similarly increased adjusted odds of the composite outcome across strata of gender, BMI, surgical status, and medication administration time (Supplemental Figure 3). Notably, patients older than 70 years who received a benzodiazepine were at 64% increased odds of the composite outcome (OR, 1.64; 95% CI, 1.30-2.08), compared to 2% to 38% increased risk for patients under 70 years. Finally, IV doses of benzodiazepines were associated with 48% increased odds for deterioration (OR, 1.48; 95% CI, 1.18-1.84; P = 0.001), compared to a nonsignificant 14% increase in the odds for PO doses (OR, 1.14; 95% CI, 0.99-1.31; P = 0.066).
DISCUSSION
In a large, single-center, observational study of ward inpatients, we found that opioid use was associated with a small but significant increased risk for clinical deterioration on the wards, with every 15 mg oral morphine equivalent increasing the odds of ICU transfer or cardiac arrest in the next 6 hours by 1.9%. Benzodiazepines were associated with a much higher risk: each equivalent of 1 mg of oral lorazepam increased the odds of ICU transfer or cardiac arrest by almost 30%. These results have important implications for care at the bedside of hospitalized ward patients and suggest the need for closer monitoring after receipt of these medications, particularly benzodiazepines.
Previous work has described negative effects of opioid medications among select inpatient populations. In surgical patients, opioids have been associated with hospital readmission, increased length of stay, and hospital mortality.26,28 More recently, Herzig et al.15 found more adverse events in nonsurgical ward patients within the hospitals prescribing opioids the most frequently. These studies may have been limited by the populations studied and the inability to control for confounders such as severity of illness and pain score. Our study expands these findings to a more generalizable population and shows that even after adjustment for potential confounders, such as severity of illness, pain score, and medication dose, opioids are associated with increased short-term risk of clinical deterioration.
By contrast, few studies have characterized the risks associated with benzodiazepine use among ward inpatients. Recently, Overdyk et al.27 found that inpatient use of opioids and sedatives was associated with increased risk for cardiac arrest and hospital death. However, this study included ICU patients, which may confound the results, as ICU patients often receive high doses of opioids or benzodiazepines to facilitate mechanical ventilation or other invasive procedures, while also having a particularly high risk of adverse outcomes like cardiac arrest and inhospital death.
Several mechanisms may explain the magnitude of effect seen with regard to benzodiazepines. First, benzodiazepines may directly produce clinical deterioration by decreased respiratory drive, diminished airway tone, or hemodynamic decompensation. It is possible that the broad spectrum of cardiorespiratory side effects of benzodiazepines—and potential unpredictability of these effects—increases the difficulty of observation and management for patients receiving them. This difficulty may be compounded with intravenous administration of benzodiazepines, which was associated with a higher risk for deterioration than oral doses in our cohort. Alternatively, benzodiazepines may contribute to clinical decompensation by masking signs of deterioration such as encephalopathy or vital sign instability like tachycardia or tachypnea that may be mistaken as anxiety. Notably, while our hospital has a nursing-driven protocol for monitoring patients receiving opioids (in which pain is serially assessed, leading to additional bedside observation), we do not have protocols for ward patients receiving benzodiazepines. Finally, although we found that orders for opioids and benzodiazepines were more common in white patients than African American patients, this finding may be due to differences in the types or number of medical comorbidities experienced by these patients.
Our study has several strengths, including the large number of admissions we included. Additionally, we included a broad range of medical and surgical ward admissions, which should increase the generalizability of our results. Further, our rates of ICU transfer are in line with data reported from other groups,41,42 which again may add to the generalizability of our findings. We also addressed many potential confounders by including patient characteristics, individual ward units, and (for opioids) pain score in our model, and by controlling for severity of illness with the eCART score, an accurate predictor of ICU transfer and ward cardiac arrest within our population.32,37 Finally, our robust methodology allowed us to include acute and cumulative medication doses, as well as time, in the model. By performing a discrete-time survival analysis, we were able to evaluate receipt of opioids and benzodiazepines—as well as risk for clinical deterioration—longitudinally, lending strength to our results.
Limitations of our study include its single-center cohort, which may reduce generalizability to other populations. Additionally, because we could not validate the accuracy of—or adherence to—outpatient medication lists, we were unable to identify chronic opioid or benzodiazepine users by these lists. However, patients chronically taking opioids or benzodiazepines would likely receive doses each hospital day; by including 24-hour cumulative doses in our model, we attempted to adjust for some portion of their chronic use. Also, because evaluation of delirium was not objectively recorded in our dataset, we were unable to evaluate the relationship between receipt of these medications and development of delirium, which is an important outcome for hospitalized patients. Finally, neither the diagnoses for which these medications were prescribed, nor the reason for ICU transfer, were present in our dataset, which leaves open the possibility of unmeasured confounding.
CONCLUSION
After adjustment for important confounders including severity of illness, medication dose, and time, opioids were associated with a slight increase in clinical deterioration on the wards, while benzodiazepines were associated with a much larger risk for deterioration. This finding raises concern about the safety of benzodiazepine use among ward patients and suggests that increased monitoring of patients receiving these medications may be warranted.
Acknowledgment
The authors thank Nicole Twu for administrative support.
Disclosure
Drs. Churpek and Edelson have a patent pending (ARCD. P0535US.P2) for risk stratification algorithms for hospitalized patients. Dr. Churpek is supported by a career development award from the National Heart, Lung, and Blood Institute (K08 HL121080). Dr. Churpek has received honoraria from Chest for invited speaking engagements. In addition, Dr. Edelson has received research support from Philips Healthcare (Andover, Massachusetts), research support from the American Heart Association (Dallas, Texas) and Laerdal Medical (Stavanger, Norway), and research support from Early Sense (Tel Aviv, Israel). She has ownership interest in Quant HC (Chicago, Illinois), which is developing products for risk stratification of hospitalized patients. Dr. Mokhlesi is supported by National Institutes of Health grant R01HL119161. Dr. Mokhlesi has served as a consultant to Philips/Respironics and has received research support from Philips/Respironics. Preliminary versions of these data were presented as a poster presentation at the 2016 meeting of the American Thoracic Society, May 17, 2016; San Francisco, California.
1. Substance Abuse and Mental Health Services Administration. Results from the 2013 National Survey on Drug Use and Health: Summary of National Findings. Rockville, MD: Substance Abuse and Mental Health Services Administration; 2014.
2. Bachhuber MA, Hennessy S, Cunningham CO, Starrels JL. Increasing benzodiazepine prescriptions and overdose mortality in the United States, 1996–2013. Am J Public Health. 2016;106(4):686-688. PubMed
3. Parsells Kelly J, Cook SF, Kaufman DW, Anderson T, Rosenberg L, Mitchell AA. Prevalence and characteristics of opioid use in the US adult population. Pain. 2008;138(3):507-513. PubMed
4. Olfson M, King M, Schoenbaum M. Benzodiazepine use in the United States. JAMA Psychiatry. 2015;72(2):136-142. PubMed
5. Hwang CS, Kang EM, Kornegay CJ, Staffa JA, Jones CM, McAninch JK. Trends in the concomitant prescribing of opioids and benzodiazepines, 2002−2014. Am J Prev Med. 2016;51(2):151-160. PubMed
6. Bohnert AS, Valenstein M, Bair MJ, et al. Association between opioid prescribing patterns and opioid overdose-related deaths. JAMA. 2011;305(13):1315-1321. PubMed
7. Dart RC, Surratt HL, Cicero TJ, et al. Trends in opioid analgesic abuse and mortality in the United States. N Engl J Med. 2015;372(3):241-248. PubMed
8. Centers for Disease Control and Prevention (CDC). Vital signs: overdoses of prescription opioid pain relievers---United States, 1999--2008. MMWR Morb Mortal Wkly Rep. 2011;60(43):1487-1492. PubMed
9. Lan TY, Zeng YF, Tang GJ, et al. The use of hypnotics and mortality - a population-based retrospective cohort study. PLoS One. 2015;10(12):e0145271. PubMed
10. Mosher HJ, Jiang L, Vaughan Sarrazin MS, Cram P, Kaboli P, Vander Weg MW. Prevalence and characteristics of hospitalized adults on chronic opioid therapy: prior opioid use among veterans. J Hosp Med. 2014;9(2):82-87. PubMed
11. Palmaro A, Dupouy J, Lapeyre-Mestre M. Benzodiazepines and risk of death: results from two large cohort studies in France and UK. Eur Neuropsychopharmacol. 2015;25(10):1566-1577. PubMed
12. Parsaik AK, Mascarenhas SS, Khosh-Chashm D, et al. Mortality associated with anxiolytic and hypnotic drugs–a systematic review and meta-analysis. Aust N Z J Psychiatry. 2016;50(6):520-533. PubMed
13. Park TW, Saitz R, Ganoczy D, Ilgen MA, Bohnert AS. Benzodiazepine prescribing patterns and deaths from drug overdose among US veterans receiving opioid analgesics: case-cohort study. BMJ. 2015;350:h2698. PubMed
14. Jones CM, McAninch JK. Emergency department visits and overdose deaths from combined use of opioids and benzodiazepines. Am J Prev Med. 2015;49(4):493-501. PubMed
15. Herzig SJ, Rothberg MB, Cheung M, Ngo LH, Marcantonio ER. Opioid utilization and opioid-related adverse events in nonsurgical patients in US hospitals. J Hosp Med. 2014;9(2):73-81. PubMed
16. Jena AB, Goldman D, Karaca-Mandic P. Hospital prescribing of opioids to Medicare beneficiaries. JAMA Intern Med. 2016;176(7):990-997. PubMed
17. Calcaterra SL, Yamashita TE, Min SJ, Keniston A, Frank JW, Binswanger IA. Opioid prescribing at hospital discharge contributes to chronic opioid use. J Gen Intern Med. 2016;31(5):478-485. PubMed
18. Garrido MM, Prigerson HG, Penrod JD, Jones SC, Boockvar KS. Benzodiazepine and sedative-hypnotic use among older seriously ill veterans: choosing wisely? Clin Ther. 2014;36(11):1547-1554. PubMed
19. Doufas AG, Tian L, Padrez KA, et al. Experimental pain and opioid analgesia in volunteers at high risk for obstructive sleep apnea. PloS One. 2013;8(1):e54807. PubMed
20. Gislason T, Almqvist M, Boman G, Lindholm CE, Terenius L. Increased CSF opioid activity in sleep apnea syndrome. Regression after successful treatment. Chest. 1989;96(2):250-254. PubMed
21. Van Ryswyk E, Antic N. Opioids and sleep disordered breathing. Chest. 2016;150(4):934-944. PubMed
22. Koga Y, Sato S, Sodeyama N, et al. Comparison of the relaxant effects of diazepam, flunitrazepam and midazolam on airway smooth muscle. Br J Anaesth. 1992;69(1):65-69. PubMed
23. Pomara N, Lee SH, Bruno D, et al. Adverse performance effects of acute lorazepam administration in elderly long-term users: pharmacokinetic and clinical predictors. Prog Neuropsychopharmacol Biol Psychiatry. 2015;56:129-135. PubMed
24. Pandharipande P, Shintani A, Peterson J, et al. Lorazepam is an independent risk factor for transitioning to delirium in intensive care unit patients. Anesthesiology. 2006;104(1):21-26. PubMed
25. O’Neil CA, Krauss MJ, Bettale J, et al. Medications and patient characteristics associated with falling in the hospital. J Patient Saf. 2015 (epub ahead of print). PubMed
26. Kessler ER, Shah M, K Gruschkus S, Raju A. Cost and quality implications of opioid-based postsurgical pain control using administrative claims data from a large health system: opioid-related adverse events and their impact on clinical and economic outcomes. Pharmacotherapy. 2013;33(4):383-391. PubMed
27. Overdyk FJ, Dowling O, Marino J, et al. Association of opioids and sedatives with increased risk of in-hospital cardiopulmonary arrest from an administrative database. PLoS One. 2016;11(2):e0150214. PubMed
28. Minkowitz HS, Gruschkus SK, Shah M, Raju A. Adverse drug events among patients receiving postsurgical opioids in a large health system: risk factors and outcomes. Am J Health Syst Pharm. 2014;71(18):1556-1565. PubMed
29. Elixhauser A, Steiner C, Harris DR, Coffey RM. Comorbidity measures for use with administrative data. Med Care. 1998;36(1):8-27. PubMed
30. Quan H, Sundararajan V, Halfon P, et al. Coding algorithms for defining comorbidities in ICD-9-CM and ICD-10 administrative data. Med Care. 2005;43(11):1130-1139. PubMed
31. Churpek MM, Yuen TC, Winslow C, et al. Multicenter development and validation of a risk stratification tool for ward patients. Am J Respir Crit Care Med. 2014;190(6):649-655. PubMed
32. Knaus WA, Wagner DP, Draper EA, Z et al. The APACHE III prognostic system. Risk prediction of hospital mortality for critically ill hospitalized adults. Chest. 1991;100(6):1619-1636. PubMed
33. van den Boogaard M, Pickkers P, Slooter AJC, et al. Development and validation
of PRE-DELIRIC (PREdiction of DELIRium in ICu patients) delirium prediction
model for intensive care patients: observational multicentre study. BMJ.
2012;344:e420. PubMed
34. Clinical calculators. ClinCalc.com. http://www.clincalc.com. Accessed February
21, 2016.
35. Churpek MM, Yuen TC, Huber MT, Park SY, Hall JB, Edelson DP. Predicting
cardiac arrest on the wards: a nested case-control study. Chest. 2012;141(5):
1170-1176. PubMed
36. Churpek MM, Yuen TC, Park SY, Gibbons R, Edelson DP. Using electronic
health record data to develop and validate a prediction model for adverse outcomes
in the wards. Crit Care Med. 2014;42(4):841-848. PubMed
37. Efron B. Logistic regression, survival analysis, and the Kaplan-Meier curve. J Am
Stat Assoc. 1988;83(402):414-425.
38. Gibbons RD, Duan N, Meltzer D, et al; Institute of Medicine Committee. Waiting
for organ transplantation: results of an analysis by an Institute of Medicine Committee.
Biostatistics. 2003;4(2):207-222. PubMed
39. Singer JD, Willett JB. It’s about time: using discrete-time survival analysis to study
duration and the timing of events. J Educ Behav Stat. 1993;18(2):155-195.
40. World Health Organization. Cancer pain relief and palliative care. Report of a
WHO Expert Committee. World Health Organ Tech Rep Ser. 1990;804:1-75. PubMed
41. Bailey TC, Chen Y, Mao Y, et al. A trial of a real-time alert for clinical deterioration
in patients hospitalized on general medical wards. J Hosp Med. 2013;8(5):236-242. PubMed
42. Liu V, Kipnis P, Rizk NW, Escobar GJ. Adverse outcomes associated with delayed
intensive care unit transfers in an integrated healthcare system. J Hosp Med.
2012;7(3):224-230. PubMed
Chronic opioid and benzodiazepine use is common and increasing.1-5 Outpatient use of these medications has been associated with hospital readmission and death,6-12 with concurrent use associated with particularly increased risk.13,14 Less is known about outcomes for hospitalized patients receiving these medications.
More than half of hospital inpatients in the United States receive opioids,15 many of which are new prescriptions rather than continuation of chronic therapy.16,17 Less is known about inpatient benzodiazepine administration, but the prevalence may exceed 10% among elderly populations.18 Hospitalized patients often have comorbidities or physiological disturbances that might increase their risk related to use of these medications. Opioids can cause central and obstructive sleep apneas,19-21 and benzodiazepines contribute to respiratory depression and airway relaxation.22 Benzodiazepines also impair psychomotor function and recall,23 which could mediate the recognized risk for delirium and falls in the hospital.24,25 These findings suggest pathways by which these medications might contribute to clinical deterioration.
Most studies in hospitalized patients have been limited to specific populations15,26-28 and have not explicitly controlled for severity of illness over time. It remains unclear whether associations identified within particular groups of patients hold true for the broader population of general ward inpatients. Therefore, we aimed to determine the independent association between opioid and benzodiazepine administration and clinical deterioration in ward patients.
MATERIALS AND METHODS
Setting and Study Population
We performed an observational cohort study at a 500-bed urban academic hospital. Data were obtained from all adults hospitalized on the wards between November 1, 2008, and January 21, 2016. The study protocol was approved by the University of Chicago Institutional Review Board (IRB#15-0195).
Data Collection
The study utilized de-identified data from the electronic health record (EHR; Epic Systems Corporation, Verona, Wisconsin) and administrative databases collected by the University of Chicago Clinical Research Data Warehouse. Patient age, sex, race, body mass index (BMI), and ward admission source (ie, emergency department (ED), transferred from the intensive care unit (ICU), or directly admitted to the wards) were collected. International Classification of Diseases, 9th Revision, Clinical Modification (ICD-9-CM) codes were used to identify Elixhauser Comorbidity Index categories.29,30 Because patients with similar diagnoses (eg, active cancer) are cohorted within particular areas in our hospital, we obtained the ward unit for all patients. Patients who underwent surgery were identified using the hospital’s admission-transfer-discharge database.
To determine severity of illness, routinely collected vital signs and laboratory values were utilized to calculate the electronic cardiac arrest risk triage (eCART) score, an accurate risk score we previously developed and validated for predicting adverse events among ward patients.31 If any vital sign or laboratory value was missing, the next available measurement was carried forward. If any value remained missing after this change, the median value for that location (ie, wards, ICU, or ED) was imputed.32,33 Additionally, patient-reported pain scores at the time of opioid administration were extracted from nursing flowsheets. If no pain score was present at the time of opioid administration, the patient’s previous score was carried forward.
We excluded patients with sickle-cell disease or seizure history and admissions with diagnoses of alcohol withdrawal from the analysis, because these diagnoses were expected to be associated with different medication administration practices compared to other inpatients. We also excluded patients with a tracheostomy because we expected their respiratory monitoring to differ from the other patients in our cohort. Finally, because ward deaths resulting from a comfort care scenario often involve opioids and/or benzodiazepines, ward segments involving comfort care deaths (defined as death without attempted resuscitation) were excluded from the analysis (Supplemental Figure 1). Patients with sickle-cell disease were identified using ICD-9 codes, and encounters during which a seizure may have occurred were identified using a combination of ICD-9 codes and receipt of anti-epileptic medication (Supplemental Table 1). Patients at risk for alcohol withdrawal were identified by the presence of any Clinical Institute Withdrawal Assessment for Alcohol score within nursing flowsheets, and patients with tracheostomies were identified using documentation of ventilator support within their first 12 hours on the wards. In addition to these exclusion criteria, patients with obstructive sleep apnea (OSA) were identified by the following ICD-9 codes: 278.03, 327.23, 780.51, 780.53, and 780.57.
Medications
Ward administrations of opioids and benzodiazepines—dose, route, and administration time—were collected from the EHR. We excluded all administrations in nonward locations such as the ED, ICU, operating room, or procedure suite. Additionally, because patients emergently intubated may receive sedative and analgesic medications to facilitate intubation, and because patients experiencing cardiac arrest are frequently intubated periresuscitation, we a priori excluded all administrations within 15 minutes of a ward cardiac arrest or an intubation.
For consistent comparisons, opioid doses were converted to oral morphine equivalents34 and adjusted by a factor of 15 to reflect the smallest routinely available oral morphine tablet in our hospital (Supplemental Table 2). Benzodiazepine doses were converted to oral lorazepam equivalents (Supplemental Table 2).34 Thus, the independent variables were oral morphine or lorazepam equivalents administered within each 6-hour window. We a priori presumed opioid doses greater than the 99th percentile (1200 mg) or benzodiazepine doses greater than 10 mg oral lorazepam equivalents within a 6-hour window to be erroneous entries, and replaced these outlier values with the median value for each medication category.
Outcomes
The primary outcome was the composite of ICU transfer or cardiac arrest (loss of pulse with attempted resuscitation) on the wards, with individual outcomes investigated secondarily. An ICU transfer (patient movement from a ward directly to the ICU) was identified using the hospital’s admission-transfer-discharge database. Cardiac arrests were identified using a prospectively validated quality improvement database.35
Because deaths on the wards resulted either from cardiac arrest or from a comfort care scenario, mortality was not studied as an outcome.
Statistical Analysis
Patient characteristics were compared using Student t tests, Wilcoxon rank sum tests, and chi-squared statistics, as appropriate. Unadjusted and adjusted models were created using discrete-time survival analysis,36-39 which involved dividing time into discrete 6-hour intervals and employing the predictor variables chronologically closest to the beginning of each time window to forecast whether the outcome occurred within each interval. Predictor variables in the adjusted model included patient characteristics (age, sex, BMI, and Elixhauser Agency for Healthcare Research and Quality-Web comorbidities30 [a priori excluding comorbidities recorded for fewer than 1000 admissions from the model]), ward unit, surgical status, prior ICU admission during the hospitalization, cumulative opioid or benzodiazepine dose during the previous 24 hours, and severity of illness (measured by eCART score). The adjusted model for opioids also included the patient’s pain score. Age, eCART score, and pain score were entered linearly while race, BMI (underweight, less than 18.5 kg/m2; normal, 18.5-24.9 kg/m2; overweight, 25.0-29.9 kg/m2; obese, 30-39.9 kg/m2; and severely obese, 40 mg/m2 or greater), and ward unit were modeled as categorical variables.
Since repeat hospitalization could confound the results of our study, we performed a sensitivity analysis including only 1 randomly selected hospital admission per patient. We also performed a sensitivity analysis including receipt of both opioids and benzodiazepines, and an interaction term within each ward segment, as well as an analysis in which zolpidem—the most commonly administered nonbenzodiazepine hypnotic medication in our hospital—was included along with both opioids and benzodiazepines. Finally, we performed a sensitivity analysis replacing missing pain scores with imputed values ranging from 0 to the median ward pain score.
We also performed subgroup analyses of adjusted models across age quartiles and for each BMI category, as well as for surgical status, OSA status, gender, time of medication administration, and route of administration (intravenous vs. oral). We also performed an analysis across pain score severity40 to determine whether these medications produce differential effects at various levels of pain.
All tests of significance used a 2-sided P value less than 0.05. Statistical analyses were completed using Stata version 14.1 (StataCorp, LLC, College Station, Texas).
RESULTS
Patient Characteristics
A total of 144,895 admissions, from 75,369 patients, had ward vital signs or laboratory values documented during the study period. Ward segments from 634 admissions were excluded due to comfort care status, which resulted in exclusion of 479 complete patient admissions. Additionally, 139 patients with tracheostomies were excluded. Furthermore, 2934 patient admissions with a sickle-cell diagnosis were excluded, of which 95% (n = 2791) received an opioid and 11% (n = 310) received a benzodiazepine. Another 14,029 admissions associated with seizures, 6134 admissions involving alcohol withdrawal, and 1332 with both were excluded, of which 66% (n = 14,174) received an opioid and 35% (n = 7504) received a benzodiazepine. After exclusions, 120,518 admissions were included in the final analysis, with 67% (n = 80,463) associated with at least 1 administration of an opioid and 21% (n = 25,279) associated with at least 1 benzodiazepine administration.
In total, there were 672,851 intervals when an opioid was administered during the study, with a median dose of 12 mg oral morphine equivalents (interquartile range, 8-30). Of these, 21,634 doses were replaced due to outlier status outside the 99th percentile. Patients receiving opioids were younger (median age 56 vs 61 years), less likely to be African American (48% vs 59%), more likely to have undergone surgery (18% vs 6%), and less likely to have most noncancer medical comorbidities than those who never received an opioid (all P < 0.001) (Table 1).
Additionally, there were a total of 98,286 6-hour intervals in which a benzodiazepine was administered in the study, with a median dose of 1 mg oral lorazepam (interquartile range, 0.5-1). A total of 790 doses of benzodiazepines (less than 1%) were replaced due to outlier status. Patients who received benzodiazepines were more likely to be male (49% vs. 41%), less likely to be African-American, less likely to be obese or morbidly obese (33% vs. 39%), and more likely to have medical comorbidities compared to patients who never received a benzodiazepine (all P < 0.001) (Table 1).
The eCART scores were similar between all patient groups. The frequency of missing variables differed by data type, with vital signs rarely missing (all less than 1.1% except AVPU [10%]), followed by hematology labs (8%-9%), electrolytes and renal function results (12%-15%), and hepatic function tests (40%-45%). In addition to imputed data for missing vital signs and laboratory values, our model omitted human immunodeficiency virus/acquired immune deficiency syndrome and peptic ulcer disease from the adjusted models on the basis of fewer than 1000 admissions with these diagnoses listed.
Patient Outcomes
The incidence of the composite outcome was higher in admissions with at least 1 opioid medication than those without an opioid (7% vs. 4%, P < 0.001), and in admissions with at least 1 dose of benzodiazepines compared to those without a benzodiazepine (11% vs. 4%, P < 0.001) (Table 2).
Within 6-hour segments, increasing doses of opioids were associated with an initial decrease in the frequency of the composite outcome followed by a dose-related increase in the frequency of the composite outcome with morphine equivalents greater than 45 mg. By contrast, the frequency of the composite outcome increased with additional benzodiazepine equivalents (Figure).
In the adjusted model, opioid administration was associated with increased risk for the composite outcome (Table 3) in a dose-dependent fashion, with each 15 mg oral morphine equivalent associated with a 1.9% increase in the odds of ICU transfer or cardiac arrest within the subsequent 6-hour time interval (odds ratio [OR], 1.019; 95% confidence interval [CI], 1.013-1.026; P < 0.001).
Similarly, benzodiazepine administration was also associated with increased adjusted risk for the composite outcome within 6 hours in a dose-dependent manner. Each 1 mg oral lorazepam equivalent was associated with a 29% increase in the odds of ward cardiac arrest or ICU transfer (OR, 1.29; 95% CI, 1.16-1.44; P < 0.001) (Table 3).
Sensitivity Analyses
A sensitivity analysis including 1 randomly selected hospitalization per patient involved 67,097 admissions and found results similar to the primary analysis, with each 15 mg oral morphine equivalent associated with a 1.9% increase in the odds of the composite outcome (OR, 1.019; 95% CI, 1.011-1.028; P < 0.001) and each 1 mg oral lorazepam equivalent associated with a 41% increase in the odds of the composite outcome (OR, 1.41; 95% CI, 1.21-1.65; P < 0.001). Inclusion of both opioids and benzodiazepines in the adjusted model again yielded results similar to the main analysis for both opioids (OR, 1.020; 95% CI, 1.013-1.026; P < 0.001) and benzodiazepines (OR, 1.35; 95% CI, 1.18-1.54; P < 0.001), without a significant interaction detected (P = 0.09). These results were unchanged with the addition of zolpidem to the model as an additional potential confounder, and zolpidem did not increase the risk of the study outcomes (P = 0.2).
A final sensitivity analysis for the opioid model involved replacing missing pain scores with imputed values ranging from 0 to the median ward score, which was 5. The results of these analyses did not differ from the primary model and were consistent regardless of imputation value (OR, 1.018; 95% CI, 1.012-1.023; P < 0.001).
Subgroup Analyses
Analyses of opioid administration by subgroup (sex, age quartiles, BMI categories, OSA diagnosis, surgical status, daytime/nighttime medication administration, IV/PO administration, and pain severity) yielded similar results to the overall analysis (Supplemental Figure 2). Subgroup analysis of patients receiving benzodiazepines revealed similarly increased adjusted odds of the composite outcome across strata of gender, BMI, surgical status, and medication administration time (Supplemental Figure 3). Notably, patients older than 70 years who received a benzodiazepine were at 64% increased odds of the composite outcome (OR, 1.64; 95% CI, 1.30-2.08), compared to 2% to 38% increased risk for patients under 70 years. Finally, IV doses of benzodiazepines were associated with 48% increased odds for deterioration (OR, 1.48; 95% CI, 1.18-1.84; P = 0.001), compared to a nonsignificant 14% increase in the odds for PO doses (OR, 1.14; 95% CI, 0.99-1.31; P = 0.066).
DISCUSSION
In a large, single-center, observational study of ward inpatients, we found that opioid use was associated with a small but significant increased risk for clinical deterioration on the wards, with every 15 mg oral morphine equivalent increasing the odds of ICU transfer or cardiac arrest in the next 6 hours by 1.9%. Benzodiazepines were associated with a much higher risk: each equivalent of 1 mg of oral lorazepam increased the odds of ICU transfer or cardiac arrest by almost 30%. These results have important implications for care at the bedside of hospitalized ward patients and suggest the need for closer monitoring after receipt of these medications, particularly benzodiazepines.
Previous work has described negative effects of opioid medications among select inpatient populations. In surgical patients, opioids have been associated with hospital readmission, increased length of stay, and hospital mortality.26,28 More recently, Herzig et al.15 found more adverse events in nonsurgical ward patients within the hospitals prescribing opioids the most frequently. These studies may have been limited by the populations studied and the inability to control for confounders such as severity of illness and pain score. Our study expands these findings to a more generalizable population and shows that even after adjustment for potential confounders, such as severity of illness, pain score, and medication dose, opioids are associated with increased short-term risk of clinical deterioration.
By contrast, few studies have characterized the risks associated with benzodiazepine use among ward inpatients. Recently, Overdyk et al.27 found that inpatient use of opioids and sedatives was associated with increased risk for cardiac arrest and hospital death. However, this study included ICU patients, which may confound the results, as ICU patients often receive high doses of opioids or benzodiazepines to facilitate mechanical ventilation or other invasive procedures, while also having a particularly high risk of adverse outcomes like cardiac arrest and inhospital death.
Several mechanisms may explain the magnitude of effect seen with regard to benzodiazepines. First, benzodiazepines may directly produce clinical deterioration by decreased respiratory drive, diminished airway tone, or hemodynamic decompensation. It is possible that the broad spectrum of cardiorespiratory side effects of benzodiazepines—and potential unpredictability of these effects—increases the difficulty of observation and management for patients receiving them. This difficulty may be compounded with intravenous administration of benzodiazepines, which was associated with a higher risk for deterioration than oral doses in our cohort. Alternatively, benzodiazepines may contribute to clinical decompensation by masking signs of deterioration such as encephalopathy or vital sign instability like tachycardia or tachypnea that may be mistaken as anxiety. Notably, while our hospital has a nursing-driven protocol for monitoring patients receiving opioids (in which pain is serially assessed, leading to additional bedside observation), we do not have protocols for ward patients receiving benzodiazepines. Finally, although we found that orders for opioids and benzodiazepines were more common in white patients than African American patients, this finding may be due to differences in the types or number of medical comorbidities experienced by these patients.
Our study has several strengths, including the large number of admissions we included. Additionally, we included a broad range of medical and surgical ward admissions, which should increase the generalizability of our results. Further, our rates of ICU transfer are in line with data reported from other groups,41,42 which again may add to the generalizability of our findings. We also addressed many potential confounders by including patient characteristics, individual ward units, and (for opioids) pain score in our model, and by controlling for severity of illness with the eCART score, an accurate predictor of ICU transfer and ward cardiac arrest within our population.32,37 Finally, our robust methodology allowed us to include acute and cumulative medication doses, as well as time, in the model. By performing a discrete-time survival analysis, we were able to evaluate receipt of opioids and benzodiazepines—as well as risk for clinical deterioration—longitudinally, lending strength to our results.
Limitations of our study include its single-center cohort, which may reduce generalizability to other populations. Additionally, because we could not validate the accuracy of—or adherence to—outpatient medication lists, we were unable to identify chronic opioid or benzodiazepine users by these lists. However, patients chronically taking opioids or benzodiazepines would likely receive doses each hospital day; by including 24-hour cumulative doses in our model, we attempted to adjust for some portion of their chronic use. Also, because evaluation of delirium was not objectively recorded in our dataset, we were unable to evaluate the relationship between receipt of these medications and development of delirium, which is an important outcome for hospitalized patients. Finally, neither the diagnoses for which these medications were prescribed, nor the reason for ICU transfer, were present in our dataset, which leaves open the possibility of unmeasured confounding.
CONCLUSION
After adjustment for important confounders including severity of illness, medication dose, and time, opioids were associated with a slight increase in clinical deterioration on the wards, while benzodiazepines were associated with a much larger risk for deterioration. This finding raises concern about the safety of benzodiazepine use among ward patients and suggests that increased monitoring of patients receiving these medications may be warranted.
Acknowledgment
The authors thank Nicole Twu for administrative support.
Disclosure
Drs. Churpek and Edelson have a patent pending (ARCD. P0535US.P2) for risk stratification algorithms for hospitalized patients. Dr. Churpek is supported by a career development award from the National Heart, Lung, and Blood Institute (K08 HL121080). Dr. Churpek has received honoraria from Chest for invited speaking engagements. In addition, Dr. Edelson has received research support from Philips Healthcare (Andover, Massachusetts), research support from the American Heart Association (Dallas, Texas) and Laerdal Medical (Stavanger, Norway), and research support from Early Sense (Tel Aviv, Israel). She has ownership interest in Quant HC (Chicago, Illinois), which is developing products for risk stratification of hospitalized patients. Dr. Mokhlesi is supported by National Institutes of Health grant R01HL119161. Dr. Mokhlesi has served as a consultant to Philips/Respironics and has received research support from Philips/Respironics. Preliminary versions of these data were presented as a poster presentation at the 2016 meeting of the American Thoracic Society, May 17, 2016; San Francisco, California.
1. Substance Abuse and Mental Health Services Administration. Results from the 2013 National Survey on Drug Use and Health: Summary of National Findings. Rockville, MD: Substance Abuse and Mental Health Services Administration; 2014.
2. Bachhuber MA, Hennessy S, Cunningham CO, Starrels JL. Increasing benzodiazepine prescriptions and overdose mortality in the United States, 1996–2013. Am J Public Health. 2016;106(4):686-688. PubMed
3. Parsells Kelly J, Cook SF, Kaufman DW, Anderson T, Rosenberg L, Mitchell AA. Prevalence and characteristics of opioid use in the US adult population. Pain. 2008;138(3):507-513. PubMed
4. Olfson M, King M, Schoenbaum M. Benzodiazepine use in the United States. JAMA Psychiatry. 2015;72(2):136-142. PubMed
5. Hwang CS, Kang EM, Kornegay CJ, Staffa JA, Jones CM, McAninch JK. Trends in the concomitant prescribing of opioids and benzodiazepines, 2002−2014. Am J Prev Med. 2016;51(2):151-160. PubMed
6. Bohnert AS, Valenstein M, Bair MJ, et al. Association between opioid prescribing patterns and opioid overdose-related deaths. JAMA. 2011;305(13):1315-1321. PubMed
7. Dart RC, Surratt HL, Cicero TJ, et al. Trends in opioid analgesic abuse and mortality in the United States. N Engl J Med. 2015;372(3):241-248. PubMed
8. Centers for Disease Control and Prevention (CDC). Vital signs: overdoses of prescription opioid pain relievers---United States, 1999--2008. MMWR Morb Mortal Wkly Rep. 2011;60(43):1487-1492. PubMed
9. Lan TY, Zeng YF, Tang GJ, et al. The use of hypnotics and mortality - a population-based retrospective cohort study. PLoS One. 2015;10(12):e0145271. PubMed
10. Mosher HJ, Jiang L, Vaughan Sarrazin MS, Cram P, Kaboli P, Vander Weg MW. Prevalence and characteristics of hospitalized adults on chronic opioid therapy: prior opioid use among veterans. J Hosp Med. 2014;9(2):82-87. PubMed
11. Palmaro A, Dupouy J, Lapeyre-Mestre M. Benzodiazepines and risk of death: results from two large cohort studies in France and UK. Eur Neuropsychopharmacol. 2015;25(10):1566-1577. PubMed
12. Parsaik AK, Mascarenhas SS, Khosh-Chashm D, et al. Mortality associated with anxiolytic and hypnotic drugs–a systematic review and meta-analysis. Aust N Z J Psychiatry. 2016;50(6):520-533. PubMed
13. Park TW, Saitz R, Ganoczy D, Ilgen MA, Bohnert AS. Benzodiazepine prescribing patterns and deaths from drug overdose among US veterans receiving opioid analgesics: case-cohort study. BMJ. 2015;350:h2698. PubMed
14. Jones CM, McAninch JK. Emergency department visits and overdose deaths from combined use of opioids and benzodiazepines. Am J Prev Med. 2015;49(4):493-501. PubMed
15. Herzig SJ, Rothberg MB, Cheung M, Ngo LH, Marcantonio ER. Opioid utilization and opioid-related adverse events in nonsurgical patients in US hospitals. J Hosp Med. 2014;9(2):73-81. PubMed
16. Jena AB, Goldman D, Karaca-Mandic P. Hospital prescribing of opioids to Medicare beneficiaries. JAMA Intern Med. 2016;176(7):990-997. PubMed
17. Calcaterra SL, Yamashita TE, Min SJ, Keniston A, Frank JW, Binswanger IA. Opioid prescribing at hospital discharge contributes to chronic opioid use. J Gen Intern Med. 2016;31(5):478-485. PubMed
18. Garrido MM, Prigerson HG, Penrod JD, Jones SC, Boockvar KS. Benzodiazepine and sedative-hypnotic use among older seriously ill veterans: choosing wisely? Clin Ther. 2014;36(11):1547-1554. PubMed
19. Doufas AG, Tian L, Padrez KA, et al. Experimental pain and opioid analgesia in volunteers at high risk for obstructive sleep apnea. PloS One. 2013;8(1):e54807. PubMed
20. Gislason T, Almqvist M, Boman G, Lindholm CE, Terenius L. Increased CSF opioid activity in sleep apnea syndrome. Regression after successful treatment. Chest. 1989;96(2):250-254. PubMed
21. Van Ryswyk E, Antic N. Opioids and sleep disordered breathing. Chest. 2016;150(4):934-944. PubMed
22. Koga Y, Sato S, Sodeyama N, et al. Comparison of the relaxant effects of diazepam, flunitrazepam and midazolam on airway smooth muscle. Br J Anaesth. 1992;69(1):65-69. PubMed
23. Pomara N, Lee SH, Bruno D, et al. Adverse performance effects of acute lorazepam administration in elderly long-term users: pharmacokinetic and clinical predictors. Prog Neuropsychopharmacol Biol Psychiatry. 2015;56:129-135. PubMed
24. Pandharipande P, Shintani A, Peterson J, et al. Lorazepam is an independent risk factor for transitioning to delirium in intensive care unit patients. Anesthesiology. 2006;104(1):21-26. PubMed
25. O’Neil CA, Krauss MJ, Bettale J, et al. Medications and patient characteristics associated with falling in the hospital. J Patient Saf. 2015 (epub ahead of print). PubMed
26. Kessler ER, Shah M, K Gruschkus S, Raju A. Cost and quality implications of opioid-based postsurgical pain control using administrative claims data from a large health system: opioid-related adverse events and their impact on clinical and economic outcomes. Pharmacotherapy. 2013;33(4):383-391. PubMed
27. Overdyk FJ, Dowling O, Marino J, et al. Association of opioids and sedatives with increased risk of in-hospital cardiopulmonary arrest from an administrative database. PLoS One. 2016;11(2):e0150214. PubMed
28. Minkowitz HS, Gruschkus SK, Shah M, Raju A. Adverse drug events among patients receiving postsurgical opioids in a large health system: risk factors and outcomes. Am J Health Syst Pharm. 2014;71(18):1556-1565. PubMed
29. Elixhauser A, Steiner C, Harris DR, Coffey RM. Comorbidity measures for use with administrative data. Med Care. 1998;36(1):8-27. PubMed
30. Quan H, Sundararajan V, Halfon P, et al. Coding algorithms for defining comorbidities in ICD-9-CM and ICD-10 administrative data. Med Care. 2005;43(11):1130-1139. PubMed
31. Churpek MM, Yuen TC, Winslow C, et al. Multicenter development and validation of a risk stratification tool for ward patients. Am J Respir Crit Care Med. 2014;190(6):649-655. PubMed
32. Knaus WA, Wagner DP, Draper EA, Z et al. The APACHE III prognostic system. Risk prediction of hospital mortality for critically ill hospitalized adults. Chest. 1991;100(6):1619-1636. PubMed
33. van den Boogaard M, Pickkers P, Slooter AJC, et al. Development and validation
of PRE-DELIRIC (PREdiction of DELIRium in ICu patients) delirium prediction
model for intensive care patients: observational multicentre study. BMJ.
2012;344:e420. PubMed
34. Clinical calculators. ClinCalc.com. http://www.clincalc.com. Accessed February
21, 2016.
35. Churpek MM, Yuen TC, Huber MT, Park SY, Hall JB, Edelson DP. Predicting
cardiac arrest on the wards: a nested case-control study. Chest. 2012;141(5):
1170-1176. PubMed
36. Churpek MM, Yuen TC, Park SY, Gibbons R, Edelson DP. Using electronic
health record data to develop and validate a prediction model for adverse outcomes
in the wards. Crit Care Med. 2014;42(4):841-848. PubMed
37. Efron B. Logistic regression, survival analysis, and the Kaplan-Meier curve. J Am
Stat Assoc. 1988;83(402):414-425.
38. Gibbons RD, Duan N, Meltzer D, et al; Institute of Medicine Committee. Waiting
for organ transplantation: results of an analysis by an Institute of Medicine Committee.
Biostatistics. 2003;4(2):207-222. PubMed
39. Singer JD, Willett JB. It’s about time: using discrete-time survival analysis to study
duration and the timing of events. J Educ Behav Stat. 1993;18(2):155-195.
40. World Health Organization. Cancer pain relief and palliative care. Report of a
WHO Expert Committee. World Health Organ Tech Rep Ser. 1990;804:1-75. PubMed
41. Bailey TC, Chen Y, Mao Y, et al. A trial of a real-time alert for clinical deterioration
in patients hospitalized on general medical wards. J Hosp Med. 2013;8(5):236-242. PubMed
42. Liu V, Kipnis P, Rizk NW, Escobar GJ. Adverse outcomes associated with delayed
intensive care unit transfers in an integrated healthcare system. J Hosp Med.
2012;7(3):224-230. PubMed
© 2017 Society of Hospital Medicine
FRAX Prediction With and Without Bone Mineral Density Testing
In the U.S. about 2 million men have osteoporosis.1 About 1 in 5 men will experience an osteoporotic-related fracture in his lifetime.2 In addition, men with hip fracture have a higher mortality rate compared with that of women with hip fracture.3 The National Osteoporosis Foundation guidelines and the Endocrine Society guidelines recommend that all men aged ≥ 70 years have bone mineral density (BMD) testing. Depending on risk factors, osteoporosis screening may be appropriate for men aged ≥ 50 years. A BMD with a T-score of -2.5 or lower is classified as osteoporosis.2
In addition to osteoporosis, osteopenia also negatively impacts men. Osteopenia is defined as a BMD with a T-score of -1 to -2.5.2 According to the National Health and Nutrition Examination Survey (NHANES), about 30% of men aged ≥ 50 years have osteopenia.4 FRAX is a fracture risk assessment tool that is used to predict the 10-year risk of fracture in untreated patients with osteopenia. The FRAX tool has been validated with the use of BMD testing only at the femoral neck; it has not been validated in other parts of the body. Treatment is indicated if the 10-year fracture risk is > 20% for major osteoporotic fractures and > 3% for hip fractures, based on the FRAX calculation.2
The following risk factors are used in the FRAX calculation: age; sex; weight (kilograms); height (centimeters); previous fracture (yes or no); parental history of hip fracture (yes or no); current smoker (yes or no); oral glucocorticoid exposure currently or for > 3 months in the past (yes or no); rheumatoid arthritis (yes or no); secondary osteoporosis or a disorder strongly associated with osteoporosis, including type 1 diabetes mellitus, osteogenesis imperfecta in adults, untreated long-standing hyperthyroidism, hypogonadism, premature menopause, chronic malnutrition, malabsorption, or chronic liver disease (yes or no); 3 or more units of alcohol daily (yes or no); and BMD.5
A dual-energy X-ray absorptiometry (DXA) examination is needed to determine BMD. However, a DXA examination is not always feasible for patients who have limited access, transportation challenges, require the use of assistive devices, and may be unaware of the importance of BMD testing.
The FRAX calculation can be obtained with or without BMD. Gadam and colleagues compared FRAX calculations with and without BMD to predict the 10-year risk of fracture.6 Their study found that 84% of patients had an identical fracture risk prediction whether or not BMD was included. The only risk factor evaluated that was significantly different between those with different treatment predictions and those with identical treatment predictions was age. However, the majority of patients included were female (96%).
No studies existed that compared fracture prediction risk with and without BMD in a male-only population. The purpose of this study was to determine whether FRAX without BMD was as effective as FRAX with BMD to predict the risk of osteoporotic fractures and provide an identical treatment recommendation in male veteran patients at the Lexington VAMC in Kentucky.
Methods
A retrospective chart review was conducted at the Lexington VAMC. Approval was obtained from the Lexington VAMC Institutional Review Board and Research and Development Committee. Patients were identified using the computerized patient record system (CPRS). Included patients were male, ≥ 50 years, had a documented DXA in CPRS from January 2006 to September 2015, and had a previous fracture determined by ICD-9 codes. Patients were excluded if they were diagnosed with osteoporosis or were ever treated for osteoporosis before a DXA scan.
Data collection included patient’s age, gender, race, glucocorticoid use for at least 3 months within 1 year prior to DXA, body weight within 3 months prior to DXA, height within 1 year prior to DXA, family history of fracture, previous fall or fracture, diagnosis of rheumatoid arthritis, smoking status at the time of DXA, alcohol intake of at least 3 drinks per day at the time of DXA, and vitamin D level within 1 year prior to DXA. In order to find a clinically significant difference (P < .05) with a power of 80%, a sample size of 64 patients was needed.
Each patient’s FRAX predictions were calculated with and without BMD. Patients were then separated into 2 groups: those who had an identical treatment recommendation when calculating FRAX with and without BMD, and those who had a different treatment recommendation when calculating FRAX with and without BMD. Binary variables for each group were compared using the Fisher exact test, and numeric variables were compared using a simple Student’s t test.
Results
After screening 1,510 patients, only 119 patients met the criteria and were included in the study (Figure). All patients included were male. Mean age was 71.2 years and 113 (95.0%) were white (Table 1).
Of the 119 patients included in the study, 98 patients (82.4%) had the same treatment recommendation when the FRAX score was calculated with and without BMD. The remaining 21 patients (17.6%) had different treatment recommendations when FRAX scores were calculated with BMD compared with FRAX scores calculated without BMD. Treatment was recommended based on risk prediction for 43 of the 98 patients who had identical treatment recommendations. Of the 21 patients who had different treatment recommendations, treatment was recommended based on risk prediction for 14 patients when FRAX scores were calculated with BMD. Treatment was recommended for the other 7 patients when FRAX scores were calculated without BMD.
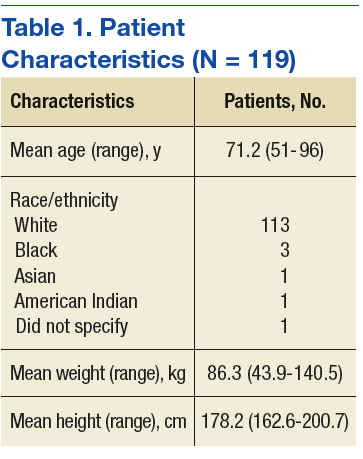
Of the numeric variables evaluated, mean age, femoral neck BMD, and T-score were all significantly different between the 2 groups (Table 2). Patients with an identical treatment recommendation were a mean age of 67.9 years (SD: 10.2 y), and patients with different treatment recommendations were a mean age of 62.2 years (SD: 8.9 y) (P = .011). Patients with an identical treatment recommendation had a mean BMD of 0.9 (SD: 0.2), and patients with different treatment recommendations had a mean BMD of 0.8 (SD: 0.1) (P = .021). Patients with an identical treatment recommendation had a mean T-score of -1.7 (SD: 1.2), and patients with different treatment recommendations had a mean T-score of -2.3 (SD: 1.1) (P = .031). Mean weight, height, and vitamin D level were not statistically significantly different between the 2 groups.
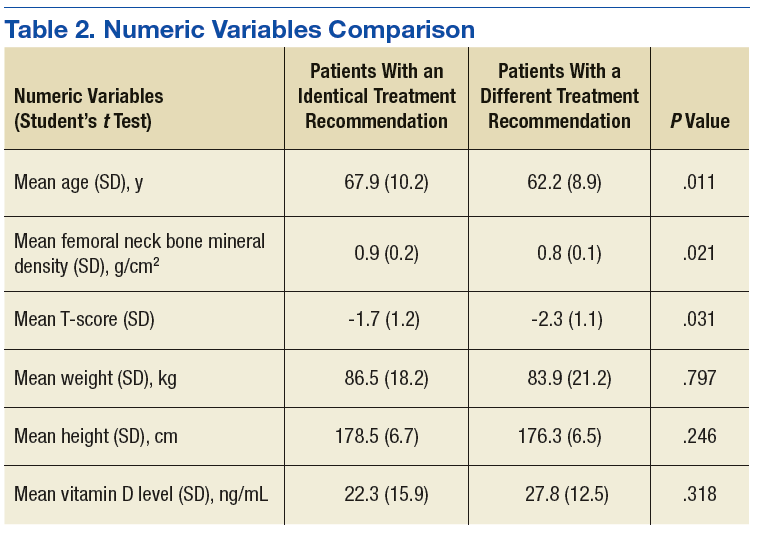
Of the binary variables evaluated, only glucocorticoid use was significantly different between the 2 groups. Of the patients with an identical treatment recommendation, 4 (4.1%) received a glucocorticoid. 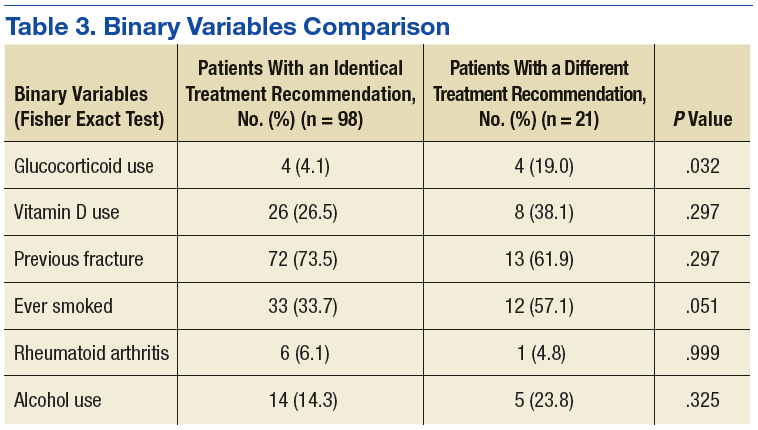
Discussion
The purpose of this retrospective study was to determine whether using FRAX without BMD was as effective as using FRAX with BMD in predicting the risk of osteoporotic fractures and in providing identical treatment recommendations in male veteran patients. The results of this study revealed that FRAX calculations without BMD provided identical treatment recommendations as FRAX calculations with BMD for 82.4% of male veteran patients. These findings were similar to the findings of another study by Gadam and colleagues, in which 84% of patients had identical treatment recommendations when calculating FRAX scores with and without BMD.6 In contrast, a prospective cohort study by Ettinger and colleagues found that the addition of BMD to the FRAX calculation enhanced the performance of the FRAX tool by correctly identifying more patients who experienced a fracture within the following 10 years.8
Several of the risk factors evaluated in the present study were indicative of an identical treatment recommendation. Age was one of the risk factors that differed significantly between the 2 groups. The mean age of patients with an identical treatment recommendation was 67.9 years, and the mean age of patients with different treatment recommendations was 62.2 years (P = .011). These findings opposed the findings in the Gadam and colleagues’ study.6 The results of that study revealed that younger age rather than older age was more indicative of an identical treatment recommendation. The study by Gadam and colleagues included both male and female patients; however, the majority of patients included in the Gadam study were female (96%).6 Because the present study included only male patients, a comparison of the results was difficult because of the different patient populations.
A higher T-score (P = .031) and a higher BMD (P = .021) were the other 2 risk factors associated with an identical treatment recommendation with and without BMD. The Gadam and colleagues study did not find these to be significant risk factors for identifying an identical treatment recommendation.6
The FRAX calculation without BMD identified all the patients meeting treatment criteria based on the FRAX calculation with BMD except for 14 of the 119 patients (11.8%). Therefore, > 88% of patients who met treatment criteria based on FRAX calculated with BMD also met treatment criteria based on FRAX without BMD.
The FRAX calculation has several advantages, including risk stratification in men and identifying those with other conditions that may predispose them to a fracture.7 Therefore, before obtaining a DXA scan, it would be reasonable to calculate a FRAX score without BMD to identify patients who are at high risk for fracture but who may not receive treatment because they are not considered to need a DXA scan or a DXA scan is not feasible.
Limitations
Currently, FRAX is validated only using femoral neck BMD. This study was a retrospective chart review only; no information was obtained from communicating with the patient, including the patient’s past medical history and family history. Also, this study had a small sample size: Of the 1,510 patients screened, only 119 met inclusion criteria. None of the 119 patients evaluated had a family history of fracture documented in their CPRS. Therefore, several of the patient’s 10-year fracture risk scores may be underestimated if one or both of their parents experienced a fracture. Last, the majority of patients included in this study were white, so the results of this study cannot necessarily be generalized to other races.
Conclusion
The majority of male patients had an identical treatment recommendation when a FRAX score was calculated with and without BMD. Older age, higher BMD, and higher T-score were all indicative of an identical treatment recommendation. Larger studies are necessary in order to validate the FRAX tool without the use of femoral neck BMD. However, the FRAX tool alone can be beneficial to identify male patients who should have a DXA scan performed to obtain a BMD. If a male patient’s FRAX score suggests risk for osteoporotic fracture, then a DXA scan should be completed to obtain a BMD if feasible.
Additionally, when obtaining a BMD is not feasible to predict fracture risk, the FRAX tool alone may be useful a majority of the time to accurately determine treatment recommendations in male patients aged > 65 years. The results of this study lead the authors to believe that FRAX without BMD in male patients aged > 65 years will appropriately identify more patients for treatment. ˜
Acknowledgments
This material is the result of work supported with resources and the use of facilities at the Lexington VA Medical Center.
1. Sweet MG, Sweet JM, Jeremiah MP, Galazka SS. Diagnosis and treatment of osteoporosis. Am Fam Physician. 2009;79(3):193-200.
2. Cosman F, de Beur SJ, LeBoff MS, et al. Clinician’s guide to prevention and treatment of osteoporosis. Osteoporos Int. 2014;25(10):2359-2381.
3. Khan AA, Hodsman AB, Papaioannou A, Kendler D, Brown JP, Olszynski WP. Management of osteoporosis in men: an update and case example. CMAJ. 2007;176(3):345-348.
4. Looker AC, Melton LJ III, Harris TB, Borrud LG, Shepherd JA. Prevalence and trends in low femur bone density among older US adults: NHANES 2005-2006 compared with NHANES III. J Bone Miner Res. 2010;25(1):64-71.
5. Kanas JA; World Health Organization Scientific Group. Assessment of osteoporosis at the primary health care level. https://www.shef.ac.uk/FRAX/pdfs/WHO_Technical_Report.pdf. Published 2007. Accessed March 29, 2017.
6. Gadam RK, Schlauch K, Izuora KE. FRAX prediction without BMD for assessment of osteoporotic fracture risk. Endocr Pract. 2013;19(5):780-784.
7. Siris E, Delmas PD. Assessment of 10-year absolute fracture risk: a new paradigm with worldwide application. Osteoporosis Int. 2008;19(4):383-384.
8. Ettinger B, Liu H, Blackwell T, et al. Validation of FRC, a fracture risk assessment tool, in a cohort of older men: the osteoporotic fractures in men (MrOS) study. J Clin Densitom. 2012;15(3):334-342.
In the U.S. about 2 million men have osteoporosis.1 About 1 in 5 men will experience an osteoporotic-related fracture in his lifetime.2 In addition, men with hip fracture have a higher mortality rate compared with that of women with hip fracture.3 The National Osteoporosis Foundation guidelines and the Endocrine Society guidelines recommend that all men aged ≥ 70 years have bone mineral density (BMD) testing. Depending on risk factors, osteoporosis screening may be appropriate for men aged ≥ 50 years. A BMD with a T-score of -2.5 or lower is classified as osteoporosis.2
In addition to osteoporosis, osteopenia also negatively impacts men. Osteopenia is defined as a BMD with a T-score of -1 to -2.5.2 According to the National Health and Nutrition Examination Survey (NHANES), about 30% of men aged ≥ 50 years have osteopenia.4 FRAX is a fracture risk assessment tool that is used to predict the 10-year risk of fracture in untreated patients with osteopenia. The FRAX tool has been validated with the use of BMD testing only at the femoral neck; it has not been validated in other parts of the body. Treatment is indicated if the 10-year fracture risk is > 20% for major osteoporotic fractures and > 3% for hip fractures, based on the FRAX calculation.2
The following risk factors are used in the FRAX calculation: age; sex; weight (kilograms); height (centimeters); previous fracture (yes or no); parental history of hip fracture (yes or no); current smoker (yes or no); oral glucocorticoid exposure currently or for > 3 months in the past (yes or no); rheumatoid arthritis (yes or no); secondary osteoporosis or a disorder strongly associated with osteoporosis, including type 1 diabetes mellitus, osteogenesis imperfecta in adults, untreated long-standing hyperthyroidism, hypogonadism, premature menopause, chronic malnutrition, malabsorption, or chronic liver disease (yes or no); 3 or more units of alcohol daily (yes or no); and BMD.5
A dual-energy X-ray absorptiometry (DXA) examination is needed to determine BMD. However, a DXA examination is not always feasible for patients who have limited access, transportation challenges, require the use of assistive devices, and may be unaware of the importance of BMD testing.
The FRAX calculation can be obtained with or without BMD. Gadam and colleagues compared FRAX calculations with and without BMD to predict the 10-year risk of fracture.6 Their study found that 84% of patients had an identical fracture risk prediction whether or not BMD was included. The only risk factor evaluated that was significantly different between those with different treatment predictions and those with identical treatment predictions was age. However, the majority of patients included were female (96%).
No studies existed that compared fracture prediction risk with and without BMD in a male-only population. The purpose of this study was to determine whether FRAX without BMD was as effective as FRAX with BMD to predict the risk of osteoporotic fractures and provide an identical treatment recommendation in male veteran patients at the Lexington VAMC in Kentucky.
Methods
A retrospective chart review was conducted at the Lexington VAMC. Approval was obtained from the Lexington VAMC Institutional Review Board and Research and Development Committee. Patients were identified using the computerized patient record system (CPRS). Included patients were male, ≥ 50 years, had a documented DXA in CPRS from January 2006 to September 2015, and had a previous fracture determined by ICD-9 codes. Patients were excluded if they were diagnosed with osteoporosis or were ever treated for osteoporosis before a DXA scan.
Data collection included patient’s age, gender, race, glucocorticoid use for at least 3 months within 1 year prior to DXA, body weight within 3 months prior to DXA, height within 1 year prior to DXA, family history of fracture, previous fall or fracture, diagnosis of rheumatoid arthritis, smoking status at the time of DXA, alcohol intake of at least 3 drinks per day at the time of DXA, and vitamin D level within 1 year prior to DXA. In order to find a clinically significant difference (P < .05) with a power of 80%, a sample size of 64 patients was needed.
Each patient’s FRAX predictions were calculated with and without BMD. Patients were then separated into 2 groups: those who had an identical treatment recommendation when calculating FRAX with and without BMD, and those who had a different treatment recommendation when calculating FRAX with and without BMD. Binary variables for each group were compared using the Fisher exact test, and numeric variables were compared using a simple Student’s t test.
Results
After screening 1,510 patients, only 119 patients met the criteria and were included in the study (Figure). All patients included were male. Mean age was 71.2 years and 113 (95.0%) were white (Table 1).
Of the 119 patients included in the study, 98 patients (82.4%) had the same treatment recommendation when the FRAX score was calculated with and without BMD. The remaining 21 patients (17.6%) had different treatment recommendations when FRAX scores were calculated with BMD compared with FRAX scores calculated without BMD. Treatment was recommended based on risk prediction for 43 of the 98 patients who had identical treatment recommendations. Of the 21 patients who had different treatment recommendations, treatment was recommended based on risk prediction for 14 patients when FRAX scores were calculated with BMD. Treatment was recommended for the other 7 patients when FRAX scores were calculated without BMD.
Of the numeric variables evaluated, mean age, femoral neck BMD, and T-score were all significantly different between the 2 groups (Table 2). Patients with an identical treatment recommendation were a mean age of 67.9 years (SD: 10.2 y), and patients with different treatment recommendations were a mean age of 62.2 years (SD: 8.9 y) (P = .011). Patients with an identical treatment recommendation had a mean BMD of 0.9 (SD: 0.2), and patients with different treatment recommendations had a mean BMD of 0.8 (SD: 0.1) (P = .021). Patients with an identical treatment recommendation had a mean T-score of -1.7 (SD: 1.2), and patients with different treatment recommendations had a mean T-score of -2.3 (SD: 1.1) (P = .031). Mean weight, height, and vitamin D level were not statistically significantly different between the 2 groups.
Of the binary variables evaluated, only glucocorticoid use was significantly different between the 2 groups. Of the patients with an identical treatment recommendation, 4 (4.1%) received a glucocorticoid.
Discussion
The purpose of this retrospective study was to determine whether using FRAX without BMD was as effective as using FRAX with BMD in predicting the risk of osteoporotic fractures and in providing identical treatment recommendations in male veteran patients. The results of this study revealed that FRAX calculations without BMD provided identical treatment recommendations as FRAX calculations with BMD for 82.4% of male veteran patients. These findings were similar to the findings of another study by Gadam and colleagues, in which 84% of patients had identical treatment recommendations when calculating FRAX scores with and without BMD.6 In contrast, a prospective cohort study by Ettinger and colleagues found that the addition of BMD to the FRAX calculation enhanced the performance of the FRAX tool by correctly identifying more patients who experienced a fracture within the following 10 years.8
Several of the risk factors evaluated in the present study were indicative of an identical treatment recommendation. Age was one of the risk factors that differed significantly between the 2 groups. The mean age of patients with an identical treatment recommendation was 67.9 years, and the mean age of patients with different treatment recommendations was 62.2 years (P = .011). These findings opposed the findings in the Gadam and colleagues’ study.6 The results of that study revealed that younger age rather than older age was more indicative of an identical treatment recommendation. The study by Gadam and colleagues included both male and female patients; however, the majority of patients included in the Gadam study were female (96%).6 Because the present study included only male patients, a comparison of the results was difficult because of the different patient populations.
A higher T-score (P = .031) and a higher BMD (P = .021) were the other 2 risk factors associated with an identical treatment recommendation with and without BMD. The Gadam and colleagues study did not find these to be significant risk factors for identifying an identical treatment recommendation.6
The FRAX calculation without BMD identified all the patients meeting treatment criteria based on the FRAX calculation with BMD except for 14 of the 119 patients (11.8%). Therefore, > 88% of patients who met treatment criteria based on FRAX calculated with BMD also met treatment criteria based on FRAX without BMD.
The FRAX calculation has several advantages, including risk stratification in men and identifying those with other conditions that may predispose them to a fracture.7 Therefore, before obtaining a DXA scan, it would be reasonable to calculate a FRAX score without BMD to identify patients who are at high risk for fracture but who may not receive treatment because they are not considered to need a DXA scan or a DXA scan is not feasible.
Limitations
Currently, FRAX is validated only using femoral neck BMD. This study was a retrospective chart review only; no information was obtained from communicating with the patient, including the patient’s past medical history and family history. Also, this study had a small sample size: Of the 1,510 patients screened, only 119 met inclusion criteria. None of the 119 patients evaluated had a family history of fracture documented in their CPRS. Therefore, several of the patient’s 10-year fracture risk scores may be underestimated if one or both of their parents experienced a fracture. Last, the majority of patients included in this study were white, so the results of this study cannot necessarily be generalized to other races.
Conclusion
The majority of male patients had an identical treatment recommendation when a FRAX score was calculated with and without BMD. Older age, higher BMD, and higher T-score were all indicative of an identical treatment recommendation. Larger studies are necessary in order to validate the FRAX tool without the use of femoral neck BMD. However, the FRAX tool alone can be beneficial to identify male patients who should have a DXA scan performed to obtain a BMD. If a male patient’s FRAX score suggests risk for osteoporotic fracture, then a DXA scan should be completed to obtain a BMD if feasible.
Additionally, when obtaining a BMD is not feasible to predict fracture risk, the FRAX tool alone may be useful a majority of the time to accurately determine treatment recommendations in male patients aged > 65 years. The results of this study lead the authors to believe that FRAX without BMD in male patients aged > 65 years will appropriately identify more patients for treatment. ˜
Acknowledgments
This material is the result of work supported with resources and the use of facilities at the Lexington VA Medical Center.
1. Sweet MG, Sweet JM, Jeremiah MP, Galazka SS. Diagnosis and treatment of osteoporosis. Am Fam Physician. 2009;79(3):193-200.
2. Cosman F, de Beur SJ, LeBoff MS, et al. Clinician’s guide to prevention and treatment of osteoporosis. Osteoporos Int. 2014;25(10):2359-2381.
3. Khan AA, Hodsman AB, Papaioannou A, Kendler D, Brown JP, Olszynski WP. Management of osteoporosis in men: an update and case example. CMAJ. 2007;176(3):345-348.
4. Looker AC, Melton LJ III, Harris TB, Borrud LG, Shepherd JA. Prevalence and trends in low femur bone density among older US adults: NHANES 2005-2006 compared with NHANES III. J Bone Miner Res. 2010;25(1):64-71.
5. Kanas JA; World Health Organization Scientific Group. Assessment of osteoporosis at the primary health care level. https://www.shef.ac.uk/FRAX/pdfs/WHO_Technical_Report.pdf. Published 2007. Accessed March 29, 2017.
6. Gadam RK, Schlauch K, Izuora KE. FRAX prediction without BMD for assessment of osteoporotic fracture risk. Endocr Pract. 2013;19(5):780-784.
7. Siris E, Delmas PD. Assessment of 10-year absolute fracture risk: a new paradigm with worldwide application. Osteoporosis Int. 2008;19(4):383-384.
8. Ettinger B, Liu H, Blackwell T, et al. Validation of FRC, a fracture risk assessment tool, in a cohort of older men: the osteoporotic fractures in men (MrOS) study. J Clin Densitom. 2012;15(3):334-342.
Readability of Orthopedic Trauma Patient Education Materials on the Internet
Take-Home Points
- The Flesch-Kincaid Readability Scale is a useful tool in evaluating the readability of PEMs.
- Only 1 article analyzed in our study was below a sixth-grade readability level.
- Coauthorship of PEMs with other subspecialty groups had no effect on readability.
- Poor health literacy has been associated with poor health outcomes.
- Efforts must be undertaken to make PEMs more readable across medical subspecialties.
Patients increasingly turn to the Internet to self-educate about orthopedic conditions.1,2 Accordingly, the Internet has become a valuable tool in maintaining effective physician-patient communication.3-5 Given the Internet’s importance as a medium for conveying patient information, it is important that orthopedic patient education materials (PEMs) on the Internet provide high-quality information that is easily read by the target patient population. Unfortunately, studies have found that many of the Internet’s orthopedic PEMs have been neither of high quality6-8 nor presented such that they are easy for patients to read and comprehend.1,9-12
Readability, which is the reading comprehension level (school grade level) a person must have to understand written materials, is determined by systematic formulae12; readability levels correlate with the ability to comprehend written information.2 Studies have consistently found that orthopedic PEMs are written at readability levels too high for the average patient to understand.1,9,13 The readability of PEMs in orthopedics as a whole9 and within the orthopedic subspecialties of arthroplasty,1 foot and ankle surgery,2 sports medicine,12 and spine surgery13 has been evaluated, but so far there has been no evaluation of PEMs in orthopedic trauma (OT).
We conducted a study to assess the readability of OT-PEMs available online from the American Academy of Orthopaedic Surgeons (AAOS) in conjunction with the Orthopaedic Trauma Association (OTA) and other orthopedic subspecialty societies. We hypothesized the readability levels of these OT-PEMs would be above the level (sixth to eighth grade) recommended by several healthcare organizations, including the Centers for Disease Control and Prevention.9,11,14 We also assessed the effect that orthopedic subspecialty coauthorship has on PEM readability.
Methods
In July 2014, we searched the AAOS online patient education library (Broken Bones & Injuries section, http://orthoinfo.aaos.org/menus/injury.cfm) and the AAOS OrthoPortal website (Trauma section, http://pubsearch.aaos.org/search?q=trauma&client=OrthoInfo&site=PATIENT&output=xml_no_dtd&proxystylesheet=OrthoInfo&filter=0) for all relevant OT-PEMs. Although OTA does not publish its own PEMs on its website, it coauthored several of the articles in the AAOS patient education library. Other subspecialty organizations, including the American Orthopaedic Society for Sports Medicine (AOSSM), the American Society for Surgery of the Hand (ASSH), the Pediatric Orthopaedic Society of North America (POSNA), the American Shoulder and Elbow Surgeons (ASES), the American Association of Hip and Knee Surgeons (AAHKS), and the American Orthopaedic Foot and Ankle Society (AOFAS), coauthored several of these online OT-PEMs as well.
Using the technique described by Badarudeen and Sabharwal,10 we saved all articles to be included in the study as separate Microsoft Word 2011 files. We saved them in plain-text format to remove any HTML tags and any other hidden formatting that might affect readability results. Then we edited them to remove elements that might affect readability result accuracy—deleted article topic–unrelated information (eg, copyright notice, disclaimers, author information) and all numerals, decimal points, bullets, abbreviations, paragraph breaks, colons, semicolons, and dashes.10Mr. Mohan used the Flesch-Kincaid (FK) Readability Scale to calculate grade level for each article. Microsoft Word 2011 was used as described in other investigations of orthopedic PEM readability2,10,12,13: Its readability function is enabled by going to the Tools tab and then to the Spelling & Grammar tool, where the “Show readability statistics” option is selected.10 Readability scores are calculated with the Spelling & Grammar tool; the readability score is displayed after completion of the spelling-and-grammar check. The formula used to calculate FK grade level is15: (0.39 × average number of words per sentence) + (11.8 × average number of syllables per word) – 15.59.
Statistical Analysis
Descriptive statistics, including means and 95% confidence intervals (CIs), were calculated for the FK grade levels. Student t tests were used to compare average FK grade levels of articles written exclusively by AAOS with those of articles coauthored by AAOS and other orthopedic subspecialty societies. A 2-sample unequal-variance t test was used, and significance was set at P < .05. Total number of articles written at or below the sixth- and eighth-grade levels, the reading levels recommended for PEMs, were tabulated.1,9-12 Intraobserver and interobserver reliabilities were calculated with intraclass correlation coefficients (ICCs): Mr. Mohan, who calculated the FK scores earlier, now 1 week later calculated the readability levels of 15 randomly selected articles10,11; in addition, Mr. Mohan and Dr. Yi independently calculated the readability levels of 30 randomly selected articles.10,11 The same method described earlier—edit plain-text files, then use Microsoft Word to obtain FK scores—was again used. ICCs of 0 to 0.24 correspond to poor correlation; 0.25 to 0.49, low correlation; 0.5 to 0.69, fair correlation; 0.7 to 0.89, good correlation; and 0.9 to 1.0, excellent correlation.10,11 All statistical analyses were performed with Microsoft Excel 2011 and VassarStats (http://vassarstats.net/tu.html).
Results
Of the 115 AAOS website articles included in the study and reviewed, 18 were coauthored by OTA, 10 by AOSSM, 14 by POSNA, 2 by ASSH, 2 by ASES, 1 by AAHKS, 3 by AOFAS, 1 by AOSSM and ASES, and 1 by AOFAS and AOSSM.
Mean FK grade level was 9.1 (range, 6.2-12; 95% CI, 8.9-9.3) for all articles reviewed and 9.1 (range, 6.2-12; 95% CI, 8.8-9.4) for articles exclusively written by AAOS. For coauthored articles, mean FK grade level was 9.3 (range, 7.6-11.3; 95% CI, 8.8-9.8) for AAOS-OTA; 8.9 (range, 7.4-10.4; 95% CI, 8.4-9.6) for AAOS-AOSSM; 9.4 (range, 7-11.8; 95% CI, 8.9-10.1) for AAOS-POSNA; 7.8 (range, 7.8-9.1; 95% CI, 7.2-9.8) for AAOS-ASSH; 9 (range, 8.2-9.6; 95% CI, 7.6-10.2) for AAOS-ASES; 9 (range, 7.9-9; 95% CI, 7.9-9.3) for AAOS-AOFAS; 8.1 for the 1 AAOS-AAHKS article; 8.5 for the 1 AAOS-AOSSM-ASES article; and 8 for the 1 AAOS-AOFAS-AOSSM article (Figure). 
For FK readability calculations, interobserver reliability (ICC, 0.9982) and intraobserver reliability (ICC, 1) were both excellent.
Discussion
Although increasing numbers of patients are using information from the Internet to inform their healthcare decisions,12 studies have shown that online PEMs are written at a readability level above that of the average patient.1,9,13 In the present study, we also found that OT-PEMs from AAOS are written at a level considerably higher than the recommended sixth-grade reading level,16 potentially impairing patient comprehension and leading to poorer health outcomes.17
The pervasiveness of too-high PEM readability levels has been found across orthopedic subspecialties.2,9,12,13 Following this trend, the OT articles we reviewed had a ninth-grade reading level on average, and only 1 of 115 articles was below the recommended sixth-grade level.10 The issue of too-high PEM readability levels is thus a problem both in OT and in orthopedics in general. Accordingly, efforts to address this problem are warranted, especially as orthopedic PEM readability has not substantially improved over the past several years.18In this study, we also tried to identify any readability differences between articles coauthored by orthopedic societies and articles that were not coauthored by orthopedic societies. We hypothesized that multidisciplinary authorship could improve PEM readability; for example, orthopedic societies could collaborate with other medical specialties (eg, family medicine) that have produced appropriately readable PEMs. One study found that the majority of PEMs from the American Academy of Family Physicians (AAFP) were written below the sixth-grade reading level because of strict organizational regulation of the production of such materials.19 By noting and adopting successful PEM development methods used by groups such as AAFP,19,20 we might be able to improve OT-PEM readability. However, this was not the case in our study, though our observations may have been limited by the small sample of reviewable articles.
One factor contributing to the poor readability of orthopedic PEMs is that orthopedics terminology is complex and includes words that are often difficult to translate into simpler terms without losing their meaning.10 When PEMs are written at a level that is too complex, patients cannot fully comprehend them, which may lead to poor health literacy. This problem may be even more harmful when considering the poor literacy levels of patients at baseline. Kadakia and colleagues16 found that OT patients had poor health literacy; for example, fewer than half knew which bone they fractured. As health literacy is associated with poorer health outcomes and reduced use of healthcare services,21 optimizing patients’ health literacy is of crucial importance to both their education and their outcomes.
Our study should be viewed in light of some important limitations. As OTA does not publish its own PEMs, we assessed only OT-related articles that were available on the AAOS website and were exclusively written by AAOS, or coauthored by AAOS and by OTA and/or another orthopedic subspecialty organization. As these articles represent only a subset of the full spectrum of OT-PEMs available on the Internet, our results may not be generalizable to the entire scope of such materials. However, as AAOS and OTA represent the most authoritative OT organizations, we think these PEMs would be among those most likely to be recommended to patients by their surgeons. In addition, although we used a well-established tool for examining readability—the FK readability scale10-13—this tool has its own inherent limitations, as FK readability grade level is calculated purely on the basis of words per sentence and total syllables per word, and does not take into account other article elements, such as images, which also provide information.1,10 Nevertheless, the FK scale is an inexpensive, easily accessed readability tool that provides a reproducible readability value that is easily comparable to results from earlier studies.10 The final limitation is that we excluded from the study AAOS website articles written in a language other than English. Such articles, however, are important, as a large portion of the patient population speaks English as a second language. Indeed, the readability of Spanish PEMs has been investigated—albeit using a readability measure other than the FK scale—and may be a topic pertinent to orthopedic PEMs.22Most of the literature on the readability of orthopedic PEMs has found their reading levels too high for the average patient to comprehend.1,9-12 The trend continues with our study findings regarding OT-PEMs available online from AAOS. Although the literature on the inadequacies of orthopedic PEMs is vast,1,9-12 more work is needed to improve the quality, accuracy, and readability of these materials. There has been some success in improving PEM readability and producing appropriately readable materials within the medical profession,19,23 so we know that appropriately readable orthopedic PEMs are feasible.
Am J Orthop. 2017;46(3):E190-E194. Copyright Frontline Medical Communications Inc. 2017. All rights reserved.
1. Polishchuk DL, Hashem J, Sabharwal S. Readability of online patient education materials on adult reconstruction web sites. J Arthroplasty. 2012;27(5):716-719.
2. Bluman EM, Foley RP, Chiodo CP. Readability of the patient education section of the AOFAS website. Foot Ankle Int. 2009;30(4):287-291.
3. Hoffmann T, Russell T. Pre-admission orthopaedic occupational therapy home visits conducted using the Internet. J Telemed Telecare. 2008;14(2):83-87.
4. Rider T, Malik M, Chevassut T. Haematology patients and the Internet—the use of on-line health information and the impact on the patient–doctor relationship. Patient Educ Couns. 2014;97(2):223-238.
5. AlGhamdi KM, Moussa NA. Internet use by the public to search for health-related information. Int J Med Inform. 2012;81(6):363-373.
6. Beredjiklian PK, Bozentka DJ, Steinberg DR, Bernstein J. Evaluating the source and content of orthopaedic information on the Internet. The case of carpal tunnel syndrome. J Bone Joint Surg Am. 2000;82(11):1540-1543.
7. Meena S, Palaniswamy A, Chowdhury B. Web-based information on minimally invasive total knee arthroplasty. J Orthop Surg (Hong Kong). 2013;21(3):305-307.
8. Labovitch RS, Bozic KJ, Hansen E. An evaluation of information available on the Internet regarding minimally invasive hip arthroplasty. J Arthroplasty. 2006;21(1):1-5.
9. Badarudeen S, Sabharwal S. Assessing readability of patient education materials: current role in orthopaedics. Clin Orthop Relat Res. 2010;468(10):2572-2580.
10. Badarudeen S, Sabharwal S. Readability of patient education materials from the American Academy of Orthopaedic Surgeons and Pediatric Orthopaedic Society of North America web sites. J Bone Joint Surg Am. 2008;90(1):199-204.
11. Yi PH, Ganta A, Hussein KI, Frank RM, Jawa A. Readability of arthroscopy-related patient education materials from the American Academy of Orthopaedic Surgeons and Arthroscopy Association of North America web sites. Arthroscopy. 2013;29(6):1108-1112.
12. Ganta A, Yi PH, Hussein K, Frank RM. Readability of sports medicine–related patient education materials from the American Academy of Orthopaedic Surgeons and the American Orthopaedic Society for Sports Medicine. Am J Orthop. 2014;43(4):E65-E68.
13. Vives M, Young L, Sabharwal S. Readability of spine-related patient education materials from subspecialty organization and spine practitioner websites. Spine. 2009;34(25):2826-2831.
14. Strategic and Proactive Communication Branch, Division of Communication Services, Office of the Associate Director for Communication, Centers for Disease Control and Prevention, US Department of Health and Human Services. Simply Put: A Guide for Creating Easy-to-Understand Materials. 3rd ed. http://www.cdc.gov/healthliteracy/pdf/Simply_Put.pdf. Published July 2010. Accessed February 7, 2015.
15. Wallace LS, Keenum AJ, DeVoe JE. Evaluation of consumer medical information and oral liquid measuring devices accompanying pediatric prescriptions. Acad Pediatr. 2010;10(4):224-227.
16. Kadakia RJ, Tsahakis JM, Issar NM, et al. Health literacy in an orthopedic trauma patient population: a cross-sectional survey of patient comprehension. J Orthop Trauma. 2013;27(8):467-471.
17. Peterson PN, Shetterly SM, Clarke CL, et al. Health literacy and outcomes among patients with heart failure. JAMA. 2011;305(16):1695-1701.
18. Feghhi DP, Agarwal N, Hansberry DR, Berberian WS, Sabharwal S. Critical review of patient education materials from the American Academy of Orthopaedic Surgeons. Am J Orthop. 2014;43(8):E168-E174.
19. Schoof ML, Wallace LS. Readability of American Academy of Family Physicians patient education materials. Fam Med. 2014;46(4):291-293.
20. Doak CC, Doak LG, Root JH. Teaching Patients With Low Literacy Skills. 2nd ed. Philadelphia, PA: Lippincott; 1996.
21. Berkman ND, Sheridan SL, Donahue KE, Halpern DJ, Crotty K. Low health literacy and health outcomes: an updated systematic review. Ann Intern Med. 2011;155(2):97-107.
22. Berland GK, Elliott MN, Morales LS, et al. Health information on the Internet: accessibility, quality, and readability in English and Spanish. JAMA. 2001;285(20):2612-2621.
23. Sheppard ED, Hyde Z, Florence MN, McGwin G, Kirchner JS, Ponce BA. Improving the readability of online foot and ankle patient education materials. Foot Ankle Int. 2014;35(12):1282-1286.
Take-Home Points
- The Flesch-Kincaid Readability Scale is a useful tool in evaluating the readability of PEMs.
- Only 1 article analyzed in our study was below a sixth-grade readability level.
- Coauthorship of PEMs with other subspecialty groups had no effect on readability.
- Poor health literacy has been associated with poor health outcomes.
- Efforts must be undertaken to make PEMs more readable across medical subspecialties.
Patients increasingly turn to the Internet to self-educate about orthopedic conditions.1,2 Accordingly, the Internet has become a valuable tool in maintaining effective physician-patient communication.3-5 Given the Internet’s importance as a medium for conveying patient information, it is important that orthopedic patient education materials (PEMs) on the Internet provide high-quality information that is easily read by the target patient population. Unfortunately, studies have found that many of the Internet’s orthopedic PEMs have been neither of high quality6-8 nor presented such that they are easy for patients to read and comprehend.1,9-12
Readability, which is the reading comprehension level (school grade level) a person must have to understand written materials, is determined by systematic formulae12; readability levels correlate with the ability to comprehend written information.2 Studies have consistently found that orthopedic PEMs are written at readability levels too high for the average patient to understand.1,9,13 The readability of PEMs in orthopedics as a whole9 and within the orthopedic subspecialties of arthroplasty,1 foot and ankle surgery,2 sports medicine,12 and spine surgery13 has been evaluated, but so far there has been no evaluation of PEMs in orthopedic trauma (OT).
We conducted a study to assess the readability of OT-PEMs available online from the American Academy of Orthopaedic Surgeons (AAOS) in conjunction with the Orthopaedic Trauma Association (OTA) and other orthopedic subspecialty societies. We hypothesized the readability levels of these OT-PEMs would be above the level (sixth to eighth grade) recommended by several healthcare organizations, including the Centers for Disease Control and Prevention.9,11,14 We also assessed the effect that orthopedic subspecialty coauthorship has on PEM readability.
Methods
In July 2014, we searched the AAOS online patient education library (Broken Bones & Injuries section, http://orthoinfo.aaos.org/menus/injury.cfm) and the AAOS OrthoPortal website (Trauma section, http://pubsearch.aaos.org/search?q=trauma&client=OrthoInfo&site=PATIENT&output=xml_no_dtd&proxystylesheet=OrthoInfo&filter=0) for all relevant OT-PEMs. Although OTA does not publish its own PEMs on its website, it coauthored several of the articles in the AAOS patient education library. Other subspecialty organizations, including the American Orthopaedic Society for Sports Medicine (AOSSM), the American Society for Surgery of the Hand (ASSH), the Pediatric Orthopaedic Society of North America (POSNA), the American Shoulder and Elbow Surgeons (ASES), the American Association of Hip and Knee Surgeons (AAHKS), and the American Orthopaedic Foot and Ankle Society (AOFAS), coauthored several of these online OT-PEMs as well.
Using the technique described by Badarudeen and Sabharwal,10 we saved all articles to be included in the study as separate Microsoft Word 2011 files. We saved them in plain-text format to remove any HTML tags and any other hidden formatting that might affect readability results. Then we edited them to remove elements that might affect readability result accuracy—deleted article topic–unrelated information (eg, copyright notice, disclaimers, author information) and all numerals, decimal points, bullets, abbreviations, paragraph breaks, colons, semicolons, and dashes.10Mr. Mohan used the Flesch-Kincaid (FK) Readability Scale to calculate grade level for each article. Microsoft Word 2011 was used as described in other investigations of orthopedic PEM readability2,10,12,13: Its readability function is enabled by going to the Tools tab and then to the Spelling & Grammar tool, where the “Show readability statistics” option is selected.10 Readability scores are calculated with the Spelling & Grammar tool; the readability score is displayed after completion of the spelling-and-grammar check. The formula used to calculate FK grade level is15: (0.39 × average number of words per sentence) + (11.8 × average number of syllables per word) – 15.59.
Statistical Analysis
Descriptive statistics, including means and 95% confidence intervals (CIs), were calculated for the FK grade levels. Student t tests were used to compare average FK grade levels of articles written exclusively by AAOS with those of articles coauthored by AAOS and other orthopedic subspecialty societies. A 2-sample unequal-variance t test was used, and significance was set at P < .05. Total number of articles written at or below the sixth- and eighth-grade levels, the reading levels recommended for PEMs, were tabulated.1,9-12 Intraobserver and interobserver reliabilities were calculated with intraclass correlation coefficients (ICCs): Mr. Mohan, who calculated the FK scores earlier, now 1 week later calculated the readability levels of 15 randomly selected articles10,11; in addition, Mr. Mohan and Dr. Yi independently calculated the readability levels of 30 randomly selected articles.10,11 The same method described earlier—edit plain-text files, then use Microsoft Word to obtain FK scores—was again used. ICCs of 0 to 0.24 correspond to poor correlation; 0.25 to 0.49, low correlation; 0.5 to 0.69, fair correlation; 0.7 to 0.89, good correlation; and 0.9 to 1.0, excellent correlation.10,11 All statistical analyses were performed with Microsoft Excel 2011 and VassarStats (http://vassarstats.net/tu.html).
Results
Of the 115 AAOS website articles included in the study and reviewed, 18 were coauthored by OTA, 10 by AOSSM, 14 by POSNA, 2 by ASSH, 2 by ASES, 1 by AAHKS, 3 by AOFAS, 1 by AOSSM and ASES, and 1 by AOFAS and AOSSM.
Mean FK grade level was 9.1 (range, 6.2-12; 95% CI, 8.9-9.3) for all articles reviewed and 9.1 (range, 6.2-12; 95% CI, 8.8-9.4) for articles exclusively written by AAOS. For coauthored articles, mean FK grade level was 9.3 (range, 7.6-11.3; 95% CI, 8.8-9.8) for AAOS-OTA; 8.9 (range, 7.4-10.4; 95% CI, 8.4-9.6) for AAOS-AOSSM; 9.4 (range, 7-11.8; 95% CI, 8.9-10.1) for AAOS-POSNA; 7.8 (range, 7.8-9.1; 95% CI, 7.2-9.8) for AAOS-ASSH; 9 (range, 8.2-9.6; 95% CI, 7.6-10.2) for AAOS-ASES; 9 (range, 7.9-9; 95% CI, 7.9-9.3) for AAOS-AOFAS; 8.1 for the 1 AAOS-AAHKS article; 8.5 for the 1 AAOS-AOSSM-ASES article; and 8 for the 1 AAOS-AOFAS-AOSSM article (Figure).
For FK readability calculations, interobserver reliability (ICC, 0.9982) and intraobserver reliability (ICC, 1) were both excellent.
Discussion
Although increasing numbers of patients are using information from the Internet to inform their healthcare decisions,12 studies have shown that online PEMs are written at a readability level above that of the average patient.1,9,13 In the present study, we also found that OT-PEMs from AAOS are written at a level considerably higher than the recommended sixth-grade reading level,16 potentially impairing patient comprehension and leading to poorer health outcomes.17
The pervasiveness of too-high PEM readability levels has been found across orthopedic subspecialties.2,9,12,13 Following this trend, the OT articles we reviewed had a ninth-grade reading level on average, and only 1 of 115 articles was below the recommended sixth-grade level.10 The issue of too-high PEM readability levels is thus a problem both in OT and in orthopedics in general. Accordingly, efforts to address this problem are warranted, especially as orthopedic PEM readability has not substantially improved over the past several years.18In this study, we also tried to identify any readability differences between articles coauthored by orthopedic societies and articles that were not coauthored by orthopedic societies. We hypothesized that multidisciplinary authorship could improve PEM readability; for example, orthopedic societies could collaborate with other medical specialties (eg, family medicine) that have produced appropriately readable PEMs. One study found that the majority of PEMs from the American Academy of Family Physicians (AAFP) were written below the sixth-grade reading level because of strict organizational regulation of the production of such materials.19 By noting and adopting successful PEM development methods used by groups such as AAFP,19,20 we might be able to improve OT-PEM readability. However, this was not the case in our study, though our observations may have been limited by the small sample of reviewable articles.
One factor contributing to the poor readability of orthopedic PEMs is that orthopedics terminology is complex and includes words that are often difficult to translate into simpler terms without losing their meaning.10 When PEMs are written at a level that is too complex, patients cannot fully comprehend them, which may lead to poor health literacy. This problem may be even more harmful when considering the poor literacy levels of patients at baseline. Kadakia and colleagues16 found that OT patients had poor health literacy; for example, fewer than half knew which bone they fractured. As health literacy is associated with poorer health outcomes and reduced use of healthcare services,21 optimizing patients’ health literacy is of crucial importance to both their education and their outcomes.
Our study should be viewed in light of some important limitations. As OTA does not publish its own PEMs, we assessed only OT-related articles that were available on the AAOS website and were exclusively written by AAOS, or coauthored by AAOS and by OTA and/or another orthopedic subspecialty organization. As these articles represent only a subset of the full spectrum of OT-PEMs available on the Internet, our results may not be generalizable to the entire scope of such materials. However, as AAOS and OTA represent the most authoritative OT organizations, we think these PEMs would be among those most likely to be recommended to patients by their surgeons. In addition, although we used a well-established tool for examining readability—the FK readability scale10-13—this tool has its own inherent limitations, as FK readability grade level is calculated purely on the basis of words per sentence and total syllables per word, and does not take into account other article elements, such as images, which also provide information.1,10 Nevertheless, the FK scale is an inexpensive, easily accessed readability tool that provides a reproducible readability value that is easily comparable to results from earlier studies.10 The final limitation is that we excluded from the study AAOS website articles written in a language other than English. Such articles, however, are important, as a large portion of the patient population speaks English as a second language. Indeed, the readability of Spanish PEMs has been investigated—albeit using a readability measure other than the FK scale—and may be a topic pertinent to orthopedic PEMs.22Most of the literature on the readability of orthopedic PEMs has found their reading levels too high for the average patient to comprehend.1,9-12 The trend continues with our study findings regarding OT-PEMs available online from AAOS. Although the literature on the inadequacies of orthopedic PEMs is vast,1,9-12 more work is needed to improve the quality, accuracy, and readability of these materials. There has been some success in improving PEM readability and producing appropriately readable materials within the medical profession,19,23 so we know that appropriately readable orthopedic PEMs are feasible.
Am J Orthop. 2017;46(3):E190-E194. Copyright Frontline Medical Communications Inc. 2017. All rights reserved.
1. Polishchuk DL, Hashem J, Sabharwal S. Readability of online patient education materials on adult reconstruction web sites. J Arthroplasty. 2012;27(5):716-719.
2. Bluman EM, Foley RP, Chiodo CP. Readability of the patient education section of the AOFAS website. Foot Ankle Int. 2009;30(4):287-291.
3. Hoffmann T, Russell T. Pre-admission orthopaedic occupational therapy home visits conducted using the Internet. J Telemed Telecare. 2008;14(2):83-87.
4. Rider T, Malik M, Chevassut T. Haematology patients and the Internet—the use of on-line health information and the impact on the patient–doctor relationship. Patient Educ Couns. 2014;97(2):223-238.
5. AlGhamdi KM, Moussa NA. Internet use by the public to search for health-related information. Int J Med Inform. 2012;81(6):363-373.
6. Beredjiklian PK, Bozentka DJ, Steinberg DR, Bernstein J. Evaluating the source and content of orthopaedic information on the Internet. The case of carpal tunnel syndrome. J Bone Joint Surg Am. 2000;82(11):1540-1543.
7. Meena S, Palaniswamy A, Chowdhury B. Web-based information on minimally invasive total knee arthroplasty. J Orthop Surg (Hong Kong). 2013;21(3):305-307.
8. Labovitch RS, Bozic KJ, Hansen E. An evaluation of information available on the Internet regarding minimally invasive hip arthroplasty. J Arthroplasty. 2006;21(1):1-5.
9. Badarudeen S, Sabharwal S. Assessing readability of patient education materials: current role in orthopaedics. Clin Orthop Relat Res. 2010;468(10):2572-2580.
10. Badarudeen S, Sabharwal S. Readability of patient education materials from the American Academy of Orthopaedic Surgeons and Pediatric Orthopaedic Society of North America web sites. J Bone Joint Surg Am. 2008;90(1):199-204.
11. Yi PH, Ganta A, Hussein KI, Frank RM, Jawa A. Readability of arthroscopy-related patient education materials from the American Academy of Orthopaedic Surgeons and Arthroscopy Association of North America web sites. Arthroscopy. 2013;29(6):1108-1112.
12. Ganta A, Yi PH, Hussein K, Frank RM. Readability of sports medicine–related patient education materials from the American Academy of Orthopaedic Surgeons and the American Orthopaedic Society for Sports Medicine. Am J Orthop. 2014;43(4):E65-E68.
13. Vives M, Young L, Sabharwal S. Readability of spine-related patient education materials from subspecialty organization and spine practitioner websites. Spine. 2009;34(25):2826-2831.
14. Strategic and Proactive Communication Branch, Division of Communication Services, Office of the Associate Director for Communication, Centers for Disease Control and Prevention, US Department of Health and Human Services. Simply Put: A Guide for Creating Easy-to-Understand Materials. 3rd ed. http://www.cdc.gov/healthliteracy/pdf/Simply_Put.pdf. Published July 2010. Accessed February 7, 2015.
15. Wallace LS, Keenum AJ, DeVoe JE. Evaluation of consumer medical information and oral liquid measuring devices accompanying pediatric prescriptions. Acad Pediatr. 2010;10(4):224-227.
16. Kadakia RJ, Tsahakis JM, Issar NM, et al. Health literacy in an orthopedic trauma patient population: a cross-sectional survey of patient comprehension. J Orthop Trauma. 2013;27(8):467-471.
17. Peterson PN, Shetterly SM, Clarke CL, et al. Health literacy and outcomes among patients with heart failure. JAMA. 2011;305(16):1695-1701.
18. Feghhi DP, Agarwal N, Hansberry DR, Berberian WS, Sabharwal S. Critical review of patient education materials from the American Academy of Orthopaedic Surgeons. Am J Orthop. 2014;43(8):E168-E174.
19. Schoof ML, Wallace LS. Readability of American Academy of Family Physicians patient education materials. Fam Med. 2014;46(4):291-293.
20. Doak CC, Doak LG, Root JH. Teaching Patients With Low Literacy Skills. 2nd ed. Philadelphia, PA: Lippincott; 1996.
21. Berkman ND, Sheridan SL, Donahue KE, Halpern DJ, Crotty K. Low health literacy and health outcomes: an updated systematic review. Ann Intern Med. 2011;155(2):97-107.
22. Berland GK, Elliott MN, Morales LS, et al. Health information on the Internet: accessibility, quality, and readability in English and Spanish. JAMA. 2001;285(20):2612-2621.
23. Sheppard ED, Hyde Z, Florence MN, McGwin G, Kirchner JS, Ponce BA. Improving the readability of online foot and ankle patient education materials. Foot Ankle Int. 2014;35(12):1282-1286.
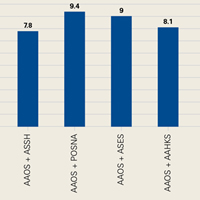
Rates, predictors and variability of interhospital transfers: A national evaluation
Interhospital transfer (IHT) is defined as the transfer of hospitalized patients between acute care hospitals. Although cited reasons for transfer include providing patients access to unique specialty services,1 patterns and practices of IHT remain largely unstudied. Interhospital transfer is known to be common in certain patient populations, including selected patients presenting to the intensive care unit2 and those with acute myocardial infarction (AMI),3-5 but no recent studies have looked at frequency of IHT among a broader group of hospitalized patients nationally. Little is known about which patients are selected for transfer and why.6 Limited evidence suggests poor concordance between cited reason for transfer among patients, transferring physicians, and receiving physicians,7 indicating ambiguity in this care process.
Interhospital transfer exposes patients to the potential risks associated with discontinuity of care. Communication is particularly vulnerable to error during times of transition.8-10 Patients transferred between acute care hospitals are especially vulnerable, given the severity of illness in this patient population,11 and the absence of other factors to fill in gaps in communication, such as common electronic health records. Limited existing literature suggests transferred patients use more resources 12-13 and experience worse outcomes compared to nontransferred patients,11 although these data involved limited patient populations, and adjustment for illness severity and other factors was variably addressed.14-16
To improve the quality and safety of IHT, therefore, it is necessary to understand which patients benefit from IHT and identify best practices in the IHT process.17 A fundamental first step is to study patterns and practices of IHT, in particular with an eye towards identifying unwarranted variation.18 This is important to understand the prevalence of the issue, provide possible evidence of lack of standardization, and natural experiments with which to identify best practices.
To address this, we conducted a foundational study examining a national sample of Medicare patients to determine the nationwide frequency of IHT among elderly patients, patient and hospital-level predictors of transfer, and hospital variability in IHT practices.
METHODS
We performed a cross-sectional analysis using 2 nationally representative datasets: (1) Center for Medicare and Medicaid Services (CMS) 2013 100% Master Beneficiary Summary and Inpatient claims files, which contains data on all fee-for-service program Medicare enrollees’ demographic information, date of death, and hospitalization claims, including ICD-9 codes for diagnoses, diagnosis-related group (DRG), and dates of service; merged with (2) 2013 American Hospital Association (AHA) data,19 which contains hospital-level characteristics for all acute care hospitals in the U.S. Our study protocol was approved by the Partners Healthcare Human Subjects Review Committee.
Beneficiaries were eligible for inclusion if they were 65 years or older, continuously enrolled in Medicare A and B, with an acute care hospitalization claim in 2013, excluding Medicare managed care and end-stage renal disease (ESRD) beneficiaries. We additionally excluded beneficiaries hospitalized at federal or nonacute care hospitals, or critical access hospitals given their mission to stabilize and transfer patients to referral hospitals.20
Transferred patients were defined as: (1) beneficiaries with a “transfer out” claim and a corresponding “transfer in” claim at a different hospital; as well as (2) beneficiaries with a “transfer out” claim and a corresponding date of admission to another hospital within 1 day following the date of claim; and (3) beneficiaries with a “transfer in” claim and a corresponding date of discharge from another hospital within 1 day preceding the date of claim. Beneficiaries transferred to the same hospital, or cared for at hospitals with “outlier” transfer in rates equal to 100% or transfer out rates greater than 35%, were excluded from analysis given the suggestion of nonstandard claims practices. Beneficiaries with greater than 1 transfer within the same hospitalization were additionally excluded.
Patient Characteristics
Patient characteristics were obtained from the CMS data files and included: demographics (age, sex, race); DRG-weight, categorized into quartiles; primary diagnosis for the index hospitalization using ICD-9 codes; patient comorbidity using ICD-9 codes compiled into a CMS-Hierarchical Condition Category (HCC) risk score;21 presence of Medicaid co-insurance; number of hospitalizations in the past 12 months, categorized into 0, 1, 2-3, and 4 or more; season, defined as calendar quarters; and median income per household by census tract. These characteristics were chosen a priori given expert opinion in combination with prior research demonstrating association with IHT.11,22
Hospital Characteristics
Hospital characteristics were obtained from AHA data files and included hospitals’ size, categorized into small, medium, and large (less than 100, 100 to 399, 400 or more beds); geographic location; ownership; teaching status; setting (urban vs. rural); case mix index (CMI) for all patients cared for at the hospital; and presence of selected specialty services, including certified trauma center, medical intensive care unit, cardiac intensive care unit, cardiac surgery services, adult interventional cardiac catheterization, adult cardiac electrophysiology, and composite score of presence of 55 other specialty services (complete list in Appendix A). All characteristics were chosen a priori given expert opinion or relationship of characteristics with IHT, and prior research utilizing AHA data.23-24
Analysis
Descriptive statistics were used to evaluate the frequency of IHT, characteristics of transferred patients, and number of days to transfer. Patient and hospital characteristics of transferred vs. nontransferred patients were compared using chi-square analyses.
To analyze the effects of each patient and hospital characteristic on the odds of transfer, we used logistic regression models incorporating all patient and hospital characteristics, accounting for fixed effects for diagnosis, and utilizing generalized estimating equations (the GENMOD procedure in SAS statistical software, v 9.4; SAS Institute Inc., Cary, North Carolina) to account for the clustering of patients within hospitals.25 Indicator variables were created for missing covariate data and included in analyses when missing data accounted for greater than 10% of the total cohort.
To measure the variability in transfer rates between hospitals, we used a sequence of random effects logistic regression models. We first ran a model with no covariates, representing the unadjusted differences in transfer rates between hospitals. We then added patient characteristics to see if the unadjusted differences in IHT rates were explained by differences in patient characteristics between hospitals. Lastly, we added hospital characteristics to determine if these explained the remaining differences in transfer rates. Each of the 3 models provided a measure of between-hospital variability, reflecting the degree to which IHT rates differed between hospitals. Additionally, we used the intercept from the unadjusted model and the measure of between-hospital variability from each model to calculate the 95% confidence intervals, illustrating the range of IHT rates spanning 95% of all hospitals. We used those same numbers to calculate the 25th and 75th percentiles, illustrating the range of IHT rates for the middle half of hospitals.

RESULTS
Among 28 million eligible beneficiaries, 6.6 million had an acute care hospitalization to nonfederal, noncritical access hospitals, and 107,741 met our defined criteria for IHT. An additional 3790 beneficiaries were excluded for being transferred to the same facility, 416 beneficiaries (115 transferred, 301 nontransferred) were excluded as they were cared for at 1 of the 11 hospitals with “outlier” transfer in/out rates, and 2329 were excluded because they had more than 1 transfer during hospitalization. Thus, the final cohort consisted of 101,507 transferred (1.5%) and 6,625,474 nontransferred beneficiaries (Figure 1). Of the 101,507 transferred beneficiaries, 2799 (2.8%) were included more than once (ie, experienced more than 1 IHT on separate hospitalizations throughout the study period; the vast majority of these had 2 separate hospitalizations resulting in IHT). Characteristics of transferred and nontransferred beneficiaries are shown (Table 1).

Among transferred patients, the top 5 primary diagnoses at time of transfer included AMI (12.2%), congestive heart failure (CHF) (7.2%), sepsis (6.6%), arrhythmia (6.6%), and pneumonia (3.4%). Comorbid conditions most commonly present in transferred patients included CHF (52.6%), renal failure (51.8%), arrhythmia (49.8%), and chronic obstructive pulmonary disease (COPD; 37.0%). The most common day of transfer was day after admission (hospital day 2, 24.7%), with 75% of transferred patients transferred before hospital day 6 (Appendix B).
After adjusting for all other patient and hospital characteristics and clustering by hospital, the following variables were associated with greater odds of transfer: older age, male sex, nonblack race, non-Medicaid co-insurance, higher comorbidity (HCC score), lower DRG-weight, and fewer hospitalizations in the prior 12 months. Beneficiaries also had greater odds of transfer if initially hospitalized at smaller hospitals, nonteaching hospitals, public hospitals, at hospitals in the Northeast, those with fewer specialty services, and those with a low CMI (Table 2).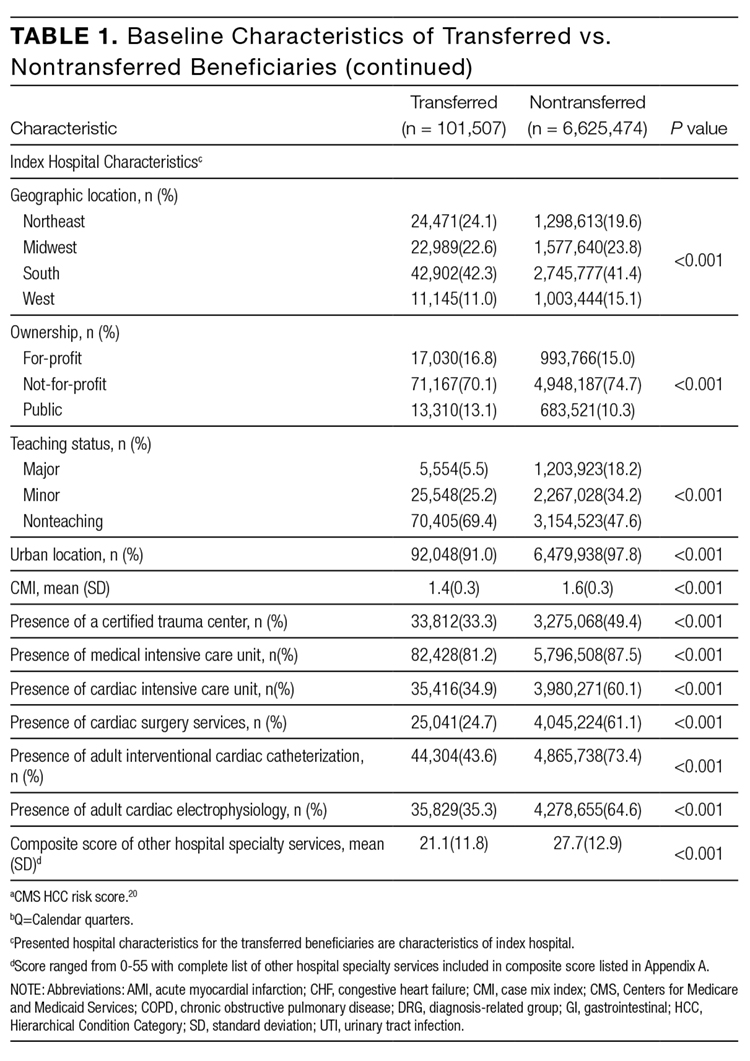
DISCUSSION
In this nationally representative study of 6.6 million Medicare beneficiaries, we found that 1.5% of patients were transferred between acute care facilities and were most often transferred prior to hospital day 6. Older age, male sex, nonblack race, higher medical comorbidity, lower DRG weight, and fewer recent hospitalizations were associated with greater odds of transfer. Initial hospitalization at smaller, nonteaching, public hospitals, with fewer specialty services were associated with greater odds of transfer, while higher CMI was associated with a lower odds of transfer. The most common comorbid conditions among transferred patients included CHF, renal failure, arrhythmia, and COPD; particularly notable was the very high prevalence of these conditions among transferred as compared with nontransferred patients. Importantly, we found significant variation in IHT by region and a large variation in transfer practices by hospital, with significant variability in transfer rates even after accounting for known patient and hospital characteristics.
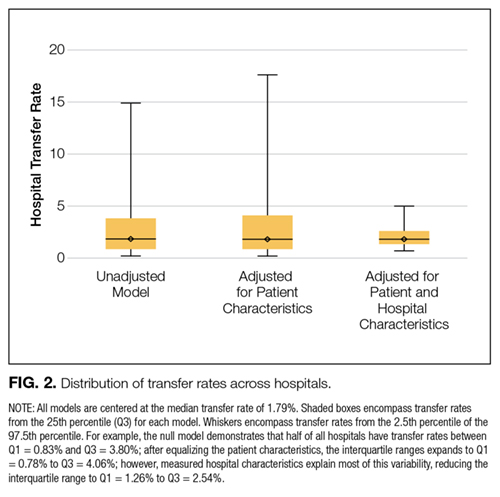
Among our examined population, we found that a sizable number of patients undergo IHT—more than 100,000 per year. Primary diagnoses at time of transfer consist of common inpatient conditions, including AMI, CHF, sepsis, arrhythmia, and pneumonia. Limited prior data support our findings, with up to 50% of AMI patients reportedly undergoing IHT,3-5 and severe sepsis and respiratory illness reported as common diagnoses at transfer.11 Although knowledge of these primary diagnoses does not directly confer an understanding of reason for transfer, one can speculate based on our findings. For example, research demonstrates the majority of AMI patients who undergo IHT had further intervention, including stress testing, cardiac catheterization, and/or coronary artery bypass graft surgery.5,26 Thus, it is reasonable to presume that many of the beneficiaries 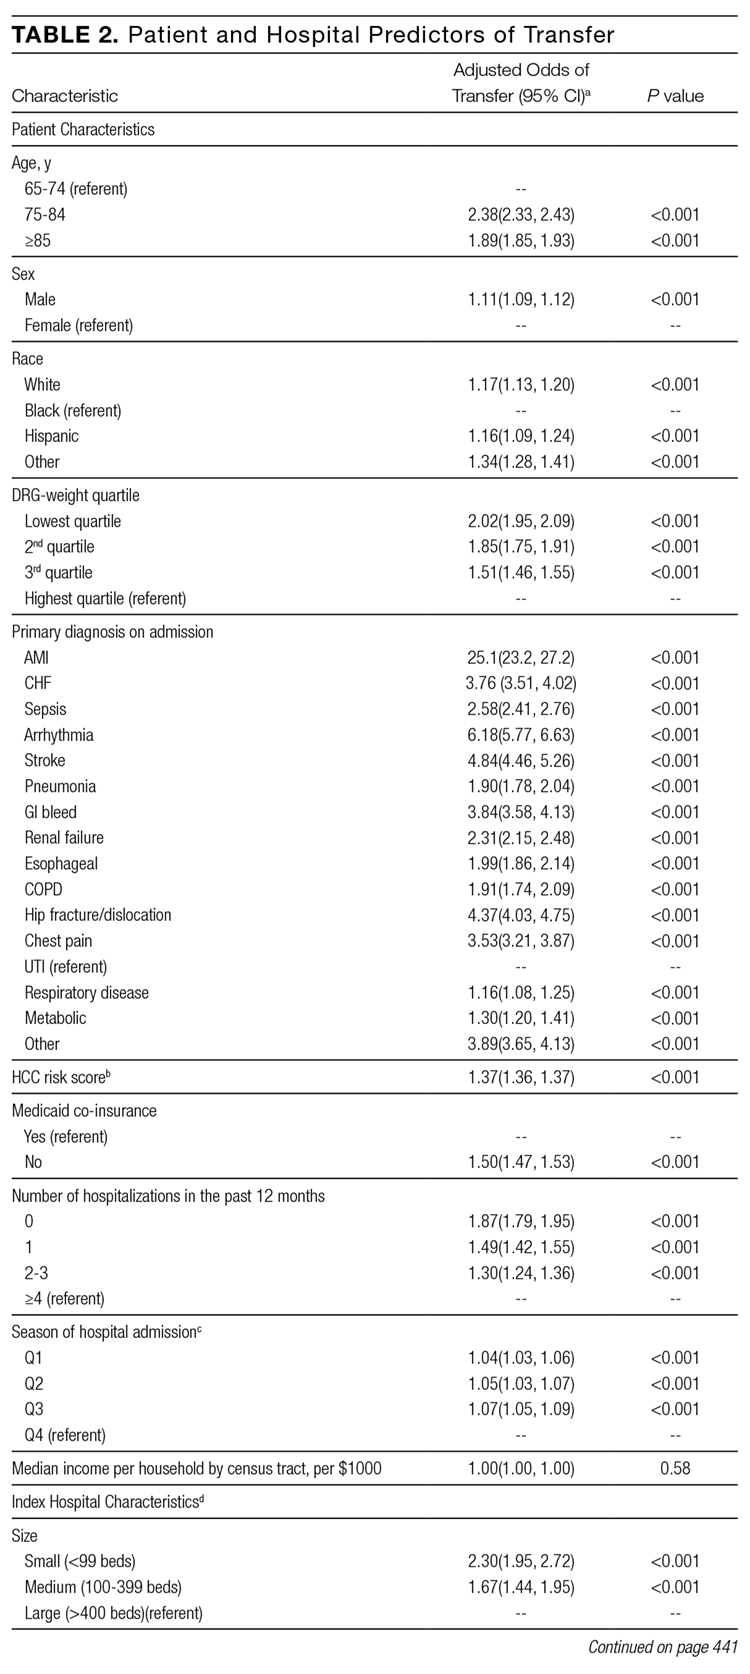
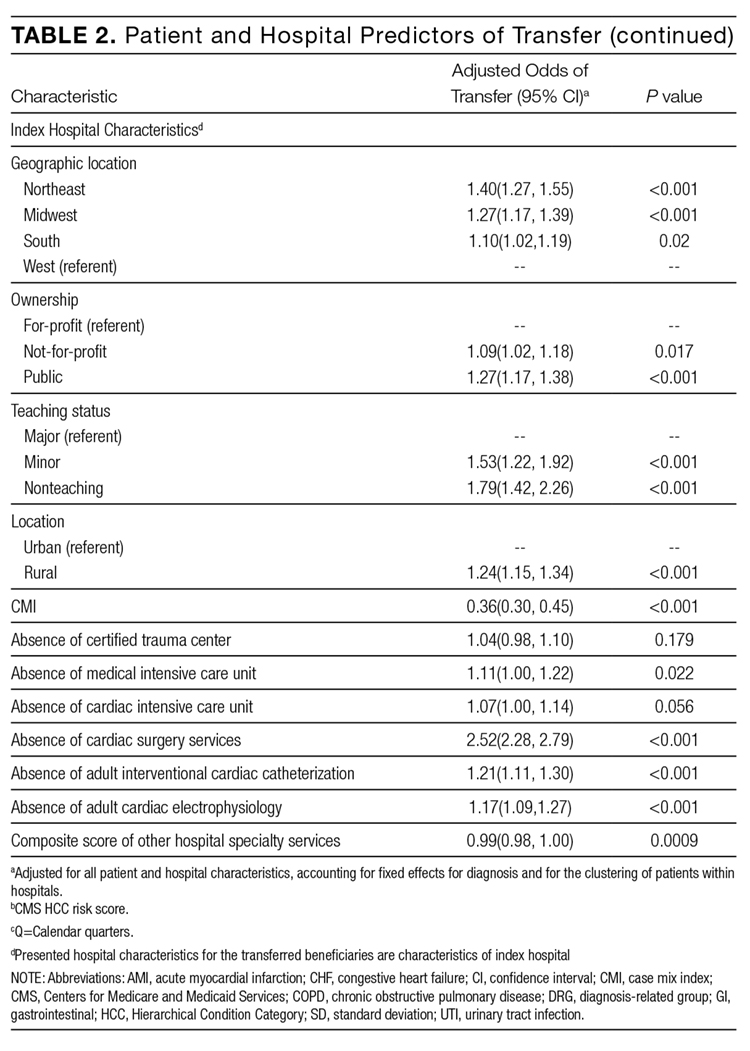
We additionally found that certain patient characteristics were associated with greater odds of transfer. Research suggests that transferred patients are “sicker” than nontransferred patients.1,11 Although our findings in part confirm these data, we paradoxically found that higher DRG-weight and 4 or more hospitalizations in the past year were actually associated with lower odds of transfer. In addition, the oldest patients in our cohort (85 years or older) were actually less likely to be transferred than their slightly younger counterparts (75 to 84 years). These variables may reflect extreme illness or frailty,27 and providers consciously (or subconsciously) may factor this in to their decision to transfer, considering a threshold past which transfer would confer more risk than benefit (eg, a patient may be “too sick” for transfer). Indeed, in a secondary analysis without hospital characteristics or comorbidities, and with fixed effects by hospital, we found the highest rates of IHT in patients in the middle 2 quartiles of DRG-weight, supporting this threshold hypothesis. It is also possible that patients with numerous hospitalizations may be less likely to be transferred because of familiarity and a strong sense of responsibility to continue to care for those patients (although we cannot confirm that those prior hospitalizations were all with the same index hospital).
It is also notable that odds of transfer differed by race, with black patients 17% less likely to undergo transfer compared to whites, similar to findings in other IHT studies.11 This finding, in combination with our demonstration that Medicaid patients also have lower odds of transfer, warrants further investigation to ensure the process of IHT does not bias against these populations, as with other well-documented health disparities.28-30
The hospital predictors of transfer were largely expected. However, interestingly, when we controlled for all other patient and hospital characteristics, regional variation persisted, with highest odds of transfer with hospitalization in the Northeast, indicating variability by region not explained by other factors, and findings supported by other limited data.31 This variability was further elucidated in our examination of change in variance estimates accounting for patient, then hospital, characteristics. Although we expected and found marked variability in hospital transfer rates in our null model (without accounting for any patient or hospital characteristics), we interestingly found that variability increased upon adjusting for patient characteristics. This result is presumably due to the fact that patients who are more likely to be transferred (ie, “sick” patients) are more often already at hospitals less likely to transfer patients, supported by our findings that hospital CMI is inversely associated with odds of transfer (in other words, hospitals that care for a less sick patient population are more likely to transfer their patients, and hospitals that care for a sicker patient population [higher CMI] are less likely to transfer). Adjusting solely for patient characteristics effectively equalizes these patients across hospitals, which would lead to even increased variability in transfer rates. Conversely, when we then adjusted for hospital characteristics, variability in hospital transfer rates decreased by 83% (in other words, hospital characteristics, rather than patient characteristics, explained much of the variability in transfer rates), although significant unexplained variability remained. We should note that although the observed reduction in variability was explained by the patient and hospital characteristics included in the model, these characteristics do not necessarily justify the variability they accounted for; although patients’ race or hospitals’ location may explain some of the observed variability, this does not reasonably justify it.
This observed variability in transfer practices is not surprising given the absence of standardization and clear guidelines to direct clinical IHT practice.17 Selection of patients that may benefit from transfer is often ambiguous and subjective.6 The Emergency Medical Treatment and Active Labor Act laws dictate that hospitals transfer patients requiring a more specialized service, or when “medical benefits ... outweigh the increased risks to the individual...,” although in practice this provides little guidance to practitioners.1 Thus, clearer guidelines may be necessary to achieve less variable practices.
Our study is subject to several limitations. First, although nationally representative, the Medicare population is not reflective of all hospitalized patients nationwide. Additionally, we excluded patients transferred from the emergency room. Thus, the total number of patients who undergo IHT nationally is expected to be much higher than reflected in our analysis. We also excluded patients who were transferred more than once during a given hospitalization. This enabled us to focus on the initial transfer decision but does not allow us to look at patients who are transferred to a referral center and then transferred back. Second, given the criteria we used to define transfer, it is possible that we included nontransferred patients within our transferred cohort if they were discharged from one hospital and admitted to a different hospital within 1 day. However, on quality assurance analyses where we limited our cohort to only those beneficiaries with corresponding “transfer in” and “transfer out” claims (87% of the total cohort), we found no marked differences in our results. Additionally, although we assume that patient transfer status was coded correctly within the Medicare dataset, we could not confirm by individually examining each patient we defined as “transferred.” However, on additional quality assurance analyses where we examined randomly selected excluded patients with greater than 1 transfer during hospitalization, we found differing provider numbers with each transfer, suggesting validity of the coding. Third, because there are likely many unmeasured patient confounders, we cannot be sure how much of the between-hospital variation is due to incomplete adjustment for patient characteristics. However, since adjusting for patient characteristics actually increased variability in hospital transfer rates, it is unlikely that residual patient confounders fully explain our observed results. Despite this, other variables that are not available within the CMS or AHA datasets may further elucidate hospital transfer practices, including variables reflective of the transfer process (eg, time of day of patient transfer, time delay between initiation of transfer and patient arrival at accepting hospital, accepting service on transfer, etc.); other markers of illness severity (eg, clinical service at the time of index admission, acute physiology score, utilization of critical care services on arrival at receiving hospital); and other hospital system variables (ie, membership in an accountable care organization and/or regional care network, the density of nearby tertiary referral centers (indicating possible supply-induced demand), other variables reflective of the “transfer culture” (such as the transfer rate at the hospital or region where the attending physician trained, etc.). Lastly, though our examination provides important foundational information regarding IHT nationally, this study did not examine patient outcomes in transferred and nontransferred patients, which may help to determine which patients benefit (or do not benefit) from transfer and why. Further investigation is needed to study these outcomes.
CONCLUSION
In this national study of IHT, we found that a sizable number of patients admitted to the hospital undergo transfer to another acute care facility. Patients are transferred with common medical conditions, including those requiring specialized care such as AMI, and a high rate of comorbid clinical conditions, and certain patient and hospital characteristics are associated with greater odds of transfer. Although many of the observed associations between characteristics and odds of transfer were expected based on limited existing literature, we found several unexpected findings, eg, suggesting the possibility of a threshold beyond which sicker patients are not transferred. Additionally, we found that black and Medicaid patients had lower odds of transfer, which warrants further investigation for potential health care disparity. Importantly, we found much variability in the practice of IHT, as evidenced by the inexplicable differences in transfer by hospital region, and by residual unexplained variability in hospital transfer rates after accounting for patient and hospital characteristics, which may be due to lack of standard guidelines to direct IHT practices. In conclusion, this study of hospitalized Medicare patients provides important foundational information regarding rates and predictors of IHT nationally, as well as unexplained variability that exists within this complex care transition. Further investigation will be essential to understand reasons for, processes related to, and outcomes of transferred patients, to help guide standardization in best practices in care.
Disclosure
Nothing to report.
1. Iwashyna TJ. The incomplete infrastructure for interhospital patient transfer. Crit Care Med. 2012;40(8):2470-2478. PubMed
2. Iwashyna TJ, Christie JD, Moody J, Kahn JM, Asch DA. The structure of critical care transfer networks. Med Care. 2009;47(7):787-793. PubMed
3. Mehta RH, Stalhandske EJ, McCargar PA, Ruane TJ, Eagle KA. Elderly patients at highest risk with acute myocardial infarction are more frequently transferred from community hospitals to tertiary centers: reality or myth? Am Heart J. 1999;138(4 Pt 1):688-695. PubMed
4. Iwashyna TJ, Kahn JM, Hayward RA, Nallamothu BK. Interhospital transfers among Medicare beneficiaries admitted for acute myocardial infarction at nonrevascularization hospitals. Circ Cardiovasc Qual Outcomes. 2010;3(5):468-475. PubMed
5. Roe MT, Chen AY, Delong ER, Boden WE, Calvin JE Jr, Cairns CB, et al. Patterns of transfer for patients with non-ST-segment elevation acute coronary syndrome from community to tertiary care hospitals. Am Heart J. 2008;156(1):185-192. PubMed
6. Bosk EA, Veinot T, Iwashyna TJ. Which patients and where: a qualitative study of patient transfers from community hospitals. Med Care. 2011;49(6):592-598. PubMed
7. Wagner J, Iwashyna TJ, Kahn JM. Reasons underlying interhospital transfers to an academic medical intensive care unit. J Crit Care. 2013;28(2):202-208. PubMed
8. Cohen MD, Hilligoss PB. The published literature on handoffs in hospitals: deficiencies identified in an extensive review. Qual Saf Health Care. 2010;19(6):493-497. PubMed
9. Riesenberg LA, Leitzsch J, Massucci JL, et al. Residents’ and attending physicians’ handoffs: a systematic review of the literature. Acad Med. 2009;84(12):1775-1787. PubMed
10. Arora V, Johnson J, Lovinger D, Humphrey HJ, Meltzer DO. Communication failures in patient sign-out and suggestions for improvement: a critical incident analysis. Qual Saf Health Care. 2005;14(6):401-407. PubMed
11. Sokol-Hessner L, White AA, Davis KF, Herzig SJ, Hohmann SF. Interhospital transfer patients discharged by academic hospitalists and general internists: characteristics and outcomes. J Hosp Med. 2016;11(4):245-250. PubMed
12. Bernard AM, Hayward RA, Rosevear J, Chun H, McMahon LF. Comparing the hospitalizations of transfer and non-transfer patients in an academic medical center. Acad Med. 1996;71(3):262-266. PubMed
13. Golestanian E, Scruggs JE, Gangnon RE, Mak RP, Wood KE. Effect of interhospital transfer on resource utilization and outcomes at a tertiary care referral center. Crit Care Med. 2007;35(6):1470-1476. PubMed
14. Durairaj L, Will JG, Torner JC, Doebbeling BN. Prognostic factors for mortality following interhospital transfers to the medical intensive care unit of a tertiary referral center. Crit Care Med. 2003;31(7):1981-1986. PubMed
15. Kerr HD, Byrd JC. Community hospital transfers to a VA Medical Center. JAMA. 1989;262(1):70-73. PubMed
16. Dragsted L, Jörgensen J, Jensen NH, et al. Interhospital comparisons of patient outcome from intensive care: importance of lead-time bias. Crit Care Med. 1989;17(5):418-422. PubMed
17. Gupta K, Mueller SK. Interhospital transfers: the need for standards. J Hosp Med. 2015;10(6):415-417. PubMed
18. The Dartmouth Atlas of Health Care: Understanding of the Efficiency and Effectiveness of the Health Care System. The Dartmouth Institute for Health Practice and Clinical Policy, Lebanon, NH. http://www.dartmouthatlas.org/. Accessed November 1, 2016.
19. American Hospital Association Annual Survey Database. American Hospital Association, Chicago, IL. http://www.ahadataviewer.com/book-cd-products/AHA-Survey/. Accessed July 1, 2013.
20. U.S. Department of Health and Human Services (HRSA): What are critical access hospitals (CAH)? http://www.hrsa.gov/healthit/toolbox/RuralHealthITtoolbox/Introduction/critical.html. Accessed June 9, 2016.
21. Li P, Kim MM, Doshi JA. Comparison of the performance of the CMS Hierarchical Condition Category (CMS-HCC) risk adjuster with the Charlson and Elixhauser comorbidity measures in predicting mortality. BMC Health Serv Res. 2010;10:245. PubMed
22. Hernandez-Boussard T, Davies S, McDonald K, Wang NE. Interhospital facility transfers in the United States: a nationwide outcomes study. J Patient Saf. Nov 13 2014. PubMed
23. Landon BE, Normand SL, Lessler A, et al. Quality of care for the treatment of acute medical conditions in US hospitals. Arch Intern Med. 2006;166(22):2511-2517. PubMed
24. Mueller SK, Lipsitz S, Hicks LS. Impact of hospital teaching intensity on quality of care and patient outcomes. Med Care.2013;51(7):567-574. PubMed
25. Lopez L, Hicks LS, Cohen AP, McKean S, Weissman JS. Hospitalists and the quality of care in hospitals. Arch Intern Med. 2009;169(15):1389-1394. PubMed
26. Barreto-Filho JA, Wang Y, Rathore SS, et al. Transfer rates from nonprocedure hospitals after initial admission and outcomes among elderly patients with acute myocardial infarction. JAMA Intern Med. 2014;174(2):213-222. PubMed
27. Carlson JE, Zocchi KA, Bettencourt DM, et al. Measuring frailty in the hospitalized elderly: concept of functional homeostasis. Am J Phys Med Rehabil. 1998;77(3):252-257. PubMed
28. Ward E, Jemal A, Cokkinides V, et al. Cancer disparities by race/ethnicity and socioeconomic status. CA Cancer J Clin. 2004;54(2):78-93. PubMed
29. Iribarren C, Tolstykh I, Somkin CP, et al. Sex and racial/ethnic disparities in outcomes after acute myocardial infarction: a cohort study among members of a large integrated health care delivery system in northern California. Arch Intern Med. 2005;165(18):2105-2113. PubMed
30. Kawachi I, Daniels N, Robinson DE. Health disparities by race and class: why both matter. Health Aff (Millwood). 2005;24(2):343-352. PubMed
31. Herrigel DJ, Carroll M, Fanning C, Steinberg MB, Parikh A, Usher M. Interhospital transfer handoff practices among US tertiary care centers: a descriptive survey. J Hosp Med. 2016;11(6):413-417. PubMed
Interhospital transfer (IHT) is defined as the transfer of hospitalized patients between acute care hospitals. Although cited reasons for transfer include providing patients access to unique specialty services,1 patterns and practices of IHT remain largely unstudied. Interhospital transfer is known to be common in certain patient populations, including selected patients presenting to the intensive care unit2 and those with acute myocardial infarction (AMI),3-5 but no recent studies have looked at frequency of IHT among a broader group of hospitalized patients nationally. Little is known about which patients are selected for transfer and why.6 Limited evidence suggests poor concordance between cited reason for transfer among patients, transferring physicians, and receiving physicians,7 indicating ambiguity in this care process.
Interhospital transfer exposes patients to the potential risks associated with discontinuity of care. Communication is particularly vulnerable to error during times of transition.8-10 Patients transferred between acute care hospitals are especially vulnerable, given the severity of illness in this patient population,11 and the absence of other factors to fill in gaps in communication, such as common electronic health records. Limited existing literature suggests transferred patients use more resources 12-13 and experience worse outcomes compared to nontransferred patients,11 although these data involved limited patient populations, and adjustment for illness severity and other factors was variably addressed.14-16
To improve the quality and safety of IHT, therefore, it is necessary to understand which patients benefit from IHT and identify best practices in the IHT process.17 A fundamental first step is to study patterns and practices of IHT, in particular with an eye towards identifying unwarranted variation.18 This is important to understand the prevalence of the issue, provide possible evidence of lack of standardization, and natural experiments with which to identify best practices.
To address this, we conducted a foundational study examining a national sample of Medicare patients to determine the nationwide frequency of IHT among elderly patients, patient and hospital-level predictors of transfer, and hospital variability in IHT practices.
METHODS
We performed a cross-sectional analysis using 2 nationally representative datasets: (1) Center for Medicare and Medicaid Services (CMS) 2013 100% Master Beneficiary Summary and Inpatient claims files, which contains data on all fee-for-service program Medicare enrollees’ demographic information, date of death, and hospitalization claims, including ICD-9 codes for diagnoses, diagnosis-related group (DRG), and dates of service; merged with (2) 2013 American Hospital Association (AHA) data,19 which contains hospital-level characteristics for all acute care hospitals in the U.S. Our study protocol was approved by the Partners Healthcare Human Subjects Review Committee.
Beneficiaries were eligible for inclusion if they were 65 years or older, continuously enrolled in Medicare A and B, with an acute care hospitalization claim in 2013, excluding Medicare managed care and end-stage renal disease (ESRD) beneficiaries. We additionally excluded beneficiaries hospitalized at federal or nonacute care hospitals, or critical access hospitals given their mission to stabilize and transfer patients to referral hospitals.20
Transferred patients were defined as: (1) beneficiaries with a “transfer out” claim and a corresponding “transfer in” claim at a different hospital; as well as (2) beneficiaries with a “transfer out” claim and a corresponding date of admission to another hospital within 1 day following the date of claim; and (3) beneficiaries with a “transfer in” claim and a corresponding date of discharge from another hospital within 1 day preceding the date of claim. Beneficiaries transferred to the same hospital, or cared for at hospitals with “outlier” transfer in rates equal to 100% or transfer out rates greater than 35%, were excluded from analysis given the suggestion of nonstandard claims practices. Beneficiaries with greater than 1 transfer within the same hospitalization were additionally excluded.
Patient Characteristics
Patient characteristics were obtained from the CMS data files and included: demographics (age, sex, race); DRG-weight, categorized into quartiles; primary diagnosis for the index hospitalization using ICD-9 codes; patient comorbidity using ICD-9 codes compiled into a CMS-Hierarchical Condition Category (HCC) risk score;21 presence of Medicaid co-insurance; number of hospitalizations in the past 12 months, categorized into 0, 1, 2-3, and 4 or more; season, defined as calendar quarters; and median income per household by census tract. These characteristics were chosen a priori given expert opinion in combination with prior research demonstrating association with IHT.11,22
Hospital Characteristics
Hospital characteristics were obtained from AHA data files and included hospitals’ size, categorized into small, medium, and large (less than 100, 100 to 399, 400 or more beds); geographic location; ownership; teaching status; setting (urban vs. rural); case mix index (CMI) for all patients cared for at the hospital; and presence of selected specialty services, including certified trauma center, medical intensive care unit, cardiac intensive care unit, cardiac surgery services, adult interventional cardiac catheterization, adult cardiac electrophysiology, and composite score of presence of 55 other specialty services (complete list in Appendix A). All characteristics were chosen a priori given expert opinion or relationship of characteristics with IHT, and prior research utilizing AHA data.23-24
Analysis
Descriptive statistics were used to evaluate the frequency of IHT, characteristics of transferred patients, and number of days to transfer. Patient and hospital characteristics of transferred vs. nontransferred patients were compared using chi-square analyses.
To analyze the effects of each patient and hospital characteristic on the odds of transfer, we used logistic regression models incorporating all patient and hospital characteristics, accounting for fixed effects for diagnosis, and utilizing generalized estimating equations (the GENMOD procedure in SAS statistical software, v 9.4; SAS Institute Inc., Cary, North Carolina) to account for the clustering of patients within hospitals.25 Indicator variables were created for missing covariate data and included in analyses when missing data accounted for greater than 10% of the total cohort.
To measure the variability in transfer rates between hospitals, we used a sequence of random effects logistic regression models. We first ran a model with no covariates, representing the unadjusted differences in transfer rates between hospitals. We then added patient characteristics to see if the unadjusted differences in IHT rates were explained by differences in patient characteristics between hospitals. Lastly, we added hospital characteristics to determine if these explained the remaining differences in transfer rates. Each of the 3 models provided a measure of between-hospital variability, reflecting the degree to which IHT rates differed between hospitals. Additionally, we used the intercept from the unadjusted model and the measure of between-hospital variability from each model to calculate the 95% confidence intervals, illustrating the range of IHT rates spanning 95% of all hospitals. We used those same numbers to calculate the 25th and 75th percentiles, illustrating the range of IHT rates for the middle half of hospitals.
RESULTS
Among 28 million eligible beneficiaries, 6.6 million had an acute care hospitalization to nonfederal, noncritical access hospitals, and 107,741 met our defined criteria for IHT. An additional 3790 beneficiaries were excluded for being transferred to the same facility, 416 beneficiaries (115 transferred, 301 nontransferred) were excluded as they were cared for at 1 of the 11 hospitals with “outlier” transfer in/out rates, and 2329 were excluded because they had more than 1 transfer during hospitalization. Thus, the final cohort consisted of 101,507 transferred (1.5%) and 6,625,474 nontransferred beneficiaries (Figure 1). Of the 101,507 transferred beneficiaries, 2799 (2.8%) were included more than once (ie, experienced more than 1 IHT on separate hospitalizations throughout the study period; the vast majority of these had 2 separate hospitalizations resulting in IHT). Characteristics of transferred and nontransferred beneficiaries are shown (Table 1).
Among transferred patients, the top 5 primary diagnoses at time of transfer included AMI (12.2%), congestive heart failure (CHF) (7.2%), sepsis (6.6%), arrhythmia (6.6%), and pneumonia (3.4%). Comorbid conditions most commonly present in transferred patients included CHF (52.6%), renal failure (51.8%), arrhythmia (49.8%), and chronic obstructive pulmonary disease (COPD; 37.0%). The most common day of transfer was day after admission (hospital day 2, 24.7%), with 75% of transferred patients transferred before hospital day 6 (Appendix B).
After adjusting for all other patient and hospital characteristics and clustering by hospital, the following variables were associated with greater odds of transfer: older age, male sex, nonblack race, non-Medicaid co-insurance, higher comorbidity (HCC score), lower DRG-weight, and fewer hospitalizations in the prior 12 months. Beneficiaries also had greater odds of transfer if initially hospitalized at smaller hospitals, nonteaching hospitals, public hospitals, at hospitals in the Northeast, those with fewer specialty services, and those with a low CMI (Table 2).
DISCUSSION
In this nationally representative study of 6.6 million Medicare beneficiaries, we found that 1.5% of patients were transferred between acute care facilities and were most often transferred prior to hospital day 6. Older age, male sex, nonblack race, higher medical comorbidity, lower DRG weight, and fewer recent hospitalizations were associated with greater odds of transfer. Initial hospitalization at smaller, nonteaching, public hospitals, with fewer specialty services were associated with greater odds of transfer, while higher CMI was associated with a lower odds of transfer. The most common comorbid conditions among transferred patients included CHF, renal failure, arrhythmia, and COPD; particularly notable was the very high prevalence of these conditions among transferred as compared with nontransferred patients. Importantly, we found significant variation in IHT by region and a large variation in transfer practices by hospital, with significant variability in transfer rates even after accounting for known patient and hospital characteristics.
Among our examined population, we found that a sizable number of patients undergo IHT—more than 100,000 per year. Primary diagnoses at time of transfer consist of common inpatient conditions, including AMI, CHF, sepsis, arrhythmia, and pneumonia. Limited prior data support our findings, with up to 50% of AMI patients reportedly undergoing IHT,3-5 and severe sepsis and respiratory illness reported as common diagnoses at transfer.11 Although knowledge of these primary diagnoses does not directly confer an understanding of reason for transfer, one can speculate based on our findings. For example, research demonstrates the majority of AMI patients who undergo IHT had further intervention, including stress testing, cardiac catheterization, and/or coronary artery bypass graft surgery.5,26 Thus, it is reasonable to presume that many of the beneficiaries
We additionally found that certain patient characteristics were associated with greater odds of transfer. Research suggests that transferred patients are “sicker” than nontransferred patients.1,11 Although our findings in part confirm these data, we paradoxically found that higher DRG-weight and 4 or more hospitalizations in the past year were actually associated with lower odds of transfer. In addition, the oldest patients in our cohort (85 years or older) were actually less likely to be transferred than their slightly younger counterparts (75 to 84 years). These variables may reflect extreme illness or frailty,27 and providers consciously (or subconsciously) may factor this in to their decision to transfer, considering a threshold past which transfer would confer more risk than benefit (eg, a patient may be “too sick” for transfer). Indeed, in a secondary analysis without hospital characteristics or comorbidities, and with fixed effects by hospital, we found the highest rates of IHT in patients in the middle 2 quartiles of DRG-weight, supporting this threshold hypothesis. It is also possible that patients with numerous hospitalizations may be less likely to be transferred because of familiarity and a strong sense of responsibility to continue to care for those patients (although we cannot confirm that those prior hospitalizations were all with the same index hospital).
It is also notable that odds of transfer differed by race, with black patients 17% less likely to undergo transfer compared to whites, similar to findings in other IHT studies.11 This finding, in combination with our demonstration that Medicaid patients also have lower odds of transfer, warrants further investigation to ensure the process of IHT does not bias against these populations, as with other well-documented health disparities.28-30
The hospital predictors of transfer were largely expected. However, interestingly, when we controlled for all other patient and hospital characteristics, regional variation persisted, with highest odds of transfer with hospitalization in the Northeast, indicating variability by region not explained by other factors, and findings supported by other limited data.31 This variability was further elucidated in our examination of change in variance estimates accounting for patient, then hospital, characteristics. Although we expected and found marked variability in hospital transfer rates in our null model (without accounting for any patient or hospital characteristics), we interestingly found that variability increased upon adjusting for patient characteristics. This result is presumably due to the fact that patients who are more likely to be transferred (ie, “sick” patients) are more often already at hospitals less likely to transfer patients, supported by our findings that hospital CMI is inversely associated with odds of transfer (in other words, hospitals that care for a less sick patient population are more likely to transfer their patients, and hospitals that care for a sicker patient population [higher CMI] are less likely to transfer). Adjusting solely for patient characteristics effectively equalizes these patients across hospitals, which would lead to even increased variability in transfer rates. Conversely, when we then adjusted for hospital characteristics, variability in hospital transfer rates decreased by 83% (in other words, hospital characteristics, rather than patient characteristics, explained much of the variability in transfer rates), although significant unexplained variability remained. We should note that although the observed reduction in variability was explained by the patient and hospital characteristics included in the model, these characteristics do not necessarily justify the variability they accounted for; although patients’ race or hospitals’ location may explain some of the observed variability, this does not reasonably justify it.
This observed variability in transfer practices is not surprising given the absence of standardization and clear guidelines to direct clinical IHT practice.17 Selection of patients that may benefit from transfer is often ambiguous and subjective.6 The Emergency Medical Treatment and Active Labor Act laws dictate that hospitals transfer patients requiring a more specialized service, or when “medical benefits ... outweigh the increased risks to the individual...,” although in practice this provides little guidance to practitioners.1 Thus, clearer guidelines may be necessary to achieve less variable practices.
Our study is subject to several limitations. First, although nationally representative, the Medicare population is not reflective of all hospitalized patients nationwide. Additionally, we excluded patients transferred from the emergency room. Thus, the total number of patients who undergo IHT nationally is expected to be much higher than reflected in our analysis. We also excluded patients who were transferred more than once during a given hospitalization. This enabled us to focus on the initial transfer decision but does not allow us to look at patients who are transferred to a referral center and then transferred back. Second, given the criteria we used to define transfer, it is possible that we included nontransferred patients within our transferred cohort if they were discharged from one hospital and admitted to a different hospital within 1 day. However, on quality assurance analyses where we limited our cohort to only those beneficiaries with corresponding “transfer in” and “transfer out” claims (87% of the total cohort), we found no marked differences in our results. Additionally, although we assume that patient transfer status was coded correctly within the Medicare dataset, we could not confirm by individually examining each patient we defined as “transferred.” However, on additional quality assurance analyses where we examined randomly selected excluded patients with greater than 1 transfer during hospitalization, we found differing provider numbers with each transfer, suggesting validity of the coding. Third, because there are likely many unmeasured patient confounders, we cannot be sure how much of the between-hospital variation is due to incomplete adjustment for patient characteristics. However, since adjusting for patient characteristics actually increased variability in hospital transfer rates, it is unlikely that residual patient confounders fully explain our observed results. Despite this, other variables that are not available within the CMS or AHA datasets may further elucidate hospital transfer practices, including variables reflective of the transfer process (eg, time of day of patient transfer, time delay between initiation of transfer and patient arrival at accepting hospital, accepting service on transfer, etc.); other markers of illness severity (eg, clinical service at the time of index admission, acute physiology score, utilization of critical care services on arrival at receiving hospital); and other hospital system variables (ie, membership in an accountable care organization and/or regional care network, the density of nearby tertiary referral centers (indicating possible supply-induced demand), other variables reflective of the “transfer culture” (such as the transfer rate at the hospital or region where the attending physician trained, etc.). Lastly, though our examination provides important foundational information regarding IHT nationally, this study did not examine patient outcomes in transferred and nontransferred patients, which may help to determine which patients benefit (or do not benefit) from transfer and why. Further investigation is needed to study these outcomes.
CONCLUSION
In this national study of IHT, we found that a sizable number of patients admitted to the hospital undergo transfer to another acute care facility. Patients are transferred with common medical conditions, including those requiring specialized care such as AMI, and a high rate of comorbid clinical conditions, and certain patient and hospital characteristics are associated with greater odds of transfer. Although many of the observed associations between characteristics and odds of transfer were expected based on limited existing literature, we found several unexpected findings, eg, suggesting the possibility of a threshold beyond which sicker patients are not transferred. Additionally, we found that black and Medicaid patients had lower odds of transfer, which warrants further investigation for potential health care disparity. Importantly, we found much variability in the practice of IHT, as evidenced by the inexplicable differences in transfer by hospital region, and by residual unexplained variability in hospital transfer rates after accounting for patient and hospital characteristics, which may be due to lack of standard guidelines to direct IHT practices. In conclusion, this study of hospitalized Medicare patients provides important foundational information regarding rates and predictors of IHT nationally, as well as unexplained variability that exists within this complex care transition. Further investigation will be essential to understand reasons for, processes related to, and outcomes of transferred patients, to help guide standardization in best practices in care.
Disclosure
Nothing to report.
1. Iwashyna TJ. The incomplete infrastructure for interhospital patient transfer. Crit Care Med. 2012;40(8):2470-2478. PubMed
2. Iwashyna TJ, Christie JD, Moody J, Kahn JM, Asch DA. The structure of critical care transfer networks. Med Care. 2009;47(7):787-793. PubMed
3. Mehta RH, Stalhandske EJ, McCargar PA, Ruane TJ, Eagle KA. Elderly patients at highest risk with acute myocardial infarction are more frequently transferred from community hospitals to tertiary centers: reality or myth? Am Heart J. 1999;138(4 Pt 1):688-695. PubMed
4. Iwashyna TJ, Kahn JM, Hayward RA, Nallamothu BK. Interhospital transfers among Medicare beneficiaries admitted for acute myocardial infarction at nonrevascularization hospitals. Circ Cardiovasc Qual Outcomes. 2010;3(5):468-475. PubMed
5. Roe MT, Chen AY, Delong ER, Boden WE, Calvin JE Jr, Cairns CB, et al. Patterns of transfer for patients with non-ST-segment elevation acute coronary syndrome from community to tertiary care hospitals. Am Heart J. 2008;156(1):185-192. PubMed
6. Bosk EA, Veinot T, Iwashyna TJ. Which patients and where: a qualitative study of patient transfers from community hospitals. Med Care. 2011;49(6):592-598. PubMed
7. Wagner J, Iwashyna TJ, Kahn JM. Reasons underlying interhospital transfers to an academic medical intensive care unit. J Crit Care. 2013;28(2):202-208. PubMed
8. Cohen MD, Hilligoss PB. The published literature on handoffs in hospitals: deficiencies identified in an extensive review. Qual Saf Health Care. 2010;19(6):493-497. PubMed
9. Riesenberg LA, Leitzsch J, Massucci JL, et al. Residents’ and attending physicians’ handoffs: a systematic review of the literature. Acad Med. 2009;84(12):1775-1787. PubMed
10. Arora V, Johnson J, Lovinger D, Humphrey HJ, Meltzer DO. Communication failures in patient sign-out and suggestions for improvement: a critical incident analysis. Qual Saf Health Care. 2005;14(6):401-407. PubMed
11. Sokol-Hessner L, White AA, Davis KF, Herzig SJ, Hohmann SF. Interhospital transfer patients discharged by academic hospitalists and general internists: characteristics and outcomes. J Hosp Med. 2016;11(4):245-250. PubMed
12. Bernard AM, Hayward RA, Rosevear J, Chun H, McMahon LF. Comparing the hospitalizations of transfer and non-transfer patients in an academic medical center. Acad Med. 1996;71(3):262-266. PubMed
13. Golestanian E, Scruggs JE, Gangnon RE, Mak RP, Wood KE. Effect of interhospital transfer on resource utilization and outcomes at a tertiary care referral center. Crit Care Med. 2007;35(6):1470-1476. PubMed
14. Durairaj L, Will JG, Torner JC, Doebbeling BN. Prognostic factors for mortality following interhospital transfers to the medical intensive care unit of a tertiary referral center. Crit Care Med. 2003;31(7):1981-1986. PubMed
15. Kerr HD, Byrd JC. Community hospital transfers to a VA Medical Center. JAMA. 1989;262(1):70-73. PubMed
16. Dragsted L, Jörgensen J, Jensen NH, et al. Interhospital comparisons of patient outcome from intensive care: importance of lead-time bias. Crit Care Med. 1989;17(5):418-422. PubMed
17. Gupta K, Mueller SK. Interhospital transfers: the need for standards. J Hosp Med. 2015;10(6):415-417. PubMed
18. The Dartmouth Atlas of Health Care: Understanding of the Efficiency and Effectiveness of the Health Care System. The Dartmouth Institute for Health Practice and Clinical Policy, Lebanon, NH. http://www.dartmouthatlas.org/. Accessed November 1, 2016.
19. American Hospital Association Annual Survey Database. American Hospital Association, Chicago, IL. http://www.ahadataviewer.com/book-cd-products/AHA-Survey/. Accessed July 1, 2013.
20. U.S. Department of Health and Human Services (HRSA): What are critical access hospitals (CAH)? http://www.hrsa.gov/healthit/toolbox/RuralHealthITtoolbox/Introduction/critical.html. Accessed June 9, 2016.
21. Li P, Kim MM, Doshi JA. Comparison of the performance of the CMS Hierarchical Condition Category (CMS-HCC) risk adjuster with the Charlson and Elixhauser comorbidity measures in predicting mortality. BMC Health Serv Res. 2010;10:245. PubMed
22. Hernandez-Boussard T, Davies S, McDonald K, Wang NE. Interhospital facility transfers in the United States: a nationwide outcomes study. J Patient Saf. Nov 13 2014. PubMed
23. Landon BE, Normand SL, Lessler A, et al. Quality of care for the treatment of acute medical conditions in US hospitals. Arch Intern Med. 2006;166(22):2511-2517. PubMed
24. Mueller SK, Lipsitz S, Hicks LS. Impact of hospital teaching intensity on quality of care and patient outcomes. Med Care.2013;51(7):567-574. PubMed
25. Lopez L, Hicks LS, Cohen AP, McKean S, Weissman JS. Hospitalists and the quality of care in hospitals. Arch Intern Med. 2009;169(15):1389-1394. PubMed
26. Barreto-Filho JA, Wang Y, Rathore SS, et al. Transfer rates from nonprocedure hospitals after initial admission and outcomes among elderly patients with acute myocardial infarction. JAMA Intern Med. 2014;174(2):213-222. PubMed
27. Carlson JE, Zocchi KA, Bettencourt DM, et al. Measuring frailty in the hospitalized elderly: concept of functional homeostasis. Am J Phys Med Rehabil. 1998;77(3):252-257. PubMed
28. Ward E, Jemal A, Cokkinides V, et al. Cancer disparities by race/ethnicity and socioeconomic status. CA Cancer J Clin. 2004;54(2):78-93. PubMed
29. Iribarren C, Tolstykh I, Somkin CP, et al. Sex and racial/ethnic disparities in outcomes after acute myocardial infarction: a cohort study among members of a large integrated health care delivery system in northern California. Arch Intern Med. 2005;165(18):2105-2113. PubMed
30. Kawachi I, Daniels N, Robinson DE. Health disparities by race and class: why both matter. Health Aff (Millwood). 2005;24(2):343-352. PubMed
31. Herrigel DJ, Carroll M, Fanning C, Steinberg MB, Parikh A, Usher M. Interhospital transfer handoff practices among US tertiary care centers: a descriptive survey. J Hosp Med. 2016;11(6):413-417. PubMed
© 2017 Society of Hospital Medicine
Dependence of Elevated Eosinophil Levels on Geographic Location
A primary care physician in the VA San Diego Healthcare System (VASDHS) clinically observed an unexpected rate of elevated eosinophil levels on routine blood tests of patients residing in inland areas of San Diego County and Imperial County. The majority of the affected patients did not present with symptoms or associated pathology, leaving the significance of these laboratory results unclear and creating question of what intervention, if any, might be most appropriate for these patients. A preliminary chart review of clinic visits at community-based clinic sites confirmed higher rates of elevated eosinophil levels compared with those of patients seen at the San Diego-based medical center. Based on this finding, a more formal investigation was initiated.
Eosinophils are leukocyte components of the cell-mediated immune response and may be elevated in conditions that include hypersensitivity reactions, adrenal insufficiency, neoplastic disorders, and parasitic infections, among others.1 An elevated percentage of eosinophils can be attributed to a variety of causes, and isolated elevations in a particular individual may not necessarily reflect an underlying pathology. Furthermore, elevated eosinophil levels alone do not necessarily indicate eosinophilia, as the latter is defined by absolute eosinophil counts. However, the occurrence of elevated eosinophil levels that remain unexplained at the population level raises the possibility of a common exposure and warrants further investigation. If such a phenomenon appears to be geographically distributed, as was noted by VA physicians in San Diego and Imperial County, it becomes important to consider what exposures might be unique to a particular site.
Coccidioides immitis
The soil fungus Coccidioides immitis (C immitis) is a growing public health concern for inland areas of San Diego County and Imperial County. While its presence in the northern California San Joaquin Valley has been of particular research interest and has gained traction in public discourse, the organism also is endemic to much of southern California, Arizona, New Mexico, and Texas, with its range extending as far north as parts of Nevada and Utah.2 Although C immitis has been identified as endemic to the dry climate of Imperial County, the precise degree of its endemicity and clinical significance are less clear.
From 2006 to 2010, Imperial County reported a comparatively low incidence rate of coccidioidomycosis (C immitis infection) compared with that of similar adjacent climates, such as Yuma, Arizona. A 2011 Imperial County survey found that only 23% of clinicians considered coccidioidomycosis a problem in California, and only 43% would consider the diagnosis in a patient presenting with respiratory problems.3 These findings have raised the concern that cases are being missed either from failure to diagnose or from underreporting. Furthermore, in light of a 1997 study that found intestinal parasites in about 28% of the population in Mexico, there is concern that given the close proximity to northern Mexico (where C immitis also is found), rates of Strongyloides stercoralis, Giardia lamblia, Entamoeba histolytica, Cryptosporidium, Ascaris lumbricoides, and other parasitic infections might be higher in border counties, such as Imperial County, compared with other sites in California.4
While coccidioidomycosis and parasitic infections are potential causes of the elevated eosinophil levels at VASDHS, recent studies have demonstrated an association between cardiovascular risk factors, such as dyslipidemia and diabetes mellitus, and eosinophil count.5 The association between dyslipidemia and elevated eosinophil levels is not well understood, although recent studies have described it as likely multifactorial with contributing mechanisms involving oxidative stress, endothelial dysfunction, and inflammatory changes.6 Consideration of these cardiovascular risk factors is of particular importance in this population because of its high rate of overweight and obesity. According to the 2011-2012 California Health Interview Survey, 71% of Imperial Valley adults were found to be either overweight or obese compared with the California state average of 55% and the San Diego County average of 57%.7,8
This investigation aimed to identify whether geographically distributed elevated eosinophil levels can be identified using population-level data, whether eosinophil levels are found to be elevated at a particular site, and whether such observations might be explained by known characteristics of the patient population based on existing patient data.
Methods
The percentage of eosinophils on complete blood counts (CBCs) were acquired for all VASDHS patients who had laboratory visits from May 1 to June 30, 2010, based on patient records. For patients with multiple laboratory visits during the period, only data from the earliest visit were included for this investigation. Initially, patients were sorted according to the site of their laboratory blood draw: Chula Vista, Escondido, Imperial Valley, La Jolla, Mission Valley, and Oceanside. Descriptive statistical analyses were carried out for each specific site as well as with patients from all sites pooled.
Sites With Elevated Eosinophil Levels
In addition to descriptive statistics, Pearson χ2 tests were initially performed to determine whether the proportions of elevated eosinophil levels at inland VASDHS sites in San Diego and Imperial counties deviated significantly from the expected levels at the coastal La Jolla hospital comparison site. Additional Pearson χ2 tests were performed subsequently to compare all sites involved in the study against all other sites. The goal of these Pearson χ2 tests was to identify potential sites for further investigation with no adjustment made for multiple testing. Sites with eosinophil levels significantly higher or lower than the expected levels when compared with the other sites included in the study were investigated further with a chart review.
Based on the VA Clinical Laboratory standards, a peripheral eosinophil percentage > 3% was considered elevated. Absolute eosinophil levels also were calculated to determine whether elevated eosinophil levels were associated with absolute counts reflective of eosinophilia. Counts of 500 to 1,499 eosinophils/mL were considered mild eosinophilia, 1,500 to 4,999 eosinophils/mL considered moderate eosinophilia, and ≥ 5,000 considered severe eosinophilia.9
Site-Specific Subgroup Analysis
A structured chart review was conducted for all patient notes, laboratory findings, studies, and communications for sites identified with elevated eosinophil levels. Demographic information was collected for all subjects, including age, race, occupation, and gender. Each record was systematically evaluated for information relating to possible causes of eosinophilia, including recent or prior data on the following: CBC, eosinophil percentage; HIV, C immitis, or Strongyloides stercoralis serology, stool ova and parasites, diagnoses of dyslipidemia, diabetes mellitus, malignancy, or adrenal insufficiency; and histories of atopy, allergies, and/or allergic rhinitis. In addition, given the unique exposures of the veteran population, data on service history and potential exposures during service, such as to Agent Orange, also were collected.
A multivariate analysis using logistic regression was conducted to determine whether conditions or exposures often associated with eosinophilia might explain any observed elevations in eosinophil levels. For the logistic regression model, the response variable was eosinophil levels > 3%. Explanatory variables included parasitic infection diagnosis, including C immitis, dyslipidemia diagnosis, malignancy diagnosis, allergy and/or atopy diagnosis, and HIV diagnosis. In addition, the analysis controlled for demographic variables, such as age, sex, race, period of service, and Agent Orange exposure and were included as explanatory variables in the model. Categorical variables were coded as 0 for negative results and 1 for positive results and were identified as missing if no data were recorded for that variable. Statistics were performed using Stata 13 (College Station, TX).
Results
A total of 6,777 VASDHS patient records were acquired. Two records included CBC without differentials and were omitted from the study. Among those included, the median eosinophil percentage was 2.3% (SD 2.51). Eosinophil percentages ranged from 0% to 39.3%. The 25th percentile and 75th percentile eosinophil levels were 1.3% and 3.6%, respectively. Nine percent of patients had percentages below 11.6%, and 4 patients had eosinophil percentages ranging from 30% to 39% (Figure 1).
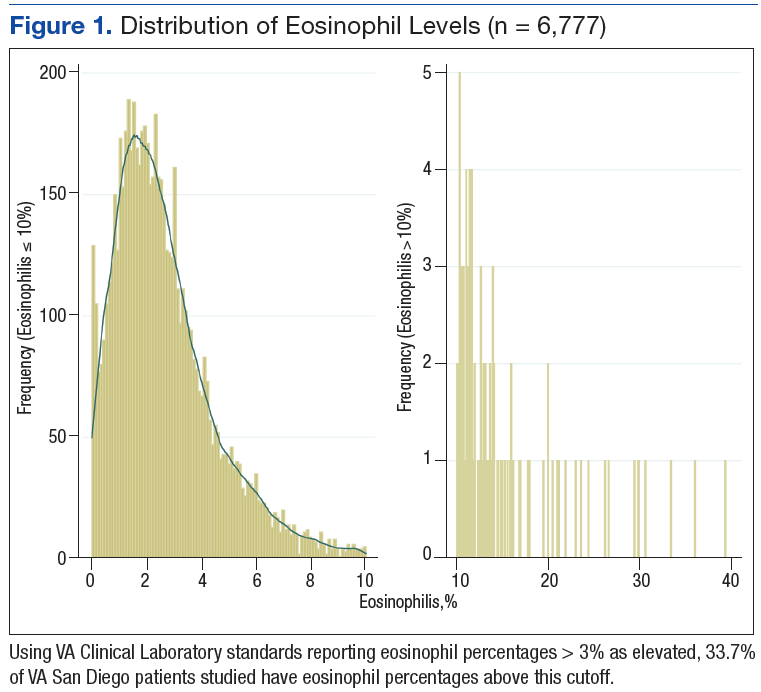
Grouping the records by clinic, 30% to 40% of patients had elevated eosinophil levels at all sites except for Imperial Valley (Figure 2). At the Imperial Valley site, 50.5% of patients had elevated eosinophil levels, which was statistically higher than those of all other sites (Figure 3).
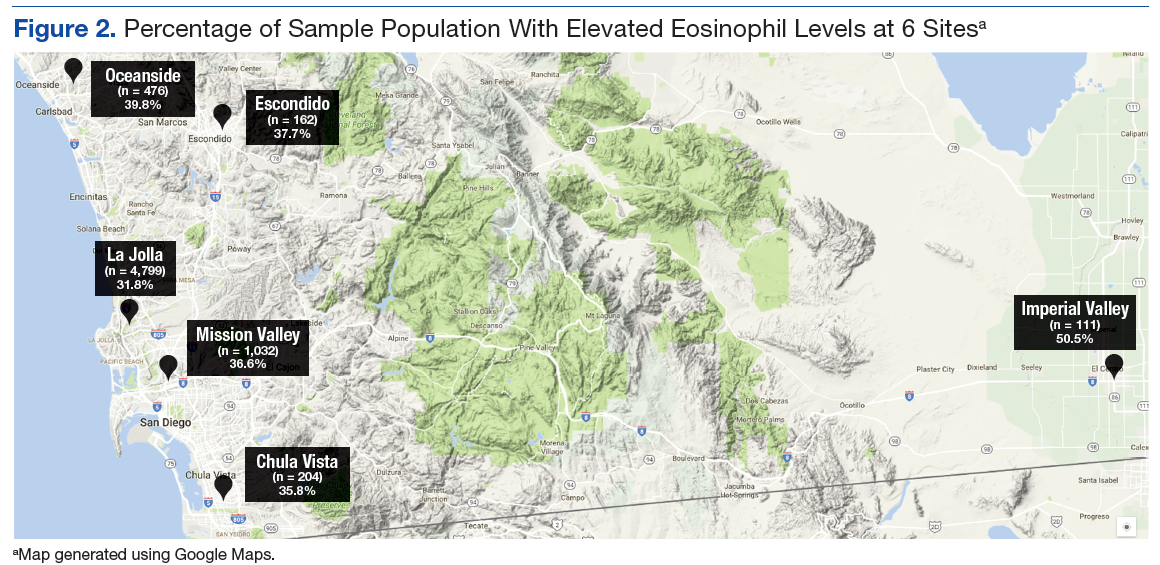
The authors tested the null hypothesis that there is no association between geographic location and the proportion of the population with elevated eosinophil levels. A Pearson χ2 test of the proportion of elevated eosinophil level (P < .001) indicated that the observed differences in elevated eosinophil levels were unlikely due to chance. Further sets of exploratory χ2 tests comparing only 2 sites at a time identified Imperial Valley as differing significantly from all other sites at α = .05. Eosinophil proportions at the Mission Valley (P = .003) and Oceanside (P < .001) sites also were found to differ significantly from the La Jolla site. In contrast, eosinophil proportions at the Escondido (P = .199) and Chula Vista (P = .237) sites did not differ significantly from those of the La Jolla site using χ2 testing.
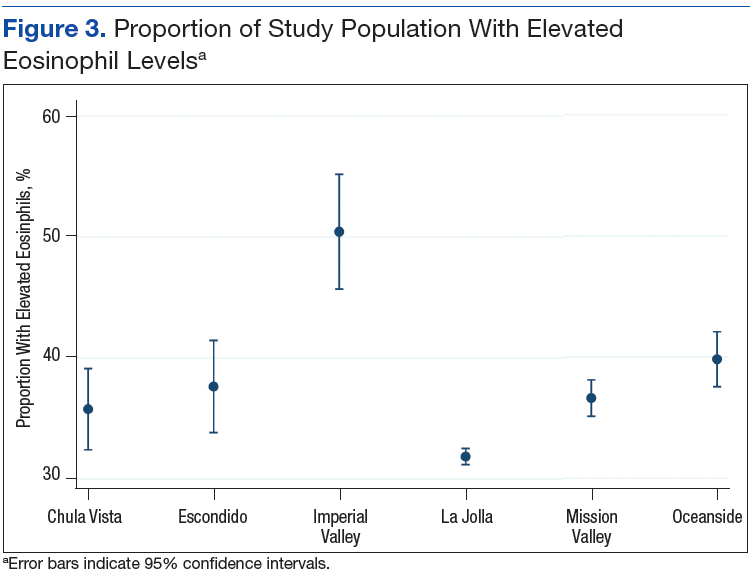
Imperial Valley Clinic
Records were acquired for 109 patients at the Imperial Valley clinic (107 male and 2 female). Fifty-five patients (50.5%) were identified as having elevated eosinophil levels. However, only 5 patients were classified as having mild eosinophilia. No patients were found to have moderate or severe eosinophilia (Table 1).
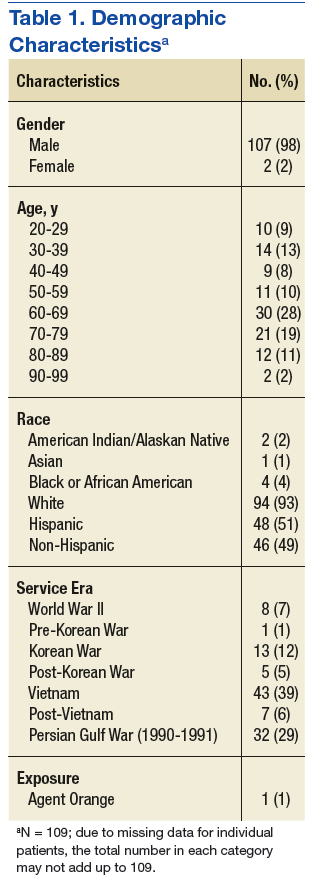
On review of the data for Imperial Valley patients, 68 had a diagnosis of dyslipidemia and 17 had asthma, atopic dermatitis, allergic rhinitis, and/or atopy not otherwise specified diagnoses. Three patients were identified with diagnoses of malignancies or premalignant conditions, including 1 patient with chronic lymphocytic leukemia, 1 patient with renal cell carcinoma with metastasis to the lungs, and 1 patient with myelodysplastic syndrome. No patients were identified with a diagnosis of HIV. There were no diagnostic laboratory tests on record for C immitis serology, stool ova and parasites, Strongyloides stercoralis serology, or clinical diagnoses of related conditions.
Logistic regressions assessed whether elevated eosinophil levels > 3% might be explained by predictor variables, such as a history of dyslipidemia, malignancy, or asthma/allergies/atopy (Table 2). As no parasitic infections or HIV diagnoses were identified in the patient population, they were noncontributory in the model. The probability of obtaining the χ2 statistic given the assumption that the null hypothesis is true equals .027 for the model, suggesting that the overall model was statistically significant at the α = .05 level.
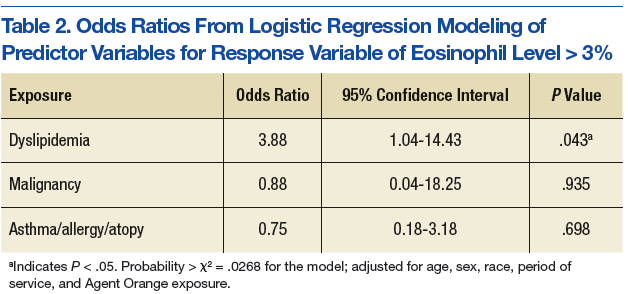
Of the key predictor variables of interest, only dyslipidemia was found to predict elevated eosinophil levels. Patients with a diagnosis of dyslipidemia were found to have nearly 4 times greater likelihood of having elevated eosinophil levels compared with patients without dyslipidemia (odds ratio 3.88, 95% confidence interval: 1.04-14.43). Patients with malignancy or a history of asthma, allergy, or atopy were not found to have significantly different odds of having elevated eosinophil levels compared with baseline within the study population.
Discussion
High proportions of elevated eosinophil levels among VASDHS patients were found to be geographically concentrated at sites that included Imperial Valley, Oceanside, and Mission Valley. Although initial exploratory Pearson χ2 tests did not accommodate for multiple comparisons, a particularly consistent finding was that the proportion of patients with elevated eosinophil levels seemed to be notably high at the Imperial Valley site in particular, which corresponded with the clinical observations made by physicians.
It was initially thought that the elevated eosinophil levels might be due to exposure to geographically distributed pathogens, such as C immitis, but there were no clinically diagnosed cases in the population studied. However, it also is true that no C immitis serologies or other parasitic serologies were ordered for the patients during the study period. In the context of possible undertesting and underdiagnosis of coccidioidomycosis, it may be possible that these cases were simply missed.
Nonetheless, alternative explanations for elevated eosinophil levels also must be considered. Of the possible explanatory exposures considered, only dyslipidemia was found to be statistically significant in the study population. Patients with dyslipidemia had 4 times greater odds of also having elevated eosinophil levels compared with those who did not have dyslipidemia, which is in line with recent literature identifying conditions such as dyslipidemia and diabetes mellitus as independent predictors of elevated eosinophil levels.6
In light of the known high rates of obesity in the Imperial Valley in comparison with rates of obesity in San Diego County from previous studies and questionnaires, the increased levels of dyslipidemia in the Imperial Valley compared with those of the other sites included in the study may help explain the geographic distribution of observed elevated eosinophil levels.7,8 Although data on dyslipidemia rates among study participants at sites other than Imperial Valley were not collected for this study, this explanation represents a promising area of further investigation.
Furthermore, although about 50% of the population in the Imperial Valley had CBCs with eosinophil levels > 3%, only 5% of the population was found to have eosinophilia based on absolute eosinophil counts, and all such cases were mild. Although excluding infection or other causes of elevated eosinophil levels is difficult, it is reasonable to believe that such low-grade elevations that do not meet the criteria for true eosinophilia may be more consistent with chronic processes, such as dyslipidemia, as opposed to frank infection in which one might expect a morerobust response.
Limitations
The cause of this phenomenon is not yet clear, with the investigation limited by several factors. Possibly the sample size of 109 patients in the Imperial Valley was not sufficient to capture some causes of elevated eosinophil levels, particularly if the effect size of an exposure is low or the exposure infrequent. Of note, no cases of HIV, C immitis infection, or other parasitic infections were observed. Furthermore, only 3 cases of malignancy and 17 cases of asthma, allergies, and/or atopy were identified. Malignancy, asthma, and allergy and/or atopy were not statistically significant as predictors of eosinophilia at the α = .05 level, although the analysis of these variables was likely limited by the small number of patients with these conditions in the sample population. While all these exposures are known to be associated with eosinophilia in the literature, none were identified as predictors in the logistic regression model, likely due, in part, to the limited sample size.
Given the high proportion of the Imperial Valley population with elevated eosinophil levels compared with those of all other sites investigated, a rare or subtle exposure of the types noted would be less likely to explain such a large difference. It is important to look more carefully at a number of possible factors—including gathering more detailed data on dyslipidemia and C immitis infection rates among other possible contributors—to determine more precisely the cause of the notably elevated eosinophil levels in this and other sites in the region.
Conclusion
Using a convenience sample of the VA population based on routine laboratory testing, this study has established that geographically distributed elevated eosinophil levels can be identified in the San Diego region. However, it is less clear why notably elevated eosinophil levels were found at these sites. Although there was no evidence of a correlation between certain environmental factors and elevated eosinophil levels, this may have been due to insufficiently detailed consideration of environmental factors.
Logistic regression analysis associated dyslipidemia with a notably increased risk of elevated eosinophil levels in the Imperial Valley population, but it would be premature to conclude that this association is necessarily causal. Further research would help elucidate this. Increasing the investigational time frame and a chart review of additional sites could provide informative data points for analysis and would allow for a more in-depth comparison between sites. More immediately, given the possibility that dyslipidemia may be a source of the observed elevated eosinophil levels in the Imperial Valley population, it would be worth investigating the rates of dyslipidemia at comparison sites to see whether the lower rates of elevated eosinophil levels at these other sites correspond to lower rates of dyslipidemia.
In future work, it may be valuable to test the study population for C immitis, given the prevalence of the fungus in the area and the concern among many public health professionals of its undertesting and underdiagnosis. Because many cases of C immitis are subclinical, it may be worth investigating whether these are being missed and to what degree such cases might be accompanied by elevations in eosinophil levels.
Given that much remains unknown regarding the causes of elevated eosinophil levels in the Imperial Valley and other sites in the region, further study of such elevations across sites and over time—as well as careful consideration of noninfectious causes of elevated eosinophil levels, such as dyslipidemia—may be of important value to both local clinicians and public health professionals in this region. ˜
Acknowledgments
The authors thank Ms. Robin Nuspl and Mr. Ben Clark for their assistance with the data and guidance. The authors also are grateful to the staff members at the VA San Diego Healthcare System for their many contributions to this project.
1. Tefferi A. Blood eosinophilia: a new paradigm in disease classification, diagnosis, and treatment. Mayo Clin Proc. 2005;80(1):75-83.
2. Wardlaw AJ. Eosinophils and their disorders. In: Kaushansky K, Lichtman MA, Beutler E, Kipps TJ, Seligsohn U, Prchal JT, eds. Williams Hematology. 8th ed. New York, NY: The McGraw-Hill Companies; 2010:897-914.
3. MacLean ML. The epidemiology of coccidioidomycosis—15 California counties, 2007-2011. http://vfce.arizona.edu/sites/vfce/files/the_epidemiology_of_coccidioidomycosis_collaborative_county_report.pdf. Published January 22, 2014. Accessed February 28, 2017.
4. Guarner J, Matilde-Nava T, Villaseñor-Flores R, Sanchez-Mejorada G. Frequency of intestinal parasites in adult cancer patients in Mexico. Arch Med Res. 1997;28(2):219-222.
5. Tanaka M, Fukui M, Tomiyasu K, et al. Eosinophil count is positively correlated with coronary artery calcification. Hypertens Res. 2012;35(3):325-328.
6. Altas Y, Kurtoglu E, Yaylak B, et al. The relationship between eosinophilia and slow coronary flow. Ther Clin Risk Manag. 2015;11:1187-1191.
7. Imperial County Comprehensive Economic Development Strategy Committee. Imperial County Comprehensive Economic Development Strategy: 2014-2015 Annual Update. http://www.co.imperial.ca.us/announcements/PDFs/2014-2015FinalCEDS.pdf. Accessed March 6, 2017.
8. California Health Interview Survey. CHIS 2009 Adult Public Use File. Version November 2012 [computer file]. Los Angeles, CA: UCLA Center for Health Policy Research, November 2012. http://healthpolicy.ucla.edu/chis/data/public-use-data-file/Pages/2009.aspx. Accessed March 29, 2016. 9. Roufosse F, Weller PF. Practical approach to the patient with hypereosinophilia. J Allergy Clin Immun. 2010;126(1):39-44.
A primary care physician in the VA San Diego Healthcare System (VASDHS) clinically observed an unexpected rate of elevated eosinophil levels on routine blood tests of patients residing in inland areas of San Diego County and Imperial County. The majority of the affected patients did not present with symptoms or associated pathology, leaving the significance of these laboratory results unclear and creating question of what intervention, if any, might be most appropriate for these patients. A preliminary chart review of clinic visits at community-based clinic sites confirmed higher rates of elevated eosinophil levels compared with those of patients seen at the San Diego-based medical center. Based on this finding, a more formal investigation was initiated.
Eosinophils are leukocyte components of the cell-mediated immune response and may be elevated in conditions that include hypersensitivity reactions, adrenal insufficiency, neoplastic disorders, and parasitic infections, among others.1 An elevated percentage of eosinophils can be attributed to a variety of causes, and isolated elevations in a particular individual may not necessarily reflect an underlying pathology. Furthermore, elevated eosinophil levels alone do not necessarily indicate eosinophilia, as the latter is defined by absolute eosinophil counts. However, the occurrence of elevated eosinophil levels that remain unexplained at the population level raises the possibility of a common exposure and warrants further investigation. If such a phenomenon appears to be geographically distributed, as was noted by VA physicians in San Diego and Imperial County, it becomes important to consider what exposures might be unique to a particular site.
Coccidioides immitis
The soil fungus Coccidioides immitis (C immitis) is a growing public health concern for inland areas of San Diego County and Imperial County. While its presence in the northern California San Joaquin Valley has been of particular research interest and has gained traction in public discourse, the organism also is endemic to much of southern California, Arizona, New Mexico, and Texas, with its range extending as far north as parts of Nevada and Utah.2 Although C immitis has been identified as endemic to the dry climate of Imperial County, the precise degree of its endemicity and clinical significance are less clear.
From 2006 to 2010, Imperial County reported a comparatively low incidence rate of coccidioidomycosis (C immitis infection) compared with that of similar adjacent climates, such as Yuma, Arizona. A 2011 Imperial County survey found that only 23% of clinicians considered coccidioidomycosis a problem in California, and only 43% would consider the diagnosis in a patient presenting with respiratory problems.3 These findings have raised the concern that cases are being missed either from failure to diagnose or from underreporting. Furthermore, in light of a 1997 study that found intestinal parasites in about 28% of the population in Mexico, there is concern that given the close proximity to northern Mexico (where C immitis also is found), rates of Strongyloides stercoralis, Giardia lamblia, Entamoeba histolytica, Cryptosporidium, Ascaris lumbricoides, and other parasitic infections might be higher in border counties, such as Imperial County, compared with other sites in California.4
While coccidioidomycosis and parasitic infections are potential causes of the elevated eosinophil levels at VASDHS, recent studies have demonstrated an association between cardiovascular risk factors, such as dyslipidemia and diabetes mellitus, and eosinophil count.5 The association between dyslipidemia and elevated eosinophil levels is not well understood, although recent studies have described it as likely multifactorial with contributing mechanisms involving oxidative stress, endothelial dysfunction, and inflammatory changes.6 Consideration of these cardiovascular risk factors is of particular importance in this population because of its high rate of overweight and obesity. According to the 2011-2012 California Health Interview Survey, 71% of Imperial Valley adults were found to be either overweight or obese compared with the California state average of 55% and the San Diego County average of 57%.7,8
This investigation aimed to identify whether geographically distributed elevated eosinophil levels can be identified using population-level data, whether eosinophil levels are found to be elevated at a particular site, and whether such observations might be explained by known characteristics of the patient population based on existing patient data.
Methods
The percentage of eosinophils on complete blood counts (CBCs) were acquired for all VASDHS patients who had laboratory visits from May 1 to June 30, 2010, based on patient records. For patients with multiple laboratory visits during the period, only data from the earliest visit were included for this investigation. Initially, patients were sorted according to the site of their laboratory blood draw: Chula Vista, Escondido, Imperial Valley, La Jolla, Mission Valley, and Oceanside. Descriptive statistical analyses were carried out for each specific site as well as with patients from all sites pooled.
Sites With Elevated Eosinophil Levels
In addition to descriptive statistics, Pearson χ2 tests were initially performed to determine whether the proportions of elevated eosinophil levels at inland VASDHS sites in San Diego and Imperial counties deviated significantly from the expected levels at the coastal La Jolla hospital comparison site. Additional Pearson χ2 tests were performed subsequently to compare all sites involved in the study against all other sites. The goal of these Pearson χ2 tests was to identify potential sites for further investigation with no adjustment made for multiple testing. Sites with eosinophil levels significantly higher or lower than the expected levels when compared with the other sites included in the study were investigated further with a chart review.
Based on the VA Clinical Laboratory standards, a peripheral eosinophil percentage > 3% was considered elevated. Absolute eosinophil levels also were calculated to determine whether elevated eosinophil levels were associated with absolute counts reflective of eosinophilia. Counts of 500 to 1,499 eosinophils/mL were considered mild eosinophilia, 1,500 to 4,999 eosinophils/mL considered moderate eosinophilia, and ≥ 5,000 considered severe eosinophilia.9
Site-Specific Subgroup Analysis
A structured chart review was conducted for all patient notes, laboratory findings, studies, and communications for sites identified with elevated eosinophil levels. Demographic information was collected for all subjects, including age, race, occupation, and gender. Each record was systematically evaluated for information relating to possible causes of eosinophilia, including recent or prior data on the following: CBC, eosinophil percentage; HIV, C immitis, or Strongyloides stercoralis serology, stool ova and parasites, diagnoses of dyslipidemia, diabetes mellitus, malignancy, or adrenal insufficiency; and histories of atopy, allergies, and/or allergic rhinitis. In addition, given the unique exposures of the veteran population, data on service history and potential exposures during service, such as to Agent Orange, also were collected.
A multivariate analysis using logistic regression was conducted to determine whether conditions or exposures often associated with eosinophilia might explain any observed elevations in eosinophil levels. For the logistic regression model, the response variable was eosinophil levels > 3%. Explanatory variables included parasitic infection diagnosis, including C immitis, dyslipidemia diagnosis, malignancy diagnosis, allergy and/or atopy diagnosis, and HIV diagnosis. In addition, the analysis controlled for demographic variables, such as age, sex, race, period of service, and Agent Orange exposure and were included as explanatory variables in the model. Categorical variables were coded as 0 for negative results and 1 for positive results and were identified as missing if no data were recorded for that variable. Statistics were performed using Stata 13 (College Station, TX).
Results
A total of 6,777 VASDHS patient records were acquired. Two records included CBC without differentials and were omitted from the study. Among those included, the median eosinophil percentage was 2.3% (SD 2.51). Eosinophil percentages ranged from 0% to 39.3%. The 25th percentile and 75th percentile eosinophil levels were 1.3% and 3.6%, respectively. Nine percent of patients had percentages below 11.6%, and 4 patients had eosinophil percentages ranging from 30% to 39% (Figure 1).
Grouping the records by clinic, 30% to 40% of patients had elevated eosinophil levels at all sites except for Imperial Valley (Figure 2). At the Imperial Valley site, 50.5% of patients had elevated eosinophil levels, which was statistically higher than those of all other sites (Figure 3).
The authors tested the null hypothesis that there is no association between geographic location and the proportion of the population with elevated eosinophil levels. A Pearson χ2 test of the proportion of elevated eosinophil level (P < .001) indicated that the observed differences in elevated eosinophil levels were unlikely due to chance. Further sets of exploratory χ2 tests comparing only 2 sites at a time identified Imperial Valley as differing significantly from all other sites at α = .05. Eosinophil proportions at the Mission Valley (P = .003) and Oceanside (P < .001) sites also were found to differ significantly from the La Jolla site. In contrast, eosinophil proportions at the Escondido (P = .199) and Chula Vista (P = .237) sites did not differ significantly from those of the La Jolla site using χ2 testing.
Imperial Valley Clinic
Records were acquired for 109 patients at the Imperial Valley clinic (107 male and 2 female). Fifty-five patients (50.5%) were identified as having elevated eosinophil levels. However, only 5 patients were classified as having mild eosinophilia. No patients were found to have moderate or severe eosinophilia (Table 1).
On review of the data for Imperial Valley patients, 68 had a diagnosis of dyslipidemia and 17 had asthma, atopic dermatitis, allergic rhinitis, and/or atopy not otherwise specified diagnoses. Three patients were identified with diagnoses of malignancies or premalignant conditions, including 1 patient with chronic lymphocytic leukemia, 1 patient with renal cell carcinoma with metastasis to the lungs, and 1 patient with myelodysplastic syndrome. No patients were identified with a diagnosis of HIV. There were no diagnostic laboratory tests on record for C immitis serology, stool ova and parasites, Strongyloides stercoralis serology, or clinical diagnoses of related conditions.
Logistic regressions assessed whether elevated eosinophil levels > 3% might be explained by predictor variables, such as a history of dyslipidemia, malignancy, or asthma/allergies/atopy (Table 2). As no parasitic infections or HIV diagnoses were identified in the patient population, they were noncontributory in the model. The probability of obtaining the χ2 statistic given the assumption that the null hypothesis is true equals .027 for the model, suggesting that the overall model was statistically significant at the α = .05 level.
Of the key predictor variables of interest, only dyslipidemia was found to predict elevated eosinophil levels. Patients with a diagnosis of dyslipidemia were found to have nearly 4 times greater likelihood of having elevated eosinophil levels compared with patients without dyslipidemia (odds ratio 3.88, 95% confidence interval: 1.04-14.43). Patients with malignancy or a history of asthma, allergy, or atopy were not found to have significantly different odds of having elevated eosinophil levels compared with baseline within the study population.
Discussion
High proportions of elevated eosinophil levels among VASDHS patients were found to be geographically concentrated at sites that included Imperial Valley, Oceanside, and Mission Valley. Although initial exploratory Pearson χ2 tests did not accommodate for multiple comparisons, a particularly consistent finding was that the proportion of patients with elevated eosinophil levels seemed to be notably high at the Imperial Valley site in particular, which corresponded with the clinical observations made by physicians.
It was initially thought that the elevated eosinophil levels might be due to exposure to geographically distributed pathogens, such as C immitis, but there were no clinically diagnosed cases in the population studied. However, it also is true that no C immitis serologies or other parasitic serologies were ordered for the patients during the study period. In the context of possible undertesting and underdiagnosis of coccidioidomycosis, it may be possible that these cases were simply missed.
Nonetheless, alternative explanations for elevated eosinophil levels also must be considered. Of the possible explanatory exposures considered, only dyslipidemia was found to be statistically significant in the study population. Patients with dyslipidemia had 4 times greater odds of also having elevated eosinophil levels compared with those who did not have dyslipidemia, which is in line with recent literature identifying conditions such as dyslipidemia and diabetes mellitus as independent predictors of elevated eosinophil levels.6
In light of the known high rates of obesity in the Imperial Valley in comparison with rates of obesity in San Diego County from previous studies and questionnaires, the increased levels of dyslipidemia in the Imperial Valley compared with those of the other sites included in the study may help explain the geographic distribution of observed elevated eosinophil levels.7,8 Although data on dyslipidemia rates among study participants at sites other than Imperial Valley were not collected for this study, this explanation represents a promising area of further investigation.
Furthermore, although about 50% of the population in the Imperial Valley had CBCs with eosinophil levels > 3%, only 5% of the population was found to have eosinophilia based on absolute eosinophil counts, and all such cases were mild. Although excluding infection or other causes of elevated eosinophil levels is difficult, it is reasonable to believe that such low-grade elevations that do not meet the criteria for true eosinophilia may be more consistent with chronic processes, such as dyslipidemia, as opposed to frank infection in which one might expect a morerobust response.
Limitations
The cause of this phenomenon is not yet clear, with the investigation limited by several factors. Possibly the sample size of 109 patients in the Imperial Valley was not sufficient to capture some causes of elevated eosinophil levels, particularly if the effect size of an exposure is low or the exposure infrequent. Of note, no cases of HIV, C immitis infection, or other parasitic infections were observed. Furthermore, only 3 cases of malignancy and 17 cases of asthma, allergies, and/or atopy were identified. Malignancy, asthma, and allergy and/or atopy were not statistically significant as predictors of eosinophilia at the α = .05 level, although the analysis of these variables was likely limited by the small number of patients with these conditions in the sample population. While all these exposures are known to be associated with eosinophilia in the literature, none were identified as predictors in the logistic regression model, likely due, in part, to the limited sample size.
Given the high proportion of the Imperial Valley population with elevated eosinophil levels compared with those of all other sites investigated, a rare or subtle exposure of the types noted would be less likely to explain such a large difference. It is important to look more carefully at a number of possible factors—including gathering more detailed data on dyslipidemia and C immitis infection rates among other possible contributors—to determine more precisely the cause of the notably elevated eosinophil levels in this and other sites in the region.
Conclusion
Using a convenience sample of the VA population based on routine laboratory testing, this study has established that geographically distributed elevated eosinophil levels can be identified in the San Diego region. However, it is less clear why notably elevated eosinophil levels were found at these sites. Although there was no evidence of a correlation between certain environmental factors and elevated eosinophil levels, this may have been due to insufficiently detailed consideration of environmental factors.
Logistic regression analysis associated dyslipidemia with a notably increased risk of elevated eosinophil levels in the Imperial Valley population, but it would be premature to conclude that this association is necessarily causal. Further research would help elucidate this. Increasing the investigational time frame and a chart review of additional sites could provide informative data points for analysis and would allow for a more in-depth comparison between sites. More immediately, given the possibility that dyslipidemia may be a source of the observed elevated eosinophil levels in the Imperial Valley population, it would be worth investigating the rates of dyslipidemia at comparison sites to see whether the lower rates of elevated eosinophil levels at these other sites correspond to lower rates of dyslipidemia.
In future work, it may be valuable to test the study population for C immitis, given the prevalence of the fungus in the area and the concern among many public health professionals of its undertesting and underdiagnosis. Because many cases of C immitis are subclinical, it may be worth investigating whether these are being missed and to what degree such cases might be accompanied by elevations in eosinophil levels.
Given that much remains unknown regarding the causes of elevated eosinophil levels in the Imperial Valley and other sites in the region, further study of such elevations across sites and over time—as well as careful consideration of noninfectious causes of elevated eosinophil levels, such as dyslipidemia—may be of important value to both local clinicians and public health professionals in this region. ˜
Acknowledgments
The authors thank Ms. Robin Nuspl and Mr. Ben Clark for their assistance with the data and guidance. The authors also are grateful to the staff members at the VA San Diego Healthcare System for their many contributions to this project.
1. Tefferi A. Blood eosinophilia: a new paradigm in disease classification, diagnosis, and treatment. Mayo Clin Proc. 2005;80(1):75-83.
2. Wardlaw AJ. Eosinophils and their disorders. In: Kaushansky K, Lichtman MA, Beutler E, Kipps TJ, Seligsohn U, Prchal JT, eds. Williams Hematology. 8th ed. New York, NY: The McGraw-Hill Companies; 2010:897-914.
3. MacLean ML. The epidemiology of coccidioidomycosis—15 California counties, 2007-2011. http://vfce.arizona.edu/sites/vfce/files/the_epidemiology_of_coccidioidomycosis_collaborative_county_report.pdf. Published January 22, 2014. Accessed February 28, 2017.
4. Guarner J, Matilde-Nava T, Villaseñor-Flores R, Sanchez-Mejorada G. Frequency of intestinal parasites in adult cancer patients in Mexico. Arch Med Res. 1997;28(2):219-222.
5. Tanaka M, Fukui M, Tomiyasu K, et al. Eosinophil count is positively correlated with coronary artery calcification. Hypertens Res. 2012;35(3):325-328.
6. Altas Y, Kurtoglu E, Yaylak B, et al. The relationship between eosinophilia and slow coronary flow. Ther Clin Risk Manag. 2015;11:1187-1191.
7. Imperial County Comprehensive Economic Development Strategy Committee. Imperial County Comprehensive Economic Development Strategy: 2014-2015 Annual Update. http://www.co.imperial.ca.us/announcements/PDFs/2014-2015FinalCEDS.pdf. Accessed March 6, 2017.
8. California Health Interview Survey. CHIS 2009 Adult Public Use File. Version November 2012 [computer file]. Los Angeles, CA: UCLA Center for Health Policy Research, November 2012. http://healthpolicy.ucla.edu/chis/data/public-use-data-file/Pages/2009.aspx. Accessed March 29, 2016. 9. Roufosse F, Weller PF. Practical approach to the patient with hypereosinophilia. J Allergy Clin Immun. 2010;126(1):39-44.
Electronic Health Record Implementation Is Associated With a Negligible Change in Outpatient Volume and Billing
Take-Home Points
- With EHR implementation there are small changes in the level of billing coding.
- Although these changes may be statistically significant they are relatively minor.
- In the general internal medicine department, level 4 coding increased by 1.2% while level 3 coding decreased by 0.5%.
- In the orthopedics department, level 4 coding increased by 3.3% while level 3 coding decreased by 3.1%.
- Reports in the lay media regarding dramatic up-coding after EHR implementation may be misleading.
The Health Information Technology for Economic and Clinical Health (HITECH) Act, which was signed into law in 2009, mandated that hospitals that care for Medicare patients either begin using electronic health records (EHRs) or pay a nontrivial penalty.1 By now, the majority of orthopedic surgeons have implemented EHRs in their practices.2 Despite ongoing debate in the orthopedic literature,3 EHRs are expected to improve coordination of care, reduce duplicate testing, and reduce costs over the long term as healthcare insurance coverage is extended to millions more Americans.
In early coverage, however, media reported that EHR implementation at some hospitals was correlated with substantial increases in Medicare payments.4 Journalists suggested the billion dollars more paid by Medicare to hospitals in 2010 than in 2005 were partly attributable to up-coding facilitated by EHRs.5 The secretary of the Department of Health and Human Services (DHHS) and the attorney general of the Department of Justice also weighed in on this controversy by expressing their concerns in a letter to the presidents of 5 hospital associations.6 The inspector general of DHHS also published a report critical of Medicare officials’ oversight of EHRs.7Responding to the critical reception of EHR implementations, investigators studied the validity of the early reports and anecdotes. Some initial reports cited the emergency department (ED) as an area at high risk for using the convenience of EHRs to up-code visits.5 The DHHS Office of the Inspector General noted that, between 2001 and 2010, the proportion of claims for lower reimbursement categories of American Medical Association Current Procedural Terminology (CPT) codes decreased while the proportion for higher-paid billing codes increased for all visit types.8 Addressing these concerns, the American Hospital Association9 issued a brief that noted that any observed coding increases were more likely attributable to more ED use by Medicare patients and increased average illness severity. In a thoughtful perspective, Pitts10 conceded that, though utilization and illness severity may explain part of the trend, the trend may also be related to technological innovations and changes in culture and practice style in the ED.
Because these studies and reports variously suggested that EHR implementation affects patient volume and up-coding, and because none of the reports specifically addressed orthopedics, we conducted a study to determine whether any significant up-coding or change in patient volumes occurred around the time of EHR implementation in ambulatory practices at our academic medical center. In a recent national study, Adler-Milstein and Jha11 compared billing data of hospitals that adopted EHRs and hospitals that did not. Although both groups showed increased billing trends, the increases were not significantly different between the EHR adopters and nonadopters. To more effectively control for the confounding differences between groups of EHR adopters and nonadopters, we studied individual departments during EHR implementation at our institution.
Methods
In 2011, our academic medical center began the transition to EHRs (Epic). We examined our center’s trends in patient volumes and billing coding around the time of the transition in the outpatient practice of the general internal medicine (GIM) department (EHR transition, October 2011) and the outpatient practice of the orthopedics department (EHR transition, March 2012). These departments were chosen because they are representative of a GIM practice and a subspecialty practice, and because a recent study found that GIM practitioners and orthopedic surgeons were among those specialists who used EHRs the most.12
After this study was approved by our Human Investigations Committee, we began using CPT codes to identify all outpatient visits (new, consultation, and return) on a monthly basis. We compared the volume of patient visits and the billing coding level in the GIM and orthopedics departments before and after EHR implementation. Pearson χ2 test was used when appropriate, and statistical analyses were performed with SPSS for Windows Version 16.0.
Results
In the GIM department, mean monthly volume of patient visits in the 12 months before EHR implementation was similar to that in the 12 months afterward (613 vs 587; P = .439). Even when normalized for changes in provider availability (maternity leave), the decrease in volume of patient visits after EHR implementation in the GIM department was not significant (6.9%; P = .107). Likewise, in the orthopedics department, mean monthly volume of patient visits in the 17 months before EHR implementation was similar to that in the 7 months afterward (2157 vs 2317; P = .156). In fact, patient volumes remained constant during the EHR transition (Figure 1).
EHR implementation brought small changes in billing coding levels. In the GIM department, the largest change was a 1.2% increase in level 4 billing coding—an increase accompanied by a 0.5% decrease in level 3 coding. 
Discussion
It is remarkable that the volumes of patient visits in the GIM and orthopedics departments at our academic center were not affected by EHR implementation. 
Rather than reduce scheduling during the EHR transition, surgeons in our practice either added or lengthened clinic sessions, and the level of ancillary staffing was adjusted accordingly. As staffing costs at any given time are multifactorial and vary widely, estimating the cost of these staffing changes during the EHR transition is difficult. We should note that extending ancillary staff hours during the transition very likely increased costs, and it is unclear whether they were higher or lower than the costs that would have been incurred had we reduced scheduling or tried some combination of these strategies.
Although billing coding levels changed with EHR implementation, the changes were small. In the GIM department, level 4 CPT coded visits as percentages of all visits increased to 59.5% from 58.3%, and level 5 visits increased to 6.2% from 6.0%; in the orthopedics department, level 4 visits increased to 40.2% from 37.1%, and level 5 visits increased to 5.5% from 3.8% (Table). The 1.2% and 0.2% absolute increases in level 4 and level 5 visits in the GIM department represent 2.1% and 3.3% relative increases in level 4 and level 5 visits, and the 3.3% and 1.7% absolute increases in the orthopedics department represent 8.4% and 44.7% relative increases in level 4 and level 5 visits after EHR implementation.
Although the absolute increases in level 4 and level 5 visits were relatively minor, popular media have raised the alarm about 43% and 82% relative increases in level 5 visits after EHR implementation in some hospitals’ EDs.4 Although our orthopedics department showed a 44.7% relative increase in level 5 visits after EHR implementation, this represented an increase of only 1.7% of patient visits overall. Our findings therefore indicate that lay media reports could be misleading. Nevertheless, the small changes we found were statistically significant.
One explanation for these small changes is that EHRs facilitate better documentation of services provided. Therefore, what seem to be billing coding changes could be more accurate reports of high-level care that is the same as before. In addition, because of meaningful use mandates that coincided with the requirement to implement EHRs, additional data elements are now being consistently collected and reviewed (these may not necessarily have been collected and reviewed before). In some patient encounters, these additional data elements may have contributed to higher levels of service, and this effect could be especially apparent in EDs.
Some have suggested a potential for large-scale up-coding during EHR transitions. Others have contended that coding level increases are a consequence of a time-intensive data entry process, collection and review of additional data, and more accurate reporting of services already being provided. We are not convinced that large coding changes are attributable solely to EHR implementation, as the changes at our center have been relatively small.
Nevertheless, minor coding level changes could translate to large changes in healthcare costs when scaled nationally. Although causes may be innocuous, any increases in national healthcare costs are concerning in our time of limited budgets and scrutinized healthcare utilization.
This study had its limitations. First, including billing data from only 2 departments at a single center may limit the generalizability of findings. However, we specifically selected a GIM department and a specialty (orthopedics) department in an attempt to capture a representative sample of practices. Another limitation is that we investigated billing codes over only 2 years, around the implementation of EHRs in these departments, and therefore may have captured only short-term changes. However, as patient volumes and billing are subject to many factors, including staffing changes (eg, new partners, new hires, retirements, other departures), we attempted to limit the effect of confounding variables by limiting the period of analysis.
Overall, changes in patient volume and coded level of service during EHR implementation at our institution were relatively small. Although the trend toward higher billing coding levels was statistically significant, these 0.2% and 1.7% increases in level 5 coding hardly deserve the negative attention from lay media. These small increases are unlikely caused by intentional up-coding, and more likely reflect better documentation of an already high level of care. We hope these findings allay the concern that up-coding increased dramatically with EHR implementation.
Am J Orthop. 2017;46(3):E172-E176. Copyright Frontline Medical Communications Inc. 2017. All rights reserved.
1. Centers for Medicare & Medicaid Services. Electronic health records (EHR) incentive programs. http://www.cms.gov/Regulations-and-Guidance/Legislation/EHRIncentivePrograms. Accessed February 5, 2015.
2. American Academy of Orthopaedic Surgeons Practice Management Committee. EMR: A Primer for Orthopaedic Surgeons. 2nd ed. Rosemont, IL: American Academy of Orthopaedic Surgeons; 2010.
3. Ries MD. Electronic medical records: friends or foes? Clin Orthop Relat Res. 2014;472(1):16-21.
4. Abelson R. Medicare is faulted on shift to electronic records. New York Times. November 29, 2012;B1. http://www.nytimes.com/2012/11/29/business/medicare-is-faulted-in-electronic-medical-records-conversion.html. Accessed February 5, 2015.
5. Abelson R, Creswell J, Palmer G. Medicare bills rise as records turn electronic. New York Times. September 22, 2012;A1. http://www.nytimes.com/2012/09/22/business/medicare-billing-rises-at-hospitals-with-electronic-records.html. Accessed February 5, 2015.
6. Carlson J. Warning bell. Potential for fraud through use of EHRs draws federal scrutiny. Mod Healthc. 2012;42(40):8-9.
7. Levinson DR. Early assessment finds that CMS faces obstacles in overseeing the Medicare EHR Incentive Program. Dept of Health and Human Services, Office of Inspector General website. https://oig.hss.gov/oei/reports/oei-05-11-00250.pdf. Publication OEI-05-11-00250. Published November 2012. Accessed February 5, 2015.
8. Levinson DR. Coding trends of Medicare evaluation and management services. Dept of Health and Human Services, Office of Inspector General website. https://oig.hhs.gov/oei/reports/oei-04-10-00180.pdf. Publication OEI-04-10-00180. Published May 2012. Accessed February 5, 2015.
9. American Hospital Association. Sicker, more complex patients are driving up intensity of ED care [issue brief]. http://www.aha.org/content/13/13issuebrief-ed.pdf. Published May 2, 2013. Accessed February 5, 2015.
10. Pitts SR. Higher-complexity ED billing codes—sicker patients, more intensive practice, or improper payments? N Engl J Med. 2012;367(26):2465-2467.
11. Adler-Milstein J, Jha AK. No evidence found that hospitals are using new electronic health records to increase Medicare reimbursements. Health Aff (Millwood). 2014;33(7):1271-1277.
12. Kokkonen EW, Davis SA, Lin HC, Dabade TS, Feldman SR, Fleischer AB Jr. Use of electronic medical records differs by specialty and office settings. J Am Med Inform Assoc. 2013;20(e1):e33-e38.
13. Samaan ZM, Klein MD, Mansour ME, DeWitt TG. The impact of the electronic health record on an academic pediatric primary care center. J Ambul Care Manage. 2009;32(3):180-187.
Take-Home Points
- With EHR implementation there are small changes in the level of billing coding.
- Although these changes may be statistically significant they are relatively minor.
- In the general internal medicine department, level 4 coding increased by 1.2% while level 3 coding decreased by 0.5%.
- In the orthopedics department, level 4 coding increased by 3.3% while level 3 coding decreased by 3.1%.
- Reports in the lay media regarding dramatic up-coding after EHR implementation may be misleading.
The Health Information Technology for Economic and Clinical Health (HITECH) Act, which was signed into law in 2009, mandated that hospitals that care for Medicare patients either begin using electronic health records (EHRs) or pay a nontrivial penalty.1 By now, the majority of orthopedic surgeons have implemented EHRs in their practices.2 Despite ongoing debate in the orthopedic literature,3 EHRs are expected to improve coordination of care, reduce duplicate testing, and reduce costs over the long term as healthcare insurance coverage is extended to millions more Americans.
In early coverage, however, media reported that EHR implementation at some hospitals was correlated with substantial increases in Medicare payments.4 Journalists suggested the billion dollars more paid by Medicare to hospitals in 2010 than in 2005 were partly attributable to up-coding facilitated by EHRs.5 The secretary of the Department of Health and Human Services (DHHS) and the attorney general of the Department of Justice also weighed in on this controversy by expressing their concerns in a letter to the presidents of 5 hospital associations.6 The inspector general of DHHS also published a report critical of Medicare officials’ oversight of EHRs.7Responding to the critical reception of EHR implementations, investigators studied the validity of the early reports and anecdotes. Some initial reports cited the emergency department (ED) as an area at high risk for using the convenience of EHRs to up-code visits.5 The DHHS Office of the Inspector General noted that, between 2001 and 2010, the proportion of claims for lower reimbursement categories of American Medical Association Current Procedural Terminology (CPT) codes decreased while the proportion for higher-paid billing codes increased for all visit types.8 Addressing these concerns, the American Hospital Association9 issued a brief that noted that any observed coding increases were more likely attributable to more ED use by Medicare patients and increased average illness severity. In a thoughtful perspective, Pitts10 conceded that, though utilization and illness severity may explain part of the trend, the trend may also be related to technological innovations and changes in culture and practice style in the ED.
Because these studies and reports variously suggested that EHR implementation affects patient volume and up-coding, and because none of the reports specifically addressed orthopedics, we conducted a study to determine whether any significant up-coding or change in patient volumes occurred around the time of EHR implementation in ambulatory practices at our academic medical center. In a recent national study, Adler-Milstein and Jha11 compared billing data of hospitals that adopted EHRs and hospitals that did not. Although both groups showed increased billing trends, the increases were not significantly different between the EHR adopters and nonadopters. To more effectively control for the confounding differences between groups of EHR adopters and nonadopters, we studied individual departments during EHR implementation at our institution.
Methods
In 2011, our academic medical center began the transition to EHRs (Epic). We examined our center’s trends in patient volumes and billing coding around the time of the transition in the outpatient practice of the general internal medicine (GIM) department (EHR transition, October 2011) and the outpatient practice of the orthopedics department (EHR transition, March 2012). These departments were chosen because they are representative of a GIM practice and a subspecialty practice, and because a recent study found that GIM practitioners and orthopedic surgeons were among those specialists who used EHRs the most.12
After this study was approved by our Human Investigations Committee, we began using CPT codes to identify all outpatient visits (new, consultation, and return) on a monthly basis. We compared the volume of patient visits and the billing coding level in the GIM and orthopedics departments before and after EHR implementation. Pearson χ2 test was used when appropriate, and statistical analyses were performed with SPSS for Windows Version 16.0.
Results
In the GIM department, mean monthly volume of patient visits in the 12 months before EHR implementation was similar to that in the 12 months afterward (613 vs 587; P = .439). Even when normalized for changes in provider availability (maternity leave), the decrease in volume of patient visits after EHR implementation in the GIM department was not significant (6.9%; P = .107). Likewise, in the orthopedics department, mean monthly volume of patient visits in the 17 months before EHR implementation was similar to that in the 7 months afterward (2157 vs 2317; P = .156). In fact, patient volumes remained constant during the EHR transition (Figure 1).
EHR implementation brought small changes in billing coding levels. In the GIM department, the largest change was a 1.2% increase in level 4 billing coding—an increase accompanied by a 0.5% decrease in level 3 coding.
Discussion
It is remarkable that the volumes of patient visits in the GIM and orthopedics departments at our academic center were not affected by EHR implementation.
Rather than reduce scheduling during the EHR transition, surgeons in our practice either added or lengthened clinic sessions, and the level of ancillary staffing was adjusted accordingly. As staffing costs at any given time are multifactorial and vary widely, estimating the cost of these staffing changes during the EHR transition is difficult. We should note that extending ancillary staff hours during the transition very likely increased costs, and it is unclear whether they were higher or lower than the costs that would have been incurred had we reduced scheduling or tried some combination of these strategies.
Although billing coding levels changed with EHR implementation, the changes were small. In the GIM department, level 4 CPT coded visits as percentages of all visits increased to 59.5% from 58.3%, and level 5 visits increased to 6.2% from 6.0%; in the orthopedics department, level 4 visits increased to 40.2% from 37.1%, and level 5 visits increased to 5.5% from 3.8% (Table). The 1.2% and 0.2% absolute increases in level 4 and level 5 visits in the GIM department represent 2.1% and 3.3% relative increases in level 4 and level 5 visits, and the 3.3% and 1.7% absolute increases in the orthopedics department represent 8.4% and 44.7% relative increases in level 4 and level 5 visits after EHR implementation.
Although the absolute increases in level 4 and level 5 visits were relatively minor, popular media have raised the alarm about 43% and 82% relative increases in level 5 visits after EHR implementation in some hospitals’ EDs.4 Although our orthopedics department showed a 44.7% relative increase in level 5 visits after EHR implementation, this represented an increase of only 1.7% of patient visits overall. Our findings therefore indicate that lay media reports could be misleading. Nevertheless, the small changes we found were statistically significant.
One explanation for these small changes is that EHRs facilitate better documentation of services provided. Therefore, what seem to be billing coding changes could be more accurate reports of high-level care that is the same as before. In addition, because of meaningful use mandates that coincided with the requirement to implement EHRs, additional data elements are now being consistently collected and reviewed (these may not necessarily have been collected and reviewed before). In some patient encounters, these additional data elements may have contributed to higher levels of service, and this effect could be especially apparent in EDs.
Some have suggested a potential for large-scale up-coding during EHR transitions. Others have contended that coding level increases are a consequence of a time-intensive data entry process, collection and review of additional data, and more accurate reporting of services already being provided. We are not convinced that large coding changes are attributable solely to EHR implementation, as the changes at our center have been relatively small.
Nevertheless, minor coding level changes could translate to large changes in healthcare costs when scaled nationally. Although causes may be innocuous, any increases in national healthcare costs are concerning in our time of limited budgets and scrutinized healthcare utilization.
This study had its limitations. First, including billing data from only 2 departments at a single center may limit the generalizability of findings. However, we specifically selected a GIM department and a specialty (orthopedics) department in an attempt to capture a representative sample of practices. Another limitation is that we investigated billing codes over only 2 years, around the implementation of EHRs in these departments, and therefore may have captured only short-term changes. However, as patient volumes and billing are subject to many factors, including staffing changes (eg, new partners, new hires, retirements, other departures), we attempted to limit the effect of confounding variables by limiting the period of analysis.
Overall, changes in patient volume and coded level of service during EHR implementation at our institution were relatively small. Although the trend toward higher billing coding levels was statistically significant, these 0.2% and 1.7% increases in level 5 coding hardly deserve the negative attention from lay media. These small increases are unlikely caused by intentional up-coding, and more likely reflect better documentation of an already high level of care. We hope these findings allay the concern that up-coding increased dramatically with EHR implementation.
Am J Orthop. 2017;46(3):E172-E176. Copyright Frontline Medical Communications Inc. 2017. All rights reserved.
1. Centers for Medicare & Medicaid Services. Electronic health records (EHR) incentive programs. http://www.cms.gov/Regulations-and-Guidance/Legislation/EHRIncentivePrograms. Accessed February 5, 2015.
2. American Academy of Orthopaedic Surgeons Practice Management Committee. EMR: A Primer for Orthopaedic Surgeons. 2nd ed. Rosemont, IL: American Academy of Orthopaedic Surgeons; 2010.
3. Ries MD. Electronic medical records: friends or foes? Clin Orthop Relat Res. 2014;472(1):16-21.
4. Abelson R. Medicare is faulted on shift to electronic records. New York Times. November 29, 2012;B1. http://www.nytimes.com/2012/11/29/business/medicare-is-faulted-in-electronic-medical-records-conversion.html. Accessed February 5, 2015.
5. Abelson R, Creswell J, Palmer G. Medicare bills rise as records turn electronic. New York Times. September 22, 2012;A1. http://www.nytimes.com/2012/09/22/business/medicare-billing-rises-at-hospitals-with-electronic-records.html. Accessed February 5, 2015.
6. Carlson J. Warning bell. Potential for fraud through use of EHRs draws federal scrutiny. Mod Healthc. 2012;42(40):8-9.
7. Levinson DR. Early assessment finds that CMS faces obstacles in overseeing the Medicare EHR Incentive Program. Dept of Health and Human Services, Office of Inspector General website. https://oig.hss.gov/oei/reports/oei-05-11-00250.pdf. Publication OEI-05-11-00250. Published November 2012. Accessed February 5, 2015.
8. Levinson DR. Coding trends of Medicare evaluation and management services. Dept of Health and Human Services, Office of Inspector General website. https://oig.hhs.gov/oei/reports/oei-04-10-00180.pdf. Publication OEI-04-10-00180. Published May 2012. Accessed February 5, 2015.
9. American Hospital Association. Sicker, more complex patients are driving up intensity of ED care [issue brief]. http://www.aha.org/content/13/13issuebrief-ed.pdf. Published May 2, 2013. Accessed February 5, 2015.
10. Pitts SR. Higher-complexity ED billing codes—sicker patients, more intensive practice, or improper payments? N Engl J Med. 2012;367(26):2465-2467.
11. Adler-Milstein J, Jha AK. No evidence found that hospitals are using new electronic health records to increase Medicare reimbursements. Health Aff (Millwood). 2014;33(7):1271-1277.
12. Kokkonen EW, Davis SA, Lin HC, Dabade TS, Feldman SR, Fleischer AB Jr. Use of electronic medical records differs by specialty and office settings. J Am Med Inform Assoc. 2013;20(e1):e33-e38.
13. Samaan ZM, Klein MD, Mansour ME, DeWitt TG. The impact of the electronic health record on an academic pediatric primary care center. J Ambul Care Manage. 2009;32(3):180-187.
Blood Loss and Need for Blood Transfusions in Total Knee and Total Hip Arthroplasty
The number of patients who undergo total knee arthroplasty (TKA) and total hip arthroplasty (THA) procedures has significantly increased over the past 2 to 3 decades. As life expectancy in the U.S. increases and medical advances allow patients with preexisting conditions to successfully undergo joint replacements, the demand for these procedures is expected to grow.1 In 2010, the CDC estimated that 719,000 patients underwent TKA procedures and 332,000 patients underwent THA procedures in the U.S.2 Kurtz and colleagues have projected that by 2030 the annual number of TKA procedures will increase to 3.5 million and the number of THA procedures will increase to 572,000.1
Although becoming more prevalent, these procedures are still associated with considerable intra- and postoperative blood loss that may lead to complications and blood transfusions.3 Previous studies have shown that perioperative anemia and red blood cell transfusions are associated with negative outcomes, including increased health care resource utilization; length of hospitalization; pulmonary, septic, wound, or thromboembolic complications; and mortality.4,5
In order to prevent excessive blood loss during TKA and THA procedures, antifibrinolytic agents, such as tranexamic acid, have been used. Tranexamic acid is a synthetic form of lysine that binds to the lysine-binding sites on plasminogen and slows the conversion of plasminogen to plasmin. This interaction inhibits fibrinolysis and theoretically decreases bleeding.6 Because tranexamic acid is an antifibrinolytic, its mechanism of action has raised concerns that it could increase the risk of clotting complications, such as venous thromboembolism and myocardial infarction.7
Several published meta-analyses and systematic reviews have shown that tranexamic acid reduces blood loss in patients undergoing orthopedic surgery. Despite positive results, many study authors have acknowledged limitations in their analyses, such as heterogeneity of study results, small trial size, and varied dosing strategies.3,7-12 There is no FDA-approved tranexamic acid dosing strategy for orthopedic procedures; therefore, its use in TKA and THA procedures is off label. This lack of guidance results in the medication being used at varied doses, timing of doses, and routes of administration with no clear dosing strategy showing the best outcomes.
Tranexamic acid was first used in TKA and THA surgical procedures at the Sioux Falls VA Health Care System (SFVAHCS) in South Dakota in October 2012. The dose used during these procedures was 1 g IV at first surgical incision and 1 g IV at incision closure. The objective of this study was to determine whether this tranexamic acid dosing strategy utilized at SFVAHCS safely improved outcomes related to blood loss.
Methods
A single-center retrospective chart review was performed on all patients who underwent TKA and THA procedures by 4 orthopedic surgeons between January 2010 and August 2015 at SFVAHCS. This study received approval by the local institutional review board and research and development committee in September 2015.
Patients were included in the study if they were aged ≥ 18 years and underwent primary unilateral TKA or THA procedures during the study time frame. Patients were excluded if they underwent bilateral or revision TKA or THA procedures, did not have recorded blood loss measurements during and/or after the procedure, or did not receive tranexamic acid between October 2012 and August 2015 at the standard dosing strategy utilized at SFVAHCS.
Patients who underwent surgery between January 2010 and October 2012 and did not receive tranexamic acid were included in the control groups. The treatment groups contained patients who underwent surgery between October 2012 and August 2015 and received tranexamic acid at the standard SFVAHCS dosing strategy. Patients in the control and treatment groups were divided and compared with patients who underwent the same type of surgery.
The primary endpoint of this study was total blood loss, which included intraoperative and postoperative blood loss. Intraoperative blood loss was measured by a suctioning device that the surgical physician’s assistant used to keep the surgical site clear of bodily fluids. The suctioning device collected blood as well as irrigation fluids used throughout the surgical procedure. The volume of irrigation fluids used during the procedure was subtracted from the total volume collected by the suctioning device to estimate the total blood volume lost during surgery. Sponges and other surgical materials that may have collected blood were not included in the intraoperative blood loss calculation. Postoperative blood loss was collected by a drain that was placed in the surgical site prior to incision closure. The drain collected postoperative blood loss until it was removed 1 day after surgery.
The secondary endpoints for the study were changes in hemoglobin (Hgb) and hematocrit (Hct) from before surgery to after surgery. These changes were calculated by subtracting the lowest measured postoperative Hgb or Hct level within 21 days postsurgery from the closest measured Hgb or Hct level obtained presurgery.
Follow-up appointments were routinely conducted 2 weeks after surgery, so the 21-day time frame would include any laboratory results drawn at these appointments. Other secondary endpoints included the number of patients receiving at least 1 blood transfusion during hospitalization and the number of patients experiencing clotting complications within 30 days of surgery. Postoperative and progress notes were reviewed by a single study investigator in order to record blood transfusions and clotting complications.
All patients who underwent TKA or THA procedures were instructed to stop taking antiplatelet agents 7 days prior to surgery and warfarin 5 days prior to surgery. If patients were determined to be at high risk for thromboembolic complications following warfarin discontinuation, therapeutic doses of low-molecular weight heparin or unfractionated heparin were used as a bridging therapy pre- and postsurgery. Enoxaparin 30 mg twice daily was started the day after surgery in all patients not previously on warfarin therapy prior to surgery to prevent clotting complications. If a patient was on warfarin therapy prior to the procedure but not considered to be at high risk of thromboembolic complications by the surgeon, warfarin was restarted after surgery, and enoxaparin 30 mg twice daily was used until therapeutic international normalized ratio values were obtained. If the patient had ongoing bleeding after the procedure or was determined to be at high risk for bleeding complications, the provider may have delayed anticoagulant use.
Some patients who underwent TKA or THA procedures during the study time frame received periarticular pain injections during surgery. These pain injections included a combination of ropivacaine 200 mg, ketorolac 30 mg, epinephrine 0.5 mg, and clonidine 0.08 mg and were compounded in a sterile mixture with normal saline. Several injections of this mixture were administered into the surgical site to reduce postoperative pain. These periarticular pain injections were first implemented into TKA and THA procedures in August 2012 and were used in patients at the surgeon’s discretion.
Baseline characteristics were analyzed using a chi-square test for categoric variables and an unpaired t test for continuous variables to determine whether any differences were present. Total blood loss, change in Hgb, and change in Hct were analyzed using an unpaired t test. Patients receiving at least 1 blood transfusion during hospitalization and patients experiencing a clotting complication were analyzed using a chi-square test. P values < .05 were considered to indicate statistical significance. Descriptive statistics were calculated using Microsoft Excel (Redmond, WA), and GraphPad Prism (La Jolla, CA) was used for all statistical analyses.
Results
Initially, a total of 443 TKA patients and 111 THA patients were reviewed. Of these patients, 418 TKA patients and 100 THA patients met the inclusion criteria. Due to the retrospective design of this study, not all of the baseline characteristics were equal between groups (Table 1). Most notably, the number of patients who received the periarticular pain injection and the distribution of surgeons performing the procedures were different between groups in both the TKA and THA procedures.
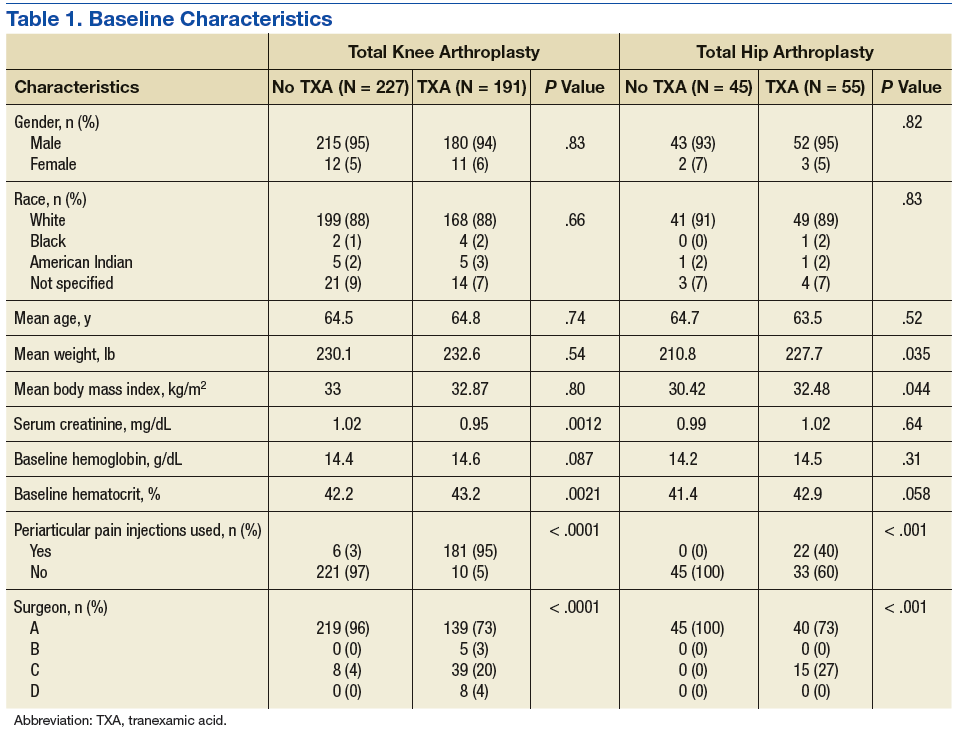
Baseline Hgb levels were not found to be different between groups in either type of procedure; however, the baseline Hct levels of patients undergoing TKA who received tranexamic acid were found to be statistically higher when compared with those who did not receive tranexamic acid. Other baseline characteristics with statistically higher values included average weight and BMI in patients who received tranexamic acid and underwent THA and serum creatinine in patients who did not receive tranexamic acid and underwent TKA.
In the primary analysis (Tables 2 and 3), the mean estimated total blood loss in TKA patients was lower in patients who received tranexamic acid than it was in the control group (339.4 mL vs 457.4 mL, P < .001). Patients who underwent THA receiving tranexamic acid similarly had significantly less total blood loss than that of the control group (419.7 mL vs 585.7 mL, P < .001). Consistent with previous studies, patients undergoing TKA procedures in the treatment group when compared to the control group, respectively, were likely to have more blood loss postoperatively (275.9 mL vs 399.7 mL) than intraoperatively (63.5 mL vs 57.7 mL) regardless of tranexamic acid administration.6 On the other hand, patients who had undergone THA were more likely to experience more intraoperative blood loss (281.6 mL in treatment group vs 328.9 mL in control group) than postoperative blood loss (138.1 mL in treatment group vs 256.8 mL in control group) regardless of tranexamic acid administration.
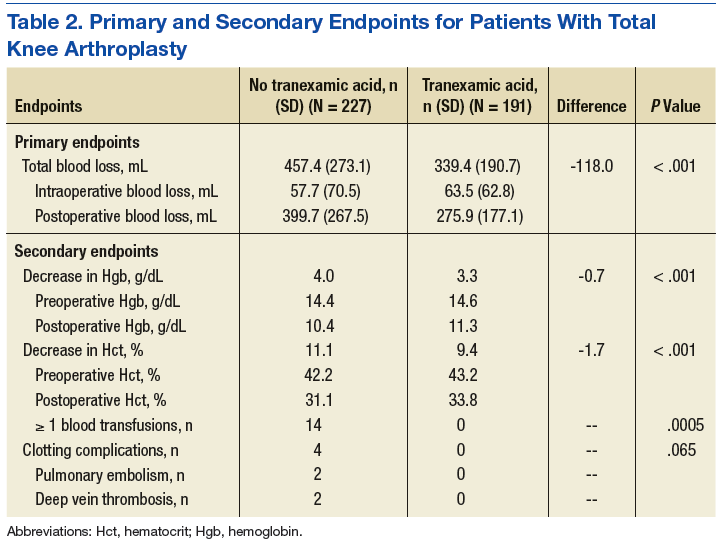
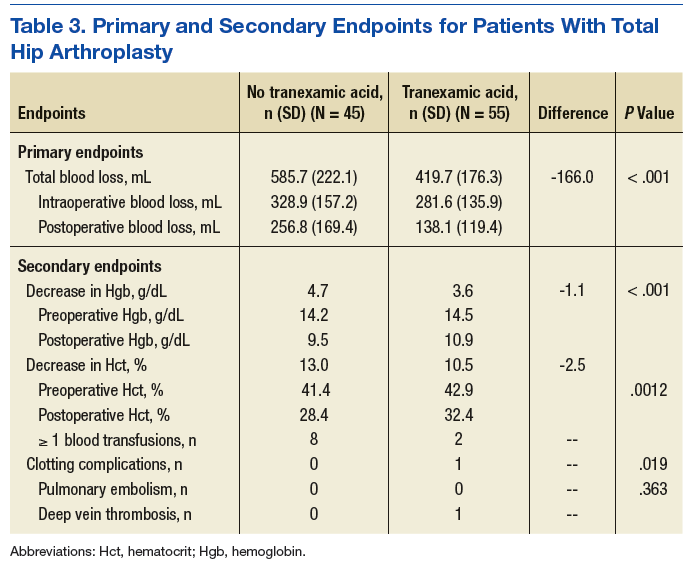
In the secondary analysis, the change between preoperative and postoperative Hgb and Hct had results consistent with the total blood loss results. Patients receiving tranexamic acid in TKA procedures had a lower decrease in Hgb compared with the control group (3.3 mg/dL vs 4.0 mg/dL, P < .001). Similarly, patients undergoing TKA who received tranexamic acid had a smaller decrease in Hct than that of the control group (9.4% vs 11.1%, P < .001). Consistent with the TKA procedure results, patients undergoing THA who received tranexamic acid had a smaller decrease in Hgb (3.6 mg/dL vs 4.7 mg/dL, P < .001) and Hct (10.5% vs 13.0%, P = .0012) than that of the control group.
Patients who did not receive tranexamic acid were more likely to require at least 1 blood transfusion than were patients who received tranexamic acid in TKA (14 patients vs 0 patients, P = .0005) and THA procedures (8 patients vs 2 patients, P = .019). Despite the theoretically increased likelihood of clotting complications with tranexamic acid, no significant differences were observed between the treatment and control groups in either TKA (0 vs 4, P = .065) or THA (1 vs 0, P = .363) procedures.
Discussion
Patients undergoing total joint arthroplasty are at risk for significant blood loss with a potential need for postoperative blood transfusions.6,13 The use of tranexamic acid during these procedures offers a possible solution to decrease blood loss and minimize blood transfusions. This study retrospectively evaluated whether tranexamic acid safely decreased blood loss and the need for blood transfusions at SFVAHCS with the dosing strategy of 1 g IV at first incision and 1 g IV at incision closure.
Patients who received tranexamic acid in TKA and THA procedures had significantly less blood loss than did patients who did not receive tranexamic acid. Patients receiving tranexamic acid also had a significantly lower change from preoperative to postoperative Hgb and Hct levels than did patients who did not receive tranexamic acid in TKA and THA procedures. In addition to decreasing blood loss, the tranexamic acid groups had significantly fewer patients who required blood transfusions than that of the control groups.
This reduction in blood transfusions should be considered clinically significant.
Even though baseline Hct levels were found to be significantly different between the tranexamic acid group and the control group for patients who underwent TKA, medical record documentation indicated that the determination whether postoperative blood transfusions were needed was based primarily on Hgb levels. Baseline Hgb levels were found not to be significantly different between the tranexamic acid and control groups for either TKA or THA procedures. This suggests that at baseline the tranexamic acid and control groups had the same risk of reaching the Hgb threshold where blood transfusions would be required.
There was a significant difference in the proportion of patients receiving the periarticular pain injection of ropivacaine, ketorolac, epinephrine, and clonidine between the groups who received tranexamic acid and those who did not. Originally, this baseline characteristic was theorized to be a major confounder in the primary and secondary analyses because epinephrine is a vasoconstrictor and ketorolac is a reversible antiplatelet agent. However, Vendittoli and colleagues showed that patients receiving these periarticular pain injections during surgery actually had greater total blood loss than did patients who did not receive the injections, although this comparison did not reach statistical significance.14 The Vendittoli and colleagues results suggest that the pain injections did not confound the primary and secondary analyses by aiding in the process of reducing blood loss in these procedures.
Limitations
There are several limitations for extrapolating the results from this study to the general population. Due to the retrospective study design, there was no way to actively control potentially confounding variables during the TKA and THA procedures. Surgeons and surgery teams likely had slightly different techniques and protocols during and after surgery. Several baseline characteristics were not equal between patients who received tranexamic acid and those who did not. Therefore, it is unknown whether these baseline characteristics affected the results of this study. Postoperative anticoagulant use was not recorded and may have differed between study groups, depending on the patient’s risk of thromboembolic complications; however, the drains that collected blood loss were removed prior to the first dose of enoxaparin, which was administered the day after surgery.
Another limitation is that the method of measuring blood loss during and after the procedure was imprecise. Blood not suctioned through the suctioning device during surgery or not collected in the drain after surgery was not measured and may have increased the total blood loss. Hemoglobin and Hct levels also are sensitive to intravascular volume changes. If a patient required more IV fluids during or after a procedure, the fluids may have lowered the Hgb and/or Hct levels by dilution.
Conclusion
This study suggests that using tranexamic acid at a dose of 1 g IV at first incision and 1 g IV at incision closure safely and effectively reduced blood loss and the need for transfusions in patients undergoing TKA and THA procedures at SFVAHCS. Further prospective studies are needed to compare different tranexamic dosing strategies to minimize blood loss during these procedures. ˜
Acknowledgments
This study is the result of work supported with resources and the use of facilities at the Sioux Falls VA Health Care System in South Dakota.
1. Kurtz S, Ong K, Lau E, Mowat F, Halpern M. Projections of primary and revision hip and knee arthroplasty in the United States from 2005 to 2030. J Bone Joint Surg Am. 2007;89(4):780-785.
2. Centers for Disease Control and Prevention. Number of all-listed procedures for discharges from short-stay hospitals, by procedure category and age: United States, 2010. https://www.cdc.gov/nchs/data/nhds/4procedures/2010pro4_numberprocedureage.pdf. Published 2010. Accessed March 15, 2017.
3. Wei Z, Liu M. The effectiveness and safety of tranexamic acid in total hip or knee arthroplasty: a meta-analysis of 2720 cases. Transfus Med. 2015;25(3):151-162.
4. Glance LG, Dick AW, Mukamel DB, et al. Association between intraoperative blood transfusion and mortality and morbidity in patients undergoing noncardiac surgery. Anesthesiology. 2011;114(2):283-292.
5. Wu WC, Smith TS, Henderson WG, et al. Operative blood loss, blood transfusion, and 30-day mortality in older patients after major noncardiac surgery. Ann Surg. 2010;252(1):283-292.
6. Sehat KR, Evans RL, Newman JH. Hidden blood loss following hip and knee arthroplasty. Correct management of blood loss should take hidden loss into account. J Bone Joint Surg Br. 2004;86(4):561-565.
7. Gandhi R, Evans HMK, Mahomed SR, Mahomed NN. Tranexamic acid and the reduction of blood loss in total knee and hip arthroplasty: a meta-analysis. BMC Res Notes. 2013;6:184.
8. Alshryda S, Sarda P, Sukeik M, Nargol A, Blenkinsopp J, Mason JM. Tranexamic acid in total knee replacement: a systematic review and meta-analysis. J Bone Joint Surg Br. 2011;93(12):1577-1585.
9. Yang ZG, Chen WP, Wu LE. Effectiveness and safety of tranexamic acid in reducing blood loss in total knee arthroplasty: a meta-analysis. J Bone Joint Surg Am. 2012;94(13):1153-1159.
10. Tan J, Chen H, Liu Q, Chen C, Huang W. A meta-analysis of the effectiveness and safety of using tranexamic acid in primary unilateral total knee arthroplasty. J Surg Res. 2013;184(2):880-887.
11. Sukeik M, Alshryda S, Haddad FS, Mason JM. Systematic review and meta-analysis of the use of tranexamic acid in total hip replacement. J Bone Joint Surg Br. 2011;93(1):39-46.
12. Zhou XD, Tao LJ, Li J, Wu LD. Do we really need tranexamic acid in total hip arthroplasty? A meta-analysis of nineteen randomized controlled trials. Arch Orthop Trauma Surg. 2013;133(7):1017-1027.
13. Bierbaum BE, Callaghan JJ, Galante JO, Rubash HE, Tooms RE, Welch RB. An analysis of blood management in patients having a total hip or knee arthroplasty. J Bone Joint Surg Am. 1999;81(1):2-10.
14. Vendittoli PA, Makinen P, Drolet P, et al. A multimodal analgesia protocol for total knee arthroplasty: a randomized, controlled study. J Bone Joint Surg Am. 2006;88(2):282-289.
The number of patients who undergo total knee arthroplasty (TKA) and total hip arthroplasty (THA) procedures has significantly increased over the past 2 to 3 decades. As life expectancy in the U.S. increases and medical advances allow patients with preexisting conditions to successfully undergo joint replacements, the demand for these procedures is expected to grow.1 In 2010, the CDC estimated that 719,000 patients underwent TKA procedures and 332,000 patients underwent THA procedures in the U.S.2 Kurtz and colleagues have projected that by 2030 the annual number of TKA procedures will increase to 3.5 million and the number of THA procedures will increase to 572,000.1
Although becoming more prevalent, these procedures are still associated with considerable intra- and postoperative blood loss that may lead to complications and blood transfusions.3 Previous studies have shown that perioperative anemia and red blood cell transfusions are associated with negative outcomes, including increased health care resource utilization; length of hospitalization; pulmonary, septic, wound, or thromboembolic complications; and mortality.4,5
In order to prevent excessive blood loss during TKA and THA procedures, antifibrinolytic agents, such as tranexamic acid, have been used. Tranexamic acid is a synthetic form of lysine that binds to the lysine-binding sites on plasminogen and slows the conversion of plasminogen to plasmin. This interaction inhibits fibrinolysis and theoretically decreases bleeding.6 Because tranexamic acid is an antifibrinolytic, its mechanism of action has raised concerns that it could increase the risk of clotting complications, such as venous thromboembolism and myocardial infarction.7
Several published meta-analyses and systematic reviews have shown that tranexamic acid reduces blood loss in patients undergoing orthopedic surgery. Despite positive results, many study authors have acknowledged limitations in their analyses, such as heterogeneity of study results, small trial size, and varied dosing strategies.3,7-12 There is no FDA-approved tranexamic acid dosing strategy for orthopedic procedures; therefore, its use in TKA and THA procedures is off label. This lack of guidance results in the medication being used at varied doses, timing of doses, and routes of administration with no clear dosing strategy showing the best outcomes.
Tranexamic acid was first used in TKA and THA surgical procedures at the Sioux Falls VA Health Care System (SFVAHCS) in South Dakota in October 2012. The dose used during these procedures was 1 g IV at first surgical incision and 1 g IV at incision closure. The objective of this study was to determine whether this tranexamic acid dosing strategy utilized at SFVAHCS safely improved outcomes related to blood loss.
Methods
A single-center retrospective chart review was performed on all patients who underwent TKA and THA procedures by 4 orthopedic surgeons between January 2010 and August 2015 at SFVAHCS. This study received approval by the local institutional review board and research and development committee in September 2015.
Patients were included in the study if they were aged ≥ 18 years and underwent primary unilateral TKA or THA procedures during the study time frame. Patients were excluded if they underwent bilateral or revision TKA or THA procedures, did not have recorded blood loss measurements during and/or after the procedure, or did not receive tranexamic acid between October 2012 and August 2015 at the standard dosing strategy utilized at SFVAHCS.
Patients who underwent surgery between January 2010 and October 2012 and did not receive tranexamic acid were included in the control groups. The treatment groups contained patients who underwent surgery between October 2012 and August 2015 and received tranexamic acid at the standard SFVAHCS dosing strategy. Patients in the control and treatment groups were divided and compared with patients who underwent the same type of surgery.
The primary endpoint of this study was total blood loss, which included intraoperative and postoperative blood loss. Intraoperative blood loss was measured by a suctioning device that the surgical physician’s assistant used to keep the surgical site clear of bodily fluids. The suctioning device collected blood as well as irrigation fluids used throughout the surgical procedure. The volume of irrigation fluids used during the procedure was subtracted from the total volume collected by the suctioning device to estimate the total blood volume lost during surgery. Sponges and other surgical materials that may have collected blood were not included in the intraoperative blood loss calculation. Postoperative blood loss was collected by a drain that was placed in the surgical site prior to incision closure. The drain collected postoperative blood loss until it was removed 1 day after surgery.
The secondary endpoints for the study were changes in hemoglobin (Hgb) and hematocrit (Hct) from before surgery to after surgery. These changes were calculated by subtracting the lowest measured postoperative Hgb or Hct level within 21 days postsurgery from the closest measured Hgb or Hct level obtained presurgery.
Follow-up appointments were routinely conducted 2 weeks after surgery, so the 21-day time frame would include any laboratory results drawn at these appointments. Other secondary endpoints included the number of patients receiving at least 1 blood transfusion during hospitalization and the number of patients experiencing clotting complications within 30 days of surgery. Postoperative and progress notes were reviewed by a single study investigator in order to record blood transfusions and clotting complications.
All patients who underwent TKA or THA procedures were instructed to stop taking antiplatelet agents 7 days prior to surgery and warfarin 5 days prior to surgery. If patients were determined to be at high risk for thromboembolic complications following warfarin discontinuation, therapeutic doses of low-molecular weight heparin or unfractionated heparin were used as a bridging therapy pre- and postsurgery. Enoxaparin 30 mg twice daily was started the day after surgery in all patients not previously on warfarin therapy prior to surgery to prevent clotting complications. If a patient was on warfarin therapy prior to the procedure but not considered to be at high risk of thromboembolic complications by the surgeon, warfarin was restarted after surgery, and enoxaparin 30 mg twice daily was used until therapeutic international normalized ratio values were obtained. If the patient had ongoing bleeding after the procedure or was determined to be at high risk for bleeding complications, the provider may have delayed anticoagulant use.
Some patients who underwent TKA or THA procedures during the study time frame received periarticular pain injections during surgery. These pain injections included a combination of ropivacaine 200 mg, ketorolac 30 mg, epinephrine 0.5 mg, and clonidine 0.08 mg and were compounded in a sterile mixture with normal saline. Several injections of this mixture were administered into the surgical site to reduce postoperative pain. These periarticular pain injections were first implemented into TKA and THA procedures in August 2012 and were used in patients at the surgeon’s discretion.
Baseline characteristics were analyzed using a chi-square test for categoric variables and an unpaired t test for continuous variables to determine whether any differences were present. Total blood loss, change in Hgb, and change in Hct were analyzed using an unpaired t test. Patients receiving at least 1 blood transfusion during hospitalization and patients experiencing a clotting complication were analyzed using a chi-square test. P values < .05 were considered to indicate statistical significance. Descriptive statistics were calculated using Microsoft Excel (Redmond, WA), and GraphPad Prism (La Jolla, CA) was used for all statistical analyses.
Results
Initially, a total of 443 TKA patients and 111 THA patients were reviewed. Of these patients, 418 TKA patients and 100 THA patients met the inclusion criteria. Due to the retrospective design of this study, not all of the baseline characteristics were equal between groups (Table 1). Most notably, the number of patients who received the periarticular pain injection and the distribution of surgeons performing the procedures were different between groups in both the TKA and THA procedures.
Baseline Hgb levels were not found to be different between groups in either type of procedure; however, the baseline Hct levels of patients undergoing TKA who received tranexamic acid were found to be statistically higher when compared with those who did not receive tranexamic acid. Other baseline characteristics with statistically higher values included average weight and BMI in patients who received tranexamic acid and underwent THA and serum creatinine in patients who did not receive tranexamic acid and underwent TKA.
In the primary analysis (Tables 2 and 3), the mean estimated total blood loss in TKA patients was lower in patients who received tranexamic acid than it was in the control group (339.4 mL vs 457.4 mL, P < .001). Patients who underwent THA receiving tranexamic acid similarly had significantly less total blood loss than that of the control group (419.7 mL vs 585.7 mL, P < .001). Consistent with previous studies, patients undergoing TKA procedures in the treatment group when compared to the control group, respectively, were likely to have more blood loss postoperatively (275.9 mL vs 399.7 mL) than intraoperatively (63.5 mL vs 57.7 mL) regardless of tranexamic acid administration.6 On the other hand, patients who had undergone THA were more likely to experience more intraoperative blood loss (281.6 mL in treatment group vs 328.9 mL in control group) than postoperative blood loss (138.1 mL in treatment group vs 256.8 mL in control group) regardless of tranexamic acid administration.
In the secondary analysis, the change between preoperative and postoperative Hgb and Hct had results consistent with the total blood loss results. Patients receiving tranexamic acid in TKA procedures had a lower decrease in Hgb compared with the control group (3.3 mg/dL vs 4.0 mg/dL, P < .001). Similarly, patients undergoing TKA who received tranexamic acid had a smaller decrease in Hct than that of the control group (9.4% vs 11.1%, P < .001). Consistent with the TKA procedure results, patients undergoing THA who received tranexamic acid had a smaller decrease in Hgb (3.6 mg/dL vs 4.7 mg/dL, P < .001) and Hct (10.5% vs 13.0%, P = .0012) than that of the control group.
Patients who did not receive tranexamic acid were more likely to require at least 1 blood transfusion than were patients who received tranexamic acid in TKA (14 patients vs 0 patients, P = .0005) and THA procedures (8 patients vs 2 patients, P = .019). Despite the theoretically increased likelihood of clotting complications with tranexamic acid, no significant differences were observed between the treatment and control groups in either TKA (0 vs 4, P = .065) or THA (1 vs 0, P = .363) procedures.
Discussion
Patients undergoing total joint arthroplasty are at risk for significant blood loss with a potential need for postoperative blood transfusions.6,13 The use of tranexamic acid during these procedures offers a possible solution to decrease blood loss and minimize blood transfusions. This study retrospectively evaluated whether tranexamic acid safely decreased blood loss and the need for blood transfusions at SFVAHCS with the dosing strategy of 1 g IV at first incision and 1 g IV at incision closure.
Patients who received tranexamic acid in TKA and THA procedures had significantly less blood loss than did patients who did not receive tranexamic acid. Patients receiving tranexamic acid also had a significantly lower change from preoperative to postoperative Hgb and Hct levels than did patients who did not receive tranexamic acid in TKA and THA procedures. In addition to decreasing blood loss, the tranexamic acid groups had significantly fewer patients who required blood transfusions than that of the control groups.
This reduction in blood transfusions should be considered clinically significant.
Even though baseline Hct levels were found to be significantly different between the tranexamic acid group and the control group for patients who underwent TKA, medical record documentation indicated that the determination whether postoperative blood transfusions were needed was based primarily on Hgb levels. Baseline Hgb levels were found not to be significantly different between the tranexamic acid and control groups for either TKA or THA procedures. This suggests that at baseline the tranexamic acid and control groups had the same risk of reaching the Hgb threshold where blood transfusions would be required.
There was a significant difference in the proportion of patients receiving the periarticular pain injection of ropivacaine, ketorolac, epinephrine, and clonidine between the groups who received tranexamic acid and those who did not. Originally, this baseline characteristic was theorized to be a major confounder in the primary and secondary analyses because epinephrine is a vasoconstrictor and ketorolac is a reversible antiplatelet agent. However, Vendittoli and colleagues showed that patients receiving these periarticular pain injections during surgery actually had greater total blood loss than did patients who did not receive the injections, although this comparison did not reach statistical significance.14 The Vendittoli and colleagues results suggest that the pain injections did not confound the primary and secondary analyses by aiding in the process of reducing blood loss in these procedures.
Limitations
There are several limitations for extrapolating the results from this study to the general population. Due to the retrospective study design, there was no way to actively control potentially confounding variables during the TKA and THA procedures. Surgeons and surgery teams likely had slightly different techniques and protocols during and after surgery. Several baseline characteristics were not equal between patients who received tranexamic acid and those who did not. Therefore, it is unknown whether these baseline characteristics affected the results of this study. Postoperative anticoagulant use was not recorded and may have differed between study groups, depending on the patient’s risk of thromboembolic complications; however, the drains that collected blood loss were removed prior to the first dose of enoxaparin, which was administered the day after surgery.
Another limitation is that the method of measuring blood loss during and after the procedure was imprecise. Blood not suctioned through the suctioning device during surgery or not collected in the drain after surgery was not measured and may have increased the total blood loss. Hemoglobin and Hct levels also are sensitive to intravascular volume changes. If a patient required more IV fluids during or after a procedure, the fluids may have lowered the Hgb and/or Hct levels by dilution.
Conclusion
This study suggests that using tranexamic acid at a dose of 1 g IV at first incision and 1 g IV at incision closure safely and effectively reduced blood loss and the need for transfusions in patients undergoing TKA and THA procedures at SFVAHCS. Further prospective studies are needed to compare different tranexamic dosing strategies to minimize blood loss during these procedures. ˜
Acknowledgments
This study is the result of work supported with resources and the use of facilities at the Sioux Falls VA Health Care System in South Dakota.
1. Kurtz S, Ong K, Lau E, Mowat F, Halpern M. Projections of primary and revision hip and knee arthroplasty in the United States from 2005 to 2030. J Bone Joint Surg Am. 2007;89(4):780-785.
2. Centers for Disease Control and Prevention. Number of all-listed procedures for discharges from short-stay hospitals, by procedure category and age: United States, 2010. https://www.cdc.gov/nchs/data/nhds/4procedures/2010pro4_numberprocedureage.pdf. Published 2010. Accessed March 15, 2017.
3. Wei Z, Liu M. The effectiveness and safety of tranexamic acid in total hip or knee arthroplasty: a meta-analysis of 2720 cases. Transfus Med. 2015;25(3):151-162.
4. Glance LG, Dick AW, Mukamel DB, et al. Association between intraoperative blood transfusion and mortality and morbidity in patients undergoing noncardiac surgery. Anesthesiology. 2011;114(2):283-292.
5. Wu WC, Smith TS, Henderson WG, et al. Operative blood loss, blood transfusion, and 30-day mortality in older patients after major noncardiac surgery. Ann Surg. 2010;252(1):283-292.
6. Sehat KR, Evans RL, Newman JH. Hidden blood loss following hip and knee arthroplasty. Correct management of blood loss should take hidden loss into account. J Bone Joint Surg Br. 2004;86(4):561-565.
7. Gandhi R, Evans HMK, Mahomed SR, Mahomed NN. Tranexamic acid and the reduction of blood loss in total knee and hip arthroplasty: a meta-analysis. BMC Res Notes. 2013;6:184.
8. Alshryda S, Sarda P, Sukeik M, Nargol A, Blenkinsopp J, Mason JM. Tranexamic acid in total knee replacement: a systematic review and meta-analysis. J Bone Joint Surg Br. 2011;93(12):1577-1585.
9. Yang ZG, Chen WP, Wu LE. Effectiveness and safety of tranexamic acid in reducing blood loss in total knee arthroplasty: a meta-analysis. J Bone Joint Surg Am. 2012;94(13):1153-1159.
10. Tan J, Chen H, Liu Q, Chen C, Huang W. A meta-analysis of the effectiveness and safety of using tranexamic acid in primary unilateral total knee arthroplasty. J Surg Res. 2013;184(2):880-887.
11. Sukeik M, Alshryda S, Haddad FS, Mason JM. Systematic review and meta-analysis of the use of tranexamic acid in total hip replacement. J Bone Joint Surg Br. 2011;93(1):39-46.
12. Zhou XD, Tao LJ, Li J, Wu LD. Do we really need tranexamic acid in total hip arthroplasty? A meta-analysis of nineteen randomized controlled trials. Arch Orthop Trauma Surg. 2013;133(7):1017-1027.
13. Bierbaum BE, Callaghan JJ, Galante JO, Rubash HE, Tooms RE, Welch RB. An analysis of blood management in patients having a total hip or knee arthroplasty. J Bone Joint Surg Am. 1999;81(1):2-10.
14. Vendittoli PA, Makinen P, Drolet P, et al. A multimodal analgesia protocol for total knee arthroplasty: a randomized, controlled study. J Bone Joint Surg Am. 2006;88(2):282-289.
Handheld Reflectance Confocal Microscopy to Aid in the Management of Complex Facial Lentigo Maligna
Lentigo maligna (LM) and LM melanoma (LMM) represent diagnostic and therapeutic challenges due to their heterogeneous nature and location on cosmetically sensitive areas. Newer ancillary technologies such as reflectance confocal microscopy (RCM) have helped improve diagnosis and management of these challenging lesions.1,2
Reflectance confocal microscopy is a noninvasive laser system that provides real-time imaging of the epidermis and dermis with cellular resolution and improves diagnostic accuracy of melanocytic lesions.2,3 Normal melanocytes appear as round bright structures on RCM that are similar in size to surrounding keratinocytes located in the basal layer and regularly distributed around the dermal papillae (junctional nevi) or form regular dense nests in the dermis (intradermal nevi).4,5 In LM/LMM, there may be widespread infiltration of atypical melanocytes invading hair follicles; large, round, pagetoid melanocytes (larger than surrounding keratinocytes); sheets of large atypical cells at the dermoepidermal junction (DEJ); loss of contour in the dermal papillae; and atypical melanocytes invading the dermal papillae.2 Indeed, RCM has good correlation with the degree of histologic atypia and is useful to distinguish between benign nevi, atypical nevi, and melanoma.6 By combining lateral mosaics with vertical stacks, RCM allows 3-dimensional approximation of tumor margins and monitoring of nonsurgical therapies.7,8 The advent of handheld RCM (HRCM) has allowed assessment of large lesions as well as those presenting in difficult locations.9 Furthermore, the generation of videomosaics overcomes the limited field of view of traditional RCM and allows for accurate assessment of large lesions.10
Traditional and handheld RCM have been used to diagnose and map primary LM.1,2,11 Guitera et al2 developed an algorithm using traditional RCM to distinguish benign facial macules and LM. In their training set, they found that when their score resulted in 2 or more points, the sensitivity and specificity to diagnose LM was 85% and 76%, respectively, with an odds ratio of 18.6 for LM. They later applied the algorithm in a test set of 44 benign facial macules and 29 LM and obtained an odds ratio of 60.7 for LM, with sensitivity and specificity rates of 93% and 82%, respectively.2 This algorithm also was tested by Menge et al11 using the HRCM. They found 100% sensitivity and 71% specificity for LM when evaluating 63 equivocal facial lesions. Although these results suggest that RCM can accurately distinguish LM from benign lesions in the primary setting, few reports have studied the impact of HRCM in the recurrent setting and its impact in monitoring treatment of LM.12,13
Herein, we present 5 cases in which HRCM was used to manage complex facial LM/LMM, highlighting its versatility and potential for use in the clinical setting (eTable).
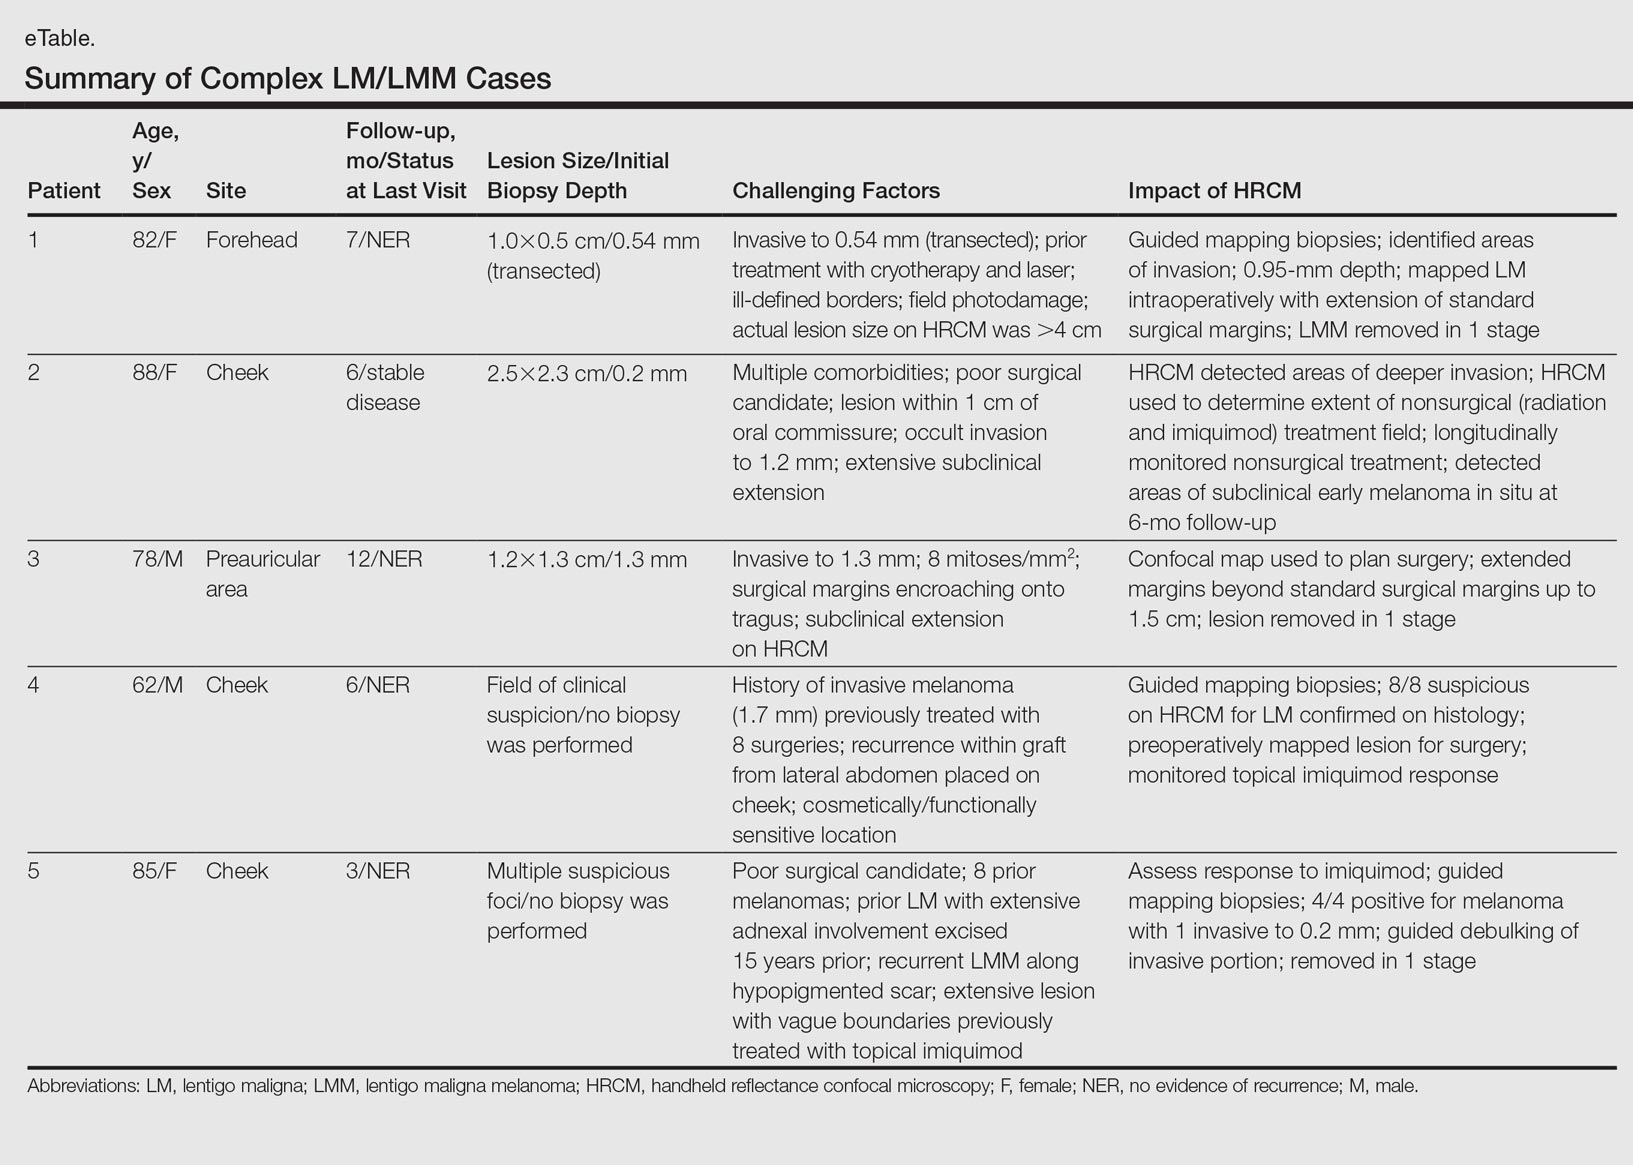
Case Series
Following institutional review board approval, cases of facial LM/LMM presenting for assessment and treatment from January 2014 to December 2015 were retrospectively reviewed. Initially, the clinical margins of the lesions were determined using Wood lamp and/or dermoscopy. Using HRCM, vertical stacks were taken at the 12-, 3-, 6-, and 9-o'clock positions, and videos were captured along the peripheral margins at the DEJ. To create videomosaics, HRCM video frames were extracted and later stitched using a computer algorithm written in a fourth-generation programming language based on prior studies.10,14 An example HRCM video that was captured and turned into a videomosaic accompanies this article online (http://bit.ly/2oDYS6k). Additional stacks were taken in suspicious areas. We considered an area positive for LM under HRCM when the LM score developed by Guitera et al2 was 2 or more. The algorithm scoring includes 2 major criteria--nonedged papillae and round large pagetoid cells--which score 2 points, and 4 minor criteria, including 3 positive criteria--atypical cells at the DEJ, follicular invasion, nucleated cells in the papillae--which each score 1 point, and 1 negative criterion--broadened honeycomb pattern--which scores -1 point.2
RELATED VIDEO: RCM Videomosaic of Melanoma In Situ
Patient 1
An 82-year-old woman was referred to us for management of an LMM on the left side of the forehead (Figure 1A). Handheld RCM from the biopsy site showed large atypical cells in the epidermis, DEJ, and papillary dermis. Superiorly, HRCM showed large dendritic processes but did not reveal LM features in 3 additional clinically worrisome areas. Biopsies showed LMM at the prior biopsy site, LM superiorly, and actinic keratosis in the remaining 3 areas, supporting the HRCM findings. Due to upstaging, the patient was referred for head and neck surgery. To aid in resection, HRCM was performed intraoperatively in a multidisciplinary approach (Figure 1B). Due to the large size of the lesion, surgical margins were taken right outside the HRCM border. Pathology showed LMM extending focally into the margins that were reexcised, achieving clearance.
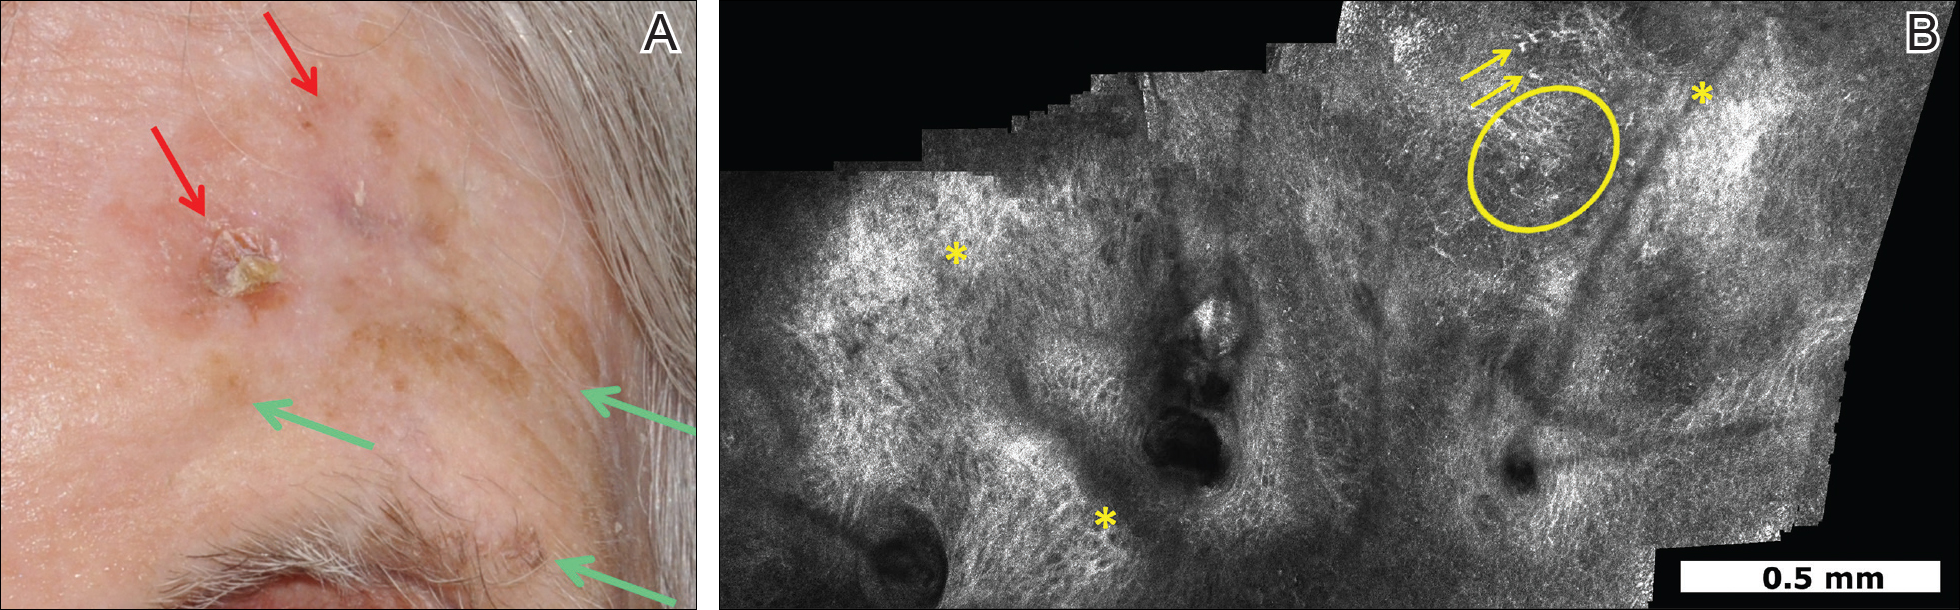
Patient 2
An 88-year-old woman presented with a slightly pigmented, 2.5×2.3-cm LMM on the left cheek. Because of her age and comorbidities (eg, osteoporosis, deep vein thrombosis in both lower legs requiring anticoagulation therapy, presence of an inferior vena cava filter, bilateral lymphedema of the legs, irritable bowel syndrome, hyperparathyroidism), she was treated with imiquimod cream 5% achieving partial response. The lesion was subsequently excised showing LMM extending to the margins. Not wanting to undergo further surgery, she opted for radiation therapy. Handheld RCM was performed to guide the radiation field, showing pagetoid cells within 1 cm of the scar and clear margins beyond 2 cm. She underwent radiation therapy followed by treatment with imiquimod. On 6-month follow-up, no clinical lesion was apparent, but HRCM showed atypical cells. Biopsies revealed an atypical intraepidermal melanocytic proliferation, but due to patient's comorbidities, close observation was decided.
Patient 3
A 78-year-old man presented with an LMM on the right preauricular area. Handheld RCM demonstrated pleomorphic pagetoid cells along and beyond the clinical margins. Wide excision with sentinel lymph node biopsy was planned, and to aid surgery a confocal map was created (Figure 2). Margins were clear at 1 cm, except inferiorly where they extended to 1.5 cm. Using this preoperative HRCM map, all intraoperative sections were clear. Final pathology confirmed clear margins throughout.
Patient 4
A 62-year-old man presented with hyperpigmentation and bleeding on the left cheek where an LMM was previously removed 8 times over 18 years. Handheld RCM showed pleomorphic cells along the graft border and interestingly within the graft. Ten biopsies were taken, 8 at sites with confocal features that were worrisome for LM (Figures 3A and 3B) and 2 at clinically suspicious sites. The former revealed melanomas (2 that were invasive to 0.3 mm), and the latter revealed solar lentigines. The patient underwent staged excision guided by HRCM (Figure 3C), achieving clear histologic margins except for a focus in the helix. This area was RCM positive but was intentionally not resected due to reconstructive difficulties; imiquimod was indicated in this area.
Patient 5
An 85-year-old woman with 6 prior melanomas over 15 years presented with ill-defined light brown patches on the left cheek at the site where an LM was previously excised 15 years prior. Biopsies showed LM, and due to the patient's age, health, and personal preference to avoid extensive surgery, treatment with imiquimod cream 5% was decided. Over a period of 6 to 12 months, she developed multiple erythematous macules with 2 faintly pigmented areas. Handheld RCM demonstrated atypical cells within the papillae in previously biopsied sites that were rebiopsied, revealing LMM (Breslow depth, 0.2 mm). Staged excision achieved clear margins, but after 8 months HRCM showed LM features. Histology confirmed the diagnosis and imiquimod was reapplied.
Comment
Diagnosis and choice of treatment modality for cases of facial LM is a challenge, and there are a number of factors that may create even more of a clinical dilemma. Surgical excision is the treatment of choice for LM/LMM, and better results are achieved when using histologically controlled surgical procedures such as Mohs micrographic surgery, staged excision, or the "spaghetti technique."15-17 However, advanced patient age, multiple comorbidities (eg, coronary artery disease, deep vein thrombosis, other conditions requiring anticoagulation therapy), large lesion size in functionally or aesthetically sensitive areas, and indiscriminate borders on photodamaged skin may make surgical excision complicated or not feasible. Additionally, prior treatments to the affected area may further obscure clinical borders, complicating the diagnosis of recurrence/persistence when observed with the naked eye, dermoscopy, or Wood lamp. Because RCM can detect small amounts of melanin and has cellular resolution, it has been suggested as a great diagnostic tool to be combined with dermoscopy when evaluating lightly pigmented/amelanotic facial lesions arising on sun-damaged skin.18,19 In this case series, we highlighted these difficulties and showed how HRCM can be useful in a variety of scenarios, both pretreatment and posttreatment in complex LM/LMM cases.
Pretreatment Evaluation
Blind mapping biopsies of LM are prone to sample bias and depend greatly on biopsy technique; however, HRCM can guide mapping biopsies by detecting features of LM in vivo with high sensitivity.11 Due to the cosmetically sensitive nature of the lesions, many physicians are discouraged to do multiple mapping biopsies, making it difficult to assess the breadth of the lesion and occult invasion. Multiple studies have shown that occult invasion was not apparent until complete lesion excision was done.15,20,21 Agarwal-Antal et al20 reported 92 cases of LM, of which 16% (15/92) had unsuspected invasion on final excisional pathology. A long-standing disadvantage of treating LM with nonsurgical modalities has been the inability to detect occult invasion or multifocal invasion within the lesion. As described in patients 1, 4, and 5 in the current case series, utilizing real-time video imaging of the DEJ at the margins and within the lesion has allowed for the detection of deep atypical melanocytes suspicious for perifollicular infiltration and invasion. Knowing the depth of invasion before treatment is essential for not only counseling the patient about disease risk but also for choosing an appropriate treatment modality. Therefore, prospective studies evaluating the performance of RCM to identify invasion are crucial to improve sampling error and avoid unnecessary biopsies.
Surgical Treatment
Although surgery is the first-line treatment option for facial LM, it is not without associated morbidity, and LM is known to have histological subclinical extension, which makes margin assessment difficult. Wide surgical margins on the face are not always possible and become further complicated when trying to maintain adequate functional and cosmetic outcomes. Additionally, the margin for surgical clearance may not be straightforward for facial lesions. Hazan et al15 showed the mean total surgical margins required for excision of LM and LMM was 7.1 and 10.3 mm, respectively; of the 91 tumors initially diagnosed as LM on biopsy, 16% (15/91) had unsuspected invasion. Guitera et al2 reported that the presence of atypical cells within the dermal papillae might be a sign of invasion, which occasionally is not detected histologically due to sampling bias. Handheld RCM offers the advantage of a rapid real-time assessment in areas that may not have been amenable to previous iterations of the device, and it also provides a larger field of view that would be time consuming if performed using conventional RCM. Compared to prior RCM devices that were not handheld, the use of the HRCM does not need to attach a ring to the skin and is less bulky, permitting its use at the bedside of the patient or even intraoperatively.13 In our experience, HRCM has helped to better characterize subclinical spread of LM during the initial consultation and better counsel patients about the extent of the lesion. Handheld RCM also has been used to guide the spaghetti technique in patients with LM/LMM with good correlation between HRCM and histology.22 In our case series, HRCM was used in complex LM/LMM to delineate surgical margins, though in some cases the histologic margins were too close or affected, suggesting HRCM underestimation. Lentigo maligna margin assessment with RCM uses an algorithm that evaluates confocal features in the center of the lesion.1,2 Therefore, further studies using HRCM should evaluate minor confocal features in the margins as potential markers of positivity to accurately delineate surgical margins.
Nonsurgical Treatment Options
For patients unable or unwilling to pursue surgical treatment, therapies such as imiquimod or radiation have been suggested.23,24 However, the lack of histological confirmation and possibility for invasive spread has limited these modalities. Lentigo malignas treated with radiation have a 5% recurrence rate, with a median follow-up time of 3 years.23 Recurrence often can be difficult to detect clinically, as it may manifest as an amelanotic lesion, or postradiation changes can hinder detection. Handheld RCM allows for a cellular-level observation of the irradiated field and can identify radiation-induced changes in LM lesions, including superficial necrosis, apoptotic cells, dilated vessels, and increased inflammatory cells.25 Handheld RCM has previously been used to assess LM treated with radiation and, as in patient 2, can help define the radiation field and detect treatment failure or recurrence.12,25
Similarly, as described in patient 5, HRCM was utilized to monitor treatment with imiquimod. Many reports use imiquimod for treatment of LM, but application and response vary greatly. Reflectance confocal microscopy has been shown to be useful in monitoring LM treated with imiquimod,8 which is important because clinical findings such as inflammation and erythema do not correlate well with response to therapy. Thus, RCM is an appealing noninvasive modality to monitor response to treatment and assess the need for longer treatment duration. Moreover, similar to postradiation changes, treatment with imiquimod may cause an alteration of the clinically apparent pigment. Therefore, it is difficult to assess treatment success by clinical inspection alone. The use of RCM before, during, and after treatment provides a longitudinal assessment of the lesion and has augmented dermatologists' ability to determine treatment success or failure; however, prospective studies evaluating the usefulness of HRCM in the recurrent setting are needed to validate these results.
Limitations
Limitations of this technology include the time needed to image large areas; technology cost; and associated learning curve, which may take from 6 months to 1 year based on our experience. Others have reported the training required for accurate RCM interpretation to be less than that of dermoscopy.26 It has been shown that key RCM diagnostic criteria for lesions including melanoma and basal cell carcinoma are reproducibly recognized among RCM users and that diagnostic accuracy increases with experience.27 These limitations can be overcome with advances in videomosaicing that may streamline the imaging as well as an eventual decrease in cost with greater user adoption and the development of training platforms that enable a faster learning of RCM.28
Conclusion
The use of HRCM can help in the diagnosis and management of facial LMs. Handheld RCM provides longitudinal assessment of LM/LMM that may help determine treatment success or failure and has proven to be useful in detecting the presence of recurrence/persistence in cases that were clinically poorly evident. Moreover, HRCM is a notable ancillary tool, as it can be performed at the bedside of the patient or even intraoperatively and provides a faster approach than conventional RCM in cases where large areas need to be mapped.
In summary, HRCM may eventually be a useful screening tool to guide scouting biopsies to diagnose de novo LM; guide surgical and nonsurgical therapies; and evaluate the presence of recurrence/persistence, especially in large, complex, amelanotic or poorly pigmented lesions. A more standardized use of HRCM in mapping surgical and nonsurgical approaches needs to be evaluated in further studies to provide a fast and reliable complement to histology in such complex cases; therefore, larger studies need to be performed to validate this technique in such complex cases.
- Guitera P, Moloney FJ, Menzies SW, et al. Improving management and patient care in lentigo maligna by mapping with in vivo confocal microscopy. JAMA Dermatol. 2013;149:692-698.
- Guitera P, Pellacani G, Crotty KA, et al. The impact of in vivo reflectance confocal microscopy on the diagnostic accuracy of lentigo maligna and equivocal pigmented and nonpigmented macules of the face. J Invest Dermatol. 2010;130:2080-2091.
- Pellacani G, Guitera P, Longo C, et al. The impact of in vivo reflectance confocal microscopy for the diagnostic accuracy of melanoma and equivocal melanocytic lesions. J Invest Dermatol. 2007;127:2759-2765.
- Segura S, Puig S, Carrera C, et al. Development of a two-step method for the diagnosis of melanoma by reflectance confocal microscopy. J Am Acad Dermatol. 2009;61:216-229.
- Hofmann-Wellenhof R, Pellacani G, Malvehy J, et al. Reflectance Confocal Microscopy for Skin Diseases. New York, NY: Springer; 2012.
- Pellacani G, Farnetani F, Gonzalez S, et al. In vivo confocal microscopy for detection and grading of dysplastic nevi: a pilot study. J Am Acad Dermatol. 2012;66:E109-E121.
- Nadiminti H, Scope A, Marghoob AA, et al. Use of reflectance confocal microscopy to monitor response of lentigo maligna to nonsurgical treatment. Dermatol Surg. 2010;36:177-184.
- Alarcon I, Carrera C, Alos L, et al. In vivo reflectance confocal microscopy to monitor the response of lentigo maligna to imiquimod. J Am Acad Dermatol. 2014;71:49-55.
- Fraga-Braghiroli NA, Stephens A, Grossman D, et al. Use of handheld reflectance confocal microscopy for in vivo diagnosis of solitary facial papules: a case series. J Eur Acad Dermatol Venereol. 2014;28:933-942.
- Kose K, Cordova M, Duffy M, et al. Video-mosaicing of reflectance confocal images for examination of extended areas of skin in vivo. Br J Dermatol. 2014;171:1239-1241.
- Menge TD, Hibler BP, Cordova MA, et al. Concordance of handheld reflectance confocal microscopy (RCM) with histopathology in the diagnosis of lentigo maligna (LM): a prospective study [published online January 27, 2016]. J Am Acad Dermatol. 2016;74:1114-1120.
- Hibler BP, Connolly KL, Cordova M, et al. Radiation therapy for synchronous basal cell carcinoma and lentigo maligna of the nose: response assessment by clinical examination and reflectance confocal microscopy. Pract Radiat Oncol. 2015;5:E543-E547.
- Hibler BP, Cordova M, Wong RJ, et al. Intraoperative real-time reflectance confocal microscopy for guiding surgical margins of lentigo maligna melanoma. Dermatol Surg. 2015;41:980-983.
- Kose K, Gou M, Yelamos O, et al. Video-mosaicking of in vivo reflectance confocal microscopy images for noninvasive examination of skin lesions [published February 6, 2017]. Proceedings of SPIE Photonics West. doi:10.1117/12.2253085.
- Hazan C, Dusza SW, Delgado R, et al. Staged excision for lentigo maligna and lentigo maligna melanoma: a retrospective analysis of 117 cases. J Am Acad Dermatol. 2008;58:142-148.
- Etzkorn JR, Sobanko JF, Elenitsas R, et al. Low recurrence rates for in situ and invasive melanomas using Mohs micrographic surgery with melanoma antigen recognized by T cells 1 (MART-1) immunostaining: tissue processing methodology to optimize pathologic staging and margin assessment. J Am Acad Dermatol. 2015;72:840-850.
- Gaudy-Marqueste C, Perchenet AS, Tasei AM, et al. The "spaghetti technique": an alternative to Mohs surgery or staged surgery for problematic lentiginous melanoma (lentigo maligna and acral lentiginous melanoma). J Am Acad Dermatol. 2011;64:113-118.
- Guitera P, Menzies SW, Argenziano G, et al. Dermoscopy and in vivo confocal microscopy are complementary techniques for diagnosis of difficult amelanotic and light-coloured skin lesions [published online October 12, 2016]. Br J Dermatol. 2016;175:1311-1319.
- Borsari S, Pampena R, Lallas A, et al. Clinical indications for use of reflectance confocal microscopy for skin cancer diagnosis. JAMA Dermatol. 2016;152:1093-1098.
- Agarwal-Antal N, Bowen GM, Gerwels JW. Histologic evaluation of lentigo maligna with permanent sections: implications regarding current guidelines. J Am Acad Dermatol. 2002;47:743-748.
- Gardner KH, Hill DE, Wright AC, et al. Upstaging from melanoma in situ to invasive melanoma on the head and neck after complete surgical resection. Dermatol Surg. 2015;41:1122-1125.
- Champin J, Perrot JL, Cinotti E, et al. In vivo reflectance confocal microscopy to optimize the spaghetti technique for defining surgical margins of lentigo maligna. Dermatolog Surg. 2014;40:247-256.
- Fogarty GB, Hong A, Scolyer RA, et al. Radiotherapy for lentigo maligna: a literature review and recommendations for treatment. Br J Dermatol. 2014;170:52-58.
- Swetter SM, Chen FW, Kim DD, et al. Imiquimod 5% cream as primary or adjuvant therapy for melanoma in situ, lentigo maligna type. J Am Acad Dermatol. 2015;72:1047-1053.
- Richtig E, Arzberger E, Hofmann-Wellenhof R, et al. Assessment of changes in lentigo maligna during radiotherapy by in-vivo reflectance confocal microscopy--a pilot study. Br J Dermatol. 2015;172:81-87.
- Gerger A, Koller S, Kern T, et al. Diagnostic applicability of in vivo confocal laser scanning microscopy in melanocytic skin tumors. J Invest Dermatol. 2005;124:493-498.
- Farnetani F, Scope A, Braun RP, et al. Skin cancer diagnosis with reflectance confocal microscopy: reproducibility of feature recognition and accuracy of diagnosis. JAMA Dermatol. 2015;151:1075-1080.
- Rajadhyaksha M, Marghoob A, Rossi A, et al. Reflectance confocal microscopy of skin in vivo: from bench to bedside [published online October 27, 2016]. Lasers Surg Med. 2017;49:7-19.
Lentigo maligna (LM) and LM melanoma (LMM) represent diagnostic and therapeutic challenges due to their heterogeneous nature and location on cosmetically sensitive areas. Newer ancillary technologies such as reflectance confocal microscopy (RCM) have helped improve diagnosis and management of these challenging lesions.1,2
Reflectance confocal microscopy is a noninvasive laser system that provides real-time imaging of the epidermis and dermis with cellular resolution and improves diagnostic accuracy of melanocytic lesions.2,3 Normal melanocytes appear as round bright structures on RCM that are similar in size to surrounding keratinocytes located in the basal layer and regularly distributed around the dermal papillae (junctional nevi) or form regular dense nests in the dermis (intradermal nevi).4,5 In LM/LMM, there may be widespread infiltration of atypical melanocytes invading hair follicles; large, round, pagetoid melanocytes (larger than surrounding keratinocytes); sheets of large atypical cells at the dermoepidermal junction (DEJ); loss of contour in the dermal papillae; and atypical melanocytes invading the dermal papillae.2 Indeed, RCM has good correlation with the degree of histologic atypia and is useful to distinguish between benign nevi, atypical nevi, and melanoma.6 By combining lateral mosaics with vertical stacks, RCM allows 3-dimensional approximation of tumor margins and monitoring of nonsurgical therapies.7,8 The advent of handheld RCM (HRCM) has allowed assessment of large lesions as well as those presenting in difficult locations.9 Furthermore, the generation of videomosaics overcomes the limited field of view of traditional RCM and allows for accurate assessment of large lesions.10
Traditional and handheld RCM have been used to diagnose and map primary LM.1,2,11 Guitera et al2 developed an algorithm using traditional RCM to distinguish benign facial macules and LM. In their training set, they found that when their score resulted in 2 or more points, the sensitivity and specificity to diagnose LM was 85% and 76%, respectively, with an odds ratio of 18.6 for LM. They later applied the algorithm in a test set of 44 benign facial macules and 29 LM and obtained an odds ratio of 60.7 for LM, with sensitivity and specificity rates of 93% and 82%, respectively.2 This algorithm also was tested by Menge et al11 using the HRCM. They found 100% sensitivity and 71% specificity for LM when evaluating 63 equivocal facial lesions. Although these results suggest that RCM can accurately distinguish LM from benign lesions in the primary setting, few reports have studied the impact of HRCM in the recurrent setting and its impact in monitoring treatment of LM.12,13
Herein, we present 5 cases in which HRCM was used to manage complex facial LM/LMM, highlighting its versatility and potential for use in the clinical setting (eTable).
Case Series
Following institutional review board approval, cases of facial LM/LMM presenting for assessment and treatment from January 2014 to December 2015 were retrospectively reviewed. Initially, the clinical margins of the lesions were determined using Wood lamp and/or dermoscopy. Using HRCM, vertical stacks were taken at the 12-, 3-, 6-, and 9-o'clock positions, and videos were captured along the peripheral margins at the DEJ. To create videomosaics, HRCM video frames were extracted and later stitched using a computer algorithm written in a fourth-generation programming language based on prior studies.10,14 An example HRCM video that was captured and turned into a videomosaic accompanies this article online (http://bit.ly/2oDYS6k). Additional stacks were taken in suspicious areas. We considered an area positive for LM under HRCM when the LM score developed by Guitera et al2 was 2 or more. The algorithm scoring includes 2 major criteria--nonedged papillae and round large pagetoid cells--which score 2 points, and 4 minor criteria, including 3 positive criteria--atypical cells at the DEJ, follicular invasion, nucleated cells in the papillae--which each score 1 point, and 1 negative criterion--broadened honeycomb pattern--which scores -1 point.2
RELATED VIDEO: RCM Videomosaic of Melanoma In Situ
Patient 1
An 82-year-old woman was referred to us for management of an LMM on the left side of the forehead (Figure 1A). Handheld RCM from the biopsy site showed large atypical cells in the epidermis, DEJ, and papillary dermis. Superiorly, HRCM showed large dendritic processes but did not reveal LM features in 3 additional clinically worrisome areas. Biopsies showed LMM at the prior biopsy site, LM superiorly, and actinic keratosis in the remaining 3 areas, supporting the HRCM findings. Due to upstaging, the patient was referred for head and neck surgery. To aid in resection, HRCM was performed intraoperatively in a multidisciplinary approach (Figure 1B). Due to the large size of the lesion, surgical margins were taken right outside the HRCM border. Pathology showed LMM extending focally into the margins that were reexcised, achieving clearance.
Patient 2
An 88-year-old woman presented with a slightly pigmented, 2.5×2.3-cm LMM on the left cheek. Because of her age and comorbidities (eg, osteoporosis, deep vein thrombosis in both lower legs requiring anticoagulation therapy, presence of an inferior vena cava filter, bilateral lymphedema of the legs, irritable bowel syndrome, hyperparathyroidism), she was treated with imiquimod cream 5% achieving partial response. The lesion was subsequently excised showing LMM extending to the margins. Not wanting to undergo further surgery, she opted for radiation therapy. Handheld RCM was performed to guide the radiation field, showing pagetoid cells within 1 cm of the scar and clear margins beyond 2 cm. She underwent radiation therapy followed by treatment with imiquimod. On 6-month follow-up, no clinical lesion was apparent, but HRCM showed atypical cells. Biopsies revealed an atypical intraepidermal melanocytic proliferation, but due to patient's comorbidities, close observation was decided.
Patient 3
A 78-year-old man presented with an LMM on the right preauricular area. Handheld RCM demonstrated pleomorphic pagetoid cells along and beyond the clinical margins. Wide excision with sentinel lymph node biopsy was planned, and to aid surgery a confocal map was created (Figure 2). Margins were clear at 1 cm, except inferiorly where they extended to 1.5 cm. Using this preoperative HRCM map, all intraoperative sections were clear. Final pathology confirmed clear margins throughout.
Patient 4
A 62-year-old man presented with hyperpigmentation and bleeding on the left cheek where an LMM was previously removed 8 times over 18 years. Handheld RCM showed pleomorphic cells along the graft border and interestingly within the graft. Ten biopsies were taken, 8 at sites with confocal features that were worrisome for LM (Figures 3A and 3B) and 2 at clinically suspicious sites. The former revealed melanomas (2 that were invasive to 0.3 mm), and the latter revealed solar lentigines. The patient underwent staged excision guided by HRCM (Figure 3C), achieving clear histologic margins except for a focus in the helix. This area was RCM positive but was intentionally not resected due to reconstructive difficulties; imiquimod was indicated in this area.
Patient 5
An 85-year-old woman with 6 prior melanomas over 15 years presented with ill-defined light brown patches on the left cheek at the site where an LM was previously excised 15 years prior. Biopsies showed LM, and due to the patient's age, health, and personal preference to avoid extensive surgery, treatment with imiquimod cream 5% was decided. Over a period of 6 to 12 months, she developed multiple erythematous macules with 2 faintly pigmented areas. Handheld RCM demonstrated atypical cells within the papillae in previously biopsied sites that were rebiopsied, revealing LMM (Breslow depth, 0.2 mm). Staged excision achieved clear margins, but after 8 months HRCM showed LM features. Histology confirmed the diagnosis and imiquimod was reapplied.
Comment
Diagnosis and choice of treatment modality for cases of facial LM is a challenge, and there are a number of factors that may create even more of a clinical dilemma. Surgical excision is the treatment of choice for LM/LMM, and better results are achieved when using histologically controlled surgical procedures such as Mohs micrographic surgery, staged excision, or the "spaghetti technique."15-17 However, advanced patient age, multiple comorbidities (eg, coronary artery disease, deep vein thrombosis, other conditions requiring anticoagulation therapy), large lesion size in functionally or aesthetically sensitive areas, and indiscriminate borders on photodamaged skin may make surgical excision complicated or not feasible. Additionally, prior treatments to the affected area may further obscure clinical borders, complicating the diagnosis of recurrence/persistence when observed with the naked eye, dermoscopy, or Wood lamp. Because RCM can detect small amounts of melanin and has cellular resolution, it has been suggested as a great diagnostic tool to be combined with dermoscopy when evaluating lightly pigmented/amelanotic facial lesions arising on sun-damaged skin.18,19 In this case series, we highlighted these difficulties and showed how HRCM can be useful in a variety of scenarios, both pretreatment and posttreatment in complex LM/LMM cases.
Pretreatment Evaluation
Blind mapping biopsies of LM are prone to sample bias and depend greatly on biopsy technique; however, HRCM can guide mapping biopsies by detecting features of LM in vivo with high sensitivity.11 Due to the cosmetically sensitive nature of the lesions, many physicians are discouraged to do multiple mapping biopsies, making it difficult to assess the breadth of the lesion and occult invasion. Multiple studies have shown that occult invasion was not apparent until complete lesion excision was done.15,20,21 Agarwal-Antal et al20 reported 92 cases of LM, of which 16% (15/92) had unsuspected invasion on final excisional pathology. A long-standing disadvantage of treating LM with nonsurgical modalities has been the inability to detect occult invasion or multifocal invasion within the lesion. As described in patients 1, 4, and 5 in the current case series, utilizing real-time video imaging of the DEJ at the margins and within the lesion has allowed for the detection of deep atypical melanocytes suspicious for perifollicular infiltration and invasion. Knowing the depth of invasion before treatment is essential for not only counseling the patient about disease risk but also for choosing an appropriate treatment modality. Therefore, prospective studies evaluating the performance of RCM to identify invasion are crucial to improve sampling error and avoid unnecessary biopsies.
Surgical Treatment
Although surgery is the first-line treatment option for facial LM, it is not without associated morbidity, and LM is known to have histological subclinical extension, which makes margin assessment difficult. Wide surgical margins on the face are not always possible and become further complicated when trying to maintain adequate functional and cosmetic outcomes. Additionally, the margin for surgical clearance may not be straightforward for facial lesions. Hazan et al15 showed the mean total surgical margins required for excision of LM and LMM was 7.1 and 10.3 mm, respectively; of the 91 tumors initially diagnosed as LM on biopsy, 16% (15/91) had unsuspected invasion. Guitera et al2 reported that the presence of atypical cells within the dermal papillae might be a sign of invasion, which occasionally is not detected histologically due to sampling bias. Handheld RCM offers the advantage of a rapid real-time assessment in areas that may not have been amenable to previous iterations of the device, and it also provides a larger field of view that would be time consuming if performed using conventional RCM. Compared to prior RCM devices that were not handheld, the use of the HRCM does not need to attach a ring to the skin and is less bulky, permitting its use at the bedside of the patient or even intraoperatively.13 In our experience, HRCM has helped to better characterize subclinical spread of LM during the initial consultation and better counsel patients about the extent of the lesion. Handheld RCM also has been used to guide the spaghetti technique in patients with LM/LMM with good correlation between HRCM and histology.22 In our case series, HRCM was used in complex LM/LMM to delineate surgical margins, though in some cases the histologic margins were too close or affected, suggesting HRCM underestimation. Lentigo maligna margin assessment with RCM uses an algorithm that evaluates confocal features in the center of the lesion.1,2 Therefore, further studies using HRCM should evaluate minor confocal features in the margins as potential markers of positivity to accurately delineate surgical margins.
Nonsurgical Treatment Options
For patients unable or unwilling to pursue surgical treatment, therapies such as imiquimod or radiation have been suggested.23,24 However, the lack of histological confirmation and possibility for invasive spread has limited these modalities. Lentigo malignas treated with radiation have a 5% recurrence rate, with a median follow-up time of 3 years.23 Recurrence often can be difficult to detect clinically, as it may manifest as an amelanotic lesion, or postradiation changes can hinder detection. Handheld RCM allows for a cellular-level observation of the irradiated field and can identify radiation-induced changes in LM lesions, including superficial necrosis, apoptotic cells, dilated vessels, and increased inflammatory cells.25 Handheld RCM has previously been used to assess LM treated with radiation and, as in patient 2, can help define the radiation field and detect treatment failure or recurrence.12,25
Similarly, as described in patient 5, HRCM was utilized to monitor treatment with imiquimod. Many reports use imiquimod for treatment of LM, but application and response vary greatly. Reflectance confocal microscopy has been shown to be useful in monitoring LM treated with imiquimod,8 which is important because clinical findings such as inflammation and erythema do not correlate well with response to therapy. Thus, RCM is an appealing noninvasive modality to monitor response to treatment and assess the need for longer treatment duration. Moreover, similar to postradiation changes, treatment with imiquimod may cause an alteration of the clinically apparent pigment. Therefore, it is difficult to assess treatment success by clinical inspection alone. The use of RCM before, during, and after treatment provides a longitudinal assessment of the lesion and has augmented dermatologists' ability to determine treatment success or failure; however, prospective studies evaluating the usefulness of HRCM in the recurrent setting are needed to validate these results.
Limitations
Limitations of this technology include the time needed to image large areas; technology cost; and associated learning curve, which may take from 6 months to 1 year based on our experience. Others have reported the training required for accurate RCM interpretation to be less than that of dermoscopy.26 It has been shown that key RCM diagnostic criteria for lesions including melanoma and basal cell carcinoma are reproducibly recognized among RCM users and that diagnostic accuracy increases with experience.27 These limitations can be overcome with advances in videomosaicing that may streamline the imaging as well as an eventual decrease in cost with greater user adoption and the development of training platforms that enable a faster learning of RCM.28
Conclusion
The use of HRCM can help in the diagnosis and management of facial LMs. Handheld RCM provides longitudinal assessment of LM/LMM that may help determine treatment success or failure and has proven to be useful in detecting the presence of recurrence/persistence in cases that were clinically poorly evident. Moreover, HRCM is a notable ancillary tool, as it can be performed at the bedside of the patient or even intraoperatively and provides a faster approach than conventional RCM in cases where large areas need to be mapped.
In summary, HRCM may eventually be a useful screening tool to guide scouting biopsies to diagnose de novo LM; guide surgical and nonsurgical therapies; and evaluate the presence of recurrence/persistence, especially in large, complex, amelanotic or poorly pigmented lesions. A more standardized use of HRCM in mapping surgical and nonsurgical approaches needs to be evaluated in further studies to provide a fast and reliable complement to histology in such complex cases; therefore, larger studies need to be performed to validate this technique in such complex cases.
- Guitera P, Moloney FJ, Menzies SW, et al. Improving management and patient care in lentigo maligna by mapping with in vivo confocal microscopy. JAMA Dermatol. 2013;149:692-698.
- Guitera P, Pellacani G, Crotty KA, et al. The impact of in vivo reflectance confocal microscopy on the diagnostic accuracy of lentigo maligna and equivocal pigmented and nonpigmented macules of the face. J Invest Dermatol. 2010;130:2080-2091.
- Pellacani G, Guitera P, Longo C, et al. The impact of in vivo reflectance confocal microscopy for the diagnostic accuracy of melanoma and equivocal melanocytic lesions. J Invest Dermatol. 2007;127:2759-2765.
- Segura S, Puig S, Carrera C, et al. Development of a two-step method for the diagnosis of melanoma by reflectance confocal microscopy. J Am Acad Dermatol. 2009;61:216-229.
- Hofmann-Wellenhof R, Pellacani G, Malvehy J, et al. Reflectance Confocal Microscopy for Skin Diseases. New York, NY: Springer; 2012.
- Pellacani G, Farnetani F, Gonzalez S, et al. In vivo confocal microscopy for detection and grading of dysplastic nevi: a pilot study. J Am Acad Dermatol. 2012;66:E109-E121.
- Nadiminti H, Scope A, Marghoob AA, et al. Use of reflectance confocal microscopy to monitor response of lentigo maligna to nonsurgical treatment. Dermatol Surg. 2010;36:177-184.
- Alarcon I, Carrera C, Alos L, et al. In vivo reflectance confocal microscopy to monitor the response of lentigo maligna to imiquimod. J Am Acad Dermatol. 2014;71:49-55.
- Fraga-Braghiroli NA, Stephens A, Grossman D, et al. Use of handheld reflectance confocal microscopy for in vivo diagnosis of solitary facial papules: a case series. J Eur Acad Dermatol Venereol. 2014;28:933-942.
- Kose K, Cordova M, Duffy M, et al. Video-mosaicing of reflectance confocal images for examination of extended areas of skin in vivo. Br J Dermatol. 2014;171:1239-1241.
- Menge TD, Hibler BP, Cordova MA, et al. Concordance of handheld reflectance confocal microscopy (RCM) with histopathology in the diagnosis of lentigo maligna (LM): a prospective study [published online January 27, 2016]. J Am Acad Dermatol. 2016;74:1114-1120.
- Hibler BP, Connolly KL, Cordova M, et al. Radiation therapy for synchronous basal cell carcinoma and lentigo maligna of the nose: response assessment by clinical examination and reflectance confocal microscopy. Pract Radiat Oncol. 2015;5:E543-E547.
- Hibler BP, Cordova M, Wong RJ, et al. Intraoperative real-time reflectance confocal microscopy for guiding surgical margins of lentigo maligna melanoma. Dermatol Surg. 2015;41:980-983.
- Kose K, Gou M, Yelamos O, et al. Video-mosaicking of in vivo reflectance confocal microscopy images for noninvasive examination of skin lesions [published February 6, 2017]. Proceedings of SPIE Photonics West. doi:10.1117/12.2253085.
- Hazan C, Dusza SW, Delgado R, et al. Staged excision for lentigo maligna and lentigo maligna melanoma: a retrospective analysis of 117 cases. J Am Acad Dermatol. 2008;58:142-148.
- Etzkorn JR, Sobanko JF, Elenitsas R, et al. Low recurrence rates for in situ and invasive melanomas using Mohs micrographic surgery with melanoma antigen recognized by T cells 1 (MART-1) immunostaining: tissue processing methodology to optimize pathologic staging and margin assessment. J Am Acad Dermatol. 2015;72:840-850.
- Gaudy-Marqueste C, Perchenet AS, Tasei AM, et al. The "spaghetti technique": an alternative to Mohs surgery or staged surgery for problematic lentiginous melanoma (lentigo maligna and acral lentiginous melanoma). J Am Acad Dermatol. 2011;64:113-118.
- Guitera P, Menzies SW, Argenziano G, et al. Dermoscopy and in vivo confocal microscopy are complementary techniques for diagnosis of difficult amelanotic and light-coloured skin lesions [published online October 12, 2016]. Br J Dermatol. 2016;175:1311-1319.
- Borsari S, Pampena R, Lallas A, et al. Clinical indications for use of reflectance confocal microscopy for skin cancer diagnosis. JAMA Dermatol. 2016;152:1093-1098.
- Agarwal-Antal N, Bowen GM, Gerwels JW. Histologic evaluation of lentigo maligna with permanent sections: implications regarding current guidelines. J Am Acad Dermatol. 2002;47:743-748.
- Gardner KH, Hill DE, Wright AC, et al. Upstaging from melanoma in situ to invasive melanoma on the head and neck after complete surgical resection. Dermatol Surg. 2015;41:1122-1125.
- Champin J, Perrot JL, Cinotti E, et al. In vivo reflectance confocal microscopy to optimize the spaghetti technique for defining surgical margins of lentigo maligna. Dermatolog Surg. 2014;40:247-256.
- Fogarty GB, Hong A, Scolyer RA, et al. Radiotherapy for lentigo maligna: a literature review and recommendations for treatment. Br J Dermatol. 2014;170:52-58.
- Swetter SM, Chen FW, Kim DD, et al. Imiquimod 5% cream as primary or adjuvant therapy for melanoma in situ, lentigo maligna type. J Am Acad Dermatol. 2015;72:1047-1053.
- Richtig E, Arzberger E, Hofmann-Wellenhof R, et al. Assessment of changes in lentigo maligna during radiotherapy by in-vivo reflectance confocal microscopy--a pilot study. Br J Dermatol. 2015;172:81-87.
- Gerger A, Koller S, Kern T, et al. Diagnostic applicability of in vivo confocal laser scanning microscopy in melanocytic skin tumors. J Invest Dermatol. 2005;124:493-498.
- Farnetani F, Scope A, Braun RP, et al. Skin cancer diagnosis with reflectance confocal microscopy: reproducibility of feature recognition and accuracy of diagnosis. JAMA Dermatol. 2015;151:1075-1080.
- Rajadhyaksha M, Marghoob A, Rossi A, et al. Reflectance confocal microscopy of skin in vivo: from bench to bedside [published online October 27, 2016]. Lasers Surg Med. 2017;49:7-19.
Practice Points
- Diagnosis and management of lentigo maligna (LM) and LM melanoma (LMM) is challenging due to their ill-defined margins and location mainly on the head and neck.
- Handheld reflectance confocal microscopy (RCM) has high diagnostic accuracy for LM/LMM and can be used in curved locations to assess large lesions.
- Handheld RCM can be a versatile tool in pretreatment decision-making, intraoperative surgical mapping, and posttreatment monitoring of both surgical and nonsurgical therapies for complex facial LM/LMM.
Sun Protection for Infants: Parent Behaviors and Beliefs in Miami, Florida
Sun exposure and sunburns sustained during childhood are linked to an increased risk for development of skin cancers in adulthood. In infants, the skin is particularly vulnerable and is considered to be at increased risk for UV radiation damage,1 even as early as the first 6 months of life.2 Sun-safe behaviors instituted from a young age may help reduce the risk for future skin cancers.3 To effectively teach parents proper sun-safe practices, it is essential to understand their existing perceptions and behaviors. This study sought to examine differences in infant sun-safety practices during the first 6 months of life among black, Hispanic, and non-Hispanic white (NHW) parents in Miami, Florida.
Methods
Parents presenting to the University of Miami general pediatrics clinic from February 2015 through April 2015 with a child younger than 5 years were administered a 15-item questionnaire that included items on demographics, sun-safety strategies, sunburns and tanning, beliefs and limitations regarding sunscreen, and primary information source regarding sun safety (eg, physician, Internet, media, instincts). Parents were approached by the investigators consecutively for participation in scheduled blocks, with the exception of those who were otherwise engaged in appointment-related tasks (eg, paperwork). The study was approved by the University of Miami Miller School of Medicine institutional review board. The primary objective of this study was to determine the sun protection behaviors that black and Hispanic parents in Miami, Florida, employ in infants younger than 6 months. Secondary objectives included determining if this patient population is at risk for infant sunburns and tanning, beliefs among parents regarding sunscreen's efficacy in the prevention of skin cancers, and limitations of sunscreen use.
All data were analyzed using SAS software version 9.3. Wilcoxon signed rank test, Kruskal-Wallis test, Fisher exact test, and proportional-odds cumulative logit model were used to compare nonparametric data. Parents reporting on the full first 6 months of life (ie, the child was older than 6 months at the time of study completion) were included for analysis of sun-safety strategies. All survey respondents were included for analysis of secondary objectives. Responses from parents of infants of mixed racial and ethnic backgrounds were excluded from applicable subgroup analyses.
Results
Ninety-eight parents were approached for participation in the study; 97 consented to participate and 95 completed the survey. Seventy parents had children who were at least 6 months of age and were included for analysis of the primary objectives (ie, sun-protection strategies in the first 6 months of life). The cohort included 49 Hispanic parents, 26 black parents, and 9 NHW parents; 5 parents indicated their child was of mixed racial and ethnic background. Six respondents indicated another minority group (eg, Native American, Pacific Islander). Eighty-three respondents were mothers, 72 were educated beyond high school, and 14 were Spanish-speaking only. Four reported a known family history of skin cancer.
There were notable differences in application of sunscreen, belief in the efficacy of sunscreen, and primary source of information between parents (Tables 1 and 2). Hispanic parents reported applying sunscreen more consistently than black parents (odds ratio, 4.656; 95% confidence interval, 1.154-18.782; P<.01). Hispanic parents also were more likely than black parents to believe sunscreen is effective in the prevention of skin cancers (odds ratio, 7.499; 95% confidence interval, 1.535-36.620; P<.01). Hispanic parents were more likely to report receiving information regarding sun-safety practices for infants from their pediatrician, whereas NHW parents were more likely to follow their instincts regarding how and if infants should be exposed to the sun (P<.05). No significant differences were found in the reported primary source of information in black versus Hispanic parents or in black versus NHW parents. Three percent (3/95) of respondents reported a sunburn in the infant's first 6 months of life, and 12% (11/95) reported tanning of infants' skin from sun exposure. Tanning was associated with inconsistent shade (P<.01), inconsistent clothing coverage (P<.01), and consistently allowing infants to "develop tolerance to the sun's rays by slowly increasing sun exposure each day" (P<.05).
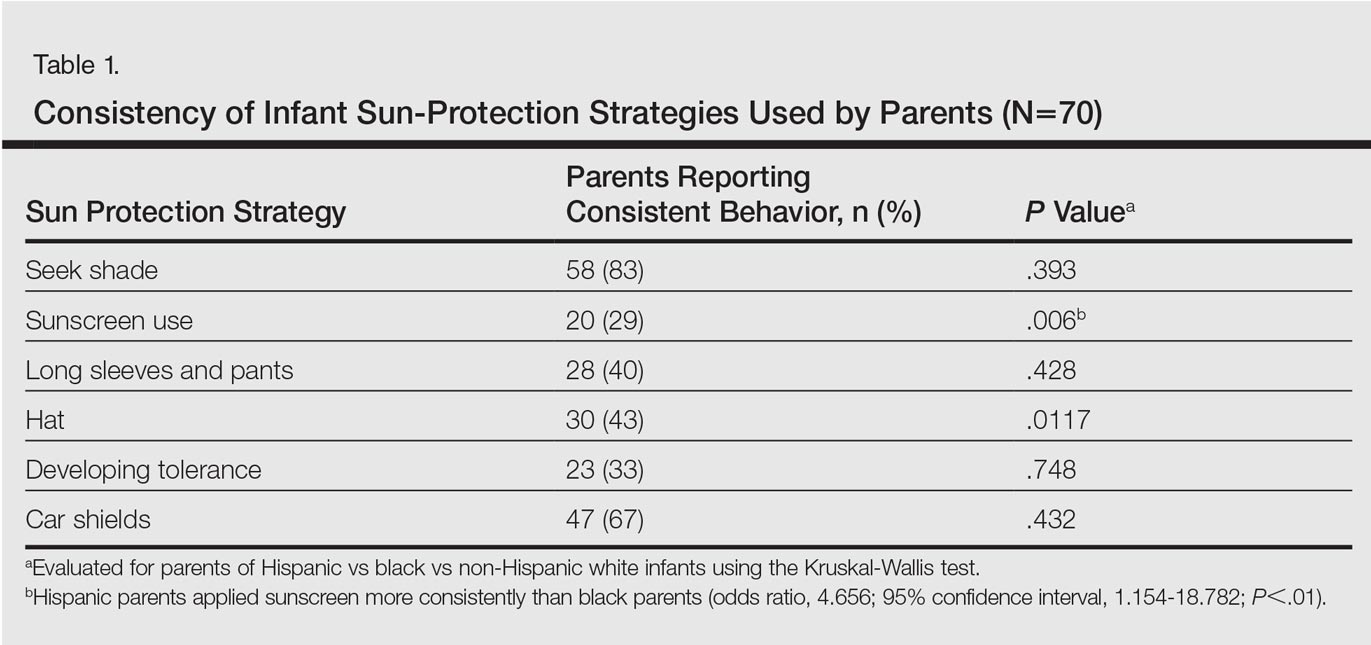
Comment
The survey results indicated suboptimal sun-protection practices among parents of black and Hispanic infants in Miami. Although the majority of respondents (83% [58/70]) reported keeping their infants in the shade, less than half of parents consistently covered their infants adequately with clothing and hats (40% [28/70] and 43% [30/70], respectively). More alarmingly, one-third of parents reported intentionally increasing their infant's level of sun exposure to develop his/her tolerance to the sun. A minority of parents reported sunburns (3%) and tanning (12%) within the first 6 months of life. Twenty-nine percent of parents (20/70) reported consistently applying sunscreen to their infants who were younger than 6 months despite limited safety data available for this age group.
Although our study included a limited sample size and represents a narrow geographic distribution, these results suggest that shortcomings in current practices in sun protection for black and Hispanic infants younger than 6 months may be a widespread problem. Black and Hispanic patients have a lower incidence of skin cancer, but the diagnosis often is delayed and the mortality is higher when skin cancer does occur.4 The common perception among laypeople as well as many health care providers that black and Hispanic individuals are not at risk for skin cancer may limit sun-safety counseling as well as the overall knowledge base of this patient demographic. As demonstrated by the results of this study, there is a need for counseling on sun-safe behaviors from a young age among this population.
Conclusion
This study highlights potential shortcomings in current sun-protection practices for black and Hispanic infants younger than 6 months. Sun-safe behaviors instituted from a young age may help reduce the risk for future skin cancers.3 Additional studies are needed to further define sun-safety behaviors in black and Hispanic children across the United States. Further, additional studies should focus on developing interventions that positively influence sun-safety behaviors in this patient population.
- Paller AS, Hawk JL, Honig P, et al. New insights about infant and toddler skin: implications for sun protection. Pediatrics. 2011;128:92-102.
- Benjes LS, Brooks DR, Zhang Z, et al. Changing patterns of sun protection between the first and second summers for very young children. Arch Dermatol. 2004;140:925-930.
- Oliveria SA, Saraiya M, Geller AC, et al. Sun exposure and risk of melanoma. Arch Dis Child. 2006;91:131-138.
- Wu XC, Eide MJ, King J, et al. Racial and ethnic variations in incidence and survival of cutaneous melanoma in the United States, 1999-2006. J Am Acad Dermatol. 2011;65(5 suppl 1):S26-S37.
Sun exposure and sunburns sustained during childhood are linked to an increased risk for development of skin cancers in adulthood. In infants, the skin is particularly vulnerable and is considered to be at increased risk for UV radiation damage,1 even as early as the first 6 months of life.2 Sun-safe behaviors instituted from a young age may help reduce the risk for future skin cancers.3 To effectively teach parents proper sun-safe practices, it is essential to understand their existing perceptions and behaviors. This study sought to examine differences in infant sun-safety practices during the first 6 months of life among black, Hispanic, and non-Hispanic white (NHW) parents in Miami, Florida.
Methods
Parents presenting to the University of Miami general pediatrics clinic from February 2015 through April 2015 with a child younger than 5 years were administered a 15-item questionnaire that included items on demographics, sun-safety strategies, sunburns and tanning, beliefs and limitations regarding sunscreen, and primary information source regarding sun safety (eg, physician, Internet, media, instincts). Parents were approached by the investigators consecutively for participation in scheduled blocks, with the exception of those who were otherwise engaged in appointment-related tasks (eg, paperwork). The study was approved by the University of Miami Miller School of Medicine institutional review board. The primary objective of this study was to determine the sun protection behaviors that black and Hispanic parents in Miami, Florida, employ in infants younger than 6 months. Secondary objectives included determining if this patient population is at risk for infant sunburns and tanning, beliefs among parents regarding sunscreen's efficacy in the prevention of skin cancers, and limitations of sunscreen use.
All data were analyzed using SAS software version 9.3. Wilcoxon signed rank test, Kruskal-Wallis test, Fisher exact test, and proportional-odds cumulative logit model were used to compare nonparametric data. Parents reporting on the full first 6 months of life (ie, the child was older than 6 months at the time of study completion) were included for analysis of sun-safety strategies. All survey respondents were included for analysis of secondary objectives. Responses from parents of infants of mixed racial and ethnic backgrounds were excluded from applicable subgroup analyses.
Results
Ninety-eight parents were approached for participation in the study; 97 consented to participate and 95 completed the survey. Seventy parents had children who were at least 6 months of age and were included for analysis of the primary objectives (ie, sun-protection strategies in the first 6 months of life). The cohort included 49 Hispanic parents, 26 black parents, and 9 NHW parents; 5 parents indicated their child was of mixed racial and ethnic background. Six respondents indicated another minority group (eg, Native American, Pacific Islander). Eighty-three respondents were mothers, 72 were educated beyond high school, and 14 were Spanish-speaking only. Four reported a known family history of skin cancer.
There were notable differences in application of sunscreen, belief in the efficacy of sunscreen, and primary source of information between parents (Tables 1 and 2). Hispanic parents reported applying sunscreen more consistently than black parents (odds ratio, 4.656; 95% confidence interval, 1.154-18.782; P<.01). Hispanic parents also were more likely than black parents to believe sunscreen is effective in the prevention of skin cancers (odds ratio, 7.499; 95% confidence interval, 1.535-36.620; P<.01). Hispanic parents were more likely to report receiving information regarding sun-safety practices for infants from their pediatrician, whereas NHW parents were more likely to follow their instincts regarding how and if infants should be exposed to the sun (P<.05). No significant differences were found in the reported primary source of information in black versus Hispanic parents or in black versus NHW parents. Three percent (3/95) of respondents reported a sunburn in the infant's first 6 months of life, and 12% (11/95) reported tanning of infants' skin from sun exposure. Tanning was associated with inconsistent shade (P<.01), inconsistent clothing coverage (P<.01), and consistently allowing infants to "develop tolerance to the sun's rays by slowly increasing sun exposure each day" (P<.05).
Comment
The survey results indicated suboptimal sun-protection practices among parents of black and Hispanic infants in Miami. Although the majority of respondents (83% [58/70]) reported keeping their infants in the shade, less than half of parents consistently covered their infants adequately with clothing and hats (40% [28/70] and 43% [30/70], respectively). More alarmingly, one-third of parents reported intentionally increasing their infant's level of sun exposure to develop his/her tolerance to the sun. A minority of parents reported sunburns (3%) and tanning (12%) within the first 6 months of life. Twenty-nine percent of parents (20/70) reported consistently applying sunscreen to their infants who were younger than 6 months despite limited safety data available for this age group.
Although our study included a limited sample size and represents a narrow geographic distribution, these results suggest that shortcomings in current practices in sun protection for black and Hispanic infants younger than 6 months may be a widespread problem. Black and Hispanic patients have a lower incidence of skin cancer, but the diagnosis often is delayed and the mortality is higher when skin cancer does occur.4 The common perception among laypeople as well as many health care providers that black and Hispanic individuals are not at risk for skin cancer may limit sun-safety counseling as well as the overall knowledge base of this patient demographic. As demonstrated by the results of this study, there is a need for counseling on sun-safe behaviors from a young age among this population.
Conclusion
This study highlights potential shortcomings in current sun-protection practices for black and Hispanic infants younger than 6 months. Sun-safe behaviors instituted from a young age may help reduce the risk for future skin cancers.3 Additional studies are needed to further define sun-safety behaviors in black and Hispanic children across the United States. Further, additional studies should focus on developing interventions that positively influence sun-safety behaviors in this patient population.
- Paller AS, Hawk JL, Honig P, et al. New insights about infant and toddler skin: implications for sun protection. Pediatrics. 2011;128:92-102.
- Benjes LS, Brooks DR, Zhang Z, et al. Changing patterns of sun protection between the first and second summers for very young children. Arch Dermatol. 2004;140:925-930.
- Oliveria SA, Saraiya M, Geller AC, et al. Sun exposure and risk of melanoma. Arch Dis Child. 2006;91:131-138.
- Wu XC, Eide MJ, King J, et al. Racial and ethnic variations in incidence and survival of cutaneous melanoma in the United States, 1999-2006. J Am Acad Dermatol. 2011;65(5 suppl 1):S26-S37.
Practice Points
- Infants of all racial and ethnic backgrounds need protection from the sun's rays. Remember to counsel parents on the importance of sun protection.
- Instruct parents to keep infants in the shade when outdoors and to dress infants in a long-sleeved shirt, pants, and a hat. Intentional sun exposure for infants is not recommended.
- The American Academy of Dermatology currently recommends that parents begin sunscreen application when their child reaches 6 months of age. Broad-spectrum barrier sunscreens containing zinc oxide or titanium dioxide are preferred and should provide a sun protection factor of 30 or greater.