User login
General Applications of Ultrasound in Rheumatology Practice
Over the past 2 decades, an increasing number of rheumatologists have progressively incorporated ultrasound (US) as an invaluable diagnostic and monitoring tool into their clinical and research practice.1,2 This imaging modality has become an established aid incorporated into the clinical evaluation of periarticular and articular structures involved in the diagnosis of several rheumatic disorders.
Ultrasound is a safe, noninvasive, patient-friendly imaging modality with a lack of contraindications and free of ionizing radiation. It allows real-time evaluation with dynamic assessment in a multiplanar view, assessment of multiple targets, and lower cost compared with magnetic resonance imaging (MRI) or computerized tomography scan. Above all, for the rheumatologist, US provides real-time scanning of all peripheral joints as many times as is required at the time of consultation. It is of great advantage in the assessment of a wide spectrum of abnormalities in rheumatic diseases with the potential of point-of-care imaging modality in the clinical evaluation and management of the patient. It facilitates a direct correlation between imaging findings and clinical data that improves the approach to a wide range of rheumatic diseases, from acute to chronic inflammatory arthritis, crystalline arthropathies, osteoarthritis (OA), spondyloarthropathies (SpA), vasculitis, and soft tissue syndromes. In addition, US is a bedside tool for performing accurate and safe diagnostic arthrocentesis, injections, and synovial biopsies.3,4
Recently, a gradual attempt has been made to incorporate US into rheumatology disease classification or diagnostic criteria for rheumatoid arthritis (RA), polymyalgia rheumatica, gout, calcium pyrophosphate deposition disease (CPPD), and Sjögren’s syndrome.5-10 Furthermore, the American College of Rheumatology (ACR) and the European League Against Rheumatism (EULAR) have produced evidence and expert opinion-based recommendations on the use of US in the clinical management of rheumatic diseases.10-12 This article highlights the most common applications of US for assessment and management of different rheumatic diseases frequently encountered at the VAMC rheumatology inpatient and outpatient clinical service.
Evaluation of Inflammatory Arthritis
In RA and any other inflammatory arthritis, US has been used for the detection of joint effusions, synovitis, bone erosions, and tendon and enthesis involvement.11,12 Ultrasound B-mode and power Doppler (PD) techniques have demonstrated a consistent and relevant role in optimizing the diagnosis, assessing the inflammatory activity, monitoring response to therapy, and predicting the inflammatory arthritis outcomes (Figures 1-3).10-12 Ultrasound provides real-time information about the status of the synovial membrane, tendons, cartilage, bursae, and cortical bones, allowing an accurate assessment of the degree of inflammatory process in periarticular and articular tissues. Also, US can provide details about the characteristics of the collected fluid (ie, effusion or synovial hypertrophy), which is fundamental for the correct interpretation of the pathologic joint and/or soft tissue processes. The inflammatory process can be assessed by using PD mode, which detects and quantifies the vascular changes in the pannus due to vasodilation and the increased blood flow characteristic of active inflammation.13,14 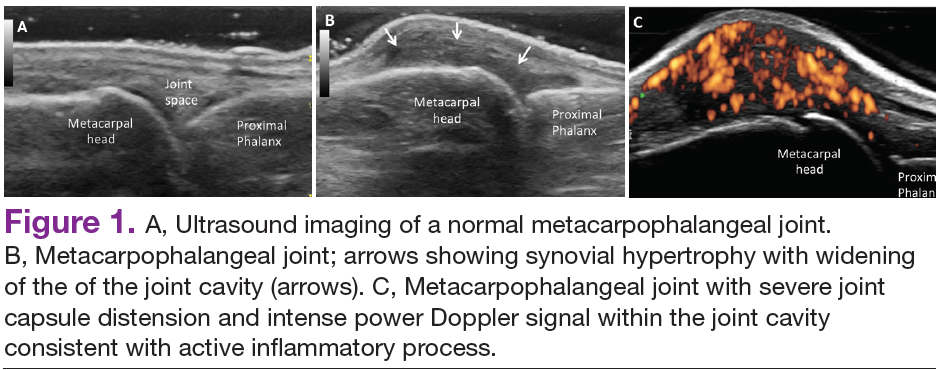
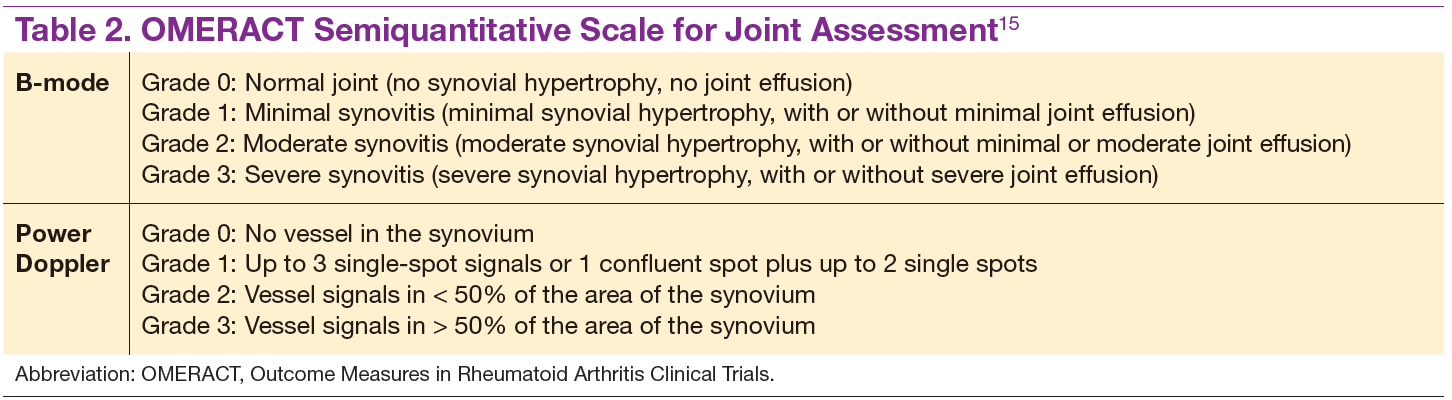
The Outcomes Measures in Rheumatoid Arthritis Clinical Trials (OMERACT) study group developed standardized sonopathologic definitions and scanning methods to be used in the daily rheumatologic practice and clinical trials (Table 1).15 Furthermore, it developed a semiquantitative scale to assess the degree of synovitis in US B-mode and PD mode (Table 2).15
The use of US to find subclinical synovitis in patients with RA considered to be in clinical remission is a new issue.16 Some reports have demonstrated progressive joint damage in these patients with evidence of active inflammation on PDUS despite clinical remission.17,18 More prospective studies are required to provide a better understanding of the long-term effects of residual inflammation and the proper long-term treatment of these patients. Furthermore, the PD signal has been shown to be superior to the Disease Activity Score 28 (DAS-28) in evaluating disease activity, particularly in predicting joint damage.18
Ultrasound may be considered the gold standard imaging tool for the assessment of tendons in inflammatory arthritis and includes the detection of tenosynovitis and anatomical damage represented by the loss of the normal fibrillar echotexture and loss of definition of the tendon margins, which may occur in early disease.19,20 Tenosynovitis of the extensor carpi ulnaris (ECU) detected by US has been shown to be an independent predictive factor of erosive joint damage, suggesting that ECU tenosynovitis represents a useful ultrasonographic landmark in the diagnosis of early RA.21
The availability of new nonbiologic and biologic therapies for inflammatory arthritis has raised the importance of identifying early changes, such as the detection of early erosions, which portend a poor long-term prognosis. The capability of US in identifying this lesion at an earlier stage compared with conventional radiography (CR) has allowed the early diagnosis and treatment of these patients before irreversible joint destruction occurs.22 In spite of all the supportive evidence of US utility in RA, it is not considered among the mandatory diagnostic criteria in the ACR/EULAR classification criteria for RA.5 Still, the addition of US findings to these criteria has increased the number of patients who fulfilled the 1987 ACR classification criteria for RA after 18 months of follow-up.23 Despite extensive evidence of its utility in the diagnosis and monitoring of RA, further studies are still needed.
Spondyloarthritis
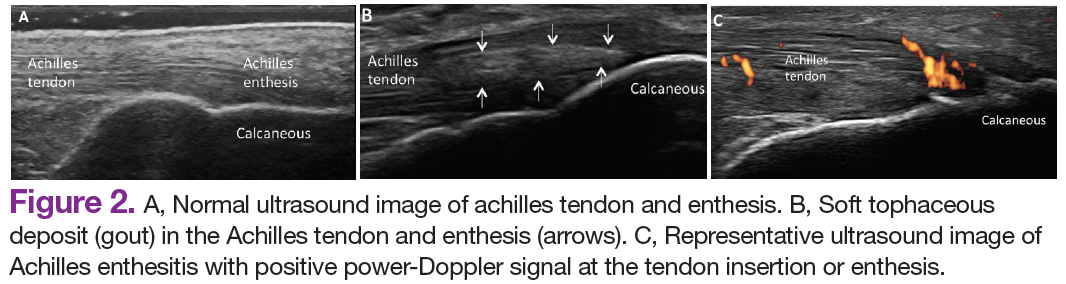
Similar to RA, SpA discloses sonographic findings of inflammatory arthritis; however, with more entheseal and tenosynovium involvement. Ultrasound has also been used in the early identification of characteristic changes of the skin and nail tissues, which can aid the global assessment of this heterogeneous disease, especially in psoriatic arthritis (PsA). The most common locations of enthesitis in SpA are the quadriceps and the Achilles enthesis.24,25
Although US offers detailed imaging for the assessment of both tendons and enthesis, there is a lack of literature evaluating dactylitis. The OMERACT group recently released a composite measure of activity and severity of US dactylitis, which included newly defined elementary US lesions that may discern dactylitis of a digit.26,27 Ultrasound has been compared with MRI in the detection of SpA-related synovitis of the hands and feet and has demonstrated competitive diagnostic sensitivity.28 Ultrasound also shows higher sensitivity in detecting synovitis of the hands and feet compared with clinical examination and CR in PsA.28,29 Unfortunately, there are no strongly validated US findings that can aid in the differential diagnosis of PsA against other chronic inflammatory arthritides. The presence of peritendinous extensor tendon inflammation was a highly specific sonographic feature of PsA, because it was present in 66% of metacarpophalangeal (MCP) joints as the only US sign of inflammation compared with patients with RA.30
Another application of US is in the evaluation of subclinical inflammation at the enthesis in patients with a history of psoriasis without prior history of PsA.27,31 In those patients with psoriatic nail changes, more subclinical enthesitis was found compared with patients with psoriasis without nail involvement.32 Furthermore, subclinical joint inflammation has also been described.33 These findings suggest a possible predictive value in patients with psoriasis who should be monitored on a regular basis, because they are at risk of developing PsA.
Subclinical enthesitis by US imaging has been described in patients with recurrent anterior uveitis and inflammatory bowel disease.34,35 In cases where SpA is suspected but diagnostic criteria are not fulfilled, the presence of one enthesis with increased PD signal highly predicts the eventual development of SpA.36 Therefore, B-mode and PD evaluations of the entheses are critical in the identification of patients who are at an increased risk of developing SpA.37 Treatment monitoring is performed by using a US scoring system in a follow-up evaluation of patients with PsA. Some of the scoring systems have evaluated changes in B-mode US lesions (enthesis and soft tissues, such as skin and nails), whereas others focus on changes in the PD signal.37,38
The Five Targets Power Doppler for Psoriatic Disease PD scoring system comprises the assessment of PD signal in the joint, tendon with synovial sheath, enthesis, skin, and nails. Each of the targets is scored from 0 to 3 points, with a maximum of 15 total points. Some studies have shown that PDUS can provide valuable information in the evaluation of psoriatic plaques and onychopathy in patients with psoriasis and PsA.39 The detection of a PD signal within the dermis and nail bed is equivalent to active inflammation in these sites.39-41 However, further studies with larger cohorts proving inter- and intra-observer reliability are necessary to consolidate these findings and comfortably apply them in clinical practice.
Osteoarthritis
Increasingly US is studied for its validity and reliability in evaluating periarticular soft tissue and cartilage changes in knee OA. The associated US findings include a high prevalence of synovitis with a low prevalence of a PD signal, the presence of osteophytes, and joint space narrowing.42,43 Increased PD signal, synovial hypertrophy, and joint effusion were observed in patients with radiographically erosive OA compared with those with radiographically nonerosive OA.44
Bone erosions and inflammatory changes are also frequently detected by US in both erosive and nodal hand OA.45 Compared with MRI, US has shown a good to excellent correlation in the assessment of osteophytes, bone erosions, synovitis, and tenosynovitis in erosive and hand nodal OA.46 In comparison with CR, US has shown to have a higher sensitivity in the assessment of bony erosions, osteophytes, and space narrowing.47 Ultrasound is able to detect changes in the earlier stages of cartilage erosion in OA, characterized by loss of the sharp contour and variations in the echogenicity of the cartilage matrix, asymmetric shrinkage, and ultimately the disappearance of the cartilaginous band, which is more evident in the later stages of OA.45
Similar to RA management, US has been used to monitor disease activity and response to OA treatment. Patients who received intra-articular hyaluronic acid or intramuscular methylprednisolone for OA treatment were found to have a decrease of PD signal intensity and synovial effusion posttreatment.48 One could extrapolate these findings and conclude that US could be an additional tool for monitoring disease activity and assessing response to local and systemic treatments in OA.
Crystalline Arthropathies
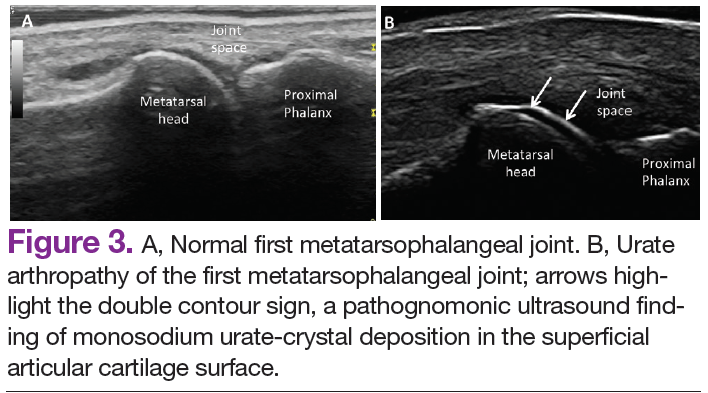
Ultrasound application to crystal diseases facilitates the identification of microcrystalline deposits within the synovial membrane (joints), cartilage (both hyaline cartilage and fibrocartilage), and periarticular tissues (tendons, bursae, and soft tissues). Crystals appear as hyperechogenic spots of different sizes and shapes that can be seen in both articular and periarticular tissues.49,50 The crystal deposition pattern on hyaline cartilage allows the differentiation between monosodium urate (MSU) and calcium pyrophosphate dehydrate (CPP) crystals. The MSU crystals are deposited at the chondrosynovial (or superficial) margin of the hyaline cartilage and described sonographically as the double contour sign in gout, whereas CPP crystals are deposited within the intermediate layer of the hyaline cartilage and are seen as hyperechoic spots frequently described as rosary beads on US.6,49,50
Other important sites that can be evaluated to determine the presence of CPP crystals include the menisci, symphysis pubis, and triangular fibrocartilage at the wrists, hips, and shoulders. Recent EULAR recommendations have incorporated US as part of the diagnostic imaging modality for the diagnosis of CPPD and more recently for gout.6,51 Tophi are seen as MSU precipitates deposited in the joint cavity, tendons, and/or periarticular tissues such as bursae. They can show different echogenic signal. Soft tophi can demonstrate high PD signal due to high vascularization. On the other hand, hard tophi are hyperechoic on B-mode due to the presence of calcification, which does not allow passage of US waves, creating postacoustic shadowing.8 Studies have evaluated the predictive role of US in evaluating patients with asymptomatic hyperuricemia without any prior history of crystal-related joint disease and found tophaceous deposits in the triceps and patellar and quadriceps tendons.52-55 Studies have also looked at using US in the assessment of treatment response to serum uratelowering therapy in patients with gout.56,57 These studies have noted an improvement in the double contour sign, hyperechoic spots, cloudy areas in the synovial fluid, and tophus diameter and size in those patients who achieved a treat-to-target with a serum uric acid level ≤ 6 mg/dL. Patients who did not reach this target had no changes in the gout US features.56-57 Larger cohort studies are needed to confirm these findings.
An active inflammatory process can be determined by using a PD signal in the acute gout setting with increased vascularization; however, an increased PD signal can also be seen in septic arthritis or tenosynovitis, which sometimes can coexist with crystal-induced arthritis. Therefore, diagnostic arthrocentesis, Gram stain, and culture, as well as evaluation of crystals under polarized microscopy, are still recommended.
Therapeutic Interventions
Real-time visualization of the injection needle by US allows reliable placement of the needle tip in the tissue or cavity of interest. Multiple studies have shown the low accuracy of palpation-guided injection for reaching the site of interest.58,59 Some studies have shown a higher response rate to US-guided injections compared with palpation-guided as well as a higher rate of successful aspirations and clinical outcomes. Meta-analyses have demonstrated improved treatment response with the use of US-guided procedures compared with blinded injections.60,61 Ultrasound-guided interventions are performed in both peripheral and axial joints.62 The most common US-guided procedures at the VA rheumatology clinic include arthrocentesis and intra-articular corticosteroid injections of small and medium-sized joints, such as MCP joints, elbows, wrists, and ankles.
Conclusions
Ultrasound is becoming a relevant part of rheumatology practice and research and can be regarded as a feasible and effective imaging technique that can allow real-time recognition of early anatomical changes, provide careful guidance for aspiration, and monitor local and/or systemic treatment response at the joint, tendon, enthesis, nail, and skin levels. Ultrasound is a user-friendly imaging modality readily applied at the bedside and considered an extension of the rheumatologist's physical examination.
The success of US depends on the individual operator. For this reason, structured educational programs during fellowship training programs and an efficient competency assessment system would facilitate proper implementation of US in rheumatology practice as performed by some but not all institutions.
Author disclosures
The authors report no actual or potential conflicts of interest with regard to this article.
Disclaimer
The opinions expressed herein are those of the authors and do not necessarily reflect those of Federal Practitioner, Frontline Medical Communications Inc., the U.S. Government, or any of its agencies. This article may discuss unlabeled or investigational use of certain drugs. Please review the complete prescribing information for specific drugs or drug combinations—including indications, contraindications, warnings, and adverse effects—before administering pharmacologic therapy to patients.
1. Naredo E, D’Agostino MA, Conaghan PG, et al. Current state of musculoskeletal ultrasound training and implementation in Europe: results of a survey of experts and scientific societies. Rheumatology (Oxford). 2010;49(12):2438-2943.
2. Micu MC, Alcalde M, Sáenz JI, et al. Impact of musculoskeletal ultrasound in an outpatient rheumatology clinic. Arthritis Care Res (Hoboken). 2013;65(4):615-621.
3. Koski JM. Ultrasound guided injections in rheumatology. J Rheumatol. 2000;27(9):2131-2138.
4. Kelly S, Humby F, Filer A, et al. Ultrasound-guided synovial biopsy: a safe, well-tolerated and reliable technique for obtaining high-quality synovial tissue from both large and small joints in early arthritis patients. Ann Rheum Dis. 2015;74(3):611-617.
5. Aletaha D, Neogi T, Silman AJ, et al. 2010 rheumatoid arthritis classification criteria: an American College of Rheumatology/European League Against Rheumatism collaborative initiative. Arthritis Rheum Dis. 2010;69(9):1580-1588.
6. Zhang W, Doherty M, Bardin T, et al. European League Against Rheumatism recommendations for calcium pyrophosphate deposition. Part I: terminology and diagnosis. Ann Rheum Dis. 2011;70(4):563-570.
7. Dasgupta B, Cimmino MA, Kremers HM, et al. 2012 provisional classification criteria for polymyalgia rheumatica: a European League Against Rheumatism/ American College of Rheumatology collaborative initiative. Arthritis Rheum. 2012;64(4):943-954.
8. Fodor D, Nestorova R, Vlad V, Micu M. The place of musculoskeletal ultrasonography in gout diagnosis. Med Ultrason. 2014;16(4):336-344.
9. Takagi Y, Sumi M, Nakamura H, et al. Ultrasonography as an additional item in the American College of Rheumatology classification of Sjögren’s syndrome. Rheumatology (Oxford). 2014;53(11):1977-1983.
10. Colebatch AN, Edwards CJ, Østergaard M, et al. EULAR recommendations for the use of imaging of the joints in the clinical management of rheumatoid arthritis. Ann Rheum Dis. 2013;72(6):804-814.
11. American College of Rheumatology Musculoskeletal Ultrasound Task Force. Ultrasound in American rheumatology practice: report of the American College of Rheumatology musculoskeletal ultrasound task force. Arthritis Care Res (Hoboken). 2010;62(9):1206-1219.
12. McAlindon T, Kissin E, Nazarian L, et al. American College of Rheumatology report on reasonable use of musculoskeletal ultrasonography in rheumatology clinical practice. Arthritis Care Res (Hoboken). 2012;64(11):1625-1640.
13. Naredo E, Möller I, Cruz A, Carmona L, Garrido J. Power Doppler ultrasonographic monitoring of response to anti-tumor necrosis factor therapy in patients with rheumatoid arthritis. Arthritis Rheum. 2008;58(8):2248-2256.
14. Newman JS, Laing TJ, McCarthy CJ, Adler RS. Power Doppler sonography of synovitis: assessment of therapeutic response—preliminary observations. Radiology. 1996;198(2):582-584.
15. Wakefield RJ, Balint PV, Szkudlarek M, et al; OMERACT 7 Special Interest Group. Musculoskeletal ultrasound including definitions for ultrasonographic pathology. J Rheumatol. 2005;32(12):2485-2487.
16. Wakefield RJ, Green MJ, Marzo-Ortega H, et al. Should oligoarthritis be reclassified? Ultrasound reveals a high prevalence of subclinical disease. Ann Rheum Dis. 2004;63(4):382-385.
17. Brown AK, Quinn MA, Karim Z, et al. Presence of significant synovitis in rheumatoid arthritis patients with disease-modifying antirheumatic drug-induced clinical remission: evidence from an imaging study may explain structural progression. Arthritis Rheum. 2006;54(12):3761-3773.
18. Brown AK, Conaghan PG, Karim Z, et al. An explanation for the apparent dissociation between clinical remission and continued structural deterioration in rheumatoid arthritis. Arthritis Rheum. 2008;58(10):2958-2967.
19. Bruyn GA, Hanova P, Iagnocco A, et al; OMERACT Ultrasound Task Force. Ultrasound definition of tendon damage in patients with rheumatoid arthritis. Results of a OMERACT consensus-based ultrasound score focusing on the diagnostic reliability. Ann Rheum Dis. 2014;73(11):1929-1934.
20. Filippucci E, Gabba A, Di Geso L, Girolimetti R, Salaffi F, Grassi W. Hand tendon involvement in rheumatoid arthritis: an ultrasound study. Semin Arthritis Rheum. 2012;41(6):752-760.
21. Lillegraven S, Bøyesen P, Hammer HB, et al. Tenosynovitis of the extensor carpi ulnaris tendon predicts erosive progression in early rheumatoid arthritis. Ann Rheum Dis. 2011;70(11):2049-2050.
22. Baillet A, Gaujoux-Viala C, Mouterde G, et al. Comparison of the efficacy of sonography, magnetic resonance imaging and conventional radiography for the detection of bone erosions in rheumatoid arthritis patients: a systematic review and meta-analysis. Rheumatology (Oxford). 2011;50(6):1137-1147.
23. Filer A, de Pablo P, Allen G, et al. Utility of ultrasound joint counts in the prediction of rheumatoid arthritis in patients with very early synovitis. Ann Rheum Dis. 2011;70(3):500-507.
24. Frediani B, Falsetti P, Storri L, et al. Quadricepital tendon enthesitis in psoriatic arthritis and rheumatoid arthritis: ultrasound examinations and clinical correlations. J Rheumatol. 2001;28(11):2566-2568.
25. D’Agostino MA, Said-Nahal R, Hacquard-Bouder C, Brasseur JL, Dougados M, Breban M. Assessment of peripheral enthesitis in the spondylarthropathies by ultrasonography combined with power Doppler: a cross-sectional study. Arthritis Rheum. 2003;48(2):523-533.
26. Gisondi P, Tinazzi I, El-Dalati G, et al. Lower limb enthesopathy in patients with psoriasis without clinical signs of arthropathy: a hospital-based case-control study. Ann Rheum Dis. 2008;67(1):26-30.
27. Gutierrez M, Filippucci E, De Angelis R, et al. Subclinical entheseal involvement
in patients with psoriasis: an ultrasound study. Semin Arthritis Rheum. 2011;40(5):407-412.
28. Weiner SM, Jurenz S, Uhl M, et al. Ultrasonography in the assessment of peripheral joint involvement in psoriatic arthritis: a comparison with radiography, MRI and scintigraphy. Clin Rheumatol. 2008;27(8):983-989.
29. Balint PV, Kane D, Wilson H, McInnes IB, Sturrock RD. Ultrasonography of entheseal insertions in the lower limb in spondyloarthropathy. Ann Rheum Dis. 2002;61(10):905-910.
30. Gutierrez M, Filippucci E, Salaffi F, Di Geso L, Grassi W. Differential diagnosis
between rheumatoid arthritis and psoriatic arthritis: the value of ultrasound findings at metacarpophalangeal joints level. Ann Rheum Dis. 2011;70(6):1111-1114.
31. De Miguel E, Cobo T, Muñoz-Fernández S, et al. Validity of enthesis ultrasound assessment in spondyloarthropathy. Ann Rheum Dis. 2009;68(2):169-174.
32. Ash ZR, Tinazzi I, Gallego CC, et al. Psoriasis patients with nail disease have a greater magnitude of underlying systemic subclinical enthesopathy than those with normal nails. Ann Rheum Dis. 2012;71(4):553-556.
33. Naredo E, Möller I, de Miguel E, et al; Ultrasound School of the Spanish Society of Rheumatology and Spanish ECO-APs Group. High prevalence of ultrasonographic synovitis and enthesopathy in patients with psoriasis without psoriatic arthritis: a prospective case-control study. Rheumatology (Oxford). 2011;50(10):1838-1848.
34. Muñoz-Fernández S, de Miguel E, Cobo-Ibáñez T, et al. Enthesis inflammation in recurrent acute anterior uveitis without spondylarthritis. Arthritis Rheum. 2009;60(7):1985-1990.
35. Bandinelli F, Milla M, Genise S, et al. Ultrasound discloses entheseal involvement
in inactive and low active inflammatory bowel disease without clinical signs and symptoms of spondyloarthropathy. Rheumatology (Oxford). 2011;50(7):1275-1279.
36. D’Agostino MA, Aegerter P, Bechara K, et al. How to diagnose spondyloarthritis early? Accuracy of peripheral enthesitis detection by power Doppler ultrasonography. Ann Rheum Dis. 2011;70(8):1433-1440.
37. Aydin SZ, Karadag O, Filippucci E, et al. Monitoring Achilles enthesitis in ankylosing spondylitis during TNF-alpha antagonist therapy: an ultrasound study. Rheumatology (Oxford). 2010;49(3):578-582.
38. Naredo E, Batlle-Gualda E, Garcia-Vivar ML, et al; Ultrasound Group of the Spanish Society of Rheumatology. Power Doppler ultrasonography assessment of entheses in spondyloarthropathies: response to therapy of entheseal abnormalities. J Rheumatol. 2010;37(10):2110-2117.
39. Gutierrez M, Di Geso L, Salaffi F, et al. Development of a preliminary US power Doppler composite score for monitoring treatment in PsA. Rheumatology (Oxford). 2012;51(7):1261-1268.
40. Gutierrez M, De Angelis R, Bernardini ML, et al. Clinical, power Doppler sonography and histological assessment of the psoriatic plaque: short-term monitoring in patients treated with etanercept. Br J Dermatol. 2011;164(1):33-37.
41. Gutierrez M, Filippucci E, Bertolazzi C, Grassi W. Sonographic monitoring of psoriatic plaque. J Rheumatol. 2009;36(4):850-851.
42. Keen HI, Wakefield RJ, Grainger AJ, Hensor EM, Emery P, Conaghan PG. An ultrasonographic study of osteoarthritis of the hand: synovitis and its relationship to structural pathology and symptoms. Arthritis Rheum. 2008;59(12):1756-1763.
43. Kortekaas MC, Kwok WY, Reijnierse M, Watt I, Huizinga TW, Kloppenburg M. Pain in hand osteoarthritis is associated with inflammation: the value of ultrasound. Ann Rheum Dis. 2010;69(7):1367-1369.
44. Mancarella L, Magnani M, Addimanda O, Pignotti E, Galletti S, Meliconi R. Ultrasound-detected synovitis with power Doppler signal is associated with severe radiographic damage and reduced cartilage thickness in hand osteoarthritis. Osteoarthritis Cartilage. 2010;18(10):1263-1268.
45. Möller I, Bong D, Naredo E, et al. Ultrasound in the study and monitoring of osteoarthritis. Osteoarthritis Cartilage. 2008;16(suppl 3):S4-S7.
46. Vlychou M, Koutroumpas A, Alexiou I, Fezoulidis I, Sakkas LI. High-resolution ultrasonography and 3.0 T magnetic resonance imaging in erosive and nodal hand osteoarthritis: high frequency of erosions in nodal osteoarthritis. Clin Rheumatol. 2013;32(6):755-762.
47. Keen HI, Wakefield RJ, Grainger AJ, Hensor EM, Emery P, Conaghan PG. Can ultrasonography improve on radiographic assessment in osteoarthritis of the hands? A comparison between radiographic and ultrasonographic detected pathology. Ann Rheum Dis. 2008;67(8):1116-1120.
48. Keen HI, Wakefield RJ, Hensor EM, Emery P, Conaghan PG. Response of symptoms
and synovitis to intra-muscular methylprednisolone in osteoarthritis of the hand: an ultrasonographic study. Rheumatology (Oxford). 2010;49(6):1093-1100.
49. Grassi W, Meenagh G, Pascual E, Filippucci E. “Crystal clear”-sonographic assessment of gout and calcium pyrophosphate deposition disease. Semin Arthritis Rheum. 2006;36(3):197-202.
50. Ciapetti A, Filippucci E, Gutierrez M, Grassi W. Calcium pyrophosphate dihydrate crystal deposition disease: sonographic findings. Clin Rheumatol. 2009;28(3):271-276.
51. Taylor WJ, Fransen J, Jansen TL, et al. Study for Updated Gout Classification Criteria (SUGAR): identification of features to classify gout. Arthritis Care Res (Hoboken). [Published online ahead of print March 16, 2015.]
52. Puig JG, de Miguel E, Castillo MC, Rocha AL, Martinez MA, Torres RJ. Asymptomatic hyperuricemia: impact of ultrasonography. Nucleosides Nucleotides Nucleic Acids. 2008;27(6):592-595.
53. Pineda C, Amezcua-Guerra LM, Solano C, et al. Joint and tendon subclinical involvement suggestive of gouty arthritis in asymptomatic hyperuricemia: an ultrasound controlled study. Arthritis Res Ther. 2011;13(1):R4.
54. Naredo E, Uson J, Jiménez-Palop M, et al. Ultrasound-detected musculoskeletal urate crystal deposition: which joints and what findings should be assessed for diagnosing gout? Ann Rheum Dis. 2014;73(8):1522-1528.
55. De Miguel E, Puig JG, Castillo C, Peiteado D, Torres RJ, Martín-Mola E. Diagnosis of gout in patients with asymptomatic hyperuricaemia: a pilot ultrasound study. Ann Rheum Dis. 2012;71(1):157-158.
56. Perez-Ruiz F, Martin I, Canteli B. Ultrasonographic measurement of tophi as an outcome measure for chronic gout. J Rheumatol. 2007;34(9):1888-1893.
57. Thiele RG, Schlesinger N. Ultrasonography shows disappearance of monosodium urate crystal deposition on hyaline cartilage after sustained normouricemia is achieved. Rheumatol Int. 2010;30(4):495-503.
58. Balint PV, Kane D, Hunter J, McInnes IB, Field M, Sturrock RD. Ultrasound guided versus conventional joint and soft tissue fluid aspiration in rheumatology practice: a pilot study. J Rheumatol. 2002;29(10):2209-2213.
59. Raza K, Lee CY, Pilling D, et al. Ultrasound guidance allows accurate needle placement and aspiration from small joints in patients with early inflammatory arthritis. Rheumatology (Oxford). 2003;42(8):976-979.
60. Dubreuil M, Greger S, LaValley M, Cunnington J, Sibbitt WL Jr, Kissin EY. Improvement in wrist pain with ultrasound-guided glucocorticoid injections: a metaanalysis of individual patient data. Semin Arthritis Rheum. 2013;42(5):492-497.
61. Sage W, Pickup L, Smith TO, Denton ER, Toms AP. The clinical and functional outcomes of ultrasound-guided vs landmark-guided injections for adults with shoulder pathology—a systematic review and meta-analysis. Rheumatology (Oxford). 2013;52(4):743-751.
62. Darrieutort-Laffite C, Hamel O, Glémarec J, Maugars Y, Le Goff B. Ultrasonography of the lumbar spine: sonoanatomy and practical applications. Joint Bone Spine. 2014;81(2):130-136.
Over the past 2 decades, an increasing number of rheumatologists have progressively incorporated ultrasound (US) as an invaluable diagnostic and monitoring tool into their clinical and research practice.1,2 This imaging modality has become an established aid incorporated into the clinical evaluation of periarticular and articular structures involved in the diagnosis of several rheumatic disorders.
Ultrasound is a safe, noninvasive, patient-friendly imaging modality with a lack of contraindications and free of ionizing radiation. It allows real-time evaluation with dynamic assessment in a multiplanar view, assessment of multiple targets, and lower cost compared with magnetic resonance imaging (MRI) or computerized tomography scan. Above all, for the rheumatologist, US provides real-time scanning of all peripheral joints as many times as is required at the time of consultation. It is of great advantage in the assessment of a wide spectrum of abnormalities in rheumatic diseases with the potential of point-of-care imaging modality in the clinical evaluation and management of the patient. It facilitates a direct correlation between imaging findings and clinical data that improves the approach to a wide range of rheumatic diseases, from acute to chronic inflammatory arthritis, crystalline arthropathies, osteoarthritis (OA), spondyloarthropathies (SpA), vasculitis, and soft tissue syndromes. In addition, US is a bedside tool for performing accurate and safe diagnostic arthrocentesis, injections, and synovial biopsies.3,4
Recently, a gradual attempt has been made to incorporate US into rheumatology disease classification or diagnostic criteria for rheumatoid arthritis (RA), polymyalgia rheumatica, gout, calcium pyrophosphate deposition disease (CPPD), and Sjögren’s syndrome.5-10 Furthermore, the American College of Rheumatology (ACR) and the European League Against Rheumatism (EULAR) have produced evidence and expert opinion-based recommendations on the use of US in the clinical management of rheumatic diseases.10-12 This article highlights the most common applications of US for assessment and management of different rheumatic diseases frequently encountered at the VAMC rheumatology inpatient and outpatient clinical service.
Evaluation of Inflammatory Arthritis
In RA and any other inflammatory arthritis, US has been used for the detection of joint effusions, synovitis, bone erosions, and tendon and enthesis involvement.11,12 Ultrasound B-mode and power Doppler (PD) techniques have demonstrated a consistent and relevant role in optimizing the diagnosis, assessing the inflammatory activity, monitoring response to therapy, and predicting the inflammatory arthritis outcomes (Figures 1-3).10-12 Ultrasound provides real-time information about the status of the synovial membrane, tendons, cartilage, bursae, and cortical bones, allowing an accurate assessment of the degree of inflammatory process in periarticular and articular tissues. Also, US can provide details about the characteristics of the collected fluid (ie, effusion or synovial hypertrophy), which is fundamental for the correct interpretation of the pathologic joint and/or soft tissue processes. The inflammatory process can be assessed by using PD mode, which detects and quantifies the vascular changes in the pannus due to vasodilation and the increased blood flow characteristic of active inflammation.13,14
The Outcomes Measures in Rheumatoid Arthritis Clinical Trials (OMERACT) study group developed standardized sonopathologic definitions and scanning methods to be used in the daily rheumatologic practice and clinical trials (Table 1).15 Furthermore, it developed a semiquantitative scale to assess the degree of synovitis in US B-mode and PD mode (Table 2).15
The use of US to find subclinical synovitis in patients with RA considered to be in clinical remission is a new issue.16 Some reports have demonstrated progressive joint damage in these patients with evidence of active inflammation on PDUS despite clinical remission.17,18 More prospective studies are required to provide a better understanding of the long-term effects of residual inflammation and the proper long-term treatment of these patients. Furthermore, the PD signal has been shown to be superior to the Disease Activity Score 28 (DAS-28) in evaluating disease activity, particularly in predicting joint damage.18
Ultrasound may be considered the gold standard imaging tool for the assessment of tendons in inflammatory arthritis and includes the detection of tenosynovitis and anatomical damage represented by the loss of the normal fibrillar echotexture and loss of definition of the tendon margins, which may occur in early disease.19,20 Tenosynovitis of the extensor carpi ulnaris (ECU) detected by US has been shown to be an independent predictive factor of erosive joint damage, suggesting that ECU tenosynovitis represents a useful ultrasonographic landmark in the diagnosis of early RA.21
The availability of new nonbiologic and biologic therapies for inflammatory arthritis has raised the importance of identifying early changes, such as the detection of early erosions, which portend a poor long-term prognosis. The capability of US in identifying this lesion at an earlier stage compared with conventional radiography (CR) has allowed the early diagnosis and treatment of these patients before irreversible joint destruction occurs.22 In spite of all the supportive evidence of US utility in RA, it is not considered among the mandatory diagnostic criteria in the ACR/EULAR classification criteria for RA.5 Still, the addition of US findings to these criteria has increased the number of patients who fulfilled the 1987 ACR classification criteria for RA after 18 months of follow-up.23 Despite extensive evidence of its utility in the diagnosis and monitoring of RA, further studies are still needed.
Spondyloarthritis
Similar to RA, SpA discloses sonographic findings of inflammatory arthritis; however, with more entheseal and tenosynovium involvement. Ultrasound has also been used in the early identification of characteristic changes of the skin and nail tissues, which can aid the global assessment of this heterogeneous disease, especially in psoriatic arthritis (PsA). The most common locations of enthesitis in SpA are the quadriceps and the Achilles enthesis.24,25
Although US offers detailed imaging for the assessment of both tendons and enthesis, there is a lack of literature evaluating dactylitis. The OMERACT group recently released a composite measure of activity and severity of US dactylitis, which included newly defined elementary US lesions that may discern dactylitis of a digit.26,27 Ultrasound has been compared with MRI in the detection of SpA-related synovitis of the hands and feet and has demonstrated competitive diagnostic sensitivity.28 Ultrasound also shows higher sensitivity in detecting synovitis of the hands and feet compared with clinical examination and CR in PsA.28,29 Unfortunately, there are no strongly validated US findings that can aid in the differential diagnosis of PsA against other chronic inflammatory arthritides. The presence of peritendinous extensor tendon inflammation was a highly specific sonographic feature of PsA, because it was present in 66% of metacarpophalangeal (MCP) joints as the only US sign of inflammation compared with patients with RA.30
Another application of US is in the evaluation of subclinical inflammation at the enthesis in patients with a history of psoriasis without prior history of PsA.27,31 In those patients with psoriatic nail changes, more subclinical enthesitis was found compared with patients with psoriasis without nail involvement.32 Furthermore, subclinical joint inflammation has also been described.33 These findings suggest a possible predictive value in patients with psoriasis who should be monitored on a regular basis, because they are at risk of developing PsA.
Subclinical enthesitis by US imaging has been described in patients with recurrent anterior uveitis and inflammatory bowel disease.34,35 In cases where SpA is suspected but diagnostic criteria are not fulfilled, the presence of one enthesis with increased PD signal highly predicts the eventual development of SpA.36 Therefore, B-mode and PD evaluations of the entheses are critical in the identification of patients who are at an increased risk of developing SpA.37 Treatment monitoring is performed by using a US scoring system in a follow-up evaluation of patients with PsA. Some of the scoring systems have evaluated changes in B-mode US lesions (enthesis and soft tissues, such as skin and nails), whereas others focus on changes in the PD signal.37,38
The Five Targets Power Doppler for Psoriatic Disease PD scoring system comprises the assessment of PD signal in the joint, tendon with synovial sheath, enthesis, skin, and nails. Each of the targets is scored from 0 to 3 points, with a maximum of 15 total points. Some studies have shown that PDUS can provide valuable information in the evaluation of psoriatic plaques and onychopathy in patients with psoriasis and PsA.39 The detection of a PD signal within the dermis and nail bed is equivalent to active inflammation in these sites.39-41 However, further studies with larger cohorts proving inter- and intra-observer reliability are necessary to consolidate these findings and comfortably apply them in clinical practice.
Osteoarthritis
Increasingly US is studied for its validity and reliability in evaluating periarticular soft tissue and cartilage changes in knee OA. The associated US findings include a high prevalence of synovitis with a low prevalence of a PD signal, the presence of osteophytes, and joint space narrowing.42,43 Increased PD signal, synovial hypertrophy, and joint effusion were observed in patients with radiographically erosive OA compared with those with radiographically nonerosive OA.44
Bone erosions and inflammatory changes are also frequently detected by US in both erosive and nodal hand OA.45 Compared with MRI, US has shown a good to excellent correlation in the assessment of osteophytes, bone erosions, synovitis, and tenosynovitis in erosive and hand nodal OA.46 In comparison with CR, US has shown to have a higher sensitivity in the assessment of bony erosions, osteophytes, and space narrowing.47 Ultrasound is able to detect changes in the earlier stages of cartilage erosion in OA, characterized by loss of the sharp contour and variations in the echogenicity of the cartilage matrix, asymmetric shrinkage, and ultimately the disappearance of the cartilaginous band, which is more evident in the later stages of OA.45
Similar to RA management, US has been used to monitor disease activity and response to OA treatment. Patients who received intra-articular hyaluronic acid or intramuscular methylprednisolone for OA treatment were found to have a decrease of PD signal intensity and synovial effusion posttreatment.48 One could extrapolate these findings and conclude that US could be an additional tool for monitoring disease activity and assessing response to local and systemic treatments in OA.
Crystalline Arthropathies
Ultrasound application to crystal diseases facilitates the identification of microcrystalline deposits within the synovial membrane (joints), cartilage (both hyaline cartilage and fibrocartilage), and periarticular tissues (tendons, bursae, and soft tissues). Crystals appear as hyperechogenic spots of different sizes and shapes that can be seen in both articular and periarticular tissues.49,50 The crystal deposition pattern on hyaline cartilage allows the differentiation between monosodium urate (MSU) and calcium pyrophosphate dehydrate (CPP) crystals. The MSU crystals are deposited at the chondrosynovial (or superficial) margin of the hyaline cartilage and described sonographically as the double contour sign in gout, whereas CPP crystals are deposited within the intermediate layer of the hyaline cartilage and are seen as hyperechoic spots frequently described as rosary beads on US.6,49,50
Other important sites that can be evaluated to determine the presence of CPP crystals include the menisci, symphysis pubis, and triangular fibrocartilage at the wrists, hips, and shoulders. Recent EULAR recommendations have incorporated US as part of the diagnostic imaging modality for the diagnosis of CPPD and more recently for gout.6,51 Tophi are seen as MSU precipitates deposited in the joint cavity, tendons, and/or periarticular tissues such as bursae. They can show different echogenic signal. Soft tophi can demonstrate high PD signal due to high vascularization. On the other hand, hard tophi are hyperechoic on B-mode due to the presence of calcification, which does not allow passage of US waves, creating postacoustic shadowing.8 Studies have evaluated the predictive role of US in evaluating patients with asymptomatic hyperuricemia without any prior history of crystal-related joint disease and found tophaceous deposits in the triceps and patellar and quadriceps tendons.52-55 Studies have also looked at using US in the assessment of treatment response to serum uratelowering therapy in patients with gout.56,57 These studies have noted an improvement in the double contour sign, hyperechoic spots, cloudy areas in the synovial fluid, and tophus diameter and size in those patients who achieved a treat-to-target with a serum uric acid level ≤ 6 mg/dL. Patients who did not reach this target had no changes in the gout US features.56-57 Larger cohort studies are needed to confirm these findings.
An active inflammatory process can be determined by using a PD signal in the acute gout setting with increased vascularization; however, an increased PD signal can also be seen in septic arthritis or tenosynovitis, which sometimes can coexist with crystal-induced arthritis. Therefore, diagnostic arthrocentesis, Gram stain, and culture, as well as evaluation of crystals under polarized microscopy, are still recommended.
Therapeutic Interventions
Real-time visualization of the injection needle by US allows reliable placement of the needle tip in the tissue or cavity of interest. Multiple studies have shown the low accuracy of palpation-guided injection for reaching the site of interest.58,59 Some studies have shown a higher response rate to US-guided injections compared with palpation-guided as well as a higher rate of successful aspirations and clinical outcomes. Meta-analyses have demonstrated improved treatment response with the use of US-guided procedures compared with blinded injections.60,61 Ultrasound-guided interventions are performed in both peripheral and axial joints.62 The most common US-guided procedures at the VA rheumatology clinic include arthrocentesis and intra-articular corticosteroid injections of small and medium-sized joints, such as MCP joints, elbows, wrists, and ankles.
Conclusions
Ultrasound is becoming a relevant part of rheumatology practice and research and can be regarded as a feasible and effective imaging technique that can allow real-time recognition of early anatomical changes, provide careful guidance for aspiration, and monitor local and/or systemic treatment response at the joint, tendon, enthesis, nail, and skin levels. Ultrasound is a user-friendly imaging modality readily applied at the bedside and considered an extension of the rheumatologist's physical examination.
The success of US depends on the individual operator. For this reason, structured educational programs during fellowship training programs and an efficient competency assessment system would facilitate proper implementation of US in rheumatology practice as performed by some but not all institutions.
Author disclosures
The authors report no actual or potential conflicts of interest with regard to this article.
Disclaimer
The opinions expressed herein are those of the authors and do not necessarily reflect those of Federal Practitioner, Frontline Medical Communications Inc., the U.S. Government, or any of its agencies. This article may discuss unlabeled or investigational use of certain drugs. Please review the complete prescribing information for specific drugs or drug combinations—including indications, contraindications, warnings, and adverse effects—before administering pharmacologic therapy to patients.
1. Naredo E, D’Agostino MA, Conaghan PG, et al. Current state of musculoskeletal ultrasound training and implementation in Europe: results of a survey of experts and scientific societies. Rheumatology (Oxford). 2010;49(12):2438-2943.
2. Micu MC, Alcalde M, Sáenz JI, et al. Impact of musculoskeletal ultrasound in an outpatient rheumatology clinic. Arthritis Care Res (Hoboken). 2013;65(4):615-621.
3. Koski JM. Ultrasound guided injections in rheumatology. J Rheumatol. 2000;27(9):2131-2138.
4. Kelly S, Humby F, Filer A, et al. Ultrasound-guided synovial biopsy: a safe, well-tolerated and reliable technique for obtaining high-quality synovial tissue from both large and small joints in early arthritis patients. Ann Rheum Dis. 2015;74(3):611-617.
5. Aletaha D, Neogi T, Silman AJ, et al. 2010 rheumatoid arthritis classification criteria: an American College of Rheumatology/European League Against Rheumatism collaborative initiative. Arthritis Rheum Dis. 2010;69(9):1580-1588.
6. Zhang W, Doherty M, Bardin T, et al. European League Against Rheumatism recommendations for calcium pyrophosphate deposition. Part I: terminology and diagnosis. Ann Rheum Dis. 2011;70(4):563-570.
7. Dasgupta B, Cimmino MA, Kremers HM, et al. 2012 provisional classification criteria for polymyalgia rheumatica: a European League Against Rheumatism/ American College of Rheumatology collaborative initiative. Arthritis Rheum. 2012;64(4):943-954.
8. Fodor D, Nestorova R, Vlad V, Micu M. The place of musculoskeletal ultrasonography in gout diagnosis. Med Ultrason. 2014;16(4):336-344.
9. Takagi Y, Sumi M, Nakamura H, et al. Ultrasonography as an additional item in the American College of Rheumatology classification of Sjögren’s syndrome. Rheumatology (Oxford). 2014;53(11):1977-1983.
10. Colebatch AN, Edwards CJ, Østergaard M, et al. EULAR recommendations for the use of imaging of the joints in the clinical management of rheumatoid arthritis. Ann Rheum Dis. 2013;72(6):804-814.
11. American College of Rheumatology Musculoskeletal Ultrasound Task Force. Ultrasound in American rheumatology practice: report of the American College of Rheumatology musculoskeletal ultrasound task force. Arthritis Care Res (Hoboken). 2010;62(9):1206-1219.
12. McAlindon T, Kissin E, Nazarian L, et al. American College of Rheumatology report on reasonable use of musculoskeletal ultrasonography in rheumatology clinical practice. Arthritis Care Res (Hoboken). 2012;64(11):1625-1640.
13. Naredo E, Möller I, Cruz A, Carmona L, Garrido J. Power Doppler ultrasonographic monitoring of response to anti-tumor necrosis factor therapy in patients with rheumatoid arthritis. Arthritis Rheum. 2008;58(8):2248-2256.
14. Newman JS, Laing TJ, McCarthy CJ, Adler RS. Power Doppler sonography of synovitis: assessment of therapeutic response—preliminary observations. Radiology. 1996;198(2):582-584.
15. Wakefield RJ, Balint PV, Szkudlarek M, et al; OMERACT 7 Special Interest Group. Musculoskeletal ultrasound including definitions for ultrasonographic pathology. J Rheumatol. 2005;32(12):2485-2487.
16. Wakefield RJ, Green MJ, Marzo-Ortega H, et al. Should oligoarthritis be reclassified? Ultrasound reveals a high prevalence of subclinical disease. Ann Rheum Dis. 2004;63(4):382-385.
17. Brown AK, Quinn MA, Karim Z, et al. Presence of significant synovitis in rheumatoid arthritis patients with disease-modifying antirheumatic drug-induced clinical remission: evidence from an imaging study may explain structural progression. Arthritis Rheum. 2006;54(12):3761-3773.
18. Brown AK, Conaghan PG, Karim Z, et al. An explanation for the apparent dissociation between clinical remission and continued structural deterioration in rheumatoid arthritis. Arthritis Rheum. 2008;58(10):2958-2967.
19. Bruyn GA, Hanova P, Iagnocco A, et al; OMERACT Ultrasound Task Force. Ultrasound definition of tendon damage in patients with rheumatoid arthritis. Results of a OMERACT consensus-based ultrasound score focusing on the diagnostic reliability. Ann Rheum Dis. 2014;73(11):1929-1934.
20. Filippucci E, Gabba A, Di Geso L, Girolimetti R, Salaffi F, Grassi W. Hand tendon involvement in rheumatoid arthritis: an ultrasound study. Semin Arthritis Rheum. 2012;41(6):752-760.
21. Lillegraven S, Bøyesen P, Hammer HB, et al. Tenosynovitis of the extensor carpi ulnaris tendon predicts erosive progression in early rheumatoid arthritis. Ann Rheum Dis. 2011;70(11):2049-2050.
22. Baillet A, Gaujoux-Viala C, Mouterde G, et al. Comparison of the efficacy of sonography, magnetic resonance imaging and conventional radiography for the detection of bone erosions in rheumatoid arthritis patients: a systematic review and meta-analysis. Rheumatology (Oxford). 2011;50(6):1137-1147.
23. Filer A, de Pablo P, Allen G, et al. Utility of ultrasound joint counts in the prediction of rheumatoid arthritis in patients with very early synovitis. Ann Rheum Dis. 2011;70(3):500-507.
24. Frediani B, Falsetti P, Storri L, et al. Quadricepital tendon enthesitis in psoriatic arthritis and rheumatoid arthritis: ultrasound examinations and clinical correlations. J Rheumatol. 2001;28(11):2566-2568.
25. D’Agostino MA, Said-Nahal R, Hacquard-Bouder C, Brasseur JL, Dougados M, Breban M. Assessment of peripheral enthesitis in the spondylarthropathies by ultrasonography combined with power Doppler: a cross-sectional study. Arthritis Rheum. 2003;48(2):523-533.
26. Gisondi P, Tinazzi I, El-Dalati G, et al. Lower limb enthesopathy in patients with psoriasis without clinical signs of arthropathy: a hospital-based case-control study. Ann Rheum Dis. 2008;67(1):26-30.
27. Gutierrez M, Filippucci E, De Angelis R, et al. Subclinical entheseal involvement
in patients with psoriasis: an ultrasound study. Semin Arthritis Rheum. 2011;40(5):407-412.
28. Weiner SM, Jurenz S, Uhl M, et al. Ultrasonography in the assessment of peripheral joint involvement in psoriatic arthritis: a comparison with radiography, MRI and scintigraphy. Clin Rheumatol. 2008;27(8):983-989.
29. Balint PV, Kane D, Wilson H, McInnes IB, Sturrock RD. Ultrasonography of entheseal insertions in the lower limb in spondyloarthropathy. Ann Rheum Dis. 2002;61(10):905-910.
30. Gutierrez M, Filippucci E, Salaffi F, Di Geso L, Grassi W. Differential diagnosis
between rheumatoid arthritis and psoriatic arthritis: the value of ultrasound findings at metacarpophalangeal joints level. Ann Rheum Dis. 2011;70(6):1111-1114.
31. De Miguel E, Cobo T, Muñoz-Fernández S, et al. Validity of enthesis ultrasound assessment in spondyloarthropathy. Ann Rheum Dis. 2009;68(2):169-174.
32. Ash ZR, Tinazzi I, Gallego CC, et al. Psoriasis patients with nail disease have a greater magnitude of underlying systemic subclinical enthesopathy than those with normal nails. Ann Rheum Dis. 2012;71(4):553-556.
33. Naredo E, Möller I, de Miguel E, et al; Ultrasound School of the Spanish Society of Rheumatology and Spanish ECO-APs Group. High prevalence of ultrasonographic synovitis and enthesopathy in patients with psoriasis without psoriatic arthritis: a prospective case-control study. Rheumatology (Oxford). 2011;50(10):1838-1848.
34. Muñoz-Fernández S, de Miguel E, Cobo-Ibáñez T, et al. Enthesis inflammation in recurrent acute anterior uveitis without spondylarthritis. Arthritis Rheum. 2009;60(7):1985-1990.
35. Bandinelli F, Milla M, Genise S, et al. Ultrasound discloses entheseal involvement
in inactive and low active inflammatory bowel disease without clinical signs and symptoms of spondyloarthropathy. Rheumatology (Oxford). 2011;50(7):1275-1279.
36. D’Agostino MA, Aegerter P, Bechara K, et al. How to diagnose spondyloarthritis early? Accuracy of peripheral enthesitis detection by power Doppler ultrasonography. Ann Rheum Dis. 2011;70(8):1433-1440.
37. Aydin SZ, Karadag O, Filippucci E, et al. Monitoring Achilles enthesitis in ankylosing spondylitis during TNF-alpha antagonist therapy: an ultrasound study. Rheumatology (Oxford). 2010;49(3):578-582.
38. Naredo E, Batlle-Gualda E, Garcia-Vivar ML, et al; Ultrasound Group of the Spanish Society of Rheumatology. Power Doppler ultrasonography assessment of entheses in spondyloarthropathies: response to therapy of entheseal abnormalities. J Rheumatol. 2010;37(10):2110-2117.
39. Gutierrez M, Di Geso L, Salaffi F, et al. Development of a preliminary US power Doppler composite score for monitoring treatment in PsA. Rheumatology (Oxford). 2012;51(7):1261-1268.
40. Gutierrez M, De Angelis R, Bernardini ML, et al. Clinical, power Doppler sonography and histological assessment of the psoriatic plaque: short-term monitoring in patients treated with etanercept. Br J Dermatol. 2011;164(1):33-37.
41. Gutierrez M, Filippucci E, Bertolazzi C, Grassi W. Sonographic monitoring of psoriatic plaque. J Rheumatol. 2009;36(4):850-851.
42. Keen HI, Wakefield RJ, Grainger AJ, Hensor EM, Emery P, Conaghan PG. An ultrasonographic study of osteoarthritis of the hand: synovitis and its relationship to structural pathology and symptoms. Arthritis Rheum. 2008;59(12):1756-1763.
43. Kortekaas MC, Kwok WY, Reijnierse M, Watt I, Huizinga TW, Kloppenburg M. Pain in hand osteoarthritis is associated with inflammation: the value of ultrasound. Ann Rheum Dis. 2010;69(7):1367-1369.
44. Mancarella L, Magnani M, Addimanda O, Pignotti E, Galletti S, Meliconi R. Ultrasound-detected synovitis with power Doppler signal is associated with severe radiographic damage and reduced cartilage thickness in hand osteoarthritis. Osteoarthritis Cartilage. 2010;18(10):1263-1268.
45. Möller I, Bong D, Naredo E, et al. Ultrasound in the study and monitoring of osteoarthritis. Osteoarthritis Cartilage. 2008;16(suppl 3):S4-S7.
46. Vlychou M, Koutroumpas A, Alexiou I, Fezoulidis I, Sakkas LI. High-resolution ultrasonography and 3.0 T magnetic resonance imaging in erosive and nodal hand osteoarthritis: high frequency of erosions in nodal osteoarthritis. Clin Rheumatol. 2013;32(6):755-762.
47. Keen HI, Wakefield RJ, Grainger AJ, Hensor EM, Emery P, Conaghan PG. Can ultrasonography improve on radiographic assessment in osteoarthritis of the hands? A comparison between radiographic and ultrasonographic detected pathology. Ann Rheum Dis. 2008;67(8):1116-1120.
48. Keen HI, Wakefield RJ, Hensor EM, Emery P, Conaghan PG. Response of symptoms
and synovitis to intra-muscular methylprednisolone in osteoarthritis of the hand: an ultrasonographic study. Rheumatology (Oxford). 2010;49(6):1093-1100.
49. Grassi W, Meenagh G, Pascual E, Filippucci E. “Crystal clear”-sonographic assessment of gout and calcium pyrophosphate deposition disease. Semin Arthritis Rheum. 2006;36(3):197-202.
50. Ciapetti A, Filippucci E, Gutierrez M, Grassi W. Calcium pyrophosphate dihydrate crystal deposition disease: sonographic findings. Clin Rheumatol. 2009;28(3):271-276.
51. Taylor WJ, Fransen J, Jansen TL, et al. Study for Updated Gout Classification Criteria (SUGAR): identification of features to classify gout. Arthritis Care Res (Hoboken). [Published online ahead of print March 16, 2015.]
52. Puig JG, de Miguel E, Castillo MC, Rocha AL, Martinez MA, Torres RJ. Asymptomatic hyperuricemia: impact of ultrasonography. Nucleosides Nucleotides Nucleic Acids. 2008;27(6):592-595.
53. Pineda C, Amezcua-Guerra LM, Solano C, et al. Joint and tendon subclinical involvement suggestive of gouty arthritis in asymptomatic hyperuricemia: an ultrasound controlled study. Arthritis Res Ther. 2011;13(1):R4.
54. Naredo E, Uson J, Jiménez-Palop M, et al. Ultrasound-detected musculoskeletal urate crystal deposition: which joints and what findings should be assessed for diagnosing gout? Ann Rheum Dis. 2014;73(8):1522-1528.
55. De Miguel E, Puig JG, Castillo C, Peiteado D, Torres RJ, Martín-Mola E. Diagnosis of gout in patients with asymptomatic hyperuricaemia: a pilot ultrasound study. Ann Rheum Dis. 2012;71(1):157-158.
56. Perez-Ruiz F, Martin I, Canteli B. Ultrasonographic measurement of tophi as an outcome measure for chronic gout. J Rheumatol. 2007;34(9):1888-1893.
57. Thiele RG, Schlesinger N. Ultrasonography shows disappearance of monosodium urate crystal deposition on hyaline cartilage after sustained normouricemia is achieved. Rheumatol Int. 2010;30(4):495-503.
58. Balint PV, Kane D, Hunter J, McInnes IB, Field M, Sturrock RD. Ultrasound guided versus conventional joint and soft tissue fluid aspiration in rheumatology practice: a pilot study. J Rheumatol. 2002;29(10):2209-2213.
59. Raza K, Lee CY, Pilling D, et al. Ultrasound guidance allows accurate needle placement and aspiration from small joints in patients with early inflammatory arthritis. Rheumatology (Oxford). 2003;42(8):976-979.
60. Dubreuil M, Greger S, LaValley M, Cunnington J, Sibbitt WL Jr, Kissin EY. Improvement in wrist pain with ultrasound-guided glucocorticoid injections: a metaanalysis of individual patient data. Semin Arthritis Rheum. 2013;42(5):492-497.
61. Sage W, Pickup L, Smith TO, Denton ER, Toms AP. The clinical and functional outcomes of ultrasound-guided vs landmark-guided injections for adults with shoulder pathology—a systematic review and meta-analysis. Rheumatology (Oxford). 2013;52(4):743-751.
62. Darrieutort-Laffite C, Hamel O, Glémarec J, Maugars Y, Le Goff B. Ultrasonography of the lumbar spine: sonoanatomy and practical applications. Joint Bone Spine. 2014;81(2):130-136.
Treatment of Unstable Trochanteric Femur Fractures: Proximal Femur Nail Versus Proximal Femur Locking Compression Plate
Take-Home Points
- Both PFN and PFLCP are effective treatments for unstable trochanteric femur fractures.
- PFN is superior to PFLCP only in terms of shorter incisions and shorter time to full weight-bearing.
- Both devices have good long-term functional outcomes.
- Complication rates in unstable trochanteric fractures treated with both implants are comparable.
- Larger randomized controlled multicenter studies are needed to further evaluate and compare both implants in displaced unstable trochanteric femur fractures.
Trochanteric fractures are among the most widely treated orthopedic injuries, occurring mainly as low-energy injuries in elderly patients and high-energy injuries in younger patients.1,2 About half of these injuries are unstable.3 According to the AO/OTA (Arbeitsgemeinschaft für Osteosynthesefragen/Orthopaedic Trauma Association) system, trochanteric fractures can be classified stable (AO/OTA 31.A1-1 to 31.A2-1) or unstable (AO/OTA 31.A2-2 to 31.A3.3).4,5 For surgical fixation of trochanteric femur fractures, various internal fixation devices have been used, either extramedullary (EM) or intramedullary (IM).6 The dynamic hip screw (DHS) is the implant of choice in the treatment of stable trochanteric femur fractures (AO/OTA 31-A1), as it provides secure fixation and controlled impaction.7 Mechanical and technical failures continue to occur in up to 6% to 18% of cases of unstable trochanteric fractures treated with DHS.8 Excessive sliding of the lag screw within the plate barrel results in limb shortening and distal fragment medialization, which are the main causes of these failures.9,10 Dissatisfaction with DHS use in unstable fractures led to the use of IM nails. The various IM devices available are condylocephalic (Ender) nails and cephalomedullary nails, such as gamma nails; IM hip screws; trochanteric antegrade nails; proximal femoral nails (PFNs); and trochanteric fixation nails.11,12 Unstable trochanteric fractures treated with these IM fixation devices have had good results.12-14 Because of their central location and shorter lever arm, IM nails decrease the tensile strain on the implant and thereby reduce the risk of implant failure and provide more efficient load transfer while maintaining the advantage of controlled fracture impaction, as in DHS.15,16 According to some authors, IM nail insertion theoretically requires less operative time and less soft-tissue dissection, potentially resulting in decreased overall morbidity.15,16 PFN is one of the most effective fixation methods used to treat unstable trochanteric femur fractures.17 However, it is associated with various technical problems and failures, such as anterior femoral cortex penetration (caused by mismatch of nail curvature and intact femur), lag screw prominence in the lateral thigh, creation of a large hole in the greater trochanter (leading to abductors weakness), and potential for the Z-effect.18,19 Studies have compared PFN with the Less Invasive Stabilization System-Distal Femur (LISS-DF) in the treatment of proximal femur fracture, and the clinical results are encouraging.20,21 Recently, the proximal femoral locking compression plate (PFLCP) was introduced as a new implant that allows for angular-stable plating in the treatment of complex comminuted and osteoporotic intertrochanteric fractures.22,23
To our knowledge, our study is the first to compare functional outcomes and complications of unstable trochanteric fractures treated with PFN and those treated with PFLCP. We hypothesized that both PFN and PFLCP would provide good functional outcomes with acceptable and comparable complications in the treatment of unstable trochanteric fractures.
Materials and Methods
The protocol for this prospective comparative study was approved by the Institutional Review Board at Mayo Institute of Medical Sciences. Informed consent was provided by all patients. A power analysis with power of 90% to detect a Harris Hip Score (HHS) difference of 10 as being significant at the 5% level, and with a 10% to 15% dropout rate, determined that a sample size of 50 patients was needed. Each group (PFN, PFLCP) required at least 25 participants. From April 2009 to June 2011, 74 patients with unilateral closed unstable trochanteric fractures were admitted to our hospital. Of these patients, 48 met our inclusion criteria and were included in the study. A sealed envelope method was used to randomly assign 24 of these patients to PFN treatment and the other 24 to PFLCP treatment. One patient died of causes unrelated to an implant during the study, and 2 were lost to follow-up (telephone numbers changed). The remaining 45 patients (23 PFN, 22 PFLCP) reached 2-year follow-up.
Inclusion criteria were unilateral, closed unstable trochanteric fractures, and age over 18 years. Exclusion criteria were bilateral fractures, polytrauma, pathologic fractures, open fractures (American Society of Anesthesiologists [ASA] grade 4 or 5),24 and associated hip osteoarthritis (Kellgren-Lawrence grade 3 or 4).25 We collected data on demographics, operative time, incision length, intraoperative blood loss (measured by gravimetric method), hospital length of stay (LOS), and time to full weight-bearing. Mean (SD) age was 58.3 (9.3) years for the PFN group (range, 19-82 years) and 60.5 (8.1) years for the PFLCP group (range, 20-84 years). 
Before surgery, each patient’s standard plain radiographs (1 anteroposterior [AP], 1 lateral) were evaluated. Patients underwent surgery as soon as their general medical condition allowed. Surgery was performed through a lateral approach with the patient supine and in traction on a fracture table. PFN patients received 2 femoral neck screws (DePuy Synthes) (Figures A-D), and PFLCP patients received PFLCP (DePuy Synthes) in a fashion similar to that described in AO internal fixation manuals. 
Absolute values of differences were used for statistical analysis. For categorical outcome variables (eg, reoperation reason and type), Pearson χ2 test was used; for continuous variables (eg, pain, HHS), Student t test was used. Statistical significance was set at P = .05 (2-sided).
Results
Intraoperative blood loss (P = .02) and incision length (P = .008) were significantly less in the PFN group than in the PFLCP group. No significant difference was found between the groups in terms of operative time (P = .08), reduction quality (P = .82), radiologic exposure time (P = .18), LOS (P = .32), union rate (P = .42), and time to union (P = .68). 
Two PFN patients and 3 PFLCP patients developed a superficial infection (P = .36); all 5 infections were controlled with oral antibiotics. There was 1 nonunion in the PFN group but none in the PFLCP group (P = .28). The nonunion patient, who also had a broken implant without any history of fresh trauma, was treated with implant removal and bipolar hemiarthroplasty. 
There was no significant difference between the groups in terms of functional outcome (HHS) at final follow-up (P = .48). 
Discussion
The goal in managing proximal femoral fractures is to achieve near anatomical reduction with stable fracture fixation. Over the years, EM and IM devices have been used to treat trochanteric fractures; each has its merits and demerits.29,30 However, unstable trochanteric fractures treated with EM devices (eg, DHS, dynamic condylar screw) have high complication rates (6%-18%).8,31 Excessive sliding of the lag screw within the plate barrel may result in limb shortening and distal fragment medialization. EM devices cannot adequately prevent secondary limb shortening after weight-bearing, owing to medialization of the distal fragment.32,33 Varus collapse and implant failure (eg, cut-out of the femoral head screw) are also common.29 These complications led to the development of IM hip screw devices, such as PFN, which has several potential advantages, including a shorter lever arm (decreases tensile strain on implant) and efficient load transfer capacity. PFN has been found to have increased fracture stability, with no difference in operative time or intraoperative complication rates, but some studies have reported implant failure and other complications (3%-17%) in PFN-treated unstable trochanteric fractures.29,34,35
We conducted the present study to compare PFN and PFLCP, new treatment options for unstable and highly comminuted trochanteric fractures. The characteristics of the patients in this study are very different from those in most hip fracture studies. Our PFN and PFLCP groups’ mean ages were lower relative to other studies.14,15,36 In addition, time from injury to surgery was longer for both our groups than for groups in other studies, though some studies36 have reported comparable times. Moreover, our groups showed no statistically significant differences in operative time, radiologic exposure time, LOS, union rate, or time to union. Our PFN patients had significantly shorter incisions and less time to full weight-bearing.
Wang and colleagues37 compared the clinical outcomes of DHS, IM fixation (IMF), and PFLCP in the treatment of trochanteric fractures in elderly patients. Incision length and operative time were shorter for the IMF group than for DHS and PFLCP, but there were no significant differences between DHS and PFLCP. Intraoperative blood loss, rehabilitation, and time to healing were less for the IMF and PFLCP groups than for DHS, but there were no significant differences between IMF and PFLCP. Functional recovery was better for the IMF and PFLCP groups than for DHS, and there were significant differences among the 3 groups. There were fewer complications in the PFLCP group than in IMF and DHS.
Yao and colleagues38 compared reverse LISS and PFN treatment of intertrochanteric fractures and reported no significant differences in operative time, intraoperative blood loss, or functional outcome. Regarding complications, the PFN group had none, and the LISS group had 3 (1 nonunion with locking screw breakage, 2 varus unions).
Haq and colleagues39 compared PFN and contralateral reverse distal femoral locking compression plate (reverse DFLCP) in the management of unstable intertrochanteric fractures with compromised lateral wall and reported better intraoperative variables, better functional outcomes, and lower failure rates in the PFN group than in the reverse DFLCP group.
Zha and colleagues22 followed up 110 patients with intertrochanteric and subtrochanteric fractures treated with PFLCP fixation and reported a 100% union rate at 1-year follow-up. Mean operative time was 35.5minutes, and mean bleeding amount was 150mL, which included operative blood loss and wound drainage. Mean radiologic exposure time was 5minutes, and mean incision length was 9cm. There was 1 case of implant breakage.
Strohm and colleagues40 reported good results in children with trochanteric fractures treated with conventional locking compression plate.
Brett and colleagues41 compared blade plate and PFLCP with and without a kickstand screw in a composite femur subtrochanteric fracture gap model. In their biomechanical study, the PFLCP with a kickstand screw provided higher axial but less torsional stiffness than the blade plate. The authors concluded that, though the devices are biomechanically equivalent, PFLCP may allow percutaneous insertion that avoids the potential morbidity associated with the blade plate’s extensile approach.
Our PFN group’s mean (SD) time to healing was 4.2 (1.3) months. In other studies, mean healing time for IMF-treated unstable trochanteric fractures was 3 to 4 months. Some authors have reported even longer healing times, up to 17 months,42 for PFN-treated trochanteric fractures. Many of the studies indicated that gradual weight-bearing was allowed around 6 weeks, when callus formation was adequate.43 Our treatment protocol differed in that its protected weight-bearing period was prolonged, and controlled weight-bearing was delayed until around 6 weeks, when callus formation was adequate.
The better PFLCP outcomes in our study, relative to most other studies, can be attributed to the relatively younger age of our PFN and PFLCP groups. In a study of 19 patients with trochanteric fractures treated with open reduction and internal fixation using PFLCP, Wirtz and colleagues44 reported 4 cases of secondary varus collapse, 2 cut-outs of the proximal fragment, and 1 implant failure caused by a broken proximal screw. Eight patients experienced persistent trochanteric pain, and 3 underwent hardware removal.
Streubel and colleagues45 retrospectively analyzed 29 patients with 30 OTA 31.A3 fractures treated with PFLCP and reported 11 failures (37%) at 20-month follow-up. The most frequent failure mode (5 cases) was varus collapse with screw cut-out. Presence of a kickstand screw and medial cortical reduction were not significantly different between cases that failed and those that did not.
Glassner and Tejwani46 retrospectively studied 10 patients with trochanteric fractures treated with open reduction and internal fixation with PFLCP. Failure modes were implant fracture (4 cases) and fixation loss (3 cases) resulting from varus collapse and implant cutout.
One of our PFN patients had a lower neck screw back out by 9-month follow-up. As the fracture had consolidated well, the patient underwent screw removal. Another PFN patient had a broken implant and fracture nonunion at 1-year follow-up. Various complications have been reported in the literature,13,14,47,48 but none occurred in our study. There were no implant-related complications in our PFLCP group, possibly because of the mechanical advantage of 3-dimensional and angular-stable fixation with PFLCP in unstable trochanteric fractures.
Gadegone and Salphale49 analyzed 100 cases of PFN-treated trochanteric fractures and reported femoral head cut-through (4.8%), intraoperative femoral shaft fracture (0.8%), implant breakage (0.8%), wound-healing impairment (9.7%), and false placement of osteosynthesis materials (0.8%). The 19% reoperation rate in their study mainly involved cephalic screw removal for lateral protrusion at the proximal thigh. Our PFN reoperation rate was 8.7%; none of our PFLCP patients required revision surgery.
Tyllianakis and colleagues50 analyzed 45 cases of PFN-treated unstable trochanteric fractures and concluded technical or mechanical complications were related more to fracture type, surgical technique, and time to weight-bearing than to the implant itself. Our postoperative wound complication rate was similar to that of other studies.14,47,51 Regarding functional outcomes, our groups’ HHSs were good and comparable at final follow-up, as were their PPM scores.
This study was limited in that it was a small prospective comparative single-center study with a small number of patients. Larger randomized controlled multicenter studies are needed to evaluate and compare both implants in displaced unstable trochanteric femur fractures.
This study found that both PFN and PFLCP were effective treatments for unstable trochanteric femur fractures. PFN is superior to PFLCP only in terms of shorter incisions and shorter time to full weight-bearing. Both devices can be used in unstable trochanteric fractures, and both have good functional outcomes and acceptable complication rates.
Am J Orthop. 2017;46(2):E116-E123. Copyright Frontline Medical Communications Inc. 2017. All rights reserved.
1. Cummings SR, Rubin SM, Black D. The future of hip fractures in the United States. Numbers, costs, and potential effects of postmenopausal estrogen. Clin Orthop Relat Res. 1990;(252):163-166.
2. Kyle RF, Cabanela ME, Russell TA, et al. Fractures of the proximal part of the femur. Instr Course Lect. 1995;44:227-253.
3. Koval KJ, Aharonoff GB, Rokito AS, Lyon T, Zuckerman JD. Patients with femoral neck and intertrochanteric fractures. Are they the same? Clin Orthop Relat Res. 1996;(330):166-172.
4. Marsh JL, Slongo TF, Agel J, et al. Fracture and dislocation classification compendium - 2007: Orthopaedic Trauma Association classification, database and outcomes committee. J Orthop Trauma. 2007;21(10 suppl):S1-S133.
5. Lindskog D, Baumgaertner MR. Unstable intertrochanteric hip fractures in the elderly. J Am Acad Orthop Surg. 2004;12(3):179-190.
6. Kokoroghiannis C, Aktselis I, Deligeorgis A, Fragkomichalos E, Papadimas D, Pappadas I. Evolving concepts of stability and intramedullary fixation of intertrochanteric fractures—a review. Injury. 2012;43(6):686-693.
7. Larsson S, Friberg S, Hansson LI. Trochanteric fractures. Influence of reduction and implant position on impaction and complications. Clin Orthop Relat Res. 1990;(259):130-139.
8. Simpson AH, Varty K, Dodd CA. Sliding hip screws: modes of failure. Injury. 1989;20(4):227-231.
9. Rha JD, Kim YH, Yoon SI, Park TS, Lee MH. Factors affecting sliding of the lag screw in intertrochanteric fractures. Int Orthop. 1993;17(5):320-324.
10. Baixauli F, Vicent V, Baixauli E, et al. A reinforced rigid fixation device for unstable intertrochanteric fractures. Clin Orthop Relat Res. 1999;(361):205-215.
11. Harrington P, Nihal A, Singhania AK, Howell FR. Intramedullary hip screw versus sliding hip screw for unstable intertrochanteric femoral fractures in the elderly. Injury. 2002;33(1):23-28.
12. Parker MJ, Handoll HH. Gamma and other cephalocondylic intramedullary nails versus extramedullary implants for extracapsular hip fractures in adults. Cochrane Database Syst Rev. 2010;(9):CD000093.
13. Pajarinen J, Lindahl J, Michelsson O, Savolainen V, Hirvensalo E. Pertrochanteric femoral fractures treated with a dynamic hip screw or a proximal femoral nail. A randomised study comparing postoperative rehabilitation. J Bone Joint Surg Br. 2005;87(1):76-81.
14. Papasimos S, Koutsojannis CM, Panagopoulos A, Megas P, Lambiris E. A randomised comparison of AMBI, TGN and PFN for treatment of unstable trochanteric fractures. Arch Orthop Trauma Surg. 2005;125(7):462-468.
15. Saudan M, Lübbeke A, Sadowski C, Riand N, Stern R, Hoffmeyer P. Pertrochanteric fractures: is there an advantage to an intramedullary nail? A randomized, prospective study of 206 patients comparing the dynamic hip screw and proximal femoral nail. J Orthop Trauma. 2002;16(6):386-393.
16. Schipper IB, Steyerberg EW, Castelein RM, et al. Treatment of unstable trochanteric fractures. Randomised comparison of the gamma nail and the proximal femoral nail. J Bone Joint Surg Br. 2004;86(1):86-94.
17. Gardenbroek TJ, Segers MJ, Simmermacher RK, Hammacher ER. The proximal femur nail antirotation: an identifiable improvement in the treatment of unstable pertrochanteric fractures? J Trauma. 2011;71(1):169-174.
18. Egol KA, Chang EY, Cvitkovic J, Kummer FJ, Koval KJ. Mismatch of current intramedullary nails with the anterior bow of the femur. J Orthop Trauma. 2004;18(7):410-415.
19. Werner-Tutschku W, Lajtai G, Schmiedhuber G, Lang T, Pirkl C, Orthner E. Intra- and perioperative complications in the stabilization of per- and subtrochanteric femoral fractures by means of PFN [in German]. Unfallchirurg. 2002;105(10):881-885.
20. Ma CH, Tu YK, Yu SW, Yen CY, Yeh JH, Wu CH. Reverse LISS plates for unstable proximal femoral fractures. Injury. 2010;41(8):827-833.
21. Pryce Lewis JR, Ashcroft GP. Reverse LISS plating for proximal segmental femoral fractures in the polytrauma patient: a case report. Injury. 2007;38(2):235-239.
22. Zha GC, Chen ZL, Qi XB, Sun JY. Treatment of pertrochanteric fractures with a proximal femur locking compression plate. Injury. 2011;42(11):1294-1299.
23. Oh CW, Kim JJ, Byun YS, et al. Minimally invasive plate osteosynthesis of subtrochanteric femur fractures with a locking plate: a prospective series of 20 fractures. Arch Orthop Trauma Surg. 2009;129(12):1659-1665.
24. American Society of Anesthesiologists new classification of physical status. Anesthesiology. 1963;24:111-114.
25. Kellgren JH, Lawrence JS. Radiological assessment of osteo-arthrosis. Ann Rheum Dis. 1957;16(4):494-502.
26. Vidyadhara S, Rao SK. One and two femoral neck screws with intramedullary nails for unstable trochanteric fractures of femur in the elderly—randomised clinical trial. Injury. 2007;38(7):806-814.
27. Parker MJ, Palmer CR. A new mobility score for predicting mortality after hip fracture. J Bone Joint Surg Br. 1993;75(5):797-798.
28. Harris WH. Traumatic arthritis of the hip after dislocation and acetabular fractures: treatment by mold arthroplasty. An end-result study using a new method of result evaluation. J Bone Joint Surg Am. 1969;51(4):737-755.
29. Sadowski C, Lübbeke A, Saudan M, Riand N, Stern R, Hoffmeyer P. Treatment of reverse oblique and transverse intertrochanteric fractures with use of an intramedullary nail or a 95 degrees screw-plate: a prospective, randomized study. J Bone Joint Surg Am. 2002;84(3):372-381.
30. Suckel AA, Dietz K, Wuelker N, Helwig P. Evaluation of complications of three different types of proximal extra-articular femur fractures: differences in complications, age, sex and surviving rates. Int Orthop. 2007;31(5):689-695.
31. Nuber S, Schönweiss T, Rüter A. Stabilisation of unstable trochanteric femoral fractures. Dynamic hip screw (DHS) with trochanteric stabilisation plate vs. proximal femur nail (PFN) [in German]. Unfallchirurg. 2003;106(1):39-47.
32. Klinger HM, Baums MH, Eckert M, Neugebauer R. A comparative study of unstable per- and intertrochanteric femoral fractures treated with dynamic hip screw (DHS) and trochanteric butt-press plate vs. proximal femoral nail (PFN) [in German]. Zentralbl Chir. 2005;130(4):301-306.
33. Bridle SH, Patel AD, Bircher M, Calvert PT. Fixation of intertrochanteric fractures of the femur. A randomised prospective comparison of the gamma nail and the dynamic hip screw. J Bone Joint Surg Br. 1991;73(2):330-334.
34. Utrilla AL, Reig JS, Muñoz FM, Tufanisco CB. Trochanteric gamma nail and compression hip screw for trochanteric fractures: a randomized, prospective, comparative study in 210 elderly patients with a new design of the gamma nail. J Orthop Trauma. 2005;19(4):229-233.
35. Lenich A, Mayr E, Rüter A, Möckl CH, Füchtmeier B. First results with the trochanter fixation nail (TFN): a report on 120 cases. Arch Orthop Trauma Surg. 2006;126(10):706-712.
36. Tao R, Lu Y, Xu H, Zhou ZY, Wang YH, Liu F. Internal fixation of intertrochanteric hip fractures: a clinical comparison of two implant designs. ScientificWorldJournal. 2013;2013:834825.
37. Wang Y, Yang YY, Yu ZH, Li CQ, Wu YS, Zheng XX. Comparative study of intertrochanteric fractures treated with proximal femur locking compress plate in aged [in Chinese]. Zhongguo Gu Shang. 2011;24(5):370-373.
38. Yao C, Zhang CQ, Jin DX, Chen YF. Early results of reverse less invasive stabilization system plating in treating elderly intertrochanteric fractures: a prospective study compared to proximal femoral nail. Chin Med J (Engl). 2011;124(14):2150-2157.
39. Haq RU, Manhas V, Pankaj A, Srivastava A, Dhammi IK, Jain AK. Proximal femoral nails compared with reverse distal femoral locking plates in intertrochanteric fractures with a compromised lateral wall; a randomised controlled trial. Int Orthop. 2014;38(7):1443-1449.
40. Strohm PC, Schmal H, Kuminack K, Reising K, Südkamp NP. Intertrochanteric femoral fractures in children [in German]. Unfallchirurg. 2006;109(5):425-430.
41. Brett CD, Lee MA, Khalafi AK, Hazelwood SJ. A comparison of percutaneous versus traditional open plate fixation in a subtrochanteric fracture gap model. In: Proceedings of the Annual Meeting of the Orthopaedic Trauma Association (OTA); October 5-7, 2006; Phoenix, AZ. Basic science poster 71 (abstract).
42. Park SY, Yang KH, Yoo JH, Yoon HK, Park HW. The treatment of reverse obliquity intertrochanteric fractures with the intramedullary hip nail. J Trauma. 2008;65(4):852-857.
43. Habernek H, Wallner T, Aschauer E, Schmid L. Comparison of Ender nails, dynamic hip screws, and gamma nails in the treatment of peritrochanteric femoral fractures. Orthopedics. 2000;23(2):121-127.
44. Wirtz C, Abbassi F, Evangelopoulos DS, Kohl S, Siebenrock KA, Krüger A. High failure rate of trochanteric fracture osteosynthesis with proximal femoral locking compression plate. Injury. 2013;44(6):751-756.
45. Streubel PN, Moustoukas MJ, Obremskey WT. Mechanical failure after locking plate fixation of unstable intertrochanteric femur fractures. J Orthop Trauma. 2013;27(1):22-28.
46. Glassner PJ, Tejwani NC. Failure of proximal femoral locking compression plate: a case series. J Orthop Trauma. 2011;25(2):76-83.
47. Ekström W, Karlsson-Thur C, Larsson S, Ragnarsson B, Alberts KA. Functional outcome in treatment of unstable trochanteric and subtrochanteric fractures with the proximal femoral nail and the Medoff sliding plate. J Orthop Trauma. 2007;21(1):18-25.
48. Boldin C, Seibert FJ, Fankhauser F, Peicha G, Grechenig W, Szyszkowitz R. The proximal femoral nail (PFN)—a minimal invasive treatment of unstable proximal femoral fractures: a prospective study of 55 patients with a follow-up of 15 months. Acta Orthop Scand. 2003;74(1):53-58.
49. Gadegone WM, Salphale YS. Proximal femoral nail—an analysis of 100 cases of proximal femoral fractures with an average follow up of 1 year. Int Orthop. 2007;31(3):403-408.
50. Tyllianakis M, Panagopoulos A, Papadopoulos A, Papasimos S, Mousafiris K. Treatment of extracapsular hip fractures with the proximal femoral nail (PFN): long term results in 45 patients. Acta Orthop Belg. 2004;70(5):444-454.
51. Morihara T, Arai Y, Tokugawa S, Fujita S, Chatani K, Kubo T. Proximal femoral nail for treatment of trochanteric femoral fractures. J Orthop Surg (Hong Kong). 2007;15(3):273-277.
Take-Home Points
- Both PFN and PFLCP are effective treatments for unstable trochanteric femur fractures.
- PFN is superior to PFLCP only in terms of shorter incisions and shorter time to full weight-bearing.
- Both devices have good long-term functional outcomes.
- Complication rates in unstable trochanteric fractures treated with both implants are comparable.
- Larger randomized controlled multicenter studies are needed to further evaluate and compare both implants in displaced unstable trochanteric femur fractures.
Trochanteric fractures are among the most widely treated orthopedic injuries, occurring mainly as low-energy injuries in elderly patients and high-energy injuries in younger patients.1,2 About half of these injuries are unstable.3 According to the AO/OTA (Arbeitsgemeinschaft für Osteosynthesefragen/Orthopaedic Trauma Association) system, trochanteric fractures can be classified stable (AO/OTA 31.A1-1 to 31.A2-1) or unstable (AO/OTA 31.A2-2 to 31.A3.3).4,5 For surgical fixation of trochanteric femur fractures, various internal fixation devices have been used, either extramedullary (EM) or intramedullary (IM).6 The dynamic hip screw (DHS) is the implant of choice in the treatment of stable trochanteric femur fractures (AO/OTA 31-A1), as it provides secure fixation and controlled impaction.7 Mechanical and technical failures continue to occur in up to 6% to 18% of cases of unstable trochanteric fractures treated with DHS.8 Excessive sliding of the lag screw within the plate barrel results in limb shortening and distal fragment medialization, which are the main causes of these failures.9,10 Dissatisfaction with DHS use in unstable fractures led to the use of IM nails. The various IM devices available are condylocephalic (Ender) nails and cephalomedullary nails, such as gamma nails; IM hip screws; trochanteric antegrade nails; proximal femoral nails (PFNs); and trochanteric fixation nails.11,12 Unstable trochanteric fractures treated with these IM fixation devices have had good results.12-14 Because of their central location and shorter lever arm, IM nails decrease the tensile strain on the implant and thereby reduce the risk of implant failure and provide more efficient load transfer while maintaining the advantage of controlled fracture impaction, as in DHS.15,16 According to some authors, IM nail insertion theoretically requires less operative time and less soft-tissue dissection, potentially resulting in decreased overall morbidity.15,16 PFN is one of the most effective fixation methods used to treat unstable trochanteric femur fractures.17 However, it is associated with various technical problems and failures, such as anterior femoral cortex penetration (caused by mismatch of nail curvature and intact femur), lag screw prominence in the lateral thigh, creation of a large hole in the greater trochanter (leading to abductors weakness), and potential for the Z-effect.18,19 Studies have compared PFN with the Less Invasive Stabilization System-Distal Femur (LISS-DF) in the treatment of proximal femur fracture, and the clinical results are encouraging.20,21 Recently, the proximal femoral locking compression plate (PFLCP) was introduced as a new implant that allows for angular-stable plating in the treatment of complex comminuted and osteoporotic intertrochanteric fractures.22,23
To our knowledge, our study is the first to compare functional outcomes and complications of unstable trochanteric fractures treated with PFN and those treated with PFLCP. We hypothesized that both PFN and PFLCP would provide good functional outcomes with acceptable and comparable complications in the treatment of unstable trochanteric fractures.
Materials and Methods
The protocol for this prospective comparative study was approved by the Institutional Review Board at Mayo Institute of Medical Sciences. Informed consent was provided by all patients. A power analysis with power of 90% to detect a Harris Hip Score (HHS) difference of 10 as being significant at the 5% level, and with a 10% to 15% dropout rate, determined that a sample size of 50 patients was needed. Each group (PFN, PFLCP) required at least 25 participants. From April 2009 to June 2011, 74 patients with unilateral closed unstable trochanteric fractures were admitted to our hospital. Of these patients, 48 met our inclusion criteria and were included in the study. A sealed envelope method was used to randomly assign 24 of these patients to PFN treatment and the other 24 to PFLCP treatment. One patient died of causes unrelated to an implant during the study, and 2 were lost to follow-up (telephone numbers changed). The remaining 45 patients (23 PFN, 22 PFLCP) reached 2-year follow-up.
Inclusion criteria were unilateral, closed unstable trochanteric fractures, and age over 18 years. Exclusion criteria were bilateral fractures, polytrauma, pathologic fractures, open fractures (American Society of Anesthesiologists [ASA] grade 4 or 5),24 and associated hip osteoarthritis (Kellgren-Lawrence grade 3 or 4).25 We collected data on demographics, operative time, incision length, intraoperative blood loss (measured by gravimetric method), hospital length of stay (LOS), and time to full weight-bearing. Mean (SD) age was 58.3 (9.3) years for the PFN group (range, 19-82 years) and 60.5 (8.1) years for the PFLCP group (range, 20-84 years).
Before surgery, each patient’s standard plain radiographs (1 anteroposterior [AP], 1 lateral) were evaluated. Patients underwent surgery as soon as their general medical condition allowed. Surgery was performed through a lateral approach with the patient supine and in traction on a fracture table. PFN patients received 2 femoral neck screws (DePuy Synthes) (Figures A-D), and PFLCP patients received PFLCP (DePuy Synthes) in a fashion similar to that described in AO internal fixation manuals.
Absolute values of differences were used for statistical analysis. For categorical outcome variables (eg, reoperation reason and type), Pearson χ2 test was used; for continuous variables (eg, pain, HHS), Student t test was used. Statistical significance was set at P = .05 (2-sided).
Results
Intraoperative blood loss (P = .02) and incision length (P = .008) were significantly less in the PFN group than in the PFLCP group. No significant difference was found between the groups in terms of operative time (P = .08), reduction quality (P = .82), radiologic exposure time (P = .18), LOS (P = .32), union rate (P = .42), and time to union (P = .68).
Two PFN patients and 3 PFLCP patients developed a superficial infection (P = .36); all 5 infections were controlled with oral antibiotics. There was 1 nonunion in the PFN group but none in the PFLCP group (P = .28). The nonunion patient, who also had a broken implant without any history of fresh trauma, was treated with implant removal and bipolar hemiarthroplasty.
There was no significant difference between the groups in terms of functional outcome (HHS) at final follow-up (P = .48).
Discussion
The goal in managing proximal femoral fractures is to achieve near anatomical reduction with stable fracture fixation. Over the years, EM and IM devices have been used to treat trochanteric fractures; each has its merits and demerits.29,30 However, unstable trochanteric fractures treated with EM devices (eg, DHS, dynamic condylar screw) have high complication rates (6%-18%).8,31 Excessive sliding of the lag screw within the plate barrel may result in limb shortening and distal fragment medialization. EM devices cannot adequately prevent secondary limb shortening after weight-bearing, owing to medialization of the distal fragment.32,33 Varus collapse and implant failure (eg, cut-out of the femoral head screw) are also common.29 These complications led to the development of IM hip screw devices, such as PFN, which has several potential advantages, including a shorter lever arm (decreases tensile strain on implant) and efficient load transfer capacity. PFN has been found to have increased fracture stability, with no difference in operative time or intraoperative complication rates, but some studies have reported implant failure and other complications (3%-17%) in PFN-treated unstable trochanteric fractures.29,34,35
We conducted the present study to compare PFN and PFLCP, new treatment options for unstable and highly comminuted trochanteric fractures. The characteristics of the patients in this study are very different from those in most hip fracture studies. Our PFN and PFLCP groups’ mean ages were lower relative to other studies.14,15,36 In addition, time from injury to surgery was longer for both our groups than for groups in other studies, though some studies36 have reported comparable times. Moreover, our groups showed no statistically significant differences in operative time, radiologic exposure time, LOS, union rate, or time to union. Our PFN patients had significantly shorter incisions and less time to full weight-bearing.
Wang and colleagues37 compared the clinical outcomes of DHS, IM fixation (IMF), and PFLCP in the treatment of trochanteric fractures in elderly patients. Incision length and operative time were shorter for the IMF group than for DHS and PFLCP, but there were no significant differences between DHS and PFLCP. Intraoperative blood loss, rehabilitation, and time to healing were less for the IMF and PFLCP groups than for DHS, but there were no significant differences between IMF and PFLCP. Functional recovery was better for the IMF and PFLCP groups than for DHS, and there were significant differences among the 3 groups. There were fewer complications in the PFLCP group than in IMF and DHS.
Yao and colleagues38 compared reverse LISS and PFN treatment of intertrochanteric fractures and reported no significant differences in operative time, intraoperative blood loss, or functional outcome. Regarding complications, the PFN group had none, and the LISS group had 3 (1 nonunion with locking screw breakage, 2 varus unions).
Haq and colleagues39 compared PFN and contralateral reverse distal femoral locking compression plate (reverse DFLCP) in the management of unstable intertrochanteric fractures with compromised lateral wall and reported better intraoperative variables, better functional outcomes, and lower failure rates in the PFN group than in the reverse DFLCP group.
Zha and colleagues22 followed up 110 patients with intertrochanteric and subtrochanteric fractures treated with PFLCP fixation and reported a 100% union rate at 1-year follow-up. Mean operative time was 35.5minutes, and mean bleeding amount was 150mL, which included operative blood loss and wound drainage. Mean radiologic exposure time was 5minutes, and mean incision length was 9cm. There was 1 case of implant breakage.
Strohm and colleagues40 reported good results in children with trochanteric fractures treated with conventional locking compression plate.
Brett and colleagues41 compared blade plate and PFLCP with and without a kickstand screw in a composite femur subtrochanteric fracture gap model. In their biomechanical study, the PFLCP with a kickstand screw provided higher axial but less torsional stiffness than the blade plate. The authors concluded that, though the devices are biomechanically equivalent, PFLCP may allow percutaneous insertion that avoids the potential morbidity associated with the blade plate’s extensile approach.
Our PFN group’s mean (SD) time to healing was 4.2 (1.3) months. In other studies, mean healing time for IMF-treated unstable trochanteric fractures was 3 to 4 months. Some authors have reported even longer healing times, up to 17 months,42 for PFN-treated trochanteric fractures. Many of the studies indicated that gradual weight-bearing was allowed around 6 weeks, when callus formation was adequate.43 Our treatment protocol differed in that its protected weight-bearing period was prolonged, and controlled weight-bearing was delayed until around 6 weeks, when callus formation was adequate.
The better PFLCP outcomes in our study, relative to most other studies, can be attributed to the relatively younger age of our PFN and PFLCP groups. In a study of 19 patients with trochanteric fractures treated with open reduction and internal fixation using PFLCP, Wirtz and colleagues44 reported 4 cases of secondary varus collapse, 2 cut-outs of the proximal fragment, and 1 implant failure caused by a broken proximal screw. Eight patients experienced persistent trochanteric pain, and 3 underwent hardware removal.
Streubel and colleagues45 retrospectively analyzed 29 patients with 30 OTA 31.A3 fractures treated with PFLCP and reported 11 failures (37%) at 20-month follow-up. The most frequent failure mode (5 cases) was varus collapse with screw cut-out. Presence of a kickstand screw and medial cortical reduction were not significantly different between cases that failed and those that did not.
Glassner and Tejwani46 retrospectively studied 10 patients with trochanteric fractures treated with open reduction and internal fixation with PFLCP. Failure modes were implant fracture (4 cases) and fixation loss (3 cases) resulting from varus collapse and implant cutout.
One of our PFN patients had a lower neck screw back out by 9-month follow-up. As the fracture had consolidated well, the patient underwent screw removal. Another PFN patient had a broken implant and fracture nonunion at 1-year follow-up. Various complications have been reported in the literature,13,14,47,48 but none occurred in our study. There were no implant-related complications in our PFLCP group, possibly because of the mechanical advantage of 3-dimensional and angular-stable fixation with PFLCP in unstable trochanteric fractures.
Gadegone and Salphale49 analyzed 100 cases of PFN-treated trochanteric fractures and reported femoral head cut-through (4.8%), intraoperative femoral shaft fracture (0.8%), implant breakage (0.8%), wound-healing impairment (9.7%), and false placement of osteosynthesis materials (0.8%). The 19% reoperation rate in their study mainly involved cephalic screw removal for lateral protrusion at the proximal thigh. Our PFN reoperation rate was 8.7%; none of our PFLCP patients required revision surgery.
Tyllianakis and colleagues50 analyzed 45 cases of PFN-treated unstable trochanteric fractures and concluded technical or mechanical complications were related more to fracture type, surgical technique, and time to weight-bearing than to the implant itself. Our postoperative wound complication rate was similar to that of other studies.14,47,51 Regarding functional outcomes, our groups’ HHSs were good and comparable at final follow-up, as were their PPM scores.
This study was limited in that it was a small prospective comparative single-center study with a small number of patients. Larger randomized controlled multicenter studies are needed to evaluate and compare both implants in displaced unstable trochanteric femur fractures.
This study found that both PFN and PFLCP were effective treatments for unstable trochanteric femur fractures. PFN is superior to PFLCP only in terms of shorter incisions and shorter time to full weight-bearing. Both devices can be used in unstable trochanteric fractures, and both have good functional outcomes and acceptable complication rates.
Am J Orthop. 2017;46(2):E116-E123. Copyright Frontline Medical Communications Inc. 2017. All rights reserved.
1. Cummings SR, Rubin SM, Black D. The future of hip fractures in the United States. Numbers, costs, and potential effects of postmenopausal estrogen. Clin Orthop Relat Res. 1990;(252):163-166.
2. Kyle RF, Cabanela ME, Russell TA, et al. Fractures of the proximal part of the femur. Instr Course Lect. 1995;44:227-253.
3. Koval KJ, Aharonoff GB, Rokito AS, Lyon T, Zuckerman JD. Patients with femoral neck and intertrochanteric fractures. Are they the same? Clin Orthop Relat Res. 1996;(330):166-172.
4. Marsh JL, Slongo TF, Agel J, et al. Fracture and dislocation classification compendium - 2007: Orthopaedic Trauma Association classification, database and outcomes committee. J Orthop Trauma. 2007;21(10 suppl):S1-S133.
5. Lindskog D, Baumgaertner MR. Unstable intertrochanteric hip fractures in the elderly. J Am Acad Orthop Surg. 2004;12(3):179-190.
6. Kokoroghiannis C, Aktselis I, Deligeorgis A, Fragkomichalos E, Papadimas D, Pappadas I. Evolving concepts of stability and intramedullary fixation of intertrochanteric fractures—a review. Injury. 2012;43(6):686-693.
7. Larsson S, Friberg S, Hansson LI. Trochanteric fractures. Influence of reduction and implant position on impaction and complications. Clin Orthop Relat Res. 1990;(259):130-139.
8. Simpson AH, Varty K, Dodd CA. Sliding hip screws: modes of failure. Injury. 1989;20(4):227-231.
9. Rha JD, Kim YH, Yoon SI, Park TS, Lee MH. Factors affecting sliding of the lag screw in intertrochanteric fractures. Int Orthop. 1993;17(5):320-324.
10. Baixauli F, Vicent V, Baixauli E, et al. A reinforced rigid fixation device for unstable intertrochanteric fractures. Clin Orthop Relat Res. 1999;(361):205-215.
11. Harrington P, Nihal A, Singhania AK, Howell FR. Intramedullary hip screw versus sliding hip screw for unstable intertrochanteric femoral fractures in the elderly. Injury. 2002;33(1):23-28.
12. Parker MJ, Handoll HH. Gamma and other cephalocondylic intramedullary nails versus extramedullary implants for extracapsular hip fractures in adults. Cochrane Database Syst Rev. 2010;(9):CD000093.
13. Pajarinen J, Lindahl J, Michelsson O, Savolainen V, Hirvensalo E. Pertrochanteric femoral fractures treated with a dynamic hip screw or a proximal femoral nail. A randomised study comparing postoperative rehabilitation. J Bone Joint Surg Br. 2005;87(1):76-81.
14. Papasimos S, Koutsojannis CM, Panagopoulos A, Megas P, Lambiris E. A randomised comparison of AMBI, TGN and PFN for treatment of unstable trochanteric fractures. Arch Orthop Trauma Surg. 2005;125(7):462-468.
15. Saudan M, Lübbeke A, Sadowski C, Riand N, Stern R, Hoffmeyer P. Pertrochanteric fractures: is there an advantage to an intramedullary nail? A randomized, prospective study of 206 patients comparing the dynamic hip screw and proximal femoral nail. J Orthop Trauma. 2002;16(6):386-393.
16. Schipper IB, Steyerberg EW, Castelein RM, et al. Treatment of unstable trochanteric fractures. Randomised comparison of the gamma nail and the proximal femoral nail. J Bone Joint Surg Br. 2004;86(1):86-94.
17. Gardenbroek TJ, Segers MJ, Simmermacher RK, Hammacher ER. The proximal femur nail antirotation: an identifiable improvement in the treatment of unstable pertrochanteric fractures? J Trauma. 2011;71(1):169-174.
18. Egol KA, Chang EY, Cvitkovic J, Kummer FJ, Koval KJ. Mismatch of current intramedullary nails with the anterior bow of the femur. J Orthop Trauma. 2004;18(7):410-415.
19. Werner-Tutschku W, Lajtai G, Schmiedhuber G, Lang T, Pirkl C, Orthner E. Intra- and perioperative complications in the stabilization of per- and subtrochanteric femoral fractures by means of PFN [in German]. Unfallchirurg. 2002;105(10):881-885.
20. Ma CH, Tu YK, Yu SW, Yen CY, Yeh JH, Wu CH. Reverse LISS plates for unstable proximal femoral fractures. Injury. 2010;41(8):827-833.
21. Pryce Lewis JR, Ashcroft GP. Reverse LISS plating for proximal segmental femoral fractures in the polytrauma patient: a case report. Injury. 2007;38(2):235-239.
22. Zha GC, Chen ZL, Qi XB, Sun JY. Treatment of pertrochanteric fractures with a proximal femur locking compression plate. Injury. 2011;42(11):1294-1299.
23. Oh CW, Kim JJ, Byun YS, et al. Minimally invasive plate osteosynthesis of subtrochanteric femur fractures with a locking plate: a prospective series of 20 fractures. Arch Orthop Trauma Surg. 2009;129(12):1659-1665.
24. American Society of Anesthesiologists new classification of physical status. Anesthesiology. 1963;24:111-114.
25. Kellgren JH, Lawrence JS. Radiological assessment of osteo-arthrosis. Ann Rheum Dis. 1957;16(4):494-502.
26. Vidyadhara S, Rao SK. One and two femoral neck screws with intramedullary nails for unstable trochanteric fractures of femur in the elderly—randomised clinical trial. Injury. 2007;38(7):806-814.
27. Parker MJ, Palmer CR. A new mobility score for predicting mortality after hip fracture. J Bone Joint Surg Br. 1993;75(5):797-798.
28. Harris WH. Traumatic arthritis of the hip after dislocation and acetabular fractures: treatment by mold arthroplasty. An end-result study using a new method of result evaluation. J Bone Joint Surg Am. 1969;51(4):737-755.
29. Sadowski C, Lübbeke A, Saudan M, Riand N, Stern R, Hoffmeyer P. Treatment of reverse oblique and transverse intertrochanteric fractures with use of an intramedullary nail or a 95 degrees screw-plate: a prospective, randomized study. J Bone Joint Surg Am. 2002;84(3):372-381.
30. Suckel AA, Dietz K, Wuelker N, Helwig P. Evaluation of complications of three different types of proximal extra-articular femur fractures: differences in complications, age, sex and surviving rates. Int Orthop. 2007;31(5):689-695.
31. Nuber S, Schönweiss T, Rüter A. Stabilisation of unstable trochanteric femoral fractures. Dynamic hip screw (DHS) with trochanteric stabilisation plate vs. proximal femur nail (PFN) [in German]. Unfallchirurg. 2003;106(1):39-47.
32. Klinger HM, Baums MH, Eckert M, Neugebauer R. A comparative study of unstable per- and intertrochanteric femoral fractures treated with dynamic hip screw (DHS) and trochanteric butt-press plate vs. proximal femoral nail (PFN) [in German]. Zentralbl Chir. 2005;130(4):301-306.
33. Bridle SH, Patel AD, Bircher M, Calvert PT. Fixation of intertrochanteric fractures of the femur. A randomised prospective comparison of the gamma nail and the dynamic hip screw. J Bone Joint Surg Br. 1991;73(2):330-334.
34. Utrilla AL, Reig JS, Muñoz FM, Tufanisco CB. Trochanteric gamma nail and compression hip screw for trochanteric fractures: a randomized, prospective, comparative study in 210 elderly patients with a new design of the gamma nail. J Orthop Trauma. 2005;19(4):229-233.
35. Lenich A, Mayr E, Rüter A, Möckl CH, Füchtmeier B. First results with the trochanter fixation nail (TFN): a report on 120 cases. Arch Orthop Trauma Surg. 2006;126(10):706-712.
36. Tao R, Lu Y, Xu H, Zhou ZY, Wang YH, Liu F. Internal fixation of intertrochanteric hip fractures: a clinical comparison of two implant designs. ScientificWorldJournal. 2013;2013:834825.
37. Wang Y, Yang YY, Yu ZH, Li CQ, Wu YS, Zheng XX. Comparative study of intertrochanteric fractures treated with proximal femur locking compress plate in aged [in Chinese]. Zhongguo Gu Shang. 2011;24(5):370-373.
38. Yao C, Zhang CQ, Jin DX, Chen YF. Early results of reverse less invasive stabilization system plating in treating elderly intertrochanteric fractures: a prospective study compared to proximal femoral nail. Chin Med J (Engl). 2011;124(14):2150-2157.
39. Haq RU, Manhas V, Pankaj A, Srivastava A, Dhammi IK, Jain AK. Proximal femoral nails compared with reverse distal femoral locking plates in intertrochanteric fractures with a compromised lateral wall; a randomised controlled trial. Int Orthop. 2014;38(7):1443-1449.
40. Strohm PC, Schmal H, Kuminack K, Reising K, Südkamp NP. Intertrochanteric femoral fractures in children [in German]. Unfallchirurg. 2006;109(5):425-430.
41. Brett CD, Lee MA, Khalafi AK, Hazelwood SJ. A comparison of percutaneous versus traditional open plate fixation in a subtrochanteric fracture gap model. In: Proceedings of the Annual Meeting of the Orthopaedic Trauma Association (OTA); October 5-7, 2006; Phoenix, AZ. Basic science poster 71 (abstract).
42. Park SY, Yang KH, Yoo JH, Yoon HK, Park HW. The treatment of reverse obliquity intertrochanteric fractures with the intramedullary hip nail. J Trauma. 2008;65(4):852-857.
43. Habernek H, Wallner T, Aschauer E, Schmid L. Comparison of Ender nails, dynamic hip screws, and gamma nails in the treatment of peritrochanteric femoral fractures. Orthopedics. 2000;23(2):121-127.
44. Wirtz C, Abbassi F, Evangelopoulos DS, Kohl S, Siebenrock KA, Krüger A. High failure rate of trochanteric fracture osteosynthesis with proximal femoral locking compression plate. Injury. 2013;44(6):751-756.
45. Streubel PN, Moustoukas MJ, Obremskey WT. Mechanical failure after locking plate fixation of unstable intertrochanteric femur fractures. J Orthop Trauma. 2013;27(1):22-28.
46. Glassner PJ, Tejwani NC. Failure of proximal femoral locking compression plate: a case series. J Orthop Trauma. 2011;25(2):76-83.
47. Ekström W, Karlsson-Thur C, Larsson S, Ragnarsson B, Alberts KA. Functional outcome in treatment of unstable trochanteric and subtrochanteric fractures with the proximal femoral nail and the Medoff sliding plate. J Orthop Trauma. 2007;21(1):18-25.
48. Boldin C, Seibert FJ, Fankhauser F, Peicha G, Grechenig W, Szyszkowitz R. The proximal femoral nail (PFN)—a minimal invasive treatment of unstable proximal femoral fractures: a prospective study of 55 patients with a follow-up of 15 months. Acta Orthop Scand. 2003;74(1):53-58.
49. Gadegone WM, Salphale YS. Proximal femoral nail—an analysis of 100 cases of proximal femoral fractures with an average follow up of 1 year. Int Orthop. 2007;31(3):403-408.
50. Tyllianakis M, Panagopoulos A, Papadopoulos A, Papasimos S, Mousafiris K. Treatment of extracapsular hip fractures with the proximal femoral nail (PFN): long term results in 45 patients. Acta Orthop Belg. 2004;70(5):444-454.
51. Morihara T, Arai Y, Tokugawa S, Fujita S, Chatani K, Kubo T. Proximal femoral nail for treatment of trochanteric femoral fractures. J Orthop Surg (Hong Kong). 2007;15(3):273-277.
Management of Asthma in the Military
Asthma is a chronic inflammatory disorder of the airways that leads to airflow obstruction and bronchial hyperresponsiveness. Clinical features of asthma include episodic cough, wheeze, and dyspnea, which may resolve with avoidance of triggers or therapy. Characteristic triggers of asthma are irritanttype airway exposures, including cold air, exercise, various environmental allergens, and work-related exposures. Work-related exposures are the etiology for occupational asthma and work-exacerbated asthma, accounting for up to 25% of adult-onset asthma.1 It is imperative that clinicians evaluate the clinical history, pulmonary function testing, and response to prior therapies when caring for patients with asthma.
Asthma is common in active-duty service members, despite the diagnosis limiting entrance into the military, and there is potential for significant rates of underdiagnosis among new recruits.2 Recent changes in military medical guidelines have allowed service members with well controlled asthma to remain on active duty.3 This potentially increases the number of service members with compromised respiratory status, which is concerning in light of the past decade of deployment to southwest Asia (SWA) and ongoing investigations into potential deployment-related irritant respiratory exposures.
Diagnosis
An accurate initial diagnosis is a critical starting point in the management of asthma. Many diseases can mimic asthma, including vocal cord dysfunction, chronic obstructive pulmonary disease (COPD), congestive heart failure, sarcoidosis, allergic bronchopulmonary aspergillosis
(ABPA), and eosinophilic granulomatosis with polyangiitis (EGPA), formerly known as Churg-Strauss syndrome (Table 1).4 Asthma-mimics, in particular ABPA and EGPA, are often diagnosed via careful longitudinal follow-up.
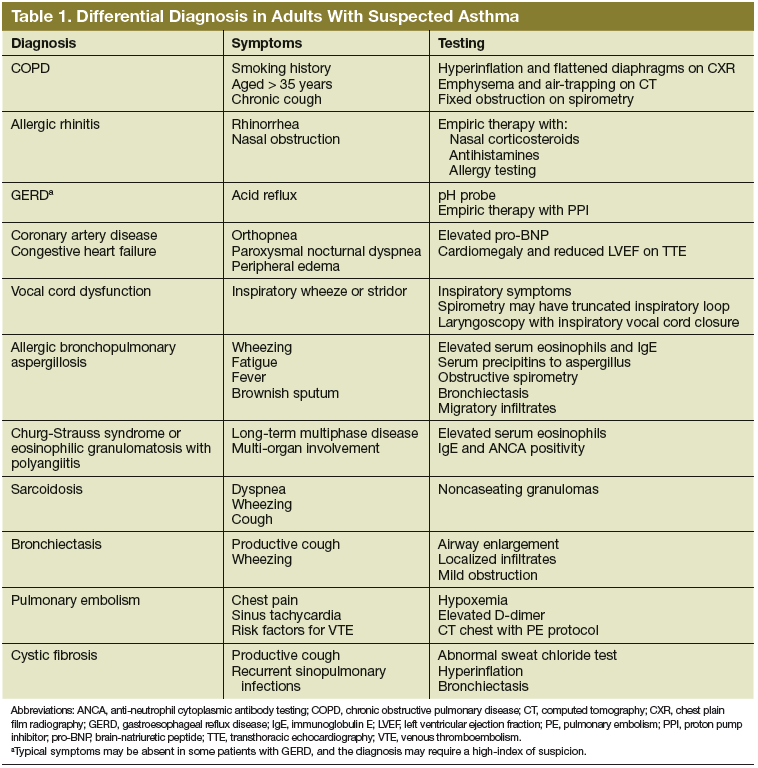
Characteristic symptoms of asthma include cough, wheeze, dyspnea, chest tightness, and sputum production. Symptoms should be described systematically in terms of onset, frequency, duration, diurnal variability, and seasonality. A careful review of systems should be conducted to exclude conditions such as COPD, pulmonary emboli, congestive heart failure, viral syndromes, acute infection, or hypersensitivity pneumonitis. Patients must be queried (carefully and often repeatedly) about potential triggers, including physical activity, hobbies, pets (including any animals owned by the patient, family members, or living on the property), and occupation.
Physical examination may reveal presence of nasal polyps, nasal mucosal swelling, increased secretions, wheezing, a prolonged expiratory phase, atopic dermatitis, or eczema. Further cardiac evaluation with transthoracic echocardiography may be considered in patients with a heart murmur. Digital clubbing is not characteristic of asthma and should prompt investigation of alternative inflammatory disease (connective tissue disease, interstitial lung disease, or bronchiectasis).
Pulmonary function testing including spirometry and bronchodilator response should be performed as demonstration of airflow limitation is crucial for the diagnosis of asthma.4 Spirometry should be performed in accordance with published standards and documented in the patient's medical record. Airflow limitation should be described in accordance with the Third National Health and Nutrition Examination Survey (NHANES III) references values as recommended by the American Thoracic Society and the European Respiratory Society (ATS/ERS) guidelines.5-7 Obstruction is defined as an forced expiratory volume in 1 second to forced vital capacity (FEV1/FVC) ratio less than the fifth percentile of the
normal distribution (lower limit of normal). Bronchodilator testing should also be performed to establish presence and degree of response to inhaled bronchodilator medication. A12% increase in the FEV1 with an absolute increase of 200 mL is considered significant in adults.7
It is important to note that although a positive bronchodilator response is highly suggestive of asthma in the appropriate clinical circumstance, it is not required for diagnosis, and inhaled bronchodilators may be useful in disease management even in the absence of a positive response. Patients with nonspecific reductions in the FVC, with symptoms not consistent with asthma, or not responding to typical asthma therapy are more likely to have been falsely diagnosed. These patients should have lung volumes and diffusion capacity of carbon monoxide measured to evaluate for other potential etiologies (eg, parenchymal lung disease, pulmonary vascular disease).4
Bronchoprovocation testing is useful for demonstrating airway hyperresponsiveness in a patient with symptoms suggestive of asthma, particularly those with normal baseline spirometry. Patients should have testing performed and interpreted in accordance with ATS
standards.8 Although methacholine challenge testing is preferred, other methods including cold air or eucapnic hyperventilation are also established. Exercise challenge testing, although less sensitive, remains a useful tool, particularly in patients with primarily exertional symptoms. It is important to note that a positive bronchoprovocation test result may occur in other conditions. Whereas a positive test is consistent with asthma, a negative test may be more useful to exclude the diagnosis.8 Finally, chest imaging with plain film radiographs (posteroanterior and lateral views) is important to exclude parenchymal lung disease or mediastinal disorders. Further imaging with computed tomography is not indicated in the absence of atypical clinical features (such as abnormal plain films or failure to respond to therapy).
Management
The initial management of asthma in based on severity and follows a stepwise progression according to the 2007 National Asthma Education and Prevention Program.9 Severity is determined by the following factors: symptoms in the past 2 to 4 weeks, pulmonary function testing, and number of exacerbations requiring oral glucocorticoids (Table 2).
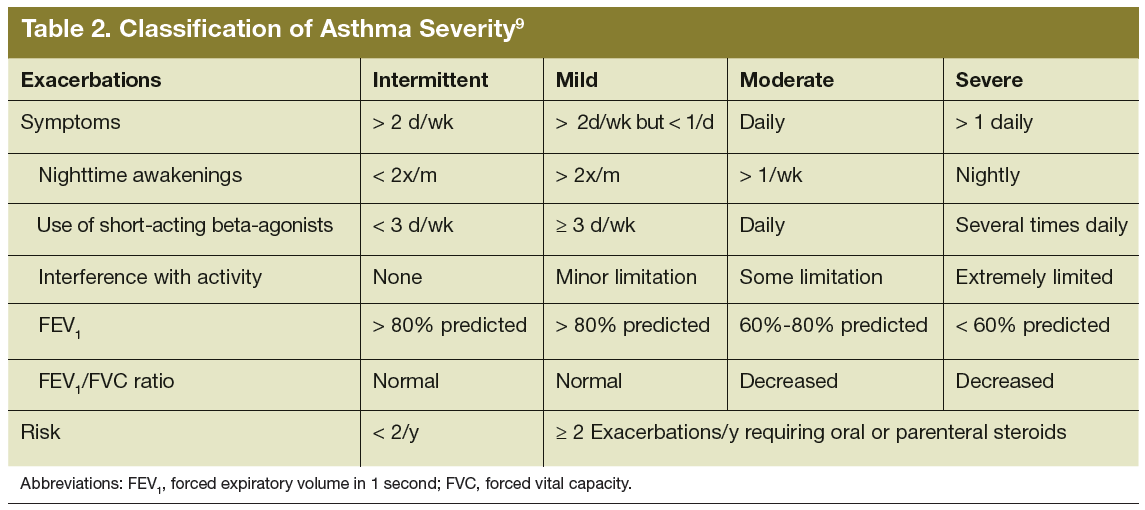
The initiation of therapy is based on the assessment of severity (Table 3). Patients with intermittent asthma are treated initially with short-acting beta-agonists (SABA) alone. Patients with known triggers are instructed to use beta-agonists about 20 minutes prior to a known trigger such as exercise.4,9 For a patient with mild persistent asthma, the preferred controller medication is a low-dose inhaled corticosteroid (ICS). If a patient has moderate persistent asthma, the preferred controller medication becomes a lowdose ICS plus a long-acting beta agonist (LABA) or a medium-dose ICS. Severe persistent patients are treated with a medium-dose ICS and a LABA or a high-dose ICS.4,9 In patients who need additional therapy beyond that described here, providers may consider adjunctive therapy with theophylline, leukotriene receptor antagonists (such as montelukast), or cromolyn/nedocromil.4,9 If a patient has severe persistent asthma, anti-IgE therapy omalizumab can be considered if serum IgE levels are within the established range (30-700 IU/mL).10
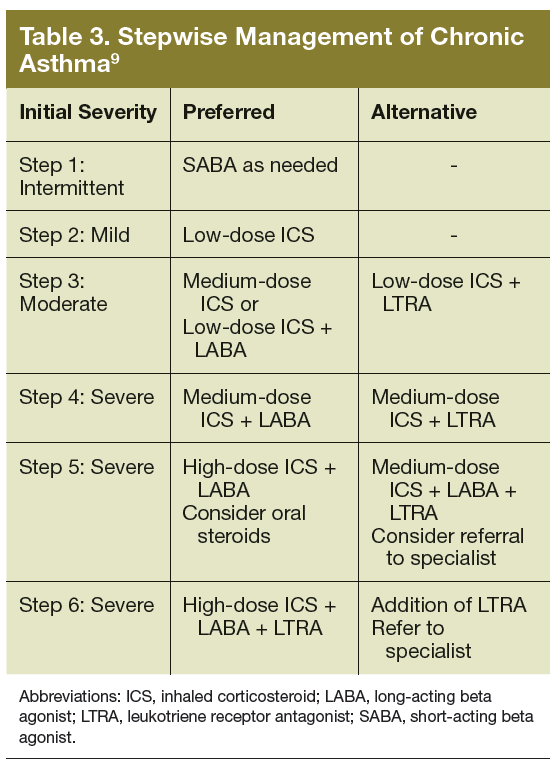
Chronic asthma management relies on assessment and monitoring of functional impairment and response to therapy over time. Impairment is best assessed using a validated questionnaire assessing nighttime awakenings; frequency of as-needed bronchodilator therapy; limitation in home, school, or work activities; and perception of control or peak flow monitoring.4 One questionnaire that has been validated in the outpatient setting (as well as for home use via mail or telephone) is the Asthma Control Test.11-14 The history obtained in clinic should assess risk factors for future exacerbations, such as the use of oral glucocorticoids, emergency department visits, hospitalizations, and admissions to the intensive care unit. For patients whose symptoms are not well controlled, a step up in therapy of one level should be performed. Therapy can be continued or stepped down (to minimize adverse effects) in those with adequate control.
Comorbid Conditions
Asthma management should also address comorbid conditions, including gastroesophageal reflux disease (GERD), allergic rhinosinusitis, obesity, and obstructive sleep apnea (OSA). Gastroesophageal reflux disease is common in asthmatics, and treatment may reduce exacerbations and symptoms, particularly in severe asthma.15 Allergic rhinitis/sinusitis is also common, and treatment may improve respiratory symptoms. Obesity is associated with an increased risk of developing asthma and may be associated with increased asthma severity.16 Patients with asthma and comorbid OSA should be encouraged to use continuous positive airway pressure (CPAP) with regular compliance (> 4 hours per night on > 70% of nights).17 Optimally, the goal for CPAP use should be 7 to 8 hours per night. Finally, patients with asthma are at higher risk for depression and other behavioral disorders, which may lead to poor compliance with therapy, adversely impacting disease severity and efficacy of medical care.18
Triggers
The avoidance of triggers may reduce the need for controller medications. Inhaled allergens or irritants (tobacco or wood smoke) may be suggested by a history of worsening at home or in the workplace (or during the work week).9 Allergy testing may be considered for identification of allergens— particularly indoor allergens such as dust mites, animal dander, molds, mice, and cockroaches. Nonselective beta blockers, aspirin, nonsteroidal anti-inflammatory drugs, or dietary sulfites may produce significant exacerbations in some patients with asthma. Administration of the flu vaccine is indicated in all asthma patients, and pneumococcal vaccination is indicated in all adult patients requiring controller medication due to significant risk of complications with pneumococcal infection or influenza.4
Patient Education
Patient education is an integral part of asthma management. Patients should be educated on roles of medications, appropriate technique for using a metered dose inhaler and spacer, self-monitoring of disease, identification of triggers and environmental control measures, and a plan for care during exacerbations. Patient education programs have been shown to be effective in reducing hospitalizations.19 Use of valved holding chambers is preferred.4 Investigation and education into the role of allergens in the patient’s disease is recommended. However, there is insufficient evidence to advocate a single specific avoidance strategy. Comprehensive, as opposed to limited, strategies are recommended. Immunotherapy is effective for patients with persistent asthma and identified inhaled allergen sensitivities.4 All patients should be queried about smoking history and advised strongly to quit smoking.
Pharmacotherapy
Medications used for asthma primarily include inhaled bronchodilators and ICS when controller therapy is required. Short-acting beta agonists should be used for quick relief of symptoms and can be used preemptively for triggers. The frequency of SABA use should be queried to assess control. In addition, patients should be instructed to seek medical attention should a SABA fail to achieve a quick and sustained response. Inhaled corticosteroids should be used as a first-line treatment to control persistent asthma with initial dosing based on severity. Long-acting beta agonists are the preferred add-on to ICS therapy for patients whose symptoms are not controlled with an ICS. Long-acting beta agonists should not be used for acute symptoms or without an ICS, regardless of asthma stage. They carry an FDA boxed warning regarding increased risk of severe asthma exacerbations and asthma-related deaths.20
Leukotriene modifiers may provide benefit and should be used in stepwise fashion as an alternative to LABA in appropriately selected patients. Cromolyn may be considered as alternative to ICS in mild persistent asthma, but is rarely used. Theophylline may be considered if other options have not been successful. Serum levels should be maintained between 5 and 15 μg/mL, and routine monitoring is indicated due to significant toxicities and medication interactions. Omalizumab can be considered as adjunctive therapy in patients with elevated IgE in the prescribed target ranges (30-700 IU/mL) and sensitivity to relevant allergies. In patients with chronic, refractory symptoms there may be a role for oral corticosteroid therapy outside the setting of acute exacerbations. This decision should be individualized and balance the
benefits obtained from therapy against the risks of chronic steroid use (impaired glucose control, immunosuppression, poor wound healing, adverse effects on bone density, and adverse psychiatric effects).
Novel biologic therapies for asthma include antagonists of cytokines interleukin-4 (IL-4), interleukin-5 (IL-5), and interleukin-13 (IL-13), and tumor necrosis factor (TNF)-α inhibitors. These agents have been evaluated in phase 2 and phase 3 studies thus far. The eosinophilic asthma phenotype is described as increased blood or sputum eosinophil levels correlating with disease activity. T-helper 2 cells that express IL-4, IL-5, and IL-13 coordinate eosinophilic inflammation in asthma.21
Mepolizumab (anti–IL-5) has been shown to be effective in reduction of exacerbations in patients with eosinophilic asthma phenotype, particularly those with frequent exacerbations.22 Reslizumab (humanized anti–IL-5) has been shown to significantly reduce symptoms and is currently undergoing phase 3 trials.21 Benralizumab is a humanized fucosylated IgG1κ monoclonal antibody (mAb) that binds IL-5Ra in order to induce apoptosis in eosinophils and basophils. It is currently under investigation for use in asthma and COPD.21
Lebrikizumab (anti–IL-13) has been shown to improve lung function in inadequately controlled asthma patients with elevated periostin levels.23 Tralokinumab (anti–IL-13 humanized IgG4) improved FEV1 and reduced symptoms in patients with moderate to severe uncontrolled asthma in comparison with placebo.24 Pitrakinra is a recombinant IL-4 variant that competitively inhibits the IL-4Rα receptor, inhibiting the function of both IL-4 and IL-13. This agent may prove beneficial in patients with atopic asthma.21
Dupilumab, a fully humanized mAb to the IL-4Rα/IL-13Rα receptor complex inhibiting actions of both IL-4 and IL-13 signaling, and has demonstrated > 80% relative reduction in asthma exacerbations, improved symptoms and led to improvement in FEV1 in patients with
moderate to severe asthma and increased serum or sputum eosinophils.25 It may represent a promising avenue for future asthma research, as its initial investigation has shown both improvement in function and clinical outcomes. Ultimately, ongoing research will be needed to determine the long-term effects of these agents and whether they offer efficacy in asthma patients in general vs specific asthma-phenotypes.
The TNF-α inhibitors have also been investigated for use in asthma. TNF-α is an innate cytokine implicated in chronic inflammatory conditions, including rheumatoid arthritis and Crohn’s disease. Macrophages are a major source of TNF-α along with contributions from monocytes, dendritic cells, B lymphocytes, T cells,neutrophils, mast cells, and eosinophils. TNF-α has a proinflammatory effect on eosinophils, neutrophils, T cells, epithelial cells, and endothelial cells. Studies of asthma have revealed increased TNF-α within respiratory epithelial tissue biopsies and airway lavages of patients with severe asthma compared with those with good control. Etanercept, a soluble TNF-α receptor linked to human IgG1, has been reported to significantly improve symptoms and lung function in severe refractory asthma.26
However golimumab, an anti-TNF biologic, was shown to have deleterious effects, including an increased rate of serious infections, potential increased risk of malignancy, and 1 death in the treatment group.27 Identification of the correct patient population may improve clinical outcomes, but a potentially unfavorable risk benefit ratio may limit the future of anti–TNF-α therapy in severe asthma.
Considerations Unique to the Military
Active-duty personnel present unique challenges in the diagnosis and management of asthma. Service members should be questioned thoroughly on deployment and exposure history. A significant portion of the current military population has deployed to SWA in the past decade, many for multiple deployments. Research addressing respiratory complaints in the deployed military population is ongoing. To date, military research has demonstrated
that while many service members with deploymentrelated respiratory exposures have a paucity of objective findings after pulmonary medicine evaluation, some demonstrate functional limitations consistent with asthma or airway hyperresponsivenesss.28 Further retrospective studies did not find a relationship between deployment and diagnosis rates or severity in asthma patients in the Army.29 A comprehensive evaluation is recommended for service members with dyspnea to include investigating for potential asthma- or exercise-induced bronchospasm, in addition to diagnoses such as vocal cord dysfunction, GERD, and OSA.28-30
A recent study in service members with respiratory complaints related to deployment included surgical lung biopsy; however, the clinical applicability of these results is unclear, given the lack of a firm association between the histologic diagnoses and clinical condition of the subjects.31 In general, it is not recommended to perform surgical lung biopsy for patients with deployment history to SWA in the absence of objective findings on chest imaging or significant changes in pulmonary function testing. Screening spirometry has been postulated as a way to improve monitoring for military members proximate to deployment and longitudinally. However, an unpublished cost analysis estimates that for the over 500,000 activeduty service members, screening spirometry would cost in the tens of millions of dollars.32 This analysis did not include the costs of follow-up specialty care or further
tests. Although screening spirometry does not appear to be feasible presently, research evaluating screening spirometry is in progress in the military.33
If diagnosed with asthma, service members should be able to perform all required duties, wear protective gear, and have stable disease requiring infrequent, if any, oral corticosteroid treatment. According to U.S. Army retention regulations, soldiers diagnosed with asthma may be placed on temporary profile (duty restrictions) for up to 12 months when medically advised. If at the end of that trial the soldier is unable to wear a protective mask or pass the timed physical fitness run outdoors (on medications), then the soldier should be placed on a more restrictive physical profile and referred for a medical evaluation board. If able to pass the physical fitness run (or an alternate aerobic fitness event) within standards and perform all military training and duties on ICSs and bronchodilators, the soldier may be placed on a less restrictive temporary profile. If the soldier does not require medications or activity limitations, then no profile qualifications are required. Chronic asthma should also require a physical profile if it results in repetitive hospitalizations, emergency department visits, excessive time lost from duty, or repetitive use of oral corticosteroids.3
Conclusion
The evaluation and management of asthma in the military requires appropriate diagnosis, treatment, and longitudinal follow-up. The diagnosis should always be confirmed with pulmonary function and bronchoprovocation testing. Conditions mimicking asthma should be excluded, particularly when asthma does not respond to appropriate therapy. It is imperative that patients with asthma who do not demonstrate an expected course of improvement with therapy seek evaluation by a pulmonary disease specialist. This serves to re-evaluate whether the initial diagnosis was correct, assess for potential disease mimics and aggravating comorbidities, and ensure that asthma therapy is in accordance with published guidelines. Service members with asthma can remain on active duty when management with inhaled therapies allows them to meet standards and perform required duties.
Service members with asthma represent a unique and ever expanding patient population, given the role of potential respiratory exposures in SWA. Longitudinal follow-up is critical in conjunction with application of novel therapies as appropriate and understanding the impact of deployment-related respiratory exposures. These patients will continue to require care in the military health care system, the VA health care system, and in the private sector for decades to come.
Author disclosures
Dr. Morris is a paid speaker for Spiriva by Boehringer-Ingelheim. The other authors have no financial interests to disclose. None of the authors have any relevant conflicts of interest to disclose. This study was not supported by any funding or financial sponsorship.
Disclaimer
The opinions expressed herein are those of the author and do not necessarily reflect those of Federal Practitioner or Frontline Medical Communications Inc. This article may discuss unlabeled or investigational use of certain drugs. Please review complete prescribing information for specific drugs or drug combinations—including indications, contraindications, warnings, and adverse effects—before administering pharmacologic therapy to patients.
The opinions in this manuscript do not constitute endorsement by San Antonio Army Medical Center, the U.S. Army Medical Department, the U.S. Army Office of the Surgeon General, the Department of the Army, Department of Defense, or the U.S. Government of the information contained therein. The authors alone are responsible for the content and writing of the paper.
1. Tarlo SM, Balmes J, Balkissoon R, et al. Diagnosis and management of workrelated asthma: American College Of Chest Physicians Consensus Statement [published correction appears in Chest. 2008;134(4):892]. Chest. 2008;134(3)(suppl):1S-41S.
2. Nish WA, Schwietz LA. Underdiagnosis of asthma in young adults presenting for USAF basic training. Ann Allergy. 1992;69(3):239-242.
3. US Department of the Army. Standards of Medical Fitness. Army Regulation 40-501. http://armypubs.army.mil/epubs/pdf/r40_501.pdf. Revised August 4, 2011. Accessed January 8, 2015.
4. Management of Asthma Working Group. VA/DoD Clinical Practice Guideline for Management of Asthma in Children and Adults. http://www.healthquality.va.gov/guidelines/CD/asthma/ast_2_sum.pdf. Published 2009. Accessed January 8, 2015.
5. Miller MR, Crapo R, Hankinson J, et al. General considerations for lung function testing. Eur Respir J. 2005;26(1):153-161.
6. Miller MR, Hankinson J, Brusasco V, et al; ATS/ERS Task Force. Standardisation of spirometry. Eur Respir J. 2005;26(2):319-338.
7. Pellegrino R, Viegi G, Brusasco V, et al. Interpretative strategies for lung function tests. Eur Respir J. 2005;26(5):948-968.
8. Crapo RO, Casaburi R, Coates AL, et al; ATS/ERS Task Force. Guidelines for methacholine and exercise challenge testing-1999. This official statement of the American Thoracic Society was adopted by the ATS Board of Directors, July 1999. Am J Respir Crit Care Med. 2000;161(1):309-329.
9. National Asthma Education and Prevention Program, Third Expert Panel on the Diagnosis and Management of Asthma. Expert Panel Report 3: Guidelines for the Diagnosis and Management of Asthma—full report 2007. Bethesda, MD: U.S. Department of Health and Human Services, National Institutes of Health, National Heart, Lung, and Blood Institute; 2007. http://www.nhlbi.nih.gov/guidelines/asthma/asthgdln.pdf. Accessed November 18, 2014.
10. Omalizumab (Xolair): an anti-IgE antibody for asthma. Med Lett Drugs Ther. 2003;45(1163):67-68.
11. Nathan RA, Sorkness CA, Kosinski M, et al. Development of the asthma control test: a survey for assessing asthma control. J Allergy Clin Immunol. 2004;113(1):59-65.
12. Schatz M, Mosen DM, Kosinski M, et al. Validity of the Asthma Control Test completed at home. Am J Manag Care. 2007;13(12):661-667.
13. Schatz M, Sorkness CA, Li JT, et al. Asthma Control Test: reliability, validity, and responsiveness in patients not previously followed by asthma specialists. J Allergy Clin Immunol. 2006;117(3):549-556.
14. Schatz M, Zeiger RS, Drane A, et al. Reliability and predictive validity of the Asthma Control Test administered by telephone calls using speech recognition technology. J Allergy Clin Immunol. 2007;119(2):336-343.
15. Parsons JP, Mastronarde JG. Gastroesophageal reflux disease and asthma. Curr Opin Pulm Med. 2010;16(1):60-63.
16. Taylor B, Mannino D, Brown C, Crocker D, Twum-Baah N, Holguin F. Body mass index and asthma severity in the National Asthma Survey. Thorax. 2008;63(1):14-20.
17. Kribbs NB, Pack AI, Kline LR, et al. Objective measurement of patterns of nasal CPAP use by patients with obstructive sleep apnea. Am Rev Respir Dis. 1993;147(4):887-895.
18. Mancuso CA, Wenderoth S, Westermann H, Choi TN, Briggs WM, Charlson ME. Patient-reported and physician-reported depressive conditions in relation to asthma severity and control. Chest. 2008;133(5):1142-1148.
19. Castro M, Zimmermann NA, Crocker S, Bradley J, Leven C, Schechtman KB. Asthma intervention program prevents readmissions in high healthcare users. Am J Respir Crit Care Med. 2003;168(9):1095-1099.
20. Nelson HS, Weiss ST, Bleecker ER, Yancey SW, Dorinsky PM; SMART Study Group. The Salmeterol Multicenter Asthma Research Trial: a comparison of usual pharmacotherapy for asthma or usual pharmacotherapy plus salmeterol [published correction appears in Chest. 2006;129(5):1393]. Chest. 2006;129(1):15-26.
21. Walsh GM. An update on biologic-based therapy in asthma. Immunotherapy. 2013;5(11):1255-1264.
22. Pavord ID, Korn S, Howarth P, et al. Mepolizumab for severe eosinophilic asthma (DREAM): a multicentre, double-blind, placebo-controlled trial. Lancet. 2012;380(9842):651-659.
23. Corren J, Lemanske RF, Hanania NA, et al. Lebrikizumab treatment in adults with
asthma. N Engl J Med. 2011;365(12):1088-1098.
24. Piper E, Brightling C, Niven R, et al. A phase II placebo-controlled study of tralokinumab in moderate-to-severe asthma. Eur Respir J. 2013;41(2):330-338.
25. Wenzel S, Ford L, Pearlman D, et al. Dupilumab in persistent asthma with elevated eosinophil levels. N Engl J Med. 2013;368(26):2455-2466.
26. Holgate ST, Noonan M, Chanez P, et al. Efficacy and safety of etanercept in moderate-to-severe asthma: a randomised, controlled trial. Eur Respir J. 2011;37(6):1352-1359.
27. Wenzel SE, Barnes PJ, Bleecker ER, et al; T03 Asthma Investigators. A randomized, double-blind, placebo-controlled study of tumor necrosis factor-alpha blockade in severe persistent asthma. Am J Respir Crit Care Med. 2009;179(7):549-558.
28. Morris MJ, Dodson DW, Lucero PF, et al. Study of active duty military for pulmonary disease related to environmental deployment exposures (STAMPEDE). Am J Respir Crit Care Med. 2014;190(1):77-84.
29. DelVecchio SP, Collen JF, Zacher LL, Morris MJ. The impact of combat deployment on asthma diagnosis and severity. J Asthma. 2015;52(4):363-369.
30. Morris MJ, Grbach VX, Deal LE, Boyd SY, Morgan JA, Johnson JE. Evaluation of exertional dyspnea in the active duty patient: the diagnostic approach and the utility of clinical testing. Mil Med. 2002;167(4):281-288.
31. King MS, Eisenberg R, Newman JH, et al. Constrictive bronchiolitis in soldiers returning from Iraq and Afghanistan. N Engl J Med. 2011;365(3):222-230.
32. Morris MJ, Eschenbacher WL, McCannon CE. Discussion summary: recommendations for surveillance spirometry in military personnel. In: Baird CP, Harkins DK, eds. Airborne Hazards Related to Deployment. Fort Sam Houston, TX: Borden Institute, US Army Medical Department Center and School; 2014:95-102.
33. Mabe D, Perkins M, Walter R, et al. A handheld device comparable to impulse oscillometry for measurement of respiratory resistance. Chest. 2014;146 (4 MeetingAbstracts):682A.
Asthma is a chronic inflammatory disorder of the airways that leads to airflow obstruction and bronchial hyperresponsiveness. Clinical features of asthma include episodic cough, wheeze, and dyspnea, which may resolve with avoidance of triggers or therapy. Characteristic triggers of asthma are irritanttype airway exposures, including cold air, exercise, various environmental allergens, and work-related exposures. Work-related exposures are the etiology for occupational asthma and work-exacerbated asthma, accounting for up to 25% of adult-onset asthma.1 It is imperative that clinicians evaluate the clinical history, pulmonary function testing, and response to prior therapies when caring for patients with asthma.
Asthma is common in active-duty service members, despite the diagnosis limiting entrance into the military, and there is potential for significant rates of underdiagnosis among new recruits.2 Recent changes in military medical guidelines have allowed service members with well controlled asthma to remain on active duty.3 This potentially increases the number of service members with compromised respiratory status, which is concerning in light of the past decade of deployment to southwest Asia (SWA) and ongoing investigations into potential deployment-related irritant respiratory exposures.
Diagnosis
An accurate initial diagnosis is a critical starting point in the management of asthma. Many diseases can mimic asthma, including vocal cord dysfunction, chronic obstructive pulmonary disease (COPD), congestive heart failure, sarcoidosis, allergic bronchopulmonary aspergillosis
(ABPA), and eosinophilic granulomatosis with polyangiitis (EGPA), formerly known as Churg-Strauss syndrome (Table 1).4 Asthma-mimics, in particular ABPA and EGPA, are often diagnosed via careful longitudinal follow-up.
Characteristic symptoms of asthma include cough, wheeze, dyspnea, chest tightness, and sputum production. Symptoms should be described systematically in terms of onset, frequency, duration, diurnal variability, and seasonality. A careful review of systems should be conducted to exclude conditions such as COPD, pulmonary emboli, congestive heart failure, viral syndromes, acute infection, or hypersensitivity pneumonitis. Patients must be queried (carefully and often repeatedly) about potential triggers, including physical activity, hobbies, pets (including any animals owned by the patient, family members, or living on the property), and occupation.
Physical examination may reveal presence of nasal polyps, nasal mucosal swelling, increased secretions, wheezing, a prolonged expiratory phase, atopic dermatitis, or eczema. Further cardiac evaluation with transthoracic echocardiography may be considered in patients with a heart murmur. Digital clubbing is not characteristic of asthma and should prompt investigation of alternative inflammatory disease (connective tissue disease, interstitial lung disease, or bronchiectasis).
Pulmonary function testing including spirometry and bronchodilator response should be performed as demonstration of airflow limitation is crucial for the diagnosis of asthma.4 Spirometry should be performed in accordance with published standards and documented in the patient's medical record. Airflow limitation should be described in accordance with the Third National Health and Nutrition Examination Survey (NHANES III) references values as recommended by the American Thoracic Society and the European Respiratory Society (ATS/ERS) guidelines.5-7 Obstruction is defined as an forced expiratory volume in 1 second to forced vital capacity (FEV1/FVC) ratio less than the fifth percentile of the
normal distribution (lower limit of normal). Bronchodilator testing should also be performed to establish presence and degree of response to inhaled bronchodilator medication. A12% increase in the FEV1 with an absolute increase of 200 mL is considered significant in adults.7
It is important to note that although a positive bronchodilator response is highly suggestive of asthma in the appropriate clinical circumstance, it is not required for diagnosis, and inhaled bronchodilators may be useful in disease management even in the absence of a positive response. Patients with nonspecific reductions in the FVC, with symptoms not consistent with asthma, or not responding to typical asthma therapy are more likely to have been falsely diagnosed. These patients should have lung volumes and diffusion capacity of carbon monoxide measured to evaluate for other potential etiologies (eg, parenchymal lung disease, pulmonary vascular disease).4
Bronchoprovocation testing is useful for demonstrating airway hyperresponsiveness in a patient with symptoms suggestive of asthma, particularly those with normal baseline spirometry. Patients should have testing performed and interpreted in accordance with ATS
standards.8 Although methacholine challenge testing is preferred, other methods including cold air or eucapnic hyperventilation are also established. Exercise challenge testing, although less sensitive, remains a useful tool, particularly in patients with primarily exertional symptoms. It is important to note that a positive bronchoprovocation test result may occur in other conditions. Whereas a positive test is consistent with asthma, a negative test may be more useful to exclude the diagnosis.8 Finally, chest imaging with plain film radiographs (posteroanterior and lateral views) is important to exclude parenchymal lung disease or mediastinal disorders. Further imaging with computed tomography is not indicated in the absence of atypical clinical features (such as abnormal plain films or failure to respond to therapy).
Management
The initial management of asthma in based on severity and follows a stepwise progression according to the 2007 National Asthma Education and Prevention Program.9 Severity is determined by the following factors: symptoms in the past 2 to 4 weeks, pulmonary function testing, and number of exacerbations requiring oral glucocorticoids (Table 2).
The initiation of therapy is based on the assessment of severity (Table 3). Patients with intermittent asthma are treated initially with short-acting beta-agonists (SABA) alone. Patients with known triggers are instructed to use beta-agonists about 20 minutes prior to a known trigger such as exercise.4,9 For a patient with mild persistent asthma, the preferred controller medication is a low-dose inhaled corticosteroid (ICS). If a patient has moderate persistent asthma, the preferred controller medication becomes a lowdose ICS plus a long-acting beta agonist (LABA) or a medium-dose ICS. Severe persistent patients are treated with a medium-dose ICS and a LABA or a high-dose ICS.4,9 In patients who need additional therapy beyond that described here, providers may consider adjunctive therapy with theophylline, leukotriene receptor antagonists (such as montelukast), or cromolyn/nedocromil.4,9 If a patient has severe persistent asthma, anti-IgE therapy omalizumab can be considered if serum IgE levels are within the established range (30-700 IU/mL).10
Chronic asthma management relies on assessment and monitoring of functional impairment and response to therapy over time. Impairment is best assessed using a validated questionnaire assessing nighttime awakenings; frequency of as-needed bronchodilator therapy; limitation in home, school, or work activities; and perception of control or peak flow monitoring.4 One questionnaire that has been validated in the outpatient setting (as well as for home use via mail or telephone) is the Asthma Control Test.11-14 The history obtained in clinic should assess risk factors for future exacerbations, such as the use of oral glucocorticoids, emergency department visits, hospitalizations, and admissions to the intensive care unit. For patients whose symptoms are not well controlled, a step up in therapy of one level should be performed. Therapy can be continued or stepped down (to minimize adverse effects) in those with adequate control.
Comorbid Conditions
Asthma management should also address comorbid conditions, including gastroesophageal reflux disease (GERD), allergic rhinosinusitis, obesity, and obstructive sleep apnea (OSA). Gastroesophageal reflux disease is common in asthmatics, and treatment may reduce exacerbations and symptoms, particularly in severe asthma.15 Allergic rhinitis/sinusitis is also common, and treatment may improve respiratory symptoms. Obesity is associated with an increased risk of developing asthma and may be associated with increased asthma severity.16 Patients with asthma and comorbid OSA should be encouraged to use continuous positive airway pressure (CPAP) with regular compliance (> 4 hours per night on > 70% of nights).17 Optimally, the goal for CPAP use should be 7 to 8 hours per night. Finally, patients with asthma are at higher risk for depression and other behavioral disorders, which may lead to poor compliance with therapy, adversely impacting disease severity and efficacy of medical care.18
Triggers
The avoidance of triggers may reduce the need for controller medications. Inhaled allergens or irritants (tobacco or wood smoke) may be suggested by a history of worsening at home or in the workplace (or during the work week).9 Allergy testing may be considered for identification of allergens— particularly indoor allergens such as dust mites, animal dander, molds, mice, and cockroaches. Nonselective beta blockers, aspirin, nonsteroidal anti-inflammatory drugs, or dietary sulfites may produce significant exacerbations in some patients with asthma. Administration of the flu vaccine is indicated in all asthma patients, and pneumococcal vaccination is indicated in all adult patients requiring controller medication due to significant risk of complications with pneumococcal infection or influenza.4
Patient Education
Patient education is an integral part of asthma management. Patients should be educated on roles of medications, appropriate technique for using a metered dose inhaler and spacer, self-monitoring of disease, identification of triggers and environmental control measures, and a plan for care during exacerbations. Patient education programs have been shown to be effective in reducing hospitalizations.19 Use of valved holding chambers is preferred.4 Investigation and education into the role of allergens in the patient’s disease is recommended. However, there is insufficient evidence to advocate a single specific avoidance strategy. Comprehensive, as opposed to limited, strategies are recommended. Immunotherapy is effective for patients with persistent asthma and identified inhaled allergen sensitivities.4 All patients should be queried about smoking history and advised strongly to quit smoking.
Pharmacotherapy
Medications used for asthma primarily include inhaled bronchodilators and ICS when controller therapy is required. Short-acting beta agonists should be used for quick relief of symptoms and can be used preemptively for triggers. The frequency of SABA use should be queried to assess control. In addition, patients should be instructed to seek medical attention should a SABA fail to achieve a quick and sustained response. Inhaled corticosteroids should be used as a first-line treatment to control persistent asthma with initial dosing based on severity. Long-acting beta agonists are the preferred add-on to ICS therapy for patients whose symptoms are not controlled with an ICS. Long-acting beta agonists should not be used for acute symptoms or without an ICS, regardless of asthma stage. They carry an FDA boxed warning regarding increased risk of severe asthma exacerbations and asthma-related deaths.20
Leukotriene modifiers may provide benefit and should be used in stepwise fashion as an alternative to LABA in appropriately selected patients. Cromolyn may be considered as alternative to ICS in mild persistent asthma, but is rarely used. Theophylline may be considered if other options have not been successful. Serum levels should be maintained between 5 and 15 μg/mL, and routine monitoring is indicated due to significant toxicities and medication interactions. Omalizumab can be considered as adjunctive therapy in patients with elevated IgE in the prescribed target ranges (30-700 IU/mL) and sensitivity to relevant allergies. In patients with chronic, refractory symptoms there may be a role for oral corticosteroid therapy outside the setting of acute exacerbations. This decision should be individualized and balance the
benefits obtained from therapy against the risks of chronic steroid use (impaired glucose control, immunosuppression, poor wound healing, adverse effects on bone density, and adverse psychiatric effects).
Novel biologic therapies for asthma include antagonists of cytokines interleukin-4 (IL-4), interleukin-5 (IL-5), and interleukin-13 (IL-13), and tumor necrosis factor (TNF)-α inhibitors. These agents have been evaluated in phase 2 and phase 3 studies thus far. The eosinophilic asthma phenotype is described as increased blood or sputum eosinophil levels correlating with disease activity. T-helper 2 cells that express IL-4, IL-5, and IL-13 coordinate eosinophilic inflammation in asthma.21
Mepolizumab (anti–IL-5) has been shown to be effective in reduction of exacerbations in patients with eosinophilic asthma phenotype, particularly those with frequent exacerbations.22 Reslizumab (humanized anti–IL-5) has been shown to significantly reduce symptoms and is currently undergoing phase 3 trials.21 Benralizumab is a humanized fucosylated IgG1κ monoclonal antibody (mAb) that binds IL-5Ra in order to induce apoptosis in eosinophils and basophils. It is currently under investigation for use in asthma and COPD.21
Lebrikizumab (anti–IL-13) has been shown to improve lung function in inadequately controlled asthma patients with elevated periostin levels.23 Tralokinumab (anti–IL-13 humanized IgG4) improved FEV1 and reduced symptoms in patients with moderate to severe uncontrolled asthma in comparison with placebo.24 Pitrakinra is a recombinant IL-4 variant that competitively inhibits the IL-4Rα receptor, inhibiting the function of both IL-4 and IL-13. This agent may prove beneficial in patients with atopic asthma.21
Dupilumab, a fully humanized mAb to the IL-4Rα/IL-13Rα receptor complex inhibiting actions of both IL-4 and IL-13 signaling, and has demonstrated > 80% relative reduction in asthma exacerbations, improved symptoms and led to improvement in FEV1 in patients with
moderate to severe asthma and increased serum or sputum eosinophils.25 It may represent a promising avenue for future asthma research, as its initial investigation has shown both improvement in function and clinical outcomes. Ultimately, ongoing research will be needed to determine the long-term effects of these agents and whether they offer efficacy in asthma patients in general vs specific asthma-phenotypes.
The TNF-α inhibitors have also been investigated for use in asthma. TNF-α is an innate cytokine implicated in chronic inflammatory conditions, including rheumatoid arthritis and Crohn’s disease. Macrophages are a major source of TNF-α along with contributions from monocytes, dendritic cells, B lymphocytes, T cells,neutrophils, mast cells, and eosinophils. TNF-α has a proinflammatory effect on eosinophils, neutrophils, T cells, epithelial cells, and endothelial cells. Studies of asthma have revealed increased TNF-α within respiratory epithelial tissue biopsies and airway lavages of patients with severe asthma compared with those with good control. Etanercept, a soluble TNF-α receptor linked to human IgG1, has been reported to significantly improve symptoms and lung function in severe refractory asthma.26
However golimumab, an anti-TNF biologic, was shown to have deleterious effects, including an increased rate of serious infections, potential increased risk of malignancy, and 1 death in the treatment group.27 Identification of the correct patient population may improve clinical outcomes, but a potentially unfavorable risk benefit ratio may limit the future of anti–TNF-α therapy in severe asthma.
Considerations Unique to the Military
Active-duty personnel present unique challenges in the diagnosis and management of asthma. Service members should be questioned thoroughly on deployment and exposure history. A significant portion of the current military population has deployed to SWA in the past decade, many for multiple deployments. Research addressing respiratory complaints in the deployed military population is ongoing. To date, military research has demonstrated
that while many service members with deploymentrelated respiratory exposures have a paucity of objective findings after pulmonary medicine evaluation, some demonstrate functional limitations consistent with asthma or airway hyperresponsivenesss.28 Further retrospective studies did not find a relationship between deployment and diagnosis rates or severity in asthma patients in the Army.29 A comprehensive evaluation is recommended for service members with dyspnea to include investigating for potential asthma- or exercise-induced bronchospasm, in addition to diagnoses such as vocal cord dysfunction, GERD, and OSA.28-30
A recent study in service members with respiratory complaints related to deployment included surgical lung biopsy; however, the clinical applicability of these results is unclear, given the lack of a firm association between the histologic diagnoses and clinical condition of the subjects.31 In general, it is not recommended to perform surgical lung biopsy for patients with deployment history to SWA in the absence of objective findings on chest imaging or significant changes in pulmonary function testing. Screening spirometry has been postulated as a way to improve monitoring for military members proximate to deployment and longitudinally. However, an unpublished cost analysis estimates that for the over 500,000 activeduty service members, screening spirometry would cost in the tens of millions of dollars.32 This analysis did not include the costs of follow-up specialty care or further
tests. Although screening spirometry does not appear to be feasible presently, research evaluating screening spirometry is in progress in the military.33
If diagnosed with asthma, service members should be able to perform all required duties, wear protective gear, and have stable disease requiring infrequent, if any, oral corticosteroid treatment. According to U.S. Army retention regulations, soldiers diagnosed with asthma may be placed on temporary profile (duty restrictions) for up to 12 months when medically advised. If at the end of that trial the soldier is unable to wear a protective mask or pass the timed physical fitness run outdoors (on medications), then the soldier should be placed on a more restrictive physical profile and referred for a medical evaluation board. If able to pass the physical fitness run (or an alternate aerobic fitness event) within standards and perform all military training and duties on ICSs and bronchodilators, the soldier may be placed on a less restrictive temporary profile. If the soldier does not require medications or activity limitations, then no profile qualifications are required. Chronic asthma should also require a physical profile if it results in repetitive hospitalizations, emergency department visits, excessive time lost from duty, or repetitive use of oral corticosteroids.3
Conclusion
The evaluation and management of asthma in the military requires appropriate diagnosis, treatment, and longitudinal follow-up. The diagnosis should always be confirmed with pulmonary function and bronchoprovocation testing. Conditions mimicking asthma should be excluded, particularly when asthma does not respond to appropriate therapy. It is imperative that patients with asthma who do not demonstrate an expected course of improvement with therapy seek evaluation by a pulmonary disease specialist. This serves to re-evaluate whether the initial diagnosis was correct, assess for potential disease mimics and aggravating comorbidities, and ensure that asthma therapy is in accordance with published guidelines. Service members with asthma can remain on active duty when management with inhaled therapies allows them to meet standards and perform required duties.
Service members with asthma represent a unique and ever expanding patient population, given the role of potential respiratory exposures in SWA. Longitudinal follow-up is critical in conjunction with application of novel therapies as appropriate and understanding the impact of deployment-related respiratory exposures. These patients will continue to require care in the military health care system, the VA health care system, and in the private sector for decades to come.
Author disclosures
Dr. Morris is a paid speaker for Spiriva by Boehringer-Ingelheim. The other authors have no financial interests to disclose. None of the authors have any relevant conflicts of interest to disclose. This study was not supported by any funding or financial sponsorship.
Disclaimer
The opinions expressed herein are those of the author and do not necessarily reflect those of Federal Practitioner or Frontline Medical Communications Inc. This article may discuss unlabeled or investigational use of certain drugs. Please review complete prescribing information for specific drugs or drug combinations—including indications, contraindications, warnings, and adverse effects—before administering pharmacologic therapy to patients.
The opinions in this manuscript do not constitute endorsement by San Antonio Army Medical Center, the U.S. Army Medical Department, the U.S. Army Office of the Surgeon General, the Department of the Army, Department of Defense, or the U.S. Government of the information contained therein. The authors alone are responsible for the content and writing of the paper.
1. Tarlo SM, Balmes J, Balkissoon R, et al. Diagnosis and management of workrelated asthma: American College Of Chest Physicians Consensus Statement [published correction appears in Chest. 2008;134(4):892]. Chest. 2008;134(3)(suppl):1S-41S.
2. Nish WA, Schwietz LA. Underdiagnosis of asthma in young adults presenting for USAF basic training. Ann Allergy. 1992;69(3):239-242.
3. US Department of the Army. Standards of Medical Fitness. Army Regulation 40-501. http://armypubs.army.mil/epubs/pdf/r40_501.pdf. Revised August 4, 2011. Accessed January 8, 2015.
4. Management of Asthma Working Group. VA/DoD Clinical Practice Guideline for Management of Asthma in Children and Adults. http://www.healthquality.va.gov/guidelines/CD/asthma/ast_2_sum.pdf. Published 2009. Accessed January 8, 2015.
5. Miller MR, Crapo R, Hankinson J, et al. General considerations for lung function testing. Eur Respir J. 2005;26(1):153-161.
6. Miller MR, Hankinson J, Brusasco V, et al; ATS/ERS Task Force. Standardisation of spirometry. Eur Respir J. 2005;26(2):319-338.
7. Pellegrino R, Viegi G, Brusasco V, et al. Interpretative strategies for lung function tests. Eur Respir J. 2005;26(5):948-968.
8. Crapo RO, Casaburi R, Coates AL, et al; ATS/ERS Task Force. Guidelines for methacholine and exercise challenge testing-1999. This official statement of the American Thoracic Society was adopted by the ATS Board of Directors, July 1999. Am J Respir Crit Care Med. 2000;161(1):309-329.
9. National Asthma Education and Prevention Program, Third Expert Panel on the Diagnosis and Management of Asthma. Expert Panel Report 3: Guidelines for the Diagnosis and Management of Asthma—full report 2007. Bethesda, MD: U.S. Department of Health and Human Services, National Institutes of Health, National Heart, Lung, and Blood Institute; 2007. http://www.nhlbi.nih.gov/guidelines/asthma/asthgdln.pdf. Accessed November 18, 2014.
10. Omalizumab (Xolair): an anti-IgE antibody for asthma. Med Lett Drugs Ther. 2003;45(1163):67-68.
11. Nathan RA, Sorkness CA, Kosinski M, et al. Development of the asthma control test: a survey for assessing asthma control. J Allergy Clin Immunol. 2004;113(1):59-65.
12. Schatz M, Mosen DM, Kosinski M, et al. Validity of the Asthma Control Test completed at home. Am J Manag Care. 2007;13(12):661-667.
13. Schatz M, Sorkness CA, Li JT, et al. Asthma Control Test: reliability, validity, and responsiveness in patients not previously followed by asthma specialists. J Allergy Clin Immunol. 2006;117(3):549-556.
14. Schatz M, Zeiger RS, Drane A, et al. Reliability and predictive validity of the Asthma Control Test administered by telephone calls using speech recognition technology. J Allergy Clin Immunol. 2007;119(2):336-343.
15. Parsons JP, Mastronarde JG. Gastroesophageal reflux disease and asthma. Curr Opin Pulm Med. 2010;16(1):60-63.
16. Taylor B, Mannino D, Brown C, Crocker D, Twum-Baah N, Holguin F. Body mass index and asthma severity in the National Asthma Survey. Thorax. 2008;63(1):14-20.
17. Kribbs NB, Pack AI, Kline LR, et al. Objective measurement of patterns of nasal CPAP use by patients with obstructive sleep apnea. Am Rev Respir Dis. 1993;147(4):887-895.
18. Mancuso CA, Wenderoth S, Westermann H, Choi TN, Briggs WM, Charlson ME. Patient-reported and physician-reported depressive conditions in relation to asthma severity and control. Chest. 2008;133(5):1142-1148.
19. Castro M, Zimmermann NA, Crocker S, Bradley J, Leven C, Schechtman KB. Asthma intervention program prevents readmissions in high healthcare users. Am J Respir Crit Care Med. 2003;168(9):1095-1099.
20. Nelson HS, Weiss ST, Bleecker ER, Yancey SW, Dorinsky PM; SMART Study Group. The Salmeterol Multicenter Asthma Research Trial: a comparison of usual pharmacotherapy for asthma or usual pharmacotherapy plus salmeterol [published correction appears in Chest. 2006;129(5):1393]. Chest. 2006;129(1):15-26.
21. Walsh GM. An update on biologic-based therapy in asthma. Immunotherapy. 2013;5(11):1255-1264.
22. Pavord ID, Korn S, Howarth P, et al. Mepolizumab for severe eosinophilic asthma (DREAM): a multicentre, double-blind, placebo-controlled trial. Lancet. 2012;380(9842):651-659.
23. Corren J, Lemanske RF, Hanania NA, et al. Lebrikizumab treatment in adults with
asthma. N Engl J Med. 2011;365(12):1088-1098.
24. Piper E, Brightling C, Niven R, et al. A phase II placebo-controlled study of tralokinumab in moderate-to-severe asthma. Eur Respir J. 2013;41(2):330-338.
25. Wenzel S, Ford L, Pearlman D, et al. Dupilumab in persistent asthma with elevated eosinophil levels. N Engl J Med. 2013;368(26):2455-2466.
26. Holgate ST, Noonan M, Chanez P, et al. Efficacy and safety of etanercept in moderate-to-severe asthma: a randomised, controlled trial. Eur Respir J. 2011;37(6):1352-1359.
27. Wenzel SE, Barnes PJ, Bleecker ER, et al; T03 Asthma Investigators. A randomized, double-blind, placebo-controlled study of tumor necrosis factor-alpha blockade in severe persistent asthma. Am J Respir Crit Care Med. 2009;179(7):549-558.
28. Morris MJ, Dodson DW, Lucero PF, et al. Study of active duty military for pulmonary disease related to environmental deployment exposures (STAMPEDE). Am J Respir Crit Care Med. 2014;190(1):77-84.
29. DelVecchio SP, Collen JF, Zacher LL, Morris MJ. The impact of combat deployment on asthma diagnosis and severity. J Asthma. 2015;52(4):363-369.
30. Morris MJ, Grbach VX, Deal LE, Boyd SY, Morgan JA, Johnson JE. Evaluation of exertional dyspnea in the active duty patient: the diagnostic approach and the utility of clinical testing. Mil Med. 2002;167(4):281-288.
31. King MS, Eisenberg R, Newman JH, et al. Constrictive bronchiolitis in soldiers returning from Iraq and Afghanistan. N Engl J Med. 2011;365(3):222-230.
32. Morris MJ, Eschenbacher WL, McCannon CE. Discussion summary: recommendations for surveillance spirometry in military personnel. In: Baird CP, Harkins DK, eds. Airborne Hazards Related to Deployment. Fort Sam Houston, TX: Borden Institute, US Army Medical Department Center and School; 2014:95-102.
33. Mabe D, Perkins M, Walter R, et al. A handheld device comparable to impulse oscillometry for measurement of respiratory resistance. Chest. 2014;146 (4 MeetingAbstracts):682A.
Prostate Cancer in Male Seniors Part 2: Treatment
This article (part 2 of 2) focuses on the treatment of prostate cancer in seniors. Part 1 provided an overview of prostate cancer epidemiology, pathology, and screening in senior patients.
There have been no specific practice guidelines for managing prostate cancer in older adults, and the current management of older patients with prostate cancer is often suboptimal. Recently, the International Society of Geriatric Oncology assembled a multidisciplinary prostate cancer working group, which has begun offering guidelines on evidence-based treatments of prostate cancer in the geriatric population.
Patient Evaluation
The practice guidelines of the National Comprehensive Cancer Network (NCCN) recommend using life expectancy in determining treatment.1 Prostate cancer is considered to be an indolent disease, and active therapy may be more harmful than beneficial to older patients whose life expectancy is limited because of treatment-related sequelae. Therefore, an accurate estimation of life expectancy is important in devising treatment strategies for older patients.
Age should not be the only factor in determining the life expectancy of patients, because life expectancy varies widely based on the patient’s health status, including preexisting comorbidities. Chronologic life expectancy can be found in the Social Security Administration’s life tables. Individual life expectancy is then projected by adding 50% to or deducting 50% from the chronologic life expectancy for men in the highest and lowest quartile of health, respectively. The life expectancy from the life tables can be applied with no addition or subtraction for men in the middle 2 quartiles of health status (Figure 1).2
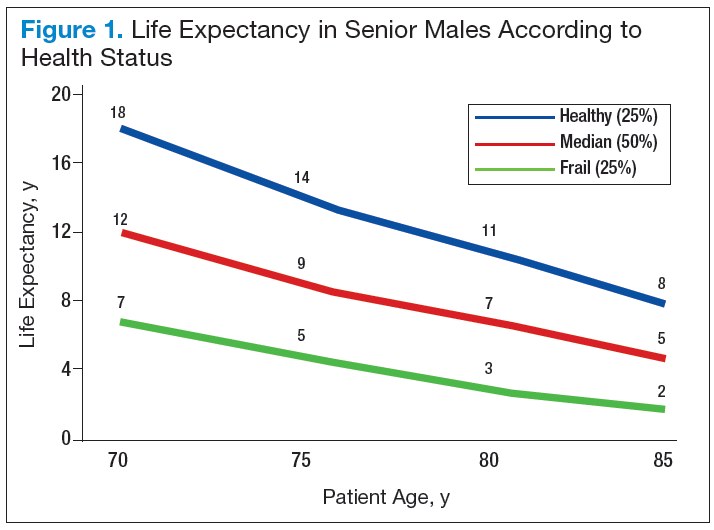
Geriatric Assessment
Despite the increasing incidence of prostate cancer in older adults, no particular guidelines for its management exist. Compared with younger patients, older
patients with prostate cancer need to weigh the benefits of treatment vs the risks to avoid any potential adverse treatment-related quality of life (QOL) decreases. Clearly, for some patients there are no significant benefits from treatment (eg, improved survival).
The Comprehensive Geriatric Assessment has been created to properly assess aging in correlation to individual and patient-centered biologic and clinical metrics.
Following extensive literature reviews, the International Society of Geriatric Oncology (SIOG) Prostate Cancer Working Group recognized that the most important prognostic factors in evaluating health status in elderly patients with prostate cancer include comorbidities, functional dependence, and nutrition status.3 An important prognosticator of survival in prostate cancer is preexisting comorbidities. The Cumulative Illness Rating Scale-Geriatrics (CIRS-G) is considered the best metric currently available in assessing a patient’s death risk unrelated to cancer.
Another important factor influencing survival of older patients with prostate cancer is the patient’s level of independent activity. Independent functioning is evaluated
using (1) activities of daily living (ADL); and (2) the instrumental activities of daily living (IADL).4-6
Health Status Subgroups
The SIOG recommendation for prostate cancer treatment in older patients is based on a complete assessment of existing comorbidities of patients using the CIRS-G,
IADL, and ADL scales as well as the nutritional status of each patient.3,7-9 Based on these prognostic tools, the SIOG classifies the health status of elderly patients with prostate cancer into 4 prognostic health status categories: healthy, vulnerable, frail, and terminal.10,11
Patient Characteristics
Older patients generally present with highrisk prostate cancer at diagnosis.12,13 However, older patients are less likely to be treated with curative intent, resulting in
lower overall and disease-specific survivals. Nearly 40% of deaths due to prostate cancer occur in patients aged ≥ 75 years and 31% in the group aged ≥ 85 years.12,14 Recent reports have demonstrated that curative radiotherapy or surgery improved survival outcomes as well as QOL in the elderly, comparable with those seen in younger patients.
Bechis and colleagues analyzed the relationship between survival of older patients with high-risk cancer and curative local therapy.15 Treatment modalities included radical prostatectomy, external-beam radiation therapy (EBRT), watchful waiting/active surveillance, and other modalities, including primary androgen deprivation therapy (ADT). The findings were: (1) older patients more frequently presented with high-risk disease as age increased; (2) therapeutic approaches varied but were based mainly on age at diagnosis rather than on cancer risk factors (Figures 2 and 3); and (3) ADT was used more frequently in older patients compared with its use in younger patients, irrespective of the risk score, including patients with high-risk disease.
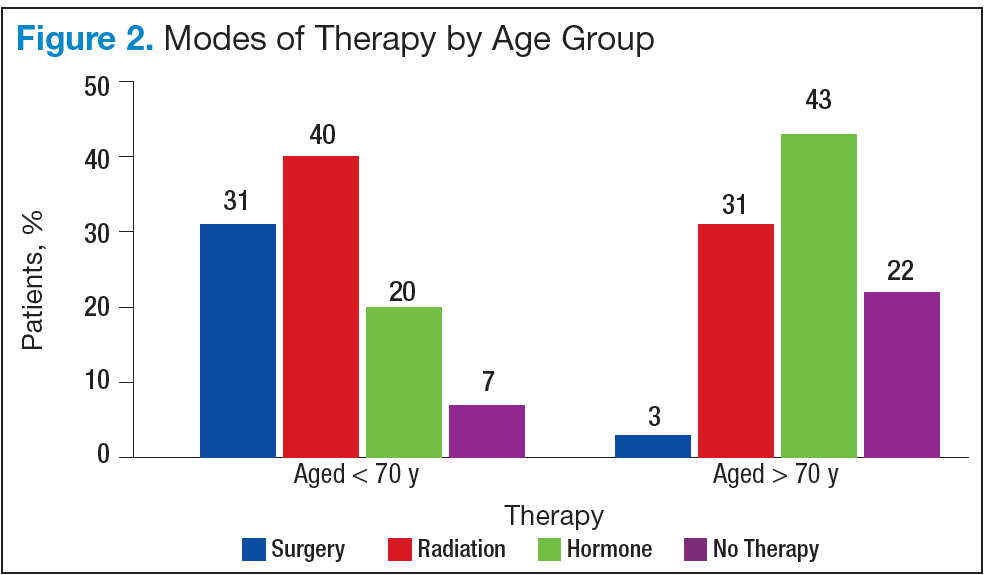
Older patients were less likely to receive radical therapy, especially surgical treatment, regardless of risk category. Forty-four percent of patients aged > 70 years with high-risk disease died of any cause at a median 5.7 years, and 21% died of prostate cancer; whereas 47% of patients aged > 75 years with high-risk disease died at a median of 5.3 years, and 20% of those died of prostate cancer.
When older patients with high-risk disease received curative local therapy, however, the mortality rate decreased.
In a study by Sun and colleagues, 4,561 senior patients who received radical prostatectomy therapy were classified into 3 age groups (aged < 60 years, aged 60 to 70 years, and aged > 70 years) based on the year of surgery (before or after 2000). Therapy outcomes were compared among the 3 groups.16 The researchers found that seniors aged > 70 years who presented with high-risk disease had poorer therapeutic outcomes. A diagnosis of advancedstage cancer and a Gleason score > 7 were more often made in patients aged > 70 years vs that of their younger counterparts. They also found greater risk of failures for these patients in biochemical recurrence, distant metastasis, and disease-specific survivals.
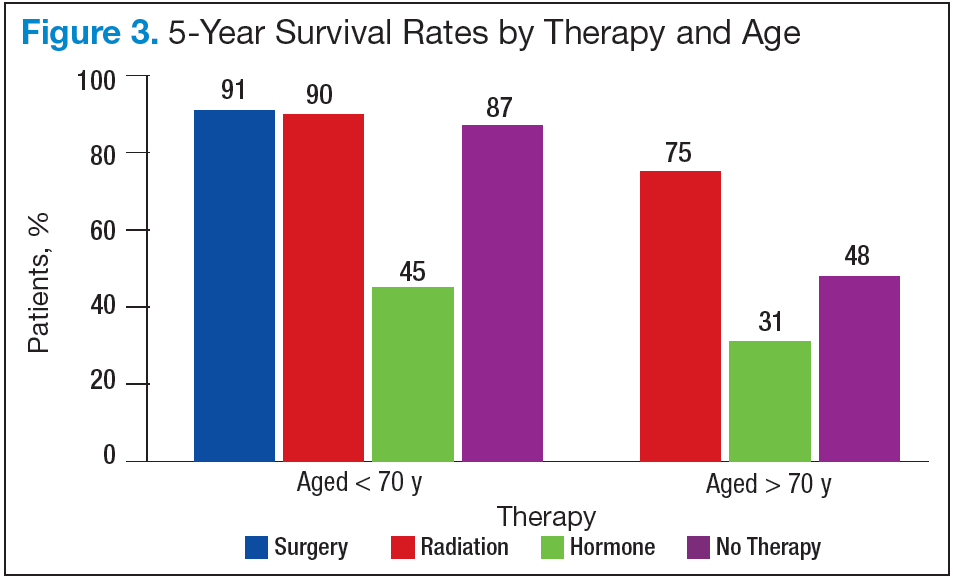
Most clinicians typically ruled out active treatment based on chronologic age alone, without considering existing comorbidities and overall life expectancy. According
to a study by Daskivich and colleagues, only 16% of patients aged > 75 years were aggressively treated, whereas 84% of patients aged < 55 years received aggressive curative therapy, using radical prostatectomy, radiation therapy, or brachytherapy.17
Therapeutic Approaches
Current NCCN guidelines recommend active surveillance as an option for men with low- and intermediate-risk disease with a < 10-year life expectancy and the only option for men with a < 20-year life expectancy and a very low-risk of prostate cancer (stage T1c, Gleason ≤ 6, prostate specific antigen [PSA] < 10 ng/mL, < 3 positive cores, < 50% core involvement, and PSA density < 0.15 ng/mL2). Patients who are older and have significant comorbidities should be managed with active surveillance rather than with active treatment. In the practice setting, however, studies indicated that a substantial number of older men with limited life expectancy still received aggressive treatment for low-risk cancer. Active treatment tended to decrease with age but was still common among men aged > 80 years: 25% received active local therapy, 36% received primary ADT, and only 39% received no active treatment.18
Surgery
Surgical treatment is an active therapeutic option for some patients with localized disease. Mortalities were reduced using prostatectomy vs watchful waiting, including disease-specific mortality and rates of metastasis. As newer techniques develop, laparoscopic prostatectomy may be able to provide excellent therapeutic
outcomes with quick surgical recovery times and possibly less postoperative nerve damage. Compared with younger patients, older patients experienced comparable
outcomes after surgical therapy.19-21 Despite encouraging surgical outcomes, however, surgery is not generally offered to patients aged > 70 years because
of the presumed high risks related to possible surgical complications.
Radiation Therapies
External-beam radiation therapy has been a well-established, standard mode of radiotherapy for the past several decades, among various radiation modalities, including brachytherapy (high- and low-dose radioactive seed implant therapy), cyber-knife therapy, and proton therapy. If indicated, EBRT rather than surgery is generally suggested as an active treatment for patients with localized prostate cancer. In general, EBRT and radical prostatectomy are comparable in survival
outcomes, but EBRT is preferred for older patients because it is noninvasive.21,22 Conventional EBRT technique has gradually progressed over the past several decades, advancing to 3D conformal radiotherapy, intensity-modulated radiation therapy (IMRT), image-guided radiotherapy, and then most recently to RapidArc radiation therapy.
RapidArc radiotherapy is an advanced form of IMRT that increases dose conformity and significantly shortens daily treatment times. In contrast to the static conventional IMRT technique (requiring repeated stops to deliver radiation through a 360° rotation of the therapy machine around the patient), RapidArc radiotherapy continues to deliver radiation therapy to the targeted tumor lesion with no interruption while the therapy machine is rotating around the patient. Accordingly, radiation therapy time is much shorter (up to 8 times faster) compared with conventional IMRT radiotherapy.
Systemic Therapy
Androgen-deprivation therapy can slow cancer growth, as it inhibits androgen production, blocks androgen action, or both. For localized prostate cancers with intermittent- and high-risk for recurrence, radiation therapy combined with ADT (eg, leuprolide, goserelin, triptorelin) reduces mortality of patients compared with ADT alone. In addition, hormone therapy is used for advanced, recurrent, or metastatic prostate cancers.
Most advanced and roughly one-fifth of biologically recurrent cancers ultimately convert to castrationresistant prostate cancer and may potentially benefit from nonhormonal systemic chemotherapy. Docetaxel with or without prednisone is the agent of choice for castration-resistant symptomatic metastatic prostate cancer. Cabazitaxel is a secondgeneration taxane and approved for castration-resistantmetastatic prostate cancer. Other systemic drugs (hormonal) for chemotherapy-naïve, metastatic castration-resistant prostate cancer are abiraterone (androgen synthesis inhibitor) and enzalutamide (anti-androgen).
Low-Risk Prostate Cancers
Active surveillance would be a reasonable management option for older patients with low-risk, localized prostate cancer and limited life expectancy of < 10 years. Albertsen and colleagues reported that patients with welldifferentiated prostate cancer and limited life expectancy have little chance of death due to prostate cancer but are more likely die of other causes, such as preexisting comorbidities.23 Bill-Axelson and colleagues reported a very similar cancer-specific mortality rate of only 2.5% for patients with well-differentiated prostate cancer who are receiving either active therapy or active surveillance.24 In another study, Krakowsky and colleagues reported a 97% 10-year cancer-specific survival rate in 450 patients with a median age of 70 years, and in a randomized study, Holmberg and colleagues reported no differences in overall survival for patients aged > 65 years who were randomized to surgery or watchful waiting for early-stage prostate cancer.25,26
The literature consistently reports cancer-specific survival rates approaching 100% for patients with low-risk prostate cancer. The main concern regarding aggressive
therapy for older patients with low-risk cancer and significant comorbidities, as well as limited life expectancy, is the real possibility of overtreatment and the resultant high risk of treatment-related complications and loss in QOL. For example, surgery can lead to varying degrees of incontinence, and radiation can lead to rectal bleeding from proctitis, both severely impacting patients’ QOL.
High-Risk Prostate Cancers
Older patients with high-risk prostate cancer generally do not receive curative therapy. Bechis and colleagues examined the influence of age on disease-specific mortality.15 They found that patients aged > 75 years were more likely to be diagnosed with high-risk prostate cancer and treated with conservative therapy, such as ADT or watchful waiting, often resulting in death. They also found that the choice of therapy in older patients was based primarily on age rather than on comorbidities or other disease factors. Trends for such undertreatment were most evident in healthy seniors with high-risk cancer. The undertreatment of older patients with lower comorbidities contributes to the higher disease-specific mortality seen in the elderly population. Such healthy older patients were often overlooked solely because of their age and might have been denied the opportunity to receive curative and life-saving therapy early.
Summary
Most prostate cancers develop in older patients, and nearly one-fourth of prostate cancers are diagnosed in patients who are aged > 75 years. In addition, older patients show a higher tendency to present with highrisk prostate cancer. Furthermore, older patients have a higher risk of death compared with that of younger
patients, although many of them still die of causes other than prostate cancer. The most important prognostic factors in older patients, as recognized by the SIOG Prostate Cancer Working Group, included comorbidities, dependence status, and nutrition status. Management decisions for older patients with prostate cancer should be individualized and formulated based on remaining life expectancy, the patient’s functional performance and health status, as well as coexisting comorbidities and patient-specific prognostic characteristics of the prostate cancer, such as stage, Gleason score, and PSA values.
Author disclosures
The authors report no actual or potential conflicts of interest with regard to this article.
Disclaimer
The opinions expressed herein are those of the authors and do not necessarily reflect those of Federal Practitioner, Frontline Medical Communications Inc., the U.S. Government, or any of its agencies. This article may discuss unlabeled or investigational use of certain drugs. Please review the complete prescribing information for specific drugs or drug combinations— including indications, contraindications, warnings, and adverse effects—before administering pharmacologic
therapy to patients.
Click here to read the digital edition.
1. NCCN Clinical Practice Guidelines in Oncology (NCCN Guidelines): prostate cancer. National Comprehensive Cancer Network Website http://www.nccn.org/professionals/physician_gls/pdf/prostate.pdf. Updated October 24, 2014. Accessed June 14, 2015.
2. Walter LC, Covinsky KE. Cancer screening in elderly patients: a framework for individualized decision making. JAMA. 2001;285(21):2750-2756.
3. Droz JP, Balducci L, Bolla M, et al. Background for the proposal of SIOG guidelines for the management of prostate cancer in senior adults. Crit Rev Oncol Hematol. 2010;73(1):68-91.
4. Extermann M. Measuring comorbidity in older cancer patients. Eur J Cancer. 2000;36(4):453-471.
5. Tewari A, Johnson CC, Divine G, et al. Long-term survival probability in men with clinically localized prostate cancer: a case-control, propensity modeling study stratified by race, age, treatment and comorbidities. J Urol. 2004;171(4):1513-1519.
6. Linn BS, Linn MW, Gurel L. Cumulative illness rating scale. J Am Geriatr Soc. 1968;16(5):622-626.
7. Katz S, Ford AB, Moskowitz RW, Jackson BA, Jaffe MW. Studies of illness in the aged. The index of ADL: a standardized measure of biological and psychosocial function. JAMA. 1963;185(12):914-919.
8. Rockwood K, Stadnyk K, MacKnight C, McDowell I, Hébert R, Hogan DB. A brief clinical instrument to classify frailty in elderly people. Lancet. 1999;353(9148):205-206.
9. Lawton MP, Brody EM. Assessment of older people: self-maintaining and instrumental activities of daily living. Gerontologist. 1969;9(3):179-186.
10. Droz JP, Balducci L, Bolla M, et al. Management of prostate cancer in older men: recommendations of a working group of the International Society of Geriatric Oncology. BJU Int. 2010;106(4):462-469.
11. Fitzpatrick JM, Graefen M, Payne HA, Scotté F, Aapro MS. A Comment on the International Society of Geriatric Oncology guidelines: evidence-based advice for the clinical setting. Oncologist. 2012;17(suppl 1):31-35.
12. Hoffman KE. Management of older men with clinically localized prostate cancer: the significance of advanced age and comorbidity. Sem Radiat Oncol. 2012;22(4):284-294.
13. Howlader N, Noon AM, Krapcho M, et al. SEER cancer statistics review 1975-2008. SEER Website. http://seer.cancer.gov/archive/csr/1975_2008. Updated November 10, 2011. Accessed June 10, 2015.
14. Shao YH, Demissie K, Shih W, et al. Contemporary risk profile of prostate cancer in the United States. J Natl Cancer Inst. 2009;101(18):1280-1283.
15. Bechis SK, Carroll PR, Cooperberg MR. Impact of age at diagnosis on prostate cancer treatment and survival. J Clin Oncol. 2011;29(2):235-241.
16. Sun L, Caire AA, Robertson CN, et al. Men older than 70 years have higher risk prostate cancer and poorer survival in the early and late prostate specific antigen eras. J Urol. 2009;182(5):2242-2248.
17. Daskivich TJ, Chamie K, Kwan L, et al. Overtreatment of men with low-risk prostate cancer and significant comorbidity. Cancer. 2011;117(10):2058-2066.
18. Cooperburg MR, Lubeck DP, Meng MV, Mehta SS, Carroll PR. The changing face of low-risk prostate cancer: trends in clinical presentation and primary management. J Clin Oncol. 2004;22(1):2141-2149.
19. Richstone L, Bianco FJ, Shah HH, et al. Radical prostatectomy in men aged > or = 70 years: effect of age on upgrading, upstaging, and the accuracy of a preoperative nomogram. BJU Int. 2008;101(5):541-546.
20. Siddiqui SA, Sengupta S, Slezak JM, et al. Impact of patient age at treatment on outcome following radical retropubic prostatectomy for prostate cancer. J Urol. 2006;175(3 pt 1):952-957.
21. Bian SX, Hoffman KE. Management of prostate cancer in elderly men. Semin Radiat Oncol. 2013;23(3):198-205.
22. Payne HA, Hughes S. Radical radiotherapy for high-risk prostate cancer in older men. Oncologist. 2012;17(suppl 1):9-15.
23. Albertsen PC, Hanley JA, Fine J. 20-year outcomes following conservative management of clinically localized prostate cancer. JAMA. 2005;293(17):2095-2101.
24. Bill-Axelson A, Holmberg L, Ruutu M, et al; Scandinavian Prostate Cancer Group Study No. 4. Radical prostatectomy versus watchful waiting in early prostate cancer. N Engl J Med. 2005;352(19):1977-1984.
25. Krakowsky Y, Loblaw A, Klotz L. Prostate cancer death of men treated with initial active surveillance: clinical and biochemical characteristics. J Urol. 2010;184(1):131-135.
26. Holmberg L, Bill-Axelson A, Helgesen F, et al; Scandinavian Prostatic Cancer Group Study Number 4. A randomized trial comparing radical prostatectomy with watchful waiting in early prostate cancer. New Engl J Med. 2002;347(11):781-789.
This article (part 2 of 2) focuses on the treatment of prostate cancer in seniors. Part 1 provided an overview of prostate cancer epidemiology, pathology, and screening in senior patients.
There have been no specific practice guidelines for managing prostate cancer in older adults, and the current management of older patients with prostate cancer is often suboptimal. Recently, the International Society of Geriatric Oncology assembled a multidisciplinary prostate cancer working group, which has begun offering guidelines on evidence-based treatments of prostate cancer in the geriatric population.
Patient Evaluation
The practice guidelines of the National Comprehensive Cancer Network (NCCN) recommend using life expectancy in determining treatment.1 Prostate cancer is considered to be an indolent disease, and active therapy may be more harmful than beneficial to older patients whose life expectancy is limited because of treatment-related sequelae. Therefore, an accurate estimation of life expectancy is important in devising treatment strategies for older patients.
Age should not be the only factor in determining the life expectancy of patients, because life expectancy varies widely based on the patient’s health status, including preexisting comorbidities. Chronologic life expectancy can be found in the Social Security Administration’s life tables. Individual life expectancy is then projected by adding 50% to or deducting 50% from the chronologic life expectancy for men in the highest and lowest quartile of health, respectively. The life expectancy from the life tables can be applied with no addition or subtraction for men in the middle 2 quartiles of health status (Figure 1).2
Geriatric Assessment
Despite the increasing incidence of prostate cancer in older adults, no particular guidelines for its management exist. Compared with younger patients, older
patients with prostate cancer need to weigh the benefits of treatment vs the risks to avoid any potential adverse treatment-related quality of life (QOL) decreases. Clearly, for some patients there are no significant benefits from treatment (eg, improved survival).
The Comprehensive Geriatric Assessment has been created to properly assess aging in correlation to individual and patient-centered biologic and clinical metrics.
Following extensive literature reviews, the International Society of Geriatric Oncology (SIOG) Prostate Cancer Working Group recognized that the most important prognostic factors in evaluating health status in elderly patients with prostate cancer include comorbidities, functional dependence, and nutrition status.3 An important prognosticator of survival in prostate cancer is preexisting comorbidities. The Cumulative Illness Rating Scale-Geriatrics (CIRS-G) is considered the best metric currently available in assessing a patient’s death risk unrelated to cancer.
Another important factor influencing survival of older patients with prostate cancer is the patient’s level of independent activity. Independent functioning is evaluated
using (1) activities of daily living (ADL); and (2) the instrumental activities of daily living (IADL).4-6
Health Status Subgroups
The SIOG recommendation for prostate cancer treatment in older patients is based on a complete assessment of existing comorbidities of patients using the CIRS-G,
IADL, and ADL scales as well as the nutritional status of each patient.3,7-9 Based on these prognostic tools, the SIOG classifies the health status of elderly patients with prostate cancer into 4 prognostic health status categories: healthy, vulnerable, frail, and terminal.10,11
Patient Characteristics
Older patients generally present with highrisk prostate cancer at diagnosis.12,13 However, older patients are less likely to be treated with curative intent, resulting in
lower overall and disease-specific survivals. Nearly 40% of deaths due to prostate cancer occur in patients aged ≥ 75 years and 31% in the group aged ≥ 85 years.12,14 Recent reports have demonstrated that curative radiotherapy or surgery improved survival outcomes as well as QOL in the elderly, comparable with those seen in younger patients.
Bechis and colleagues analyzed the relationship between survival of older patients with high-risk cancer and curative local therapy.15 Treatment modalities included radical prostatectomy, external-beam radiation therapy (EBRT), watchful waiting/active surveillance, and other modalities, including primary androgen deprivation therapy (ADT). The findings were: (1) older patients more frequently presented with high-risk disease as age increased; (2) therapeutic approaches varied but were based mainly on age at diagnosis rather than on cancer risk factors (Figures 2 and 3); and (3) ADT was used more frequently in older patients compared with its use in younger patients, irrespective of the risk score, including patients with high-risk disease.
Older patients were less likely to receive radical therapy, especially surgical treatment, regardless of risk category. Forty-four percent of patients aged > 70 years with high-risk disease died of any cause at a median 5.7 years, and 21% died of prostate cancer; whereas 47% of patients aged > 75 years with high-risk disease died at a median of 5.3 years, and 20% of those died of prostate cancer.
When older patients with high-risk disease received curative local therapy, however, the mortality rate decreased.
In a study by Sun and colleagues, 4,561 senior patients who received radical prostatectomy therapy were classified into 3 age groups (aged < 60 years, aged 60 to 70 years, and aged > 70 years) based on the year of surgery (before or after 2000). Therapy outcomes were compared among the 3 groups.16 The researchers found that seniors aged > 70 years who presented with high-risk disease had poorer therapeutic outcomes. A diagnosis of advancedstage cancer and a Gleason score > 7 were more often made in patients aged > 70 years vs that of their younger counterparts. They also found greater risk of failures for these patients in biochemical recurrence, distant metastasis, and disease-specific survivals.
Most clinicians typically ruled out active treatment based on chronologic age alone, without considering existing comorbidities and overall life expectancy. According
to a study by Daskivich and colleagues, only 16% of patients aged > 75 years were aggressively treated, whereas 84% of patients aged < 55 years received aggressive curative therapy, using radical prostatectomy, radiation therapy, or brachytherapy.17
Therapeutic Approaches
Current NCCN guidelines recommend active surveillance as an option for men with low- and intermediate-risk disease with a < 10-year life expectancy and the only option for men with a < 20-year life expectancy and a very low-risk of prostate cancer (stage T1c, Gleason ≤ 6, prostate specific antigen [PSA] < 10 ng/mL, < 3 positive cores, < 50% core involvement, and PSA density < 0.15 ng/mL2). Patients who are older and have significant comorbidities should be managed with active surveillance rather than with active treatment. In the practice setting, however, studies indicated that a substantial number of older men with limited life expectancy still received aggressive treatment for low-risk cancer. Active treatment tended to decrease with age but was still common among men aged > 80 years: 25% received active local therapy, 36% received primary ADT, and only 39% received no active treatment.18
Surgery
Surgical treatment is an active therapeutic option for some patients with localized disease. Mortalities were reduced using prostatectomy vs watchful waiting, including disease-specific mortality and rates of metastasis. As newer techniques develop, laparoscopic prostatectomy may be able to provide excellent therapeutic
outcomes with quick surgical recovery times and possibly less postoperative nerve damage. Compared with younger patients, older patients experienced comparable
outcomes after surgical therapy.19-21 Despite encouraging surgical outcomes, however, surgery is not generally offered to patients aged > 70 years because
of the presumed high risks related to possible surgical complications.
Radiation Therapies
External-beam radiation therapy has been a well-established, standard mode of radiotherapy for the past several decades, among various radiation modalities, including brachytherapy (high- and low-dose radioactive seed implant therapy), cyber-knife therapy, and proton therapy. If indicated, EBRT rather than surgery is generally suggested as an active treatment for patients with localized prostate cancer. In general, EBRT and radical prostatectomy are comparable in survival
outcomes, but EBRT is preferred for older patients because it is noninvasive.21,22 Conventional EBRT technique has gradually progressed over the past several decades, advancing to 3D conformal radiotherapy, intensity-modulated radiation therapy (IMRT), image-guided radiotherapy, and then most recently to RapidArc radiation therapy.
RapidArc radiotherapy is an advanced form of IMRT that increases dose conformity and significantly shortens daily treatment times. In contrast to the static conventional IMRT technique (requiring repeated stops to deliver radiation through a 360° rotation of the therapy machine around the patient), RapidArc radiotherapy continues to deliver radiation therapy to the targeted tumor lesion with no interruption while the therapy machine is rotating around the patient. Accordingly, radiation therapy time is much shorter (up to 8 times faster) compared with conventional IMRT radiotherapy.
Systemic Therapy
Androgen-deprivation therapy can slow cancer growth, as it inhibits androgen production, blocks androgen action, or both. For localized prostate cancers with intermittent- and high-risk for recurrence, radiation therapy combined with ADT (eg, leuprolide, goserelin, triptorelin) reduces mortality of patients compared with ADT alone. In addition, hormone therapy is used for advanced, recurrent, or metastatic prostate cancers.
Most advanced and roughly one-fifth of biologically recurrent cancers ultimately convert to castrationresistant prostate cancer and may potentially benefit from nonhormonal systemic chemotherapy. Docetaxel with or without prednisone is the agent of choice for castration-resistant symptomatic metastatic prostate cancer. Cabazitaxel is a secondgeneration taxane and approved for castration-resistantmetastatic prostate cancer. Other systemic drugs (hormonal) for chemotherapy-naïve, metastatic castration-resistant prostate cancer are abiraterone (androgen synthesis inhibitor) and enzalutamide (anti-androgen).
Low-Risk Prostate Cancers
Active surveillance would be a reasonable management option for older patients with low-risk, localized prostate cancer and limited life expectancy of < 10 years. Albertsen and colleagues reported that patients with welldifferentiated prostate cancer and limited life expectancy have little chance of death due to prostate cancer but are more likely die of other causes, such as preexisting comorbidities.23 Bill-Axelson and colleagues reported a very similar cancer-specific mortality rate of only 2.5% for patients with well-differentiated prostate cancer who are receiving either active therapy or active surveillance.24 In another study, Krakowsky and colleagues reported a 97% 10-year cancer-specific survival rate in 450 patients with a median age of 70 years, and in a randomized study, Holmberg and colleagues reported no differences in overall survival for patients aged > 65 years who were randomized to surgery or watchful waiting for early-stage prostate cancer.25,26
The literature consistently reports cancer-specific survival rates approaching 100% for patients with low-risk prostate cancer. The main concern regarding aggressive
therapy for older patients with low-risk cancer and significant comorbidities, as well as limited life expectancy, is the real possibility of overtreatment and the resultant high risk of treatment-related complications and loss in QOL. For example, surgery can lead to varying degrees of incontinence, and radiation can lead to rectal bleeding from proctitis, both severely impacting patients’ QOL.
High-Risk Prostate Cancers
Older patients with high-risk prostate cancer generally do not receive curative therapy. Bechis and colleagues examined the influence of age on disease-specific mortality.15 They found that patients aged > 75 years were more likely to be diagnosed with high-risk prostate cancer and treated with conservative therapy, such as ADT or watchful waiting, often resulting in death. They also found that the choice of therapy in older patients was based primarily on age rather than on comorbidities or other disease factors. Trends for such undertreatment were most evident in healthy seniors with high-risk cancer. The undertreatment of older patients with lower comorbidities contributes to the higher disease-specific mortality seen in the elderly population. Such healthy older patients were often overlooked solely because of their age and might have been denied the opportunity to receive curative and life-saving therapy early.
Summary
Most prostate cancers develop in older patients, and nearly one-fourth of prostate cancers are diagnosed in patients who are aged > 75 years. In addition, older patients show a higher tendency to present with highrisk prostate cancer. Furthermore, older patients have a higher risk of death compared with that of younger
patients, although many of them still die of causes other than prostate cancer. The most important prognostic factors in older patients, as recognized by the SIOG Prostate Cancer Working Group, included comorbidities, dependence status, and nutrition status. Management decisions for older patients with prostate cancer should be individualized and formulated based on remaining life expectancy, the patient’s functional performance and health status, as well as coexisting comorbidities and patient-specific prognostic characteristics of the prostate cancer, such as stage, Gleason score, and PSA values.
Author disclosures
The authors report no actual or potential conflicts of interest with regard to this article.
Disclaimer
The opinions expressed herein are those of the authors and do not necessarily reflect those of Federal Practitioner, Frontline Medical Communications Inc., the U.S. Government, or any of its agencies. This article may discuss unlabeled or investigational use of certain drugs. Please review the complete prescribing information for specific drugs or drug combinations— including indications, contraindications, warnings, and adverse effects—before administering pharmacologic
therapy to patients.
Click here to read the digital edition.
1. NCCN Clinical Practice Guidelines in Oncology (NCCN Guidelines): prostate cancer. National Comprehensive Cancer Network Website http://www.nccn.org/professionals/physician_gls/pdf/prostate.pdf. Updated October 24, 2014. Accessed June 14, 2015.
2. Walter LC, Covinsky KE. Cancer screening in elderly patients: a framework for individualized decision making. JAMA. 2001;285(21):2750-2756.
3. Droz JP, Balducci L, Bolla M, et al. Background for the proposal of SIOG guidelines for the management of prostate cancer in senior adults. Crit Rev Oncol Hematol. 2010;73(1):68-91.
4. Extermann M. Measuring comorbidity in older cancer patients. Eur J Cancer. 2000;36(4):453-471.
5. Tewari A, Johnson CC, Divine G, et al. Long-term survival probability in men with clinically localized prostate cancer: a case-control, propensity modeling study stratified by race, age, treatment and comorbidities. J Urol. 2004;171(4):1513-1519.
6. Linn BS, Linn MW, Gurel L. Cumulative illness rating scale. J Am Geriatr Soc. 1968;16(5):622-626.
7. Katz S, Ford AB, Moskowitz RW, Jackson BA, Jaffe MW. Studies of illness in the aged. The index of ADL: a standardized measure of biological and psychosocial function. JAMA. 1963;185(12):914-919.
8. Rockwood K, Stadnyk K, MacKnight C, McDowell I, Hébert R, Hogan DB. A brief clinical instrument to classify frailty in elderly people. Lancet. 1999;353(9148):205-206.
9. Lawton MP, Brody EM. Assessment of older people: self-maintaining and instrumental activities of daily living. Gerontologist. 1969;9(3):179-186.
10. Droz JP, Balducci L, Bolla M, et al. Management of prostate cancer in older men: recommendations of a working group of the International Society of Geriatric Oncology. BJU Int. 2010;106(4):462-469.
11. Fitzpatrick JM, Graefen M, Payne HA, Scotté F, Aapro MS. A Comment on the International Society of Geriatric Oncology guidelines: evidence-based advice for the clinical setting. Oncologist. 2012;17(suppl 1):31-35.
12. Hoffman KE. Management of older men with clinically localized prostate cancer: the significance of advanced age and comorbidity. Sem Radiat Oncol. 2012;22(4):284-294.
13. Howlader N, Noon AM, Krapcho M, et al. SEER cancer statistics review 1975-2008. SEER Website. http://seer.cancer.gov/archive/csr/1975_2008. Updated November 10, 2011. Accessed June 10, 2015.
14. Shao YH, Demissie K, Shih W, et al. Contemporary risk profile of prostate cancer in the United States. J Natl Cancer Inst. 2009;101(18):1280-1283.
15. Bechis SK, Carroll PR, Cooperberg MR. Impact of age at diagnosis on prostate cancer treatment and survival. J Clin Oncol. 2011;29(2):235-241.
16. Sun L, Caire AA, Robertson CN, et al. Men older than 70 years have higher risk prostate cancer and poorer survival in the early and late prostate specific antigen eras. J Urol. 2009;182(5):2242-2248.
17. Daskivich TJ, Chamie K, Kwan L, et al. Overtreatment of men with low-risk prostate cancer and significant comorbidity. Cancer. 2011;117(10):2058-2066.
18. Cooperburg MR, Lubeck DP, Meng MV, Mehta SS, Carroll PR. The changing face of low-risk prostate cancer: trends in clinical presentation and primary management. J Clin Oncol. 2004;22(1):2141-2149.
19. Richstone L, Bianco FJ, Shah HH, et al. Radical prostatectomy in men aged > or = 70 years: effect of age on upgrading, upstaging, and the accuracy of a preoperative nomogram. BJU Int. 2008;101(5):541-546.
20. Siddiqui SA, Sengupta S, Slezak JM, et al. Impact of patient age at treatment on outcome following radical retropubic prostatectomy for prostate cancer. J Urol. 2006;175(3 pt 1):952-957.
21. Bian SX, Hoffman KE. Management of prostate cancer in elderly men. Semin Radiat Oncol. 2013;23(3):198-205.
22. Payne HA, Hughes S. Radical radiotherapy for high-risk prostate cancer in older men. Oncologist. 2012;17(suppl 1):9-15.
23. Albertsen PC, Hanley JA, Fine J. 20-year outcomes following conservative management of clinically localized prostate cancer. JAMA. 2005;293(17):2095-2101.
24. Bill-Axelson A, Holmberg L, Ruutu M, et al; Scandinavian Prostate Cancer Group Study No. 4. Radical prostatectomy versus watchful waiting in early prostate cancer. N Engl J Med. 2005;352(19):1977-1984.
25. Krakowsky Y, Loblaw A, Klotz L. Prostate cancer death of men treated with initial active surveillance: clinical and biochemical characteristics. J Urol. 2010;184(1):131-135.
26. Holmberg L, Bill-Axelson A, Helgesen F, et al; Scandinavian Prostatic Cancer Group Study Number 4. A randomized trial comparing radical prostatectomy with watchful waiting in early prostate cancer. New Engl J Med. 2002;347(11):781-789.
Establishing a Genetic Cancer Risk Assessment Clinic
Genetic cancers are relatively uncommon but not rare. Although there has not been a comprehensive study of the incidence of cancers that are caused by an identifiable single gene mutation, it is estimated that they account for approximately 5% to 10% of all cancers, or 50,000 to 100,000 patients annually in the U.S.1 The hallmarks of a genetic cancer syndrome are early onset, multiple family members in multiple generations with cancer, bilateral cancer, and multiple cancers in the same person.
Until recently, the VA has not had a significant interest in genetic cancer risk assessment (GCRA). This is changing, however, because veterans with identified genetic risks for cancer can benefit from targeted screening and intervention strategies to lower their risk of dying of cancer. The value of GCRA was also recognized in the 2015 standards for accreditation of the American College of Surgeons, which include a requirement for programs to include a provision for GCRA.2
The 2 most common familial cancer syndromes are hereditary breast and ovarian cancer (HBOC) syndrome, which occurs in about 5% of all patients with breast cancer, and Lynch syndrome (LS), or hereditary nonpolyposis colorectal cancer (CRC) syndrome, which occurs in about 3% of all patients with CRC.3,4 Other familial cancer syndromes are rare: For example, familial adenomatous polyposis (FAP) accounts for 0.2% to 0.5% of all CRC cases.5
The Raymond G. Murphy VAMC in Albuquerque is the sole VA hospital in New Mexico. Its catchment area extends into southern Colorado, eastern Arizona, and western Texas. About 40 CRCs and 8 breast cancers are diagnosed at this facility yearly. Given the incidence of these familial cancer syndromes, one might expect to see 1 LS case/year, 1 HBOC case every 2 years, and 1 FAP or attenuated FAP case every 5 to 10 years.
Methods
In 2010, a GCRA clinic was set up to evaluate and manage treatment of veterans who might have inherited a genetic cancer syndrome. Prior to that, veterans with suspected genetic cancer family syndromes were referred to the University of New Mexico for evaluation and testing. Initially, the pathology department (PD) paid for genetic testing. However, due to the cost of testing, a formal budget for genetic testing was approved. Contracts were set up by the PD with outside laboratories for genetic testing services. For quality control, all veterans who were referred for genetic evaluation were seen by Dr. Lin.
The initial consultation consisted of construction of a family pedigree and evaluation, using available models or tables, such as the Myriad tables (BRCA), Penn II BRCA, or PREMM1,2,6 (LS), to estimate likelihood of finding a mutation. Veterans who had a 10% likelihood of finding a gene mutation were counseled, following the American Society of Clinical Oncology guidelines (Table 1). Those who consented to genetic testing signed a consent form and were given a copy of that form and a copy of their family pedigree. Because the VA covers the cost of counseling and testing, cost was not discussed.
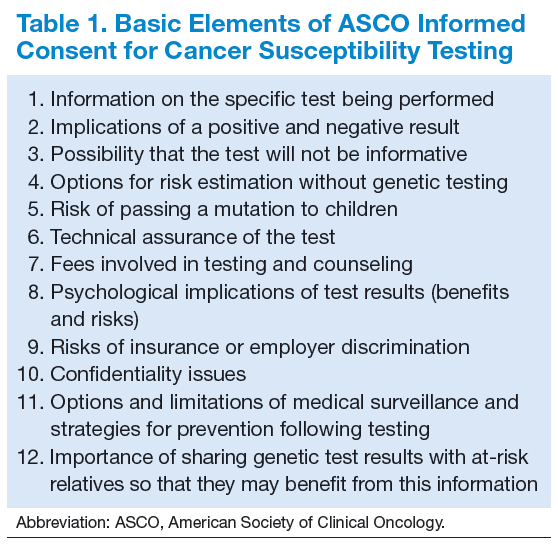
Veterans had a follow-up visit to review the test results. Patients were counseled on treatment recommendations, including a copy of current consensus recommendations, and disclosure to the family. The recommendations were then included in the patient’s electronic medical record. For example, BRCA patients had a discussion of risks and benefits of various management options, including breast magnetic resonance imaging, prophylactic mastectomy, and prophylactic bilateral salpingo-oophorectomy, once childbearing was complete.
Results
Table 2 shows the number of veterans referred to the GCRA clinic since it started in late 2010, categorized by the likely genetic syndrome, the number and percentage of veterans where genetic testing was recommended, and the results of testing. Four veterans, 2 with LS, 1 with CHEK2 mutation, and 1 with Peutz-Jeghers syndrome, were identified outside the VA system but were referred for counseling. One of the veterans with LS was referred by an outside provider who obtained a suspicious family history, and the other was identified via pathologic screening. The miscellaneous group included 1 veteran with MEN 1 and 1 veteran with Birt-Hogg-Dube.
There are a number of interesting results. Although the number of patients referred for LS was low, the number of annual referrals for possible BRCA was about equal to the number of patients with breast cancer who were diagnosed and treated yearly. Although this could have been due to pent up demand initially, the number of annual referrals has not decreased with time. Furthermore, the number of patients referred for polyposis has been considerably higher than would be expected by the rarity of attenuated FAP. Initially, patients with 10 to 20 polyps of any type were referred for evaluation. All but 1 had their first polyp diagnosed after the age of 50 years. Five veterans who were referred to GCRA had < 10 polyps lifetime, 3 veterans had between 10 and 20 polyps, and 12 veterans have had ≥ 20 adenomatous polyps over their lifetime. None seen to date have had a personal or family history of gastrointestinal (GI) cancer.
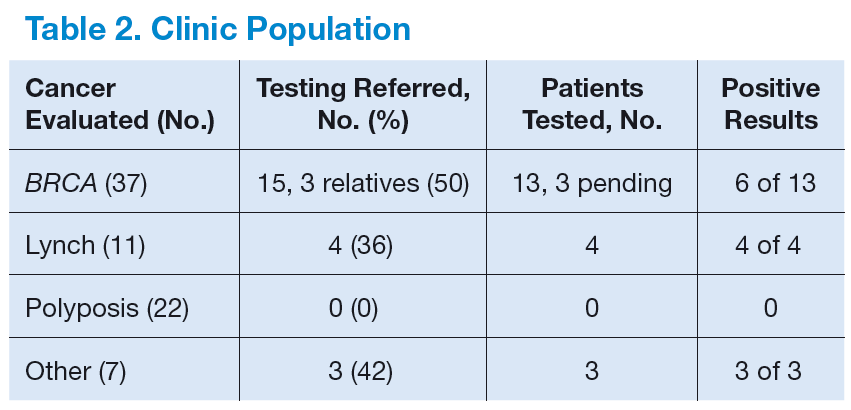
Discussion
A genetic cancer risk assessment clinic was set up in a VA hospital and has been running successfully for 4 years. Although many parts of setting up such a clinic are common to a community GCRA clinic, there are also aspects that are specific to a VA setting.6
Because genetic testing is relatively expensive, a budget must be set up and approved by VA administration. This budget is based on the estimated number of veterans that will be referred yearly, the likely percentage that will need to be tested, and the cost of testing. Currently, the average cost of a single gene test is about $2,000 to $3,000. Some patients will need to have 2 to 4 genes tested. Furthermore, many centers are now moving to multigene testing, and the cost of these panels is about $10,000 or more, though this is less than the cumulative cost of the genes done individually.
Since there is currently no national VA contract for genetic cancer testing, each VA facility needs to negotiate contracts with outside laboratories. Several of these laboratories offer gene panel testing, but the panels vary from one laboratory to another.
Limiting the number of providers who can order genetic testing helps maintain quality control and ensure a comprehensive database of patient testing. At the Albuquerque VAMC, Dr. Lin is currently the only provider who can order genetic testing for cancer risk assessment. Nearly all GCRA consultations, from obtaining a detailed family history to providing education on the risks, benefits, and limitations of genetic testing, can be conducted via telemedicine. The VA GCRA program in Utah has established a number of telemedicine collaborations with VA facilities around the country, beginning with BRCA consultations and branching out into a national LS screening program.
The first few years of the program have shown some unexpected results, including a much higher referral rate for HBOC referrals than was anticipated. The reasons for this are not clear. The high rate of polyposis referrals can be attributed in large part to the robust CRC screening program in the VA system. Veterans are routinely screened for CRC with occult blood tests, and positive results are referred for colonoscopy. Nearly 400 veterans per year have a colonoscopy at the Albuquerque VAMC.
Because the VA screening program begins at age 50 years, nearly all the veterans referred to date have had their first polyp diagnosed at age ≥ 50 years. Unfortunately, the 1 patient who had polyps and CRC at a young age was not tested due to lack of budget when she was evaluated. By contrast, in a large study, the median age of first polyp diagnosis in patients with APC mutation was 30 years, and with biallelic MUTYH mutations was 47 years.7
The difficulty in distinguishing which veterans should be tested for attenuated FAP lies in the fact that age of onset and personal or family history alone or in
combination do not seem to be adequate discriminators to screen out low-risk veterans who do not need testing.7 Considering the number of veterans referred each year and the incidence of attenuated FAP, if every veteran who fit the current criteria of 20 adenomatous polyps lifetime were tested, about 35 to 70 veterans would have to be tested to detect 1 mutation carrier. The development of clinical criteria to identify low-risk patients would be very helpful.
On the other hand, referrals for LS were uncommon. This is consistent with results reported elsewhere.8 For this reason, diagnosis of LS has shifted from clinical identification to pathologic screening for the molecular hallmarks of LS in tumor specimens.8,9 Shortly after the GCRA clinic was established, a pathologist with an interest in GI malignancies developed and validated a pathologic screening program using immunohistochemistry (IHC) staining for mismatch repair (MMR) gene expression, with the assistance of a pathologist who had been involved in a community-based LS screening program.9 For the past 3 years, all CRC patients aged ≤ 60 years have been screened for loss of expression of MMR IHC. Patients identified have been seen in the GCRA clinic to discuss possible genetic testing. This screening program is now extending to all patients with CRC aged ≤ 70 years, in line with consensus recommendations.10
The Future
The lack of a national VA contract with outside laboratories for genetic testing means that each facility has to negotiate its own contract, which is a wasteful duplication of resources that needs to be addressed. Beyond this parochial concern, GCRA is undergoing a revolution in diagnosing and managing cancer risk. In the past, a careful family history was followed by selected single gene testing for mutations, using Sanger sequencing. However, many laboratories are now offering multigene testing using next-generation sequencing that can look at multiple genes, all the way up to whole genome sequencing. Current estimates for the actual cost to the laboratory for a whole genome using next-generation sequencing is about $1,000.
A number of laboratories also have been offering multigene panels for testing in patients with familial cancer syndromes. The genes in these panels include those with a well-documented association with known cancer syndromes as well as other genes where mutations may confer only a modestly increased risk. Furthermore, new genetic syndromes and new genes associated with known syndromes are being reported yearly.
This revolution in technology and the virtual explosion in the amount of data generated have raised as many questions as answers.11 One joke in the genetic testing community goes: “$1,000 genome, $100,000 interpretation.” Among the remaining issues are how to counsel patients about the possible results from multigene testing, including the possibility of results that may be applicable to noncancer-related diagnoses; what to do about the unanticipated actionable finding (incidentaloma); how to interpret and treat a patient whose gene test results are at odds with the clinical family history; how to treat patients whose panel returns with a mutation in a gene that has only a minor increased risk for the cancers; how genes with modestly increased or decreased risk singly or in combination may modify highrisk gene expression; and how to address variants of unknown significance.
A general consensus has emerged that these questions will need much more research correlating genetic and clinical data to answer. As a result, many leading researchers have set up multi-institutional, international collaborative groups directed at specific syndromes, which pool data from many investigators to answer questions beyond the capability of any single investigator or group. These big data collaborative studies are already beginning to publish early results and seem to represent the future of genetic cancer risk assessment, a field that is at once dynamic, exciting, and confusing.4
A major question is whether and how the VA can cooperate with these international consortia. The VA has particular concerns about confidentiality based on past experience, but it also has a unique group of patients who could provide valuable contributions to our knowledge about genetic markers for disease, including cancer. A method for the VA system to provide data to collaborative groups who are advancing our knowledge of the genetic risk factors for cancer while protecting the confidentiality of veterans could provide a model for collaboration between the VA and non-VA health care systems.
Author disclosures
The author reports no actual or potential conflicts of interest with regard to this article.
Disclaimer
The opinions expressed herein are those of the author and do not necessarily reflect those of Federal Practitioner, Frontline Medical Communications Inc., the U.S. Government, or any of its agencies. This article may discuss unlabeled or investigational use of certain drugs. Please review the complete prescribing information for specific drugs or drug combinations—including indications, contraindications, warnings, and adverse effects—before administering pharmacologic therapy to patients.
Click here to read the digital edition.
1. Claus EB, Schildkraut JM, Thompson WD, Risch NJ. The genetic attributable risk of breast and ovarian cancer. Cancer. 1996;77(11):2318-2324.
2. American College of Surgeons. Cancer Program Standards 2012: Ensuring Patient- Centered Care, v1.2.1. Chicago, IL: American College of Surgeons; 2012. https://www.facs.org/~/media/files/quality%20programs/cancer/coc/programstandards2012.ashx. Accessed July 6, 2015.
3. Campeau PM, Foulkes WD, Tischkowitz MD. Hereditary breast cancer: new genetic developments, new therapeutic avenues. Hum Genet. 2008;124(1):31-34.
4. Moreira L, Balaguer F, Lindor N, et al; EPICOLON Consortium. Identification of Lynch syndrome among patients with colorectal cancer. JAMA. 2012;308(15):1555-1565.
5. Bülow S, Faurschou Nielsen T, Bülow C, Bisgaard ML, Karlsen L, Moesgaard F. The incidence rate of familial adenomatous polyposis. Results from the Danish Polyposis Register. Int J Colorect Dis. 1996;11(2):88-91.
6. Duncan PR, Lin JT. Ingredients for success: a familial cancer clinic in an oncology
practice setting. J Oncol Pract. 2011;7(1):39-42.
7. Grover S, Kastrinos F, Steyerberg EW, et al. Prevalence and phenotypes of APC and MUTYH mutations in patients with multiple colorectal adenomas. JAMA. 2012;308(5):485-492.
8. Hampel H, de la Chapelle A. How do we approach the goal of identifying everybody with Lynch syndrome? Fam Cancer. 2013;12(2):313-317.
9. Duncan PR, Lin JT, Feddersen R. Prospective screening for Lynch syndrome (LS) in a cohort of colorectal cancer (CRC) surgical patients in a community hospital. J Clin Oncol. 2010;28(suppl; abstr 1535):15s.
10. Giardiello FM, Allen JI, Axilbund JE, et al. Guidelines on genetic evaluation and management of Lynch syndrome: a consensus statement by the US Multi-Society Task Force on Colorectal Cancer. Dis Colon Rectum. 2014;57(8):1025-1048.
11. Domchek SM, Bradbury A, Garber JE, Offit K, Robson ME. Multiplex genetic testing for cancer susceptibility: out on a high wire without a net? J Clin Oncol. 2013;31(10):1267-1270.
Genetic cancers are relatively uncommon but not rare. Although there has not been a comprehensive study of the incidence of cancers that are caused by an identifiable single gene mutation, it is estimated that they account for approximately 5% to 10% of all cancers, or 50,000 to 100,000 patients annually in the U.S.1 The hallmarks of a genetic cancer syndrome are early onset, multiple family members in multiple generations with cancer, bilateral cancer, and multiple cancers in the same person.
Until recently, the VA has not had a significant interest in genetic cancer risk assessment (GCRA). This is changing, however, because veterans with identified genetic risks for cancer can benefit from targeted screening and intervention strategies to lower their risk of dying of cancer. The value of GCRA was also recognized in the 2015 standards for accreditation of the American College of Surgeons, which include a requirement for programs to include a provision for GCRA.2
The 2 most common familial cancer syndromes are hereditary breast and ovarian cancer (HBOC) syndrome, which occurs in about 5% of all patients with breast cancer, and Lynch syndrome (LS), or hereditary nonpolyposis colorectal cancer (CRC) syndrome, which occurs in about 3% of all patients with CRC.3,4 Other familial cancer syndromes are rare: For example, familial adenomatous polyposis (FAP) accounts for 0.2% to 0.5% of all CRC cases.5
The Raymond G. Murphy VAMC in Albuquerque is the sole VA hospital in New Mexico. Its catchment area extends into southern Colorado, eastern Arizona, and western Texas. About 40 CRCs and 8 breast cancers are diagnosed at this facility yearly. Given the incidence of these familial cancer syndromes, one might expect to see 1 LS case/year, 1 HBOC case every 2 years, and 1 FAP or attenuated FAP case every 5 to 10 years.
Methods
In 2010, a GCRA clinic was set up to evaluate and manage treatment of veterans who might have inherited a genetic cancer syndrome. Prior to that, veterans with suspected genetic cancer family syndromes were referred to the University of New Mexico for evaluation and testing. Initially, the pathology department (PD) paid for genetic testing. However, due to the cost of testing, a formal budget for genetic testing was approved. Contracts were set up by the PD with outside laboratories for genetic testing services. For quality control, all veterans who were referred for genetic evaluation were seen by Dr. Lin.
The initial consultation consisted of construction of a family pedigree and evaluation, using available models or tables, such as the Myriad tables (BRCA), Penn II BRCA, or PREMM1,2,6 (LS), to estimate likelihood of finding a mutation. Veterans who had a 10% likelihood of finding a gene mutation were counseled, following the American Society of Clinical Oncology guidelines (Table 1). Those who consented to genetic testing signed a consent form and were given a copy of that form and a copy of their family pedigree. Because the VA covers the cost of counseling and testing, cost was not discussed.
Veterans had a follow-up visit to review the test results. Patients were counseled on treatment recommendations, including a copy of current consensus recommendations, and disclosure to the family. The recommendations were then included in the patient’s electronic medical record. For example, BRCA patients had a discussion of risks and benefits of various management options, including breast magnetic resonance imaging, prophylactic mastectomy, and prophylactic bilateral salpingo-oophorectomy, once childbearing was complete.
Results
Table 2 shows the number of veterans referred to the GCRA clinic since it started in late 2010, categorized by the likely genetic syndrome, the number and percentage of veterans where genetic testing was recommended, and the results of testing. Four veterans, 2 with LS, 1 with CHEK2 mutation, and 1 with Peutz-Jeghers syndrome, were identified outside the VA system but were referred for counseling. One of the veterans with LS was referred by an outside provider who obtained a suspicious family history, and the other was identified via pathologic screening. The miscellaneous group included 1 veteran with MEN 1 and 1 veteran with Birt-Hogg-Dube.
There are a number of interesting results. Although the number of patients referred for LS was low, the number of annual referrals for possible BRCA was about equal to the number of patients with breast cancer who were diagnosed and treated yearly. Although this could have been due to pent up demand initially, the number of annual referrals has not decreased with time. Furthermore, the number of patients referred for polyposis has been considerably higher than would be expected by the rarity of attenuated FAP. Initially, patients with 10 to 20 polyps of any type were referred for evaluation. All but 1 had their first polyp diagnosed after the age of 50 years. Five veterans who were referred to GCRA had < 10 polyps lifetime, 3 veterans had between 10 and 20 polyps, and 12 veterans have had ≥ 20 adenomatous polyps over their lifetime. None seen to date have had a personal or family history of gastrointestinal (GI) cancer.
Discussion
A genetic cancer risk assessment clinic was set up in a VA hospital and has been running successfully for 4 years. Although many parts of setting up such a clinic are common to a community GCRA clinic, there are also aspects that are specific to a VA setting.6
Because genetic testing is relatively expensive, a budget must be set up and approved by VA administration. This budget is based on the estimated number of veterans that will be referred yearly, the likely percentage that will need to be tested, and the cost of testing. Currently, the average cost of a single gene test is about $2,000 to $3,000. Some patients will need to have 2 to 4 genes tested. Furthermore, many centers are now moving to multigene testing, and the cost of these panels is about $10,000 or more, though this is less than the cumulative cost of the genes done individually.
Since there is currently no national VA contract for genetic cancer testing, each VA facility needs to negotiate contracts with outside laboratories. Several of these laboratories offer gene panel testing, but the panels vary from one laboratory to another.
Limiting the number of providers who can order genetic testing helps maintain quality control and ensure a comprehensive database of patient testing. At the Albuquerque VAMC, Dr. Lin is currently the only provider who can order genetic testing for cancer risk assessment. Nearly all GCRA consultations, from obtaining a detailed family history to providing education on the risks, benefits, and limitations of genetic testing, can be conducted via telemedicine. The VA GCRA program in Utah has established a number of telemedicine collaborations with VA facilities around the country, beginning with BRCA consultations and branching out into a national LS screening program.
The first few years of the program have shown some unexpected results, including a much higher referral rate for HBOC referrals than was anticipated. The reasons for this are not clear. The high rate of polyposis referrals can be attributed in large part to the robust CRC screening program in the VA system. Veterans are routinely screened for CRC with occult blood tests, and positive results are referred for colonoscopy. Nearly 400 veterans per year have a colonoscopy at the Albuquerque VAMC.
Because the VA screening program begins at age 50 years, nearly all the veterans referred to date have had their first polyp diagnosed at age ≥ 50 years. Unfortunately, the 1 patient who had polyps and CRC at a young age was not tested due to lack of budget when she was evaluated. By contrast, in a large study, the median age of first polyp diagnosis in patients with APC mutation was 30 years, and with biallelic MUTYH mutations was 47 years.7
The difficulty in distinguishing which veterans should be tested for attenuated FAP lies in the fact that age of onset and personal or family history alone or in
combination do not seem to be adequate discriminators to screen out low-risk veterans who do not need testing.7 Considering the number of veterans referred each year and the incidence of attenuated FAP, if every veteran who fit the current criteria of 20 adenomatous polyps lifetime were tested, about 35 to 70 veterans would have to be tested to detect 1 mutation carrier. The development of clinical criteria to identify low-risk patients would be very helpful.
On the other hand, referrals for LS were uncommon. This is consistent with results reported elsewhere.8 For this reason, diagnosis of LS has shifted from clinical identification to pathologic screening for the molecular hallmarks of LS in tumor specimens.8,9 Shortly after the GCRA clinic was established, a pathologist with an interest in GI malignancies developed and validated a pathologic screening program using immunohistochemistry (IHC) staining for mismatch repair (MMR) gene expression, with the assistance of a pathologist who had been involved in a community-based LS screening program.9 For the past 3 years, all CRC patients aged ≤ 60 years have been screened for loss of expression of MMR IHC. Patients identified have been seen in the GCRA clinic to discuss possible genetic testing. This screening program is now extending to all patients with CRC aged ≤ 70 years, in line with consensus recommendations.10
The Future
The lack of a national VA contract with outside laboratories for genetic testing means that each facility has to negotiate its own contract, which is a wasteful duplication of resources that needs to be addressed. Beyond this parochial concern, GCRA is undergoing a revolution in diagnosing and managing cancer risk. In the past, a careful family history was followed by selected single gene testing for mutations, using Sanger sequencing. However, many laboratories are now offering multigene testing using next-generation sequencing that can look at multiple genes, all the way up to whole genome sequencing. Current estimates for the actual cost to the laboratory for a whole genome using next-generation sequencing is about $1,000.
A number of laboratories also have been offering multigene panels for testing in patients with familial cancer syndromes. The genes in these panels include those with a well-documented association with known cancer syndromes as well as other genes where mutations may confer only a modestly increased risk. Furthermore, new genetic syndromes and new genes associated with known syndromes are being reported yearly.
This revolution in technology and the virtual explosion in the amount of data generated have raised as many questions as answers.11 One joke in the genetic testing community goes: “$1,000 genome, $100,000 interpretation.” Among the remaining issues are how to counsel patients about the possible results from multigene testing, including the possibility of results that may be applicable to noncancer-related diagnoses; what to do about the unanticipated actionable finding (incidentaloma); how to interpret and treat a patient whose gene test results are at odds with the clinical family history; how to treat patients whose panel returns with a mutation in a gene that has only a minor increased risk for the cancers; how genes with modestly increased or decreased risk singly or in combination may modify highrisk gene expression; and how to address variants of unknown significance.
A general consensus has emerged that these questions will need much more research correlating genetic and clinical data to answer. As a result, many leading researchers have set up multi-institutional, international collaborative groups directed at specific syndromes, which pool data from many investigators to answer questions beyond the capability of any single investigator or group. These big data collaborative studies are already beginning to publish early results and seem to represent the future of genetic cancer risk assessment, a field that is at once dynamic, exciting, and confusing.4
A major question is whether and how the VA can cooperate with these international consortia. The VA has particular concerns about confidentiality based on past experience, but it also has a unique group of patients who could provide valuable contributions to our knowledge about genetic markers for disease, including cancer. A method for the VA system to provide data to collaborative groups who are advancing our knowledge of the genetic risk factors for cancer while protecting the confidentiality of veterans could provide a model for collaboration between the VA and non-VA health care systems.
Author disclosures
The author reports no actual or potential conflicts of interest with regard to this article.
Disclaimer
The opinions expressed herein are those of the author and do not necessarily reflect those of Federal Practitioner, Frontline Medical Communications Inc., the U.S. Government, or any of its agencies. This article may discuss unlabeled or investigational use of certain drugs. Please review the complete prescribing information for specific drugs or drug combinations—including indications, contraindications, warnings, and adverse effects—before administering pharmacologic therapy to patients.
Click here to read the digital edition.
1. Claus EB, Schildkraut JM, Thompson WD, Risch NJ. The genetic attributable risk of breast and ovarian cancer. Cancer. 1996;77(11):2318-2324.
2. American College of Surgeons. Cancer Program Standards 2012: Ensuring Patient- Centered Care, v1.2.1. Chicago, IL: American College of Surgeons; 2012. https://www.facs.org/~/media/files/quality%20programs/cancer/coc/programstandards2012.ashx. Accessed July 6, 2015.
3. Campeau PM, Foulkes WD, Tischkowitz MD. Hereditary breast cancer: new genetic developments, new therapeutic avenues. Hum Genet. 2008;124(1):31-34.
4. Moreira L, Balaguer F, Lindor N, et al; EPICOLON Consortium. Identification of Lynch syndrome among patients with colorectal cancer. JAMA. 2012;308(15):1555-1565.
5. Bülow S, Faurschou Nielsen T, Bülow C, Bisgaard ML, Karlsen L, Moesgaard F. The incidence rate of familial adenomatous polyposis. Results from the Danish Polyposis Register. Int J Colorect Dis. 1996;11(2):88-91.
6. Duncan PR, Lin JT. Ingredients for success: a familial cancer clinic in an oncology
practice setting. J Oncol Pract. 2011;7(1):39-42.
7. Grover S, Kastrinos F, Steyerberg EW, et al. Prevalence and phenotypes of APC and MUTYH mutations in patients with multiple colorectal adenomas. JAMA. 2012;308(5):485-492.
8. Hampel H, de la Chapelle A. How do we approach the goal of identifying everybody with Lynch syndrome? Fam Cancer. 2013;12(2):313-317.
9. Duncan PR, Lin JT, Feddersen R. Prospective screening for Lynch syndrome (LS) in a cohort of colorectal cancer (CRC) surgical patients in a community hospital. J Clin Oncol. 2010;28(suppl; abstr 1535):15s.
10. Giardiello FM, Allen JI, Axilbund JE, et al. Guidelines on genetic evaluation and management of Lynch syndrome: a consensus statement by the US Multi-Society Task Force on Colorectal Cancer. Dis Colon Rectum. 2014;57(8):1025-1048.
11. Domchek SM, Bradbury A, Garber JE, Offit K, Robson ME. Multiplex genetic testing for cancer susceptibility: out on a high wire without a net? J Clin Oncol. 2013;31(10):1267-1270.
Improving Patient Satisfaction in Dermatology: A Prospective Study of an Urban Dermatology Clinic
The Patient Protection and Affordable Care Act was signed into law in 2010, aiming to expand access to and improve the quality of health care in the United States. In the states that expanded Medicaid eligibility, uninsurance among adults decreased from 15.8% in September 2013 to 7.3% in March 2016, a decline of 53.8%.1 On average, these newly insured individuals were younger and more likely to report fair to poor health than those previously insured. Approximately half of the newly insured have family incomes at or below 138% of the federal poverty level.1
Improvement in quality in medicine is not as easily quantified. Several programs have been implemented through the Centers for Medicare & Medicaid Services to measure and reimburse hospital systems and providers based on the quality and value of care being provided. Because of the complexity in defining quality in medicine, patient satisfaction has become a proxy measurement tool.2 With higher numbers of insured patients and an increased demand for services, dermatologists are being challenged to improve availability of services and respond to patients’ needs and desires as expressed through satisfaction surveys.
Few studies have assessed patient satisfaction in dermatology practices. As patient satisfaction surveys move to the forefront under the Patient Protection and Affordable Care Act, hospitals and providers will try to demonstrate the quality of their care through positive survey responses from patients. Importantly, patient satisfaction is a strong determinate if patients will comply with treatment and continue seeing their practitioner.3 A better understanding of patients’ perceptions regarding quality will allow for targeted interventions to be implemented. This study assesses and analyzes patient satisfaction, nonattendance rates, and cycle times in an outpatient dermatology clinic to provide a snapshot of patient satisfaction in an urban dermatology clinic.
Dr. Adam Sutton discusses the results of this study with Editor-in-Chief Vincent A. DeLeo, MD, in a "Peer to Peer" audiocast, "Measuring Patient Satisfaction: How Do Patients Perceive Quality of Care Delivered by Dermatologists?"
Methods
We conducted a prospective study that was approved by the University of Southern California Health Sciences (Los Angeles, California) institutional review board. A convenience sample of patients 18 years and older who spoke English or Spanish were recruited to participate in the study and agreed to complete the Patient Satisfaction Questionnaire Short Form (PSQ-18) and a demographic questionnaire, both in English or Spanish, at the conclusion of their visit.
Based on schedules and availability, medical students came to our clinic and obtained the surveys in the following manner: After patients checked in, the students approached the patients in the waiting area and asked if they would be willing to participate in the study. If patients agreed to participate, they provided written consent and the medical student handed them an envelope containing paper copies of the survey in English or Spanish, depending on the patient’s preference. Patients were asked to complete the surveys at the end of the visit and return them to the student in the envelope. The medical students did not otherwise participate in the patient’s visit.
Surveys were collected over an 8-month period at Los Angeles County+USC Medical Center dermatology clinics, which are part of a large safety-net health system. Among this population, it is common for patients to lack reliable Internet access or permanent home addresses; therefore, we elected to use point-of-care printed survey forms. Midway through the survey collection, we moved our clinic location; however, patients and physicians did not change. The comparison between clinics showed no substantive differences and did not change the conclusions of the study.
Patient Demographics
Demographic variables were age, sex, ethnicity, highest education level, annual household income, and primary language. Patients were grouped into 4 age categories: 18 to 29 years, 30 to 49 years, 50 to 64 years, and 65 years and older. Ethnicity was classified as Hispanic/Latino or other. Highest education level was classified as high school diploma or lower, and some college or higher. Annual household income was grouped into 3 categories: less than $15,000, $15,000 to $35,000, and more than $35,000.
Patient Satisfaction Questionnaire
The PSQ-18 survey was developed by the RAND Corporation (Santa Monica, California) and has been validated.4 The survey asks patients to rate aspects of their care experience on a 5-point Likert scale (strongly agree, agree, uncertain, disagree, strongly disagree), with 5 representing highest satisfaction. The survey contains 18 questions and is scored on 7 subscales: general satisfaction, technical quality, interpersonal manner, communication, financial aspects, time spent with doctor, and accessibility and convenience. The survey typically takes less than 5 minutes to complete.
Cycle Times and Nonattendance Rates
Cycle time is defined as the total amount of time that a patient spends in a clinic from check in to checkout, which was collected from our scheduling system for each patient who agreed to participate in the study. Cycle times were grouped into 4 categories: 0 to 60 minutes, 61 to 90 minutes, 91 to 120 minutes, and 121 minutes or more. During the study period, data also were collected from the electronic health record system regarding the number of patients with appointments scheduled and the number of patients who attended each clinic. From these figures, the rate of nonattendance for each clinic was calculated.
Statistical Analysis
Demographic results were calculated using arithmetic means. The PSQ-18 subscale scores were compared among demographic subgroups using a generalized linear model. Covariates included age, sex, ethnicity, highest education level, annual household income, and primary language. All statistical analyses were conducted using SAS software version 9.2.
Results
Of the 298 participants surveyed, the average age was 49 years, 51% were male, 73% self-identified as Hispanic/Latino, 64% spoke Spanish, 58% had a high school diploma or lower, and 68% reported an annual household income of less than $15,000 (Table 1).
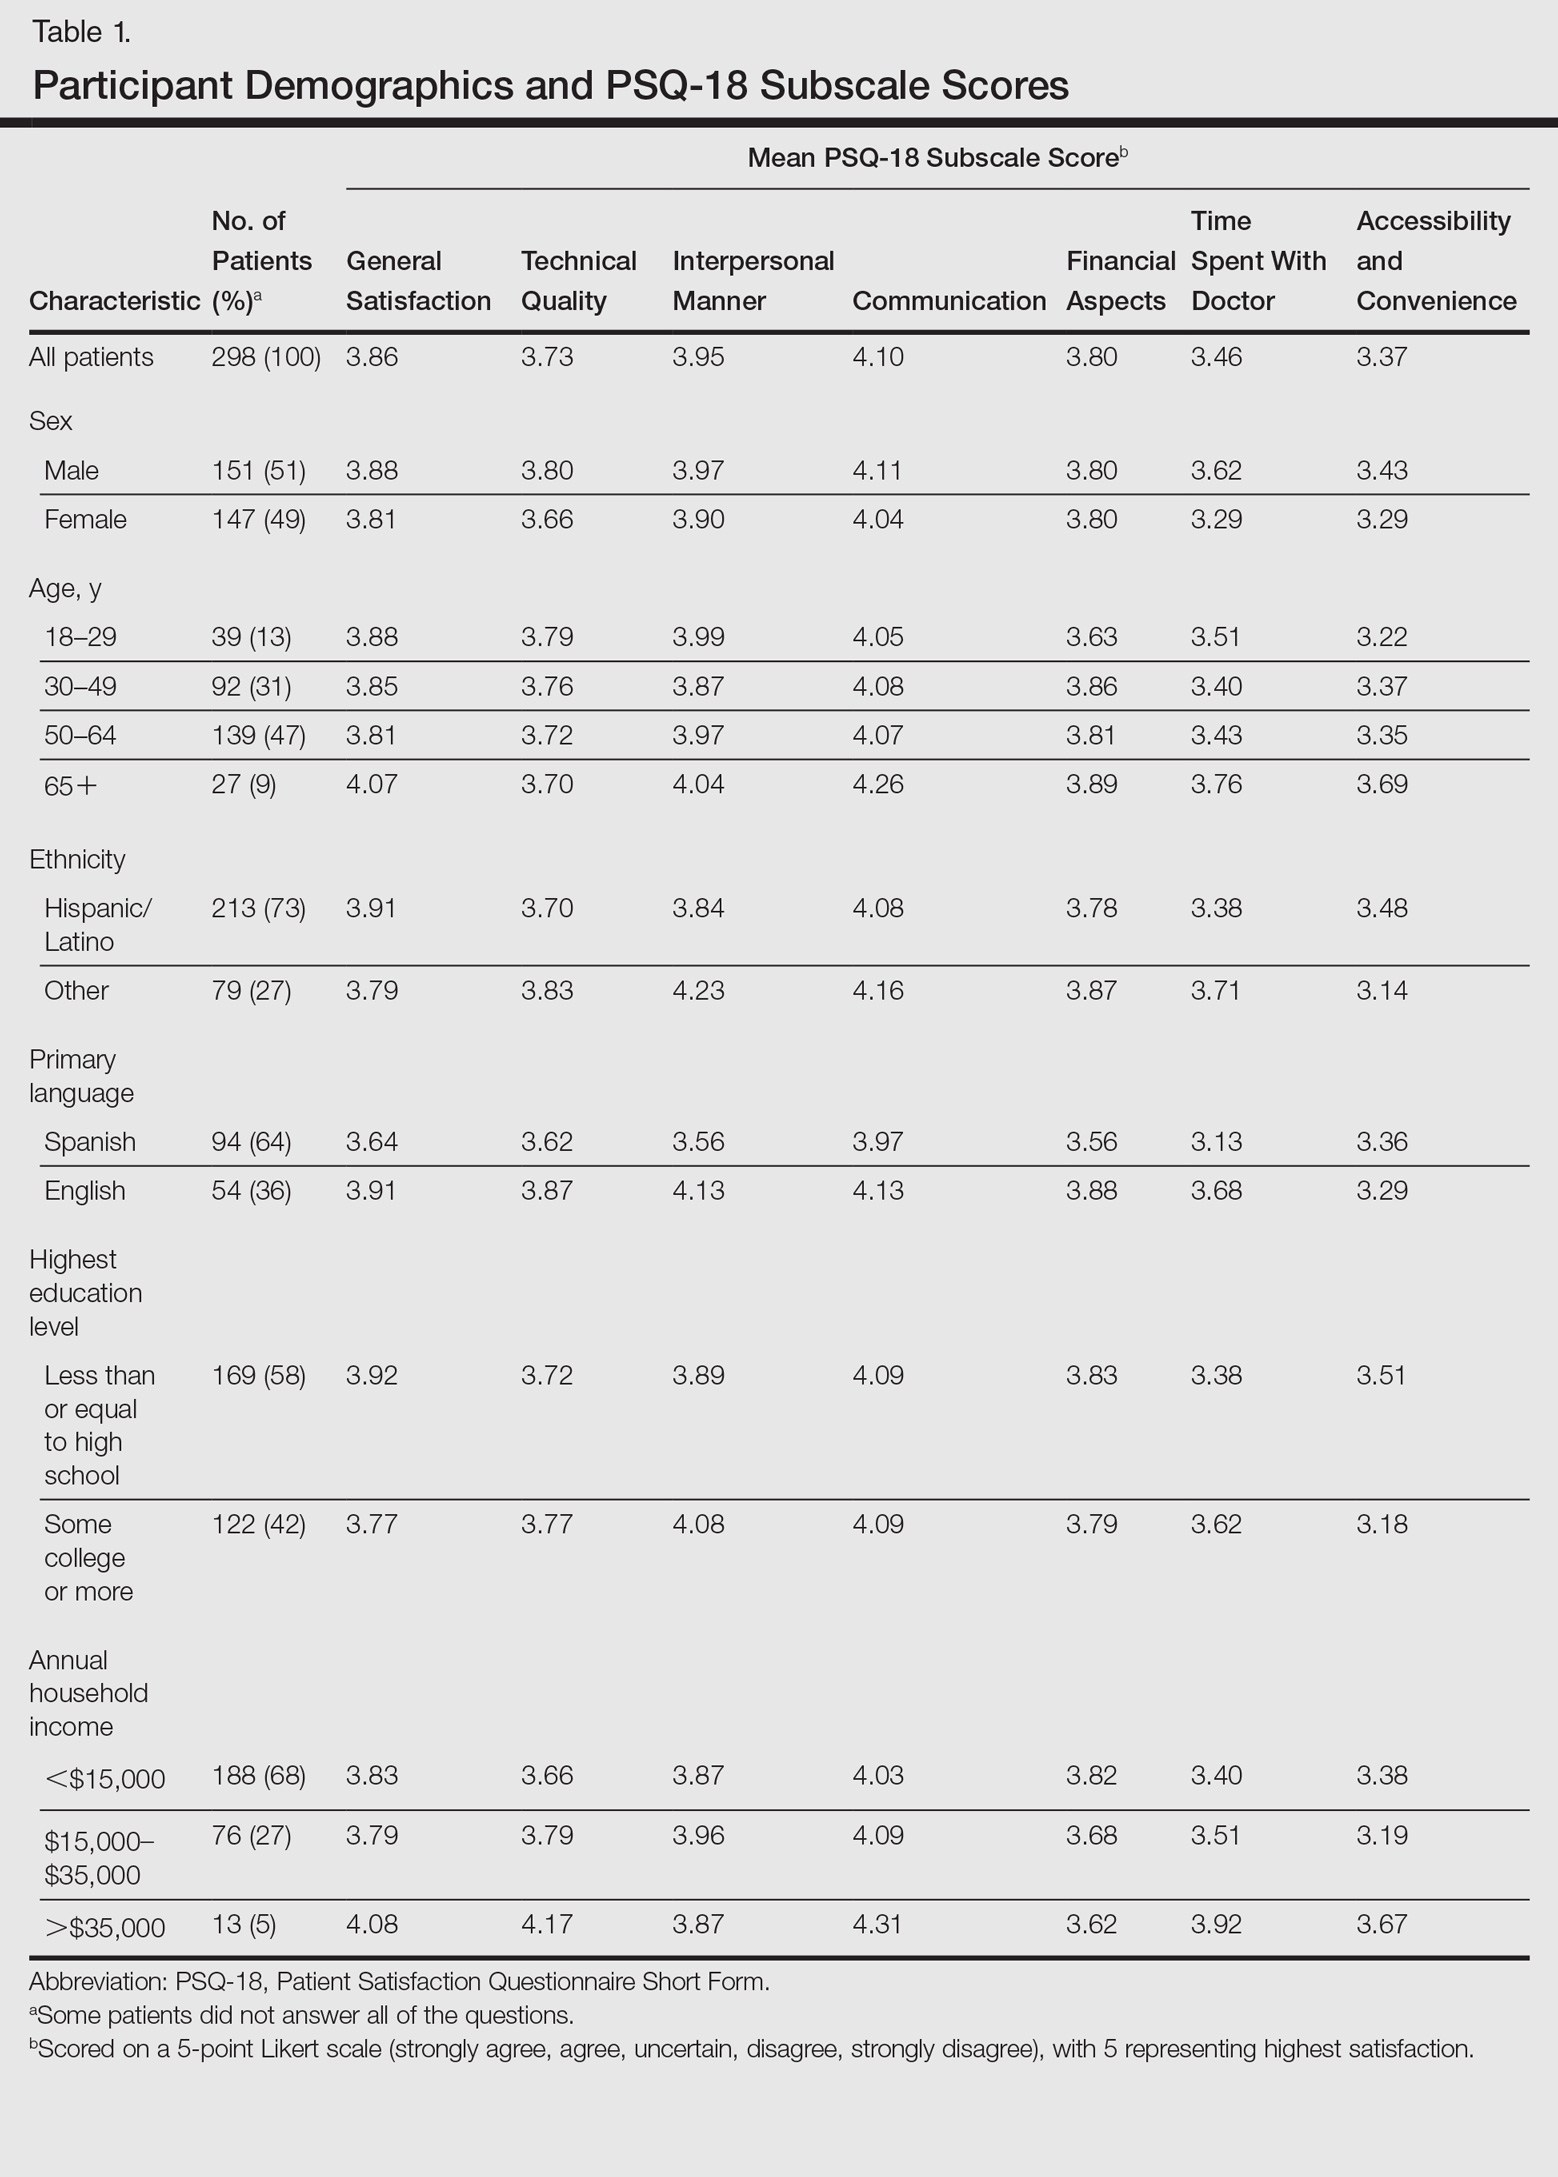
Table 1 shows PSQ-18 scores for all patients stratified by demographics. Notably, patients with some college or more were significantly more satisfied on the interpersonal manner (P<.03) and time spent with doctor (P<.007) subscales when compared to those who were less educated, but they had lower general satisfaction scores (P<.001). Patients with a reported annual household income of greater than $35,000 were more satisfied on the technical quality (P<.07) and time spent with doctor (P<.04) subscales when compared to those making less than $15,000. The patients with a household income greater than $35,000 also were more satisfied with accessibility and convenience (P<.05) than those making $15,000 to $35,000. When stratified by sex, the time spent with doctor subscale was significantly higher in males than females (P<.001). (Statistically significant differences when stratifying by age, ethnicity, and language are noted in the “Comment” section.)
Patients’ average cycle time from check in to checkout was 102 minutes (range, 24–177 minutes). There was no statistically significant difference in patient satisfaction subscale scores when stratifying patients by cycle time. During a period comparable to the time that surveys were collected, our mean (standard deviation [SD]) nonattendance rate was 30% (7%). Therefore, based on 2 SDs, there was a 95% chance that 16% to 44% of patients would not attend their scheduled appointments in each clinic.
Comment
Our dermatology clinic received an average general satisfaction subscale score of 3.86. Although the general impression of patients was positive, there were subscale scores in which the clinic performed below the general satisfaction score; the 2 lowest were time spent with doctor (3.46), and accessibility and convenience (3.37). One possible explanation for the lower time spent with doctor subscale score relates to visiting an academic medical center. Patients often are seen sequentially by a medical student, resident, and supervising physician. This educational model contributes to long cycle times; indeed, average patient visit length was more than 1.5 hours in our study. Meanwhile, patients may consider their “doctor” to be the last member of the medical team they see; thus, the percentage of the clinic visit time that a supervising physician spends with the patient may be perceived by patients as short compared to the overall time spent in the clinic.
Surprisingly, there was no statistically significant difference in patient satisfaction subscale scores, including time spent with doctor, for patients with longer cycle times compared to short cycle times (Table 2), which suggests that the length of clinic visits may have been longer than the threshold for further effect on satisfaction scores. To this point, prior research has shown that patient satisfaction notably drops after 15 minutes of waiting,5 defined as the time from check in to when the patient first sees the provider. Our data set did not allow us to analyze wait time by that definition. However, we used cycle time, which includes various periods of waiting during the patient’s visit. If we had more data points on cycle times less than 30 minutes, we might have detected a clearer relationship of cycle times to patient satisfaction scores.
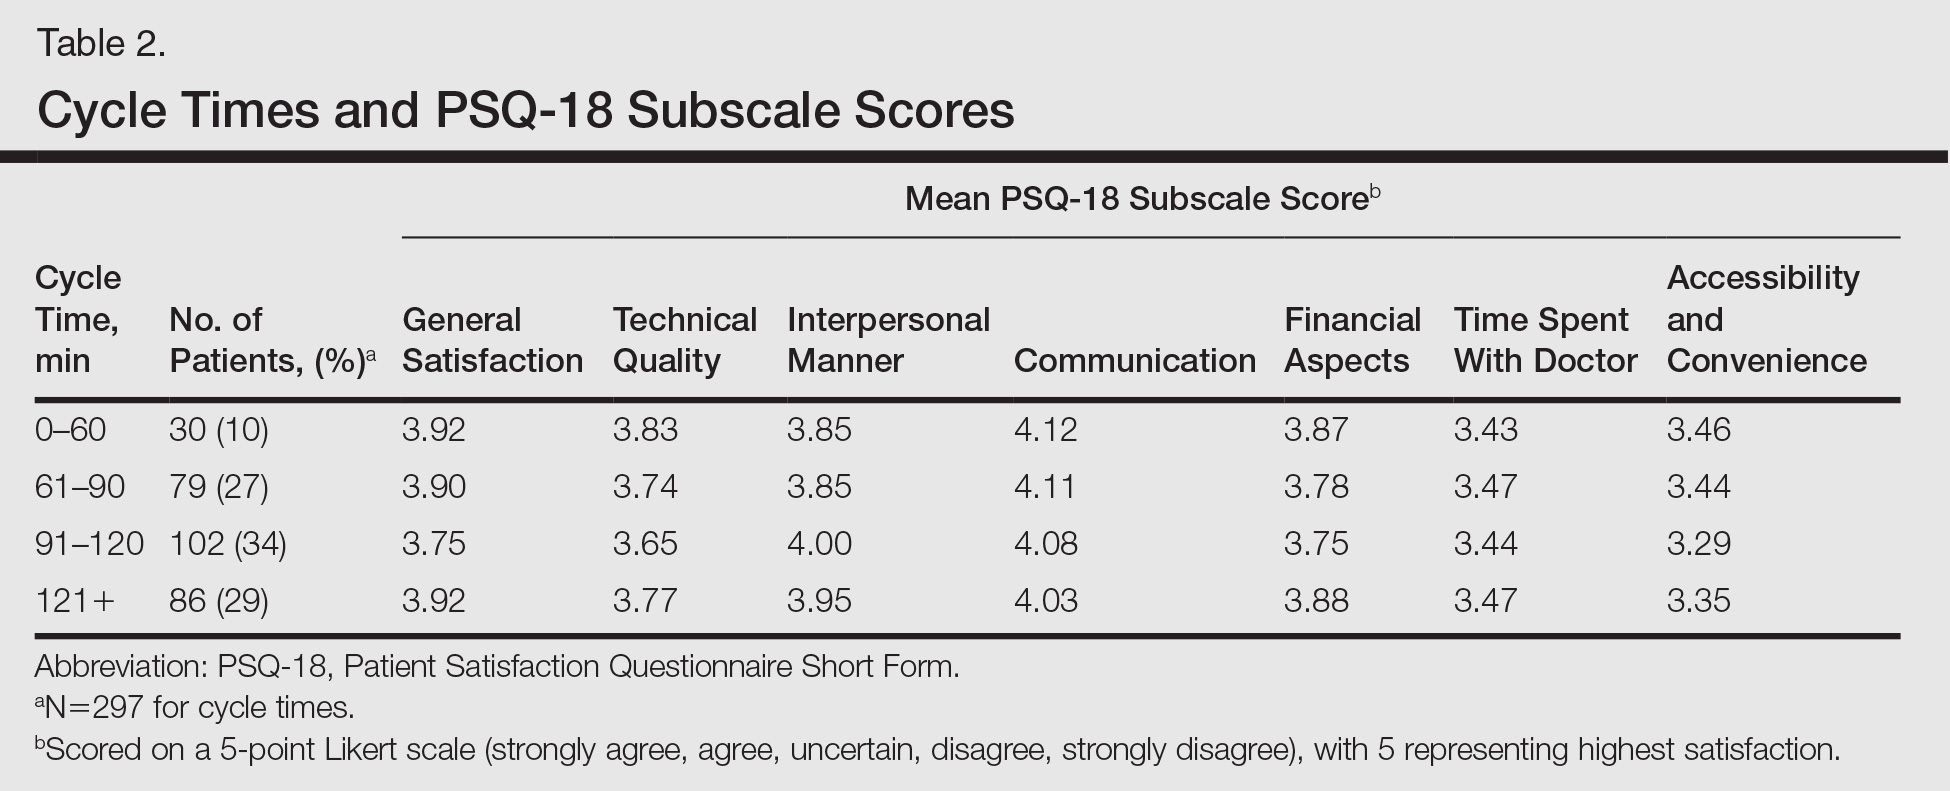
Satisfaction may not have varied with longer cycle times because differing perceptions might have balanced each other; in some cases, longer cycle times might reflect additional time spent with the provider, which could be perceived as valuable by the patient, and for others the long cycle time might be dissatisfying. Nevertheless, many of our patients were familiar with the county health system and expected to spend 90 minutes or more in clinic for each visit. Regardless, newly insured patients may have different expectations on how their health care should be delivered, an issue that could be investigated in the future.
The accessibility and convenience subscale scores reflected patients’ perception of timeliness and availability of medical care. The way that patients are scheduled at our clinic likely affected this subscale score, as patients must be referred through their primary care provider or the emergency department. We believe that many patients consider the wait for a primary care appointment as part of the overall wait for a dermatology appointment, which affects perception of accessibility and convenience for our clinic.
When we stratified by age, ethnicity, and language, other interesting trends occurred in satisfaction scores. Patients older than 65 years had a statistically significant higher accessibility and convenience subscale score when compared to the groups aged 18 to 29 years (P<.02) and 50 to 64 years (P<.05) as well as a higher but not statistically significant score compared to those aged 30 to 49 years (P<.07). Possible explanations include that older patients are familiar with the workings of our health system or that some of our patients older than 65 years may be retired and have fewer daily obligations. For the time spent with doctor subscale score, patients older than 65 years had higher scores when compared to those aged 30 to 49 years (P<.06) and 50 to 64 years (P<.07), perhaps because providers are spending more time with older individuals who may have more medical issues. A study involving a family medicine clinic also found that older patients were more satisfied with their overall care,6 which may be important given the changing demographics of Americans seeking medical care.
Differences in patient satisfaction when our patients were stratified by primary language and self-identified ethnicity also were noted. English-speaking patients were significantly more satisfied than Spanish-speaking patients in 4 subscales of satisfaction: technical quality (P<.01), interpersonal manner (P<.0001), financial aspects (P<.02), and time spent with doctor (P<.0006). For ethnicity, non-Hispanic/Latino patients had significantly higher subscale satisfaction scores for interpersonal manner (P<.0001) and time spent with doctor (P<.005). Variability in patient satisfaction based on primary language spoken and ethnicity has been described in other health care settings. Differences in satisfaction with care, understanding of potential side effects of a medication, compliance, and perceived rapport with physicians have been described.7-9
In addition to validating quality of care through patient satisfaction surveys, providers will be challenged to increase access to dermatologic services. Health systems that accept predominately Medicaid insurance, such as academic medical centers and safety-net hospitals, will be responsible for caring for millions of newly insured Medicaid patients. However, our high and variable nonattendance rates lead to inefficient use of our resources, often reducing the number of patients that are seen.
Canizares and Penneys10 studied an urban dermatology clinic over a 6-month period (N=508) and found that 17% of patients failed to keep their appointments; the subgroup of individuals with state-assisted insurance plans had the highest nonattendance rate (26%).10 In contrast, a group from Canada (N=5300) found that the nonattendance rate in a private dermatology practice was less than 8%.11 Our average nonattendance rate of 30% is within the range for urban clinics10,12; however, our SD of 7% leads to a high variability in patient volume each clinic day. As a result, on many days a reduced number of patients are seen resulting in a higher per-patient cost of delivering care.
Limitations
A potential bias is that the surveys were completed in the clinic and patients may have been concerned about possible repercussions for negative evaluations, which may have skewed results to be more positive than they otherwise would have been. We attempted to minimize this potential bias by having medical students who were not involved in the patients’ care administer the surveys. We also advised patients that their individual surveys would not be given to their providers and that any identifying information would be removed during data analysis. Our inferences could be affected by use of the terms satisfied and very satisfied in our patient satisfaction survey. Although we may interpret the results as patients reporting their degree of satisfaction, the patient may mean that there is room for improvement.13 Therefore, a survey that allows for more varied responses could potentially lead to different results.
Conclusion
Dermatology practitioners can support the specialty and validate the work they do by achieving high patient satisfaction scores. A study of online reviews compared patient ratings from 23 specialties and found that dermatology ranked second to last, ahead of only psychiatry.14 Our data has highlighted several opportunities to implement interventions that might improve patient satisfaction, though future studies would be required. Expanding or changing office hours, hiring more providers, or improving telephone access are potential interventions that might improve the accessibility and convenience subscale of patient satisfaction. Reducing the variability of nonattendance rates through the creation of resources to provide patients with clear directions and travel options, reminder calls, and instituting fees for missed appointments in some patient populations might allow for more predictable scheduling to optimize flow and the number of patients seen in each clinic.
Other approaches to improve satisfaction scores based on our results could include simple measures such as increasing the perception of time spent with the patient by having the physician sit down briefly in the examination room.15,16 It might be helpful to streamline translation assistance for patients who do not speak English as a primary language. It may be useful to recognize that younger patients have different expectations for clinic visits. For example, offering online scheduling to improve accessibility and convenience may improve satisfaction, particularly in patients who are accustomed to using technology.
It is our hope that while dermatologists continue to provide high quality care, they will work to demonstrate the value of their care by becoming leaders in patient satisfaction. Connecting their satisfaction with health care to patients’ quality of life has the potential to validate our specialty to insurers.
- Shatzer A, Long SK, Zuckerman S. Who are the newly insured as of early March 2014? Urban Institute Health Policy Center website. http://hrms.urban.org/briefs/Who-Are-the-Newly-Insured.html. Published May 22, 2014. Accessed March 17, 2017.
- Press I. Patient Satisfaction: Understanding and Measuring the Experience of Care. 2nd ed. Chicago, IL: Health Administration Press; 2006.
- Carr-Hill RA. The measurement of patient satisfaction. J Public Health Med. 1992;14:236-249.
- Thayparan A, Mahdi E. The Patient Satisfaction Questionnaire Short Form (PSQ-18) as an adaptable, reliable, and validated tool for use in various settings. Med Educ Online. 2013;18:21747.
- Garcia D, Kennedy C, Langager, J, et al. Pulse report 2009: outpatient: patient perspectives on American health care. South Bend, IN: Press Ganey Associates, Inc; 2009.
- Wetmore S, Boisvert L, Graham E, et al. Patient satisfaction with access and continuity of care in a multidisciplinary academic family medicine clinic. Can Fam Physician. 2014;60:E230-E236.
- Carrasquillo O, Orav EJ, Brennan TA, et al. Impact of language barriers on patient satisfaction in an emergency department. J Gen Intern Med. 1999;14:82-87.
- David RA, Rhee M. The impact of language as a barrier to effective health care in an underserved urban Hispanic community. Mt Sinai J Med. 1998;65:393-397.
- Ferguson WJ, Candib LM. Culture, language, and the doctor-patient relationship. Fam Med. 2002;34:353-361.
- Canizares MJ, Penneys NS. The incidence of nonattendance at an urgent care dermatology clinic. J Am Acad Dermatol. 2002;46:457-459.
- Pehr K. No show: incidence of nonattendance at a dermatology practice in a single universal payer model. J Cutan Med Surg. 2007;11:53-56.
- Penneys N, Glaser DA. The incidence of cancellation and non-attendance at a dermatology clinic. J Am Acad Dermatol. 1999;40:714-718.
- Collins K, O’Cathain A. The continuum of patient satisfaction—from satisfied to very satisfied. Soc Sci Med. 2003;57:2465-2470.
- Internet study: highest educated & trained doctors get poorest online reviews [news release]. Denver, CO: Vanguard Communications; April 22, 2015. https://vanguardcommunications.net/best-online-doctor-reviews/. Accessed November 28, 2016.
- Swayden KJ, Anderson KK, Connelly LM, et al. Effect of sitting vs. standing on perception of provider time at bedside: a pilot study. Patient Educ Couns. 2012;86:166-171.
- Sorenson E, Malakouti M, Brown G, et al. Enhancing patient satisfaction in dermatology. Am J Clin Dermatol. 2015;16:1-4.
The Patient Protection and Affordable Care Act was signed into law in 2010, aiming to expand access to and improve the quality of health care in the United States. In the states that expanded Medicaid eligibility, uninsurance among adults decreased from 15.8% in September 2013 to 7.3% in March 2016, a decline of 53.8%.1 On average, these newly insured individuals were younger and more likely to report fair to poor health than those previously insured. Approximately half of the newly insured have family incomes at or below 138% of the federal poverty level.1
Improvement in quality in medicine is not as easily quantified. Several programs have been implemented through the Centers for Medicare & Medicaid Services to measure and reimburse hospital systems and providers based on the quality and value of care being provided. Because of the complexity in defining quality in medicine, patient satisfaction has become a proxy measurement tool.2 With higher numbers of insured patients and an increased demand for services, dermatologists are being challenged to improve availability of services and respond to patients’ needs and desires as expressed through satisfaction surveys.
Few studies have assessed patient satisfaction in dermatology practices. As patient satisfaction surveys move to the forefront under the Patient Protection and Affordable Care Act, hospitals and providers will try to demonstrate the quality of their care through positive survey responses from patients. Importantly, patient satisfaction is a strong determinate if patients will comply with treatment and continue seeing their practitioner.3 A better understanding of patients’ perceptions regarding quality will allow for targeted interventions to be implemented. This study assesses and analyzes patient satisfaction, nonattendance rates, and cycle times in an outpatient dermatology clinic to provide a snapshot of patient satisfaction in an urban dermatology clinic.
Dr. Adam Sutton discusses the results of this study with Editor-in-Chief Vincent A. DeLeo, MD, in a "Peer to Peer" audiocast, "Measuring Patient Satisfaction: How Do Patients Perceive Quality of Care Delivered by Dermatologists?"
Methods
We conducted a prospective study that was approved by the University of Southern California Health Sciences (Los Angeles, California) institutional review board. A convenience sample of patients 18 years and older who spoke English or Spanish were recruited to participate in the study and agreed to complete the Patient Satisfaction Questionnaire Short Form (PSQ-18) and a demographic questionnaire, both in English or Spanish, at the conclusion of their visit.
Based on schedules and availability, medical students came to our clinic and obtained the surveys in the following manner: After patients checked in, the students approached the patients in the waiting area and asked if they would be willing to participate in the study. If patients agreed to participate, they provided written consent and the medical student handed them an envelope containing paper copies of the survey in English or Spanish, depending on the patient’s preference. Patients were asked to complete the surveys at the end of the visit and return them to the student in the envelope. The medical students did not otherwise participate in the patient’s visit.
Surveys were collected over an 8-month period at Los Angeles County+USC Medical Center dermatology clinics, which are part of a large safety-net health system. Among this population, it is common for patients to lack reliable Internet access or permanent home addresses; therefore, we elected to use point-of-care printed survey forms. Midway through the survey collection, we moved our clinic location; however, patients and physicians did not change. The comparison between clinics showed no substantive differences and did not change the conclusions of the study.
Patient Demographics
Demographic variables were age, sex, ethnicity, highest education level, annual household income, and primary language. Patients were grouped into 4 age categories: 18 to 29 years, 30 to 49 years, 50 to 64 years, and 65 years and older. Ethnicity was classified as Hispanic/Latino or other. Highest education level was classified as high school diploma or lower, and some college or higher. Annual household income was grouped into 3 categories: less than $15,000, $15,000 to $35,000, and more than $35,000.
Patient Satisfaction Questionnaire
The PSQ-18 survey was developed by the RAND Corporation (Santa Monica, California) and has been validated.4 The survey asks patients to rate aspects of their care experience on a 5-point Likert scale (strongly agree, agree, uncertain, disagree, strongly disagree), with 5 representing highest satisfaction. The survey contains 18 questions and is scored on 7 subscales: general satisfaction, technical quality, interpersonal manner, communication, financial aspects, time spent with doctor, and accessibility and convenience. The survey typically takes less than 5 minutes to complete.
Cycle Times and Nonattendance Rates
Cycle time is defined as the total amount of time that a patient spends in a clinic from check in to checkout, which was collected from our scheduling system for each patient who agreed to participate in the study. Cycle times were grouped into 4 categories: 0 to 60 minutes, 61 to 90 minutes, 91 to 120 minutes, and 121 minutes or more. During the study period, data also were collected from the electronic health record system regarding the number of patients with appointments scheduled and the number of patients who attended each clinic. From these figures, the rate of nonattendance for each clinic was calculated.
Statistical Analysis
Demographic results were calculated using arithmetic means. The PSQ-18 subscale scores were compared among demographic subgroups using a generalized linear model. Covariates included age, sex, ethnicity, highest education level, annual household income, and primary language. All statistical analyses were conducted using SAS software version 9.2.
Results
Of the 298 participants surveyed, the average age was 49 years, 51% were male, 73% self-identified as Hispanic/Latino, 64% spoke Spanish, 58% had a high school diploma or lower, and 68% reported an annual household income of less than $15,000 (Table 1).
Table 1 shows PSQ-18 scores for all patients stratified by demographics. Notably, patients with some college or more were significantly more satisfied on the interpersonal manner (P<.03) and time spent with doctor (P<.007) subscales when compared to those who were less educated, but they had lower general satisfaction scores (P<.001). Patients with a reported annual household income of greater than $35,000 were more satisfied on the technical quality (P<.07) and time spent with doctor (P<.04) subscales when compared to those making less than $15,000. The patients with a household income greater than $35,000 also were more satisfied with accessibility and convenience (P<.05) than those making $15,000 to $35,000. When stratified by sex, the time spent with doctor subscale was significantly higher in males than females (P<.001). (Statistically significant differences when stratifying by age, ethnicity, and language are noted in the “Comment” section.)
Patients’ average cycle time from check in to checkout was 102 minutes (range, 24–177 minutes). There was no statistically significant difference in patient satisfaction subscale scores when stratifying patients by cycle time. During a period comparable to the time that surveys were collected, our mean (standard deviation [SD]) nonattendance rate was 30% (7%). Therefore, based on 2 SDs, there was a 95% chance that 16% to 44% of patients would not attend their scheduled appointments in each clinic.
Comment
Our dermatology clinic received an average general satisfaction subscale score of 3.86. Although the general impression of patients was positive, there were subscale scores in which the clinic performed below the general satisfaction score; the 2 lowest were time spent with doctor (3.46), and accessibility and convenience (3.37). One possible explanation for the lower time spent with doctor subscale score relates to visiting an academic medical center. Patients often are seen sequentially by a medical student, resident, and supervising physician. This educational model contributes to long cycle times; indeed, average patient visit length was more than 1.5 hours in our study. Meanwhile, patients may consider their “doctor” to be the last member of the medical team they see; thus, the percentage of the clinic visit time that a supervising physician spends with the patient may be perceived by patients as short compared to the overall time spent in the clinic.
Surprisingly, there was no statistically significant difference in patient satisfaction subscale scores, including time spent with doctor, for patients with longer cycle times compared to short cycle times (Table 2), which suggests that the length of clinic visits may have been longer than the threshold for further effect on satisfaction scores. To this point, prior research has shown that patient satisfaction notably drops after 15 minutes of waiting,5 defined as the time from check in to when the patient first sees the provider. Our data set did not allow us to analyze wait time by that definition. However, we used cycle time, which includes various periods of waiting during the patient’s visit. If we had more data points on cycle times less than 30 minutes, we might have detected a clearer relationship of cycle times to patient satisfaction scores.
Satisfaction may not have varied with longer cycle times because differing perceptions might have balanced each other; in some cases, longer cycle times might reflect additional time spent with the provider, which could be perceived as valuable by the patient, and for others the long cycle time might be dissatisfying. Nevertheless, many of our patients were familiar with the county health system and expected to spend 90 minutes or more in clinic for each visit. Regardless, newly insured patients may have different expectations on how their health care should be delivered, an issue that could be investigated in the future.
The accessibility and convenience subscale scores reflected patients’ perception of timeliness and availability of medical care. The way that patients are scheduled at our clinic likely affected this subscale score, as patients must be referred through their primary care provider or the emergency department. We believe that many patients consider the wait for a primary care appointment as part of the overall wait for a dermatology appointment, which affects perception of accessibility and convenience for our clinic.
When we stratified by age, ethnicity, and language, other interesting trends occurred in satisfaction scores. Patients older than 65 years had a statistically significant higher accessibility and convenience subscale score when compared to the groups aged 18 to 29 years (P<.02) and 50 to 64 years (P<.05) as well as a higher but not statistically significant score compared to those aged 30 to 49 years (P<.07). Possible explanations include that older patients are familiar with the workings of our health system or that some of our patients older than 65 years may be retired and have fewer daily obligations. For the time spent with doctor subscale score, patients older than 65 years had higher scores when compared to those aged 30 to 49 years (P<.06) and 50 to 64 years (P<.07), perhaps because providers are spending more time with older individuals who may have more medical issues. A study involving a family medicine clinic also found that older patients were more satisfied with their overall care,6 which may be important given the changing demographics of Americans seeking medical care.
Differences in patient satisfaction when our patients were stratified by primary language and self-identified ethnicity also were noted. English-speaking patients were significantly more satisfied than Spanish-speaking patients in 4 subscales of satisfaction: technical quality (P<.01), interpersonal manner (P<.0001), financial aspects (P<.02), and time spent with doctor (P<.0006). For ethnicity, non-Hispanic/Latino patients had significantly higher subscale satisfaction scores for interpersonal manner (P<.0001) and time spent with doctor (P<.005). Variability in patient satisfaction based on primary language spoken and ethnicity has been described in other health care settings. Differences in satisfaction with care, understanding of potential side effects of a medication, compliance, and perceived rapport with physicians have been described.7-9
In addition to validating quality of care through patient satisfaction surveys, providers will be challenged to increase access to dermatologic services. Health systems that accept predominately Medicaid insurance, such as academic medical centers and safety-net hospitals, will be responsible for caring for millions of newly insured Medicaid patients. However, our high and variable nonattendance rates lead to inefficient use of our resources, often reducing the number of patients that are seen.
Canizares and Penneys10 studied an urban dermatology clinic over a 6-month period (N=508) and found that 17% of patients failed to keep their appointments; the subgroup of individuals with state-assisted insurance plans had the highest nonattendance rate (26%).10 In contrast, a group from Canada (N=5300) found that the nonattendance rate in a private dermatology practice was less than 8%.11 Our average nonattendance rate of 30% is within the range for urban clinics10,12; however, our SD of 7% leads to a high variability in patient volume each clinic day. As a result, on many days a reduced number of patients are seen resulting in a higher per-patient cost of delivering care.
Limitations
A potential bias is that the surveys were completed in the clinic and patients may have been concerned about possible repercussions for negative evaluations, which may have skewed results to be more positive than they otherwise would have been. We attempted to minimize this potential bias by having medical students who were not involved in the patients’ care administer the surveys. We also advised patients that their individual surveys would not be given to their providers and that any identifying information would be removed during data analysis. Our inferences could be affected by use of the terms satisfied and very satisfied in our patient satisfaction survey. Although we may interpret the results as patients reporting their degree of satisfaction, the patient may mean that there is room for improvement.13 Therefore, a survey that allows for more varied responses could potentially lead to different results.
Conclusion
Dermatology practitioners can support the specialty and validate the work they do by achieving high patient satisfaction scores. A study of online reviews compared patient ratings from 23 specialties and found that dermatology ranked second to last, ahead of only psychiatry.14 Our data has highlighted several opportunities to implement interventions that might improve patient satisfaction, though future studies would be required. Expanding or changing office hours, hiring more providers, or improving telephone access are potential interventions that might improve the accessibility and convenience subscale of patient satisfaction. Reducing the variability of nonattendance rates through the creation of resources to provide patients with clear directions and travel options, reminder calls, and instituting fees for missed appointments in some patient populations might allow for more predictable scheduling to optimize flow and the number of patients seen in each clinic.
Other approaches to improve satisfaction scores based on our results could include simple measures such as increasing the perception of time spent with the patient by having the physician sit down briefly in the examination room.15,16 It might be helpful to streamline translation assistance for patients who do not speak English as a primary language. It may be useful to recognize that younger patients have different expectations for clinic visits. For example, offering online scheduling to improve accessibility and convenience may improve satisfaction, particularly in patients who are accustomed to using technology.
It is our hope that while dermatologists continue to provide high quality care, they will work to demonstrate the value of their care by becoming leaders in patient satisfaction. Connecting their satisfaction with health care to patients’ quality of life has the potential to validate our specialty to insurers.
- Shatzer A, Long SK, Zuckerman S. Who are the newly insured as of early March 2014? Urban Institute Health Policy Center website. http://hrms.urban.org/briefs/Who-Are-the-Newly-Insured.html. Published May 22, 2014. Accessed March 17, 2017.
- Press I. Patient Satisfaction: Understanding and Measuring the Experience of Care. 2nd ed. Chicago, IL: Health Administration Press; 2006.
- Carr-Hill RA. The measurement of patient satisfaction. J Public Health Med. 1992;14:236-249.
- Thayparan A, Mahdi E. The Patient Satisfaction Questionnaire Short Form (PSQ-18) as an adaptable, reliable, and validated tool for use in various settings. Med Educ Online. 2013;18:21747.
- Garcia D, Kennedy C, Langager, J, et al. Pulse report 2009: outpatient: patient perspectives on American health care. South Bend, IN: Press Ganey Associates, Inc; 2009.
- Wetmore S, Boisvert L, Graham E, et al. Patient satisfaction with access and continuity of care in a multidisciplinary academic family medicine clinic. Can Fam Physician. 2014;60:E230-E236.
- Carrasquillo O, Orav EJ, Brennan TA, et al. Impact of language barriers on patient satisfaction in an emergency department. J Gen Intern Med. 1999;14:82-87.
- David RA, Rhee M. The impact of language as a barrier to effective health care in an underserved urban Hispanic community. Mt Sinai J Med. 1998;65:393-397.
- Ferguson WJ, Candib LM. Culture, language, and the doctor-patient relationship. Fam Med. 2002;34:353-361.
- Canizares MJ, Penneys NS. The incidence of nonattendance at an urgent care dermatology clinic. J Am Acad Dermatol. 2002;46:457-459.
- Pehr K. No show: incidence of nonattendance at a dermatology practice in a single universal payer model. J Cutan Med Surg. 2007;11:53-56.
- Penneys N, Glaser DA. The incidence of cancellation and non-attendance at a dermatology clinic. J Am Acad Dermatol. 1999;40:714-718.
- Collins K, O’Cathain A. The continuum of patient satisfaction—from satisfied to very satisfied. Soc Sci Med. 2003;57:2465-2470.
- Internet study: highest educated & trained doctors get poorest online reviews [news release]. Denver, CO: Vanguard Communications; April 22, 2015. https://vanguardcommunications.net/best-online-doctor-reviews/. Accessed November 28, 2016.
- Swayden KJ, Anderson KK, Connelly LM, et al. Effect of sitting vs. standing on perception of provider time at bedside: a pilot study. Patient Educ Couns. 2012;86:166-171.
- Sorenson E, Malakouti M, Brown G, et al. Enhancing patient satisfaction in dermatology. Am J Clin Dermatol. 2015;16:1-4.
Practice Points
- Patient experience can be measured through brief point-of-service patient satisfaction questionnaires.
- Stratifying and analyzing patient satisfaction allows for targeted interventions to be developed and implemented.
- Educational handouts in the patient's primary language may help increase satisfaction and improve compliance.

Electronic Collaboration in Dermatology Resident Training Through Social Networking
More than 1.8 billion individuals utilize social media, a number that continues to grow as the social media market expands.1 Social media enables individuals, groups, and organizations to efficiently disperse and access information2-4 and also provides a structure that encourages collaboration between patients, staff, and physicians that cannot be achieved by other communication modalities.4-6 Expert opinions and related educational materials can be shared globally, improving collaboration between dermatologists.6 A structured social networking site for sharing training materials, research, and ideas can help bring the national dermatology community together in a new way.
Other professions have employed social networking tools to accomplish similar goals of organizing training resources; radiology has an electronic database that allows sharing of training materials and incorporates social networking capabilities.7 Their Web software provides functionality for individual file uploading and supports collaboration and sharing, all while maintaining the security of uploaded information. General surgery has already addressed similar concerns via a task force that incorporates all the essential organizations in surgical education.8 Increased satisfaction and academic abilities have been demonstrated with their collaborative curriculum.9 Gastroenterologists also utilize electronic resources; one study showed that using videos to educate patients prior to colonoscopies was superior to face-to-face education.10 In addition, video education may free up time for office staff to accomplish other tasks.
As a specialty, dermatology has not been a leader in the implementation of social networking for collaboration and training purposes. Every dermatologist is an educator. To maintain a successful practice, dermatologists must keep up-to-date on their own clinical knowledge, provide training to their staff, and educate their patients. Although there are numerous educational resources available to dermatologists, an informal survey of 30 dermatology faculty members revealed a practice gap in awareness and utilization of these expanding electronic resources.11
To better understand the needs of the specialty as a whole, we chose to focus on one aspect of dermatology education: resident training. The goal of our study was to survey dermatology residents and faculty to gain a better understanding of how they currently provide education and what online resources and social networking sites they currently use or would be willing to use. The study included 3 central hypotheses: First, residents would be less satisfied with their current curriculum and residents would report greater contributions to the curriculum relative to faculty. Second, both residents and faculty of smaller programs would be more interested in collaborative educational resources relative to larger programs. Lastly, residents would be more willing than faculty to participate in social networking for educational purposes.
Methods
This study was granted institutional review board exemption. Two surveys were developed by the authors to assess the current structure and satisfaction of dermatology residency curriculum and the willingness to participate in social networking to use and share educational materials. The surveys were evaluated for relevance by the survey evaluation team of the Association of Professors of Dermatology (APD). The instrument was not pilot tested.
The surveys were electronically distributed using an online service to dermatology faculty via the APD listserve, which comprised the entirety of the APD membership in 2014. The resident survey was distributed to the dermatology residents via the American Society for Dermatologic Surgery listserve, which included all residents in training (2013-2014 academic year). Second and third invitations to complete the surveys were distributed 3 and 5 weeks later, respectively.
Resident and faculty responses were compared. Additionally, responses were stratified for large (>9 residents) and small programs (≤9 residents) for comparison. Descriptive statistics including means and medians for continuous variables and frequency tables for categorical variables were generated using research and spreadsheet software.
Results
There were 137 survey respondents; 52 of 426 (12.2%) dermatology faculty and 85 of 1539 (5.5%) dermatology residents responded to the survey. Small programs accounted for 24% of total survey responses and 76% were from large programs.
Current Curriculum
The majority of dermatology faculty (44%) and residents (35%) identified 1 to 2 faculty members as contributing to the creation and organization of their respective curricula; however, a notable percentage of residents (9%) reported that no faculty contributed to the organization of the curriculum. Residents noted that senior residents carry twice the responsibility for structuring the curriculum compared to faculty (61% vs 32% of the workload), but faculty described an even split between senior residents and faculty (47% vs 49% of the workload). Faculty believed their residents spend a similar amount of time in resident- and faculty-led instruction (38% vs 35% of their time); however, the majority of residents reported spending too little time in faculty-led instruction (53%). When residents ranked their preference for learning modes, faculty-led and self-study learning were ranked first and second by 48% and 45% of residents, respectively. Resident-led instruction was ranked last by 66% of residents. Likewise, a majority of residents (53%) described their amount of time in faculty-led instruction as too little.
When asked what subjects in dermatology were lacking at their programs, residents reported clinical trials (47%), skin of color (46%), cosmetic dermatology (34%), and aggressive skin cancer/multidisciplinary tumor board (32%). Although 11% of residents reported lacking inpatient dermatology in their curriculum, 0% of faculty reported the same. A notable percentage of faculty reported nothing was lacking compared to residents (25% vs 7%). Despite these different views between residents and faculty on their contributions to and structure of their curriculums, both faculty and residents claimed overall satisfaction (satisfied or very satisfied) with their program’s ability to optimally cover the field of dermatology in 3 years (100% and 91%, respectively).
Large Versus Small Residency Programs
When stratifying the resident responses for small versus large programs, both program sizes reported more time in resident-led instruction than faculty-led instruction. Likewise, residents in both program sizes equally preferred self-study or faculty-led instruction to resident-led instruction. Residents at small programs more often reported lacking instruction in rheumatology, immunobullous diseases, and basic science/skin biology compared to large-program residents. Compared to large-program faculty, small-program faculty reported lacking instruction in cosmetic dermatology.
Faculty at small programs reported spending too little time preparing for their faculty-led instruction compared to faculty at large programs (44% vs 12%). All (100%) of the faculty at small programs were likely to seek out study materials shared by top educators, while 77% of faculty at large programs were likely to do the same. When asked if faculty would translate what their program does well into an electronic format for sharing, 30% of large-program faculty were likely to do so compared to 11% of small-program faculty (Figure 1).
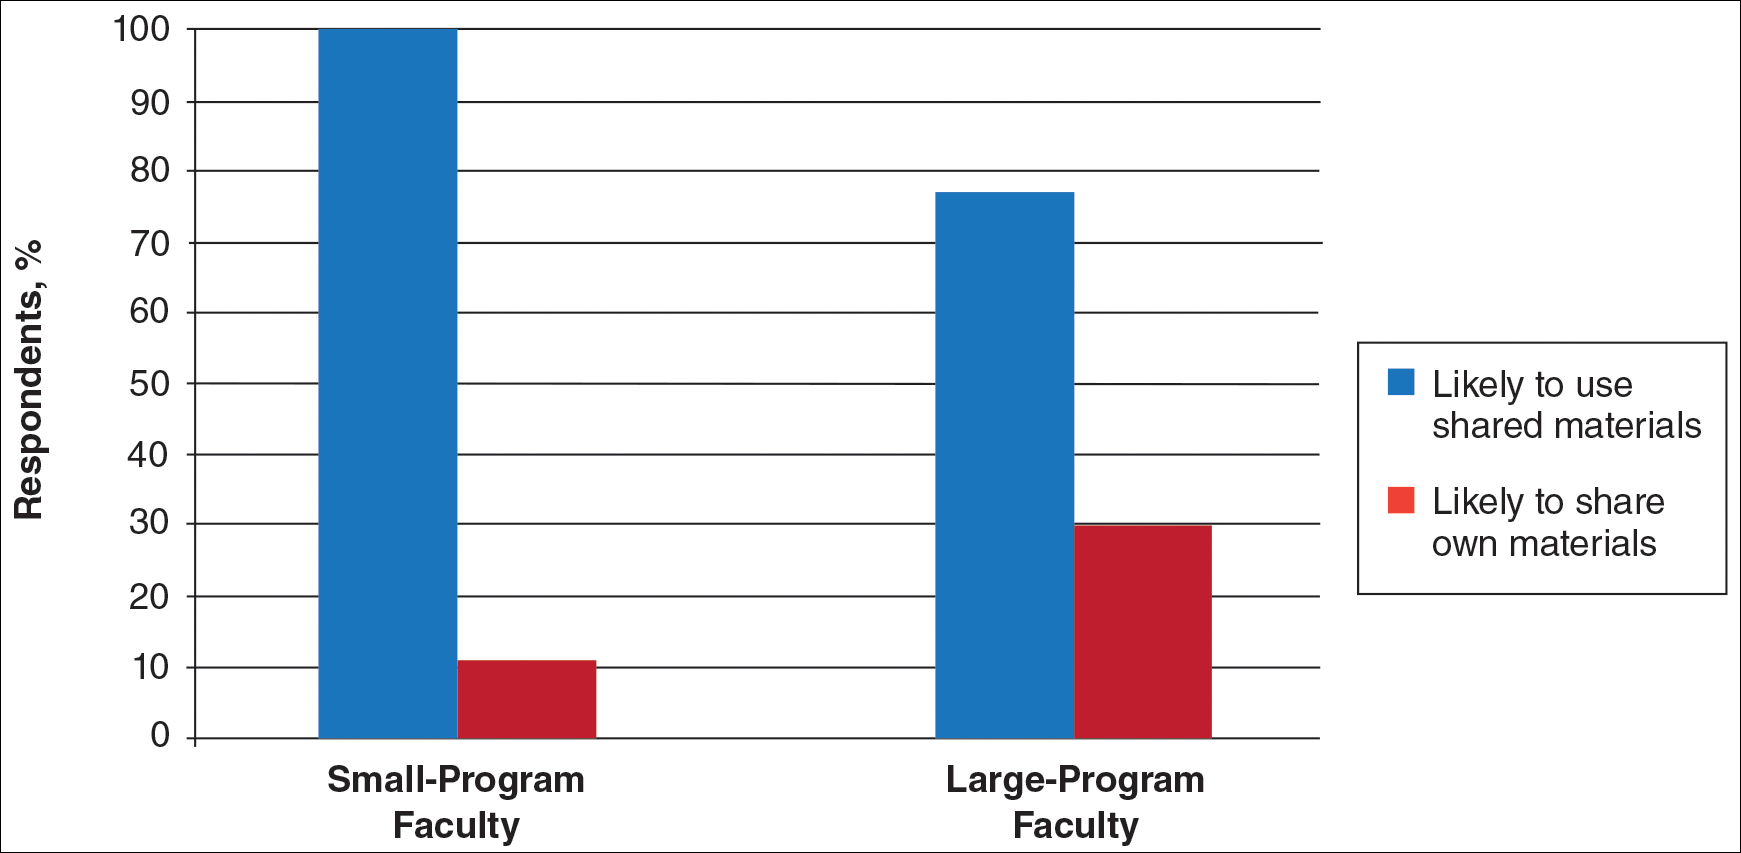
Use of Online Educational Materials and Interest in Collaboration
A majority of faculty and residents stated that they use online educational materials as supplements to traditional classroom lecture and print materials (81% vs 86%); however, almost twice as many residents stated that online educational materials were essential to their current study routines compared to faculty (39% vs 21%).
The majority of faculty (92%) and residents (84%) were either interested or very interested in a collaborative online curriculum. Both residents (85%) and faculty (81%) stated they would be likely to seek out online educational materials shared by top educators. Although both residents and faculty reported many aspects of their curriculums they thought could be beneficial to other dermatology programs (Table 1), only 27% of faculty and 19% of residents were likely to translate those strengths into a shareable electronic format. Several reasons were reported for not contributing to an online curriculum, with lack of time being the most common reason (Table 2).
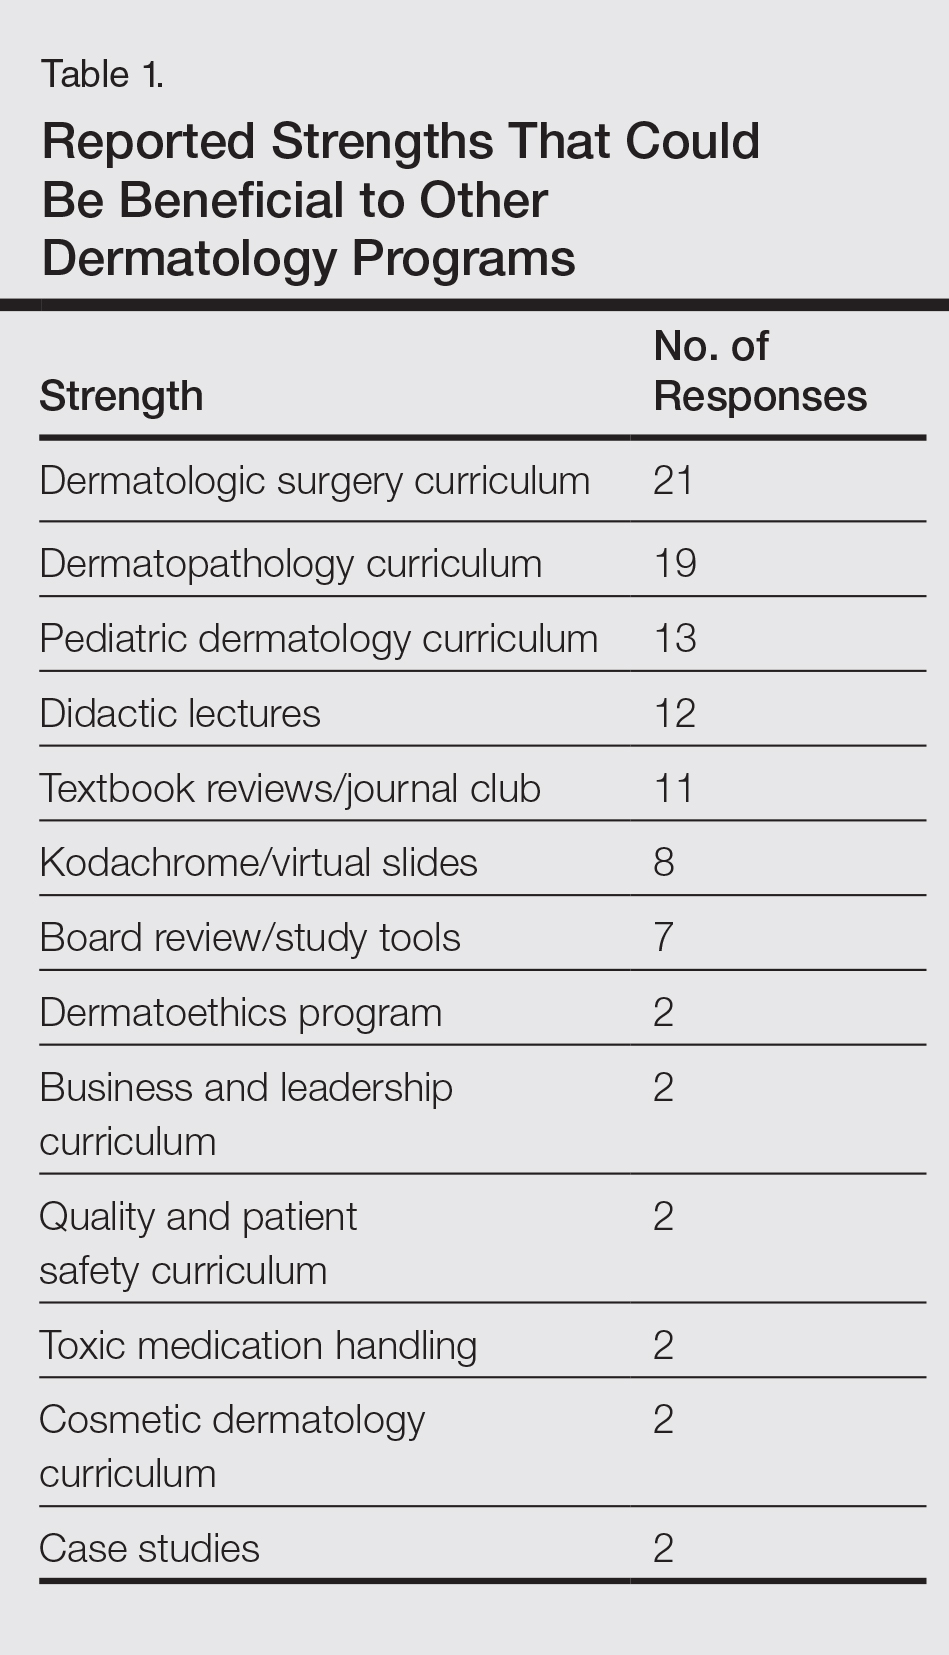
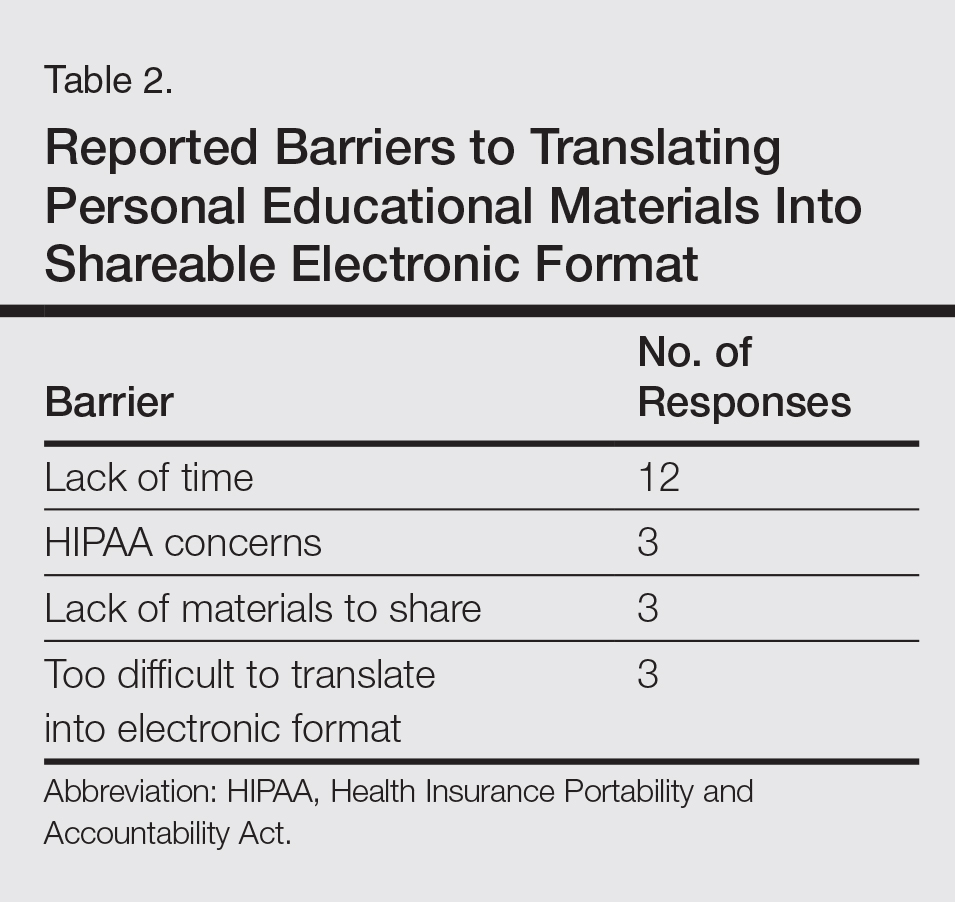
Eighty percent of residents and 88% of faculty reported they were either interested or very interested in being more connected/interactive with their dermatology peers nationally (Figure 2). Likewise, 94% of residents and 87% of faculty agreed that the dermatology community could benefit from a social networking site for educational collaboration. Four times as many residents versus faculty currently use social networking sites (eg, Facebook, LinkedIn, Google Groups) as a primary mode of communication with distant professional peers. The majority of residents (52%) reported they would be likely to participate in a professional social networking site, while the majority of faculty (50%) stated they were neutral on their likelihood of participating. Both residents and faculty reported lack of time as a common reason for being unlikely to utilize a professional social networking site. Other barriers to participation are listed in Table 3.
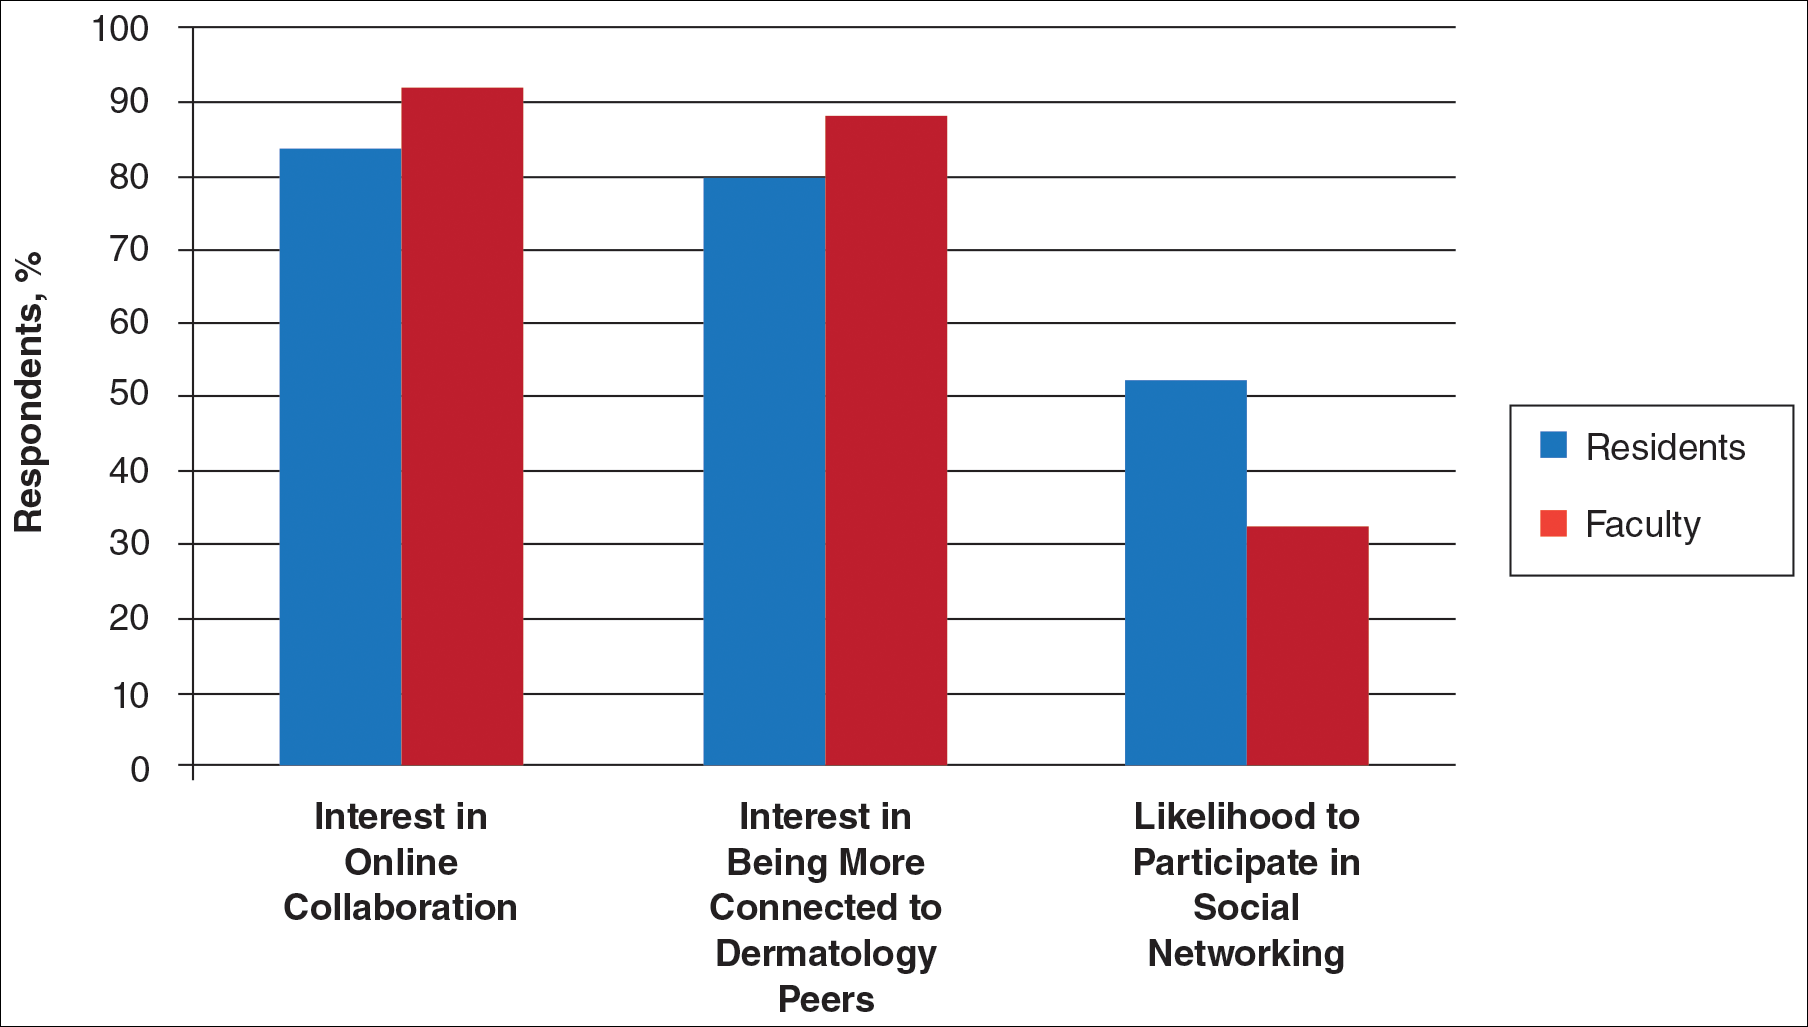
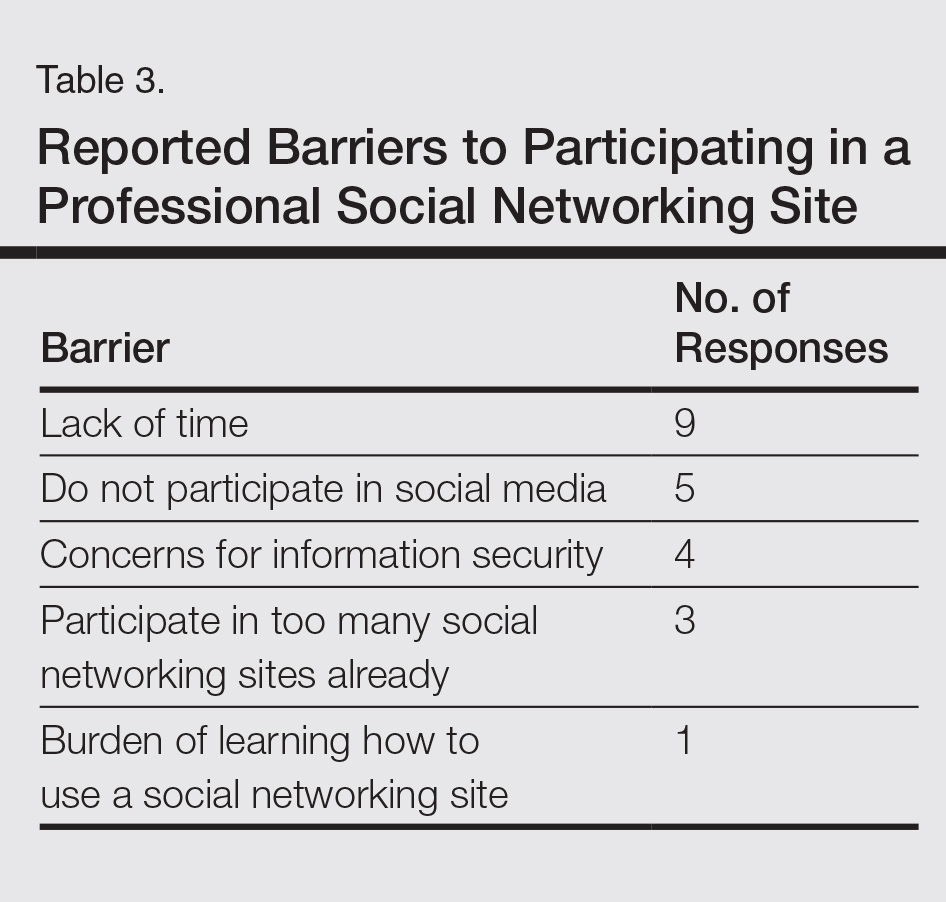
Comment
This study showed how dermatology faculty and residents currently provide training and what online resources and social networking sites they currently use or would be willing to use. The generalizability of the conclusions is limited by the low response rate for the surveys. The results demonstrated the different views between faculty and residents and between large and small residency programs on various topics. This microcosm of dermatology training can likely be applied to other training scenarios in dermatology, including patient education; training of nurses, physician extenders, and office staff; continuing medical education for physicians; and peer-to-peer collaboration.
Hypothesis 1: Partially Proven
We hypothesized that residents would report less satisfaction with their current curriculum and would report greater resident contributions to the curriculum relative to faculty. Overall, residents and faculty reported satisfaction with their curriculums to provide up-to-date information and breadth in the field of dermatology. Despite their overall satisfaction, more residents reported lacking instruction in several dermatology subtopics compared to faculty. Additionally, residents believed they spend twice as much time structuring their curriculum compared to faculty, with some residents reporting no faculty involvement. Although residents preferred faculty-led instruction, a majority of residents reported they do not have enough faculty-led didactics. The preference for faculty-led training is likely due to the expertise of faculty compared to residents.
Hypothesis 2: Partially Proven
We also hypothesized that both residents and faculty of smaller programs would be more interested in collaborative educational resources relative to larger programs. Although there was no difference in interest between residents at small versus large programs, there was a difference between faculty at small versus large programs. Small-program faculty were more interested in using shared materials than larger programs, while large-program faculty were more likely to share their educational materials. Small-program faculty reported spending too little time preparing their lectures, which is possibly due to a lack of time for preparation. Additionally, residents and faculty at smaller programs report their curriculum was lacking specific dermatology topics compared to large programs. These disparities between program sizes indicate a need for a social networking site for training collaboration in dermatology. Large programs have the ability to share what they do well, which small programs are eager to utilize.
Hypothesis 3: Not Proven
We hypothesized that residents would be more willing than faculty to participate in social networking for educational purposes. The majority of faculty and residents were interested in participating in a collaborative online curriculum and using the shared materials from top educators; however, even though such large majorities favored collaboration and sharing, only 27% of faculty and 19% of residents were likely to translate their own materials into a shareable format. Although lack of time was the most common reason for not sharing materials, electronic methods may have the potential to ultimately save time and remove the burden of content creation. The time it would take to translate selected personal training materials into a shareable form would be made up for by the time saved using another educators’ materials. Updating and customizing shared online educational materials can be much quicker and easier than educators creating materials on their own. Dermatologists would be more efficient facilitators of training via high-quality shared materials while decreasing the time burden associated with resident education.5 Another concern for not sharing or participating in a social networking site was skepticism of information security on such a network. The poor organization and information overload of online resources can compound the already existing time constraints on dermatologists, which may limit their ability to utilize such valuable resources. In addition, quality of online resources is not always guaranteed, and determining the sources that are high quality is sometimes a difficult task.6 For online materials to remain useful, there should be a peer-review process to evaluate quality and assess satisfaction.5
Solution: Create a Dermatology Task Force
A dermatology task force could facilitate the resolution of these challenges of online materials. In addition, a task force could cover the administrative support needed to ensure security and provide maintenance on social networks.
The main limitation to implementing a social network is the presence of the administrative infrastructure to jumpstart its creation. A task force incorporating the essential stakeholders in dermatology training is the first step. With inclusive representation from all of the smaller professional dermatology societies, the American Academy of Dermatology is optimally positioned to create this task force. With existing information technologies, a task force could address the concerns revealed in our survey as well as any future concerns that may arise.
The goal is a single social network for dermatologists that has the capability of improving communication and collaboration between professional peers regardless of their practice setting. Such a network is ideal for the practicing dermatologist for the purposes of staff training, patient education, and obtaining continuing medical education credit. Additionally, peer group collaboration would facilitate the understanding and completion of the evolving requirements for Maintenance of Certification from the American Board of Dermatology. The availability of quality shared materials would save time and increase efficiency of an entire dermatology practice. Materials that aid in patient education would allow office staff to dedicate their time to other tasks, thereby increasing productivity. Shared training materials would decrease the burden of staff education, providing more time for advanced hands-on training. This method of collaborative effort is capable of advancing the field of dermatology as a whole. It can overcome geographical and institutional barriers to connect dermatologists with similar interests worldwide; disseminate advances in diagnosis and treatment; and improve the quality of dermatology training of dermatologists, staff, and patients.
- Statistics and facts about social networks. Statista website. http://www.statista.com/topics/1164/social-networks/. Accessed March 22, 2017.
- Baker RC, Klein M, Samaan Z, et al. Effectiveness of an online pediatric primary care curriculum. Acad Pediatr. 2010;10:131-137.
- Dolev JC, O’Sullivan P, Berger T. The eDerm online curriculum: a randomized study of effective skin cancer teaching to medical students. J Am Acad Dermatol. 2011;65:e165-e171.
- Amir M, Sampson BP, Endly D, et al. Social networking sites: emerging and essential tools for communication in dermatology. JAMA Dermatol. 2014;150:56-60.
- Ruiz JG, Mintzer MJ, Leipzig RM. The impact of e-learning in medical education. Acad Med. 2006;81:207-212.
- Hanson AH, Krause LK, Simmons RN, et al. Dermatology education and the internet: traditional and cutting-edge resources. J Am Acad Dermatol. 2011;65:836-842.
- Rowe SP, Siddiqui A, Bonekamp D. The key image and case log application: new radiology software for teaching file creation and case logging that incorporates elements of a social network. Acad Radiol. 2014;21:916-930.
- Bell RH. Surgical council on resident education: a new organization devoted to graduate surgical education. J Am Coll Surg. 2007;204:341-346.
- Kirton OC, Reilly P, Staff I, et al. Development and implementation of an interactive, objective, and simulation-based curriculum for general surgery residents. J Surg Educ. 2012;69:718-723.
- Prakash S, Verma S, McGowan J, et al. Improving the quality of colonoscopy bowel preparation using an educational video. Can J Gastroenterol. 2013;27:696-700.
- Carroll BT. eTools for teaching dermatologic surgery. Paper presented at the Association of Professors of Dermatology 2014 Annual Meeting; September 12-13, 2014; Chicago, IL.
More than 1.8 billion individuals utilize social media, a number that continues to grow as the social media market expands.1 Social media enables individuals, groups, and organizations to efficiently disperse and access information2-4 and also provides a structure that encourages collaboration between patients, staff, and physicians that cannot be achieved by other communication modalities.4-6 Expert opinions and related educational materials can be shared globally, improving collaboration between dermatologists.6 A structured social networking site for sharing training materials, research, and ideas can help bring the national dermatology community together in a new way.
Other professions have employed social networking tools to accomplish similar goals of organizing training resources; radiology has an electronic database that allows sharing of training materials and incorporates social networking capabilities.7 Their Web software provides functionality for individual file uploading and supports collaboration and sharing, all while maintaining the security of uploaded information. General surgery has already addressed similar concerns via a task force that incorporates all the essential organizations in surgical education.8 Increased satisfaction and academic abilities have been demonstrated with their collaborative curriculum.9 Gastroenterologists also utilize electronic resources; one study showed that using videos to educate patients prior to colonoscopies was superior to face-to-face education.10 In addition, video education may free up time for office staff to accomplish other tasks.
As a specialty, dermatology has not been a leader in the implementation of social networking for collaboration and training purposes. Every dermatologist is an educator. To maintain a successful practice, dermatologists must keep up-to-date on their own clinical knowledge, provide training to their staff, and educate their patients. Although there are numerous educational resources available to dermatologists, an informal survey of 30 dermatology faculty members revealed a practice gap in awareness and utilization of these expanding electronic resources.11
To better understand the needs of the specialty as a whole, we chose to focus on one aspect of dermatology education: resident training. The goal of our study was to survey dermatology residents and faculty to gain a better understanding of how they currently provide education and what online resources and social networking sites they currently use or would be willing to use. The study included 3 central hypotheses: First, residents would be less satisfied with their current curriculum and residents would report greater contributions to the curriculum relative to faculty. Second, both residents and faculty of smaller programs would be more interested in collaborative educational resources relative to larger programs. Lastly, residents would be more willing than faculty to participate in social networking for educational purposes.
Methods
This study was granted institutional review board exemption. Two surveys were developed by the authors to assess the current structure and satisfaction of dermatology residency curriculum and the willingness to participate in social networking to use and share educational materials. The surveys were evaluated for relevance by the survey evaluation team of the Association of Professors of Dermatology (APD). The instrument was not pilot tested.
The surveys were electronically distributed using an online service to dermatology faculty via the APD listserve, which comprised the entirety of the APD membership in 2014. The resident survey was distributed to the dermatology residents via the American Society for Dermatologic Surgery listserve, which included all residents in training (2013-2014 academic year). Second and third invitations to complete the surveys were distributed 3 and 5 weeks later, respectively.
Resident and faculty responses were compared. Additionally, responses were stratified for large (>9 residents) and small programs (≤9 residents) for comparison. Descriptive statistics including means and medians for continuous variables and frequency tables for categorical variables were generated using research and spreadsheet software.
Results
There were 137 survey respondents; 52 of 426 (12.2%) dermatology faculty and 85 of 1539 (5.5%) dermatology residents responded to the survey. Small programs accounted for 24% of total survey responses and 76% were from large programs.
Current Curriculum
The majority of dermatology faculty (44%) and residents (35%) identified 1 to 2 faculty members as contributing to the creation and organization of their respective curricula; however, a notable percentage of residents (9%) reported that no faculty contributed to the organization of the curriculum. Residents noted that senior residents carry twice the responsibility for structuring the curriculum compared to faculty (61% vs 32% of the workload), but faculty described an even split between senior residents and faculty (47% vs 49% of the workload). Faculty believed their residents spend a similar amount of time in resident- and faculty-led instruction (38% vs 35% of their time); however, the majority of residents reported spending too little time in faculty-led instruction (53%). When residents ranked their preference for learning modes, faculty-led and self-study learning were ranked first and second by 48% and 45% of residents, respectively. Resident-led instruction was ranked last by 66% of residents. Likewise, a majority of residents (53%) described their amount of time in faculty-led instruction as too little.
When asked what subjects in dermatology were lacking at their programs, residents reported clinical trials (47%), skin of color (46%), cosmetic dermatology (34%), and aggressive skin cancer/multidisciplinary tumor board (32%). Although 11% of residents reported lacking inpatient dermatology in their curriculum, 0% of faculty reported the same. A notable percentage of faculty reported nothing was lacking compared to residents (25% vs 7%). Despite these different views between residents and faculty on their contributions to and structure of their curriculums, both faculty and residents claimed overall satisfaction (satisfied or very satisfied) with their program’s ability to optimally cover the field of dermatology in 3 years (100% and 91%, respectively).
Large Versus Small Residency Programs
When stratifying the resident responses for small versus large programs, both program sizes reported more time in resident-led instruction than faculty-led instruction. Likewise, residents in both program sizes equally preferred self-study or faculty-led instruction to resident-led instruction. Residents at small programs more often reported lacking instruction in rheumatology, immunobullous diseases, and basic science/skin biology compared to large-program residents. Compared to large-program faculty, small-program faculty reported lacking instruction in cosmetic dermatology.
Faculty at small programs reported spending too little time preparing for their faculty-led instruction compared to faculty at large programs (44% vs 12%). All (100%) of the faculty at small programs were likely to seek out study materials shared by top educators, while 77% of faculty at large programs were likely to do the same. When asked if faculty would translate what their program does well into an electronic format for sharing, 30% of large-program faculty were likely to do so compared to 11% of small-program faculty (Figure 1).
Use of Online Educational Materials and Interest in Collaboration
A majority of faculty and residents stated that they use online educational materials as supplements to traditional classroom lecture and print materials (81% vs 86%); however, almost twice as many residents stated that online educational materials were essential to their current study routines compared to faculty (39% vs 21%).
The majority of faculty (92%) and residents (84%) were either interested or very interested in a collaborative online curriculum. Both residents (85%) and faculty (81%) stated they would be likely to seek out online educational materials shared by top educators. Although both residents and faculty reported many aspects of their curriculums they thought could be beneficial to other dermatology programs (Table 1), only 27% of faculty and 19% of residents were likely to translate those strengths into a shareable electronic format. Several reasons were reported for not contributing to an online curriculum, with lack of time being the most common reason (Table 2).
Eighty percent of residents and 88% of faculty reported they were either interested or very interested in being more connected/interactive with their dermatology peers nationally (Figure 2). Likewise, 94% of residents and 87% of faculty agreed that the dermatology community could benefit from a social networking site for educational collaboration. Four times as many residents versus faculty currently use social networking sites (eg, Facebook, LinkedIn, Google Groups) as a primary mode of communication with distant professional peers. The majority of residents (52%) reported they would be likely to participate in a professional social networking site, while the majority of faculty (50%) stated they were neutral on their likelihood of participating. Both residents and faculty reported lack of time as a common reason for being unlikely to utilize a professional social networking site. Other barriers to participation are listed in Table 3.
Comment
This study showed how dermatology faculty and residents currently provide training and what online resources and social networking sites they currently use or would be willing to use. The generalizability of the conclusions is limited by the low response rate for the surveys. The results demonstrated the different views between faculty and residents and between large and small residency programs on various topics. This microcosm of dermatology training can likely be applied to other training scenarios in dermatology, including patient education; training of nurses, physician extenders, and office staff; continuing medical education for physicians; and peer-to-peer collaboration.
Hypothesis 1: Partially Proven
We hypothesized that residents would report less satisfaction with their current curriculum and would report greater resident contributions to the curriculum relative to faculty. Overall, residents and faculty reported satisfaction with their curriculums to provide up-to-date information and breadth in the field of dermatology. Despite their overall satisfaction, more residents reported lacking instruction in several dermatology subtopics compared to faculty. Additionally, residents believed they spend twice as much time structuring their curriculum compared to faculty, with some residents reporting no faculty involvement. Although residents preferred faculty-led instruction, a majority of residents reported they do not have enough faculty-led didactics. The preference for faculty-led training is likely due to the expertise of faculty compared to residents.
Hypothesis 2: Partially Proven
We also hypothesized that both residents and faculty of smaller programs would be more interested in collaborative educational resources relative to larger programs. Although there was no difference in interest between residents at small versus large programs, there was a difference between faculty at small versus large programs. Small-program faculty were more interested in using shared materials than larger programs, while large-program faculty were more likely to share their educational materials. Small-program faculty reported spending too little time preparing their lectures, which is possibly due to a lack of time for preparation. Additionally, residents and faculty at smaller programs report their curriculum was lacking specific dermatology topics compared to large programs. These disparities between program sizes indicate a need for a social networking site for training collaboration in dermatology. Large programs have the ability to share what they do well, which small programs are eager to utilize.
Hypothesis 3: Not Proven
We hypothesized that residents would be more willing than faculty to participate in social networking for educational purposes. The majority of faculty and residents were interested in participating in a collaborative online curriculum and using the shared materials from top educators; however, even though such large majorities favored collaboration and sharing, only 27% of faculty and 19% of residents were likely to translate their own materials into a shareable format. Although lack of time was the most common reason for not sharing materials, electronic methods may have the potential to ultimately save time and remove the burden of content creation. The time it would take to translate selected personal training materials into a shareable form would be made up for by the time saved using another educators’ materials. Updating and customizing shared online educational materials can be much quicker and easier than educators creating materials on their own. Dermatologists would be more efficient facilitators of training via high-quality shared materials while decreasing the time burden associated with resident education.5 Another concern for not sharing or participating in a social networking site was skepticism of information security on such a network. The poor organization and information overload of online resources can compound the already existing time constraints on dermatologists, which may limit their ability to utilize such valuable resources. In addition, quality of online resources is not always guaranteed, and determining the sources that are high quality is sometimes a difficult task.6 For online materials to remain useful, there should be a peer-review process to evaluate quality and assess satisfaction.5
Solution: Create a Dermatology Task Force
A dermatology task force could facilitate the resolution of these challenges of online materials. In addition, a task force could cover the administrative support needed to ensure security and provide maintenance on social networks.
The main limitation to implementing a social network is the presence of the administrative infrastructure to jumpstart its creation. A task force incorporating the essential stakeholders in dermatology training is the first step. With inclusive representation from all of the smaller professional dermatology societies, the American Academy of Dermatology is optimally positioned to create this task force. With existing information technologies, a task force could address the concerns revealed in our survey as well as any future concerns that may arise.
The goal is a single social network for dermatologists that has the capability of improving communication and collaboration between professional peers regardless of their practice setting. Such a network is ideal for the practicing dermatologist for the purposes of staff training, patient education, and obtaining continuing medical education credit. Additionally, peer group collaboration would facilitate the understanding and completion of the evolving requirements for Maintenance of Certification from the American Board of Dermatology. The availability of quality shared materials would save time and increase efficiency of an entire dermatology practice. Materials that aid in patient education would allow office staff to dedicate their time to other tasks, thereby increasing productivity. Shared training materials would decrease the burden of staff education, providing more time for advanced hands-on training. This method of collaborative effort is capable of advancing the field of dermatology as a whole. It can overcome geographical and institutional barriers to connect dermatologists with similar interests worldwide; disseminate advances in diagnosis and treatment; and improve the quality of dermatology training of dermatologists, staff, and patients.
- Statistics and facts about social networks. Statista website. http://www.statista.com/topics/1164/social-networks/. Accessed March 22, 2017.
- Baker RC, Klein M, Samaan Z, et al. Effectiveness of an online pediatric primary care curriculum. Acad Pediatr. 2010;10:131-137.
- Dolev JC, O’Sullivan P, Berger T. The eDerm online curriculum: a randomized study of effective skin cancer teaching to medical students. J Am Acad Dermatol. 2011;65:e165-e171.
- Amir M, Sampson BP, Endly D, et al. Social networking sites: emerging and essential tools for communication in dermatology. JAMA Dermatol. 2014;150:56-60.
- Ruiz JG, Mintzer MJ, Leipzig RM. The impact of e-learning in medical education. Acad Med. 2006;81:207-212.
- Hanson AH, Krause LK, Simmons RN, et al. Dermatology education and the internet: traditional and cutting-edge resources. J Am Acad Dermatol. 2011;65:836-842.
- Rowe SP, Siddiqui A, Bonekamp D. The key image and case log application: new radiology software for teaching file creation and case logging that incorporates elements of a social network. Acad Radiol. 2014;21:916-930.
- Bell RH. Surgical council on resident education: a new organization devoted to graduate surgical education. J Am Coll Surg. 2007;204:341-346.
- Kirton OC, Reilly P, Staff I, et al. Development and implementation of an interactive, objective, and simulation-based curriculum for general surgery residents. J Surg Educ. 2012;69:718-723.
- Prakash S, Verma S, McGowan J, et al. Improving the quality of colonoscopy bowel preparation using an educational video. Can J Gastroenterol. 2013;27:696-700.
- Carroll BT. eTools for teaching dermatologic surgery. Paper presented at the Association of Professors of Dermatology 2014 Annual Meeting; September 12-13, 2014; Chicago, IL.
Practice Points
- Educational collaboration between residency programs via social media can result in more well-rounded dermatologists, which will enhance patient care.
- Social media can connect dermatologists nationwide to improve patient care via collaboration.

Efinaconazole Solution 10% for Treatment of Toenail Onychomycosis in Latino Patients
Onychomycosis is a common progressive fungal infection of the nail bed, matrix, or plate leading to destruction and deformity of the toenails and fingernails.1,2 It represents up to 50% of all nail disorders1,3 with a notable increasing prevalence in the United States.4-6
Latinos represent the largest ethnic minority group in the United States,7 which is growing rapidly through immigration, particularly in the southern United States. Prevalence data are limited. An incidence of 9.3% secondary to dermatophytes was recorded in a dermatology clinic setting (N=2000).8 Onychomycosis was reported in 31.9% of a group of Latino immigrants in North Carolina (N=518), with higher prevalence in poultry workers, possibly due to the work environment.9
Efinaconazole solution 10% was shown to be well tolerated and more effective than a vehicle in a phase 2 study in Mexico.10 Two identical phase 3 studies of 1655 participants assessed the safety and efficacy of efinaconazole solution 10% in the treatment of onychomycosis.11 This post hoc analysis compares the data for Latino versus non-Latino populations.
Methods
We evaluated the results of 2 multicenter, randomized, double-blind, vehicle-controlled studies that included a total of 1655 participants with mild to moderate toenail onychomycosis (20%–50% clinical involvement). Participants were randomized to efinaconazole solu-tion 10% or vehicle once daily (3:1) for 48 weeks with a 4-week posttreatment follow-up period.11
Our post hoc analysis included 270 Latino patients, defined as an individual of Cuban, Mexican, Puerto Rican, or South or Central American origin or other Latino culture, regardless of race. In addition, data were compared to the 1380 non-Latino patients in the 2 studies. Patients who were randomized in error and never received treatment were excluded from the intention-to-treat analysis.
Efficacy Evaluation
The primary efficacy end point was complete cure rate (0% clinical involvement of target toenail, and both negative potassium hydroxide examination and fungal culture) at week 52. Secondary end points included mycologic cure, complete/almost complete cure (≤5% clinical involvement of target toenail, mycologic cure), and treatment success (≤10% clinical involvement of target toenail) at week 52.
Safety Evaluation
Safety assessments included monitoring and recording of adverse events (AEs) at every postbaseline study visit through week 52. All AEs were classified using the Medical Dictionary for Regulatory Activities (version 12.1). Treatment-emergent AEs (ie, events that began after the first application of study drug) that occurred during the study were summarized for each treatment group by the number of patients reporting each event, as well as by system organ class, preferred term, severity, seriousness, and relationship to the study drug.
Results
A total of 270 Latino participants with toenail onychomycosis (efinaconazole solution 10%, n=193; vehicle, n=77) were included in our study. The mean age of participants at baseline was 45.9 years. They were predominantly male (69.6%) and white Latinos (91.1%). The mean area of target toenail involvement was 36.6%, and the mean number of affected nontarget toenails was 2.5. Latino participants tended to be younger than non-Latino participants (45.9 vs 52.6 years), with a higher proportion of females (30.4% vs 21.3%). Disease severity was similar in both populations. Diabetes was reported in 7.0% and 6.7% of Latino and non-Latino participants, respectively, and mean weight was 83.6 and 86.6 kg, respectively.
Primary Efficacy End Points (Observed Case [OC])
At week 52, 25.6% of Latino participants in the efinaconazole group achieved complete cure versus 0% in the vehicle group (P<.001)(Figure 1). The efficacy of efinaconazole was statistically superior in Latino participants versus non-Latino participants (17.2% [P=.012]). The net effect (calculated by active treatment minus vehicle) for Latino participants also was superior to non-Latino participants (25.6% vs 11.6%).
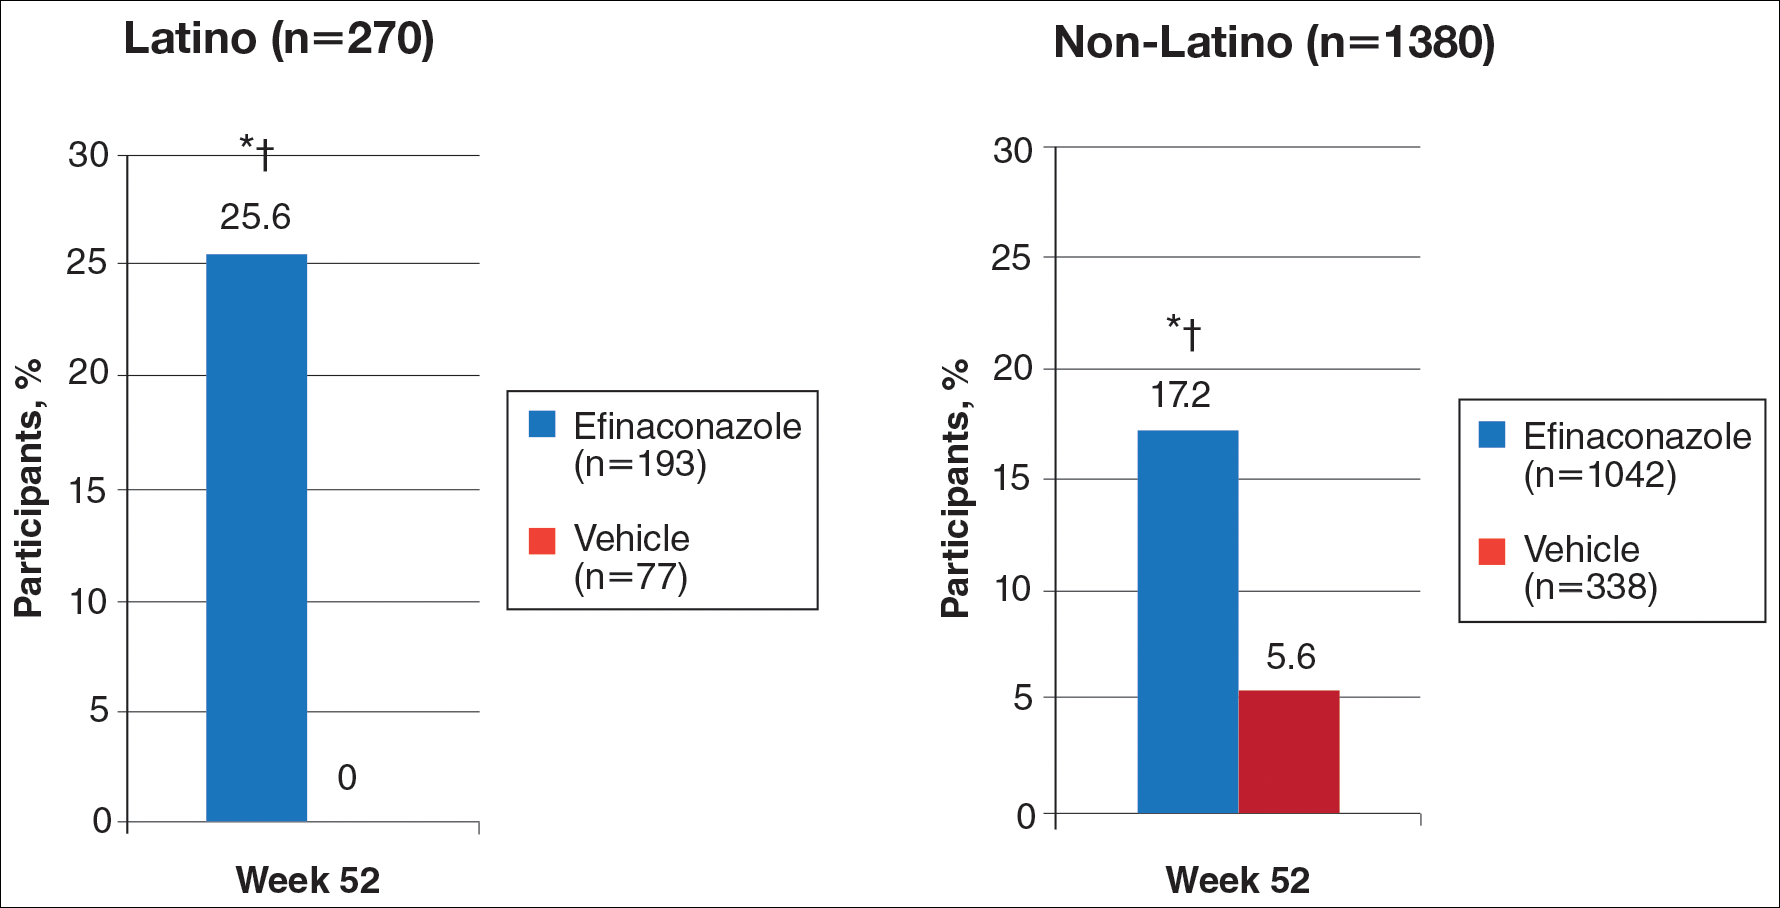
Secondary Efficacy End Points (OC)
At week 52, 61.5% of Latino participants in the efina-conazole group achieved mycologic cure versus 15.3% in the vehicle group (P<.001)(Figure 2). The net effect for Latino participants was superior to non-Latino participants (46.2% vs 38.5%). More Latino participants in the efinaconazole group compared to vehicle group achieved complete/almost complete cure (32.7% vs 1.7%) or treatment success (49.4% vs 5.1%)(all P<.001)(Figure 3). Although there was no significant difference between the 2 groups for secondary efficacy end points, the net effect of efinaconazole was greater for all end points.
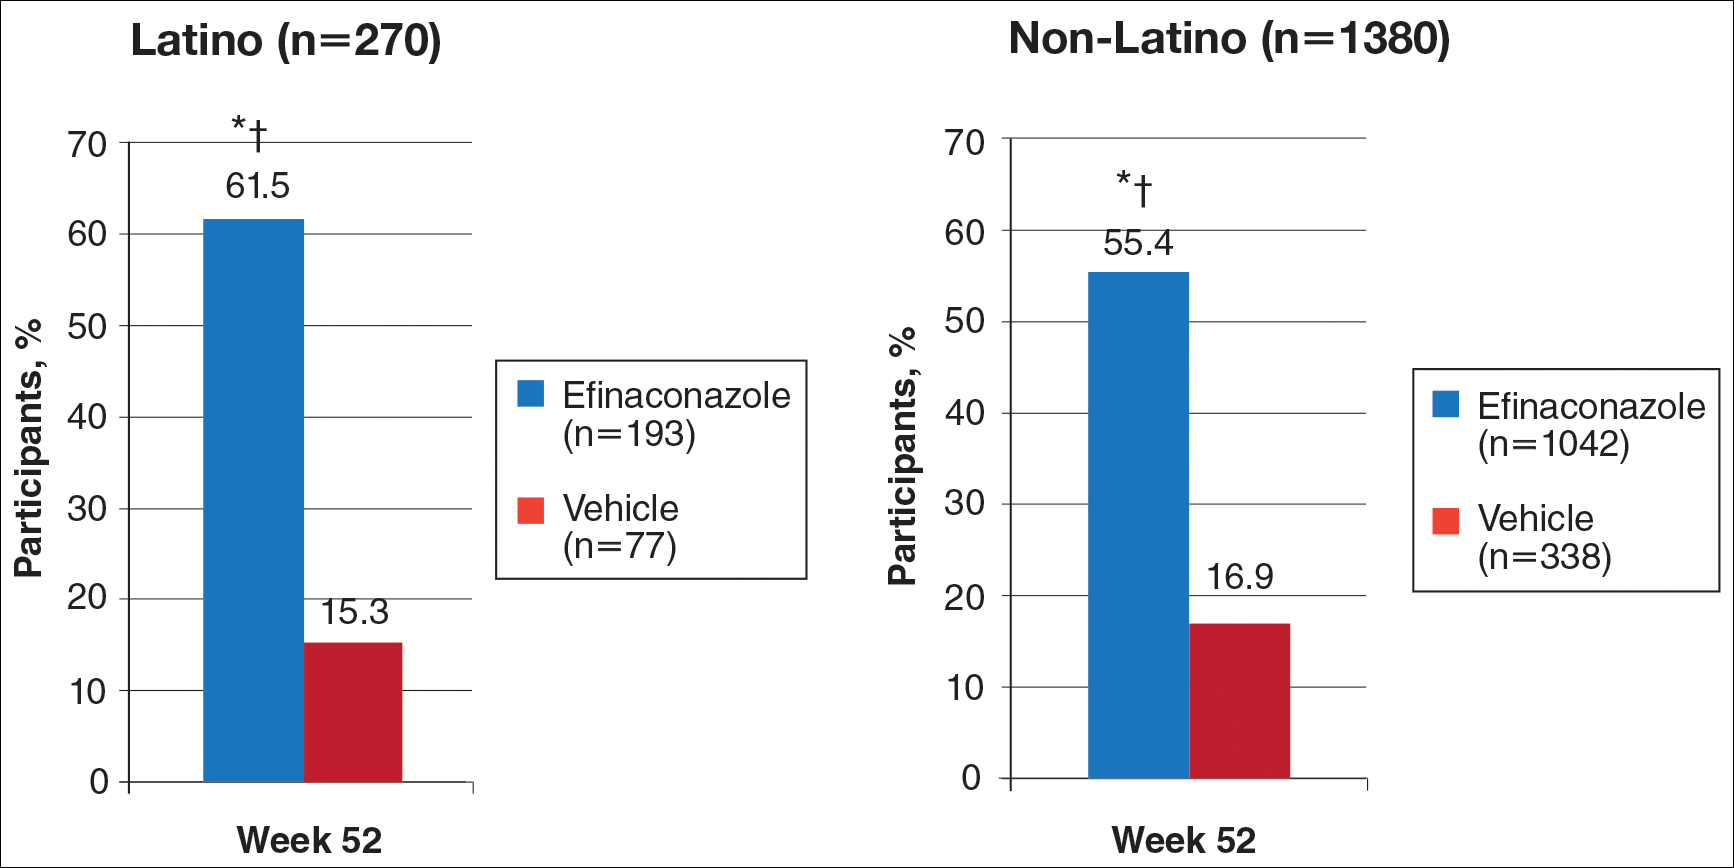
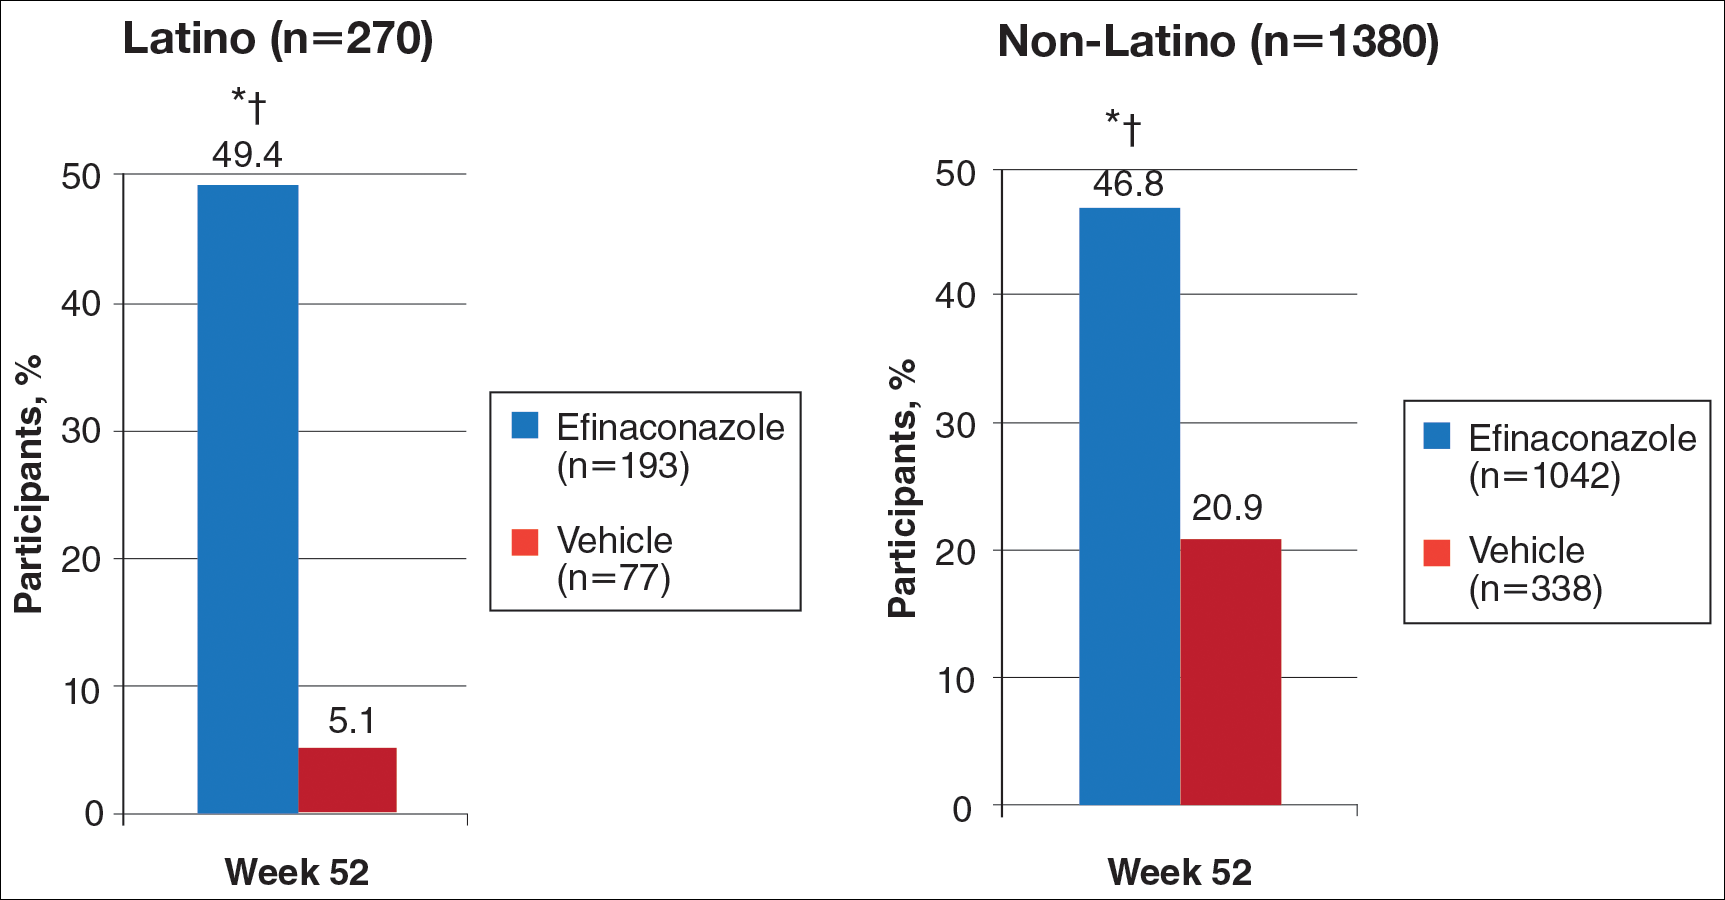
Safety
Adverse event rates were higher in the efinaconazole group than the vehicle group (65.3% vs 54.4%) and were similar in both populations; they were generally mild (61.8% vs 54.5%) or moderate (35.3% vs 45.5%) in severity, not related to study medication (96.8% vs 98.0%), and resolved without sequelae. Only 3 Latino participants (1.6%) discontinued efinaconazole treatment compared to 29 (2.8%) in the non-Latino population.
Comment
With the continued growth of the Latino population in the United States and likely higher prevalence of onychomycosis,9 this post hoc analysis provides important insights into treatment of onychomycosis in this patient population.
Efinaconazole solution 10% was significantly more effective than vehicle in the Latino population (P<.001) and also appeared significantly more effective than the non-Latino population across the 2 phase 3 studies (P=.012). Interestingly, complete cure rates (25.6%) were identical to those reported in the phase 2 study of Mexican patients treated with efinaconazole for 36 weeks.10 Specific data with other topical therapies, such as tavaborole, in Latino patients are not available. One phase 3 study of tavaborole for onychomycosis included 89 Mexican patients (15% of the total study population), but complete cure rates for the overall active treatment group were higher in a second phase 3 study (6.5% vs 9.1%) that did not include participants outside the United States or Canada.12
It is not clear why phase 3 efficacy results with efinaconazole appear better in the Latino population. There are a number of predisposing factors for onychomycosis that are important treatment considerations in Latinos. Obesity is an important factor in the development of onychomycosis,13 with more than 42% of Latino adults in the United States reportedly obese compared to 32.6% of non-Latino adults.14 Obese patients reportedly have shown a poorer response to efinaconazole treatment15; however, in our analysis, the mean weight of the 2 subpopulations was similar at baseline. Diabetes also is associated with an increased risk for onychomycosis16,17 and may be a more important issue in Latinos perhaps due to differences in health care access, social and cultural factors, and/or genetics, as well as the greater incidence of obesity. Prior reports suggest the efficacy of efinaconazole is not substantially influenced by the presence of diabetes,18 and in our 2 subpopulations, baseline incidence of coexisting diabetes was similar. These factors are unlikely to account for the better treatment success seen in our analysis. Efinaconazole has been reported to be more effective in females,19 though the reasons are less clear. The higher proportion of female Latinos (30.4% vs 21.3%) in our study may have had an impact on the results reported, though this baseline characteristic cannot be considered in isolation.
When considering the net effect (active minus vehicle), the apparent benefits of efinaconazole in Latino patients with onychomycosis were more marked. Vehicle complete cure rates at week 52 were 0% compared with 5.6% of non-Latino participants. Vehicle cure rates in randomized controlled trials of toenail onychomycosis are relatively low and appear to be independent of the study characteristics.20 Vehicle cure rates of 2 topical treatments—efinaconazole and tavaborole—reported in their 2 respective phase 3 studies were 3.3% and 5.5% for efinaconzole11 and 0.5% and 1.5% for tavaborole.12 It has been suggested that the higher results seen with the efinaconazole vehicle relate to the formulation, though there is no reason to expect it to perform differently in a Latino population. It also has been suggested that baseline disease severity might impact vehicle treatment outcome.20 In our analysis, the percentage affected nail at baseline was higher in the Latino participants treated with vehicle (38.9% vs 36.2%).
Although the overall level of AEs was similar in Latino versus non-Latino participants treated with efinaconazole, events were generally milder in the Latino subpopulation and fewer participants discontinued because of AEs.
Our study had a number of limitations. A study period of 52 weeks may be too brief to evaluate clinical cure in onychomycosis, as continued improvement could occur with either longer treatment or follow-up. Also, the pivotal studies were not set up to specifically study Latino participants; the demographics and study disposition may not be representative of the general Latino population.
Conclusion
Once-daily treatment with efinaconazole solution 10% may provide a useful topical option in the treatment of Latino patients with toenail onychomycosis.
Acknowledgment
The authors would like to thank Brian Bulley, MSc (Konic Limited, West Sussex, United Kingdom), for medical writing support. Valeant Pharmaceuticals North America LLC funded Konic Limited’s activities pertaining to this manuscript. Dr. Cook-Bolden did not receive funding or any form of compensation for authorship of this publication.
- Scher RK, Coppa LM. Advances in the diagnosis and treatment of onychomycosis. Hosp Med. 1998;34:11-20.
- Crissey JT. Common dermatophyte infections. a simple diagnostic test and current management. Postgrad Med. 1998;103:191-192, 197-200, 205.
- Gupta AK, Jain HC, Lynde CW, et al. Prevalence and epidemiology of onychomycosis in patients visiting physicians’ offices: a multicenter Canadian survey of 15,000 patients. J Am Acad Dermatol. 2000;43:244-248.
- Scher RK, Rich P, Pariser D, et al. The epidemiology, etiology, and pathophysiology of onychomycosis. Semin Cutan Med Surg. 2013;32(2, suppl 1):S2-S4.
- Kumar S, Kimball AB. New antifungal therapies for the treatment of onychomycosis. Expert Opin Investig Drugs. 2009;18:727-734.
- Ghannoum MA, Hajjeh RA, Scher R, et al. A large-scale North American study of fungal isolates from nails: the frequency of onychomycosis, fungal distribution, and antifungal susceptibility patterns. J Am Acad Dermatol. 2000;43:641-648.
- Census 2010: 50 million Latinos. Hispanics account for more than half of nation’s growth in past decade. Pew Hispanic Center website. http://pewhispanic.org/files/reports/140.pdf. Published March 24, 2011. Accessed November 22, 2016.
- Sanchez MR. Cutaneous diseases in Latinos. Dermatol Clin. 2002;21:689-697.
- Pichardo-Geisinger R, Mun˜oz-Ali D, Arcury TA, et al. Dermatologist-diagnosed skin diseases among immigrant Latino poultry processors and other manual workers in North Carolina, USA. Int J Dermatol. 2013;52:1342-1348.
- Tschen EH, Bucko AD, Oizumi N, et al. Efinaconazole solution in the treatment of toenail onychomycosis: a phase 2, multicenter, randomized, double-blind study. J Drugs Dermatol. 2013;12:186-192.
- Elewski BE, Rich P, Pollak R, et al. Efinaconazole 10% solution in the treatment of toenail onychomycosis: two phase III multicenter, randomized, double-blind studies. J Am Acad Dermatol. 2013;68:600-608.
- Elewski BE, Aly R, Baldwin SL, et al. Efficacy and safety of tavaborole topical solution, 5%, a novel boron-based antifungal agent, for the treatment of toenail onychomycosis: results from 2 randomized phase-III studies. J Am Acad Dermatol. 2015;73:62-69.
- Chan MK, Chong LY. A prospective epidemiology survey of foot disease in Hong Kong. J Am Podiatr Med Assoc. 2002;92:450-456.
- Ogden CL, Carroll MD, Kit BK, et al. Prevalence of Obesity Among Adults: United States, 2011-2012. Hyattsville, MD: National Center for Health Statistics, 2013. NCHS data brief, no. 131.
- Elewski BE, Tosti A. Risk factors and comorbidities for onychomycosis: implications for treatment with topical therapy. J Clin Aesthet Dermatol. 2015;8:38-42.
- Tosti A, Hay R, Arenas-Guzmán R. Patients at risk of onychomycosis–risk factor identification and active prevention. J Eur Acad Dermatol Venereol. 2005;19(suppl 1):13-16.
- Sigurgeirsson B, Steingrímsson O. Risk factors associated with onychomycosis. J Eur Acad Dermatol Venereol. 2004;18:48-51.
- Vlahovic TC, Joseph WS. Efinaconazole topical, 10% for the treatment of toenail onychomycosis in patients with diabetes. J Drugs Dermatol. 2014;13:1186-1190.
- Rosen T. Evaluation of gender as a clinically relevant outcome variable in the treatment of onychomycosis with efinaconazole topical solution 10%. Cutis. 2015;96:197-201.
- Gupta AK, Paquet M. Placebo cure rates in the treatment of onychomycosis. J Am Podiatr Med Assoc. 2014;104:277-282.
Onychomycosis is a common progressive fungal infection of the nail bed, matrix, or plate leading to destruction and deformity of the toenails and fingernails.1,2 It represents up to 50% of all nail disorders1,3 with a notable increasing prevalence in the United States.4-6
Latinos represent the largest ethnic minority group in the United States,7 which is growing rapidly through immigration, particularly in the southern United States. Prevalence data are limited. An incidence of 9.3% secondary to dermatophytes was recorded in a dermatology clinic setting (N=2000).8 Onychomycosis was reported in 31.9% of a group of Latino immigrants in North Carolina (N=518), with higher prevalence in poultry workers, possibly due to the work environment.9
Efinaconazole solution 10% was shown to be well tolerated and more effective than a vehicle in a phase 2 study in Mexico.10 Two identical phase 3 studies of 1655 participants assessed the safety and efficacy of efinaconazole solution 10% in the treatment of onychomycosis.11 This post hoc analysis compares the data for Latino versus non-Latino populations.
Methods
We evaluated the results of 2 multicenter, randomized, double-blind, vehicle-controlled studies that included a total of 1655 participants with mild to moderate toenail onychomycosis (20%–50% clinical involvement). Participants were randomized to efinaconazole solu-tion 10% or vehicle once daily (3:1) for 48 weeks with a 4-week posttreatment follow-up period.11
Our post hoc analysis included 270 Latino patients, defined as an individual of Cuban, Mexican, Puerto Rican, or South or Central American origin or other Latino culture, regardless of race. In addition, data were compared to the 1380 non-Latino patients in the 2 studies. Patients who were randomized in error and never received treatment were excluded from the intention-to-treat analysis.
Efficacy Evaluation
The primary efficacy end point was complete cure rate (0% clinical involvement of target toenail, and both negative potassium hydroxide examination and fungal culture) at week 52. Secondary end points included mycologic cure, complete/almost complete cure (≤5% clinical involvement of target toenail, mycologic cure), and treatment success (≤10% clinical involvement of target toenail) at week 52.
Safety Evaluation
Safety assessments included monitoring and recording of adverse events (AEs) at every postbaseline study visit through week 52. All AEs were classified using the Medical Dictionary for Regulatory Activities (version 12.1). Treatment-emergent AEs (ie, events that began after the first application of study drug) that occurred during the study were summarized for each treatment group by the number of patients reporting each event, as well as by system organ class, preferred term, severity, seriousness, and relationship to the study drug.
Results
A total of 270 Latino participants with toenail onychomycosis (efinaconazole solution 10%, n=193; vehicle, n=77) were included in our study. The mean age of participants at baseline was 45.9 years. They were predominantly male (69.6%) and white Latinos (91.1%). The mean area of target toenail involvement was 36.6%, and the mean number of affected nontarget toenails was 2.5. Latino participants tended to be younger than non-Latino participants (45.9 vs 52.6 years), with a higher proportion of females (30.4% vs 21.3%). Disease severity was similar in both populations. Diabetes was reported in 7.0% and 6.7% of Latino and non-Latino participants, respectively, and mean weight was 83.6 and 86.6 kg, respectively.
Primary Efficacy End Points (Observed Case [OC])
At week 52, 25.6% of Latino participants in the efinaconazole group achieved complete cure versus 0% in the vehicle group (P<.001)(Figure 1). The efficacy of efinaconazole was statistically superior in Latino participants versus non-Latino participants (17.2% [P=.012]). The net effect (calculated by active treatment minus vehicle) for Latino participants also was superior to non-Latino participants (25.6% vs 11.6%).
Secondary Efficacy End Points (OC)
At week 52, 61.5% of Latino participants in the efina-conazole group achieved mycologic cure versus 15.3% in the vehicle group (P<.001)(Figure 2). The net effect for Latino participants was superior to non-Latino participants (46.2% vs 38.5%). More Latino participants in the efinaconazole group compared to vehicle group achieved complete/almost complete cure (32.7% vs 1.7%) or treatment success (49.4% vs 5.1%)(all P<.001)(Figure 3). Although there was no significant difference between the 2 groups for secondary efficacy end points, the net effect of efinaconazole was greater for all end points.
Safety
Adverse event rates were higher in the efinaconazole group than the vehicle group (65.3% vs 54.4%) and were similar in both populations; they were generally mild (61.8% vs 54.5%) or moderate (35.3% vs 45.5%) in severity, not related to study medication (96.8% vs 98.0%), and resolved without sequelae. Only 3 Latino participants (1.6%) discontinued efinaconazole treatment compared to 29 (2.8%) in the non-Latino population.
Comment
With the continued growth of the Latino population in the United States and likely higher prevalence of onychomycosis,9 this post hoc analysis provides important insights into treatment of onychomycosis in this patient population.
Efinaconazole solution 10% was significantly more effective than vehicle in the Latino population (P<.001) and also appeared significantly more effective than the non-Latino population across the 2 phase 3 studies (P=.012). Interestingly, complete cure rates (25.6%) were identical to those reported in the phase 2 study of Mexican patients treated with efinaconazole for 36 weeks.10 Specific data with other topical therapies, such as tavaborole, in Latino patients are not available. One phase 3 study of tavaborole for onychomycosis included 89 Mexican patients (15% of the total study population), but complete cure rates for the overall active treatment group were higher in a second phase 3 study (6.5% vs 9.1%) that did not include participants outside the United States or Canada.12
It is not clear why phase 3 efficacy results with efinaconazole appear better in the Latino population. There are a number of predisposing factors for onychomycosis that are important treatment considerations in Latinos. Obesity is an important factor in the development of onychomycosis,13 with more than 42% of Latino adults in the United States reportedly obese compared to 32.6% of non-Latino adults.14 Obese patients reportedly have shown a poorer response to efinaconazole treatment15; however, in our analysis, the mean weight of the 2 subpopulations was similar at baseline. Diabetes also is associated with an increased risk for onychomycosis16,17 and may be a more important issue in Latinos perhaps due to differences in health care access, social and cultural factors, and/or genetics, as well as the greater incidence of obesity. Prior reports suggest the efficacy of efinaconazole is not substantially influenced by the presence of diabetes,18 and in our 2 subpopulations, baseline incidence of coexisting diabetes was similar. These factors are unlikely to account for the better treatment success seen in our analysis. Efinaconazole has been reported to be more effective in females,19 though the reasons are less clear. The higher proportion of female Latinos (30.4% vs 21.3%) in our study may have had an impact on the results reported, though this baseline characteristic cannot be considered in isolation.
When considering the net effect (active minus vehicle), the apparent benefits of efinaconazole in Latino patients with onychomycosis were more marked. Vehicle complete cure rates at week 52 were 0% compared with 5.6% of non-Latino participants. Vehicle cure rates in randomized controlled trials of toenail onychomycosis are relatively low and appear to be independent of the study characteristics.20 Vehicle cure rates of 2 topical treatments—efinaconazole and tavaborole—reported in their 2 respective phase 3 studies were 3.3% and 5.5% for efinaconzole11 and 0.5% and 1.5% for tavaborole.12 It has been suggested that the higher results seen with the efinaconazole vehicle relate to the formulation, though there is no reason to expect it to perform differently in a Latino population. It also has been suggested that baseline disease severity might impact vehicle treatment outcome.20 In our analysis, the percentage affected nail at baseline was higher in the Latino participants treated with vehicle (38.9% vs 36.2%).
Although the overall level of AEs was similar in Latino versus non-Latino participants treated with efinaconazole, events were generally milder in the Latino subpopulation and fewer participants discontinued because of AEs.
Our study had a number of limitations. A study period of 52 weeks may be too brief to evaluate clinical cure in onychomycosis, as continued improvement could occur with either longer treatment or follow-up. Also, the pivotal studies were not set up to specifically study Latino participants; the demographics and study disposition may not be representative of the general Latino population.
Conclusion
Once-daily treatment with efinaconazole solution 10% may provide a useful topical option in the treatment of Latino patients with toenail onychomycosis.
Acknowledgment
The authors would like to thank Brian Bulley, MSc (Konic Limited, West Sussex, United Kingdom), for medical writing support. Valeant Pharmaceuticals North America LLC funded Konic Limited’s activities pertaining to this manuscript. Dr. Cook-Bolden did not receive funding or any form of compensation for authorship of this publication.
- Scher RK, Coppa LM. Advances in the diagnosis and treatment of onychomycosis. Hosp Med. 1998;34:11-20.
- Crissey JT. Common dermatophyte infections. a simple diagnostic test and current management. Postgrad Med. 1998;103:191-192, 197-200, 205.
- Gupta AK, Jain HC, Lynde CW, et al. Prevalence and epidemiology of onychomycosis in patients visiting physicians’ offices: a multicenter Canadian survey of 15,000 patients. J Am Acad Dermatol. 2000;43:244-248.
- Scher RK, Rich P, Pariser D, et al. The epidemiology, etiology, and pathophysiology of onychomycosis. Semin Cutan Med Surg. 2013;32(2, suppl 1):S2-S4.
- Kumar S, Kimball AB. New antifungal therapies for the treatment of onychomycosis. Expert Opin Investig Drugs. 2009;18:727-734.
- Ghannoum MA, Hajjeh RA, Scher R, et al. A large-scale North American study of fungal isolates from nails: the frequency of onychomycosis, fungal distribution, and antifungal susceptibility patterns. J Am Acad Dermatol. 2000;43:641-648.
- Census 2010: 50 million Latinos. Hispanics account for more than half of nation’s growth in past decade. Pew Hispanic Center website. http://pewhispanic.org/files/reports/140.pdf. Published March 24, 2011. Accessed November 22, 2016.
- Sanchez MR. Cutaneous diseases in Latinos. Dermatol Clin. 2002;21:689-697.
- Pichardo-Geisinger R, Mun˜oz-Ali D, Arcury TA, et al. Dermatologist-diagnosed skin diseases among immigrant Latino poultry processors and other manual workers in North Carolina, USA. Int J Dermatol. 2013;52:1342-1348.
- Tschen EH, Bucko AD, Oizumi N, et al. Efinaconazole solution in the treatment of toenail onychomycosis: a phase 2, multicenter, randomized, double-blind study. J Drugs Dermatol. 2013;12:186-192.
- Elewski BE, Rich P, Pollak R, et al. Efinaconazole 10% solution in the treatment of toenail onychomycosis: two phase III multicenter, randomized, double-blind studies. J Am Acad Dermatol. 2013;68:600-608.
- Elewski BE, Aly R, Baldwin SL, et al. Efficacy and safety of tavaborole topical solution, 5%, a novel boron-based antifungal agent, for the treatment of toenail onychomycosis: results from 2 randomized phase-III studies. J Am Acad Dermatol. 2015;73:62-69.
- Chan MK, Chong LY. A prospective epidemiology survey of foot disease in Hong Kong. J Am Podiatr Med Assoc. 2002;92:450-456.
- Ogden CL, Carroll MD, Kit BK, et al. Prevalence of Obesity Among Adults: United States, 2011-2012. Hyattsville, MD: National Center for Health Statistics, 2013. NCHS data brief, no. 131.
- Elewski BE, Tosti A. Risk factors and comorbidities for onychomycosis: implications for treatment with topical therapy. J Clin Aesthet Dermatol. 2015;8:38-42.
- Tosti A, Hay R, Arenas-Guzmán R. Patients at risk of onychomycosis–risk factor identification and active prevention. J Eur Acad Dermatol Venereol. 2005;19(suppl 1):13-16.
- Sigurgeirsson B, Steingrímsson O. Risk factors associated with onychomycosis. J Eur Acad Dermatol Venereol. 2004;18:48-51.
- Vlahovic TC, Joseph WS. Efinaconazole topical, 10% for the treatment of toenail onychomycosis in patients with diabetes. J Drugs Dermatol. 2014;13:1186-1190.
- Rosen T. Evaluation of gender as a clinically relevant outcome variable in the treatment of onychomycosis with efinaconazole topical solution 10%. Cutis. 2015;96:197-201.
- Gupta AK, Paquet M. Placebo cure rates in the treatment of onychomycosis. J Am Podiatr Med Assoc. 2014;104:277-282.
Practice Points
- Onychomycosis is a common disease of importance in the increasing Latino population of the United States, especially due to predisposing factors such as obesity and diabetes mellitus. Specific data on the treatment of this patient population are lacking.
- Two large phase 3 studies with topical efinaconazole treatment included a notable number of Latino patients.
- Complete cure rates with efinaconazole in Latino participants were notably greater than those observed in the non-Latino population, and treatment was well tolerated in both groups.
- Treatment of onychomycosis is important to possibly prevent a more serious infectious disease involving the lower extremities, especially in those with comorbidities such as obesity, diabetes, and peripheral vascular disease.
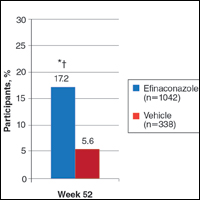
Can scribes boost FPs’ efficiency and job satisfaction?
ABSTRACT
Purpose Research in other medical specialties has shown that the addition of medical scribes to the clinical team enhances physicians’ practice experience and increases productivity. To date, literature on the implementation of scribes in primary care is limited. To determine the feasibility and benefits of implementing scribes in family medicine, we undertook a pilot mixed-method quality improvement (QI) study.
Methods In 2014, we incorporated 4 part-time scribes into an academic family medicine practice consisting of 7 physicians. We then measured, via survey and time-tracking data, the impact the scribes had on physician office hours and productivity, time spent on documentation, perceptions of work-life balance, and physician and patient satisfaction.
Results Six of the 7 faculty physicians participated. This study demonstrated that the use of scribes in a busy academic primary care practice substantially reduced the amount of time that family physicians spent on charting, improved work-life balance, and had good patient acceptance. Specifically, the physicians spent an average of 5.1 fewer hours/week (hrs/wk) on documentation, while various measures of productivity revealed increases ranging from 9.2% to 28.8%. Perhaps most important of all, when the results of the pilot study were annualized, they were projected to generate $168,600 per year—more than twice the $79,500 annual cost of 2 full-time equivalent scribes.
Surveys assessing work-life balance demonstrated improvement in the physicians’ perception of the administrative burden/paperwork related to practice and a decrease in their perception of the extent to which work encroached on their personal lives. In addition, survey data from 313 patients at the time of their ambulatory visit with a scribe present revealed a high level of comfort. Likewise, surveys completed by physicians after 55 clinical sessions (ie, blocks of consecutive, uninterrupted patient appointments; there are usually 2 sessions per day) revealed good to excellent ratings more than 90% of the time.
Conclusion In an outpatient family medicine clinic, the use of scribes substantially improved physicians’ efficiency, job satisfaction, and productivity without negatively impacting the patient experience.
While electronic medical records (EMRs) are important tools for improving patient care and communication, they bring with them an additional administrative burden for health care providers. In the emergency medicine literature, scribes have been reported to reduce that burden and improve clinicians’ productivity and satisfaction.1-4 Additionally, studies have reported increases in patient volume, generated billings, and provider morale, as well as decreases in emergency department (ED) lengths of stay.5 A recent review of the emergency medicine literature concluded that scribes have “the ability to allay the burden of documentation, improve throughput in the ED, and potentially enhance doctors’ satisfaction.”6
Similar benefits following scribe implementation have been reported in the literature of other specialties. A maternal-fetal medicine practice reported significant increases in generated billings and reimbursement.7 Increases in physician productivity and improvements in physician-patient interactions were reported in a cardiology clinic,8 and a urology practice reported high satisfaction and acceptance rates among both patients and physicians.9
Practice management literature and an article in The New York Times have anecdotally described the benefits of scribes in clinical practice10-12 with the latter noting that, “Physicians who use [scribes] say they feel liberated from the constant note-taking ...” and that “scribes have helped restore joy in the practice of medicine.”10
A small retrospective review that appeared in The Journal of Family Practice last year looked at the quality of scribes’ notes and found that they were rated slightly higher than physicians’ notes—at least for diabetes visits. However, it did not address the issues of physician productivity or satisfaction. (See "Medical scribes: How do their notes stack up?" 2016;65:155-159.)
The only family medicine study that we did find that addressed these 2 issues was one done in Oregon. The study noted that scribes enabled physicians to see 24 patients per day—up from 18, with accompanying improvements in physician “quality of life.”13 Absent from the literature are quantitative data on the feasibility and benefits of implementing scribes in family medicine.
Could a study at our facility offer some insights? In light of the paucity of published data on scribes in family medicine, and the fact that a survey conducted at our health center revealed that our faculty physicians felt overburdened by the administrative demands of clinical practice,14 we decided to study whether scribes might improve the work climate for clinicians at our family medicine residency training site. Our goal was to assess the impact of scribes on physician and patient satisfaction and on hours physicians spent on administrative tasks generated by clinical care.
METHODS
The study took place at the Barre Family Health Center (BFHC), a rural, freestanding family health center/residency site owned and operated by UMassMemorial Health Care (UMMHC), the major teaching/clinical affiliate of the University of Massachusetts Medical School. The health care providers of BFHC conduct 40,000 patient visits annually. Without scribes, the physicians typically dictated their notes at the end of the day, and they became available for review/sign off usually within 24 hours.
Six of the 7 faculty physicians working at BFHC in 2014 (including the lead author) participated in the pilot study (the seventh declined to participate). Three male and 3 female physicians between the ages of 34 and 65 years participated; they had been in practice between 5 and 40 years. All of the physicians had used an EMR for 5 years or more, and all but 2 had previously used a paper record. Residents and advanced practitioners did not participate because limited funding allowed for the hiring of only 2 full-time equivalent (FTE; 4 part-time) scribes.
Contracting for services. We contracted with an outside vendor for scribe services. Prior to their arrival at our health care center, the scribes received online training on medical vocabulary, note structure, billing and coding, and patient confidentiality (HIPAA). Once they arrived, on-site training detailed workflow, precharting, use of templates, the EMR and chart organization, and billing. In addition to typing notes into the EMR during patient visits, the scribes helped develop processes for scheduling, alerting patients to the scribe’s role, and defining when scribes should and should not be present in the exam room. The chief scribe created a monthly schedule, which enabled staff to determine which physician schedules should have extra appointment slots added. This was imperative because our parent institution mandated that new initiatives yield a 25% return on investment (ROI).
Using standard scripting and consent methods, nursing staff informed patients during rooming that the provider was working with a scribe, explained the scribe’s role, and asked about any objections to the scribe’s presence. Patients could decline scribe involvement, and all scribes were routinely excused during genital and rectal examinations.
Data collection
Data were collected during the 6-month trial period from May through October of 2014. The number of hours physicians spent at BFHC and at home working on clinical documentation was collected using a smartphone time-tracking application for two 3-week periods: the first period was in April 2014, before the scribes came on board; the second period was at the end of the 6-month scribe implementation period. In order to assess effects on productivity and whether the project was meeting the required ROI for continuation, we included a retrospective review of the EMR for both of the 3-week periods to document total clinical hours, number of clinic sessions (blocks of consecutive, uninterrupted appointments), average hours per session, the number of patient appointments scheduled per session, and the number of patient visits actually conducted per session (accounting for no-shows and unused appointments).
Physician work-life balance. We utilized 19 questions most relevant to this project’s focus from the 36-item Physician Work-Life Survey.15 Items were scored on a 5-point Likert scale ranging from ‘strongly disagree’ (1) to ‘strongly agree’ (5). The BFHC ambulatory manager distributed surveys to physicians immediately prior to the trial with scribes and 2 weeks after the conclusion of the 6-month trial.
Patient and provider satisfaction. During the 6-month intervention period, satisfaction surveys9 were distributed to patients by scribes at the end of the office visit and to physicians at the end of each scribed session, after notes were completed and reviewed. Patient surveys consisted of 6 closed-end questions regarding comfort level with the scribe in the exam room, willingness to have a scribe present for subsequent visits, importance of the scribe being the same gender/age as the patient, and overall satisfaction with the scribe’s presence (TABLE 1).
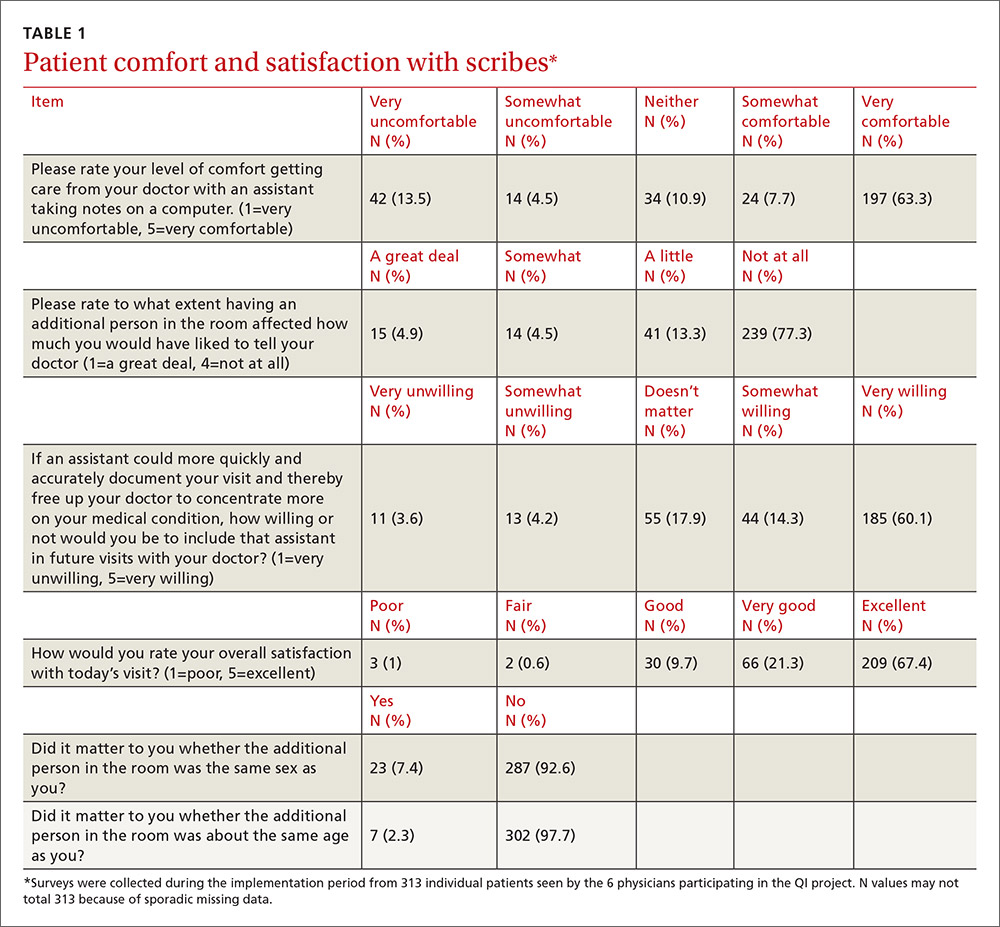
Physician surveys included 5 closed-end questions9 regarding comfort level with the scribe’s presence, ease of EMR documentation, change in office hours with having a scribe for that day’s session(s), and overall helpfulness of the scribe (TABLE 2). Open-ended questions on both surveys asked for additional comments or concerns regarding scribes and the scribe’s impact on patient encounters.
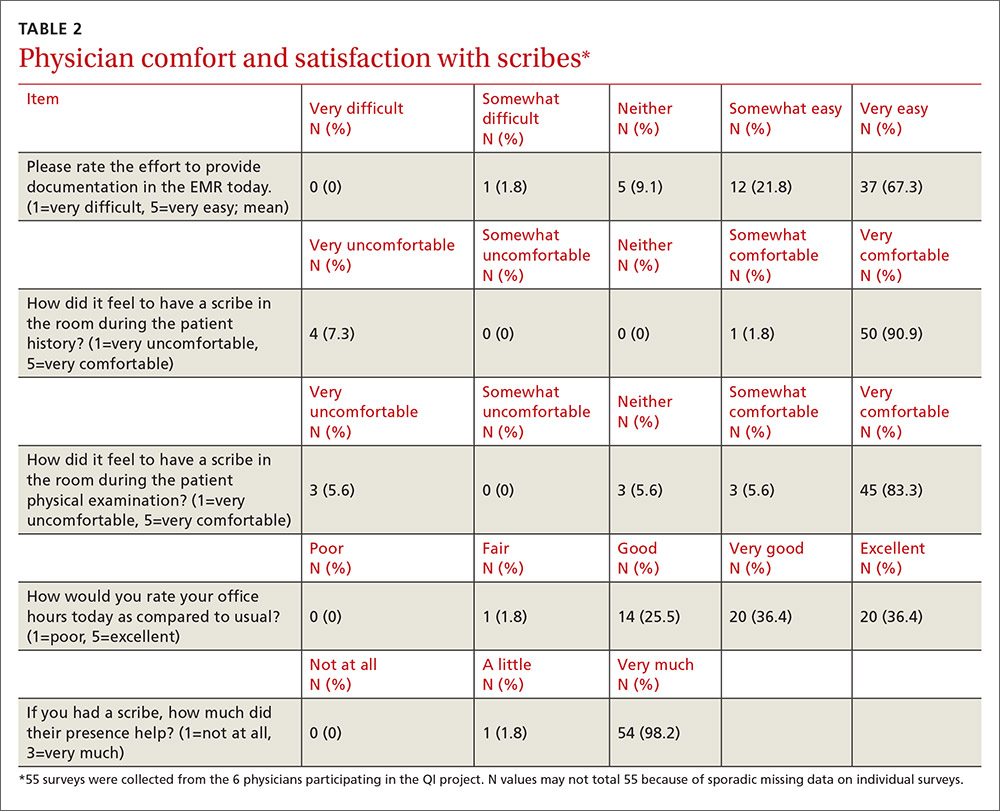
Our goal was to collect a minimum of 100 completed patient surveys and 50 completed physician surveys representing as many different patient demographics, visit types, days of the week, and times of day as possible. Surveys were anonymous and distributed during the second and third months of the trial, giving the scribes a one-month training and adjustment period.
Impact assessment, professional development needs. At the end of the 6-month study period, we held 2 focus groups—one with nurses and one with scribes. From the nurses, we solicited insights regarding the impact of scribes on patient volume, patient satisfaction, visit flow, and EMR documentation.
Scribes were asked about job skills needed, amount of training received, comfort in the exam room (both for themselves and patients), frequency of feedback received, balancing physician style with EMR documentation needs, and lessons learned.
Data analysis
Data were analyzed using the software SPSS V22.0. Univariate statistics were used to analyze patient and physician satisfaction, as well as clinic volume, time tracking, and EMR documentation. Initially, bivariate statistics were used to examine pre- and post-trial physician and patient data, but then non-parametric comparisons were used because of small sample sizes (and the resulting data being distributed abnormally). Detailed focus group notes were reviewed by all study investigators and summarized for dominant themes to support the quantitative evaluation. Lastly, the study was evaluated by the University of Massachusetts Institutional Review Board and was waived from review/oversight because of its QI intent.
RESULTS
Physician findings. Fifty-five physician surveys were completed during the 6-month period (TABLE 2). All of the physicians who were asked to complete this short survey at the end of the day (after reviewing notes with their scribe) did so. Physicians reported a high degree of satisfaction with collaboration with scribes. Their comments reflected positive experiences, including an improved ability to remain on schedule, having assistance finding important information in the record, and having notes completed at the end of the session.
TABLE 3 shows high satisfaction with clinical roles and colleagues with no substantive changes over time regarding these questions. However, the incorporation of scribes had a positive impact on issues related to physician morale, due to changes in paperwork, administrative duties, and work schedules.
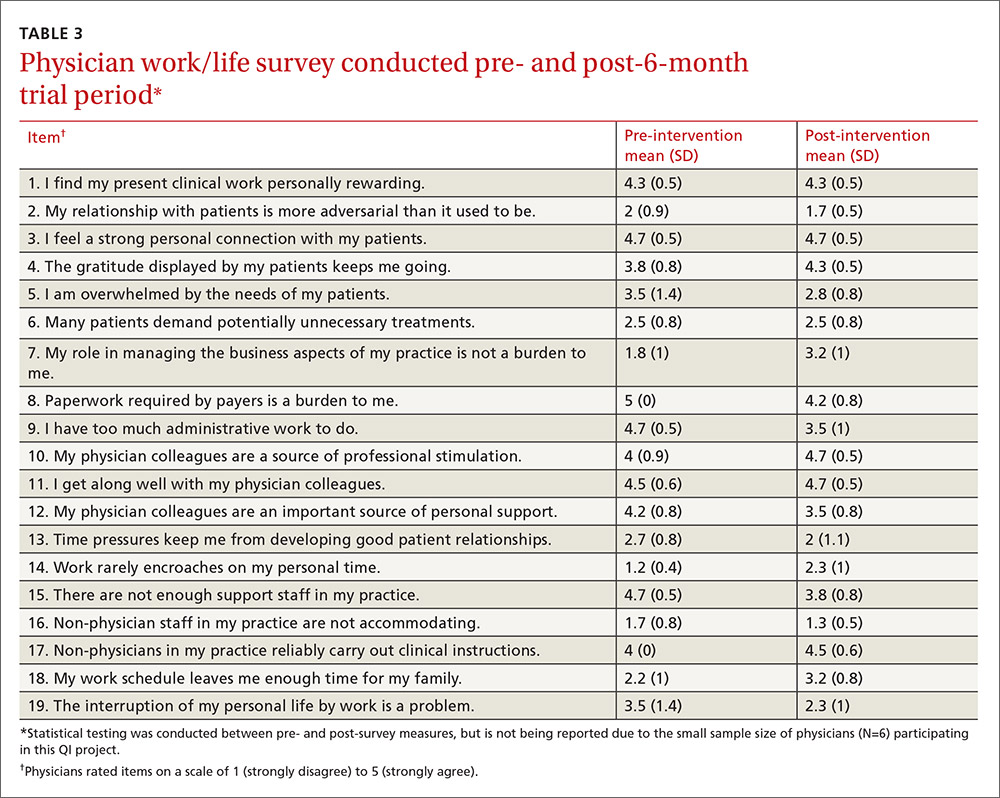
Review of patient scheduling and documentation (TABLE 4) revealed visits per clinical session increased 28.8% from 6.6 to 8.5, and for sessions with 10 or more appointment slots available, billable visits increased 9.2% from 8.7 to 9.5. This increase was a result of adding an additional appointment slot to the schedule when a scribe was assigned and a greater physician willingness to overbook when scribe assistance was available.
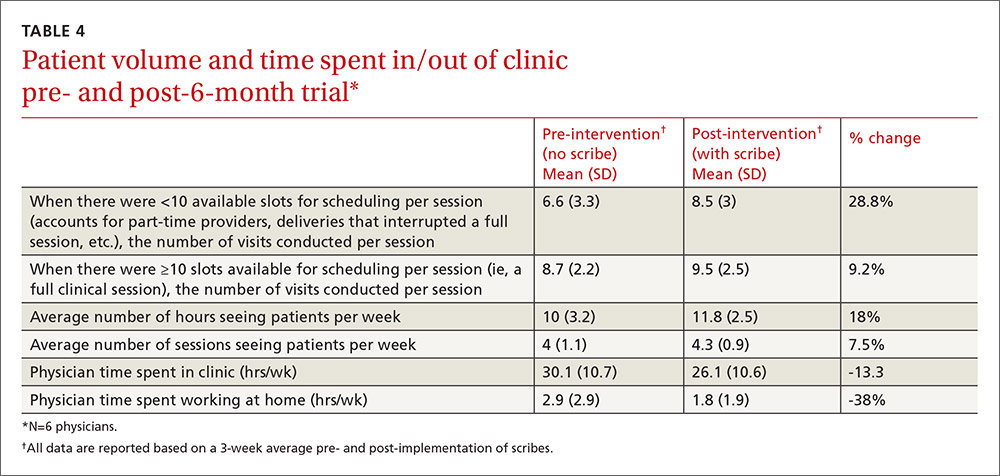
A comparison of time tracking pre- and post-intervention showed a 13% decrease in time spent in the clinic, from a 3-week average of 30.1 hrs/wk to 26.1 hrs/wk (TABLE 4). Time spent working at home decreased 38%, from a 3-week average of 2.9 hrs/wk to 1.8 hrs/wk. These reductions occurred despite average scheduled clinic hours being 18% higher (35.5 vs 30.1) during the post- vs pre-intervention measurement periods.
Patient findings. TABLE 1 summarizes the 313 patient responses. Less than 10% of patients declined to have a scribe during the visit. Patients reported a high level of comfort with the scribe and indicated that having a scribe in the room had little impact on what they would have liked to tell their doctor. Nearly all open-ended comments were positive and reflected feelings that the scribe’s presence enabled their provider to focus more on them and less on the computer.
Focus group findings
The scribe focus group identified a number of skills thought to be necessary to be successful in the job, including typing quickly; having technology/computer-searching strategy skills; and being detail-oriented, organized, and able to multitask. Scribes estimated that it took 2 to 6 weeks to feel comfortable doing the job. Physician feedback was preferred at the end of every session.
Lastly, the 4 scribes identified several challenges that should be addressed in future training, such as how to: 1. document a visit when the patient has a complicated medical history and the communication between the doctor and the patient is implicit; 2. incorporate the particulars of a visit into a patient’s full medical history; and 3. sift through the volume of previous notes when a physician has been seeing a patient for a long period of time.
The nurses’ focus group identified many positive effects on patient care. They reported no significant challenges with introducing scribes to patients. Improvements in timely availability of documentation enhanced their ability to respond quickly and more completely to patient queries. The nurses noted that the use of scribes improved patient care and made them “a better practice.”
DISCUSSION
This study demonstrated that the use of scribes in a busy academic primary care practice substantially reduced the amount of time that family practitioners spent on charting, improved work-life balance, and had good patient acceptance. Our time-tracking studies demonstrated that physicians spent 5.1 fewer hrs/wk working—4 fewer hrs/wk in the clinic, and 1.1 fewer hrs/wk outside of the clinic—while clinical hours and productivity per session increased. Patients reported high satisfaction with scribed visits and a willingness to have scribes in the future. Creating notes in real time and having immediate availability after the session was a plus for nursing staff in providing follow-up patient care.
Concerns by physicians that having another person in the room would alter the physician-patient relationship were not substantiated, perhaps because the staff routinely obtained consent and explained the scribe’s role. Consistent with previous work, we found no suggestion that a scribe’s presence affected patients’ willingness to discuss sensitive issues.9 Patients reacted positively to scribes who enabled physicians to focus more on the patient and less on charting.
Despite increased patient volume, physician morale improved. Physicians left work more than an hour earlier per day, on average, and spent over 1 hour less per week working on clinical documentation outside the office. Physician surveys showed an improvement in perceptions of how much work encroached on their personal life, consistent with the time-tracking data. These results have significant implications for clinician retention, productivity, and satisfaction.
Since our site is an academic training site, one might wonder how residents and advanced practitioners viewed this implementation, as they were not initially included. From the perspective of the administrators, this was a feasibility study. Clinicians who were not included understood that if this pilot was successful, the use of scribes would be expanded in the future. In fact, because of these positive results, our institution has expanded the scribe program, so that it now covers all clinical sessions for faculty in our center and is rolling out a similar program in 3 other departmental academic practices.
Financial implications. At the beginning of this initiative, our institution required that we cover the cost of the program plus generate a 25% ROI. Using a conservative 9.2% increase in billable visits, we extrapolated that utilizing 2 FTE scribes would result in an additional 860 visits annually. Per our hospital’s finance department, estimated revenue generated by our facility-based practice per visit is $196, including ancillaries. That means that additional visits would generate an estimated $168,600 annually—more than twice the $79,500 annual cost of 2 FTE scribes, yielding a 112% ROI. Furthermore, patient access improved by making more visits available. Beyond the positive direct ROI, the improvements in physician morale and work-life balance have positive implications for retention, likely substantially increasing the long-term, overall ROI.
Challenges. Implementing a new program in a large organization proved to be challenging. The biggest hurdle was convincing our institution’s administration and finance department that this new expense would pay for itself in both tangible (increased visits per session) and intangible (increased physician satisfaction and retention) ways. A cost-sharing arrangement proposed by our department’s administrator convinced hospital administration to move forward. Additional challenges included delays in getting the scribe program started because of vendor selection, purchasing new laptops for scribes, hiring and training scribes, developing new EMR templates, validating provider productivity, and legal/compliance approval of the scribe’s EMR documentation processes to meet third-party and accuracy/quality requirements—all taking longer than anticipated. However, we believe that our results indicate significant potential for other primary care practices.
Limitations. The number of physicians in the study was small, and they all worked in the same location. Social desirability could have biased patient and provider feedback, but our quantitative results were consistent with subjective assessments, suggesting that information bias potential was low. Patient and provider survey findings were also supported by qualitative assessments from both scribes and nursing staff. The size of the project did not lend itself to an analysis controlling for clustering by physician and/or scribe. The focus group discussions were not subject to rigorous qualitative analysis, potentially increasing the risk of biased interpretation. Lastly, we did not have the ability to directly compare sessions with and without scribes during the pilot.
Similarity to other findings. Despite these limitations, our findings are remarkably similar to those of Howard, et al,16 on the pilot implementation of scribes in a community health center, including good patient and clinician acceptance and increased productivity that more than offset the cost of the scribes. We expect that others implementing scribe services in primary care settings will experience similar results.
CORRESPONDENCE
Stephen T. Earls, MD, 151 Worcester Road, Barre, MA 01005; stephen.earls@umassmemorial.org.
ACKNOWLEDGEMENT
The authors gratefully acknowledge the assistance of Barbara Fisher, MBA, vice president for ambulatory services; Nicholas Comeau, BS; and Brenda Rivard, administrative lead, Barre Family Health Center, UMassMemorial Health Care, in the preparation and execution of this study.
1. Walker K, Ben-Meir M, O’Mullane P, et al. Scribes in an Australian private emergency department: a description of physician productivity. Emerg Med Australas. 2014;26:543-548.
2. Arya R, Salovich DM, Ohman-Strickland P, et al. Impact of scribes on performance indicators in the emergency department. Acad Emerg Med. 2010;17:490-494.
3. Expanded scribe role boosts staff morale. ED Manag. 2009;21:75-77.
4. Scribes, EMR please docs, save $600,000. ED Manag. 2009;21:117-118.
5. Bastani A, Shaqiri B, Palomba K, et al. An ED scribe program is able to improve throughput time and patient satisfaction. Am J Emerg Med. 2014;32:399-402.
6. Cabilan CJ, Eley RM. Review article: potential of medical scribes to allay the burden of documentation and enhance efficiency in Australian emergency departments. Emerg Med Australas. 2015 Aug 13. [Epub ahead of print]
7. Hegstrom L, Leslie J, Hutchinson E, et al. Medical scribes: are scribe programs cost effective in an outpatient MFM setting? Am J Obstet Gynecol. 2013;208:S240.
8. Campbell LL, Case D, Crocker JE, et al. Using medical scribes in a physician practice. J AHIMA. 2012;83:64-69.
9. Koshy S, Feustel PJ, Hong M, et al. Scribes in an ambulatory urology practice: patient and physician satisfaction. J Urol. 2010;184:258-262.
10. Hafner K. A busy doctor’s right hand, ever ready to type. The New York Times. January 12, 2014. Available at: https://www.nytimes.com/2014/01/14/health/a-busy-doctors-right-hand-ever-ready-to-type.html?_r=0. Accessed February 6, 2017.
11. Brady K, Shariff A. Virtual medical scribes: making electronic medical records work for you. J Med Pract Manage. 2013;29:133-136.
12. Baugh R, Jones JE, Troff K, et al. Medical scribes. J Med Pract Manage. 2012;28:195-197.
13. Grimshaw H. Physician scribes improve productivity. Oak Street Medical allows doctors to spend more face time with patients, improve job satisfaction. MGMA Connex. 2012;12:27-28.
14. Morehead Associates, Inc. UMassMemorial Health Care: Physician Satisfaction Survey. 2013.
15. Konrad TR, Williams ES, Linzer M, et al. Measuring physician job satisfaction in a changing workplace and challenging environment. SGIM Career Satisfaction Study Group. Society of General Internal Medicine. Med Care. 1999;37:1174-1182.
16. Howard KA, Helé K, Salibi N, et al. BTW Informing change. Blue Shield of California Foundation. Adapting the EHR scribe model to community health centers: the experience of Shasta Community Health Center’s pilot. Available at: http://informingchange.com/cat-publications/adapting-the-ehr-scribe-model-to-community-health-centers-the-experience-of-shasta-community-health-centers-pilot. Accessed November 6, 2015.
ABSTRACT
Purpose Research in other medical specialties has shown that the addition of medical scribes to the clinical team enhances physicians’ practice experience and increases productivity. To date, literature on the implementation of scribes in primary care is limited. To determine the feasibility and benefits of implementing scribes in family medicine, we undertook a pilot mixed-method quality improvement (QI) study.
Methods In 2014, we incorporated 4 part-time scribes into an academic family medicine practice consisting of 7 physicians. We then measured, via survey and time-tracking data, the impact the scribes had on physician office hours and productivity, time spent on documentation, perceptions of work-life balance, and physician and patient satisfaction.
Results Six of the 7 faculty physicians participated. This study demonstrated that the use of scribes in a busy academic primary care practice substantially reduced the amount of time that family physicians spent on charting, improved work-life balance, and had good patient acceptance. Specifically, the physicians spent an average of 5.1 fewer hours/week (hrs/wk) on documentation, while various measures of productivity revealed increases ranging from 9.2% to 28.8%. Perhaps most important of all, when the results of the pilot study were annualized, they were projected to generate $168,600 per year—more than twice the $79,500 annual cost of 2 full-time equivalent scribes.
Surveys assessing work-life balance demonstrated improvement in the physicians’ perception of the administrative burden/paperwork related to practice and a decrease in their perception of the extent to which work encroached on their personal lives. In addition, survey data from 313 patients at the time of their ambulatory visit with a scribe present revealed a high level of comfort. Likewise, surveys completed by physicians after 55 clinical sessions (ie, blocks of consecutive, uninterrupted patient appointments; there are usually 2 sessions per day) revealed good to excellent ratings more than 90% of the time.
Conclusion In an outpatient family medicine clinic, the use of scribes substantially improved physicians’ efficiency, job satisfaction, and productivity without negatively impacting the patient experience.
While electronic medical records (EMRs) are important tools for improving patient care and communication, they bring with them an additional administrative burden for health care providers. In the emergency medicine literature, scribes have been reported to reduce that burden and improve clinicians’ productivity and satisfaction.1-4 Additionally, studies have reported increases in patient volume, generated billings, and provider morale, as well as decreases in emergency department (ED) lengths of stay.5 A recent review of the emergency medicine literature concluded that scribes have “the ability to allay the burden of documentation, improve throughput in the ED, and potentially enhance doctors’ satisfaction.”6
Similar benefits following scribe implementation have been reported in the literature of other specialties. A maternal-fetal medicine practice reported significant increases in generated billings and reimbursement.7 Increases in physician productivity and improvements in physician-patient interactions were reported in a cardiology clinic,8 and a urology practice reported high satisfaction and acceptance rates among both patients and physicians.9
Practice management literature and an article in The New York Times have anecdotally described the benefits of scribes in clinical practice10-12 with the latter noting that, “Physicians who use [scribes] say they feel liberated from the constant note-taking ...” and that “scribes have helped restore joy in the practice of medicine.”10
A small retrospective review that appeared in The Journal of Family Practice last year looked at the quality of scribes’ notes and found that they were rated slightly higher than physicians’ notes—at least for diabetes visits. However, it did not address the issues of physician productivity or satisfaction. (See "Medical scribes: How do their notes stack up?" 2016;65:155-159.)
The only family medicine study that we did find that addressed these 2 issues was one done in Oregon. The study noted that scribes enabled physicians to see 24 patients per day—up from 18, with accompanying improvements in physician “quality of life.”13 Absent from the literature are quantitative data on the feasibility and benefits of implementing scribes in family medicine.
Could a study at our facility offer some insights? In light of the paucity of published data on scribes in family medicine, and the fact that a survey conducted at our health center revealed that our faculty physicians felt overburdened by the administrative demands of clinical practice,14 we decided to study whether scribes might improve the work climate for clinicians at our family medicine residency training site. Our goal was to assess the impact of scribes on physician and patient satisfaction and on hours physicians spent on administrative tasks generated by clinical care.
METHODS
The study took place at the Barre Family Health Center (BFHC), a rural, freestanding family health center/residency site owned and operated by UMassMemorial Health Care (UMMHC), the major teaching/clinical affiliate of the University of Massachusetts Medical School. The health care providers of BFHC conduct 40,000 patient visits annually. Without scribes, the physicians typically dictated their notes at the end of the day, and they became available for review/sign off usually within 24 hours.
Six of the 7 faculty physicians working at BFHC in 2014 (including the lead author) participated in the pilot study (the seventh declined to participate). Three male and 3 female physicians between the ages of 34 and 65 years participated; they had been in practice between 5 and 40 years. All of the physicians had used an EMR for 5 years or more, and all but 2 had previously used a paper record. Residents and advanced practitioners did not participate because limited funding allowed for the hiring of only 2 full-time equivalent (FTE; 4 part-time) scribes.
Contracting for services. We contracted with an outside vendor for scribe services. Prior to their arrival at our health care center, the scribes received online training on medical vocabulary, note structure, billing and coding, and patient confidentiality (HIPAA). Once they arrived, on-site training detailed workflow, precharting, use of templates, the EMR and chart organization, and billing. In addition to typing notes into the EMR during patient visits, the scribes helped develop processes for scheduling, alerting patients to the scribe’s role, and defining when scribes should and should not be present in the exam room. The chief scribe created a monthly schedule, which enabled staff to determine which physician schedules should have extra appointment slots added. This was imperative because our parent institution mandated that new initiatives yield a 25% return on investment (ROI).
Using standard scripting and consent methods, nursing staff informed patients during rooming that the provider was working with a scribe, explained the scribe’s role, and asked about any objections to the scribe’s presence. Patients could decline scribe involvement, and all scribes were routinely excused during genital and rectal examinations.
Data collection
Data were collected during the 6-month trial period from May through October of 2014. The number of hours physicians spent at BFHC and at home working on clinical documentation was collected using a smartphone time-tracking application for two 3-week periods: the first period was in April 2014, before the scribes came on board; the second period was at the end of the 6-month scribe implementation period. In order to assess effects on productivity and whether the project was meeting the required ROI for continuation, we included a retrospective review of the EMR for both of the 3-week periods to document total clinical hours, number of clinic sessions (blocks of consecutive, uninterrupted appointments), average hours per session, the number of patient appointments scheduled per session, and the number of patient visits actually conducted per session (accounting for no-shows and unused appointments).
Physician work-life balance. We utilized 19 questions most relevant to this project’s focus from the 36-item Physician Work-Life Survey.15 Items were scored on a 5-point Likert scale ranging from ‘strongly disagree’ (1) to ‘strongly agree’ (5). The BFHC ambulatory manager distributed surveys to physicians immediately prior to the trial with scribes and 2 weeks after the conclusion of the 6-month trial.
Patient and provider satisfaction. During the 6-month intervention period, satisfaction surveys9 were distributed to patients by scribes at the end of the office visit and to physicians at the end of each scribed session, after notes were completed and reviewed. Patient surveys consisted of 6 closed-end questions regarding comfort level with the scribe in the exam room, willingness to have a scribe present for subsequent visits, importance of the scribe being the same gender/age as the patient, and overall satisfaction with the scribe’s presence (TABLE 1).
Physician surveys included 5 closed-end questions9 regarding comfort level with the scribe’s presence, ease of EMR documentation, change in office hours with having a scribe for that day’s session(s), and overall helpfulness of the scribe (TABLE 2). Open-ended questions on both surveys asked for additional comments or concerns regarding scribes and the scribe’s impact on patient encounters.
Our goal was to collect a minimum of 100 completed patient surveys and 50 completed physician surveys representing as many different patient demographics, visit types, days of the week, and times of day as possible. Surveys were anonymous and distributed during the second and third months of the trial, giving the scribes a one-month training and adjustment period.
Impact assessment, professional development needs. At the end of the 6-month study period, we held 2 focus groups—one with nurses and one with scribes. From the nurses, we solicited insights regarding the impact of scribes on patient volume, patient satisfaction, visit flow, and EMR documentation.
Scribes were asked about job skills needed, amount of training received, comfort in the exam room (both for themselves and patients), frequency of feedback received, balancing physician style with EMR documentation needs, and lessons learned.
Data analysis
Data were analyzed using the software SPSS V22.0. Univariate statistics were used to analyze patient and physician satisfaction, as well as clinic volume, time tracking, and EMR documentation. Initially, bivariate statistics were used to examine pre- and post-trial physician and patient data, but then non-parametric comparisons were used because of small sample sizes (and the resulting data being distributed abnormally). Detailed focus group notes were reviewed by all study investigators and summarized for dominant themes to support the quantitative evaluation. Lastly, the study was evaluated by the University of Massachusetts Institutional Review Board and was waived from review/oversight because of its QI intent.
RESULTS
Physician findings. Fifty-five physician surveys were completed during the 6-month period (TABLE 2). All of the physicians who were asked to complete this short survey at the end of the day (after reviewing notes with their scribe) did so. Physicians reported a high degree of satisfaction with collaboration with scribes. Their comments reflected positive experiences, including an improved ability to remain on schedule, having assistance finding important information in the record, and having notes completed at the end of the session.
TABLE 3 shows high satisfaction with clinical roles and colleagues with no substantive changes over time regarding these questions. However, the incorporation of scribes had a positive impact on issues related to physician morale, due to changes in paperwork, administrative duties, and work schedules.
Review of patient scheduling and documentation (TABLE 4) revealed visits per clinical session increased 28.8% from 6.6 to 8.5, and for sessions with 10 or more appointment slots available, billable visits increased 9.2% from 8.7 to 9.5. This increase was a result of adding an additional appointment slot to the schedule when a scribe was assigned and a greater physician willingness to overbook when scribe assistance was available.
A comparison of time tracking pre- and post-intervention showed a 13% decrease in time spent in the clinic, from a 3-week average of 30.1 hrs/wk to 26.1 hrs/wk (TABLE 4). Time spent working at home decreased 38%, from a 3-week average of 2.9 hrs/wk to 1.8 hrs/wk. These reductions occurred despite average scheduled clinic hours being 18% higher (35.5 vs 30.1) during the post- vs pre-intervention measurement periods.
Patient findings. TABLE 1 summarizes the 313 patient responses. Less than 10% of patients declined to have a scribe during the visit. Patients reported a high level of comfort with the scribe and indicated that having a scribe in the room had little impact on what they would have liked to tell their doctor. Nearly all open-ended comments were positive and reflected feelings that the scribe’s presence enabled their provider to focus more on them and less on the computer.
Focus group findings
The scribe focus group identified a number of skills thought to be necessary to be successful in the job, including typing quickly; having technology/computer-searching strategy skills; and being detail-oriented, organized, and able to multitask. Scribes estimated that it took 2 to 6 weeks to feel comfortable doing the job. Physician feedback was preferred at the end of every session.
Lastly, the 4 scribes identified several challenges that should be addressed in future training, such as how to: 1. document a visit when the patient has a complicated medical history and the communication between the doctor and the patient is implicit; 2. incorporate the particulars of a visit into a patient’s full medical history; and 3. sift through the volume of previous notes when a physician has been seeing a patient for a long period of time.
The nurses’ focus group identified many positive effects on patient care. They reported no significant challenges with introducing scribes to patients. Improvements in timely availability of documentation enhanced their ability to respond quickly and more completely to patient queries. The nurses noted that the use of scribes improved patient care and made them “a better practice.”
DISCUSSION
This study demonstrated that the use of scribes in a busy academic primary care practice substantially reduced the amount of time that family practitioners spent on charting, improved work-life balance, and had good patient acceptance. Our time-tracking studies demonstrated that physicians spent 5.1 fewer hrs/wk working—4 fewer hrs/wk in the clinic, and 1.1 fewer hrs/wk outside of the clinic—while clinical hours and productivity per session increased. Patients reported high satisfaction with scribed visits and a willingness to have scribes in the future. Creating notes in real time and having immediate availability after the session was a plus for nursing staff in providing follow-up patient care.
Concerns by physicians that having another person in the room would alter the physician-patient relationship were not substantiated, perhaps because the staff routinely obtained consent and explained the scribe’s role. Consistent with previous work, we found no suggestion that a scribe’s presence affected patients’ willingness to discuss sensitive issues.9 Patients reacted positively to scribes who enabled physicians to focus more on the patient and less on charting.
Despite increased patient volume, physician morale improved. Physicians left work more than an hour earlier per day, on average, and spent over 1 hour less per week working on clinical documentation outside the office. Physician surveys showed an improvement in perceptions of how much work encroached on their personal life, consistent with the time-tracking data. These results have significant implications for clinician retention, productivity, and satisfaction.
Since our site is an academic training site, one might wonder how residents and advanced practitioners viewed this implementation, as they were not initially included. From the perspective of the administrators, this was a feasibility study. Clinicians who were not included understood that if this pilot was successful, the use of scribes would be expanded in the future. In fact, because of these positive results, our institution has expanded the scribe program, so that it now covers all clinical sessions for faculty in our center and is rolling out a similar program in 3 other departmental academic practices.
Financial implications. At the beginning of this initiative, our institution required that we cover the cost of the program plus generate a 25% ROI. Using a conservative 9.2% increase in billable visits, we extrapolated that utilizing 2 FTE scribes would result in an additional 860 visits annually. Per our hospital’s finance department, estimated revenue generated by our facility-based practice per visit is $196, including ancillaries. That means that additional visits would generate an estimated $168,600 annually—more than twice the $79,500 annual cost of 2 FTE scribes, yielding a 112% ROI. Furthermore, patient access improved by making more visits available. Beyond the positive direct ROI, the improvements in physician morale and work-life balance have positive implications for retention, likely substantially increasing the long-term, overall ROI.
Challenges. Implementing a new program in a large organization proved to be challenging. The biggest hurdle was convincing our institution’s administration and finance department that this new expense would pay for itself in both tangible (increased visits per session) and intangible (increased physician satisfaction and retention) ways. A cost-sharing arrangement proposed by our department’s administrator convinced hospital administration to move forward. Additional challenges included delays in getting the scribe program started because of vendor selection, purchasing new laptops for scribes, hiring and training scribes, developing new EMR templates, validating provider productivity, and legal/compliance approval of the scribe’s EMR documentation processes to meet third-party and accuracy/quality requirements—all taking longer than anticipated. However, we believe that our results indicate significant potential for other primary care practices.
Limitations. The number of physicians in the study was small, and they all worked in the same location. Social desirability could have biased patient and provider feedback, but our quantitative results were consistent with subjective assessments, suggesting that information bias potential was low. Patient and provider survey findings were also supported by qualitative assessments from both scribes and nursing staff. The size of the project did not lend itself to an analysis controlling for clustering by physician and/or scribe. The focus group discussions were not subject to rigorous qualitative analysis, potentially increasing the risk of biased interpretation. Lastly, we did not have the ability to directly compare sessions with and without scribes during the pilot.
Similarity to other findings. Despite these limitations, our findings are remarkably similar to those of Howard, et al,16 on the pilot implementation of scribes in a community health center, including good patient and clinician acceptance and increased productivity that more than offset the cost of the scribes. We expect that others implementing scribe services in primary care settings will experience similar results.
CORRESPONDENCE
Stephen T. Earls, MD, 151 Worcester Road, Barre, MA 01005; stephen.earls@umassmemorial.org.
ACKNOWLEDGEMENT
The authors gratefully acknowledge the assistance of Barbara Fisher, MBA, vice president for ambulatory services; Nicholas Comeau, BS; and Brenda Rivard, administrative lead, Barre Family Health Center, UMassMemorial Health Care, in the preparation and execution of this study.
1. Walker K, Ben-Meir M, O’Mullane P, et al. Scribes in an Australian private emergency department: a description of physician productivity. Emerg Med Australas. 2014;26:543-548.
2. Arya R, Salovich DM, Ohman-Strickland P, et al. Impact of scribes on performance indicators in the emergency department. Acad Emerg Med. 2010;17:490-494.
3. Expanded scribe role boosts staff morale. ED Manag. 2009;21:75-77.
4. Scribes, EMR please docs, save $600,000. ED Manag. 2009;21:117-118.
5. Bastani A, Shaqiri B, Palomba K, et al. An ED scribe program is able to improve throughput time and patient satisfaction. Am J Emerg Med. 2014;32:399-402.
6. Cabilan CJ, Eley RM. Review article: potential of medical scribes to allay the burden of documentation and enhance efficiency in Australian emergency departments. Emerg Med Australas. 2015 Aug 13. [Epub ahead of print]
7. Hegstrom L, Leslie J, Hutchinson E, et al. Medical scribes: are scribe programs cost effective in an outpatient MFM setting? Am J Obstet Gynecol. 2013;208:S240.
8. Campbell LL, Case D, Crocker JE, et al. Using medical scribes in a physician practice. J AHIMA. 2012;83:64-69.
9. Koshy S, Feustel PJ, Hong M, et al. Scribes in an ambulatory urology practice: patient and physician satisfaction. J Urol. 2010;184:258-262.
10. Hafner K. A busy doctor’s right hand, ever ready to type. The New York Times. January 12, 2014. Available at: https://www.nytimes.com/2014/01/14/health/a-busy-doctors-right-hand-ever-ready-to-type.html?_r=0. Accessed February 6, 2017.
11. Brady K, Shariff A. Virtual medical scribes: making electronic medical records work for you. J Med Pract Manage. 2013;29:133-136.
12. Baugh R, Jones JE, Troff K, et al. Medical scribes. J Med Pract Manage. 2012;28:195-197.
13. Grimshaw H. Physician scribes improve productivity. Oak Street Medical allows doctors to spend more face time with patients, improve job satisfaction. MGMA Connex. 2012;12:27-28.
14. Morehead Associates, Inc. UMassMemorial Health Care: Physician Satisfaction Survey. 2013.
15. Konrad TR, Williams ES, Linzer M, et al. Measuring physician job satisfaction in a changing workplace and challenging environment. SGIM Career Satisfaction Study Group. Society of General Internal Medicine. Med Care. 1999;37:1174-1182.
16. Howard KA, Helé K, Salibi N, et al. BTW Informing change. Blue Shield of California Foundation. Adapting the EHR scribe model to community health centers: the experience of Shasta Community Health Center’s pilot. Available at: http://informingchange.com/cat-publications/adapting-the-ehr-scribe-model-to-community-health-centers-the-experience-of-shasta-community-health-centers-pilot. Accessed November 6, 2015.