Important changes to the guidelines clarify the use of antiretroviral therapies and the treatment options for patients who experience virologic failure to first- and second-line regimen failures.
On April 8, 2015, HSS released updated HIV treatment guidelines.1 The original 1998 guidelines for the use of antiretroviral agents for treating adults and adolescents infected with HIV emphasized the benefit of potent combination antiretroviral therapies (ARTs) that included protease inhibitors (PIs).2,3 Since then there have been more than 25 HSS guidelines focusing primarily on when to initiate ART and which ART to prescribe. The question of when to start ART had been controversial, but the most recently issued guidelines have addressed this question. For the first time, HSS recommends ART for all individuals infected with HIV regardless of CD4+ T-cell count.1 The timely initiation of effective ART with an associated reduction in HIV viremia benefits patients infected with HIV and substantially decreases transmission of HIV to uninfected sexual partners.3
Three large, international randomized placebo-controlled studies conducted between 2002 and 2015 provide evidence that the benefits of ART outweigh the potential deleterious effects of long-term ART. The Strategies for Management of Antiretroviral Therapy (SMART) was the first published study in this trifecta.4,5 Given concern about the adverse effects (AEs) of ART, particularly PIs, this study was designed to investigate whether long-term ART was associated with more toxicities than was deferred therapy, determined by CD4+ cell counts. The study was halted prematurely, because the risk of death or grade-4 toxicity was statistically greater among those receiving episodic ART than among those on continuous therapy. The SMART trial demonstrated that ART therapy was beneficial, but it did not determine when to initiate ART, particularly in asymptomatic persons.5
It was thought that the risk of transmission of HIV through sexual contact or shared drug paraphernalia was significantly lower for patients on ART who achieve viral suppression compared with those with uncontrolled viremia. The HIV Prevention Trials Network study enrolled HIV-serodiscordant couples to examine transmission of HIV. The trial compared HIV-positive patients who initiated ART when their CD4+ cell count was between 350 to 550 cells/mm3 with patients who began therapy when their CD4+ cell count was < 250 cells/mm3 or when an AIDS-defining illness was diagnosed. The difference in the rate of transmission to a HIV-negative partner was dramatic. The rate was 96% less among those in the early-therapy group vs those in the deferred-therapy group. In addition, there was a 40% reduction in the progression of HIV-related disease in the participants randomized to the early-therapy group.6
In March 2011, the International Network for Strategic Initiatives in Global HIV Trials (INSIGHT), which conducted SMART, initiated the Strategic Timing of AntiRetroviral Treatment (START) study to define the optimal time to begin ART among asymptomatic patients with a CD4+ count of > 350 cells/mm3. Patients with a CD4+ cell count of > 500 cells/mm3 were randomized to either initiate ART, or defer ART until the CD4+ cell count fell to < 350 cells/mm3 or until an AIDS-defining illness occurred.7 On May 15, 2015, the study was terminated early. Based on an interim analysis, the data safety and monitoring board announced that the risk for a serious AIDS-related event, serious non-AIDS-related event, or death from any cause was 57% less in the early treatment group. When compared with patients who delayed ART, for those on ART, serious AIDS-related events were reduced 72%, and serious non-AIDS events were reduced 39%.8 A similar study conducted in the Ivory Coast from March 2008 to January 2015 also favored early rather than deferred ART.9
Experience in clinical practice, these landmark clinical trials, and several cohort studies served as the basis of the changes in the new HSS guidelines that endorse ART for all HIV-infected persons. The World Health Organization (WHO) has recently published similar guidelines.10 It is yet to be determined whether the guidelines have been implemented successfully. Nonetheless, for both the clinician and the patient where access to ongoing care and ART are available, the new guidelines greatly simplify the treatment choices.
What's New in the Guidelines?
The Guidelines for the Use of Antiretroviral Agents in HIV-Infected Adults and Adolescents presents significant changes in several of the tables that are most clinically useful, including Tables 6, 7, and 8.1 Table 6 presents recommended, alternative, and other antiretroviral regimen options. The guidelines also added new tables describing antiretroviral regimen considerations for initial therapy and the mechanisms of antiretroviral-associated drug interactions.
Initial Combination Regimens for the Antiretroviral-Naïve Patient
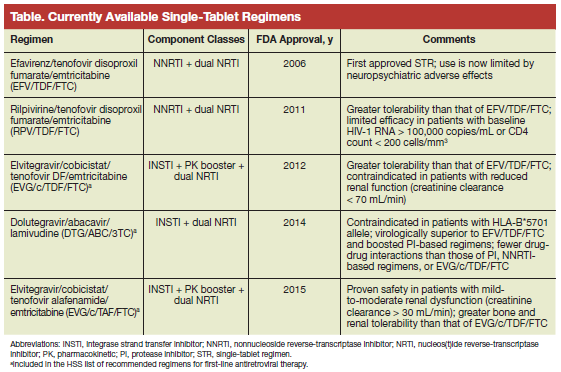
Five regimens are now recommended for ART-naïve patients: 4 are integrase strand transfer inhibitor-based regimens, and 1 is a ritonavir-boosted PI-based regimen (Table 1). A nonnucleoside reverse transcriptase inhibitor-based regimen is no longer recommended. The guidelines include regimens that are now considered less favorable for a variety of reasons, including reduced virologic activity and greater risk of toxicities, higher pill burden, and more potential drug interactions. Several regimens that have been widely used are now included in this latter option, in particular efavirenz plus abacavir/lamivudine (3TC), lopinavir/ritonavir plus abacavir (ABC)/3TC, and tenofovir fumarate (TDF)/emtricitabine (FTC).
The most significant change in the guideline is the reclassification of efavirenz from a recommended to an alternative therapy. The principal reasons for this change are central nervous system (CNS) AEs, which can include depression and a reported 2-fold increase in the risk of suicide or suicidal ideation.11
In November 2015, the FDA approved Genvoya, a once-daily, fixed-dose combination tablet containing elvitegravir, cobicistat, FTC, and tenofovir alafenamide (TAF).12 With this approval, there are now 5 once-daily HIV treatment options. This new drug is similar to elvitegravir/cobicistat/TDF/FTC, but it substitutes TAF for TDF. The benefits of this substitution include less bone loss and decreased renal toxicity.13-15 Genvoya may be prescribed in patients with a 30 mL/min creatinine clearance. The TAF-containing once-daily formulation achieves higher intracellular levels and lower blood levels of TAF. Therefore, the cholesterol-lowering benefits are less than those of the TDF-containing alternative.
In the 2015 guidelines, Table 7 provides concise guidance on the selection of an ART regimen based on patient and regimen characteristics, including food-based AEs; the presence of other medical and/or psychiatric conditions; and the presence of co-infections, including hepatitis B virus (HBV), hepatitis C virus (HCV), and tuberculosis.1 In addition, Table 8 outlines the advantages and disadvantages of the different classes of ART.1 For example, dolutegravir may have a higher barrier to resistance than that of elvitegravir or raltegravir.16 It is now possible for those living with HIV to have ongoing viral suppression, which will not only improve their lives, but also decrease the risk of HIV transmission to sexual partners. Starting from the time of diagnosis, achieving viral suppression is dependent on a link to care with initiation of ART and retention in care. The 5 once-daily options should improve adherence. The infrastructure to ensure lifelong retention in care, medication availability, and adherence still poses many challenges.
Treatment-Experienced Patients
The guidelines were updated to include more direction on virologic failure to a first-line regimen as well as a second-line regimen failure or beyond. It includes a discussion of treatment options for achieving full virologic suppression. There also are treatment recommendations for patients with multidrug viral resistance in whom maximal viral suppression may not be achieved. For such patients, ART should be continued to preserve immunologic function, lessen clinical progression, and minimize resistance to drug classes that could include new efficacious drugs.17,18
There is also a discussion in the guidelines of the issues surrounding isolated CNS virologic failure and the onset of new neurologic symptoms. With CNS virologic failure, magnetic resonance brain imaging may be abnormal with a lymphocytic pleocytosis in the cerebrospinal fluid (CSF). If available to guide therapy, CSF HIV RNA should be measured, and HIV drug resistance in the CSF should be tested. Central nervous system viral escape should be differentiated from other CNS conditions, such as herpes zoster infection; incidental mild CSF HIV RNA increases; or the now relatively common but chronic neurocognitive impairment seen with HIV infection.19,20
Poor CD4+ Recovery and Persistent Inflammation Despite Viral Suppression
For patients on ART who achieve viral suppression but fail to have a significant increase in CD4+ cell count over time (particularly for the patient with a CD4+ cell count < 200 cells/mm3), the guidelines do not endorse additional ARTs or switching the regimen. However, there may be an increased risk of non-AIDS mortality and morbidity, including cardiovascular disease. For such patients, interleukin-2 adjunctive therapy has no demonstrated clinical benefit.21 Interleukin-7 and recombinant human growth hormone should be used only as part of a clinical trial.
It is now evident that immune activation and inflammation, although lessened, persist despite ART-mediated viral suppression.22,23 There is no recommendation to monitor markers of immune activation and inflammation. Efforts should focus on risk factor modifications, such as smoking cessation, improved diet, treatment of alcohol abuse and dependence, regular exercise, and maintenance of appropriate weight. Emphasis should be on treating chronic comorbidities, such as hypertension, diabetes, osteoporosis, and hyperlipidemia.
HIV/HCV Co-infection
According to the WHO, 130 to 150 million people worldwide have chronic HCV infection.24 In the U.S., it is estimated that up to one-quarter of HIV-infected persons have HCV co-infection.25 With the currently available oral direct-acting agents (DAAs) for the treatment of chronic HCV infection in patients with HIV/HCV co-infection, rates of sustained virologic response to treatment are comparable in patients with HIV/HCV co-infection with those of patients with HCV monoinfection.26 Accordingly, all HIV-infected patients should be screened for HCV infection, and HIV ART should not be deferred for most patients.
For patients with a CD4+ cell count of < 200 cells/mm3, treatment of HCV should be deferred until the patients are on a stable and effective ART regimen. Whereas for those with a CD4+ cell count > 500 cells/mm3, HCV can be treated before initiating HIV ART. When initiating HCV therapy, clinicians must pay attention to drug-drug interactions. Patients with cirrhosis are particularly at risk. The most recent guidelines for the treatment of HCV co-infection should be reviewed when selecting a DAA to treat HCV.27 Many patients are now being treated successfully for HCV co-infection. Extending such therapy to all patients with HIV/HCV co-infection for whom treatment is appropriate should be a priority for clinicians, insurance providers, and policy makers.
Drug Interactions
Given the availability of numerous once-daily ART regimens, prescribing ART has been greatly simplified. Nonetheless, there are many pharmacokinetic drug-drug interactions between antiretroviral drugs and concomitant medications. When changing either the ART or adding or changing other medications, the clinician must always pay attention to potential drug-drug interactions. Consideration must be given to the interaction with drugs that affect antiretroviral absorption—particularly, acid-reducing agents and products that contain polyvalent cations, including calcium and magnesium.
When antiretrovirals that undergo hepatic metabolism are given with other drugs that also are metabolized by the cytochrome P450 enzyme system or other hepatic enzymes, the levels of antiretrovirals or other drug may be significantly increased or decreased.1 The 2 booster—cobicistat and ritonavir—used to increase certain antiretrovirals levels also may alter the metabolism of other drugs.28,29 The new guidelines contain updated and detailed tables on drug-drug interactions. Given the comorbid conditions, particularly among those aging with HIV, polypharmacy is an increasingly common concern. It is essential for clinicians to work with knowledgeable HIV pharmacists to ensure the correct and safe prescribing of all medications.
HIV/AIDS Demographics in U.S.
Of the more than 1.2 million people aged > 13 years in the U.S. living with HIV, about 1 in 8 are unaware of their infection.30 The Centers for Disease Control and Prevention (CDC) estimates that about 50,000 people are newly infected every year.31 Men who have sex with men (MSM) are the group most impacted by HIV, and African American MSM are disproportionately represented. Although MSM were only about 4% of the U.S. male population in 2010, 78% of the newly diagnosed HIV infections among males were in MSM (63% of all new HIV infections).32,33 The groups at greatest risk of HIV infection are now young black and Latino MSM aged 13 to 24 years.33 Decreasing the rate of new HIV infections in this high-risk population remains challenging.
Across the U.S., the HIV epidemic continues to disproportionately impact southern states. An estimated 44% of all people living with HIV in the U.S. reside in the District of Columbia and in 16 southern states.34 Among the 10 states with the highest death rate for persons diagnosed with HIV, 7 are southern states–Louisiana, Alabama, Mississippi, South Carolina, Kentucky, and Maryland.35,36 The HIV epidemic in southern states is not confined to urban centers but instead extends across rural areas that have limited access to adequate health care and high rates of poverty.37
HIV Care Continuum
In July 2013, President Obama established the HIV Continuum Care Initiative directing federal departments to accelerate efforts and direct resources to increase the proportion of HIV-infected persons successfully receiving care in each stage of the continuum as part of the National HIV/AIDS Strategy.38,39 In November 2014, the CDC released a report on HIV in the U.S. that found about 14% of those with HIV infection have never been diagnosed, and only 40% are receiving HIV medical care.40 Despite the much improved and simplified ART regimens, only 30% of those living with HIV infection in the U.S. have achieved viral suppression. The CDC has outlined 4 steps for achieving viral suppression, the ultimate goal of all HIV treatment (Table 2).41
In the U.S. and Canada, a person diagnosed with HIV aged 20 years who adheres to a HIV ART regimen has a life expectancy of 71 years. The same person not taking ART has a dramatically shortened life expectancy of 32 years.42 The successful implementation of ART can help those living with HIV to enjoy an average life expectancy no different from that of persons without HIV infection.
The Future of the HIV/AIDS Epidemic
In 2014, the Joint United Nations Program on HIV/ AIDS estimated that 35 million people were living with HIV/AIDS and that 13 million were receiving ART globally. Three of 5 people with HIV infection, about 22 million, did not have access to ART. Less than one quarter of HIV-infected children are on ART.43 Changing the course of the HIV/AIDS pandemic in the U.S. and worldwide is within reach, and the new HSS and WHO guidelines provide an evidence-based framework to alter this course. Significantly expanding screening for HIV and ensuring treatment access for all persons diagnosed with HIV as well as appropriate provision of pre-exposure prophylaxis would irrevocably alter the lives of the millions of people living with HIV/AIDS and others in their communities. It remains to be seen whether the goal to eliminate AIDS by 2020, set in both the National HIV/AIDS Strategy and the UN global commitment will be achieved.
1. DHHS Panel on Antiretroviral Guidelines for Adults and Adolescents. Guidelines for the use of antiretroviral agents in HIV-1 infected adults and adolescents. AIDSinfo Website. https://aidsinfo.nih.gov/contentfiles/lvguidelines/adultandadolescentgl.pdf. Updated January 28, 2016. Accessed March 9, 2016.
2. NIH Panel to Define Principles of Therapy of HIV Infection. Report of the NIH panel to define principles of therapy of HIV infection and Guidelines for the Use of Antiretroviral Agents in HIV-Infected Adults and Adolescents. MMWR Recomm Rep. 1988;47(RR-5):1-41.
3. Stanley SK, Kaplan JE, National Center for HIV, STD, and TB Prevention Division of HIV/AIDS Prevention Surveillance, and Epidemiology. Guidelines for the use of antiretroviral agents in HIV-infected adults and adolescents. MMWR Recomm Rep. 1988;47(RR-5):42-82.
4. Fauci AS, Marston HD. Ending the HIV-AIDS pandemic—follow the science. N Engl J Med. 2015;373(23):2197-2199.
5. El-Sadr WM, Lundgren J, Neaton JD, et al; The Strategies for Management of Antiretroviral Therapy (SMART) Study Group. CD4+ count-guided interruption of antiretroviral treatment. N Engl J Med. 2006;355(22):2283-2296.
6. Cohen MS, Chen YQ, McCauley M. et al; HPTN 052 Study Team. Prevention of HIV-1 infection with early antiretroviral therapy. N Engl J Med. 2011;365(6):493-505.
7. Lundgren JD, Babiker AG, et al; The INSIGHT START Study Group. Initiation of antiretroviral therapy in early asymptomatic HIV infection. N Engl J Med. 2015;373(9):795-807.
8. National Institutes of Health. Starting antiretroviral therapy early improves outcomes for HIV-infected individuals [news release]. U.S. Dept. of Health and Human Services Website. http://www.nih.gov/news-events/news-releases/starting-antiretroviral-treatment-early-improves-outcomes-hiv-infected-individuals, Published May 27, 2015. Accessed March 9, 2016.
9. Danel C, Moh R, et al; The TEMPRANO ANRS 12136 Study Group. A trial of early antiretrovirals and isoniazid preventive therapy in Africa. N Engl J Med. 2015;373(9):808-822.
10. World Health Organization. Guidelines on when to start antiretroviral therapy and on pre-exposure prophylaxis for HIV. World Health Organization Website. http://apps.who.int/iris/bitstream/10665/186275/1/9789241509565_eng.pdf. Published September 2015. Accessed March 9, 2016.
11. Mollan KR, Smurzynski M, Eron JJ, et al. Association between efavirenz as initial therapy for HIV-1 infection and increased risk for suicidal ideation or attempted or completed suicide: an analysis of trial data. Ann Intern Med. 2014;161(1):1-10.
12. FDA approves new treatment for HIV [news release]. U.S. Food and Drug Administration Website. http://www.fda.gov/NewsEvents/Newsroom/PressAnnouncements/ucm471300.htm. Published November 5, 2015. Accessed March 9, 2016.
13. Mills A, Aribas JR, Andrade-Villanueve J, et al. Switching from tenofovir disoproxil fumarate to tenofovir alafenamide in antiretroviral regimens for virologically suppressed adults with HIV-1 infection: a randomized, active-controlled, multicentre, open-label, phase 3, non-inferiority study. Lancet Infect Dis. 2016;16(1):43-52.
14. Sax PE, Zolopa A, Brar I, et al. Tenofovir alafenamide vs. tenofovir disoproxil fumarate in single tablet regimens for initial HIV-1 therapy: a randomized phase 2 study. J Acquir Immune Defic Syndr. 2014;67(1):52-58.
15. Sax PE, Wohl A, Yin MT, et al; GS-US-292-0104/0111 Study Team. Tenofovir alafenamide versus tenofovir disoproxil fumarate, coformulated with elvitegravir, cobicistat, and emtricitabine, for initial treatment of HIV-1 infection: two randomised, double-blind, phase 3, non-inferiority trials. Lancet. 2015;385(9987):2602-2615.
16. Fanrauzzi A, Messaroma I. Dolutegravir: clinical efficacy and role in HIV therapy. Ther Adv Chronic Dis. 2014;5(4):164-177.
17. Miller V, Sabon C, Hertogs K, et al. Virological and immunological effects of treatment interruptions in HIV-1 infected patients with treatment failure. AIDS. 2000;14(18):2857-2867.
18. Raffanti SP, Fusco JS, Sherrill BH, et al; Collaborations in HIV Outcomes Research/United States Project. Effect of persistent moderate viremia on disease progression during HIV therapy. J Acquir Immune Defic Syndr. 2004;37(1):1174-1154.
19. Canestri A, Lescure FX, Jaureguiberry S, et al. Discordance between cerebral spinal fluid and plasma HIV replication in patients with neurological symptoms who are receiving suppressive antiretroviral therapy. Clin Infect Dis. 2010;50(5):773-778.
20. Peluso MJ, Ferretti F, Peterson J, et al. Cerebrospinal fluid HIV escape associated with progressive neurologic dysfunction in patients on antiretroviral therapy with well controlled plasma viral load. AIDS. 2012;26(14):1765-1774.
21. Abrams D, Levy Y, Losso MH, et al. Interleukin-2 therapy in patients with HIV infection. N Engl J Med. 2009;361(16):1548-1559.
22. Tien PC, Choi AI, Zolopa AR, et al. Inflammation and mortality in HIV-infected adults: analysis of the FRAM study cohort. J Acquir Immune Defic Syndr. 2010;55(3):316-322.
23. Lederman MM, Funderburg NT, Sekaly RP, Klatt NR, Hunt PW. Residual immune dysregulation syndrome in treated HIV infection. Adv Immunol. 2013;119:51-83.
24. Mohd Hanafiah K, Groeger J, Flaxman AD, Wiersma ST. Global epidemiology of hepatitis C virus infection new estimates of age-specific antibody to HCV seroprevalence. Hepatology. 2013;57(4):1333-1342.
25. Sherman KE, Rouster SD, Chung RT, Rajicic N. Hepatitis C virus prevalence among patients infected with human immunodeficiency virus: a crosssectional analysis of the US adult AIDS Clinical Trials Group. Clin Infect Dis. 2002;34(6):831-837.
26. Cachay ER, Wyles D, Hill L, et al. The impact of direct-acting antivirals in the hepatitis C-sustained viral response in human immunodeficiency virus-infected patients with ongoing barriers to care. Open Forum Infect Dis. 2015;2(4):ofv168.
27. American Association for the Study of Liver Diseases, Infectious Diseases Society of American. Recommendations for testing, managing, and treating hepatitis C. American Association for the Study of Liver Diseases and the Infectious Diseases Society of America Website. http://hcvguidelines.org/sites/default/files/HCV-Guidance_February_2016_a1.pdf. Updated February 24, 2016. Accessed March 8, 2016.
28. Shah BM, Schafer JJ, Priano J, Squires KE. Cobicistat: a new booster for the treatment of human immunodeficiency virus infection. Pharmacotherapy. 2013;33(10):1107-1116.
29. Hull MW, Montaner JS. Ritonavir-boosted protease inhibitors in HIV therapy. Ann Med. 2011;43(5):375-388.
30. Centers for Disease Control and Prevention. HIV in the United States: at a glance. Centers for Disease Control and Prevention Website. http://www.cdc.gov/hiv/statistics/overview/ataglance.html. Updated September 29, 2015. Accessed March 8, 2016.
31. Prejean J, Song R, Hernandez A, et al. Estimated HIV incidence in the United States, 2006-2009. PLoS One. 2011;6(8):e17502.
32. Purcell DW, Johnson CH, Lansky A, et al. Estimating the population size of men who have sex with men in the United States to obtain HIV and syphilis rates. Open AIDS J. 2012;6:98-107.
33. Centers for Disease Control and Prevention. Estimated HIV incidence in the United States, 2007-2010. HIV Surveillance Report: Supplemental Report 2012;17(4). http://www.cdc.gov/hiv/pdf/statistics_hssr_vol_17_no_4.pdf. Published December 2012. Accessed Mar 23, 2016.
34. Centers for Disease Control and Prevention. HIV in the Southern United States. Centers for Disease Control and Prevention Website. http://www.cdc.gov/hiv/pdf /policies/cdc-hiv-in-the-south-issue-brief.pdf. Published December 2015. Accessed March 22, 2016.
35. Centers for Disease Control and Prevention. Southern states lag behind the rest of the nation in HIV treatment, testing [release]. Centers for Disease Control and Prevention Website. http://www.cdc.gov/nchhstp/newsroom/2015 /nhpc-press-release-southern-states.html. Published December 6, 2015. Accessed March 23, 2016.
36. Krawczyk CS, Funkhouser E, Kilbe JM, Vermund SH. Delayed access to HIV diagnosis and care: special concerns for the Southern United States. AIDS Care. 2006;18(suppl 1):S35-S44.
37. Reif S, Pence BW, Hall I, Hu X, Whetten K, Wilson E. HIV diagnosis, prevalence and outcomes in nine southern states. J Community Health. 2015;40(4);642-651.
38. Office of National AIDS Policy. National HIV/AIDS strategy. Improving outcomes: accelerating progress along the HIV care continuum. White House Website. https://www.whitehouse.gov/sites/default/files/onap_nhas_improving_outcomes _dec_2013.pdf. Published December 2013. Accessed March 8, 2016.
39. The White House Office of National AIDS Policy. National HIV/AIDS Strategy: Federal implementation plan. White House Website. http://www.whitehouse.gov/files/documents/nhas-implementation.pdf. Published July 2010. Accessed March 8, 2016.
40. Bradley H, Hall HI, Wolitski RJ, et al. Vital signs: HIV diagnosis, care, and treatment among persons living with HIV—United States, 2011. MMWR Morb Mortal Wkly Rep. 2014;63(47):1113-1117.
41. Centers for Disease Control and Prevention. CDC Vitalsigns. HIV care saves lives: viral suppression is key. Centers for Disease Control and Prevention Website. http://www.cdc.gov/vitalsigns/hiv-aids-medical-care. Published November 2014. Accessed March 8, 2016.
42. Samji H, Cescon A, Hogg RS, et al; North American AIDS Cohort Collaboration on Research and Design (NA-ACCORD) of IeDEA. Closing the gap: increases in life expectancy among treated HIV-positive individuals in the United States and Canada. PLoS One. 2013;8(12):e81355.
43. Joint United Nations Programme on HIV/AIDS. UNAIDS report shows that 19 million of the 35 million people living with HIV today do not know that they have the virus [press release]. UNAIDS Website. http://www.unaids.org/sites/default/files/web_story/20140716_PR_GapReport_en.pdf. Published July 16, 2014. Accessed March 8, 2016.
Author and Disclosure Information
Dr. Gibert is chair of the institutional review board and director of special projects at the Washington DC VAMC and professor of medicine at the George Washington University School of Medicine and Public Health in Washington, DC.
Author disclosures The author reports no actual or potential conflicts of interest with regard to this article.
Disclaimer The opinions expressed herein are those of the author and do not necessarily reflect those of Federal Practitioner, Frontline Medical Communications Inc., the U.S. Government, or any of its agencies. This article may discuss unlabeled or investigational use of certain drugs. Please review complete prescribing information for specific drugs or drug combinations—including indications, contraindications, warnings, and adverse effects—before administering pharmacologic therapy to patients.
Author and Disclosure Information
Dr. Gibert is chair of the institutional review board and director of special projects at the Washington DC VAMC and professor of medicine at the George Washington University School of Medicine and Public Health in Washington, DC.
Author disclosures The author reports no actual or potential conflicts of interest with regard to this article.
Disclaimer The opinions expressed herein are those of the author and do not necessarily reflect those of Federal Practitioner, Frontline Medical Communications Inc., the U.S. Government, or any of its agencies. This article may discuss unlabeled or investigational use of certain drugs. Please review complete prescribing information for specific drugs or drug combinations—including indications, contraindications, warnings, and adverse effects—before administering pharmacologic therapy to patients.
Important changes to the guidelines clarify the use of antiretroviral therapies and the treatment options for patients who experience virologic failure to first- and second-line regimen failures.
Important changes to the guidelines clarify the use of antiretroviral therapies and the treatment options for patients who experience virologic failure to first- and second-line regimen failures.
On April 8, 2015, HSS released updated HIV treatment guidelines.1 The original 1998 guidelines for the use of antiretroviral agents for treating adults and adolescents infected with HIV emphasized the benefit of potent combination antiretroviral therapies (ARTs) that included protease inhibitors (PIs).2,3 Since then there have been more than 25 HSS guidelines focusing primarily on when to initiate ART and which ART to prescribe. The question of when to start ART had been controversial, but the most recently issued guidelines have addressed this question. For the first time, HSS recommends ART for all individuals infected with HIV regardless of CD4+ T-cell count.1 The timely initiation of effective ART with an associated reduction in HIV viremia benefits patients infected with HIV and substantially decreases transmission of HIV to uninfected sexual partners.3
Three large, international randomized placebo-controlled studies conducted between 2002 and 2015 provide evidence that the benefits of ART outweigh the potential deleterious effects of long-term ART. The Strategies for Management of Antiretroviral Therapy (SMART) was the first published study in this trifecta.4,5 Given concern about the adverse effects (AEs) of ART, particularly PIs, this study was designed to investigate whether long-term ART was associated with more toxicities than was deferred therapy, determined by CD4+ cell counts. The study was halted prematurely, because the risk of death or grade-4 toxicity was statistically greater among those receiving episodic ART than among those on continuous therapy. The SMART trial demonstrated that ART therapy was beneficial, but it did not determine when to initiate ART, particularly in asymptomatic persons.5
It was thought that the risk of transmission of HIV through sexual contact or shared drug paraphernalia was significantly lower for patients on ART who achieve viral suppression compared with those with uncontrolled viremia. The HIV Prevention Trials Network study enrolled HIV-serodiscordant couples to examine transmission of HIV. The trial compared HIV-positive patients who initiated ART when their CD4+ cell count was between 350 to 550 cells/mm3 with patients who began therapy when their CD4+ cell count was < 250 cells/mm3 or when an AIDS-defining illness was diagnosed. The difference in the rate of transmission to a HIV-negative partner was dramatic. The rate was 96% less among those in the early-therapy group vs those in the deferred-therapy group. In addition, there was a 40% reduction in the progression of HIV-related disease in the participants randomized to the early-therapy group.6
In March 2011, the International Network for Strategic Initiatives in Global HIV Trials (INSIGHT), which conducted SMART, initiated the Strategic Timing of AntiRetroviral Treatment (START) study to define the optimal time to begin ART among asymptomatic patients with a CD4+ count of > 350 cells/mm3. Patients with a CD4+ cell count of > 500 cells/mm3 were randomized to either initiate ART, or defer ART until the CD4+ cell count fell to < 350 cells/mm3 or until an AIDS-defining illness occurred.7 On May 15, 2015, the study was terminated early. Based on an interim analysis, the data safety and monitoring board announced that the risk for a serious AIDS-related event, serious non-AIDS-related event, or death from any cause was 57% less in the early treatment group. When compared with patients who delayed ART, for those on ART, serious AIDS-related events were reduced 72%, and serious non-AIDS events were reduced 39%.8 A similar study conducted in the Ivory Coast from March 2008 to January 2015 also favored early rather than deferred ART.9
Experience in clinical practice, these landmark clinical trials, and several cohort studies served as the basis of the changes in the new HSS guidelines that endorse ART for all HIV-infected persons. The World Health Organization (WHO) has recently published similar guidelines.10 It is yet to be determined whether the guidelines have been implemented successfully. Nonetheless, for both the clinician and the patient where access to ongoing care and ART are available, the new guidelines greatly simplify the treatment choices.
What's New in the Guidelines?
The Guidelines for the Use of Antiretroviral Agents in HIV-Infected Adults and Adolescents presents significant changes in several of the tables that are most clinically useful, including Tables 6, 7, and 8.1 Table 6 presents recommended, alternative, and other antiretroviral regimen options. The guidelines also added new tables describing antiretroviral regimen considerations for initial therapy and the mechanisms of antiretroviral-associated drug interactions.
Initial Combination Regimens for the Antiretroviral-Naïve Patient
Five regimens are now recommended for ART-naïve patients: 4 are integrase strand transfer inhibitor-based regimens, and 1 is a ritonavir-boosted PI-based regimen (Table 1). A nonnucleoside reverse transcriptase inhibitor-based regimen is no longer recommended. The guidelines include regimens that are now considered less favorable for a variety of reasons, including reduced virologic activity and greater risk of toxicities, higher pill burden, and more potential drug interactions. Several regimens that have been widely used are now included in this latter option, in particular efavirenz plus abacavir/lamivudine (3TC), lopinavir/ritonavir plus abacavir (ABC)/3TC, and tenofovir fumarate (TDF)/emtricitabine (FTC).
The most significant change in the guideline is the reclassification of efavirenz from a recommended to an alternative therapy. The principal reasons for this change are central nervous system (CNS) AEs, which can include depression and a reported 2-fold increase in the risk of suicide or suicidal ideation.11
In November 2015, the FDA approved Genvoya, a once-daily, fixed-dose combination tablet containing elvitegravir, cobicistat, FTC, and tenofovir alafenamide (TAF).12 With this approval, there are now 5 once-daily HIV treatment options. This new drug is similar to elvitegravir/cobicistat/TDF/FTC, but it substitutes TAF for TDF. The benefits of this substitution include less bone loss and decreased renal toxicity.13-15 Genvoya may be prescribed in patients with a 30 mL/min creatinine clearance. The TAF-containing once-daily formulation achieves higher intracellular levels and lower blood levels of TAF. Therefore, the cholesterol-lowering benefits are less than those of the TDF-containing alternative.
In the 2015 guidelines, Table 7 provides concise guidance on the selection of an ART regimen based on patient and regimen characteristics, including food-based AEs; the presence of other medical and/or psychiatric conditions; and the presence of co-infections, including hepatitis B virus (HBV), hepatitis C virus (HCV), and tuberculosis.1 In addition, Table 8 outlines the advantages and disadvantages of the different classes of ART.1 For example, dolutegravir may have a higher barrier to resistance than that of elvitegravir or raltegravir.16 It is now possible for those living with HIV to have ongoing viral suppression, which will not only improve their lives, but also decrease the risk of HIV transmission to sexual partners. Starting from the time of diagnosis, achieving viral suppression is dependent on a link to care with initiation of ART and retention in care. The 5 once-daily options should improve adherence. The infrastructure to ensure lifelong retention in care, medication availability, and adherence still poses many challenges.
Treatment-Experienced Patients
The guidelines were updated to include more direction on virologic failure to a first-line regimen as well as a second-line regimen failure or beyond. It includes a discussion of treatment options for achieving full virologic suppression. There also are treatment recommendations for patients with multidrug viral resistance in whom maximal viral suppression may not be achieved. For such patients, ART should be continued to preserve immunologic function, lessen clinical progression, and minimize resistance to drug classes that could include new efficacious drugs.17,18
There is also a discussion in the guidelines of the issues surrounding isolated CNS virologic failure and the onset of new neurologic symptoms. With CNS virologic failure, magnetic resonance brain imaging may be abnormal with a lymphocytic pleocytosis in the cerebrospinal fluid (CSF). If available to guide therapy, CSF HIV RNA should be measured, and HIV drug resistance in the CSF should be tested. Central nervous system viral escape should be differentiated from other CNS conditions, such as herpes zoster infection; incidental mild CSF HIV RNA increases; or the now relatively common but chronic neurocognitive impairment seen with HIV infection.19,20
Poor CD4+ Recovery and Persistent Inflammation Despite Viral Suppression
For patients on ART who achieve viral suppression but fail to have a significant increase in CD4+ cell count over time (particularly for the patient with a CD4+ cell count < 200 cells/mm3), the guidelines do not endorse additional ARTs or switching the regimen. However, there may be an increased risk of non-AIDS mortality and morbidity, including cardiovascular disease. For such patients, interleukin-2 adjunctive therapy has no demonstrated clinical benefit.21 Interleukin-7 and recombinant human growth hormone should be used only as part of a clinical trial.
It is now evident that immune activation and inflammation, although lessened, persist despite ART-mediated viral suppression.22,23 There is no recommendation to monitor markers of immune activation and inflammation. Efforts should focus on risk factor modifications, such as smoking cessation, improved diet, treatment of alcohol abuse and dependence, regular exercise, and maintenance of appropriate weight. Emphasis should be on treating chronic comorbidities, such as hypertension, diabetes, osteoporosis, and hyperlipidemia.
HIV/HCV Co-infection
According to the WHO, 130 to 150 million people worldwide have chronic HCV infection.24 In the U.S., it is estimated that up to one-quarter of HIV-infected persons have HCV co-infection.25 With the currently available oral direct-acting agents (DAAs) for the treatment of chronic HCV infection in patients with HIV/HCV co-infection, rates of sustained virologic response to treatment are comparable in patients with HIV/HCV co-infection with those of patients with HCV monoinfection.26 Accordingly, all HIV-infected patients should be screened for HCV infection, and HIV ART should not be deferred for most patients.
For patients with a CD4+ cell count of < 200 cells/mm3, treatment of HCV should be deferred until the patients are on a stable and effective ART regimen. Whereas for those with a CD4+ cell count > 500 cells/mm3, HCV can be treated before initiating HIV ART. When initiating HCV therapy, clinicians must pay attention to drug-drug interactions. Patients with cirrhosis are particularly at risk. The most recent guidelines for the treatment of HCV co-infection should be reviewed when selecting a DAA to treat HCV.27 Many patients are now being treated successfully for HCV co-infection. Extending such therapy to all patients with HIV/HCV co-infection for whom treatment is appropriate should be a priority for clinicians, insurance providers, and policy makers.
Drug Interactions
Given the availability of numerous once-daily ART regimens, prescribing ART has been greatly simplified. Nonetheless, there are many pharmacokinetic drug-drug interactions between antiretroviral drugs and concomitant medications. When changing either the ART or adding or changing other medications, the clinician must always pay attention to potential drug-drug interactions. Consideration must be given to the interaction with drugs that affect antiretroviral absorption—particularly, acid-reducing agents and products that contain polyvalent cations, including calcium and magnesium.
When antiretrovirals that undergo hepatic metabolism are given with other drugs that also are metabolized by the cytochrome P450 enzyme system or other hepatic enzymes, the levels of antiretrovirals or other drug may be significantly increased or decreased.1 The 2 booster—cobicistat and ritonavir—used to increase certain antiretrovirals levels also may alter the metabolism of other drugs.28,29 The new guidelines contain updated and detailed tables on drug-drug interactions. Given the comorbid conditions, particularly among those aging with HIV, polypharmacy is an increasingly common concern. It is essential for clinicians to work with knowledgeable HIV pharmacists to ensure the correct and safe prescribing of all medications.
HIV/AIDS Demographics in U.S.
Of the more than 1.2 million people aged > 13 years in the U.S. living with HIV, about 1 in 8 are unaware of their infection.30 The Centers for Disease Control and Prevention (CDC) estimates that about 50,000 people are newly infected every year.31 Men who have sex with men (MSM) are the group most impacted by HIV, and African American MSM are disproportionately represented. Although MSM were only about 4% of the U.S. male population in 2010, 78% of the newly diagnosed HIV infections among males were in MSM (63% of all new HIV infections).32,33 The groups at greatest risk of HIV infection are now young black and Latino MSM aged 13 to 24 years.33 Decreasing the rate of new HIV infections in this high-risk population remains challenging.
Across the U.S., the HIV epidemic continues to disproportionately impact southern states. An estimated 44% of all people living with HIV in the U.S. reside in the District of Columbia and in 16 southern states.34 Among the 10 states with the highest death rate for persons diagnosed with HIV, 7 are southern states–Louisiana, Alabama, Mississippi, South Carolina, Kentucky, and Maryland.35,36 The HIV epidemic in southern states is not confined to urban centers but instead extends across rural areas that have limited access to adequate health care and high rates of poverty.37
HIV Care Continuum
In July 2013, President Obama established the HIV Continuum Care Initiative directing federal departments to accelerate efforts and direct resources to increase the proportion of HIV-infected persons successfully receiving care in each stage of the continuum as part of the National HIV/AIDS Strategy.38,39 In November 2014, the CDC released a report on HIV in the U.S. that found about 14% of those with HIV infection have never been diagnosed, and only 40% are receiving HIV medical care.40 Despite the much improved and simplified ART regimens, only 30% of those living with HIV infection in the U.S. have achieved viral suppression. The CDC has outlined 4 steps for achieving viral suppression, the ultimate goal of all HIV treatment (Table 2).41
In the U.S. and Canada, a person diagnosed with HIV aged 20 years who adheres to a HIV ART regimen has a life expectancy of 71 years. The same person not taking ART has a dramatically shortened life expectancy of 32 years.42 The successful implementation of ART can help those living with HIV to enjoy an average life expectancy no different from that of persons without HIV infection.
The Future of the HIV/AIDS Epidemic
In 2014, the Joint United Nations Program on HIV/ AIDS estimated that 35 million people were living with HIV/AIDS and that 13 million were receiving ART globally. Three of 5 people with HIV infection, about 22 million, did not have access to ART. Less than one quarter of HIV-infected children are on ART.43 Changing the course of the HIV/AIDS pandemic in the U.S. and worldwide is within reach, and the new HSS and WHO guidelines provide an evidence-based framework to alter this course. Significantly expanding screening for HIV and ensuring treatment access for all persons diagnosed with HIV as well as appropriate provision of pre-exposure prophylaxis would irrevocably alter the lives of the millions of people living with HIV/AIDS and others in their communities. It remains to be seen whether the goal to eliminate AIDS by 2020, set in both the National HIV/AIDS Strategy and the UN global commitment will be achieved.
1. DHHS Panel on Antiretroviral Guidelines for Adults and Adolescents. Guidelines for the use of antiretroviral agents in HIV-1 infected adults and adolescents. AIDSinfo Website. https://aidsinfo.nih.gov/contentfiles/lvguidelines/adultandadolescentgl.pdf. Updated January 28, 2016. Accessed March 9, 2016.
2. NIH Panel to Define Principles of Therapy of HIV Infection. Report of the NIH panel to define principles of therapy of HIV infection and Guidelines for the Use of Antiretroviral Agents in HIV-Infected Adults and Adolescents. MMWR Recomm Rep. 1988;47(RR-5):1-41.
3. Stanley SK, Kaplan JE, National Center for HIV, STD, and TB Prevention Division of HIV/AIDS Prevention Surveillance, and Epidemiology. Guidelines for the use of antiretroviral agents in HIV-infected adults and adolescents. MMWR Recomm Rep. 1988;47(RR-5):42-82.
4. Fauci AS, Marston HD. Ending the HIV-AIDS pandemic—follow the science. N Engl J Med. 2015;373(23):2197-2199.
5. El-Sadr WM, Lundgren J, Neaton JD, et al; The Strategies for Management of Antiretroviral Therapy (SMART) Study Group. CD4+ count-guided interruption of antiretroviral treatment. N Engl J Med. 2006;355(22):2283-2296.
6. Cohen MS, Chen YQ, McCauley M. et al; HPTN 052 Study Team. Prevention of HIV-1 infection with early antiretroviral therapy. N Engl J Med. 2011;365(6):493-505.
7. Lundgren JD, Babiker AG, et al; The INSIGHT START Study Group. Initiation of antiretroviral therapy in early asymptomatic HIV infection. N Engl J Med. 2015;373(9):795-807.
8. National Institutes of Health. Starting antiretroviral therapy early improves outcomes for HIV-infected individuals [news release]. U.S. Dept. of Health and Human Services Website. http://www.nih.gov/news-events/news-releases/starting-antiretroviral-treatment-early-improves-outcomes-hiv-infected-individuals, Published May 27, 2015. Accessed March 9, 2016.
9. Danel C, Moh R, et al; The TEMPRANO ANRS 12136 Study Group. A trial of early antiretrovirals and isoniazid preventive therapy in Africa. N Engl J Med. 2015;373(9):808-822.
10. World Health Organization. Guidelines on when to start antiretroviral therapy and on pre-exposure prophylaxis for HIV. World Health Organization Website. http://apps.who.int/iris/bitstream/10665/186275/1/9789241509565_eng.pdf. Published September 2015. Accessed March 9, 2016.
11. Mollan KR, Smurzynski M, Eron JJ, et al. Association between efavirenz as initial therapy for HIV-1 infection and increased risk for suicidal ideation or attempted or completed suicide: an analysis of trial data. Ann Intern Med. 2014;161(1):1-10.
12. FDA approves new treatment for HIV [news release]. U.S. Food and Drug Administration Website. http://www.fda.gov/NewsEvents/Newsroom/PressAnnouncements/ucm471300.htm. Published November 5, 2015. Accessed March 9, 2016.
13. Mills A, Aribas JR, Andrade-Villanueve J, et al. Switching from tenofovir disoproxil fumarate to tenofovir alafenamide in antiretroviral regimens for virologically suppressed adults with HIV-1 infection: a randomized, active-controlled, multicentre, open-label, phase 3, non-inferiority study. Lancet Infect Dis. 2016;16(1):43-52.
14. Sax PE, Zolopa A, Brar I, et al. Tenofovir alafenamide vs. tenofovir disoproxil fumarate in single tablet regimens for initial HIV-1 therapy: a randomized phase 2 study. J Acquir Immune Defic Syndr. 2014;67(1):52-58.
15. Sax PE, Wohl A, Yin MT, et al; GS-US-292-0104/0111 Study Team. Tenofovir alafenamide versus tenofovir disoproxil fumarate, coformulated with elvitegravir, cobicistat, and emtricitabine, for initial treatment of HIV-1 infection: two randomised, double-blind, phase 3, non-inferiority trials. Lancet. 2015;385(9987):2602-2615.
16. Fanrauzzi A, Messaroma I. Dolutegravir: clinical efficacy and role in HIV therapy. Ther Adv Chronic Dis. 2014;5(4):164-177.
17. Miller V, Sabon C, Hertogs K, et al. Virological and immunological effects of treatment interruptions in HIV-1 infected patients with treatment failure. AIDS. 2000;14(18):2857-2867.
18. Raffanti SP, Fusco JS, Sherrill BH, et al; Collaborations in HIV Outcomes Research/United States Project. Effect of persistent moderate viremia on disease progression during HIV therapy. J Acquir Immune Defic Syndr. 2004;37(1):1174-1154.
19. Canestri A, Lescure FX, Jaureguiberry S, et al. Discordance between cerebral spinal fluid and plasma HIV replication in patients with neurological symptoms who are receiving suppressive antiretroviral therapy. Clin Infect Dis. 2010;50(5):773-778.
20. Peluso MJ, Ferretti F, Peterson J, et al. Cerebrospinal fluid HIV escape associated with progressive neurologic dysfunction in patients on antiretroviral therapy with well controlled plasma viral load. AIDS. 2012;26(14):1765-1774.
21. Abrams D, Levy Y, Losso MH, et al. Interleukin-2 therapy in patients with HIV infection. N Engl J Med. 2009;361(16):1548-1559.
22. Tien PC, Choi AI, Zolopa AR, et al. Inflammation and mortality in HIV-infected adults: analysis of the FRAM study cohort. J Acquir Immune Defic Syndr. 2010;55(3):316-322.
23. Lederman MM, Funderburg NT, Sekaly RP, Klatt NR, Hunt PW. Residual immune dysregulation syndrome in treated HIV infection. Adv Immunol. 2013;119:51-83.
24. Mohd Hanafiah K, Groeger J, Flaxman AD, Wiersma ST. Global epidemiology of hepatitis C virus infection new estimates of age-specific antibody to HCV seroprevalence. Hepatology. 2013;57(4):1333-1342.
25. Sherman KE, Rouster SD, Chung RT, Rajicic N. Hepatitis C virus prevalence among patients infected with human immunodeficiency virus: a crosssectional analysis of the US adult AIDS Clinical Trials Group. Clin Infect Dis. 2002;34(6):831-837.
26. Cachay ER, Wyles D, Hill L, et al. The impact of direct-acting antivirals in the hepatitis C-sustained viral response in human immunodeficiency virus-infected patients with ongoing barriers to care. Open Forum Infect Dis. 2015;2(4):ofv168.
27. American Association for the Study of Liver Diseases, Infectious Diseases Society of American. Recommendations for testing, managing, and treating hepatitis C. American Association for the Study of Liver Diseases and the Infectious Diseases Society of America Website. http://hcvguidelines.org/sites/default/files/HCV-Guidance_February_2016_a1.pdf. Updated February 24, 2016. Accessed March 8, 2016.
28. Shah BM, Schafer JJ, Priano J, Squires KE. Cobicistat: a new booster for the treatment of human immunodeficiency virus infection. Pharmacotherapy. 2013;33(10):1107-1116.
29. Hull MW, Montaner JS. Ritonavir-boosted protease inhibitors in HIV therapy. Ann Med. 2011;43(5):375-388.
30. Centers for Disease Control and Prevention. HIV in the United States: at a glance. Centers for Disease Control and Prevention Website. http://www.cdc.gov/hiv/statistics/overview/ataglance.html. Updated September 29, 2015. Accessed March 8, 2016.
31. Prejean J, Song R, Hernandez A, et al. Estimated HIV incidence in the United States, 2006-2009. PLoS One. 2011;6(8):e17502.
32. Purcell DW, Johnson CH, Lansky A, et al. Estimating the population size of men who have sex with men in the United States to obtain HIV and syphilis rates. Open AIDS J. 2012;6:98-107.
33. Centers for Disease Control and Prevention. Estimated HIV incidence in the United States, 2007-2010. HIV Surveillance Report: Supplemental Report 2012;17(4). http://www.cdc.gov/hiv/pdf/statistics_hssr_vol_17_no_4.pdf. Published December 2012. Accessed Mar 23, 2016.
34. Centers for Disease Control and Prevention. HIV in the Southern United States. Centers for Disease Control and Prevention Website. http://www.cdc.gov/hiv/pdf /policies/cdc-hiv-in-the-south-issue-brief.pdf. Published December 2015. Accessed March 22, 2016.
35. Centers for Disease Control and Prevention. Southern states lag behind the rest of the nation in HIV treatment, testing [release]. Centers for Disease Control and Prevention Website. http://www.cdc.gov/nchhstp/newsroom/2015 /nhpc-press-release-southern-states.html. Published December 6, 2015. Accessed March 23, 2016.
36. Krawczyk CS, Funkhouser E, Kilbe JM, Vermund SH. Delayed access to HIV diagnosis and care: special concerns for the Southern United States. AIDS Care. 2006;18(suppl 1):S35-S44.
37. Reif S, Pence BW, Hall I, Hu X, Whetten K, Wilson E. HIV diagnosis, prevalence and outcomes in nine southern states. J Community Health. 2015;40(4);642-651.
38. Office of National AIDS Policy. National HIV/AIDS strategy. Improving outcomes: accelerating progress along the HIV care continuum. White House Website. https://www.whitehouse.gov/sites/default/files/onap_nhas_improving_outcomes _dec_2013.pdf. Published December 2013. Accessed March 8, 2016.
39. The White House Office of National AIDS Policy. National HIV/AIDS Strategy: Federal implementation plan. White House Website. http://www.whitehouse.gov/files/documents/nhas-implementation.pdf. Published July 2010. Accessed March 8, 2016.
40. Bradley H, Hall HI, Wolitski RJ, et al. Vital signs: HIV diagnosis, care, and treatment among persons living with HIV—United States, 2011. MMWR Morb Mortal Wkly Rep. 2014;63(47):1113-1117.
41. Centers for Disease Control and Prevention. CDC Vitalsigns. HIV care saves lives: viral suppression is key. Centers for Disease Control and Prevention Website. http://www.cdc.gov/vitalsigns/hiv-aids-medical-care. Published November 2014. Accessed March 8, 2016.
42. Samji H, Cescon A, Hogg RS, et al; North American AIDS Cohort Collaboration on Research and Design (NA-ACCORD) of IeDEA. Closing the gap: increases in life expectancy among treated HIV-positive individuals in the United States and Canada. PLoS One. 2013;8(12):e81355.
43. Joint United Nations Programme on HIV/AIDS. UNAIDS report shows that 19 million of the 35 million people living with HIV today do not know that they have the virus [press release]. UNAIDS Website. http://www.unaids.org/sites/default/files/web_story/20140716_PR_GapReport_en.pdf. Published July 16, 2014. Accessed March 8, 2016.
References
1. DHHS Panel on Antiretroviral Guidelines for Adults and Adolescents. Guidelines for the use of antiretroviral agents in HIV-1 infected adults and adolescents. AIDSinfo Website. https://aidsinfo.nih.gov/contentfiles/lvguidelines/adultandadolescentgl.pdf. Updated January 28, 2016. Accessed March 9, 2016.
2. NIH Panel to Define Principles of Therapy of HIV Infection. Report of the NIH panel to define principles of therapy of HIV infection and Guidelines for the Use of Antiretroviral Agents in HIV-Infected Adults and Adolescents. MMWR Recomm Rep. 1988;47(RR-5):1-41.
3. Stanley SK, Kaplan JE, National Center for HIV, STD, and TB Prevention Division of HIV/AIDS Prevention Surveillance, and Epidemiology. Guidelines for the use of antiretroviral agents in HIV-infected adults and adolescents. MMWR Recomm Rep. 1988;47(RR-5):42-82.
4. Fauci AS, Marston HD. Ending the HIV-AIDS pandemic—follow the science. N Engl J Med. 2015;373(23):2197-2199.
5. El-Sadr WM, Lundgren J, Neaton JD, et al; The Strategies for Management of Antiretroviral Therapy (SMART) Study Group. CD4+ count-guided interruption of antiretroviral treatment. N Engl J Med. 2006;355(22):2283-2296.
6. Cohen MS, Chen YQ, McCauley M. et al; HPTN 052 Study Team. Prevention of HIV-1 infection with early antiretroviral therapy. N Engl J Med. 2011;365(6):493-505.
7. Lundgren JD, Babiker AG, et al; The INSIGHT START Study Group. Initiation of antiretroviral therapy in early asymptomatic HIV infection. N Engl J Med. 2015;373(9):795-807.
8. National Institutes of Health. Starting antiretroviral therapy early improves outcomes for HIV-infected individuals [news release]. U.S. Dept. of Health and Human Services Website. http://www.nih.gov/news-events/news-releases/starting-antiretroviral-treatment-early-improves-outcomes-hiv-infected-individuals, Published May 27, 2015. Accessed March 9, 2016.
9. Danel C, Moh R, et al; The TEMPRANO ANRS 12136 Study Group. A trial of early antiretrovirals and isoniazid preventive therapy in Africa. N Engl J Med. 2015;373(9):808-822.
10. World Health Organization. Guidelines on when to start antiretroviral therapy and on pre-exposure prophylaxis for HIV. World Health Organization Website. http://apps.who.int/iris/bitstream/10665/186275/1/9789241509565_eng.pdf. Published September 2015. Accessed March 9, 2016.
11. Mollan KR, Smurzynski M, Eron JJ, et al. Association between efavirenz as initial therapy for HIV-1 infection and increased risk for suicidal ideation or attempted or completed suicide: an analysis of trial data. Ann Intern Med. 2014;161(1):1-10.
12. FDA approves new treatment for HIV [news release]. U.S. Food and Drug Administration Website. http://www.fda.gov/NewsEvents/Newsroom/PressAnnouncements/ucm471300.htm. Published November 5, 2015. Accessed March 9, 2016.
13. Mills A, Aribas JR, Andrade-Villanueve J, et al. Switching from tenofovir disoproxil fumarate to tenofovir alafenamide in antiretroviral regimens for virologically suppressed adults with HIV-1 infection: a randomized, active-controlled, multicentre, open-label, phase 3, non-inferiority study. Lancet Infect Dis. 2016;16(1):43-52.
14. Sax PE, Zolopa A, Brar I, et al. Tenofovir alafenamide vs. tenofovir disoproxil fumarate in single tablet regimens for initial HIV-1 therapy: a randomized phase 2 study. J Acquir Immune Defic Syndr. 2014;67(1):52-58.
15. Sax PE, Wohl A, Yin MT, et al; GS-US-292-0104/0111 Study Team. Tenofovir alafenamide versus tenofovir disoproxil fumarate, coformulated with elvitegravir, cobicistat, and emtricitabine, for initial treatment of HIV-1 infection: two randomised, double-blind, phase 3, non-inferiority trials. Lancet. 2015;385(9987):2602-2615.
16. Fanrauzzi A, Messaroma I. Dolutegravir: clinical efficacy and role in HIV therapy. Ther Adv Chronic Dis. 2014;5(4):164-177.
17. Miller V, Sabon C, Hertogs K, et al. Virological and immunological effects of treatment interruptions in HIV-1 infected patients with treatment failure. AIDS. 2000;14(18):2857-2867.
18. Raffanti SP, Fusco JS, Sherrill BH, et al; Collaborations in HIV Outcomes Research/United States Project. Effect of persistent moderate viremia on disease progression during HIV therapy. J Acquir Immune Defic Syndr. 2004;37(1):1174-1154.
19. Canestri A, Lescure FX, Jaureguiberry S, et al. Discordance between cerebral spinal fluid and plasma HIV replication in patients with neurological symptoms who are receiving suppressive antiretroviral therapy. Clin Infect Dis. 2010;50(5):773-778.
20. Peluso MJ, Ferretti F, Peterson J, et al. Cerebrospinal fluid HIV escape associated with progressive neurologic dysfunction in patients on antiretroviral therapy with well controlled plasma viral load. AIDS. 2012;26(14):1765-1774.
21. Abrams D, Levy Y, Losso MH, et al. Interleukin-2 therapy in patients with HIV infection. N Engl J Med. 2009;361(16):1548-1559.
22. Tien PC, Choi AI, Zolopa AR, et al. Inflammation and mortality in HIV-infected adults: analysis of the FRAM study cohort. J Acquir Immune Defic Syndr. 2010;55(3):316-322.
23. Lederman MM, Funderburg NT, Sekaly RP, Klatt NR, Hunt PW. Residual immune dysregulation syndrome in treated HIV infection. Adv Immunol. 2013;119:51-83.
24. Mohd Hanafiah K, Groeger J, Flaxman AD, Wiersma ST. Global epidemiology of hepatitis C virus infection new estimates of age-specific antibody to HCV seroprevalence. Hepatology. 2013;57(4):1333-1342.
25. Sherman KE, Rouster SD, Chung RT, Rajicic N. Hepatitis C virus prevalence among patients infected with human immunodeficiency virus: a crosssectional analysis of the US adult AIDS Clinical Trials Group. Clin Infect Dis. 2002;34(6):831-837.
26. Cachay ER, Wyles D, Hill L, et al. The impact of direct-acting antivirals in the hepatitis C-sustained viral response in human immunodeficiency virus-infected patients with ongoing barriers to care. Open Forum Infect Dis. 2015;2(4):ofv168.
27. American Association for the Study of Liver Diseases, Infectious Diseases Society of American. Recommendations for testing, managing, and treating hepatitis C. American Association for the Study of Liver Diseases and the Infectious Diseases Society of America Website. http://hcvguidelines.org/sites/default/files/HCV-Guidance_February_2016_a1.pdf. Updated February 24, 2016. Accessed March 8, 2016.
28. Shah BM, Schafer JJ, Priano J, Squires KE. Cobicistat: a new booster for the treatment of human immunodeficiency virus infection. Pharmacotherapy. 2013;33(10):1107-1116.
29. Hull MW, Montaner JS. Ritonavir-boosted protease inhibitors in HIV therapy. Ann Med. 2011;43(5):375-388.
30. Centers for Disease Control and Prevention. HIV in the United States: at a glance. Centers for Disease Control and Prevention Website. http://www.cdc.gov/hiv/statistics/overview/ataglance.html. Updated September 29, 2015. Accessed March 8, 2016.
31. Prejean J, Song R, Hernandez A, et al. Estimated HIV incidence in the United States, 2006-2009. PLoS One. 2011;6(8):e17502.
32. Purcell DW, Johnson CH, Lansky A, et al. Estimating the population size of men who have sex with men in the United States to obtain HIV and syphilis rates. Open AIDS J. 2012;6:98-107.
33. Centers for Disease Control and Prevention. Estimated HIV incidence in the United States, 2007-2010. HIV Surveillance Report: Supplemental Report 2012;17(4). http://www.cdc.gov/hiv/pdf/statistics_hssr_vol_17_no_4.pdf. Published December 2012. Accessed Mar 23, 2016.
34. Centers for Disease Control and Prevention. HIV in the Southern United States. Centers for Disease Control and Prevention Website. http://www.cdc.gov/hiv/pdf /policies/cdc-hiv-in-the-south-issue-brief.pdf. Published December 2015. Accessed March 22, 2016.
35. Centers for Disease Control and Prevention. Southern states lag behind the rest of the nation in HIV treatment, testing [release]. Centers for Disease Control and Prevention Website. http://www.cdc.gov/nchhstp/newsroom/2015 /nhpc-press-release-southern-states.html. Published December 6, 2015. Accessed March 23, 2016.
36. Krawczyk CS, Funkhouser E, Kilbe JM, Vermund SH. Delayed access to HIV diagnosis and care: special concerns for the Southern United States. AIDS Care. 2006;18(suppl 1):S35-S44.
37. Reif S, Pence BW, Hall I, Hu X, Whetten K, Wilson E. HIV diagnosis, prevalence and outcomes in nine southern states. J Community Health. 2015;40(4);642-651.
38. Office of National AIDS Policy. National HIV/AIDS strategy. Improving outcomes: accelerating progress along the HIV care continuum. White House Website. https://www.whitehouse.gov/sites/default/files/onap_nhas_improving_outcomes _dec_2013.pdf. Published December 2013. Accessed March 8, 2016.
39. The White House Office of National AIDS Policy. National HIV/AIDS Strategy: Federal implementation plan. White House Website. http://www.whitehouse.gov/files/documents/nhas-implementation.pdf. Published July 2010. Accessed March 8, 2016.
40. Bradley H, Hall HI, Wolitski RJ, et al. Vital signs: HIV diagnosis, care, and treatment among persons living with HIV—United States, 2011. MMWR Morb Mortal Wkly Rep. 2014;63(47):1113-1117.
41. Centers for Disease Control and Prevention. CDC Vitalsigns. HIV care saves lives: viral suppression is key. Centers for Disease Control and Prevention Website. http://www.cdc.gov/vitalsigns/hiv-aids-medical-care. Published November 2014. Accessed March 8, 2016.
42. Samji H, Cescon A, Hogg RS, et al; North American AIDS Cohort Collaboration on Research and Design (NA-ACCORD) of IeDEA. Closing the gap: increases in life expectancy among treated HIV-positive individuals in the United States and Canada. PLoS One. 2013;8(12):e81355.
43. Joint United Nations Programme on HIV/AIDS. UNAIDS report shows that 19 million of the 35 million people living with HIV today do not know that they have the virus [press release]. UNAIDS Website. http://www.unaids.org/sites/default/files/web_story/20140716_PR_GapReport_en.pdf. Published July 16, 2014. Accessed March 8, 2016.
The emergence of highly active antiretroviral therapies has decreased mortality, increased viral suppression, and significantly reduced the risk of the sexual transmission of HIV.
Together with prophylaxis for opportunistic infections, the widespread use of combination antiretroviral therapy (ART)—known as highly active antiretroviral therapy (HAART)—led to substantial gains in the life expectancy of patients infected with human immunodeficiency virus type 1 (HIV-1).1-3 The emergence of HAARTs has decreased mortality, increased viral suppression, and significantly reduced the risk of the sexual transmission of HIV.4-6
Since its introduction, HAART has evolved significantly with more options for triple therapy combinations that show improved efficacy, convenience, and tolerability. Single-tablet regimens (STRs) are the culmination of this evolution. The first STR was introduced in 2006, and to date, there are 5 STR options approved for use. In this review, the authors discuss the rationale and path to development of STRs, compare the currently available STRs, and discuss practical considerations in their use for the treatment of HIV-1 infection.
Is Triple Therapy The Sweet Spot?
Because current ART cannot eradicate HIV-1 infection due to latently infected CD4+ T-cell reservoirs, the primary goals of ART according to the HHS guidelines are to (1) reduce HIV-associated morbidity and prolong the duration and quality of survival; (2) restore and preserve immunologic function; (3) maximally and durably suppress plasma HIV viral load; and (4) prevent HIV transmission.7
These goals currently seem to be optimally achieved by treatment with 3 active agents, usually consisting of 2 nucleos(t)ide reverse-transcriptase inhibitors (NRTIs) as a backbone plus a drug from 1 of 3 drug classes: an integrase strand transfer inhibitor (INSTI), a nonnucleoside reverse-transcriptase inhibitor (NNRTI), or a protease inhibitor (PI) boosted with ritonavir or cobicistat. The most widely used NRTI backbones are abacavir plus lamivudine (ABC/3TC) or tenofovir disoproxil fumarate plus emtricitabine (TDF/FTC). Attempts to increase the number of active drugs in a regimen (≥ 4) have generally failed to yield additional virologic or immunologic benefits. Conversely, recent attempts to decrease the number of drugs in a regimen (≤ 2) have met with mixed success.
Mega-HAART
The AIDS Clinical Trial Group (ACTG) 5095 was a randomized controlled trial (RCT) to compare the safety and efficacy of a 3-drug regimen (zidovudine/lamivudine [AZT/3TC] plus efavirenz [EFV]) vs a 4-drug regimen (AZT/3TC/ABC plus EFV) in the initial treatment of HIV-1 infection.8 There were no significant differences in virologic efficacy between the 3-drug and 4-drug regimens, findings that have been corroborated in subsequent studies.9,10 Intensified (≥ 4 drugs) regimens have also failed to lead to significant decay in viral reservoir.10,11
Dual Therapy With Newer Agents
Recent clinical studies have explored the use of fewer medications in treatment-naïve HIV-infected patients. In the GARDEL study, dual therapy consisting of lopinavir/ritonavir (LPV/RTV) plus 3TC proved to be virologically noninferior to triple therapy of LPV/RTV plus 2 NRTIs in a fixed-dose combination.12 In a large European clinical trial (NEAT001/ANRS143), the combination of darunavir/ritonavir (DRV/RTV) plus raltegravir (RAL) was noninferior to DRV/RTV plus TDF/FTC, although more virologic failures were seen in the dual-therapy arm for patients with high baseline HIV-1 RNA viral loads or low baseline CD4+ counts.13
Suboptimal virologic responses also were observed with the DRV/RTV plus RAL regimen in several smaller studies: ACTG 5262 and RADAR.14,15 Finally, a combination of DRV/RTV plus maraviroc proved virologically inferior to standard DRV/RTV plus TDF/FTC in the MODERN trial.16 Although some dual-agent regimens have shown promise, none have established consistent and durable virologic efficacy sufficient to supplant triple therapy, which is currently endorsed by treatment guidelines and forms the basis for current STRs.
Current Single-Tablet Regimens
There are currently 5 STRs available for the treatment of HIV-1 infection, 3 are among the recommended regimens for ART in treatment-naïve patients. An older, triple NRTI-based STR (AZT/3TC/ABC) has fallen out of routine use due to inferior virologic efficacy, toxicities, and better-tolerated alternative agents.17 A review of the indications for use, major clinical trials, and unique features of available STRs follows and is summarized in the Table.
Efavirenz/tenofovir DF/emtricitabine
The first widely used STR, Atripla (Bristol-Myers Squibb and Gilead Sciences) combines the NRTIs tenofovir DF and FTC with the NNRTI EFV and was released in 2006. It is indicated for use alone or in combination with other ARTs for treatment of HIV-1 infection in adults or children aged > 12 years.18 Contraindications include hypersensitivity to efavirenz or coadministration with voriconazole. Major precautions are required for patients with severe psychiatric disease or suicidality; new or worsening renal impairment; women in the first trimester of pregnancy or of childbearing age not on effective contraception; or osteoporosis or history of fragility fractures. Patients with chronic liver disease also should be monitored for hepatotoxicity.
Large RCTs confirmed the potency and durability of viral suppression of EFV/TDF/FTC in treatment-naïve patients19,20 or in the context of antiretroviral switching for treatment simplification in patients previously suppressed with NNRTI- or PI-based regimens.21 This combination has been shown to be noninferior or superior to multiple PI-based,22 NNRTI-based,23 and INSTI-based regimens.18 However, it recently was found to be associated with lower virologic response than was the INSTI-based regimen of ABC/3TC plus dolutegravir (DTG) and higher discontinuation rates than that of a TDF/FTC plus RAL regimen.24,25 Due to lingering concerns about an EFV association with suicidality26 and neural tube defects with first trimester exposure,27 EFV/TDF/FTC was downgraded to an alternative regimen for treatmentnaïve patients, because other available regimens are better tolerated with equal or superior efficacy.7
Rilpivirine/tenofovir DF/emtricitabine
Approved in 2011, Complera was the second STR (Gilead Sciences), combining the NNRTI rilpivirine (RPV) with the NRTI backbone TDF/FTC. It is indicated for use in (1) treatment-naïve adults with a baseline HIV-1 RNA ≤ 100,000 copies/mL and baseline CD4+ > 200 cells/mm3; or (2) switch therapy (changing from a previous antiretroviral regimen) in patients virologically suppressed (HIV-1 RNA ≤ 50 copies/mL) for at least 6 months without history of virologic failure or resistance to any of the component drugs.28 Contraindications include administration with other drugs that significantly lower RPV concentrations, such as certain acid-lowering drugs. Although not associated with as many neuropsychiatric or teratogenic effects as EFV/TDF/FTC, this combination still requires caution in circumstances of preexisting renal impairment, severe hepatic disease, or bone disease.
Two phase 3 studies and 1 open-label phase 3b study confirmed that RPV-based STRs were noninferior to EFVbased STRs overall.23,29 Importantly, patients with higher baseline viral loads experienced higher rates of virologic failure and higher rates of NRTI backbone resistance. Patients with baseline CD4+ < 200 cells/mm3 also had higher virologic failure rates. Because of these virologic and immunologic prerequisites for use, RPV/TDF/FTC is considered an alternative regimen for treatment-naïve patients.7 On the other hand, in the aforementioned studies, fewer patients in the RPV arms discontinued therapy due to adverse events (AEs), and a switch from EFV/TDF/FTC to RPV/TDF/FTC was shown to be safe and effective.30 Its greater tolerability and safety profile make RPV/TDF/FTC an option for patients who do not tolerate EFV/TDF/3TC, who are pregnant, and who have a psychiatric illness.
Released in 2012, Stribild (Gilead Sciences) was the first treatment to combine an INSTI and elvitegravir (EVG) with the pharmacologic booster cobicistat and the TDF/FTC backbone. It is indicated for use in treatmentnaïve adults or as switch therapy in patients virologically suppressed (HIV-1 RNA < 50 copies/mL) for at least 6 months without a history of virologic failure or resistance to any of the components.31
Two double-blind, active-controlled trials established that EVG/c/TDF/FTC was virologically noninferior and had greater safety and tolerability than that of EFV/TDF/FTC32 and ATV/RTV plus DF/FTC33 in treatment-naïve patients. It also maintained virologic suppression in patients switching from a boosted PI34 or an NNRTI-based regimen.35 On the basis of this efficacy and safety data, EVG/c/TDF/FTC is considered a recommended regimen for initial ART treatment.7 However, limitations to this regimen include significant drug-drug interactions due to potent CYP3A inhibition by cobicistat, potential renal and bone toxicity due to TDF, and cobicistat-induced inhibition of renal tubular creatinine secretion, which can lead to a mild creatinine increase (≤ 0.4 mg/dL) and may complicate renal function monitoring. Therefore, it is contraindicated in patients concomitantly taking medications that are strong inducers of CYP3A or that are heavily metabolized by CYP3A for clearance, patients with reduced renal function (estimated creatinine clearance [CrCl] < 70 mL/min), and those receiving polyvalent cationic antacids or supplements.
Dolutegravir/abacavir/lamivudine
Approved in 2014, Triumeq (ViiV Healthcare) is the first and only currently available STR with an NRTI backbone of ABC/3TC rather than a tenofovir (TFV) derivative, combined with the INSTI DTG. It is indicated for the treatment of HIV-1 infection in patients without prior resistance to the INSTI class of ART or the other component drugs in this combination pill.36 The major contraindication is presence of the HLA-B*5701 allele, a polymorphism that predicts abacavir-related hypersensitivity, or moderate-tosevere hepatic impairment.37 Caution is required in patients with hepatitis B virus (HBV) co-infection due to the risk of 3TC drug resistance and subsequent acute exacerbation of HBV. Coadministration with dofetilide is contraindicated, and coadministration of some medications, most notably rifampin, requires an additional dose of DTG alone be given.36 Dolutegravir absorption is also decreased when coadministered with polyvalent cationic antacids or laxatives.
Dolutegravir-based regimens have been shown to be noninferior to RAL-based regimens38 and superior to EFV/TDF/FTC24 and boosted DRV-based regimens.39 Treatment-emergent resistance to DTG has been rare, suggesting a high genetic barrier to resistance compared with that of other INSTIs. On this basis, DTG/ABC/3TC is considered a recommended regimen for initial ART treatment.7 Another advantage of DTG/ABC/3TC is fewer drug-drug interactions than those of PI- or NNRTI-based regimens or the EVG/c/TDF/FTC STR.24,38,39 Limitations include the requirement to confirm a negative HLAB* 5701 allele, the potential association of abacavir with cardiovascular (CV) events seen in some but not all studies, and a small increase in creatinine due to DTG effects on renal tubular secretion.40-43
The latest STR, Genvoya (Gilead Sciences), approved in 2015, combines the INSTI elvitegravir and cobicistat with the novel NRTI backbone alafenamide(TAF)/FTC. Like TDF, TAF is an oral prodrug of TFV, but it achieves lower plasma and higher intracellular TFV levels than does TDF, potentially leading to improved bone and renal tolerability. This combination pill is indicated for use in treatment-naïve adults and children aged ≥ 12 years as switch therapy for patients virologically suppressed (HIV-1 RNA < 50 copies/mL) for at least 6 months without a history of virologic failure or resistance to any of the components.44 Contraindications include use of concomitant medications that are strong inducers of CYP3A or that are heavily metabolized by CYP3A for clearance. Initiation of this STR is also not recommended in patients with an estimated CrCl < 30 mL/min or with severe hepatic impairment.
In 2 phase 3 RCTs in treatment naïve patients, EVG/c/TAF/FTC was virologically noninferior to EVG/c/TDF/FTC.45 Patients in the TAF arms had smaller declines in estimated glomerular filtration (eGFR) and reductions in bone mineral density (BMD) but higher fasting lipids compared with that of patients in the TDF arms. Switching virologically suppressed patients with mild-tomoderate renal insufficiency (eGFR 30-69 mL/min) from TDF-containing regimens to EVG/c/TDF/FTC also has demonstrated maintenance of virologic response while improving BMD and markers of renal function.46
In November 2015, EVG/c/TAF/FTC was added as a recommended regimen for initial ART treatment in patients with CrCl ≥ 30 mL/min.7 Advantages of this regimen include its favorable safety profile mentioned earlier and the indication for use in patients with mildto-moderate renal impairment, which is unique among the STRs. However, limitations still remain, including significant drug-drug interactions due to potent CYP3A inhibition and cobicistat-induced inhibition of renal tubular creatinine secretion. Also, more clinical data are needed to confirm the durability of this regimen and to assess whether its improved safety profile translates into fewer clinical outcomes such as renal failure or fractures.
Single-Tablet Regimen Pros and Cons
The proportion of patients on STRs has significantly increased over the past several years. A recently published report of the Women’s Interagency HIV Study (WIHS), a longitudinal study of HIV infection in U.S. women, has analyzed the use of STR. The study showed that the use of STR among ART users increased from 7% in 2006 to 27% in 2013.47
Advantages of STRs
Potential advantages of STRs include simplicity, convenience, and adherence, especially by eliminating the risk of selective nonadherence to components of the regimens. Observational cohorts and meta-analyses are beginning to confirm these theoretical advantages. A meta-analysis of 19 RCTs including 6,312 patients demonstrated that regimens with lower pill burdens and once-daily dosing were both associated with better adherence, and fewer pills also led to improved virologic suppression.48 In the analysis of the WIHS cohort, STR use was significantly associated with increasedadherence (adjusted risk ratio: 1.05; 95% confidence interval: 1.03 to 1.08) and virologic suppression (risk ratio: 1.06; 95% confidence interval: 1.01 to 1.11).47 Another observational cohort analysis of commercially insured HIV-infected patients showed that patients on STRs were 1.3 times more likely to achieve at least 90% adherence.49
A recent RCT, which assigned 300 patients on stable ART to continue their current regimen or switch to EFV/TDF/FTC as an STR, demonstrated no difference in virologic suppression or patient-reported adherence between the 2 groups.21 However, 91% of patients in this study reported a preference for the STR regimen.50 Single-tablet regimen recipients also have been shown to be less likely to develop treatment-emergent, drug-resistance mutations (DRMs) at the time of virologic failure. In a recently published study, patients receiving the STR EFV/FTC/TDF had a significantly lower risk of DRMs on failure than did those receiving the same components individually in a non-STR regimen.51 Finally, recent data showed that prescription errors in inpatient ART are common and often go undetected, but coformulated regimens were associated with lower error rates.52
Disadvantages of STRs
Although outweighed by the advantages, there are potential disadvantages to the use of STRs. These include the inability to adjust dosages of components of the regimen for drug-drug or drug-food interactions. In particular, patients with preexisting renal impairment (estimated CrCl < 50 mL/min) have limited options and safety data for STRs. Also, STRs do not exist currently for all NRTI-anchor drug pairings. Notably, there is no available 2 NRTI plus boosted PI STR. This limitation may be important in treatment-experienced patients where PI-based regimens may be needed or in patients with comorbidities where a NRTI-sparing regimen would be considered.
Finally, at the population level, the potential benefits of STRs must be balanced with the increased costs compared with that of generic ART regimens with multiple pills. For example, a mathematical simulation model based on 2009 U.S. data suggested that switching all patients in the U.S. from the branded STR EFV/TDF/FTC to a triple regimen of generic EFV, 3TC, and branded TDF would have saved almost $1 billion per year with only a small decrement in virologic efficacy.53 More costeffectiveness analyses are needed, especially for the developing world, to inform strategies for the use of STRs to improve outcomes in the most costeffective way globally.
When to Use STRS?
For initial ART in treatment-naïve patients, 3 of the available STRs are listed as recommended regimens by the HHS guidelines: EVG/c/TDF/FTC, DTG/ABC/3TC, or EVG/c/TAF/FTC.7 In choosing an initial regimen, a number of factors must be considered, including baseline HIV-1 resistance, drug-drug interactions, medical comorbidities, food restrictions, patient preference and convenience, and cost. Patients with drug-resistant HIV-1 or significant renal impairment are less ideal candidates for STRs for initial therapy. Otherwise, the determination typically depends on which of the NRTI backbone drugs, TDF or TAF vs ABC, is most appropriate. Clinicians may favor TDF-containing or TAFcontaining regimens in patients with HBV coinfection, clinically significant CV disease, or patients with the HLA-B*5701 genetic polymorphism.
Conversely, clinicians may favor ABC-containing or TAF-containing regimens in patients at high risk or with preexisting metabolic bone disease or more mild renal impairment. Drug-drug and drug-supplement interactions must be carefully considered in all cases. Although listed as alternative regimens, the other available STRs—EFV/TDF/FTC or RPV/TDF/FTC—may still be the preferred regimen in select individual patients.
In patients already on ART, a switch to a STR may be considered in the following scenarios, with the caveat that most of the clinical trials evaluating switch therapy have been in patients who were virologically suppressed for 6 months on their prior regimens:
Improve tolerability. In the STRATEGY-NNRTI trial, patients on a stable EFV-containing regimen experienced significant improvements in neuropsychiatric AEs after switching to EVG/c/TDF/FTC.35
Virologically suppressed patients with multiple comorbidities. Difficulty managing dyslipidemia or high CV risk might necessitate a switch from a PI-containing regimen. From the results of the SPIRIT trial54 and the STRATEGY-PI trial,34 these patients could be switched safely to RPV/TDF/FTC or EVG/c/TDF/FTC, respectively.
Management of virologic failure. This may be beneficial provided that drug resistance has not compromised the components of the regimen.
Conclusion
The potency and once-daily dosing of EFV-based regimens ushered in the era of STRs. The list of STRs has now expanded with the introduction of an RPV-based STR and, lately, 3 different INSTI-based STRs. In the current HHS guidelines, only the INSTI-based STRs are included in the recommended list, mostly because of poor tolerability of EFV/TDF/FTC and lower efficacy of RPV/TDF/FTC in patients with high baseline viremia. In general, the safety profile of STRs has been improving with newer iterations. Their main advantages are convenience, simplicity and improvements in adherence, and possibly reductions in medication errors. Due to these advantages, the percentage of patients on STRs is likely to continue rising. Further expansions of the ART armamentarium may include the development of boosted PI-based STRs as well as novel delivery strategies, such as long-acting injectable regimens.55 In the meantime, clinicians should develop a greater familiarity with the use of the currently available STRs.
1. Centers for Disease Control and Prevention. Update: trends in AIDS incidence, deaths, and prevalence—United States, 1996. MMWR Morb Mortal Wkly Rep.1997;46(8):165-173.
2. Palella FJ Jr, Delaney KM, Moorman AC, et al; HIV Outpatient Study Investigators. Declining morbidity and mortality among patients with advanced human immunodeficiency virus infection. N Engl J Med. 1998;338(13):853-860.
3. Crum NF, Riffenburgh RH, Wegner S, et al; Triservice AIDS Clinical Consortium. Comparisons of causes of death and mortality rates among HIV-infected persons:analysis of the pre-, early, and late HAART (highly active antiretroviral therapy) eras. J Acquir Immune Defic Syndr. 2006;41(2):194-200.
4. Bor J, Herbst AJ, Newell M-L, Bärnighausen T. Increases in adult life expectancy in rural South Africa: valuing the scale-up of HIV treatment. Science. 2013;339(6122):961-965.
5. Antiretroviral Therapy Cohort Collaboration. Life expectancy of individuals on combination antiretroviral therapy in high-income countries: a collaborative analysis of 14 cohort studies. Lancet. 2008;372(9635):293-299.
6. Cohen MS, Chen YQ, McCauley M, et al; the HPTN 052 Study Team. Prevention of HIV-1 infection with early antiretroviral therapy. N Engl J Med. 2011;365(6):493-505.
7. DHHS Panel on Antiretroviral Guidelines for Adults and Adolescents. Guidelines for the use of antiretroviral agents in HIV-1 infected adults and adolescents. AIDSinfo Website. https://aidsinfo.nih.gov/contentfiles/lvguidelines/adultandadolescentgl.pdf. Updated January 28, 2016. Accessed March 10, 2016.
8. Gulick RM, Ribaudo HJ, Shikuma CM, et al; AIDS Clinical Trials Group (ACTG) A5095 Study Team. Three- vs four-drug antiretroviral regimens for the initial treatment of HIV-1 infection: a randomized controlled trial. JAMA. 2006;296(7):769-781.
9. Orkin C, Stebbing J, Nelson M, et al. A randomized study comparing a three- and four-drug HAART regimen in first-line therapy (QUAD study). J Antimicrob Chemother. 2005;55(2):246-251.
10. Gandhi RT, Bosch RJ, Aga E, et al; AIDS Clinical Trials Group A5173 Team. No evidence for decay of the latent reservoir in HIV-1-infected patients receiving intensive enfuvirtide containing antiretroviral therapy. J Infect Dis. 2010;201(2): 293-296.
11. Chéret A, Nembot G, Mélard A, et al; OPTIPRIM ANRS Study Group. Intensive five-drug antiretroviral therapy regimen versus standard triple-drug therapy during primary HIV-1 infection (OPTIPRIM-ANRS 147): a randomised, open-label, phase 3 trial. Lancet Infect Dis. 2015;15(4):387-396.
12. Cahn P, Andrade-Villanueva J, Arribas JR, et al; GARDEL Study Group. Dual therapy with lopinavir and ritonavir plus lamivudine versus triple therapy with lopinavir and ritonavir plus two nucleoside reverse transcriptase inhibitors in antiretroviral-therapy-naive adults with HIV-1 infection: 48 week results of the randomised, open label, non-inferiority GARDEL trial. Lancet Infect Dis. 2014;14(7):572-580.
13. Raffi F, Babiker AG, Richert L, et al; for the NEAT001/ANRS143 Study Group. Ritonavir-boosted darunavir combined with raltegravir or tenofoviremtricitabine in antiretroviral-naive adults infected with HIV-1: 96 week results from the NEAT001/ANRS143 randomised non-inferiority trial. Lancet. 2014;384(9958):1942-1951.
14. Taiwo B, Zheng L, Gallien S, et al; ACTG A5262 Team. Efficacy of a nucleosidesparing regimen of darunavir/ritonavir plus raltegravir in treatment-naive HIV-1-infected patients (ACTG A5262). AIDS. 2011;25(17):2113-2122.
15. Bedimo RJ, Drechsler H, Jain M, et al. The RADAR study: week 48 safety and efficacy of RAltegravir combined with boosted DARunavir compared to tenofovir/emtricitabine combined with boosted darunavir in antiretroviral-naive patients. Impact on bone health. PLoS One. 2014;9(8):e106221.
16. Stellbrink HJ, Pulik P, Szlavik J, et al. Maraviroc (MVC) dosed once daily with darunavir/ritonavir (DRV/r) in a 2 drug-regimen compared to emtricitabine/tenofovir (TDF/FTC) with DRV/r; 48-week results from MODERN (Study A4001095) (Abstract). AIDS 2014 Website. http://pag.aids2014.org/Abstracts.aspx?SID=1139&AID=6180. Accessed March 11, 2016.
17. Gulick RM, Ribaudo HJ, Shikuma CM, et al; AIDS Clinical Trials Group Study A5095 Team. Triple-nucleoside regimens versus efavirenz-containing regimens for the initial treatment of HIV-1 infection. N Engl J Med. 2004;350(18):1850-1861.
18. Sax PE, DeJesus E, Mills A; GS-US-236-0102 study team. Co-formulated elvitegravir, cobicistat, emtricitabine, and tenofovir versus co-formulated efavirenz, emtricitabine, and tenofovir for initial treatment of HIV-1 infection: a randomised, double-blind, phase 3 trial, analysis of results after 48 weeks. Lancet. 2012;379(9835):2439-2448.
19. Gallant JE, DeJesus E, Arribas JR, et al; Study 934 Group. Tenofovir DF, emtricitabine, and efavirenz vs. zidovudine, lamivudine, and efavirenz for HIV. N Engl J Med. 2006;354(3):251-260.
20. Arribas JR, Pozniak AL, Gallant JE, et al. Tenofovir disoproxil fumarate, emtricitabine, and efavirenz compared with zidovudine/lamivudine and efavirenz in treatment-naive patients: 144-week analysis. J Acquir Immune Defic Syndr. 2008;47(1):74-78.
21. Dejesus E, Young B, Morales-Ramirez JO, et al; AI266073 Study Group. Simplification of antiretroviral therapy to a single-tablet regimen consisting of efavirenz, emtricitabine, and tenofovir disoproxil fumarate versus unmodified antiretroviral therapy in virologically suppressed HIV-1-infected patients. J Acquir Immune Defic Syndr. 2009;51(2):163-174.
22. Daar ES, Tierney C, Fischl MA, et al; AIDS Clinical Trials Group Study A5202 Team. Atazanavir plus ritonavir or efavirenz as part of a 3-drug regimen for initial treatment of HIV-1. Ann Intern Med. 2011;154(7):445-456.
23. Cohen CJ, Molina JM, Cassetti I, et al; ECHO, THRIVE study groups. Week 96 efficacy and safety of rilpivirine in treatment-naive, HIV-1 patients in two Phase III randomized trials. AIDS. 2013;27(6):939-950.
24. Walmsley SL, Antela A, Clumeck N, et al; SINGLE Investigators. Dolutegravir plus abacavir-lamivudine for the treatment of HIV-1 infection. N Engl J Med. 2013;369(19):1807-1818.
25. Rockstroh JK, DeJesus E, Lennox JL, et al; STARTMRK Investigators. Durable efficacy and safety of raltegravir versus efavirenz when combined with tenofovir/emtricitabine in treatment-naive HIV-1-infected patients: final 5-year results from STARTMRK. J Acquir Immune Defic Syndr. 2013;63(1):77-85.
26. Mollan KR, Smurzynski M, Eron JJ, et al. Association between efavirenz as initial therapy for HIV-1 infection and increased risk for suicidal ideation or attempted or completed suicide: an analysis of trial data. Ann Intern Med. 2014;161(1):1-10.
27. Fundarò C, Genovese O, Rendeli C, Tamburrini E, Salvaggio E. Myelomeningocele in a child with intrauterine exposure to efavirenz. AIDS. 2002;16(2):299-300.
29. Cohen C, Wohl D, Arribas JR, et al. Week 48 results from a randomized clinical trial of rilpivirine/emtricitabine/tenofovir disoproxil fumarate vs. efavirenz/emtricitabine/tenofovir disoproxil fumarate in treatment-naive HIV-1-infected adults. AIDS. 2014;28(7):989-997.
30. Mills AM, Cohen C, DeJesus E, et al. Efficacy and safety 48 weeks after switching from efavirenz to rilpivirine using emtricitabine/tenofovir disoproxil fumaratebased single-tablet regimens. HIV Clin Trials. 2013;14(5):216-223.
32. Wohl DA, Cohen C, Gallant JE, et al; GS-US-236-0102 Study Team. A randomized, double-blind comparison of single-tablet regimen elvitegravir/cobicistat/emtricitabin/tenofovir DF versus single-tablet regimen efavirenz/emtricitabine/tenofovir DF for initial treatment of HIV-1 infection: analysis of week 144 results. J Acquir Immune Defic Syndr. 2014;65(3):e118-e120.
33. DeJesus E, Rockstroh JK, Henry K, et al; GS-236-0103 Study Team. Co-formulated elvitegravir, cobicistat, emtricitabine, and tenofovir disoproxil fumarate versus ritonavir-boosted atazanavir plus co-formulated emtricitabine and tenofovir disoproxil fumarate for initial treatment of HIV-1 infection: a randomised, doubleblind, phase 3, non-inferiority trial. Lancet. 2012;379(9835):2429-2438.
34. Arribas JR, Pialoux G, Gathe J, et al. Simplification to coformulated elvitegravir, cobicistat, emtricitabine, and tenofovir versus continuation of ritonavir-boosted protease inhibitor with emtricitabine and tenofovir in adults with virologically suppressed HIV (STRATEGY-PI): 48 week results of a randomised, open-label, phase 3b, non-inferiority trial. Lancet Infect Dis. 2014;14(7):581-589.
35. Pozniak A, Markowitz M, Mills A, et al. Switching to coformulated elvitegravir, cobicistat, emtricitabine, and tenofovir versus continuation of non-nucleoside reverse transcriptase inhibitor with emtricitabine and tenofovir in virologically suppressed adults with HIV (STRATEGY-NNRTI): 48 week results of a randomised, open-label, phase 3b non-inferiority trial. Lancet Infect Dis. 2014;14(7):590-599.
37. Mallal S, Phillips E, Carosi G, et al. HLA-B*5701 screening for hypersensitivity to abacavir. N Engl J Med. 2008;358(6):568-579.
38. Raffi F, Rachlis A, Stellbrink HJ, et al. Once-daily dolutegravir versus raltegravir in antiretroviral-naive adults with HIV-1 infection: 48 week results from the randomised, double-blind, non-inferiority SPRING-2 study. Lancet. 2013;381(9868):735-743.
39. Clotet B, Feinberg J, van Lunzen J, et al; ING114915 Study Team. Once-daily dolutegravir versus darunavir plus ritonavir in antiretroviral-naive adults with HIV-1 infection (FLAMINGO): 48 week results from the randomised open-label phase p3b study. Lancet. 2014;383(9936):2222-2231.
40. Strategies for Management of Anti-Retroviral Therapy/INSIGHT; DAD Study Groups. Use of nucleoside reverse transcriptase inhibitors and risk of myocardial infarction in HIV-infected patients. AIDS. 2008;22(14):F17-F24.
41. Bedimo RJ, Westfall AO, Drechsler H, Vidiella G, Tebas P. Abacavir use and risk of acute myocardial infarction and cerebrovascular events in the highly active antiretroviral therapy era. Clin Infect Dis. 2011;53(1):84-91.
42. Ding X, Andraca-Carrera E, Cooper C, et al. No association of abacavir use with myocardial infarction: findings of an FDA meta-analysis. J Acquir Immune Defic Syndr. 2012;61(4):441-447.
43. Desai M, Joyce V, Bendavid E, et al. Risk of cardiovascular events associated with current exposure to HIV antiretroviral therapies in a US veteran population. Clin Infect Dis. 2015;61(3):445-452.
45. Sax PE, Wohl D, Yin MT, et al. Tenofovir alafenamide versus tenofovir disoproxil fumarate, coformulated with elvitegravir, cobicistat, and emtricitabine, for initial treatment of HIV-1 infection: two randomised, double-blind, phase 3, non-inferiority trials. Lancet. 2015;385(9987):2606-2615.
46. Mills A, Arribas JR, Andrade-Villanueva J, et al. Switching from tenofovir disoproxil fumarate to tenofovir alafenamide in antiretroviral regimens for virologically suppressed adults with HIV-1 infection: a randomised, active-controlled, multicentre, open-label, phase 3, non-inferiority study. Lancet Infect Dis. 2016;16(1):43-52.
47. Hanna DB, Hessol NA, Golub ET, et al. Increase in single-tablet regimen use and associated improvements in adherence-related outcomes in HIV-infected women. J Acquir Immune Defic Syndr. 2014;65(5):587-596.
48. Nachega JB, Parienti JJ, Uthman OA, et al. Lower pill burden and once-daily antiretroviral treatment regimens for HIV infection: a meta-analysis of randomized controlled trials. Clin Infect Dis. 2014;58(9):1297-1307.
49. Cooke CE, Lee HY, Xing S. Adherence to antiretroviral therapy in managed care members in the United States: a retrospective claims analysis. J Manag Care Pharm. 2014;20(1):86-92.
50. Hodder SL, Mounzer K, DeJesus E, et al; AI266073 Study Group. Patient-reported outcomes in virologically suppressed, HIV-1-iInfected subjects after switching to a simplified, single-tablet regimen of efavirenz, emtricitabine, and tenofovir DF. AIDS Patient Care STDS. 2010;24(2):87-96.
51. Blanco JL, Montaner JS, Marconi VC, et al. Lower prevalence of drug resistance mutations at first-line virological failure to first-line therapy with atripla vs. tenofovir + emtricitabine/lamivudine + efavirenz administered on a multiple tablet therapy. AIDS. 2014;28(17):2531-2539.
52. Commers T, Swindells S, Sayles H, Gross AE, Devetten M, Sandkovsky U. Antiretroviral medication prescribing errors are common with hospitalization of HIV infected patients. J Antimicrob Chemother. 2014;69(1):262-267.
53. Walensky RP, Sax PE, Nakamura YM, et al. Economic savings versus health losses: the cost-effectiveness of generic antiretroviral therapy in the United States. Ann Intern Med. 2013;158(2):84-92.
54. Palella FJ Jr, Fisher M, Tebas P, et al. Simplification to rilpivirine/emtricitabine/ tenofovir disoproxil fumarate from ritonavir-boosted protease inhibitor antiretroviral therapy in a randomized trial of HIV-1 RNA-suppressed participants. AIDS. 2014;28(3):335-344.
55. Gulick R. HIV treatment 2020: what will it look like? J Int AIDS Soc. 2014;17(4)(suppl 3):19528.
Author and Disclosure Information
Dr. Cutrell is a staff physician, and Dr. Bedimo is the chief of the Infectious Diseases Section, both at the VA North Texas Health Care System in Dallas, Texas. Dr. Cutrell is assistant professor of medicine, and Dr. Bedimo is associate professor of medicine, both at the University of Texas Southwestern Medical Center in Dallas.
Author disclosures The authors report no actual or potential conflicts of interest with regard to this article.
Disclaimer The opinions expressed herein are those of the authors and do not necessarily reflect those of Federal Practitioner, Frontline Medical Communications Inc., the U.S. Government, or any of its agencies. This article may discuss unlabeled or investigational use of certain drugs. Please review complete prescribing information for specific drugs or drug combinations—including indications, contraindications, warnings, and adverse effects—before administering pharmacologic therapy to patients.
Author and Disclosure Information
Dr. Cutrell is a staff physician, and Dr. Bedimo is the chief of the Infectious Diseases Section, both at the VA North Texas Health Care System in Dallas, Texas. Dr. Cutrell is assistant professor of medicine, and Dr. Bedimo is associate professor of medicine, both at the University of Texas Southwestern Medical Center in Dallas.
Author disclosures The authors report no actual or potential conflicts of interest with regard to this article.
Disclaimer The opinions expressed herein are those of the authors and do not necessarily reflect those of Federal Practitioner, Frontline Medical Communications Inc., the U.S. Government, or any of its agencies. This article may discuss unlabeled or investigational use of certain drugs. Please review complete prescribing information for specific drugs or drug combinations—including indications, contraindications, warnings, and adverse effects—before administering pharmacologic therapy to patients.
The emergence of highly active antiretroviral therapies has decreased mortality, increased viral suppression, and significantly reduced the risk of the sexual transmission of HIV.
The emergence of highly active antiretroviral therapies has decreased mortality, increased viral suppression, and significantly reduced the risk of the sexual transmission of HIV.
Together with prophylaxis for opportunistic infections, the widespread use of combination antiretroviral therapy (ART)—known as highly active antiretroviral therapy (HAART)—led to substantial gains in the life expectancy of patients infected with human immunodeficiency virus type 1 (HIV-1).1-3 The emergence of HAARTs has decreased mortality, increased viral suppression, and significantly reduced the risk of the sexual transmission of HIV.4-6
Since its introduction, HAART has evolved significantly with more options for triple therapy combinations that show improved efficacy, convenience, and tolerability. Single-tablet regimens (STRs) are the culmination of this evolution. The first STR was introduced in 2006, and to date, there are 5 STR options approved for use. In this review, the authors discuss the rationale and path to development of STRs, compare the currently available STRs, and discuss practical considerations in their use for the treatment of HIV-1 infection.
Is Triple Therapy The Sweet Spot?
Because current ART cannot eradicate HIV-1 infection due to latently infected CD4+ T-cell reservoirs, the primary goals of ART according to the HHS guidelines are to (1) reduce HIV-associated morbidity and prolong the duration and quality of survival; (2) restore and preserve immunologic function; (3) maximally and durably suppress plasma HIV viral load; and (4) prevent HIV transmission.7
These goals currently seem to be optimally achieved by treatment with 3 active agents, usually consisting of 2 nucleos(t)ide reverse-transcriptase inhibitors (NRTIs) as a backbone plus a drug from 1 of 3 drug classes: an integrase strand transfer inhibitor (INSTI), a nonnucleoside reverse-transcriptase inhibitor (NNRTI), or a protease inhibitor (PI) boosted with ritonavir or cobicistat. The most widely used NRTI backbones are abacavir plus lamivudine (ABC/3TC) or tenofovir disoproxil fumarate plus emtricitabine (TDF/FTC). Attempts to increase the number of active drugs in a regimen (≥ 4) have generally failed to yield additional virologic or immunologic benefits. Conversely, recent attempts to decrease the number of drugs in a regimen (≤ 2) have met with mixed success.
Mega-HAART
The AIDS Clinical Trial Group (ACTG) 5095 was a randomized controlled trial (RCT) to compare the safety and efficacy of a 3-drug regimen (zidovudine/lamivudine [AZT/3TC] plus efavirenz [EFV]) vs a 4-drug regimen (AZT/3TC/ABC plus EFV) in the initial treatment of HIV-1 infection.8 There were no significant differences in virologic efficacy between the 3-drug and 4-drug regimens, findings that have been corroborated in subsequent studies.9,10 Intensified (≥ 4 drugs) regimens have also failed to lead to significant decay in viral reservoir.10,11
Dual Therapy With Newer Agents
Recent clinical studies have explored the use of fewer medications in treatment-naïve HIV-infected patients. In the GARDEL study, dual therapy consisting of lopinavir/ritonavir (LPV/RTV) plus 3TC proved to be virologically noninferior to triple therapy of LPV/RTV plus 2 NRTIs in a fixed-dose combination.12 In a large European clinical trial (NEAT001/ANRS143), the combination of darunavir/ritonavir (DRV/RTV) plus raltegravir (RAL) was noninferior to DRV/RTV plus TDF/FTC, although more virologic failures were seen in the dual-therapy arm for patients with high baseline HIV-1 RNA viral loads or low baseline CD4+ counts.13
Suboptimal virologic responses also were observed with the DRV/RTV plus RAL regimen in several smaller studies: ACTG 5262 and RADAR.14,15 Finally, a combination of DRV/RTV plus maraviroc proved virologically inferior to standard DRV/RTV plus TDF/FTC in the MODERN trial.16 Although some dual-agent regimens have shown promise, none have established consistent and durable virologic efficacy sufficient to supplant triple therapy, which is currently endorsed by treatment guidelines and forms the basis for current STRs.
Current Single-Tablet Regimens
There are currently 5 STRs available for the treatment of HIV-1 infection, 3 are among the recommended regimens for ART in treatment-naïve patients. An older, triple NRTI-based STR (AZT/3TC/ABC) has fallen out of routine use due to inferior virologic efficacy, toxicities, and better-tolerated alternative agents.17 A review of the indications for use, major clinical trials, and unique features of available STRs follows and is summarized in the Table.
Efavirenz/tenofovir DF/emtricitabine
The first widely used STR, Atripla (Bristol-Myers Squibb and Gilead Sciences) combines the NRTIs tenofovir DF and FTC with the NNRTI EFV and was released in 2006. It is indicated for use alone or in combination with other ARTs for treatment of HIV-1 infection in adults or children aged > 12 years.18 Contraindications include hypersensitivity to efavirenz or coadministration with voriconazole. Major precautions are required for patients with severe psychiatric disease or suicidality; new or worsening renal impairment; women in the first trimester of pregnancy or of childbearing age not on effective contraception; or osteoporosis or history of fragility fractures. Patients with chronic liver disease also should be monitored for hepatotoxicity.
Large RCTs confirmed the potency and durability of viral suppression of EFV/TDF/FTC in treatment-naïve patients19,20 or in the context of antiretroviral switching for treatment simplification in patients previously suppressed with NNRTI- or PI-based regimens.21 This combination has been shown to be noninferior or superior to multiple PI-based,22 NNRTI-based,23 and INSTI-based regimens.18 However, it recently was found to be associated with lower virologic response than was the INSTI-based regimen of ABC/3TC plus dolutegravir (DTG) and higher discontinuation rates than that of a TDF/FTC plus RAL regimen.24,25 Due to lingering concerns about an EFV association with suicidality26 and neural tube defects with first trimester exposure,27 EFV/TDF/FTC was downgraded to an alternative regimen for treatmentnaïve patients, because other available regimens are better tolerated with equal or superior efficacy.7
Rilpivirine/tenofovir DF/emtricitabine
Approved in 2011, Complera was the second STR (Gilead Sciences), combining the NNRTI rilpivirine (RPV) with the NRTI backbone TDF/FTC. It is indicated for use in (1) treatment-naïve adults with a baseline HIV-1 RNA ≤ 100,000 copies/mL and baseline CD4+ > 200 cells/mm3; or (2) switch therapy (changing from a previous antiretroviral regimen) in patients virologically suppressed (HIV-1 RNA ≤ 50 copies/mL) for at least 6 months without history of virologic failure or resistance to any of the component drugs.28 Contraindications include administration with other drugs that significantly lower RPV concentrations, such as certain acid-lowering drugs. Although not associated with as many neuropsychiatric or teratogenic effects as EFV/TDF/FTC, this combination still requires caution in circumstances of preexisting renal impairment, severe hepatic disease, or bone disease.
Two phase 3 studies and 1 open-label phase 3b study confirmed that RPV-based STRs were noninferior to EFVbased STRs overall.23,29 Importantly, patients with higher baseline viral loads experienced higher rates of virologic failure and higher rates of NRTI backbone resistance. Patients with baseline CD4+ < 200 cells/mm3 also had higher virologic failure rates. Because of these virologic and immunologic prerequisites for use, RPV/TDF/FTC is considered an alternative regimen for treatment-naïve patients.7 On the other hand, in the aforementioned studies, fewer patients in the RPV arms discontinued therapy due to adverse events (AEs), and a switch from EFV/TDF/FTC to RPV/TDF/FTC was shown to be safe and effective.30 Its greater tolerability and safety profile make RPV/TDF/FTC an option for patients who do not tolerate EFV/TDF/3TC, who are pregnant, and who have a psychiatric illness.
Released in 2012, Stribild (Gilead Sciences) was the first treatment to combine an INSTI and elvitegravir (EVG) with the pharmacologic booster cobicistat and the TDF/FTC backbone. It is indicated for use in treatmentnaïve adults or as switch therapy in patients virologically suppressed (HIV-1 RNA < 50 copies/mL) for at least 6 months without a history of virologic failure or resistance to any of the components.31
Two double-blind, active-controlled trials established that EVG/c/TDF/FTC was virologically noninferior and had greater safety and tolerability than that of EFV/TDF/FTC32 and ATV/RTV plus DF/FTC33 in treatment-naïve patients. It also maintained virologic suppression in patients switching from a boosted PI34 or an NNRTI-based regimen.35 On the basis of this efficacy and safety data, EVG/c/TDF/FTC is considered a recommended regimen for initial ART treatment.7 However, limitations to this regimen include significant drug-drug interactions due to potent CYP3A inhibition by cobicistat, potential renal and bone toxicity due to TDF, and cobicistat-induced inhibition of renal tubular creatinine secretion, which can lead to a mild creatinine increase (≤ 0.4 mg/dL) and may complicate renal function monitoring. Therefore, it is contraindicated in patients concomitantly taking medications that are strong inducers of CYP3A or that are heavily metabolized by CYP3A for clearance, patients with reduced renal function (estimated creatinine clearance [CrCl] < 70 mL/min), and those receiving polyvalent cationic antacids or supplements.
Dolutegravir/abacavir/lamivudine
Approved in 2014, Triumeq (ViiV Healthcare) is the first and only currently available STR with an NRTI backbone of ABC/3TC rather than a tenofovir (TFV) derivative, combined with the INSTI DTG. It is indicated for the treatment of HIV-1 infection in patients without prior resistance to the INSTI class of ART or the other component drugs in this combination pill.36 The major contraindication is presence of the HLA-B*5701 allele, a polymorphism that predicts abacavir-related hypersensitivity, or moderate-tosevere hepatic impairment.37 Caution is required in patients with hepatitis B virus (HBV) co-infection due to the risk of 3TC drug resistance and subsequent acute exacerbation of HBV. Coadministration with dofetilide is contraindicated, and coadministration of some medications, most notably rifampin, requires an additional dose of DTG alone be given.36 Dolutegravir absorption is also decreased when coadministered with polyvalent cationic antacids or laxatives.
Dolutegravir-based regimens have been shown to be noninferior to RAL-based regimens38 and superior to EFV/TDF/FTC24 and boosted DRV-based regimens.39 Treatment-emergent resistance to DTG has been rare, suggesting a high genetic barrier to resistance compared with that of other INSTIs. On this basis, DTG/ABC/3TC is considered a recommended regimen for initial ART treatment.7 Another advantage of DTG/ABC/3TC is fewer drug-drug interactions than those of PI- or NNRTI-based regimens or the EVG/c/TDF/FTC STR.24,38,39 Limitations include the requirement to confirm a negative HLAB* 5701 allele, the potential association of abacavir with cardiovascular (CV) events seen in some but not all studies, and a small increase in creatinine due to DTG effects on renal tubular secretion.40-43
The latest STR, Genvoya (Gilead Sciences), approved in 2015, combines the INSTI elvitegravir and cobicistat with the novel NRTI backbone alafenamide(TAF)/FTC. Like TDF, TAF is an oral prodrug of TFV, but it achieves lower plasma and higher intracellular TFV levels than does TDF, potentially leading to improved bone and renal tolerability. This combination pill is indicated for use in treatment-naïve adults and children aged ≥ 12 years as switch therapy for patients virologically suppressed (HIV-1 RNA < 50 copies/mL) for at least 6 months without a history of virologic failure or resistance to any of the components.44 Contraindications include use of concomitant medications that are strong inducers of CYP3A or that are heavily metabolized by CYP3A for clearance. Initiation of this STR is also not recommended in patients with an estimated CrCl < 30 mL/min or with severe hepatic impairment.
In 2 phase 3 RCTs in treatment naïve patients, EVG/c/TAF/FTC was virologically noninferior to EVG/c/TDF/FTC.45 Patients in the TAF arms had smaller declines in estimated glomerular filtration (eGFR) and reductions in bone mineral density (BMD) but higher fasting lipids compared with that of patients in the TDF arms. Switching virologically suppressed patients with mild-tomoderate renal insufficiency (eGFR 30-69 mL/min) from TDF-containing regimens to EVG/c/TDF/FTC also has demonstrated maintenance of virologic response while improving BMD and markers of renal function.46
In November 2015, EVG/c/TAF/FTC was added as a recommended regimen for initial ART treatment in patients with CrCl ≥ 30 mL/min.7 Advantages of this regimen include its favorable safety profile mentioned earlier and the indication for use in patients with mildto-moderate renal impairment, which is unique among the STRs. However, limitations still remain, including significant drug-drug interactions due to potent CYP3A inhibition and cobicistat-induced inhibition of renal tubular creatinine secretion. Also, more clinical data are needed to confirm the durability of this regimen and to assess whether its improved safety profile translates into fewer clinical outcomes such as renal failure or fractures.
Single-Tablet Regimen Pros and Cons
The proportion of patients on STRs has significantly increased over the past several years. A recently published report of the Women’s Interagency HIV Study (WIHS), a longitudinal study of HIV infection in U.S. women, has analyzed the use of STR. The study showed that the use of STR among ART users increased from 7% in 2006 to 27% in 2013.47
Advantages of STRs
Potential advantages of STRs include simplicity, convenience, and adherence, especially by eliminating the risk of selective nonadherence to components of the regimens. Observational cohorts and meta-analyses are beginning to confirm these theoretical advantages. A meta-analysis of 19 RCTs including 6,312 patients demonstrated that regimens with lower pill burdens and once-daily dosing were both associated with better adherence, and fewer pills also led to improved virologic suppression.48 In the analysis of the WIHS cohort, STR use was significantly associated with increasedadherence (adjusted risk ratio: 1.05; 95% confidence interval: 1.03 to 1.08) and virologic suppression (risk ratio: 1.06; 95% confidence interval: 1.01 to 1.11).47 Another observational cohort analysis of commercially insured HIV-infected patients showed that patients on STRs were 1.3 times more likely to achieve at least 90% adherence.49
A recent RCT, which assigned 300 patients on stable ART to continue their current regimen or switch to EFV/TDF/FTC as an STR, demonstrated no difference in virologic suppression or patient-reported adherence between the 2 groups.21 However, 91% of patients in this study reported a preference for the STR regimen.50 Single-tablet regimen recipients also have been shown to be less likely to develop treatment-emergent, drug-resistance mutations (DRMs) at the time of virologic failure. In a recently published study, patients receiving the STR EFV/FTC/TDF had a significantly lower risk of DRMs on failure than did those receiving the same components individually in a non-STR regimen.51 Finally, recent data showed that prescription errors in inpatient ART are common and often go undetected, but coformulated regimens were associated with lower error rates.52
Disadvantages of STRs
Although outweighed by the advantages, there are potential disadvantages to the use of STRs. These include the inability to adjust dosages of components of the regimen for drug-drug or drug-food interactions. In particular, patients with preexisting renal impairment (estimated CrCl < 50 mL/min) have limited options and safety data for STRs. Also, STRs do not exist currently for all NRTI-anchor drug pairings. Notably, there is no available 2 NRTI plus boosted PI STR. This limitation may be important in treatment-experienced patients where PI-based regimens may be needed or in patients with comorbidities where a NRTI-sparing regimen would be considered.
Finally, at the population level, the potential benefits of STRs must be balanced with the increased costs compared with that of generic ART regimens with multiple pills. For example, a mathematical simulation model based on 2009 U.S. data suggested that switching all patients in the U.S. from the branded STR EFV/TDF/FTC to a triple regimen of generic EFV, 3TC, and branded TDF would have saved almost $1 billion per year with only a small decrement in virologic efficacy.53 More costeffectiveness analyses are needed, especially for the developing world, to inform strategies for the use of STRs to improve outcomes in the most costeffective way globally.
When to Use STRS?
For initial ART in treatment-naïve patients, 3 of the available STRs are listed as recommended regimens by the HHS guidelines: EVG/c/TDF/FTC, DTG/ABC/3TC, or EVG/c/TAF/FTC.7 In choosing an initial regimen, a number of factors must be considered, including baseline HIV-1 resistance, drug-drug interactions, medical comorbidities, food restrictions, patient preference and convenience, and cost. Patients with drug-resistant HIV-1 or significant renal impairment are less ideal candidates for STRs for initial therapy. Otherwise, the determination typically depends on which of the NRTI backbone drugs, TDF or TAF vs ABC, is most appropriate. Clinicians may favor TDF-containing or TAFcontaining regimens in patients with HBV coinfection, clinically significant CV disease, or patients with the HLA-B*5701 genetic polymorphism.
Conversely, clinicians may favor ABC-containing or TAF-containing regimens in patients at high risk or with preexisting metabolic bone disease or more mild renal impairment. Drug-drug and drug-supplement interactions must be carefully considered in all cases. Although listed as alternative regimens, the other available STRs—EFV/TDF/FTC or RPV/TDF/FTC—may still be the preferred regimen in select individual patients.
In patients already on ART, a switch to a STR may be considered in the following scenarios, with the caveat that most of the clinical trials evaluating switch therapy have been in patients who were virologically suppressed for 6 months on their prior regimens:
Improve tolerability. In the STRATEGY-NNRTI trial, patients on a stable EFV-containing regimen experienced significant improvements in neuropsychiatric AEs after switching to EVG/c/TDF/FTC.35
Virologically suppressed patients with multiple comorbidities. Difficulty managing dyslipidemia or high CV risk might necessitate a switch from a PI-containing regimen. From the results of the SPIRIT trial54 and the STRATEGY-PI trial,34 these patients could be switched safely to RPV/TDF/FTC or EVG/c/TDF/FTC, respectively.
Management of virologic failure. This may be beneficial provided that drug resistance has not compromised the components of the regimen.
Conclusion
The potency and once-daily dosing of EFV-based regimens ushered in the era of STRs. The list of STRs has now expanded with the introduction of an RPV-based STR and, lately, 3 different INSTI-based STRs. In the current HHS guidelines, only the INSTI-based STRs are included in the recommended list, mostly because of poor tolerability of EFV/TDF/FTC and lower efficacy of RPV/TDF/FTC in patients with high baseline viremia. In general, the safety profile of STRs has been improving with newer iterations. Their main advantages are convenience, simplicity and improvements in adherence, and possibly reductions in medication errors. Due to these advantages, the percentage of patients on STRs is likely to continue rising. Further expansions of the ART armamentarium may include the development of boosted PI-based STRs as well as novel delivery strategies, such as long-acting injectable regimens.55 In the meantime, clinicians should develop a greater familiarity with the use of the currently available STRs.
1. Centers for Disease Control and Prevention. Update: trends in AIDS incidence, deaths, and prevalence—United States, 1996. MMWR Morb Mortal Wkly Rep.1997;46(8):165-173.
2. Palella FJ Jr, Delaney KM, Moorman AC, et al; HIV Outpatient Study Investigators. Declining morbidity and mortality among patients with advanced human immunodeficiency virus infection. N Engl J Med. 1998;338(13):853-860.
3. Crum NF, Riffenburgh RH, Wegner S, et al; Triservice AIDS Clinical Consortium. Comparisons of causes of death and mortality rates among HIV-infected persons:analysis of the pre-, early, and late HAART (highly active antiretroviral therapy) eras. J Acquir Immune Defic Syndr. 2006;41(2):194-200.
4. Bor J, Herbst AJ, Newell M-L, Bärnighausen T. Increases in adult life expectancy in rural South Africa: valuing the scale-up of HIV treatment. Science. 2013;339(6122):961-965.
5. Antiretroviral Therapy Cohort Collaboration. Life expectancy of individuals on combination antiretroviral therapy in high-income countries: a collaborative analysis of 14 cohort studies. Lancet. 2008;372(9635):293-299.
6. Cohen MS, Chen YQ, McCauley M, et al; the HPTN 052 Study Team. Prevention of HIV-1 infection with early antiretroviral therapy. N Engl J Med. 2011;365(6):493-505.
7. DHHS Panel on Antiretroviral Guidelines for Adults and Adolescents. Guidelines for the use of antiretroviral agents in HIV-1 infected adults and adolescents. AIDSinfo Website. https://aidsinfo.nih.gov/contentfiles/lvguidelines/adultandadolescentgl.pdf. Updated January 28, 2016. Accessed March 10, 2016.
8. Gulick RM, Ribaudo HJ, Shikuma CM, et al; AIDS Clinical Trials Group (ACTG) A5095 Study Team. Three- vs four-drug antiretroviral regimens for the initial treatment of HIV-1 infection: a randomized controlled trial. JAMA. 2006;296(7):769-781.
9. Orkin C, Stebbing J, Nelson M, et al. A randomized study comparing a three- and four-drug HAART regimen in first-line therapy (QUAD study). J Antimicrob Chemother. 2005;55(2):246-251.
10. Gandhi RT, Bosch RJ, Aga E, et al; AIDS Clinical Trials Group A5173 Team. No evidence for decay of the latent reservoir in HIV-1-infected patients receiving intensive enfuvirtide containing antiretroviral therapy. J Infect Dis. 2010;201(2): 293-296.
11. Chéret A, Nembot G, Mélard A, et al; OPTIPRIM ANRS Study Group. Intensive five-drug antiretroviral therapy regimen versus standard triple-drug therapy during primary HIV-1 infection (OPTIPRIM-ANRS 147): a randomised, open-label, phase 3 trial. Lancet Infect Dis. 2015;15(4):387-396.
12. Cahn P, Andrade-Villanueva J, Arribas JR, et al; GARDEL Study Group. Dual therapy with lopinavir and ritonavir plus lamivudine versus triple therapy with lopinavir and ritonavir plus two nucleoside reverse transcriptase inhibitors in antiretroviral-therapy-naive adults with HIV-1 infection: 48 week results of the randomised, open label, non-inferiority GARDEL trial. Lancet Infect Dis. 2014;14(7):572-580.
13. Raffi F, Babiker AG, Richert L, et al; for the NEAT001/ANRS143 Study Group. Ritonavir-boosted darunavir combined with raltegravir or tenofoviremtricitabine in antiretroviral-naive adults infected with HIV-1: 96 week results from the NEAT001/ANRS143 randomised non-inferiority trial. Lancet. 2014;384(9958):1942-1951.
14. Taiwo B, Zheng L, Gallien S, et al; ACTG A5262 Team. Efficacy of a nucleosidesparing regimen of darunavir/ritonavir plus raltegravir in treatment-naive HIV-1-infected patients (ACTG A5262). AIDS. 2011;25(17):2113-2122.
15. Bedimo RJ, Drechsler H, Jain M, et al. The RADAR study: week 48 safety and efficacy of RAltegravir combined with boosted DARunavir compared to tenofovir/emtricitabine combined with boosted darunavir in antiretroviral-naive patients. Impact on bone health. PLoS One. 2014;9(8):e106221.
16. Stellbrink HJ, Pulik P, Szlavik J, et al. Maraviroc (MVC) dosed once daily with darunavir/ritonavir (DRV/r) in a 2 drug-regimen compared to emtricitabine/tenofovir (TDF/FTC) with DRV/r; 48-week results from MODERN (Study A4001095) (Abstract). AIDS 2014 Website. http://pag.aids2014.org/Abstracts.aspx?SID=1139&AID=6180. Accessed March 11, 2016.
17. Gulick RM, Ribaudo HJ, Shikuma CM, et al; AIDS Clinical Trials Group Study A5095 Team. Triple-nucleoside regimens versus efavirenz-containing regimens for the initial treatment of HIV-1 infection. N Engl J Med. 2004;350(18):1850-1861.
18. Sax PE, DeJesus E, Mills A; GS-US-236-0102 study team. Co-formulated elvitegravir, cobicistat, emtricitabine, and tenofovir versus co-formulated efavirenz, emtricitabine, and tenofovir for initial treatment of HIV-1 infection: a randomised, double-blind, phase 3 trial, analysis of results after 48 weeks. Lancet. 2012;379(9835):2439-2448.
19. Gallant JE, DeJesus E, Arribas JR, et al; Study 934 Group. Tenofovir DF, emtricitabine, and efavirenz vs. zidovudine, lamivudine, and efavirenz for HIV. N Engl J Med. 2006;354(3):251-260.
20. Arribas JR, Pozniak AL, Gallant JE, et al. Tenofovir disoproxil fumarate, emtricitabine, and efavirenz compared with zidovudine/lamivudine and efavirenz in treatment-naive patients: 144-week analysis. J Acquir Immune Defic Syndr. 2008;47(1):74-78.
21. Dejesus E, Young B, Morales-Ramirez JO, et al; AI266073 Study Group. Simplification of antiretroviral therapy to a single-tablet regimen consisting of efavirenz, emtricitabine, and tenofovir disoproxil fumarate versus unmodified antiretroviral therapy in virologically suppressed HIV-1-infected patients. J Acquir Immune Defic Syndr. 2009;51(2):163-174.
22. Daar ES, Tierney C, Fischl MA, et al; AIDS Clinical Trials Group Study A5202 Team. Atazanavir plus ritonavir or efavirenz as part of a 3-drug regimen for initial treatment of HIV-1. Ann Intern Med. 2011;154(7):445-456.
23. Cohen CJ, Molina JM, Cassetti I, et al; ECHO, THRIVE study groups. Week 96 efficacy and safety of rilpivirine in treatment-naive, HIV-1 patients in two Phase III randomized trials. AIDS. 2013;27(6):939-950.
24. Walmsley SL, Antela A, Clumeck N, et al; SINGLE Investigators. Dolutegravir plus abacavir-lamivudine for the treatment of HIV-1 infection. N Engl J Med. 2013;369(19):1807-1818.
25. Rockstroh JK, DeJesus E, Lennox JL, et al; STARTMRK Investigators. Durable efficacy and safety of raltegravir versus efavirenz when combined with tenofovir/emtricitabine in treatment-naive HIV-1-infected patients: final 5-year results from STARTMRK. J Acquir Immune Defic Syndr. 2013;63(1):77-85.
26. Mollan KR, Smurzynski M, Eron JJ, et al. Association between efavirenz as initial therapy for HIV-1 infection and increased risk for suicidal ideation or attempted or completed suicide: an analysis of trial data. Ann Intern Med. 2014;161(1):1-10.
27. Fundarò C, Genovese O, Rendeli C, Tamburrini E, Salvaggio E. Myelomeningocele in a child with intrauterine exposure to efavirenz. AIDS. 2002;16(2):299-300.
29. Cohen C, Wohl D, Arribas JR, et al. Week 48 results from a randomized clinical trial of rilpivirine/emtricitabine/tenofovir disoproxil fumarate vs. efavirenz/emtricitabine/tenofovir disoproxil fumarate in treatment-naive HIV-1-infected adults. AIDS. 2014;28(7):989-997.
30. Mills AM, Cohen C, DeJesus E, et al. Efficacy and safety 48 weeks after switching from efavirenz to rilpivirine using emtricitabine/tenofovir disoproxil fumaratebased single-tablet regimens. HIV Clin Trials. 2013;14(5):216-223.
32. Wohl DA, Cohen C, Gallant JE, et al; GS-US-236-0102 Study Team. A randomized, double-blind comparison of single-tablet regimen elvitegravir/cobicistat/emtricitabin/tenofovir DF versus single-tablet regimen efavirenz/emtricitabine/tenofovir DF for initial treatment of HIV-1 infection: analysis of week 144 results. J Acquir Immune Defic Syndr. 2014;65(3):e118-e120.
33. DeJesus E, Rockstroh JK, Henry K, et al; GS-236-0103 Study Team. Co-formulated elvitegravir, cobicistat, emtricitabine, and tenofovir disoproxil fumarate versus ritonavir-boosted atazanavir plus co-formulated emtricitabine and tenofovir disoproxil fumarate for initial treatment of HIV-1 infection: a randomised, doubleblind, phase 3, non-inferiority trial. Lancet. 2012;379(9835):2429-2438.
34. Arribas JR, Pialoux G, Gathe J, et al. Simplification to coformulated elvitegravir, cobicistat, emtricitabine, and tenofovir versus continuation of ritonavir-boosted protease inhibitor with emtricitabine and tenofovir in adults with virologically suppressed HIV (STRATEGY-PI): 48 week results of a randomised, open-label, phase 3b, non-inferiority trial. Lancet Infect Dis. 2014;14(7):581-589.
35. Pozniak A, Markowitz M, Mills A, et al. Switching to coformulated elvitegravir, cobicistat, emtricitabine, and tenofovir versus continuation of non-nucleoside reverse transcriptase inhibitor with emtricitabine and tenofovir in virologically suppressed adults with HIV (STRATEGY-NNRTI): 48 week results of a randomised, open-label, phase 3b non-inferiority trial. Lancet Infect Dis. 2014;14(7):590-599.
37. Mallal S, Phillips E, Carosi G, et al. HLA-B*5701 screening for hypersensitivity to abacavir. N Engl J Med. 2008;358(6):568-579.
38. Raffi F, Rachlis A, Stellbrink HJ, et al. Once-daily dolutegravir versus raltegravir in antiretroviral-naive adults with HIV-1 infection: 48 week results from the randomised, double-blind, non-inferiority SPRING-2 study. Lancet. 2013;381(9868):735-743.
39. Clotet B, Feinberg J, van Lunzen J, et al; ING114915 Study Team. Once-daily dolutegravir versus darunavir plus ritonavir in antiretroviral-naive adults with HIV-1 infection (FLAMINGO): 48 week results from the randomised open-label phase p3b study. Lancet. 2014;383(9936):2222-2231.
40. Strategies for Management of Anti-Retroviral Therapy/INSIGHT; DAD Study Groups. Use of nucleoside reverse transcriptase inhibitors and risk of myocardial infarction in HIV-infected patients. AIDS. 2008;22(14):F17-F24.
41. Bedimo RJ, Westfall AO, Drechsler H, Vidiella G, Tebas P. Abacavir use and risk of acute myocardial infarction and cerebrovascular events in the highly active antiretroviral therapy era. Clin Infect Dis. 2011;53(1):84-91.
42. Ding X, Andraca-Carrera E, Cooper C, et al. No association of abacavir use with myocardial infarction: findings of an FDA meta-analysis. J Acquir Immune Defic Syndr. 2012;61(4):441-447.
43. Desai M, Joyce V, Bendavid E, et al. Risk of cardiovascular events associated with current exposure to HIV antiretroviral therapies in a US veteran population. Clin Infect Dis. 2015;61(3):445-452.
45. Sax PE, Wohl D, Yin MT, et al. Tenofovir alafenamide versus tenofovir disoproxil fumarate, coformulated with elvitegravir, cobicistat, and emtricitabine, for initial treatment of HIV-1 infection: two randomised, double-blind, phase 3, non-inferiority trials. Lancet. 2015;385(9987):2606-2615.
46. Mills A, Arribas JR, Andrade-Villanueva J, et al. Switching from tenofovir disoproxil fumarate to tenofovir alafenamide in antiretroviral regimens for virologically suppressed adults with HIV-1 infection: a randomised, active-controlled, multicentre, open-label, phase 3, non-inferiority study. Lancet Infect Dis. 2016;16(1):43-52.
47. Hanna DB, Hessol NA, Golub ET, et al. Increase in single-tablet regimen use and associated improvements in adherence-related outcomes in HIV-infected women. J Acquir Immune Defic Syndr. 2014;65(5):587-596.
48. Nachega JB, Parienti JJ, Uthman OA, et al. Lower pill burden and once-daily antiretroviral treatment regimens for HIV infection: a meta-analysis of randomized controlled trials. Clin Infect Dis. 2014;58(9):1297-1307.
49. Cooke CE, Lee HY, Xing S. Adherence to antiretroviral therapy in managed care members in the United States: a retrospective claims analysis. J Manag Care Pharm. 2014;20(1):86-92.
50. Hodder SL, Mounzer K, DeJesus E, et al; AI266073 Study Group. Patient-reported outcomes in virologically suppressed, HIV-1-iInfected subjects after switching to a simplified, single-tablet regimen of efavirenz, emtricitabine, and tenofovir DF. AIDS Patient Care STDS. 2010;24(2):87-96.
51. Blanco JL, Montaner JS, Marconi VC, et al. Lower prevalence of drug resistance mutations at first-line virological failure to first-line therapy with atripla vs. tenofovir + emtricitabine/lamivudine + efavirenz administered on a multiple tablet therapy. AIDS. 2014;28(17):2531-2539.
52. Commers T, Swindells S, Sayles H, Gross AE, Devetten M, Sandkovsky U. Antiretroviral medication prescribing errors are common with hospitalization of HIV infected patients. J Antimicrob Chemother. 2014;69(1):262-267.
53. Walensky RP, Sax PE, Nakamura YM, et al. Economic savings versus health losses: the cost-effectiveness of generic antiretroviral therapy in the United States. Ann Intern Med. 2013;158(2):84-92.
54. Palella FJ Jr, Fisher M, Tebas P, et al. Simplification to rilpivirine/emtricitabine/ tenofovir disoproxil fumarate from ritonavir-boosted protease inhibitor antiretroviral therapy in a randomized trial of HIV-1 RNA-suppressed participants. AIDS. 2014;28(3):335-344.
55. Gulick R. HIV treatment 2020: what will it look like? J Int AIDS Soc. 2014;17(4)(suppl 3):19528.
References
1. Centers for Disease Control and Prevention. Update: trends in AIDS incidence, deaths, and prevalence—United States, 1996. MMWR Morb Mortal Wkly Rep.1997;46(8):165-173.
2. Palella FJ Jr, Delaney KM, Moorman AC, et al; HIV Outpatient Study Investigators. Declining morbidity and mortality among patients with advanced human immunodeficiency virus infection. N Engl J Med. 1998;338(13):853-860.
3. Crum NF, Riffenburgh RH, Wegner S, et al; Triservice AIDS Clinical Consortium. Comparisons of causes of death and mortality rates among HIV-infected persons:analysis of the pre-, early, and late HAART (highly active antiretroviral therapy) eras. J Acquir Immune Defic Syndr. 2006;41(2):194-200.
4. Bor J, Herbst AJ, Newell M-L, Bärnighausen T. Increases in adult life expectancy in rural South Africa: valuing the scale-up of HIV treatment. Science. 2013;339(6122):961-965.
5. Antiretroviral Therapy Cohort Collaboration. Life expectancy of individuals on combination antiretroviral therapy in high-income countries: a collaborative analysis of 14 cohort studies. Lancet. 2008;372(9635):293-299.
6. Cohen MS, Chen YQ, McCauley M, et al; the HPTN 052 Study Team. Prevention of HIV-1 infection with early antiretroviral therapy. N Engl J Med. 2011;365(6):493-505.
7. DHHS Panel on Antiretroviral Guidelines for Adults and Adolescents. Guidelines for the use of antiretroviral agents in HIV-1 infected adults and adolescents. AIDSinfo Website. https://aidsinfo.nih.gov/contentfiles/lvguidelines/adultandadolescentgl.pdf. Updated January 28, 2016. Accessed March 10, 2016.
8. Gulick RM, Ribaudo HJ, Shikuma CM, et al; AIDS Clinical Trials Group (ACTG) A5095 Study Team. Three- vs four-drug antiretroviral regimens for the initial treatment of HIV-1 infection: a randomized controlled trial. JAMA. 2006;296(7):769-781.
9. Orkin C, Stebbing J, Nelson M, et al. A randomized study comparing a three- and four-drug HAART regimen in first-line therapy (QUAD study). J Antimicrob Chemother. 2005;55(2):246-251.
10. Gandhi RT, Bosch RJ, Aga E, et al; AIDS Clinical Trials Group A5173 Team. No evidence for decay of the latent reservoir in HIV-1-infected patients receiving intensive enfuvirtide containing antiretroviral therapy. J Infect Dis. 2010;201(2): 293-296.
11. Chéret A, Nembot G, Mélard A, et al; OPTIPRIM ANRS Study Group. Intensive five-drug antiretroviral therapy regimen versus standard triple-drug therapy during primary HIV-1 infection (OPTIPRIM-ANRS 147): a randomised, open-label, phase 3 trial. Lancet Infect Dis. 2015;15(4):387-396.
12. Cahn P, Andrade-Villanueva J, Arribas JR, et al; GARDEL Study Group. Dual therapy with lopinavir and ritonavir plus lamivudine versus triple therapy with lopinavir and ritonavir plus two nucleoside reverse transcriptase inhibitors in antiretroviral-therapy-naive adults with HIV-1 infection: 48 week results of the randomised, open label, non-inferiority GARDEL trial. Lancet Infect Dis. 2014;14(7):572-580.
13. Raffi F, Babiker AG, Richert L, et al; for the NEAT001/ANRS143 Study Group. Ritonavir-boosted darunavir combined with raltegravir or tenofoviremtricitabine in antiretroviral-naive adults infected with HIV-1: 96 week results from the NEAT001/ANRS143 randomised non-inferiority trial. Lancet. 2014;384(9958):1942-1951.
14. Taiwo B, Zheng L, Gallien S, et al; ACTG A5262 Team. Efficacy of a nucleosidesparing regimen of darunavir/ritonavir plus raltegravir in treatment-naive HIV-1-infected patients (ACTG A5262). AIDS. 2011;25(17):2113-2122.
15. Bedimo RJ, Drechsler H, Jain M, et al. The RADAR study: week 48 safety and efficacy of RAltegravir combined with boosted DARunavir compared to tenofovir/emtricitabine combined with boosted darunavir in antiretroviral-naive patients. Impact on bone health. PLoS One. 2014;9(8):e106221.
16. Stellbrink HJ, Pulik P, Szlavik J, et al. Maraviroc (MVC) dosed once daily with darunavir/ritonavir (DRV/r) in a 2 drug-regimen compared to emtricitabine/tenofovir (TDF/FTC) with DRV/r; 48-week results from MODERN (Study A4001095) (Abstract). AIDS 2014 Website. http://pag.aids2014.org/Abstracts.aspx?SID=1139&AID=6180. Accessed March 11, 2016.
17. Gulick RM, Ribaudo HJ, Shikuma CM, et al; AIDS Clinical Trials Group Study A5095 Team. Triple-nucleoside regimens versus efavirenz-containing regimens for the initial treatment of HIV-1 infection. N Engl J Med. 2004;350(18):1850-1861.
18. Sax PE, DeJesus E, Mills A; GS-US-236-0102 study team. Co-formulated elvitegravir, cobicistat, emtricitabine, and tenofovir versus co-formulated efavirenz, emtricitabine, and tenofovir for initial treatment of HIV-1 infection: a randomised, double-blind, phase 3 trial, analysis of results after 48 weeks. Lancet. 2012;379(9835):2439-2448.
19. Gallant JE, DeJesus E, Arribas JR, et al; Study 934 Group. Tenofovir DF, emtricitabine, and efavirenz vs. zidovudine, lamivudine, and efavirenz for HIV. N Engl J Med. 2006;354(3):251-260.
20. Arribas JR, Pozniak AL, Gallant JE, et al. Tenofovir disoproxil fumarate, emtricitabine, and efavirenz compared with zidovudine/lamivudine and efavirenz in treatment-naive patients: 144-week analysis. J Acquir Immune Defic Syndr. 2008;47(1):74-78.
21. Dejesus E, Young B, Morales-Ramirez JO, et al; AI266073 Study Group. Simplification of antiretroviral therapy to a single-tablet regimen consisting of efavirenz, emtricitabine, and tenofovir disoproxil fumarate versus unmodified antiretroviral therapy in virologically suppressed HIV-1-infected patients. J Acquir Immune Defic Syndr. 2009;51(2):163-174.
22. Daar ES, Tierney C, Fischl MA, et al; AIDS Clinical Trials Group Study A5202 Team. Atazanavir plus ritonavir or efavirenz as part of a 3-drug regimen for initial treatment of HIV-1. Ann Intern Med. 2011;154(7):445-456.
23. Cohen CJ, Molina JM, Cassetti I, et al; ECHO, THRIVE study groups. Week 96 efficacy and safety of rilpivirine in treatment-naive, HIV-1 patients in two Phase III randomized trials. AIDS. 2013;27(6):939-950.
24. Walmsley SL, Antela A, Clumeck N, et al; SINGLE Investigators. Dolutegravir plus abacavir-lamivudine for the treatment of HIV-1 infection. N Engl J Med. 2013;369(19):1807-1818.
25. Rockstroh JK, DeJesus E, Lennox JL, et al; STARTMRK Investigators. Durable efficacy and safety of raltegravir versus efavirenz when combined with tenofovir/emtricitabine in treatment-naive HIV-1-infected patients: final 5-year results from STARTMRK. J Acquir Immune Defic Syndr. 2013;63(1):77-85.
26. Mollan KR, Smurzynski M, Eron JJ, et al. Association between efavirenz as initial therapy for HIV-1 infection and increased risk for suicidal ideation or attempted or completed suicide: an analysis of trial data. Ann Intern Med. 2014;161(1):1-10.
27. Fundarò C, Genovese O, Rendeli C, Tamburrini E, Salvaggio E. Myelomeningocele in a child with intrauterine exposure to efavirenz. AIDS. 2002;16(2):299-300.
29. Cohen C, Wohl D, Arribas JR, et al. Week 48 results from a randomized clinical trial of rilpivirine/emtricitabine/tenofovir disoproxil fumarate vs. efavirenz/emtricitabine/tenofovir disoproxil fumarate in treatment-naive HIV-1-infected adults. AIDS. 2014;28(7):989-997.
30. Mills AM, Cohen C, DeJesus E, et al. Efficacy and safety 48 weeks after switching from efavirenz to rilpivirine using emtricitabine/tenofovir disoproxil fumaratebased single-tablet regimens. HIV Clin Trials. 2013;14(5):216-223.
32. Wohl DA, Cohen C, Gallant JE, et al; GS-US-236-0102 Study Team. A randomized, double-blind comparison of single-tablet regimen elvitegravir/cobicistat/emtricitabin/tenofovir DF versus single-tablet regimen efavirenz/emtricitabine/tenofovir DF for initial treatment of HIV-1 infection: analysis of week 144 results. J Acquir Immune Defic Syndr. 2014;65(3):e118-e120.
33. DeJesus E, Rockstroh JK, Henry K, et al; GS-236-0103 Study Team. Co-formulated elvitegravir, cobicistat, emtricitabine, and tenofovir disoproxil fumarate versus ritonavir-boosted atazanavir plus co-formulated emtricitabine and tenofovir disoproxil fumarate for initial treatment of HIV-1 infection: a randomised, doubleblind, phase 3, non-inferiority trial. Lancet. 2012;379(9835):2429-2438.
34. Arribas JR, Pialoux G, Gathe J, et al. Simplification to coformulated elvitegravir, cobicistat, emtricitabine, and tenofovir versus continuation of ritonavir-boosted protease inhibitor with emtricitabine and tenofovir in adults with virologically suppressed HIV (STRATEGY-PI): 48 week results of a randomised, open-label, phase 3b, non-inferiority trial. Lancet Infect Dis. 2014;14(7):581-589.
35. Pozniak A, Markowitz M, Mills A, et al. Switching to coformulated elvitegravir, cobicistat, emtricitabine, and tenofovir versus continuation of non-nucleoside reverse transcriptase inhibitor with emtricitabine and tenofovir in virologically suppressed adults with HIV (STRATEGY-NNRTI): 48 week results of a randomised, open-label, phase 3b non-inferiority trial. Lancet Infect Dis. 2014;14(7):590-599.
37. Mallal S, Phillips E, Carosi G, et al. HLA-B*5701 screening for hypersensitivity to abacavir. N Engl J Med. 2008;358(6):568-579.
38. Raffi F, Rachlis A, Stellbrink HJ, et al. Once-daily dolutegravir versus raltegravir in antiretroviral-naive adults with HIV-1 infection: 48 week results from the randomised, double-blind, non-inferiority SPRING-2 study. Lancet. 2013;381(9868):735-743.
39. Clotet B, Feinberg J, van Lunzen J, et al; ING114915 Study Team. Once-daily dolutegravir versus darunavir plus ritonavir in antiretroviral-naive adults with HIV-1 infection (FLAMINGO): 48 week results from the randomised open-label phase p3b study. Lancet. 2014;383(9936):2222-2231.
40. Strategies for Management of Anti-Retroviral Therapy/INSIGHT; DAD Study Groups. Use of nucleoside reverse transcriptase inhibitors and risk of myocardial infarction in HIV-infected patients. AIDS. 2008;22(14):F17-F24.
41. Bedimo RJ, Westfall AO, Drechsler H, Vidiella G, Tebas P. Abacavir use and risk of acute myocardial infarction and cerebrovascular events in the highly active antiretroviral therapy era. Clin Infect Dis. 2011;53(1):84-91.
42. Ding X, Andraca-Carrera E, Cooper C, et al. No association of abacavir use with myocardial infarction: findings of an FDA meta-analysis. J Acquir Immune Defic Syndr. 2012;61(4):441-447.
43. Desai M, Joyce V, Bendavid E, et al. Risk of cardiovascular events associated with current exposure to HIV antiretroviral therapies in a US veteran population. Clin Infect Dis. 2015;61(3):445-452.
45. Sax PE, Wohl D, Yin MT, et al. Tenofovir alafenamide versus tenofovir disoproxil fumarate, coformulated with elvitegravir, cobicistat, and emtricitabine, for initial treatment of HIV-1 infection: two randomised, double-blind, phase 3, non-inferiority trials. Lancet. 2015;385(9987):2606-2615.
46. Mills A, Arribas JR, Andrade-Villanueva J, et al. Switching from tenofovir disoproxil fumarate to tenofovir alafenamide in antiretroviral regimens for virologically suppressed adults with HIV-1 infection: a randomised, active-controlled, multicentre, open-label, phase 3, non-inferiority study. Lancet Infect Dis. 2016;16(1):43-52.
47. Hanna DB, Hessol NA, Golub ET, et al. Increase in single-tablet regimen use and associated improvements in adherence-related outcomes in HIV-infected women. J Acquir Immune Defic Syndr. 2014;65(5):587-596.
48. Nachega JB, Parienti JJ, Uthman OA, et al. Lower pill burden and once-daily antiretroviral treatment regimens for HIV infection: a meta-analysis of randomized controlled trials. Clin Infect Dis. 2014;58(9):1297-1307.
49. Cooke CE, Lee HY, Xing S. Adherence to antiretroviral therapy in managed care members in the United States: a retrospective claims analysis. J Manag Care Pharm. 2014;20(1):86-92.
50. Hodder SL, Mounzer K, DeJesus E, et al; AI266073 Study Group. Patient-reported outcomes in virologically suppressed, HIV-1-iInfected subjects after switching to a simplified, single-tablet regimen of efavirenz, emtricitabine, and tenofovir DF. AIDS Patient Care STDS. 2010;24(2):87-96.
51. Blanco JL, Montaner JS, Marconi VC, et al. Lower prevalence of drug resistance mutations at first-line virological failure to first-line therapy with atripla vs. tenofovir + emtricitabine/lamivudine + efavirenz administered on a multiple tablet therapy. AIDS. 2014;28(17):2531-2539.
52. Commers T, Swindells S, Sayles H, Gross AE, Devetten M, Sandkovsky U. Antiretroviral medication prescribing errors are common with hospitalization of HIV infected patients. J Antimicrob Chemother. 2014;69(1):262-267.
53. Walensky RP, Sax PE, Nakamura YM, et al. Economic savings versus health losses: the cost-effectiveness of generic antiretroviral therapy in the United States. Ann Intern Med. 2013;158(2):84-92.
54. Palella FJ Jr, Fisher M, Tebas P, et al. Simplification to rilpivirine/emtricitabine/ tenofovir disoproxil fumarate from ritonavir-boosted protease inhibitor antiretroviral therapy in a randomized trial of HIV-1 RNA-suppressed participants. AIDS. 2014;28(3):335-344.
55. Gulick R. HIV treatment 2020: what will it look like? J Int AIDS Soc. 2014;17(4)(suppl 3):19528.
Despite the availability of an effective hepatitis B vaccine, the global prevalence has not substantially declined, and significant barriers remain to screening and care.
Globally, chronic hepatitis B virus (HBV) infection is the leading cause of liver-related morbidity and mortality. Worldwide, more than 2 billion people have been exposed to HBV, and about 250 million are chronically infected.1
The prevalence of hepatitis B surface antigen (HBsAg), the serologic marker of chronicity, varies significantly worldwide. The highest rates of HBsAg are reported in Asia, Sub-Saharan Africa, and the Amazon basin. The overall prevalence of chronic HBV infection in the U.S. is low, 800,000 to 1.4 million persons. The disease is predominantly seen in immigrants, with > 90% of cases in persons from countries of intermediate or high HBV prevalence, such as East Asia, Africa, Pacific Islands, parts of Africa, and Eastern Europe.2
The prevalence of chronic HBV infection in the U.S. may be underestimated and closer to 2.2 million persons, because many foreign-born persons are generally excluded from national prevalence surveys.3 More worrisome, studies suggest that a majority of individuals with chronic HBV infection are unaware of their diagnosis, and consequently, many patients who might benefit from therapy do not receive appropriate care or treatment.4 This review will discuss screening recommendations for HBV in the U.S., identify knowledge gaps regarding the disease, and present a cogent argument for why treatment-eligible patients should be entered into management programs and evaluated for therapy.
Hepatitis B Screening
Chronic hepatitis B meets the criteria established by the World Health Organization as a disease for which screening would be beneficial to public health. Chronic HBV infection is an important health problem that can result in serious sequelae, such as cirrhosis, hepatocellular carcinoma, and liver-related mortality. Moreover, persons unaware of their diagnosis may unwittingly transmit the virus to unprotected individuals.
A simple, relatively inexpensive test is widely available to identify chronic HBV infection. The test allows physicians to confirm a diagnosis before symptoms develop and offer a safe and effective therapy. Modeling studies suggest that screening populations with a prevalence of chronic HBV infection ≥ 2% also would be cost-effective in reducing the burden of HBV-associated liver cancer and chronic liver disease in high-risk populations.5,6 However, a number of barriers exist that limit screening (Table 1).
Who to Screen?
All guidelines recommend that persons at high risk for HBV infection should be screened. Broadly, these include persons from geographic areas with a high prevalence of chronic infection, persons at high risk for acquiring HBV infection, persons with increased risk of transmitting HBV, and persons at risk for reactivation of HBV. In addition to previous recommendations, the Centers for Disease Control and Prevention (CDC) updated 2008 guidelines now recommend testing all persons born in geographic areas with a HBsAg prevalence of ≥ 2%, U.S.-born persons not vaccinated as infants whose parents were born in regions with HBsAg prevalence ≥ 8%, persons who inject drugs, men who have sex with men, persons with elevated alanine transaminase and aspartate transaminase of unknown etiology, and persons with selected medical conditions that require immunosuppressive therapy (Table 2).7 In 2014, the U.S. Preventive Services Task Force provided updated guidance on screening of nonpregnant adolescents and adults that aligned with the CDC guidelines and also recommended screening individuals at high risk for HBV infection.8 The American Association for the Study of Liver Diseases and other professional liver organizations support these recommendations.9
Which Test to Use
Serologic testing for HBsAg is the recommended method to identify persons with chronic HBV infection. Testing for HBV infection in high-risk groups should be performed with a FDA-licensed or FDA-approved serologic assay for HBsAg (sensitivity and specificity of > 98%) according to the manufacturer’s recommendations. Initially, reactive specimens should be confirmed with a licensed confirmatory test.
A positive HBsAg result indicates active infection, either acute or chronic. Other serological markers of HBV infection, such as presence of hepatitis B core IgM antibody, and the clinical context are used to differentiate between acute, chronic, or resolving infection. For identification of individuals who are at risk for chronic infection, the screening strategy should be with HBsAg only. For identifying susceptible persons who should be offered HBV vaccination, or patients that are at risk of reactivation or transmission of HBV, screening should include testing for HBsAg, hepatitis B core antibody (anti-HBc) and hepatitis B surface antibody (anti-HBs).
The interpretation of HBV screening serology is shown in Table 3. Persons with chronic HBV infection are treated, if needed, per practice guidelines based on the initial test results and interpretation of the stage of the disease and counseled regarding transmission of infection. 9,10 Vaccination is recommended for uninfected persons.
Hepatitis B Education
There is relatively poor awareness of HBV among highrisk individuals and health care professionals (HCPs). A study examining the prevalence of chronic hepatitis B in an Asian and Pacific Islander population reported that about 15% of participants had not been previously tested for hepatitis B.11 Another study that surveyed 3,163 Asian American adults in the San Francisco Bay Area found that of those screened and identified with chronic HBV infection (8.9%), two-thirds were unaware that they were infected.12
Primary care providers in San Francisco correctly identified that Chinese immigrants have a higher prevalence of chronic hepatitis B than that of non-Hispanic white or U.S.-born Chinese people, but the providers incorrectly identified persons with HIV infection, men who have sex with men, and persons who inject drugs as having higher prevalence than that of Chinese immigrants in a survey.13 Lack of awareness probably contributes to poor outcomes from the infection among at-risk persons as well as continued transmission to susceptible individuals. Furthermore, lack of knowledge is a barrier to testing, prevention, and care. Increased awareness to identify the at-risk population and early treatment is an important step to prevent morbidity and mortality from chronic hepatitis B.
Public Awareness
Many at-risk populations are unaware of HBV, its possible routes of transmission, or that a safe and effective vaccine exists for HBV prevention. Moreover, many foreign-born persons with chronic HBV infection feel stigmatized by others or have cultural barriers against Western medicine and prefer alternative therapies. As a result, the Institute of Medicine (IOM) has suggested that innovative approaches need to be developed to promote a better understanding of transmission, prevent and treat HBV, increase HBV vaccination rates among children and at-risk adults, educate women about vertical transmission risk, reduce stigmatization, and provide culturally sensitive and understandable educational material.14
Awareness Among Health Care Professionals
Studies have identified knowledge gaps among HCPs regarding the prevalence of HBV in the general U.S. population, outcome of infection, who should be screened and vaccinated against HBV, appropriate methods for screening and interpretation of serologic tests for HBV, and proper treatment of persons with chronic infection. As a consequence, the IOM recommended educational programs for HCPs on the prevalence of HBV infection in the general U.S. population and at-risk populations, particularly foreign-born persons. In addition, these educational programs should target all levels of HCPs, including undergraduates and postgraduates, and include information on screening and prevention, testing, and interpretation of tests.14
Need to Treat
The global HBV disease burden remains high despite the existence of an effective vaccine. Worldwide, there are an estimated 4.5 million new infections and 780,000 HBVrelated deaths each year.15 In the U.S., the highest rates of mortality are seen in Asians and Pacific Islanders and among persons aged 55 to 64 years. Asians and Pacific Islanders also have the highest rate of liver cancer deaths.16,17
The natural history of chronic hepatitis B is highly variable and dependent on a complex interplay between the virus and the host immune response. It is estimated that between 25% and 40% of persons with chronic hepatitis B will be at risk for progression to cirrhosis.7,18,19 In a study among persons with cirrhosis, the 5-year cumulative risk of developing hepatocellular carcinoma was 17% in Asian patients and 10% in white Americans and Europeans. The 5-year liver-related death rate was 14% among East Asians and 15% among white Europeans.18
A significant proportion of individuals infected with HBV are unaware of their diagnosis, not enrolled in care, or not receiving therapy.7,12,20-24 Data from several prospective and retrospective cohort studies have demonstrated that prolonged viral suppression achieved with therapy is associated with regression of fibrosis and reversal of cirrhosis in a substantial proportion of individuals.25,26 Treatment has also been associated with a reduction in rates of liver decompensation, HCC, liverrelated, and all-cause mortality among patients with liver cirrhosis.27
Given the risk of serious complications and the availability of safe and effective therapy, it is imperative that persons identified as having chronic hepatitis B be referred for evaluation to determine whether therapy is warranted. However, it is also important to recognize that a cure for HBV infection is currently not available, and most patients who initiate therapy will require longterm treatment. In addition, persons who are not currently treatment candidates may become candidates due to changes in disease activity. This underscores the point that patients with chronic hepatitis B require lifelong monitoring regardless of whether they are receiving treatment.
Conclusions
The primary reasons to screen for HBV are to reduce morbidity and mortality related to liver disease and to prevent transmission. Significant barriers remain to screening and referral for care for HBV in the U.S. Educational programs to increase knowledge and awareness among HCPs and the public together with improved access to care are critical to improve disease outcomes and prevent transmission. Despite the availability of an effective vaccine for 3 decades, the global prevalence of HBV has not substantially declined. Further research is needed to explore strategies to overcome screening barriers, improve vaccination rates, and to develop new models of health care delivery to reduce the burden of disease-related to HBV.
1. Schweitzer A, Horn J, Mikolajczyk RT, Krause G, Ott JJ. Estimations of worldwide prevalence of chronic hepatitis B virus infection: a systematic review of data published between 1965 and 2013. Lancet. 2015;386(10003):1546-1555.
2. Mitchell T, Armstrong GL, Hu DJ, Wasley A, Painter JA. The increasing burden of imported chronic hepatitis B--United States, 1974-2008. PLoS One. 2011;6(12):e27717.
3. Kowdley KV, Wang CC, Welch S, Roberts H, Brosgart CL. Prevalence of chronic hepatitis B among foreign-born persons living in the United States by country of origin. Hepatology. 2012;56(2):422-433.
4. Cohen C, Holmberg SD, McMahon BJ, et al. Is chronic hepatitis B being undertreated in the United States? J Viral Hepat. 2011;18(6):377-383.
5. Hutton DW, Tan D, So SK, Brandeau ML. Cost-effectiveness of screening and vaccinating Asian and Pacific Islander adults for hepatitis B. Ann Intern Med. 2007;147(7):460-469.
6. Eckman MH, Kaiser TE, Sherman KE. The cost-effectiveness of screening for chronic hepatitis B infection in the United States. Clin Infect Dis. 2011;52(11):1294-1306.
7. Weinbaum CM, Williams I, Mast EE, et al; Centers for Disease Control and Prevention (CDC). Recommendations for identification and public health management of persons with chronic hepatitis B virus infection. MMWR Recomm Rep. 2008;57(RR-8):1-20.
8. LeFevre ML; U.S. Preventive Services Task Force. Screening for hepatitis B virus infection in nonpregnant adolescents and adults: U.S. Preventive Services Task Force recommendation statement. Ann Intern Med. 2014;161(1):58-66.
10. Terrault NA, Bzowej NH, Chang KM, Hwang JP, Jonas MM, Murad MH. AASLD guidelines for treatment of chronic hepatitis B. Hepatology. 2016;63(1):261-283.
11. Centers for Disease Control and Prevention (CDC). Screening for chronic hepatitis B among Asian/Pacific Islander populations--New York City, 2005. MMWR Morb Mortal Wkly Rep. 2006;55(18):505-509.
12. Lin SY, Chang ET, So SK. Why we should routinely screen Asian American adults for hepatitis B: a cross-sectional study of Asians in California. Hepatology. 2007;46(4):1034-1040.
13. Lai CJ, Nguyen TT, Hwang J, Stewart SL, Kwan A, McPhee SJ. Provider knowledge and practice regarding hepatitis B screening in Chinese-speaking patients. J Cancer Educ. 2007;22(1):37-41.
14. Colvin HM, Mitchell AE, eds; Committee on the Prevention and Control of Viral Hepatitis Infections Board on Population Health and Public Health Practice. Hepatitis and liver cancer: a national strategy for prevention and control of hepatitis B and C. Washington, DC: National Academies Press; 2010:xix, 232.
15. Hepatitis B Fact Sheet No. 204. World Health Organization Website. http://www.who.int/entity/mediacentre/factsheets/fs204/en/. Updated July 2015. Accessed March 17, 2016.
16. Perz JF, Openo K, Ahmed F, Bell BP. P.382 Trends in mortality from liver cancer in the USA, 1993-2002. J Clin Virol. 2006;36(suppl 2):S178.
17. Chang ET, Keegan TH, Gomez SL, et al. The burden of liver cancer in Asians and Pacific Islanders in the Greater San Francisco Bay Area, 1990 through 2004. Cancer. 2007;109(10):2100-2108.
18. Fattovich G1, Bortolotti F, Donato F. Natural history of chronic hepatitis B: special emphasis on disease progression and prognostic factors. J Hepatol. 2008;48(2):335-352.
19. Chou R, Dana T, Bougatsos C, Blazina I, Khangura J, Zakher B. Screening for hepatitis B virus infection in adolescents and adults: a systematic review to update the U.S. Preventive Services Task Force recommendation. Ann Intern Med. 2014;161(1):31-45.
20. Wan KJ, Miyoshi T, Fryer G, et al. Screening for hepatitis B virus infection by primary care physicians in New York City: are screening recommendations for persons born inendemic countries being followed?[abstract 1454]. Hepatology. 2007;46(suppl):889A-890A.
21. Thompson MJ, Taylor VM, Jackson JC, et al. Hepatitis B knowledge and practices among Chinese American women in Seattle, Washington. J Cancer Educ. 2002;17(4):222-226.
22. Ma GX, Fang CY, Shive SE, Toubbeh J, Tan Y, Siu P. Risk perceptions and barriers to hepatitis B screening and vaccination among Vietnamese immigrants. J Immigr Minor Health. 2007;9(3):213-220.
23. Taylor VM, Choe JH, Yasui Y, Li Lin, Burke N, Jackson JC. Hepatitis B awareness, testing, and knowledge among Vietnamese American men and women. J Community Health. 2005;30(6):477-490.
24. Weinbaum CM, Lyerla R, Mackellar DA, et al; Young Men’s Survey Study Group. The young men’s survey phase II: hepatitis B immunization and infection among young men who have sex with men. Am J Public Health. 2008;98(5):839-845.
25. Marcellin P, Gane E, Buti M. Regression of cirrhosis during treatment with tenofovir disoproxil fumarate for chronic hepatitis B: a 5-year open-label follow-up study. Lancet. 2013;381(9865):468-475.
26. Chang TT, Liaw YF, Wu SS. Long-term entecavir therapy results in the reversal of fibrosis/cirrhosis and continued histological improvement in patients with chronic hepatitis B. Hepatology. 2010;52(3):886-893.
27. Wong GL, Chan HL, Mak CW. Entecavir treatment reduces hepatic events and deaths in chronic hepatitis B patients with liver cirrhosis. Hepatology.2013;58(5):1537-1547.
Author and Disclosure Information
Dr. Lingala is a clinical fellow and Dr. Ghany is an investigator, both at the Liver Diseases Branch of the National Institute of Diabetes and Digestive and Kidney Diseases, National Institutes of Health in Bethesda, Maryland.
Acknowledgements This work was supported by the Intramural Program of the National Institute of Diabetes and Digestive and Kidney Diseases, National Institutes of Health.
Author disclosures The authors report no actual or potential conflicts of interest with regard to this article.
Disclaimer The opinions expressed herein are those of the authors and do not necessarily reflect those of Federal Practitioner, Frontline Medical Communications Inc., the U.S. Government, or any of its agencies. This article may discuss unlabeled or investigational use of certain drugs. Please review complete prescribing information for specific drugs or drug combinations—including indications, contraindications, warnings, and adverse effects—before administering pharmacologic therapy to patients.
Author and Disclosure Information
Dr. Lingala is a clinical fellow and Dr. Ghany is an investigator, both at the Liver Diseases Branch of the National Institute of Diabetes and Digestive and Kidney Diseases, National Institutes of Health in Bethesda, Maryland.
Acknowledgements This work was supported by the Intramural Program of the National Institute of Diabetes and Digestive and Kidney Diseases, National Institutes of Health.
Author disclosures The authors report no actual or potential conflicts of interest with regard to this article.
Disclaimer The opinions expressed herein are those of the authors and do not necessarily reflect those of Federal Practitioner, Frontline Medical Communications Inc., the U.S. Government, or any of its agencies. This article may discuss unlabeled or investigational use of certain drugs. Please review complete prescribing information for specific drugs or drug combinations—including indications, contraindications, warnings, and adverse effects—before administering pharmacologic therapy to patients.
Despite the availability of an effective hepatitis B vaccine, the global prevalence has not substantially declined, and significant barriers remain to screening and care.
Despite the availability of an effective hepatitis B vaccine, the global prevalence has not substantially declined, and significant barriers remain to screening and care.
Globally, chronic hepatitis B virus (HBV) infection is the leading cause of liver-related morbidity and mortality. Worldwide, more than 2 billion people have been exposed to HBV, and about 250 million are chronically infected.1
The prevalence of hepatitis B surface antigen (HBsAg), the serologic marker of chronicity, varies significantly worldwide. The highest rates of HBsAg are reported in Asia, Sub-Saharan Africa, and the Amazon basin. The overall prevalence of chronic HBV infection in the U.S. is low, 800,000 to 1.4 million persons. The disease is predominantly seen in immigrants, with > 90% of cases in persons from countries of intermediate or high HBV prevalence, such as East Asia, Africa, Pacific Islands, parts of Africa, and Eastern Europe.2
The prevalence of chronic HBV infection in the U.S. may be underestimated and closer to 2.2 million persons, because many foreign-born persons are generally excluded from national prevalence surveys.3 More worrisome, studies suggest that a majority of individuals with chronic HBV infection are unaware of their diagnosis, and consequently, many patients who might benefit from therapy do not receive appropriate care or treatment.4 This review will discuss screening recommendations for HBV in the U.S., identify knowledge gaps regarding the disease, and present a cogent argument for why treatment-eligible patients should be entered into management programs and evaluated for therapy.
Hepatitis B Screening
Chronic hepatitis B meets the criteria established by the World Health Organization as a disease for which screening would be beneficial to public health. Chronic HBV infection is an important health problem that can result in serious sequelae, such as cirrhosis, hepatocellular carcinoma, and liver-related mortality. Moreover, persons unaware of their diagnosis may unwittingly transmit the virus to unprotected individuals.
A simple, relatively inexpensive test is widely available to identify chronic HBV infection. The test allows physicians to confirm a diagnosis before symptoms develop and offer a safe and effective therapy. Modeling studies suggest that screening populations with a prevalence of chronic HBV infection ≥ 2% also would be cost-effective in reducing the burden of HBV-associated liver cancer and chronic liver disease in high-risk populations.5,6 However, a number of barriers exist that limit screening (Table 1).
Who to Screen?
All guidelines recommend that persons at high risk for HBV infection should be screened. Broadly, these include persons from geographic areas with a high prevalence of chronic infection, persons at high risk for acquiring HBV infection, persons with increased risk of transmitting HBV, and persons at risk for reactivation of HBV. In addition to previous recommendations, the Centers for Disease Control and Prevention (CDC) updated 2008 guidelines now recommend testing all persons born in geographic areas with a HBsAg prevalence of ≥ 2%, U.S.-born persons not vaccinated as infants whose parents were born in regions with HBsAg prevalence ≥ 8%, persons who inject drugs, men who have sex with men, persons with elevated alanine transaminase and aspartate transaminase of unknown etiology, and persons with selected medical conditions that require immunosuppressive therapy (Table 2).7 In 2014, the U.S. Preventive Services Task Force provided updated guidance on screening of nonpregnant adolescents and adults that aligned with the CDC guidelines and also recommended screening individuals at high risk for HBV infection.8 The American Association for the Study of Liver Diseases and other professional liver organizations support these recommendations.9
Which Test to Use
Serologic testing for HBsAg is the recommended method to identify persons with chronic HBV infection. Testing for HBV infection in high-risk groups should be performed with a FDA-licensed or FDA-approved serologic assay for HBsAg (sensitivity and specificity of > 98%) according to the manufacturer’s recommendations. Initially, reactive specimens should be confirmed with a licensed confirmatory test.
A positive HBsAg result indicates active infection, either acute or chronic. Other serological markers of HBV infection, such as presence of hepatitis B core IgM antibody, and the clinical context are used to differentiate between acute, chronic, or resolving infection. For identification of individuals who are at risk for chronic infection, the screening strategy should be with HBsAg only. For identifying susceptible persons who should be offered HBV vaccination, or patients that are at risk of reactivation or transmission of HBV, screening should include testing for HBsAg, hepatitis B core antibody (anti-HBc) and hepatitis B surface antibody (anti-HBs).
The interpretation of HBV screening serology is shown in Table 3. Persons with chronic HBV infection are treated, if needed, per practice guidelines based on the initial test results and interpretation of the stage of the disease and counseled regarding transmission of infection. 9,10 Vaccination is recommended for uninfected persons.
Hepatitis B Education
There is relatively poor awareness of HBV among highrisk individuals and health care professionals (HCPs). A study examining the prevalence of chronic hepatitis B in an Asian and Pacific Islander population reported that about 15% of participants had not been previously tested for hepatitis B.11 Another study that surveyed 3,163 Asian American adults in the San Francisco Bay Area found that of those screened and identified with chronic HBV infection (8.9%), two-thirds were unaware that they were infected.12
Primary care providers in San Francisco correctly identified that Chinese immigrants have a higher prevalence of chronic hepatitis B than that of non-Hispanic white or U.S.-born Chinese people, but the providers incorrectly identified persons with HIV infection, men who have sex with men, and persons who inject drugs as having higher prevalence than that of Chinese immigrants in a survey.13 Lack of awareness probably contributes to poor outcomes from the infection among at-risk persons as well as continued transmission to susceptible individuals. Furthermore, lack of knowledge is a barrier to testing, prevention, and care. Increased awareness to identify the at-risk population and early treatment is an important step to prevent morbidity and mortality from chronic hepatitis B.
Public Awareness
Many at-risk populations are unaware of HBV, its possible routes of transmission, or that a safe and effective vaccine exists for HBV prevention. Moreover, many foreign-born persons with chronic HBV infection feel stigmatized by others or have cultural barriers against Western medicine and prefer alternative therapies. As a result, the Institute of Medicine (IOM) has suggested that innovative approaches need to be developed to promote a better understanding of transmission, prevent and treat HBV, increase HBV vaccination rates among children and at-risk adults, educate women about vertical transmission risk, reduce stigmatization, and provide culturally sensitive and understandable educational material.14
Awareness Among Health Care Professionals
Studies have identified knowledge gaps among HCPs regarding the prevalence of HBV in the general U.S. population, outcome of infection, who should be screened and vaccinated against HBV, appropriate methods for screening and interpretation of serologic tests for HBV, and proper treatment of persons with chronic infection. As a consequence, the IOM recommended educational programs for HCPs on the prevalence of HBV infection in the general U.S. population and at-risk populations, particularly foreign-born persons. In addition, these educational programs should target all levels of HCPs, including undergraduates and postgraduates, and include information on screening and prevention, testing, and interpretation of tests.14
Need to Treat
The global HBV disease burden remains high despite the existence of an effective vaccine. Worldwide, there are an estimated 4.5 million new infections and 780,000 HBVrelated deaths each year.15 In the U.S., the highest rates of mortality are seen in Asians and Pacific Islanders and among persons aged 55 to 64 years. Asians and Pacific Islanders also have the highest rate of liver cancer deaths.16,17
The natural history of chronic hepatitis B is highly variable and dependent on a complex interplay between the virus and the host immune response. It is estimated that between 25% and 40% of persons with chronic hepatitis B will be at risk for progression to cirrhosis.7,18,19 In a study among persons with cirrhosis, the 5-year cumulative risk of developing hepatocellular carcinoma was 17% in Asian patients and 10% in white Americans and Europeans. The 5-year liver-related death rate was 14% among East Asians and 15% among white Europeans.18
A significant proportion of individuals infected with HBV are unaware of their diagnosis, not enrolled in care, or not receiving therapy.7,12,20-24 Data from several prospective and retrospective cohort studies have demonstrated that prolonged viral suppression achieved with therapy is associated with regression of fibrosis and reversal of cirrhosis in a substantial proportion of individuals.25,26 Treatment has also been associated with a reduction in rates of liver decompensation, HCC, liverrelated, and all-cause mortality among patients with liver cirrhosis.27
Given the risk of serious complications and the availability of safe and effective therapy, it is imperative that persons identified as having chronic hepatitis B be referred for evaluation to determine whether therapy is warranted. However, it is also important to recognize that a cure for HBV infection is currently not available, and most patients who initiate therapy will require longterm treatment. In addition, persons who are not currently treatment candidates may become candidates due to changes in disease activity. This underscores the point that patients with chronic hepatitis B require lifelong monitoring regardless of whether they are receiving treatment.
Conclusions
The primary reasons to screen for HBV are to reduce morbidity and mortality related to liver disease and to prevent transmission. Significant barriers remain to screening and referral for care for HBV in the U.S. Educational programs to increase knowledge and awareness among HCPs and the public together with improved access to care are critical to improve disease outcomes and prevent transmission. Despite the availability of an effective vaccine for 3 decades, the global prevalence of HBV has not substantially declined. Further research is needed to explore strategies to overcome screening barriers, improve vaccination rates, and to develop new models of health care delivery to reduce the burden of disease-related to HBV.
1. Schweitzer A, Horn J, Mikolajczyk RT, Krause G, Ott JJ. Estimations of worldwide prevalence of chronic hepatitis B virus infection: a systematic review of data published between 1965 and 2013. Lancet. 2015;386(10003):1546-1555.
2. Mitchell T, Armstrong GL, Hu DJ, Wasley A, Painter JA. The increasing burden of imported chronic hepatitis B--United States, 1974-2008. PLoS One. 2011;6(12):e27717.
3. Kowdley KV, Wang CC, Welch S, Roberts H, Brosgart CL. Prevalence of chronic hepatitis B among foreign-born persons living in the United States by country of origin. Hepatology. 2012;56(2):422-433.
4. Cohen C, Holmberg SD, McMahon BJ, et al. Is chronic hepatitis B being undertreated in the United States? J Viral Hepat. 2011;18(6):377-383.
5. Hutton DW, Tan D, So SK, Brandeau ML. Cost-effectiveness of screening and vaccinating Asian and Pacific Islander adults for hepatitis B. Ann Intern Med. 2007;147(7):460-469.
6. Eckman MH, Kaiser TE, Sherman KE. The cost-effectiveness of screening for chronic hepatitis B infection in the United States. Clin Infect Dis. 2011;52(11):1294-1306.
7. Weinbaum CM, Williams I, Mast EE, et al; Centers for Disease Control and Prevention (CDC). Recommendations for identification and public health management of persons with chronic hepatitis B virus infection. MMWR Recomm Rep. 2008;57(RR-8):1-20.
8. LeFevre ML; U.S. Preventive Services Task Force. Screening for hepatitis B virus infection in nonpregnant adolescents and adults: U.S. Preventive Services Task Force recommendation statement. Ann Intern Med. 2014;161(1):58-66.
10. Terrault NA, Bzowej NH, Chang KM, Hwang JP, Jonas MM, Murad MH. AASLD guidelines for treatment of chronic hepatitis B. Hepatology. 2016;63(1):261-283.
11. Centers for Disease Control and Prevention (CDC). Screening for chronic hepatitis B among Asian/Pacific Islander populations--New York City, 2005. MMWR Morb Mortal Wkly Rep. 2006;55(18):505-509.
12. Lin SY, Chang ET, So SK. Why we should routinely screen Asian American adults for hepatitis B: a cross-sectional study of Asians in California. Hepatology. 2007;46(4):1034-1040.
13. Lai CJ, Nguyen TT, Hwang J, Stewart SL, Kwan A, McPhee SJ. Provider knowledge and practice regarding hepatitis B screening in Chinese-speaking patients. J Cancer Educ. 2007;22(1):37-41.
14. Colvin HM, Mitchell AE, eds; Committee on the Prevention and Control of Viral Hepatitis Infections Board on Population Health and Public Health Practice. Hepatitis and liver cancer: a national strategy for prevention and control of hepatitis B and C. Washington, DC: National Academies Press; 2010:xix, 232.
15. Hepatitis B Fact Sheet No. 204. World Health Organization Website. http://www.who.int/entity/mediacentre/factsheets/fs204/en/. Updated July 2015. Accessed March 17, 2016.
16. Perz JF, Openo K, Ahmed F, Bell BP. P.382 Trends in mortality from liver cancer in the USA, 1993-2002. J Clin Virol. 2006;36(suppl 2):S178.
17. Chang ET, Keegan TH, Gomez SL, et al. The burden of liver cancer in Asians and Pacific Islanders in the Greater San Francisco Bay Area, 1990 through 2004. Cancer. 2007;109(10):2100-2108.
18. Fattovich G1, Bortolotti F, Donato F. Natural history of chronic hepatitis B: special emphasis on disease progression and prognostic factors. J Hepatol. 2008;48(2):335-352.
19. Chou R, Dana T, Bougatsos C, Blazina I, Khangura J, Zakher B. Screening for hepatitis B virus infection in adolescents and adults: a systematic review to update the U.S. Preventive Services Task Force recommendation. Ann Intern Med. 2014;161(1):31-45.
20. Wan KJ, Miyoshi T, Fryer G, et al. Screening for hepatitis B virus infection by primary care physicians in New York City: are screening recommendations for persons born inendemic countries being followed?[abstract 1454]. Hepatology. 2007;46(suppl):889A-890A.
21. Thompson MJ, Taylor VM, Jackson JC, et al. Hepatitis B knowledge and practices among Chinese American women in Seattle, Washington. J Cancer Educ. 2002;17(4):222-226.
22. Ma GX, Fang CY, Shive SE, Toubbeh J, Tan Y, Siu P. Risk perceptions and barriers to hepatitis B screening and vaccination among Vietnamese immigrants. J Immigr Minor Health. 2007;9(3):213-220.
23. Taylor VM, Choe JH, Yasui Y, Li Lin, Burke N, Jackson JC. Hepatitis B awareness, testing, and knowledge among Vietnamese American men and women. J Community Health. 2005;30(6):477-490.
24. Weinbaum CM, Lyerla R, Mackellar DA, et al; Young Men’s Survey Study Group. The young men’s survey phase II: hepatitis B immunization and infection among young men who have sex with men. Am J Public Health. 2008;98(5):839-845.
25. Marcellin P, Gane E, Buti M. Regression of cirrhosis during treatment with tenofovir disoproxil fumarate for chronic hepatitis B: a 5-year open-label follow-up study. Lancet. 2013;381(9865):468-475.
26. Chang TT, Liaw YF, Wu SS. Long-term entecavir therapy results in the reversal of fibrosis/cirrhosis and continued histological improvement in patients with chronic hepatitis B. Hepatology. 2010;52(3):886-893.
27. Wong GL, Chan HL, Mak CW. Entecavir treatment reduces hepatic events and deaths in chronic hepatitis B patients with liver cirrhosis. Hepatology.2013;58(5):1537-1547.
References
1. Schweitzer A, Horn J, Mikolajczyk RT, Krause G, Ott JJ. Estimations of worldwide prevalence of chronic hepatitis B virus infection: a systematic review of data published between 1965 and 2013. Lancet. 2015;386(10003):1546-1555.
2. Mitchell T, Armstrong GL, Hu DJ, Wasley A, Painter JA. The increasing burden of imported chronic hepatitis B--United States, 1974-2008. PLoS One. 2011;6(12):e27717.
3. Kowdley KV, Wang CC, Welch S, Roberts H, Brosgart CL. Prevalence of chronic hepatitis B among foreign-born persons living in the United States by country of origin. Hepatology. 2012;56(2):422-433.
4. Cohen C, Holmberg SD, McMahon BJ, et al. Is chronic hepatitis B being undertreated in the United States? J Viral Hepat. 2011;18(6):377-383.
5. Hutton DW, Tan D, So SK, Brandeau ML. Cost-effectiveness of screening and vaccinating Asian and Pacific Islander adults for hepatitis B. Ann Intern Med. 2007;147(7):460-469.
6. Eckman MH, Kaiser TE, Sherman KE. The cost-effectiveness of screening for chronic hepatitis B infection in the United States. Clin Infect Dis. 2011;52(11):1294-1306.
7. Weinbaum CM, Williams I, Mast EE, et al; Centers for Disease Control and Prevention (CDC). Recommendations for identification and public health management of persons with chronic hepatitis B virus infection. MMWR Recomm Rep. 2008;57(RR-8):1-20.
8. LeFevre ML; U.S. Preventive Services Task Force. Screening for hepatitis B virus infection in nonpregnant adolescents and adults: U.S. Preventive Services Task Force recommendation statement. Ann Intern Med. 2014;161(1):58-66.
10. Terrault NA, Bzowej NH, Chang KM, Hwang JP, Jonas MM, Murad MH. AASLD guidelines for treatment of chronic hepatitis B. Hepatology. 2016;63(1):261-283.
11. Centers for Disease Control and Prevention (CDC). Screening for chronic hepatitis B among Asian/Pacific Islander populations--New York City, 2005. MMWR Morb Mortal Wkly Rep. 2006;55(18):505-509.
12. Lin SY, Chang ET, So SK. Why we should routinely screen Asian American adults for hepatitis B: a cross-sectional study of Asians in California. Hepatology. 2007;46(4):1034-1040.
13. Lai CJ, Nguyen TT, Hwang J, Stewart SL, Kwan A, McPhee SJ. Provider knowledge and practice regarding hepatitis B screening in Chinese-speaking patients. J Cancer Educ. 2007;22(1):37-41.
14. Colvin HM, Mitchell AE, eds; Committee on the Prevention and Control of Viral Hepatitis Infections Board on Population Health and Public Health Practice. Hepatitis and liver cancer: a national strategy for prevention and control of hepatitis B and C. Washington, DC: National Academies Press; 2010:xix, 232.
15. Hepatitis B Fact Sheet No. 204. World Health Organization Website. http://www.who.int/entity/mediacentre/factsheets/fs204/en/. Updated July 2015. Accessed March 17, 2016.
16. Perz JF, Openo K, Ahmed F, Bell BP. P.382 Trends in mortality from liver cancer in the USA, 1993-2002. J Clin Virol. 2006;36(suppl 2):S178.
17. Chang ET, Keegan TH, Gomez SL, et al. The burden of liver cancer in Asians and Pacific Islanders in the Greater San Francisco Bay Area, 1990 through 2004. Cancer. 2007;109(10):2100-2108.
18. Fattovich G1, Bortolotti F, Donato F. Natural history of chronic hepatitis B: special emphasis on disease progression and prognostic factors. J Hepatol. 2008;48(2):335-352.
19. Chou R, Dana T, Bougatsos C, Blazina I, Khangura J, Zakher B. Screening for hepatitis B virus infection in adolescents and adults: a systematic review to update the U.S. Preventive Services Task Force recommendation. Ann Intern Med. 2014;161(1):31-45.
20. Wan KJ, Miyoshi T, Fryer G, et al. Screening for hepatitis B virus infection by primary care physicians in New York City: are screening recommendations for persons born inendemic countries being followed?[abstract 1454]. Hepatology. 2007;46(suppl):889A-890A.
21. Thompson MJ, Taylor VM, Jackson JC, et al. Hepatitis B knowledge and practices among Chinese American women in Seattle, Washington. J Cancer Educ. 2002;17(4):222-226.
22. Ma GX, Fang CY, Shive SE, Toubbeh J, Tan Y, Siu P. Risk perceptions and barriers to hepatitis B screening and vaccination among Vietnamese immigrants. J Immigr Minor Health. 2007;9(3):213-220.
23. Taylor VM, Choe JH, Yasui Y, Li Lin, Burke N, Jackson JC. Hepatitis B awareness, testing, and knowledge among Vietnamese American men and women. J Community Health. 2005;30(6):477-490.
24. Weinbaum CM, Lyerla R, Mackellar DA, et al; Young Men’s Survey Study Group. The young men’s survey phase II: hepatitis B immunization and infection among young men who have sex with men. Am J Public Health. 2008;98(5):839-845.
25. Marcellin P, Gane E, Buti M. Regression of cirrhosis during treatment with tenofovir disoproxil fumarate for chronic hepatitis B: a 5-year open-label follow-up study. Lancet. 2013;381(9865):468-475.
26. Chang TT, Liaw YF, Wu SS. Long-term entecavir therapy results in the reversal of fibrosis/cirrhosis and continued histological improvement in patients with chronic hepatitis B. Hepatology. 2010;52(3):886-893.
27. Wong GL, Chan HL, Mak CW. Entecavir treatment reduces hepatic events and deaths in chronic hepatitis B patients with liver cirrhosis. Hepatology.2013;58(5):1537-1547.
From Beth Israel Deaconess Medical Center and Harvard Medical School, Boston, MA.
Abstracts
Objective: To identify patient factors associated with willingness to take daily weight loss medication and weight loss expectations using these medications.
Methods: A random sample of 331 primary care patients aged 18–65 years with a BMI ≥ 35 kg/m2 were recruited from 4 diverse primary care practices in Boston, MA. We conducted telephone interviews and chart reviews to assess patients’ willingness to take a weight loss medication and their expectations for weight loss. We used sequential logistic regression models to identify demographic, clinical, and quality of life (QOL) factors associated with this willingness.
Results: Of 331 subjects, 69% were women, 35% were white, 35% were black, and 25% were Hispanic; 249 (75%) of patients were willing to take a daily weight loss medication if recommended by their doctor but required a median weight loss of 15% to 24%; only 17% of patients were willing to take a medication for ≤ 10% weight loss. Men were significantly more willing than women (1.2 [95% CI 1.0–1.4]). Diabetes was the only comorbidity associated with willingness to consider pharmacotherapy (1.2 [1.0–1.3]) but only modestly improved model performance (C-statistic increased from 0.59 to 0.60). In contrast, lower QOL, especially low self-esteem and sex life, were stronger correlates (C-statistic 0.72).
Conclusion: A majority of obese primary care patients were willing to take a daily weight loss pill; however, most required more than 10% weight loss to consider pharmacotherapy worthwhile. Poor QOL, especially low self-esteem and poor sex life, were stronger correlates than having diabetes.
Key words: obesity; primary care; weight loss medication.
In the United States, obesity continues to be unrelentingly prevalent, affecting more than one-third of adults (34.9%) [1]. This statistic has ominous implications when considering that obesity is a risk factor for numerous chronic diseases, such as coronary heart disease, diabetes, sleep apnea, osteoarthritis, and some types of cancers [2]. Moreover, it is associated with increased risk of all-cause and cardiovascular disease mortality. Promisingly, an initial 5% to 10% weight loss over 6 months has been associated with improvement in LDL, HDL, triglycerides, glucose, hemoglobin A1C, diabetes risk, blood pressure, and medication use [2]. Therefore, although patients may not be able to achieve their ideal body weight or normal BMI, modest weight loss can still have beneficial health effects.
Weight loss medications are effective adjunctive therapies in helping patients lose up to 10% of their body weight on average when combined with diet and exercise [3–5]. There are currently 5 medications approved by the Food and Drug Administration for long-term use for weight loss: orlistat, lorcaserin, phentermine-topiramate, bupropion-naltrexone, and liraglutide. Despite their proven efficacy, there are barriers to initiating a long-term weight loss medication. Insurance reimbursement is limited for these medications, thus resulting in high out-of-pocket cost for patients that they may be unable or unwilling to pay [6]. There may also be safety concerns given that several weight loss medications, including fenfluramine, sibutramine, and rimonabant, have been withdrawn from the market because of adverse effects [7]. Thus, in deciding whether to initiate a pharmacologic weight loss regimen, patients must believe that the weight loss benefits will exceed the potential risks.
Little is known, however, about patients’ willingness to take weight loss medications or the minimum weight loss they expect to lose to make pharmacotherapy worthwhile. Only a few studies have investigated patient willingness to adopt pharmacotherapy as part of a weight loss regimen, and only one investigated obese patients in the United States [8]. In this context, we surveyed a sociodemographically diverse group of primary care patients with moderate to severe obesity to examine patient characteristics associated with willingness to pursue weight loss pharmacotherapy. We also aimed to evaluate how much weight patients expected to lose in order to make taking a daily medication worth the effort. Characterizing patients seen in primary care who are willing to adopt pharmacotherapy to lose weight may guide weight loss counseling in the primary care setting. Furthermore, determining whether patients have realistic weight loss expectations can help clinicians better counsel their patients on weight loss goals.
Methods
Study Sample
We recruited 337 subjects from 4 diverse primary care practices in Boston, Massachusetts: a large hospital-based academic practice, a community practice in a working-class suburb, a community practice in an affluent suburb, and a health center serving a predominantly socially disadvantaged population. The primary goal of the parent study was to understand the preferences of patients for weight loss treatment, especially bariatric surgery. Therefore, to be included, patients needed to have a BMI ≥ 35 kg/m2 at the time of recruitment, been seen in clinic within the past year, be aged 18–65 years, and be English or Spanish speaking. By design, African-American and Hispanic patients were oversampled from an electronic list of potentially eligible patient groups so that we could examine for racial differences in treatment preferences. Study details have been previously described [9].
Data Collection and Measures
Trained interviewers conducted a 45- to 60-minute telephone interview with each participant in either English or Spanish. To assess willingness to use a daily weight loss medication, subjects were asked, “If your doctor recommended it, would you be willing to take a pill or medication every day in order to lose weight?” Those who answered affirmatively were then asked the minimum amount of weight they would have to lose to make taking a pill everyday worthwhile.
Subjects were also asked about demographic information (age, race, education, marital status) and comorbid health conditions commonly associated with obesity (diabetes mellitus, hypertension, asthma, obstructive sleep apnea, GERD, depression, anxiety, back pain, and cardiovascular problems). We assessed quality of life (QOL) using the Impact of Weight on Quality of Life-Lite (IWQOL-Lite), a 31-item instrument designed specifically to assess the impact of obesity on QOL capturing 5 domains (physical function, self-esteem, sexual life, public distress, and work). Subjects were asked to rate a series of statements beginning with “Because of my weight…” as “always true,” “usually true,” “sometimes true,” “rarely true,” or “never true.” Global and domain scores ranged from 0 to 100; higher scores reflected better QOL [10].
Data Analysis
We used descriptive statistics to characterize the proportion of subjects willing to use a daily weight loss medication and the weight loss required for patients to be willing to consider pharmacotherapy. We used a stepwise logistic model to examine demographic, QOL, and clinical factors associated with the willingness to take a weight loss medication as the outcome, with an entry criteria of P value of 0.1 and an exit criteria of 0.05. Log-Poisson distribution using the sandwich estimator was used to obtain relative risks for each significant variable. Adjusted models included age, BMI, sex, and race and any significant comorbidities. We added overall QOL score and individual QOL scores in subsequent models to examine the relative influence of overall vs. domain-specific QOL. Statistical analyses were conducted with SAS (SAS Institute, Cary, NC). We considered the change in model C-statistic when specific variables were added to the model to determine the importance of these factors in contributing to patients’ willingness to consider pharmacotherapy; larger changes in model C-statistic signifies a greater contribution.
Results
Of the 337 subjects enrolled in this study, 331 responded to the question “If your doctor recommended it, would you be willing to take a pill or medication every day in order to lose weight?” Of the respondents, 249 (75%) answered affirmatively. Table 1 characterizes our sample’s willingness to take a weight loss medication and factors significantly associated with willingness to take a weight loss medication prior to adjustment. The median weight loss required by patients ranged from 15% to 24% of body weight depending on the patient subgroup. Only 17% of patients overall were willing to take a medication for 10% weight loss or less (ranged from 6% to 31% depending on subgroup).
Table 2 displays sequentially adjusted models examining various demographic, clinical, and QOL factors associated with willingness to take a weight loss medication.
Willingness did not significantly differ by BMI, sex, and race after initial adjustment (model 1). When we considered comorbidities, only diabetes and anxiety were significant correlates; however, the change in C-statistic was negligible. In contrast, overall QOL score (model 3) was significantly associated with willingness to consider pharmacotherapy and improved the model C-statistic from 0.60 to 0.65. When we considered individual QOL domains (model 4), self-esteem and sex life were the only 2 significant domains but together improved the model C-statistics to a greater extent than overall QOL. After adjustment for QOL, men were now significantly more likely than women to consider pharmacotherapy and having a diagnosis of anxiety was no longer a significant correlate.
Discussion
In our study, we found that a large proportion (75%) of primary care patients with at least moderate obesity were willing to take a daily weight loss medication if their doctor recommended it. After full adjustment, men, those with lower quality of life (QOL), and patients with diabetes were more likely to pursue weight loss pharmacotherapy than their counterparts. Moreover, QOL appeared more important than comorbid diagnoses in contributing to whether patients would consider taking a weight loss medication. Most patients expected to lose more than 10% of their weight to make taking a daily medication worthwhile.
Few studies have examined patients’ willingness to take a medication to lose weight. Tan et al [11] found that only about half of their surveyed outpatients were likely to take a medication to lose weight; however, approximately a quarter of the patients in that study were of normal BMI. In contrast, our study interviewed patients with at least a BMI of 35 kg/m2 and the majority of these patients reported a willingness to take a weight loss medication. Nevertheless, patients appear to have unrealistic expectations of the weight loss potential of pharmacotherapy. Only a minority of patients in our study would be willing to take a weight loss medication if the weight loss was no more than 10%, a level that is more consistent with the outcomes achievable in most clinical trials of weight loss medications [12]. Prior studies have also shown that patients often have unrealistic weight loss expectations and are unable to achieve their ideal body weight using diet, exercise, or pharmacotherapy [13,14]. Doyle et al found that percentage of weight loss was the most important treatment attribute when considering weight loss pharmacotherapy when compared to cost, health improvements, side effects, diet and exercise requirements, and method of medication administration [8]. Thus it is important to educate patients on realistic goal setting and the benefits of modest weight loss when considering pharmacotherapy. The weight loss preferences expressed in our study may also influence the weight loss outcomes targets pursued in pharmaceutical development. Interestingly, after full adjustment, BMI did not correlate with willingness to take a weight loss medication. Given that all patients in our study had a BMI of ≥ 35 kg/m2, this may imply that variations beyond this BMI threshold did not significantly affect a patient’s willingness to use pharmacotherapy. In contrast, weight-related QOL was an important correlate.
Men were slightly more likely than women to be willing to take a weight loss medication, which is interesting since men have been shown to be less likely to participate in behavioral weight loss programs and diets [15]. One reason may be that many weight loss programs are delivered in group settings which may deter men from participating. Whether this hypothetical willingness to undergo pharmacotherapy would translate to actual use is unclear, especially since there are barriers to pharmacotherapy including out-of-pocket costs. In a prior study in the United Kingdom, women were more likely to have reported prior weight loss medication use than men [16].
Our study did not find differences in willingness to pursue weight loss medication by race or educational attainment. This is consistent with our prior work demonstrating that racial and ethnic minorities were no less likely to consider bariatric surgery if the treatment were recommended by their doctor [9]. However, our other work did suggest that clinicians may be less likely to recommend bariatric surgery to their medically eligible minority patients as compared to their Caucasian patients. Whether this may be the case for pharmacotherapy is unclear since this was not explicitly queried in our current study [9].
Our study also found that patients with diabetes but not other comorbidities were more likely to consider weight loss medication after adjusting for QOL. This may reflect a stronger link between diabetes and obesity perceived by patients. Our result is consistent with our earlier data showing that diabetes but not other comorbid conditions was associated with a higher likelihood of considering weight loss surgery [9]. Nevertheless, having diabetes contributed only modestly to the variation in patient preferences regarding pharmacotherapy as reflected by the trivial change in model C-statistic when diabetes status was added to the model.
In contrast, lower QOL scores, especially in the domains of self-esteem and sex life, were associated with increased willingness to take a weight loss medication and appeared to be a stronger predictor than individual comorbidities. This is consistent with other studies showing that patients seeking treatment for obesity tend to have lower health-related QOL [9,17]. Our findings are also consistent with our previous research demonstrating that impairments in specific QOL domains are often more important to patients and stronger drivers of diminished well-being than measures of overall QOL [18]. Hence, given their importance to patients, clinicians need to consider QOL benefits when counseling patients about the risks and benefits of various obesity treatments.
This study is the first to our knowledge to systematically characterize demographic factors associated with the likelihood of primary care patients with obesity considering weight loss pharmacotherapy. This information may aid outpatient weight loss counseling by increasing awareness of gender and patient specific preferences. The fact that many patients with obesity appear to be interested in pursuing weight loss medication may also support public health initiatives in providing equitable access to weight loss pharmacotherapy. As our study characterizes patients who are willing to pursue weight loss medications, future studies may include retrospective analyses on actual use of weight loss medications among various demographic groups. Further investigation on specific reasons why patients choose whether or not to use weight loss medication may also be helpful.
This study has important limitations. The sample size was modest and potentially underpowered to detect small differences across different subgroups. Our sample was also limited to practices in Boston, which limits generalizability; although, by design, we oversampled racial and ethnic subjects to ensure diverse representation. Finally, our study examined patients’ hypothetical willingness to take weight loss medications rather than their actual adherence to treatment if offered.
Conclusion
In this sample of obese primary care patients, we found that the majority of patients were willing to take a daily medication to lose weight; however, patients had expectations for weight loss that far exceeded the level achievable by patients in pharmaceutical trials of these agents. Men and patients with diabetes were more likely to be willing to pursue weight loss medication; however, lower weight-related QOL, especially low self-esteem and impaired sexual function, appeared to be a stronger correlate of willingness to consider pharmacotherapy than comorbid diagnoses.
Corresponding author: Christina C. Wee, MD, MPH, Beth Israel Deaconess Medical Center, 330 Brookline Ave., Boston, MA 02215, cwee@bidmc.harvard.edu.
Funding/support: This study was funded by the National Institute of Diabetes, Digestive and Kidney Diseases (R01 DK073302, PI Wee). Dr. Wee is also supported by an NIH midcareer mentorship award (K24DK087932). The sponsor had no role in the design or conduct of the study; the collection, management, analysis, and interpretation of the data; or the preparation, review, or approval of the manuscript.
Financial disclosures: None reported.
References
1. Ogden CL, Carroll MD, Kit BK, Flegal KM. Prevalence of obesity among adults: United States, 2011–2012. NCHS Data Brief 2013;(131):1–8.
2. Jensen MD, Ryan DH, Apovian CM, et al. 2013 AHA/ACC/TOS guideline for the management of overweight and obesity in adults: a report of the American College of Cardiology/American Heart Association Task Force on Practice Guidelines and The Obesity Society. J Am Coll Cardiol 2014;63(25 Pt B):2985–3023.
3. Hauptman J, Lucas C, Boldrin MN, et al. Orlistat in the long-term treatment of obesity in primary care settings. Arch Fam Med 2000;9:160–7.
4. Kakkar AK, Dahiya N. Drug treatment of obesity: current status and future prospects. Eur J Intern Med 2015;26:89–94.
5. Allison DB, Gadde KM, Garvey WT, et al. Controlled-release phentermine/topiramate in severely obese adults: a randomized controlled trial (EQUIP). Obesity (Silver Spring). 2012;20:330–42.
6. Fabricatore AN, Wadden TA. Obesity. Annu Rev Clin Psychol 2006;2:357–77.
7. Cheung BM, Cheung TT, Samaranayake NR. Safety of antiobesity drugs. Ther Adv Drug Saf 2013;4:171–81.
8. Doyle S, Lloyd A, Birt J, et al. Willingness to pay for obesity pharmacotherapy. Obesity (Silver Spring) 2012;20:2019–26.
9. Wee CC HK, Bolcic-Jankovic D, Colten ME, et al. Sex, race, and consideration of bariatric surgery among primary care patients with moderate to severe obesity. J Gen Intern Med 2014;29:68–75.
10. Kolotkin RL, Crosby RD, Kosloski KD, Williams GR. Development of a brief measure to assess quality of life in obesity. Obes Res 2001;9:102–11.
11. Tan DZN, Dennis SM, Vagholkar S. Weight management in general practice: what do patients want? Med J Aust 2006;185:73–5.
12. Yanovski SZ, Yanovski JA. Long-term drug treatment for obesity: a systematic and clinical review. JAMA 2014;311:74–86.
13. Foster GD, Wadden TA, Vogt RA, Brewer G. What is a reasonable weight loss? Patients’ expectations and evaluations of obesity treatment outcomes. J Consult Clin Psychol 1997;65:79–85.
14. Fabricatore AN, Wadden TA, Womble LG, et al. The role of patients’ expectations and goals in the behavioral and pharmacological treatment of obesity. Int J Obes (Lond) 2007;31:1739–45.
15. Robertson C, Archibald D, Avenell A, et al. Systematic reviews of and integrated report on the quantitative, qualitative and economic evidence base for the management of obesity in men. Health Technol Assess 2014;18:1–424.
16. Thompson RL, Thomas DE. A cross-sectional survey of the opinions on weight loss treatments of adult obese patients attending a dietetic clinic. Int J Obes Relat Metab Disord 2000;24:164–70.
17. Kolotkin RL, Crosby RD, Williams GR. Health-related quality of life varies among obese subgroups. Obes Res 2002;10:748–56.
18. Wee C, Davis R, Chiodi S, et al. Sex, race, and the adverse effects of social stigma vs. other quality of life factors among primary care patients with moderate to severe obesity. J Gen Intern Med 2015;30:229–35.
Issue
Journal of Clinical Outcomes Management - March 2017, Vol. 24, No. 3
From Beth Israel Deaconess Medical Center and Harvard Medical School, Boston, MA.
Abstracts
Objective: To identify patient factors associated with willingness to take daily weight loss medication and weight loss expectations using these medications.
Methods: A random sample of 331 primary care patients aged 18–65 years with a BMI ≥ 35 kg/m2 were recruited from 4 diverse primary care practices in Boston, MA. We conducted telephone interviews and chart reviews to assess patients’ willingness to take a weight loss medication and their expectations for weight loss. We used sequential logistic regression models to identify demographic, clinical, and quality of life (QOL) factors associated with this willingness.
Results: Of 331 subjects, 69% were women, 35% were white, 35% were black, and 25% were Hispanic; 249 (75%) of patients were willing to take a daily weight loss medication if recommended by their doctor but required a median weight loss of 15% to 24%; only 17% of patients were willing to take a medication for ≤ 10% weight loss. Men were significantly more willing than women (1.2 [95% CI 1.0–1.4]). Diabetes was the only comorbidity associated with willingness to consider pharmacotherapy (1.2 [1.0–1.3]) but only modestly improved model performance (C-statistic increased from 0.59 to 0.60). In contrast, lower QOL, especially low self-esteem and sex life, were stronger correlates (C-statistic 0.72).
Conclusion: A majority of obese primary care patients were willing to take a daily weight loss pill; however, most required more than 10% weight loss to consider pharmacotherapy worthwhile. Poor QOL, especially low self-esteem and poor sex life, were stronger correlates than having diabetes.
Key words: obesity; primary care; weight loss medication.
In the United States, obesity continues to be unrelentingly prevalent, affecting more than one-third of adults (34.9%) [1]. This statistic has ominous implications when considering that obesity is a risk factor for numerous chronic diseases, such as coronary heart disease, diabetes, sleep apnea, osteoarthritis, and some types of cancers [2]. Moreover, it is associated with increased risk of all-cause and cardiovascular disease mortality. Promisingly, an initial 5% to 10% weight loss over 6 months has been associated with improvement in LDL, HDL, triglycerides, glucose, hemoglobin A1C, diabetes risk, blood pressure, and medication use [2]. Therefore, although patients may not be able to achieve their ideal body weight or normal BMI, modest weight loss can still have beneficial health effects.
Weight loss medications are effective adjunctive therapies in helping patients lose up to 10% of their body weight on average when combined with diet and exercise [3–5]. There are currently 5 medications approved by the Food and Drug Administration for long-term use for weight loss: orlistat, lorcaserin, phentermine-topiramate, bupropion-naltrexone, and liraglutide. Despite their proven efficacy, there are barriers to initiating a long-term weight loss medication. Insurance reimbursement is limited for these medications, thus resulting in high out-of-pocket cost for patients that they may be unable or unwilling to pay [6]. There may also be safety concerns given that several weight loss medications, including fenfluramine, sibutramine, and rimonabant, have been withdrawn from the market because of adverse effects [7]. Thus, in deciding whether to initiate a pharmacologic weight loss regimen, patients must believe that the weight loss benefits will exceed the potential risks.
Little is known, however, about patients’ willingness to take weight loss medications or the minimum weight loss they expect to lose to make pharmacotherapy worthwhile. Only a few studies have investigated patient willingness to adopt pharmacotherapy as part of a weight loss regimen, and only one investigated obese patients in the United States [8]. In this context, we surveyed a sociodemographically diverse group of primary care patients with moderate to severe obesity to examine patient characteristics associated with willingness to pursue weight loss pharmacotherapy. We also aimed to evaluate how much weight patients expected to lose in order to make taking a daily medication worth the effort. Characterizing patients seen in primary care who are willing to adopt pharmacotherapy to lose weight may guide weight loss counseling in the primary care setting. Furthermore, determining whether patients have realistic weight loss expectations can help clinicians better counsel their patients on weight loss goals.
Methods
Study Sample
We recruited 337 subjects from 4 diverse primary care practices in Boston, Massachusetts: a large hospital-based academic practice, a community practice in a working-class suburb, a community practice in an affluent suburb, and a health center serving a predominantly socially disadvantaged population. The primary goal of the parent study was to understand the preferences of patients for weight loss treatment, especially bariatric surgery. Therefore, to be included, patients needed to have a BMI ≥ 35 kg/m2 at the time of recruitment, been seen in clinic within the past year, be aged 18–65 years, and be English or Spanish speaking. By design, African-American and Hispanic patients were oversampled from an electronic list of potentially eligible patient groups so that we could examine for racial differences in treatment preferences. Study details have been previously described [9].
Data Collection and Measures
Trained interviewers conducted a 45- to 60-minute telephone interview with each participant in either English or Spanish. To assess willingness to use a daily weight loss medication, subjects were asked, “If your doctor recommended it, would you be willing to take a pill or medication every day in order to lose weight?” Those who answered affirmatively were then asked the minimum amount of weight they would have to lose to make taking a pill everyday worthwhile.
Subjects were also asked about demographic information (age, race, education, marital status) and comorbid health conditions commonly associated with obesity (diabetes mellitus, hypertension, asthma, obstructive sleep apnea, GERD, depression, anxiety, back pain, and cardiovascular problems). We assessed quality of life (QOL) using the Impact of Weight on Quality of Life-Lite (IWQOL-Lite), a 31-item instrument designed specifically to assess the impact of obesity on QOL capturing 5 domains (physical function, self-esteem, sexual life, public distress, and work). Subjects were asked to rate a series of statements beginning with “Because of my weight…” as “always true,” “usually true,” “sometimes true,” “rarely true,” or “never true.” Global and domain scores ranged from 0 to 100; higher scores reflected better QOL [10].
Data Analysis
We used descriptive statistics to characterize the proportion of subjects willing to use a daily weight loss medication and the weight loss required for patients to be willing to consider pharmacotherapy. We used a stepwise logistic model to examine demographic, QOL, and clinical factors associated with the willingness to take a weight loss medication as the outcome, with an entry criteria of P value of 0.1 and an exit criteria of 0.05. Log-Poisson distribution using the sandwich estimator was used to obtain relative risks for each significant variable. Adjusted models included age, BMI, sex, and race and any significant comorbidities. We added overall QOL score and individual QOL scores in subsequent models to examine the relative influence of overall vs. domain-specific QOL. Statistical analyses were conducted with SAS (SAS Institute, Cary, NC). We considered the change in model C-statistic when specific variables were added to the model to determine the importance of these factors in contributing to patients’ willingness to consider pharmacotherapy; larger changes in model C-statistic signifies a greater contribution.
Results
Of the 337 subjects enrolled in this study, 331 responded to the question “If your doctor recommended it, would you be willing to take a pill or medication every day in order to lose weight?” Of the respondents, 249 (75%) answered affirmatively. Table 1 characterizes our sample’s willingness to take a weight loss medication and factors significantly associated with willingness to take a weight loss medication prior to adjustment. The median weight loss required by patients ranged from 15% to 24% of body weight depending on the patient subgroup. Only 17% of patients overall were willing to take a medication for 10% weight loss or less (ranged from 6% to 31% depending on subgroup).
Table 2 displays sequentially adjusted models examining various demographic, clinical, and QOL factors associated with willingness to take a weight loss medication.
Willingness did not significantly differ by BMI, sex, and race after initial adjustment (model 1). When we considered comorbidities, only diabetes and anxiety were significant correlates; however, the change in C-statistic was negligible. In contrast, overall QOL score (model 3) was significantly associated with willingness to consider pharmacotherapy and improved the model C-statistic from 0.60 to 0.65. When we considered individual QOL domains (model 4), self-esteem and sex life were the only 2 significant domains but together improved the model C-statistics to a greater extent than overall QOL. After adjustment for QOL, men were now significantly more likely than women to consider pharmacotherapy and having a diagnosis of anxiety was no longer a significant correlate.
Discussion
In our study, we found that a large proportion (75%) of primary care patients with at least moderate obesity were willing to take a daily weight loss medication if their doctor recommended it. After full adjustment, men, those with lower quality of life (QOL), and patients with diabetes were more likely to pursue weight loss pharmacotherapy than their counterparts. Moreover, QOL appeared more important than comorbid diagnoses in contributing to whether patients would consider taking a weight loss medication. Most patients expected to lose more than 10% of their weight to make taking a daily medication worthwhile.
Few studies have examined patients’ willingness to take a medication to lose weight. Tan et al [11] found that only about half of their surveyed outpatients were likely to take a medication to lose weight; however, approximately a quarter of the patients in that study were of normal BMI. In contrast, our study interviewed patients with at least a BMI of 35 kg/m2 and the majority of these patients reported a willingness to take a weight loss medication. Nevertheless, patients appear to have unrealistic expectations of the weight loss potential of pharmacotherapy. Only a minority of patients in our study would be willing to take a weight loss medication if the weight loss was no more than 10%, a level that is more consistent with the outcomes achievable in most clinical trials of weight loss medications [12]. Prior studies have also shown that patients often have unrealistic weight loss expectations and are unable to achieve their ideal body weight using diet, exercise, or pharmacotherapy [13,14]. Doyle et al found that percentage of weight loss was the most important treatment attribute when considering weight loss pharmacotherapy when compared to cost, health improvements, side effects, diet and exercise requirements, and method of medication administration [8]. Thus it is important to educate patients on realistic goal setting and the benefits of modest weight loss when considering pharmacotherapy. The weight loss preferences expressed in our study may also influence the weight loss outcomes targets pursued in pharmaceutical development. Interestingly, after full adjustment, BMI did not correlate with willingness to take a weight loss medication. Given that all patients in our study had a BMI of ≥ 35 kg/m2, this may imply that variations beyond this BMI threshold did not significantly affect a patient’s willingness to use pharmacotherapy. In contrast, weight-related QOL was an important correlate.
Men were slightly more likely than women to be willing to take a weight loss medication, which is interesting since men have been shown to be less likely to participate in behavioral weight loss programs and diets [15]. One reason may be that many weight loss programs are delivered in group settings which may deter men from participating. Whether this hypothetical willingness to undergo pharmacotherapy would translate to actual use is unclear, especially since there are barriers to pharmacotherapy including out-of-pocket costs. In a prior study in the United Kingdom, women were more likely to have reported prior weight loss medication use than men [16].
Our study did not find differences in willingness to pursue weight loss medication by race or educational attainment. This is consistent with our prior work demonstrating that racial and ethnic minorities were no less likely to consider bariatric surgery if the treatment were recommended by their doctor [9]. However, our other work did suggest that clinicians may be less likely to recommend bariatric surgery to their medically eligible minority patients as compared to their Caucasian patients. Whether this may be the case for pharmacotherapy is unclear since this was not explicitly queried in our current study [9].
Our study also found that patients with diabetes but not other comorbidities were more likely to consider weight loss medication after adjusting for QOL. This may reflect a stronger link between diabetes and obesity perceived by patients. Our result is consistent with our earlier data showing that diabetes but not other comorbid conditions was associated with a higher likelihood of considering weight loss surgery [9]. Nevertheless, having diabetes contributed only modestly to the variation in patient preferences regarding pharmacotherapy as reflected by the trivial change in model C-statistic when diabetes status was added to the model.
In contrast, lower QOL scores, especially in the domains of self-esteem and sex life, were associated with increased willingness to take a weight loss medication and appeared to be a stronger predictor than individual comorbidities. This is consistent with other studies showing that patients seeking treatment for obesity tend to have lower health-related QOL [9,17]. Our findings are also consistent with our previous research demonstrating that impairments in specific QOL domains are often more important to patients and stronger drivers of diminished well-being than measures of overall QOL [18]. Hence, given their importance to patients, clinicians need to consider QOL benefits when counseling patients about the risks and benefits of various obesity treatments.
This study is the first to our knowledge to systematically characterize demographic factors associated with the likelihood of primary care patients with obesity considering weight loss pharmacotherapy. This information may aid outpatient weight loss counseling by increasing awareness of gender and patient specific preferences. The fact that many patients with obesity appear to be interested in pursuing weight loss medication may also support public health initiatives in providing equitable access to weight loss pharmacotherapy. As our study characterizes patients who are willing to pursue weight loss medications, future studies may include retrospective analyses on actual use of weight loss medications among various demographic groups. Further investigation on specific reasons why patients choose whether or not to use weight loss medication may also be helpful.
This study has important limitations. The sample size was modest and potentially underpowered to detect small differences across different subgroups. Our sample was also limited to practices in Boston, which limits generalizability; although, by design, we oversampled racial and ethnic subjects to ensure diverse representation. Finally, our study examined patients’ hypothetical willingness to take weight loss medications rather than their actual adherence to treatment if offered.
Conclusion
In this sample of obese primary care patients, we found that the majority of patients were willing to take a daily medication to lose weight; however, patients had expectations for weight loss that far exceeded the level achievable by patients in pharmaceutical trials of these agents. Men and patients with diabetes were more likely to be willing to pursue weight loss medication; however, lower weight-related QOL, especially low self-esteem and impaired sexual function, appeared to be a stronger correlate of willingness to consider pharmacotherapy than comorbid diagnoses.
Corresponding author: Christina C. Wee, MD, MPH, Beth Israel Deaconess Medical Center, 330 Brookline Ave., Boston, MA 02215, cwee@bidmc.harvard.edu.
Funding/support: This study was funded by the National Institute of Diabetes, Digestive and Kidney Diseases (R01 DK073302, PI Wee). Dr. Wee is also supported by an NIH midcareer mentorship award (K24DK087932). The sponsor had no role in the design or conduct of the study; the collection, management, analysis, and interpretation of the data; or the preparation, review, or approval of the manuscript.
Financial disclosures: None reported.
References
1. Ogden CL, Carroll MD, Kit BK, Flegal KM. Prevalence of obesity among adults: United States, 2011–2012. NCHS Data Brief 2013;(131):1–8.
2. Jensen MD, Ryan DH, Apovian CM, et al. 2013 AHA/ACC/TOS guideline for the management of overweight and obesity in adults: a report of the American College of Cardiology/American Heart Association Task Force on Practice Guidelines and The Obesity Society. J Am Coll Cardiol 2014;63(25 Pt B):2985–3023.
3. Hauptman J, Lucas C, Boldrin MN, et al. Orlistat in the long-term treatment of obesity in primary care settings. Arch Fam Med 2000;9:160–7.
4. Kakkar AK, Dahiya N. Drug treatment of obesity: current status and future prospects. Eur J Intern Med 2015;26:89–94.
5. Allison DB, Gadde KM, Garvey WT, et al. Controlled-release phentermine/topiramate in severely obese adults: a randomized controlled trial (EQUIP). Obesity (Silver Spring). 2012;20:330–42.
6. Fabricatore AN, Wadden TA. Obesity. Annu Rev Clin Psychol 2006;2:357–77.
7. Cheung BM, Cheung TT, Samaranayake NR. Safety of antiobesity drugs. Ther Adv Drug Saf 2013;4:171–81.
8. Doyle S, Lloyd A, Birt J, et al. Willingness to pay for obesity pharmacotherapy. Obesity (Silver Spring) 2012;20:2019–26.
9. Wee CC HK, Bolcic-Jankovic D, Colten ME, et al. Sex, race, and consideration of bariatric surgery among primary care patients with moderate to severe obesity. J Gen Intern Med 2014;29:68–75.
10. Kolotkin RL, Crosby RD, Kosloski KD, Williams GR. Development of a brief measure to assess quality of life in obesity. Obes Res 2001;9:102–11.
11. Tan DZN, Dennis SM, Vagholkar S. Weight management in general practice: what do patients want? Med J Aust 2006;185:73–5.
12. Yanovski SZ, Yanovski JA. Long-term drug treatment for obesity: a systematic and clinical review. JAMA 2014;311:74–86.
13. Foster GD, Wadden TA, Vogt RA, Brewer G. What is a reasonable weight loss? Patients’ expectations and evaluations of obesity treatment outcomes. J Consult Clin Psychol 1997;65:79–85.
14. Fabricatore AN, Wadden TA, Womble LG, et al. The role of patients’ expectations and goals in the behavioral and pharmacological treatment of obesity. Int J Obes (Lond) 2007;31:1739–45.
15. Robertson C, Archibald D, Avenell A, et al. Systematic reviews of and integrated report on the quantitative, qualitative and economic evidence base for the management of obesity in men. Health Technol Assess 2014;18:1–424.
16. Thompson RL, Thomas DE. A cross-sectional survey of the opinions on weight loss treatments of adult obese patients attending a dietetic clinic. Int J Obes Relat Metab Disord 2000;24:164–70.
17. Kolotkin RL, Crosby RD, Williams GR. Health-related quality of life varies among obese subgroups. Obes Res 2002;10:748–56.
18. Wee C, Davis R, Chiodi S, et al. Sex, race, and the adverse effects of social stigma vs. other quality of life factors among primary care patients with moderate to severe obesity. J Gen Intern Med 2015;30:229–35.
Issue
Journal of Clinical Outcomes Management - March 2017, Vol. 24, No. 3
Issue
Journal of Clinical Outcomes Management - March 2017, Vol. 24, No. 3
The incidence of acne in adult females is rising,1 and treatment with combined oral contraceptive pills (OCPs) is becoming an increasingly important therapy for women with acne. Prior reports have indicated that OCPs were as effective as systemic antibiotics in reducing inflammatory, noninflammatory, and total facialacne lesions after 6 months of treatment.2,3 The acne management guidelines of the American Academy of Dermatology confer OCPs a grade A recommendation based on consistent and good-quality patient-oriented evidence.4
The US Food and Drug Administration (FDA) has approved 3 OCPs for the treatment of acne in adult women: norgestimate–ethinyl estradiol in 1997, norethindrone acetate–ethinyl estradiol in 2001, and drospirenone–ethinyl estradiol in 2007.5 However, the use of these OCPs is poorly understood by many dermatologists. One study showed that dermatologists prescribed OCPs in only 2% of visits with female patients aged 12 to 55 years who presented for acne treatment, which is less often than obstetrician/gynecologists (36%) and internists (11%),6 perhaps due to perceived risks or unfamiliarity with OCP formulations and guidelines among dermatologists.7 Adverse effects of OCPs include venous thromboembolism (VTE), myocardial infarction, and hypertension,8 but they generally are well tolerated.9
Even less is known about dermatologists’ use of drospirenone-containing OCPs (DCOCPs), which contain the only FDA-approved progestin that blocks androgen receptors. In prior studies, treatment with DCOCPs was associated with greater reductions in total lesion count and investigator-graded acne severity compared to early-generation OCPs.10,11 However, DCOCPs have been associated with a greater risk for VTE (4.0–6.3 times higher than OCP nonuse; 1.0–3.3 times higher than levonorgestrel-containing OCPs),12 which may explain the decline in DCOCP prescriptions among gynecologists in Germany from 23.8% of OCP prescriptions in 2007 to 11.4% in 2011.13
In this study, we surveyed US dermatologists about their knowledge, comfort, and prescribing practices pertaining to the use of OCPs. We compare OCP-prescribing to nonprescribing dermatologists, and those frequently prescribing DCOCPs to those who infrequently prescribe DCOCPs.
Methods
Survey Design
We performed a cross-sectional survey study using convenience sampling. The instrument was designed based on primary literature on OCPs in acne treatment and questionnaires assessing the use of OCPs in other specialties. Topics included prescribing practices, contraindications for OCPs defined by the Centers for Disease Control and Prevention (CDC),14 VTE risk, patient selection for hormonal acne therapy, comfort with prescribing OCP therapy, and participant demographics.
Skip logic was employed (ie, subsequent questions depended on prior answers). A pilot study surveyed 9 board-certified dermatologists at our home institution (Weill Cornell Medical College, New York, New York).
Data Collection
Eligible participants were board-certified US dermatologists. Data were collected and managed using an electronic data capture tool through the Weill Cornell Medical College Clinical & Translational Science Center. Surveys were distributed electronically to dermatologic society members, university alumni networks, investigators’ professional contacts, and dermatologists whose contact information was purchased froman email marketing company. Chain-referral sampling (ie, participants’ recruitment among their colleagues) was used. Surveys were distributed at a regional dermatology meeting. Responses were collected from November 2014 to April 2015. This study was approved by the institutional review board.
Statistical Analysis
For the descriptive data, all responses including pilot study participants were analyzed regardless of survey completion and were summarized using frequency counts and percentages (N=130).
For the analysis of OCP prescription predictors, the sample included all respondents answering the demographic questions and indicating if they prescribe OCPs (N=116). One respondent was excluded for answering other for current practice setting. Demographic predictors of OCP prescription were physician characteristics, geographic region, practice location population density, practice attributes, time spent on medical versus pediatric dermatology, number of weekly acne patients, and percentage of total patients who are female. Medical school graduation year was a categorical variable and was categorized as prior to 1997 (when norgestimate–ethinyl estradiol was FDA approved for acne5) versus 1997 or later. Respondents’ practice states were analyzed according to US regions—Northeast, Midwest, South, West/Pacific—and population density (persons per square mile) using US Census Bureau data.15,16
Univariate logistic regressions modeling OCP prescribing probability were performed for each demographic variable; a multivariable logistic model was constructed including all variables significant at α=.20 from univariate modeling.
To compare frequent prescribers versus infrequent prescribers of DCOCPs, we included all respondents answering whether they frequently prescribe DCOCPs and whether they believed the risk for VTE associated with DCOCPs differed from other OCPs (n=68). A univariate logistic regression was performed to model the probability of responding “Yes, they pose a greater risk” versus any of the other 3 responses by whether or not the respondent frequently prescribed DCOCPs for acne, and an unadjusted odds ratio was obtained. All P values were 2-tailed with statistical significance evaluated at α=.05. Ninety-five percent confidence intervals were calculated to assess precision of obtained estimates. Analyses were performed using SAS software version 9.4.
Results
Demographics
Participant demographics as predictors of OCP prescription practices are described in Table 1.
Knowledge
Oral contraceptive pills were endorsed as effective in the treatment of acne in women by 95.4% (124/130) of respondents. Among prescribers of OCPs for acne, 94.2% (65/69) believed OCPs were associated with an increased risk for VTE, no respondents thought OCPs were associated with a decreased VTE risk, 2.9% (2/69) believed OCPs did not affect VTE risk, and 2.9% (2/69) were unsure.
Among prescribers of OCPs for acne, 46.4% (32/69) believed DCOCPs posed a greater VTE risk than other OCPs. Odds of this response did not differ with frequent DCOCP prescribers versus infrequent prescribers (odds ratio, 0.731 [95% confidence interval, 0.272-1.964]; P=.5342). Participant responses on VTE risk and DCOCPs are provided in Table 2.
Dermatologists prescribing OCPs for acne endorsed greater likelihood of doing so in cases of cyclical flares with menstrual cycle (94.2% [65/69]), acne unresponsive to conventional therapy (87.0% [60/69]), acne on the lower half of the face (78.3% [54/69]), diagnosis of polycystic ovary syndrome (PCOS)(76.8% [53/69]), clinical suspicion of PCOS (71.0% [49/69]), concomitant hirsutism (71.0% [49/69]), late- or adult-onset acne (66.7% [46/69]), laboratory evidence of hyperandrogenism (60.9% [42/69]), and concomitant androgenetic alopecia (49.3% [34/69]).
Among dermatologists who prescribed OCPs for acne, CDC-defined absolute contraindications identified correctly were blood pressure of 160/100 mm Hg (59.4% [41/69]) and history of migraine with focal neurologic symptoms (49.3% [34/69]). The CDC-defined relative contraindications identified correctly were history of deep vein thrombosis or pulmonary embolism (1.4% [1/69]), breast cancer history with 5 years of no disease (15.9% [11/69]), hyperlipidemia (42.0% [29/69]), and 36 years or older smoking fewer than 15 cigarettes per day (21.7% [15/69]).
Comfort
Dermatologist self-reported comfort levels in prescribing OCPs for acne are shown in Table 3.
PrescribingPractices
Among all respondents, acne medications prescribed often included oral antibiotics (76.9% [100/130]), isotretinoin (41.5% [54/130]), and spironolactone (40.8% [53/130]).
Overall, 55.4% (72/130) of respondents prescribed OCPs for the following uses: acne (95.8% [69/72]), concomitant treatment with teratogenic medication (48.6% [35/72]), PCOS (34.7% [25/72]), hirsutism (26.4% [19/72]), androgenetic alopecia (19.4% [14/72]), SAHA (seborrhea, acne, hirsutism, alopecia) syndrome (12.5% [9/72]), and HAIR-AN (hyperandrogenism, insulin resistance, acanthosis nigricans) syndrome (11.1% [8/72]). For teratogenic medications, dermatologists prescribing OCPs did so with isotretinoin (77.8% [56/72]), spironolactone (73.6% [53/72]), tetracycline antibiotics (37.5% [27/72]), and other (34.7% [25/72]).
Of dermatologists prescribing OCPs for acne, frequency included often (19% [13/69]), sometimes (45% [31/69]), and rarely (36% [25/69]). The most frequently prescribed OCPsincluded Ortho Tri-Cyclen (Janssen Pharmaceuticals, Inc)(80% [55/69]), Yaz (Bayer)(64% [44/69]), and Estrostep (Warner Chilcott)(19% [13/69]). Fill-in responses included Desogen (Merck & Co, Inc)(3/69 [4%]), Alesse (Wyeth Pharmaceuticals, Inc)(3/69 [4%]), Lutera (Watson Pharma, Inc)(1/69 [1%]), Loestrin (Warner Chilcott)(1/69 [1%]), and Yasmin (Bayer)(1/69 [1%]).
In univariate regressions, graduation from medical school in 1997 or later(P=.0416), academic practice setting (P=.0130), and low-density practice setting (P=.0034) were significant predictors of prescribing OCPs. In multivariable regression, only academic practice setting (P=.0295) and low-density practice setting (P=.0050) remained significant predictors. Demographic predictors are summarized in Table 1.
Comment
Our results suggest that most dermatologists (95.4%) believe OCPs effectively treat acne; however, only 54% of respondents reported prescribing them. Academic dermatologists were more likely to prescribe OCPsthan nonacademic dermatologists, possibly indicating that academic dermatologists are more familiar with the literature on the efficacy and use of OCPs. Nearly half of respondents seeing 25 or more acne patients weekly did not prescribe OCPs, suggesting a notable practice gap. Dermatologists in less dense US regions were more likely to prescribe OCPs, perhaps because dermatologists may be more likely to prescribe OCPs than refer patients in health care access–limited areas, just as primary care providers treat a broader range of conditions in low-density rural areas than urban ones.17 Exploring all dermatologists’ referral patterns for OCPs is warranted.
A strong knowledge area revealed from this study was hormonal treatment of acne in women, a vital area because appropriate patient selection is key to treatment success.8 Weaker knowledge areas included OCP contraindications and differences in VTE risk between formulations containing drospirenone and those not containing drospirenone. Only half the sample identified CDC-defined absolute contraindications, suggesting an education target for dermatologists to ensure patient safety. In contrast, respondents were conservative about relative contraindications, with most identifying deep vein thrombosis or pulmonary embolism, remote breast cancer history, and light smoking at 36 years or older as absolute contraindications. These results could reflect weighing the risk of relative contraindications against the benefit in acne, resulting in appropriately more conservative management than overall guidelines suggest. If so, it may suggest that dermatologists are adapting overall guidelines appropriately for use of OCPs in skin conditions.
Nearly all respondents knew that OCPs are associated with an increased risk for VTE. Approximately half understood that DCOCPs are associated with a greater VTE risk than other OCPs, with no difference between frequent and infrequent prescribers. Comparing these results to the findings on OCP prescribing overall, some dermatologists’ risk-benefit calculation for VTE differs from other specialties because DCOCPs have superior efficacy in acne, whereas DCOCPs have similar contraceptive efficacy to other OCPs.18 The fact that more dermatologists believed VTE to be an absolute contraindication than hypertension suggests dermatologists have a heightened awareness of VTE risk but prescribe DCOCPs for acne despite it.
Most OCP prescribers felt very comfortable selecting good candidates for OCPs (55.5%) and counseling on treatment initiation (45.8%) and side effects (48.6%). Only 22.2%, by contrast, were very comfortable managing side effects. This finding likely reflects the notion that VTEs are not most appropriately managed by a dermatologist. Exploring if a greater comfort level in managing side effects would make dermatologists more likely to prescribe OCPs is worthwhile. Additionally, exploring why many dermatologists do not prescribe OCPs despite believing they are effective for acne is warranted.
Study limitations included the use of convenience sampling. Additionally, our study did not investigate dermatologists’ reasons for not prescribing OCPs.
Conclusion
This study demonstrates that dermatologists believe OCPs effectively treat acne in women and that most dermatologists prescribing OCPs do so for acne treatment. Academic practice setting was associated with higher odds of prescribing OCPs than a nonacademic setting, but the number of weekly acne patients did not impact the likelihood of prescribing OCPs, which suggests a treatment gap warranting education efforts for dermatologists in nonacademic settings seeing many acne patients. Our study also suggests that awareness of the increased risk for VTE associated with DCOCPs is not associated with lower likelihood of prescribing DCOCPs, suggesting dermatologists may find greater treatment efficacy to be worth the higher risk.
Acknowledgments
We are grateful to the Department of Dermatology at the Weill Cornell College of Medicine (New York, New York) for providing funding to complete this study. We also acknowledge Paul Christos, DrPH, MS (New York, New York), and Xuming Sun, MS (New York, New York), for their assistance with the survey design. We also are indebted to numerous dermatologic professional societies for allowing the survey to be distributed to their membership.
References
Kim GK, Michaels BB. Post-adolescent acne in women: more common and more clinical considerations. J Drugs Dermatol. 2012;11:708-713.
Arowojolu AO, Gallo MF, Lopez LM, et al. Combined oral contraceptive pills for treatment of acne. Cochrane Database Syst Rev. July 11,2012:CD004425.
Koo EB, Petersen TD, Kimball AB. Meta-analysis comparing efficacy of antibiotics versus oral contraceptives in acne vulgaris. J Am Acad Dermatol.2014;71:450-459.
Strauss JS, Krowchuk DP, Leyden JJ, et al; American Academy of Dermatology/American Academy of Dermatology Association. Guidelines of care for acne vulgaris management. J Am Acad Dermatol.2007;56:651-663.
Harper JC. Should dermatologists prescribe hormonal contraceptives for acne? Dermatol Ther. 2009;22:452-457.
Landis ET, Levender MM, Davis SA, et al. Isotretinoin and oral contraceptive use in female acne patients varies by physician specialty: analysis of data from the National Ambulatory Medical Care Survey. J Dermatol Treat. 2012;23:272-277.
Lam C, Zaenglein AL. Contraceptive use in acne. Clin Dermatol. 2014;32:502-515.
Katsambas AD, Dessinioti C. Hormonal therapy for acne: why not as first line therapy? facts and controversies. Clin Dermatol. 2010;28:17-23.
Dragoman MV. The combined oral contraceptive pill—recent developments, risks and benefits. Best Pract Res Clin Obstet Gynaecol. 2014;28:825-834.
Thorneycroft IH, Gollnick H, Schellschmidt I. Superiority of a combined contraceptive containing drospirenone to a triphasic preparation containing norgestimate in acne treatment. Cutis. 2004;74:123-130.
Mansour D, Verhoeven C, Sommer W, et al. Efficacy and tolerability of a monophasic combined oral contraceptive containing nomegestrol acetate and 17β-oestradiol in a 24/4 regimen, in comparison to an oral contraceptive containing ethinylestradiol and drospirenone in a 21/7 regimen. Eur J Contracept Reproduct Health Care. 2011;16:430-443.
Wu CQ, Grandi SM, Filion KB, et al. Drospirenone-containing oral contraceptive pills and the risk of venous and arterial thrombosis: a systematic review. BJOG.2013;120:801-810.
Ziller M, Rashed AN, Ziller V, et al. The prescribing of contraceptives for adolescents in German gynecologic practices in 2007 and 2011: a retrospective database analysis. J Pediatr Adolesc Gynecol. 2013;26:261-264.
Centers for Disease Control and Prevention. US medical eligibility criteria for contraceptive use, 2010. MMWR Recomm Rep. 2010;59(RR-4):1-86.
United States Census Bureau. Census Regions and Divisions of the United States. New York, NY: United States Department of Commerce; 2010.
Resident Population Data—Population Density, 1910 to 2010. U.S. Census Bureau; 2012. http ://www.census.gov/2010census/data/apportionment-dens-text.php. Accessed January 9, 2017.
Reschovsky A, Zahner SJ. Forecasting the revenues of local public health departments in the shadows of the “Great Recession.” J Public Health Manag Pract.2016;22:120-128.
Klipping C, Duijkers I, Fortier MP, et al. Contraceptive efficacy and tolerability of ethinylestradiol 20 μg/drospirenone 3 mg in a flexible extended regimen: an open-label, multicentre, randomised, controlled study. J Fam Plann Reprod Health Care.2012;38:73-83.
Dr. Fitzpatrick and Ms. Mauer are from and Dr. Chen was from Weill Cornell Medical College, New York, New York. Dr. Chen currently is from the Permanente Medical Group, Pleasanton, California.
The authors report no conflict of interest.
Correspondence: Cynthia L. Chen, MD, 7601 Stoneridge Dr, Pleasanton, CA 94588 (Cynthia.l.chen@kp.org).
Author and Disclosure Information
Dr. Fitzpatrick and Ms. Mauer are from and Dr. Chen was from Weill Cornell Medical College, New York, New York. Dr. Chen currently is from the Permanente Medical Group, Pleasanton, California.
The authors report no conflict of interest.
Correspondence: Cynthia L. Chen, MD, 7601 Stoneridge Dr, Pleasanton, CA 94588 (Cynthia.l.chen@kp.org).
The incidence of acne in adult females is rising,1 and treatment with combined oral contraceptive pills (OCPs) is becoming an increasingly important therapy for women with acne. Prior reports have indicated that OCPs were as effective as systemic antibiotics in reducing inflammatory, noninflammatory, and total facialacne lesions after 6 months of treatment.2,3 The acne management guidelines of the American Academy of Dermatology confer OCPs a grade A recommendation based on consistent and good-quality patient-oriented evidence.4
The US Food and Drug Administration (FDA) has approved 3 OCPs for the treatment of acne in adult women: norgestimate–ethinyl estradiol in 1997, norethindrone acetate–ethinyl estradiol in 2001, and drospirenone–ethinyl estradiol in 2007.5 However, the use of these OCPs is poorly understood by many dermatologists. One study showed that dermatologists prescribed OCPs in only 2% of visits with female patients aged 12 to 55 years who presented for acne treatment, which is less often than obstetrician/gynecologists (36%) and internists (11%),6 perhaps due to perceived risks or unfamiliarity with OCP formulations and guidelines among dermatologists.7 Adverse effects of OCPs include venous thromboembolism (VTE), myocardial infarction, and hypertension,8 but they generally are well tolerated.9
Even less is known about dermatologists’ use of drospirenone-containing OCPs (DCOCPs), which contain the only FDA-approved progestin that blocks androgen receptors. In prior studies, treatment with DCOCPs was associated with greater reductions in total lesion count and investigator-graded acne severity compared to early-generation OCPs.10,11 However, DCOCPs have been associated with a greater risk for VTE (4.0–6.3 times higher than OCP nonuse; 1.0–3.3 times higher than levonorgestrel-containing OCPs),12 which may explain the decline in DCOCP prescriptions among gynecologists in Germany from 23.8% of OCP prescriptions in 2007 to 11.4% in 2011.13
In this study, we surveyed US dermatologists about their knowledge, comfort, and prescribing practices pertaining to the use of OCPs. We compare OCP-prescribing to nonprescribing dermatologists, and those frequently prescribing DCOCPs to those who infrequently prescribe DCOCPs.
Methods
Survey Design
We performed a cross-sectional survey study using convenience sampling. The instrument was designed based on primary literature on OCPs in acne treatment and questionnaires assessing the use of OCPs in other specialties. Topics included prescribing practices, contraindications for OCPs defined by the Centers for Disease Control and Prevention (CDC),14 VTE risk, patient selection for hormonal acne therapy, comfort with prescribing OCP therapy, and participant demographics.
Skip logic was employed (ie, subsequent questions depended on prior answers). A pilot study surveyed 9 board-certified dermatologists at our home institution (Weill Cornell Medical College, New York, New York).
Data Collection
Eligible participants were board-certified US dermatologists. Data were collected and managed using an electronic data capture tool through the Weill Cornell Medical College Clinical & Translational Science Center. Surveys were distributed electronically to dermatologic society members, university alumni networks, investigators’ professional contacts, and dermatologists whose contact information was purchased froman email marketing company. Chain-referral sampling (ie, participants’ recruitment among their colleagues) was used. Surveys were distributed at a regional dermatology meeting. Responses were collected from November 2014 to April 2015. This study was approved by the institutional review board.
Statistical Analysis
For the descriptive data, all responses including pilot study participants were analyzed regardless of survey completion and were summarized using frequency counts and percentages (N=130).
For the analysis of OCP prescription predictors, the sample included all respondents answering the demographic questions and indicating if they prescribe OCPs (N=116). One respondent was excluded for answering other for current practice setting. Demographic predictors of OCP prescription were physician characteristics, geographic region, practice location population density, practice attributes, time spent on medical versus pediatric dermatology, number of weekly acne patients, and percentage of total patients who are female. Medical school graduation year was a categorical variable and was categorized as prior to 1997 (when norgestimate–ethinyl estradiol was FDA approved for acne5) versus 1997 or later. Respondents’ practice states were analyzed according to US regions—Northeast, Midwest, South, West/Pacific—and population density (persons per square mile) using US Census Bureau data.15,16
Univariate logistic regressions modeling OCP prescribing probability were performed for each demographic variable; a multivariable logistic model was constructed including all variables significant at α=.20 from univariate modeling.
To compare frequent prescribers versus infrequent prescribers of DCOCPs, we included all respondents answering whether they frequently prescribe DCOCPs and whether they believed the risk for VTE associated with DCOCPs differed from other OCPs (n=68). A univariate logistic regression was performed to model the probability of responding “Yes, they pose a greater risk” versus any of the other 3 responses by whether or not the respondent frequently prescribed DCOCPs for acne, and an unadjusted odds ratio was obtained. All P values were 2-tailed with statistical significance evaluated at α=.05. Ninety-five percent confidence intervals were calculated to assess precision of obtained estimates. Analyses were performed using SAS software version 9.4.
Results
Demographics
Participant demographics as predictors of OCP prescription practices are described in Table 1.
Knowledge
Oral contraceptive pills were endorsed as effective in the treatment of acne in women by 95.4% (124/130) of respondents. Among prescribers of OCPs for acne, 94.2% (65/69) believed OCPs were associated with an increased risk for VTE, no respondents thought OCPs were associated with a decreased VTE risk, 2.9% (2/69) believed OCPs did not affect VTE risk, and 2.9% (2/69) were unsure.
Among prescribers of OCPs for acne, 46.4% (32/69) believed DCOCPs posed a greater VTE risk than other OCPs. Odds of this response did not differ with frequent DCOCP prescribers versus infrequent prescribers (odds ratio, 0.731 [95% confidence interval, 0.272-1.964]; P=.5342). Participant responses on VTE risk and DCOCPs are provided in Table 2.
Dermatologists prescribing OCPs for acne endorsed greater likelihood of doing so in cases of cyclical flares with menstrual cycle (94.2% [65/69]), acne unresponsive to conventional therapy (87.0% [60/69]), acne on the lower half of the face (78.3% [54/69]), diagnosis of polycystic ovary syndrome (PCOS)(76.8% [53/69]), clinical suspicion of PCOS (71.0% [49/69]), concomitant hirsutism (71.0% [49/69]), late- or adult-onset acne (66.7% [46/69]), laboratory evidence of hyperandrogenism (60.9% [42/69]), and concomitant androgenetic alopecia (49.3% [34/69]).
Among dermatologists who prescribed OCPs for acne, CDC-defined absolute contraindications identified correctly were blood pressure of 160/100 mm Hg (59.4% [41/69]) and history of migraine with focal neurologic symptoms (49.3% [34/69]). The CDC-defined relative contraindications identified correctly were history of deep vein thrombosis or pulmonary embolism (1.4% [1/69]), breast cancer history with 5 years of no disease (15.9% [11/69]), hyperlipidemia (42.0% [29/69]), and 36 years or older smoking fewer than 15 cigarettes per day (21.7% [15/69]).
Comfort
Dermatologist self-reported comfort levels in prescribing OCPs for acne are shown in Table 3.
PrescribingPractices
Among all respondents, acne medications prescribed often included oral antibiotics (76.9% [100/130]), isotretinoin (41.5% [54/130]), and spironolactone (40.8% [53/130]).
Overall, 55.4% (72/130) of respondents prescribed OCPs for the following uses: acne (95.8% [69/72]), concomitant treatment with teratogenic medication (48.6% [35/72]), PCOS (34.7% [25/72]), hirsutism (26.4% [19/72]), androgenetic alopecia (19.4% [14/72]), SAHA (seborrhea, acne, hirsutism, alopecia) syndrome (12.5% [9/72]), and HAIR-AN (hyperandrogenism, insulin resistance, acanthosis nigricans) syndrome (11.1% [8/72]). For teratogenic medications, dermatologists prescribing OCPs did so with isotretinoin (77.8% [56/72]), spironolactone (73.6% [53/72]), tetracycline antibiotics (37.5% [27/72]), and other (34.7% [25/72]).
Of dermatologists prescribing OCPs for acne, frequency included often (19% [13/69]), sometimes (45% [31/69]), and rarely (36% [25/69]). The most frequently prescribed OCPsincluded Ortho Tri-Cyclen (Janssen Pharmaceuticals, Inc)(80% [55/69]), Yaz (Bayer)(64% [44/69]), and Estrostep (Warner Chilcott)(19% [13/69]). Fill-in responses included Desogen (Merck & Co, Inc)(3/69 [4%]), Alesse (Wyeth Pharmaceuticals, Inc)(3/69 [4%]), Lutera (Watson Pharma, Inc)(1/69 [1%]), Loestrin (Warner Chilcott)(1/69 [1%]), and Yasmin (Bayer)(1/69 [1%]).
In univariate regressions, graduation from medical school in 1997 or later(P=.0416), academic practice setting (P=.0130), and low-density practice setting (P=.0034) were significant predictors of prescribing OCPs. In multivariable regression, only academic practice setting (P=.0295) and low-density practice setting (P=.0050) remained significant predictors. Demographic predictors are summarized in Table 1.
Comment
Our results suggest that most dermatologists (95.4%) believe OCPs effectively treat acne; however, only 54% of respondents reported prescribing them. Academic dermatologists were more likely to prescribe OCPsthan nonacademic dermatologists, possibly indicating that academic dermatologists are more familiar with the literature on the efficacy and use of OCPs. Nearly half of respondents seeing 25 or more acne patients weekly did not prescribe OCPs, suggesting a notable practice gap. Dermatologists in less dense US regions were more likely to prescribe OCPs, perhaps because dermatologists may be more likely to prescribe OCPs than refer patients in health care access–limited areas, just as primary care providers treat a broader range of conditions in low-density rural areas than urban ones.17 Exploring all dermatologists’ referral patterns for OCPs is warranted.
A strong knowledge area revealed from this study was hormonal treatment of acne in women, a vital area because appropriate patient selection is key to treatment success.8 Weaker knowledge areas included OCP contraindications and differences in VTE risk between formulations containing drospirenone and those not containing drospirenone. Only half the sample identified CDC-defined absolute contraindications, suggesting an education target for dermatologists to ensure patient safety. In contrast, respondents were conservative about relative contraindications, with most identifying deep vein thrombosis or pulmonary embolism, remote breast cancer history, and light smoking at 36 years or older as absolute contraindications. These results could reflect weighing the risk of relative contraindications against the benefit in acne, resulting in appropriately more conservative management than overall guidelines suggest. If so, it may suggest that dermatologists are adapting overall guidelines appropriately for use of OCPs in skin conditions.
Nearly all respondents knew that OCPs are associated with an increased risk for VTE. Approximately half understood that DCOCPs are associated with a greater VTE risk than other OCPs, with no difference between frequent and infrequent prescribers. Comparing these results to the findings on OCP prescribing overall, some dermatologists’ risk-benefit calculation for VTE differs from other specialties because DCOCPs have superior efficacy in acne, whereas DCOCPs have similar contraceptive efficacy to other OCPs.18 The fact that more dermatologists believed VTE to be an absolute contraindication than hypertension suggests dermatologists have a heightened awareness of VTE risk but prescribe DCOCPs for acne despite it.
Most OCP prescribers felt very comfortable selecting good candidates for OCPs (55.5%) and counseling on treatment initiation (45.8%) and side effects (48.6%). Only 22.2%, by contrast, were very comfortable managing side effects. This finding likely reflects the notion that VTEs are not most appropriately managed by a dermatologist. Exploring if a greater comfort level in managing side effects would make dermatologists more likely to prescribe OCPs is worthwhile. Additionally, exploring why many dermatologists do not prescribe OCPs despite believing they are effective for acne is warranted.
Study limitations included the use of convenience sampling. Additionally, our study did not investigate dermatologists’ reasons for not prescribing OCPs.
Conclusion
This study demonstrates that dermatologists believe OCPs effectively treat acne in women and that most dermatologists prescribing OCPs do so for acne treatment. Academic practice setting was associated with higher odds of prescribing OCPs than a nonacademic setting, but the number of weekly acne patients did not impact the likelihood of prescribing OCPs, which suggests a treatment gap warranting education efforts for dermatologists in nonacademic settings seeing many acne patients. Our study also suggests that awareness of the increased risk for VTE associated with DCOCPs is not associated with lower likelihood of prescribing DCOCPs, suggesting dermatologists may find greater treatment efficacy to be worth the higher risk.
Acknowledgments
We are grateful to the Department of Dermatology at the Weill Cornell College of Medicine (New York, New York) for providing funding to complete this study. We also acknowledge Paul Christos, DrPH, MS (New York, New York), and Xuming Sun, MS (New York, New York), for their assistance with the survey design. We also are indebted to numerous dermatologic professional societies for allowing the survey to be distributed to their membership.
References
Kim GK, Michaels BB. Post-adolescent acne in women: more common and more clinical considerations. J Drugs Dermatol. 2012;11:708-713.
Arowojolu AO, Gallo MF, Lopez LM, et al. Combined oral contraceptive pills for treatment of acne. Cochrane Database Syst Rev. July 11,2012:CD004425.
Koo EB, Petersen TD, Kimball AB. Meta-analysis comparing efficacy of antibiotics versus oral contraceptives in acne vulgaris. J Am Acad Dermatol.2014;71:450-459.
Strauss JS, Krowchuk DP, Leyden JJ, et al; American Academy of Dermatology/American Academy of Dermatology Association. Guidelines of care for acne vulgaris management. J Am Acad Dermatol.2007;56:651-663.
Harper JC. Should dermatologists prescribe hormonal contraceptives for acne? Dermatol Ther. 2009;22:452-457.
Landis ET, Levender MM, Davis SA, et al. Isotretinoin and oral contraceptive use in female acne patients varies by physician specialty: analysis of data from the National Ambulatory Medical Care Survey. J Dermatol Treat. 2012;23:272-277.
Lam C, Zaenglein AL. Contraceptive use in acne. Clin Dermatol. 2014;32:502-515.
Katsambas AD, Dessinioti C. Hormonal therapy for acne: why not as first line therapy? facts and controversies. Clin Dermatol. 2010;28:17-23.
Dragoman MV. The combined oral contraceptive pill—recent developments, risks and benefits. Best Pract Res Clin Obstet Gynaecol. 2014;28:825-834.
Thorneycroft IH, Gollnick H, Schellschmidt I. Superiority of a combined contraceptive containing drospirenone to a triphasic preparation containing norgestimate in acne treatment. Cutis. 2004;74:123-130.
Mansour D, Verhoeven C, Sommer W, et al. Efficacy and tolerability of a monophasic combined oral contraceptive containing nomegestrol acetate and 17β-oestradiol in a 24/4 regimen, in comparison to an oral contraceptive containing ethinylestradiol and drospirenone in a 21/7 regimen. Eur J Contracept Reproduct Health Care. 2011;16:430-443.
Wu CQ, Grandi SM, Filion KB, et al. Drospirenone-containing oral contraceptive pills and the risk of venous and arterial thrombosis: a systematic review. BJOG.2013;120:801-810.
Ziller M, Rashed AN, Ziller V, et al. The prescribing of contraceptives for adolescents in German gynecologic practices in 2007 and 2011: a retrospective database analysis. J Pediatr Adolesc Gynecol. 2013;26:261-264.
Centers for Disease Control and Prevention. US medical eligibility criteria for contraceptive use, 2010. MMWR Recomm Rep. 2010;59(RR-4):1-86.
United States Census Bureau. Census Regions and Divisions of the United States. New York, NY: United States Department of Commerce; 2010.
Resident Population Data—Population Density, 1910 to 2010. U.S. Census Bureau; 2012. http ://www.census.gov/2010census/data/apportionment-dens-text.php. Accessed January 9, 2017.
Reschovsky A, Zahner SJ. Forecasting the revenues of local public health departments in the shadows of the “Great Recession.” J Public Health Manag Pract.2016;22:120-128.
Klipping C, Duijkers I, Fortier MP, et al. Contraceptive efficacy and tolerability of ethinylestradiol 20 μg/drospirenone 3 mg in a flexible extended regimen: an open-label, multicentre, randomised, controlled study. J Fam Plann Reprod Health Care.2012;38:73-83.
In prior reports, oral contraceptive pills (OCPs) were found to be as effective as systemic antibiotics in reducing acne lesion counts at 6 months of treatment.
Most dermatologists have prescribed OCPs and most believed they were an effective treatment for acne in women.
The care of hospitalized patients requires practitioners from multiple disciplines to assess and communicate the patient’s status in a dynamic manner during hospitalization. Although optimal teamwork is needed for patient care to be delivered reliably and efficiently, care within hospitals is typically delivered in a fragmented manner.1 A bedside model for daily interdisciplinary rounds (IDR) has been proposed as a method to provide a structured process and engage all team members in a patient-centered, system-of-care delivery.2 Specific advantages of convening rounds in the presence of the patient include the ability to directly assess care (eg, presence of a potentially unnecessary urinary catheter), patient engagement in key aspects of their care and disposition, and an increased opportunity for team members to develop a shared understanding of the patient’s views and needs.
Implementing dramatic changes to the workflow of multiple disciplines will require rigorous evidence to support a concerted effort from leadership and buy-in from stakeholders at the front line of patient care. Despite the urgency for evidence, there has been little investigation of this strategy. A systematic review3 identified 30 studies published between 1998 and 2013 addressing interdisciplinary interventions on medical wards, none of which examined a bedside IDR model. In a study performed after the period assessed by the systematic review, Stein et al4 described the restructuring of a medical ward as an accountable care unit (ACU), which included a bedside model for rounds by the interdisciplinary team. The change was associated with decreased mortality and length of stay (LOS), although the study did not isolate the impact of rounds or use a concurrent control group and presented aggregate rather than patient-level outcomes. The lack of convincing data may be a reason bedside rounds are not widely employed by hospitals. To provide high-quality evidence, we performed a large, prospective controlled trial comparing a structured bedside model (mobile interdisciplinary care rounds [MICRO]) with standard rounds.
METHODS
This study took place at the Mount Sinai Hospital, which is a 1171-bed tertiary care academic medical center in New York City, New York. A nonteaching unit offered the ability to use a prospective controlled design. Patients were assigned to the north and the south wings of the unit in a quasi-randomized manner, rather than based on diagnosis or acuity. We transformed IDR to a bedside model on the north side of the unit (MICRO group), while the south side of the unit continued using standard conference room-based IDR (control group). The north and south sides of the unit contain 17 and 14 beds, respectively. During the study period, nurses and hospitalists cared for patients on both sides of the study unit, although on any given day were assigned only patients on 1 side of the unit. The unit uses a clinical microsystem model, which has been defined as “a group of clinicians and staff working together with a shared clinical purpose to provide care for a population of patients,” and has a defined set of characteristics associated with high performance.5,6 Our microsystem model has incorporated features as described by Stein’s ACU model,4 including co-leadership by a hospitalist and a nurse manager, geographic assignment of patients to teams, and unit-level data reports. One hospitalist is assigned geographically to each area of the unit in a 2- to 4-week rotation. Coverage of the unit does not include house staff; patients are primarily assigned to hospitalists working with nurse practitioners. Patients were enrolled prospectively during their initial IDR by a research coordinator. Patient-level data and outcomes were collected prospectively by a research coordinator who attended IDR on the intervention and the control sides of the study unit daily.
Inclusion Criteria
All patients admitted to the medicine service on the study unit were eligible. Patients were greater than 18 years and admitted for an acute medical condition. Patients admitted to another unit and later transferred to the study unit were enrolled at the time of transfer. Patients could be included more than once if hospitalized on the study unit on more than 1 occasion. Most patients were covered by hospitalists, although patients covered by private physicians were included. Patients from other departments, including family medicine, are uncommonly admitted to the unit and were excluded. Patients were also excluded if they were admitted and discharged over the same weekend, because the MICRO rounds occur during weekdays and there was no opportunity to offer the intervention on Saturdays and Sundays.
MICRO Intervention
Interdisciplinary rounds occurred daily at 10:00 am for the control group and at 10:30 am for the MICRO group, and were attended by the hospitalist caring for the majority of patients on the unit, staff nurses, and the unit medical director, nurse manager, social worker, and case manager. Rounds on the control unit focused on the plan of care and disposition but did not follow any set structure and were typically 25 to 30 minutes in duration.
The MICRO rounds occurred at the bedside and followed a structured script (Appendix 1) that was designed to limit discussion of each patient to 3 minutes or less, and included speaking roles for the hospitalist, nurse, and social worker. For private physicians, the nurse practitioner assigned to the patient performed the role of the hospitalist. Rounds were expected to be approximately 50 minutes in duration. Patients were further engaged by asking for their main goal for the day. A patient safety checklist was reviewed. Initially, this task was performed by the nurse manager, who did not verbalize the items unless a deficiency was noted. After 6 months’ experience, this responsibility was given to the staff nurse, who reviewed the checklist verbally as part of the bedside script. Patients were seen daily, including those being discharged later that same day.
Staff and Clinician Education
We developed and implemented a curriculum based on a modified version of the Agency for Healthcare Research and Quality’s TeamStepps® program to ensure that all team members were provided with the basic principles of communication within the healthcare setting. The curriculum consisted of interactive didactics on essential elements of teamwork, including team structure, communication, situation monitoring, and mutual support, as well as the purpose and structure of the MICRO model. The curriculum was delivered to nurses at 3 monthly staff meetings on the study unit and to hospitalists during 3 hospital medicine grand rounds over a 3-month period. Nurses and physicians providing care on both geographic areas of the study unit received the education program because no group of practitioners was designated to only 1 geographic area.
Outcomes
Primary and Secondary Outcomes
The primary outcomes were clinical deterioration (CD) and length of stay. Clinical deterioration was a composite outcome defined a priori as death; escalation of care (ie, transfer to an intensive care unit, intermediate care unit, or teaching unit); or a hospital-acquired complication (ie, venous thromboembolism, fall, stage III-IV pressure ulcer, catheter-associated urinary tract infection, central-line associated bloodstream infection, or Clostridium difficile-associated diarrhea). The LOS was calculated as the mean LOS with outliers excluded (outliers defined as having a LOS 100 days or longer or 2.5 or more standard deviations from the expected LOS).
Process metrics on IDR, such as the duration of rounds, attendance by members of the interdisciplinary team, the percentage of patients discussed, or the effectiveness of communication, were not collected. We assessed patient satisfaction based on the Hospital Consumer Assessment of Healthcare Providers and Systems (HCAHPS) survey.
Patient Safety Culture Survey
To assess the impact on the perceptions of patient safety, we administered the Agency for Healthcare Research and Quality (AHRQ) Hospital Survey on Patient Safety Culture toall staff and clinicians working on both sides of the study unit immediately before and 12 months after implementation of the MICRO model. Results are reported for the AHRQ dimensions that were most relevant to the MICRO intervention: “teamwork within units,” “overall perceptions of safety,” “communication,” “openness,” “overall patient safety grade,” and “handoffs and transitions.” The survey represents pre- and post-comparison. All nurses and hospitalists on both the MICRO and control sides of the study unit had received the TeamStepps curriculum and participated in MICRO rounds by the time of the postintervention survey. We added 3 questions specifically assessing the perception of the efficiency and effectiveness of IDR. Postintervention respondents reflected on their overall impression of IDR, which included their experiences on both sides of the unit, because no group of nurses or hospitalists was exposed only to the MICRO side or the control side of the unit. Responses to survey questions were recorded on a 5-point Likert scale (from “strongly disagree” to “strongly agree” for opinion questions; and “never,” rarely,” sometimes,” “most of the time,” and “always” for frequency questions) and given a score from 1 to 5. The question asking for an overall grade for patient safety was scored from 1 to 5 points corresponding to letter grade choices F, D, C, B, A.
Statistical Analysis
The sample size was based on the estimate of the baseline rate of the primary outcome of CD and the projected decrease by the MICRO intervention. A study using the Global Trigger Tool developed by the Institute for Healthcare Improvement provided a best estimate of 16% as the baseline rate for CD.7 A total of 2000 hospitalizations were planned to be included to have a power of at least 80% to detect a 25% reduction in the annual incidence of CD with a 2-tailed type I error rate of 0.05. Comparisons of dichotomous event rates were made using chi square tests at a 2-tailed level for significance of 0.05. The LOS was analyzed using the nonparametric median test and multivariable regression analysis. We used a generalized linear model with gamma distribution and log link for all analyses of LOS, where LOS was the outcome variable, and intervention vs. control unit type was the predictor variable. Age, sex, race, payer, case mix, and comorbidities defined with the Elixhauser algorithm were used as covariates.8 We used multivariable logistic regression for analysis of CD, where the dependent variable was CD. Predictor variables included intervention, patient age, sex, race, payer, case mix and comorbidities. Patient satisfaction data were compared using the chi square test. The Student t test for dependent means was used to analyze the patient safety culture survey data.
The study protocol was submitted to the Icahn Mount Sinai School of Medicine’s institutional review board and determined to be exempt from full review.
RESULTS
A total of 2005 hospitalizations were included over the 12-month study period, consisting of 1089 hospitalizations in the MICRO group and 916 in the control group. Bedside and standard IDR were completed daily, Monday through Friday without exception. The demographic characteristics and comorbidities were similar for the 2 groups (Table). Hospitalizations of patients who were initially admitted to another unit and subsequently transferred to the study unit accounted for 11.1% of hospitalizations.
Table
Risk-adjusted LOS was similar for the groups (6.6 vs 7.0 days, P = 0.17, for the MICRO and control groups, respectively). On subgroup analysis, a reduction in LOS was noted for patients transferred to the study unit (10.4 vs 14.0 days, P = 0.02, for the MICRO and control groups, respectively). The LOS was unchanged for patients admitted directly to the study unit (6.0 vs 5.8 days, P = 0.93). There was no difference in the incidence of clinical deterioration for the MICRO or control groups (7.7% vs 9.3%, odds ratio, 0.89; 95% confidence interval, 0.61-1.22, P = 0.46).
The finding of a LOS benefit for the MICRO group limited to patients transferred to the study unit prompted a comparison of patients transferred to the study unit and patients directly admitted to the study unit from the emergency department (Appendix 2). Compared to patients admitted directly to the study unit, patients transferred to the study unit were more likely to have Medicaid or no insurance, more likely to be discharged to a facility, had longer LOS, and were more likely to experience CD.
Patient Satisfaction
There were 175 and 140 responses to the HCAHPS survey for the MICRO and the control groups, respectively. Patients in the MICRO group were more likely to report that “doctors, nurses, or other hospital staff talk with you about whether you would have the help you needed when you left the hospital” (88% vs 78%, P = 0.01). Responses for all other HCAHPS items were similar for the 2 groups.
Figure 1
Clinician/Staff Survey
The response rate was 96% (30 nurses and 17 hospitalists) pre-intervention and 100% (30 nurses and 22 hospitalists) postintervention. Hospitalists and nurses gave significantly higher scores for the dimensions “teamwork within units,” “overall perception of patient safety,” and “patient safety grade” on the postintervention survey compared to the pre-intervention survey (Figure 1). Hospitalists and nurses rated the efficiency of IDR and the ability of IDR to identify safety issues higher on the postintervention survey compared to the pre-intervention survey (Figure 2).
Figure 2
DISCUSSION
We transformed daily IDR from a standard conference room model to a structured bedside model with scripted roles, and performed a rigorous comparison using patient-level data. Our finding that transforming daily IDR from a standard conference room model to a bedside model did not significantly reduce LOS suggests either that the model is ineffective or needs to be incorporated into more comprehensive efforts to improve clinical outcomes. Studies suggest that bedside rounding can improve outcomes when implemented in the context of comprehensive restructuring of patient care.4,9 Stein et al.4 have described the reorganization of a medical ward as an “accountable care unit.” The ACU model included daily IDRs at the bedside, as well as geographic-based teams, co-leadership by a hospitalist and nurse manager, and unit-level reporting. Although no definitive conclusions can be drawn based on their descriptive report, transformation of the unit was associated with reduced LOS and mortality. Similarly, Kara et al.9 found that the number of elements of an “accountable care team” model implemented by each unit was associated with greater reductions in LOS and cost. In contrast, our findings of a lack of an effect are consistent with a recent cluster-randomized trial by O’Leary et al,10 which found that implementation of patient-centered bedside rounds did not improve patient satisfaction or perceptions of shared decision-making compared to units using a model of structured IDRs in a conference room setting. It is notable that the control groups in both the O’Leary trial10 and this study did not represent usual care, because these groups featured localization of the clinical teams and high-quality IDR. In our trial, it is plausible that the control side of the unit was functioning at a high level, which would have decreased our ability to further improve outcomes. Whether restructuring unit processes, including implementation of bedside IDR, improves care compared to usual care without these processes is unknown.
We found that the MICRO intervention significantly decreased LOS compared to the control group for patients transferred to the study unit. This analysis was exploratory and the finding was unexpected. Patients were transferred to the study unit from units of higher acuity, and were more likely to have Medicaid or no insurance and be discharged to facilities rather than home, suggesting that these patients had substantial disposition challenges. It is plausible that this is the population for which bedside IDRs may have the greatest impact. This was a secondary analysis, however, and should be considered as hypothesis-generating for future investigations.
Although the impact on outcomes of bedside IDRs is uncertain, potential benefits and practical barriers have been examined. Gonzalo et al.11 surveyed inpatient physicians and nurses at a hospital employing bedside IDRs and found that the benefits ranked the highest were communication, coordination, and teamwork, and the lowest-ranked benefits were related to efficiency and outcomes. The 6 greatest barriers concerned the time required to complete bedside IDR. These results indicate that the time investiture by staff may be a barrier to widespread adoption. More modest changes, such as increasing the structure of standard conference room rounds, may improve care, although the data are mixed. O’Leary et al.12 assessed the value of a structured approach in a conference room setting, which primarily entailed implementing a checklist for newly admitted patients, and found no difference in LOS. Follow-up studies by these investigators found mixed results on the ability of structured IDR to decrease the incidence of adverse events.13,14
The results of our AHRQ survey of patient safety culture found that several important aspects of teamwork and safety were perceived as improved by the intervention, including the “overall grade on patient safety.” Other studies have similarly shown increases in teamwork and safety ratings through redesign of IDR. O’Leary et al.12 surveyed residents and nurses on a unit that implemented a structured, conference room-based IDR and found that providers on the intervention unit rated the teamwork climate higher than providers on the control unit. Our finding that hospitalists and nurses gave higher ratings for IDR being “efficient” and “a good use of my time” on the postintervention survey than the pre-intervention survey suggests that initial concerns about the additional time commitment may be offset by gains in overall efficiency and in development of an environment of enhanced communication, teamwork, and safety.
This study has several limitations. First, the trial may have been underpowered to find small differences between the groups. The trends for decreased LOS and clinical deterioration in the MICRO group may suggest that bedside IDR can provide a small but clinically significant benefit that would be statistically significant only in a larger trial. Second, patients were not randomized to the 2 groups. The impact is diminished, however, because the routine hospital process for assigning patients to the 2 areas in which the groups were located is random and based solely on bed availability. Third, nurses and hospitalists caring for patients in the control group likely experienced improved communication practices from the unit-wide TeamStepps education and from participating in the MICRO protocol when caring for patients on the intervention side of the unit. Fourth, we did not collect data on the effectiveness of communication and are unable to assess the fidelity with which the structured protocol was followed or whether interprofessional communication was fostered or hindered. Lastly, the study was implemented on a nonteaching unit at a single academic medical center. The protocol and the results may not be generalizable to other hospitals or units that include house staff.
In conclusion, transforming IDR from a conference room model to a bedside model did not reduce overall LOS or clinical deterioration on a unit using features of an ACU structure. Although several beneficial effects were noted, including a reduction in LOS for patients transferred to the study unit and higher ratings of the patient safety climate and efficiency of IDR, implementing bedside IDR in this setting has marginal benefit. Future studies should assess whether a comprehensive transformation of the inpatient model of care, including patient-centered bedside IDR, geographic cohorting of teams, and co-leadership, improves outcomes compared to models without these features.
Disclosures
This trial was funded by Medline’s Prevention Above All Discoveries Grant Program. The authors report no financial conflicts of interest.
1. O’Leary KJ, Sehgal NL, Terrell G, Williams MV; High Performance Teams and the Hospital of the Future Project Team. Interdisciplinary teamwork in hospitals: A review and practical recommendations for improvement. J Hosp Med. 2011;7(1):48-54. PubMed 2. Gonzalo JD, Wolpaw DR, Lehman E, Chuang CH. Patient-centered interprofessional collaborative care: factors associated with bedside interprofessional rounds. J Gen Intern Med. 2014;29(7):1040-1047. PubMed 3. Pannick S, Davis R, Ashrafian H, et al. Effects of interdisciplinary team care interventions on general medical wards. A systematic review. JAMA Intern Med. 2015;175(8):1288-1298. PubMed 4. Stein J, Payne C, Methvin A, et al. Reorganizing a hospital ward as an accountable care unit. J Hosp Med. 2015;10(1):36-40. PubMed 5. Mohr J, Batalden P, Barach P. Integrating patient safety into the clinical microsystem. Qual Saf Health Care. 2004;13(suppl 2):ii34-ii38. PubMed 6. Nelson EC, Batalden PB, Huber TP, et al. Microsystems in health care: Part 1. Learning from high-performing front-line clinical units. Jt Comm J Qual Improv. 2002;28:472-493. PubMed 7. Rutberg H, Borgstedt Risberg MB, Sjödahl R, Nordqvist P, Valter L, Nilsson L. Characterisations of adverse events detected in a university hospital: a 4-year study using the Global Trigger Tool method. BMJ Open. 2014;4(5):e004879. PubMed 8. Elixhauser A, Steiner C, Harris DR, Coffey RM. Comorbidity measures for use with administrative data. Med Care. 1998;36(1):8-27. PubMed 9. Kara A, Johnson CS, Nicley A, Niemeier MR, Hui SL. Redesigning accountable care: testing the effectiveness of an accountable care team model. J Hosp Med. 2015;10(12):773-779. PubMed 10. O’Leary KJ, Killarney A, Hansen LO, Jones S, Malladi M, Marks K, et al. Effect of patient-centred bedside rounds on hospitalised patients’ decision control, activation and satisfaction with care. BMJ Qual Saf. 2016;25(12):921-928. PubMed 11. Gonzalo JD, Kuperman E, Lehman E, Haidet P. Bedside interprofessional rounds: perceptions of benefits and barriers by internal medicine nursing staff, attending physicians, and housestaff physicians. J Hosp Med. 2014;9(10):646-651. PubMed 12. O’Leary KJ, Wayne DB, Haviley C, Slade ME, Lee J, Williams MV. Improving teamwork: impact of structured interdisciplinary rounds on a medical teaching unit. J Gen Intern Med. 2010;25:826-832. PubMed 13. O’Leary KJ, Buck R, Fligiel HM, et al. Structured interdisciplinary rounds in a medical teaching unit: improving patient safety. Arch Intern Med. 2011;171(7):678-684. PubMed 14. O’Leary KJ, Creden AJ, Slade ME, et al. Implementation of unit-based interventions to improve teamwork and patient safety on a medical service. Am J Med Qual. 2015;30(5):409-416. PubMed
The care of hospitalized patients requires practitioners from multiple disciplines to assess and communicate the patient’s status in a dynamic manner during hospitalization. Although optimal teamwork is needed for patient care to be delivered reliably and efficiently, care within hospitals is typically delivered in a fragmented manner.1 A bedside model for daily interdisciplinary rounds (IDR) has been proposed as a method to provide a structured process and engage all team members in a patient-centered, system-of-care delivery.2 Specific advantages of convening rounds in the presence of the patient include the ability to directly assess care (eg, presence of a potentially unnecessary urinary catheter), patient engagement in key aspects of their care and disposition, and an increased opportunity for team members to develop a shared understanding of the patient’s views and needs.
Implementing dramatic changes to the workflow of multiple disciplines will require rigorous evidence to support a concerted effort from leadership and buy-in from stakeholders at the front line of patient care. Despite the urgency for evidence, there has been little investigation of this strategy. A systematic review3 identified 30 studies published between 1998 and 2013 addressing interdisciplinary interventions on medical wards, none of which examined a bedside IDR model. In a study performed after the period assessed by the systematic review, Stein et al4 described the restructuring of a medical ward as an accountable care unit (ACU), which included a bedside model for rounds by the interdisciplinary team. The change was associated with decreased mortality and length of stay (LOS), although the study did not isolate the impact of rounds or use a concurrent control group and presented aggregate rather than patient-level outcomes. The lack of convincing data may be a reason bedside rounds are not widely employed by hospitals. To provide high-quality evidence, we performed a large, prospective controlled trial comparing a structured bedside model (mobile interdisciplinary care rounds [MICRO]) with standard rounds.
METHODS
This study took place at the Mount Sinai Hospital, which is a 1171-bed tertiary care academic medical center in New York City, New York. A nonteaching unit offered the ability to use a prospective controlled design. Patients were assigned to the north and the south wings of the unit in a quasi-randomized manner, rather than based on diagnosis or acuity. We transformed IDR to a bedside model on the north side of the unit (MICRO group), while the south side of the unit continued using standard conference room-based IDR (control group). The north and south sides of the unit contain 17 and 14 beds, respectively. During the study period, nurses and hospitalists cared for patients on both sides of the study unit, although on any given day were assigned only patients on 1 side of the unit. The unit uses a clinical microsystem model, which has been defined as “a group of clinicians and staff working together with a shared clinical purpose to provide care for a population of patients,” and has a defined set of characteristics associated with high performance.5,6 Our microsystem model has incorporated features as described by Stein’s ACU model,4 including co-leadership by a hospitalist and a nurse manager, geographic assignment of patients to teams, and unit-level data reports. One hospitalist is assigned geographically to each area of the unit in a 2- to 4-week rotation. Coverage of the unit does not include house staff; patients are primarily assigned to hospitalists working with nurse practitioners. Patients were enrolled prospectively during their initial IDR by a research coordinator. Patient-level data and outcomes were collected prospectively by a research coordinator who attended IDR on the intervention and the control sides of the study unit daily.
Inclusion Criteria
All patients admitted to the medicine service on the study unit were eligible. Patients were greater than 18 years and admitted for an acute medical condition. Patients admitted to another unit and later transferred to the study unit were enrolled at the time of transfer. Patients could be included more than once if hospitalized on the study unit on more than 1 occasion. Most patients were covered by hospitalists, although patients covered by private physicians were included. Patients from other departments, including family medicine, are uncommonly admitted to the unit and were excluded. Patients were also excluded if they were admitted and discharged over the same weekend, because the MICRO rounds occur during weekdays and there was no opportunity to offer the intervention on Saturdays and Sundays.
MICRO Intervention
Interdisciplinary rounds occurred daily at 10:00 am for the control group and at 10:30 am for the MICRO group, and were attended by the hospitalist caring for the majority of patients on the unit, staff nurses, and the unit medical director, nurse manager, social worker, and case manager. Rounds on the control unit focused on the plan of care and disposition but did not follow any set structure and were typically 25 to 30 minutes in duration.
The MICRO rounds occurred at the bedside and followed a structured script (Appendix 1) that was designed to limit discussion of each patient to 3 minutes or less, and included speaking roles for the hospitalist, nurse, and social worker. For private physicians, the nurse practitioner assigned to the patient performed the role of the hospitalist. Rounds were expected to be approximately 50 minutes in duration. Patients were further engaged by asking for their main goal for the day. A patient safety checklist was reviewed. Initially, this task was performed by the nurse manager, who did not verbalize the items unless a deficiency was noted. After 6 months’ experience, this responsibility was given to the staff nurse, who reviewed the checklist verbally as part of the bedside script. Patients were seen daily, including those being discharged later that same day.
Staff and Clinician Education
We developed and implemented a curriculum based on a modified version of the Agency for Healthcare Research and Quality’s TeamStepps® program to ensure that all team members were provided with the basic principles of communication within the healthcare setting. The curriculum consisted of interactive didactics on essential elements of teamwork, including team structure, communication, situation monitoring, and mutual support, as well as the purpose and structure of the MICRO model. The curriculum was delivered to nurses at 3 monthly staff meetings on the study unit and to hospitalists during 3 hospital medicine grand rounds over a 3-month period. Nurses and physicians providing care on both geographic areas of the study unit received the education program because no group of practitioners was designated to only 1 geographic area.
Outcomes
Primary and Secondary Outcomes
The primary outcomes were clinical deterioration (CD) and length of stay. Clinical deterioration was a composite outcome defined a priori as death; escalation of care (ie, transfer to an intensive care unit, intermediate care unit, or teaching unit); or a hospital-acquired complication (ie, venous thromboembolism, fall, stage III-IV pressure ulcer, catheter-associated urinary tract infection, central-line associated bloodstream infection, or Clostridium difficile-associated diarrhea). The LOS was calculated as the mean LOS with outliers excluded (outliers defined as having a LOS 100 days or longer or 2.5 or more standard deviations from the expected LOS).
Process metrics on IDR, such as the duration of rounds, attendance by members of the interdisciplinary team, the percentage of patients discussed, or the effectiveness of communication, were not collected. We assessed patient satisfaction based on the Hospital Consumer Assessment of Healthcare Providers and Systems (HCAHPS) survey.
Patient Safety Culture Survey
To assess the impact on the perceptions of patient safety, we administered the Agency for Healthcare Research and Quality (AHRQ) Hospital Survey on Patient Safety Culture toall staff and clinicians working on both sides of the study unit immediately before and 12 months after implementation of the MICRO model. Results are reported for the AHRQ dimensions that were most relevant to the MICRO intervention: “teamwork within units,” “overall perceptions of safety,” “communication,” “openness,” “overall patient safety grade,” and “handoffs and transitions.” The survey represents pre- and post-comparison. All nurses and hospitalists on both the MICRO and control sides of the study unit had received the TeamStepps curriculum and participated in MICRO rounds by the time of the postintervention survey. We added 3 questions specifically assessing the perception of the efficiency and effectiveness of IDR. Postintervention respondents reflected on their overall impression of IDR, which included their experiences on both sides of the unit, because no group of nurses or hospitalists was exposed only to the MICRO side or the control side of the unit. Responses to survey questions were recorded on a 5-point Likert scale (from “strongly disagree” to “strongly agree” for opinion questions; and “never,” rarely,” sometimes,” “most of the time,” and “always” for frequency questions) and given a score from 1 to 5. The question asking for an overall grade for patient safety was scored from 1 to 5 points corresponding to letter grade choices F, D, C, B, A.
Statistical Analysis
The sample size was based on the estimate of the baseline rate of the primary outcome of CD and the projected decrease by the MICRO intervention. A study using the Global Trigger Tool developed by the Institute for Healthcare Improvement provided a best estimate of 16% as the baseline rate for CD.7 A total of 2000 hospitalizations were planned to be included to have a power of at least 80% to detect a 25% reduction in the annual incidence of CD with a 2-tailed type I error rate of 0.05. Comparisons of dichotomous event rates were made using chi square tests at a 2-tailed level for significance of 0.05. The LOS was analyzed using the nonparametric median test and multivariable regression analysis. We used a generalized linear model with gamma distribution and log link for all analyses of LOS, where LOS was the outcome variable, and intervention vs. control unit type was the predictor variable. Age, sex, race, payer, case mix, and comorbidities defined with the Elixhauser algorithm were used as covariates.8 We used multivariable logistic regression for analysis of CD, where the dependent variable was CD. Predictor variables included intervention, patient age, sex, race, payer, case mix and comorbidities. Patient satisfaction data were compared using the chi square test. The Student t test for dependent means was used to analyze the patient safety culture survey data.
The study protocol was submitted to the Icahn Mount Sinai School of Medicine’s institutional review board and determined to be exempt from full review.
RESULTS
A total of 2005 hospitalizations were included over the 12-month study period, consisting of 1089 hospitalizations in the MICRO group and 916 in the control group. Bedside and standard IDR were completed daily, Monday through Friday without exception. The demographic characteristics and comorbidities were similar for the 2 groups (Table). Hospitalizations of patients who were initially admitted to another unit and subsequently transferred to the study unit accounted for 11.1% of hospitalizations.
Table
Risk-adjusted LOS was similar for the groups (6.6 vs 7.0 days, P = 0.17, for the MICRO and control groups, respectively). On subgroup analysis, a reduction in LOS was noted for patients transferred to the study unit (10.4 vs 14.0 days, P = 0.02, for the MICRO and control groups, respectively). The LOS was unchanged for patients admitted directly to the study unit (6.0 vs 5.8 days, P = 0.93). There was no difference in the incidence of clinical deterioration for the MICRO or control groups (7.7% vs 9.3%, odds ratio, 0.89; 95% confidence interval, 0.61-1.22, P = 0.46).
The finding of a LOS benefit for the MICRO group limited to patients transferred to the study unit prompted a comparison of patients transferred to the study unit and patients directly admitted to the study unit from the emergency department (Appendix 2). Compared to patients admitted directly to the study unit, patients transferred to the study unit were more likely to have Medicaid or no insurance, more likely to be discharged to a facility, had longer LOS, and were more likely to experience CD.
Patient Satisfaction
There were 175 and 140 responses to the HCAHPS survey for the MICRO and the control groups, respectively. Patients in the MICRO group were more likely to report that “doctors, nurses, or other hospital staff talk with you about whether you would have the help you needed when you left the hospital” (88% vs 78%, P = 0.01). Responses for all other HCAHPS items were similar for the 2 groups.
Figure 1
Clinician/Staff Survey
The response rate was 96% (30 nurses and 17 hospitalists) pre-intervention and 100% (30 nurses and 22 hospitalists) postintervention. Hospitalists and nurses gave significantly higher scores for the dimensions “teamwork within units,” “overall perception of patient safety,” and “patient safety grade” on the postintervention survey compared to the pre-intervention survey (Figure 1). Hospitalists and nurses rated the efficiency of IDR and the ability of IDR to identify safety issues higher on the postintervention survey compared to the pre-intervention survey (Figure 2).
Figure 2
DISCUSSION
We transformed daily IDR from a standard conference room model to a structured bedside model with scripted roles, and performed a rigorous comparison using patient-level data. Our finding that transforming daily IDR from a standard conference room model to a bedside model did not significantly reduce LOS suggests either that the model is ineffective or needs to be incorporated into more comprehensive efforts to improve clinical outcomes. Studies suggest that bedside rounding can improve outcomes when implemented in the context of comprehensive restructuring of patient care.4,9 Stein et al.4 have described the reorganization of a medical ward as an “accountable care unit.” The ACU model included daily IDRs at the bedside, as well as geographic-based teams, co-leadership by a hospitalist and nurse manager, and unit-level reporting. Although no definitive conclusions can be drawn based on their descriptive report, transformation of the unit was associated with reduced LOS and mortality. Similarly, Kara et al.9 found that the number of elements of an “accountable care team” model implemented by each unit was associated with greater reductions in LOS and cost. In contrast, our findings of a lack of an effect are consistent with a recent cluster-randomized trial by O’Leary et al,10 which found that implementation of patient-centered bedside rounds did not improve patient satisfaction or perceptions of shared decision-making compared to units using a model of structured IDRs in a conference room setting. It is notable that the control groups in both the O’Leary trial10 and this study did not represent usual care, because these groups featured localization of the clinical teams and high-quality IDR. In our trial, it is plausible that the control side of the unit was functioning at a high level, which would have decreased our ability to further improve outcomes. Whether restructuring unit processes, including implementation of bedside IDR, improves care compared to usual care without these processes is unknown.
We found that the MICRO intervention significantly decreased LOS compared to the control group for patients transferred to the study unit. This analysis was exploratory and the finding was unexpected. Patients were transferred to the study unit from units of higher acuity, and were more likely to have Medicaid or no insurance and be discharged to facilities rather than home, suggesting that these patients had substantial disposition challenges. It is plausible that this is the population for which bedside IDRs may have the greatest impact. This was a secondary analysis, however, and should be considered as hypothesis-generating for future investigations.
Although the impact on outcomes of bedside IDRs is uncertain, potential benefits and practical barriers have been examined. Gonzalo et al.11 surveyed inpatient physicians and nurses at a hospital employing bedside IDRs and found that the benefits ranked the highest were communication, coordination, and teamwork, and the lowest-ranked benefits were related to efficiency and outcomes. The 6 greatest barriers concerned the time required to complete bedside IDR. These results indicate that the time investiture by staff may be a barrier to widespread adoption. More modest changes, such as increasing the structure of standard conference room rounds, may improve care, although the data are mixed. O’Leary et al.12 assessed the value of a structured approach in a conference room setting, which primarily entailed implementing a checklist for newly admitted patients, and found no difference in LOS. Follow-up studies by these investigators found mixed results on the ability of structured IDR to decrease the incidence of adverse events.13,14
The results of our AHRQ survey of patient safety culture found that several important aspects of teamwork and safety were perceived as improved by the intervention, including the “overall grade on patient safety.” Other studies have similarly shown increases in teamwork and safety ratings through redesign of IDR. O’Leary et al.12 surveyed residents and nurses on a unit that implemented a structured, conference room-based IDR and found that providers on the intervention unit rated the teamwork climate higher than providers on the control unit. Our finding that hospitalists and nurses gave higher ratings for IDR being “efficient” and “a good use of my time” on the postintervention survey than the pre-intervention survey suggests that initial concerns about the additional time commitment may be offset by gains in overall efficiency and in development of an environment of enhanced communication, teamwork, and safety.
This study has several limitations. First, the trial may have been underpowered to find small differences between the groups. The trends for decreased LOS and clinical deterioration in the MICRO group may suggest that bedside IDR can provide a small but clinically significant benefit that would be statistically significant only in a larger trial. Second, patients were not randomized to the 2 groups. The impact is diminished, however, because the routine hospital process for assigning patients to the 2 areas in which the groups were located is random and based solely on bed availability. Third, nurses and hospitalists caring for patients in the control group likely experienced improved communication practices from the unit-wide TeamStepps education and from participating in the MICRO protocol when caring for patients on the intervention side of the unit. Fourth, we did not collect data on the effectiveness of communication and are unable to assess the fidelity with which the structured protocol was followed or whether interprofessional communication was fostered or hindered. Lastly, the study was implemented on a nonteaching unit at a single academic medical center. The protocol and the results may not be generalizable to other hospitals or units that include house staff.
In conclusion, transforming IDR from a conference room model to a bedside model did not reduce overall LOS or clinical deterioration on a unit using features of an ACU structure. Although several beneficial effects were noted, including a reduction in LOS for patients transferred to the study unit and higher ratings of the patient safety climate and efficiency of IDR, implementing bedside IDR in this setting has marginal benefit. Future studies should assess whether a comprehensive transformation of the inpatient model of care, including patient-centered bedside IDR, geographic cohorting of teams, and co-leadership, improves outcomes compared to models without these features.
Disclosures
This trial was funded by Medline’s Prevention Above All Discoveries Grant Program. The authors report no financial conflicts of interest.
References
1. O’Leary KJ, Sehgal NL, Terrell G, Williams MV; High Performance Teams and the Hospital of the Future Project Team. Interdisciplinary teamwork in hospitals: A review and practical recommendations for improvement. J Hosp Med. 2011;7(1):48-54. PubMed 2. Gonzalo JD, Wolpaw DR, Lehman E, Chuang CH. Patient-centered interprofessional collaborative care: factors associated with bedside interprofessional rounds. J Gen Intern Med. 2014;29(7):1040-1047. PubMed 3. Pannick S, Davis R, Ashrafian H, et al. Effects of interdisciplinary team care interventions on general medical wards. A systematic review. JAMA Intern Med. 2015;175(8):1288-1298. PubMed 4. Stein J, Payne C, Methvin A, et al. Reorganizing a hospital ward as an accountable care unit. J Hosp Med. 2015;10(1):36-40. PubMed 5. Mohr J, Batalden P, Barach P. Integrating patient safety into the clinical microsystem. Qual Saf Health Care. 2004;13(suppl 2):ii34-ii38. PubMed 6. Nelson EC, Batalden PB, Huber TP, et al. Microsystems in health care: Part 1. Learning from high-performing front-line clinical units. Jt Comm J Qual Improv. 2002;28:472-493. PubMed 7. Rutberg H, Borgstedt Risberg MB, Sjödahl R, Nordqvist P, Valter L, Nilsson L. Characterisations of adverse events detected in a university hospital: a 4-year study using the Global Trigger Tool method. BMJ Open. 2014;4(5):e004879. PubMed 8. Elixhauser A, Steiner C, Harris DR, Coffey RM. Comorbidity measures for use with administrative data. Med Care. 1998;36(1):8-27. PubMed 9. Kara A, Johnson CS, Nicley A, Niemeier MR, Hui SL. Redesigning accountable care: testing the effectiveness of an accountable care team model. J Hosp Med. 2015;10(12):773-779. PubMed 10. O’Leary KJ, Killarney A, Hansen LO, Jones S, Malladi M, Marks K, et al. Effect of patient-centred bedside rounds on hospitalised patients’ decision control, activation and satisfaction with care. BMJ Qual Saf. 2016;25(12):921-928. PubMed 11. Gonzalo JD, Kuperman E, Lehman E, Haidet P. Bedside interprofessional rounds: perceptions of benefits and barriers by internal medicine nursing staff, attending physicians, and housestaff physicians. J Hosp Med. 2014;9(10):646-651. PubMed 12. O’Leary KJ, Wayne DB, Haviley C, Slade ME, Lee J, Williams MV. Improving teamwork: impact of structured interdisciplinary rounds on a medical teaching unit. J Gen Intern Med. 2010;25:826-832. PubMed 13. O’Leary KJ, Buck R, Fligiel HM, et al. Structured interdisciplinary rounds in a medical teaching unit: improving patient safety. Arch Intern Med. 2011;171(7):678-684. PubMed 14. O’Leary KJ, Creden AJ, Slade ME, et al. Implementation of unit-based interventions to improve teamwork and patient safety on a medical service. Am J Med Qual. 2015;30(5):409-416. PubMed
Address for correspondence and reprint requests: Andrew S. Dunn, MD, MPH, Chief, Division of Hospital Medicine, Mount Sinai Health System, 1468 Madison Ave, Box 1087, New York, NY 10029; Telephone: 212-241-2920; Fax: 212-289-6393; E-mail: andrew.dunn@mountsinai.org
Content Gating
Gated (full article locked unless allowed per User)
Attending rounds at academic medical centers are often disconnected from patients and non-physician care team members. Time spent bedside is consistently less than one third of total rounding time, with observational studies reporting a range of 9% to 33% over the past several decades.1-8 Rounds are often conducted outside patient rooms, denying patients, families, and nurses the opportunity to participate and offer valuable insights. Lack of bedside rounds thus limits patient and family engagement, patient input into the care plan, teaching of the physical examination, and communication and collaboration with nurses. In one study, physicians and nurses on rounds engaged in interprofessional communication in only 12% of patient cases.1 Studies have found interdisciplinary bedside rounds have several benefits, including subjectively improved communication and teamwork between physicians and nurses; increased patient satisfaction, including feeling more cared for by the medical team; and decreased length of stay and costs of care.2-10
However, there are many barriers to conducting interdisciplinary bedside rounds at large academic medical centers. Patients cared for by a single medical team are often geographically dispersed to several nursing units, and nurses are unable to predict when physicians will round on their patients. This situation limits nursing involvement on rounds and keeps doctors and nurses isolated from each other.2 Regionalization of care teams reduces this fragmentation by facilitating more interaction among doctors, patients, families, and nursing staff.
There are few data on how regionalized patients and interdisciplinary bedside rounds affect rounding time and the nature of rounds. This information is needed to understand how these structural changes mediate their effects, whether other steps are required to optimize outcomes, and how to maximize efficiency. We used time-motion analysis (TMA) to investigate how regionalization of medical teams, encouragement of bedside rounding, and systematic inclusion of nurses on ward rounds affect amount of time spent with patients, nursing presence on rounds, and total rounding time.
METHODS
Setting
This prospective interventional study, approved by the Institutional Review Board of Partners HealthCare, was conducted on the general medical wards at Brigham and Women’s Hospital, an academic 793-bed tertiary-care center in Boston, Massachusetts. Housestaff teams consist of 1 attending, 1 resident, and 2 interns with or without a medical student. Before June 20, 2013, daily rounds on medical inpatients were conducted largely on the patient unit but outside patient rooms. After completing most of a rounding discussion outside a patient’s room, the team might walk in to examine or speak with the patient. A typical medical team had patients dispersed over 7 medical units on average, and over as many as 13. As nurses were unit based, they did not consistently participate in rounds.
Intervention
In June 2013, as part of a general medical service care redesign initiative, the general medical teams were regionalized to specific inpatient units. The goal was to have teams admit patients predominantly to the team’s designated unit and to have all patients on a unit be cared for by the unit’s assigned team as often as possible, with an 85% goal for both. Toward those ends, the admitting structure was changed from a traditional 4-day call cycle to daily admitting for all teams, based on each unit’s bed availability.11
Teams were also expected to conduct rounds with nurses, and a system for facilitating these rounds was established. As physician and nurse care teams were now geographically co-located, it became possible for residents and nurses to check a rounding sheet for the planned patient rounding order, which had been set by the resident and nurse-in-charge before rounds. No more than about 5 minutes was needed to prepare each day’s order. The rounding sheet prioritized sick patients, newly admitted patients, and planned morning discharges, but patients were also always grouped by nurse. For example, the physician team rounded with the first nurse on all 3 of a nurse’s patients, and then proceeded to the next group of 3 patients with the next nurse, until all patients were seen.
Teams were encouraged to conduct patient- and family-centered rounds exclusively at bedside, except when bedside rounding was thought to be detrimental to a patient (eg, one with delirium). After an intern’s bedside presentation, which included a brief summary and details about overnight events and vital signs, the concerns of the patient, family, and nurse were shared, a focused physical examination performed, relevant data (eg, laboratory test results and imaging studies) reviewed, and the day’s plan formulated. The entire team, including the attending, was expected to have read new patients’ admission notes before rounds. Bedside rounds could thus be focused more on patient assessment and patient/family engagement and less on data transfer.
Several actions were taken to facilitate these changes. Residents, attendings, nurses, and other interdisciplinary team members participated in a series of focus groups and conferences to define workflows and share best practices for patient- and family-centered bedside rounds. Tips on bedside rounding were included in a general medicine rotation guidebook made available to residents and attendings. At the beginning of each post-intervention general medicine rotation, attendings and residents attended brief orientation sessions to review the new daily schedule, have interdisciplinary huddles, and share expectations for patient- and family-centered bedside rounds. On the general medicine units, new medical directors were hired to partner with existing nursing directors to support adoption of the workflows. Last, an interdisciplinary leadership team was formed to support the care redesign efforts. This team started meeting every 2 weeks.
Study Design
We used a pre–post analysis to study the effects of care redesign. Analysis was performed at the same time of year for 2 consecutive years to control for the stage of training and experience of the housestaff. TMA was performed by trained medical students using computer tablets linked to a customized Microsoft Access database form (Redmond, Washington). The form and the database were designed with specific buttons that, when pressed, recorded the time of particular events, such as the coming and going of each participant, the location of rounds, and the beginning and the end of rounding encounters with a patient. One research assistant using an Access entry form was able to dynamically track all events in real time, as they occurred. We collected data on 4 teams at baseline and 5 teams after the intervention. Each of the 4 baseline teams was followed for 4 consecutive weekdays—16 rounds total, April-June 2013—to capture the 4-day call cycle. Each of the 5 post-intervention teams was followed for 5 consecutive weekdays—25 rounds total, April–June 2014—to capture the 5-day cycle. (Because of technical difficulties, data from 1 rounding session were not captured.) For inclusion in the statistical analyses, TMA captured 166 on-service patients before the intervention and 304 afterward. Off-service patients, those with an attending other than the team attending, were excluded because their rounds were conducted separately.
We examined 2 primary outcomes, the proportion of time each clinical team member was present on rounds and the proportion of bedside rounding time. Secondary outcomes were round duration, rounding time per patient, and total non-patient time per rounding session (total rounding time minus total patient time).
Statistical Analysis
TMA data were organized in an Access database and analyzed with SAS Version 9.3 (SAS Institute, Cary, North Carolina). We analyzed the data by round session as well as by patient.
Data are presented as means with standard deviations, medians with interquartile ranges, and proportions, as appropriate. For analyses by round session, we used unadjusted linear regression; for patient-level analyses, we used general estimating equations to adjust for clustering of patients within each session; for nurse presence during any part of a round by patient, we used a χ2 test. Total non-patient time per round session was compared with use of patient-clustered general estimating equations using a γ distribution to account for the non-normality of the data.
Table 1
RESULTS
Patient and Care Team Characteristics
Over the first year of the initiative, 85% of a team’s patients were on their assigned unit, and 87% of a unit’s patients were with the assigned team. Census numbers were 10.4 patients per general medicine team in April-June 2013 and 12.7 patients per team in April-June 2014, a 22% increase after care redesign. There were no statistically significant differences in patient characteristics, including age, sex, race, language, admission source, and comorbidity measure (Elixhauser score), between the pre-intervention and post-intervention study periods, except for a slightly higher proportion of patients admitted from home and fewer patients admitted directly from clinic (Table 1).
Figure 1
Primary Outcomes
Mean proportion of time the nurse was present on rounds per round session increased significantly (P < 0.001), from 24.1% to 67.8% (Figure 1A, Table 2). For individual patient encounters, the increased overall nursing presence was attributable to having more nurses on rounds and having nurses present for a larger proportion of individual rounding encounters (Figure 1B, Table 2). Nurses were present for at least some part of rounds for 53% of patients before the intervention and 93% afterward (P < 0.001). Mean proportion of round time by each of the 2 interns on each team decreased from 59.6% to 49.6% (P = 0.007).
Total bedside rounding time increased significantly (P < 0.001), from 39.9% before the intervention to 55.8% afterward (Table 2). Meanwhile, percentage of rounding time spent on the unit but outside patient rooms decreased significantly (P = 0.004), from 55.2% to 42.2%, as did rounding time on a unit completely different from the patient’s (4.9% before intervention, 2.0% afterward; P = 0.03). Again, patient-level results were similar (Figure 2, Table 2), but the decreased time spent on the unit, outside the patient rooms, was not significant.
Table 2
Secondary Outcomes
Total rounding time decreased significantly, from a mean of 182 minutes (3.0 hours) at baseline to a mean of 146 minutes (2.4 hours) after the intervention, despite the higher post-intervention census. (When adjusted for patient census, the difference increased from 35.5 to 53.8 minutes; Table 2.) Mean rounding time per patient decreased significantly, from 14.7 minutes at baseline to 10.5 minutes after the intervention. For newly admitted patients, mean rounding time per patient decreased from 30.0 minutes before implementation to 16.3 minutes afterward. Mean rounding time also decreased, though much less, for subsequent-day patients (Table 2). For both new and existing patients, the decrease in rounding time largely was a reduction in time spent rounding outside patient rooms, with minimal impact on bedside time (Table 2). Mean time nurses were present during a patient’s rounds increased significantly, from 4.5 to 8.0 minutes (Table 2). Total nurse rounding time increased from 45.1 minutes per session to 98.8 minutes. Rounding time not related to patient discussion or evaluation decreased from 22.7 minutes per session to 13.3 minutes (P = 0.003).
Figure 2
DISCUSSION
TMA of our care redesign initiative showed that this multipronged intervention, which included team regionalization, encouragement of bedside rounding with nurses, call structure changes, and attendings’ reading of admission notes before rounds, resulted in an increased proportion of rounding time spent with patients and an increased proportion of time nurses were present on rounds. Secondarily, round duration decreased even as patient census increased.
Regionalized teams have been found to improve interdisciplinary communication.1 The present study elaborates on that finding by demonstrating a dramatic increase in nursing presence on rounds, likely resulting from the unit’s use of rounding schedules and nurses’ prioritization of rounding orders, both of which were made possible by geographic co-localization. Other research has noted that one of the most significant barriers to interdisciplinary rounds is difficulty coordinating the start times of physician/nurse bedside rounding encounters. The system we have studied directly addresses this difficulty.9 Of note, nursing presence on rounds is necessary but not sufficient for true physician–nurse collaboration and effective communication,1 as reflected in a separate study of the intervention showing no significant difference in the concordance of the patient care plan between nurses and physicians before and after regionalization.12 Additional interventions may be needed to ensure that communication during bedside rounds is effective.
Our regionalized teams spent a significantly higher proportion of rounding time bedside, likely because of a cultural shift in expectations and the increased convenience of seeing patients on the team’s unit. Nevertheless, bedside time was not 100%. Structural barriers (eg, patients off-unit for dialysis) and cultural barriers likely contributed to the less than full adoption of bedside rounding. As described previously, cultural barriers to bedside rounding include trainees’ anxiety about being questioned in front of patients, the desire to freely exchange academic ideas in a conference room, and attendings’ doubts about their bedside teaching ability.1,9,13 Bedside rounds provide an important opportunity to apply the principles of patient- and family-centered care, including promotion of dignity and respect, information sharing, and collaboration. Thus, overcoming the concerns of housestaff and attendings and helping them feel prepared for bedside rounds can benefit the patient experience. More attention should be given to these practices as these types of interventions are implemented at Brigham and Women’s Hospital and elsewhere.1,13-15
Another primary concern about interdisciplinary bedside rounding is the perception that it takes more time.9 Therefore, it was important for us to measure round duration as a balancing measure to be considered for our intervention. Fortunately, we found round duration decreased with regionalization and encouragement of bedside rounding. This decrease was driven largely by a significant decrease in mean rounding time per new patient, which may be attributable at least in part to setting expectations that attendings and residents will read admission notes before rounds and that interns will summarize rather than recount information from admission notes. However, we also found rounding time decreases for subsequent-day patients, suggesting an underlying time savings. Spending a larger proportion of time bedside may therefore result in more efficient rounds. Bedside presentations can reduce redundancies, such as discussing a patient’s case outside his or her room and subsequently walking in and going over much of the same information with the patient. Our model de-emphasizes data transfer in favor of discussion of care plans. There was also a decrease in non-patient time, likely reflecting reduced transit time for regionalized teams. This decrease aligns with a recent finding that bedside rounding was at least as efficient as rounding outside the room.16
Of note, though a larger percentage of time was spent bedside after implementation of the care redesign, the absolute amount of bedside time did not change significantly. Our data showed that, even with shorter rounds, the same amount of absolute time can be spent bedside, face to face with the patient, by increasing the proportion of bedside rounding time. In other words, teams on average did not spend more time with patients, though the content and the structure of those encounters may have changed. This finding may be attributable to eliminating redundancy, forgoing the outside-the-room discussion, and thus the largest time reductions were realized there. In addition, teams incompletely adopted beside rounds, as reflected in the data. We expect that, with more complete adoption, an even larger proportion of time will be spent bedside, and absolute time bedside might increase as a result.
An unexpected result of the care redesign was that interns’ proportion of rounding time decreased after the intervention. This decrease most likely is attributable to interns’ being less likely to participate in rounds for a co-intern’s patient, and to their staying outside that patient’s room to give themselves more time to advance the care of their own patients. Before the intervention, when more rounding time was spent outside patient rooms, interns were more likely to join rounds for their co-intern’s patients because they could easily break away, as needed, to continue care of their own patients. The resident is now encouraged to use the morning huddle to identify which patients likely have the most educational value, and both interns are expected to join the bedside rounds for these patients.
This study had a few limitations. First, the pre–post design made it difficult to exclude the possibility that other temporal changes may have affected outcomes, though we did account for time-of-year effects by aligning our data-collection phases. In addition, the authors, including the director of the general medical service, are unaware of any co-interventions during the study period. Second, the multipronged intervention included care team regionalization, encouragement of bedside rounding with nurses, call structure changes (from 4 days to daily admitting), and attendings’ reading of admission notes before rounds. Thus, parsing which component(s) contributed to the results was difficult, though all the changes instituted likely were necessary for system redesign. For example, regionalization of clinicians to unit-based teams was made possible by switching to a daily admitting system.
Time that team members spent preparing for rounds was not recorded before or after the intervention. Thus, the decrease in total rounding time could have been accompanied by an increase in time spent preparing for rounds. However, admission notes were available in our electronic medical record before and after the intervention, and most residents and attendings were already reading them pre-intervention. After the intervention, pre-round note reading was more clearly defined as an expectation, and we were able to set the expectation that interns should use their presentations to summarize rather than recount information. In addition, in the post-intervention period, we did not include time spent preparing rounding orders; as already noted, however, preparation took only 5 minutes per day. Also, we did not analyze the content or the quality of the discussion on rounds, but simply recorded who was present where and when. Regarding the effect of the intervention on patient care, results were mixed. As reported in 2016, we saw no difference in frequency of adverse events with this intervention.12 However, a more sensitive measure of adverse events—used in a study on handoffs—showed our regionalization efforts had an additive effect on reducing overnight adverse events.17Researchers should now focus on the effects of care redesign on clinical outcomes, interdisciplinary care team communication, patient engagement and satisfaction, provider opinions of communication, workflow, patient care, and housestaff education. Our methodology can be used as a model to link structure, process, and outcome related to rounds and thereby better understand how best to optimize patient care and efficiency. Additional studies are needed to analyze the content of rounds and their association with patient and educational outcomes. Last, it will be important to conduct a study to see if the effects we have identified can be sustained. Such a study is already under way.
In conclusion, creating regionalized care teams and encouraging focused bedside rounds increased the proportion of bedside time and the presence of nurses on rounds. Rounds were shorter despite higher patient census. TMA revealed that regionalized care teams and bedside rounding at a large academic hospital are feasible, and are useful in establishing the necessary structures for increasing physician–nurse and provider–patient interactions.
Acknowledgments
The authors acknowledge Dr. Stan Ashley, Dr. Jacqueline Somerville, and Sheila Harris for their support of the regionalization initiative.
Disclosures
Dr. Schnipper received funding from Sanofi-aventis to conduct an investigator-initiated study to implement and evaluate a multi-faceted intervention to improve transitions of care in patients discharged home on insulin. The study was also supported by funding from the Marshall A. Wolf Medical Education Fund, Brigham and Women’s Hospital, and Dr. Stan Ashley, Chief Medical Officer, Brigham and Women’s Hospital. Some of the content of this article was orally presented at the annual meeting of the Society of Hospital Medicine; March 29-April 1, 2015; National Harbor, MD.
References
1. Crumlish CM, Yialamas MA, McMahon GT. Quantification of bedside teaching by an academic hospitalist group. J Hosp Med. 2009;4(5):304-307. PubMed 2. Gonzalo JD, Masters PA, Simons RJ, Chuang CH. Attending rounds and bedside case presentations: medical student and medicine resident experiences and attitudes. Teach Learn Med. 2009;21(2):105-110. PubMed 3. Elliot DL, Hickam DH. Attending rounds on in-patient units: differences between medical and non-medical services. Med Educ. 1993;27(6):503-508. PubMed 4. Payson HE, Barchas JD. A time study of medical teaching rounds. N Engl J Med. 1965;273(27):1468-1471. PubMed 5. Tremonti LP, Biddle WB. Teaching behaviors of residents and faculty members. J Med Educ. 1982;57(11):854-859. PubMed 6. Miller M, Johnson B, Greene HL, Baier M, Nowlin S. An observational study of attending rounds. J Gen Intern Med. 1992;7(6):646-648. PubMed 7. Collins GF, Cassie JM, Daggett CJ. The role of the attending physician in clinical training. J Med Educ. 1978;53(5):429-431. PubMed 8. Ward DR, Ghali WA, Graham A, Lemaire JB. A real-time locating system observes physician time-motion patterns during walk-rounds: a pilot study. BMC Med Educ. 2014;14:37. PubMed 9. Gonzalo JD, Kuperman E, Lehman E, Haidet P. Bedside interprofessional rounds: perceptions of benefits and barriers by internal medicine nursing staff, attending physicians, and housestaff physicians. J Hosp Med. 2014;9(10):646-651. PubMed 10. Stickrath C, Noble M, Prochazka A, et al. Attending rounds in the current era: what is and is not happening. JAMA Intern Med. 2013;173(12):1084-1089. PubMed 11. Boxer R, Vitale M, Gershanik EF, et al. 5th time’s a charm: creation of unit-based care teams in a high occupancy hospital [abstract]. J Hosp Med. 2015;10(suppl 2). 12. Mueller SK, Schnipper JL, Giannelli K, Roy CL, Boxer R. Impact of regionalized care on concordance of plan and preventable adverse events on general medicine services. J Hosp Med. 2016;11(9):620-627. PubMed 13. Chauke HL, Pattinson RC. Ward rounds—bedside or conference room? S Afr Med J. 2006;96(5):398-400. PubMed 14. Wang-Cheng RM, Barnas GP, Sigmann P, Riendl PA, Young MJ. Bedside case presentations: why patients like them but learners don’t. J Gen Intern Med. 1989;4(4):284-287. PubMed 15. Lehmann LS, Brancati FL, Chen MC, Roter D, Dobs AS. The effect of bedside case presentations on patients’ perceptions of their medical care. N Engl J Med. 1997;336(16):1150-1155. PubMed 16. Gonzalo JD, Chuang CH, Huang G, Smith C. The return of bedside rounds: an educational intervention. J Gen Intern Med. 2010;25(8):792-798. PubMed 17. Mueller SK, Yoon C, Schnipper JL. Association of a web-based handoff tool with rates of medical errors. JAMA Intern Med. 2016;176(9):1400-1402. PubMed
Attending rounds at academic medical centers are often disconnected from patients and non-physician care team members. Time spent bedside is consistently less than one third of total rounding time, with observational studies reporting a range of 9% to 33% over the past several decades.1-8 Rounds are often conducted outside patient rooms, denying patients, families, and nurses the opportunity to participate and offer valuable insights. Lack of bedside rounds thus limits patient and family engagement, patient input into the care plan, teaching of the physical examination, and communication and collaboration with nurses. In one study, physicians and nurses on rounds engaged in interprofessional communication in only 12% of patient cases.1 Studies have found interdisciplinary bedside rounds have several benefits, including subjectively improved communication and teamwork between physicians and nurses; increased patient satisfaction, including feeling more cared for by the medical team; and decreased length of stay and costs of care.2-10
However, there are many barriers to conducting interdisciplinary bedside rounds at large academic medical centers. Patients cared for by a single medical team are often geographically dispersed to several nursing units, and nurses are unable to predict when physicians will round on their patients. This situation limits nursing involvement on rounds and keeps doctors and nurses isolated from each other.2 Regionalization of care teams reduces this fragmentation by facilitating more interaction among doctors, patients, families, and nursing staff.
There are few data on how regionalized patients and interdisciplinary bedside rounds affect rounding time and the nature of rounds. This information is needed to understand how these structural changes mediate their effects, whether other steps are required to optimize outcomes, and how to maximize efficiency. We used time-motion analysis (TMA) to investigate how regionalization of medical teams, encouragement of bedside rounding, and systematic inclusion of nurses on ward rounds affect amount of time spent with patients, nursing presence on rounds, and total rounding time.
METHODS
Setting
This prospective interventional study, approved by the Institutional Review Board of Partners HealthCare, was conducted on the general medical wards at Brigham and Women’s Hospital, an academic 793-bed tertiary-care center in Boston, Massachusetts. Housestaff teams consist of 1 attending, 1 resident, and 2 interns with or without a medical student. Before June 20, 2013, daily rounds on medical inpatients were conducted largely on the patient unit but outside patient rooms. After completing most of a rounding discussion outside a patient’s room, the team might walk in to examine or speak with the patient. A typical medical team had patients dispersed over 7 medical units on average, and over as many as 13. As nurses were unit based, they did not consistently participate in rounds.
Intervention
In June 2013, as part of a general medical service care redesign initiative, the general medical teams were regionalized to specific inpatient units. The goal was to have teams admit patients predominantly to the team’s designated unit and to have all patients on a unit be cared for by the unit’s assigned team as often as possible, with an 85% goal for both. Toward those ends, the admitting structure was changed from a traditional 4-day call cycle to daily admitting for all teams, based on each unit’s bed availability.11
Teams were also expected to conduct rounds with nurses, and a system for facilitating these rounds was established. As physician and nurse care teams were now geographically co-located, it became possible for residents and nurses to check a rounding sheet for the planned patient rounding order, which had been set by the resident and nurse-in-charge before rounds. No more than about 5 minutes was needed to prepare each day’s order. The rounding sheet prioritized sick patients, newly admitted patients, and planned morning discharges, but patients were also always grouped by nurse. For example, the physician team rounded with the first nurse on all 3 of a nurse’s patients, and then proceeded to the next group of 3 patients with the next nurse, until all patients were seen.
Teams were encouraged to conduct patient- and family-centered rounds exclusively at bedside, except when bedside rounding was thought to be detrimental to a patient (eg, one with delirium). After an intern’s bedside presentation, which included a brief summary and details about overnight events and vital signs, the concerns of the patient, family, and nurse were shared, a focused physical examination performed, relevant data (eg, laboratory test results and imaging studies) reviewed, and the day’s plan formulated. The entire team, including the attending, was expected to have read new patients’ admission notes before rounds. Bedside rounds could thus be focused more on patient assessment and patient/family engagement and less on data transfer.
Several actions were taken to facilitate these changes. Residents, attendings, nurses, and other interdisciplinary team members participated in a series of focus groups and conferences to define workflows and share best practices for patient- and family-centered bedside rounds. Tips on bedside rounding were included in a general medicine rotation guidebook made available to residents and attendings. At the beginning of each post-intervention general medicine rotation, attendings and residents attended brief orientation sessions to review the new daily schedule, have interdisciplinary huddles, and share expectations for patient- and family-centered bedside rounds. On the general medicine units, new medical directors were hired to partner with existing nursing directors to support adoption of the workflows. Last, an interdisciplinary leadership team was formed to support the care redesign efforts. This team started meeting every 2 weeks.
Study Design
We used a pre–post analysis to study the effects of care redesign. Analysis was performed at the same time of year for 2 consecutive years to control for the stage of training and experience of the housestaff. TMA was performed by trained medical students using computer tablets linked to a customized Microsoft Access database form (Redmond, Washington). The form and the database were designed with specific buttons that, when pressed, recorded the time of particular events, such as the coming and going of each participant, the location of rounds, and the beginning and the end of rounding encounters with a patient. One research assistant using an Access entry form was able to dynamically track all events in real time, as they occurred. We collected data on 4 teams at baseline and 5 teams after the intervention. Each of the 4 baseline teams was followed for 4 consecutive weekdays—16 rounds total, April-June 2013—to capture the 4-day call cycle. Each of the 5 post-intervention teams was followed for 5 consecutive weekdays—25 rounds total, April–June 2014—to capture the 5-day cycle. (Because of technical difficulties, data from 1 rounding session were not captured.) For inclusion in the statistical analyses, TMA captured 166 on-service patients before the intervention and 304 afterward. Off-service patients, those with an attending other than the team attending, were excluded because their rounds were conducted separately.
We examined 2 primary outcomes, the proportion of time each clinical team member was present on rounds and the proportion of bedside rounding time. Secondary outcomes were round duration, rounding time per patient, and total non-patient time per rounding session (total rounding time minus total patient time).
Statistical Analysis
TMA data were organized in an Access database and analyzed with SAS Version 9.3 (SAS Institute, Cary, North Carolina). We analyzed the data by round session as well as by patient.
Data are presented as means with standard deviations, medians with interquartile ranges, and proportions, as appropriate. For analyses by round session, we used unadjusted linear regression; for patient-level analyses, we used general estimating equations to adjust for clustering of patients within each session; for nurse presence during any part of a round by patient, we used a χ2 test. Total non-patient time per round session was compared with use of patient-clustered general estimating equations using a γ distribution to account for the non-normality of the data.
Table 1
RESULTS
Patient and Care Team Characteristics
Over the first year of the initiative, 85% of a team’s patients were on their assigned unit, and 87% of a unit’s patients were with the assigned team. Census numbers were 10.4 patients per general medicine team in April-June 2013 and 12.7 patients per team in April-June 2014, a 22% increase after care redesign. There were no statistically significant differences in patient characteristics, including age, sex, race, language, admission source, and comorbidity measure (Elixhauser score), between the pre-intervention and post-intervention study periods, except for a slightly higher proportion of patients admitted from home and fewer patients admitted directly from clinic (Table 1).
Figure 1
Primary Outcomes
Mean proportion of time the nurse was present on rounds per round session increased significantly (P < 0.001), from 24.1% to 67.8% (Figure 1A, Table 2). For individual patient encounters, the increased overall nursing presence was attributable to having more nurses on rounds and having nurses present for a larger proportion of individual rounding encounters (Figure 1B, Table 2). Nurses were present for at least some part of rounds for 53% of patients before the intervention and 93% afterward (P < 0.001). Mean proportion of round time by each of the 2 interns on each team decreased from 59.6% to 49.6% (P = 0.007).
Total bedside rounding time increased significantly (P < 0.001), from 39.9% before the intervention to 55.8% afterward (Table 2). Meanwhile, percentage of rounding time spent on the unit but outside patient rooms decreased significantly (P = 0.004), from 55.2% to 42.2%, as did rounding time on a unit completely different from the patient’s (4.9% before intervention, 2.0% afterward; P = 0.03). Again, patient-level results were similar (Figure 2, Table 2), but the decreased time spent on the unit, outside the patient rooms, was not significant.
Table 2
Secondary Outcomes
Total rounding time decreased significantly, from a mean of 182 minutes (3.0 hours) at baseline to a mean of 146 minutes (2.4 hours) after the intervention, despite the higher post-intervention census. (When adjusted for patient census, the difference increased from 35.5 to 53.8 minutes; Table 2.) Mean rounding time per patient decreased significantly, from 14.7 minutes at baseline to 10.5 minutes after the intervention. For newly admitted patients, mean rounding time per patient decreased from 30.0 minutes before implementation to 16.3 minutes afterward. Mean rounding time also decreased, though much less, for subsequent-day patients (Table 2). For both new and existing patients, the decrease in rounding time largely was a reduction in time spent rounding outside patient rooms, with minimal impact on bedside time (Table 2). Mean time nurses were present during a patient’s rounds increased significantly, from 4.5 to 8.0 minutes (Table 2). Total nurse rounding time increased from 45.1 minutes per session to 98.8 minutes. Rounding time not related to patient discussion or evaluation decreased from 22.7 minutes per session to 13.3 minutes (P = 0.003).
Figure 2
DISCUSSION
TMA of our care redesign initiative showed that this multipronged intervention, which included team regionalization, encouragement of bedside rounding with nurses, call structure changes, and attendings’ reading of admission notes before rounds, resulted in an increased proportion of rounding time spent with patients and an increased proportion of time nurses were present on rounds. Secondarily, round duration decreased even as patient census increased.
Regionalized teams have been found to improve interdisciplinary communication.1 The present study elaborates on that finding by demonstrating a dramatic increase in nursing presence on rounds, likely resulting from the unit’s use of rounding schedules and nurses’ prioritization of rounding orders, both of which were made possible by geographic co-localization. Other research has noted that one of the most significant barriers to interdisciplinary rounds is difficulty coordinating the start times of physician/nurse bedside rounding encounters. The system we have studied directly addresses this difficulty.9 Of note, nursing presence on rounds is necessary but not sufficient for true physician–nurse collaboration and effective communication,1 as reflected in a separate study of the intervention showing no significant difference in the concordance of the patient care plan between nurses and physicians before and after regionalization.12 Additional interventions may be needed to ensure that communication during bedside rounds is effective.
Our regionalized teams spent a significantly higher proportion of rounding time bedside, likely because of a cultural shift in expectations and the increased convenience of seeing patients on the team’s unit. Nevertheless, bedside time was not 100%. Structural barriers (eg, patients off-unit for dialysis) and cultural barriers likely contributed to the less than full adoption of bedside rounding. As described previously, cultural barriers to bedside rounding include trainees’ anxiety about being questioned in front of patients, the desire to freely exchange academic ideas in a conference room, and attendings’ doubts about their bedside teaching ability.1,9,13 Bedside rounds provide an important opportunity to apply the principles of patient- and family-centered care, including promotion of dignity and respect, information sharing, and collaboration. Thus, overcoming the concerns of housestaff and attendings and helping them feel prepared for bedside rounds can benefit the patient experience. More attention should be given to these practices as these types of interventions are implemented at Brigham and Women’s Hospital and elsewhere.1,13-15
Another primary concern about interdisciplinary bedside rounding is the perception that it takes more time.9 Therefore, it was important for us to measure round duration as a balancing measure to be considered for our intervention. Fortunately, we found round duration decreased with regionalization and encouragement of bedside rounding. This decrease was driven largely by a significant decrease in mean rounding time per new patient, which may be attributable at least in part to setting expectations that attendings and residents will read admission notes before rounds and that interns will summarize rather than recount information from admission notes. However, we also found rounding time decreases for subsequent-day patients, suggesting an underlying time savings. Spending a larger proportion of time bedside may therefore result in more efficient rounds. Bedside presentations can reduce redundancies, such as discussing a patient’s case outside his or her room and subsequently walking in and going over much of the same information with the patient. Our model de-emphasizes data transfer in favor of discussion of care plans. There was also a decrease in non-patient time, likely reflecting reduced transit time for regionalized teams. This decrease aligns with a recent finding that bedside rounding was at least as efficient as rounding outside the room.16
Of note, though a larger percentage of time was spent bedside after implementation of the care redesign, the absolute amount of bedside time did not change significantly. Our data showed that, even with shorter rounds, the same amount of absolute time can be spent bedside, face to face with the patient, by increasing the proportion of bedside rounding time. In other words, teams on average did not spend more time with patients, though the content and the structure of those encounters may have changed. This finding may be attributable to eliminating redundancy, forgoing the outside-the-room discussion, and thus the largest time reductions were realized there. In addition, teams incompletely adopted beside rounds, as reflected in the data. We expect that, with more complete adoption, an even larger proportion of time will be spent bedside, and absolute time bedside might increase as a result.
An unexpected result of the care redesign was that interns’ proportion of rounding time decreased after the intervention. This decrease most likely is attributable to interns’ being less likely to participate in rounds for a co-intern’s patient, and to their staying outside that patient’s room to give themselves more time to advance the care of their own patients. Before the intervention, when more rounding time was spent outside patient rooms, interns were more likely to join rounds for their co-intern’s patients because they could easily break away, as needed, to continue care of their own patients. The resident is now encouraged to use the morning huddle to identify which patients likely have the most educational value, and both interns are expected to join the bedside rounds for these patients.
This study had a few limitations. First, the pre–post design made it difficult to exclude the possibility that other temporal changes may have affected outcomes, though we did account for time-of-year effects by aligning our data-collection phases. In addition, the authors, including the director of the general medical service, are unaware of any co-interventions during the study period. Second, the multipronged intervention included care team regionalization, encouragement of bedside rounding with nurses, call structure changes (from 4 days to daily admitting), and attendings’ reading of admission notes before rounds. Thus, parsing which component(s) contributed to the results was difficult, though all the changes instituted likely were necessary for system redesign. For example, regionalization of clinicians to unit-based teams was made possible by switching to a daily admitting system.
Time that team members spent preparing for rounds was not recorded before or after the intervention. Thus, the decrease in total rounding time could have been accompanied by an increase in time spent preparing for rounds. However, admission notes were available in our electronic medical record before and after the intervention, and most residents and attendings were already reading them pre-intervention. After the intervention, pre-round note reading was more clearly defined as an expectation, and we were able to set the expectation that interns should use their presentations to summarize rather than recount information. In addition, in the post-intervention period, we did not include time spent preparing rounding orders; as already noted, however, preparation took only 5 minutes per day. Also, we did not analyze the content or the quality of the discussion on rounds, but simply recorded who was present where and when. Regarding the effect of the intervention on patient care, results were mixed. As reported in 2016, we saw no difference in frequency of adverse events with this intervention.12 However, a more sensitive measure of adverse events—used in a study on handoffs—showed our regionalization efforts had an additive effect on reducing overnight adverse events.17Researchers should now focus on the effects of care redesign on clinical outcomes, interdisciplinary care team communication, patient engagement and satisfaction, provider opinions of communication, workflow, patient care, and housestaff education. Our methodology can be used as a model to link structure, process, and outcome related to rounds and thereby better understand how best to optimize patient care and efficiency. Additional studies are needed to analyze the content of rounds and their association with patient and educational outcomes. Last, it will be important to conduct a study to see if the effects we have identified can be sustained. Such a study is already under way.
In conclusion, creating regionalized care teams and encouraging focused bedside rounds increased the proportion of bedside time and the presence of nurses on rounds. Rounds were shorter despite higher patient census. TMA revealed that regionalized care teams and bedside rounding at a large academic hospital are feasible, and are useful in establishing the necessary structures for increasing physician–nurse and provider–patient interactions.
Acknowledgments
The authors acknowledge Dr. Stan Ashley, Dr. Jacqueline Somerville, and Sheila Harris for their support of the regionalization initiative.
Disclosures
Dr. Schnipper received funding from Sanofi-aventis to conduct an investigator-initiated study to implement and evaluate a multi-faceted intervention to improve transitions of care in patients discharged home on insulin. The study was also supported by funding from the Marshall A. Wolf Medical Education Fund, Brigham and Women’s Hospital, and Dr. Stan Ashley, Chief Medical Officer, Brigham and Women’s Hospital. Some of the content of this article was orally presented at the annual meeting of the Society of Hospital Medicine; March 29-April 1, 2015; National Harbor, MD.
References
1. Crumlish CM, Yialamas MA, McMahon GT. Quantification of bedside teaching by an academic hospitalist group. J Hosp Med. 2009;4(5):304-307. PubMed 2. Gonzalo JD, Masters PA, Simons RJ, Chuang CH. Attending rounds and bedside case presentations: medical student and medicine resident experiences and attitudes. Teach Learn Med. 2009;21(2):105-110. PubMed 3. Elliot DL, Hickam DH. Attending rounds on in-patient units: differences between medical and non-medical services. Med Educ. 1993;27(6):503-508. PubMed 4. Payson HE, Barchas JD. A time study of medical teaching rounds. N Engl J Med. 1965;273(27):1468-1471. PubMed 5. Tremonti LP, Biddle WB. Teaching behaviors of residents and faculty members. J Med Educ. 1982;57(11):854-859. PubMed 6. Miller M, Johnson B, Greene HL, Baier M, Nowlin S. An observational study of attending rounds. J Gen Intern Med. 1992;7(6):646-648. PubMed 7. Collins GF, Cassie JM, Daggett CJ. The role of the attending physician in clinical training. J Med Educ. 1978;53(5):429-431. PubMed 8. Ward DR, Ghali WA, Graham A, Lemaire JB. A real-time locating system observes physician time-motion patterns during walk-rounds: a pilot study. BMC Med Educ. 2014;14:37. PubMed 9. Gonzalo JD, Kuperman E, Lehman E, Haidet P. Bedside interprofessional rounds: perceptions of benefits and barriers by internal medicine nursing staff, attending physicians, and housestaff physicians. J Hosp Med. 2014;9(10):646-651. PubMed 10. Stickrath C, Noble M, Prochazka A, et al. Attending rounds in the current era: what is and is not happening. JAMA Intern Med. 2013;173(12):1084-1089. PubMed 11. Boxer R, Vitale M, Gershanik EF, et al. 5th time’s a charm: creation of unit-based care teams in a high occupancy hospital [abstract]. J Hosp Med. 2015;10(suppl 2). 12. Mueller SK, Schnipper JL, Giannelli K, Roy CL, Boxer R. Impact of regionalized care on concordance of plan and preventable adverse events on general medicine services. J Hosp Med. 2016;11(9):620-627. PubMed 13. Chauke HL, Pattinson RC. Ward rounds—bedside or conference room? S Afr Med J. 2006;96(5):398-400. PubMed 14. Wang-Cheng RM, Barnas GP, Sigmann P, Riendl PA, Young MJ. Bedside case presentations: why patients like them but learners don’t. J Gen Intern Med. 1989;4(4):284-287. PubMed 15. Lehmann LS, Brancati FL, Chen MC, Roter D, Dobs AS. The effect of bedside case presentations on patients’ perceptions of their medical care. N Engl J Med. 1997;336(16):1150-1155. PubMed 16. Gonzalo JD, Chuang CH, Huang G, Smith C. The return of bedside rounds: an educational intervention. J Gen Intern Med. 2010;25(8):792-798. PubMed 17. Mueller SK, Yoon C, Schnipper JL. Association of a web-based handoff tool with rates of medical errors. JAMA Intern Med. 2016;176(9):1400-1402. PubMed
Address for correspondence and reprint requests: Robert Boxer, MD, PhD, Brigham and Women’s Hospital, 75 Francis St, PBB-B 412, Boston, MA 02115; Telephone: 617-278-0055; Fax: 617-278-6906; E-mail: rboxer@partners.org
Content Gating
Gated (full article locked unless allowed per User)
In recent years, rapid response teams (RRTs) have been widely implemented to improve patient safety and quality of care. RRTs traditionally are activated by providers to address a clinically deteriorating patient; trained nurses, respiratory care specialists, and physicians are brought bedside to assist in triage and management. After the Joint Commission1 endorsed patient engagement as a strategy for enhancing patient safety, new initiatives were developed to meet the challenge. Programs designed to enhance patient engagement have taken a variety of forms, including educational campaigns encouraging patients to report adverse events, requests for handwashing by providers, and the institution of patient- and family-activated RRTs.2 Patient involvement is viewed favorably and has been shown to increase patients’ perception of health care quality.3 Although these initiatives are presumed helpful in encouraging communication, there is limited evidence that more communication leads to safety improvements. Despite the increasing prevalence of patient-activated RRTs in the United States, they have gone largely unevaluated in the adult population, and their efficacy remains unclear.
CONDITION HELP
Condition Help (CH) is a patient- and family-initiated RRT designed to prevent medical errors and communication problems and improve patient safety. Patients and families are encouraged to call the CH hotline if they believe that there has been a breakdown in care or that their health is in imminent danger. This RRT was inspired by the case of Josie King, an 18-month-old girl who died of preventable causes at a large children’s hospital.4 After her daughter’s death, Sorrel King started the Josie King Foundation, an organization committed to preventing medical errors and creating a culture of patient safety. With the support of this foundation, CH was launched in 2005 at the Children’s Hospital of Pittsburgh at the University of Pittsburgh Medical Center (UPMC). Later it was implemented at the UPMC adult tertiary-care center, and now it is available in all UPMC facilities.
On admission, patients receive a brochure that details the purpose of CH and provides examples of when and how to call the CH hotline. In this brochure, patients are instructed to call CH in 3 situations: “1) There is an emergency and you cannot get the attention of hospital staff, 2) You see a change in the patient’s condition and the health care team is not recognizing the concern, or 3) There is breakdown in how care is given or uncertainty over what needs to be done.” These instructions are printed on bulletins placed in elevators and hallways throughout the hospital. Patients and families may activate the system at any time and can even do so from home.
When a patient or family member calls the hotline, an operator notifies the CH team. This team, which consists of a patient care liaison (or an on-duty administrator) and the unit charge nurse, convenes bedside to address the patient’s concern. The team was designed without a physician to ensure that the primary team remains in charge of the care plan. CH is kept separate from our traditional RRT and does not compete for resources (personnel, equipment, time) with the RRT, which is designed to address a clinically deteriorating patient.
In this article, we describe the characteristics of patients for whom CH was activated at our adult hospital. We also describe reasons for calls, whether changes in care were implemented, and outcomes, including traditional RRT activation, transfer to intensive care unit (ICU), and inpatient mortality. As CH was designed with patient safety as a goal, we tracked 2 types of calls, those involving safety issues and those involving nonsafety issues.
METHODS
This study was approved by the quality improvement committee at the University of Pittsburgh and was considered exempt from review by the university’s Institutional Review Board.
Our integrated health system consists of more than 20 hospitals serving a tristate region. UPMC Presbyterian and UPMC Montefiore are adult tertiary-care referral hospitals with more than 750 medical/surgical beds and 150 critical care beds and more than 30,000 annual inpatient admissions. These hospitals are physically connected and function as a single large medical center. We reviewed all CH events that occurred at this combined hospital during the period January 2012 through June 2015. The dates coincided with CH data acquisition.
CH was available 24 hours a day 7 days a week. A patient care liaison (or an on-duty administrator) and the unit charge nurse responded to CH calls. Data from all calls included date and time of call, day of week, primary service, patient location, unique patient identifiers, call initiator (patient or family), whether a call led to changes in care, and primary reason for call. Each call reason was sorted into 1 of 10 categories: pain control, staff problem, lack of communication between patient/family and care team, questions about patient management, care delays, delays in a particular service, questions about discharge, administrative issues, acute psychiatric needs, and unknown/other. In addition, after a call, we reviewed all charts to determine if a safety issue was involved; Dr. Eden and Dr. Bump independently reviewed calls for safety issues and discussed any differences until they reached consensus. We also recorded outcomes, including activation of a traditional RRT or transfer to ICU within 24 hours of CH call, inpatient mortality, and against medical advice (AMA) discharges. Given that many calls were made by patients who called more than once (during a single admission or over multiple admissions), we also sorted patients into one-time callers and repeat callers for comparison. Patient satisfaction data were unavailable for review.
Patient demographic data are presented as means, standard deviations, and percentages, and call characteristics as percentages. Chi-square tests and t tests were used for analyses except for comparisons having few observations. For those, Fisher exact test was used. All analyses were performed with SAS Version 9.4 (SAS Institute, Cary, North Carolina).
RESULTS
From January 2012 through June 2015, 367 CH calls were made, about 105 annually. During this period, there were about 33,000 admissions, 800 combined grievances and complaints, 170 AMA discharges, 155 cardiac arrests, 2300 traditional RRT activations, and 1200 inpatient deaths per year. The 367 CH calls were made by 240 patients (Table 1). Of these 240 patients, 43 (18%) activated the CH team with multiple calls; their calls accounted for (46.3%) of all calls (170/367). The majority of calls were made by patients (76.8%) rather than family members (21.8%). Mean (SD) patient age was 45.8 (17.4) years. Mean (SD) number of admissions per patient per year was 2.7 (3.5). More events were activated for patients admitted to medical services (66%) than surgical services (34%). Calls were evenly distributed between time of day and day of week.
Table 1
The most common reason for CH calls was inadequate pain control (48.2%), followed by dissatisfaction with staff (12.5%); the remaining calls were evenly distributed among the other categories. The majority of calls involved nonsafety issues (83.4%) rather than safety issues (11.4%); in 5.2% of calls, the distinction could not be made because of lack of information (Table 2). In 152 (41.4%) of the 367 total calls, a change in care or alteration in management was made. Of these 152 calls, 99 (65.1%) involved distinct changes in the care plan, such as medication changes, imaging or additional testing, or consultation with other physicians; the other 53 calls (34.9%) involved additional patient counseling or nonmedical changes. Our traditional RRT was activated within 24 hours of CH in 19 cases (5.2%); of the 19 patients, 6 were transferred to ICU. Seven patients (2.9%) died during admission. Twelve (3.3%) were discharged AMA. We compared outcomes of patients who made safety-issue calls with those of patients who made nonsafety-issue calls. The composite outcome of RRT activation, ICU transfer, and mortality was found for 6 (14.3%) of the 42 safety-issue calls and 15 (4.9%) of the 306 nonsafety-issue calls (P = 0.0291).
Table 2 The unexpected high rate of repeat calling prompted us to compare the characteristics of one-time and repeat callers. Repeat callers were younger: Mean age was 39.3 (12.8) years for repeat callers and 47.2 (17.9) years for one-time callers (P = 0.0012). Repeat callers had more admissions per year: Mean (SD) number of admissions was 5.67 (5.4) for repeat callers and 2.09 (2.5) for one-time callers (P = 0.0001). One-time and repeat callers did not differ with respect to race or sex. Compared with one-time callers, repeat callers were more often (P = 0.002) admitted to medical services (74.7%) than surgical services (58.9%). For repeat callers, a larger percentage of calls (P < 0.0001) were made by patients (93.5%) rather than families (62.4%). Calls about pain were more often (P < 0.0001) made by repeat callers (62.3%) than one-time callers (36%), calls involving safety issues were less often (P < 0.0001) made by repeat callers (5.9%) than one-time callers (16.2%), and changes in care were made less often (P < 0.0001) for repeat callers (32.9%) than one-time callers (48.7%). Between-group differences in rates of RRT activation, transfer to ICU, inpatient mortality, and AMA discharges were not significant.
DISCUSSION
Patient- and family-activated RRTs provide unique opportunities for patient and family engagement during inpatient hospital stays. Our study described the results obtained with use of a well-established patient-activated RRT over several years, one of the longer observation periods reported in the literature. We found that, with use of patient-activated RRTs, patient safety issues were identified, though these were far outnumbered by nonsafety issues.
Almost half of all CH events were related to pain. Pain as the primary driver for RRT activation may be attributable to several factors, including degree of illness, poor communication about pain management expectations, positive reinforcement of narcotic-seeking behavior as a result of CH activation, and high rate of opiate use in the catchment area. A striking finding of our analysis was repeat calling; only 43 (18%) of the 240 callers were repeat callers, but they made almost half of all the calls. In some cases, during a single admission, multiple calls were made because the first had no effect on care or management; more typically, though, multiple calls were made over several admissions. Repeat callers were admitted more often per year, and they used hospital services more. They should be further studied with a goal of designing programs that better meet their needs and that prospectively address expectations of pain control.
Our study was unique in describing several outcomes related to CH events. We found that traditional RRTs were seldom activated, level of care was seldom escalated, and mortality was rare, though these outcomes occurred more often for safety-issue calls than nonsafety-issue calls. We also found that activation of CH teams often led to changes in medical management, though we could not determine whether these changes in care led to different patient outcomes.
Patient-initiated RRTs are described in a limited number of pediatric and adult studies, all with findings differing from ours. In the pediatric models, most calls were initiated by family members, were less frequent, and tended to signal higher patient acuity.5,6 For example, in a pediatric RRT model,5 family members activated the RRT only twice within the study year, but both calls resulted in ICU transfer. Most descriptions of patient-activated RRTs in adult hospitals are from pilot studies, which similarly identified infrequent RRT calls but often did not identify call reasons or specific outcomes.7 A single-center study concluded that, after implementation of a mixed-model RRT8—a traditional practitioner-activated RRT later enhanced with a patient/family activation mechanism—non-ICU codes decreased, and there was a statistically significant drop in hospital-wide mortality rates. However, this RRT was patient-activated only 25 times over 2 years, and the specific outcomes of those events were not described.
Other initiatives have been designed to enhance patient care and communication. Purposeful rounding systems9 involve hourly rounding by bedside nurses and daily rounding by nurse leaders to improve timely patient care and provide proactive service. Such systems ideally preempt calls involving dissatisfaction and nonsafety issues. Although they would reduce the number of patient-dissatisfaction calls made in the CH system, they may not be any better than the CH system is in its main purpose, identifying safety issues. In addition, whether patient-activated RRTs or purposeful rounding systems are better at addressing patient dissatisfaction is unclear.
This study had its limitations. First, like other studies, it was a single-center observational study without a concurrent control group. Second, because CH was first implemented 10 years ago, we could not compare patient outcomes or traditional RRT use before and after program initiation. Third, our study cohort consisted of patients hospitalized at one academic tertiary-care center in one region, and the hospital is a training site for multiple residencies and fellowships. These factors likely affect the generalizability of our data to smaller or community-based centers. Fourth, some determinations were subjective (eg, whether calls involved safety or nonsafety issues). We tried to minimize bias by having 2 authors independently review cases, but the process did not reflect patient experience or perspective. Fifth, our hospital adopted its traditional RRT years before its CH system. The criteria used by hospital personnel for traditional RRT activation are designed to encourage staff to call for help at early signs of patient deterioration. Consequently, traditional RRT activations substantially outnumber CH calls. Whether this resulted in fewer CH safety calls is unclear. Sixth, we did not capture the financial implications of using CH teams.
Although patient-activated RRTs identified patient safety issues, questions about the utility or necessity of these RRTs remain. In our era of limited hospital resources, the case has not been definitively made that these teams are practical, based on patient outcomes, though other studies have found improved patient satisfaction.7 Most of the RRT calls in our study involved patient dissatisfaction and communication issues. CH may not be the ideal approach for managing these issues, but it represents the last line of patient advocacy once other systems have failed.
We think patient-activated RRTs have the potential to effect patient engagement in safe care. Given the importance of establishing a culture of patient safety and engagement, and increased detection of safety-related events, CH remains active throughout our hospital system. Newer iterations of CH may benefit from stricter language in defining appropriate occasions for calling RRTs, and from descriptions of other resources for patient advocacy within the hospital. These modifications could end up restricting RRT activations to patient complaints and preserving CH resources for patients with safety concerns. Our study lays the groundwork for other institutions that are considering similar interventions. Studies should now start evaluating how well patient- and family-activated RRTs improve patient satisfaction, staff satisfaction, and patient outcomes.
CONCLUSION
Patient- and family-activated RRTs were designed to engage patients and families in safe care. Although CH detects patient safety issues, these are far outnumbered by nonsafety issues. CH demonstrates a commitment to patient engagement and a culture that emphasizes patient safety.
Acknowledgements
This work was presented as a poster at the annual meeting of the Society of Hospital Medicine; March 6-9, 2016; San Diego, CA.
Disclosure
Nothing to report.
References
1. Joint Commission. Improving America’s Hospitals: The Joint Commission’s Annual Report on Quality and Safety 2008. http://www.jointcommission.org/assets/1/6/2008_Annual_Report.pdf. Published November 2008. Accessed May 4, 2016. PubMed 2. Berger Z, Flickinger TE, Pfoh E, Martinez KA, Dy SM. Promoting engagement by patients and families to reduce adverse events in acute care settings: a systematic review. BMJ Qual Saf. 2014;23(7):548-555. PubMed 3. Weingart SN, Zhu J, Chiappetta L, et al. Hospitalized patients’ participation and its impact on quality of care and patient safety. Int J Qual Health Care. 2011;23(3):269-277. PubMed 4. Kennedy P, Pronovost P. Shepherding change: how the market, healthcare providers, and public policy can deliver quality care for the 21st century. Crit Care Med. 2006;34(3 suppl):S1-S6. PubMed 5. Ray EM, Smith R, Massie S, et al. Family alert: implementing direct family activation of a pediatric response team. Jt Comm J Qual Patient Saf. 2009;35(11):575-580. PubMed 6. Dean BS, Decker MJ, Hupp D, Urbach AH, Lewis E, Benes-Stickle J. Condition Help: a pediatric rapid response team triggered by patients and parents. J Healthc Qual. 2008;30(3):28-31. PubMed 7. Vorwerk J, King L. Consumer participation in early detection of the deteriorating patient and call activation to rapid response systems: a literature review. J Clin Nurs. 2015;25(1-2):38-52. PubMed 8. Gerdik C, Vallish RO, Miles K, Godwin SA, Wludyka PS, Panni MK. Successful implementation of a family and patient activated rapid response team in an adult level 1 trauma center. Resuscitation. 2010;81(12):1676-1681. PubMed 9. Hancock KK. From the bedside: purposeful rounding essential to patient experience. Association for Patient Experience website. http://www.patient-experience.org/Resources/Newsletter/Newsletters/Articles/2014/From-the-Bedside-Purposeful-Rounding-Essential-to.aspx. Published February 27, 2014. Accessed July 25, 2016.
In recent years, rapid response teams (RRTs) have been widely implemented to improve patient safety and quality of care. RRTs traditionally are activated by providers to address a clinically deteriorating patient; trained nurses, respiratory care specialists, and physicians are brought bedside to assist in triage and management. After the Joint Commission1 endorsed patient engagement as a strategy for enhancing patient safety, new initiatives were developed to meet the challenge. Programs designed to enhance patient engagement have taken a variety of forms, including educational campaigns encouraging patients to report adverse events, requests for handwashing by providers, and the institution of patient- and family-activated RRTs.2 Patient involvement is viewed favorably and has been shown to increase patients’ perception of health care quality.3 Although these initiatives are presumed helpful in encouraging communication, there is limited evidence that more communication leads to safety improvements. Despite the increasing prevalence of patient-activated RRTs in the United States, they have gone largely unevaluated in the adult population, and their efficacy remains unclear.
CONDITION HELP
Condition Help (CH) is a patient- and family-initiated RRT designed to prevent medical errors and communication problems and improve patient safety. Patients and families are encouraged to call the CH hotline if they believe that there has been a breakdown in care or that their health is in imminent danger. This RRT was inspired by the case of Josie King, an 18-month-old girl who died of preventable causes at a large children’s hospital.4 After her daughter’s death, Sorrel King started the Josie King Foundation, an organization committed to preventing medical errors and creating a culture of patient safety. With the support of this foundation, CH was launched in 2005 at the Children’s Hospital of Pittsburgh at the University of Pittsburgh Medical Center (UPMC). Later it was implemented at the UPMC adult tertiary-care center, and now it is available in all UPMC facilities.
On admission, patients receive a brochure that details the purpose of CH and provides examples of when and how to call the CH hotline. In this brochure, patients are instructed to call CH in 3 situations: “1) There is an emergency and you cannot get the attention of hospital staff, 2) You see a change in the patient’s condition and the health care team is not recognizing the concern, or 3) There is breakdown in how care is given or uncertainty over what needs to be done.” These instructions are printed on bulletins placed in elevators and hallways throughout the hospital. Patients and families may activate the system at any time and can even do so from home.
When a patient or family member calls the hotline, an operator notifies the CH team. This team, which consists of a patient care liaison (or an on-duty administrator) and the unit charge nurse, convenes bedside to address the patient’s concern. The team was designed without a physician to ensure that the primary team remains in charge of the care plan. CH is kept separate from our traditional RRT and does not compete for resources (personnel, equipment, time) with the RRT, which is designed to address a clinically deteriorating patient.
In this article, we describe the characteristics of patients for whom CH was activated at our adult hospital. We also describe reasons for calls, whether changes in care were implemented, and outcomes, including traditional RRT activation, transfer to intensive care unit (ICU), and inpatient mortality. As CH was designed with patient safety as a goal, we tracked 2 types of calls, those involving safety issues and those involving nonsafety issues.
METHODS
This study was approved by the quality improvement committee at the University of Pittsburgh and was considered exempt from review by the university’s Institutional Review Board.
Our integrated health system consists of more than 20 hospitals serving a tristate region. UPMC Presbyterian and UPMC Montefiore are adult tertiary-care referral hospitals with more than 750 medical/surgical beds and 150 critical care beds and more than 30,000 annual inpatient admissions. These hospitals are physically connected and function as a single large medical center. We reviewed all CH events that occurred at this combined hospital during the period January 2012 through June 2015. The dates coincided with CH data acquisition.
CH was available 24 hours a day 7 days a week. A patient care liaison (or an on-duty administrator) and the unit charge nurse responded to CH calls. Data from all calls included date and time of call, day of week, primary service, patient location, unique patient identifiers, call initiator (patient or family), whether a call led to changes in care, and primary reason for call. Each call reason was sorted into 1 of 10 categories: pain control, staff problem, lack of communication between patient/family and care team, questions about patient management, care delays, delays in a particular service, questions about discharge, administrative issues, acute psychiatric needs, and unknown/other. In addition, after a call, we reviewed all charts to determine if a safety issue was involved; Dr. Eden and Dr. Bump independently reviewed calls for safety issues and discussed any differences until they reached consensus. We also recorded outcomes, including activation of a traditional RRT or transfer to ICU within 24 hours of CH call, inpatient mortality, and against medical advice (AMA) discharges. Given that many calls were made by patients who called more than once (during a single admission or over multiple admissions), we also sorted patients into one-time callers and repeat callers for comparison. Patient satisfaction data were unavailable for review.
Patient demographic data are presented as means, standard deviations, and percentages, and call characteristics as percentages. Chi-square tests and t tests were used for analyses except for comparisons having few observations. For those, Fisher exact test was used. All analyses were performed with SAS Version 9.4 (SAS Institute, Cary, North Carolina).
RESULTS
From January 2012 through June 2015, 367 CH calls were made, about 105 annually. During this period, there were about 33,000 admissions, 800 combined grievances and complaints, 170 AMA discharges, 155 cardiac arrests, 2300 traditional RRT activations, and 1200 inpatient deaths per year. The 367 CH calls were made by 240 patients (Table 1). Of these 240 patients, 43 (18%) activated the CH team with multiple calls; their calls accounted for (46.3%) of all calls (170/367). The majority of calls were made by patients (76.8%) rather than family members (21.8%). Mean (SD) patient age was 45.8 (17.4) years. Mean (SD) number of admissions per patient per year was 2.7 (3.5). More events were activated for patients admitted to medical services (66%) than surgical services (34%). Calls were evenly distributed between time of day and day of week.
Table 1
The most common reason for CH calls was inadequate pain control (48.2%), followed by dissatisfaction with staff (12.5%); the remaining calls were evenly distributed among the other categories. The majority of calls involved nonsafety issues (83.4%) rather than safety issues (11.4%); in 5.2% of calls, the distinction could not be made because of lack of information (Table 2). In 152 (41.4%) of the 367 total calls, a change in care or alteration in management was made. Of these 152 calls, 99 (65.1%) involved distinct changes in the care plan, such as medication changes, imaging or additional testing, or consultation with other physicians; the other 53 calls (34.9%) involved additional patient counseling or nonmedical changes. Our traditional RRT was activated within 24 hours of CH in 19 cases (5.2%); of the 19 patients, 6 were transferred to ICU. Seven patients (2.9%) died during admission. Twelve (3.3%) were discharged AMA. We compared outcomes of patients who made safety-issue calls with those of patients who made nonsafety-issue calls. The composite outcome of RRT activation, ICU transfer, and mortality was found for 6 (14.3%) of the 42 safety-issue calls and 15 (4.9%) of the 306 nonsafety-issue calls (P = 0.0291).
Table 2 The unexpected high rate of repeat calling prompted us to compare the characteristics of one-time and repeat callers. Repeat callers were younger: Mean age was 39.3 (12.8) years for repeat callers and 47.2 (17.9) years for one-time callers (P = 0.0012). Repeat callers had more admissions per year: Mean (SD) number of admissions was 5.67 (5.4) for repeat callers and 2.09 (2.5) for one-time callers (P = 0.0001). One-time and repeat callers did not differ with respect to race or sex. Compared with one-time callers, repeat callers were more often (P = 0.002) admitted to medical services (74.7%) than surgical services (58.9%). For repeat callers, a larger percentage of calls (P < 0.0001) were made by patients (93.5%) rather than families (62.4%). Calls about pain were more often (P < 0.0001) made by repeat callers (62.3%) than one-time callers (36%), calls involving safety issues were less often (P < 0.0001) made by repeat callers (5.9%) than one-time callers (16.2%), and changes in care were made less often (P < 0.0001) for repeat callers (32.9%) than one-time callers (48.7%). Between-group differences in rates of RRT activation, transfer to ICU, inpatient mortality, and AMA discharges were not significant.
DISCUSSION
Patient- and family-activated RRTs provide unique opportunities for patient and family engagement during inpatient hospital stays. Our study described the results obtained with use of a well-established patient-activated RRT over several years, one of the longer observation periods reported in the literature. We found that, with use of patient-activated RRTs, patient safety issues were identified, though these were far outnumbered by nonsafety issues.
Almost half of all CH events were related to pain. Pain as the primary driver for RRT activation may be attributable to several factors, including degree of illness, poor communication about pain management expectations, positive reinforcement of narcotic-seeking behavior as a result of CH activation, and high rate of opiate use in the catchment area. A striking finding of our analysis was repeat calling; only 43 (18%) of the 240 callers were repeat callers, but they made almost half of all the calls. In some cases, during a single admission, multiple calls were made because the first had no effect on care or management; more typically, though, multiple calls were made over several admissions. Repeat callers were admitted more often per year, and they used hospital services more. They should be further studied with a goal of designing programs that better meet their needs and that prospectively address expectations of pain control.
Our study was unique in describing several outcomes related to CH events. We found that traditional RRTs were seldom activated, level of care was seldom escalated, and mortality was rare, though these outcomes occurred more often for safety-issue calls than nonsafety-issue calls. We also found that activation of CH teams often led to changes in medical management, though we could not determine whether these changes in care led to different patient outcomes.
Patient-initiated RRTs are described in a limited number of pediatric and adult studies, all with findings differing from ours. In the pediatric models, most calls were initiated by family members, were less frequent, and tended to signal higher patient acuity.5,6 For example, in a pediatric RRT model,5 family members activated the RRT only twice within the study year, but both calls resulted in ICU transfer. Most descriptions of patient-activated RRTs in adult hospitals are from pilot studies, which similarly identified infrequent RRT calls but often did not identify call reasons or specific outcomes.7 A single-center study concluded that, after implementation of a mixed-model RRT8—a traditional practitioner-activated RRT later enhanced with a patient/family activation mechanism—non-ICU codes decreased, and there was a statistically significant drop in hospital-wide mortality rates. However, this RRT was patient-activated only 25 times over 2 years, and the specific outcomes of those events were not described.
Other initiatives have been designed to enhance patient care and communication. Purposeful rounding systems9 involve hourly rounding by bedside nurses and daily rounding by nurse leaders to improve timely patient care and provide proactive service. Such systems ideally preempt calls involving dissatisfaction and nonsafety issues. Although they would reduce the number of patient-dissatisfaction calls made in the CH system, they may not be any better than the CH system is in its main purpose, identifying safety issues. In addition, whether patient-activated RRTs or purposeful rounding systems are better at addressing patient dissatisfaction is unclear.
This study had its limitations. First, like other studies, it was a single-center observational study without a concurrent control group. Second, because CH was first implemented 10 years ago, we could not compare patient outcomes or traditional RRT use before and after program initiation. Third, our study cohort consisted of patients hospitalized at one academic tertiary-care center in one region, and the hospital is a training site for multiple residencies and fellowships. These factors likely affect the generalizability of our data to smaller or community-based centers. Fourth, some determinations were subjective (eg, whether calls involved safety or nonsafety issues). We tried to minimize bias by having 2 authors independently review cases, but the process did not reflect patient experience or perspective. Fifth, our hospital adopted its traditional RRT years before its CH system. The criteria used by hospital personnel for traditional RRT activation are designed to encourage staff to call for help at early signs of patient deterioration. Consequently, traditional RRT activations substantially outnumber CH calls. Whether this resulted in fewer CH safety calls is unclear. Sixth, we did not capture the financial implications of using CH teams.
Although patient-activated RRTs identified patient safety issues, questions about the utility or necessity of these RRTs remain. In our era of limited hospital resources, the case has not been definitively made that these teams are practical, based on patient outcomes, though other studies have found improved patient satisfaction.7 Most of the RRT calls in our study involved patient dissatisfaction and communication issues. CH may not be the ideal approach for managing these issues, but it represents the last line of patient advocacy once other systems have failed.
We think patient-activated RRTs have the potential to effect patient engagement in safe care. Given the importance of establishing a culture of patient safety and engagement, and increased detection of safety-related events, CH remains active throughout our hospital system. Newer iterations of CH may benefit from stricter language in defining appropriate occasions for calling RRTs, and from descriptions of other resources for patient advocacy within the hospital. These modifications could end up restricting RRT activations to patient complaints and preserving CH resources for patients with safety concerns. Our study lays the groundwork for other institutions that are considering similar interventions. Studies should now start evaluating how well patient- and family-activated RRTs improve patient satisfaction, staff satisfaction, and patient outcomes.
CONCLUSION
Patient- and family-activated RRTs were designed to engage patients and families in safe care. Although CH detects patient safety issues, these are far outnumbered by nonsafety issues. CH demonstrates a commitment to patient engagement and a culture that emphasizes patient safety.
Acknowledgements
This work was presented as a poster at the annual meeting of the Society of Hospital Medicine; March 6-9, 2016; San Diego, CA.
Disclosure
Nothing to report.
References
1. Joint Commission. Improving America’s Hospitals: The Joint Commission’s Annual Report on Quality and Safety 2008. http://www.jointcommission.org/assets/1/6/2008_Annual_Report.pdf. Published November 2008. Accessed May 4, 2016. PubMed 2. Berger Z, Flickinger TE, Pfoh E, Martinez KA, Dy SM. Promoting engagement by patients and families to reduce adverse events in acute care settings: a systematic review. BMJ Qual Saf. 2014;23(7):548-555. PubMed 3. Weingart SN, Zhu J, Chiappetta L, et al. Hospitalized patients’ participation and its impact on quality of care and patient safety. Int J Qual Health Care. 2011;23(3):269-277. PubMed 4. Kennedy P, Pronovost P. Shepherding change: how the market, healthcare providers, and public policy can deliver quality care for the 21st century. Crit Care Med. 2006;34(3 suppl):S1-S6. PubMed 5. Ray EM, Smith R, Massie S, et al. Family alert: implementing direct family activation of a pediatric response team. Jt Comm J Qual Patient Saf. 2009;35(11):575-580. PubMed 6. Dean BS, Decker MJ, Hupp D, Urbach AH, Lewis E, Benes-Stickle J. Condition Help: a pediatric rapid response team triggered by patients and parents. J Healthc Qual. 2008;30(3):28-31. PubMed 7. Vorwerk J, King L. Consumer participation in early detection of the deteriorating patient and call activation to rapid response systems: a literature review. J Clin Nurs. 2015;25(1-2):38-52. PubMed 8. Gerdik C, Vallish RO, Miles K, Godwin SA, Wludyka PS, Panni MK. Successful implementation of a family and patient activated rapid response team in an adult level 1 trauma center. Resuscitation. 2010;81(12):1676-1681. PubMed 9. Hancock KK. From the bedside: purposeful rounding essential to patient experience. Association for Patient Experience website. http://www.patient-experience.org/Resources/Newsletter/Newsletters/Articles/2014/From-the-Bedside-Purposeful-Rounding-Essential-to.aspx. Published February 27, 2014. Accessed July 25, 2016.
Address for correspondence and reprint requests: Elizabeth L. Eden, MD, Internal Medicine Residency Program, 7th Floor, Montefiore Hospital, 200 Lothrop St, Pittsburgh PA 15213; Telephone: 412-802-6648; Fax: 412-692-4499; E-mail: edenel@upmc.edu
Content Gating
Gated (full article locked unless allowed per User)
Millions of individuals with chronic diseases are hospitalized annually in the United States. More than 90% of hospitalized adults have at least 1 chronic disease,1 and almost half of Medicare beneficiaries in the hospital have 4 or more chronic conditions.2 While many patients are admitted for worsening of a single chronic disease, patients are hospitalized more commonly for other causes. For instance, although acute heart failure is among the most frequent causes of hospitalizations among older adults, three-fourths of hospitalizations of patients with heart failure are for reasons other than acute heart failure.3
When a patient with a chronic disease is hospitalized, the inpatient provider must consider whether to actively or passively manage the chronic disease. Studies have suggested that intervening in chronic diseases during hospitalizations can lead to long-term improvement in treatment;4-6 for instance, stroke patients who were started on antihypertensive therapy at discharge were more likely to have their blood pressure controlled in the next year.5 However, some authors have argued that aggressive hypertension management by inpatient providers may result in patient harm.7 One case-based survey suggested that hospitalists were mixed in their interest in participating in chronic disease management in the hospital.8 This study found that providers were less likely to participate in chronic disease management if it was unrelated to the reason for hospitalization.8 However, to our knowledge, no studies have broadly evaluated inpatient provider attitudes, motivating factors, or barriers to participation in chronic disease management.
The purpose of this study was to understand provider attitudes towards chronic disease management for patients who are hospitalized for other causes. We were particularly interested in perceptions of barriers and facilitators to delivery of inpatient chronic disease management. Ultimately, such findings can inform future interventions to improve inpatient care of chronic disease.
METHODS
In this qualitative study, we conducted in-depth interviews with providers to understand attitudes, barriers, and facilitators towards inpatient management of chronic disease; this study was part of a larger studyto implement an electronic health record-based clinical decision-support system intervention to improve quality of care for hospitalized patients with heart failure.
We included providers who care for and can write medication orders for hospitalized adult patients at New York University (NYU) Langone Medical Center, an urban academic medical center. As patients with chronic conditions are commonly hospitalized for many reasons, we sought to interview providers from a range of clinical services without consideration of factors such as frequency of caring for patients with heart failure. We used a purposive sampling framework: we invited participants to ensure a range of services, including medicine, surgery, and neurology, and provider types, including attending physicians, resident physicians, nurse practitioners, and physician assistants. Potential participants, therefore, included all providers for adult hospitalized patients.
We identified potential participants through study team members, referrals from department heads and prior interviewees, and e-mails to department list serves. We did not formally track declinations to being interviewed, although we estimate them as fewer than 20% of providers directly approached. While we focused on inpatient providers at New York University Langone Medical Center, many of the attending physicians and residents spend a portion of their time at the Manhattan Veterans Affairs Hospital and Bellevue Hospital, a safety-net city hospital; providers could have outpatient responsibilities as well.
All participants provided verbal consent to participate. The study was approved by the New York University Institutional Review Board, which granted a waiver of documentation of consent. Participants received a $25 gift card following the interview.
We used a semi-structured interview guide (Appendix) to elicit in-depth accounts of provider attitudes, experiences with, and barriers and facilitators towards chronic disease management in the hospital. The interview began by asking about chronic disease in general and then asked more specific questions about heart failure; we included responses to both groups of questions in the current study. The interview also included questions related to the clinical decision-support system being developed as part of the larger implementation study, although we do not report on these results in the current study. The semi-structured interview guide was informed by the consolidated framework for advancing implementation science (CFIR), which offers an overarching typology for delineating factors that influence guideline implementation;9 we also used CFIR constructs in theme development. We conducted in-depth interviews with providers.
A priori, we estimated 25 interviews would be sufficient to include the purposive sample and achieve data saturation,10 which was reached after 31 interviews. Interviews were held in person or by telephone, at the convenience of the subject. All interviews were transcribed by a professional service. Transcriptions were reviewed against recordings with any mistakes corrected. Prior to each interview, we conducted a brief demographic survey.
Qualitative data were analyzed using a constant comparative analytic technique.11 The investigative team met after reviewing the first 10 interviews and discussed emergent themes from these early transcripts, which led to the initial code list. Two investigators coded the transcripts. Reliability was evaluated by independent coding of a 20% subset of interviews. Differences were reviewed and discussed until consensus was reached. Final intercoder reliability was determined to be greater than 95%.12 All investigators reviewed and refined the code list during the analysis phase. Codes were clustered into themes based on CFIR constructs.9 Analyses were performed using Atlas.ti v. 7 (ATLAS.ti Scientific Software Development GmbH, Berlin, Germany).
Table 1
RESULTS
We conducted interviews with 31 providers. Of these, 12 were on the medicine service, 12 were on the surgery or a surgical subspecialty service, and 7 were on other services; 11 were attending physicians, 12 were resident physicians, 5 were NPs, and 3 were PAs. Only 2 providers—an attending in medicine and a resident in surgery—had a specialty focus that was cardiac-related. Median time in current position was 4 years (Table 1). Seventeen of the interviews were in person, and 14 were conducted by telephone. The mean interview time was 20 minutes and ranged from 11 to 41 minutes.
Table 2
We identified 5 main themes with 29 supporting codes (Table 2) describing provider attitudes towards the management of chronic disease for hospitalized patients. These themes, with related CFIR constructs, were: 1) perceived impact on patient outcomes (CFIR construct: intervention characteristics, relative advantage); 2) hospital structural characteristics (inner setting, structural characteristics); 3) provider knowledge and self-efficacy (characteristic of individual, knowledge and beliefs about the intervention and self-efficacy); 4) hospital priorities (inner setting, implementation climate, relative priority); and 5) continuity and communication (inner setting, networks and communications). For most themes, subjects described both positive and negative aspects of chronic disease management, as well as related facilitators and barriers to delivery of chronic disease care for hospitalized patients. Illustrative quotes for each theme are shown in Table 3.
Perceived Impact on Patient Outcomes
Perceived impact on patient outcomes was mixed. Most providers believed the management of chronic diseases could lead to improvement in important patient outcomes, including decreased length of stay (LOS), prevention of hospital complication, and decreased readmissions. Surgical providers focused particularly on the benefits of preventing surgical complications and noted that they were more likely to manage chronic conditions—primarily through use of specialist consultation—when they perceived a benefit to prevention of surgical outcomes or a fear that surgery may worsen a stable chronic condition:
“Most of the surgery I do is pretty stressful on the body and is very likely to induce acute on chronic exacerbations of heart failure. For someone with Class II or higher heart failure, I’m definitely gonna have cardiology on board or at least internal medicine on board right from the beginning.”
Table 3 However, some providers acknowledged that there were potential risks to such management, including “prolonging hospital stays for nonemergent indications” and treatment with therapies that had previously led to an “adverse reaction that wasn’t clearly documented.” Providers were also concerned that treating chronic conditions may take focus away from acute conditions, which could lead to worse patient-centered outcomes. One attending in medicine described it:
“If you do potentially focus on those chronic issues, and there’s already a lot of other stuff going on with the patient, you might not be prioritizing the patient’s active issues appropriately. The patient’s saying, ‘I’m in pain. I’m in pain. I’m in pain,’ and you’re saying, ‘Thank you very much. Look, your heart failure, you didn’t get your beta-blocker.’ There could be a disconnect between patient’s goals, expectations, and your goals and expectations.”
Hospital Structural Characteristics
For many providers, the hospital setting provides a unique opportunity for care of patients with chronic disease. First, a hospitalization is a time for a patient’s management to be reviewed by a new care team. The hospital team reviews the management plan for patients at admission, which is a time to reevaluate whether patients are on evidence-based therapies: “It’s helpful to have a new set of eyes on somebody, like fresh information.” According to providers, this reevaluation can overcome instances of therapeutic inertia by the outpatient physician. Second, the hospital has many resources, including readily available specialist services and diagnostic tests, which can allow a patient-centered approach that coordinates care in 1 place, as a surgery NP described: “I think the advantage for the patient is that they wind up stopping in for 1 thing but we wind up taking care of a few without requiring the need for him or her to go to all these different specialists on the outside. They’re mostly elderly and not able to get around.” Third, the high availability of services and frequent monitoring allows rapid titration of evidence-based medicines, as discussed by a medicine resident: “It’s easier and faster to titrate medication—they’re in a monitored setting; you can ensure compliance.”
Patients may also differ from their usual state while hospitalized, creating both risks and benefits. The hospital setting can provide an opportunity to educate patients on their chronic disease(s) because they are motivated: “They’re in an office visit and their sugars are out of whack or something, they may take it a little bit more seriously if they were just in the hospital even though it was on an unrelated issue. I think it probably just changes their perspective on their disease.” However, in the hospital, patients are in an unusual environment with a restricted diet and forced medication compliance. Furthermore, the acute condition can lead to changes in their chronic disease, as described by 1 medicine attending: “their sugar is high because they’re acutely ill.” Providers expressed concern that changing medications in this setting may lead to adverse events (AEs) when patients return to their usual environment.
Provider Knowledge and Self-Efficacy
Insufficient knowledge of treatments for chronic conditions was cited as a barrier to some providers’ ability to actively manage chronic disease for hospitalized patients. Some providers described management of conditions outside their area as less satisfying than their primary focus. For example, an orthopedic surgeon explained: “…it’s very simple. You see your bone is broken, you fix it, that’s it…it’s intellectually satisfying…managing chronic diseases is less like that.” Reliance on consultants was 1 approach to deal with knowledge gaps in areas outside a provider’s expertise.
For a number of providers, management of stable chronic disease is the responsibility of the outpatient provider. Providers expressed concern that inpatient management was a reach into the domain of the primary care provider (PCP) and might take “away from the primary focus” of the hospitalization. Nonetheless, some providers noted an “ethical responsibility to manage [a] patient correctly,” and some providers believed that engaging in chronic disease management in the hospital would present an opportunity to expand their own expertise.
A few providers were worried about legal risk related to chronic disease management: “we don’t typically deal too much with managing some of these other medical issues for medical and legal reasons.” Providers again suggested that consults can help overcome this concern for risk, as discussed by 1 surgical attending: “We’re all not wanting to be sued, and we want to do the right thing. It costs me nothing to have a cardiologist on board, so like—why not.”
Hospital Priorities
Providers explained that the hospital has strong interests in early discharge and minimizing LOS. These priorities are based on goals of improving patient outcomes, increasing bed availability and hospital volume, and reducing costs. Providers perceive these hospital priorities as potential barriers to chronic disease management, which can increase LOS and costs through additional testing and treatment. As a medicine resident described: “The DBN philosophy, ‘discharge before noon’ philosophy, which is part of the hospital efficiency to get people in and out of the hospital as quickly as [is] safe, or maybe faster. And I think that there’s a culture where you’re encouraged to only focus on the acute issue and tend to defer everything else.”
Continuity and Communication
According to many providers, care continuity between the outpatient setting and the hospital played a major role in management of chronic disease. One barrier to starting a new evidence-based medication was lack of knowledge of patient history. As noted, providers expressed concern that a patient may not be on a given therapy because of an adverse reaction that was not documented in the hospital chart. This is particularly true because, as discussed by a surgery resident, patients with “PCPs outside the system [in which providers] don’t have access to the electronic medical record.” To overcome this barrier, providers attempt to communicate with the outpatient provider to confirm a lack of contraindications to therapies prior to any changes; notably, communication is easier if the inpatient provider has a relationship with the outpatient PCP.
Some providers were more likely to start chronic disease therapies if the patient had no prior outpatient care, because the provider was reassured that there was no rationale for missing therapies. One neurology attending noted that if a patient had newly documented “hypertension even if they were in for something else, I might start them on an antihypertensive, but then arrange for a close follow-up with a new PCP.”
Following hospitalization, providers wanted assurance that any changes to chronic disease management would be followed up by an outpatient physician. Any changes are relayed to the outpatient provider and the “level of communication…with the outpatient provider who’s gonna inherit” these changes can influence how aggressively the inpatient provider manages chronic diseases. Providers may be reluctant to start therapy for patients if they are concerned about outpatient follow up: “they have diabetes and they should really technically be on an ACE [angiotensin converting enzyme]inhibitor and aspirin, but they’re not. I might send them out on the aspirin but I might either start ACE inhibitor and have them follow up with their PCP in 2 weeks if I’m confident that they’ll do it or if I’m really confident that they’ll not follow up, I will help them get the appointment and then the discharge instruction is to the PCP is ‘Please start this patient on ACE inhibitor if they show up.’”
DISCUSSION
Providers frequently perceive benefit to chronic disease management in the hospital, including improvements in clinical outcomes. Notably, providers see opportunities to improve compliance with evidence-based care to overcome potential barriers to managing chronic disease in the outpatient setting, which can be limited by pressure for brief encounters,13 clinical inertia,14 difficulty with close monitoring of patients,15 and care fragmentation.16 Concurrently, inpatient providers are concerned about potential for patient harm related to chronic disease management, primarily related to AEs from medications. Similar to a case study about a patient with outpatient hypotension following aggressive inpatient hypertension management,7 providers fear that changing a patient’s chronic disease management in a hospital setting may cause harm when the patient returns home.
Although some clinicians have argued against aggressive in-hospital chronic disease management because of concerns for risk of AEs,7 our study and others8 have suggested that many clinicians perceive benefit. In some cases, such as smoking cessation counseling for all current smokers and prescribing an angiotensin converting enzyme inhibitor for patients with systolic heart failure, the perceived importance is so great that chronic disease management has been used as a national quality metric for hospitals. While these hospital metrics may be justified for short-term benefits after hospitalization, studies have demonstrated only weak improvement in short-term postdischarge outcomes related to chronic disease management.17 The true benefit is likely from improved processes of care in the short term that lead to long-term improvement in outcomes.4,5,18 Thus, the advantage of starting a patient hospitalized for a stroke on blood pressure medication is the increased likelihood that the patient will continue the medication as an outpatient, which may reduce long-term mortality.
For hospital delivery systems that are concerned with such care process improvement through in-hospital chronic disease management, we identified a number of barriers and facilitators to delivering this care. One significant barrier was poor transitions between the inpatient and the outpatient settings. When a patient transitions into the hospital, providers need to understand prior management choices. Facilitators to help inpatient providers understand prior management included either knowing the outpatient provider, or understanding that there was a lack of regular outpatient care; in both these cases, inpatient providers felt more comfortable managing chronic diseases because they had insight into the outpatient plan, or lack thereof. However, these facilitators may not be practical to incorporate in interventions to improve chronic disease care, which should consider overcoming these communication barriers. Use of shared electronic health records or standardized telephone calls with well-documented care plans obtained through health information exchanges may facilitate an inpatient provider to manage appropriately chronic disease. Similarly, discontinuity between the inpatient provider and the outpatient provider is a barrier that must be overcome to ease concerns that any chronic disease management changes do not result in harm in the postdischarge period. These findings again point to the need for improved documentation and communication between inpatient and outpatient providers. Of course, the transitional care period is one of high risk, and improving communication between providers has been an area of ongoing work.19
Lack of comfort among inpatient providers with managing chronic diseases is another important barrier, which appears to be largely overcome through the use of consultation services. Ready availability of specialists, common in academic medical centers, can facilitate delivery of chronic disease management. Inpatient interventions designed to improve evidence-based care for a chronic disease may benefit from involvement or at least availability of specialists in the effort. Another major barrier relates to hospital priorities, which in our study were closely aligned with external factors such as payment models. As hospitalizations are typically paid based on the discharge diagnosis, hospitals have incentives to discharge quickly and not order extra diagnostic tests. As a result, there are disincentives for chronic disease management that may require additional testing or monitoring in the hospital. Conversely, as hospitals accept postdischarge financial risks through readmission penalties or postdischarge cost savings, hospitals may perceive that long-term benefits of chronic disease management may outweigh short-term costs.
The study findings should be interpreted in the context of its limitations. Findings of our study of providers from a single academic medical center may not be generalizable. Nearly half of our interviews were conducted by telephone, which limits our ability to capture nonverbal cues in communication. Providers may have had social desirability bias towards positive aspects of chronic disease management. We did not have the power to determine differences in response by provider characteristic because this was an exploratory qualitative study. Future studies with representative sampling, a larger sample size, and measures for constructs such as provider self-efficacy are needed to examine differences by specialty, provider type, and experience level.
In conclusion, inpatient providers believe that hospital chronic disease management has the potential to be beneficial for both process of care and clinical outcomes; providers also express concern about potential adverse consequences of managing chronic disease during acute hospitalizations. To maximize both quality of care and patient safety, overcoming communication barriers between inpatient and outpatient providers is needed. Both a supportive hospital environment and availability of specialty support can facilitate in-hospital chronic disease management. Interventions that incorporate these factors may be well-suited to improve chronic disease care and long-term outcomes.
Disclosures
This work was supported by the Agency for Healthcare Research and Quality (AHRQ) grant K08HS23683. The authors report no financial conflicts of interest.
1. Friedman B, Jiang HJ, Elixhauser A, Segal A. Hospital inpatient costs for adults with multiple chronic conditions. Med Care Res Rev. 2006;63(3):327-346. PubMed 2. Steiner CA, Friedman B. Hospital utilization, costs, and mortality for adults with multiple chronic conditions, Nationwide Inpatient Sample, 2009. Prev Chronic Dis. 2013;10:E62. PubMed 3. Blecker S, Paul M, Taksler G, Ogedegbe G, Katz S. Heart failure-associated hospitalizations in the United States. J Am Coll Cardiol. 2013;61(12):1259-1267. PubMed 4. Fonarow GC. Role of in-hospital initiation of carvedilol to improve treatment rates and clinical outcomes. Am J Cardiol. 2004;93(9A):77B-81B. PubMed 5. Touze E, Coste J, Voicu M, et al. Importance of in-hospital initiation of therapies and therapeutic inertia in secondary stroke prevention: IMplementation of Prevention After a Cerebrovascular evenT (IMPACT) Study. Stroke. 2008;39(6):1834-1843. PubMed 6. Ovbiagele B, Saver JL, Fredieu A, et al. In-hospital initiation of secondary stroke prevention therapies yields high rates of adherence at follow-up. Stroke. 2004;35(12):2879-2883. PubMed 7. Steinman MA, Auerbach AD. Managing chronic disease in hospitalized patients. JAMA Intern Med. 2013;173(20):1857-1858. PubMed 8. Breu AC, Allen-Dicker J, Mueller S, Palamara K, Hinami K, Herzig SJ. Hospitalist and primary care physician perspectives on medication management of chronic conditions for hospitalized patients. J Hosp Med. 2014;9(5):303-309. PubMed 9. Damschroder LJ, Aron DC, Keith RE, Kirsh SR, Alexander JA, Lowery JC. Fostering implementation of health services research findings into practice: a consolidated framework for advancing implementation science. Implement Sci. 2009;4:50. PubMed 10. Morse JM. The significance of saturation. Qualitative Health Research. 1995;5(2):147-149. 11. Bradley EH, Curry LA, Devers KJ. Qualitative data analysis for health services research: developing taxonomy, themes, and theory. Health Services Research. 2007;42(4):1758-1772. PubMed 12. Riegel B, Dickson VV, Topaz M. Qualitative analysis of naturalistic decision making in adults with chronic heart failure. Nurs Res. 2013;62(2):91-98. PubMed 13. Linzer M, Konrad TR, Douglas J, et al. Managed care, time pressure, and physician job satisfaction: results from the physician worklife study. J Gen Intern Med. 2000;15(7):441-450. PubMed 14. Phillips LS, Branch WT, Cook CB, et al. Clinical inertia. Ann Intern Med. 2001;135(9):825-834. 15. Dev S, Hoffman TK, Kavalieratos D, et al. Barriers to adoption of mineralocorticoid receptor antagonists in patients with heart failure: A mixed-methods study. J Am Heart Assoc. 2016;4(3):e002493. PubMed 16. Stange KC. The problem of fragmentation and the need for integrative solutions. Ann Fam Med. 2009;7(2):100-103. PubMed 17. Fonarow GC, Abraham WT, Albert NM, et al. Association between performance measures and clinical outcomes for patients hospitalized with heart failure. JAMA. 2007;297(1):61-70. PubMed 18. Shah M, Norwood CA, Farias S, Ibrahim S, Chong PH, Fogelfeld L. Diabetes transitional care from inpatient to outpatient setting: pharmacist discharge counseling. J Pharm Pract. 2013;26(2):120-124. PubMed 19. Kripalani S, LeFevre F, Phillips CO, Williams MV, Basaviah P, Baker DW. Deficits in communication and information transfer between hospital-based and primary care physicians: implications for patient safety and continuity of care. JAMA. 2007;297(8):831-841. PubMed
Millions of individuals with chronic diseases are hospitalized annually in the United States. More than 90% of hospitalized adults have at least 1 chronic disease,1 and almost half of Medicare beneficiaries in the hospital have 4 or more chronic conditions.2 While many patients are admitted for worsening of a single chronic disease, patients are hospitalized more commonly for other causes. For instance, although acute heart failure is among the most frequent causes of hospitalizations among older adults, three-fourths of hospitalizations of patients with heart failure are for reasons other than acute heart failure.3
When a patient with a chronic disease is hospitalized, the inpatient provider must consider whether to actively or passively manage the chronic disease. Studies have suggested that intervening in chronic diseases during hospitalizations can lead to long-term improvement in treatment;4-6 for instance, stroke patients who were started on antihypertensive therapy at discharge were more likely to have their blood pressure controlled in the next year.5 However, some authors have argued that aggressive hypertension management by inpatient providers may result in patient harm.7 One case-based survey suggested that hospitalists were mixed in their interest in participating in chronic disease management in the hospital.8 This study found that providers were less likely to participate in chronic disease management if it was unrelated to the reason for hospitalization.8 However, to our knowledge, no studies have broadly evaluated inpatient provider attitudes, motivating factors, or barriers to participation in chronic disease management.
The purpose of this study was to understand provider attitudes towards chronic disease management for patients who are hospitalized for other causes. We were particularly interested in perceptions of barriers and facilitators to delivery of inpatient chronic disease management. Ultimately, such findings can inform future interventions to improve inpatient care of chronic disease.
METHODS
In this qualitative study, we conducted in-depth interviews with providers to understand attitudes, barriers, and facilitators towards inpatient management of chronic disease; this study was part of a larger studyto implement an electronic health record-based clinical decision-support system intervention to improve quality of care for hospitalized patients with heart failure.
We included providers who care for and can write medication orders for hospitalized adult patients at New York University (NYU) Langone Medical Center, an urban academic medical center. As patients with chronic conditions are commonly hospitalized for many reasons, we sought to interview providers from a range of clinical services without consideration of factors such as frequency of caring for patients with heart failure. We used a purposive sampling framework: we invited participants to ensure a range of services, including medicine, surgery, and neurology, and provider types, including attending physicians, resident physicians, nurse practitioners, and physician assistants. Potential participants, therefore, included all providers for adult hospitalized patients.
We identified potential participants through study team members, referrals from department heads and prior interviewees, and e-mails to department list serves. We did not formally track declinations to being interviewed, although we estimate them as fewer than 20% of providers directly approached. While we focused on inpatient providers at New York University Langone Medical Center, many of the attending physicians and residents spend a portion of their time at the Manhattan Veterans Affairs Hospital and Bellevue Hospital, a safety-net city hospital; providers could have outpatient responsibilities as well.
All participants provided verbal consent to participate. The study was approved by the New York University Institutional Review Board, which granted a waiver of documentation of consent. Participants received a $25 gift card following the interview.
We used a semi-structured interview guide (Appendix) to elicit in-depth accounts of provider attitudes, experiences with, and barriers and facilitators towards chronic disease management in the hospital. The interview began by asking about chronic disease in general and then asked more specific questions about heart failure; we included responses to both groups of questions in the current study. The interview also included questions related to the clinical decision-support system being developed as part of the larger implementation study, although we do not report on these results in the current study. The semi-structured interview guide was informed by the consolidated framework for advancing implementation science (CFIR), which offers an overarching typology for delineating factors that influence guideline implementation;9 we also used CFIR constructs in theme development. We conducted in-depth interviews with providers.
A priori, we estimated 25 interviews would be sufficient to include the purposive sample and achieve data saturation,10 which was reached after 31 interviews. Interviews were held in person or by telephone, at the convenience of the subject. All interviews were transcribed by a professional service. Transcriptions were reviewed against recordings with any mistakes corrected. Prior to each interview, we conducted a brief demographic survey.
Qualitative data were analyzed using a constant comparative analytic technique.11 The investigative team met after reviewing the first 10 interviews and discussed emergent themes from these early transcripts, which led to the initial code list. Two investigators coded the transcripts. Reliability was evaluated by independent coding of a 20% subset of interviews. Differences were reviewed and discussed until consensus was reached. Final intercoder reliability was determined to be greater than 95%.12 All investigators reviewed and refined the code list during the analysis phase. Codes were clustered into themes based on CFIR constructs.9 Analyses were performed using Atlas.ti v. 7 (ATLAS.ti Scientific Software Development GmbH, Berlin, Germany).
Table 1
RESULTS
We conducted interviews with 31 providers. Of these, 12 were on the medicine service, 12 were on the surgery or a surgical subspecialty service, and 7 were on other services; 11 were attending physicians, 12 were resident physicians, 5 were NPs, and 3 were PAs. Only 2 providers—an attending in medicine and a resident in surgery—had a specialty focus that was cardiac-related. Median time in current position was 4 years (Table 1). Seventeen of the interviews were in person, and 14 were conducted by telephone. The mean interview time was 20 minutes and ranged from 11 to 41 minutes.
Table 2
We identified 5 main themes with 29 supporting codes (Table 2) describing provider attitudes towards the management of chronic disease for hospitalized patients. These themes, with related CFIR constructs, were: 1) perceived impact on patient outcomes (CFIR construct: intervention characteristics, relative advantage); 2) hospital structural characteristics (inner setting, structural characteristics); 3) provider knowledge and self-efficacy (characteristic of individual, knowledge and beliefs about the intervention and self-efficacy); 4) hospital priorities (inner setting, implementation climate, relative priority); and 5) continuity and communication (inner setting, networks and communications). For most themes, subjects described both positive and negative aspects of chronic disease management, as well as related facilitators and barriers to delivery of chronic disease care for hospitalized patients. Illustrative quotes for each theme are shown in Table 3.
Perceived Impact on Patient Outcomes
Perceived impact on patient outcomes was mixed. Most providers believed the management of chronic diseases could lead to improvement in important patient outcomes, including decreased length of stay (LOS), prevention of hospital complication, and decreased readmissions. Surgical providers focused particularly on the benefits of preventing surgical complications and noted that they were more likely to manage chronic conditions—primarily through use of specialist consultation—when they perceived a benefit to prevention of surgical outcomes or a fear that surgery may worsen a stable chronic condition:
“Most of the surgery I do is pretty stressful on the body and is very likely to induce acute on chronic exacerbations of heart failure. For someone with Class II or higher heart failure, I’m definitely gonna have cardiology on board or at least internal medicine on board right from the beginning.”
Table 3 However, some providers acknowledged that there were potential risks to such management, including “prolonging hospital stays for nonemergent indications” and treatment with therapies that had previously led to an “adverse reaction that wasn’t clearly documented.” Providers were also concerned that treating chronic conditions may take focus away from acute conditions, which could lead to worse patient-centered outcomes. One attending in medicine described it:
“If you do potentially focus on those chronic issues, and there’s already a lot of other stuff going on with the patient, you might not be prioritizing the patient’s active issues appropriately. The patient’s saying, ‘I’m in pain. I’m in pain. I’m in pain,’ and you’re saying, ‘Thank you very much. Look, your heart failure, you didn’t get your beta-blocker.’ There could be a disconnect between patient’s goals, expectations, and your goals and expectations.”
Hospital Structural Characteristics
For many providers, the hospital setting provides a unique opportunity for care of patients with chronic disease. First, a hospitalization is a time for a patient’s management to be reviewed by a new care team. The hospital team reviews the management plan for patients at admission, which is a time to reevaluate whether patients are on evidence-based therapies: “It’s helpful to have a new set of eyes on somebody, like fresh information.” According to providers, this reevaluation can overcome instances of therapeutic inertia by the outpatient physician. Second, the hospital has many resources, including readily available specialist services and diagnostic tests, which can allow a patient-centered approach that coordinates care in 1 place, as a surgery NP described: “I think the advantage for the patient is that they wind up stopping in for 1 thing but we wind up taking care of a few without requiring the need for him or her to go to all these different specialists on the outside. They’re mostly elderly and not able to get around.” Third, the high availability of services and frequent monitoring allows rapid titration of evidence-based medicines, as discussed by a medicine resident: “It’s easier and faster to titrate medication—they’re in a monitored setting; you can ensure compliance.”
Patients may also differ from their usual state while hospitalized, creating both risks and benefits. The hospital setting can provide an opportunity to educate patients on their chronic disease(s) because they are motivated: “They’re in an office visit and their sugars are out of whack or something, they may take it a little bit more seriously if they were just in the hospital even though it was on an unrelated issue. I think it probably just changes their perspective on their disease.” However, in the hospital, patients are in an unusual environment with a restricted diet and forced medication compliance. Furthermore, the acute condition can lead to changes in their chronic disease, as described by 1 medicine attending: “their sugar is high because they’re acutely ill.” Providers expressed concern that changing medications in this setting may lead to adverse events (AEs) when patients return to their usual environment.
Provider Knowledge and Self-Efficacy
Insufficient knowledge of treatments for chronic conditions was cited as a barrier to some providers’ ability to actively manage chronic disease for hospitalized patients. Some providers described management of conditions outside their area as less satisfying than their primary focus. For example, an orthopedic surgeon explained: “…it’s very simple. You see your bone is broken, you fix it, that’s it…it’s intellectually satisfying…managing chronic diseases is less like that.” Reliance on consultants was 1 approach to deal with knowledge gaps in areas outside a provider’s expertise.
For a number of providers, management of stable chronic disease is the responsibility of the outpatient provider. Providers expressed concern that inpatient management was a reach into the domain of the primary care provider (PCP) and might take “away from the primary focus” of the hospitalization. Nonetheless, some providers noted an “ethical responsibility to manage [a] patient correctly,” and some providers believed that engaging in chronic disease management in the hospital would present an opportunity to expand their own expertise.
A few providers were worried about legal risk related to chronic disease management: “we don’t typically deal too much with managing some of these other medical issues for medical and legal reasons.” Providers again suggested that consults can help overcome this concern for risk, as discussed by 1 surgical attending: “We’re all not wanting to be sued, and we want to do the right thing. It costs me nothing to have a cardiologist on board, so like—why not.”
Hospital Priorities
Providers explained that the hospital has strong interests in early discharge and minimizing LOS. These priorities are based on goals of improving patient outcomes, increasing bed availability and hospital volume, and reducing costs. Providers perceive these hospital priorities as potential barriers to chronic disease management, which can increase LOS and costs through additional testing and treatment. As a medicine resident described: “The DBN philosophy, ‘discharge before noon’ philosophy, which is part of the hospital efficiency to get people in and out of the hospital as quickly as [is] safe, or maybe faster. And I think that there’s a culture where you’re encouraged to only focus on the acute issue and tend to defer everything else.”
Continuity and Communication
According to many providers, care continuity between the outpatient setting and the hospital played a major role in management of chronic disease. One barrier to starting a new evidence-based medication was lack of knowledge of patient history. As noted, providers expressed concern that a patient may not be on a given therapy because of an adverse reaction that was not documented in the hospital chart. This is particularly true because, as discussed by a surgery resident, patients with “PCPs outside the system [in which providers] don’t have access to the electronic medical record.” To overcome this barrier, providers attempt to communicate with the outpatient provider to confirm a lack of contraindications to therapies prior to any changes; notably, communication is easier if the inpatient provider has a relationship with the outpatient PCP.
Some providers were more likely to start chronic disease therapies if the patient had no prior outpatient care, because the provider was reassured that there was no rationale for missing therapies. One neurology attending noted that if a patient had newly documented “hypertension even if they were in for something else, I might start them on an antihypertensive, but then arrange for a close follow-up with a new PCP.”
Following hospitalization, providers wanted assurance that any changes to chronic disease management would be followed up by an outpatient physician. Any changes are relayed to the outpatient provider and the “level of communication…with the outpatient provider who’s gonna inherit” these changes can influence how aggressively the inpatient provider manages chronic diseases. Providers may be reluctant to start therapy for patients if they are concerned about outpatient follow up: “they have diabetes and they should really technically be on an ACE [angiotensin converting enzyme]inhibitor and aspirin, but they’re not. I might send them out on the aspirin but I might either start ACE inhibitor and have them follow up with their PCP in 2 weeks if I’m confident that they’ll do it or if I’m really confident that they’ll not follow up, I will help them get the appointment and then the discharge instruction is to the PCP is ‘Please start this patient on ACE inhibitor if they show up.’”
DISCUSSION
Providers frequently perceive benefit to chronic disease management in the hospital, including improvements in clinical outcomes. Notably, providers see opportunities to improve compliance with evidence-based care to overcome potential barriers to managing chronic disease in the outpatient setting, which can be limited by pressure for brief encounters,13 clinical inertia,14 difficulty with close monitoring of patients,15 and care fragmentation.16 Concurrently, inpatient providers are concerned about potential for patient harm related to chronic disease management, primarily related to AEs from medications. Similar to a case study about a patient with outpatient hypotension following aggressive inpatient hypertension management,7 providers fear that changing a patient’s chronic disease management in a hospital setting may cause harm when the patient returns home.
Although some clinicians have argued against aggressive in-hospital chronic disease management because of concerns for risk of AEs,7 our study and others8 have suggested that many clinicians perceive benefit. In some cases, such as smoking cessation counseling for all current smokers and prescribing an angiotensin converting enzyme inhibitor for patients with systolic heart failure, the perceived importance is so great that chronic disease management has been used as a national quality metric for hospitals. While these hospital metrics may be justified for short-term benefits after hospitalization, studies have demonstrated only weak improvement in short-term postdischarge outcomes related to chronic disease management.17 The true benefit is likely from improved processes of care in the short term that lead to long-term improvement in outcomes.4,5,18 Thus, the advantage of starting a patient hospitalized for a stroke on blood pressure medication is the increased likelihood that the patient will continue the medication as an outpatient, which may reduce long-term mortality.
For hospital delivery systems that are concerned with such care process improvement through in-hospital chronic disease management, we identified a number of barriers and facilitators to delivering this care. One significant barrier was poor transitions between the inpatient and the outpatient settings. When a patient transitions into the hospital, providers need to understand prior management choices. Facilitators to help inpatient providers understand prior management included either knowing the outpatient provider, or understanding that there was a lack of regular outpatient care; in both these cases, inpatient providers felt more comfortable managing chronic diseases because they had insight into the outpatient plan, or lack thereof. However, these facilitators may not be practical to incorporate in interventions to improve chronic disease care, which should consider overcoming these communication barriers. Use of shared electronic health records or standardized telephone calls with well-documented care plans obtained through health information exchanges may facilitate an inpatient provider to manage appropriately chronic disease. Similarly, discontinuity between the inpatient provider and the outpatient provider is a barrier that must be overcome to ease concerns that any chronic disease management changes do not result in harm in the postdischarge period. These findings again point to the need for improved documentation and communication between inpatient and outpatient providers. Of course, the transitional care period is one of high risk, and improving communication between providers has been an area of ongoing work.19
Lack of comfort among inpatient providers with managing chronic diseases is another important barrier, which appears to be largely overcome through the use of consultation services. Ready availability of specialists, common in academic medical centers, can facilitate delivery of chronic disease management. Inpatient interventions designed to improve evidence-based care for a chronic disease may benefit from involvement or at least availability of specialists in the effort. Another major barrier relates to hospital priorities, which in our study were closely aligned with external factors such as payment models. As hospitalizations are typically paid based on the discharge diagnosis, hospitals have incentives to discharge quickly and not order extra diagnostic tests. As a result, there are disincentives for chronic disease management that may require additional testing or monitoring in the hospital. Conversely, as hospitals accept postdischarge financial risks through readmission penalties or postdischarge cost savings, hospitals may perceive that long-term benefits of chronic disease management may outweigh short-term costs.
The study findings should be interpreted in the context of its limitations. Findings of our study of providers from a single academic medical center may not be generalizable. Nearly half of our interviews were conducted by telephone, which limits our ability to capture nonverbal cues in communication. Providers may have had social desirability bias towards positive aspects of chronic disease management. We did not have the power to determine differences in response by provider characteristic because this was an exploratory qualitative study. Future studies with representative sampling, a larger sample size, and measures for constructs such as provider self-efficacy are needed to examine differences by specialty, provider type, and experience level.
In conclusion, inpatient providers believe that hospital chronic disease management has the potential to be beneficial for both process of care and clinical outcomes; providers also express concern about potential adverse consequences of managing chronic disease during acute hospitalizations. To maximize both quality of care and patient safety, overcoming communication barriers between inpatient and outpatient providers is needed. Both a supportive hospital environment and availability of specialty support can facilitate in-hospital chronic disease management. Interventions that incorporate these factors may be well-suited to improve chronic disease care and long-term outcomes.
Disclosures
This work was supported by the Agency for Healthcare Research and Quality (AHRQ) grant K08HS23683. The authors report no financial conflicts of interest.
References
1. Friedman B, Jiang HJ, Elixhauser A, Segal A. Hospital inpatient costs for adults with multiple chronic conditions. Med Care Res Rev. 2006;63(3):327-346. PubMed 2. Steiner CA, Friedman B. Hospital utilization, costs, and mortality for adults with multiple chronic conditions, Nationwide Inpatient Sample, 2009. Prev Chronic Dis. 2013;10:E62. PubMed 3. Blecker S, Paul M, Taksler G, Ogedegbe G, Katz S. Heart failure-associated hospitalizations in the United States. J Am Coll Cardiol. 2013;61(12):1259-1267. PubMed 4. Fonarow GC. Role of in-hospital initiation of carvedilol to improve treatment rates and clinical outcomes. Am J Cardiol. 2004;93(9A):77B-81B. PubMed 5. Touze E, Coste J, Voicu M, et al. Importance of in-hospital initiation of therapies and therapeutic inertia in secondary stroke prevention: IMplementation of Prevention After a Cerebrovascular evenT (IMPACT) Study. Stroke. 2008;39(6):1834-1843. PubMed 6. Ovbiagele B, Saver JL, Fredieu A, et al. In-hospital initiation of secondary stroke prevention therapies yields high rates of adherence at follow-up. Stroke. 2004;35(12):2879-2883. PubMed 7. Steinman MA, Auerbach AD. Managing chronic disease in hospitalized patients. JAMA Intern Med. 2013;173(20):1857-1858. PubMed 8. Breu AC, Allen-Dicker J, Mueller S, Palamara K, Hinami K, Herzig SJ. Hospitalist and primary care physician perspectives on medication management of chronic conditions for hospitalized patients. J Hosp Med. 2014;9(5):303-309. PubMed 9. Damschroder LJ, Aron DC, Keith RE, Kirsh SR, Alexander JA, Lowery JC. Fostering implementation of health services research findings into practice: a consolidated framework for advancing implementation science. Implement Sci. 2009;4:50. PubMed 10. Morse JM. The significance of saturation. Qualitative Health Research. 1995;5(2):147-149. 11. Bradley EH, Curry LA, Devers KJ. Qualitative data analysis for health services research: developing taxonomy, themes, and theory. Health Services Research. 2007;42(4):1758-1772. PubMed 12. Riegel B, Dickson VV, Topaz M. Qualitative analysis of naturalistic decision making in adults with chronic heart failure. Nurs Res. 2013;62(2):91-98. PubMed 13. Linzer M, Konrad TR, Douglas J, et al. Managed care, time pressure, and physician job satisfaction: results from the physician worklife study. J Gen Intern Med. 2000;15(7):441-450. PubMed 14. Phillips LS, Branch WT, Cook CB, et al. Clinical inertia. Ann Intern Med. 2001;135(9):825-834. 15. Dev S, Hoffman TK, Kavalieratos D, et al. Barriers to adoption of mineralocorticoid receptor antagonists in patients with heart failure: A mixed-methods study. J Am Heart Assoc. 2016;4(3):e002493. PubMed 16. Stange KC. The problem of fragmentation and the need for integrative solutions. Ann Fam Med. 2009;7(2):100-103. PubMed 17. Fonarow GC, Abraham WT, Albert NM, et al. Association between performance measures and clinical outcomes for patients hospitalized with heart failure. JAMA. 2007;297(1):61-70. PubMed 18. Shah M, Norwood CA, Farias S, Ibrahim S, Chong PH, Fogelfeld L. Diabetes transitional care from inpatient to outpatient setting: pharmacist discharge counseling. J Pharm Pract. 2013;26(2):120-124. PubMed 19. Kripalani S, LeFevre F, Phillips CO, Williams MV, Basaviah P, Baker DW. Deficits in communication and information transfer between hospital-based and primary care physicians: implications for patient safety and continuity of care. JAMA. 2007;297(8):831-841. PubMed
Address for correspondence and reprint requests: Saul Blecker, MD, MHS, New York University School of Medicine, 227 E. 30th St., Room 648, New York, NY 10016; Telephone: 646-501-2513; Fax: 646-501-2706; E-mail: saul.blecker@nyumc.org
Content Gating
Open Access (article Unlocked/Open Access)
Alternative CME
Consolidated Pubs: Do Not Show Source Publication Logo
As the US population ages and becomes increasingly frail, the need for rehabilitation rises. By 2030, an estimated 20% of the population will be 65 years old or older, and almost 10% will be over 75.1 About 20% of hospitalized Medicare patients receive subsequent care in postacute inpatient rehabilitation (PAIR) facilities, accounting for $31 billion in Medicare expenditures in 2014.2 Although the need for rehabilitation will continue to rise, Medicare policy restricts access to it.
Under Medicare policy, PAIR services are covered for certain hospitalized patients but not others. Hospitalized patients are either inpatients, who are billed under Medicare Part A, or outpatients, billed under Part B. When hospital length of stay (LOS) is anticipated to be less than 2 midnights, patients are admitted as outpatients under the term observation status; when longer stays are expected, patients are admitted as inpatients.3 This recently implemented time-based distinction has been criticized as arbitrary, and as potentially shifting many patients from inpatient to outpatient (observation) status.4
The distinction between inpatient and observation status has significant consequences for posthospital care. Medicare Part A covers care in skilled nursing facilities (SNFs) and acute inpatient rehabilitation facilities (IRFs); after hospitalization, inpatients have access to either, without copay. As observation patients are covered under Medicare Part B, they are technically not covered for either service after their hospital stay. IRFs sometimes accept patients from ambulatory and nonacute settings; observation patients may be accepted in rare circumstances, but they pay the Part A deductible ($1288 in 2016) to have the services covered by Medicare. SNF services are never covered for observation patients, and access to this care requires an average out-of-pocket payment of more than $10,503 per beneficiary for a typical SNF stay.5 Given that about 70% of Medicare patients fall below 300% of the federal poverty line,6 the out-of-pocket costs for PAIR services for observation patients can be prohibitive.
Although only 0.75% of community-dwelling Medicare observation patients are discharged to PAIR facilities,7 it is unclear if the need for this care is higher but remains unmet secondary to cost concerns of Medicare beneficiaries. Also unclear is whether observation patients who would benefit from this care but do not receive it end up with poorer health outcomes and therefore use more healthcare services.
The purpose of this study was to estimate the proportion of Medicare observation patients who are admitted from home and receive a recommendation for placement in a PAIR facility, and to determine the ultimate disposition of such patients. We also sought to evaluate the association between recommendation for PAIR placement, LOS, and 30-day hospital revisit rate.
METHODS
The Institutional Review Board of Christiana Care Health System (CCHS) approved this study.
Sample and Design
This was an observational study of community-dwelling Medicare patients admitted under observation status to Delaware’s CCHS, which consists of a 907-bed regional tertiary-care facility in Newark and a 241-bed community hospital in Wilmington. The study period was January 1 to December 31, 2013. We limited our sample to patients treated by hospitalists on hospital wards, as this care constitutes 80% of the care provided to observation patients at CCHS and the majority of care nationally.8 As neither SNF care nor IRF care is covered under Medicare Part B, and both would result in high out-of-pocket costs for Medicare observation patients, we combined them into a single variable, PAIR.
All data were obtained from institutional electronic medical record and administrative data systems. Study inclusion criteria were Medicare as primary insurance, admission to hospital from home, and care received at either CCHS facility. Exclusion criteria were admission from PAIR facility, long-term care facility, assisted-living facility, or inpatient psychiatric facility; death; discharge against medical advice (AMA) or to hospice, non-SNF, or inpatient psychiatric facility; and discovery (during review of case management [CM] notes) of erroneous listing of Medicare as primary insurance, or of inpatient admission (within 30 days before index observation stay) that qualified for PAIR coverage under Medicare Part A.
We reviewed the medical charts of a representative (~30%) sample of the cohort and examined physical therapy (PT) and CM notes to determine the proportions of patients with recommendations for home with no services, home-based PT, possible PAIR, and PAIR. Charts were sorted by medical record number and were reviewed in consecutive order. We coded a patient as having a recommendation for possible PAIR if the PT notes indicated the patient may benefit from PAIR but could have home PT if PAIR placement was not possible. CM notes were also reviewed for evidence of patient or family preference regarding PAIR placement. All questions about PT and CM recommendations were resolved by consensus.
Measures
For the total study sample, we calculated descriptive statistics and frequencies for demographic and administrative variables, including age, sex, race (Caucasian, African American, other), ethnicity (Hispanic/non-Hispanic), ICD-9 (International Classification of Diseases, Ninth Revision) primary diagnosis code, LOS (in hours) for index observation admission, discharge disposition (home with no services, home PT, possible PAIR, PAIR), and 30-day hospital revisit (emergency department, observation, inpatient admission). We used χ2 test, Student t test, and analysis of variance (ANOVA) to test for statistically significant differences in characteristics between the chart review subgroup and the rest of the sample and between the groups with different disposition recommendations from PT notes.
For the chart review subgroup, we used ANOVA to calculate the unadjusted association between PT recommendation and LOS. We then adjusted for potential confounders, using multivariable linear regression with PT recommendation as a predictor and LOS as the outcome, controlling for variables previously associated with increased LOS among observation patients (primary diagnosis category, age, sex).6 We also adjusted for hospitalist group to account for potential variability in care delivery. As LOS was not normally distributed, we calculated the fourth root of LOS, which resulted in a more normal distribution, and used the transformed values in the regression model. We then calculated predicted values from the regression and back-transformed these to obtain adjusted mean values for LOS.
Figure
RESULTS
Of the 1417 unique patients who had Medicare as primary insurance and were admitted under observation status to a hospitalist service during the study period (2013), 94 were excluded (Figure). Of the remaining 1323 patients, the majority were 65 years old or older, female, white, and non-Hispanic. The most common ICD-9 diagnoses were syncope and chest pain. Mean LOS was 46.7 hours (range, 0-519 h). Less than 1% of patients were discharged to PAIR. Almost 25% of patients returned to the hospital, either for an emergency department visit or for observation or inpatient stay, within 30 days (Table).
Table
Of the 419 charts reviewed to determine the proportion of patients evaluated by PT, and their subsequent recommendations, 33 were excluded, leaving 386 (92%) for analysis (Figure). There were no significant demographic differences between the patients in the chart review subgroup and the rest of the patients (Appendix). Of the 386 patients whose charts were analyzed, 181 (46.9%) had a PT evaluation, and 17 (4.4%) received a PAIR recommendation (Figure). Of the 17 patients recommended for PAIR, 12 (70.5%) were 65 years old or older, and 1 was discharged to a PAIR facility. Of the 46 patients recommended for home PT, 29 (63%) were discharged home with no services (Table).
PT-evaluated patients had unadjusted mean LOS of 52.2 hours (discharged home with no services), 64.1 hours (home PT or possible PAIR), and 83.1 hours (PAIR) (P = 0.001). With adjustment made for variables previously associated with increased LOS for observation patients, mean LOS for patients recommended for PAIR remained higher than that for patients in the other 2 categories (Table). Patients recommended for PAIR were more likely to return to hospital within 30 days than patients recommended for home PT or possible PAIR and patients discharged home with no services (Table).
Review of CM notes revealed that, of the 17 patients recommended for PAIR, 7 would have accepted PAIR services had they been covered by Medicare, 4 preferred discharge with home health services, and 6 did not provide clear details of patient or family preference.
DISCUSSION
To our knowledge, this is the first study to use chart review to examine the proportion of observation patients who would benefit from PAIR and the relationships among these patients’ rehabilitation needs, dispositions, and outcomes. We tried to be conservative in our estimates by limiting the study population to patients admitted from home. Nevertheless, the potential need for PAIR significantly outweighed the actual use of PAIR on discharge. The study sample was consistent with nationally representative samples of observation patients in terms of proportion of patients admitted from and discharged to facilities7 and the most common ICD-9 diagnoses.9
Physical Therapy Consultations and Observation
Of the 386 patients whose charts were reviewed and analyzed, 17 (4.4%) were evaluated as medically qualifying for and potentially benefiting from PAIR. Although the rate represents a minority of patients, it is 5- to 6-fold higher than the rate of discharge to PAIR, both in our study population and in previous national samples that used administrative data.7 In some cases, the decision not to discharge the patient to PAIR reflected patient and family preference. However, in other cases, patients clearly could have benefited from PAIR and would have gone had it been covered by Medicare. The gap suggests an unmet need for PAIR among a substantial proportion of Medicare beneficiaries for whom the therapy is recommended and wanted.
Efforts to expand coverage for PAIR have been resisted. According to Medicare regulations, beneficiaries qualify for PAIR coverage if they are hospitalized as inpatients for 3 midnights or longer. Days under observation status do not count toward this requirement, even if this status is changed to inpatient.10 The Medicare Payment Advisory Commission (MedPAC) recommendation that time under observation status count toward the Medicare requirement11 has not been accepted,12 in large part because further expansion of PAIR services likely would be unaffordable to Medicare under its payment structure.13 Given our finding that the need for PAIR likely is much higher than previously anticipated, Medicare policy makers should consider broadening access to PAIR while efforts are made to rein in expenditures through payment reform.
One potential area of cost savings is more judicious use of PT evaluation for observation patients, particularly given our finding that the majority of PT consultations resulted in no further recommendations. Efforts to triage PT consultations for appropriateness have had some success, though the literature is scant.14 To improve value for Medicare, healthcare systems, and patients, researchers should rigorously evaluate approaches that maximize appropriate use of PT services.
Hospital Length of Stay
Our cohort’s mean hospital stay was longer than averages reported elsewhere,9 likely reflecting our selection of Medicare patients rather than a general medicine population.6 However, our cohort’s adjusted mean hospital stay was significantly longer for patients recommended for PAIR than for patients without PT needs. That out-of-pocket costs for observation patients increase dramatically as LOS goes past 48 hours6 could have significant financial implications for Medicare beneficiaries.
Return Visits
Almost 25% of our observation patients returned to hospital within 30 days. There was a significant trend toward increased rehospitalization among patients recommended for PAIR than among patients with no PT needs.
Policies related to PAIR for observation patients are rooted in the concern that expanded access to services will contribute to overuse of services and higher healthcare costs.15 However, patients who could have benefited from PAIR but were not covered also were at risk for increased healthcare use and costs. A recent study found that more than one fourth of observation patients with repeat observation stays accrued excessive financial liability.16 Researchers should determine more precisely how the cost of coverage for PAIR placement on an index observation admission compares with the cost of subsequent healthcare use potentially related to insufficient supportive care at home.
Study Limitations
Our results must be interpreted within the context of study limitations. First is the small sample size, particularly the subset of patients selected for detailed manual chart review. We were limited in our ability to calculate sample size prospectively because we were unaware of prior work that described the association between PT recommendation and outcomes among observation patients. However, post hoc analysis estimated that a sample size of 181 patients would have been needed to determine a statistically significant difference in 30-day hospital revisit between patients recommended for PAIR and patients with no PT needs with 80% power, which we achieved. Although there are significant limitations to post hoc sample size estimation, we consider our work hypothesis-generating and hope it will lead to larger studies.
We could not account for the potential bias of the physical therapists, whose evaluations could have been influenced by knowledge of patients’ observation status. Our findings could have underestimated the proportion of patients who otherwise would have been recommended for PAIR. Alternatively, therapists could have inaccurately assessed and overstated the need for PAIR. Although we could not account for the therapists’ accuracy and biases, their assessments provided crucial information beyond what was previously obtained from administrative data alone.7,9
Hospital revisits were only accounted for within our hospital system—another potential source of underestimated findings. A significant proportion of patients recommended for home PT were discharged without services, which is counterintuitive, as Medicare covers home nursing services for observation patients. This finding most likely reflects administrative error but probably merits further evaluation.
Last, causality cannot be inferred from the results of a retrospective observational study.
CONCLUSION
As our study results suggest, there is an unmet need for PAIR services for Medicare observation patients, and LOS and subsequent use may be increased among patients recommended for PAIR. Our estimates are conservative and may underestimate the true need for services within this population. Our findings bolster MedPAC recommendations to amend the policies for Medicare coverage of PAIR services for observation patients.
Acknowledgment
The authors thank Paul Kolm, PhD, for statistical support.
Disclosures
Dr. Schwartz reports receiving personal fees from the Agency for Health Research and Quality, Bayer, the Blue Cross Blue Shield Association, Pfizer, and Takeda, all outside the submitted work. Dr. Hicks is supported by an Institutional Development Award from the National Institute of General Medical Sciences of the National Institutes of Health (grant U54-GM104941; principal investigator Stuart Binder-Macleod, PT, PhD, FAPTA). The other authors have nothing to report.
1. Ortman JM, Velkoff VA, Hogan H. An Aging Nation: The Older Population in the United States (Current Population Reports, P25-1140). Washington, DC: US Census Bureau; 2014. https://www.census.gov/prod/2014pubs/p25-1140.pdf. Published May 2014. Accessed January 1, 2016. 2. Carter C, Garrett B, Wissoker D. The Need to Reform Medicare’s Payments to Skilled Nursing Facilities Is as Strong as Ever. Washington, DC: Medicare Payment Advisory Commission & Urban Institute; 2015. http://www.urban.org/sites/default/files/publication/39036/2000072-The-Need-to-Reform-Medicare-Payments-to-SNF.pdf. Published January 2015. Accessed January 1, 2016. 3. Cassidy A. The two-midnight rule (Health Policy Brief). HealthAffairs website. http://healthaffairs.org/healthpolicybriefs/brief_pdfs/healthpolicybrief_133.pdf. Published January 22, 2015. Accessed January 1, 2016. 4. Sheehy AM, Caponi B, Gangireddy S, et al. Observation and inpatient status: clinical impact of the 2-midnight rule. J Hosp Med. 2014;9(4):203-209. PubMed 5. Wright S. Memorandum report: hospitals’ use of observation stays and short inpatient stays for Medicare beneficiaries (OEI-02-12-00040). Washington, DC: US Dept of Health and Human Services, Office of Inspector General; 2013. https://oig.hhs.gov/oei/reports/oei-02-12-00040.pdf. Published July 29, 2013. Accessed January 1, 2016. 6. Hockenberry JM, Mutter R, Barrett M, Parlato J, Ross MA. Factors associated with prolonged observation services stays and the impact of long stays on patient cost. Health Serv Res. 2014;49(3):893-909. PubMed 7. Feng Z, Jung HY, Wright B, Mor V. The origin and disposition of Medicare observation stays. Med Care. 2014;52(9):796-800. PubMed 8. Ross MA, Hockenberry JM, Mutter R, Barrett M, Wheatley M, Pitts SR. Protocol-driven emergency department observation units offer savings, shorter stays, and reduced admissions. Health Aff. 2013;32(12):2149-2156. PubMed 9. Sheehy AM, Graf B, Gangireddy S, et al. Hospitalized but not admitted: characteristics of patients with “observation status” at an academic medical center. JAMA Intern Med. 2013;173(21):1991-1998. PubMed 10. Centers for Medicare & Medicaid Services. Medicare & Your Hospital Benefits. https://www.medicare.gov/Pubs/pdf/11408.pdf. CMS Product 11408. Published 2014. Revised March 2016. Accessed February 6, 2017. 11. Medicare Payment Advisory Commission. Hospital short-stay policy issues. In: Report to the Congress: Medicare and the Health Care Delivery System. Washington, DC: Medicare Payment Advisory Commission; 2015:173-204. http://www.medpac.gov/docs/default-source/reports/chapter-7-hospital-short-stay-policy-issues-june-2015-report-.pdf. Published June 2015. Accessed January 1, 2016. 12. Centers for Medicare & Medicaid Services (CMS), HHS. Medicare program: hospital outpatient prospective payment and ambulatory surgical center payment systems and quality reporting programs; short inpatient hospital stays; transition for certain Medicare-dependent, small rural hospitals under the hospital inpatient prospective payment system; provider administrative appeals and judicial review. Final rule with comment period; final rule. Fed Regist. 2015;80(219):70297-70607. PubMed 13. Medicare Payment Advisory Commission. Skilled nursing facility services. In: Report to the Congress: Medicare Payment Policy. Washington, DC: Medicare Payment Advisory Commission; 2015:181-209. http://www.medpac.gov/docs/default-source/reports/chapter-8-skilled-nursing-facility-services-march-2015-report-.pdf. Published March 2015. Accessed January 1, 2016. 14. Hobbs JA, Boysen JF, McGarry KA, Thompson JM, Nordrum JT. Development of a unique triage system for acute care physical therapy and occupational therapy services: an administrative case report. Phys Ther. 2010;90(10):1519-1529. PubMed 15. Centers for Medicare & Medicaid Services (CMS), HHS. Medicare program; hospital inpatient prospective payment systems for acute care hospitals and the long-term care hospital prospective payment system and fiscal year 2014 rates; quality reporting requirements for specific providers; hospital conditions of participation; payment policies related to patient status. Final rules. Fed Regist. 2013;78(160):50495-51040. PubMed 16. Kangovi S, Cafardi SG, Smith RA, Kulkarni R, Grande D. Patient financial responsibility for observation care. J Hosp Med. 2015;10(11):718-723. PubMed
As the US population ages and becomes increasingly frail, the need for rehabilitation rises. By 2030, an estimated 20% of the population will be 65 years old or older, and almost 10% will be over 75.1 About 20% of hospitalized Medicare patients receive subsequent care in postacute inpatient rehabilitation (PAIR) facilities, accounting for $31 billion in Medicare expenditures in 2014.2 Although the need for rehabilitation will continue to rise, Medicare policy restricts access to it.
Under Medicare policy, PAIR services are covered for certain hospitalized patients but not others. Hospitalized patients are either inpatients, who are billed under Medicare Part A, or outpatients, billed under Part B. When hospital length of stay (LOS) is anticipated to be less than 2 midnights, patients are admitted as outpatients under the term observation status; when longer stays are expected, patients are admitted as inpatients.3 This recently implemented time-based distinction has been criticized as arbitrary, and as potentially shifting many patients from inpatient to outpatient (observation) status.4
The distinction between inpatient and observation status has significant consequences for posthospital care. Medicare Part A covers care in skilled nursing facilities (SNFs) and acute inpatient rehabilitation facilities (IRFs); after hospitalization, inpatients have access to either, without copay. As observation patients are covered under Medicare Part B, they are technically not covered for either service after their hospital stay. IRFs sometimes accept patients from ambulatory and nonacute settings; observation patients may be accepted in rare circumstances, but they pay the Part A deductible ($1288 in 2016) to have the services covered by Medicare. SNF services are never covered for observation patients, and access to this care requires an average out-of-pocket payment of more than $10,503 per beneficiary for a typical SNF stay.5 Given that about 70% of Medicare patients fall below 300% of the federal poverty line,6 the out-of-pocket costs for PAIR services for observation patients can be prohibitive.
Although only 0.75% of community-dwelling Medicare observation patients are discharged to PAIR facilities,7 it is unclear if the need for this care is higher but remains unmet secondary to cost concerns of Medicare beneficiaries. Also unclear is whether observation patients who would benefit from this care but do not receive it end up with poorer health outcomes and therefore use more healthcare services.
The purpose of this study was to estimate the proportion of Medicare observation patients who are admitted from home and receive a recommendation for placement in a PAIR facility, and to determine the ultimate disposition of such patients. We also sought to evaluate the association between recommendation for PAIR placement, LOS, and 30-day hospital revisit rate.
METHODS
The Institutional Review Board of Christiana Care Health System (CCHS) approved this study.
Sample and Design
This was an observational study of community-dwelling Medicare patients admitted under observation status to Delaware’s CCHS, which consists of a 907-bed regional tertiary-care facility in Newark and a 241-bed community hospital in Wilmington. The study period was January 1 to December 31, 2013. We limited our sample to patients treated by hospitalists on hospital wards, as this care constitutes 80% of the care provided to observation patients at CCHS and the majority of care nationally.8 As neither SNF care nor IRF care is covered under Medicare Part B, and both would result in high out-of-pocket costs for Medicare observation patients, we combined them into a single variable, PAIR.
All data were obtained from institutional electronic medical record and administrative data systems. Study inclusion criteria were Medicare as primary insurance, admission to hospital from home, and care received at either CCHS facility. Exclusion criteria were admission from PAIR facility, long-term care facility, assisted-living facility, or inpatient psychiatric facility; death; discharge against medical advice (AMA) or to hospice, non-SNF, or inpatient psychiatric facility; and discovery (during review of case management [CM] notes) of erroneous listing of Medicare as primary insurance, or of inpatient admission (within 30 days before index observation stay) that qualified for PAIR coverage under Medicare Part A.
We reviewed the medical charts of a representative (~30%) sample of the cohort and examined physical therapy (PT) and CM notes to determine the proportions of patients with recommendations for home with no services, home-based PT, possible PAIR, and PAIR. Charts were sorted by medical record number and were reviewed in consecutive order. We coded a patient as having a recommendation for possible PAIR if the PT notes indicated the patient may benefit from PAIR but could have home PT if PAIR placement was not possible. CM notes were also reviewed for evidence of patient or family preference regarding PAIR placement. All questions about PT and CM recommendations were resolved by consensus.
Measures
For the total study sample, we calculated descriptive statistics and frequencies for demographic and administrative variables, including age, sex, race (Caucasian, African American, other), ethnicity (Hispanic/non-Hispanic), ICD-9 (International Classification of Diseases, Ninth Revision) primary diagnosis code, LOS (in hours) for index observation admission, discharge disposition (home with no services, home PT, possible PAIR, PAIR), and 30-day hospital revisit (emergency department, observation, inpatient admission). We used χ2 test, Student t test, and analysis of variance (ANOVA) to test for statistically significant differences in characteristics between the chart review subgroup and the rest of the sample and between the groups with different disposition recommendations from PT notes.
For the chart review subgroup, we used ANOVA to calculate the unadjusted association between PT recommendation and LOS. We then adjusted for potential confounders, using multivariable linear regression with PT recommendation as a predictor and LOS as the outcome, controlling for variables previously associated with increased LOS among observation patients (primary diagnosis category, age, sex).6 We also adjusted for hospitalist group to account for potential variability in care delivery. As LOS was not normally distributed, we calculated the fourth root of LOS, which resulted in a more normal distribution, and used the transformed values in the regression model. We then calculated predicted values from the regression and back-transformed these to obtain adjusted mean values for LOS.
Figure
RESULTS
Of the 1417 unique patients who had Medicare as primary insurance and were admitted under observation status to a hospitalist service during the study period (2013), 94 were excluded (Figure). Of the remaining 1323 patients, the majority were 65 years old or older, female, white, and non-Hispanic. The most common ICD-9 diagnoses were syncope and chest pain. Mean LOS was 46.7 hours (range, 0-519 h). Less than 1% of patients were discharged to PAIR. Almost 25% of patients returned to the hospital, either for an emergency department visit or for observation or inpatient stay, within 30 days (Table).
Table
Of the 419 charts reviewed to determine the proportion of patients evaluated by PT, and their subsequent recommendations, 33 were excluded, leaving 386 (92%) for analysis (Figure). There were no significant demographic differences between the patients in the chart review subgroup and the rest of the patients (Appendix). Of the 386 patients whose charts were analyzed, 181 (46.9%) had a PT evaluation, and 17 (4.4%) received a PAIR recommendation (Figure). Of the 17 patients recommended for PAIR, 12 (70.5%) were 65 years old or older, and 1 was discharged to a PAIR facility. Of the 46 patients recommended for home PT, 29 (63%) were discharged home with no services (Table).
PT-evaluated patients had unadjusted mean LOS of 52.2 hours (discharged home with no services), 64.1 hours (home PT or possible PAIR), and 83.1 hours (PAIR) (P = 0.001). With adjustment made for variables previously associated with increased LOS for observation patients, mean LOS for patients recommended for PAIR remained higher than that for patients in the other 2 categories (Table). Patients recommended for PAIR were more likely to return to hospital within 30 days than patients recommended for home PT or possible PAIR and patients discharged home with no services (Table).
Review of CM notes revealed that, of the 17 patients recommended for PAIR, 7 would have accepted PAIR services had they been covered by Medicare, 4 preferred discharge with home health services, and 6 did not provide clear details of patient or family preference.
DISCUSSION
To our knowledge, this is the first study to use chart review to examine the proportion of observation patients who would benefit from PAIR and the relationships among these patients’ rehabilitation needs, dispositions, and outcomes. We tried to be conservative in our estimates by limiting the study population to patients admitted from home. Nevertheless, the potential need for PAIR significantly outweighed the actual use of PAIR on discharge. The study sample was consistent with nationally representative samples of observation patients in terms of proportion of patients admitted from and discharged to facilities7 and the most common ICD-9 diagnoses.9
Physical Therapy Consultations and Observation
Of the 386 patients whose charts were reviewed and analyzed, 17 (4.4%) were evaluated as medically qualifying for and potentially benefiting from PAIR. Although the rate represents a minority of patients, it is 5- to 6-fold higher than the rate of discharge to PAIR, both in our study population and in previous national samples that used administrative data.7 In some cases, the decision not to discharge the patient to PAIR reflected patient and family preference. However, in other cases, patients clearly could have benefited from PAIR and would have gone had it been covered by Medicare. The gap suggests an unmet need for PAIR among a substantial proportion of Medicare beneficiaries for whom the therapy is recommended and wanted.
Efforts to expand coverage for PAIR have been resisted. According to Medicare regulations, beneficiaries qualify for PAIR coverage if they are hospitalized as inpatients for 3 midnights or longer. Days under observation status do not count toward this requirement, even if this status is changed to inpatient.10 The Medicare Payment Advisory Commission (MedPAC) recommendation that time under observation status count toward the Medicare requirement11 has not been accepted,12 in large part because further expansion of PAIR services likely would be unaffordable to Medicare under its payment structure.13 Given our finding that the need for PAIR likely is much higher than previously anticipated, Medicare policy makers should consider broadening access to PAIR while efforts are made to rein in expenditures through payment reform.
One potential area of cost savings is more judicious use of PT evaluation for observation patients, particularly given our finding that the majority of PT consultations resulted in no further recommendations. Efforts to triage PT consultations for appropriateness have had some success, though the literature is scant.14 To improve value for Medicare, healthcare systems, and patients, researchers should rigorously evaluate approaches that maximize appropriate use of PT services.
Hospital Length of Stay
Our cohort’s mean hospital stay was longer than averages reported elsewhere,9 likely reflecting our selection of Medicare patients rather than a general medicine population.6 However, our cohort’s adjusted mean hospital stay was significantly longer for patients recommended for PAIR than for patients without PT needs. That out-of-pocket costs for observation patients increase dramatically as LOS goes past 48 hours6 could have significant financial implications for Medicare beneficiaries.
Return Visits
Almost 25% of our observation patients returned to hospital within 30 days. There was a significant trend toward increased rehospitalization among patients recommended for PAIR than among patients with no PT needs.
Policies related to PAIR for observation patients are rooted in the concern that expanded access to services will contribute to overuse of services and higher healthcare costs.15 However, patients who could have benefited from PAIR but were not covered also were at risk for increased healthcare use and costs. A recent study found that more than one fourth of observation patients with repeat observation stays accrued excessive financial liability.16 Researchers should determine more precisely how the cost of coverage for PAIR placement on an index observation admission compares with the cost of subsequent healthcare use potentially related to insufficient supportive care at home.
Study Limitations
Our results must be interpreted within the context of study limitations. First is the small sample size, particularly the subset of patients selected for detailed manual chart review. We were limited in our ability to calculate sample size prospectively because we were unaware of prior work that described the association between PT recommendation and outcomes among observation patients. However, post hoc analysis estimated that a sample size of 181 patients would have been needed to determine a statistically significant difference in 30-day hospital revisit between patients recommended for PAIR and patients with no PT needs with 80% power, which we achieved. Although there are significant limitations to post hoc sample size estimation, we consider our work hypothesis-generating and hope it will lead to larger studies.
We could not account for the potential bias of the physical therapists, whose evaluations could have been influenced by knowledge of patients’ observation status. Our findings could have underestimated the proportion of patients who otherwise would have been recommended for PAIR. Alternatively, therapists could have inaccurately assessed and overstated the need for PAIR. Although we could not account for the therapists’ accuracy and biases, their assessments provided crucial information beyond what was previously obtained from administrative data alone.7,9
Hospital revisits were only accounted for within our hospital system—another potential source of underestimated findings. A significant proportion of patients recommended for home PT were discharged without services, which is counterintuitive, as Medicare covers home nursing services for observation patients. This finding most likely reflects administrative error but probably merits further evaluation.
Last, causality cannot be inferred from the results of a retrospective observational study.
CONCLUSION
As our study results suggest, there is an unmet need for PAIR services for Medicare observation patients, and LOS and subsequent use may be increased among patients recommended for PAIR. Our estimates are conservative and may underestimate the true need for services within this population. Our findings bolster MedPAC recommendations to amend the policies for Medicare coverage of PAIR services for observation patients.
Acknowledgment
The authors thank Paul Kolm, PhD, for statistical support.
Disclosures
Dr. Schwartz reports receiving personal fees from the Agency for Health Research and Quality, Bayer, the Blue Cross Blue Shield Association, Pfizer, and Takeda, all outside the submitted work. Dr. Hicks is supported by an Institutional Development Award from the National Institute of General Medical Sciences of the National Institutes of Health (grant U54-GM104941; principal investigator Stuart Binder-Macleod, PT, PhD, FAPTA). The other authors have nothing to report.
References
1. Ortman JM, Velkoff VA, Hogan H. An Aging Nation: The Older Population in the United States (Current Population Reports, P25-1140). Washington, DC: US Census Bureau; 2014. https://www.census.gov/prod/2014pubs/p25-1140.pdf. Published May 2014. Accessed January 1, 2016. 2. Carter C, Garrett B, Wissoker D. The Need to Reform Medicare’s Payments to Skilled Nursing Facilities Is as Strong as Ever. Washington, DC: Medicare Payment Advisory Commission & Urban Institute; 2015. http://www.urban.org/sites/default/files/publication/39036/2000072-The-Need-to-Reform-Medicare-Payments-to-SNF.pdf. Published January 2015. Accessed January 1, 2016. 3. Cassidy A. The two-midnight rule (Health Policy Brief). HealthAffairs website. http://healthaffairs.org/healthpolicybriefs/brief_pdfs/healthpolicybrief_133.pdf. Published January 22, 2015. Accessed January 1, 2016. 4. Sheehy AM, Caponi B, Gangireddy S, et al. Observation and inpatient status: clinical impact of the 2-midnight rule. J Hosp Med. 2014;9(4):203-209. PubMed 5. Wright S. Memorandum report: hospitals’ use of observation stays and short inpatient stays for Medicare beneficiaries (OEI-02-12-00040). Washington, DC: US Dept of Health and Human Services, Office of Inspector General; 2013. https://oig.hhs.gov/oei/reports/oei-02-12-00040.pdf. Published July 29, 2013. Accessed January 1, 2016. 6. Hockenberry JM, Mutter R, Barrett M, Parlato J, Ross MA. Factors associated with prolonged observation services stays and the impact of long stays on patient cost. Health Serv Res. 2014;49(3):893-909. PubMed 7. Feng Z, Jung HY, Wright B, Mor V. The origin and disposition of Medicare observation stays. Med Care. 2014;52(9):796-800. PubMed 8. Ross MA, Hockenberry JM, Mutter R, Barrett M, Wheatley M, Pitts SR. Protocol-driven emergency department observation units offer savings, shorter stays, and reduced admissions. Health Aff. 2013;32(12):2149-2156. PubMed 9. Sheehy AM, Graf B, Gangireddy S, et al. Hospitalized but not admitted: characteristics of patients with “observation status” at an academic medical center. JAMA Intern Med. 2013;173(21):1991-1998. PubMed 10. Centers for Medicare & Medicaid Services. Medicare & Your Hospital Benefits. https://www.medicare.gov/Pubs/pdf/11408.pdf. CMS Product 11408. Published 2014. Revised March 2016. Accessed February 6, 2017. 11. Medicare Payment Advisory Commission. Hospital short-stay policy issues. In: Report to the Congress: Medicare and the Health Care Delivery System. Washington, DC: Medicare Payment Advisory Commission; 2015:173-204. http://www.medpac.gov/docs/default-source/reports/chapter-7-hospital-short-stay-policy-issues-june-2015-report-.pdf. Published June 2015. Accessed January 1, 2016. 12. Centers for Medicare & Medicaid Services (CMS), HHS. Medicare program: hospital outpatient prospective payment and ambulatory surgical center payment systems and quality reporting programs; short inpatient hospital stays; transition for certain Medicare-dependent, small rural hospitals under the hospital inpatient prospective payment system; provider administrative appeals and judicial review. Final rule with comment period; final rule. Fed Regist. 2015;80(219):70297-70607. PubMed 13. Medicare Payment Advisory Commission. Skilled nursing facility services. In: Report to the Congress: Medicare Payment Policy. Washington, DC: Medicare Payment Advisory Commission; 2015:181-209. http://www.medpac.gov/docs/default-source/reports/chapter-8-skilled-nursing-facility-services-march-2015-report-.pdf. Published March 2015. Accessed January 1, 2016. 14. Hobbs JA, Boysen JF, McGarry KA, Thompson JM, Nordrum JT. Development of a unique triage system for acute care physical therapy and occupational therapy services: an administrative case report. Phys Ther. 2010;90(10):1519-1529. PubMed 15. Centers for Medicare & Medicaid Services (CMS), HHS. Medicare program; hospital inpatient prospective payment systems for acute care hospitals and the long-term care hospital prospective payment system and fiscal year 2014 rates; quality reporting requirements for specific providers; hospital conditions of participation; payment policies related to patient status. Final rules. Fed Regist. 2013;78(160):50495-51040. PubMed 16. Kangovi S, Cafardi SG, Smith RA, Kulkarni R, Grande D. Patient financial responsibility for observation care. J Hosp Med. 2015;10(11):718-723. PubMed
Address for correspondence and reprint requests: Jennifer N. Goldstein, MD, MSc, Department of Medicine, Christiana Care Health System, Suite 2E70, Ammon Education Building, 4755 Ogletown-Stanton Rd, Newark, DE 19713; Telephone: 302-733-6591; Fax: 302-733-6082; E-mail: jgoldstein@christianacare.org