User login
The unmet need for postacute rehabilitation among medicare observation patients: A single-center study
As the US population ages and becomes increasingly frail, the need for rehabilitation rises. By 2030, an estimated 20% of the population will be 65 years old or older, and almost 10% will be over 75.1 About 20% of hospitalized Medicare patients receive subsequent care in postacute inpatient rehabilitation (PAIR) facilities, accounting for $31 billion in Medicare expenditures in 2014.2 Although the need for rehabilitation will continue to rise, Medicare policy restricts access to it.
Under Medicare policy, PAIR services are covered for certain hospitalized patients but not others. Hospitalized patients are either inpatients, who are billed under Medicare Part A, or outpatients, billed under Part B. When hospital length of stay (LOS) is anticipated to be less than 2 midnights, patients are admitted as outpatients under the term observation status; when longer stays are expected, patients are admitted as inpatients.3 This recently implemented time-based distinction has been criticized as arbitrary, and as potentially shifting many patients from inpatient to outpatient (observation) status.4
The distinction between inpatient and observation status has significant consequences for posthospital care. Medicare Part A covers care in skilled nursing facilities (SNFs) and acute inpatient rehabilitation facilities (IRFs); after hospitalization, inpatients have access to either, without copay. As observation patients are covered under Medicare Part B, they are technically not covered for either service after their hospital stay. IRFs sometimes accept patients from ambulatory and nonacute settings; observation patients may be accepted in rare circumstances, but they pay the Part A deductible ($1288 in 2016) to have the services covered by Medicare. SNF services are never covered for observation patients, and access to this care requires an average out-of-pocket payment of more than $10,503 per beneficiary for a typical SNF stay.5 Given that about 70% of Medicare patients fall below 300% of the federal poverty line,6 the out-of-pocket costs for PAIR services for observation patients can be prohibitive.
Although only 0.75% of community-dwelling Medicare observation patients are discharged to PAIR facilities,7 it is unclear if the need for this care is higher but remains unmet secondary to cost concerns of Medicare beneficiaries. Also unclear is whether observation patients who would benefit from this care but do not receive it end up with poorer health outcomes and therefore use more healthcare services.
The purpose of this study was to estimate the proportion of Medicare observation patients who are admitted from home and receive a recommendation for placement in a PAIR facility, and to determine the ultimate disposition of such patients. We also sought to evaluate the association between recommendation for PAIR placement, LOS, and 30-day hospital revisit rate.
METHODS
The Institutional Review Board of Christiana Care Health System (CCHS) approved this study.
Sample and Design
This was an observational study of community-dwelling Medicare patients admitted under observation status to Delaware’s CCHS, which consists of a 907-bed regional tertiary-care facility in Newark and a 241-bed community hospital in Wilmington. The study period was January 1 to December 31, 2013. We limited our sample to patients treated by hospitalists on hospital wards, as this care constitutes 80% of the care provided to observation patients at CCHS and the majority of care nationally.8 As neither SNF care nor IRF care is covered under Medicare Part B, and both would result in high out-of-pocket costs for Medicare observation patients, we combined them into a single variable, PAIR.
All data were obtained from institutional electronic medical record and administrative data systems. Study inclusion criteria were Medicare as primary insurance, admission to hospital from home, and care received at either CCHS facility. Exclusion criteria were admission from PAIR facility, long-term care facility, assisted-living facility, or inpatient psychiatric facility; death; discharge against medical advice (AMA) or to hospice, non-SNF, or inpatient psychiatric facility; and discovery (during review of case management [CM] notes) of erroneous listing of Medicare as primary insurance, or of inpatient admission (within 30 days before index observation stay) that qualified for PAIR coverage under Medicare Part A.
We reviewed the medical charts of a representative (~30%) sample of the cohort and examined physical therapy (PT) and CM notes to determine the proportions of patients with recommendations for home with no services, home-based PT, possible PAIR, and PAIR. Charts were sorted by medical record number and were reviewed in consecutive order. We coded a patient as having a recommendation for possible PAIR if the PT notes indicated the patient may benefit from PAIR but could have home PT if PAIR placement was not possible. CM notes were also reviewed for evidence of patient or family preference regarding PAIR placement. All questions about PT and CM recommendations were resolved by consensus.
Measures
For the total study sample, we calculated descriptive statistics and frequencies for demographic and administrative variables, including age, sex, race (Caucasian, African American, other), ethnicity (Hispanic/non-Hispanic), ICD-9 (International Classification of Diseases, Ninth Revision) primary diagnosis code, LOS (in hours) for index observation admission, discharge disposition (home with no services, home PT, possible PAIR, PAIR), and 30-day hospital revisit (emergency department, observation, inpatient admission). We used χ2 test, Student t test, and analysis of variance (ANOVA) to test for statistically significant differences in characteristics between the chart review subgroup and the rest of the sample and between the groups with different disposition recommendations from PT notes.
For the chart review subgroup, we used ANOVA to calculate the unadjusted association between PT recommendation and LOS. We then adjusted for potential confounders, using multivariable linear regression with PT recommendation as a predictor and LOS as the outcome, controlling for variables previously associated with increased LOS among observation patients (primary diagnosis category, age, sex).6 We also adjusted for hospitalist group to account for potential variability in care delivery. As LOS was not normally distributed, we calculated the fourth root of LOS, which resulted in a more normal distribution, and used the transformed values in the regression model. We then calculated predicted values from the regression and back-transformed these to obtain adjusted mean values for LOS.

RESULTS
Of the 1417 unique patients who had Medicare as primary insurance and were admitted under observation status to a hospitalist service during the study period (2013), 94 were excluded (Figure). Of the remaining 1323 patients, the majority were 65 years old or older, female, white, and non-Hispanic. The most common ICD-9 diagnoses were syncope and chest pain. Mean LOS was 46.7 hours (range, 0-519 h). Less than 1% of patients were discharged to PAIR. Almost 25% of patients returned to the hospital, either for an emergency department visit or for observation or inpatient stay, within 30 days (Table).

Of the 419 charts reviewed to determine the proportion of patients evaluated by PT, and their subsequent recommendations, 33 were excluded, leaving 386 (92%) for analysis (Figure). There were no significant demographic differences between the patients in the chart review subgroup and the rest of the patients (Appendix). Of the 386 patients whose charts were analyzed, 181 (46.9%) had a PT evaluation, and 17 (4.4%) received a PAIR recommendation (Figure). Of the 17 patients recommended for PAIR, 12 (70.5%) were 65 years old or older, and 1 was discharged to a PAIR facility. Of the 46 patients recommended for home PT, 29 (63%) were discharged home with no services (Table).
PT-evaluated patients had unadjusted mean LOS of 52.2 hours (discharged home with no services), 64.1 hours (home PT or possible PAIR), and 83.1 hours (PAIR) (P = 0.001). With adjustment made for variables previously associated with increased LOS for observation patients, mean LOS for patients recommended for PAIR remained higher than that for patients in the other 2 categories (Table). Patients recommended for PAIR were more likely to return to hospital within 30 days than patients recommended for home PT or possible PAIR and patients discharged home with no services (Table).
Review of CM notes revealed that, of the 17 patients recommended for PAIR, 7 would have accepted PAIR services had they been covered by Medicare, 4 preferred discharge with home health services, and 6 did not provide clear details of patient or family preference.
DISCUSSION
To our knowledge, this is the first study to use chart review to examine the proportion of observation patients who would benefit from PAIR and the relationships among these patients’ rehabilitation needs, dispositions, and outcomes. We tried to be conservative in our estimates by limiting the study population to patients admitted from home. Nevertheless, the potential need for PAIR significantly outweighed the actual use of PAIR on discharge. The study sample was consistent with nationally representative samples of observation patients in terms of proportion of patients admitted from and discharged to facilities7 and the most common ICD-9 diagnoses.9
Physical Therapy Consultations and Observation
Of the 386 patients whose charts were reviewed and analyzed, 17 (4.4%) were evaluated as medically qualifying for and potentially benefiting from PAIR. Although the rate represents a minority of patients, it is 5- to 6-fold higher than the rate of discharge to PAIR, both in our study population and in previous national samples that used administrative data.7 In some cases, the decision not to discharge the patient to PAIR reflected patient and family preference. However, in other cases, patients clearly could have benefited from PAIR and would have gone had it been covered by Medicare. The gap suggests an unmet need for PAIR among a substantial proportion of Medicare beneficiaries for whom the therapy is recommended and wanted.
Efforts to expand coverage for PAIR have been resisted. According to Medicare regulations, beneficiaries qualify for PAIR coverage if they are hospitalized as inpatients for 3 midnights or longer. Days under observation status do not count toward this requirement, even if this status is changed to inpatient.10 The Medicare Payment Advisory Commission (MedPAC) recommendation that time under observation status count toward the Medicare requirement11 has not been accepted,12 in large part because further expansion of PAIR services likely would be unaffordable to Medicare under its payment structure.13 Given our finding that the need for PAIR likely is much higher than previously anticipated, Medicare policy makers should consider broadening access to PAIR while efforts are made to rein in expenditures through payment reform.
One potential area of cost savings is more judicious use of PT evaluation for observation patients, particularly given our finding that the majority of PT consultations resulted in no further recommendations. Efforts to triage PT consultations for appropriateness have had some success, though the literature is scant.14 To improve value for Medicare, healthcare systems, and patients, researchers should rigorously evaluate approaches that maximize
Hospital Length of Stay
Our cohort’s mean hospital stay was longer than averages reported elsewhere,9 likely reflecting our selection of Medicare patients rather than a general medicine population.6 However, our cohort’s adjusted mean hospital stay was significantly longer for patients recommended for PAIR than for patients without PT needs. That out-of-pocket costs for observation patients increase dramatically as LOS goes past 48 hours6 could have significant financial implications for Medicare beneficiaries.
Return Visits
Almost 25% of our observation patients returned to hospital within 30 days. There was a significant trend toward increased rehospitalization among patients recommended for PAIR than among patients with no PT needs.
Policies related to PAIR for observation patients are rooted in the concern that expanded access to services will contribute to overuse of services and higher healthcare costs.15 However, patients who could have benefited from PAIR but were not covered also were at risk for increased healthcare use and costs. A recent study found that more than one fourth of observation patients with repeat observation stays accrued excessive financial liability.16 Researchers should determine more precisely how the cost of coverage for PAIR placement on an index observation admission compares with the cost of subsequent healthcare use potentially related to insufficient supportive care at home.
Study Limitations
Our results must be interpreted within the context of study limitations. First is the small sample size, particularly the subset of patients selected for detailed manual chart review. We were limited in our ability to calculate sample size prospectively because we were unaware of prior work that described the association between PT recommendation and outcomes among observation patients. However, post hoc analysis estimated that a sample size of 181 patients would have been needed to determine a statistically significant difference in 30-day hospital revisit between patients recommended for PAIR and patients with no PT needs with 80% power, which we achieved. Although there are significant limitations to post hoc sample size estimation, we consider our work hypothesis-generating and hope it will lead to larger studies.
We could not account for the potential bias of the physical therapists, whose evaluations could have been influenced by knowledge of patients’ observation status. Our findings could have underestimated the proportion of patients who otherwise would have been recommended for PAIR. Alternatively, therapists could have inaccurately assessed and overstated the need for PAIR. Although we could not account for the therapists’ accuracy and biases, their assessments provided crucial information beyond what was previously obtained from administrative data alone.7,9
Hospital revisits were only accounted for within our hospital system—another potential source of underestimated findings. A significant proportion of patients recommended for home PT were discharged without services, which is counterintuitive, as Medicare covers home nursing services for observation patients. This finding most likely reflects administrative error but probably merits further evaluation.
Last, causality cannot be inferred from the results of a retrospective observational study.
CONCLUSION
As our study results suggest, there is an unmet need for PAIR services for Medicare observation patients, and LOS and subsequent use may be increased among patients recommended for PAIR. Our estimates are conservative and may underestimate the true need for services within this population. Our findings bolster MedPAC recommendations to amend the policies for Medicare coverage of PAIR services for observation patients.
Acknowledgment
The authors thank Paul Kolm, PhD, for statistical support.
Disclosures
Dr. Schwartz reports receiving personal fees from the Agency for Health Research and Quality, Bayer, the Blue Cross Blue Shield Association, Pfizer, and Takeda, all outside the submitted work. Dr. Hicks is supported by an Institutional Development Award from the National Institute of General Medical Sciences of the National Institutes of Health (grant U54-GM104941; principal investigator Stuart Binder-Macleod, PT, PhD, FAPTA). The other authors have nothing to report.
1. Ortman JM, Velkoff VA, Hogan H. An Aging Nation: The Older Population in the United States (Current Population Reports, P25-1140). Washington, DC: US Census Bureau; 2014. https://www.census.gov/prod/2014pubs/p25-1140.pdf. Published May 2014. Accessed January 1, 2016.
2. Carter C, Garrett B, Wissoker D. The Need to Reform Medicare’s Payments to Skilled Nursing Facilities Is as Strong as Ever. Washington, DC: Medicare Payment Advisory Commission & Urban Institute; 2015. http://www.urban.org/sites/default/files/publication/39036/2000072-The-Need-to-Reform-Medicare-Payments-to-SNF.pdf. Published January 2015. Accessed January 1, 2016.
3. Cassidy A. The two-midnight rule (Health Policy Brief). HealthAffairs website. http://healthaffairs.org/healthpolicybriefs/brief_pdfs/healthpolicybrief_133.pdf. Published January 22, 2015. Accessed January 1, 2016.
4. Sheehy AM, Caponi B, Gangireddy S, et al. Observation and inpatient status: clinical impact of the 2-midnight rule. J Hosp Med. 2014;9(4):203-209. PubMed
5. Wright S. Memorandum report: hospitals’ use of observation stays and short inpatient stays for Medicare beneficiaries (OEI-02-12-00040). Washington, DC: US Dept of Health and Human Services, Office of Inspector General; 2013. https://oig.hhs.gov/oei/reports/oei-02-12-00040.pdf. Published July 29, 2013. Accessed January 1, 2016.
6. Hockenberry JM, Mutter R, Barrett M, Parlato J, Ross MA. Factors associated with prolonged observation services stays and the impact of long stays on patient cost. Health Serv Res. 2014;49(3):893-909. PubMed
7. Feng Z, Jung HY, Wright B, Mor V. The origin and disposition of Medicare observation stays. Med Care. 2014;52(9):796-800. PubMed
8. Ross MA, Hockenberry JM, Mutter R, Barrett M, Wheatley M, Pitts SR. Protocol-driven emergency department observation units offer savings, shorter stays, and reduced admissions. Health Aff. 2013;32(12):2149-2156. PubMed
9. Sheehy AM, Graf B, Gangireddy S, et al. Hospitalized but not admitted: characteristics of patients with “observation status” at an academic medical center. JAMA Intern Med. 2013;173(21):1991-1998. PubMed
10. Centers for Medicare & Medicaid Services. Medicare & Your Hospital Benefits. https://www.medicare.gov/Pubs/pdf/11408.pdf. CMS Product 11408. Published 2014. Revised March 2016. Accessed February 6, 2017.
11. Medicare Payment Advisory Commission. Hospital short-stay policy issues. In: Report to the Congress: Medicare and the Health Care Delivery System. Washington, DC: Medicare Payment Advisory Commission; 2015:173-204. http://www.medpac.gov/docs/default-source/reports/chapter-7-hospital-short-stay-policy-issues-june-2015-report-.pdf. Published June 2015. Accessed January 1, 2016.
12. Centers for Medicare & Medicaid Services (CMS), HHS. Medicare program: hospital outpatient prospective payment and ambulatory surgical center payment systems and quality reporting programs; short inpatient hospital stays; transition for certain Medicare-dependent, small rural hospitals under the hospital inpatient prospective payment system; provider administrative appeals and judicial review. Final rule with comment period; final rule. Fed Regist. 2015;80(219):70297-70607. PubMed
13. Medicare Payment Advisory Commission. Skilled nursing facility services. In: Report to the Congress: Medicare Payment Policy. Washington, DC: Medicare Payment Advisory Commission; 2015:181-209. http://www.medpac.gov/docs/default-source/reports/chapter-8-skilled-nursing-facility-services-march-2015-report-.pdf. Published March 2015. Accessed January 1, 2016.
14. Hobbs JA, Boysen JF, McGarry KA, Thompson JM, Nordrum JT. Development of a unique triage system for acute care physical therapy and occupational therapy services: an administrative case report. Phys Ther. 2010;90(10):1519-1529. PubMed
15. Centers for Medicare & Medicaid Services (CMS), HHS. Medicare program; hospital inpatient prospective payment systems for acute care hospitals and the long-term care hospital prospective payment system and fiscal year 2014 rates; quality reporting requirements for specific providers; hospital conditions of participation; payment policies related to patient status. Final rules. Fed Regist. 2013;78(160):50495-51040. PubMed
16. Kangovi S, Cafardi SG, Smith RA, Kulkarni R, Grande D. Patient financial responsibility for observation care. J Hosp Med. 2015;10(11):718-723. PubMed
As the US population ages and becomes increasingly frail, the need for rehabilitation rises. By 2030, an estimated 20% of the population will be 65 years old or older, and almost 10% will be over 75.1 About 20% of hospitalized Medicare patients receive subsequent care in postacute inpatient rehabilitation (PAIR) facilities, accounting for $31 billion in Medicare expenditures in 2014.2 Although the need for rehabilitation will continue to rise, Medicare policy restricts access to it.
Under Medicare policy, PAIR services are covered for certain hospitalized patients but not others. Hospitalized patients are either inpatients, who are billed under Medicare Part A, or outpatients, billed under Part B. When hospital length of stay (LOS) is anticipated to be less than 2 midnights, patients are admitted as outpatients under the term observation status; when longer stays are expected, patients are admitted as inpatients.3 This recently implemented time-based distinction has been criticized as arbitrary, and as potentially shifting many patients from inpatient to outpatient (observation) status.4
The distinction between inpatient and observation status has significant consequences for posthospital care. Medicare Part A covers care in skilled nursing facilities (SNFs) and acute inpatient rehabilitation facilities (IRFs); after hospitalization, inpatients have access to either, without copay. As observation patients are covered under Medicare Part B, they are technically not covered for either service after their hospital stay. IRFs sometimes accept patients from ambulatory and nonacute settings; observation patients may be accepted in rare circumstances, but they pay the Part A deductible ($1288 in 2016) to have the services covered by Medicare. SNF services are never covered for observation patients, and access to this care requires an average out-of-pocket payment of more than $10,503 per beneficiary for a typical SNF stay.5 Given that about 70% of Medicare patients fall below 300% of the federal poverty line,6 the out-of-pocket costs for PAIR services for observation patients can be prohibitive.
Although only 0.75% of community-dwelling Medicare observation patients are discharged to PAIR facilities,7 it is unclear if the need for this care is higher but remains unmet secondary to cost concerns of Medicare beneficiaries. Also unclear is whether observation patients who would benefit from this care but do not receive it end up with poorer health outcomes and therefore use more healthcare services.
The purpose of this study was to estimate the proportion of Medicare observation patients who are admitted from home and receive a recommendation for placement in a PAIR facility, and to determine the ultimate disposition of such patients. We also sought to evaluate the association between recommendation for PAIR placement, LOS, and 30-day hospital revisit rate.
METHODS
The Institutional Review Board of Christiana Care Health System (CCHS) approved this study.
Sample and Design
This was an observational study of community-dwelling Medicare patients admitted under observation status to Delaware’s CCHS, which consists of a 907-bed regional tertiary-care facility in Newark and a 241-bed community hospital in Wilmington. The study period was January 1 to December 31, 2013. We limited our sample to patients treated by hospitalists on hospital wards, as this care constitutes 80% of the care provided to observation patients at CCHS and the majority of care nationally.8 As neither SNF care nor IRF care is covered under Medicare Part B, and both would result in high out-of-pocket costs for Medicare observation patients, we combined them into a single variable, PAIR.
All data were obtained from institutional electronic medical record and administrative data systems. Study inclusion criteria were Medicare as primary insurance, admission to hospital from home, and care received at either CCHS facility. Exclusion criteria were admission from PAIR facility, long-term care facility, assisted-living facility, or inpatient psychiatric facility; death; discharge against medical advice (AMA) or to hospice, non-SNF, or inpatient psychiatric facility; and discovery (during review of case management [CM] notes) of erroneous listing of Medicare as primary insurance, or of inpatient admission (within 30 days before index observation stay) that qualified for PAIR coverage under Medicare Part A.
We reviewed the medical charts of a representative (~30%) sample of the cohort and examined physical therapy (PT) and CM notes to determine the proportions of patients with recommendations for home with no services, home-based PT, possible PAIR, and PAIR. Charts were sorted by medical record number and were reviewed in consecutive order. We coded a patient as having a recommendation for possible PAIR if the PT notes indicated the patient may benefit from PAIR but could have home PT if PAIR placement was not possible. CM notes were also reviewed for evidence of patient or family preference regarding PAIR placement. All questions about PT and CM recommendations were resolved by consensus.
Measures
For the total study sample, we calculated descriptive statistics and frequencies for demographic and administrative variables, including age, sex, race (Caucasian, African American, other), ethnicity (Hispanic/non-Hispanic), ICD-9 (International Classification of Diseases, Ninth Revision) primary diagnosis code, LOS (in hours) for index observation admission, discharge disposition (home with no services, home PT, possible PAIR, PAIR), and 30-day hospital revisit (emergency department, observation, inpatient admission). We used χ2 test, Student t test, and analysis of variance (ANOVA) to test for statistically significant differences in characteristics between the chart review subgroup and the rest of the sample and between the groups with different disposition recommendations from PT notes.
For the chart review subgroup, we used ANOVA to calculate the unadjusted association between PT recommendation and LOS. We then adjusted for potential confounders, using multivariable linear regression with PT recommendation as a predictor and LOS as the outcome, controlling for variables previously associated with increased LOS among observation patients (primary diagnosis category, age, sex).6 We also adjusted for hospitalist group to account for potential variability in care delivery. As LOS was not normally distributed, we calculated the fourth root of LOS, which resulted in a more normal distribution, and used the transformed values in the regression model. We then calculated predicted values from the regression and back-transformed these to obtain adjusted mean values for LOS.
RESULTS
Of the 1417 unique patients who had Medicare as primary insurance and were admitted under observation status to a hospitalist service during the study period (2013), 94 were excluded (Figure). Of the remaining 1323 patients, the majority were 65 years old or older, female, white, and non-Hispanic. The most common ICD-9 diagnoses were syncope and chest pain. Mean LOS was 46.7 hours (range, 0-519 h). Less than 1% of patients were discharged to PAIR. Almost 25% of patients returned to the hospital, either for an emergency department visit or for observation or inpatient stay, within 30 days (Table).
Of the 419 charts reviewed to determine the proportion of patients evaluated by PT, and their subsequent recommendations, 33 were excluded, leaving 386 (92%) for analysis (Figure). There were no significant demographic differences between the patients in the chart review subgroup and the rest of the patients (Appendix). Of the 386 patients whose charts were analyzed, 181 (46.9%) had a PT evaluation, and 17 (4.4%) received a PAIR recommendation (Figure). Of the 17 patients recommended for PAIR, 12 (70.5%) were 65 years old or older, and 1 was discharged to a PAIR facility. Of the 46 patients recommended for home PT, 29 (63%) were discharged home with no services (Table).
PT-evaluated patients had unadjusted mean LOS of 52.2 hours (discharged home with no services), 64.1 hours (home PT or possible PAIR), and 83.1 hours (PAIR) (P = 0.001). With adjustment made for variables previously associated with increased LOS for observation patients, mean LOS for patients recommended for PAIR remained higher than that for patients in the other 2 categories (Table). Patients recommended for PAIR were more likely to return to hospital within 30 days than patients recommended for home PT or possible PAIR and patients discharged home with no services (Table).
Review of CM notes revealed that, of the 17 patients recommended for PAIR, 7 would have accepted PAIR services had they been covered by Medicare, 4 preferred discharge with home health services, and 6 did not provide clear details of patient or family preference.
DISCUSSION
To our knowledge, this is the first study to use chart review to examine the proportion of observation patients who would benefit from PAIR and the relationships among these patients’ rehabilitation needs, dispositions, and outcomes. We tried to be conservative in our estimates by limiting the study population to patients admitted from home. Nevertheless, the potential need for PAIR significantly outweighed the actual use of PAIR on discharge. The study sample was consistent with nationally representative samples of observation patients in terms of proportion of patients admitted from and discharged to facilities7 and the most common ICD-9 diagnoses.9
Physical Therapy Consultations and Observation
Of the 386 patients whose charts were reviewed and analyzed, 17 (4.4%) were evaluated as medically qualifying for and potentially benefiting from PAIR. Although the rate represents a minority of patients, it is 5- to 6-fold higher than the rate of discharge to PAIR, both in our study population and in previous national samples that used administrative data.7 In some cases, the decision not to discharge the patient to PAIR reflected patient and family preference. However, in other cases, patients clearly could have benefited from PAIR and would have gone had it been covered by Medicare. The gap suggests an unmet need for PAIR among a substantial proportion of Medicare beneficiaries for whom the therapy is recommended and wanted.
Efforts to expand coverage for PAIR have been resisted. According to Medicare regulations, beneficiaries qualify for PAIR coverage if they are hospitalized as inpatients for 3 midnights or longer. Days under observation status do not count toward this requirement, even if this status is changed to inpatient.10 The Medicare Payment Advisory Commission (MedPAC) recommendation that time under observation status count toward the Medicare requirement11 has not been accepted,12 in large part because further expansion of PAIR services likely would be unaffordable to Medicare under its payment structure.13 Given our finding that the need for PAIR likely is much higher than previously anticipated, Medicare policy makers should consider broadening access to PAIR while efforts are made to rein in expenditures through payment reform.
One potential area of cost savings is more judicious use of PT evaluation for observation patients, particularly given our finding that the majority of PT consultations resulted in no further recommendations. Efforts to triage PT consultations for appropriateness have had some success, though the literature is scant.14 To improve value for Medicare, healthcare systems, and patients, researchers should rigorously evaluate approaches that maximize
Hospital Length of Stay
Our cohort’s mean hospital stay was longer than averages reported elsewhere,9 likely reflecting our selection of Medicare patients rather than a general medicine population.6 However, our cohort’s adjusted mean hospital stay was significantly longer for patients recommended for PAIR than for patients without PT needs. That out-of-pocket costs for observation patients increase dramatically as LOS goes past 48 hours6 could have significant financial implications for Medicare beneficiaries.
Return Visits
Almost 25% of our observation patients returned to hospital within 30 days. There was a significant trend toward increased rehospitalization among patients recommended for PAIR than among patients with no PT needs.
Policies related to PAIR for observation patients are rooted in the concern that expanded access to services will contribute to overuse of services and higher healthcare costs.15 However, patients who could have benefited from PAIR but were not covered also were at risk for increased healthcare use and costs. A recent study found that more than one fourth of observation patients with repeat observation stays accrued excessive financial liability.16 Researchers should determine more precisely how the cost of coverage for PAIR placement on an index observation admission compares with the cost of subsequent healthcare use potentially related to insufficient supportive care at home.
Study Limitations
Our results must be interpreted within the context of study limitations. First is the small sample size, particularly the subset of patients selected for detailed manual chart review. We were limited in our ability to calculate sample size prospectively because we were unaware of prior work that described the association between PT recommendation and outcomes among observation patients. However, post hoc analysis estimated that a sample size of 181 patients would have been needed to determine a statistically significant difference in 30-day hospital revisit between patients recommended for PAIR and patients with no PT needs with 80% power, which we achieved. Although there are significant limitations to post hoc sample size estimation, we consider our work hypothesis-generating and hope it will lead to larger studies.
We could not account for the potential bias of the physical therapists, whose evaluations could have been influenced by knowledge of patients’ observation status. Our findings could have underestimated the proportion of patients who otherwise would have been recommended for PAIR. Alternatively, therapists could have inaccurately assessed and overstated the need for PAIR. Although we could not account for the therapists’ accuracy and biases, their assessments provided crucial information beyond what was previously obtained from administrative data alone.7,9
Hospital revisits were only accounted for within our hospital system—another potential source of underestimated findings. A significant proportion of patients recommended for home PT were discharged without services, which is counterintuitive, as Medicare covers home nursing services for observation patients. This finding most likely reflects administrative error but probably merits further evaluation.
Last, causality cannot be inferred from the results of a retrospective observational study.
CONCLUSION
As our study results suggest, there is an unmet need for PAIR services for Medicare observation patients, and LOS and subsequent use may be increased among patients recommended for PAIR. Our estimates are conservative and may underestimate the true need for services within this population. Our findings bolster MedPAC recommendations to amend the policies for Medicare coverage of PAIR services for observation patients.
Acknowledgment
The authors thank Paul Kolm, PhD, for statistical support.
Disclosures
Dr. Schwartz reports receiving personal fees from the Agency for Health Research and Quality, Bayer, the Blue Cross Blue Shield Association, Pfizer, and Takeda, all outside the submitted work. Dr. Hicks is supported by an Institutional Development Award from the National Institute of General Medical Sciences of the National Institutes of Health (grant U54-GM104941; principal investigator Stuart Binder-Macleod, PT, PhD, FAPTA). The other authors have nothing to report.
1. Ortman JM, Velkoff VA, Hogan H. An Aging Nation: The Older Population in the United States (Current Population Reports, P25-1140). Washington, DC: US Census Bureau; 2014. https://www.census.gov/prod/2014pubs/p25-1140.pdf. Published May 2014. Accessed January 1, 2016.
2. Carter C, Garrett B, Wissoker D. The Need to Reform Medicare’s Payments to Skilled Nursing Facilities Is as Strong as Ever. Washington, DC: Medicare Payment Advisory Commission & Urban Institute; 2015. http://www.urban.org/sites/default/files/publication/39036/2000072-The-Need-to-Reform-Medicare-Payments-to-SNF.pdf. Published January 2015. Accessed January 1, 2016.
3. Cassidy A. The two-midnight rule (Health Policy Brief). HealthAffairs website. http://healthaffairs.org/healthpolicybriefs/brief_pdfs/healthpolicybrief_133.pdf. Published January 22, 2015. Accessed January 1, 2016.
4. Sheehy AM, Caponi B, Gangireddy S, et al. Observation and inpatient status: clinical impact of the 2-midnight rule. J Hosp Med. 2014;9(4):203-209. PubMed
5. Wright S. Memorandum report: hospitals’ use of observation stays and short inpatient stays for Medicare beneficiaries (OEI-02-12-00040). Washington, DC: US Dept of Health and Human Services, Office of Inspector General; 2013. https://oig.hhs.gov/oei/reports/oei-02-12-00040.pdf. Published July 29, 2013. Accessed January 1, 2016.
6. Hockenberry JM, Mutter R, Barrett M, Parlato J, Ross MA. Factors associated with prolonged observation services stays and the impact of long stays on patient cost. Health Serv Res. 2014;49(3):893-909. PubMed
7. Feng Z, Jung HY, Wright B, Mor V. The origin and disposition of Medicare observation stays. Med Care. 2014;52(9):796-800. PubMed
8. Ross MA, Hockenberry JM, Mutter R, Barrett M, Wheatley M, Pitts SR. Protocol-driven emergency department observation units offer savings, shorter stays, and reduced admissions. Health Aff. 2013;32(12):2149-2156. PubMed
9. Sheehy AM, Graf B, Gangireddy S, et al. Hospitalized but not admitted: characteristics of patients with “observation status” at an academic medical center. JAMA Intern Med. 2013;173(21):1991-1998. PubMed
10. Centers for Medicare & Medicaid Services. Medicare & Your Hospital Benefits. https://www.medicare.gov/Pubs/pdf/11408.pdf. CMS Product 11408. Published 2014. Revised March 2016. Accessed February 6, 2017.
11. Medicare Payment Advisory Commission. Hospital short-stay policy issues. In: Report to the Congress: Medicare and the Health Care Delivery System. Washington, DC: Medicare Payment Advisory Commission; 2015:173-204. http://www.medpac.gov/docs/default-source/reports/chapter-7-hospital-short-stay-policy-issues-june-2015-report-.pdf. Published June 2015. Accessed January 1, 2016.
12. Centers for Medicare & Medicaid Services (CMS), HHS. Medicare program: hospital outpatient prospective payment and ambulatory surgical center payment systems and quality reporting programs; short inpatient hospital stays; transition for certain Medicare-dependent, small rural hospitals under the hospital inpatient prospective payment system; provider administrative appeals and judicial review. Final rule with comment period; final rule. Fed Regist. 2015;80(219):70297-70607. PubMed
13. Medicare Payment Advisory Commission. Skilled nursing facility services. In: Report to the Congress: Medicare Payment Policy. Washington, DC: Medicare Payment Advisory Commission; 2015:181-209. http://www.medpac.gov/docs/default-source/reports/chapter-8-skilled-nursing-facility-services-march-2015-report-.pdf. Published March 2015. Accessed January 1, 2016.
14. Hobbs JA, Boysen JF, McGarry KA, Thompson JM, Nordrum JT. Development of a unique triage system for acute care physical therapy and occupational therapy services: an administrative case report. Phys Ther. 2010;90(10):1519-1529. PubMed
15. Centers for Medicare & Medicaid Services (CMS), HHS. Medicare program; hospital inpatient prospective payment systems for acute care hospitals and the long-term care hospital prospective payment system and fiscal year 2014 rates; quality reporting requirements for specific providers; hospital conditions of participation; payment policies related to patient status. Final rules. Fed Regist. 2013;78(160):50495-51040. PubMed
16. Kangovi S, Cafardi SG, Smith RA, Kulkarni R, Grande D. Patient financial responsibility for observation care. J Hosp Med. 2015;10(11):718-723. PubMed
© 2017 Society of Hospital Medicine
Hospital medicine resident training tracks: Developing the hospital medicine pipeline
The field of hospital medicine (HM) is rapidly expanding in the areas of clinical medicine, administration, and quality improvement (QI).1 Emerging with this growth is a gap in the traditional internal medicine (IM) training and skills needed to be effective in HM.1,2 These skills include clinical and nonclinical aptitudes, such as process improvement, health care economics, and leadership.1-3 However, resident education on these topics must compete with other required curricular content in IM residency training.2,4 Few IM residencies offer focused HM training that emphasizes key components of successful HM careers.3,5
Within the past decade, designated HM tracks within IM residency programs have been proposed as a potential solution. Initially, calls for such tracks focused on gaps in the clinical competencies required of hospitalists.1 Tracks have since evolved to also include skills required to drive high-value care, process improvement, and scholarship. Designated HM tracks address these areas through greater breadth of curricula, additional time for reflection, participation in group projects, and active application to clinical care.4 We conducted a study to identify themes that could inform the ongoing evolution of dedicated HM tracks.
METHODS
Programs were initially identified through communication among professional networks. The phrases hospital medicine residency track and internal medicine residency hospitalist track were used in broader Google searches, as there is no database of such tracks. Searches were performed quarterly during the 2015–2016 academic year. The top 20 hits were manually filtered to identify tracks affiliated with major academic centers. IM residency program websites provided basic information for programs with tracks. We excluded tracks focused entirely on QI6 because, though a crucial part of HM, QI training alone is probably insufficient for preparing residents for success as hospitalists on residency completion. Similarly, IM residencies with stand-alone HM clinical rotations without longitudinal HM curricula were excluded.
Semistructured interviews with track directors were conducted by e-mail or telephone for all tracks except one, the details of which are published.7 We tabulated data and reviewed qualitative information to identify themes among the different tracks. As this study did not involve human participants, Institutional Review Board approval was not needed.
RESULTS
We identified 11 HM residency training programs at major academic centers across the United States: Cleveland Clinic, Stanford University, Tulane University, University of California Davis, University of California Irvine, University of Colorado, University of Kentucky, University of Minnesota, University of New Mexico, Virginia Commonwealth University, and Wake Forest University (Table 1). We reviewed the websites of about 10 other programs, but none suggested existence of a track. Additional programs contacted reported no current track.

Track Participants and Structure
HM tracks mainly target third-year residents (Table 1). Some extend into the second year of residency, and 4 have opportunities for intern involvement, including a separate match number at Colorado. Tracks accept up to 12 residents per class. Two programs, at Colorado and Virginia, are part of IM programs in which all residents belong to a track (eg, HM, primary care, research).
HM track structures vary widely and are heavily influenced by the content delivery platforms of their IM residency programs. Several HM track directors emphasized the importance of fitting into existing educational frameworks to ensure access to residents and to minimize the burden of participation. Four programs deliver the bulk of their nonclinical content in dedicated blocks; 6 others use brief recurring sessions to deliver smaller aliquots longitudinally (Table 1). The number of protected hours for content delivery ranges from 10 to more than 40 annually. All tracks use multiple content delivery modes, including didactic sessions and journal clubs. Four tracks employ panel discussions to explore career options within HM. Several also use online platforms, including discussions, readings, and modules.
Quality Improvement
The vast majority of curricula prominently feature experiential QI project involvement (Table 2). These mentored longitudinal projects allow applied delivery of content, such as QI methods and management skills. Four tracks use material from the Institute for Healthcare Improvement.8 Several also offer dedicated QI rotations that immerse residents in ongoing QI efforts.

Institutional partnerships support these initiatives at several sites. The Minnesota track is a joint venture of the university and Regions Hospital, a nonprofit community hospital. The Virginia track positions HM residents to lead university-wide interdisciplinary QI teams. For project support, the Colorado and Kentucky tracks partner with local QI resources—the Institute for Healthcare Quality, Safety, and Efficiency at Colorado and the Office of Value and Innovation in Healthcare Delivery at Kentucky.
Health Care Economics and Value
Many programs leverage the rapidly growing emphasis on health care “value” as an opportunity for synergy between IM programs and HM tracks. Examples include involving residents in efforts to improve documentation or didactic instruction on topics such as health care finance. The New Mexico and Wake Forest tracks offer elective rotations on health care economics. Several track directors mentioned successfully expanding curricula on health care value from the HM track into IM residency programs at large, providing a measurable service to the residency programs while ensuring content delivery and freeing up additional time for track activities.
Scholarship and Career Development
Most programs provide targeted career development for residents. Six tracks provide sessions on job procurement skills, such as curriculum vitae preparation and interviewing (Table 2). Many also provide content on venues for disseminating scholarly activity. The Colorado, Kentucky, New Mexico, and Tulane programs feature content on abstract and poster creation. Leadership development is addressed in several tracks through dedicated track activities or participation in discrete, outside-track events. Specifically, Colorado offers a leadership track for residents interested in hospital administration, Cleveland has a leadership journal club, Wake Forest enrolls HM residents in leadership training available through the university, and Minnesota sends residents to the Society of Hospital Medicine’s Leadership Academy (Table 2).
Clinical Rotations
Almost all tracks include a clinical rotation, typically pairing residents directly with hospitalist attendings to encourage autonomy and mentorship. Several also offer elective rotations in various disciplines within HM (Table 2). The Kentucky and Virginia tracks incorporate working with advanced practice providers into their practicums. The Cleveland, Minnesota, Tulane, and Virginia tracks offer HM rotations in community hospitals or postacute settings.
HM rotations also pair clinical experiences with didactic education on relevant topics (eg, billing and coding). The Cleveland, Minnesota, and Virginia tracks developed clinical rotations reflecting the common 7-on and 7-off schedule with nonclinical obligations, such as seminars linking specific content to clinical experiences, during nonclinical time.
DISCUSSION
Our investigation into the current state of HM training found that HM track curricula focus largely on QI, health care economics, and professional development. This focus likely developed in response to hospitalists’ increasing engagement in related endeavors. HM tracks have dynamic and variable structures, reflecting an evolving field and the need to fit into existing IM residency program structures. Similarly, the content covered in HM tracks is tightly linked to perceived opportunities within IM residency curricula. The heterogeneity of content suggests the breadth and ambiguity of necessary competencies for aspiring hospitalists. One of the 11 tracks has not had any residents enroll within the past few years—a testament to the continued effort necessary to sustain such tracks, including curricular updates and recruiting. Conversely, many programs now share track content with the larger IM residency program, suggesting HM tracks may be near the forefront of medical education in some areas.
Our study had several limitations. As we are unaware of any databases of HM tracks, we discussed tracks with professional contacts, performed Internet searches, and reviewed IM residency program websites. Our search, however, was not exhaustive; despite our best efforts, we may have missed or mischaracterized some track offerings. Nevertheless, we think that our analysis represents the first thorough compilation of HM tracks and that it will be useful to institutions seeking to create or enhance HM-specific training.
As the field continues to evolve, we are optimistic about the future of HM training. We suspect that HM residency training tracks will continue to expand. More work is needed so these tracks can adjust to the changing HM and IM residency program landscapes and supply well-trained physicians for the HM workforce.
Acknowledgment
The authors thank track directors Alpesh Amin, David Gugliotti, Rick Hilger, Karnjit Johl, Nasir Majeed, Georgia McIntosh, Charles Pizanis, and Jeff Wiese for making this study possible.
Disclosure
Nothing to report.
1. Glasheen JJ, Siegal EM, Epstein K, Kutner J, Prochazka AV. Fulfilling the promise of hospital medicine: tailoring internal medicine training to address hospitalists’ needs [published correction appears in J Gen Intern Med. 2008;23(11):1931]. J Gen Intern Med. 2008;23(7):1110-1115. PubMed
2. Arora V, Guardiano S, Donaldson D, Storch I, Hemstreet P. Closing the gap between internal medicine training and practice: recommendations from recent graduates. Am J Med. 2005;118(6):680-685. PubMed
3. Glasheen JJ, Goldenberg J, Nelson JR. Achieving hospital medicine’s promise through internal medicine residency redesign. Mt Sinai J Med. 2008;75(5):436-441. PubMed
4. Wiese J. Residency training: beginning with the end in mind. J Gen Intern Med. 2008;23(7):1122-1123. PubMed
5. Glasheen JJ, Epstein KR, Siegal E, Kutner JS, Prochazka AV. The spectrum of community-based hospitalist practice: a call to tailor internal medicine residency training. Arch Intern Med. 2007;167(7):727-728. PubMed
6. Patel N, Brennan PJ, Metlay J, Bellini L, Shannon RP, Myers JS. Building the pipeline: the creation of a residency training pathway for future physician leaders in health care quality. Acad Med. 2015;90(2):185-190. PubMed
7. Kumar A, Smeraglio A, Witteles R, et al. A resident-created hospitalist curriculum for internal medicine housestaff. J Hosp Med. 2016;11(9):646-649. PubMed
8. Institute for Healthcare Improvement website. http://www.ihi.org. Accessed December 15, 2015.
The field of hospital medicine (HM) is rapidly expanding in the areas of clinical medicine, administration, and quality improvement (QI).1 Emerging with this growth is a gap in the traditional internal medicine (IM) training and skills needed to be effective in HM.1,2 These skills include clinical and nonclinical aptitudes, such as process improvement, health care economics, and leadership.1-3 However, resident education on these topics must compete with other required curricular content in IM residency training.2,4 Few IM residencies offer focused HM training that emphasizes key components of successful HM careers.3,5
Within the past decade, designated HM tracks within IM residency programs have been proposed as a potential solution. Initially, calls for such tracks focused on gaps in the clinical competencies required of hospitalists.1 Tracks have since evolved to also include skills required to drive high-value care, process improvement, and scholarship. Designated HM tracks address these areas through greater breadth of curricula, additional time for reflection, participation in group projects, and active application to clinical care.4 We conducted a study to identify themes that could inform the ongoing evolution of dedicated HM tracks.
METHODS
Programs were initially identified through communication among professional networks. The phrases hospital medicine residency track and internal medicine residency hospitalist track were used in broader Google searches, as there is no database of such tracks. Searches were performed quarterly during the 2015–2016 academic year. The top 20 hits were manually filtered to identify tracks affiliated with major academic centers. IM residency program websites provided basic information for programs with tracks. We excluded tracks focused entirely on QI6 because, though a crucial part of HM, QI training alone is probably insufficient for preparing residents for success as hospitalists on residency completion. Similarly, IM residencies with stand-alone HM clinical rotations without longitudinal HM curricula were excluded.
Semistructured interviews with track directors were conducted by e-mail or telephone for all tracks except one, the details of which are published.7 We tabulated data and reviewed qualitative information to identify themes among the different tracks. As this study did not involve human participants, Institutional Review Board approval was not needed.
RESULTS
We identified 11 HM residency training programs at major academic centers across the United States: Cleveland Clinic, Stanford University, Tulane University, University of California Davis, University of California Irvine, University of Colorado, University of Kentucky, University of Minnesota, University of New Mexico, Virginia Commonwealth University, and Wake Forest University (Table 1). We reviewed the websites of about 10 other programs, but none suggested existence of a track. Additional programs contacted reported no current track.
Track Participants and Structure
HM tracks mainly target third-year residents (Table 1). Some extend into the second year of residency, and 4 have opportunities for intern involvement, including a separate match number at Colorado. Tracks accept up to 12 residents per class. Two programs, at Colorado and Virginia, are part of IM programs in which all residents belong to a track (eg, HM, primary care, research).
HM track structures vary widely and are heavily influenced by the content delivery platforms of their IM residency programs. Several HM track directors emphasized the importance of fitting into existing educational frameworks to ensure access to residents and to minimize the burden of participation. Four programs deliver the bulk of their nonclinical content in dedicated blocks; 6 others use brief recurring sessions to deliver smaller aliquots longitudinally (Table 1). The number of protected hours for content delivery ranges from 10 to more than 40 annually. All tracks use multiple content delivery modes, including didactic sessions and journal clubs. Four tracks employ panel discussions to explore career options within HM. Several also use online platforms, including discussions, readings, and modules.
Quality Improvement
The vast majority of curricula prominently feature experiential QI project involvement (Table 2). These mentored longitudinal projects allow applied delivery of content, such as QI methods and management skills. Four tracks use material from the Institute for Healthcare Improvement.8 Several also offer dedicated QI rotations that immerse residents in ongoing QI efforts.
Institutional partnerships support these initiatives at several sites. The Minnesota track is a joint venture of the university and Regions Hospital, a nonprofit community hospital. The Virginia track positions HM residents to lead university-wide interdisciplinary QI teams. For project support, the Colorado and Kentucky tracks partner with local QI resources—the Institute for Healthcare Quality, Safety, and Efficiency at Colorado and the Office of Value and Innovation in Healthcare Delivery at Kentucky.
Health Care Economics and Value
Many programs leverage the rapidly growing emphasis on health care “value” as an opportunity for synergy between IM programs and HM tracks. Examples include involving residents in efforts to improve documentation or didactic instruction on topics such as health care finance. The New Mexico and Wake Forest tracks offer elective rotations on health care economics. Several track directors mentioned successfully expanding curricula on health care value from the HM track into IM residency programs at large, providing a measurable service to the residency programs while ensuring content delivery and freeing up additional time for track activities.
Scholarship and Career Development
Most programs provide targeted career development for residents. Six tracks provide sessions on job procurement skills, such as curriculum vitae preparation and interviewing (Table 2). Many also provide content on venues for disseminating scholarly activity. The Colorado, Kentucky, New Mexico, and Tulane programs feature content on abstract and poster creation. Leadership development is addressed in several tracks through dedicated track activities or participation in discrete, outside-track events. Specifically, Colorado offers a leadership track for residents interested in hospital administration, Cleveland has a leadership journal club, Wake Forest enrolls HM residents in leadership training available through the university, and Minnesota sends residents to the Society of Hospital Medicine’s Leadership Academy (Table 2).
Clinical Rotations
Almost all tracks include a clinical rotation, typically pairing residents directly with hospitalist attendings to encourage autonomy and mentorship. Several also offer elective rotations in various disciplines within HM (Table 2). The Kentucky and Virginia tracks incorporate working with advanced practice providers into their practicums. The Cleveland, Minnesota, Tulane, and Virginia tracks offer HM rotations in community hospitals or postacute settings.
HM rotations also pair clinical experiences with didactic education on relevant topics (eg, billing and coding). The Cleveland, Minnesota, and Virginia tracks developed clinical rotations reflecting the common 7-on and 7-off schedule with nonclinical obligations, such as seminars linking specific content to clinical experiences, during nonclinical time.
DISCUSSION
Our investigation into the current state of HM training found that HM track curricula focus largely on QI, health care economics, and professional development. This focus likely developed in response to hospitalists’ increasing engagement in related endeavors. HM tracks have dynamic and variable structures, reflecting an evolving field and the need to fit into existing IM residency program structures. Similarly, the content covered in HM tracks is tightly linked to perceived opportunities within IM residency curricula. The heterogeneity of content suggests the breadth and ambiguity of necessary competencies for aspiring hospitalists. One of the 11 tracks has not had any residents enroll within the past few years—a testament to the continued effort necessary to sustain such tracks, including curricular updates and recruiting. Conversely, many programs now share track content with the larger IM residency program, suggesting HM tracks may be near the forefront of medical education in some areas.
Our study had several limitations. As we are unaware of any databases of HM tracks, we discussed tracks with professional contacts, performed Internet searches, and reviewed IM residency program websites. Our search, however, was not exhaustive; despite our best efforts, we may have missed or mischaracterized some track offerings. Nevertheless, we think that our analysis represents the first thorough compilation of HM tracks and that it will be useful to institutions seeking to create or enhance HM-specific training.
As the field continues to evolve, we are optimistic about the future of HM training. We suspect that HM residency training tracks will continue to expand. More work is needed so these tracks can adjust to the changing HM and IM residency program landscapes and supply well-trained physicians for the HM workforce.
Acknowledgment
The authors thank track directors Alpesh Amin, David Gugliotti, Rick Hilger, Karnjit Johl, Nasir Majeed, Georgia McIntosh, Charles Pizanis, and Jeff Wiese for making this study possible.
Disclosure
Nothing to report.
1. Glasheen JJ, Siegal EM, Epstein K, Kutner J, Prochazka AV. Fulfilling the promise of hospital medicine: tailoring internal medicine training to address hospitalists’ needs [published correction appears in J Gen Intern Med. 2008;23(11):1931]. J Gen Intern Med. 2008;23(7):1110-1115. PubMed
2. Arora V, Guardiano S, Donaldson D, Storch I, Hemstreet P. Closing the gap between internal medicine training and practice: recommendations from recent graduates. Am J Med. 2005;118(6):680-685. PubMed
3. Glasheen JJ, Goldenberg J, Nelson JR. Achieving hospital medicine’s promise through internal medicine residency redesign. Mt Sinai J Med. 2008;75(5):436-441. PubMed
4. Wiese J. Residency training: beginning with the end in mind. J Gen Intern Med. 2008;23(7):1122-1123. PubMed
5. Glasheen JJ, Epstein KR, Siegal E, Kutner JS, Prochazka AV. The spectrum of community-based hospitalist practice: a call to tailor internal medicine residency training. Arch Intern Med. 2007;167(7):727-728. PubMed
6. Patel N, Brennan PJ, Metlay J, Bellini L, Shannon RP, Myers JS. Building the pipeline: the creation of a residency training pathway for future physician leaders in health care quality. Acad Med. 2015;90(2):185-190. PubMed
7. Kumar A, Smeraglio A, Witteles R, et al. A resident-created hospitalist curriculum for internal medicine housestaff. J Hosp Med. 2016;11(9):646-649. PubMed
8. Institute for Healthcare Improvement website. http://www.ihi.org. Accessed December 15, 2015.
© 2017 Society of Hospital Medicine
Family report compared to clinician-documented diagnoses for psychiatric conditions among hospitalized children
Psychiatric conditions affect 1 in 5 children,1,2 and having a comorbid psychiatric condition is associated with worse outcomes in children hospitalized for medical or surgical indications.3-7 Although little is known about interventions for improving outcomes for hospitalized children with psychiatric conditions,8 several interventions that integrate medical and psychiatric care are known to improve ambulatory patient outcomes.9-14 The success of initiatives that test whether integrated medical and psychiatric care models can improve pediatric hospital outcomes depends on reliable identification of comorbid psychiatric conditions and family and clinician having a shared understanding of a patient’s psychiatric diagnoses.
Mental health care system fragmentation, stigma, and privacy issues15-20 may contribute to clinical teams and families having disparate views of psychiatric comorbidities. Evidence suggests that hospital clinicians caring for pediatric medical and surgical inpatients are often unaware of a psychiatric condition that has been diagnosed or managed in the ambulatory setting,3,6 even in cases in which the patient and family are aware of the diagnosis. Conversely, for other patients, clinicians may be aware of a psychiatric diagnosis, but patient and family may not share that understanding or reliably report a psychiatric diagnosis.21-23 Although hospitalization may not be the ideal setting for identifying a new psychiatric diagnosis, given the short-term relationship between patient and clinical care team, addressing and managing a psychiatric comorbidity that is known to family or clinician are important elements of patient-centered hospital care.
The success of interventions in improving hospital outcomes for hospitalized children with psychiatric comorbidity depends on patients, families, and clinicians having a shared understanding of which patients have psychiatric conditions, and on accurate estimates of the scope of the population in need of psychiatric care during pediatric hospitalization.
We conducted a study to compare estimates of point prevalence of psychiatric comorbidity identified by family report (FR) or clinician documentation (CD) and to determine the degree of FR–CD agreement regarding the presence of psychiatric comorbidity in hospitalized children.
METHODS
We estimated point prevalence and determined FR–CD agreement regarding diagnosed psychiatric comorbidities in a cross-sectional sample of pediatric medical and surgical hospitalizations at Children’s Hospital of Philadelphia (CHOP). CHOP is a free-standing 535-bed children’s hospital that serves as a community hospital for the city of Philadelphia; a regional referral center for eastern Pennsylvania, Delaware, and southern New Jersey; and a national and international quaternary referral center. This study was approved by CHOP’s institutional review board.
Patients eligible for inclusion in the study were 4 to 21 years old and hospitalized for a medical or surgical indication. Patients were ineligible if they were hospitalized for a primary psychiatric indication, were medically unstable (eg, received end-of-life care or escalating interventions for a life-threatening condition), had significant cognitive impairment precluding communication (eg, history of severe hypoxic-ischemic encephalopathy), or did not speak English (pertains to consenting parent, guardian, or patient).
The cross-sectional patient sample was selected using a point prevalence recruitment strategy. All eligible patients on each of CHOP’s 20 inpatient medical, surgical, and critical care units were approached for study participation on 2 dates between July 2015 and March 2016. To avoid enrolling the same patient multiple times for a single hospitalization, we separated recruitment dates on each unit by at least 3 months. A goal sample size of 100 to 150 patients was selected to provide precision sufficient to achieve a confidence interval (CI) of 10% around an estimate of the point prevalence of any mental health condition.
To obtain family report of prior psychiatric diagnoses, we interviewed patients and/or their parents during the hospitalization. For 18- to 21-year-old patients, the adolescent patient completed the interview. For patients under 18 years old, parents completed the interview, and for 14- to 17-year-old adolescents,either the parent, the patient, or both could complete the interview. Adolescents were asked to complete the interview confidentially without a parent present. The structured interview included questions derived from the National Survey of Children’s Health24 and the Services Assessment for Children and Adolescents22 to report the patient’s active psychiatric conditions. Interviewees reported whether the patient had ever been diagnosed with any psychiatric disorder, whether the condition was ongoing in the year prior to hospitalization, and whether the patient received any mental health services in clinical settings or school in the 12 months prior to hospitalization.
For CD, we identified a psychiatric diagnosis associated with the index hospitalization if a psychiatric diagnosis was noted in the patient’s admission note, discharge summary, or hospital problem list, or if an International Classification of Diseases (ICD) code for a psychiatric diagnosis was submitted for billing for the index hospitalization. The Healthcare Cost and Utilization Project condition classification system was used to sort psychiatric condition codes25-27 into 5 categories: attention-deficit/hyperactivity disorder (ADHD), anxiety disorders, depression, disruptive behavior disorders, and autism spectrum disorders. A residual category of other, less common psychiatric conditions included eating disorders, attachment disorders, and bipolar disorder.
For each condition category, we determined the point prevalence of having a psychiatric diagnosis identified by FR and having a diagnosis identified by CD. We used McNemar tests to compare point prevalence estimates, the Clopper-Pearson method to calculate CIs around the estimates,28 and Cohen κ statistics to estimate FR–CD agreement regarding psychiatric diagnoses, grouping patients by type of psychiatric diagnosis and by clinical and demographic characteristics. All statistical tests were 2-sided, and P < 0.05 was used for statistical significance. All statistical analyses were performed with Stata Version 13.1 (StataCorp, College Station, Texas).
RESULTS
Of 640 patients hospitalized on study recruitment dates, 411 were ineligible for the study (282 were <4 or >21 years old, 42 were not English speakers, 37 had cognitive impairment, 30 were not medically stable, and 20 were admitted for a primary psychiatric diagnosis). Of the 229 eligible patients, 119 (52%) enrolled. Included patients were 57% female; 9% Hispanic; and 35% black, 55% white, and 15% other race. Forty-eight percent of the enrollees had Medicaid (48%), and 52% had private health insurance. Mean age was 12.3 years. Of enrolled patients, 38% were admitted to subspecialty medical services. Enrollee demographics were representative of hospital-level demographics for the study-eligible population; there were no significant differences in age, sex, race, ethnicity, payer type, or hospital service admission type between enrollees and patients who declined to participate (all Ps > 0.05). Table 1 lists demographic and clinical characteristics of the complete study sample and of the groups with FR- or CD-identified psychiatric diagnosis.

Of 119 enrollees, 26 (22%; 95% CI, 15%-30%) had at least 1 FR-identified comorbid psychiatric diagnosis, and 30 (25%; 95% CI, 17%-33%) had at least 1 CD-identified diagnosis. In 13 cases, adolescents (age, 14-17 years) and their parents both completed the structured interview; there were no discrepancies between interview results.
In total, 39 of 119 patients (33%, 95% CI: 24-42%) had either a family-reported or clinician-documented psychiatric diagnosis at the time of hospitalization. For 17 of 119 patients (14%; 95% CI: 9-22%), family-report and clinician-documentation both identified the patient as having a comorbid psychiatric diagnosis. For 9 of 119 patients (8%; 95% CI: 4-14%) families reported a psychiatric diagnosis, but clinicians did not document one. Conversely, for another 13 of 119 patients (11%; 95% CI: 6-18%), a clinician documented a psychiatric diagnosis but the family did not report one. The Figure shows the point prevalence of family-reported psychiatric diagnoses and clinician-documented psychiatric diagnoses for 5 common psychiatric condition categories.

The most common psychiatric conditions reported by families or documented by clinicians were ADHD (n=16, 13%),

Although point prevalence estimates were similar for FR- and CD-identified comorbid psychiatric conditions, FR–CD agreement was modest. It was fair for any psychiatric diagnosis (κ = .49; 95% CI, .30-.67), highest for ADHD (κ = .79; 95% CI, .61-.96), and fair or poor for other psychiatric conditions (κ range, .11-.48). Table 3 lists the FR–CD agreement data for psychiatric diagnoses for hospitalized children and adolescents.

We compared the distribution of FR and CD psychiatric diagnoses with FR use of mental health services. Of the 119 patients, 47 (39%; 95% CI, 31%-49%) had used mental health services within the year before hospitalization. Of these 47 patients, 15 (32%; 95% CI, 19%-47%) had a psychiatric diagnosis identified by both FR and CD, 6 (13%; 95% CI, 5%-26%) had a diagnosis identified only by FR, 8 (17%; 95% CI, 8%-30%) had a diagnosis identified only by CD, and 18 (38%; 95% CI, 25%-54%) had no FR- or CD-identified diagnosis. For 5 (38%; 95% CI, 14%-68%) of the 13 patients with a CD-only diagnosis, the family reported no use of mental health services within the year before hospitalization.
DISCUSSION
At a tertiary-care children’s hospital, we found high point prevalence of comorbid psychiatric conditions and low agreement between FR- and CD-identified psychiatric conditions. Estimates of the prevalence of psychiatric comorbidity among pediatric medical and surgical inpatients were similar for FR- and CD-identified psychiatric conditions, though each method missed about one third of the cases identified by the other method. FR only and CD only each identified about 1 in 4 or 5 hospitalized children and adolescents with a psychiatric comorbidity. When FR and CD were combined, a comorbid psychiatric diagnosis was identified in about 1 in 3 medical and surgical inpatients aged 4 to 21 years. FR–CD agreement was substantial only for ADHD and was fair to slight for most other psychiatric conditions, including autism, depression, anxiety, and disruptive behavior disorders (eg, conduct disorder, oppositional defiant disorder).
Our finding that psychiatric conditions were more commonly reported by families and documented by clinicians for white patients is consistent with a large body of evidence showing that racial or ethnic minority patients experience more stigma related to mental health diagnoses and use mental health services less.29-33 Families were more likely to report use of mental health services than a known mental health diagnosis. This finding may reflect families’ willingness to use services even if they do not understand or experience stigma related to psychiatric diagnoses. Alternatively, use of mental health services without a diagnosis may reflect clinicians’ willingness to refer a child for services when the child is perceived to have an impairment even in the absence of a clear psychiatric diagnosis.
The low FR–CD agreement regarding psychiatric conditions in hospitalized children and adolescents raises 3 issues for pediatric hospital care. First, earlier studies likely underestimated the prevalence of these conditions. A 2014 study of a national sample found that 13% of children hospitalized for a physical health condition had psychiatric comorbidity.25 That study and other large-scale studies showing a high and increasing prevalence of primary psychiatric conditions in hospitalized children and adolescents have relied on administrative data derived from clinician-documented diagnoses.25-27 Our study findings suggest that reliance on administrative data could result in underestimation of the prevalence of psychiatric comorbidity in hospitalized children by as much as 40%. Pediatric hospitals are reporting a shortage of pediatric mental health specialists.34 Augmenting estimates of the prevalence of psychiatric comorbidity in hospitalized children with reports from other sources, including families or outpatient administrative records, may aid health systems in allocating mental health resources for pediatric inpatients.
The second issue is that the present data suggest that families and clinicians do not share the same information about a child’s psychiatric diagnoses when the child is hospitalized for a medical condition or surgical procedure. Low FR–CD agreement regarding psychiatric diagnoses suggests families and clinical teams are not always “on the same page” about psychiatric needs during hospitalization. Implications of this finding are relevant to inpatient and ambulatory care settings. In cases in which a clinician recognizes a psychiatric condition but the family does not, the family may not seek outpatient treatment. In the present study, one third of patients with a psychiatric diagnosis identified by CD but not FR were not engaged in ambulatory treatment for the condition. Conversely, a psychiatric diagnosis identified by FR but not CD suggests clinical teams lack the skills and knowledge needed to elicit information about psychiatric conditions and their potential relevance to inpatient care. As a result, clinicians may miss opportunities to provide interventions that may improve physical or mental health outcomes. For example, clinical teams with information about a patient’s anxiety disorder may be better able to provide brief interventions to prevent medical treatments from triggering anxiety symptoms and to mitigate the risk for traumatic stress symptoms related to the hospitalization.
The third issue is that anxiety disorders were most likely to be the subject of FR–CD disagreement. This finding identifies children with anxiety disorders as a priority population for research into differences between families and clinicians in understanding patients’ psychiatric diagnoses. Our findings suggest families and clinicians have different views of patients’ anxiety symptoms. Anxiety disorders are a risk factor for worse outcomes in children with chronic physical conditions,3,35-37 and acute hospitalization is associated with posthospital anxiety symptoms.38,39 Thus, anxiety disorders are particularly relevant to hospital care and are a priority for research on the differences between families’ and clinicians’ perspectives on children’s psychiatric diagnoses.
Our findings should be interpreted in the context of study limitations. First, because of resource limitations, we did not obtain psychiatric diagnostic evaluations or records to confirm FR- and CD-identified psychiatric diagnoses. Although this lack of clinical confirmation could have resulted in misclassification bias, the risk of bias was no higher than in many other studies that have successfully used hospital records21,25 and family reports to identify psychiatric comorbidity.40 Second, because the study included only English-speaking patients and families, results cannot be generalized to non-English-speaking populations. Third, this was a single-center study, conducted in a free-standing tertiary-care children’s hospital. Sample size was small, particularly for estimating the prevalence of individual psychiatric conditions. Patient characteristics and clinical practice patterns may differ at other types of hospitals. Larger multicenter studies are warranted. Despite these limitations, our results provide important new information that can further our understanding of the epidemiology of psychiatric conditions in hospitalized children. This information should interest clinical teams caring for children with comorbid physical and mental health conditions.
CONCLUSIONS
Low FR–CD agreement regarding hospitalized children’s psychiatric comorbidities suggests that patients and their families and clinicians do not always share the same information about these comorbidities, and that the prevalence of psychiatric comorbidity in hospitalized children is likely underestimated. To allocate adequate resources for these children, health systems may need to obtain information from multiple sources. Furthermore, we need to better our understanding of strategies for communicating about hospitalized children’s psychiatric conditions so that we can develop interventions to improve hospital outcomes for this vulnerable population.
Disclosures
The direct costs of this project were funded by an internal pilot grant from the Center for Pediatric Health Disparities at Children’s Hospital of Philadelphia. Dr. Doupnik was supported by Ruth L. Kirschstein National Research Service Award T32-HP010026-11, funded by the National Institutes of Health. The sponsors had no role in study design; collection, analysis, or interpretation of data; manuscript writing; or deciding to submit this article for publication.
1. Perou R, Bitsko RH, Blumberg SJ, et al; Centers for Disease Control and Prevention (CDC). Mental health surveillance among children—United States, 2005-2011. MMWR Suppl. 2013;62(2):1-35. PubMed
2. Merikangas KR, Nakamura EF, Kessler RC. Epidemiology of mental disorders in children and adolescents. Dialogues Clin Neurosci. 2009;11(1):7-20. PubMed
3. Doupnik SK, Mitra N, Feudtner C, Marcus SC. The influence of comorbid mood and anxiety disorders on outcomes of pediatric patients hospitalized for pneumonia. Hosp Pediatr. 2016;6(3):135-142. PubMed
4. Snell C, Fernandes S, Bujoreanu IS, Garcia G. Depression, illness severity, and healthcare utilization in cystic fibrosis. Pediatr Pulmonol. 2014;49(12):1177-1181. PubMed
5. Garrison MM, Katon WJ, Richardson LP. The impact of psychiatric comorbidities on readmissions for diabetes in youth. Diabetes Care. 2005;28(9):2150-2154. PubMed
6. Myrvik MP, Campbell AD, Davis MM, Butcher JL. Impact of psychiatric diagnoses on hospital length of stay in children with sickle cell anemia. Pediatr Blood Cancer. 2012;58(2):239-243. PubMed
7. Myrvik MP, Burks LM, Hoffman RG, Dasgupta M, Panepinto JA. Mental health disorders influence admission rates for pain in children with sickle cell disease. Pediatr Blood Cancer. 2013;60(7):1211-1214. PubMed
8. Bujoreanu S, White MT, Gerber B, Ibeziako P. Effect of timing of psychiatry consultation on length of pediatric hospitalization and hospital charges. Hosp Pediatr. 2015;5(5):269-275. PubMed
9. Archer J, Bower P, Gilbody S, et al. Collaborative care for depression and anxiety problems. Cochrane Database Syst Rev. 2012;10:CD006525. PubMed
10. Aupont O, Doerfler L, Connor DF, Stille C, Tisminetzky M, McLaughlin TJ. A collaborative care model to improve access to pediatric mental health services. Adm Policy Ment Health. 2013;40(4):264-273. PubMed
11. Kolko DJ, Campo J, Kilbourne AM, Hart J, Sakolsky D, Wisniewski S. Collaborative care outcomes for pediatric behavioral health problems: a cluster randomized trial. Pediatrics. 2014;133(4):e981-e992. PubMed
12. Richardson L, McCauley E, Katon W. Collaborative care for adolescent depression: a pilot study. Gen Hosp Psychiatry. 2009;31(1):36-45. PubMed
13. Richardson LP, Ludman E, McCauley E, et al. Collaborative care for adolescents with depression in primary care: a randomized clinical trial. JAMA. 2014;312(8):809-816. PubMed
14. Huffman JC, Mastromauro CA, Beach SR, et al. Collaborative care for depression and anxiety disorders in patients with recent cardiac events: the Management of Sadness and Anxiety in Cardiology (MOSAIC) randomized clinical trial. JAMA Intern Med. 2014;174(6):927-935. PubMed
15. Henderson C, Noblett J, Parke H, et al. Mental health-related stigma in health care and mental health-care settings. Lancet Psychiatry. 2014;1(6):467-482. PubMed
16. Pescosolido BA, Perry BL, Martin JK, McLeod JD, Jensen PS. Stigmatizing attitudes and beliefs about treatment and psychiatric medications for children with mental illness. Psychiatr Serv. 2007;58(5):613-618. PubMed
17. Pescosolido BA. Culture, children, and mental health treatment: special section on the National Stigma Study–Children. Psychiatr Serv. 2007;58(5):611-612. PubMed
18. Britt TW, Greene-Shortridge TM, Brink S, et al. Perceived stigma and barriers to care for psychological treatment: implications for reactions to stressors in different contexts. J Soc Clin Psychol. 2008;27(4):317-335.
19. Thornicroft G, Mehta N, Clement S, et al. Evidence for effective interventions to reduce mental-health-related stigma and discrimination. Lancet. 2016;387(10023):1123-1132. PubMed
20. Health Insurance Portability and Accountability Act of 1996. Washington, DC: US Government Publishing Office; 1996. https://www.gpo.gov/fdsys/pkg/CRPT-104hrpt736/pdf/CRPT-104hrpt736.pdf. Accessed January 21, 2017.
21. Frayne SM, Miller DR, Sharkansky EJ, et al. Using administrative data to identify mental illness: what approach is best? Am J Med Qual. 2010;25(1):42-50. PubMed
22. Horwitz SM, Hoagwood K, Stiffman AR, et al. Reliability of the Services Assessment for Children and Adolescents. Psychiatr Serv. 2001;52(8):1088-1094. PubMed
23. Ascher BH, Farmer EM, Burns BJ, Angold A. The Child and Adolescent Services Assessment (CASA): description and psychometrics. J Emot Behav Disord. 1996;4(1):12-20.
24. Data Resource Center for Child & Adolescent Health, Child and Adolescent Health Measurement Initiative, Oregon Health & Science University. National Survey of Children’s Health (NSCH), 2011/12. http://childhealthdata.org/docs/drc/2011-12-guide-to-topics-questions-draft.pdf?sfvrsn=4. Accessed January 21, 2017.
25. Bardach NS, Coker TR, Zima BT, et al. Common and costly hospitalizations for pediatric mental health disorders. Pediatrics. 2014;133(4):602-609. PubMed
26. Torio CM, Encinosa W, Berdahl T, McCormick MC, Simpson LA. Annual report on health care for children and youth in the United States: national estimates of cost, utilization and expenditures for children with mental health conditions. Acad Pediatr. 2015;15(1):19-35. PubMed
27. Zima BT, Rodean J, Hall M, Bardach NS, Coker TR, Berry JG. Ten year national trends in pediatric hospitalizations by psychiatric complexity. Abstract presented at: 62nd Annual Meeting of the American Academy of Child and Adolescent Psychiatry; October 2015; San Antonio, TX.
28. Clopper CJ, Pearson ES. The use of confidence or fiducial limits illustrated in the case of the binomial. Biometrika. 1934;26:404-413.
29. Wu CH, Erickson SR, Piette JD, Balkrishnan R. Mental health resource utilization and health care costs associated with race and comorbid anxiety among Medicaid enrollees with major depressive disorder. J Nat Med Assoc. 2012;104(1-2):78-88. PubMed
30. Mapelli E, Black T, Doan Q. Trends in pediatric emergency department utilization for mental health-related visits. J Pediatr. 2015;167(4):905-910. PubMed
31. Berdahl T, Owens PL, Dougherty D, McCormick MC, Pylypchuk Y, Simpson LA. Annual report on health care for children and youth in the United States: racial/ethnic and socioeconomic disparities in children’s health care quality. Acad Pediatr. 2010;10(2):95-118. PubMed
32. Flores G; Committee on Pediatric Research. Technical report—racial and ethnic disparities in the health and health care of children. Pediatrics. 2010;125(4):e979-e1020. PubMed
33. Turner EA, Jensen-Doss A, Heffer RW. Ethnicity as a moderator of how parents’ attitudes and perceived stigma influence intentions to seek child mental health services. Cultur Divers Ethnic Minor Psychol. 2015;21(4):613-618. PubMed
34. Shaw RJ, Wamboldt M, Bursch B, Stuber M. Practice patterns in pediatric consultation-liaison psychiatry: a national survey. Psychosomatics. 2006;47(1):43-49. PubMed
35. Benton TD, Ifeagwu JA, Smith-Whitley K. Anxiety and depression in children and adolescents with sickle cell disease. Curr Psychiatry Rep. 2007;9(2):114-121. PubMed
36. Chavira DA, Garland AF, Daley S, Hough R. The impact of medical comorbidity on mental health and functional health outcomes among children with anxiety disorders. J Dev Behav Pediatr. 2008;29(5):394-402. PubMed
37. Knight A, Weiss P, Morales K, et al. Depression and anxiety and their association with healthcare utilization in pediatric lupus and mixed connective tissue disease patients: a cross-sectional study. Pediatr Rheumatol Online J. 2014;12:42. PubMed
38. Marsac ML, Kassam-Adams N, Delahanty DL, F. Widaman K, Barakat LP. Posttraumatic stress following acute medical trauma in children: a proposed model of bio-psycho-social processes during the peri-trauma period. Clin Child Fam Psychol Rev. 2014;17(4):399-411. PubMed
39. Marsac ML, Hildenbrand AK, Kohser KL, Winston FK, Li Y, Kassam-Adams N. Preventing posttraumatic stress following pediatric injury: a randomized controlled trial of a web-based psycho-educational intervention for parents. J Pediatr Psychol. 2013;38(10):1101-1111. PubMed
40. Petersen MC, Kube DA, Whitaker TM, Graff JC, Palmer FB. Prevalence of developmental and behavioral disorders in a pediatric hospital. Pediatrics. 2009;123(3):e490-e495. PubMed
Psychiatric conditions affect 1 in 5 children,1,2 and having a comorbid psychiatric condition is associated with worse outcomes in children hospitalized for medical or surgical indications.3-7 Although little is known about interventions for improving outcomes for hospitalized children with psychiatric conditions,8 several interventions that integrate medical and psychiatric care are known to improve ambulatory patient outcomes.9-14 The success of initiatives that test whether integrated medical and psychiatric care models can improve pediatric hospital outcomes depends on reliable identification of comorbid psychiatric conditions and family and clinician having a shared understanding of a patient’s psychiatric diagnoses.
Mental health care system fragmentation, stigma, and privacy issues15-20 may contribute to clinical teams and families having disparate views of psychiatric comorbidities. Evidence suggests that hospital clinicians caring for pediatric medical and surgical inpatients are often unaware of a psychiatric condition that has been diagnosed or managed in the ambulatory setting,3,6 even in cases in which the patient and family are aware of the diagnosis. Conversely, for other patients, clinicians may be aware of a psychiatric diagnosis, but patient and family may not share that understanding or reliably report a psychiatric diagnosis.21-23 Although hospitalization may not be the ideal setting for identifying a new psychiatric diagnosis, given the short-term relationship between patient and clinical care team, addressing and managing a psychiatric comorbidity that is known to family or clinician are important elements of patient-centered hospital care.
The success of interventions in improving hospital outcomes for hospitalized children with psychiatric comorbidity depends on patients, families, and clinicians having a shared understanding of which patients have psychiatric conditions, and on accurate estimates of the scope of the population in need of psychiatric care during pediatric hospitalization.
We conducted a study to compare estimates of point prevalence of psychiatric comorbidity identified by family report (FR) or clinician documentation (CD) and to determine the degree of FR–CD agreement regarding the presence of psychiatric comorbidity in hospitalized children.
METHODS
We estimated point prevalence and determined FR–CD agreement regarding diagnosed psychiatric comorbidities in a cross-sectional sample of pediatric medical and surgical hospitalizations at Children’s Hospital of Philadelphia (CHOP). CHOP is a free-standing 535-bed children’s hospital that serves as a community hospital for the city of Philadelphia; a regional referral center for eastern Pennsylvania, Delaware, and southern New Jersey; and a national and international quaternary referral center. This study was approved by CHOP’s institutional review board.
Patients eligible for inclusion in the study were 4 to 21 years old and hospitalized for a medical or surgical indication. Patients were ineligible if they were hospitalized for a primary psychiatric indication, were medically unstable (eg, received end-of-life care or escalating interventions for a life-threatening condition), had significant cognitive impairment precluding communication (eg, history of severe hypoxic-ischemic encephalopathy), or did not speak English (pertains to consenting parent, guardian, or patient).
The cross-sectional patient sample was selected using a point prevalence recruitment strategy. All eligible patients on each of CHOP’s 20 inpatient medical, surgical, and critical care units were approached for study participation on 2 dates between July 2015 and March 2016. To avoid enrolling the same patient multiple times for a single hospitalization, we separated recruitment dates on each unit by at least 3 months. A goal sample size of 100 to 150 patients was selected to provide precision sufficient to achieve a confidence interval (CI) of 10% around an estimate of the point prevalence of any mental health condition.
To obtain family report of prior psychiatric diagnoses, we interviewed patients and/or their parents during the hospitalization. For 18- to 21-year-old patients, the adolescent patient completed the interview. For patients under 18 years old, parents completed the interview, and for 14- to 17-year-old adolescents,either the parent, the patient, or both could complete the interview. Adolescents were asked to complete the interview confidentially without a parent present. The structured interview included questions derived from the National Survey of Children’s Health24 and the Services Assessment for Children and Adolescents22 to report the patient’s active psychiatric conditions. Interviewees reported whether the patient had ever been diagnosed with any psychiatric disorder, whether the condition was ongoing in the year prior to hospitalization, and whether the patient received any mental health services in clinical settings or school in the 12 months prior to hospitalization.
For CD, we identified a psychiatric diagnosis associated with the index hospitalization if a psychiatric diagnosis was noted in the patient’s admission note, discharge summary, or hospital problem list, or if an International Classification of Diseases (ICD) code for a psychiatric diagnosis was submitted for billing for the index hospitalization. The Healthcare Cost and Utilization Project condition classification system was used to sort psychiatric condition codes25-27 into 5 categories: attention-deficit/hyperactivity disorder (ADHD), anxiety disorders, depression, disruptive behavior disorders, and autism spectrum disorders. A residual category of other, less common psychiatric conditions included eating disorders, attachment disorders, and bipolar disorder.
For each condition category, we determined the point prevalence of having a psychiatric diagnosis identified by FR and having a diagnosis identified by CD. We used McNemar tests to compare point prevalence estimates, the Clopper-Pearson method to calculate CIs around the estimates,28 and Cohen κ statistics to estimate FR–CD agreement regarding psychiatric diagnoses, grouping patients by type of psychiatric diagnosis and by clinical and demographic characteristics. All statistical tests were 2-sided, and P < 0.05 was used for statistical significance. All statistical analyses were performed with Stata Version 13.1 (StataCorp, College Station, Texas).
RESULTS
Of 640 patients hospitalized on study recruitment dates, 411 were ineligible for the study (282 were <4 or >21 years old, 42 were not English speakers, 37 had cognitive impairment, 30 were not medically stable, and 20 were admitted for a primary psychiatric diagnosis). Of the 229 eligible patients, 119 (52%) enrolled. Included patients were 57% female; 9% Hispanic; and 35% black, 55% white, and 15% other race. Forty-eight percent of the enrollees had Medicaid (48%), and 52% had private health insurance. Mean age was 12.3 years. Of enrolled patients, 38% were admitted to subspecialty medical services. Enrollee demographics were representative of hospital-level demographics for the study-eligible population; there were no significant differences in age, sex, race, ethnicity, payer type, or hospital service admission type between enrollees and patients who declined to participate (all Ps > 0.05). Table 1 lists demographic and clinical characteristics of the complete study sample and of the groups with FR- or CD-identified psychiatric diagnosis.
Of 119 enrollees, 26 (22%; 95% CI, 15%-30%) had at least 1 FR-identified comorbid psychiatric diagnosis, and 30 (25%; 95% CI, 17%-33%) had at least 1 CD-identified diagnosis. In 13 cases, adolescents (age, 14-17 years) and their parents both completed the structured interview; there were no discrepancies between interview results.
In total, 39 of 119 patients (33%, 95% CI: 24-42%) had either a family-reported or clinician-documented psychiatric diagnosis at the time of hospitalization. For 17 of 119 patients (14%; 95% CI: 9-22%), family-report and clinician-documentation both identified the patient as having a comorbid psychiatric diagnosis. For 9 of 119 patients (8%; 95% CI: 4-14%) families reported a psychiatric diagnosis, but clinicians did not document one. Conversely, for another 13 of 119 patients (11%; 95% CI: 6-18%), a clinician documented a psychiatric diagnosis but the family did not report one. The Figure shows the point prevalence of family-reported psychiatric diagnoses and clinician-documented psychiatric diagnoses for 5 common psychiatric condition categories.
The most common psychiatric conditions reported by families or documented by clinicians were ADHD (n=16, 13%),
Although point prevalence estimates were similar for FR- and CD-identified comorbid psychiatric conditions, FR–CD agreement was modest. It was fair for any psychiatric diagnosis (κ = .49; 95% CI, .30-.67), highest for ADHD (κ = .79; 95% CI, .61-.96), and fair or poor for other psychiatric conditions (κ range, .11-.48). Table 3 lists the FR–CD agreement data for psychiatric diagnoses for hospitalized children and adolescents.
We compared the distribution of FR and CD psychiatric diagnoses with FR use of mental health services. Of the 119 patients, 47 (39%; 95% CI, 31%-49%) had used mental health services within the year before hospitalization. Of these 47 patients, 15 (32%; 95% CI, 19%-47%) had a psychiatric diagnosis identified by both FR and CD, 6 (13%; 95% CI, 5%-26%) had a diagnosis identified only by FR, 8 (17%; 95% CI, 8%-30%) had a diagnosis identified only by CD, and 18 (38%; 95% CI, 25%-54%) had no FR- or CD-identified diagnosis. For 5 (38%; 95% CI, 14%-68%) of the 13 patients with a CD-only diagnosis, the family reported no use of mental health services within the year before hospitalization.
DISCUSSION
At a tertiary-care children’s hospital, we found high point prevalence of comorbid psychiatric conditions and low agreement between FR- and CD-identified psychiatric conditions. Estimates of the prevalence of psychiatric comorbidity among pediatric medical and surgical inpatients were similar for FR- and CD-identified psychiatric conditions, though each method missed about one third of the cases identified by the other method. FR only and CD only each identified about 1 in 4 or 5 hospitalized children and adolescents with a psychiatric comorbidity. When FR and CD were combined, a comorbid psychiatric diagnosis was identified in about 1 in 3 medical and surgical inpatients aged 4 to 21 years. FR–CD agreement was substantial only for ADHD and was fair to slight for most other psychiatric conditions, including autism, depression, anxiety, and disruptive behavior disorders (eg, conduct disorder, oppositional defiant disorder).
Our finding that psychiatric conditions were more commonly reported by families and documented by clinicians for white patients is consistent with a large body of evidence showing that racial or ethnic minority patients experience more stigma related to mental health diagnoses and use mental health services less.29-33 Families were more likely to report use of mental health services than a known mental health diagnosis. This finding may reflect families’ willingness to use services even if they do not understand or experience stigma related to psychiatric diagnoses. Alternatively, use of mental health services without a diagnosis may reflect clinicians’ willingness to refer a child for services when the child is perceived to have an impairment even in the absence of a clear psychiatric diagnosis.
The low FR–CD agreement regarding psychiatric conditions in hospitalized children and adolescents raises 3 issues for pediatric hospital care. First, earlier studies likely underestimated the prevalence of these conditions. A 2014 study of a national sample found that 13% of children hospitalized for a physical health condition had psychiatric comorbidity.25 That study and other large-scale studies showing a high and increasing prevalence of primary psychiatric conditions in hospitalized children and adolescents have relied on administrative data derived from clinician-documented diagnoses.25-27 Our study findings suggest that reliance on administrative data could result in underestimation of the prevalence of psychiatric comorbidity in hospitalized children by as much as 40%. Pediatric hospitals are reporting a shortage of pediatric mental health specialists.34 Augmenting estimates of the prevalence of psychiatric comorbidity in hospitalized children with reports from other sources, including families or outpatient administrative records, may aid health systems in allocating mental health resources for pediatric inpatients.
The second issue is that the present data suggest that families and clinicians do not share the same information about a child’s psychiatric diagnoses when the child is hospitalized for a medical condition or surgical procedure. Low FR–CD agreement regarding psychiatric diagnoses suggests families and clinical teams are not always “on the same page” about psychiatric needs during hospitalization. Implications of this finding are relevant to inpatient and ambulatory care settings. In cases in which a clinician recognizes a psychiatric condition but the family does not, the family may not seek outpatient treatment. In the present study, one third of patients with a psychiatric diagnosis identified by CD but not FR were not engaged in ambulatory treatment for the condition. Conversely, a psychiatric diagnosis identified by FR but not CD suggests clinical teams lack the skills and knowledge needed to elicit information about psychiatric conditions and their potential relevance to inpatient care. As a result, clinicians may miss opportunities to provide interventions that may improve physical or mental health outcomes. For example, clinical teams with information about a patient’s anxiety disorder may be better able to provide brief interventions to prevent medical treatments from triggering anxiety symptoms and to mitigate the risk for traumatic stress symptoms related to the hospitalization.
The third issue is that anxiety disorders were most likely to be the subject of FR–CD disagreement. This finding identifies children with anxiety disorders as a priority population for research into differences between families and clinicians in understanding patients’ psychiatric diagnoses. Our findings suggest families and clinicians have different views of patients’ anxiety symptoms. Anxiety disorders are a risk factor for worse outcomes in children with chronic physical conditions,3,35-37 and acute hospitalization is associated with posthospital anxiety symptoms.38,39 Thus, anxiety disorders are particularly relevant to hospital care and are a priority for research on the differences between families’ and clinicians’ perspectives on children’s psychiatric diagnoses.
Our findings should be interpreted in the context of study limitations. First, because of resource limitations, we did not obtain psychiatric diagnostic evaluations or records to confirm FR- and CD-identified psychiatric diagnoses. Although this lack of clinical confirmation could have resulted in misclassification bias, the risk of bias was no higher than in many other studies that have successfully used hospital records21,25 and family reports to identify psychiatric comorbidity.40 Second, because the study included only English-speaking patients and families, results cannot be generalized to non-English-speaking populations. Third, this was a single-center study, conducted in a free-standing tertiary-care children’s hospital. Sample size was small, particularly for estimating the prevalence of individual psychiatric conditions. Patient characteristics and clinical practice patterns may differ at other types of hospitals. Larger multicenter studies are warranted. Despite these limitations, our results provide important new information that can further our understanding of the epidemiology of psychiatric conditions in hospitalized children. This information should interest clinical teams caring for children with comorbid physical and mental health conditions.
CONCLUSIONS
Low FR–CD agreement regarding hospitalized children’s psychiatric comorbidities suggests that patients and their families and clinicians do not always share the same information about these comorbidities, and that the prevalence of psychiatric comorbidity in hospitalized children is likely underestimated. To allocate adequate resources for these children, health systems may need to obtain information from multiple sources. Furthermore, we need to better our understanding of strategies for communicating about hospitalized children’s psychiatric conditions so that we can develop interventions to improve hospital outcomes for this vulnerable population.
Disclosures
The direct costs of this project were funded by an internal pilot grant from the Center for Pediatric Health Disparities at Children’s Hospital of Philadelphia. Dr. Doupnik was supported by Ruth L. Kirschstein National Research Service Award T32-HP010026-11, funded by the National Institutes of Health. The sponsors had no role in study design; collection, analysis, or interpretation of data; manuscript writing; or deciding to submit this article for publication.
1. Perou R, Bitsko RH, Blumberg SJ, et al; Centers for Disease Control and Prevention (CDC). Mental health surveillance among children—United States, 2005-2011. MMWR Suppl. 2013;62(2):1-35. PubMed
2. Merikangas KR, Nakamura EF, Kessler RC. Epidemiology of mental disorders in children and adolescents. Dialogues Clin Neurosci. 2009;11(1):7-20. PubMed
3. Doupnik SK, Mitra N, Feudtner C, Marcus SC. The influence of comorbid mood and anxiety disorders on outcomes of pediatric patients hospitalized for pneumonia. Hosp Pediatr. 2016;6(3):135-142. PubMed
4. Snell C, Fernandes S, Bujoreanu IS, Garcia G. Depression, illness severity, and healthcare utilization in cystic fibrosis. Pediatr Pulmonol. 2014;49(12):1177-1181. PubMed
5. Garrison MM, Katon WJ, Richardson LP. The impact of psychiatric comorbidities on readmissions for diabetes in youth. Diabetes Care. 2005;28(9):2150-2154. PubMed
6. Myrvik MP, Campbell AD, Davis MM, Butcher JL. Impact of psychiatric diagnoses on hospital length of stay in children with sickle cell anemia. Pediatr Blood Cancer. 2012;58(2):239-243. PubMed
7. Myrvik MP, Burks LM, Hoffman RG, Dasgupta M, Panepinto JA. Mental health disorders influence admission rates for pain in children with sickle cell disease. Pediatr Blood Cancer. 2013;60(7):1211-1214. PubMed
8. Bujoreanu S, White MT, Gerber B, Ibeziako P. Effect of timing of psychiatry consultation on length of pediatric hospitalization and hospital charges. Hosp Pediatr. 2015;5(5):269-275. PubMed
9. Archer J, Bower P, Gilbody S, et al. Collaborative care for depression and anxiety problems. Cochrane Database Syst Rev. 2012;10:CD006525. PubMed
10. Aupont O, Doerfler L, Connor DF, Stille C, Tisminetzky M, McLaughlin TJ. A collaborative care model to improve access to pediatric mental health services. Adm Policy Ment Health. 2013;40(4):264-273. PubMed
11. Kolko DJ, Campo J, Kilbourne AM, Hart J, Sakolsky D, Wisniewski S. Collaborative care outcomes for pediatric behavioral health problems: a cluster randomized trial. Pediatrics. 2014;133(4):e981-e992. PubMed
12. Richardson L, McCauley E, Katon W. Collaborative care for adolescent depression: a pilot study. Gen Hosp Psychiatry. 2009;31(1):36-45. PubMed
13. Richardson LP, Ludman E, McCauley E, et al. Collaborative care for adolescents with depression in primary care: a randomized clinical trial. JAMA. 2014;312(8):809-816. PubMed
14. Huffman JC, Mastromauro CA, Beach SR, et al. Collaborative care for depression and anxiety disorders in patients with recent cardiac events: the Management of Sadness and Anxiety in Cardiology (MOSAIC) randomized clinical trial. JAMA Intern Med. 2014;174(6):927-935. PubMed
15. Henderson C, Noblett J, Parke H, et al. Mental health-related stigma in health care and mental health-care settings. Lancet Psychiatry. 2014;1(6):467-482. PubMed
16. Pescosolido BA, Perry BL, Martin JK, McLeod JD, Jensen PS. Stigmatizing attitudes and beliefs about treatment and psychiatric medications for children with mental illness. Psychiatr Serv. 2007;58(5):613-618. PubMed
17. Pescosolido BA. Culture, children, and mental health treatment: special section on the National Stigma Study–Children. Psychiatr Serv. 2007;58(5):611-612. PubMed
18. Britt TW, Greene-Shortridge TM, Brink S, et al. Perceived stigma and barriers to care for psychological treatment: implications for reactions to stressors in different contexts. J Soc Clin Psychol. 2008;27(4):317-335.
19. Thornicroft G, Mehta N, Clement S, et al. Evidence for effective interventions to reduce mental-health-related stigma and discrimination. Lancet. 2016;387(10023):1123-1132. PubMed
20. Health Insurance Portability and Accountability Act of 1996. Washington, DC: US Government Publishing Office; 1996. https://www.gpo.gov/fdsys/pkg/CRPT-104hrpt736/pdf/CRPT-104hrpt736.pdf. Accessed January 21, 2017.
21. Frayne SM, Miller DR, Sharkansky EJ, et al. Using administrative data to identify mental illness: what approach is best? Am J Med Qual. 2010;25(1):42-50. PubMed
22. Horwitz SM, Hoagwood K, Stiffman AR, et al. Reliability of the Services Assessment for Children and Adolescents. Psychiatr Serv. 2001;52(8):1088-1094. PubMed
23. Ascher BH, Farmer EM, Burns BJ, Angold A. The Child and Adolescent Services Assessment (CASA): description and psychometrics. J Emot Behav Disord. 1996;4(1):12-20.
24. Data Resource Center for Child & Adolescent Health, Child and Adolescent Health Measurement Initiative, Oregon Health & Science University. National Survey of Children’s Health (NSCH), 2011/12. http://childhealthdata.org/docs/drc/2011-12-guide-to-topics-questions-draft.pdf?sfvrsn=4. Accessed January 21, 2017.
25. Bardach NS, Coker TR, Zima BT, et al. Common and costly hospitalizations for pediatric mental health disorders. Pediatrics. 2014;133(4):602-609. PubMed
26. Torio CM, Encinosa W, Berdahl T, McCormick MC, Simpson LA. Annual report on health care for children and youth in the United States: national estimates of cost, utilization and expenditures for children with mental health conditions. Acad Pediatr. 2015;15(1):19-35. PubMed
27. Zima BT, Rodean J, Hall M, Bardach NS, Coker TR, Berry JG. Ten year national trends in pediatric hospitalizations by psychiatric complexity. Abstract presented at: 62nd Annual Meeting of the American Academy of Child and Adolescent Psychiatry; October 2015; San Antonio, TX.
28. Clopper CJ, Pearson ES. The use of confidence or fiducial limits illustrated in the case of the binomial. Biometrika. 1934;26:404-413.
29. Wu CH, Erickson SR, Piette JD, Balkrishnan R. Mental health resource utilization and health care costs associated with race and comorbid anxiety among Medicaid enrollees with major depressive disorder. J Nat Med Assoc. 2012;104(1-2):78-88. PubMed
30. Mapelli E, Black T, Doan Q. Trends in pediatric emergency department utilization for mental health-related visits. J Pediatr. 2015;167(4):905-910. PubMed
31. Berdahl T, Owens PL, Dougherty D, McCormick MC, Pylypchuk Y, Simpson LA. Annual report on health care for children and youth in the United States: racial/ethnic and socioeconomic disparities in children’s health care quality. Acad Pediatr. 2010;10(2):95-118. PubMed
32. Flores G; Committee on Pediatric Research. Technical report—racial and ethnic disparities in the health and health care of children. Pediatrics. 2010;125(4):e979-e1020. PubMed
33. Turner EA, Jensen-Doss A, Heffer RW. Ethnicity as a moderator of how parents’ attitudes and perceived stigma influence intentions to seek child mental health services. Cultur Divers Ethnic Minor Psychol. 2015;21(4):613-618. PubMed
34. Shaw RJ, Wamboldt M, Bursch B, Stuber M. Practice patterns in pediatric consultation-liaison psychiatry: a national survey. Psychosomatics. 2006;47(1):43-49. PubMed
35. Benton TD, Ifeagwu JA, Smith-Whitley K. Anxiety and depression in children and adolescents with sickle cell disease. Curr Psychiatry Rep. 2007;9(2):114-121. PubMed
36. Chavira DA, Garland AF, Daley S, Hough R. The impact of medical comorbidity on mental health and functional health outcomes among children with anxiety disorders. J Dev Behav Pediatr. 2008;29(5):394-402. PubMed
37. Knight A, Weiss P, Morales K, et al. Depression and anxiety and their association with healthcare utilization in pediatric lupus and mixed connective tissue disease patients: a cross-sectional study. Pediatr Rheumatol Online J. 2014;12:42. PubMed
38. Marsac ML, Kassam-Adams N, Delahanty DL, F. Widaman K, Barakat LP. Posttraumatic stress following acute medical trauma in children: a proposed model of bio-psycho-social processes during the peri-trauma period. Clin Child Fam Psychol Rev. 2014;17(4):399-411. PubMed
39. Marsac ML, Hildenbrand AK, Kohser KL, Winston FK, Li Y, Kassam-Adams N. Preventing posttraumatic stress following pediatric injury: a randomized controlled trial of a web-based psycho-educational intervention for parents. J Pediatr Psychol. 2013;38(10):1101-1111. PubMed
40. Petersen MC, Kube DA, Whitaker TM, Graff JC, Palmer FB. Prevalence of developmental and behavioral disorders in a pediatric hospital. Pediatrics. 2009;123(3):e490-e495. PubMed
© 2017 Society of Hospital Medicine
Standardized attending rounds to improve the patient experience: A pragmatic cluster randomized controlled trial
Patient experience has recently received heightened attention given evidence supporting an association between patient experience and quality of care,1 and the coupling of patient satisfaction to reimbursement rates for Medicare patients.2 Patient experience is often assessed through surveys of patient satisfaction, which correlates with patient perceptions of nurse and physician communication.3 Teaching hospitals introduce variables that may impact communication, including the involvement of multiple levels of care providers and competing patient care vs. educational priorities. Patients admitted to teaching services express decreased satisfaction with coordination and overall care compared with patients on nonteaching services.4
Clinical supervision of trainees on teaching services is primarily achieved through attending rounds (AR), where patients’ clinical presentations and management are discussed with an attending physician. Poor communication during AR may negatively affect the patient experience through inefficient care coordination among the inter-professional care team or through implementation of interventions without patients’ knowledge or input.5-11 Although patient engagement in rounds has been associated with higher patient satisfaction with rounds,12-19 AR and case presentations often occur at a distance from the patient’s bedside.20,21 Furthermore, AR vary in the time allotted per patient and the extent of participation of nurses and other allied health professionals. Standardized bedside rounding processes have been shown to improve efficiency, decrease daily resident work hours,22 and improve nurse-physician teamwork.23
Despite these benefits, recent prospective studies of bedside AR interventions have not improved patient satisfaction with rounds. One involved the implementation of interprofessional patient-centered bedside rounds on a nonteaching service,24 while the other evaluated the impact of integrating athletic principles into multidisciplinary work rounds.25 Work at our institution had sought to develop AR practice recommendations to foster an optimal patient experience, while maintaining provider workflow efficiency, facilitating interdisciplinary communication, and advancing trainee education.26 Using these AR recommendations, we conducted a prospective randomized controlled trial to evaluate the impact of implementing a standardized bedside AR model on patient satisfaction with rounds. We also assessed attending physician and trainee satisfaction with rounds, and perceived and actual AR duration.
METHODS
Setting and Participants
This trial was conducted on the internal medicine teaching service of the University of California San Francisco Medical Center from September 3, 2013 to November 27, 2013. The service is comprised of 8 teams, with a total average daily census of 80 to 90 patients. Teams are comprised of an attending physician, a senior resident (in the second or third year of residency training), 2 interns, and a third- and/or fourth-year medical student.
This trial, which was approved by the University of California, San Francisco Committee on Human Research (UCSF CHR) and was registered with ClinicalTrials.gov (NCT01931553), was classified under Quality Improvement and did not require informed consent of patients or providers.
Intervention Description
We conducted a cluster randomized trial to evaluate the impact of a bundled set of 5 AR practice recommendations, adapted from published work,26 on patient experience, as well as on attending and trainee satisfaction: 1) huddling to establish the rounding schedule and priorities; 2) conducting bedside rounds; 3) integrating bedside nurses; 4) completing real-time order entry using bedside computers; 5) updating the whiteboard in each patient’s room with care plan information.
At the beginning of each month, study investigators (Nader Najafi and Bradley Monash) led a 1.5-hour workshop to train attending physicians and trainees allocated to the intervention arm on the recommended AR practices. Participants also received informational handouts to be referenced during AR. Attending physicians and trainees randomized to the control arm continued usual rounding practices. Control teams were notified that there would be observers on rounds but were not informed of the study aims.
Randomization and Team Assignments
The medicine service was divided into 2 arms, each comprised of 4 teams. Using a coin flip, Cluster 1 (Teams A, B, C and D) was randomized to the intervention, and Cluster 2 (Teams E, F, G and H) was randomized to the control. This design was pragmatically chosen to ensure that 1 team from each arm would admit patients daily. Allocation concealment of attending physicians and trainees was not possible given the nature of the intervention. Patients were blinded to study arm allocation.
MEASURES AND OUTCOMES
Adherence to Practice Recommendations
Thirty premedical students served as volunteer AR auditors. Each auditor received orientation and training in data collection techniques during a single 2-hour workshop. The auditors, blinded to study arm allocation, independently observed morning AR during weekdays and recorded the completion of the following elements as a dichotomous (yes/no) outcome: pre-rounds huddle, participation of nurse in AR, real-time order entry, and whiteboard use. They recorded the duration of AR per day for each team (minutes) and the rounding model for each patient rounding encounter during AR (bedside, hallway, or card flip).23 Bedside rounds were defined as presentation and discussion of the patient care plan in the presence of the patient. Hallway rounds were defined as presentation and discussion of the patient care plan partially outside the patient’s room and partially in the presence of the patient. Card-flip rounds were defined as presentation and discussion of the patient care plan entirely outside of the patient’s room without the team seeing the patient together. Two auditors simultaneously observed a random subset of patient-rounding encounters to evaluate inter-rater reliability, and the concordance between auditor observations was good (Pearson correlation = 0.66).27
Patient-Related Outcomes
The primary outcome was patient satisfaction with AR, assessed using a survey adapted from published work.12,14,28,29 Patients were approached to complete the questionnaire after they had experienced at least 1 AR. Patients were excluded if they were non-English-speaking, unavailable (eg, off the unit for testing or treatment), in isolation, or had impaired mental status. For patients admitted multiple times during the study period, only the first questionnaire was used. Survey questions included patient involvement in decision-making, quality of communication between patient and medicine team, and the perception that the medicine team cared about the patient. Patients were asked to state their level of agreement with each item on a 5-point Likert scale. We obtained data on patient demographics from administrative datasets.
Healthcare Provider Outcomes
Attending physicians and trainees on service for at least 7 consecutive days were sent an electronic survey, adapted from published work.25,30 Questions assessed satisfaction with AR, perceived value of bedside rounds, and extent of patient and nursing involvement.Level of agreement with each item was captured on a continuous scale; 0 = strongly disagree to 100 = strongly agree, or from 0 (far too little) to 100 (far too much), with 50 equating to “about right.” Attending physicians and trainees were also asked to estimate the average duration of AR (in minutes).
Statistical Analyses
Analyses were blinded to study arm allocation and followed intention-to-treat principles. One attending physician crossed over from intervention to control arm; patient surveys associated with this attending (n = 4) were excluded to avoid contamination. No trainees crossed over.
Demographic and clinical characteristics of patients who completed the survey are reported (Appendix). To compare patient satisfaction scores, we used a random-effects regression model to account for correlation among responses within teams within randomized clusters, defining teams by attending physician. As this correlation was negligible and not statistically significant, we did not adjust ordinary linear regression models for clustering. Given observed differences in patient characteristics, we adjusted for a number of covariates (eg, age, gender, insurance payer, race, marital status, trial group arm).
We conducted simple linear regression for attending and trainee satisfaction comparisons between arms, adjusting only for trainee type (eg, resident, intern, and medical student).
We compared the frequency with which intervention and control teams adhered to the 5 recommended AR practices using chi-square tests. We used independent Student’s t tests to compare total duration of AR by teams within each arm, as well as mean time spent per patient.
This trial had a fixed number of arms (n = 2), each of fixed size (n = 600), based on the average monthly inpatient census on the medicine service. This fixed sample size, with 80% power and α = 0.05, will be able to detect a 0.16 difference in patient satisfaction scores between groups.
All analyses were conducted using SAS® v 9.4 (SAS Institute, Inc., Cary, NC).
RESULTS
We observed 241 AR involving 1855 patient rounding encounters in the intervention arm and 264 AR involving 1903 patient rounding encounters in the control arm (response rates shown in Figure 1). 

Patient Satisfaction and Clinical Outcomes
Five hundred ninety-five patients were allocated to the intervention arm and 605 were allocated to the control arm (Figure 1). Mean age, gender, race, marital status, primary language, and insurance provider did not differ between intervention and control arms (Table 1). 
Patients in the intervention arm reported significantly higher satisfaction with AR and felt more cared for by their medicine team (Table 2). 
Actual and Perceived Duration of Attending Rounds
The intervention shortened the total duration of AR by 8 minutes on average (143 vs. 151 minutes, P = 0.052) and the time spent per patient by 4 minutes on average (19 vs. 23 minutes, P < 0.001). Despite this, trainees in the intervention arm perceived AR to last longer (mean estimated time: 167 min vs. 152 min, P < 0.001).
Healthcare Provider Outcomes
We observed 79 attending physicians and trainees in the intervention arm and 78 in the control arm, with survey response rates shown in Figure 1. Attending physicians in the intervention and the control arms reported high levels of satisfaction with the quality of AR (Table 2). Attending physicians in the intervention arm were more likely to report an appropriate level of patient involvement and nurse involvement.
Although trainees in the intervention and control arms reported high levels of satisfaction with the quality of AR, trainees in the intervention arm reported lower satisfaction with AR compared with control arm trainees (Table 2). Trainees in the intervention arm reported that AR involved less autonomy, efficiency, and teaching. Trainees in the intervention arm also scored patient involvement more towards the “far too much” end of the scale compared with “about right” in the control arm. However, trainees in the intervention arm perceived nurse involvement closer to “about right,” as opposed to “far too little” in the control arm.
CONCLUSION/DISCUSSION
Training internal medicine teams to adhere to 5 recommended AR practices increased patient satisfaction with AR and the perception that patients were more cared for by their medicine team. Despite the intervention potentially shortening the duration of AR, attending physicians and trainees perceived AR to last longer, and trainee satisfaction with AR decreased.
Teams in the intervention arm adhered to all recommended rounding practices at higher rates than the control teams. Although intervention teams rounded at the bedside 53% of the time, they were encouraged to bedside round only on patients who desired to participate in rounds, were not altered, and for whom the clinical discussion was not too sensitive to occur at the bedside. Of the recommended rounding behaviors, the lowest adherence was seen with whiteboard use.
A major component of the intervention was to move the clinical presentation to the patient’s bedside. Most patients prefer being included in rounds and partaking in trainee education.12-19,28,29,31-33 Patients may also perceive that more time is spent with them during bedside case presentations,14,28 and exposure to providers conferring on their care may enhance patient confidence in the care being delivered.12 Although a recent study of patient-centered bedside rounding on a nonteaching service did not result in increased patient satisfaction,24 teaching services may offer more opportunities for improvement in care coordination and communication.4
Other aspects of the intervention may have contributed to increased patient satisfaction with AR. The pre-rounds huddle may have helped teams prioritize which patients required more time or would benefit most from bedside rounds. The involvement of nurses in AR may have bolstered communication and team dynamics, enhancing the patient’s perception of interprofessional collaboration. Real-time order entry might have led to more efficient implementation of the care plan, and whiteboard use may have helped to keep patients abreast of the care plan.
Patients in the intervention arm felt more cared for by their medicine teams but did not report improvements in communication or in shared decision-making. Prior work highlights that limited patient engagement, activation, and shared decision-making may occur during AR.24,34 Patient-physician communication during AR is challenged by time pressures and competing priorities, including the “need” for trainees to demonstrate their medical knowledge and clinical skills. Efforts that encourage bedside rounding should include communication training with respect to patient engagement and shared decision-making.
Attending physicians reported positive attitudes toward bedside rounding, consistent with prior studies.13,21,31 However, trainees in the intervention arm expressed decreased satisfaction with AR, estimating that AR took longer and reporting too much patient involvement. Prior studies reflect similar bedside-rounding concerns, including perceived workflow inefficiencies, infringement on teaching opportunities, and time constraints.12,20,35 Trainees are under intense time pressures to complete their work, attend educational conferences, and leave the hospital to attend afternoon clinic or to comply with duty-hour restrictions. Trainees value succinctness,12,35,36 so the perception that intervention AR lasted longer likely contributed to trainee dissatisfaction.
Reduced trainee satisfaction with intervention AR may have also stemmed from the perception of decreased autonomy and less teaching, both valued by trainees.20,35,36 The intervention itself reduced trainee autonomy because usual practice at our hospital involves residents deciding where and how to round. Attending physician presence at the bedside during rounds may have further infringed on trainee autonomy if the patient looked to the attending for answers, or if the attending was seen as the AR leader. Attending physicians may mitigate the risk of compromising trainee autonomy by allowing the trainee to speak first, ensuring the trainee is positioned closer to, and at eye level with, the patient, and redirecting patient questions to the trainee as appropriate. Optimizing trainee experience with bedside AR requires preparation and training of attending physicians, who may feel inadequately prepared to lead bedside rounds and conduct bedside teaching.37 Faculty must learn how to preserve team efficiency, create a safe, nonpunitive bedside environment that fosters the trainee-patient relationship, and ensure rounds remain educational.36,38,39
The intervention reduced the average time spent on AR and time spent per patient. Studies examining the relationship between bedside rounding and duration of rounds have yielded mixed results: some have demonstrated no effect of bedside rounds on rounding time,28,40 while others report longer rounding times.37 The pre-rounds huddle and real-time order writing may have enhanced workflow efficiency.
Our study has several limitations. These results reflect the experience of a single large academic medical center and may not be generalizable to other settings. Although overall patient response to the survey was low and may not be representative of the entire patient population, response rates in the intervention and control arms were equivalent. Non-English speaking patients may have preferences that were not reflected in our survey results, and we did not otherwise quantify individual reasons for survey noncompletion. The presence of auditors on AR may have introduced observer bias. There may have been crossover effect; however, observed prevalence of individual practices remained low in the control arm. The 1.5-hour workshop may have inadequately equipped trainees with the complex skills required to lead and participate in bedside rounding, and more training, experience, and feedback may have yielded different results. For instance, residents with more exposure to bedside rounding express greater appreciation of its role in education and patient care.20 While adherence to some of the recommended practices remained low, we did not employ a full range of change-management techniques. Instead, we opted for a “low intensity” intervention (eg, single workshop, handouts) that relied on voluntary adoption by medicine teams and that we hoped other institutions could reproduce. Finally, we did not assess the relative impact of individual rounding behaviors on the measured outcomes.
In conclusion, training medicine teams to adhere to a standardized bedside AR model increased patient satisfaction with rounds. Concomitant trainee dissatisfaction may require further experience and training of attending physicians and trainees to ensure successful adoption.
Acknowledgements
We would like to thank all patients, providers, and trainees who participated in this study. We would also like to acknowledge the following volunteer auditors who observed teams daily: Arianna Abundo, Elahhe Afkhamnejad, Yolanda Banuelos, Laila Fozoun, Soe Yupar Khin, Tam Thien Le, Wing Sum Li, Yaqiao Li, Mengyao Liu, Tzyy-Harn Lo, Shynh-Herng Lo, David Lowe, Danoush Paborji, Sa Nan Park, Urmila Powale, Redha Fouad Qabazard, Monique Quiroz, John-Luke Marcelo Rivera, Manfred Roy Luna Salvador, Tobias Gowen Squier-Roper, Flora Yan Ting, Francesca Natasha T. Tizon, Emily Claire Trautner, Stephen Weiner, Alice Wilson, Kimberly Woo, Bingling J Wu, Johnny Wu, Brenda Yee. Statistical expertise was provided by Joan Hilton from the UCSF Clinical and Translational Science Institute (CTSI), which is supported by the National Center for Advancing Translational Sciences, National Institutes of Health, through UCSF-CTSI Grant Number UL1 TR000004. Its contents are solely the responsibility of the authors and do not necessarily represent the official views of the NIH. Thanks also to Oralia Schatzman, Andrea Mazzini, and Erika Huie for their administrative support, and John Hillman for data-related support. Special thanks to Kirsten Kangelaris and Andrew Auerbach for their valuable feedback throughout, and to Maria Novelero and Robert Wachter for their divisional support of this project.
Disclosure
The authors report no financial conflicts of interest.
1. Doyle C, Lennox L, Bell D. A systematic review of evidence on the links between patient experience and clinical safety and effectiveness. BMJ Open. 2013;3(1):1-18. PubMed
2. Hospital Consumer Assessment of Healthcare Providers and Systems (HCAHPS) Fact Sheet. August 2013. Centers for Medicare and Medicaid Services (CMS). Baltimore, MD.http://www.hcahpsonline.org/files/August_2013_HCAHPS_Fact_Sheet3.pdf. Accessed December 1, 2015.
3. Boulding W, Glickman SW, Manary MP, Schulman KA, Staelin R. Relationship between patient satisfaction with inpatient care and hospital readmission within 30 days. Am J Manag Care. 2011;17:41-48. PubMed
4. Wray CM, Flores A, Padula WV, Prochaska MT, Meltzer DO, Arora VM. Measuring patient experiences on hospitalist and teaching services: Patient responses to a 30-day postdischarge questionnaire. J Hosp Med. 2016;11(2):99-104. PubMed
5. Bharwani AM, Harris GC, Southwick FS. Perspective: A business school view of medical interprofessional rounds: transforming rounding groups into rounding teams. Acad Med. 2012;87(12):1768-1771. PubMed
6. Chand DV. Observational study using the tools of lean six sigma to improve the efficiency of the resident rounding process. J Grad Med Educ. 2011;3(2):144-150. PubMed
7. Stickrath C, Noble M, Prochazka A, et al. Attending rounds in the current era: what is and is not happening. JAMA Intern Med. 2013;173(12):1084-1089. PubMed
8. Weber H, Stöckli M, Nübling M, Langewitz WA. Communication during ward rounds in internal medicine. An analysis of patient-nurse-physician interactions using RIAS. Patient Educ Couns. 2007;67(3):343-348. PubMed
9. McMahon GT, Katz JT, Thorndike ME, Levy BD, Loscalzo J. Evaluation of a redesign initiative in an internal-medicine residency. N Engl J Med. 2010;362(14):1304-1311. PubMed
10. Amoss J. Attending rounds: where do we go from here?: comment on “Attending rounds in the current era”. JAMA Intern Med. 2013;173(12):1089-1090. PubMed
11. Curley C, McEachern JE, Speroff T. A firm trial of interdisciplinary rounds on the inpatient medical wards: an intervention designed using continuous quality improvement. Med Care. 1998;36(suppl 8):AS4-A12. PubMed
12. Wang-Cheng RM, Barnas GP, Sigmann P, Riendl PA, Young MJ. Bedside case presentations: why patients like them but learners don’t. J Gen Intern Med. 1989;4(4):284-287. PubMed
13. Chauke, HL, Pattinson RC. Ward rounds—bedside or conference room? S Afr Med J. 2006;96(5):398-400. PubMed
14. Lehmann LS, Brancati FL, Chen MC, Roter D, Dobs AS. The effect of bedside case presentations on patients’ perceptions of their medical care. N Engl J Med. 1997;336(16):336, 1150-1155. PubMed
15. Simons RJ, Baily RG, Zelis R, Zwillich CW. The physiologic and psychological effects of the bedside presentation. N Engl J Med. 1989;321(18):1273-1275. PubMed
16. Wise TN, Feldheim D, Mann LS, Boyle E, Rustgi VK. Patients’ reactions to house staff work rounds. Psychosomatics. 1985;26(8):669-672. PubMed
17. Linfors EW, Neelon FA. Sounding Boards. The case of bedside rounds. N Engl J Med. 1980;303(21):1230-1233. PubMed
18. Nair BR, Coughlan JL, Hensley MJ. Student and patient perspectives on bedside teaching. Med Educ. 1997;31(5):341-346. PubMed
19. Romano J. Patients’ attitudes and behavior in ward round teaching. JAMA. 1941;117(9):664-667.
20. Gonzalo JD, Masters PA, Simons RJ, Chuang CH. Attending rounds and bedside case presentations: medical student and medicine resident experiences and attitudes. Teach Learn Med. 2009;21(2):105-110. PubMed
21. Shoeb M, Khanna R, Fang M, et al. Internal medicine rounding practices and the Accreditation Council for Graduate Medical Education core competencies. J Hosp Med. 2014;9(4):239-243. PubMed
22. Calderon AS, Blackmore CC, Williams BL, et al. Transforming ward rounds through rounding-in-flow. J Grad Med Educ. 2014;6(4):750-755. PubMed
23. Henkin S, Chon TY, Christopherson ML, Halvorsen AJ, Worden LM, Ratelle JT. Improving nurse-physician teamwork through interprofessional bedside rounding. J Multidiscip Healthc. 2016;9:201-205. PubMed
24. O’Leary KJ, Killarney A, Hansen LO, et al. Effect of patient-centred bedside rounds on hospitalised patients’ decision control, activation and satisfaction with care. BMJ Qual Saf. 2016;25:921-928. PubMed
25. Southwick F, Lewis M, Treloar D, et al. Applying athletic principles to medical rounds to improve teaching and patient care. Acad Med. 2014;89(7):1018-1023. PubMed
26. Najafi N, Monash B, Mourad M, et al. Improving attending rounds: Qualitative reflections from multidisciplinary providers. Hosp Pract (1995). 2015;43(3):186-190. PubMed
27. Altman DG. Practical Statistics For Medical Research. Boca Raton, FL: Chapman & Hall/CRC; 2006.
28. Gonzalo JD, Chuang CH, Huang G, Smith C. The return of bedside rounds: an educational intervention. J Gen Intern Med. 2010;25(8):792-798. PubMed
29. Fletcher KE, Rankey DS, Stern DT. Bedside interactions from the other side of the bedrail. J Gen Intern Med. 2005;20(1):58-61. PubMed
30. Gatorounds: Applying Championship Athletic Principles to Healthcare. University of Florida Health. http://gatorounds.med.ufl.edu/surveys/. Accessed March 1, 2013.
31. Gonzalo JD, Heist BS, Duffy BL, et al. The value of bedside rounds: a multicenter qualitative study. Teach Learn Med. 2013;25(4):326-333. PubMed
32. Rogers HD, Carline JD, Paauw DS. Examination room presentations in general internal medicine clinic: patients’ and students’ perceptions. Acad Med. 2003;78(9):945-949. PubMed
33. Fletcher KE, Furney SL, Stern DT. Patients speak: what’s really important about bedside interactions with physician teams. Teach Learn Med. 2007;19(2):120-127. PubMed
34. Satterfield JM, Bereknyei S, Hilton JF, et al. The prevalence of social and behavioral topics and related educational opportunities during attending rounds. Acad Med. 2014; 89(11):1548-1557. PubMed
35. Kroenke K, Simmons JO, Copley JB, Smith C. Attending rounds: a survey of physician attitudes. J Gen Intern Med. 1990;5(3):229-233. PubMed
36. Castiglioni A, Shewchuk RM, Willett LL, Heudebert GR, Centor RM. A pilot study using nominal group technique to assess residents’ perceptions of successful attending rounds. J Gen Intern Med. 2008;23(7):1060-1065. PubMed
37. Crumlish CM, Yialamas MA, McMahon GT. Quantification of bedside teaching by an academic hospitalist group. J Hosp Med. 2009;4(5):304-307. PubMed
38. Gonzalo JD, Wolpaw DR, Lehman E, Chuang CH. Patient-centered interprofessional collaborative care: factors associated with bedside interprofessional rounds. J Gen Intern Med. 2014;29(7):1040-1047. PubMed
39. Roy B, Castiglioni A, Kraemer RR, et al. Using cognitive mapping to define key domains for successful attending rounds. J Gen Intern Med. 2012;27(11):1492-1498. PubMed
40. Bhansali P, Birch S, Campbell JK, et al. A time-motion study of inpatient rounds using a family-centered rounds model. Hosp Pediatr. 2013;3(1):31-38. PubMed
Patient experience has recently received heightened attention given evidence supporting an association between patient experience and quality of care,1 and the coupling of patient satisfaction to reimbursement rates for Medicare patients.2 Patient experience is often assessed through surveys of patient satisfaction, which correlates with patient perceptions of nurse and physician communication.3 Teaching hospitals introduce variables that may impact communication, including the involvement of multiple levels of care providers and competing patient care vs. educational priorities. Patients admitted to teaching services express decreased satisfaction with coordination and overall care compared with patients on nonteaching services.4
Clinical supervision of trainees on teaching services is primarily achieved through attending rounds (AR), where patients’ clinical presentations and management are discussed with an attending physician. Poor communication during AR may negatively affect the patient experience through inefficient care coordination among the inter-professional care team or through implementation of interventions without patients’ knowledge or input.5-11 Although patient engagement in rounds has been associated with higher patient satisfaction with rounds,12-19 AR and case presentations often occur at a distance from the patient’s bedside.20,21 Furthermore, AR vary in the time allotted per patient and the extent of participation of nurses and other allied health professionals. Standardized bedside rounding processes have been shown to improve efficiency, decrease daily resident work hours,22 and improve nurse-physician teamwork.23
Despite these benefits, recent prospective studies of bedside AR interventions have not improved patient satisfaction with rounds. One involved the implementation of interprofessional patient-centered bedside rounds on a nonteaching service,24 while the other evaluated the impact of integrating athletic principles into multidisciplinary work rounds.25 Work at our institution had sought to develop AR practice recommendations to foster an optimal patient experience, while maintaining provider workflow efficiency, facilitating interdisciplinary communication, and advancing trainee education.26 Using these AR recommendations, we conducted a prospective randomized controlled trial to evaluate the impact of implementing a standardized bedside AR model on patient satisfaction with rounds. We also assessed attending physician and trainee satisfaction with rounds, and perceived and actual AR duration.
METHODS
Setting and Participants
This trial was conducted on the internal medicine teaching service of the University of California San Francisco Medical Center from September 3, 2013 to November 27, 2013. The service is comprised of 8 teams, with a total average daily census of 80 to 90 patients. Teams are comprised of an attending physician, a senior resident (in the second or third year of residency training), 2 interns, and a third- and/or fourth-year medical student.
This trial, which was approved by the University of California, San Francisco Committee on Human Research (UCSF CHR) and was registered with ClinicalTrials.gov (NCT01931553), was classified under Quality Improvement and did not require informed consent of patients or providers.
Intervention Description
We conducted a cluster randomized trial to evaluate the impact of a bundled set of 5 AR practice recommendations, adapted from published work,26 on patient experience, as well as on attending and trainee satisfaction: 1) huddling to establish the rounding schedule and priorities; 2) conducting bedside rounds; 3) integrating bedside nurses; 4) completing real-time order entry using bedside computers; 5) updating the whiteboard in each patient’s room with care plan information.
At the beginning of each month, study investigators (Nader Najafi and Bradley Monash) led a 1.5-hour workshop to train attending physicians and trainees allocated to the intervention arm on the recommended AR practices. Participants also received informational handouts to be referenced during AR. Attending physicians and trainees randomized to the control arm continued usual rounding practices. Control teams were notified that there would be observers on rounds but were not informed of the study aims.
Randomization and Team Assignments
The medicine service was divided into 2 arms, each comprised of 4 teams. Using a coin flip, Cluster 1 (Teams A, B, C and D) was randomized to the intervention, and Cluster 2 (Teams E, F, G and H) was randomized to the control. This design was pragmatically chosen to ensure that 1 team from each arm would admit patients daily. Allocation concealment of attending physicians and trainees was not possible given the nature of the intervention. Patients were blinded to study arm allocation.
MEASURES AND OUTCOMES
Adherence to Practice Recommendations
Thirty premedical students served as volunteer AR auditors. Each auditor received orientation and training in data collection techniques during a single 2-hour workshop. The auditors, blinded to study arm allocation, independently observed morning AR during weekdays and recorded the completion of the following elements as a dichotomous (yes/no) outcome: pre-rounds huddle, participation of nurse in AR, real-time order entry, and whiteboard use. They recorded the duration of AR per day for each team (minutes) and the rounding model for each patient rounding encounter during AR (bedside, hallway, or card flip).23 Bedside rounds were defined as presentation and discussion of the patient care plan in the presence of the patient. Hallway rounds were defined as presentation and discussion of the patient care plan partially outside the patient’s room and partially in the presence of the patient. Card-flip rounds were defined as presentation and discussion of the patient care plan entirely outside of the patient’s room without the team seeing the patient together. Two auditors simultaneously observed a random subset of patient-rounding encounters to evaluate inter-rater reliability, and the concordance between auditor observations was good (Pearson correlation = 0.66).27
Patient-Related Outcomes
The primary outcome was patient satisfaction with AR, assessed using a survey adapted from published work.12,14,28,29 Patients were approached to complete the questionnaire after they had experienced at least 1 AR. Patients were excluded if they were non-English-speaking, unavailable (eg, off the unit for testing or treatment), in isolation, or had impaired mental status. For patients admitted multiple times during the study period, only the first questionnaire was used. Survey questions included patient involvement in decision-making, quality of communication between patient and medicine team, and the perception that the medicine team cared about the patient. Patients were asked to state their level of agreement with each item on a 5-point Likert scale. We obtained data on patient demographics from administrative datasets.
Healthcare Provider Outcomes
Attending physicians and trainees on service for at least 7 consecutive days were sent an electronic survey, adapted from published work.25,30 Questions assessed satisfaction with AR, perceived value of bedside rounds, and extent of patient and nursing involvement.Level of agreement with each item was captured on a continuous scale; 0 = strongly disagree to 100 = strongly agree, or from 0 (far too little) to 100 (far too much), with 50 equating to “about right.” Attending physicians and trainees were also asked to estimate the average duration of AR (in minutes).
Statistical Analyses
Analyses were blinded to study arm allocation and followed intention-to-treat principles. One attending physician crossed over from intervention to control arm; patient surveys associated with this attending (n = 4) were excluded to avoid contamination. No trainees crossed over.
Demographic and clinical characteristics of patients who completed the survey are reported (Appendix). To compare patient satisfaction scores, we used a random-effects regression model to account for correlation among responses within teams within randomized clusters, defining teams by attending physician. As this correlation was negligible and not statistically significant, we did not adjust ordinary linear regression models for clustering. Given observed differences in patient characteristics, we adjusted for a number of covariates (eg, age, gender, insurance payer, race, marital status, trial group arm).
We conducted simple linear regression for attending and trainee satisfaction comparisons between arms, adjusting only for trainee type (eg, resident, intern, and medical student).
We compared the frequency with which intervention and control teams adhered to the 5 recommended AR practices using chi-square tests. We used independent Student’s t tests to compare total duration of AR by teams within each arm, as well as mean time spent per patient.
This trial had a fixed number of arms (n = 2), each of fixed size (n = 600), based on the average monthly inpatient census on the medicine service. This fixed sample size, with 80% power and α = 0.05, will be able to detect a 0.16 difference in patient satisfaction scores between groups.
All analyses were conducted using SAS® v 9.4 (SAS Institute, Inc., Cary, NC).
RESULTS
We observed 241 AR involving 1855 patient rounding encounters in the intervention arm and 264 AR involving 1903 patient rounding encounters in the control arm (response rates shown in Figure 1).
Patient Satisfaction and Clinical Outcomes
Five hundred ninety-five patients were allocated to the intervention arm and 605 were allocated to the control arm (Figure 1). Mean age, gender, race, marital status, primary language, and insurance provider did not differ between intervention and control arms (Table 1).
Patients in the intervention arm reported significantly higher satisfaction with AR and felt more cared for by their medicine team (Table 2).
Actual and Perceived Duration of Attending Rounds
The intervention shortened the total duration of AR by 8 minutes on average (143 vs. 151 minutes, P = 0.052) and the time spent per patient by 4 minutes on average (19 vs. 23 minutes, P < 0.001). Despite this, trainees in the intervention arm perceived AR to last longer (mean estimated time: 167 min vs. 152 min, P < 0.001).
Healthcare Provider Outcomes
We observed 79 attending physicians and trainees in the intervention arm and 78 in the control arm, with survey response rates shown in Figure 1. Attending physicians in the intervention and the control arms reported high levels of satisfaction with the quality of AR (Table 2). Attending physicians in the intervention arm were more likely to report an appropriate level of patient involvement and nurse involvement.
Although trainees in the intervention and control arms reported high levels of satisfaction with the quality of AR, trainees in the intervention arm reported lower satisfaction with AR compared with control arm trainees (Table 2). Trainees in the intervention arm reported that AR involved less autonomy, efficiency, and teaching. Trainees in the intervention arm also scored patient involvement more towards the “far too much” end of the scale compared with “about right” in the control arm. However, trainees in the intervention arm perceived nurse involvement closer to “about right,” as opposed to “far too little” in the control arm.
CONCLUSION/DISCUSSION
Training internal medicine teams to adhere to 5 recommended AR practices increased patient satisfaction with AR and the perception that patients were more cared for by their medicine team. Despite the intervention potentially shortening the duration of AR, attending physicians and trainees perceived AR to last longer, and trainee satisfaction with AR decreased.
Teams in the intervention arm adhered to all recommended rounding practices at higher rates than the control teams. Although intervention teams rounded at the bedside 53% of the time, they were encouraged to bedside round only on patients who desired to participate in rounds, were not altered, and for whom the clinical discussion was not too sensitive to occur at the bedside. Of the recommended rounding behaviors, the lowest adherence was seen with whiteboard use.
A major component of the intervention was to move the clinical presentation to the patient’s bedside. Most patients prefer being included in rounds and partaking in trainee education.12-19,28,29,31-33 Patients may also perceive that more time is spent with them during bedside case presentations,14,28 and exposure to providers conferring on their care may enhance patient confidence in the care being delivered.12 Although a recent study of patient-centered bedside rounding on a nonteaching service did not result in increased patient satisfaction,24 teaching services may offer more opportunities for improvement in care coordination and communication.4
Other aspects of the intervention may have contributed to increased patient satisfaction with AR. The pre-rounds huddle may have helped teams prioritize which patients required more time or would benefit most from bedside rounds. The involvement of nurses in AR may have bolstered communication and team dynamics, enhancing the patient’s perception of interprofessional collaboration. Real-time order entry might have led to more efficient implementation of the care plan, and whiteboard use may have helped to keep patients abreast of the care plan.
Patients in the intervention arm felt more cared for by their medicine teams but did not report improvements in communication or in shared decision-making. Prior work highlights that limited patient engagement, activation, and shared decision-making may occur during AR.24,34 Patient-physician communication during AR is challenged by time pressures and competing priorities, including the “need” for trainees to demonstrate their medical knowledge and clinical skills. Efforts that encourage bedside rounding should include communication training with respect to patient engagement and shared decision-making.
Attending physicians reported positive attitudes toward bedside rounding, consistent with prior studies.13,21,31 However, trainees in the intervention arm expressed decreased satisfaction with AR, estimating that AR took longer and reporting too much patient involvement. Prior studies reflect similar bedside-rounding concerns, including perceived workflow inefficiencies, infringement on teaching opportunities, and time constraints.12,20,35 Trainees are under intense time pressures to complete their work, attend educational conferences, and leave the hospital to attend afternoon clinic or to comply with duty-hour restrictions. Trainees value succinctness,12,35,36 so the perception that intervention AR lasted longer likely contributed to trainee dissatisfaction.
Reduced trainee satisfaction with intervention AR may have also stemmed from the perception of decreased autonomy and less teaching, both valued by trainees.20,35,36 The intervention itself reduced trainee autonomy because usual practice at our hospital involves residents deciding where and how to round. Attending physician presence at the bedside during rounds may have further infringed on trainee autonomy if the patient looked to the attending for answers, or if the attending was seen as the AR leader. Attending physicians may mitigate the risk of compromising trainee autonomy by allowing the trainee to speak first, ensuring the trainee is positioned closer to, and at eye level with, the patient, and redirecting patient questions to the trainee as appropriate. Optimizing trainee experience with bedside AR requires preparation and training of attending physicians, who may feel inadequately prepared to lead bedside rounds and conduct bedside teaching.37 Faculty must learn how to preserve team efficiency, create a safe, nonpunitive bedside environment that fosters the trainee-patient relationship, and ensure rounds remain educational.36,38,39
The intervention reduced the average time spent on AR and time spent per patient. Studies examining the relationship between bedside rounding and duration of rounds have yielded mixed results: some have demonstrated no effect of bedside rounds on rounding time,28,40 while others report longer rounding times.37 The pre-rounds huddle and real-time order writing may have enhanced workflow efficiency.
Our study has several limitations. These results reflect the experience of a single large academic medical center and may not be generalizable to other settings. Although overall patient response to the survey was low and may not be representative of the entire patient population, response rates in the intervention and control arms were equivalent. Non-English speaking patients may have preferences that were not reflected in our survey results, and we did not otherwise quantify individual reasons for survey noncompletion. The presence of auditors on AR may have introduced observer bias. There may have been crossover effect; however, observed prevalence of individual practices remained low in the control arm. The 1.5-hour workshop may have inadequately equipped trainees with the complex skills required to lead and participate in bedside rounding, and more training, experience, and feedback may have yielded different results. For instance, residents with more exposure to bedside rounding express greater appreciation of its role in education and patient care.20 While adherence to some of the recommended practices remained low, we did not employ a full range of change-management techniques. Instead, we opted for a “low intensity” intervention (eg, single workshop, handouts) that relied on voluntary adoption by medicine teams and that we hoped other institutions could reproduce. Finally, we did not assess the relative impact of individual rounding behaviors on the measured outcomes.
In conclusion, training medicine teams to adhere to a standardized bedside AR model increased patient satisfaction with rounds. Concomitant trainee dissatisfaction may require further experience and training of attending physicians and trainees to ensure successful adoption.
Acknowledgements
We would like to thank all patients, providers, and trainees who participated in this study. We would also like to acknowledge the following volunteer auditors who observed teams daily: Arianna Abundo, Elahhe Afkhamnejad, Yolanda Banuelos, Laila Fozoun, Soe Yupar Khin, Tam Thien Le, Wing Sum Li, Yaqiao Li, Mengyao Liu, Tzyy-Harn Lo, Shynh-Herng Lo, David Lowe, Danoush Paborji, Sa Nan Park, Urmila Powale, Redha Fouad Qabazard, Monique Quiroz, John-Luke Marcelo Rivera, Manfred Roy Luna Salvador, Tobias Gowen Squier-Roper, Flora Yan Ting, Francesca Natasha T. Tizon, Emily Claire Trautner, Stephen Weiner, Alice Wilson, Kimberly Woo, Bingling J Wu, Johnny Wu, Brenda Yee. Statistical expertise was provided by Joan Hilton from the UCSF Clinical and Translational Science Institute (CTSI), which is supported by the National Center for Advancing Translational Sciences, National Institutes of Health, through UCSF-CTSI Grant Number UL1 TR000004. Its contents are solely the responsibility of the authors and do not necessarily represent the official views of the NIH. Thanks also to Oralia Schatzman, Andrea Mazzini, and Erika Huie for their administrative support, and John Hillman for data-related support. Special thanks to Kirsten Kangelaris and Andrew Auerbach for their valuable feedback throughout, and to Maria Novelero and Robert Wachter for their divisional support of this project.
Disclosure
The authors report no financial conflicts of interest.
1. Doyle C, Lennox L, Bell D. A systematic review of evidence on the links between patient experience and clinical safety and effectiveness. BMJ Open. 2013;3(1):1-18. PubMed
2. Hospital Consumer Assessment of Healthcare Providers and Systems (HCAHPS) Fact Sheet. August 2013. Centers for Medicare and Medicaid Services (CMS). Baltimore, MD.http://www.hcahpsonline.org/files/August_2013_HCAHPS_Fact_Sheet3.pdf. Accessed December 1, 2015.
3. Boulding W, Glickman SW, Manary MP, Schulman KA, Staelin R. Relationship between patient satisfaction with inpatient care and hospital readmission within 30 days. Am J Manag Care. 2011;17:41-48. PubMed
4. Wray CM, Flores A, Padula WV, Prochaska MT, Meltzer DO, Arora VM. Measuring patient experiences on hospitalist and teaching services: Patient responses to a 30-day postdischarge questionnaire. J Hosp Med. 2016;11(2):99-104. PubMed
5. Bharwani AM, Harris GC, Southwick FS. Perspective: A business school view of medical interprofessional rounds: transforming rounding groups into rounding teams. Acad Med. 2012;87(12):1768-1771. PubMed
6. Chand DV. Observational study using the tools of lean six sigma to improve the efficiency of the resident rounding process. J Grad Med Educ. 2011;3(2):144-150. PubMed
7. Stickrath C, Noble M, Prochazka A, et al. Attending rounds in the current era: what is and is not happening. JAMA Intern Med. 2013;173(12):1084-1089. PubMed
8. Weber H, Stöckli M, Nübling M, Langewitz WA. Communication during ward rounds in internal medicine. An analysis of patient-nurse-physician interactions using RIAS. Patient Educ Couns. 2007;67(3):343-348. PubMed
9. McMahon GT, Katz JT, Thorndike ME, Levy BD, Loscalzo J. Evaluation of a redesign initiative in an internal-medicine residency. N Engl J Med. 2010;362(14):1304-1311. PubMed
10. Amoss J. Attending rounds: where do we go from here?: comment on “Attending rounds in the current era”. JAMA Intern Med. 2013;173(12):1089-1090. PubMed
11. Curley C, McEachern JE, Speroff T. A firm trial of interdisciplinary rounds on the inpatient medical wards: an intervention designed using continuous quality improvement. Med Care. 1998;36(suppl 8):AS4-A12. PubMed
12. Wang-Cheng RM, Barnas GP, Sigmann P, Riendl PA, Young MJ. Bedside case presentations: why patients like them but learners don’t. J Gen Intern Med. 1989;4(4):284-287. PubMed
13. Chauke, HL, Pattinson RC. Ward rounds—bedside or conference room? S Afr Med J. 2006;96(5):398-400. PubMed
14. Lehmann LS, Brancati FL, Chen MC, Roter D, Dobs AS. The effect of bedside case presentations on patients’ perceptions of their medical care. N Engl J Med. 1997;336(16):336, 1150-1155. PubMed
15. Simons RJ, Baily RG, Zelis R, Zwillich CW. The physiologic and psychological effects of the bedside presentation. N Engl J Med. 1989;321(18):1273-1275. PubMed
16. Wise TN, Feldheim D, Mann LS, Boyle E, Rustgi VK. Patients’ reactions to house staff work rounds. Psychosomatics. 1985;26(8):669-672. PubMed
17. Linfors EW, Neelon FA. Sounding Boards. The case of bedside rounds. N Engl J Med. 1980;303(21):1230-1233. PubMed
18. Nair BR, Coughlan JL, Hensley MJ. Student and patient perspectives on bedside teaching. Med Educ. 1997;31(5):341-346. PubMed
19. Romano J. Patients’ attitudes and behavior in ward round teaching. JAMA. 1941;117(9):664-667.
20. Gonzalo JD, Masters PA, Simons RJ, Chuang CH. Attending rounds and bedside case presentations: medical student and medicine resident experiences and attitudes. Teach Learn Med. 2009;21(2):105-110. PubMed
21. Shoeb M, Khanna R, Fang M, et al. Internal medicine rounding practices and the Accreditation Council for Graduate Medical Education core competencies. J Hosp Med. 2014;9(4):239-243. PubMed
22. Calderon AS, Blackmore CC, Williams BL, et al. Transforming ward rounds through rounding-in-flow. J Grad Med Educ. 2014;6(4):750-755. PubMed
23. Henkin S, Chon TY, Christopherson ML, Halvorsen AJ, Worden LM, Ratelle JT. Improving nurse-physician teamwork through interprofessional bedside rounding. J Multidiscip Healthc. 2016;9:201-205. PubMed
24. O’Leary KJ, Killarney A, Hansen LO, et al. Effect of patient-centred bedside rounds on hospitalised patients’ decision control, activation and satisfaction with care. BMJ Qual Saf. 2016;25:921-928. PubMed
25. Southwick F, Lewis M, Treloar D, et al. Applying athletic principles to medical rounds to improve teaching and patient care. Acad Med. 2014;89(7):1018-1023. PubMed
26. Najafi N, Monash B, Mourad M, et al. Improving attending rounds: Qualitative reflections from multidisciplinary providers. Hosp Pract (1995). 2015;43(3):186-190. PubMed
27. Altman DG. Practical Statistics For Medical Research. Boca Raton, FL: Chapman & Hall/CRC; 2006.
28. Gonzalo JD, Chuang CH, Huang G, Smith C. The return of bedside rounds: an educational intervention. J Gen Intern Med. 2010;25(8):792-798. PubMed
29. Fletcher KE, Rankey DS, Stern DT. Bedside interactions from the other side of the bedrail. J Gen Intern Med. 2005;20(1):58-61. PubMed
30. Gatorounds: Applying Championship Athletic Principles to Healthcare. University of Florida Health. http://gatorounds.med.ufl.edu/surveys/. Accessed March 1, 2013.
31. Gonzalo JD, Heist BS, Duffy BL, et al. The value of bedside rounds: a multicenter qualitative study. Teach Learn Med. 2013;25(4):326-333. PubMed
32. Rogers HD, Carline JD, Paauw DS. Examination room presentations in general internal medicine clinic: patients’ and students’ perceptions. Acad Med. 2003;78(9):945-949. PubMed
33. Fletcher KE, Furney SL, Stern DT. Patients speak: what’s really important about bedside interactions with physician teams. Teach Learn Med. 2007;19(2):120-127. PubMed
34. Satterfield JM, Bereknyei S, Hilton JF, et al. The prevalence of social and behavioral topics and related educational opportunities during attending rounds. Acad Med. 2014; 89(11):1548-1557. PubMed
35. Kroenke K, Simmons JO, Copley JB, Smith C. Attending rounds: a survey of physician attitudes. J Gen Intern Med. 1990;5(3):229-233. PubMed
36. Castiglioni A, Shewchuk RM, Willett LL, Heudebert GR, Centor RM. A pilot study using nominal group technique to assess residents’ perceptions of successful attending rounds. J Gen Intern Med. 2008;23(7):1060-1065. PubMed
37. Crumlish CM, Yialamas MA, McMahon GT. Quantification of bedside teaching by an academic hospitalist group. J Hosp Med. 2009;4(5):304-307. PubMed
38. Gonzalo JD, Wolpaw DR, Lehman E, Chuang CH. Patient-centered interprofessional collaborative care: factors associated with bedside interprofessional rounds. J Gen Intern Med. 2014;29(7):1040-1047. PubMed
39. Roy B, Castiglioni A, Kraemer RR, et al. Using cognitive mapping to define key domains for successful attending rounds. J Gen Intern Med. 2012;27(11):1492-1498. PubMed
40. Bhansali P, Birch S, Campbell JK, et al. A time-motion study of inpatient rounds using a family-centered rounds model. Hosp Pediatr. 2013;3(1):31-38. PubMed
© 2017 Society of Hospital Medicine
Precision and Accuracy of Identification of Anatomical Surface Landmarks by 30 Expert Hip Arthroscopists
Take-Home Points
- Surface landmarks are routinely used for physical examination and surgical technique.
- Common surface landmarks used in establishing arthroscopic portals may be more difficult to accurately identify than previously thought.
- The greater trochanter was the surface landmark most precisely identified by expert examiners.
- Ultrasound examination identified landmarks varied from landmarks identified by palpation alone.
Anatomical surface landmarks about the hip and lower abdomen are often referenced when placing arthroscopic portals and office-based injections.1-3 However, the degree to which these landmarks can be reproducibly identified using only visual inspection and palpation is unknown.
Safe access to the hip joint and surrounding structures during hip arthroscopy has been a focus in the orthopedic literature. Authors have described anatomical relationships of recommended portals to neurovascular and other anatomical structures.4-6 This information has been reported in millimeters to centimeters of safety based on cadaver dissection studies.4-7We conducted a study to assess expert hip arthroscopists’ ability to identify, using only physical examination techniques, the anatomical structures used for reference when creating safe starting points for arthroscopic access. We hypothesized that variance in examiner-identified points would exceed safe distances from neurovascular structures for the most commonly used hip arthroscopic portals. The volunteer in this study provided written informed consent for print and electronic publication of this article.
Methods
In this study, we prospectively assessed 30 expert hip arthroscopic surgeons’ ability to identify commonly referenced surface landmarks on the adult male hip, using only inspection and manual palpation. Surgeons were defined as experts on the basis of their status as hip arthroscopy instructors at the Orthopaedic Learning Center (Rosemont, IL) for the Arthroscopy Association of North America and industry-sponsored hip arthroscopy education faculty (Arthrex). Five surface landmarks were selected for their relevance to publications on safe portal placement2-5: anterior superior iliac spine (ASIS), tip of greater trochanter (GT), rectus origin (RO), superficial inguinal ring (SIR), and psoas tendon (PT).
A healthy adult male volunteer was placed supine on an examination table and exposed distally from the mid abdomen, with the perineum and the genital area covered bikini-style. An expert musculoskeletal ultrasonographer used a handheld musculoskeletal ultrasound transducer (Sonosite) to identify the 5 landmarks. Short- and long-axis images of each structure were obtained. The examiner applied a round (1 cm in diameter), uniquely colored adhesive label to the skin over each location. A professional photographer using a Canon digital camera and fixed mounts made precise overhead and lateral images. The positional integrity and scale of these images were confirmed with referral to constant anatomical skin features. Images were archived for analysis (Figure 1A).
After the ultrasonographer’s labels were removed, each of the 30 expert hip arthroscopic surgeons identified the structures by static physical examination (inspection and palpation only) and applied the same colored labels to the skin. 
Imaging software (Adobe Photoshop Creative Suite 5.1) was used to superimpose the digital images of the examiner labels on those of the ultrasound-verified anatomical labels (Figure 1C). Measurements were then taken with digital calipers to determine average distance from ultrasound label; accuracy within 10 mm of verified ultrasound label; true average location (TAL) determined by 95% confidence interval (CI); and interobserver variability calculated by 95% prediction interval, which determined the probability of where an additional examiner data point would lie.
In the second arm of the study, examiner data were compared with previously published data on arthroscopic portal safety. 
Results
Average absolute distance from examiner labels to ultrasonographer labels was 31 mm for ASIS, 24 mm for GT, 26 mm for RO, 19 mm for SIR, and 35 mm for PT (Figure 2).
Of the 30 surgeons, 1 (3%) came within 10 mm of the ultrasound for ASIS, 1 (3%) for GT, 4 (13%) for RO, 5 (17%) for SIR, and 1 (3%) for PT (Table 1).![]()
TAL as determined by CI was 16 mm medial and 29 mm inferior for ASIS; 8 mm anterior and 22 mm superior for GT; 10 mm medial and 25 mm inferior for RO; 5 mm lateral and 5 mm inferior for SIR; and 28 mm medial and 16 mm inferior for PT (Figure 3, Table 2). Interobserver variability determined by prediction interval had a range of 18 mm medial to lateral × 36 mm proximal to distal for ASIS; 33 mm anterior to posterior × 48 mm superior to inferior for GT; 41 mm medial to distal × 54 mm proximal to distal for RO; 51 mm medial to lateral × 74 mm proximal to distal for SIR; and 49 mm medial to distal × 61 mm proximal to distal for PT.
![]()
Given the difference between examiner data (direction and distance from ultrasound labels) and published data (distance to significant neurovascular structures), inaccurate identification of surface landmarks has the potential to lead to AP and MAP damage (Table 3). The examiner GT and ASIS surface landmarks used for AP overlapped directly with the safe distances for the lateral femoral cutaneous nerve and the terminal branch of the lateral circumflex femoral artery.
Discussion
Others have investigated examiners’ use of palpation, compared with ultrasound, to identify common shoulder and knee structures.8-10 In a 2011 systematic review, Gilliland and colleagues11 confirmed that accuracy was improved with use of ultrasound (vs palpation) for injections in the shoulder, hip, knee, wrist, and ankle. Given the scarcity of data in this setting, we conducted the present study to assess the precision and accuracy of expert arthroscopists in identifying common surface landmarks. We hypothesized that physical examination and ultrasound examination would differ significantly in precisely and accurately identifying these landmarks.
Working with a standard awake volunteer, our test group of examiners was consistently inaccurate when they accepted ultrasonographer-placed labels as the ideal. Precision within the group, however, trended toward close agreement; examiners consistently placed labels in the same direction and approximate magnitude away from ultrasonographer labels. This suggests that a discrepancy between the ultrasonographic surface structure definitions taught to ultrasonographers and the manually identified definitions taught to surgeons for arthroscopy (training bias) can generate differences in landmark identification.
Given reported low rates of complications in the creation of standard surface anatomy portals, more data is needed to correlate whether safe distance guidelines best apply to the points identified by hip experts or the points identified by ultrasonographers. In a 2013 systematic review, Harris and colleagues8 found a 7.5% overall complication rate, with temporary neuropraxia 1 of the 2 most common complications. Whether adding ultrasound to physical examination for the creation of some or all portals will reduce the incidence of these problems is unknown. Regardless of the anatomical area referenced by experts for portal creation, the tight grouping of examiner marks in our study supports a consensus regarding the location of the landmarks studied.
In our study of the use of surface anatomical landmarks for the creation of portals, we analyzed 4 previously described locations: ALP, AP, PLP, and MAP. ALP, AP, and PLP directly reference at least 1 surface anatomical structure; AP references 2 anatomical structures (ASIS, GT); and MAP indirectly references ASIS and GT and directly references ALP and AP. In cadaveric and radiographic studies, 7 neurovascular structures have been described in proximity to ALP, AP, MAP, and PLP: superior gluteal nerve, sciatic nerve, femoral nerve, lateral femoral cutaneous nerve, lateral circumflex femoral artery, and medial circumflex femoral artery.5,6 Our results showed that use of surface anatomy in AP and MAP creation most likely places structures at risk, given the overlap of examiner CIs and the previously published cadaveric5,6 and radiographic7 data.
Hua and colleagues12 confirmed the feasibility of using ultrasound for the creation of hip arthroscopy portals. More data is needed to assess how the standard palpation-and-fluoroscopy method described by Byrd3 compares with an ultrasound-guided technique in safety and cost. However, data from our study should not be used to justify a demand for ultrasound during arthroscopy portal establishment, as limitations do not permit such a recommendation.
With diagnostic injection remaining a mainstay of differential diagnosis and treatment about the hip,1 the data presented here suggest a potential for ultrasound in enhancing outcomes. There is evidence supporting the role of image guidance in improving palpation accuracy in the area of the biceps tendon in the forearm.10 Potentially, identification and treatment of specific extra-articular structures surrounding the hip could be made safer with more routine use of ultrasound.
Limitations
This study had several limitations. The surgeons were limited to palpation and static examination of a body in its natural state. Hip arthroscopic portals typically are created under traction and after a standard perineal post is placed for hip arthroscopy. In addition, in an awake injection setting, the clinician may receive patient feedback in the form of limb movement or speech. To what degree palpation or ultrasound will be affected in these scenarios is unknown.
Another limitation is the lack of serial examination by each examiner—intrarater variability could not be gauged. In addition, with only 1 ultrasonographic examination performed, there is the potential that adding ultrasonographic examinations, or having an examiner perform serial physical examinations, could better define the precision of each component. Given the practical limitations of our volunteer’s time and the schedules of 30 expert arthroscopists, we kept the chosen study design for its single setting.
Conclusion
Visual inspection and manual palpation are standard means of identifying common surface anatomical landmarks for the creation of arthroscopy portals and the placement of injections. Our study results showed variance in landmark identification between expert examiners and an ultrasonographer. The degree of variance exceeded established neurovascular safe zones, particularly for AP and MAP. This new evidence calls for further investigation into the best, safest means of performing hip arthroscopic techniques and injection-based interventions.
Am J Orthop. 2017;46(1):E65-E70. Copyright Frontline Medical Communications Inc. 2017. All rights reserved.
1. Byrd JW, Potts EA, Allison RK, Jones KS. Ultrasound-guided hip injections: a comparative study with fluoroscopy-guided injections. Arthroscopy. 2014;30(1):42-46.
2. Dienst M, Seil R, Kohn DM. Safe arthroscopic access to the central compartment of the hip. Arthroscopy. 2005;21(12):1510-1514.
3. Byrd JW. Hip arthroscopy, the supine approach: technique and anatomy of the intraarticular and peripheral compartments. Tech Orthop. 2005;20(1):17-31.
4. Bond JL, Knutson ZA, Ebert A, Guanche CA. The 23-point arthroscopic examination of the hip: basic setup, portal placement, and surgical technique. Arthroscopy. 2009;25(4):416-429.
5. Roberson WJ, Kelly BT. The safe zone for hip arthroscopy: a cadaveric assessment of central, peripheral, and lateral compartment portal placement. Arthroscopy. 2008;24(9):1019-1026.
6. Byrd JW, Pappas JN, Pedley MJ. Hip arthroscopy: an anatomic study of portal placement and relationship to the extra-articular structures. Arthroscopy. 1995;11(4):418-423.
7. Watson JN, Bohnenkamp F, El-Bitar Y, Moretti V, Domb BG. Variability in locations of hip neurovascular structures and their proximity to hip arthroscopic portals. Arthroscopy. 2014;30(4):462-467.
8. Harris JD, McCormick FM, Abrams GD, et al. Complications and reoperations during and after hip arthroscopy: a systematic review of 92 studies and more than 6,000 patients. Arthroscopy. 2013;29(3):589-595.
9. Jacobson JA, Bedi A, Sekiya JK, Blankenbaker DG. Evaluation of the painful athletic hip: imaging options and imaging-guided injections. AJR Am J Roentgenol. 2012;199(3):516-524.
10. Gazzillo GP, Finnoff JT, Hall MM, Sayeed YA, Smith J. Accuracy of palpating the long head of the biceps tendon: an ultrasonographic study. PM R. 2011;3(11):1035-1040.
11. Gilliland CA, Salazar LD, Borchers JR. Ultrasound versus anatomic guidance for intra-articular and periarticular injection: a systematic review. Phys Sportsmed. 2011;39(3):121-131.
12. Hua Y, Yang Y, Chen S, et al. Ultrasound-guided establishment of hip arthroscopy portals. Arthroscopy. 2009;25(12):1491-1495.
Take-Home Points
- Surface landmarks are routinely used for physical examination and surgical technique.
- Common surface landmarks used in establishing arthroscopic portals may be more difficult to accurately identify than previously thought.
- The greater trochanter was the surface landmark most precisely identified by expert examiners.
- Ultrasound examination identified landmarks varied from landmarks identified by palpation alone.
Anatomical surface landmarks about the hip and lower abdomen are often referenced when placing arthroscopic portals and office-based injections.1-3 However, the degree to which these landmarks can be reproducibly identified using only visual inspection and palpation is unknown.
Safe access to the hip joint and surrounding structures during hip arthroscopy has been a focus in the orthopedic literature. Authors have described anatomical relationships of recommended portals to neurovascular and other anatomical structures.4-6 This information has been reported in millimeters to centimeters of safety based on cadaver dissection studies.4-7We conducted a study to assess expert hip arthroscopists’ ability to identify, using only physical examination techniques, the anatomical structures used for reference when creating safe starting points for arthroscopic access. We hypothesized that variance in examiner-identified points would exceed safe distances from neurovascular structures for the most commonly used hip arthroscopic portals. The volunteer in this study provided written informed consent for print and electronic publication of this article.
Methods
In this study, we prospectively assessed 30 expert hip arthroscopic surgeons’ ability to identify commonly referenced surface landmarks on the adult male hip, using only inspection and manual palpation. Surgeons were defined as experts on the basis of their status as hip arthroscopy instructors at the Orthopaedic Learning Center (Rosemont, IL) for the Arthroscopy Association of North America and industry-sponsored hip arthroscopy education faculty (Arthrex). Five surface landmarks were selected for their relevance to publications on safe portal placement2-5: anterior superior iliac spine (ASIS), tip of greater trochanter (GT), rectus origin (RO), superficial inguinal ring (SIR), and psoas tendon (PT).
A healthy adult male volunteer was placed supine on an examination table and exposed distally from the mid abdomen, with the perineum and the genital area covered bikini-style. An expert musculoskeletal ultrasonographer used a handheld musculoskeletal ultrasound transducer (Sonosite) to identify the 5 landmarks. Short- and long-axis images of each structure were obtained. The examiner applied a round (1 cm in diameter), uniquely colored adhesive label to the skin over each location. A professional photographer using a Canon digital camera and fixed mounts made precise overhead and lateral images. The positional integrity and scale of these images were confirmed with referral to constant anatomical skin features. Images were archived for analysis (Figure 1A).
After the ultrasonographer’s labels were removed, each of the 30 expert hip arthroscopic surgeons identified the structures by static physical examination (inspection and palpation only) and applied the same colored labels to the skin.
Imaging software (Adobe Photoshop Creative Suite 5.1) was used to superimpose the digital images of the examiner labels on those of the ultrasound-verified anatomical labels (Figure 1C). Measurements were then taken with digital calipers to determine average distance from ultrasound label; accuracy within 10 mm of verified ultrasound label; true average location (TAL) determined by 95% confidence interval (CI); and interobserver variability calculated by 95% prediction interval, which determined the probability of where an additional examiner data point would lie.
In the second arm of the study, examiner data were compared with previously published data on arthroscopic portal safety.
Results
Average absolute distance from examiner labels to ultrasonographer labels was 31 mm for ASIS, 24 mm for GT, 26 mm for RO, 19 mm for SIR, and 35 mm for PT (Figure 2).
Of the 30 surgeons, 1 (3%) came within 10 mm of the ultrasound for ASIS, 1 (3%) for GT, 4 (13%) for RO, 5 (17%) for SIR, and 1 (3%) for PT (Table 1).![]()
TAL as determined by CI was 16 mm medial and 29 mm inferior for ASIS; 8 mm anterior and 22 mm superior for GT; 10 mm medial and 25 mm inferior for RO; 5 mm lateral and 5 mm inferior for SIR; and 28 mm medial and 16 mm inferior for PT (Figure 3, Table 2). Interobserver variability determined by prediction interval had a range of 18 mm medial to lateral × 36 mm proximal to distal for ASIS; 33 mm anterior to posterior × 48 mm superior to inferior for GT; 41 mm medial to distal × 54 mm proximal to distal for RO; 51 mm medial to lateral × 74 mm proximal to distal for SIR; and 49 mm medial to distal × 61 mm proximal to distal for PT.
![]()
Given the difference between examiner data (direction and distance from ultrasound labels) and published data (distance to significant neurovascular structures), inaccurate identification of surface landmarks has the potential to lead to AP and MAP damage (Table 3). The examiner GT and ASIS surface landmarks used for AP overlapped directly with the safe distances for the lateral femoral cutaneous nerve and the terminal branch of the lateral circumflex femoral artery.
Discussion
Others have investigated examiners’ use of palpation, compared with ultrasound, to identify common shoulder and knee structures.8-10 In a 2011 systematic review, Gilliland and colleagues11 confirmed that accuracy was improved with use of ultrasound (vs palpation) for injections in the shoulder, hip, knee, wrist, and ankle. Given the scarcity of data in this setting, we conducted the present study to assess the precision and accuracy of expert arthroscopists in identifying common surface landmarks. We hypothesized that physical examination and ultrasound examination would differ significantly in precisely and accurately identifying these landmarks.
Working with a standard awake volunteer, our test group of examiners was consistently inaccurate when they accepted ultrasonographer-placed labels as the ideal. Precision within the group, however, trended toward close agreement; examiners consistently placed labels in the same direction and approximate magnitude away from ultrasonographer labels. This suggests that a discrepancy between the ultrasonographic surface structure definitions taught to ultrasonographers and the manually identified definitions taught to surgeons for arthroscopy (training bias) can generate differences in landmark identification.
Given reported low rates of complications in the creation of standard surface anatomy portals, more data is needed to correlate whether safe distance guidelines best apply to the points identified by hip experts or the points identified by ultrasonographers. In a 2013 systematic review, Harris and colleagues8 found a 7.5% overall complication rate, with temporary neuropraxia 1 of the 2 most common complications. Whether adding ultrasound to physical examination for the creation of some or all portals will reduce the incidence of these problems is unknown. Regardless of the anatomical area referenced by experts for portal creation, the tight grouping of examiner marks in our study supports a consensus regarding the location of the landmarks studied.
In our study of the use of surface anatomical landmarks for the creation of portals, we analyzed 4 previously described locations: ALP, AP, PLP, and MAP. ALP, AP, and PLP directly reference at least 1 surface anatomical structure; AP references 2 anatomical structures (ASIS, GT); and MAP indirectly references ASIS and GT and directly references ALP and AP. In cadaveric and radiographic studies, 7 neurovascular structures have been described in proximity to ALP, AP, MAP, and PLP: superior gluteal nerve, sciatic nerve, femoral nerve, lateral femoral cutaneous nerve, lateral circumflex femoral artery, and medial circumflex femoral artery.5,6 Our results showed that use of surface anatomy in AP and MAP creation most likely places structures at risk, given the overlap of examiner CIs and the previously published cadaveric5,6 and radiographic7 data.
Hua and colleagues12 confirmed the feasibility of using ultrasound for the creation of hip arthroscopy portals. More data is needed to assess how the standard palpation-and-fluoroscopy method described by Byrd3 compares with an ultrasound-guided technique in safety and cost. However, data from our study should not be used to justify a demand for ultrasound during arthroscopy portal establishment, as limitations do not permit such a recommendation.
With diagnostic injection remaining a mainstay of differential diagnosis and treatment about the hip,1 the data presented here suggest a potential for ultrasound in enhancing outcomes. There is evidence supporting the role of image guidance in improving palpation accuracy in the area of the biceps tendon in the forearm.10 Potentially, identification and treatment of specific extra-articular structures surrounding the hip could be made safer with more routine use of ultrasound.
Limitations
This study had several limitations. The surgeons were limited to palpation and static examination of a body in its natural state. Hip arthroscopic portals typically are created under traction and after a standard perineal post is placed for hip arthroscopy. In addition, in an awake injection setting, the clinician may receive patient feedback in the form of limb movement or speech. To what degree palpation or ultrasound will be affected in these scenarios is unknown.
Another limitation is the lack of serial examination by each examiner—intrarater variability could not be gauged. In addition, with only 1 ultrasonographic examination performed, there is the potential that adding ultrasonographic examinations, or having an examiner perform serial physical examinations, could better define the precision of each component. Given the practical limitations of our volunteer’s time and the schedules of 30 expert arthroscopists, we kept the chosen study design for its single setting.
Conclusion
Visual inspection and manual palpation are standard means of identifying common surface anatomical landmarks for the creation of arthroscopy portals and the placement of injections. Our study results showed variance in landmark identification between expert examiners and an ultrasonographer. The degree of variance exceeded established neurovascular safe zones, particularly for AP and MAP. This new evidence calls for further investigation into the best, safest means of performing hip arthroscopic techniques and injection-based interventions.
Am J Orthop. 2017;46(1):E65-E70. Copyright Frontline Medical Communications Inc. 2017. All rights reserved.
1. Byrd JW, Potts EA, Allison RK, Jones KS. Ultrasound-guided hip injections: a comparative study with fluoroscopy-guided injections. Arthroscopy. 2014;30(1):42-46.
2. Dienst M, Seil R, Kohn DM. Safe arthroscopic access to the central compartment of the hip. Arthroscopy. 2005;21(12):1510-1514.
3. Byrd JW. Hip arthroscopy, the supine approach: technique and anatomy of the intraarticular and peripheral compartments. Tech Orthop. 2005;20(1):17-31.
4. Bond JL, Knutson ZA, Ebert A, Guanche CA. The 23-point arthroscopic examination of the hip: basic setup, portal placement, and surgical technique. Arthroscopy. 2009;25(4):416-429.
5. Roberson WJ, Kelly BT. The safe zone for hip arthroscopy: a cadaveric assessment of central, peripheral, and lateral compartment portal placement. Arthroscopy. 2008;24(9):1019-1026.
6. Byrd JW, Pappas JN, Pedley MJ. Hip arthroscopy: an anatomic study of portal placement and relationship to the extra-articular structures. Arthroscopy. 1995;11(4):418-423.
7. Watson JN, Bohnenkamp F, El-Bitar Y, Moretti V, Domb BG. Variability in locations of hip neurovascular structures and their proximity to hip arthroscopic portals. Arthroscopy. 2014;30(4):462-467.
8. Harris JD, McCormick FM, Abrams GD, et al. Complications and reoperations during and after hip arthroscopy: a systematic review of 92 studies and more than 6,000 patients. Arthroscopy. 2013;29(3):589-595.
9. Jacobson JA, Bedi A, Sekiya JK, Blankenbaker DG. Evaluation of the painful athletic hip: imaging options and imaging-guided injections. AJR Am J Roentgenol. 2012;199(3):516-524.
10. Gazzillo GP, Finnoff JT, Hall MM, Sayeed YA, Smith J. Accuracy of palpating the long head of the biceps tendon: an ultrasonographic study. PM R. 2011;3(11):1035-1040.
11. Gilliland CA, Salazar LD, Borchers JR. Ultrasound versus anatomic guidance for intra-articular and periarticular injection: a systematic review. Phys Sportsmed. 2011;39(3):121-131.
12. Hua Y, Yang Y, Chen S, et al. Ultrasound-guided establishment of hip arthroscopy portals. Arthroscopy. 2009;25(12):1491-1495.
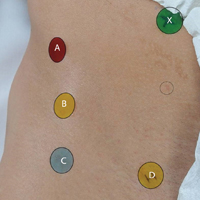
How Should the Treatment Costs of Distal Radius Fractures Be Measured?
Take-Home Points
- Physician fees, operating room costs, therapy costs, and missed work account for most (92%) of the costs in distal radius fractures.
- Indirect costs (especially missed work) contribute a significant amount to the total cost of injury.
- Patients continue to accrue costs up to 3-6 months post-injury.
- Implant costs make up only 6% of the total costs of operatively treated distal radius fractures.
Distal radius fractures (DRFs) account for 20% of all fractures seen in the emergency department, and are the most common fractures in all patients under age 75 years.1,2 Apart from causing pain and disability, DRFs have a large associated economic burden.3-6 In addition, over the past decade, the fixation technology used for DRF treatment has expanded rapidly and revolutionized operative management. With this expansion has come a growing body of high-level evidence guiding treatment decisions regarding patient outcomes.7-11 As operative treatment of these injuries has evolved, researchers have begun to critically evaluate both health outcomes and the cost-effectiveness of treatment choices.12,13
Determining the cost-effectiveness of any medical intervention requires an accurate and standardized method for measuring the total cost of a course of treatment. Although several studies have attempted to evaluate the treatment costs of DRFs,14-18 none has rigorously examined exactly what needs to be measured, and for how long, to accurately describe the overall cost. Many studies have examined only direct costs (treatment-related costs incurred in the hospital or clinic itself) and neglected indirect costs (eg, missed work, time in treatment, additional care requirements). As patient-reported disability from these injuries can be high,19-22 it is likely that the additional indirect costs, often borne by the patient, are correspondingly high. This relationship has been suggested by indirect data from large retrospective epidemiologic studies3-6 but has never been evaluated with primary data obtained in a prospective study.
Given these questions, we conducted an in-depth study of the treatment costs of these injuries to identify which factors should be captured, and for how long, to accurately describe the overall cost without missing any of the major cost-drivers. We hypothesized that indirect costs (particularly missed work) would be significant and variable cost-drivers in the overall economic impact of these injuries, and that direct prospective measurement of these costs would be the most reliable method for accurately assessing them. In short, this was a prospective, observational study of all the direct and indirect costs associated with treating DRFs. Its 2 main goals were to determine how much of the overall cost was attributable to indirect costs, and which cost factors should be measured, and for how long, to capture the true economic cost of these injuries.
Patients and Methods
Study Design
This prospective, observational study was approved by our hospital’s Institutional Review Board, and patients gave informed consent to participate. Patients with an isolated DRF that was treated either operatively or nonoperatively and followed at our hospital were eligible for the study. Treatment decisions for each patient were made by the treating surgeon and were based on injury characteristics. Patients with multiple concomitant injuries (polytrauma) were excluded. The AO/OTA (Arbeitsgemeinschaft für Osteosynthesefragen/Orthopaedic Trauma Association) classification system was used to grade all fractures.23
Patients were seen 2 weeks, 1 month, 3 months, 6 months, and 1 year after injury. Each time, clinical data (strength, range of motion, patient-rated outcome forms) and economic data were collected. A patient’s economic data were considered complete if the patient had full follow-up in our clinic up to 1 year after injury or, if applicable, the patient returned to work and had all recurring direct and indirect costs resolved. Costs were measured and calculated from the broadest possible perspective (overall societal costs) rather than from payer-specific perspectives (eg, institution costs, insurance costs).
Treatment and Rehabilitation Protocol
Each patient who underwent nonoperative treatment was placed in a molded sugar-tong splint with hand motion encouraged and followed in clinic. At 4 to 6 weeks, the splint was removed, and the patient was placed in a removable cock-up wrist splint for another 2 to 4 weeks. Throughout this period, the patient worked on elbow and finger motion with an occupational therapist (OT). On discontinuation of the wrist splint, the patient returned to the OT for gentle wrist motion and continuation of elbow and finger motion.
For each patient who underwent operative treatment, implant and approach were based on fracture pattern. Implants used included isolated Kirschner wires (K-wires), volar locked plates, dorsal plates, radial column plates, and ulnar plates. After fixation, the patient was placed in a well-padded volar splint and encouraged to start immediate finger motion. Ten to 14 days after surgery, the splint was removed, and the patient was referred to an OT for gentle wrist, finger, and elbow motion. Therapy was continued until wrist, finger, and elbow motion was full.
Direct Costs
Direct costs were obtained from hospital billing and collections records. Cost items measured included physician fees, imaging fees, inpatient bed fees (when applicable), operating room (OR) facility fees, implant costs, and OT costs. Whenever possible, the final amount collected (vs charged) was used for the cost, as this was thought to be the most reliable indicator of the real cost of an item. Total cost was obtained from ultimate collection/reimbursement for all physician, imaging, and OT fees.
In a few cases, ultimate amount collected was not in our system and instead was calculated by normalizing the charges based on internal departmental cost-to-charge ratios. Cost-to-charge ratios were used for OR/emergency department facility fees, inpatient bed fees, and implant costs.
Indirect Costs
Indirect costs were calculated from questionnaires completed by patients at initial enrollment and at each follow-up visit. The initial enrollment form captured basic demographic information, employment status and work type, and annual income. The follow-up form included questions about current work status, physical/occupational therapy frequency, and extra recurring expenses related to transportation, household chores, and personal care, among other items. Total recurring expenses from transportation, chores, and personal care were calculated by multiplying the weekly expenses listed at a given visit by the time since the previous visit.
Costs for missed work were estimated as a function of preinjury wages multiplied by decreased level of productivity and period of work missed. For a patient who indicated part-time work status, decreased level of productivity was calculated by dividing the patient’s weekly hours by 40 (assumes 40-hour week is full-time), which yielded a percentage of full-time capacity. The patient was also asked to indicate any change in work status, which allowed for an accurate accounting of how long the patient was away from work and how much the patient’s capacity was decreased, ultimately providing an estimate of total amount of work missed. Multiplying that period by annual preinjury wages gave the value used for total cost of missed work.
Results
Of the 82 patients enrolled in the study, 36 were treated operatively and 46 nonoperatively. Table 1 lists additional demographic information about the study population. 
Table 2 provides a full breakdown of costs. OT costs were similar between groups but proportionally made up 27% of the costs for the nonoperative group and 4.9% for the operative group. 
Indirect costs accounted for 28% of the total cost for the operative group and 36% for the nonoperative group. Missed work was the major contributor to overall indirect cost, accounting for 93% of all indirect costs. Additional transportation, household chores, and personal care costs accounted for 4.7%, 1.7%, and 0.8% of total indirect costs, respectively.
Of the nonoperatively treated patients who had been working before being injured, 25% missed at least some work. Except for 1 patient, all were back working full-time within 3 months after injury. Of the operatively treated patients who had been working before injury, 48% missed at least some work, and 24% were still missing at least some work between 3 and 6 months after injury. All patients in both groups were back working within 1 year after injury.
Indirect costs largely paralleled work status, with 50% of patients still incurring some costs up to 6 months after injury (Figure). 
Discussion
The drive to use evidence-based treatments in medicine has led to increased scrutiny of the benefits of novel treatments and technologies. However, in addition to carefully measuring clinical benefits, we must monitor costs. Implementation of new treatments based on small clinical advantages, without consideration of economic impact, will not be sustainable over the long term.
This study was not intended to report the “true” cost of treating these injuries, or to make direct comparisons between operative and nonoperative groups (regional and institutional costs and practices vary so much that no single-site study can report a meaningful number for cost). Furthermore, the observational (nonrandomized) nature of this study makes direct comparison of operative and nonoperative groups too confounded to draw conclusions. Simply, this study was conducted to help determine what needs to be measured, with the ultimate goal being to obtain a relatively reliable estimate of the total cost to society of a given injury and its treatment.
In this study, physician fees and facility fees were major direct expenses—not surprising given the value of physician time and OR time. In addition, OT was a fairly large direct-cost driver, particularly for nonoperative patients, for whom other costs were relatively low. This finding supports what has been reported in studies of the frequency and duration of therapy as potential targets for cost containment.24 Surprisingly, OT costs were lower for operatively (vs nonoperatively) treated patients. This finding may be attributable to earlier wrist motion in operatively treated patients (10-14 days) relative to nonoperatively treated patients (6-8 weeks), as earlier wrist motion may reduce stiffness and total need for therapy. Alternatively, the finding may be attributable to sampling error caused by difficulty in obtaining accurate OT costs, as some patients received therapy at multiple private offices, with records unavailable.
Although significant attention is often focused on implant costs, these actually comprised a relatively small portion (6%) of the total treatment costs for these injuries. However, implant costs vary significantly between institutions.
Indirect costs were a major factor, accounting for about one-third of total cost. Missed work was the single largest cost item in this study, comprising 93% of the indirect cost and 27% of the total cost. These findings suggest that the cost of missed work is crucial and should be measured in any study that compares the cost-effectiveness of different treatment modalities.
In orthopedic trauma, earlier return to work is often cited as a potential benefit of surgical intervention. However, without defining the exact economic impact of missed work, it is difficult to decide if earlier return to work justifies the added cost of surgery. The situation is further muddled by conflicting priorities, as the entities that bear the cost of missed work (patient, disability insurance) are often different from the entity that bears the cost of surgery (medical insurance). In the light of this complex decision-making with multiple and sometimes conflicting stakeholders, accurate understanding of the economic impact of missed work is paramount. Our data showed return to work took slightly longer for operatively (vs nonoperatively) treated patients, though we think this is more likely a result of higher injury severity than treatment choice.
Patients in both groups were still not back working up to 6 months after injury, indicating that return of function after these injuries is not as rapid as we might hope or expect, and may play a role in setting expectations during initial discussions with patients.
The major strength of this study is that it was the first of its kind to prospectively measure these costs at a single institution in order to make direct comparisons of different cost factors. Whenever possible, rather than relying on cost-to-charge ratio estimates, we analyzed costs obtained directly from collections reports, which improved the validity of the results generated. Missed work was captured by directly asking patients about work capacity, not by retrospectively reviewing disability applications, which for a variety of reasons often inaccurately reflects true work productivity. In addition, our final follow-up rate was relatively high (91%), which helped minimize bias. Although this study focused on DRFs, the hope is that these data can serve as a template for the kinds of factors that need to be measured to accurately describe the cost of many different upper extremity injuries. This idea, however, needs to be formally tested.
This study had several limitations. First, some costs (OR time, facility fees) still had to be estimated with cost-to-charge ratios—a less precise method. Second, measuring the societal cost of missed work is controversial. We calculated this cost by using standard economic techniques, valuing the decreased productivity period according to baseline salary, though the true “loss” to society is less clear. Third, our data represent the costs at one hospital in one city and might be very different at other institutions with different cost structures. Fourth, this study was observational (vs randomized) and subject to the usual bias of such studies, so conclusions between treatment choices and cost or clinical outcomes could not be drawn (which was not our intent in this study). Although these issues limited our ability to calculate the exact “cost” of these injuries, the relative impact of the different cost factors could be measured (which was our intent).
DRFs are common injuries that can have significant associated expenses, many of which were not captured in previous cost analyses. In the present study, we found that measuring physician, OR, therapy, and missed work costs for at least 6 months after injury was generally sufficient for accurate capture of major costs. We hope these data can help in planning studies of the treatment costs of upper extremity injuries. Only through accurate and conscientious data gathering can we evaluate the clinical and economic effects of novel technologies and ensure delivery of high-quality care while containing costs and improving efficiency.
Am J Orthop. 2017;46(1):E54-E59. Copyright Frontline Medical Communications Inc. 2017. All rights reserved.
1. Simic PM, Weiland AJ. Fractures of the distal aspect of the radius: changes in treatment over the past two decades. Instr Course Lect. 2003;52:185-195.
2. Chung KC, Spilson SV. The frequency and epidemiology of hand and forearm fractures in the United States. J Hand Surg Am. 2001;26(5):908-915.
3. Trybus M, Guzik P. The economic impact of hand injury [in Polish]. Chir Narzadow Ruchu Ortop Pol. 2003;68(4):269-273.
4. Dias JJ, Garcia-Elias M. Hand injury costs. Injury. 2006;37(11):1071-1077.
5. Wüthrich P. Epidemiology and socioeconomic significance of hand injuries [in German]. Z Unfallchir Versicherungsmed Berufskr. 1986;79(1):5-14.
6. de Putter CE, Selles RW, Polinder S, Panneman MJ, Hovius SE, van Beeck EF. Economic impact of hand and wrist injuries: health-care costs and productivity costs in a population-based study. J Bone Joint Surg Am. 2012;94(9):e56.
7. Wong TC, Chiu Y, Tsang WL, Leung WY, Yam SK, Yeung SH. Casting versus percutaneous pinning for extra-articular fractures of the distal radius in an elderly Chinese population: a prospective randomised controlled trial. J Hand Surg Eur Vol. 2010;35(3):202-208.
8. Krukhaug Y, Ugland S, Lie SA, Hove LM. External fixation of fractures of the distal radius: a randomized comparison of the Hoffman Compact II non-bridging fixator and the Dynawrist fixator in 75 patients followed for 1 year. Acta Orthop. 2009;80(1):104-108.
9. Xu GG, Chan SP, Puhaindran ME, Chew WY. Prospective randomised study of intra-articular fractures of the distal radius: comparison between external fixation and plate fixation. Ann Acad Med Singapore. 2009;38(7):600-606.
10. Egol K, Walsh M, Tejwani N, McLaurin T, Wynn C, Paksima N. Bridging external fixation and supplementary Kirschner-wire fixation versus volar locked plating for unstable fractures of the distal radius: a randomised, prospective trial. J Bone Joint Surg Br. 2008;90(9):1214-1221.
11. Wei DH, Raizman NM, Bottino CJ, Jobin CM, Strauch RJ, Rosenwasser MP. Unstable distal radial fractures treated with external fixation, a radial column plate, or a volar plate. A prospective randomized trial. J Bone Joint Surg Am. 2009;91(7):1568-1577.
12. Shauver MJ, Clapham PJ, Chung KC. An economic analysis of outcomes and complications of treating distal radius fractures in the elderly. J Hand Surg Am. 2011;36(12):1912-1918.e1-e3.
13. Espinosa Gutiérrez A, Moreno Velázquez A. Cost–benefit of various treatments for patients with distal radius fracture [in Spanish]. Acta Ortop Mex. 2010;24(2):61-65.
14. Shyamalan G, Theokli C, Pearse Y, Tennent D. Volar locking plates versus Kirschner wires for distal radial fractures—a cost analysis study. Injury. 2009;40(12):1279-1281.
15. Kakarlapudi TK, Santini A, Shahane SA, Douglas D. The cost of treatment of distal radial fractures. Injury. 2000;31(4):229-232.
16. Do TT, Strub WM, Foad SL, Mehlman CT, Crawford AH. Reduction versus remodeling in pediatric distal forearm fractures: a preliminary cost analysis. J Pediatr Orthop B. 2003;12(2):109-115.
17. Miller BS, Taylor B, Widmann RF, Bae DS, Snyder BD, Waters PM. Cast immobilization versus percutaneous pin fixation of displaced distal radius fractures in children: a prospective, randomized study. J Pediatr Orthop. 2005;25(4):490-494.
18. Shauver MJ, Yin H, Banerjee M, Chung KC. Current and future national costs to Medicare for the treatment of distal radius fracture in the elderly. J Hand Surg Am. 2011;36(8):1282-1287.
19. Handoll HH, Madhok R, Howe TE. Rehabilitation for distal radial fractures in adults. Cochrane Database Syst Rev. 2006;(3):CD003324.
20. Handoll HH, Huntley JS, Madhok R. External fixation versus conservative treatment for distal radial fractures in adults. Cochrane Database Syst Rev. 2007;(3):CD006194.
21. Handoll HH, Vaghela MV, Madhok R. Percutaneous pinning for treating distal radial fractures in adults. Cochrane Database Syst Rev. 2007;(3):CD006080.
22. Handoll HH, Huntley JS, Madhok R. Different methods of external fixation for treating distal radial fractures in adults. Cochrane Database Syst Rev. 2008;(1):CD006522.
23. Marsh JL, Slongo TF, Agel J, et al. Fracture and dislocation classification compendium—2007: Orthopaedic Trauma Association classification, database and outcomes committee. J Orthop Trauma. 2007;21(10 suppl):S1-S133.
24. Souer JS, Buijze G, Ring D. A prospective randomized controlled trial comparing occupational therapy with independent exercises after volar plate fixation of a fracture of the distal part of the radius. J Bone Joint Surg Am. 2011;93(19):1761-1766.
Take-Home Points
- Physician fees, operating room costs, therapy costs, and missed work account for most (92%) of the costs in distal radius fractures.
- Indirect costs (especially missed work) contribute a significant amount to the total cost of injury.
- Patients continue to accrue costs up to 3-6 months post-injury.
- Implant costs make up only 6% of the total costs of operatively treated distal radius fractures.
Distal radius fractures (DRFs) account for 20% of all fractures seen in the emergency department, and are the most common fractures in all patients under age 75 years.1,2 Apart from causing pain and disability, DRFs have a large associated economic burden.3-6 In addition, over the past decade, the fixation technology used for DRF treatment has expanded rapidly and revolutionized operative management. With this expansion has come a growing body of high-level evidence guiding treatment decisions regarding patient outcomes.7-11 As operative treatment of these injuries has evolved, researchers have begun to critically evaluate both health outcomes and the cost-effectiveness of treatment choices.12,13
Determining the cost-effectiveness of any medical intervention requires an accurate and standardized method for measuring the total cost of a course of treatment. Although several studies have attempted to evaluate the treatment costs of DRFs,14-18 none has rigorously examined exactly what needs to be measured, and for how long, to accurately describe the overall cost. Many studies have examined only direct costs (treatment-related costs incurred in the hospital or clinic itself) and neglected indirect costs (eg, missed work, time in treatment, additional care requirements). As patient-reported disability from these injuries can be high,19-22 it is likely that the additional indirect costs, often borne by the patient, are correspondingly high. This relationship has been suggested by indirect data from large retrospective epidemiologic studies3-6 but has never been evaluated with primary data obtained in a prospective study.
Given these questions, we conducted an in-depth study of the treatment costs of these injuries to identify which factors should be captured, and for how long, to accurately describe the overall cost without missing any of the major cost-drivers. We hypothesized that indirect costs (particularly missed work) would be significant and variable cost-drivers in the overall economic impact of these injuries, and that direct prospective measurement of these costs would be the most reliable method for accurately assessing them. In short, this was a prospective, observational study of all the direct and indirect costs associated with treating DRFs. Its 2 main goals were to determine how much of the overall cost was attributable to indirect costs, and which cost factors should be measured, and for how long, to capture the true economic cost of these injuries.
Patients and Methods
Study Design
This prospective, observational study was approved by our hospital’s Institutional Review Board, and patients gave informed consent to participate. Patients with an isolated DRF that was treated either operatively or nonoperatively and followed at our hospital were eligible for the study. Treatment decisions for each patient were made by the treating surgeon and were based on injury characteristics. Patients with multiple concomitant injuries (polytrauma) were excluded. The AO/OTA (Arbeitsgemeinschaft für Osteosynthesefragen/Orthopaedic Trauma Association) classification system was used to grade all fractures.23
Patients were seen 2 weeks, 1 month, 3 months, 6 months, and 1 year after injury. Each time, clinical data (strength, range of motion, patient-rated outcome forms) and economic data were collected. A patient’s economic data were considered complete if the patient had full follow-up in our clinic up to 1 year after injury or, if applicable, the patient returned to work and had all recurring direct and indirect costs resolved. Costs were measured and calculated from the broadest possible perspective (overall societal costs) rather than from payer-specific perspectives (eg, institution costs, insurance costs).
Treatment and Rehabilitation Protocol
Each patient who underwent nonoperative treatment was placed in a molded sugar-tong splint with hand motion encouraged and followed in clinic. At 4 to 6 weeks, the splint was removed, and the patient was placed in a removable cock-up wrist splint for another 2 to 4 weeks. Throughout this period, the patient worked on elbow and finger motion with an occupational therapist (OT). On discontinuation of the wrist splint, the patient returned to the OT for gentle wrist motion and continuation of elbow and finger motion.
For each patient who underwent operative treatment, implant and approach were based on fracture pattern. Implants used included isolated Kirschner wires (K-wires), volar locked plates, dorsal plates, radial column plates, and ulnar plates. After fixation, the patient was placed in a well-padded volar splint and encouraged to start immediate finger motion. Ten to 14 days after surgery, the splint was removed, and the patient was referred to an OT for gentle wrist, finger, and elbow motion. Therapy was continued until wrist, finger, and elbow motion was full.
Direct Costs
Direct costs were obtained from hospital billing and collections records. Cost items measured included physician fees, imaging fees, inpatient bed fees (when applicable), operating room (OR) facility fees, implant costs, and OT costs. Whenever possible, the final amount collected (vs charged) was used for the cost, as this was thought to be the most reliable indicator of the real cost of an item. Total cost was obtained from ultimate collection/reimbursement for all physician, imaging, and OT fees.
In a few cases, ultimate amount collected was not in our system and instead was calculated by normalizing the charges based on internal departmental cost-to-charge ratios. Cost-to-charge ratios were used for OR/emergency department facility fees, inpatient bed fees, and implant costs.
Indirect Costs
Indirect costs were calculated from questionnaires completed by patients at initial enrollment and at each follow-up visit. The initial enrollment form captured basic demographic information, employment status and work type, and annual income. The follow-up form included questions about current work status, physical/occupational therapy frequency, and extra recurring expenses related to transportation, household chores, and personal care, among other items. Total recurring expenses from transportation, chores, and personal care were calculated by multiplying the weekly expenses listed at a given visit by the time since the previous visit.
Costs for missed work were estimated as a function of preinjury wages multiplied by decreased level of productivity and period of work missed. For a patient who indicated part-time work status, decreased level of productivity was calculated by dividing the patient’s weekly hours by 40 (assumes 40-hour week is full-time), which yielded a percentage of full-time capacity. The patient was also asked to indicate any change in work status, which allowed for an accurate accounting of how long the patient was away from work and how much the patient’s capacity was decreased, ultimately providing an estimate of total amount of work missed. Multiplying that period by annual preinjury wages gave the value used for total cost of missed work.
Results
Of the 82 patients enrolled in the study, 36 were treated operatively and 46 nonoperatively. Table 1 lists additional demographic information about the study population.
Table 2 provides a full breakdown of costs. OT costs were similar between groups but proportionally made up 27% of the costs for the nonoperative group and 4.9% for the operative group.
Indirect costs accounted for 28% of the total cost for the operative group and 36% for the nonoperative group. Missed work was the major contributor to overall indirect cost, accounting for 93% of all indirect costs. Additional transportation, household chores, and personal care costs accounted for 4.7%, 1.7%, and 0.8% of total indirect costs, respectively.
Of the nonoperatively treated patients who had been working before being injured, 25% missed at least some work. Except for 1 patient, all were back working full-time within 3 months after injury. Of the operatively treated patients who had been working before injury, 48% missed at least some work, and 24% were still missing at least some work between 3 and 6 months after injury. All patients in both groups were back working within 1 year after injury.
Indirect costs largely paralleled work status, with 50% of patients still incurring some costs up to 6 months after injury (Figure).
Discussion
The drive to use evidence-based treatments in medicine has led to increased scrutiny of the benefits of novel treatments and technologies. However, in addition to carefully measuring clinical benefits, we must monitor costs. Implementation of new treatments based on small clinical advantages, without consideration of economic impact, will not be sustainable over the long term.
This study was not intended to report the “true” cost of treating these injuries, or to make direct comparisons between operative and nonoperative groups (regional and institutional costs and practices vary so much that no single-site study can report a meaningful number for cost). Furthermore, the observational (nonrandomized) nature of this study makes direct comparison of operative and nonoperative groups too confounded to draw conclusions. Simply, this study was conducted to help determine what needs to be measured, with the ultimate goal being to obtain a relatively reliable estimate of the total cost to society of a given injury and its treatment.
In this study, physician fees and facility fees were major direct expenses—not surprising given the value of physician time and OR time. In addition, OT was a fairly large direct-cost driver, particularly for nonoperative patients, for whom other costs were relatively low. This finding supports what has been reported in studies of the frequency and duration of therapy as potential targets for cost containment.24 Surprisingly, OT costs were lower for operatively (vs nonoperatively) treated patients. This finding may be attributable to earlier wrist motion in operatively treated patients (10-14 days) relative to nonoperatively treated patients (6-8 weeks), as earlier wrist motion may reduce stiffness and total need for therapy. Alternatively, the finding may be attributable to sampling error caused by difficulty in obtaining accurate OT costs, as some patients received therapy at multiple private offices, with records unavailable.
Although significant attention is often focused on implant costs, these actually comprised a relatively small portion (6%) of the total treatment costs for these injuries. However, implant costs vary significantly between institutions.
Indirect costs were a major factor, accounting for about one-third of total cost. Missed work was the single largest cost item in this study, comprising 93% of the indirect cost and 27% of the total cost. These findings suggest that the cost of missed work is crucial and should be measured in any study that compares the cost-effectiveness of different treatment modalities.
In orthopedic trauma, earlier return to work is often cited as a potential benefit of surgical intervention. However, without defining the exact economic impact of missed work, it is difficult to decide if earlier return to work justifies the added cost of surgery. The situation is further muddled by conflicting priorities, as the entities that bear the cost of missed work (patient, disability insurance) are often different from the entity that bears the cost of surgery (medical insurance). In the light of this complex decision-making with multiple and sometimes conflicting stakeholders, accurate understanding of the economic impact of missed work is paramount. Our data showed return to work took slightly longer for operatively (vs nonoperatively) treated patients, though we think this is more likely a result of higher injury severity than treatment choice.
Patients in both groups were still not back working up to 6 months after injury, indicating that return of function after these injuries is not as rapid as we might hope or expect, and may play a role in setting expectations during initial discussions with patients.
The major strength of this study is that it was the first of its kind to prospectively measure these costs at a single institution in order to make direct comparisons of different cost factors. Whenever possible, rather than relying on cost-to-charge ratio estimates, we analyzed costs obtained directly from collections reports, which improved the validity of the results generated. Missed work was captured by directly asking patients about work capacity, not by retrospectively reviewing disability applications, which for a variety of reasons often inaccurately reflects true work productivity. In addition, our final follow-up rate was relatively high (91%), which helped minimize bias. Although this study focused on DRFs, the hope is that these data can serve as a template for the kinds of factors that need to be measured to accurately describe the cost of many different upper extremity injuries. This idea, however, needs to be formally tested.
This study had several limitations. First, some costs (OR time, facility fees) still had to be estimated with cost-to-charge ratios—a less precise method. Second, measuring the societal cost of missed work is controversial. We calculated this cost by using standard economic techniques, valuing the decreased productivity period according to baseline salary, though the true “loss” to society is less clear. Third, our data represent the costs at one hospital in one city and might be very different at other institutions with different cost structures. Fourth, this study was observational (vs randomized) and subject to the usual bias of such studies, so conclusions between treatment choices and cost or clinical outcomes could not be drawn (which was not our intent in this study). Although these issues limited our ability to calculate the exact “cost” of these injuries, the relative impact of the different cost factors could be measured (which was our intent).
DRFs are common injuries that can have significant associated expenses, many of which were not captured in previous cost analyses. In the present study, we found that measuring physician, OR, therapy, and missed work costs for at least 6 months after injury was generally sufficient for accurate capture of major costs. We hope these data can help in planning studies of the treatment costs of upper extremity injuries. Only through accurate and conscientious data gathering can we evaluate the clinical and economic effects of novel technologies and ensure delivery of high-quality care while containing costs and improving efficiency.
Am J Orthop. 2017;46(1):E54-E59. Copyright Frontline Medical Communications Inc. 2017. All rights reserved.
1. Simic PM, Weiland AJ. Fractures of the distal aspect of the radius: changes in treatment over the past two decades. Instr Course Lect. 2003;52:185-195.
2. Chung KC, Spilson SV. The frequency and epidemiology of hand and forearm fractures in the United States. J Hand Surg Am. 2001;26(5):908-915.
3. Trybus M, Guzik P. The economic impact of hand injury [in Polish]. Chir Narzadow Ruchu Ortop Pol. 2003;68(4):269-273.
4. Dias JJ, Garcia-Elias M. Hand injury costs. Injury. 2006;37(11):1071-1077.
5. Wüthrich P. Epidemiology and socioeconomic significance of hand injuries [in German]. Z Unfallchir Versicherungsmed Berufskr. 1986;79(1):5-14.
6. de Putter CE, Selles RW, Polinder S, Panneman MJ, Hovius SE, van Beeck EF. Economic impact of hand and wrist injuries: health-care costs and productivity costs in a population-based study. J Bone Joint Surg Am. 2012;94(9):e56.
7. Wong TC, Chiu Y, Tsang WL, Leung WY, Yam SK, Yeung SH. Casting versus percutaneous pinning for extra-articular fractures of the distal radius in an elderly Chinese population: a prospective randomised controlled trial. J Hand Surg Eur Vol. 2010;35(3):202-208.
8. Krukhaug Y, Ugland S, Lie SA, Hove LM. External fixation of fractures of the distal radius: a randomized comparison of the Hoffman Compact II non-bridging fixator and the Dynawrist fixator in 75 patients followed for 1 year. Acta Orthop. 2009;80(1):104-108.
9. Xu GG, Chan SP, Puhaindran ME, Chew WY. Prospective randomised study of intra-articular fractures of the distal radius: comparison between external fixation and plate fixation. Ann Acad Med Singapore. 2009;38(7):600-606.
10. Egol K, Walsh M, Tejwani N, McLaurin T, Wynn C, Paksima N. Bridging external fixation and supplementary Kirschner-wire fixation versus volar locked plating for unstable fractures of the distal radius: a randomised, prospective trial. J Bone Joint Surg Br. 2008;90(9):1214-1221.
11. Wei DH, Raizman NM, Bottino CJ, Jobin CM, Strauch RJ, Rosenwasser MP. Unstable distal radial fractures treated with external fixation, a radial column plate, or a volar plate. A prospective randomized trial. J Bone Joint Surg Am. 2009;91(7):1568-1577.
12. Shauver MJ, Clapham PJ, Chung KC. An economic analysis of outcomes and complications of treating distal radius fractures in the elderly. J Hand Surg Am. 2011;36(12):1912-1918.e1-e3.
13. Espinosa Gutiérrez A, Moreno Velázquez A. Cost–benefit of various treatments for patients with distal radius fracture [in Spanish]. Acta Ortop Mex. 2010;24(2):61-65.
14. Shyamalan G, Theokli C, Pearse Y, Tennent D. Volar locking plates versus Kirschner wires for distal radial fractures—a cost analysis study. Injury. 2009;40(12):1279-1281.
15. Kakarlapudi TK, Santini A, Shahane SA, Douglas D. The cost of treatment of distal radial fractures. Injury. 2000;31(4):229-232.
16. Do TT, Strub WM, Foad SL, Mehlman CT, Crawford AH. Reduction versus remodeling in pediatric distal forearm fractures: a preliminary cost analysis. J Pediatr Orthop B. 2003;12(2):109-115.
17. Miller BS, Taylor B, Widmann RF, Bae DS, Snyder BD, Waters PM. Cast immobilization versus percutaneous pin fixation of displaced distal radius fractures in children: a prospective, randomized study. J Pediatr Orthop. 2005;25(4):490-494.
18. Shauver MJ, Yin H, Banerjee M, Chung KC. Current and future national costs to Medicare for the treatment of distal radius fracture in the elderly. J Hand Surg Am. 2011;36(8):1282-1287.
19. Handoll HH, Madhok R, Howe TE. Rehabilitation for distal radial fractures in adults. Cochrane Database Syst Rev. 2006;(3):CD003324.
20. Handoll HH, Huntley JS, Madhok R. External fixation versus conservative treatment for distal radial fractures in adults. Cochrane Database Syst Rev. 2007;(3):CD006194.
21. Handoll HH, Vaghela MV, Madhok R. Percutaneous pinning for treating distal radial fractures in adults. Cochrane Database Syst Rev. 2007;(3):CD006080.
22. Handoll HH, Huntley JS, Madhok R. Different methods of external fixation for treating distal radial fractures in adults. Cochrane Database Syst Rev. 2008;(1):CD006522.
23. Marsh JL, Slongo TF, Agel J, et al. Fracture and dislocation classification compendium—2007: Orthopaedic Trauma Association classification, database and outcomes committee. J Orthop Trauma. 2007;21(10 suppl):S1-S133.
24. Souer JS, Buijze G, Ring D. A prospective randomized controlled trial comparing occupational therapy with independent exercises after volar plate fixation of a fracture of the distal part of the radius. J Bone Joint Surg Am. 2011;93(19):1761-1766.
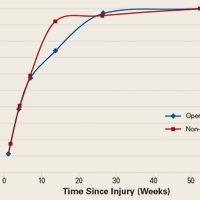
Safety of Superior Labrum Anterior and Posterior (SLAP) Repair Posterior to Biceps Tendon Is Improved With a Percutaneous Approach
Take-Home Points
- Anchors placed posterior to the biceps during SLAP repair are at risk for glenoid vault penetration and/or suprascapular nerve (SSN) injury.
- Vault penetration and SSN injury are avoided by using a Port of Wilmington (PW) portal instead of an anterior portal.
- A percutaneous PW portal is safe and passes through the rotator cuff muscle only.
Since being classified by Snyder and colleagues,1 various arthroscopic techniques have been used to repair superior labrum anterior and posterior (SLAP) tears, particularly type II tears. Despite being commonly performed, repairs of SLAP lesions remain challenging. There is high variability in the rate of good/excellent functional outcomes and athletes’ return to previous level of play after SLAP repairs.2,3 Furthermore, the rate of complications after SLAP repair is as high as 5%.4
One of the most common complications of repair of a type II SLAP tear is nerve injury.4 In particular, suprascapular nerve (SSN) injury has occurred after arthroscopic repair of SLAP tears.5,6 Three cadaveric studies have demonstrated that glenoid vault penetration is common during placement of knotted anchors for SLAP repair and that the SSN is at risk during placement of these anchors.7-9 However, 2 of the 3 studies used only an anterior portal in their evaluation of anchor placement. Safety of anchor placement posterior to the biceps tendon may be improved with a percutaneous approach using a Port of Wilmington (PW) portal.10,11 No studies have evaluated the risk of glenoid vault penetration and SSN injury with shorter knotless anchors.
We conducted a study to compare a standard anterosuperolateral (ASL) portal with a percutaneous PW portal for knotless anchors placed posterior to the biceps tendon during repair of SLAP tears. We hypothesized that anchors placed through the PW portal would be less likely to penetrate the glenoid vault and would be farther from the SSN in the event of bone penetration.
Materials and Methods
Six matched pairs of fresh human cadaveric shoulders were used in this study. Each specimen included the scapula, the clavicle, and the humerus. All 6 specimens were male, and their mean age was 41.2 years (range, 23-59 years). Shoulder arthroscopy was performed for placement of SLAP anchors, and open dissection followed.
Anchor Placement
The scapula was clamped and the shoulder placed in the lateral decubitus position with 30° of abduction, 20° of forward flexion, and neutral rotation.10 A standard posterior glenohumeral viewing portal was established and a 30° arthroscope inserted. Both shoulders of each matched pair were randomly assigned to anchor placement through either an ASL portal or a PW portal. Two anchors were placed in the superior glenoid to simulate repair of a posterior SLAP tear.11 Each was a 2.9-mm short (12.5-mm) knotless anchor (BioComposite PushLock; Arthrex) that included a polyetheretherketone (PEEK) eyelet for threading sutures before anchor placement. A drill guide was inserted according to manufacturer guidelines, and a 2.9-mm drill was used to make a bone socket 18 mm deep. The anchor eyelet was loaded with suture tape (Labral Tape; Arthrex), and the anchor and suture were inserted into the socket. The sutures were left uncut to aid in anchor visualization during open dissection. On a right shoulder, the first anchor was placed just posterior to the biceps tendon, at 11 o’clock, and the second anchor about 1 cm posterior to the first, at 10 o’clock. All anchors were placed by an arthroscopy fellowship–trained shoulder surgeon. Before placement, anchor location was confirmed by another arthroscopy fellowship–trained shoulder surgeon.
The ASL portal was created, with an 18-gauge spinal needle and an outside-in technique, about 1 cm lateral to the anterolateral corner of the acromion. 
In the opposite shoulder, the PW portal was created, with a percutaneous technique, about 1 cm anterior and 1 cm lateral to the posterolateral corner of the acromion. An 18-gauge spinal needle was inserted to allow a 45° angle of approach to the posterosuperior glenoid.11
Cadaveric Dissection
After anchor placement, another shoulder surgeon performed the dissection. Skin, subcutaneous tissue, deltoid, and clavicle were removed. In the percutaneous specimens, PW portal location relative to rotator cuff was recorded before cuff removal. After overlying soft tissues were removed from a specimen, the anchors were examined for glenoid vault penetration. In the setting of vault penetration, digital calipers were used to measure the shortest distance from anchor to SSN.
Results
In the ASL portal group, 8 (66.7%) of 12 anchors (4/6 at 11 o’clock, 4/6 at 10 o’clock) penetrated the medial glenoid vault. 
In the PW portal group, 2 (16.7%) of 12 anchors (1/6 at 11 o’clock, 1/6 at 10 o’clock, both from a single specimen) penetrated the medial glenoid vault. Actually, in each case the eyelet and not the anchor penetrated the vault. In the penetration cases, distance to SSN was 20 mm for the 11 o’clock anchor and 8 mm for the 10 o’clock anchor (Table). Of the 6 portals, 3 passed through the supraspinatus muscle, 2 through the infraspinatus musculotendinous junction, and 1 through the infraspinatus muscle.
Discussion
Our study findings support the hypothesis that SLAP repair anchors placed posterior to the biceps tendon are more likely to remain in bone with use of a percutaneous approach relative to an ASL approach. Our findings also support the growing body of evidence that such anchors placed with an anterior approach increase the risk for SSN injury.
Three other cadaveric studies have evaluated anchor placement for SLAP repair. Chan and colleagues7 evaluated drill penetration during bone socket preparation for SLAP repair in 21 matched pairs of formalin-embalmed cadavers. A 20-mm drill was used for correspondence to a 14.5-mm anchor, though no anchors were inserted, and sockets were created in an open manner. Through a mimicked ASL portal, 1 socket was made anterior to the biceps tendon, at 1 o’clock; then, through a mimicked PW portal, 2 sockets were made posterior to the tendon, at 11 o’clock and 9 to 10 o’clock. Glenoid vault penetration occurred in 29% of the 42 anterior sockets, but only 1 anchor (2.4%) touched the SSN. Penetration did not occur with the 11 o’clock anchors. The 9 to 10 o’clock anchor was at highest risk for SSN injury (9.5%, 4 cases). The study was limited by lack of anchor placement and open creation of bone sockets in embalmed cadavers.
Koh and colleagues8 evaluated arthroscopic placement of anterior SLAP anchors in 6 matched pairs of fresh-frozen cadavers. Through an ASL portal, each 14.5-mm knotted anchor was placed anterior to the biceps tendon, at 1 o’clock. As in the study by Chan and colleagues,7 drill depth was 20 mm. Notably, anchors were seated 2 mm beyond manufacturer recommendations, and the cadavers were of Asian origin, likely indicating smaller glenoids compared to specimens from North America or Europe. All 12 anchors penetrated the glenoid vault; mean distance to SSN was 3.1 mm.
Morgan and colleagues9 compared anterior and ASL portals created for SLAP repairs in 10 matched-pair cadavers. Anchors were placed at 1 o’clock, 11 o’clock, and 10 o’clock. As in the studies by Chan and colleagues7 and Koh and colleagues,8 14.5-mm knotted anchors were used. One anterior anchor (10%) placed through an ASL portal penetrated the cortex by 1 mm, and 2 anterior anchors (20%) placed through anterior portals penetrated the cortex (1 was completely out of the bone). Overall, 65% of 11 o’clock anchors and 100% of 10 o’clock anchors violated the glenoid vault. With the 11 o’clock anchors, mean distance to SSN was 6 mm for ASL portals and 4.2 mm for anterior portals; with the 10 o’clock anchors, mean distance to SSN was 8 mm for ASL portals and 2.1 mm for anterior portals.
Overall, the results of these 3 studies suggest that, with use of ASL portals, placement of SLAP anchors anterior to the biceps tendon is safe. Using the same portals, however, anchors placed posterior to the tendon are at higher risk for glenoid vault penetration. Supporting these findings are our study’s penetration rates: 66.7% for anchors placed through ASL portals and 16.7% for anchors placed through percutaneous PW portals. The different rates are not surprising given that the coracoid process projects anterior to the glenoid and provides additional bone stock for placement of anchors anteriorly vs posteriorly. Therefore, with percutaneous PW portals, the approach angle directs the anchor toward the bone of the coracoid base. Furthermore, the SSN passes nearest the posterior aspect of the glenoid. In a study by Shishido and Kikuchi,12 the distance from the posterior rim of the glenoid to the SSN was 18 mm, and from the superior rim was 29 mm. Therefore, anchors placed with an anterior approach naturally are directed toward the SSN. 
In addition to portal placement and approach angle, anchor length likely affects the risks for glenoid vault penetration and SSN injury. 
One limitation of this study was the small number of cadavers, all of which were male. Female cadavers and cadavers of other ethnic origins likely have smaller glenoid vaults, and thus their inclusion would have altered our results. This issue was well described in studies mentioned in this article, and our goal was simply to compare ASL portals with percutaneous PW portals, so we think it does not change the fact that the risks for glenoid vault penetration and SSN injury are reduced with use of PW portals for anchors placed posterior to the biceps tendon.
Conclusion
This study was the first to examine glenoid vault penetration and SSN proximity with short anchors for SLAP repair. The risk for glenoid vault penetration during repair of SLAP tears posterior to the biceps tendon was reduced by anchor placement with a percutaneous posterior approach. The percutaneous posterior approach also directs the anchor away from the SSN.
Am J Orthop. 2017;46(1):E60-E64. Copyright Frontline Medical Communications Inc. 2017. All rights reserved.
1. Snyder SJ, Banas MP, Karzel RP. An analysis of 140 injuries to the superior glenoid labrum. J Shoulder Elbow Surg. 1995;4(4):243-248.
2. Denard PJ, Lädermann A, Burkhart SS. Long-term outcome after arthroscopic repair of type II SLAP lesions: results according to age and workers’ compensation status. Arthroscopy. 2012;28(4):451-457.
3. Gorantla K, Gill C, Wright RW. The outcome of type II SLAP repair: a systematic review. Arthroscopy. 2010;26(4):537-545.
4. Weber SC, Martin DF, Seiler JG 3rd, Harrast JJ. Superior labrum anterior and posterior lesions of the shoulder: incidence rates, complications, and outcomes as reported by American Board of Orthopedic Surgery. Part II candidates. Am J Sports Med. 2012;40(7):1538-1543.
5. Kim SH, Koh YG, Sung CH, Moon HK, Park YS. Iatrogenic suprascapular nerve injury after repair of type II SLAP lesion. Arthroscopy. 2010;26(7):1005-1008.
6. Yoo JC, Lee YS, Ahn JH, Park JH, Kang HJ, Koh KH. Isolated suprascapular nerve injury below the spinoglenoid notch after SLAP repair. J Shoulder Elbow Surg. 2009;18(4):e27-e29.
7. Chan H, Beaupre LA, Bouliane MJ. Injury of the suprascapular nerve during arthroscopic repair of superior labral tears: an anatomic study. J Shoulder Elbow Surg. 2010;19(5):709-715.
8. Koh KH, Park WH, Lim TK, Yoo JC. Medial perforation of the glenoid neck following SLAP repair places the suprascapular nerve at risk: a cadaveric study. J Shoulder Elbow Surg. 2011;20(2):245-250.
9. Morgan RT, Henn RF 3rd, Paryavi E, Dreese J. Injury to the suprascapular nerve during superior labrum anterior and posterior repair: is a rotator interval portal safer than an anterosuperior portal? Arthroscopy. 2014;30(11):1418-1423.
10. Lo IK, Lind CC, Burkhart SS. Glenohumeral arthroscopy portals established using an outside-in technique: neurovascular anatomy at risk. Arthroscopy. 2004;20(6):596-602.
11. Morgan CD, Burkhart SS, Palmeri M, Gillespie M. Type II SLAP lesions: three subtypes and their relationships to superior instability and rotator cuff tears. Arthroscopy. 1998;14(6):553-565.
12. Shishido H, Kikuchi S. Injury of the suprascapular nerve in shoulder surgery: an anatomic study. J Shoulder Elbow Surg. 2001;10(4):372-376.
13. Uggen C, Wei A, Glousman RE, et al. Biomechanical comparison of knotless anchor repair versus simple suture repair for type II SLAP lesions. Arthroscopy. 2009;25(10):1085-1092.
14. Kim SH, Crater RB, Hargens AR. Movement-induced knot migration after anterior stabilization in the shoulder. Arthroscopy. 2013;29(3):485-490.
Take-Home Points
- Anchors placed posterior to the biceps during SLAP repair are at risk for glenoid vault penetration and/or suprascapular nerve (SSN) injury.
- Vault penetration and SSN injury are avoided by using a Port of Wilmington (PW) portal instead of an anterior portal.
- A percutaneous PW portal is safe and passes through the rotator cuff muscle only.
Since being classified by Snyder and colleagues,1 various arthroscopic techniques have been used to repair superior labrum anterior and posterior (SLAP) tears, particularly type II tears. Despite being commonly performed, repairs of SLAP lesions remain challenging. There is high variability in the rate of good/excellent functional outcomes and athletes’ return to previous level of play after SLAP repairs.2,3 Furthermore, the rate of complications after SLAP repair is as high as 5%.4
One of the most common complications of repair of a type II SLAP tear is nerve injury.4 In particular, suprascapular nerve (SSN) injury has occurred after arthroscopic repair of SLAP tears.5,6 Three cadaveric studies have demonstrated that glenoid vault penetration is common during placement of knotted anchors for SLAP repair and that the SSN is at risk during placement of these anchors.7-9 However, 2 of the 3 studies used only an anterior portal in their evaluation of anchor placement. Safety of anchor placement posterior to the biceps tendon may be improved with a percutaneous approach using a Port of Wilmington (PW) portal.10,11 No studies have evaluated the risk of glenoid vault penetration and SSN injury with shorter knotless anchors.
We conducted a study to compare a standard anterosuperolateral (ASL) portal with a percutaneous PW portal for knotless anchors placed posterior to the biceps tendon during repair of SLAP tears. We hypothesized that anchors placed through the PW portal would be less likely to penetrate the glenoid vault and would be farther from the SSN in the event of bone penetration.
Materials and Methods
Six matched pairs of fresh human cadaveric shoulders were used in this study. Each specimen included the scapula, the clavicle, and the humerus. All 6 specimens were male, and their mean age was 41.2 years (range, 23-59 years). Shoulder arthroscopy was performed for placement of SLAP anchors, and open dissection followed.
Anchor Placement
The scapula was clamped and the shoulder placed in the lateral decubitus position with 30° of abduction, 20° of forward flexion, and neutral rotation.10 A standard posterior glenohumeral viewing portal was established and a 30° arthroscope inserted. Both shoulders of each matched pair were randomly assigned to anchor placement through either an ASL portal or a PW portal. Two anchors were placed in the superior glenoid to simulate repair of a posterior SLAP tear.11 Each was a 2.9-mm short (12.5-mm) knotless anchor (BioComposite PushLock; Arthrex) that included a polyetheretherketone (PEEK) eyelet for threading sutures before anchor placement. A drill guide was inserted according to manufacturer guidelines, and a 2.9-mm drill was used to make a bone socket 18 mm deep. The anchor eyelet was loaded with suture tape (Labral Tape; Arthrex), and the anchor and suture were inserted into the socket. The sutures were left uncut to aid in anchor visualization during open dissection. On a right shoulder, the first anchor was placed just posterior to the biceps tendon, at 11 o’clock, and the second anchor about 1 cm posterior to the first, at 10 o’clock. All anchors were placed by an arthroscopy fellowship–trained shoulder surgeon. Before placement, anchor location was confirmed by another arthroscopy fellowship–trained shoulder surgeon.
The ASL portal was created, with an 18-gauge spinal needle and an outside-in technique, about 1 cm lateral to the anterolateral corner of the acromion.
In the opposite shoulder, the PW portal was created, with a percutaneous technique, about 1 cm anterior and 1 cm lateral to the posterolateral corner of the acromion. An 18-gauge spinal needle was inserted to allow a 45° angle of approach to the posterosuperior glenoid.11
Cadaveric Dissection
After anchor placement, another shoulder surgeon performed the dissection. Skin, subcutaneous tissue, deltoid, and clavicle were removed. In the percutaneous specimens, PW portal location relative to rotator cuff was recorded before cuff removal. After overlying soft tissues were removed from a specimen, the anchors were examined for glenoid vault penetration. In the setting of vault penetration, digital calipers were used to measure the shortest distance from anchor to SSN.
Results
In the ASL portal group, 8 (66.7%) of 12 anchors (4/6 at 11 o’clock, 4/6 at 10 o’clock) penetrated the medial glenoid vault.
In the PW portal group, 2 (16.7%) of 12 anchors (1/6 at 11 o’clock, 1/6 at 10 o’clock, both from a single specimen) penetrated the medial glenoid vault. Actually, in each case the eyelet and not the anchor penetrated the vault. In the penetration cases, distance to SSN was 20 mm for the 11 o’clock anchor and 8 mm for the 10 o’clock anchor (Table). Of the 6 portals, 3 passed through the supraspinatus muscle, 2 through the infraspinatus musculotendinous junction, and 1 through the infraspinatus muscle.
Discussion
Our study findings support the hypothesis that SLAP repair anchors placed posterior to the biceps tendon are more likely to remain in bone with use of a percutaneous approach relative to an ASL approach. Our findings also support the growing body of evidence that such anchors placed with an anterior approach increase the risk for SSN injury.
Three other cadaveric studies have evaluated anchor placement for SLAP repair. Chan and colleagues7 evaluated drill penetration during bone socket preparation for SLAP repair in 21 matched pairs of formalin-embalmed cadavers. A 20-mm drill was used for correspondence to a 14.5-mm anchor, though no anchors were inserted, and sockets were created in an open manner. Through a mimicked ASL portal, 1 socket was made anterior to the biceps tendon, at 1 o’clock; then, through a mimicked PW portal, 2 sockets were made posterior to the tendon, at 11 o’clock and 9 to 10 o’clock. Glenoid vault penetration occurred in 29% of the 42 anterior sockets, but only 1 anchor (2.4%) touched the SSN. Penetration did not occur with the 11 o’clock anchors. The 9 to 10 o’clock anchor was at highest risk for SSN injury (9.5%, 4 cases). The study was limited by lack of anchor placement and open creation of bone sockets in embalmed cadavers.
Koh and colleagues8 evaluated arthroscopic placement of anterior SLAP anchors in 6 matched pairs of fresh-frozen cadavers. Through an ASL portal, each 14.5-mm knotted anchor was placed anterior to the biceps tendon, at 1 o’clock. As in the study by Chan and colleagues,7 drill depth was 20 mm. Notably, anchors were seated 2 mm beyond manufacturer recommendations, and the cadavers were of Asian origin, likely indicating smaller glenoids compared to specimens from North America or Europe. All 12 anchors penetrated the glenoid vault; mean distance to SSN was 3.1 mm.
Morgan and colleagues9 compared anterior and ASL portals created for SLAP repairs in 10 matched-pair cadavers. Anchors were placed at 1 o’clock, 11 o’clock, and 10 o’clock. As in the studies by Chan and colleagues7 and Koh and colleagues,8 14.5-mm knotted anchors were used. One anterior anchor (10%) placed through an ASL portal penetrated the cortex by 1 mm, and 2 anterior anchors (20%) placed through anterior portals penetrated the cortex (1 was completely out of the bone). Overall, 65% of 11 o’clock anchors and 100% of 10 o’clock anchors violated the glenoid vault. With the 11 o’clock anchors, mean distance to SSN was 6 mm for ASL portals and 4.2 mm for anterior portals; with the 10 o’clock anchors, mean distance to SSN was 8 mm for ASL portals and 2.1 mm for anterior portals.
Overall, the results of these 3 studies suggest that, with use of ASL portals, placement of SLAP anchors anterior to the biceps tendon is safe. Using the same portals, however, anchors placed posterior to the tendon are at higher risk for glenoid vault penetration. Supporting these findings are our study’s penetration rates: 66.7% for anchors placed through ASL portals and 16.7% for anchors placed through percutaneous PW portals. The different rates are not surprising given that the coracoid process projects anterior to the glenoid and provides additional bone stock for placement of anchors anteriorly vs posteriorly. Therefore, with percutaneous PW portals, the approach angle directs the anchor toward the bone of the coracoid base. Furthermore, the SSN passes nearest the posterior aspect of the glenoid. In a study by Shishido and Kikuchi,12 the distance from the posterior rim of the glenoid to the SSN was 18 mm, and from the superior rim was 29 mm. Therefore, anchors placed with an anterior approach naturally are directed toward the SSN.
In addition to portal placement and approach angle, anchor length likely affects the risks for glenoid vault penetration and SSN injury.
One limitation of this study was the small number of cadavers, all of which were male. Female cadavers and cadavers of other ethnic origins likely have smaller glenoid vaults, and thus their inclusion would have altered our results. This issue was well described in studies mentioned in this article, and our goal was simply to compare ASL portals with percutaneous PW portals, so we think it does not change the fact that the risks for glenoid vault penetration and SSN injury are reduced with use of PW portals for anchors placed posterior to the biceps tendon.
Conclusion
This study was the first to examine glenoid vault penetration and SSN proximity with short anchors for SLAP repair. The risk for glenoid vault penetration during repair of SLAP tears posterior to the biceps tendon was reduced by anchor placement with a percutaneous posterior approach. The percutaneous posterior approach also directs the anchor away from the SSN.
Am J Orthop. 2017;46(1):E60-E64. Copyright Frontline Medical Communications Inc. 2017. All rights reserved.
1. Snyder SJ, Banas MP, Karzel RP. An analysis of 140 injuries to the superior glenoid labrum. J Shoulder Elbow Surg. 1995;4(4):243-248.
2. Denard PJ, Lädermann A, Burkhart SS. Long-term outcome after arthroscopic repair of type II SLAP lesions: results according to age and workers’ compensation status. Arthroscopy. 2012;28(4):451-457.
3. Gorantla K, Gill C, Wright RW. The outcome of type II SLAP repair: a systematic review. Arthroscopy. 2010;26(4):537-545.
4. Weber SC, Martin DF, Seiler JG 3rd, Harrast JJ. Superior labrum anterior and posterior lesions of the shoulder: incidence rates, complications, and outcomes as reported by American Board of Orthopedic Surgery. Part II candidates. Am J Sports Med. 2012;40(7):1538-1543.
5. Kim SH, Koh YG, Sung CH, Moon HK, Park YS. Iatrogenic suprascapular nerve injury after repair of type II SLAP lesion. Arthroscopy. 2010;26(7):1005-1008.
6. Yoo JC, Lee YS, Ahn JH, Park JH, Kang HJ, Koh KH. Isolated suprascapular nerve injury below the spinoglenoid notch after SLAP repair. J Shoulder Elbow Surg. 2009;18(4):e27-e29.
7. Chan H, Beaupre LA, Bouliane MJ. Injury of the suprascapular nerve during arthroscopic repair of superior labral tears: an anatomic study. J Shoulder Elbow Surg. 2010;19(5):709-715.
8. Koh KH, Park WH, Lim TK, Yoo JC. Medial perforation of the glenoid neck following SLAP repair places the suprascapular nerve at risk: a cadaveric study. J Shoulder Elbow Surg. 2011;20(2):245-250.
9. Morgan RT, Henn RF 3rd, Paryavi E, Dreese J. Injury to the suprascapular nerve during superior labrum anterior and posterior repair: is a rotator interval portal safer than an anterosuperior portal? Arthroscopy. 2014;30(11):1418-1423.
10. Lo IK, Lind CC, Burkhart SS. Glenohumeral arthroscopy portals established using an outside-in technique: neurovascular anatomy at risk. Arthroscopy. 2004;20(6):596-602.
11. Morgan CD, Burkhart SS, Palmeri M, Gillespie M. Type II SLAP lesions: three subtypes and their relationships to superior instability and rotator cuff tears. Arthroscopy. 1998;14(6):553-565.
12. Shishido H, Kikuchi S. Injury of the suprascapular nerve in shoulder surgery: an anatomic study. J Shoulder Elbow Surg. 2001;10(4):372-376.
13. Uggen C, Wei A, Glousman RE, et al. Biomechanical comparison of knotless anchor repair versus simple suture repair for type II SLAP lesions. Arthroscopy. 2009;25(10):1085-1092.
14. Kim SH, Crater RB, Hargens AR. Movement-induced knot migration after anterior stabilization in the shoulder. Arthroscopy. 2013;29(3):485-490.
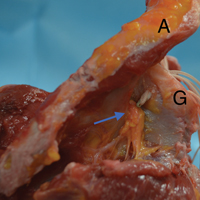
Prospective Evaluation of Opioid Consumption After Distal Radius Fracture Repair Surgery
Take-Home Points
- Prescription opioid abuse and overdose-related deaths are on the rise in the United States.
- Following Open Reduction Internal Fixation (ORIF) of a distal radius fracture (DRF), patients consumed an average of 14.6 opioid pills. We recommend prescribing no more than 15-20 opioid pills after DRF ORIF.
- There was no difference in opioid consumption between patients who underwent general anesthesia vs regional anesthesia.
- There was a significant trend towards less opioid consumption with increasing age.
- There was a trend towards increased opioid consumption in patients with worsening fracture type as well as in self-pay/Medicaid patients.
Over the past 2 decades, prescription opioid abuse in the United States has risen steadily.1,2 Although use of opioid analgesics in the US far exceeds use in other countries, US patients do not report less pain or more satisfaction with pain relief.3-5 Between 1999 and 2002, oxycodone prescriptions increased by 50%, fentanyl prescriptions by 150%, and morphine prescriptions by 60%.6 Furthermore, the Centers for Disease Control and Prevention (CDC) reported in 2012 that, for every 100 people in the United States, US physicians wrote a mean of 82.5 opioid prescriptions and 37.6 benzodiazepine prescriptions; in total, US clinicians wrote 259 million opioid prescriptions in 2012, enough for every adult to have a bottle.7 The increase in prescription opioid abuse, not surprisingly, has paralleled a 124% increase in opioid overdose-related deaths.8 Cicero and colleagues2,9 recently found that, over the past 50 years, heroin use has dramatically shifted from being a problem mainly of urban centers and minorities toward one of older, suburban Caucasians with a previous history of prescription pain killer abuse. Deaths from prescription opioid overdoses now exceed deaths from heroin and cocaine overdoses combined.10 According to the CDC, emergency department visits related to nonmedical use of prescription opioid medications jumped 111% between 2004 and 2008.11
Opioid analgesics are often prescribed for the management of musculoskeletal pain and injuries.12-16 Orthopedic surgeons, who prescribe more opioids than physicians in any other surgical field, represent the third largest group of opioid prescribers, trailing only primary care physicians and internists, who far outnumber them.17 A study focused on opioid consumption after upper extremity surgery found that upper extremity surgeons tended to overprescribe opioids for postoperative analgesia.18 Many patients saved their remaining medication for later use and were never instructed on proper disposal. There is a developing consensus that opioid medication is not as safe and effective as once thought, and that a high-dose prescription or prolonged opioid therapy do not improve outcomes.19 In addition, patients may experience numerous opioid-associated adverse effects, including nausea, vomiting, constipation, lightheadedness, dizziness, blurred vision, headache, dry mouth, sweating, and itching.
In October 2012, patient satisfaction scores on the Hospital Consumer Assessment of Healthcare Providers and Systems started affecting Medicare reimbursements.20 By 2017, up to 6% of Medicare reimbursement will be at risk, given the poor outcomes caused by uncontrolled pain.21-24 The US healthcare culture has made it more important than ever for physicians to adequately manage postoperative pain while limiting opioid availability and the risk for abuse.
Distal radius fracture (DRF) open reduction and internal fixation (ORIF) is commonly performed by orthopedic surgeons and hand surgeons. Pain management and opioid consumption after DRF repair may be influenced by several variables. We conducted a study to investigate the impact of several clinical variables on postoperative opioid use; to test the hypothesis that post-DRF-ORIF opioid consumption would increase with worsening fracture classification and certain patient demographics; and to seek postoperative opioid consumption insights that would facilitate optimization of future opioid prescribing.
Materials and Methods
Institutional Review Board approval was obtained before initiation of the study. All outpatients who underwent DRF-ORIF (performed by 9 hand surgery fellowship-trained orthopedic surgeons) were consecutively enrolled over a 6-month period in 2014. All procedures were performed with a standard volar plating technique through a flexor carpi radialis approach. The postoperative rehabilitation protocol was standardized for all patients. Data collected on each patient included age, sex, payer type, fracture type, opioid prescribed, amount prescribed, amount consumed, reasons for stopping, adverse events, and any postoperative adjunctive pain medications. The data were taken from questionnaires completed by patients at their first visit within 2 weeks after surgery. Anesthesia type (general or regional) was noted as well. All fractures were classified by Dr. O’Neil using the AO/OTA (Arbeitsgemeinschaft für Osteosynthesefragen/Orthopaedic Trauma Association) classification of long-bone fractures based on preoperative radiographs.
Amount of opioid analgesic consumed was converted into morphine equivalents to adjust for the different opioids prescribed after surgery: oxycodone/acetaminophen or oxycodone equivalent, hydrocodone/acetaminophen or hydrocodone equivalent, and acetaminophen/codeine.
Patients were excluded from the study if their procedure was performed on an inpatient basis, if they sustained other injuries or fractures from their trauma, or if an adjunctive procedure (including carpal tunnel release) was performed during the DRF repair.
We used the Spearman rank correlation coefficient and a count data model to examine the relationship between opioid use and age. The Kruskal-Wallis test was used to examine the relationships between opioid use and payer type, anesthesia type, and fracture type.
Results
Of the 109 patients eligible for the study, 11 were excluded for incomplete postoperative questionnaires, leaving 98 patients (79 females, 19 males) for analysis. Mean age was 58 years (range, 13-92 years). Of the 98 patients, 45 received general anesthesia, and 53 received regional anesthesia with a single-shot peripheral nerve block before surgery and sedation perioperatively (Table). 

Of the 98 study patients, 61 reported using over-the-counter adjunctive pain medications during the postoperative period, and 37 reported no use. Mean opioid consumption was 64.7 mg of morphine equivalents for the adjunctive medication users and 48.3 mg for the nonusers (P = .1947).
Demographic analysis revealed an inverse relationship between age and opioid use (Figure 2). The Spearman ρ between age and opioid consumption was –0.2958, which suggests decreased opioid use by older patients (P = .003). 

All fractures were graded with the AO/OTA long-bone fracture classification system. Mean opioid consumption for the 3 fracture-type groups was 57.7 mg (class A), 60.3 mg (class B), and 62.0 mg (class C) (Figure 4). 
Discussion
The US healthcare culture has elevated physicians’ responsibility in adequately and aggressively managing their patients’ pain experience. Moreover, reimbursement may be affected by patient satisfaction scores, which are partly predicated on pain control.20-24 However, as rates of opioid use and abuse rise, it is important that physicians prescribe such medications judiciously. This is particularly germane to orthopedic surgeons, who prescribe more opioid analgesics than surgeons in any other field.17 Rodgers and colleagues18 found upper extremity surgeons, in particular, tended to overprescribe postoperative opioid analgesics. In the present study, we sought to identify the crucial risk factors that influence post-DRF-ORIF pain management and opioid consumption.
Mean postoperative opioid consumption (morphine equivalents) was 58.5 mg, roughly equivalent to 14.6 tabs of oxycodone/acetaminophen 5/325 mg, an opioid analgesic commonly used during the acute postoperative period. In addition, almost 70% of our patients required <75 mg of morphine equivalents, or <20 tabs of oxycodone/acetaminophen 5/325 mg. For upper extremity surgeons, these numbers may be better guides in determining the most appropriate amount of opioid to prescribe after DRF repair.
As for predicting levels of postoperative opioid medication, there was a significant trend toward less consumption with increasing age. Given this finding, surgeons prescribing for elderly patients should expect less opioid use. Regarding payer type, there was a trend toward more opioid use by self-pay/Medicaid patients; however, there were only 3 patients in this group. The situation in the study by Rodgers and colleagues18 is similar: Their finding that Medicaid patients consumed more pain pills after surgery was underpowered (only 5 patients in the group).
In the orthopedic community, support for use of regional anesthesia has been widespread for several reasons, including the belief that it reduces postoperative pain and therefore should reduce postoperative opioid consumption.25 However, we found no significant difference in postoperative opioid consumption between patients who received general anesthesia (with and without local anesthesia) and patients who received regional anesthesia (nerve block). Mean opioid consumption was 57.93 mg in the general anesthesia group and 58.98 mg in the regional anesthesia group. However, this finding could have been confounded by the variability in success and operator dependence inherent in regional anesthesia. In addition, the anatomical location for the peripheral nerve block and anesthetic could have affected the efficacy of the block and played a role in postoperative opioid consumption.
In this study, we tested the hypothesis that there would be more postoperative opioid consumption with worsening fracture type. Although our results did not reach statistical significance, there was a trend toward increased opioid consumption in patients with a complete intra-articular fracture (AO/OTA class C) vs patients with a partial articular fracture (class B) or an extra-articular fracture (class A). In addition, patients with a partial articular fracture tended to use more postoperative opioids than patients with an extra-articular fracture. In short, postoperative opioid consumption tended to be higher with increasing articular involvement of the fracture.
This study was limited in that it relied on patient self-reporting. Given the social stigma attached to opioid use, patients may have underreported their postoperative opioid consumption, been affected by recall bias, or both. The study also did not control for preoperative opioid use or history of opioid or substance abuse. Chronic preoperative opioid consumption may have affected postoperative opioid use. Other patient-related factors, such as body mass index (BMI) and hepatorenal dysfunction, can create tremendous variability in opioid metabolism across a population. Such factors were not controlled for in this study and therefore may have affected its results. That could help explain why older patients, who are more likely to have lower BMI and less efficient organ function for opioid metabolism, had lower postoperative opioid consumption. In addition, although we excluded patients with concomitant injuries and procedures, we did not screen patients for concomitant complex regional pain syndrome, fibromyalgia, or other medical conditions that might have had a significant impact on postoperative pain management needs. Last, some findings, such as the relationship between opioid use and payer type, were underpowered: Although self-pay/Medicaid patients had higher postoperative opioid consumption, they were few in number. The same was true of the Medicaid patients in the study by Rodgers and colleagues.18Our results demonstrated that post-DRF-ORIF opioid consumption decreased with age and was independent of type of perioperative anesthesia. There was a trend toward more opioid consumption with both self- and Medicaid payment and worsening fracture classification. It has become more important than ever for orthopedic surgeons to adequately manage postoperative pain while limiting opioid availability and the risk for abuse. Surgeons must remain aware of the variables in their patients’ postoperative pain experience in order to better optimize prescribing patterns and provide a safe and effective postoperative pain regimen.
Am J Orthop. 2017;46(1):E35-E40. Copyright Frontline Medical Communications Inc. 2017. All rights reserved.
1. Kuehn BM. Opioid prescriptions soar: increase in legitimate use as well as abuse. JAMA. 2007;297(3):249-251.
2. Cicero TJ, Ellis MS, Surratt HL, Kurtz SP. The changing face of heroin use in the United States: a retrospective analysis of the past 50 years. JAMA Psychiatry. 2014;71(7):821-826.
3. Helmerhorst GT, Lindenhovius AL, Vrahas M, Ring D, Kloen P. Satisfaction with pain relief after operative treatment of an ankle fracture. Injury. 2012;43(11):1958-1961.
4. Lindenhovius AL, Helmerhorst GT, Schnellen AC, Vrahas M, Ring D, Kloen P. Differences in prescription of narcotic pain medication after operative treatment of hip and ankle fractures in the United States and the Netherlands. J Trauma. 2009;67(1):160-164.
5. Seya MJ, Gelders SF, Achara OU, Milani B, Scholten WK. A first comparison between the consumption of and the need for opioid analgesics at country, regional, and global levels. J Pain Palliat Care Pharmacother. 2011;25(1):6-18.
6. Bohnert AS, Valenstein M, Bair MJ, et al. Association between opioid prescribing patterns and opioid overdose-related deaths. JAMA. 2011;305(13):1315-1321.
7. Kuehn BM. CDC: major disparities in opioid prescribing among states: some states crack down on excess prescribing. JAMA. 2014;312(7):684-686.
8. Paulozzi LJ, Budnitz DS, Xi Y. Increasing deaths from opioid analgesics in the United States. Pharmacoepidemiol Drug Saf. 2006;15(9):618-627.
9. Cicero TJ, Kuehn BM. Driven by prescription drug abuse, heroin use increases among suburban and rural whites. JAMA. 2014;312(2):118-119.
10. Painkillers fuel growth in drug addiction. Harvard Ment Health Lett. Harvard Medical School website. http://www.health.harvard.edu/newsletter_article/painkillers-fuel-growth-in-drug-addiction. Published January 2011. Accessed March 18, 2015.
11. Cai R, Crane E, Poneleit K, Paulozzi L. Emergency department visits involving nonmedical use of selected prescription drugs in the United States, 2004-2008. J Pain Palliat Care Pharmacother. 2010;24(3):293-297.
12. Armaghani SJ, Lee DS, Bible JE, et al. Preoperative narcotic use and its relation to depression and anxiety in patients undergoing spine surgery. Spine. 2013;38(25):2196-2200.
13. Caudill-Slosberg MA, Schwartz LM, Woloshin S. Office visits and analgesic prescriptions for musculoskeletal pain in US: 1980 vs. 2000. Pain. 2004;109(3):514-519.
14. Deyo RA, Mirza SK, Turner JA, Martin BI. Overtreating chronic back pain: time to back off? J Am Board Fam Med. 2009;22(1):62-68.
15. Lee D, Armaghani S, Archer KR, et al. Preoperative opioid use as a predictor of adverse postoperative self-reported outcomes in patients undergoing spine surgery. J Bone Joint Surg Am. 2014;96(11):e89.
16. Webster BS, Verma SK, Gatchel RJ. Relationship between early opioid prescribing for acute occupational low back pain and disability duration, medical costs, subsequent surgery and late opioid use. Spine. 2007;32(19):2127-2132.
17. Volkow ND, McLellan TA, Cotto JH, Karithanom M, Weiss SR. Characteristics of opioid prescriptions in 2009. JAMA. 2011;305(13):1299-1301.
18. Rodgers J, Cunningham K, Fitzgerald K, Finnerty E. Opioid consumption following outpatient upper extremity surgery. J Hand Surg Am. 2012;37(4):645-650.
19. Chen L, Vo T, Seefeld L, et al. Lack of correlation between opioid dose adjustment and pain score change in a group of chronic pain patients. J Pain. 2013;14(4):384-392.
20. Bush H. Doubling down on the patient experience. Hosp Health Netw. 2011;85(12):22-25, 1.
21. Centers for Medicare & Medicaid Services, US Department of Health and Human Services. Medicare program; hospital inpatient prospective payment systems for acute care hospitals and the long-term care hospital prospective payment system and fiscal year 2013 rates; hospitals’ resident caps for graduate medical education payment purposes; quality reporting requirements for specific providers and for ambulatory surgical centers. Final rule. Fed Regist. 2012;77(170):53257-53750.
22. Centers for Medicare & Medicaid Services, US Department of Health and Human Services. Hospital Value-Based Purchasing. http://www.cms.gov/Outreach-and-Education/Medicare-Learning-Network-MLN/MLNProducts/downloads/Hospital_VBPurchasing_Fact_Sheet_ICN907664.pdf. Published September 2015. Accessed October 2015.
23. Manchikanti L, Singh V, Caraway DL, Benyamin RM, Falco FJ, Hirsch JA. Proposed physician payment schedule for 2013: guarded prognosis for interventional pain management. Pain Physician. 2012;15(5):E615-E627.
24. Bot AG, Bekkers S, Arnstein PM, Smith RM, Ring D. Opioid use after fracture surgery correlates with pain intensity and satisfaction with pain relief. Clin Orthop Relat Res. 2014;472(8):2542-2549.
25. Oldman M, McCartney CJ, Leung A, et al. A survey of orthopedic surgeons’ attitudes and knowledge regarding regional anesthesia. Anesth Analg. 2004;98(5):1486-1490.
Take-Home Points
- Prescription opioid abuse and overdose-related deaths are on the rise in the United States.
- Following Open Reduction Internal Fixation (ORIF) of a distal radius fracture (DRF), patients consumed an average of 14.6 opioid pills. We recommend prescribing no more than 15-20 opioid pills after DRF ORIF.
- There was no difference in opioid consumption between patients who underwent general anesthesia vs regional anesthesia.
- There was a significant trend towards less opioid consumption with increasing age.
- There was a trend towards increased opioid consumption in patients with worsening fracture type as well as in self-pay/Medicaid patients.
Over the past 2 decades, prescription opioid abuse in the United States has risen steadily.1,2 Although use of opioid analgesics in the US far exceeds use in other countries, US patients do not report less pain or more satisfaction with pain relief.3-5 Between 1999 and 2002, oxycodone prescriptions increased by 50%, fentanyl prescriptions by 150%, and morphine prescriptions by 60%.6 Furthermore, the Centers for Disease Control and Prevention (CDC) reported in 2012 that, for every 100 people in the United States, US physicians wrote a mean of 82.5 opioid prescriptions and 37.6 benzodiazepine prescriptions; in total, US clinicians wrote 259 million opioid prescriptions in 2012, enough for every adult to have a bottle.7 The increase in prescription opioid abuse, not surprisingly, has paralleled a 124% increase in opioid overdose-related deaths.8 Cicero and colleagues2,9 recently found that, over the past 50 years, heroin use has dramatically shifted from being a problem mainly of urban centers and minorities toward one of older, suburban Caucasians with a previous history of prescription pain killer abuse. Deaths from prescription opioid overdoses now exceed deaths from heroin and cocaine overdoses combined.10 According to the CDC, emergency department visits related to nonmedical use of prescription opioid medications jumped 111% between 2004 and 2008.11
Opioid analgesics are often prescribed for the management of musculoskeletal pain and injuries.12-16 Orthopedic surgeons, who prescribe more opioids than physicians in any other surgical field, represent the third largest group of opioid prescribers, trailing only primary care physicians and internists, who far outnumber them.17 A study focused on opioid consumption after upper extremity surgery found that upper extremity surgeons tended to overprescribe opioids for postoperative analgesia.18 Many patients saved their remaining medication for later use and were never instructed on proper disposal. There is a developing consensus that opioid medication is not as safe and effective as once thought, and that a high-dose prescription or prolonged opioid therapy do not improve outcomes.19 In addition, patients may experience numerous opioid-associated adverse effects, including nausea, vomiting, constipation, lightheadedness, dizziness, blurred vision, headache, dry mouth, sweating, and itching.
In October 2012, patient satisfaction scores on the Hospital Consumer Assessment of Healthcare Providers and Systems started affecting Medicare reimbursements.20 By 2017, up to 6% of Medicare reimbursement will be at risk, given the poor outcomes caused by uncontrolled pain.21-24 The US healthcare culture has made it more important than ever for physicians to adequately manage postoperative pain while limiting opioid availability and the risk for abuse.
Distal radius fracture (DRF) open reduction and internal fixation (ORIF) is commonly performed by orthopedic surgeons and hand surgeons. Pain management and opioid consumption after DRF repair may be influenced by several variables. We conducted a study to investigate the impact of several clinical variables on postoperative opioid use; to test the hypothesis that post-DRF-ORIF opioid consumption would increase with worsening fracture classification and certain patient demographics; and to seek postoperative opioid consumption insights that would facilitate optimization of future opioid prescribing.
Materials and Methods
Institutional Review Board approval was obtained before initiation of the study. All outpatients who underwent DRF-ORIF (performed by 9 hand surgery fellowship-trained orthopedic surgeons) were consecutively enrolled over a 6-month period in 2014. All procedures were performed with a standard volar plating technique through a flexor carpi radialis approach. The postoperative rehabilitation protocol was standardized for all patients. Data collected on each patient included age, sex, payer type, fracture type, opioid prescribed, amount prescribed, amount consumed, reasons for stopping, adverse events, and any postoperative adjunctive pain medications. The data were taken from questionnaires completed by patients at their first visit within 2 weeks after surgery. Anesthesia type (general or regional) was noted as well. All fractures were classified by Dr. O’Neil using the AO/OTA (Arbeitsgemeinschaft für Osteosynthesefragen/Orthopaedic Trauma Association) classification of long-bone fractures based on preoperative radiographs.
Amount of opioid analgesic consumed was converted into morphine equivalents to adjust for the different opioids prescribed after surgery: oxycodone/acetaminophen or oxycodone equivalent, hydrocodone/acetaminophen or hydrocodone equivalent, and acetaminophen/codeine.
Patients were excluded from the study if their procedure was performed on an inpatient basis, if they sustained other injuries or fractures from their trauma, or if an adjunctive procedure (including carpal tunnel release) was performed during the DRF repair.
We used the Spearman rank correlation coefficient and a count data model to examine the relationship between opioid use and age. The Kruskal-Wallis test was used to examine the relationships between opioid use and payer type, anesthesia type, and fracture type.
Results
Of the 109 patients eligible for the study, 11 were excluded for incomplete postoperative questionnaires, leaving 98 patients (79 females, 19 males) for analysis. Mean age was 58 years (range, 13-92 years). Of the 98 patients, 45 received general anesthesia, and 53 received regional anesthesia with a single-shot peripheral nerve block before surgery and sedation perioperatively (Table).
Of the 98 study patients, 61 reported using over-the-counter adjunctive pain medications during the postoperative period, and 37 reported no use. Mean opioid consumption was 64.7 mg of morphine equivalents for the adjunctive medication users and 48.3 mg for the nonusers (P = .1947).
Demographic analysis revealed an inverse relationship between age and opioid use (Figure 2). The Spearman ρ between age and opioid consumption was –0.2958, which suggests decreased opioid use by older patients (P = .003).
All fractures were graded with the AO/OTA long-bone fracture classification system. Mean opioid consumption for the 3 fracture-type groups was 57.7 mg (class A), 60.3 mg (class B), and 62.0 mg (class C) (Figure 4).
Discussion
The US healthcare culture has elevated physicians’ responsibility in adequately and aggressively managing their patients’ pain experience. Moreover, reimbursement may be affected by patient satisfaction scores, which are partly predicated on pain control.20-24 However, as rates of opioid use and abuse rise, it is important that physicians prescribe such medications judiciously. This is particularly germane to orthopedic surgeons, who prescribe more opioid analgesics than surgeons in any other field.17 Rodgers and colleagues18 found upper extremity surgeons, in particular, tended to overprescribe postoperative opioid analgesics. In the present study, we sought to identify the crucial risk factors that influence post-DRF-ORIF pain management and opioid consumption.
Mean postoperative opioid consumption (morphine equivalents) was 58.5 mg, roughly equivalent to 14.6 tabs of oxycodone/acetaminophen 5/325 mg, an opioid analgesic commonly used during the acute postoperative period. In addition, almost 70% of our patients required <75 mg of morphine equivalents, or <20 tabs of oxycodone/acetaminophen 5/325 mg. For upper extremity surgeons, these numbers may be better guides in determining the most appropriate amount of opioid to prescribe after DRF repair.
As for predicting levels of postoperative opioid medication, there was a significant trend toward less consumption with increasing age. Given this finding, surgeons prescribing for elderly patients should expect less opioid use. Regarding payer type, there was a trend toward more opioid use by self-pay/Medicaid patients; however, there were only 3 patients in this group. The situation in the study by Rodgers and colleagues18 is similar: Their finding that Medicaid patients consumed more pain pills after surgery was underpowered (only 5 patients in the group).
In the orthopedic community, support for use of regional anesthesia has been widespread for several reasons, including the belief that it reduces postoperative pain and therefore should reduce postoperative opioid consumption.25 However, we found no significant difference in postoperative opioid consumption between patients who received general anesthesia (with and without local anesthesia) and patients who received regional anesthesia (nerve block). Mean opioid consumption was 57.93 mg in the general anesthesia group and 58.98 mg in the regional anesthesia group. However, this finding could have been confounded by the variability in success and operator dependence inherent in regional anesthesia. In addition, the anatomical location for the peripheral nerve block and anesthetic could have affected the efficacy of the block and played a role in postoperative opioid consumption.
In this study, we tested the hypothesis that there would be more postoperative opioid consumption with worsening fracture type. Although our results did not reach statistical significance, there was a trend toward increased opioid consumption in patients with a complete intra-articular fracture (AO/OTA class C) vs patients with a partial articular fracture (class B) or an extra-articular fracture (class A). In addition, patients with a partial articular fracture tended to use more postoperative opioids than patients with an extra-articular fracture. In short, postoperative opioid consumption tended to be higher with increasing articular involvement of the fracture.
This study was limited in that it relied on patient self-reporting. Given the social stigma attached to opioid use, patients may have underreported their postoperative opioid consumption, been affected by recall bias, or both. The study also did not control for preoperative opioid use or history of opioid or substance abuse. Chronic preoperative opioid consumption may have affected postoperative opioid use. Other patient-related factors, such as body mass index (BMI) and hepatorenal dysfunction, can create tremendous variability in opioid metabolism across a population. Such factors were not controlled for in this study and therefore may have affected its results. That could help explain why older patients, who are more likely to have lower BMI and less efficient organ function for opioid metabolism, had lower postoperative opioid consumption. In addition, although we excluded patients with concomitant injuries and procedures, we did not screen patients for concomitant complex regional pain syndrome, fibromyalgia, or other medical conditions that might have had a significant impact on postoperative pain management needs. Last, some findings, such as the relationship between opioid use and payer type, were underpowered: Although self-pay/Medicaid patients had higher postoperative opioid consumption, they were few in number. The same was true of the Medicaid patients in the study by Rodgers and colleagues.18Our results demonstrated that post-DRF-ORIF opioid consumption decreased with age and was independent of type of perioperative anesthesia. There was a trend toward more opioid consumption with both self- and Medicaid payment and worsening fracture classification. It has become more important than ever for orthopedic surgeons to adequately manage postoperative pain while limiting opioid availability and the risk for abuse. Surgeons must remain aware of the variables in their patients’ postoperative pain experience in order to better optimize prescribing patterns and provide a safe and effective postoperative pain regimen.
Am J Orthop. 2017;46(1):E35-E40. Copyright Frontline Medical Communications Inc. 2017. All rights reserved.
1. Kuehn BM. Opioid prescriptions soar: increase in legitimate use as well as abuse. JAMA. 2007;297(3):249-251.
2. Cicero TJ, Ellis MS, Surratt HL, Kurtz SP. The changing face of heroin use in the United States: a retrospective analysis of the past 50 years. JAMA Psychiatry. 2014;71(7):821-826.
3. Helmerhorst GT, Lindenhovius AL, Vrahas M, Ring D, Kloen P. Satisfaction with pain relief after operative treatment of an ankle fracture. Injury. 2012;43(11):1958-1961.
4. Lindenhovius AL, Helmerhorst GT, Schnellen AC, Vrahas M, Ring D, Kloen P. Differences in prescription of narcotic pain medication after operative treatment of hip and ankle fractures in the United States and the Netherlands. J Trauma. 2009;67(1):160-164.
5. Seya MJ, Gelders SF, Achara OU, Milani B, Scholten WK. A first comparison between the consumption of and the need for opioid analgesics at country, regional, and global levels. J Pain Palliat Care Pharmacother. 2011;25(1):6-18.
6. Bohnert AS, Valenstein M, Bair MJ, et al. Association between opioid prescribing patterns and opioid overdose-related deaths. JAMA. 2011;305(13):1315-1321.
7. Kuehn BM. CDC: major disparities in opioid prescribing among states: some states crack down on excess prescribing. JAMA. 2014;312(7):684-686.
8. Paulozzi LJ, Budnitz DS, Xi Y. Increasing deaths from opioid analgesics in the United States. Pharmacoepidemiol Drug Saf. 2006;15(9):618-627.
9. Cicero TJ, Kuehn BM. Driven by prescription drug abuse, heroin use increases among suburban and rural whites. JAMA. 2014;312(2):118-119.
10. Painkillers fuel growth in drug addiction. Harvard Ment Health Lett. Harvard Medical School website. http://www.health.harvard.edu/newsletter_article/painkillers-fuel-growth-in-drug-addiction. Published January 2011. Accessed March 18, 2015.
11. Cai R, Crane E, Poneleit K, Paulozzi L. Emergency department visits involving nonmedical use of selected prescription drugs in the United States, 2004-2008. J Pain Palliat Care Pharmacother. 2010;24(3):293-297.
12. Armaghani SJ, Lee DS, Bible JE, et al. Preoperative narcotic use and its relation to depression and anxiety in patients undergoing spine surgery. Spine. 2013;38(25):2196-2200.
13. Caudill-Slosberg MA, Schwartz LM, Woloshin S. Office visits and analgesic prescriptions for musculoskeletal pain in US: 1980 vs. 2000. Pain. 2004;109(3):514-519.
14. Deyo RA, Mirza SK, Turner JA, Martin BI. Overtreating chronic back pain: time to back off? J Am Board Fam Med. 2009;22(1):62-68.
15. Lee D, Armaghani S, Archer KR, et al. Preoperative opioid use as a predictor of adverse postoperative self-reported outcomes in patients undergoing spine surgery. J Bone Joint Surg Am. 2014;96(11):e89.
16. Webster BS, Verma SK, Gatchel RJ. Relationship between early opioid prescribing for acute occupational low back pain and disability duration, medical costs, subsequent surgery and late opioid use. Spine. 2007;32(19):2127-2132.
17. Volkow ND, McLellan TA, Cotto JH, Karithanom M, Weiss SR. Characteristics of opioid prescriptions in 2009. JAMA. 2011;305(13):1299-1301.
18. Rodgers J, Cunningham K, Fitzgerald K, Finnerty E. Opioid consumption following outpatient upper extremity surgery. J Hand Surg Am. 2012;37(4):645-650.
19. Chen L, Vo T, Seefeld L, et al. Lack of correlation between opioid dose adjustment and pain score change in a group of chronic pain patients. J Pain. 2013;14(4):384-392.
20. Bush H. Doubling down on the patient experience. Hosp Health Netw. 2011;85(12):22-25, 1.
21. Centers for Medicare & Medicaid Services, US Department of Health and Human Services. Medicare program; hospital inpatient prospective payment systems for acute care hospitals and the long-term care hospital prospective payment system and fiscal year 2013 rates; hospitals’ resident caps for graduate medical education payment purposes; quality reporting requirements for specific providers and for ambulatory surgical centers. Final rule. Fed Regist. 2012;77(170):53257-53750.
22. Centers for Medicare & Medicaid Services, US Department of Health and Human Services. Hospital Value-Based Purchasing. http://www.cms.gov/Outreach-and-Education/Medicare-Learning-Network-MLN/MLNProducts/downloads/Hospital_VBPurchasing_Fact_Sheet_ICN907664.pdf. Published September 2015. Accessed October 2015.
23. Manchikanti L, Singh V, Caraway DL, Benyamin RM, Falco FJ, Hirsch JA. Proposed physician payment schedule for 2013: guarded prognosis for interventional pain management. Pain Physician. 2012;15(5):E615-E627.
24. Bot AG, Bekkers S, Arnstein PM, Smith RM, Ring D. Opioid use after fracture surgery correlates with pain intensity and satisfaction with pain relief. Clin Orthop Relat Res. 2014;472(8):2542-2549.
25. Oldman M, McCartney CJ, Leung A, et al. A survey of orthopedic surgeons’ attitudes and knowledge regarding regional anesthesia. Anesth Analg. 2004;98(5):1486-1490.
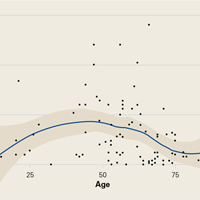
Cost of Diagnosing Psoriasis and Rosacea for Dermatologists Versus Primary Care Physicians
Growing incentives to control health care costs may cause accountable care organizations (ACOs) to reconsider how diseases are best managed. Few studies have examined the cost difference between primary care providers (PCPs) and specialists in managing the same disease. Limited data have suggested that management of some diseases by a PCP may be less costly compared to a specialist1,2; however, it is not clear if this finding extends to skin disease. This study sought to assess the cost of seeing a dermatologist versus a PCP for diagnosis of the common skin diseases psoriasis and rosacea.
Methods
Patient data were obtained from the Humana database, a large commercial data set for claims and reimbursed costs encompassing 18,162,539 patients covered between January 2007 and December 2014. Our study population consisted of 3,944,465 patients with claims that included International Classification of Diseases, Ninth Revision (ICD-9), codes for dermatological diagnoses (680.0–709.9). We searched by ICD-9 code for US patients with primary diagnoses of psoriasis (696.1) and rosacea (695.3). We narrowed the search to include patients aged 30 to 64 years, as the diagnoses for these diseases are most common in patients older than 30 years. Patients who were older than 64 years were not included in the study, as most are covered by Medicare and therefore costs covered by Humana in this age group would not be as representative as in younger age groups. Total and average diagnosis-related costs per patient were compared between dermatologists and PCPs. Diagnosis-related costs encompassed physician reimbursement; laboratory and imaging costs, including skin biopsies; inpatient hospitalization cost; and any other charge that could be coded or billed by providers and reimbursed by the insurance company. To be eligible for reimbursement from Humana, dermatologists and PCPs must be registered with the insurer according to specialty board certification and practice credentialing, and they are reimbursed differently based on specialty. Drug costs, which would possibly skew the data toward providers using more expensive systemic medications (ie, dermatologists), were not included in this study, as the discussion is better reserved for long-term management of disease rather than diagnosis-related costs. All diagnoses of psoriasis were included in the study, which likely includes all severities of psoriasis, though we did not have the ability to further break down these diagnoses by severity.
Results
We identified 30,217 psoriasis patients and 37,561 rosacea patients. Of those patients with a primary diagnosis of psoriasis, 26,112 (86%) were seen by a dermatologist and 4105 (14%) were seen by a PCP (Table). Of those patients with a primary diagnosis of rosacea, 34,694 (92%) were seen by a dermatologist and 2867 (8%) were seen by a PCP (Table). There was little difference in the average diagnosis-related cost per patient for psoriasis in males (dermatologists, $638; PCPs, $657) versus females (dermatologists, $592; PCPs, $586) or between specialties (Figure). Findings were similar for rosacea in males (dermatologists, $179; PCPs, $168) versus females (dermatologists, $157; PCPs, $161). For these skin diseases, i

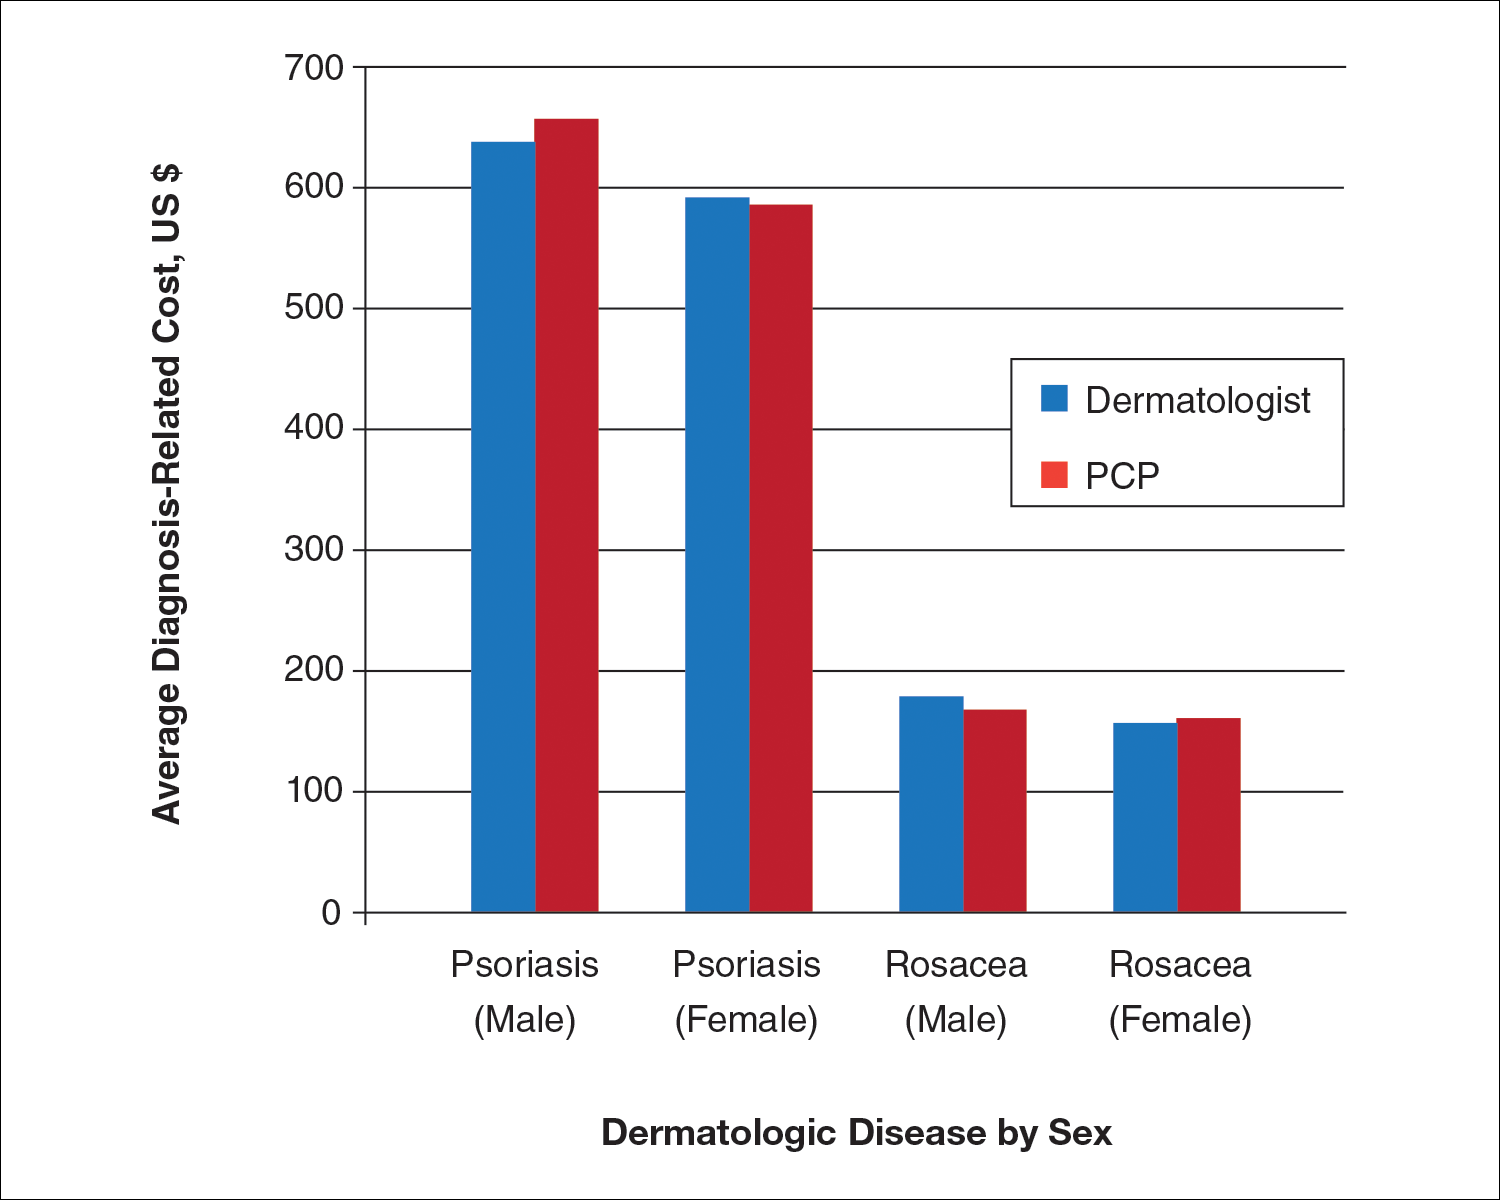
Comment
For the management of common skin disorders such as psoriasis and rosacea, there is little cost difference in seeing a dermatologist versus a PCP. Through extensive training and repeated exposure to many skin diseases, dermatologists are expected to be more comfortable in diagnosing and managing psoriasis and rosacea. Compared to PCPs, dermatologists have demonstrated increased diagnostic accuracy and efficiency when examining pigmented lesions and other dermatologic diseases in several studies.3-6 Although the current study shows that diagnosis-related costs for psoriasis and rosacea are essentially equal between dermatologists and PCPs, it actually may be less expensive for patients to see a dermatologist, as unnecessary tests, biopsies, or medications are more likely to be ordered/prescribed when there is less clinical diagnostic certainty.7,8 Additionally, seeing a PCP for diagnosis of a skin disease may be inefficient if subsequent referral to a dermatologist is needed, a common scenario that occurs when patients see a PCP for skin conditions.9
Our study had limitations, which is typical of a study using a claims database. We used ICD-9 codes recorded in patients’ medical claims to determine diagnosis of psoriasis and rosacea; therefore, our study and data are subject to coding errors. We could not assess the severity of disease, only the presence of disease. Further confirmation of diagnosis could have been made through searching for a second ICD-9 code in the patient’s history. Our data also are from a limited time period and may not represent costs from other time periods.
Conclusion
Given the lack of cost difference between both specialties, we conclude that ACOs should consider encouraging patients to seek care for dermatologic diseases by dermatologists who generally are more accurate and efficient skin diagnosticians, particularly if there is a shortage of PCPs within the ACO network.
- Wimo A, Religa D, Spångberg K, et al. Costs of diagnosing dementia: results from SveDem, the Swedish Dementia Registry. Int J Geriatr Psychiatry. 2013;28:1039-1044.
- Grunfeld E, Fitzpatrick R, Mant D, et al. Comparison of breast cancer patient satisfaction with follow-up in primary care versus specialist care: results from a randomized controlled trial. Br J Gen Pract. 1999;49:705-710.
- Chen SC, Pennie ML, Kolm P, et al. Diagnosing and managing cutaneous pigmented lesions: primary care physicians versus dermatologists. J Gen Intern Med. 2006;21:678-682.
- Federman D, Hogan D, Taylor JR, et al. A comparison of diagnosis, evaluation, and treatment of patients with dermatologic disorders. J Am Acad Dermatol. 1995;32:726-729.
- Feldman SR, Fleischer AB, Young AC, et al. Time-efficiency of nondermatologists compared with dermatologists in the care of skin disease. J Am Acad Dermatol. 1999;40:194-199.
- Feldman SR, Peterson SR, Fleischer AB Jr. Dermatologists meet the primary care standard for first contact management of skin disease. J Am Acad Dermatol. 1998;39(2, pt 1):182-186.
- Smith ES, Fleischer AB, Feldman SR. Nondermatologists are more likely than dermatologists to prescribe antifungal/corticosteroid products: an analysis of office visits for cutaneous fungal infections, 1990-1994. J Am Acad Dermatol. 1998;39:43-47.
- Shaffer MP, Feldman SR, Fleischer AB. Use of clotrimazole/betamethasone diproprionate by family physicians. Fam Med. 2000;32:561-565.
- Feldman SR, Fleischer AB, Chen JG. The gatekeeper model is inefficient for the delivery of dermatologic services. J Am Acad Dermatol. 1999;40:426-432.
Growing incentives to control health care costs may cause accountable care organizations (ACOs) to reconsider how diseases are best managed. Few studies have examined the cost difference between primary care providers (PCPs) and specialists in managing the same disease. Limited data have suggested that management of some diseases by a PCP may be less costly compared to a specialist1,2; however, it is not clear if this finding extends to skin disease. This study sought to assess the cost of seeing a dermatologist versus a PCP for diagnosis of the common skin diseases psoriasis and rosacea.
Methods
Patient data were obtained from the Humana database, a large commercial data set for claims and reimbursed costs encompassing 18,162,539 patients covered between January 2007 and December 2014. Our study population consisted of 3,944,465 patients with claims that included International Classification of Diseases, Ninth Revision (ICD-9), codes for dermatological diagnoses (680.0–709.9). We searched by ICD-9 code for US patients with primary diagnoses of psoriasis (696.1) and rosacea (695.3). We narrowed the search to include patients aged 30 to 64 years, as the diagnoses for these diseases are most common in patients older than 30 years. Patients who were older than 64 years were not included in the study, as most are covered by Medicare and therefore costs covered by Humana in this age group would not be as representative as in younger age groups. Total and average diagnosis-related costs per patient were compared between dermatologists and PCPs. Diagnosis-related costs encompassed physician reimbursement; laboratory and imaging costs, including skin biopsies; inpatient hospitalization cost; and any other charge that could be coded or billed by providers and reimbursed by the insurance company. To be eligible for reimbursement from Humana, dermatologists and PCPs must be registered with the insurer according to specialty board certification and practice credentialing, and they are reimbursed differently based on specialty. Drug costs, which would possibly skew the data toward providers using more expensive systemic medications (ie, dermatologists), were not included in this study, as the discussion is better reserved for long-term management of disease rather than diagnosis-related costs. All diagnoses of psoriasis were included in the study, which likely includes all severities of psoriasis, though we did not have the ability to further break down these diagnoses by severity.
Results
We identified 30,217 psoriasis patients and 37,561 rosacea patients. Of those patients with a primary diagnosis of psoriasis, 26,112 (86%) were seen by a dermatologist and 4105 (14%) were seen by a PCP (Table). Of those patients with a primary diagnosis of rosacea, 34,694 (92%) were seen by a dermatologist and 2867 (8%) were seen by a PCP (Table). There was little difference in the average diagnosis-related cost per patient for psoriasis in males (dermatologists, $638; PCPs, $657) versus females (dermatologists, $592; PCPs, $586) or between specialties (Figure). Findings were similar for rosacea in males (dermatologists, $179; PCPs, $168) versus females (dermatologists, $157; PCPs, $161). For these skin diseases, i
Comment
For the management of common skin disorders such as psoriasis and rosacea, there is little cost difference in seeing a dermatologist versus a PCP. Through extensive training and repeated exposure to many skin diseases, dermatologists are expected to be more comfortable in diagnosing and managing psoriasis and rosacea. Compared to PCPs, dermatologists have demonstrated increased diagnostic accuracy and efficiency when examining pigmented lesions and other dermatologic diseases in several studies.3-6 Although the current study shows that diagnosis-related costs for psoriasis and rosacea are essentially equal between dermatologists and PCPs, it actually may be less expensive for patients to see a dermatologist, as unnecessary tests, biopsies, or medications are more likely to be ordered/prescribed when there is less clinical diagnostic certainty.7,8 Additionally, seeing a PCP for diagnosis of a skin disease may be inefficient if subsequent referral to a dermatologist is needed, a common scenario that occurs when patients see a PCP for skin conditions.9
Our study had limitations, which is typical of a study using a claims database. We used ICD-9 codes recorded in patients’ medical claims to determine diagnosis of psoriasis and rosacea; therefore, our study and data are subject to coding errors. We could not assess the severity of disease, only the presence of disease. Further confirmation of diagnosis could have been made through searching for a second ICD-9 code in the patient’s history. Our data also are from a limited time period and may not represent costs from other time periods.
Conclusion
Given the lack of cost difference between both specialties, we conclude that ACOs should consider encouraging patients to seek care for dermatologic diseases by dermatologists who generally are more accurate and efficient skin diagnosticians, particularly if there is a shortage of PCPs within the ACO network.
- Wimo A, Religa D, Spångberg K, et al. Costs of diagnosing dementia: results from SveDem, the Swedish Dementia Registry. Int J Geriatr Psychiatry. 2013;28:1039-1044.
- Grunfeld E, Fitzpatrick R, Mant D, et al. Comparison of breast cancer patient satisfaction with follow-up in primary care versus specialist care: results from a randomized controlled trial. Br J Gen Pract. 1999;49:705-710.
- Chen SC, Pennie ML, Kolm P, et al. Diagnosing and managing cutaneous pigmented lesions: primary care physicians versus dermatologists. J Gen Intern Med. 2006;21:678-682.
- Federman D, Hogan D, Taylor JR, et al. A comparison of diagnosis, evaluation, and treatment of patients with dermatologic disorders. J Am Acad Dermatol. 1995;32:726-729.
- Feldman SR, Fleischer AB, Young AC, et al. Time-efficiency of nondermatologists compared with dermatologists in the care of skin disease. J Am Acad Dermatol. 1999;40:194-199.
- Feldman SR, Peterson SR, Fleischer AB Jr. Dermatologists meet the primary care standard for first contact management of skin disease. J Am Acad Dermatol. 1998;39(2, pt 1):182-186.
- Smith ES, Fleischer AB, Feldman SR. Nondermatologists are more likely than dermatologists to prescribe antifungal/corticosteroid products: an analysis of office visits for cutaneous fungal infections, 1990-1994. J Am Acad Dermatol. 1998;39:43-47.
- Shaffer MP, Feldman SR, Fleischer AB. Use of clotrimazole/betamethasone diproprionate by family physicians. Fam Med. 2000;32:561-565.
- Feldman SR, Fleischer AB, Chen JG. The gatekeeper model is inefficient for the delivery of dermatologic services. J Am Acad Dermatol. 1999;40:426-432.
Practice Points
- Growing health care costs are causing accountable care organizations (ACOs) to reconsider how to best manage skin disease.
- There is little difference in average diagnosis-related cost between primary care physicians and dermatologists in diagnosing psoriasis or rosacea.
- With diagnosis costs essentially equal and increased dermatologist diagnostic accuracy, ACOs may encourage skin disease to be managed by dermatologists.