User login
Guideline‐Concordant Antibiotic Use
Clinical guidelines are prevalent in the field of medicine, but physicians do not consistently provide guideline‐concordant care. Nonadherence to guidelines has been documented for a variety of clinical conditions, including chronic obstructive pulmonary disease,[1, 2] pain management,[3, 4] and major depressive disorder.[5, 6]
Although several professional societies, including the Infectious Diseases Society of America (IDSA), have developed and disseminated guidelines on antibiotic use, adherence to antibiotic‐prescribing guidelines is inconsistent. Several studies have documented inappropriate antibiotic prescribing for specific infections, including acute respiratory infections,[7, 8, 9] cellulitis,[10, 11] and asymptomatic bacteriuria.[12, 13]
Improving adherence to guidelines on antibiotic use could have several benefits. For certain infections, guideline adherence has been shown to improve patient outcomes and reduce resource utilization.[10, 14, 15] In general, guidelines promote more judicious use of antibiotics by clarifying when an antibiotic is indicated, which antibiotics to prescribe, and duration of antibiotic therapy. The more judicious use of antibiotics decreases a given patient's risk of developing an antibiotic‐resistant infection and Clostridium difficileassociated diarrhea.[16] Judicious antibiotic use will also have societal benefits by slowing the spread of antibiotic‐resistant bacteria.
As part of a local effort to improve antibiotic use, we decided to present physicians with hypothetical cases of common clinical scenarios to identify barriers to following antibiotic‐prescribing guidelines. Previous investigators have used case vignettes to assess the quality of care physicians provide, including decisions about antibiotics.[17, 18, 19, 20, 21] We used case vignettes to assess physicians' familiarity with and acceptance of IDSA guidelines for 3 common infectious conditions: skin and soft tissue infections (SSTI), suspected hospital‐acquired pneumonia (HAP), and asymptomatic bacteriuria (ASB). The findings from our project were intended to inform local interventions to improve antibiotic prescribing.
METHODS
All interviews were conducted at 2 acute care hospitals in Indianapolis, Indiana: Sidney and Lois Eskenazi Hospital and the Richard Roudebush Veterans Affairs Medical Center (VAMC). Eskenazi Hospital is a 316‐bed safety‐net hospital for Marion County, Indiana. The Roudebush VAMC is a 209‐bed tertiary care facility that provides comprehensive medical care for 85,000 veterans. Both hospitals are academically affiliated with Indiana University's School of Medicine.
Both hospitals have empiric antibiotic‐prescribing guidelines printed in their annual antibiograms. These guidelines, developed by each hospital's pharmacy department and the local infectious disease (ID) physicians, are distributed annually as a pocket booklet. During this study, an antibiotic stewardship program was active at hospital A but not hospital B. As part of this program at hospital A, an ID physician reviewed inpatients on antibiotics twice a week and, with the help of inpatient team pharmacists, provided feedback to the frontline prescribers.
For this study, inpatient physicians who prescribe antibiotics at either facility were invited to participate in a 30‐minute confidential interview about their antibiotic‐prescribing habits. All invitations were sent through electronic mail. The target enrollment was 30 physicians, which is consistent with prior literature on qualitative sampling.[22] Sampling was purposeful to recruit a heterogeneous group of participants from both hospital sites. Although such a sampling strategy precluded us from making conclusions about individual subgroups, our intention was to obtain the broadest range of information and perspectives, thereby challenging our own preconceived understandings and biases.
The protocol and conduct of this study were reviewed and approved by the Indiana University Institutional Review Board. Participants read and provided signed informed consent. No compensation was provided to physician participants.
A research assistant (A.R.C.) trained in qualitative interviewing conducted all interviews.[23] These interviews covered social norms, perceptions of risk, self‐efficacy, knowledge, and acceptance of guidelines. At the end of the interview, each participant was asked to respond to 3 case vignettes (Table 1), which had been developed by an ID physician (D.L.) based on both local and IDSA guidelines.[24, 25, 26] Participants decided whether to prescribe antibiotics and, if so, which antibiotic to use. After their response, the interviewer read aloud specific recommendations from IDSA guidelines and asked, Would you feel comfortable applying this recommendation to your practice? Are there situations when you would not apply this recommendation?
|
| 1. A 40‐year‐old man with poorly controlled type 2 diabetes develops pain and redness over the dorsum of his foot. He presents to the emergency room the day after these symptoms started. He denies any recent penetrating injuries to his foot, including no animal bites, and denies any water exposure. At the time of presentation, his temperature is 101.1F, pulse 89, his blood pressure is 124/76, and his respiratory rate is 16. Tender edema, warmth, and erythema extend up to the pretibial area of his right lower leg. Fissures are present between his toes, but he has no foot ulcers. There are no blisters or purulence. When you palpate, you don't feel any crepitus or fluctuance. He has a strong pulse at both dorsal pedis and posterior tibial arteries. Labs reveal a normal WBC count. What is your diagnosis? What antibiotics would you start? |
| 2. A 72‐year‐old man is admitted for a lobectomy. About 6 days after his operation, while still on mechanical ventilation, he develops findings suggestive of pneumonia, based on a new right lower lobe infiltrate on chest x‐ray, increased secretions, and fever (101.1F). A blood sample and an endotracheal aspirate are sent for culture. He is empirically started on vancomycin and piperacillin/tazobactam. After 3 days of empiric antibiotics, he has had no additional fevers and has been extubated to room air. His WBC count has normalized. Blood cultures show no growth. The respiratory sample shows >25 PMNs and <10 epithelial cells; no organisms are seen on Gram stain, and there is no growth on culture. Would you make any changes to his antibiotic regimen at this time? If so, how would you justify the change? |
| 3. A 72‐year‐old man presented with a severe Clostridium difficile infection, which resulted in both respiratory and acute renal failure. He gradually improved with supportive care, oral vancomycin, and IV metronidazole. After over a month of being hospitalized in the ICU, his Foley was removed. He was subsequently found to have urinary retention, so he was straight catheterized. The urine obtained from the straight catheterization was cloudy. A urinalysis showed 53 WBCs, positive nitrite, and many bacteria. Urine culture grew >100K ESBL‐producing Escherichia coli. He wasn't having fevers. He had no leukocytosis and no signs or symptoms attributable to a UTI. What is you diagnosis? What antibiotics would you start? |
All interviews were audio recorded, transcribed, and deidentified. All transcripts were reviewed by the study's research assistant (A.R.C.) for accuracy and completeness.
An ID physician (D.L.) reviewed each transcript to determine whether the participant's stated plan for each case vignette was in accordance with IDSA guidelines. Participants were evaluated on their decision to prescribe antibiotics and their choice of agents.
Transcripts were also analyzed using emergent thematic analysis.[27, 28, 29] First, 2 members of the research team (D.L., A.R.C.) reviewed all interview transcripts and discussed general impressions. Next, the analytic team reread one‐fifth of the transcripts, assigning codes to the data line by line. Codes were discussed among team members to determine the most prominent themes. During this phase, codes were added, eliminated, and combined while applying the codes to the remaining transcripts.[30] The analysts then performed focused coding: finalized codes from the first phase were applied to each transcript. The 2 analysts performed focused coding individually on each transcript in a consecutive fashion and met after every 10 transcripts to ensure consistency in their coding for the prior 10 transcripts. Analysts discussed any discrepancies to reach a consensus. Evidence was sought that may call observations and classifications into question.[31] Theoretical saturation was reached through the 30 interviews, so additional enrollment was deemed unnecessary. NVivo version 9 software (QSR International, Cambridge, MA) was used to facilitate all coding and analysis.
RESULTS
All participants were physicians who practiced inpatient medicine. Ten were women, and 20 were men. The median age of participants was 34 years (interquartile range [IQR] 3042). Twenty were attending or staff physicians and had spent a median of 10 years (IQR 315) in clinical practice. Of these attending physicians, 3 practiced pulmonary/critical care, 16 were hospitalists without subspecialty training, and 1 was a hospitalist with ID training. Seven attending physicians practiced exclusively at hospital A, 8 practiced exclusively at hospital B, and 5 practiced at both A and B. The remaining 10 participants were physicians in training or residents, who practiced at both hospitals and were either in their third or fourth year of an internal medicine or medicine/pediatrics residency program.
All participants expressed general awareness of and familiarity with clinical guidelines. Most participants also found guidelines useful in their clinical practice. According to a resident:
[Guidelines] give you a framework for what to do. If somebody questions what you are doing, it is easy to point to the guidelines (24, resident).
The guidelines tend to keep us up‐to‐date, because unless you're focused on 1 system, it can be impossible to keep up with everything that is changing across the board (28, attending).
Most of the guidelines are well‐researched and are approved by a lot of people, so I don't usually go against them (6, attending).
Despite general agreement with guidelines in principle, our interviews identified 3 major barriers to following guidelines in practice: (1) lack of awareness of specific guideline recommendations, (2) tension between adhering to guidelines and the desire to individualize patient care, and (3) skepticism of certain guideline recommendations.
Lack of Awareness of Specific Guideline Recommendations
Although participants stated that they agreed with guidelines in general, many had difficulty describing specific guideline recommendations. Two residents acknowledged that their attending physicians did not seem familiar with guidelines. In response to hearing a guideline recommendation on HAP, a resident stated: I'm learning from them [the guidelines] as we speak. In addition, an attending admitted that she was not familiar with the guidelines:
Now that you're asking about [prescribing] outside of the clinical guidelines, I am sitting here thinking, I can't think of any [guidelines]. In fact, I will say that I am probably not aware of all of the clinical guidelines or changes in them in recent years (28, attending).
| Category | Case Vignette | Illustrative Quotation |
|---|---|---|
| ||
| 1. Lack of awareness of specific guideline recommendations | SSTI | 1. [Treating for] methicillin susceptible [Staphylococcus aureus] without MRSA? Oh, oh, wow.[and] not doing any gram‐negative coverage? I guess I am most discomfortable with that, but if that's the guideline [recommendation], yes, I will probably start following it (8, attending). |
| ASB | 2. I still think that he has a UTI, even though he doesn't necessarily have symptoms, because he was catheterized for so long. I also know after you reach a certain age, we generally treat you even though you don't necessarily have symptoms just because of all the risks associated with having bacteria in your urine (29, resident). | |
| 2. Tension between adhering to guidelines and individualizing patient care | SSTI | 3. If he had a known history of MRSA, if he had something else likea temporary dialysis lineor prosthetic joint or something else that if he were to get bacteremic with MRSA, it would cause him more operations and significant morbidity. [In that case], I might add vancomycin to his regimen from the beginning (12, resident). |
| HAP | 4. He has only 1 lung because he had part of his lung taken out. So, anyway, part of a lung taken out, and he's got a new infiltrate on his x‐ray, and he's got all the risk factors for pneumonia, so I would say generally I would leave him on antibiotics, but cut down (5, attending). | |
| 5. I would be concerned, especially since the patient was febrile. He did have a new infiltrate, and he seemed to have gotten better on antibiotics. I would definitely take it [the guideline recommendation] into consideration, but I would probably go ahead and give a course of oral antibiotics (6, attending). | ||
| ASB | 6. I would say this is a UTI. I'm sure the guidelines are going to say no, but since he was having retention and it wasn't a urine [culture] obtained from him having a Foley, I have less comfort calling it colonization. I would say that it is probably an infection. You don't see a lot of fevers in just a bladder infection (25, attending). | |
| 3. Skepticism of guideline recommendations | SSTI | 7. My big concern is methicillin‐resistant S aureus [MRSA]. I think personally I have some concern about not covering for MRSA (17, attending). |
| HAP | 8. Those are the guidelines, so I mean it is agreeable if there are studies that back it up. It is not something I feel that great about, but I could trial them off antibiotics and see how they do (14, resident). | |
| 9. I guess I would have to look more at the studies that led to the recommendations. I don't know that I would stop antibiotics completely because of how sick he was (29, resident). | ||
| ASB | 10. They [the guidelines] are tough to swallow, but we follow them because that is what the evidence shows. A lot of people would be very, very tempted to treat this (19, attending). | |
| 11. A guy has a catheter in for a month and has a ton of white cells in his urine and is growing something that is clearly pathogenic: he needs treatment. I do not care what the guidelines say (7, attending). | ||
Tension Between Adhering to Guidelines and Individualizing Patient Care
Although participants agreed with guidelines in principle, they had difficulty applying specific guideline recommendations to an individual patient's care. Many participants acknowledged modifying these recommendations to better suit the needs of a specific patient:
So guidelines are guidelines, but at the end of the day, it still comes down to individualizing patient care, and so sometimes those guidelines do not cover all the bases, and you still need to do what you think is best for the patient (10, attending).
The guidelines are not examining the patient, and I am examining the patient. So I will do what the guidelines say unless I feel that that patient needs more care (11, resident).
Fine, the study says something, but your objective evidence about what happened [is different]. He had this fever, he had these radiologic changes that are suggestive of pneumonia, you start antibiotics, he gets better, so that clinical scenario suggests an infection that is getting better (15, resident).
[I would treat outside of guidelines] when we are treating severe sepsis in somebody with advanced liver disease. Most of the clinical research programsexclude patients with advanced liver disease if they have risks for certain types of infections that are unusual (16, attending).
If it's a patient who is intubated and sick, they can't complain [about urinary symptoms], so the asymptomatic part of that goes out the window. For critically ill patients on ventilators that have bacteriuria, particularly if it's an ESBL [extended‐spectrum ‐lactamase], which is a bad bacteria, not wanting the patient to get sicker and not knowing if they are having symptoms of pain or both, I might consider treating in that kind of situation, even though they are afebrile and no [elevated] white count (20, attending).
Skepticism of Guideline Recommendations
A third barrier to guideline adherence was physicians' skepticism of what the guidelines recommend in certain cases. This skepticism stemmed, in part, from guidelines promoting a standardized, one size fits all approach even in situations when participants were more comfortable using their own judgment:
To me, the guidelines are adding a little bit more of a stress, because the guidelines are good for the more obvious things; they're more black and white, this than that. But clinical medicine is never like that. There is always something that makes it really gray, and some of it has to do with things that you're seeing because you're there with the patient that doesn't quite fit (25, attending).
Overall, guidelines are easy to follow when they have what to do as opposed to what not to do. We are trained to do something and fix something, so to not do anything is probably the hardest guideline to follow (11, resident).
It is just scary that he is growing such a bad bug and with a bad microbe, I would be worried about it progressing (11, resident).
Another acknowledged she would have difficulty stopping all antibiotics after only 3 days of therapy:
It would make me a little nervous following them [the guidelines]. I think I would finish the course because he had a fever, and we started him on antibiotics and he got better. I still feel clinically that he could have had pneumonia (25, attending).
DISCUSSION
In this study, we used case vignettes to identify barriers to following IDSA guidelines. Case vignettes require few resources and provide a common starting point for assessing physician decision making. Prior studies have used case vignettes to measure the quality of physicians' practice, including antibiotic prescribing.[17, 18, 19, 20, 21] Case vignettes have been used to assess antibiotic prescribing in the neonatal ICU and medical students' knowledge of upper respiratory tract infections.[21, 32] In 1 study, physicians who scored poorly on a series of case vignettes more frequently prescribed antibiotics inappropriately in actual practice.[17]
Using case vignettes, we identified 3 barriers to following IDSA guidelines on SSTI, HAP, and ASB: (1) lack of awareness of specific guideline recommendations, (2) tension between adhering to guidelines and the desire to individualize patient care, and (3) skepticism of certain guideline recommendations. These barriers were distributed unevenly across participants, highlighting the heterogeneity that exists even within a subgroup of hospital medicine physicians.
We identified lack of familiarity with guideline recommendations as a barrier in our sample of physicians. Interestingly, participants initially expressed agreement with guidelines, but when presented with case vignettes and asked for their own treatment recommendations, it became clear that their familiarity with guidelines was superficial. The disconnect between self‐reported practice and actual adherence has also been described in a separate study on healthcare‐associated pneumonia.[33] In all likelihood, participants genuinely believed that they were practicing guideline‐concordant care, but without a formal process for audit and feedback, their lack of adherence had never been raised as an issue.
A second barrier to guideline‐concordant care was the tension between individualizing patient care and adhering to standardized recommendations. On one hand, this tension is unavoidable and is inherent in the practice of medicine. However, participants' responses to our case vignettes suggested that they find their patients too different to fit into any standardized guideline. This tension was also discussed by Charani et al., who interviewed 39 healthcare professionals at 4 hospitals in the United Kingdom. These investigators found that physicians routinely consider their patients to be outside the recommendations of local evidence‐based policies.[34] Instead of referring to guidelines, physicians rely on their knowledge and clinical experience to guide their antibiotic prescribing.
The final barrier to guideline adherence that we identified was providers' skepticism of what the guidelines were recommending. Although physician discomfort with certain guideline recommendations may be alleviated by reviewing the literature informing the recommendation, education alone is often insufficient to change antibiotic prescribing practices.[35] Furthermore, part of this skepticism may reflect the lack of data from randomized controlled trials to support every guideline recommendation. For example, most guideline recommendations are based on low‐quality evidence.[36] The guideline recommendations presented in this study were based on moderate‐ to high‐quality evidence.[24, 25, 26]
To our knowledge, this study is 1 of the few to describe barriers to guideline‐concordant antibiotic use among inpatient medicine physicians in the United States. The barriers discussed above have also been described by investigators in Europe who studied antibiotic use among inpatient physicians.[34, 37, 38] These commonalities highlight the shared challenges faced by local initiatives to improve antibiotic prescribing.
Our findings suggest that the 2 hospitals we studied need more active interventions to improve antibiotic prescribing. One attractive idea is involving hospitalist physicians in future improvement efforts. Hospitalists are well positioned for this role; they care for a large proportion of hospital patients, they frequently prescribe antibiotics, andas a professionthey are committed to the efficient use of healthcare resources. Hospitalists could assist in the dissemination of local guidelines, the implementation of reliable processes to prompt antibiotic de‐escalation, and the development of local standards for documenting the indication for antibiotics and the planned duration of therapy.[39]
One limitation of this study was that we did not validate whether a physician's self‐reported response to the case vignettes correlated with his or her actual practice. Interviews were conducted by a nonphysician and kept confidential, but participants may nonetheless have been inclined to give socially desirable responses. However, this is less likely because participants readily admitted to not knowing and often not following guidelines. In addition, our case vignettes presented simplistic, hypothetical situations and were therefore less able to account for all determinants of antibiotic‐prescribing decisions. Prior research has shown that antibiotic‐prescribing decisions are influenced by a multitude of factors, including social norms and the physician's underlying beliefs and emotions.[34, 40] Antibiotic‐prescribing decisions can also be influenced by audit and feedback processes.[35] Thus, we acknowledge that our findings may have been different if this study was conducted exclusively at hospitals without an antimicrobial stewardship program.
In conclusion, case vignettes may be a useful tool to assess physician knowledge and acceptance of antibiotic‐prescribing guidelines on a local level. This study used case vignettes to identify key barriers to guideline‐concordant antibiotic use. Developing local interventions to target each of these barriers will be the next step in improving antibiotic prescribing.
Disclosure: This project was supported by a Project Development Team within the ICTSI NIH/NCRR grant number UL1TR001108. The authors report no conflicts of interest.
- , , , , . Variation in adherence with Global Initiative for Chronic Obstructive Lung Disease (GOLD) drug therapy guidelines: a retrospective actuarial claims data analysis. Curr Med Res Opin. 2011;27:1425–1429.
- , , , , . Guideline adherence in management of stable chronic obstructive pulmonary disease. Respir Med. 2013;107:1046–1052.
- , , , et al. Guideline‐concordant management of opioid therapy among human immunodeficiency virus (HIV)‐infected and uninfected veterans. J Pain. 2014;15:1130–1140.
- , , , et al. Primary care clinician adherence to guidelines for the management of chronic musculoskeletal pain: results from the study of the effectiveness of a collaborative approach to pain. Pain Med. 2011;12:1490–1501.
- , , , , . Receiving guideline‐concordant pharmacotherapy for major depression: impact on ambulatory and inpatient health service use. Can J Psychiatry. 2007;52:191–200.
- , , , , , . Guideline‐concordant antidepressant use among patients with major depressive disorder. Gen Hosp Psychiatry. 2010;32:360–367.
- , . Antibiotic prescribing to adults with sore throat in the United States, 1997–2010. JAMA Intern Med. 2014;174:138–140.
- , , , . National trends in visit rates and antibiotic prescribing for adults with acute sinusitis. Arch Intern Med. 2012;172:1513–1514.
- , , . Geographic variation in outpatient antibiotic prescribing among older adults. Arch Intern Med. 2012;172:1465–1471.
- , , , et al. Decreased antibiotic utilization after implementation of a guideline for inpatient cellulitis and cutaneous abscess. Arch Intern Med. 2011;171:1072–1079.
- , , , , , . Skin and soft‐tissue infections requiring hospitalization at an academic medical center: opportunities for antimicrobial stewardship. Clin Infect Dis. 2010;51:895–903.
- , , , , , . Inappropriate treatment of catheter‐associated asymptomatic bacteriuria in a tertiary care hospital. Clin Infect Dis. 2009;48:1182–1188.
- . Asymptomatic bacteriuria: when the treatment is worse than the disease. Nat Rev Urol. 2012;9:85–93.
- , , , et al. Improving outcomes in elderly patients with community‐acquired pneumonia by adhering to national guidelines: Community‐Acquired Pneumonia Organization International cohort study results. Arch Intern Med. 2009;169:1515–1524.
- , , , et al. Effectiveness of an Antimicrobial Stewardship Approach for Urinary Catheter‐Associated Asymptomatic Bacteriuria. JAMA Intern Med. 2015;175:1120–1127.
- , , , , . Effect of antibiotic prescribing in primary care on antimicrobial resistance in individual patients: systematic review and meta‐analysis. BMJ. 2010;340:c2096.
- , , , et al. Do case vignettes accurately reflect antibiotic prescription? Infect Control Hosp Epidemiol. 2011;32:1003–1009.
- , , , et al. Antibiotic use: knowledge and perceptions in two university hospitals. J Antimicrob Chemother. 2011;66:936–940.
- , , , , . Comparison of vignettes, standardized patients, and chart abstraction: a prospective validation study of 3 methods for measuring quality. JAMA. 2000;283:1715–1722.
- , , , et al. Measuring the quality of physician practice by using clinical vignettes: a prospective validation study. Ann Intern Med. 2004;141:771–780.
- , , , et al. Clinical vignettes provide an understanding of antibiotic prescribing practices in neonatal intensive care units. Infect Control Hosp Epidemiol. 2011;32:597–602.
- . Sampling in qualitative inquiry. In: Crabtree BF, Miller WL, eds. Doing Qualitative Research. Thousand Oaks, CA: Sage; 1999:33–45.
- , , , , . Factors influencing antibiotic‐prescribing decisions among inpatient physicians: a qualitative investigation. Infect Control Hosp Epidemiol. 2015;36(9):1065–1072.
- , , , et al. Practice guidelines for the diagnosis and management of skin and soft tissue infections: 2014 update by the Infectious Diseases Society of America. Clin Infect Dis. 2014;59:e10–e52.
- American Thoracic Society and the Infectious Disease Society of North America. The new American Thoracic Society/Infectious Disease Society of North America guidelines for the management of hospital‐acquired, ventilator‐associated and healthcare‐associated pneumonia: a current view and new complementary information. Curr Opin Crit Care. 2006;12:444–445.
- , , , et al. Infectious Diseases Society of America guidelines for the diagnosis and treatment of asymptomatic bacteriuria in adults. Clin Infect Dis. 2005;40:643–654.
- , . The dance of interpretation. In: Crabtree BF, Miller WL, eds. Doing Qualitative Research. Thousand Oaks, CA: Sage; 1999:127–143.
- , . Qualitative Data Analysis. Thousand Oaks, CA: Sage; 1994.
- . Research Methods in Anthropology: Qualitative and Quantitative Approaches. Walnut Creek, CA: AltaMira; 2002.
- . Constructing Grounded Theory: A Practical Guide Through Qualitative Analysis. Thousand Oaks, CA: Sage; 2006.
- , . The Discovery of Grounded Theory: Strategies for Qualitative Research. Hawthorne, NY: Aldine de Gruyter; 1967.
- , , . Knowledge of the principles of judicious antibiotic use for upper respiratory infections: a survey of senior medical students. South Med J. 2005;98:889–895.
- , , , et al. The HCAP gap: differences between self‐reported practice patterns and published guidelines for health care‐associated pneumonia. Clin Infect Dis. 2009;49:1868–1874.
- , , , et al. Understanding the determinants of antimicrobial prescribing within hospitals: the role of “prescribing etiquette”. Clin Infect Dis. 2013;57:188–196.
- , , , et al. Infectious Diseases Society of America and the Society for Healthcare Epidemiology of America guidelines for developing an institutional program to enhance antimicrobial stewardship. Clin Infect Dis. 2007;44:159–177.
- , , , , . Quality and strength of evidence of the Infectious Diseases Society of America clinical practice guidelines. Clin Infect Dis. 2010;51:1147–1156.
- , , , , . Opposing expectations and suboptimal use of a local antibiotic hospital guideline: a qualitative study. J Antimicrob Chemother. 2008;62:189–195.
- , , , , , . Barriers to optimal antibiotic use for community‐acquired pneumonia at hospitals: a qualitative study. Qual Saf Health Care. 2007;16:143–149.
- , , . Role of the hospitalist in antimicrobial stewardship: a review of work completed and description of a multisite collaborative. Clin Ther. 2013;35:751–757.
- , , , et al. Behavior change strategies to influence antimicrobial prescribing in acute care: a systematic review. Clin Infect Dis. 2011;53:651–662.
Clinical guidelines are prevalent in the field of medicine, but physicians do not consistently provide guideline‐concordant care. Nonadherence to guidelines has been documented for a variety of clinical conditions, including chronic obstructive pulmonary disease,[1, 2] pain management,[3, 4] and major depressive disorder.[5, 6]
Although several professional societies, including the Infectious Diseases Society of America (IDSA), have developed and disseminated guidelines on antibiotic use, adherence to antibiotic‐prescribing guidelines is inconsistent. Several studies have documented inappropriate antibiotic prescribing for specific infections, including acute respiratory infections,[7, 8, 9] cellulitis,[10, 11] and asymptomatic bacteriuria.[12, 13]
Improving adherence to guidelines on antibiotic use could have several benefits. For certain infections, guideline adherence has been shown to improve patient outcomes and reduce resource utilization.[10, 14, 15] In general, guidelines promote more judicious use of antibiotics by clarifying when an antibiotic is indicated, which antibiotics to prescribe, and duration of antibiotic therapy. The more judicious use of antibiotics decreases a given patient's risk of developing an antibiotic‐resistant infection and Clostridium difficileassociated diarrhea.[16] Judicious antibiotic use will also have societal benefits by slowing the spread of antibiotic‐resistant bacteria.
As part of a local effort to improve antibiotic use, we decided to present physicians with hypothetical cases of common clinical scenarios to identify barriers to following antibiotic‐prescribing guidelines. Previous investigators have used case vignettes to assess the quality of care physicians provide, including decisions about antibiotics.[17, 18, 19, 20, 21] We used case vignettes to assess physicians' familiarity with and acceptance of IDSA guidelines for 3 common infectious conditions: skin and soft tissue infections (SSTI), suspected hospital‐acquired pneumonia (HAP), and asymptomatic bacteriuria (ASB). The findings from our project were intended to inform local interventions to improve antibiotic prescribing.
METHODS
All interviews were conducted at 2 acute care hospitals in Indianapolis, Indiana: Sidney and Lois Eskenazi Hospital and the Richard Roudebush Veterans Affairs Medical Center (VAMC). Eskenazi Hospital is a 316‐bed safety‐net hospital for Marion County, Indiana. The Roudebush VAMC is a 209‐bed tertiary care facility that provides comprehensive medical care for 85,000 veterans. Both hospitals are academically affiliated with Indiana University's School of Medicine.
Both hospitals have empiric antibiotic‐prescribing guidelines printed in their annual antibiograms. These guidelines, developed by each hospital's pharmacy department and the local infectious disease (ID) physicians, are distributed annually as a pocket booklet. During this study, an antibiotic stewardship program was active at hospital A but not hospital B. As part of this program at hospital A, an ID physician reviewed inpatients on antibiotics twice a week and, with the help of inpatient team pharmacists, provided feedback to the frontline prescribers.
For this study, inpatient physicians who prescribe antibiotics at either facility were invited to participate in a 30‐minute confidential interview about their antibiotic‐prescribing habits. All invitations were sent through electronic mail. The target enrollment was 30 physicians, which is consistent with prior literature on qualitative sampling.[22] Sampling was purposeful to recruit a heterogeneous group of participants from both hospital sites. Although such a sampling strategy precluded us from making conclusions about individual subgroups, our intention was to obtain the broadest range of information and perspectives, thereby challenging our own preconceived understandings and biases.
The protocol and conduct of this study were reviewed and approved by the Indiana University Institutional Review Board. Participants read and provided signed informed consent. No compensation was provided to physician participants.
A research assistant (A.R.C.) trained in qualitative interviewing conducted all interviews.[23] These interviews covered social norms, perceptions of risk, self‐efficacy, knowledge, and acceptance of guidelines. At the end of the interview, each participant was asked to respond to 3 case vignettes (Table 1), which had been developed by an ID physician (D.L.) based on both local and IDSA guidelines.[24, 25, 26] Participants decided whether to prescribe antibiotics and, if so, which antibiotic to use. After their response, the interviewer read aloud specific recommendations from IDSA guidelines and asked, Would you feel comfortable applying this recommendation to your practice? Are there situations when you would not apply this recommendation?
|
| 1. A 40‐year‐old man with poorly controlled type 2 diabetes develops pain and redness over the dorsum of his foot. He presents to the emergency room the day after these symptoms started. He denies any recent penetrating injuries to his foot, including no animal bites, and denies any water exposure. At the time of presentation, his temperature is 101.1F, pulse 89, his blood pressure is 124/76, and his respiratory rate is 16. Tender edema, warmth, and erythema extend up to the pretibial area of his right lower leg. Fissures are present between his toes, but he has no foot ulcers. There are no blisters or purulence. When you palpate, you don't feel any crepitus or fluctuance. He has a strong pulse at both dorsal pedis and posterior tibial arteries. Labs reveal a normal WBC count. What is your diagnosis? What antibiotics would you start? |
| 2. A 72‐year‐old man is admitted for a lobectomy. About 6 days after his operation, while still on mechanical ventilation, he develops findings suggestive of pneumonia, based on a new right lower lobe infiltrate on chest x‐ray, increased secretions, and fever (101.1F). A blood sample and an endotracheal aspirate are sent for culture. He is empirically started on vancomycin and piperacillin/tazobactam. After 3 days of empiric antibiotics, he has had no additional fevers and has been extubated to room air. His WBC count has normalized. Blood cultures show no growth. The respiratory sample shows >25 PMNs and <10 epithelial cells; no organisms are seen on Gram stain, and there is no growth on culture. Would you make any changes to his antibiotic regimen at this time? If so, how would you justify the change? |
| 3. A 72‐year‐old man presented with a severe Clostridium difficile infection, which resulted in both respiratory and acute renal failure. He gradually improved with supportive care, oral vancomycin, and IV metronidazole. After over a month of being hospitalized in the ICU, his Foley was removed. He was subsequently found to have urinary retention, so he was straight catheterized. The urine obtained from the straight catheterization was cloudy. A urinalysis showed 53 WBCs, positive nitrite, and many bacteria. Urine culture grew >100K ESBL‐producing Escherichia coli. He wasn't having fevers. He had no leukocytosis and no signs or symptoms attributable to a UTI. What is you diagnosis? What antibiotics would you start? |
All interviews were audio recorded, transcribed, and deidentified. All transcripts were reviewed by the study's research assistant (A.R.C.) for accuracy and completeness.
An ID physician (D.L.) reviewed each transcript to determine whether the participant's stated plan for each case vignette was in accordance with IDSA guidelines. Participants were evaluated on their decision to prescribe antibiotics and their choice of agents.
Transcripts were also analyzed using emergent thematic analysis.[27, 28, 29] First, 2 members of the research team (D.L., A.R.C.) reviewed all interview transcripts and discussed general impressions. Next, the analytic team reread one‐fifth of the transcripts, assigning codes to the data line by line. Codes were discussed among team members to determine the most prominent themes. During this phase, codes were added, eliminated, and combined while applying the codes to the remaining transcripts.[30] The analysts then performed focused coding: finalized codes from the first phase were applied to each transcript. The 2 analysts performed focused coding individually on each transcript in a consecutive fashion and met after every 10 transcripts to ensure consistency in their coding for the prior 10 transcripts. Analysts discussed any discrepancies to reach a consensus. Evidence was sought that may call observations and classifications into question.[31] Theoretical saturation was reached through the 30 interviews, so additional enrollment was deemed unnecessary. NVivo version 9 software (QSR International, Cambridge, MA) was used to facilitate all coding and analysis.
RESULTS
All participants were physicians who practiced inpatient medicine. Ten were women, and 20 were men. The median age of participants was 34 years (interquartile range [IQR] 3042). Twenty were attending or staff physicians and had spent a median of 10 years (IQR 315) in clinical practice. Of these attending physicians, 3 practiced pulmonary/critical care, 16 were hospitalists without subspecialty training, and 1 was a hospitalist with ID training. Seven attending physicians practiced exclusively at hospital A, 8 practiced exclusively at hospital B, and 5 practiced at both A and B. The remaining 10 participants were physicians in training or residents, who practiced at both hospitals and were either in their third or fourth year of an internal medicine or medicine/pediatrics residency program.
All participants expressed general awareness of and familiarity with clinical guidelines. Most participants also found guidelines useful in their clinical practice. According to a resident:
[Guidelines] give you a framework for what to do. If somebody questions what you are doing, it is easy to point to the guidelines (24, resident).
The guidelines tend to keep us up‐to‐date, because unless you're focused on 1 system, it can be impossible to keep up with everything that is changing across the board (28, attending).
Most of the guidelines are well‐researched and are approved by a lot of people, so I don't usually go against them (6, attending).
Despite general agreement with guidelines in principle, our interviews identified 3 major barriers to following guidelines in practice: (1) lack of awareness of specific guideline recommendations, (2) tension between adhering to guidelines and the desire to individualize patient care, and (3) skepticism of certain guideline recommendations.
Lack of Awareness of Specific Guideline Recommendations
Although participants stated that they agreed with guidelines in general, many had difficulty describing specific guideline recommendations. Two residents acknowledged that their attending physicians did not seem familiar with guidelines. In response to hearing a guideline recommendation on HAP, a resident stated: I'm learning from them [the guidelines] as we speak. In addition, an attending admitted that she was not familiar with the guidelines:
Now that you're asking about [prescribing] outside of the clinical guidelines, I am sitting here thinking, I can't think of any [guidelines]. In fact, I will say that I am probably not aware of all of the clinical guidelines or changes in them in recent years (28, attending).
| Category | Case Vignette | Illustrative Quotation |
|---|---|---|
| ||
| 1. Lack of awareness of specific guideline recommendations | SSTI | 1. [Treating for] methicillin susceptible [Staphylococcus aureus] without MRSA? Oh, oh, wow.[and] not doing any gram‐negative coverage? I guess I am most discomfortable with that, but if that's the guideline [recommendation], yes, I will probably start following it (8, attending). |
| ASB | 2. I still think that he has a UTI, even though he doesn't necessarily have symptoms, because he was catheterized for so long. I also know after you reach a certain age, we generally treat you even though you don't necessarily have symptoms just because of all the risks associated with having bacteria in your urine (29, resident). | |
| 2. Tension between adhering to guidelines and individualizing patient care | SSTI | 3. If he had a known history of MRSA, if he had something else likea temporary dialysis lineor prosthetic joint or something else that if he were to get bacteremic with MRSA, it would cause him more operations and significant morbidity. [In that case], I might add vancomycin to his regimen from the beginning (12, resident). |
| HAP | 4. He has only 1 lung because he had part of his lung taken out. So, anyway, part of a lung taken out, and he's got a new infiltrate on his x‐ray, and he's got all the risk factors for pneumonia, so I would say generally I would leave him on antibiotics, but cut down (5, attending). | |
| 5. I would be concerned, especially since the patient was febrile. He did have a new infiltrate, and he seemed to have gotten better on antibiotics. I would definitely take it [the guideline recommendation] into consideration, but I would probably go ahead and give a course of oral antibiotics (6, attending). | ||
| ASB | 6. I would say this is a UTI. I'm sure the guidelines are going to say no, but since he was having retention and it wasn't a urine [culture] obtained from him having a Foley, I have less comfort calling it colonization. I would say that it is probably an infection. You don't see a lot of fevers in just a bladder infection (25, attending). | |
| 3. Skepticism of guideline recommendations | SSTI | 7. My big concern is methicillin‐resistant S aureus [MRSA]. I think personally I have some concern about not covering for MRSA (17, attending). |
| HAP | 8. Those are the guidelines, so I mean it is agreeable if there are studies that back it up. It is not something I feel that great about, but I could trial them off antibiotics and see how they do (14, resident). | |
| 9. I guess I would have to look more at the studies that led to the recommendations. I don't know that I would stop antibiotics completely because of how sick he was (29, resident). | ||
| ASB | 10. They [the guidelines] are tough to swallow, but we follow them because that is what the evidence shows. A lot of people would be very, very tempted to treat this (19, attending). | |
| 11. A guy has a catheter in for a month and has a ton of white cells in his urine and is growing something that is clearly pathogenic: he needs treatment. I do not care what the guidelines say (7, attending). | ||
Tension Between Adhering to Guidelines and Individualizing Patient Care
Although participants agreed with guidelines in principle, they had difficulty applying specific guideline recommendations to an individual patient's care. Many participants acknowledged modifying these recommendations to better suit the needs of a specific patient:
So guidelines are guidelines, but at the end of the day, it still comes down to individualizing patient care, and so sometimes those guidelines do not cover all the bases, and you still need to do what you think is best for the patient (10, attending).
The guidelines are not examining the patient, and I am examining the patient. So I will do what the guidelines say unless I feel that that patient needs more care (11, resident).
Fine, the study says something, but your objective evidence about what happened [is different]. He had this fever, he had these radiologic changes that are suggestive of pneumonia, you start antibiotics, he gets better, so that clinical scenario suggests an infection that is getting better (15, resident).
[I would treat outside of guidelines] when we are treating severe sepsis in somebody with advanced liver disease. Most of the clinical research programsexclude patients with advanced liver disease if they have risks for certain types of infections that are unusual (16, attending).
If it's a patient who is intubated and sick, they can't complain [about urinary symptoms], so the asymptomatic part of that goes out the window. For critically ill patients on ventilators that have bacteriuria, particularly if it's an ESBL [extended‐spectrum ‐lactamase], which is a bad bacteria, not wanting the patient to get sicker and not knowing if they are having symptoms of pain or both, I might consider treating in that kind of situation, even though they are afebrile and no [elevated] white count (20, attending).
Skepticism of Guideline Recommendations
A third barrier to guideline adherence was physicians' skepticism of what the guidelines recommend in certain cases. This skepticism stemmed, in part, from guidelines promoting a standardized, one size fits all approach even in situations when participants were more comfortable using their own judgment:
To me, the guidelines are adding a little bit more of a stress, because the guidelines are good for the more obvious things; they're more black and white, this than that. But clinical medicine is never like that. There is always something that makes it really gray, and some of it has to do with things that you're seeing because you're there with the patient that doesn't quite fit (25, attending).
Overall, guidelines are easy to follow when they have what to do as opposed to what not to do. We are trained to do something and fix something, so to not do anything is probably the hardest guideline to follow (11, resident).
It is just scary that he is growing such a bad bug and with a bad microbe, I would be worried about it progressing (11, resident).
Another acknowledged she would have difficulty stopping all antibiotics after only 3 days of therapy:
It would make me a little nervous following them [the guidelines]. I think I would finish the course because he had a fever, and we started him on antibiotics and he got better. I still feel clinically that he could have had pneumonia (25, attending).
DISCUSSION
In this study, we used case vignettes to identify barriers to following IDSA guidelines. Case vignettes require few resources and provide a common starting point for assessing physician decision making. Prior studies have used case vignettes to measure the quality of physicians' practice, including antibiotic prescribing.[17, 18, 19, 20, 21] Case vignettes have been used to assess antibiotic prescribing in the neonatal ICU and medical students' knowledge of upper respiratory tract infections.[21, 32] In 1 study, physicians who scored poorly on a series of case vignettes more frequently prescribed antibiotics inappropriately in actual practice.[17]
Using case vignettes, we identified 3 barriers to following IDSA guidelines on SSTI, HAP, and ASB: (1) lack of awareness of specific guideline recommendations, (2) tension between adhering to guidelines and the desire to individualize patient care, and (3) skepticism of certain guideline recommendations. These barriers were distributed unevenly across participants, highlighting the heterogeneity that exists even within a subgroup of hospital medicine physicians.
We identified lack of familiarity with guideline recommendations as a barrier in our sample of physicians. Interestingly, participants initially expressed agreement with guidelines, but when presented with case vignettes and asked for their own treatment recommendations, it became clear that their familiarity with guidelines was superficial. The disconnect between self‐reported practice and actual adherence has also been described in a separate study on healthcare‐associated pneumonia.[33] In all likelihood, participants genuinely believed that they were practicing guideline‐concordant care, but without a formal process for audit and feedback, their lack of adherence had never been raised as an issue.
A second barrier to guideline‐concordant care was the tension between individualizing patient care and adhering to standardized recommendations. On one hand, this tension is unavoidable and is inherent in the practice of medicine. However, participants' responses to our case vignettes suggested that they find their patients too different to fit into any standardized guideline. This tension was also discussed by Charani et al., who interviewed 39 healthcare professionals at 4 hospitals in the United Kingdom. These investigators found that physicians routinely consider their patients to be outside the recommendations of local evidence‐based policies.[34] Instead of referring to guidelines, physicians rely on their knowledge and clinical experience to guide their antibiotic prescribing.
The final barrier to guideline adherence that we identified was providers' skepticism of what the guidelines were recommending. Although physician discomfort with certain guideline recommendations may be alleviated by reviewing the literature informing the recommendation, education alone is often insufficient to change antibiotic prescribing practices.[35] Furthermore, part of this skepticism may reflect the lack of data from randomized controlled trials to support every guideline recommendation. For example, most guideline recommendations are based on low‐quality evidence.[36] The guideline recommendations presented in this study were based on moderate‐ to high‐quality evidence.[24, 25, 26]
To our knowledge, this study is 1 of the few to describe barriers to guideline‐concordant antibiotic use among inpatient medicine physicians in the United States. The barriers discussed above have also been described by investigators in Europe who studied antibiotic use among inpatient physicians.[34, 37, 38] These commonalities highlight the shared challenges faced by local initiatives to improve antibiotic prescribing.
Our findings suggest that the 2 hospitals we studied need more active interventions to improve antibiotic prescribing. One attractive idea is involving hospitalist physicians in future improvement efforts. Hospitalists are well positioned for this role; they care for a large proportion of hospital patients, they frequently prescribe antibiotics, andas a professionthey are committed to the efficient use of healthcare resources. Hospitalists could assist in the dissemination of local guidelines, the implementation of reliable processes to prompt antibiotic de‐escalation, and the development of local standards for documenting the indication for antibiotics and the planned duration of therapy.[39]
One limitation of this study was that we did not validate whether a physician's self‐reported response to the case vignettes correlated with his or her actual practice. Interviews were conducted by a nonphysician and kept confidential, but participants may nonetheless have been inclined to give socially desirable responses. However, this is less likely because participants readily admitted to not knowing and often not following guidelines. In addition, our case vignettes presented simplistic, hypothetical situations and were therefore less able to account for all determinants of antibiotic‐prescribing decisions. Prior research has shown that antibiotic‐prescribing decisions are influenced by a multitude of factors, including social norms and the physician's underlying beliefs and emotions.[34, 40] Antibiotic‐prescribing decisions can also be influenced by audit and feedback processes.[35] Thus, we acknowledge that our findings may have been different if this study was conducted exclusively at hospitals without an antimicrobial stewardship program.
In conclusion, case vignettes may be a useful tool to assess physician knowledge and acceptance of antibiotic‐prescribing guidelines on a local level. This study used case vignettes to identify key barriers to guideline‐concordant antibiotic use. Developing local interventions to target each of these barriers will be the next step in improving antibiotic prescribing.
Disclosure: This project was supported by a Project Development Team within the ICTSI NIH/NCRR grant number UL1TR001108. The authors report no conflicts of interest.
- , , , , . Variation in adherence with Global Initiative for Chronic Obstructive Lung Disease (GOLD) drug therapy guidelines: a retrospective actuarial claims data analysis. Curr Med Res Opin. 2011;27:1425–1429.
- , , , , . Guideline adherence in management of stable chronic obstructive pulmonary disease. Respir Med. 2013;107:1046–1052.
- , , , et al. Guideline‐concordant management of opioid therapy among human immunodeficiency virus (HIV)‐infected and uninfected veterans. J Pain. 2014;15:1130–1140.
- , , , et al. Primary care clinician adherence to guidelines for the management of chronic musculoskeletal pain: results from the study of the effectiveness of a collaborative approach to pain. Pain Med. 2011;12:1490–1501.
- , , , , . Receiving guideline‐concordant pharmacotherapy for major depression: impact on ambulatory and inpatient health service use. Can J Psychiatry. 2007;52:191–200.
- , , , , , . Guideline‐concordant antidepressant use among patients with major depressive disorder. Gen Hosp Psychiatry. 2010;32:360–367.
- , . Antibiotic prescribing to adults with sore throat in the United States, 1997–2010. JAMA Intern Med. 2014;174:138–140.
- , , , . National trends in visit rates and antibiotic prescribing for adults with acute sinusitis. Arch Intern Med. 2012;172:1513–1514.
- , , . Geographic variation in outpatient antibiotic prescribing among older adults. Arch Intern Med. 2012;172:1465–1471.
- , , , et al. Decreased antibiotic utilization after implementation of a guideline for inpatient cellulitis and cutaneous abscess. Arch Intern Med. 2011;171:1072–1079.
- , , , , , . Skin and soft‐tissue infections requiring hospitalization at an academic medical center: opportunities for antimicrobial stewardship. Clin Infect Dis. 2010;51:895–903.
- , , , , , . Inappropriate treatment of catheter‐associated asymptomatic bacteriuria in a tertiary care hospital. Clin Infect Dis. 2009;48:1182–1188.
- . Asymptomatic bacteriuria: when the treatment is worse than the disease. Nat Rev Urol. 2012;9:85–93.
- , , , et al. Improving outcomes in elderly patients with community‐acquired pneumonia by adhering to national guidelines: Community‐Acquired Pneumonia Organization International cohort study results. Arch Intern Med. 2009;169:1515–1524.
- , , , et al. Effectiveness of an Antimicrobial Stewardship Approach for Urinary Catheter‐Associated Asymptomatic Bacteriuria. JAMA Intern Med. 2015;175:1120–1127.
- , , , , . Effect of antibiotic prescribing in primary care on antimicrobial resistance in individual patients: systematic review and meta‐analysis. BMJ. 2010;340:c2096.
- , , , et al. Do case vignettes accurately reflect antibiotic prescription? Infect Control Hosp Epidemiol. 2011;32:1003–1009.
- , , , et al. Antibiotic use: knowledge and perceptions in two university hospitals. J Antimicrob Chemother. 2011;66:936–940.
- , , , , . Comparison of vignettes, standardized patients, and chart abstraction: a prospective validation study of 3 methods for measuring quality. JAMA. 2000;283:1715–1722.
- , , , et al. Measuring the quality of physician practice by using clinical vignettes: a prospective validation study. Ann Intern Med. 2004;141:771–780.
- , , , et al. Clinical vignettes provide an understanding of antibiotic prescribing practices in neonatal intensive care units. Infect Control Hosp Epidemiol. 2011;32:597–602.
- . Sampling in qualitative inquiry. In: Crabtree BF, Miller WL, eds. Doing Qualitative Research. Thousand Oaks, CA: Sage; 1999:33–45.
- , , , , . Factors influencing antibiotic‐prescribing decisions among inpatient physicians: a qualitative investigation. Infect Control Hosp Epidemiol. 2015;36(9):1065–1072.
- , , , et al. Practice guidelines for the diagnosis and management of skin and soft tissue infections: 2014 update by the Infectious Diseases Society of America. Clin Infect Dis. 2014;59:e10–e52.
- American Thoracic Society and the Infectious Disease Society of North America. The new American Thoracic Society/Infectious Disease Society of North America guidelines for the management of hospital‐acquired, ventilator‐associated and healthcare‐associated pneumonia: a current view and new complementary information. Curr Opin Crit Care. 2006;12:444–445.
- , , , et al. Infectious Diseases Society of America guidelines for the diagnosis and treatment of asymptomatic bacteriuria in adults. Clin Infect Dis. 2005;40:643–654.
- , . The dance of interpretation. In: Crabtree BF, Miller WL, eds. Doing Qualitative Research. Thousand Oaks, CA: Sage; 1999:127–143.
- , . Qualitative Data Analysis. Thousand Oaks, CA: Sage; 1994.
- . Research Methods in Anthropology: Qualitative and Quantitative Approaches. Walnut Creek, CA: AltaMira; 2002.
- . Constructing Grounded Theory: A Practical Guide Through Qualitative Analysis. Thousand Oaks, CA: Sage; 2006.
- , . The Discovery of Grounded Theory: Strategies for Qualitative Research. Hawthorne, NY: Aldine de Gruyter; 1967.
- , , . Knowledge of the principles of judicious antibiotic use for upper respiratory infections: a survey of senior medical students. South Med J. 2005;98:889–895.
- , , , et al. The HCAP gap: differences between self‐reported practice patterns and published guidelines for health care‐associated pneumonia. Clin Infect Dis. 2009;49:1868–1874.
- , , , et al. Understanding the determinants of antimicrobial prescribing within hospitals: the role of “prescribing etiquette”. Clin Infect Dis. 2013;57:188–196.
- , , , et al. Infectious Diseases Society of America and the Society for Healthcare Epidemiology of America guidelines for developing an institutional program to enhance antimicrobial stewardship. Clin Infect Dis. 2007;44:159–177.
- , , , , . Quality and strength of evidence of the Infectious Diseases Society of America clinical practice guidelines. Clin Infect Dis. 2010;51:1147–1156.
- , , , , . Opposing expectations and suboptimal use of a local antibiotic hospital guideline: a qualitative study. J Antimicrob Chemother. 2008;62:189–195.
- , , , , , . Barriers to optimal antibiotic use for community‐acquired pneumonia at hospitals: a qualitative study. Qual Saf Health Care. 2007;16:143–149.
- , , . Role of the hospitalist in antimicrobial stewardship: a review of work completed and description of a multisite collaborative. Clin Ther. 2013;35:751–757.
- , , , et al. Behavior change strategies to influence antimicrobial prescribing in acute care: a systematic review. Clin Infect Dis. 2011;53:651–662.
© 2015 Society of Hospital Medicine
Pharmacist Impact on Transitional Care
Hospital readmissions have a significant impact on the healthcare system. Medicare data suggest a 19% all‐cause 30‐day readmission rate, of which 47% may be preventable.[1, 2] The Centers for Medicare & Medicaid Services continue to expand their criteria of disease states that will be penalized for readmissions, now reducing hospital reimbursement rates up to 3%. Pharmacists, by optimizing patient utilization of medications, can play a valuable role in contributing to preventing readmissions.[3]
Lack of acceptable transitional care is a serious problem that is consistently identified in the literature.[4] Transitional care involves 3 domains of transfer: information, education, and destination. A breakdown in any of these components can negatively impact patients and their caregivers.
Prior studies consistently demonstrated a high likelihood of adverse drug events (ADEs) and patients' lack of knowledge regarding medications postdischarge, both of which can lead to readmission. Forster and colleagues found that 19% to 23% of patients experienced an ADE within 5 weeks of discharge from an inpatient visit, 66% to 72% of which were drug related, and approximately one‐third were deemed preventable.[5, 6] One survey found that less than 60% of patients knew the indication for a new medication prescribed at discharge, whereas only 12% reported knowledge of an anticipated ADE.[7]
Pharmacists can play a large role in the information and education aspect of transitional care. Previous studies demonstrate that pharmacist involvement in the discharge process can reduce the incidence of ADEs and have a positive impact on patient satisfaction. There are conflicting data regarding the effect of comprehensive medication education and follow‐up calls by pharmacy team members on ADEs and medication errors (MEs).[3, 8, 9] Although overall pharmacist participation has shown positive patient‐related outcomes, the impact of pharmacists' involvement on readmissions has not been consistently demonstrated.[10, 11, 12, 13, 14]
Our study evaluated the impact of the pharmacy team in the transitions‐of‐care settings in a unique combination utilizing the pharmacist during medication reconciliation, discharge, and with 3 follow‐up phone call interactions postdischarge. Our study was designed to evaluate the impact of intensive pharmacist involvement during the acute care admission as well as for a 30‐day time period postdischarge on both ADEs and readmissions.
METHODS
All patients were admitted to hospitalist‐based internal medicine units at Northwestern Memorial Hospital, an 894‐bed academic medical center located in Chicago, Illinois. Patients were randomized by study investigators using a random number generator to either the usual care or intervention arms and then evaluated each day for eligibility to participate in the study. Patients remained blinded throughout the study. Patients met inclusion criteria if they were discharged to home and either discharged on greater than 3 scheduled prescription medications or discharged with at least 1 high‐risk medication. High‐risk medications were classified as anticoagulants, antiplatelets (eg, aspirin and clopidogrel), hypoglycemic agents (eg, insulin), immunosuppressants, or anti‐infectives. Patients also needed to participate in a minimum of 1 postdischarge phone call or experience an emergency department (ED) visit or readmission within 30 days of discharge to meet inclusion criteria. Exclusion criteria included: impaired cognition based on Mini‐Cog screening assessment scale, unable or unwilling to provide informed consent, lack of a personal phone number, nonEnglish speaking, subsequent elective readmission within 30 days of initial visit, more than 3 previous hospital admissions in the past 2 months, palliative care or home/skilled nursing hospice, anticipated length of survival less than 3 months, discharged within 24 hours of admission, discharged against medical advice, or discharged before medication education was conducted (Figure 1). Patients who met inclusion criteria provided informed consent, received a Mini‐Cog screening assessment, and were given the Rapid Estimate of Adult Literacy in Medicine revised (REALM‐R) assessment to evaluate health literacy. The REALM‐R is a word recognition test designed to identify patients at risk for poor health literacy skills. Patients with REALM‐R scores of 6 or less are considered to have low health literacy.[15] Patients were randomized to receive either the usual care or pharmacist‐directed medication evaluation and management as described in Table 1. Patients included in the study were contacted by phone postdischarge, with 3 attempts on consecutive days. Patients who were readmitted as an inpatient or had an ED visit were not contacted for the study after that point.
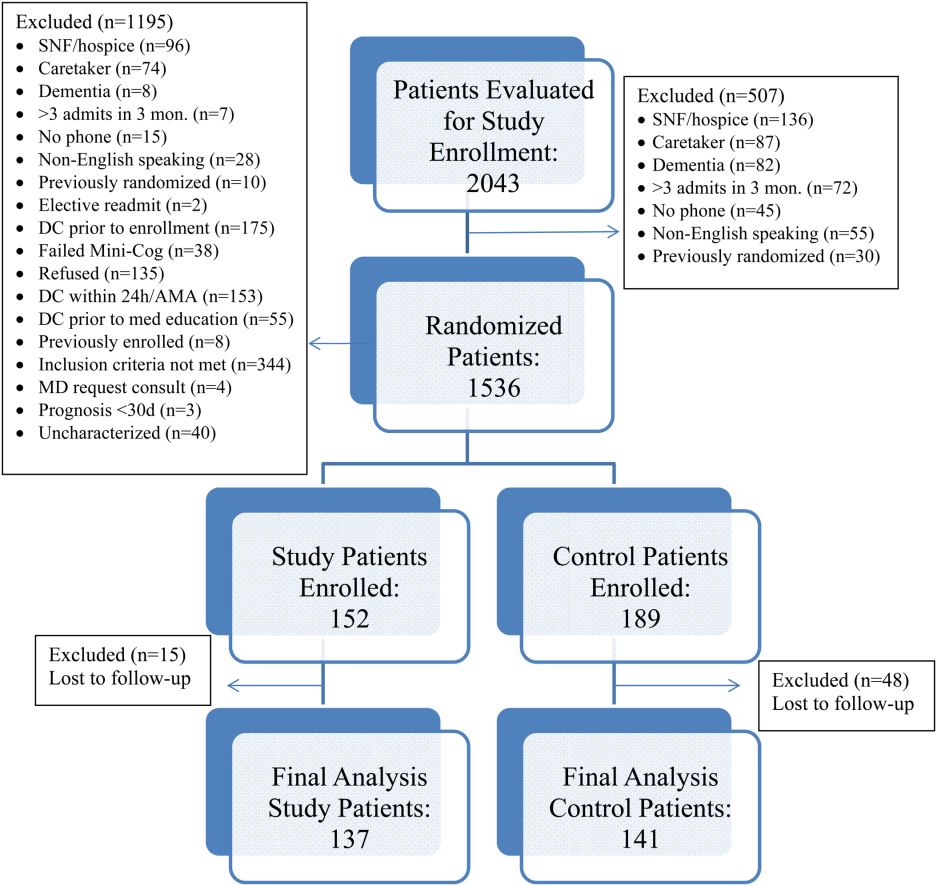
| Admission Medication Reconciliation | Hospitalist (Confirmation by Pharmacist Reviewing the History and Physical Note in Electronic Medical Record) | Performed by Pharmacy Team Member Face to Face |
|---|---|---|
| ||
| Discharge medication reconciliation | Hospitalist | Pharmacy team member |
| Discharge medication education | Hospitalist and/or nurse | Pharmacy team member |
| Individualized medication plan | No | Yes |
| Postdischarge callback day 3 | No | Yes |
| Postdischarge callback day 14 | No | Yes |
| Postdischarge callback day 30 | Yes | Yes |
| Postdischarge call assessment topic(s) | ADEs/MEs, ED visits, inpatient readmissions | ADEs/MEs, ED visits, inpatient readmissions clarify pharmacy/discharge plan, resolve medication‐related issues, identify/overcome adherence barriers |
Patients enrolled in the control group received the usual standard of care by a clinical pharmacist. This included a medication reconciliation completed from the admitting physician's patient history and physical and medication counseling provided by the physician or nursing staff at discharge. Patients were not interviewed face‐to‐face on admission and did not receive discharge counseling by a pharmacy team member. Patients were assessed daily by the pharmacist for evaluation of the pharmacotherapy plans and presence of MEs or safety‐related concerns. The control group received 1 postdischarge phone call from a pharmacist at day 30 to assess for study endpoints of ADEs, MEs, ED visit, and readmission only. The endpoints of ADEs and MEs were determined by professional judgment by the clinical pharmacist based on an algorithm similar to National Coordinating Council for Medication Error Reporting and Prevention, although a specific tool was not utilized.
The study group received face‐to‐face medication reconciliation on admission by a pharmacist or a pharmacy student. Prior to discharge, a personalized medication plan was created by the pharmacist and discussed with the physician. Medication discrepancies were addressed prior to the discharge instructions being given and discussed with the patient. Medication counseling was performed at discharge by the pharmacist or pharmacy student. Patients received 3 phone calls at 3, 14, and 30 days postdischarge. The presence of ADEs and MEs were evaluated during each phone call. The patients were asked to confirm their medication regimens including drug, indication, dose, route, and frequency. They were also asked questions regarding possible side effects, new symptoms, and any changes to their current therapy. The calls focused on clarifying the pharmacy discharge plan, resolving any unanswered questions or medication‐related issues, identifying and overcoming any barriers to adherence, and assistance with providing patients access to medications by contacting pharmacies and physicians to resolve and troubleshoot further prescription claims and clarifications. Pharmacists performed all postdischarge phone calls. Pharmacy students were able to provide face‐to‐face medication reconciliation upon admission and discharge counseling under the supervision of the pharmacist for the intervention arm.
The patient Hospital Consumer Assessment of Healthcare Providers and Systems (HCAHPS) responses to the medication domain question, Did you clearly understand the purpose for taking each of your medications at the time of discharge? were collected for the 2 designated hospitalist units for both the control and study groups. HCAHPS scores were collected at the 6 months point prior to the study initiation and throughout the 6‐month study period for the control and intervention groups. A physician and 2 pharmacists, who were blinded to the study randomization and results, assessed all Northwestern Memorial Hospital readmissions to determine if the readmissions were medication‐related or not.
This study obtained institutional review board approval from Northwestern University.
Data Collected
Data collected from all patients included demographics (age, sex), payer, reason for admission, number of medications at time of discharge, Charlson Comorbidity Index score, number of high‐risk medications prescribed at time of discharge, length of stay, REALM‐R score, ADEs, inpatient readmission or ED visit, and the reason for readmission or ED visit. Only the first occurrence was counted for patients with both an ED visit and an inpatient readmission. It was estimated that a sample size of 150 patients in each group would provide 80% power to demonstrate a 20% improvement in ADE rates in the study group. Data were analyzed utilizing Fischer exact, 2, and Student t tests, and multivariate logistic regression as appropriate. Analyses were performed using SAS version 9.4 (SAS Institute, Inc., Cary, NC).
RESULTS
Over the course of 7 months, 341 patients were enrolled in the study, 189 in the control arm and 152 in the study arm. Forty‐eight patients in the control group and 15 patients in the study group were lost to follow‐up. The final analysis included 278 patients, 141 in the control group and 137 in the study group. Patients were eligible for study inclusion if they received at least 1 phone call, which resulted in more patients being lost to follow‐up in the control arm due to fewer total phone call attempts. Demographic and disposition data for the control and study groups are shown in Table 2. Baseline characteristics between the 2 groups were similar with the exception of total medications at time of discharge. The control group had more total medications at discharge compared to the study group (7.2 vs 6.4, P=0.04). The number of high‐risk medications and the number of scheduled medications were similar between both groups. During medication reconciliation, 380 discrepancies (46.2%) were found in the study group compared to 205 (19.9%) in the control group (P<0.0001). The higher number of identified discrepancies in the study group was expected due to the fact that the pharmacist did not complete a face‐to‐face medication history in the control patients. The average length of stay, REALM‐R scores, and reason for admissions were similar between the 2 groups (Table 2).
| Study, N=137 | Control, N=141 | P Value | |
|---|---|---|---|
| |||
| Sex, male | 52 (37.95%) | 59 (41.8%) | 0.54 |
| Average age, y | 55.4 | 55.8 | 0.87 |
| Average length of stay, d | 5.4 (range, 1104) | 4.6 (range, 028) | 0.67 |
| Average REALM‐R score (range, 08) | 6.8 | 6.7 | 0.67 |
| Average total no. of medications | 6.4 | 7.2 | 0.04 |
| Average no. of scheduled medications | 5.7 | 6.2 | 0.15 |
| Average no. of high‐risk category medications | 2.2 | 2.3 | 0.64 |
| Reason for admission | |||
| Cardiovascular disease | 5 (3.4%) | 15 (8.3%) | 0.035 |
| Pneumonia | 11 (7.5%) | 8 (4.4%) | 0.48 |
| Respiratory | 11 (7.5%) | 9 (5%) | 0.65 |
| Infectious disease | 39 (26.5%) | 53 (29.3%) | 0.13 |
| Gastrointestinal | 25 (17%) | 28 (15.5%) | 0.13 |
| Endocrine | 20 (13.6%) | 34 (18.8%) | 0.76 |
| Genitourinary | 0 (0%) | 0 (0%) | 0.05 |
| Hematological | 19 (12.9%) | 20 (11%) | 1 |
| Injury | 10 (6.8%) | 14 (7.7%) | 1 |
| Neurological | 2 (1.4%) | 0 (0%) | 0.52 |
| Heart failure | 4 (2.7%) | 0 (0%) | 0.24 |
| Myocardial infarction | 0 (0%) | 0 (0%) | 0.58 |
| Mental/substance abuse | 1 (0.7%) | 0 (0%) | 1 |
A total of 55 patients (39%) in the control arm were readmitted to an inpatient hospital or had an ED visit within 30‐days postdischarge compared to 34 patients (24.8%) in the study group (P=0.001) (Table 3). Of the patients readmitted to the ED, 21 were enrolled in the control arm (14.8%) compared to only 6 patients in the study arm (4.4%) (P=0.005). Reviewers concluded that 24% of the control group readmissions were medication‐related versus 23% of the study group (P=1.0). In total, 78 out of 89 readmissions were to Northwestern Memorial Hospital. Medication‐related causes to outside institutions were not evaluated. The causes for all readmissions were not evaluated.
| Study Group, n=137 | Control Group, n=141 | P Value | |
|---|---|---|---|
| |||
| Composite inpatient readmission and ED visit | 34 (24.8%) | 55 (38.7%) | 0.001 |
| ED visits | 6 (4.4%) | 21 (14.8%) | 0.005 |
| Inpatient readmissions | 28 (20.4%) | 34 (23.9%) | 0.43 |
| Medication‐related readmissions | 8 (23.5%) | 13 (23.6%) | 1.0 |
| ADEs/MEs reported at 30‐day phone call | 11/84 patients | 18/86 patients | 0.22 |
| Days to readmission/ED visit | 7.9 (SD 12.5) | 13.2 (SD 9.61) | 0.03 |
| Preintervention: HCAHPS scores pertaining to knowledge of indication of medication question preintervention | 47% | ||
| Postintervention: HCAHPS scores pertaining to knowledge of indication of medication question postintervention | 56% | ||
A sensitivity analysis was undertaken to understand the impact of the lost to follow‐up rate in both the control and study groups. Undertaking an assumption that all 15 patients lost to follow‐up in the study group were readmitted and that 15 of 48 patients lost to follow‐up in the control group were readmitted, the intervention continued to show a significant benefit in reduction of composite ED and inpatient readmissions (35.7% study group vs 49.6% control group, P=0.022)
Multivariate logistic regression analysis that controlled for Charlson Comorbidity Index score, length of stay, total number of medications on discharge, and payer type showed an adjusted odds ratio of 0.55 (95% confidence interval [CI]: 0.32‐0.94) in the intervention cohort compared to controls for the combined endpoint of readmission and ED visit within 30‐days postdischarge. The adjusted odds ratio for 30‐day readmission alone was 0.88 (95% CI: 0.49‐1.61).
Eighteen of the 86 control patients who received a 30‐day postdischarge phone call experienced an ADE or ME compared to 11 of the 83 study patients (P=0.22). Patient satisfaction scores of both designated units as represented by the HCAHPS score in the medication knowledge domain increased from the prestudy period. Patients selected agree or strongly agree only 47% of the time at the 6‐month prestudy point compared to 56% of the time during the 6‐month study period.
DISCUSSION
Although previous studies show conflicting results regarding the impact of pharmacist interventions on readmissions, our study demonstrated a decrease in the composite measure of inpatient readmissions and ED visits. Its success stresses the need for a comprehensive approach that contains continuity of care by healthcare providers to reconcile and manage medications throughout the hospital stay, extending up to a full month postdischarge with multiple phone calls. This included (1) face‐to‐face medication reconciliation on admission, (2) development of a personalized medication plan discussed with the patient's physician, (3) addressing any medication discrepancies to the discharge instructions being given to the patient, (4) medication counseling performed at discharge, and (5) 3 postdischarge phone calls at 3, 14, and 30 days.
A study conducted in 2001 analyzed the Medicare Current Beneficiary Survey (MCBS) and found that living alone, having limited education, and lack of self‐management skills have significant associations with early readmission.[16] Approximately 80 million Americans have limited health literacy and are associated with poor health outcomes and healthcare utilization as seen in a review completed by Berkman and colleagues.[17] Because no difference was found between both groups, it would suggest health literacy did not influence or bias the study group. Additionally, no statistically different medication issues, such as total number of medications or rates of ADEs and MEs, were identified in the patients of this study. This may be explained by the small, final population size at the 30‐day period or that the impact of the pharmacist intervention did not reach the threshold that this study was powered to detect. Also, a lack of statistical significance may be due to the subjective nature of ADEs/MEs and the prevention of ADEs/MEs throughout all patients' hospitalizations from the clinical pharmacist's involvement in care, which was not collected. Although a combined endpoint collecting readmission to either the ED or rehospitalization was lower in the intervention cohort, the isolated rehospitalization endpoint was not significantly different between the 2 groups. ED utilization was markedly decreased, but we may have lacked the power to show a statistically significant decrease in rehospitalization. These results mirror those of the Project RED (Re‐Engineered Discharge) intervention.[17]
HCAHPS surveys are sent to only a small percent of randomly selected patients who are discharged from the hospital. Thus, respondents may or may not have been included in the study, indicating a possible greater impact of the intervention on individual patients than collected. Importantly, the described interventions appeared to improve patients' perception of understanding the purpose of their medications. We found that HCAHPS scores across the 2 units improved, though the intervention only impacted 16.8% of all patients discharged from these units due to the nature of the survey distribution.
The pharmacists' abilities to educate all eligible patients prior to discharge from 7:30 am to 4:00 pm each day of the week was a limitation of this study, as some patients were discharged outside of the duty hours. This may have allowed for a differential exclusion and could have led to selection bias. Another limitation is that a large number of patients were lost to follow‐up in the control group, likely because the first postdischarge contact with patients was not until the day 30 phone calls. The extensive exclusion criteria caused many patients not to be enrolled. Though the intervention arm received postdischarge phone calls at days 3 and 14, only postdischarge call‐backs at day 30 of the intervention arm were compared to the control arm, which could have led to bias in the 30‐day analysis of the intervention arm, as patients may have not reported previous issues that were resolved in earlier phone calls. Medication‐related readmissions were not statistically different between the groups, which could suggest that the difference in readmissions were not solely due to the intervention, and a decrease in healthcare utilization may be due to chance. The subjective nature of how ADEs and MEs were collected also serves as a limitation, as they were only screened for presence or absence and not classified by severity or category. This study was at a single‐center academic institution, which may limit the ability to apply the results to other institutions. Last, outcome assessments relied on participant report, including ADE and ME occurrence and presentation at outside hospitals. Future study evaluation conducted as a multicenter design while continuing to strengthen the continuity of the healthcare provider and patient relationship at each intervention would be ideal. Also, having an objective measure of ADEs and MEs with severity categorization would be beneficial.
Compared to previous literature, our study design was unique in the number of phone calls made to patients postdischarge and its prospective, randomized design. In the previously mentioned study by Walker et al., phone calls were made only at days 3 and 30.[13] Although the majority of readmissions occurred within the first 14 days of discharge, additional visits to the ED and readmissions may have been avoided by contacting patients twice within the critical 14‐day period. Another distinction of this study design was the expansion of a rather limited and peripheral pharmacist role in transitions of care to a much more integrated participation. We believe the relationship developed between patients and their pharmacy care team provided coordination and the continuity of communication regarding their care. Additionally, our study was unique through the use of pharmacy extenders via fourth‐year pharmacy students who were completing their advanced pharmacy practice rotations. Pharmacy extenders can also be certified and trained pharmacy technicians, which many hospitals utilize to perform medication reconciliations at a lower cost than pharmacists. As hospitals face increased demands to shrink budgets due to decreasing reimbursements, healthcare systems will be forced to find creative new ways to use existing resources.
In conclusion, transition of care is a high‐risk situation for many patients. A comprehensive approach by healthcare providers, including pharmacists and pharmacy extenders, may have a positive impact in reducing or preventing ADEs/MEs, inpatient admissions, and ED visits. Although our study focused directly on the impact of a pharmacy care team on transitions‐of‐care, we cannot conclude this applies strictly to pharmacists. Across the nation, the role of various disciplines of healthcare providers in admission, hospitalization, discharge, and postdischarge is not standardized and varies significantly by institution. Importantly, no mechanism currently exists to directly reimburse for such efforts, but demonstration of cost effectiveness through reduced posthospital utilization may justify this investment for accountable care organizations.[18]
- , , , , , . Medicare readmission rates show meaningful decline in 2012. Medicare Medicaid Res Rev. 2013;3(2):E1‐E11.
- , , , et al. Factors contributing to all‐cause 30‐day readmissions: a structured case series across 18 hospitals. Med Care. 2012:50(7):599–605.
- , , , et al. Role of pharmacist counseling in preventing adverse events after hospitalization. Arch Intern Med. 2006;66:565–571.
- , , . Optimizing transitions of care to reduce rehospitalizations. Cleve Clin J Med. 2014;81(5):1–9.
- , , , , . The incidence and severity of adverse events affecting patients following discharge from the hospital. Ann Intern Med. 2003;138:161–167.
- , . Adverse drug events occurring following hospital discharge. J Gen Intern Med. 2005;20:317–323.
- . What do discharged patients know about their medications? Patient Educ Couns. 2005;56:276–282.
- , , , . The impact of telephone calls to patients after hospitalization. Dis Mon. 2002;48:239–248.
- , , , et al. Effect of a pharmacist intervention on clinically important medication errors after hospital discharge: a randomized trial. Ann Intern Med. 2012;157:1–10.
- , , , et al. A reengineered hospital discharge program to decrease rehospitalization: a randomized trial. Ann Intern Med. 2009;150(3):178–187.
- , , , , . The value of inpatient pharmaceutical counselling to elderly patients prior to discharge. Br J Clin Pharmacol. 2002;54:657–664.
- , , , . Postdischarge pharmacist medication reconciliation: impact on readmission rates and financial savings. J Am Pharm Assoc (2003). 2013;53(1):78–84.
- , , , et al. Impact of pharmacist‐facilitated hospital discharge program. Arch Intern Med. 2009;169:2003–2010.
- , , , et al. Does pharmacist‐led medication review help to reduce hospital admissions and deaths in older people? A systematic review and meta‐analysis. Br J Clin Pharmacol. 2008;65(3):303–316.
- . The meaning and the measure of health literacy. J Gen Intern Med. 2006;21(8):878–883.
- , , , , , . Postdischarge environmental and socioeconomic factors and the likelihood of early hospital readmission among community‐dwelling Medicare beneficiaries. Gerontologist. 2008;48(4):495–504.
- , , , , . Low health literacy and health outcomes: an updated systematic review. Ann Intern Med. 2011;155(2):97–107.
- , , , et al. Fostering accountable health care: moving forward in Medicare. Health Affairs. 2009;28(2):219–231.
Hospital readmissions have a significant impact on the healthcare system. Medicare data suggest a 19% all‐cause 30‐day readmission rate, of which 47% may be preventable.[1, 2] The Centers for Medicare & Medicaid Services continue to expand their criteria of disease states that will be penalized for readmissions, now reducing hospital reimbursement rates up to 3%. Pharmacists, by optimizing patient utilization of medications, can play a valuable role in contributing to preventing readmissions.[3]
Lack of acceptable transitional care is a serious problem that is consistently identified in the literature.[4] Transitional care involves 3 domains of transfer: information, education, and destination. A breakdown in any of these components can negatively impact patients and their caregivers.
Prior studies consistently demonstrated a high likelihood of adverse drug events (ADEs) and patients' lack of knowledge regarding medications postdischarge, both of which can lead to readmission. Forster and colleagues found that 19% to 23% of patients experienced an ADE within 5 weeks of discharge from an inpatient visit, 66% to 72% of which were drug related, and approximately one‐third were deemed preventable.[5, 6] One survey found that less than 60% of patients knew the indication for a new medication prescribed at discharge, whereas only 12% reported knowledge of an anticipated ADE.[7]
Pharmacists can play a large role in the information and education aspect of transitional care. Previous studies demonstrate that pharmacist involvement in the discharge process can reduce the incidence of ADEs and have a positive impact on patient satisfaction. There are conflicting data regarding the effect of comprehensive medication education and follow‐up calls by pharmacy team members on ADEs and medication errors (MEs).[3, 8, 9] Although overall pharmacist participation has shown positive patient‐related outcomes, the impact of pharmacists' involvement on readmissions has not been consistently demonstrated.[10, 11, 12, 13, 14]
Our study evaluated the impact of the pharmacy team in the transitions‐of‐care settings in a unique combination utilizing the pharmacist during medication reconciliation, discharge, and with 3 follow‐up phone call interactions postdischarge. Our study was designed to evaluate the impact of intensive pharmacist involvement during the acute care admission as well as for a 30‐day time period postdischarge on both ADEs and readmissions.
METHODS
All patients were admitted to hospitalist‐based internal medicine units at Northwestern Memorial Hospital, an 894‐bed academic medical center located in Chicago, Illinois. Patients were randomized by study investigators using a random number generator to either the usual care or intervention arms and then evaluated each day for eligibility to participate in the study. Patients remained blinded throughout the study. Patients met inclusion criteria if they were discharged to home and either discharged on greater than 3 scheduled prescription medications or discharged with at least 1 high‐risk medication. High‐risk medications were classified as anticoagulants, antiplatelets (eg, aspirin and clopidogrel), hypoglycemic agents (eg, insulin), immunosuppressants, or anti‐infectives. Patients also needed to participate in a minimum of 1 postdischarge phone call or experience an emergency department (ED) visit or readmission within 30 days of discharge to meet inclusion criteria. Exclusion criteria included: impaired cognition based on Mini‐Cog screening assessment scale, unable or unwilling to provide informed consent, lack of a personal phone number, nonEnglish speaking, subsequent elective readmission within 30 days of initial visit, more than 3 previous hospital admissions in the past 2 months, palliative care or home/skilled nursing hospice, anticipated length of survival less than 3 months, discharged within 24 hours of admission, discharged against medical advice, or discharged before medication education was conducted (Figure 1). Patients who met inclusion criteria provided informed consent, received a Mini‐Cog screening assessment, and were given the Rapid Estimate of Adult Literacy in Medicine revised (REALM‐R) assessment to evaluate health literacy. The REALM‐R is a word recognition test designed to identify patients at risk for poor health literacy skills. Patients with REALM‐R scores of 6 or less are considered to have low health literacy.[15] Patients were randomized to receive either the usual care or pharmacist‐directed medication evaluation and management as described in Table 1. Patients included in the study were contacted by phone postdischarge, with 3 attempts on consecutive days. Patients who were readmitted as an inpatient or had an ED visit were not contacted for the study after that point.
| Admission Medication Reconciliation | Hospitalist (Confirmation by Pharmacist Reviewing the History and Physical Note in Electronic Medical Record) | Performed by Pharmacy Team Member Face to Face |
|---|---|---|
| ||
| Discharge medication reconciliation | Hospitalist | Pharmacy team member |
| Discharge medication education | Hospitalist and/or nurse | Pharmacy team member |
| Individualized medication plan | No | Yes |
| Postdischarge callback day 3 | No | Yes |
| Postdischarge callback day 14 | No | Yes |
| Postdischarge callback day 30 | Yes | Yes |
| Postdischarge call assessment topic(s) | ADEs/MEs, ED visits, inpatient readmissions | ADEs/MEs, ED visits, inpatient readmissions clarify pharmacy/discharge plan, resolve medication‐related issues, identify/overcome adherence barriers |
Patients enrolled in the control group received the usual standard of care by a clinical pharmacist. This included a medication reconciliation completed from the admitting physician's patient history and physical and medication counseling provided by the physician or nursing staff at discharge. Patients were not interviewed face‐to‐face on admission and did not receive discharge counseling by a pharmacy team member. Patients were assessed daily by the pharmacist for evaluation of the pharmacotherapy plans and presence of MEs or safety‐related concerns. The control group received 1 postdischarge phone call from a pharmacist at day 30 to assess for study endpoints of ADEs, MEs, ED visit, and readmission only. The endpoints of ADEs and MEs were determined by professional judgment by the clinical pharmacist based on an algorithm similar to National Coordinating Council for Medication Error Reporting and Prevention, although a specific tool was not utilized.
The study group received face‐to‐face medication reconciliation on admission by a pharmacist or a pharmacy student. Prior to discharge, a personalized medication plan was created by the pharmacist and discussed with the physician. Medication discrepancies were addressed prior to the discharge instructions being given and discussed with the patient. Medication counseling was performed at discharge by the pharmacist or pharmacy student. Patients received 3 phone calls at 3, 14, and 30 days postdischarge. The presence of ADEs and MEs were evaluated during each phone call. The patients were asked to confirm their medication regimens including drug, indication, dose, route, and frequency. They were also asked questions regarding possible side effects, new symptoms, and any changes to their current therapy. The calls focused on clarifying the pharmacy discharge plan, resolving any unanswered questions or medication‐related issues, identifying and overcoming any barriers to adherence, and assistance with providing patients access to medications by contacting pharmacies and physicians to resolve and troubleshoot further prescription claims and clarifications. Pharmacists performed all postdischarge phone calls. Pharmacy students were able to provide face‐to‐face medication reconciliation upon admission and discharge counseling under the supervision of the pharmacist for the intervention arm.
The patient Hospital Consumer Assessment of Healthcare Providers and Systems (HCAHPS) responses to the medication domain question, Did you clearly understand the purpose for taking each of your medications at the time of discharge? were collected for the 2 designated hospitalist units for both the control and study groups. HCAHPS scores were collected at the 6 months point prior to the study initiation and throughout the 6‐month study period for the control and intervention groups. A physician and 2 pharmacists, who were blinded to the study randomization and results, assessed all Northwestern Memorial Hospital readmissions to determine if the readmissions were medication‐related or not.
This study obtained institutional review board approval from Northwestern University.
Data Collected
Data collected from all patients included demographics (age, sex), payer, reason for admission, number of medications at time of discharge, Charlson Comorbidity Index score, number of high‐risk medications prescribed at time of discharge, length of stay, REALM‐R score, ADEs, inpatient readmission or ED visit, and the reason for readmission or ED visit. Only the first occurrence was counted for patients with both an ED visit and an inpatient readmission. It was estimated that a sample size of 150 patients in each group would provide 80% power to demonstrate a 20% improvement in ADE rates in the study group. Data were analyzed utilizing Fischer exact, 2, and Student t tests, and multivariate logistic regression as appropriate. Analyses were performed using SAS version 9.4 (SAS Institute, Inc., Cary, NC).
RESULTS
Over the course of 7 months, 341 patients were enrolled in the study, 189 in the control arm and 152 in the study arm. Forty‐eight patients in the control group and 15 patients in the study group were lost to follow‐up. The final analysis included 278 patients, 141 in the control group and 137 in the study group. Patients were eligible for study inclusion if they received at least 1 phone call, which resulted in more patients being lost to follow‐up in the control arm due to fewer total phone call attempts. Demographic and disposition data for the control and study groups are shown in Table 2. Baseline characteristics between the 2 groups were similar with the exception of total medications at time of discharge. The control group had more total medications at discharge compared to the study group (7.2 vs 6.4, P=0.04). The number of high‐risk medications and the number of scheduled medications were similar between both groups. During medication reconciliation, 380 discrepancies (46.2%) were found in the study group compared to 205 (19.9%) in the control group (P<0.0001). The higher number of identified discrepancies in the study group was expected due to the fact that the pharmacist did not complete a face‐to‐face medication history in the control patients. The average length of stay, REALM‐R scores, and reason for admissions were similar between the 2 groups (Table 2).
| Study, N=137 | Control, N=141 | P Value | |
|---|---|---|---|
| |||
| Sex, male | 52 (37.95%) | 59 (41.8%) | 0.54 |
| Average age, y | 55.4 | 55.8 | 0.87 |
| Average length of stay, d | 5.4 (range, 1104) | 4.6 (range, 028) | 0.67 |
| Average REALM‐R score (range, 08) | 6.8 | 6.7 | 0.67 |
| Average total no. of medications | 6.4 | 7.2 | 0.04 |
| Average no. of scheduled medications | 5.7 | 6.2 | 0.15 |
| Average no. of high‐risk category medications | 2.2 | 2.3 | 0.64 |
| Reason for admission | |||
| Cardiovascular disease | 5 (3.4%) | 15 (8.3%) | 0.035 |
| Pneumonia | 11 (7.5%) | 8 (4.4%) | 0.48 |
| Respiratory | 11 (7.5%) | 9 (5%) | 0.65 |
| Infectious disease | 39 (26.5%) | 53 (29.3%) | 0.13 |
| Gastrointestinal | 25 (17%) | 28 (15.5%) | 0.13 |
| Endocrine | 20 (13.6%) | 34 (18.8%) | 0.76 |
| Genitourinary | 0 (0%) | 0 (0%) | 0.05 |
| Hematological | 19 (12.9%) | 20 (11%) | 1 |
| Injury | 10 (6.8%) | 14 (7.7%) | 1 |
| Neurological | 2 (1.4%) | 0 (0%) | 0.52 |
| Heart failure | 4 (2.7%) | 0 (0%) | 0.24 |
| Myocardial infarction | 0 (0%) | 0 (0%) | 0.58 |
| Mental/substance abuse | 1 (0.7%) | 0 (0%) | 1 |
A total of 55 patients (39%) in the control arm were readmitted to an inpatient hospital or had an ED visit within 30‐days postdischarge compared to 34 patients (24.8%) in the study group (P=0.001) (Table 3). Of the patients readmitted to the ED, 21 were enrolled in the control arm (14.8%) compared to only 6 patients in the study arm (4.4%) (P=0.005). Reviewers concluded that 24% of the control group readmissions were medication‐related versus 23% of the study group (P=1.0). In total, 78 out of 89 readmissions were to Northwestern Memorial Hospital. Medication‐related causes to outside institutions were not evaluated. The causes for all readmissions were not evaluated.
| Study Group, n=137 | Control Group, n=141 | P Value | |
|---|---|---|---|
| |||
| Composite inpatient readmission and ED visit | 34 (24.8%) | 55 (38.7%) | 0.001 |
| ED visits | 6 (4.4%) | 21 (14.8%) | 0.005 |
| Inpatient readmissions | 28 (20.4%) | 34 (23.9%) | 0.43 |
| Medication‐related readmissions | 8 (23.5%) | 13 (23.6%) | 1.0 |
| ADEs/MEs reported at 30‐day phone call | 11/84 patients | 18/86 patients | 0.22 |
| Days to readmission/ED visit | 7.9 (SD 12.5) | 13.2 (SD 9.61) | 0.03 |
| Preintervention: HCAHPS scores pertaining to knowledge of indication of medication question preintervention | 47% | ||
| Postintervention: HCAHPS scores pertaining to knowledge of indication of medication question postintervention | 56% | ||
A sensitivity analysis was undertaken to understand the impact of the lost to follow‐up rate in both the control and study groups. Undertaking an assumption that all 15 patients lost to follow‐up in the study group were readmitted and that 15 of 48 patients lost to follow‐up in the control group were readmitted, the intervention continued to show a significant benefit in reduction of composite ED and inpatient readmissions (35.7% study group vs 49.6% control group, P=0.022)
Multivariate logistic regression analysis that controlled for Charlson Comorbidity Index score, length of stay, total number of medications on discharge, and payer type showed an adjusted odds ratio of 0.55 (95% confidence interval [CI]: 0.32‐0.94) in the intervention cohort compared to controls for the combined endpoint of readmission and ED visit within 30‐days postdischarge. The adjusted odds ratio for 30‐day readmission alone was 0.88 (95% CI: 0.49‐1.61).
Eighteen of the 86 control patients who received a 30‐day postdischarge phone call experienced an ADE or ME compared to 11 of the 83 study patients (P=0.22). Patient satisfaction scores of both designated units as represented by the HCAHPS score in the medication knowledge domain increased from the prestudy period. Patients selected agree or strongly agree only 47% of the time at the 6‐month prestudy point compared to 56% of the time during the 6‐month study period.
DISCUSSION
Although previous studies show conflicting results regarding the impact of pharmacist interventions on readmissions, our study demonstrated a decrease in the composite measure of inpatient readmissions and ED visits. Its success stresses the need for a comprehensive approach that contains continuity of care by healthcare providers to reconcile and manage medications throughout the hospital stay, extending up to a full month postdischarge with multiple phone calls. This included (1) face‐to‐face medication reconciliation on admission, (2) development of a personalized medication plan discussed with the patient's physician, (3) addressing any medication discrepancies to the discharge instructions being given to the patient, (4) medication counseling performed at discharge, and (5) 3 postdischarge phone calls at 3, 14, and 30 days.
A study conducted in 2001 analyzed the Medicare Current Beneficiary Survey (MCBS) and found that living alone, having limited education, and lack of self‐management skills have significant associations with early readmission.[16] Approximately 80 million Americans have limited health literacy and are associated with poor health outcomes and healthcare utilization as seen in a review completed by Berkman and colleagues.[17] Because no difference was found between both groups, it would suggest health literacy did not influence or bias the study group. Additionally, no statistically different medication issues, such as total number of medications or rates of ADEs and MEs, were identified in the patients of this study. This may be explained by the small, final population size at the 30‐day period or that the impact of the pharmacist intervention did not reach the threshold that this study was powered to detect. Also, a lack of statistical significance may be due to the subjective nature of ADEs/MEs and the prevention of ADEs/MEs throughout all patients' hospitalizations from the clinical pharmacist's involvement in care, which was not collected. Although a combined endpoint collecting readmission to either the ED or rehospitalization was lower in the intervention cohort, the isolated rehospitalization endpoint was not significantly different between the 2 groups. ED utilization was markedly decreased, but we may have lacked the power to show a statistically significant decrease in rehospitalization. These results mirror those of the Project RED (Re‐Engineered Discharge) intervention.[17]
HCAHPS surveys are sent to only a small percent of randomly selected patients who are discharged from the hospital. Thus, respondents may or may not have been included in the study, indicating a possible greater impact of the intervention on individual patients than collected. Importantly, the described interventions appeared to improve patients' perception of understanding the purpose of their medications. We found that HCAHPS scores across the 2 units improved, though the intervention only impacted 16.8% of all patients discharged from these units due to the nature of the survey distribution.
The pharmacists' abilities to educate all eligible patients prior to discharge from 7:30 am to 4:00 pm each day of the week was a limitation of this study, as some patients were discharged outside of the duty hours. This may have allowed for a differential exclusion and could have led to selection bias. Another limitation is that a large number of patients were lost to follow‐up in the control group, likely because the first postdischarge contact with patients was not until the day 30 phone calls. The extensive exclusion criteria caused many patients not to be enrolled. Though the intervention arm received postdischarge phone calls at days 3 and 14, only postdischarge call‐backs at day 30 of the intervention arm were compared to the control arm, which could have led to bias in the 30‐day analysis of the intervention arm, as patients may have not reported previous issues that were resolved in earlier phone calls. Medication‐related readmissions were not statistically different between the groups, which could suggest that the difference in readmissions were not solely due to the intervention, and a decrease in healthcare utilization may be due to chance. The subjective nature of how ADEs and MEs were collected also serves as a limitation, as they were only screened for presence or absence and not classified by severity or category. This study was at a single‐center academic institution, which may limit the ability to apply the results to other institutions. Last, outcome assessments relied on participant report, including ADE and ME occurrence and presentation at outside hospitals. Future study evaluation conducted as a multicenter design while continuing to strengthen the continuity of the healthcare provider and patient relationship at each intervention would be ideal. Also, having an objective measure of ADEs and MEs with severity categorization would be beneficial.
Compared to previous literature, our study design was unique in the number of phone calls made to patients postdischarge and its prospective, randomized design. In the previously mentioned study by Walker et al., phone calls were made only at days 3 and 30.[13] Although the majority of readmissions occurred within the first 14 days of discharge, additional visits to the ED and readmissions may have been avoided by contacting patients twice within the critical 14‐day period. Another distinction of this study design was the expansion of a rather limited and peripheral pharmacist role in transitions of care to a much more integrated participation. We believe the relationship developed between patients and their pharmacy care team provided coordination and the continuity of communication regarding their care. Additionally, our study was unique through the use of pharmacy extenders via fourth‐year pharmacy students who were completing their advanced pharmacy practice rotations. Pharmacy extenders can also be certified and trained pharmacy technicians, which many hospitals utilize to perform medication reconciliations at a lower cost than pharmacists. As hospitals face increased demands to shrink budgets due to decreasing reimbursements, healthcare systems will be forced to find creative new ways to use existing resources.
In conclusion, transition of care is a high‐risk situation for many patients. A comprehensive approach by healthcare providers, including pharmacists and pharmacy extenders, may have a positive impact in reducing or preventing ADEs/MEs, inpatient admissions, and ED visits. Although our study focused directly on the impact of a pharmacy care team on transitions‐of‐care, we cannot conclude this applies strictly to pharmacists. Across the nation, the role of various disciplines of healthcare providers in admission, hospitalization, discharge, and postdischarge is not standardized and varies significantly by institution. Importantly, no mechanism currently exists to directly reimburse for such efforts, but demonstration of cost effectiveness through reduced posthospital utilization may justify this investment for accountable care organizations.[18]
- , , , , , . Medicare readmission rates show meaningful decline in 2012. Medicare Medicaid Res Rev. 2013;3(2):E1‐E11.
- , , , et al. Factors contributing to all‐cause 30‐day readmissions: a structured case series across 18 hospitals. Med Care. 2012:50(7):599–605.
- , , , et al. Role of pharmacist counseling in preventing adverse events after hospitalization. Arch Intern Med. 2006;66:565–571.
- , , . Optimizing transitions of care to reduce rehospitalizations. Cleve Clin J Med. 2014;81(5):1–9.
- , , , , . The incidence and severity of adverse events affecting patients following discharge from the hospital. Ann Intern Med. 2003;138:161–167.
- , . Adverse drug events occurring following hospital discharge. J Gen Intern Med. 2005;20:317–323.
- . What do discharged patients know about their medications? Patient Educ Couns. 2005;56:276–282.
- , , , . The impact of telephone calls to patients after hospitalization. Dis Mon. 2002;48:239–248.
- , , , et al. Effect of a pharmacist intervention on clinically important medication errors after hospital discharge: a randomized trial. Ann Intern Med. 2012;157:1–10.
- , , , et al. A reengineered hospital discharge program to decrease rehospitalization: a randomized trial. Ann Intern Med. 2009;150(3):178–187.
- , , , , . The value of inpatient pharmaceutical counselling to elderly patients prior to discharge. Br J Clin Pharmacol. 2002;54:657–664.
- , , , . Postdischarge pharmacist medication reconciliation: impact on readmission rates and financial savings. J Am Pharm Assoc (2003). 2013;53(1):78–84.
- , , , et al. Impact of pharmacist‐facilitated hospital discharge program. Arch Intern Med. 2009;169:2003–2010.
- , , , et al. Does pharmacist‐led medication review help to reduce hospital admissions and deaths in older people? A systematic review and meta‐analysis. Br J Clin Pharmacol. 2008;65(3):303–316.
- . The meaning and the measure of health literacy. J Gen Intern Med. 2006;21(8):878–883.
- , , , , , . Postdischarge environmental and socioeconomic factors and the likelihood of early hospital readmission among community‐dwelling Medicare beneficiaries. Gerontologist. 2008;48(4):495–504.
- , , , , . Low health literacy and health outcomes: an updated systematic review. Ann Intern Med. 2011;155(2):97–107.
- , , , et al. Fostering accountable health care: moving forward in Medicare. Health Affairs. 2009;28(2):219–231.
© 2015 Society of Hospital Medicine

Hand Hygiene Intervention in Japan
Healthcare‐associated infections are a major cause of illness and death in hospitalized patients, and preventing healthcare‐associated infection is a global challenge.[1] Worldwide, the prevalence of healthcare‐associated infections in developed and undeveloped countries ranges from 5.1% to 11.6% and 5.7% to 19.1%, respectively.[2] In the United States, roughly 2 million such infections occur annually, resulting in approximately 99,000 deaths[3] and estimated annual direct medical costs between $28.4 and $33.8 billion.[4] In Japan, nearly 9% of patients admitted to the intensive care unit (ICU) develop an infection during hospitalization,[5] and 5% of all patients hospitalized become infected with methicillin‐resistant Staphylococcus aureus.[6] The management of healthcare‐associated infections in Japan accounts for up to 5% of total annual healthcare costs, with an estimated $6.8 billion estimated to be potentially preventable.[7] In addition, healthcare‐associated infections are associated with increased length of stay in the hospital. Studies estimate surgical site infections extend length of stay by 9.7 days,[8] and bloodstream infections increase length of stay by 10 days.[9]
Improving hand hygiene practice for healthcare workers is considered a core strategy to decrease the incidence of healthcare‐associated infection.[6, 10] Specifically, the use of alcohol‐based hand rub is strongly recommended in acute care hospitals by both the World Health Organization (WHO) and the US Centers for Disease Control and Prevention.[11, 12] Improving hand hygiene adherence may reduce healthcare‐associated infection by 9% to 50%,[13, 14] and multiple studies have reported that greater use of alcohol‐based hand rubs results in significant reductions in healthcare‐associated infections.[14, 15]
Due to the difficulty in improving hand hygiene in various settings across the world, the WHO strategy for improving hand hygiene has been adopted and implemented by several studies in varying locations, such as Costa Rica, Italy, Mali, Pakistan, and Saudi Arabia.[16] Implementations of these multimodal strategies, following WHObased guidelines, have been shown to increase the level of hand hygiene adherence among healthcare workers and reduce infections at these locations.[14, 17, 18] This study expands upon that work by extending the same implementation strategy to assess the effectiveness of the introduction of alcohol‐based hand rub on hand hygiene practice at multiple hospitals in Japan.
In a previous article[19] we reported results from an observational study assessing healthcare worker hand hygiene adherence before touching the patient in 4 geographically diverse hospitals in Japan. The study reported that hand hygiene adherence in Japanese hospitals was lower than reported mean values from other international studies, and that greater adherence to hand hygiene should be encouraged. In this article, we present the results of a multimodal intervention intended to improve levels of healthcare worker hand hygiene in 3 of these hospitals.
METHODS
Participating Institutions
Three of the 4 hospitals participating in the prior observational study chose to participate in this intervention. Evaluation of hand hygiene practice was performed in at least 3 wards of each hospital including an inpatient surgical ward, an inpatient medicine ward, an ICU, or an emergency ward.
Table 1 lists the characteristics of the participating hospitals. Hospital A is a university‐affiliated, tertiary care medical center with 312 beds in East Japan. Although the hospital did not have an infection prevention unit or designated infection control nurses during the preintervention periods, the hospital hired a designated infection prevention nurse and established a department of infection prevention before this intervention in April 2012. Hospital B is a community‐based, tertiary care medical center with 428 beds, located in Midwest Japan. Although the facility had no infection control nurses at the outset of the study, a physician certified by the American Board of Internal Medicine and Infectious Diseases provided educational sessions of hand hygiene. Hospital B hired a designated infection prevention nurse and established a department of infection prevention in April 2012. Hospital C, located in Northern Japan, is a community‐based, tertiary care medical center with 562 beds. The department of infection prevention was established in 2010 and has 1 full‐time and 2 part‐time infection prevention nurses.
| Hospital A | Hospital B | Hospital C | ||||
|---|---|---|---|---|---|---|
| Preintervention | Postintervention | Preintervention | Postintervention | Preintervention | Postintervention | |
| ||||||
| Hospital characteristics | ||||||
| Location | East Japan | Midwest Japan | Northern Japan | |||
| Hospital type | University affiliated | Community based | Community based | |||
| Level of care | Tertiary care | Tertiary care | Tertiary care | |||
| Residency program | Yes | Yes | Yes | |||
| No. of beds | 250 | 312 | 428 | 428 | 550 | 562 |
| No. of employees | 398 | 475 | 1,035 | 1,263 | 1,500 | 1,568 |
| No. of physicians | 73 | 91 | 179 | 188 | 207 | 217 |
| No. of nurses | 172 | 210 | 410 | 540 | 616 | 800 |
| Infection control practice | ||||||
| Establishment of infection prevention units (year) | N/A | Yes (2012) | N/A | Yes (2012) | Yes (2010) | Yes |
| Employment of certified nurses in infection control (FTE) | 0 | 1 (1) | 0 | 1 (1) | 3 (1.5) | 3 (1.5) |
| Employment of ABIM‐IDcertified physician | 0 | 0 | 1 | 1 | 1 | 0 |
Role of the Funding Source
This study was unfunded. The prize for the contest was provided by an American collaborator (S.S.) who was not affiliated with any of the participating hospitals.
Intervention
In the prior preintervention study, hand hygiene adherence rates of healthcare workers were evaluated between July 2011 and November 2011.[19] To improve hand hygiene adherence in these facilities, we initiated a multimodal intervention based on WHO recommendations and the findings from the prior study. Each facility was provided the same guidance on how to improve hand hygiene adherence (Table 2) and encouraged to tailor the intervention to their local setting. As an added incentive, we initiated a contest, where the facility obtaining the highest hand hygiene adherence postintervention would win a trophy and 500,000 Japanese yen (approximately $5000 US dollars). The recommended strategies consisted of 15 components (Table 2): infrastructure (3 components), training and education (2 components), evaluation and feedback (5 components), reminder in the workplace (1 component), and institution safety climate (4 components). Of note, the participating institutions had already implemented a varying number of the intervention components prior to the start of the intervention. Each facility conducted a 6‐month intervention to improve hand hygiene adherence; however, the actual timing of interventions varied slightly by institution. Hospitals A and C conducted an intervention from October 2012 through March 2013, whereas hospital B's intervention was from April 2012 to September 2012. Details of the multimodal intervention performed at each participating hospital are shown in Table 3.
| Intervention Components | Description |
|---|---|
| 1. Infrastructure (3 components) | |
| Hand‐washing faucets for each room | At least 1 faucet and sink for each room was available. |
| Placement of alcohol hand rub at patient's room entrance | Alcohol hand rub was placed at all patient room entrances. |
| Portable alcohol hand rub distributed for each healthcare worker | Personal, portable alcohol hand rub dispensers were provided for healthcare workers who contact patients. |
| 2. Training/education (2 components) | |
| Educational resources | At least 1 physician or 1 nurse who provides educational sessions regarding hand hygiene practice was available. |
| Periodic seminars and lectures regarding hand hygiene education | Hospital‐wide hand hygiene seminar or educational activities were held during the intervention period. |
| 3. Evaluation and feedback (5 components) | |
| Evaluation of hand hygiene practice by direct observation | Hospitals utilize direct observation for healthcare worker's hand hygiene practice. |
| Evaluation of hand hygiene practice by monitoring the amount of alcohol hand rub consumption | Hospitals utilize the amount of alcohol hand rub consumption as a parameter for healthcare worker's hand hygiene practice. |
| Hand hygiene rate feedback at infection control committee | Hand hygiene adherence rate was reported and discussed at hospital infection control committee. |
| Hand hygiene rate feedback to the designated wards/units | Hand hygiene adherence rate was reported and discussed with healthcare workers at the designated wards/units where hand hygiene observation was performed. |
| Granting the award of top‐rated person of hand hygiene | Hospitals established the system to assess individual healthcare worker's hand hygiene adherence rate. |
| 4. Reminder in the workplace (1 components) | |
| Poster notification | Poster notification for hand hygiene practice was performed in the intervention period. |
| 5. Institutional safety climate (4 components) | |
| Commitment of hospital president or hospital executives | Hospital executives including the president agreed on the importance of hand hygiene practice and declared to healthcare workers to enhance hand hygiene practice during the intervention period. |
| Commitment of nurse managers and physician leaders | Commitment of improving hand hygiene practice by representative healthcare workers at the designated wards/units (eg, meeting by nurse manager or physician leaders at the designated wards/units and collaborative work with infection prevention services). |
| Meeting at the designated wards/units | A ward/unit‐level meeting or voluntary session for hands‐on hand hygiene practice by healthcare workers at the designated wards/units. |
| Identifying champions at the designated wards/units | An individual healthcare worker who contributed to improving hand hygiene practice was appointed. |
| Hospital A | Hospital Ba | Hospital C | ||||
|---|---|---|---|---|---|---|
| ||||||
| Intervention period | October 2012March 2013 | April 2012September 2012 | October 2012March 2013 | |||
| Evaluation of hand hygiene in the postintervention period | May 2013July 2013 | October 2012 | June 2013 | |||
| Suggested intervention components | Preintervention | Postintervention | Preintervention | Postintervention | Preintervention | Postintervention |
| No. of implemented components | 2/15 | 10/15 | 9/15 | 10/15 | 6/15 | 8/15 |
| Infrastructure (3 components) | ||||||
| Hand‐washing faucets for each room | No | No | Yes | Yes | Yes | Yes |
| Placement of alcohol hand rubs at patient's room entrance | Yes | Yes | Yes | Yes | Yes | Yes |
| Portable alcohol hand rub distributed for each healthcare worker | No | Yesb | No | Yesb | No | No |
| Training/education (2 components) | ||||||
| Educational resources | No | Yesb | Yes | Yesb | Yes | Yes |
| Periodic seminars and lectures regarding hand hygiene education | No | Yesb | Yes | Yes | Yes | Yes |
| Evaluation and feedback (5 components) | ||||||
| Evaluation of hand hygiene practice by direct observation | No | Yesb | Yes | Yes | No | No |
| Evaluation of hand hygiene practice by the amount of alcohol hand rub consumption | No | No | Yes | Yes | Yes | Yes |
| Hand hygiene rate feedback at infection control committee | No | Yesb | Yes | Yes | No | Yesb |
| Hand hygiene rate feedback to designated departments | No | Yesb | Yes | Yes | No | Yesb |
| Granting the award of top‐rated person | No | No | No | No | No | No |
| Reminders in the workplace (1 component) | ||||||
| Poster notification | Yes | Yes | Yes | Yes | Yes | Yes |
| 5. Institutional safety climate (4 components) | ||||||
| Commitment of hospital president or hospital executives | No | Yesb | No | No | No | No |
| Commitment of nurse managers and physicians leaders | No | Yesb | No | No | No | No |
| Meeting regarding hand hygiene practice by the designated wards/units | No | No | No | No | No | No |
| Identifying champions at the designated wards/units | No | No | No | No | No | No |
Observation of Hand Hygiene Practice
The same methods for hand hygiene observation used for the preintervention study was used for postintervention assessment. Ten distinct units across the 3 participating hospitals were evaluated for healthcare worker hand hygiene prior to patient contact. Three to 4 units were observed at each facility. One of the study authors (T.S.), a Japanese board‐certified infection control nurse, conducted all of the hand hygiene observations for both the preintervention and postintervention studies. Intraobserver variation was minimized by providing the same training outlined in the previous study.[19] Appropriate hand hygiene was defined as the use of soap and water or alcohol‐based hand rub before patient contact, which corresponds to the first moment of the WHO's 5 moments of hand hygiene.[11]
Hand hygiene practice prior to patient contact for each individual provider‐patient encounter was observed and recorded using the hand hygiene observation form adapted from a previous study by Saint et al.[6, 20] Identical to the preintervention study,[19] the form captured the following information: unit in which observations were performed, time of initiation and completion of observations, healthcare worker subgroup (physician or nurse), and the type of hand hygiene before patient contact (ie, hand washing with soap and water, use of alcohol‐based hand rub, or no hand hygiene). Unit physicians and nurses were informed that their clinical practices were going to be observed, but were not informed of the purpose of the observations (eg, hand hygiene adherence). To avoid interfering with clinical care delivery, the observer was given strict instructions to maintain a certain distance from the observed healthcare workers. The observer was instructed to leave immediately if asked for any reason by the unit staff or patients.
Statistical Analysis
Overall hand hygiene adherence rates were calculated and compared between the pre‐ and the postintervention periods. Comparison of hand hygiene adherence by healthcare worker subgroup and by hospital unit between the pre‐ and postintervention periods was also performed. Hand hygiene adherence rates were compared using JMP 9.0 and SAS 9.3 (SAS Institute Inc., Cary, NC). Comparison of hand hygiene adherence rates by observational periods was calculated by Pearson [2] tests, and 95% confidence intervals (CIs) were estimated using binomial distribution. Pearson correlations were used to determine the relationship of hand hygiene between physicians and nurses in the same unit. Two‐tailed P value0.05 was considered statistically significant. The study protocol was reviewed and approved by the ethics committees at the participating hospitals.
RESULTS
Data were collected from May 2013 to July 2013 in hospital A, in October 2012 in hospital B, and June 2013 in hospital C to ensure data were collected after the 6‐month intervention at each site. A total of 2982 observations of hand hygiene were performed in 10 distinct units across the 3 participating hospitals during the postintervention periods. Hand hygiene observations were performed during the day Monday through Friday between 8:30 am and 7:30 pm, with the majority occurring prior to 1:00 pm.
The overall postintervention hand hygiene adherence rate (in all 3 hospitals) was significantly higher at 32.7% (974/2982) adherence compared to 18.0% (482/2679) adherence in the preintervention period (P<0.001). An increased hand hygiene adherence rate in each participating hospital in the postintervention period was observed (Figure 1). Similar trends of higher overall hand hygiene adherence rates for both nurses and physicians in the postintervention period were seen. Use of alcohol‐based hand rub among those with appropriate hand hygiene was significantly higher, with 90.0% (880/974) using hand rub in the postintervention period versus 67.0% (322/482) in the preintervention period (P<0.001). Comparison of overall hand hygiene adherence rates by unit type and healthcare worker subgroup between the pre‐ and postintervention periods are shown in Table 4. Detailed comparisons of hand hygiene adherence rates for each hospital are available in the supplementary appendix. Although a significant improvement of hand hygiene practice was observed in the majority of participating units (6/10), there was a significant decline in hand hygiene practice in 2 units for nurses and 1 unit for physicians. Hand hygiene adherence rates by healthcare worker subgroups (both physicians and nurses) were significantly higher in the postintervention period than those in the preintervention period. Trends toward higher hand hygiene adherence rate of nurses in the postintervention period were observed (34.8% adherence for nurses compared to 30.4% adherence for physicians); the difference between nurses and physicians were not statistically significant (P=0.07).

| Ward/Unit | Healthcare Worker Subgroup | Preintervention Period | Postintervention Period | Improvement After Intervention (%) | P Value | ||
|---|---|---|---|---|---|---|---|
| No. of Observations | Hand hygiene Adherence (%) | No. of Observations | Hand Hygiene Adherence (%) | ||||
| |||||||
| All 3 hospitals | |||||||
| Surgery | Nurse | 455 | 20 | 480 | 40 | 20 | <0.001 |
| Physician | 424 | 18 | 448 | 43 | 25 | <0.001 | |
| All | 879 | 19 | 928 | 41 | 22 | <0.001 | |
| Medicine | Nurse | 455 | 23 | 508 | 39 | 16 | <0.001 |
| Physician | 435 | 15 | 452 | 33 | 18 | <0.001 | |
| All | 890 | 20 | 960 | 36 | 16 | <0.001 | |
| ICU | Nurse | 305 | 21 | 379 | 25 | 4 | 0.17 |
| Physician | 203 | 9 | 268 | 28 | 19 | <0.001 | |
| All | 508 | 16 | 647 | 26 | 10 | <0.001 | |
| ED | Nurse | 170 | 16 | 173 | 27 | 11 | 0.01 |
| Physician | 232 | 14 | 274 | 9 | ‐5 | 0.07 | |
| All | 402 | 15 | 447 | 16 | 1 | 0.64 | |
| All units | Nurse | 1385 | 21 | 1540 | 35 | 14 | <0.001 |
| Physician | 1294 | 15 | 1442 | 30 | 15 | <0.001 | |
| All | 2679 | 18 | 2982 | 33 | 15 | <0.001 | |
Hospital A achieved the highest postintervention adherence rates (39.9% adherence postintervention), as well as the greatest absolute improvement in hand hygiene (increase of 29.0%). There were significant improvements in 3 of the 4 participating units in hospital A, with the emergency department showing improvements only in the nurse subgroup. In hospital B, total hand hygiene adherence increased from 24.7% to 30.0% (P=0.01); however, this increase was mainly due to increase in hand hygiene adherence rates of nurses. There were significant increases in hand hygiene adherence rates for nurses in the medicine (+11%, P=0.04) and surgery wards (+14%, P=0.01), with nonsignificant increases for physicians (+10% medicine, P=0.07;+2% surgery, P=0.78). However, in the emergency department, nurses showed no significant improvement, and physicians had a significant decrease in adherence (15.7% preintervention vs 7.4% postintervention; P=0.02). In hospital C, total hand hygiene practice rates were significantly improved (from 18.9% to 26.5%; P<0.001); however, this was driven by improvements only in the surgical ward (14.6% preintervention to 42.3% postintervention; P<0.001). The rates for nurses declined significantly in both the medicine and ICU wards, leading to no observed improvements on those wards.
DISCUSSION
Our multicenter intervention study in Japan included observations from almost 3000 encounters between clinicians and patients. Before the intervention, the overall rate of hand hygiene adherence was 18%. After the multimodal intervention, the absolute increase in healthcare worker hand hygiene adherence was 15%. Although there was overall improvement, the adherence rates varied by hospital, with hospital A increasing by 29% and hospital B and C only attaining increases of 5% and 7%, respectively.
Despite the importance of hand hygiene of healthcare workers, it is challenging to increase hand hygiene adherence because it requires behavioral modification. Moreover, it remains uncertain what factors will affect healthcare worker behavior. We implemented pragmatic strategies to evaluate the efficacy of hand hygiene multimodal interventions based on internationally recognized WHO hand hygiene adherence strategies[11] and an institutional‐level contest with financial incentives. The findings in the current study help us understand not only how a multimodal intervention importantly improves hand hygiene adherence, but also what factors potentially make healthcare workers modify their behaviors.
In this study, we evaluated whether an institutional‐level contest with financial incentives contributed to improved hand hygiene adherence of healthcare workers. This study demonstrated improvement of hand hygiene practice after implementation of a multimodal hand hygiene intervention combined with an institutional‐level contest with financial incentives. The contest might have had a modest effect to help motivate the participating hospitals to improve their hand hygiene adherence rate. This is consistent with a previous study that demonstrated financial incentives were associated with modifying healthcare workers' hand hygiene practice.[21] However, we did not strictly standardize how the contest information was distributed in each participating institution and the objective assessment for changes in motivation by the contest was lacking in this study. Thus, changes in motivation by the contest with financial incentives likely varied by each participating institution. Further studies are needed to assess if this type of approach is worth pursuing.
We observed several noteworthy associations between the intervention components that were implemented at each facility and their improvement in hand hygiene adherence. Among the participating hospitals, hospital A was most successful with improving hand hygiene adherence, although all participating hospitals achieved a similar number of the 15 recommended intervention components during the intervention (8 to 10 per hospital). Interestingly, hospital A initiated the most new components during the intervention period (8 new components for a total of 10 out of 15), whereas hospital B and hospital C initiated only 1 or 2 new components during the intervention period. Hospital A also successfully involved hospital executives, and elicited the commitment of a nurse manager and physician leader. Consistent with a previous study,[22] we believe that involvement of hospital executives appears to be important to increase overall hand hygiene rate among healthcare workers.
In contrast, hospitals B and C did not involve senior executives or identify nurse or physician champions for all participating units. Based on the results in this study, we believe that the involvement of hospital executives is likely a key for the penetration of hospital‐wide hand hygiene culture among healthcare workers.
Although this study was unable to determine which components are precisely associated with improving hand hygiene adherence, the findings suggest initiating multiple intervention components at the same time may provide more motivation for change than initiating only 1 or 2 components at a time. It is also possible that certain intervention components were more beneficial than others. For example, hospital A, which achieved the most success, was the only hospital to obtain leadership support. Other studies have demonstrated that the presence of leadership appeared to play a key role in improving hand hygiene adherence.[23, 24] Moreover, a recent Japanese nationwide survey demonstrated higher safety centeredness was associated with regular use of standard infection prevention practice.[25] Consistent with a previous study, improving hand hygiene adherence cannot be simply achieved by improving infrastructure (eg, introduction of portable alcohol‐based hand rub) alone, but it depends on altering healthcare worker behavior.[26]
This study has several limitations. Because participating hospitals could tailor the specific interventions chosen for their facility, the improvement in hand hygiene adherence was likely multifactorial. We are unable in the existing study to determine a direct causal relationship between any of the individual intervention components and hand hygiene adherence. We are also unable to determine whether the improvements seen in hospital A were due to participation in the contest or due to the specific intervention components that were implemented. However, WHO hand hygiene guidelines point out that recognition of the importance of hand hygiene varies in different regions and countries, and the goal for hand hygiene interventions is to establish a culture of hand hygiene practice through pragmatic intervention strategies, frequent evaluation, and feedback to healthcare workers.[27] Thus, we prioritized pragmatic strategies to include in our intervention to promote hand hygiene adherence. Another limitation was the date of implementation of the multimodal intervention was slightly different at each facility. It was challenging to implement the intervention simultaneously across institutions due to competing priorities at each facility. Although the primary goal of hand hygiene is to reduce the burden of healthcare‐associated infection, we were unable to measure infection rates at the participating facilities. It is possible the presence of an external observer had an impact on the healthcare workers' behavior.[28] However, the healthcare workers were not informed as to what the observer was monitoring to minimize this potential effect. Lastly, the findings in this study provide immediate intervention effects but further study will be required to determine if these effects are sustainable.
Altering healthcare worker behavior is likely the key element to improve hand hygiene adherence, and behavioral modification may be achieved with the support of leadership at the unit and facility level. However, even though we found significant improvements in healthcare worker hand hygiene adherence after the intervention, the adherence rates are still relatively low compared to reported adherence rates from other countries,[29] suggesting further intervention is needed in this setting to optimize and hygiene practice. Because hand hygiene practice is a crucial strategy to prevent healthcare‐associated infections, every effort should be made to enhance the hand hygiene practice of healthcare workers.
Acknowledgements
The authors thank the International Ann Arbor Safety Collaborative (
Disclosure: Nothing to report.
- . Infection control—a problem for patient safety. N Engl J Med. 2003;348(7):651–656.
- World Health Organization. The burden of health care‐associated infection worldwide: a summary. Available at: http://www.who.int/gpsc/country_work/summary_20100430_en.pdf. Accessed October 6, 2014.
- , , , et al. Estimating health care‐associated infections and deaths in U.S. hospitals, 2002. Public Health Rep. 2007;122(2):160–166.
- . The direct medical costs of healthcare‐associated infections in U.S. hospitals and the benefits of prevention. Atlanta, GA: Centers for Disease Control and Prevention; 2009. Available at: http://www.cdc.gov/HAI/pdfs/hai/Scott_CostPaper.pdf. Accessed April 20, 2015.
- , , . Epidemiological approach to nosocomial infection surveillance data: the Japanese Nosocomial Infection Surveillance System. Environ Health Prev Med. 2008;13(1):30–35.
- , , , et al. Improving healthcare worker hand hygiene adherence before patient contact: a before‐and‐after five‐unit multimodal intervention in Tuscany. Qual Saf Health Care. 2009;18(6):429–433.
- . Economical efficiency of infection control. Antibiot Chemother (Northfield). 2004;20:635–638.
- , , , , , . Surgical site infection: incidence and impact on hospital utilization and treatment costs. Am J Infect Control. 2009;37(5):387–397.
- , , , , , . Hospital‐acquired, laboratory‐confirmed bloodstream infections: linking national surveillance data to clinical and financial hospital data to estimate increased length of stay and healthcare costs. J Hosp Infect. 2010;75(3):158–162.
- . APIC guideline for handwashing and hand antisepsis in health care settings. Am J Infect Control. 1995;23(4):251–269.
- World Health Organization. WHO Guidelines on Hand Hygiene in Health Care. Clean care is safer care: first global patient safety challenge. Geneva, Switzerland; 2009. Available at: http://www.who.int/gpsc/en/index.html. Accessed October 6, 2014.
- , ; Healthcare Infection Control Practices Advisory Committee, HICPAC SHEA APIC IDSA Hand Hygiene Task Force. Guideline for hand hygiene in health‐care settings. Recommendations of the Healthcare Infection Control Practices Advisory Committee and the HICPAC/SHEA/APIC/IDSA Hand Hygiene Task Force. Society for Healthcare Epidemiology of America/Association for Professionals in Infection Control/Infectious Diseases Society of America. MMWR Recomm Rep. 2002;51(RR‐16):1–45.
- National Patient Safety Agency. The economic case: implementing near‐patient alcohol hand rum in your trust. London, United Kingdom; 2004. Available at: http://www.npsa.nhs.uk/cleanyourhands/resource‐area/evidence‐base/?EntryId34=58433. Accessed October 9, 2014.
- , , , et al. Effectiveness of a hospital‐wide programme to improve compliance with hand hygiene. Infection Control Programme. Lancet. 2000;356(9238):1307–1312.
- , . Role of hand hygiene in healthcare‐associated infection prevention. J Hosp Infect. 2009;73(4):305–315.
- , , , et al. Global implementation of WHO's multimodal strategy for improvement of hand hygiene: a quasi‐experimental study. Lancet Infect Dis. 2013;13(10):843–851.
- , , , et al. Impact of the International Nosocomial Infection Control Consortium (INICC) multidimensional hand hygiene approach over 13 years in 51 cities of 19 limited‐resource countries from Latin America, Asia, the Middle East, and Europe. Infect Control Hosp Epidemiol. 2013;34(4):415–423.
- , , , . Bundling hand hygiene interventions and measurement to decrease health care‐associated infections. Am J Infect Control. 2012;40(4 suppl 1):S18–S27.
- , , , et al. Hand hygiene adherence among health care workers at Japanese hospitals: a multicenter observational study in Japan [published online April 8, 2014]. J Patient Saf. doi: 10.1097/PTS.0000000000000108.
- , , , et al. Marked variability in adherence to hand hygiene: a 5‐unit observational study in Tuscany. Am J Infect Control. 2009;37(4):306–310.
- , , , et al. Sustained improvement in hand hygiene adherence: utilizing shared accountability and financial incentives. Infect Control Hosp Epidemiol. 2013;34(11):1129–1136.
- , , , . Status of the implementation of the World Health Organization multimodal hand hygiene strategy in United States of America health care facilities. Am J Infect Control. 2014;42(3):224–230.
- , , , et al. The effect of leadership on hand hygiene: assessing hand hygiene adherence prior to patient contact in 2 infectious disease units in Tuscany. Infect Control Hosp Epidemiol. 2014;35(3):313–316.
- , , , , , . Impact of a hospital‐wide hand hygiene initiative on healthcare‐associated infections: results of an interrupted time series. BMJ Qual Saf. 2012;21(12):1019–1026.
- , , , , , . Health care‐associated infection prevention in Japan: the role of safety culture. Am J Infect Control. 2014;42(8):888–893.
- , , . Why healthcare workers don't wash their hands: a behavioral explanation. Infect Control Hosp Epidemiol. 2006;27(5):484–492.
- World Health Organization. Guide to implementation. A guide to the implementation of the WHO multimodal hand hygiene improvement strategy. Available at: http://whqlibdoc.who.int/hq/2009/WHO_IER_PSP_2009.02_eng.pdf. Accessed October 9, 2014.
- , , , et al. Compliance of health care workers with hand hygiene practices: independent advantages of overt and covert observers. PLoS One. 2013;8(1):e53746.
- , , , et al. Systematic review of studies on compliance with hand hygiene guidelines in hospital care. Infect Control Hosp Epidemiol. 2010;31(3):283–294.
Healthcare‐associated infections are a major cause of illness and death in hospitalized patients, and preventing healthcare‐associated infection is a global challenge.[1] Worldwide, the prevalence of healthcare‐associated infections in developed and undeveloped countries ranges from 5.1% to 11.6% and 5.7% to 19.1%, respectively.[2] In the United States, roughly 2 million such infections occur annually, resulting in approximately 99,000 deaths[3] and estimated annual direct medical costs between $28.4 and $33.8 billion.[4] In Japan, nearly 9% of patients admitted to the intensive care unit (ICU) develop an infection during hospitalization,[5] and 5% of all patients hospitalized become infected with methicillin‐resistant Staphylococcus aureus.[6] The management of healthcare‐associated infections in Japan accounts for up to 5% of total annual healthcare costs, with an estimated $6.8 billion estimated to be potentially preventable.[7] In addition, healthcare‐associated infections are associated with increased length of stay in the hospital. Studies estimate surgical site infections extend length of stay by 9.7 days,[8] and bloodstream infections increase length of stay by 10 days.[9]
Improving hand hygiene practice for healthcare workers is considered a core strategy to decrease the incidence of healthcare‐associated infection.[6, 10] Specifically, the use of alcohol‐based hand rub is strongly recommended in acute care hospitals by both the World Health Organization (WHO) and the US Centers for Disease Control and Prevention.[11, 12] Improving hand hygiene adherence may reduce healthcare‐associated infection by 9% to 50%,[13, 14] and multiple studies have reported that greater use of alcohol‐based hand rubs results in significant reductions in healthcare‐associated infections.[14, 15]
Due to the difficulty in improving hand hygiene in various settings across the world, the WHO strategy for improving hand hygiene has been adopted and implemented by several studies in varying locations, such as Costa Rica, Italy, Mali, Pakistan, and Saudi Arabia.[16] Implementations of these multimodal strategies, following WHObased guidelines, have been shown to increase the level of hand hygiene adherence among healthcare workers and reduce infections at these locations.[14, 17, 18] This study expands upon that work by extending the same implementation strategy to assess the effectiveness of the introduction of alcohol‐based hand rub on hand hygiene practice at multiple hospitals in Japan.
In a previous article[19] we reported results from an observational study assessing healthcare worker hand hygiene adherence before touching the patient in 4 geographically diverse hospitals in Japan. The study reported that hand hygiene adherence in Japanese hospitals was lower than reported mean values from other international studies, and that greater adherence to hand hygiene should be encouraged. In this article, we present the results of a multimodal intervention intended to improve levels of healthcare worker hand hygiene in 3 of these hospitals.
METHODS
Participating Institutions
Three of the 4 hospitals participating in the prior observational study chose to participate in this intervention. Evaluation of hand hygiene practice was performed in at least 3 wards of each hospital including an inpatient surgical ward, an inpatient medicine ward, an ICU, or an emergency ward.
Table 1 lists the characteristics of the participating hospitals. Hospital A is a university‐affiliated, tertiary care medical center with 312 beds in East Japan. Although the hospital did not have an infection prevention unit or designated infection control nurses during the preintervention periods, the hospital hired a designated infection prevention nurse and established a department of infection prevention before this intervention in April 2012. Hospital B is a community‐based, tertiary care medical center with 428 beds, located in Midwest Japan. Although the facility had no infection control nurses at the outset of the study, a physician certified by the American Board of Internal Medicine and Infectious Diseases provided educational sessions of hand hygiene. Hospital B hired a designated infection prevention nurse and established a department of infection prevention in April 2012. Hospital C, located in Northern Japan, is a community‐based, tertiary care medical center with 562 beds. The department of infection prevention was established in 2010 and has 1 full‐time and 2 part‐time infection prevention nurses.
| Hospital A | Hospital B | Hospital C | ||||
|---|---|---|---|---|---|---|
| Preintervention | Postintervention | Preintervention | Postintervention | Preintervention | Postintervention | |
| ||||||
| Hospital characteristics | ||||||
| Location | East Japan | Midwest Japan | Northern Japan | |||
| Hospital type | University affiliated | Community based | Community based | |||
| Level of care | Tertiary care | Tertiary care | Tertiary care | |||
| Residency program | Yes | Yes | Yes | |||
| No. of beds | 250 | 312 | 428 | 428 | 550 | 562 |
| No. of employees | 398 | 475 | 1,035 | 1,263 | 1,500 | 1,568 |
| No. of physicians | 73 | 91 | 179 | 188 | 207 | 217 |
| No. of nurses | 172 | 210 | 410 | 540 | 616 | 800 |
| Infection control practice | ||||||
| Establishment of infection prevention units (year) | N/A | Yes (2012) | N/A | Yes (2012) | Yes (2010) | Yes |
| Employment of certified nurses in infection control (FTE) | 0 | 1 (1) | 0 | 1 (1) | 3 (1.5) | 3 (1.5) |
| Employment of ABIM‐IDcertified physician | 0 | 0 | 1 | 1 | 1 | 0 |
Role of the Funding Source
This study was unfunded. The prize for the contest was provided by an American collaborator (S.S.) who was not affiliated with any of the participating hospitals.
Intervention
In the prior preintervention study, hand hygiene adherence rates of healthcare workers were evaluated between July 2011 and November 2011.[19] To improve hand hygiene adherence in these facilities, we initiated a multimodal intervention based on WHO recommendations and the findings from the prior study. Each facility was provided the same guidance on how to improve hand hygiene adherence (Table 2) and encouraged to tailor the intervention to their local setting. As an added incentive, we initiated a contest, where the facility obtaining the highest hand hygiene adherence postintervention would win a trophy and 500,000 Japanese yen (approximately $5000 US dollars). The recommended strategies consisted of 15 components (Table 2): infrastructure (3 components), training and education (2 components), evaluation and feedback (5 components), reminder in the workplace (1 component), and institution safety climate (4 components). Of note, the participating institutions had already implemented a varying number of the intervention components prior to the start of the intervention. Each facility conducted a 6‐month intervention to improve hand hygiene adherence; however, the actual timing of interventions varied slightly by institution. Hospitals A and C conducted an intervention from October 2012 through March 2013, whereas hospital B's intervention was from April 2012 to September 2012. Details of the multimodal intervention performed at each participating hospital are shown in Table 3.
| Intervention Components | Description |
|---|---|
| 1. Infrastructure (3 components) | |
| Hand‐washing faucets for each room | At least 1 faucet and sink for each room was available. |
| Placement of alcohol hand rub at patient's room entrance | Alcohol hand rub was placed at all patient room entrances. |
| Portable alcohol hand rub distributed for each healthcare worker | Personal, portable alcohol hand rub dispensers were provided for healthcare workers who contact patients. |
| 2. Training/education (2 components) | |
| Educational resources | At least 1 physician or 1 nurse who provides educational sessions regarding hand hygiene practice was available. |
| Periodic seminars and lectures regarding hand hygiene education | Hospital‐wide hand hygiene seminar or educational activities were held during the intervention period. |
| 3. Evaluation and feedback (5 components) | |
| Evaluation of hand hygiene practice by direct observation | Hospitals utilize direct observation for healthcare worker's hand hygiene practice. |
| Evaluation of hand hygiene practice by monitoring the amount of alcohol hand rub consumption | Hospitals utilize the amount of alcohol hand rub consumption as a parameter for healthcare worker's hand hygiene practice. |
| Hand hygiene rate feedback at infection control committee | Hand hygiene adherence rate was reported and discussed at hospital infection control committee. |
| Hand hygiene rate feedback to the designated wards/units | Hand hygiene adherence rate was reported and discussed with healthcare workers at the designated wards/units where hand hygiene observation was performed. |
| Granting the award of top‐rated person of hand hygiene | Hospitals established the system to assess individual healthcare worker's hand hygiene adherence rate. |
| 4. Reminder in the workplace (1 components) | |
| Poster notification | Poster notification for hand hygiene practice was performed in the intervention period. |
| 5. Institutional safety climate (4 components) | |
| Commitment of hospital president or hospital executives | Hospital executives including the president agreed on the importance of hand hygiene practice and declared to healthcare workers to enhance hand hygiene practice during the intervention period. |
| Commitment of nurse managers and physician leaders | Commitment of improving hand hygiene practice by representative healthcare workers at the designated wards/units (eg, meeting by nurse manager or physician leaders at the designated wards/units and collaborative work with infection prevention services). |
| Meeting at the designated wards/units | A ward/unit‐level meeting or voluntary session for hands‐on hand hygiene practice by healthcare workers at the designated wards/units. |
| Identifying champions at the designated wards/units | An individual healthcare worker who contributed to improving hand hygiene practice was appointed. |
| Hospital A | Hospital Ba | Hospital C | ||||
|---|---|---|---|---|---|---|
| ||||||
| Intervention period | October 2012March 2013 | April 2012September 2012 | October 2012March 2013 | |||
| Evaluation of hand hygiene in the postintervention period | May 2013July 2013 | October 2012 | June 2013 | |||
| Suggested intervention components | Preintervention | Postintervention | Preintervention | Postintervention | Preintervention | Postintervention |
| No. of implemented components | 2/15 | 10/15 | 9/15 | 10/15 | 6/15 | 8/15 |
| Infrastructure (3 components) | ||||||
| Hand‐washing faucets for each room | No | No | Yes | Yes | Yes | Yes |
| Placement of alcohol hand rubs at patient's room entrance | Yes | Yes | Yes | Yes | Yes | Yes |
| Portable alcohol hand rub distributed for each healthcare worker | No | Yesb | No | Yesb | No | No |
| Training/education (2 components) | ||||||
| Educational resources | No | Yesb | Yes | Yesb | Yes | Yes |
| Periodic seminars and lectures regarding hand hygiene education | No | Yesb | Yes | Yes | Yes | Yes |
| Evaluation and feedback (5 components) | ||||||
| Evaluation of hand hygiene practice by direct observation | No | Yesb | Yes | Yes | No | No |
| Evaluation of hand hygiene practice by the amount of alcohol hand rub consumption | No | No | Yes | Yes | Yes | Yes |
| Hand hygiene rate feedback at infection control committee | No | Yesb | Yes | Yes | No | Yesb |
| Hand hygiene rate feedback to designated departments | No | Yesb | Yes | Yes | No | Yesb |
| Granting the award of top‐rated person | No | No | No | No | No | No |
| Reminders in the workplace (1 component) | ||||||
| Poster notification | Yes | Yes | Yes | Yes | Yes | Yes |
| 5. Institutional safety climate (4 components) | ||||||
| Commitment of hospital president or hospital executives | No | Yesb | No | No | No | No |
| Commitment of nurse managers and physicians leaders | No | Yesb | No | No | No | No |
| Meeting regarding hand hygiene practice by the designated wards/units | No | No | No | No | No | No |
| Identifying champions at the designated wards/units | No | No | No | No | No | No |
Observation of Hand Hygiene Practice
The same methods for hand hygiene observation used for the preintervention study was used for postintervention assessment. Ten distinct units across the 3 participating hospitals were evaluated for healthcare worker hand hygiene prior to patient contact. Three to 4 units were observed at each facility. One of the study authors (T.S.), a Japanese board‐certified infection control nurse, conducted all of the hand hygiene observations for both the preintervention and postintervention studies. Intraobserver variation was minimized by providing the same training outlined in the previous study.[19] Appropriate hand hygiene was defined as the use of soap and water or alcohol‐based hand rub before patient contact, which corresponds to the first moment of the WHO's 5 moments of hand hygiene.[11]
Hand hygiene practice prior to patient contact for each individual provider‐patient encounter was observed and recorded using the hand hygiene observation form adapted from a previous study by Saint et al.[6, 20] Identical to the preintervention study,[19] the form captured the following information: unit in which observations were performed, time of initiation and completion of observations, healthcare worker subgroup (physician or nurse), and the type of hand hygiene before patient contact (ie, hand washing with soap and water, use of alcohol‐based hand rub, or no hand hygiene). Unit physicians and nurses were informed that their clinical practices were going to be observed, but were not informed of the purpose of the observations (eg, hand hygiene adherence). To avoid interfering with clinical care delivery, the observer was given strict instructions to maintain a certain distance from the observed healthcare workers. The observer was instructed to leave immediately if asked for any reason by the unit staff or patients.
Statistical Analysis
Overall hand hygiene adherence rates were calculated and compared between the pre‐ and the postintervention periods. Comparison of hand hygiene adherence by healthcare worker subgroup and by hospital unit between the pre‐ and postintervention periods was also performed. Hand hygiene adherence rates were compared using JMP 9.0 and SAS 9.3 (SAS Institute Inc., Cary, NC). Comparison of hand hygiene adherence rates by observational periods was calculated by Pearson [2] tests, and 95% confidence intervals (CIs) were estimated using binomial distribution. Pearson correlations were used to determine the relationship of hand hygiene between physicians and nurses in the same unit. Two‐tailed P value0.05 was considered statistically significant. The study protocol was reviewed and approved by the ethics committees at the participating hospitals.
RESULTS
Data were collected from May 2013 to July 2013 in hospital A, in October 2012 in hospital B, and June 2013 in hospital C to ensure data were collected after the 6‐month intervention at each site. A total of 2982 observations of hand hygiene were performed in 10 distinct units across the 3 participating hospitals during the postintervention periods. Hand hygiene observations were performed during the day Monday through Friday between 8:30 am and 7:30 pm, with the majority occurring prior to 1:00 pm.
The overall postintervention hand hygiene adherence rate (in all 3 hospitals) was significantly higher at 32.7% (974/2982) adherence compared to 18.0% (482/2679) adherence in the preintervention period (P<0.001). An increased hand hygiene adherence rate in each participating hospital in the postintervention period was observed (Figure 1). Similar trends of higher overall hand hygiene adherence rates for both nurses and physicians in the postintervention period were seen. Use of alcohol‐based hand rub among those with appropriate hand hygiene was significantly higher, with 90.0% (880/974) using hand rub in the postintervention period versus 67.0% (322/482) in the preintervention period (P<0.001). Comparison of overall hand hygiene adherence rates by unit type and healthcare worker subgroup between the pre‐ and postintervention periods are shown in Table 4. Detailed comparisons of hand hygiene adherence rates for each hospital are available in the supplementary appendix. Although a significant improvement of hand hygiene practice was observed in the majority of participating units (6/10), there was a significant decline in hand hygiene practice in 2 units for nurses and 1 unit for physicians. Hand hygiene adherence rates by healthcare worker subgroups (both physicians and nurses) were significantly higher in the postintervention period than those in the preintervention period. Trends toward higher hand hygiene adherence rate of nurses in the postintervention period were observed (34.8% adherence for nurses compared to 30.4% adherence for physicians); the difference between nurses and physicians were not statistically significant (P=0.07).
| Ward/Unit | Healthcare Worker Subgroup | Preintervention Period | Postintervention Period | Improvement After Intervention (%) | P Value | ||
|---|---|---|---|---|---|---|---|
| No. of Observations | Hand hygiene Adherence (%) | No. of Observations | Hand Hygiene Adherence (%) | ||||
| |||||||
| All 3 hospitals | |||||||
| Surgery | Nurse | 455 | 20 | 480 | 40 | 20 | <0.001 |
| Physician | 424 | 18 | 448 | 43 | 25 | <0.001 | |
| All | 879 | 19 | 928 | 41 | 22 | <0.001 | |
| Medicine | Nurse | 455 | 23 | 508 | 39 | 16 | <0.001 |
| Physician | 435 | 15 | 452 | 33 | 18 | <0.001 | |
| All | 890 | 20 | 960 | 36 | 16 | <0.001 | |
| ICU | Nurse | 305 | 21 | 379 | 25 | 4 | 0.17 |
| Physician | 203 | 9 | 268 | 28 | 19 | <0.001 | |
| All | 508 | 16 | 647 | 26 | 10 | <0.001 | |
| ED | Nurse | 170 | 16 | 173 | 27 | 11 | 0.01 |
| Physician | 232 | 14 | 274 | 9 | ‐5 | 0.07 | |
| All | 402 | 15 | 447 | 16 | 1 | 0.64 | |
| All units | Nurse | 1385 | 21 | 1540 | 35 | 14 | <0.001 |
| Physician | 1294 | 15 | 1442 | 30 | 15 | <0.001 | |
| All | 2679 | 18 | 2982 | 33 | 15 | <0.001 | |
Hospital A achieved the highest postintervention adherence rates (39.9% adherence postintervention), as well as the greatest absolute improvement in hand hygiene (increase of 29.0%). There were significant improvements in 3 of the 4 participating units in hospital A, with the emergency department showing improvements only in the nurse subgroup. In hospital B, total hand hygiene adherence increased from 24.7% to 30.0% (P=0.01); however, this increase was mainly due to increase in hand hygiene adherence rates of nurses. There were significant increases in hand hygiene adherence rates for nurses in the medicine (+11%, P=0.04) and surgery wards (+14%, P=0.01), with nonsignificant increases for physicians (+10% medicine, P=0.07;+2% surgery, P=0.78). However, in the emergency department, nurses showed no significant improvement, and physicians had a significant decrease in adherence (15.7% preintervention vs 7.4% postintervention; P=0.02). In hospital C, total hand hygiene practice rates were significantly improved (from 18.9% to 26.5%; P<0.001); however, this was driven by improvements only in the surgical ward (14.6% preintervention to 42.3% postintervention; P<0.001). The rates for nurses declined significantly in both the medicine and ICU wards, leading to no observed improvements on those wards.
DISCUSSION
Our multicenter intervention study in Japan included observations from almost 3000 encounters between clinicians and patients. Before the intervention, the overall rate of hand hygiene adherence was 18%. After the multimodal intervention, the absolute increase in healthcare worker hand hygiene adherence was 15%. Although there was overall improvement, the adherence rates varied by hospital, with hospital A increasing by 29% and hospital B and C only attaining increases of 5% and 7%, respectively.
Despite the importance of hand hygiene of healthcare workers, it is challenging to increase hand hygiene adherence because it requires behavioral modification. Moreover, it remains uncertain what factors will affect healthcare worker behavior. We implemented pragmatic strategies to evaluate the efficacy of hand hygiene multimodal interventions based on internationally recognized WHO hand hygiene adherence strategies[11] and an institutional‐level contest with financial incentives. The findings in the current study help us understand not only how a multimodal intervention importantly improves hand hygiene adherence, but also what factors potentially make healthcare workers modify their behaviors.
In this study, we evaluated whether an institutional‐level contest with financial incentives contributed to improved hand hygiene adherence of healthcare workers. This study demonstrated improvement of hand hygiene practice after implementation of a multimodal hand hygiene intervention combined with an institutional‐level contest with financial incentives. The contest might have had a modest effect to help motivate the participating hospitals to improve their hand hygiene adherence rate. This is consistent with a previous study that demonstrated financial incentives were associated with modifying healthcare workers' hand hygiene practice.[21] However, we did not strictly standardize how the contest information was distributed in each participating institution and the objective assessment for changes in motivation by the contest was lacking in this study. Thus, changes in motivation by the contest with financial incentives likely varied by each participating institution. Further studies are needed to assess if this type of approach is worth pursuing.
We observed several noteworthy associations between the intervention components that were implemented at each facility and their improvement in hand hygiene adherence. Among the participating hospitals, hospital A was most successful with improving hand hygiene adherence, although all participating hospitals achieved a similar number of the 15 recommended intervention components during the intervention (8 to 10 per hospital). Interestingly, hospital A initiated the most new components during the intervention period (8 new components for a total of 10 out of 15), whereas hospital B and hospital C initiated only 1 or 2 new components during the intervention period. Hospital A also successfully involved hospital executives, and elicited the commitment of a nurse manager and physician leader. Consistent with a previous study,[22] we believe that involvement of hospital executives appears to be important to increase overall hand hygiene rate among healthcare workers.
In contrast, hospitals B and C did not involve senior executives or identify nurse or physician champions for all participating units. Based on the results in this study, we believe that the involvement of hospital executives is likely a key for the penetration of hospital‐wide hand hygiene culture among healthcare workers.
Although this study was unable to determine which components are precisely associated with improving hand hygiene adherence, the findings suggest initiating multiple intervention components at the same time may provide more motivation for change than initiating only 1 or 2 components at a time. It is also possible that certain intervention components were more beneficial than others. For example, hospital A, which achieved the most success, was the only hospital to obtain leadership support. Other studies have demonstrated that the presence of leadership appeared to play a key role in improving hand hygiene adherence.[23, 24] Moreover, a recent Japanese nationwide survey demonstrated higher safety centeredness was associated with regular use of standard infection prevention practice.[25] Consistent with a previous study, improving hand hygiene adherence cannot be simply achieved by improving infrastructure (eg, introduction of portable alcohol‐based hand rub) alone, but it depends on altering healthcare worker behavior.[26]
This study has several limitations. Because participating hospitals could tailor the specific interventions chosen for their facility, the improvement in hand hygiene adherence was likely multifactorial. We are unable in the existing study to determine a direct causal relationship between any of the individual intervention components and hand hygiene adherence. We are also unable to determine whether the improvements seen in hospital A were due to participation in the contest or due to the specific intervention components that were implemented. However, WHO hand hygiene guidelines point out that recognition of the importance of hand hygiene varies in different regions and countries, and the goal for hand hygiene interventions is to establish a culture of hand hygiene practice through pragmatic intervention strategies, frequent evaluation, and feedback to healthcare workers.[27] Thus, we prioritized pragmatic strategies to include in our intervention to promote hand hygiene adherence. Another limitation was the date of implementation of the multimodal intervention was slightly different at each facility. It was challenging to implement the intervention simultaneously across institutions due to competing priorities at each facility. Although the primary goal of hand hygiene is to reduce the burden of healthcare‐associated infection, we were unable to measure infection rates at the participating facilities. It is possible the presence of an external observer had an impact on the healthcare workers' behavior.[28] However, the healthcare workers were not informed as to what the observer was monitoring to minimize this potential effect. Lastly, the findings in this study provide immediate intervention effects but further study will be required to determine if these effects are sustainable.
Altering healthcare worker behavior is likely the key element to improve hand hygiene adherence, and behavioral modification may be achieved with the support of leadership at the unit and facility level. However, even though we found significant improvements in healthcare worker hand hygiene adherence after the intervention, the adherence rates are still relatively low compared to reported adherence rates from other countries,[29] suggesting further intervention is needed in this setting to optimize and hygiene practice. Because hand hygiene practice is a crucial strategy to prevent healthcare‐associated infections, every effort should be made to enhance the hand hygiene practice of healthcare workers.
Acknowledgements
The authors thank the International Ann Arbor Safety Collaborative (
Disclosure: Nothing to report.
- . Infection control—a problem for patient safety. N Engl J Med. 2003;348(7):651–656.
- World Health Organization. The burden of health care‐associated infection worldwide: a summary. Available at: http://www.who.int/gpsc/country_work/summary_20100430_en.pdf. Accessed October 6, 2014.
- , , , et al. Estimating health care‐associated infections and deaths in U.S. hospitals, 2002. Public Health Rep. 2007;122(2):160–166.
- . The direct medical costs of healthcare‐associated infections in U.S. hospitals and the benefits of prevention. Atlanta, GA: Centers for Disease Control and Prevention; 2009. Available at: http://www.cdc.gov/HAI/pdfs/hai/Scott_CostPaper.pdf. Accessed April 20, 2015.
- , , . Epidemiological approach to nosocomial infection surveillance data: the Japanese Nosocomial Infection Surveillance System. Environ Health Prev Med. 2008;13(1):30–35.
- , , , et al. Improving healthcare worker hand hygiene adherence before patient contact: a before‐and‐after five‐unit multimodal intervention in Tuscany. Qual Saf Health Care. 2009;18(6):429–433.
- . Economical efficiency of infection control. Antibiot Chemother (Northfield). 2004;20:635–638.
- , , , , , . Surgical site infection: incidence and impact on hospital utilization and treatment costs. Am J Infect Control. 2009;37(5):387–397.
- , , , , , . Hospital‐acquired, laboratory‐confirmed bloodstream infections: linking national surveillance data to clinical and financial hospital data to estimate increased length of stay and healthcare costs. J Hosp Infect. 2010;75(3):158–162.
- . APIC guideline for handwashing and hand antisepsis in health care settings. Am J Infect Control. 1995;23(4):251–269.
- World Health Organization. WHO Guidelines on Hand Hygiene in Health Care. Clean care is safer care: first global patient safety challenge. Geneva, Switzerland; 2009. Available at: http://www.who.int/gpsc/en/index.html. Accessed October 6, 2014.
- , ; Healthcare Infection Control Practices Advisory Committee, HICPAC SHEA APIC IDSA Hand Hygiene Task Force. Guideline for hand hygiene in health‐care settings. Recommendations of the Healthcare Infection Control Practices Advisory Committee and the HICPAC/SHEA/APIC/IDSA Hand Hygiene Task Force. Society for Healthcare Epidemiology of America/Association for Professionals in Infection Control/Infectious Diseases Society of America. MMWR Recomm Rep. 2002;51(RR‐16):1–45.
- National Patient Safety Agency. The economic case: implementing near‐patient alcohol hand rum in your trust. London, United Kingdom; 2004. Available at: http://www.npsa.nhs.uk/cleanyourhands/resource‐area/evidence‐base/?EntryId34=58433. Accessed October 9, 2014.
- , , , et al. Effectiveness of a hospital‐wide programme to improve compliance with hand hygiene. Infection Control Programme. Lancet. 2000;356(9238):1307–1312.
- , . Role of hand hygiene in healthcare‐associated infection prevention. J Hosp Infect. 2009;73(4):305–315.
- , , , et al. Global implementation of WHO's multimodal strategy for improvement of hand hygiene: a quasi‐experimental study. Lancet Infect Dis. 2013;13(10):843–851.
- , , , et al. Impact of the International Nosocomial Infection Control Consortium (INICC) multidimensional hand hygiene approach over 13 years in 51 cities of 19 limited‐resource countries from Latin America, Asia, the Middle East, and Europe. Infect Control Hosp Epidemiol. 2013;34(4):415–423.
- , , , . Bundling hand hygiene interventions and measurement to decrease health care‐associated infections. Am J Infect Control. 2012;40(4 suppl 1):S18–S27.
- , , , et al. Hand hygiene adherence among health care workers at Japanese hospitals: a multicenter observational study in Japan [published online April 8, 2014]. J Patient Saf. doi: 10.1097/PTS.0000000000000108.
- , , , et al. Marked variability in adherence to hand hygiene: a 5‐unit observational study in Tuscany. Am J Infect Control. 2009;37(4):306–310.
- , , , et al. Sustained improvement in hand hygiene adherence: utilizing shared accountability and financial incentives. Infect Control Hosp Epidemiol. 2013;34(11):1129–1136.
- , , , . Status of the implementation of the World Health Organization multimodal hand hygiene strategy in United States of America health care facilities. Am J Infect Control. 2014;42(3):224–230.
- , , , et al. The effect of leadership on hand hygiene: assessing hand hygiene adherence prior to patient contact in 2 infectious disease units in Tuscany. Infect Control Hosp Epidemiol. 2014;35(3):313–316.
- , , , , , . Impact of a hospital‐wide hand hygiene initiative on healthcare‐associated infections: results of an interrupted time series. BMJ Qual Saf. 2012;21(12):1019–1026.
- , , , , , . Health care‐associated infection prevention in Japan: the role of safety culture. Am J Infect Control. 2014;42(8):888–893.
- , , . Why healthcare workers don't wash their hands: a behavioral explanation. Infect Control Hosp Epidemiol. 2006;27(5):484–492.
- World Health Organization. Guide to implementation. A guide to the implementation of the WHO multimodal hand hygiene improvement strategy. Available at: http://whqlibdoc.who.int/hq/2009/WHO_IER_PSP_2009.02_eng.pdf. Accessed October 9, 2014.
- , , , et al. Compliance of health care workers with hand hygiene practices: independent advantages of overt and covert observers. PLoS One. 2013;8(1):e53746.
- , , , et al. Systematic review of studies on compliance with hand hygiene guidelines in hospital care. Infect Control Hosp Epidemiol. 2010;31(3):283–294.
© 2015 Society of Hospital Medicine
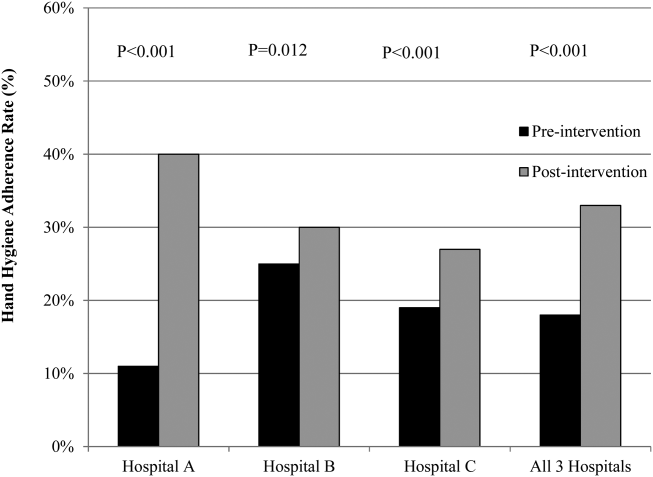
Invasive Compartment Pressure Testing for Chronic Exertional Compartment Syndrome: A Survey of Clinical Practice Among Military Orthopedic Surgeons
Chronic exertional compartment syndrome (CECS) is a common cause of leg pain during exertion in athletic and active-duty populations.1 It is caused by an increase in intramuscular pressure to a point that the tissues within the involved compartment become ischemic because of a decrease in arteriolar blood flow.2 This relative ischemia causes pain and may also be associated with neurologic symptoms. By definition, the pain associated with CECS resolves with rest. Patients typically describe a feeling of fullness or tightness, which eventually evolves into pain as they continue exercising. Pain onset is usually predictable and reproducible after a finite amount of time and/or intensity of exercise.
The differential diagnosis of leg pain during exercise includes CECS, medial tibial stress syndrome, popliteal entrapment syndrome, myopathy, peripheral nerve entrapment syndromes, stress fracture, and effort-induced rhabdomyolysis.3 CECS can be differentiated from other causes of leg pain with measurement of compartment pressures (the standard recommendation).4 Compartment pressure measurement, however, is invasive, time-consuming, and painful and may be associated with bleeding risk, infection, and nerve injury. Noninvasive means of testing for CECS (eg, magnetic resonance imaging [MRI], near-infrared spectroscopy [NIRS], thallium stress testing) remain experimental and expensive and are not easily accessible at all institutions.5-8 While invasive compartment pressure (ICP) testing remains an important tool in the diagnosis of CECS, its criteria and execution vary considerably. Aweid and colleagues4 performed a meta-analysis of use of ICP testing in the diagnosis of CECS and concluded that, though elevated ICP measurements are accepted as the gold standard for diagnosing CECS, the criteria outlined for a positive test lack high-level supporting evidence. In addition, how the test is performed has been inconsistent across studies—further clouding the literature.4
The review by Aweid and colleagues4 highlights the deficiencies in diagnosing CECS by ICP testing. In clinical practice, ICP testing is challenging for both the patient and physician. As other validated, less-invasive tests are lacking, emphasis should remain on the history and the physical examination. Although all athletic populations are at risk for CECS, the active-duty military population is at particularly high risk because of the physical requirements and demands of military service.1,9
We surveyed military orthopedic surgeons to investigate the clinical practice of performing ICP testing in patients with suspected CECS. We hypothesized that the rate of ICP testing among military orthopedic surgeons would not be 100% for patients with the typical signs and symptoms of CECS.
Materials and Methods
This study was approved by the institutional review board at Wright-Patterson Medical Center at Wright-Patterson Air Force Base in Ohio. A link to an online survey was distributed by email to members of the Society of Military Orthopaedic Surgeons. The anonymous survey polled the surgeons regarding basic demographic data and clinical practice as it pertains to the evaluation and treatment of CECS. No patient-protected health information was obtained. Survey results were compiled in a Microsoft Excel file for analysis.
Results
The survey was distributed to 606 email accounts; the response rate was 19% (114/606). Ninety-one surgeons (80%) indicated they have patients with CECS in their practice (Figure 1). Surgeons were asked how many CECS patients they see per year (responses are summarized in Figure 2) and how many years they have been in practice (Table).
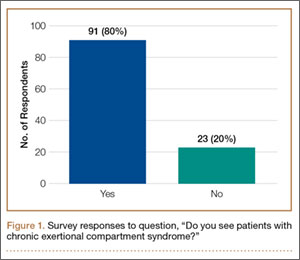
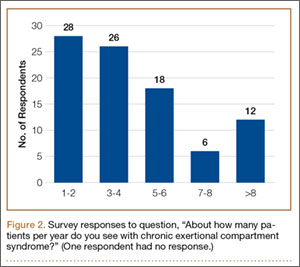
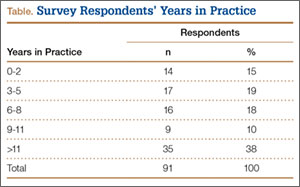
Ninety-three percent of the respondents agreed or strongly agreed that ICP testing is unpleasant for the patient (Figure 3), and 90% would prefer a less-invasive test for confirmatory testing for CECS (Figure 4). Only 13% of respondents indicated they actually use noninvasive modalities (eg, MRI, NIRS) to confirm the diagnosis of CECS (Figure 5).
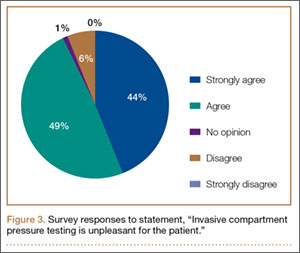
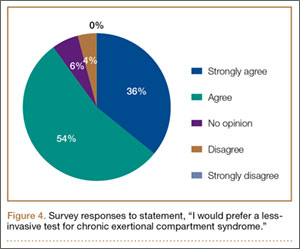
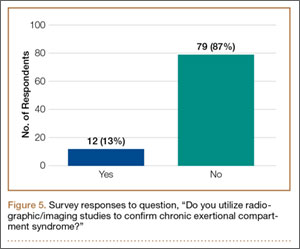
Respondents were asked about the practice of using ICP testing in the diagnosis of CECS (responses are summarized in Figures 6, 7). Although 85% of respondents agreed or strongly agreed with always confirming the diagnosis of CECS with ICP testing, 39% stated they would recommend surgical treatment without ICP testing if they were confident about the diagnosis based on clinical examination findings.
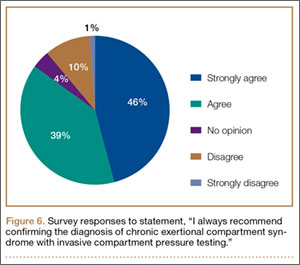
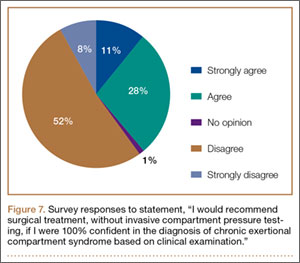
To better understand the apparent discrepancy between the percentage of surgeons who agreed or strongly agreed with always recommending ICP testing (85%) and the percentage who would recommend treatment without testing (39%), responses were stratified by clinical experience. Surgeons in practice more than 11 years (n = 35) were compared with those in practice 5 years or less (n = 31) (Table). Although the vast majority (85%) of respondents from both groups agreed or strongly agreed with always recommending ICP testing, 49% of those in practice more than 11 years and 29% in practice 5 years or less indicated they would recommend surgical treatment for CECS based solely on clinical examination findings (Figures 8, 9).
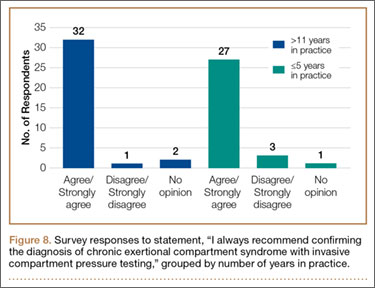
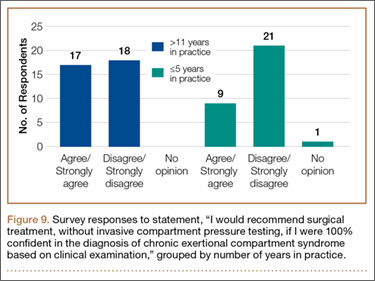
Responses were also stratified by number of CECS patients seen by each surgeon per year. Twenty-eight respondents saw 1 or 2 patients per year, and 12 saw more than 8 patients per year—31% and 13% of the total number of respondents, respectively. Of the respondents who saw 1 or 2 patients, 86% (24/28) agreed or strongly agreed with always recommending ICP testing—comparable to the 75% (9/12) who saw more than 8 patients (Figure 10). However, of the respondents who saw 1 or 2 patients, 36% (10/28) indicated they would recommend surgical treatment, without ICP testing, if they were confident about the clinical diagnosis of CECS—in contrast to the 75% (9/12) who saw more than 8 patients (Figure 11).
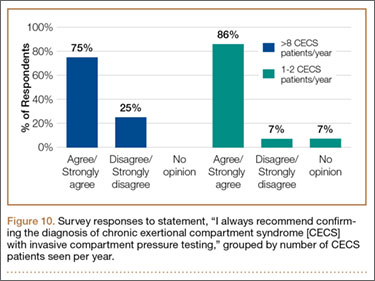
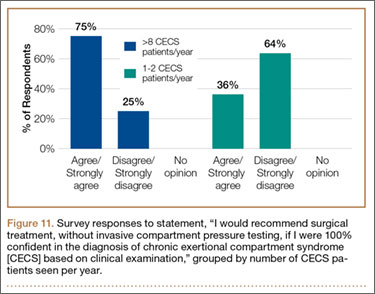
Discussion
CECS is a common cause of leg pain and a significant cause of disability among the active-duty military population. This was illustrated in 2 recent studies by Waterman and colleagues.1,9 The first1 investigated failure rates and disability after surgery for CECS among those on active duty. The authors showed that CECS is a substantial contributor to lower extremity disability in the military population and that there is a substantial risk for persistent symptoms despite surgical treatment. Nearly 1 in 5 patients experienced surgical failure after elective fasciotomy, and about 28% of patients were unable to return to the full activity required in the military. The second, more recent study9 was an epidemiologic study of risk factors associated with CECS in a physically active military population. The authors identified 4100 cases diagnosed between 2006 and 2011—representing an overall annual incidence of 0.49 per 1000 at-risk person-years, or about 683 cases per year; the authors also showed the incidence increased during the time period studied.
The diagnosis of CECS remains imperfect. A clinical history of exercise-induced lower leg pain that is relieved with rest suggests the diagnosis, but a confirmatory test is needed to distinguish CECS from other causes of exercise-induced leg pain. Although direct measurement of compartment pressures is the test used most often, it is invasive and time-consuming, can be uncomfortable for the patient, and may be associated with bleeding risk, infection, and nerve injury. Pedowitz and colleagues10 described the ICP testing criteria now generally used in the diagnosis of CECS. Unfortunately, there is little objective evidence supporting these criteria.4 Although less invasive tests (eg, MRI, NIRS) have been described,5-8 they may not be readily available across institutions, and further study is needed to validate their use in diagnosing CECS.
While an objective, validated test or measurement for confirming the diagnosis of CECS remains elusive, the outcomes after surgical treatment of CECS also remain imperfect. Surgery consists of both open and endoscopically assisted fasciotomy of the involved compartments.2,11-17 Reports of improvement after treatment range from 81% to 100%3; however, symptom relief does not come for all patients, particularly those in the military. Waterman and colleagues1 found a failure rate of about 20% among an active-duty military population. Packer and colleagues18 examined civilians with CECS, treated both operatively and nonoperatively. Patients in this series were diagnosed with CECS based on clinical symptoms as well as compartment pressure measurements according to the Pedowitz criteria. Although overall outcomes were better for operatively treated patients than for nonoperatively treated patients, only 47% of patients were completely pain-free, and 21% were unable to return to full activity.
More recent studies have explored use of other nonoperative treatment modalities. Diebal and colleagues19,20 used a running retraining program to treat patients with CECS. They based this treatment on the hypothesis that a heel-strike running pattern is associated with increased anterior compartment pressures.21 CECS patients who underwent a 6-week systematic treatment program focused on forefoot running, stride shortening, and hamstring activation during push-off experienced a decrease in clinical symptoms and posttreatment intracompartmental pressures.20 The improvements in clinical scores were maintained at 1-year follow-up. Another nonoperative intervention, recently described by Isner-Horobeti and colleagues,22 involves injecting botulinum toxin A (BoNT-A) into the anterior and lateral compartments of the leg. Sixteen patients with CECS received BoNT-A injections. On average, intracompartmental pressures were lower after injection than they were before injection. In addition, exertional pain was eliminated in 15 patients at an average follow-up of 4.4 months.
This survey-based study examined the practice patterns of military orthopedic surgeons who performed ICP testing for cases of suspected CECS. Our hypothesis was that, though ICP testing is the most commonly accepted method for confirming the diagnosis of CECS, the ICP testing rate would not be 100% among those surveyed.
The results of our study uncover an apparent inconsistency in survey responses among physicians who evaluate and treat patients with CECS. About 85% of respondents stated they would always recommend confirming the diagnosis of CECS with ICP testing. However, about 40% stated they would recommend surgical treatment without confirmatory testing if they were confident about the diagnosis based on clinical findings. In other words, only 60% of the respondents disagreed or strongly disagreed with pursuing surgical treatment without testing. One would expect a closer correlation between respondents who would always recommend ICP testing and those who disagreed with recommending surgical treatment without ICP testing. This raises the question of what actually occurs when CECS is suspected in clinical practice.
To better understand the apparent discrepancy between respondents who agreed or strongly agreed with always recommending ICP testing and respondents who would recommend treatment without testing, we grouped responses by clinical experience. Although 85% of respondents (no matter the number of years in practice) agreed or strongly agreed with the statement, “I always recommend confirming the diagnosis of CECS with ICP measurements,” 49% of those in practice more than 11 years (vs. 29% of those in practice 5 years or less) agreed or strongly agreed with recommending surgery without testing if they were 100% confident about the diagnosis of CECS based solely on clinical findings. This may suggest that, though most agreed that the gold standard for confirming the diagnosis of CECS remains ICP testing, those with more clinical experience were more comfortable forgoing this diagnostic measure and recommending treatment without testing.
Another measure of clinical experience used in this survey was based on number of CECS patients seen per year. Responses of surgeons who saw 1 or 2 patients with CECS per year were compared with responses of surgeons who saw more than 8 patients with CECS per year. Of the respondents who saw 1 or 2 patients, 86% agreed or strongly agreed with always recommending ICP testing to confirm CECS—comparable to the 75% who saw more than 8 patients. However, of the respondents who saw 1 or 2 patients, 36% indicated they would recommend surgical treatment, without ICP testing, if they were confident about the clinical diagnosis of CECS—in contrast to the 75% who saw more than 8 patients.
Responses regarding the absolute of always recommending ICP testing and the absolute of being 100% confident about the clinical diagnosis of CECS highlight differences between the surgeons with more experience (>11 years in practice, >8 CECS patients per year) and those with less experience (≤5 years in practice, 1 or 2 CECS patients per year). Surgeons in practice longer, and surgeons who saw more patients with suspected CECS per year, were more likely to recommend surgical treatment based solely on clinical findings.
Conclusion
CECS can cause debilitating activity-related leg pain in both civilian and military populations. Treatment with fasciotomy is often curative, but a significant number of patients may continue to have pain and disability. As the incidence of treatment failures may be higher in the military than in civilians, proper evaluation of patients with suspected CECS is particularly important for military orthopedic surgeons. The diagnosis of CECS can be challenging to both the clinician and patient, and diagnostic modalities remain imperfect. The results of this study highlight this, revealing less than 100% agreement regarding use of ICP testing (the gold standard) for diagnosis of CECS.
This study also highlights the need for an improved method of diagnosing CECS since 93% of respondents agreed or strongly agreed that ICP testing is unpleasant for the patient, and 90% would prefer a less-invasive test. In addition, the ICP testing criteria for establishing the diagnosis of CECS remain inconsistent. If a reliable, consistent, and less-invasive test were available, perhaps there would be less variability in practitioners’ evaluations of patients with CECS.
This study shows an inconsistency among military orthopedic surgeons evaluating and treating patients with CECS. As testing modalities for CECS remain imperfect, clinical acumen and experience assume an important role in the assessment of patients with suspected CECS.
1. Waterman BR, Laughlin M, Kilcoyne K, Cameron KL, Owens BD. Surgical treatment of chronic exertional compartment syndrome of the leg: failure rates and postoperative disability in an active patient population. J Bone Joint Surg Am. 2013;95(7):592-596.
2. Mubarak SJ, Pedowitz RA, Hargens AR. Compartment syndromes. Curr Orthop. 1989;3:36-40.
3. Fraipont MJ, Adamson GJ. Chronic exertional compartment syndrome. J Am Acad Orthop Surg. 2003;11(4):268-276.
4. Aweid O, Del Buono A, Malliaras P, et al. Systematic review and recommendations for intracompartmental pressure monitoring in diagnosing chronic exertional compartment syndrome of the leg. Clin J Sport Med. 2012;22(4):356-370.
5. Ringler MD, Litwiller DV, Felmlee JP, et al. MRI accurately detects chronic exertional compartment syndrome: a validation study. Skeletal Radiol. 2013;42(3):385-392.
6. van den Brand JG, Verleisdonk EJ, van der Werken C. Near infrared spectroscopy in the diagnosis of chronic exertional compartment syndrome. Am J Sports Med. 2004;32(2):452-456.
7. van den Brand JG, Nelson T, Verleisdonk EJ, van der Werken C. The diagnostic value of intracompartmental pressure measurement, magnetic resonance imaging, and near-infrared spectroscopy in chronic exertional compartment syndrome: a prospective study in 50 patients. Am J Sports Med. 2005;33(5):699-704.
8. Verleisdonk EJ, van Gils A, van der Werken C. The diagnostic value of MRI scans for the diagnosis of chronic exertional compartment syndrome of the lower leg. Skeletal Radiol. 2001;30(6):321-325.
9. Waterman BR, Liu J, Newcomb R, Schoenfeld AJ, Orr JD, Belmont PJ Jr. Risk factors for chronic exertional compartment syndrome in a physically active military population. Am J Sports Med. 2013;41(11):2545-2549.
10. Pedowitz RA, Hargens AR, Mubarek SJ, Gershuni DH. Modified criteria for the objective diagnosis of chronic compartment syndrome of the leg. Am J Sports Med. 1990;18(1):35-40.1. Rorabeck CH, Bourne RB, Fowler PJ. The surgical treatment of exertional compartment syndrome in athletes. J Bone Joint Surg Am. 1983;65(9):1245-1251.
12. Rorabeck CH, Fowler PJ, Nott L. The results of fasciotomy in the management of chronic exertional compartment syndrome. Am J Sports Med. 1988;16(3):224-227.
13. Detmer DE, Sharpe K, Sufit RL, Girdley FM. Chronic compartment syndrome: diagnosis, management, and outcomes. Am J Sports Med. 1985;13(3):162-170.
14. Stein DA, Sennett BJ. One-portal endoscopically assisted fasciotomy for exertional compartment syndrome. Arthroscopy. 2005;21(1):108-112.
15. Fronek J, Mubarak SJ, Hargens AR, et al. Management of chronic exertional anterior compartment syndrome of the lower extremity. Clin Orthop Relat Res. 1989;(220):217-227.
16. Leversedge FJ, Casey PJ, Seiler JG 3rd, Xerogeanes JW. Endoscopically assisted fasciotomy: description of technique and in vitro assessment of lower-leg compartment decompression. Am J Sports Med. 2002;30(2):272-278.
17. Schepsis AA, Martini D, Corbett M. Surgical management of exertional compartment syndrome of the lower leg. Long-term followup. Am J Sports Med. 1993;21(6):811-817.
18. Packer JD, Day MS, Nguyen JT, Hobart SJ, Hannafin JA, Metzl JD. Functional outcomes and patient satisfaction after fasciotomy for chronic exertional compartment syndrome. Am J Sports Med. 2013;41(2):430-436.
19. Diebal AR, Gregory R, Alitz C, Gerber JP. Effects of forefoot running on chronic exertional compartment syndrome: a case series. Int J Sports Phys Ther. 2011;6(4):312-321.
20. Diebal AR, Gregory R, Alitz C, Gerber JP. Forefoot running improves pain and disability associated with chronic exertional compartment syndrome. Am J Sports Med. 2012;40(5):1060-1067.
21. Kirby RL, McDermott AG. Anterior tibial compartment pressures during running with rearfoot and forefoot landing styles. Arch Phys Med Rehabil. 1983;64(7):296-299.
22. Isner-Horobeti ME, Dufour SP, Blaes C, Lecocq J. Intramuscular pressure before and after botulinum toxin in chronic exertional compartment syndrome of the leg: a preliminary study. Am J Sports Med. 2013;41(11):2558-2566.
Chronic exertional compartment syndrome (CECS) is a common cause of leg pain during exertion in athletic and active-duty populations.1 It is caused by an increase in intramuscular pressure to a point that the tissues within the involved compartment become ischemic because of a decrease in arteriolar blood flow.2 This relative ischemia causes pain and may also be associated with neurologic symptoms. By definition, the pain associated with CECS resolves with rest. Patients typically describe a feeling of fullness or tightness, which eventually evolves into pain as they continue exercising. Pain onset is usually predictable and reproducible after a finite amount of time and/or intensity of exercise.
The differential diagnosis of leg pain during exercise includes CECS, medial tibial stress syndrome, popliteal entrapment syndrome, myopathy, peripheral nerve entrapment syndromes, stress fracture, and effort-induced rhabdomyolysis.3 CECS can be differentiated from other causes of leg pain with measurement of compartment pressures (the standard recommendation).4 Compartment pressure measurement, however, is invasive, time-consuming, and painful and may be associated with bleeding risk, infection, and nerve injury. Noninvasive means of testing for CECS (eg, magnetic resonance imaging [MRI], near-infrared spectroscopy [NIRS], thallium stress testing) remain experimental and expensive and are not easily accessible at all institutions.5-8 While invasive compartment pressure (ICP) testing remains an important tool in the diagnosis of CECS, its criteria and execution vary considerably. Aweid and colleagues4 performed a meta-analysis of use of ICP testing in the diagnosis of CECS and concluded that, though elevated ICP measurements are accepted as the gold standard for diagnosing CECS, the criteria outlined for a positive test lack high-level supporting evidence. In addition, how the test is performed has been inconsistent across studies—further clouding the literature.4
The review by Aweid and colleagues4 highlights the deficiencies in diagnosing CECS by ICP testing. In clinical practice, ICP testing is challenging for both the patient and physician. As other validated, less-invasive tests are lacking, emphasis should remain on the history and the physical examination. Although all athletic populations are at risk for CECS, the active-duty military population is at particularly high risk because of the physical requirements and demands of military service.1,9
We surveyed military orthopedic surgeons to investigate the clinical practice of performing ICP testing in patients with suspected CECS. We hypothesized that the rate of ICP testing among military orthopedic surgeons would not be 100% for patients with the typical signs and symptoms of CECS.
Materials and Methods
This study was approved by the institutional review board at Wright-Patterson Medical Center at Wright-Patterson Air Force Base in Ohio. A link to an online survey was distributed by email to members of the Society of Military Orthopaedic Surgeons. The anonymous survey polled the surgeons regarding basic demographic data and clinical practice as it pertains to the evaluation and treatment of CECS. No patient-protected health information was obtained. Survey results were compiled in a Microsoft Excel file for analysis.
Results
The survey was distributed to 606 email accounts; the response rate was 19% (114/606). Ninety-one surgeons (80%) indicated they have patients with CECS in their practice (Figure 1). Surgeons were asked how many CECS patients they see per year (responses are summarized in Figure 2) and how many years they have been in practice (Table).
Ninety-three percent of the respondents agreed or strongly agreed that ICP testing is unpleasant for the patient (Figure 3), and 90% would prefer a less-invasive test for confirmatory testing for CECS (Figure 4). Only 13% of respondents indicated they actually use noninvasive modalities (eg, MRI, NIRS) to confirm the diagnosis of CECS (Figure 5).
Respondents were asked about the practice of using ICP testing in the diagnosis of CECS (responses are summarized in Figures 6, 7). Although 85% of respondents agreed or strongly agreed with always confirming the diagnosis of CECS with ICP testing, 39% stated they would recommend surgical treatment without ICP testing if they were confident about the diagnosis based on clinical examination findings.
To better understand the apparent discrepancy between the percentage of surgeons who agreed or strongly agreed with always recommending ICP testing (85%) and the percentage who would recommend treatment without testing (39%), responses were stratified by clinical experience. Surgeons in practice more than 11 years (n = 35) were compared with those in practice 5 years or less (n = 31) (Table). Although the vast majority (85%) of respondents from both groups agreed or strongly agreed with always recommending ICP testing, 49% of those in practice more than 11 years and 29% in practice 5 years or less indicated they would recommend surgical treatment for CECS based solely on clinical examination findings (Figures 8, 9).
Responses were also stratified by number of CECS patients seen by each surgeon per year. Twenty-eight respondents saw 1 or 2 patients per year, and 12 saw more than 8 patients per year—31% and 13% of the total number of respondents, respectively. Of the respondents who saw 1 or 2 patients, 86% (24/28) agreed or strongly agreed with always recommending ICP testing—comparable to the 75% (9/12) who saw more than 8 patients (Figure 10). However, of the respondents who saw 1 or 2 patients, 36% (10/28) indicated they would recommend surgical treatment, without ICP testing, if they were confident about the clinical diagnosis of CECS—in contrast to the 75% (9/12) who saw more than 8 patients (Figure 11).
Discussion
CECS is a common cause of leg pain and a significant cause of disability among the active-duty military population. This was illustrated in 2 recent studies by Waterman and colleagues.1,9 The first1 investigated failure rates and disability after surgery for CECS among those on active duty. The authors showed that CECS is a substantial contributor to lower extremity disability in the military population and that there is a substantial risk for persistent symptoms despite surgical treatment. Nearly 1 in 5 patients experienced surgical failure after elective fasciotomy, and about 28% of patients were unable to return to the full activity required in the military. The second, more recent study9 was an epidemiologic study of risk factors associated with CECS in a physically active military population. The authors identified 4100 cases diagnosed between 2006 and 2011—representing an overall annual incidence of 0.49 per 1000 at-risk person-years, or about 683 cases per year; the authors also showed the incidence increased during the time period studied.
The diagnosis of CECS remains imperfect. A clinical history of exercise-induced lower leg pain that is relieved with rest suggests the diagnosis, but a confirmatory test is needed to distinguish CECS from other causes of exercise-induced leg pain. Although direct measurement of compartment pressures is the test used most often, it is invasive and time-consuming, can be uncomfortable for the patient, and may be associated with bleeding risk, infection, and nerve injury. Pedowitz and colleagues10 described the ICP testing criteria now generally used in the diagnosis of CECS. Unfortunately, there is little objective evidence supporting these criteria.4 Although less invasive tests (eg, MRI, NIRS) have been described,5-8 they may not be readily available across institutions, and further study is needed to validate their use in diagnosing CECS.
While an objective, validated test or measurement for confirming the diagnosis of CECS remains elusive, the outcomes after surgical treatment of CECS also remain imperfect. Surgery consists of both open and endoscopically assisted fasciotomy of the involved compartments.2,11-17 Reports of improvement after treatment range from 81% to 100%3; however, symptom relief does not come for all patients, particularly those in the military. Waterman and colleagues1 found a failure rate of about 20% among an active-duty military population. Packer and colleagues18 examined civilians with CECS, treated both operatively and nonoperatively. Patients in this series were diagnosed with CECS based on clinical symptoms as well as compartment pressure measurements according to the Pedowitz criteria. Although overall outcomes were better for operatively treated patients than for nonoperatively treated patients, only 47% of patients were completely pain-free, and 21% were unable to return to full activity.
More recent studies have explored use of other nonoperative treatment modalities. Diebal and colleagues19,20 used a running retraining program to treat patients with CECS. They based this treatment on the hypothesis that a heel-strike running pattern is associated with increased anterior compartment pressures.21 CECS patients who underwent a 6-week systematic treatment program focused on forefoot running, stride shortening, and hamstring activation during push-off experienced a decrease in clinical symptoms and posttreatment intracompartmental pressures.20 The improvements in clinical scores were maintained at 1-year follow-up. Another nonoperative intervention, recently described by Isner-Horobeti and colleagues,22 involves injecting botulinum toxin A (BoNT-A) into the anterior and lateral compartments of the leg. Sixteen patients with CECS received BoNT-A injections. On average, intracompartmental pressures were lower after injection than they were before injection. In addition, exertional pain was eliminated in 15 patients at an average follow-up of 4.4 months.
This survey-based study examined the practice patterns of military orthopedic surgeons who performed ICP testing for cases of suspected CECS. Our hypothesis was that, though ICP testing is the most commonly accepted method for confirming the diagnosis of CECS, the ICP testing rate would not be 100% among those surveyed.
The results of our study uncover an apparent inconsistency in survey responses among physicians who evaluate and treat patients with CECS. About 85% of respondents stated they would always recommend confirming the diagnosis of CECS with ICP testing. However, about 40% stated they would recommend surgical treatment without confirmatory testing if they were confident about the diagnosis based on clinical findings. In other words, only 60% of the respondents disagreed or strongly disagreed with pursuing surgical treatment without testing. One would expect a closer correlation between respondents who would always recommend ICP testing and those who disagreed with recommending surgical treatment without ICP testing. This raises the question of what actually occurs when CECS is suspected in clinical practice.
To better understand the apparent discrepancy between respondents who agreed or strongly agreed with always recommending ICP testing and respondents who would recommend treatment without testing, we grouped responses by clinical experience. Although 85% of respondents (no matter the number of years in practice) agreed or strongly agreed with the statement, “I always recommend confirming the diagnosis of CECS with ICP measurements,” 49% of those in practice more than 11 years (vs. 29% of those in practice 5 years or less) agreed or strongly agreed with recommending surgery without testing if they were 100% confident about the diagnosis of CECS based solely on clinical findings. This may suggest that, though most agreed that the gold standard for confirming the diagnosis of CECS remains ICP testing, those with more clinical experience were more comfortable forgoing this diagnostic measure and recommending treatment without testing.
Another measure of clinical experience used in this survey was based on number of CECS patients seen per year. Responses of surgeons who saw 1 or 2 patients with CECS per year were compared with responses of surgeons who saw more than 8 patients with CECS per year. Of the respondents who saw 1 or 2 patients, 86% agreed or strongly agreed with always recommending ICP testing to confirm CECS—comparable to the 75% who saw more than 8 patients. However, of the respondents who saw 1 or 2 patients, 36% indicated they would recommend surgical treatment, without ICP testing, if they were confident about the clinical diagnosis of CECS—in contrast to the 75% who saw more than 8 patients.
Responses regarding the absolute of always recommending ICP testing and the absolute of being 100% confident about the clinical diagnosis of CECS highlight differences between the surgeons with more experience (>11 years in practice, >8 CECS patients per year) and those with less experience (≤5 years in practice, 1 or 2 CECS patients per year). Surgeons in practice longer, and surgeons who saw more patients with suspected CECS per year, were more likely to recommend surgical treatment based solely on clinical findings.
Conclusion
CECS can cause debilitating activity-related leg pain in both civilian and military populations. Treatment with fasciotomy is often curative, but a significant number of patients may continue to have pain and disability. As the incidence of treatment failures may be higher in the military than in civilians, proper evaluation of patients with suspected CECS is particularly important for military orthopedic surgeons. The diagnosis of CECS can be challenging to both the clinician and patient, and diagnostic modalities remain imperfect. The results of this study highlight this, revealing less than 100% agreement regarding use of ICP testing (the gold standard) for diagnosis of CECS.
This study also highlights the need for an improved method of diagnosing CECS since 93% of respondents agreed or strongly agreed that ICP testing is unpleasant for the patient, and 90% would prefer a less-invasive test. In addition, the ICP testing criteria for establishing the diagnosis of CECS remain inconsistent. If a reliable, consistent, and less-invasive test were available, perhaps there would be less variability in practitioners’ evaluations of patients with CECS.
This study shows an inconsistency among military orthopedic surgeons evaluating and treating patients with CECS. As testing modalities for CECS remain imperfect, clinical acumen and experience assume an important role in the assessment of patients with suspected CECS.
1. Waterman BR, Laughlin M, Kilcoyne K, Cameron KL, Owens BD. Surgical treatment of chronic exertional compartment syndrome of the leg: failure rates and postoperative disability in an active patient population. J Bone Joint Surg Am. 2013;95(7):592-596.
2. Mubarak SJ, Pedowitz RA, Hargens AR. Compartment syndromes. Curr Orthop. 1989;3:36-40.
3. Fraipont MJ, Adamson GJ. Chronic exertional compartment syndrome. J Am Acad Orthop Surg. 2003;11(4):268-276.
4. Aweid O, Del Buono A, Malliaras P, et al. Systematic review and recommendations for intracompartmental pressure monitoring in diagnosing chronic exertional compartment syndrome of the leg. Clin J Sport Med. 2012;22(4):356-370.
5. Ringler MD, Litwiller DV, Felmlee JP, et al. MRI accurately detects chronic exertional compartment syndrome: a validation study. Skeletal Radiol. 2013;42(3):385-392.
6. van den Brand JG, Verleisdonk EJ, van der Werken C. Near infrared spectroscopy in the diagnosis of chronic exertional compartment syndrome. Am J Sports Med. 2004;32(2):452-456.
7. van den Brand JG, Nelson T, Verleisdonk EJ, van der Werken C. The diagnostic value of intracompartmental pressure measurement, magnetic resonance imaging, and near-infrared spectroscopy in chronic exertional compartment syndrome: a prospective study in 50 patients. Am J Sports Med. 2005;33(5):699-704.
8. Verleisdonk EJ, van Gils A, van der Werken C. The diagnostic value of MRI scans for the diagnosis of chronic exertional compartment syndrome of the lower leg. Skeletal Radiol. 2001;30(6):321-325.
9. Waterman BR, Liu J, Newcomb R, Schoenfeld AJ, Orr JD, Belmont PJ Jr. Risk factors for chronic exertional compartment syndrome in a physically active military population. Am J Sports Med. 2013;41(11):2545-2549.
10. Pedowitz RA, Hargens AR, Mubarek SJ, Gershuni DH. Modified criteria for the objective diagnosis of chronic compartment syndrome of the leg. Am J Sports Med. 1990;18(1):35-40.1. Rorabeck CH, Bourne RB, Fowler PJ. The surgical treatment of exertional compartment syndrome in athletes. J Bone Joint Surg Am. 1983;65(9):1245-1251.
12. Rorabeck CH, Fowler PJ, Nott L. The results of fasciotomy in the management of chronic exertional compartment syndrome. Am J Sports Med. 1988;16(3):224-227.
13. Detmer DE, Sharpe K, Sufit RL, Girdley FM. Chronic compartment syndrome: diagnosis, management, and outcomes. Am J Sports Med. 1985;13(3):162-170.
14. Stein DA, Sennett BJ. One-portal endoscopically assisted fasciotomy for exertional compartment syndrome. Arthroscopy. 2005;21(1):108-112.
15. Fronek J, Mubarak SJ, Hargens AR, et al. Management of chronic exertional anterior compartment syndrome of the lower extremity. Clin Orthop Relat Res. 1989;(220):217-227.
16. Leversedge FJ, Casey PJ, Seiler JG 3rd, Xerogeanes JW. Endoscopically assisted fasciotomy: description of technique and in vitro assessment of lower-leg compartment decompression. Am J Sports Med. 2002;30(2):272-278.
17. Schepsis AA, Martini D, Corbett M. Surgical management of exertional compartment syndrome of the lower leg. Long-term followup. Am J Sports Med. 1993;21(6):811-817.
18. Packer JD, Day MS, Nguyen JT, Hobart SJ, Hannafin JA, Metzl JD. Functional outcomes and patient satisfaction after fasciotomy for chronic exertional compartment syndrome. Am J Sports Med. 2013;41(2):430-436.
19. Diebal AR, Gregory R, Alitz C, Gerber JP. Effects of forefoot running on chronic exertional compartment syndrome: a case series. Int J Sports Phys Ther. 2011;6(4):312-321.
20. Diebal AR, Gregory R, Alitz C, Gerber JP. Forefoot running improves pain and disability associated with chronic exertional compartment syndrome. Am J Sports Med. 2012;40(5):1060-1067.
21. Kirby RL, McDermott AG. Anterior tibial compartment pressures during running with rearfoot and forefoot landing styles. Arch Phys Med Rehabil. 1983;64(7):296-299.
22. Isner-Horobeti ME, Dufour SP, Blaes C, Lecocq J. Intramuscular pressure before and after botulinum toxin in chronic exertional compartment syndrome of the leg: a preliminary study. Am J Sports Med. 2013;41(11):2558-2566.
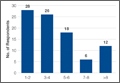
Characteristics Associated With Active Defects in Juvenile Spondylolysis
Spondylolysis, a defect in the pars interarticularis, is the single most common identifiable source of persistent low back pain in adolescent athletes.1,2 The diagnosis of spondylolysis is confirmed by radiographic imaging.3 However, there is controversy regarding which imaging modality is preferred—specifically, which to use for first-line advanced imaging after plain radiographs are obtained.3 Single-photon emission computed tomography (SPECT) consistently has been shown to be the most sensitive modality, and it is considered the gold standard.4-7 Patients with a positive SPECT scan are then routinely imaged with computed tomography (CT) for bone detail and staging of the pars defect.8 This imaging or diagnostic sequence yields organ-specific radiation doses (15-30 mSv) as much as 50-fold higher than those of plain radiography.9 Recent epidemiologic studies have shown that this organ dose results in an increased risk of cancer, especially in children.10
Diagnosis is crucial in early-stage lumbar spondylolysis, as osseous healing can occur with conservative treatment.11,12 High signal change (HSC) in the pedicle or pars interarticularis (Figure 1) on fluid-specific (T2) magnetic resonance imaging (MRI) sequences has been shown to be important in the diagnosis of early spondylolysis and, subsequently, a good predictor of bony healing.13,14 We conducted a study to determine the clinical and radiographic characteristics associated with the diagnosis of early or active spondylolysis.
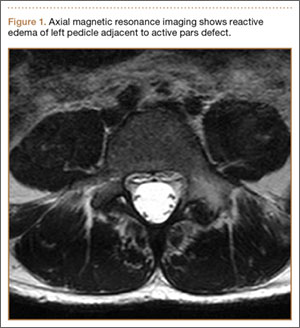
Materials and Methods
The study was reviewed and approved by the local institutional review board. Using the International Classification of Diseases, Ninth Revision (ICD-9) diagnosis code for spondylolysis (756.11), we retrospectively identified patients (age, 12-21 years) from 2002–2011 billing data from a single specialty spine practice. Baseline data—including height, weight, sex, age, symptom duration, sporting activities, defect location, pain score, and previous treatments—were collected from a standardized patient intake questionnaire and office medical records. We also determined radiographic data, including level, laterality (right vs left, unilateral vs bilateral), presence of listhesis, and slip grade and percentage. CT scans were reviewed to confirm the spondylolysis diagnosis and to measure parameters described by Fujii and colleagues.15 These parameters include spondylolysis chronicity (early, progressive, terminal) (Figure 2), distance from defect to posterior margin of vertebral body, and defect angle relative to posterior margin of vertebral body. We also measured sagittal radiographic parameters, including pelvic incidence and lumbar lordosis.
Pars lesions were divided into active and inactive defects16 based on signal characteristics on either MRI or SPECT (Figure 3). Defects with a positive SPECT or HSC on T2 MRI were classified as active; all other defects were classified as inactive. All MRIs were reviewed by a radiologist, and any mention of HSC in the pedicle or pars of the corresponding level was considered positive. For the sake of accuracy, all MRIs were also reviewed by a spine surgeon. All CT measurements were done by 1 of 2 authors. Demographic, clinical, and radiographic characteristics were compared between patients with active defects and patients with inactive defects. Independent t tests and Fisher exact tests were used to compare continuous and categorical variables, respectively. Threshold P was set at .01 to account for the small sample size and multiple concurrent comparisons.
Results
Fifty-seven patients (29 males, 28 females) with a total of 108 pars defects (6 unilateral, 102 bilateral) were identified. Mean age was 14.64 years. Of the 108 defects, 49 were classified as active and 59 as inactive. SPECT results were available for 52 defects, MRI results for 85, and CT results for 76 (Table 1). There was no difference between the active and inactive groups in age (14.7 vs 14.6 years; P = .083), body mass index (24.2 vs 21.7 kg/m2; P = .034), symptom duration (236.3 vs 397.4 days; P = .016), lumbar lordosis (27.4° vs 32.1°; P = .097), pelvic incidence (59.0° vs 61.2°; P = .488), slip percentage (9.5% vs 14.2%; P = .034), and laterality (right vs left, P = .847; unilateral vs bilateral, P = .281) (Table 2). There was a significant difference between the active and inactive groups in sex (35 vs 19 males; P < .0001) and presence of listhesis (16 vs 35; P = .006) (Table 2).
Of the 49 active defects, 3 were graded as early, 10 as progressive, and 11 as terminal (Table 3). There was a statistically significant (P < .0001) difference between active and inactive lesions for each stage. Mean distance from posterior margin of the vertebral body was 0.57 mm and 0.68 mm for inactive and active lesions, respectively (P = .007). There was no significant difference (P = .294) in the posterior angle of the vertebral body and the defect between inactive (20.54°) and active (24.73°) lesions (Table 3).
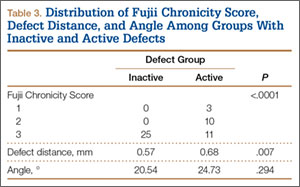
Subanalysis by sex showed no difference in age (males, 16.4 years vs females, 18.7 years; P = .073), slip percentage (10.4% vs 13.4%; P = .168), or presence or absence of slip (25 vs 26; P > .99) (Table 4).
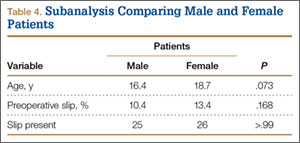
Discussion
Increasing MRI resolution combined with increasing concern about unnecessary radiation exposure has added to the attractiveness of MRI in the diagnosis of spondylolysis. Spondylolysis progresses on a continuum, starting with a stress reaction (early or active defect) and ending with either healing or nonunion of the pars defect (terminal defect) (Figure 4). Although risk factors for progression are not clearly defined, Fujii and colleagues15 showed that the reaction around the defect is the most important factor for osseous union. It would then make sense that the earlier the spondylolytic defect is identified, the higher the likelihood for union, especially with nonoperative treatment such as rest, activity restriction, and bracing.12,17
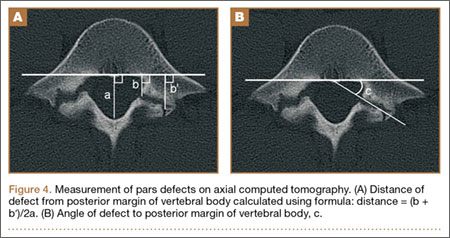
There is a lack of consensus regarding MRI use in the diagnosis of spondylolysis. Masci and colleagues18 prospectively evaluated 50 defects in 39 patients using a 1.5-Tesla MRI scanner, concluded MRI is inferior to SPECT/CT, and recommended that SPECT remain the first-line advanced imaging modality. Conversely, Campbell and colleagues4 prospectively evaluated 40 defects in 22 patients using a 1.0-Tesla magnet and concluded that MRI can be used as an effective and reliable first-line advanced imaging modality. These are the only 2 prospective studies conducted within the past decade. Both were underpowered and used outdated technology (newer MRI scanners use 3.0-Tesla magnets). In addition, specific imaging characteristics (eg, edema in pars or pedicle on fluid-specific sequences) that suggest a positive finding—versus overt fracture on T1 MRI—have been recently emphasized. Neither Masci and colleagues18 nor Campbell and colleagues4 detailed what constituted a positive MRI finding. Although an adequately powered prospective study will provide a better analysis of the utility of MRI versus SPECT, such a study is costly and time-consuming. It is important to identify patient and lesion characteristics to help optimize the usefulness of MRI. It is also important to identify the subset of patients most likely to experience osseous healing of active defects,16 as this is the same subset of patients most likely to respond to nonoperative treatment.
We conducted the present study to identify any clinical or radiographic characteristics associated with the diagnosis of early or active spondylolysis. Almost equal numbers of active and inactive defects (49, 59) were identified. There were no differences in patient characteristics, including age, body mass index, and symptom duration. However, there was a significant sex difference—a relatively high proportion of males with active spondylolysis. This finding, which had been reported before,16,19,20 is probably the result of several factors, including males’ lower lumbar spine bone mineral density21; their relatively less spinal flexibility, which affects the distribution of torsional loads on the spine22; and their relatively greater participation in sports, especially sports involving high-velocity, torsional loading of the lumbar spine.23 Studies are needed to delineate the extent to which sex influences the development and persistence of active spondylolytic lesions. Alternatively, a subanalysis revealed an age difference, between our female and male cohorts (18.7 vs 16.4 years), that may have contributed to the high proportion of males with active spondylolysis.
Although the groups’ difference in symptom duration was not significant, it was trending toward significance. As discussed, it could be explained that, along the continuum of disease, earlier defects are more active and either achieve fibrous or osseous union or become chronic and “burn out” to inactive lesions, potentially leading to a listhesis.24 The listhesis association was higher in the inactive group than in the active group (P = .006). The difference in numbers of active and inactive defects at each stage (early, progressive, late) confirms this finding, with no inactive lesions in the early and progressive stages and many fewer active lesions in the terminal stage. Overall, presence of a spondylolisthesis on plain radiographs may obviate the need for SPECT or MRI, as it indicates an inactive chronic lesion—unless new symptoms are suspicious for reactivation or development of previously described adjacent-level pars defects.
No other radiographic parameters were found to be significant—consistent with findings of other studies.2,5,16 Pelvic incidence has been shown to predict progression of spondylisthesis, but under our study parameters it appears not to be associated with development of a slip.
This study had several weaknesses. First, it was retrospective, and imaging parameters were inconsistent, as we included patients who underwent imaging at other facilities. Second, the timing of imaging was inconsistent. Ideally, the same sequence protocol would be used, and all imaging studies (MRI, SPECT, CT) would be performed within a specific period after the initial concern for a spondylolysis was raised. Last, not all patients underwent all 3 advanced imaging modalities; having all 3 would have allowed for a retrospective comparison of MRI and SPECT sensitivity in detecting spondylolysis. Such a comparison would have been interesting, though it was not the goal of this study.
With its technological improvements and lack of radiation exposure, MRI is becoming more attractive as a first-line advanced imaging modality. Although the superiority of MRI over SPECT is yet to be confirmed, clinical use of MRI in the evaluation of spondylolysis seems to be increasing. It is therefore important to characterize the spondylolytic defects that are readily detected with MRI.
Active or early juvenile spondylolysis appears to be associated with males and absence of an associated listhesis. These clinical and radiographic characteristics may be important in the identification of patients with higher potential for osseous healing after nonoperative treatment.
1. Micheli LJ, Wood R. Back pain in young athletes. Significant differences from adults in causes and patterns. Arch Pediatr Adolesc Med. 1995;149(1):15-18.
2. Sakai T, Sairyo K, Suzue N, Kosaka H, Yasui N. Incidence and etiology of lumbar spondylolysis: review of the literature. J Orthop Sci. 2010;15(3):281-288.
3. Standaert CJ, Herring SA. Expert opinion and controversies in sports and musculoskeletal medicine: the diagnosis and treatment of spondylolysis in adolescent athletes. Arch Phys Med Rehabil. 2007;88(4):537-540.
4. Campbell RS, Grainger AJ, Hide IG, Papastefanou S, Greenough CG. Juvenile spondylolysis: a comparative analysis of CT, SPECT and MRI. Skeletal Radiol. 2005;34(2):63-73.
5. Kalichman L, Kim DH, Li L, Guermazi A, Berkin V, Hunter DJ. Spondylolysis and spondylolisthesis: prevalence and association with low back pain in the adult community-based population. Spine. 2009;34(2):199-205.
6. Zukotynski K, Curtis C, Grant FD, Micheli L, Treves ST. The value of SPECT in the detection of stress injury to the pars interarticularis in patients with low back pain. J Orthop Surg Res. 2010;5:13.
7. Leone A, Cianfoni A, Cerase A, Magarelli N, Bonomo L. Lumbar spondylolysis: a review. Skeletal Radiol. 2011;40(6):683-700.
8. Gregory PL, Batt ME, Kerslake RW, Scammell BE, Webb JF. The value of combining single photon emission computerised tomography and computerised tomography in the investigation of spondylolysis. Eur Spine J. 2004;13(6):503-509.
9. Brenner DJ, Hall EJ. Computed tomography—an increasing source of radiation exposure. N Engl J Med. 2007;357(22):2277-2284.
10. Brenner DJ, Shuryak I, Einstein AJ. Impact of reduced patient life expectancy on potential cancer risks from radiologic imaging. Radiology. 2011;261(1):193-198.
11. Sairyo K, Sakai T, Yasui N, Dezawa A. Conservative treatment for pediatric lumbar spondylolysis to achieve bone healing using a hard brace: what type and how long?: Clinical article. J Neurosurg Spine. 2012;16(6):610-614.
12. Steiner ME, Micheli LJ. Treatment of symptomatic spondylolysis and spondylolisthesis with the modified Boston brace. Spine. 1985;10(10):937-943.
13. Sairyo K, Katoh S, Takata Y, et al. MRI signal changes of the pedicle as an indicator for early diagnosis of spondylolysis in children and adolescents: a clinical and biomechanical study. Spine. 2006;31(2):206-211.
14. Sakai T, Sairyo K, Mima S, Yasui N. Significance of magnetic resonance imaging signal change in the pedicle in the management of pediatric lumbar spondylolysis. Spine. 2010;35(14):E641-E645.
15. Fujii K, Katoh S, Sairyo K, Ikata T, Yasui N. Union of defects in the pars interarticularis of the lumbar spine in children and adolescents. The radiological outcome after conservative treatment. J Bone Joint Surg Br. 2004;86(2):225-231.
16. Gregg CD, Dean S, Schneiders AG. Variables associated with active spondylolysis. Phys Ther Sport. 2009;10(4):121-124.
17. Kobayashi A, Kobayashi T, Kato K, Higuchi H, Takagishi K. Diagnosis of radiographically occult lumbar spondylolysis in young athletes by magnetic resonance imaging. Am J Sports Med. 2013;41(1):169-176.
18. Masci L, Pike J, Malara F, Phillips B, Bennell K, Brukner P. Use of the one-legged hyperextension test and magnetic resonance imaging in the diagnosis of active spondylolysis. Br J Sports Med. 2006;40(11):940-946.
19. Beutler WJ, Fredrickson BE, Murtland A, Sweeney CA, Grant WD, Baker D. The natural history of spondylolysis and spondylolisthesis: 45-year follow-up evaluation. Spine. 2003;28(10):1027-1035.
20. Miller SF, Congeni J, Swanson K. Long-term functional and anatomical follow-up of early detected spondylolysis in young athletes. Am J Sports Med. 2004;32(4):928-933.
21. Zanchetta JR, Plotkin H, Alvarez Filgueira ML. Bone mass in children: normative values for the 2-20-year-old population. Bone. 1995;16(4 suppl):393S-399S.
22. Kondratek M, Krauss J, Stiller C, Olson R. Normative values for active lumbar range of motion in children. Pediatr Phys Ther. 2007;19(3):236-244.
23. Hardcastle P, Annear P, Foster DH, et al. Spinal abnormalities in young fast bowlers. J Bone Joint Surg Br. 1992;74(3):421-425.
24. Fredrickson BE, Baker D, McHolick WJ, Yuan HA, Lubicky JP. The natural history of spondylolysis and spondylolisthesis. J Bone Joint Surg Am. 1984;66(5):699-707.
Spondylolysis, a defect in the pars interarticularis, is the single most common identifiable source of persistent low back pain in adolescent athletes.1,2 The diagnosis of spondylolysis is confirmed by radiographic imaging.3 However, there is controversy regarding which imaging modality is preferred—specifically, which to use for first-line advanced imaging after plain radiographs are obtained.3 Single-photon emission computed tomography (SPECT) consistently has been shown to be the most sensitive modality, and it is considered the gold standard.4-7 Patients with a positive SPECT scan are then routinely imaged with computed tomography (CT) for bone detail and staging of the pars defect.8 This imaging or diagnostic sequence yields organ-specific radiation doses (15-30 mSv) as much as 50-fold higher than those of plain radiography.9 Recent epidemiologic studies have shown that this organ dose results in an increased risk of cancer, especially in children.10
Diagnosis is crucial in early-stage lumbar spondylolysis, as osseous healing can occur with conservative treatment.11,12 High signal change (HSC) in the pedicle or pars interarticularis (Figure 1) on fluid-specific (T2) magnetic resonance imaging (MRI) sequences has been shown to be important in the diagnosis of early spondylolysis and, subsequently, a good predictor of bony healing.13,14 We conducted a study to determine the clinical and radiographic characteristics associated with the diagnosis of early or active spondylolysis.
Materials and Methods
The study was reviewed and approved by the local institutional review board. Using the International Classification of Diseases, Ninth Revision (ICD-9) diagnosis code for spondylolysis (756.11), we retrospectively identified patients (age, 12-21 years) from 2002–2011 billing data from a single specialty spine practice. Baseline data—including height, weight, sex, age, symptom duration, sporting activities, defect location, pain score, and previous treatments—were collected from a standardized patient intake questionnaire and office medical records. We also determined radiographic data, including level, laterality (right vs left, unilateral vs bilateral), presence of listhesis, and slip grade and percentage. CT scans were reviewed to confirm the spondylolysis diagnosis and to measure parameters described by Fujii and colleagues.15 These parameters include spondylolysis chronicity (early, progressive, terminal) (Figure 2), distance from defect to posterior margin of vertebral body, and defect angle relative to posterior margin of vertebral body. We also measured sagittal radiographic parameters, including pelvic incidence and lumbar lordosis.
Pars lesions were divided into active and inactive defects16 based on signal characteristics on either MRI or SPECT (Figure 3). Defects with a positive SPECT or HSC on T2 MRI were classified as active; all other defects were classified as inactive. All MRIs were reviewed by a radiologist, and any mention of HSC in the pedicle or pars of the corresponding level was considered positive. For the sake of accuracy, all MRIs were also reviewed by a spine surgeon. All CT measurements were done by 1 of 2 authors. Demographic, clinical, and radiographic characteristics were compared between patients with active defects and patients with inactive defects. Independent t tests and Fisher exact tests were used to compare continuous and categorical variables, respectively. Threshold P was set at .01 to account for the small sample size and multiple concurrent comparisons.
Results
Fifty-seven patients (29 males, 28 females) with a total of 108 pars defects (6 unilateral, 102 bilateral) were identified. Mean age was 14.64 years. Of the 108 defects, 49 were classified as active and 59 as inactive. SPECT results were available for 52 defects, MRI results for 85, and CT results for 76 (Table 1). There was no difference between the active and inactive groups in age (14.7 vs 14.6 years; P = .083), body mass index (24.2 vs 21.7 kg/m2; P = .034), symptom duration (236.3 vs 397.4 days; P = .016), lumbar lordosis (27.4° vs 32.1°; P = .097), pelvic incidence (59.0° vs 61.2°; P = .488), slip percentage (9.5% vs 14.2%; P = .034), and laterality (right vs left, P = .847; unilateral vs bilateral, P = .281) (Table 2). There was a significant difference between the active and inactive groups in sex (35 vs 19 males; P < .0001) and presence of listhesis (16 vs 35; P = .006) (Table 2).
Of the 49 active defects, 3 were graded as early, 10 as progressive, and 11 as terminal (Table 3). There was a statistically significant (P < .0001) difference between active and inactive lesions for each stage. Mean distance from posterior margin of the vertebral body was 0.57 mm and 0.68 mm for inactive and active lesions, respectively (P = .007). There was no significant difference (P = .294) in the posterior angle of the vertebral body and the defect between inactive (20.54°) and active (24.73°) lesions (Table 3).
Subanalysis by sex showed no difference in age (males, 16.4 years vs females, 18.7 years; P = .073), slip percentage (10.4% vs 13.4%; P = .168), or presence or absence of slip (25 vs 26; P > .99) (Table 4).
Discussion
Increasing MRI resolution combined with increasing concern about unnecessary radiation exposure has added to the attractiveness of MRI in the diagnosis of spondylolysis. Spondylolysis progresses on a continuum, starting with a stress reaction (early or active defect) and ending with either healing or nonunion of the pars defect (terminal defect) (Figure 4). Although risk factors for progression are not clearly defined, Fujii and colleagues15 showed that the reaction around the defect is the most important factor for osseous union. It would then make sense that the earlier the spondylolytic defect is identified, the higher the likelihood for union, especially with nonoperative treatment such as rest, activity restriction, and bracing.12,17
There is a lack of consensus regarding MRI use in the diagnosis of spondylolysis. Masci and colleagues18 prospectively evaluated 50 defects in 39 patients using a 1.5-Tesla MRI scanner, concluded MRI is inferior to SPECT/CT, and recommended that SPECT remain the first-line advanced imaging modality. Conversely, Campbell and colleagues4 prospectively evaluated 40 defects in 22 patients using a 1.0-Tesla magnet and concluded that MRI can be used as an effective and reliable first-line advanced imaging modality. These are the only 2 prospective studies conducted within the past decade. Both were underpowered and used outdated technology (newer MRI scanners use 3.0-Tesla magnets). In addition, specific imaging characteristics (eg, edema in pars or pedicle on fluid-specific sequences) that suggest a positive finding—versus overt fracture on T1 MRI—have been recently emphasized. Neither Masci and colleagues18 nor Campbell and colleagues4 detailed what constituted a positive MRI finding. Although an adequately powered prospective study will provide a better analysis of the utility of MRI versus SPECT, such a study is costly and time-consuming. It is important to identify patient and lesion characteristics to help optimize the usefulness of MRI. It is also important to identify the subset of patients most likely to experience osseous healing of active defects,16 as this is the same subset of patients most likely to respond to nonoperative treatment.
We conducted the present study to identify any clinical or radiographic characteristics associated with the diagnosis of early or active spondylolysis. Almost equal numbers of active and inactive defects (49, 59) were identified. There were no differences in patient characteristics, including age, body mass index, and symptom duration. However, there was a significant sex difference—a relatively high proportion of males with active spondylolysis. This finding, which had been reported before,16,19,20 is probably the result of several factors, including males’ lower lumbar spine bone mineral density21; their relatively less spinal flexibility, which affects the distribution of torsional loads on the spine22; and their relatively greater participation in sports, especially sports involving high-velocity, torsional loading of the lumbar spine.23 Studies are needed to delineate the extent to which sex influences the development and persistence of active spondylolytic lesions. Alternatively, a subanalysis revealed an age difference, between our female and male cohorts (18.7 vs 16.4 years), that may have contributed to the high proportion of males with active spondylolysis.
Although the groups’ difference in symptom duration was not significant, it was trending toward significance. As discussed, it could be explained that, along the continuum of disease, earlier defects are more active and either achieve fibrous or osseous union or become chronic and “burn out” to inactive lesions, potentially leading to a listhesis.24 The listhesis association was higher in the inactive group than in the active group (P = .006). The difference in numbers of active and inactive defects at each stage (early, progressive, late) confirms this finding, with no inactive lesions in the early and progressive stages and many fewer active lesions in the terminal stage. Overall, presence of a spondylolisthesis on plain radiographs may obviate the need for SPECT or MRI, as it indicates an inactive chronic lesion—unless new symptoms are suspicious for reactivation or development of previously described adjacent-level pars defects.
No other radiographic parameters were found to be significant—consistent with findings of other studies.2,5,16 Pelvic incidence has been shown to predict progression of spondylisthesis, but under our study parameters it appears not to be associated with development of a slip.
This study had several weaknesses. First, it was retrospective, and imaging parameters were inconsistent, as we included patients who underwent imaging at other facilities. Second, the timing of imaging was inconsistent. Ideally, the same sequence protocol would be used, and all imaging studies (MRI, SPECT, CT) would be performed within a specific period after the initial concern for a spondylolysis was raised. Last, not all patients underwent all 3 advanced imaging modalities; having all 3 would have allowed for a retrospective comparison of MRI and SPECT sensitivity in detecting spondylolysis. Such a comparison would have been interesting, though it was not the goal of this study.
With its technological improvements and lack of radiation exposure, MRI is becoming more attractive as a first-line advanced imaging modality. Although the superiority of MRI over SPECT is yet to be confirmed, clinical use of MRI in the evaluation of spondylolysis seems to be increasing. It is therefore important to characterize the spondylolytic defects that are readily detected with MRI.
Active or early juvenile spondylolysis appears to be associated with males and absence of an associated listhesis. These clinical and radiographic characteristics may be important in the identification of patients with higher potential for osseous healing after nonoperative treatment.
1. Micheli LJ, Wood R. Back pain in young athletes. Significant differences from adults in causes and patterns. Arch Pediatr Adolesc Med. 1995;149(1):15-18.
2. Sakai T, Sairyo K, Suzue N, Kosaka H, Yasui N. Incidence and etiology of lumbar spondylolysis: review of the literature. J Orthop Sci. 2010;15(3):281-288.
3. Standaert CJ, Herring SA. Expert opinion and controversies in sports and musculoskeletal medicine: the diagnosis and treatment of spondylolysis in adolescent athletes. Arch Phys Med Rehabil. 2007;88(4):537-540.
4. Campbell RS, Grainger AJ, Hide IG, Papastefanou S, Greenough CG. Juvenile spondylolysis: a comparative analysis of CT, SPECT and MRI. Skeletal Radiol. 2005;34(2):63-73.
5. Kalichman L, Kim DH, Li L, Guermazi A, Berkin V, Hunter DJ. Spondylolysis and spondylolisthesis: prevalence and association with low back pain in the adult community-based population. Spine. 2009;34(2):199-205.
6. Zukotynski K, Curtis C, Grant FD, Micheli L, Treves ST. The value of SPECT in the detection of stress injury to the pars interarticularis in patients with low back pain. J Orthop Surg Res. 2010;5:13.
7. Leone A, Cianfoni A, Cerase A, Magarelli N, Bonomo L. Lumbar spondylolysis: a review. Skeletal Radiol. 2011;40(6):683-700.
8. Gregory PL, Batt ME, Kerslake RW, Scammell BE, Webb JF. The value of combining single photon emission computerised tomography and computerised tomography in the investigation of spondylolysis. Eur Spine J. 2004;13(6):503-509.
9. Brenner DJ, Hall EJ. Computed tomography—an increasing source of radiation exposure. N Engl J Med. 2007;357(22):2277-2284.
10. Brenner DJ, Shuryak I, Einstein AJ. Impact of reduced patient life expectancy on potential cancer risks from radiologic imaging. Radiology. 2011;261(1):193-198.
11. Sairyo K, Sakai T, Yasui N, Dezawa A. Conservative treatment for pediatric lumbar spondylolysis to achieve bone healing using a hard brace: what type and how long?: Clinical article. J Neurosurg Spine. 2012;16(6):610-614.
12. Steiner ME, Micheli LJ. Treatment of symptomatic spondylolysis and spondylolisthesis with the modified Boston brace. Spine. 1985;10(10):937-943.
13. Sairyo K, Katoh S, Takata Y, et al. MRI signal changes of the pedicle as an indicator for early diagnosis of spondylolysis in children and adolescents: a clinical and biomechanical study. Spine. 2006;31(2):206-211.
14. Sakai T, Sairyo K, Mima S, Yasui N. Significance of magnetic resonance imaging signal change in the pedicle in the management of pediatric lumbar spondylolysis. Spine. 2010;35(14):E641-E645.
15. Fujii K, Katoh S, Sairyo K, Ikata T, Yasui N. Union of defects in the pars interarticularis of the lumbar spine in children and adolescents. The radiological outcome after conservative treatment. J Bone Joint Surg Br. 2004;86(2):225-231.
16. Gregg CD, Dean S, Schneiders AG. Variables associated with active spondylolysis. Phys Ther Sport. 2009;10(4):121-124.
17. Kobayashi A, Kobayashi T, Kato K, Higuchi H, Takagishi K. Diagnosis of radiographically occult lumbar spondylolysis in young athletes by magnetic resonance imaging. Am J Sports Med. 2013;41(1):169-176.
18. Masci L, Pike J, Malara F, Phillips B, Bennell K, Brukner P. Use of the one-legged hyperextension test and magnetic resonance imaging in the diagnosis of active spondylolysis. Br J Sports Med. 2006;40(11):940-946.
19. Beutler WJ, Fredrickson BE, Murtland A, Sweeney CA, Grant WD, Baker D. The natural history of spondylolysis and spondylolisthesis: 45-year follow-up evaluation. Spine. 2003;28(10):1027-1035.
20. Miller SF, Congeni J, Swanson K. Long-term functional and anatomical follow-up of early detected spondylolysis in young athletes. Am J Sports Med. 2004;32(4):928-933.
21. Zanchetta JR, Plotkin H, Alvarez Filgueira ML. Bone mass in children: normative values for the 2-20-year-old population. Bone. 1995;16(4 suppl):393S-399S.
22. Kondratek M, Krauss J, Stiller C, Olson R. Normative values for active lumbar range of motion in children. Pediatr Phys Ther. 2007;19(3):236-244.
23. Hardcastle P, Annear P, Foster DH, et al. Spinal abnormalities in young fast bowlers. J Bone Joint Surg Br. 1992;74(3):421-425.
24. Fredrickson BE, Baker D, McHolick WJ, Yuan HA, Lubicky JP. The natural history of spondylolysis and spondylolisthesis. J Bone Joint Surg Am. 1984;66(5):699-707.
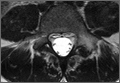
Business and Practice Management Knowledge Deficiencies in Graduating Orthopedic Residents
With the increasing complexity of health care policy, significant changes in reimbursement and payer sources, and constant push to improve the cost-efficiency of care delivery, there has been a growing focus on the importance of business knowledge and practice management (PM) skills among physicians. Family medicine was the first specialty to require PM training during residency; other specialities have begun implementing business training into their residency curriculum.1 In 1999, the Accreditation Council for Graduate Medical Education (ACGME) identified 6 core competencies that should be included in resident training. One of these core competencies involves training in health care systems and PM.2,3
Residency program directors have also recognized the need for business training among residents. One study that surveyed general surgery program directors found that more than 87% agreed that residents should be trained in business and PM.4 Although these directors recognized the need for training, they also acknowledged the current deficiency: more than 70% thought their current trainees were inadequately trained in business and PM. Similarly, residents and physicians in multiple specialties have reported significant deficiencies in their training and knowledge of PM and business principles.5-11 For example, in a recent survey of ophthalmologists who had been in practice less than 5 years, 70% reported being not very well or not at all trained in overall PM skills during residency.5 Yet, most respondents thought training in this area was the responsibility of the training program.
The call for more business and PM training during residency has been tempered by increasing demands on medical and surgical skills training and time limitations such as duty-hour restrictions. These limitations reinforce the need to find efficient and effective means of teaching necessary business knowledge and PM skills. Paramount to doing this is recognizing the difference between general knowledge and functional knowledge—essentially, what is specifically needed to function effectively in practice.
We conducted a study not only to determine the general level of knowledge that physicians have in different business and PM topics when they complete their residency, but also to evaluate the level of knowledge that graduating physicians need in different business and PM topics in order to function effectively in a medical practice. Toward this end, we developed a novel model that could help determine the level of the functional knowledge deficiency (FKD) of particular business topics. We thought this model would allow us to quantify how much knowledge physicians needed to acquire in a given topic in order to function effectively in practice. We hypothesized that graduating residents would report overall low levels of business knowledge and high FKDs.
Materials and Methods
To minimize variability in the specific type and amount of business training received, we focused this study on a single institution that had maintained a uniform business management curriculum over an extended period. The business training program provided to residents in the orthopedic surgery residency at this institution included 6 hours of didactic lectures on various business topics annually. This program has been in place for more than 15 years and has not undergone any significant changes during that time.
Using the program’s alumni directory, we emailed a cover letter and an 11-question survey to all 332 residents and fellows who had completed their residency or fellowship training at our institution between 1970 and 2008. Anyone who did not reply to the email was mailed a copy of the cover letter and the survey.
The first 4 survey questions involved the demographics of the surgeon and the surgeon’s practice. Subsequent questions focused on the surgeon’s understanding of 9 different general business and PM topics and their importance in the practice. The topics were marketing, business operations, human resources, contract negotiations, malpractice issues, coding/billing, medical records management, accounting, and economic analytical tools. The surgeon was asked to use a 10-point scale ranging from 1 (“knew nothing at all”) to 10 (“complete understanding”) to rate his or her understanding of each topic at the completion of residency. The surgeon was also asked to rate how important it was to understand that topic in the surgeon’s current practice. Again, a 10-point scale was used: 1 (“not important at all”) to 10 (“absolutely vital”) (Figure).
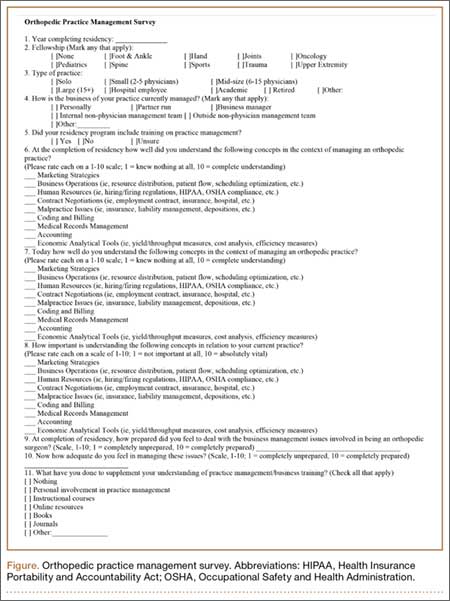
When the surveys were returned, their data were compiled and analyzed to determine the overall knowledge levels for each topic and the levels based on years in practice, type of practice, and level of involvement in PM. We also wanted to determine the amount of business knowledge that they needed in order to function effectively in practice (and that they lacked at time of graduation). We defined this as the FKD at graduation and calculated it as the difference between the surgeon’s reported importance of a topic in his or her current practice and his or her level of understanding of that topic at graduation. A larger FKD score represented greater deficiency, with a maximal possible FKD score of 9. A score of 0 would reflect an appropriate amount of knowledge to function effectively, and a negative score would reflect a knowledge surplus. Using the demographic information from the survey, we were then able to further analyze the levels of overall knowledge as well as the FKD for each topic with respect to length of time in practice, type of practice, and the surgeon’s involvement in PM.
We evaluated the reported levels of knowledge based on both type of practice (academic, hospital-employed, private practice) and who managed the practice (physician, nonphysician). Academic practices were defined as those associated with an academic medical center; hospital-employed practices were those in which the physician was an employee of a health system not associated with an academic medical center; and private practices were defined as physician-owned orthopedic practices not associated with an academic medical center. Regarding management, practices in which physicians were primarily responsible for the daily operations of the practice were considered physician-managed; conversely, practices in which operations were controlled by either employed or institutionally assigned administration were defined as nonphysician-managed.
Statistical analysis of the results for different practice types and levels of involvement in management was performed for both general knowledge and FKD. Means, medians, and standard deviations were calculated. One-way analysis of variance or t tests were then used to examine mean differences overall and within each business topic. When a difference was found, a post hoc Tukey multiple range test was performed to identify it. Differences at P < .05 were considered significant.
Results
One hundred eighty-two surgeons answered the survey, yielding a response rate of 55%. All had completed their training at our institution. Seven respondents were removed from the study because they had retired from practice (5) or had returned incomplete surveys (2).
The overall self-rated level of business knowledge of all responding surgeons at the conclusion of their training was 2.4 on the 10-point scale (Table 1). Specifically, physicians reported the lowest levels of business understanding in economic analytical tools (1.5), human resources (1.7), and contract negotiations (1.9), suggesting minimal knowledge of these topics generally. They reported the highest levels of knowledge in medical records management (3.8) and malpractice issues (3.3). Even these topics, however, still reflected overall low levels of knowledge.
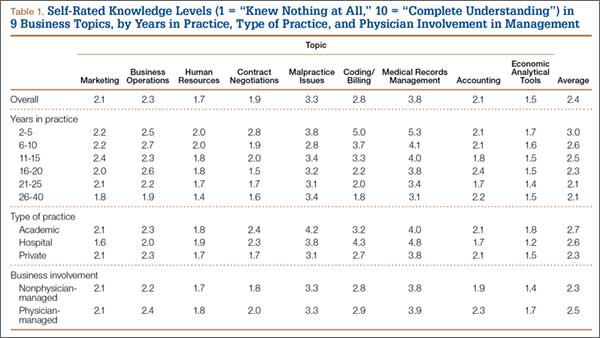
There was no statistically significant difference between private practice and academic physicians. In addition, surgeons in physician-managed practices reported significantly (P = .045) higher levels of understanding of economic analytical tools than surgeons in nonphysician-managed practices (Table 1). There were no other statistically significant differences among groups.
The overall calculated FKD for all surgeons was 5.6. FKDs were calculated for all 9 business topics. The worst FKDs were in business operations (6.4) and coding/billing (6.3). The topic with the least deficiency (lowest FKD) was in medical records management (4.2) (Table 2).

Surgeons’ FKDs based on practice type (academic, hospital-employed, private practice) were compared to identify potentially significant differences. Hospital-employed physicians had the lowest overall FKD (4.0), followed by physicians in academic practices (5.1) and private practices (5.9). Hospital-employed physicians reported statistically significantly better (lower) FKDs in comparison with physicians in private practice in multiple topics, including human resources, contract negotiations, malpractice issues, coding/billing, and accounting (Table 2). Similarly, physicians in academic practices also had statistically significantly better FKDs than physicians in private practice in the topics of business operations, contract negotiations, and billing/coding. Compared with hospital-employed physicians, physicians in academic practices had significantly more knowledge about marketing, business operations, and accounting. Physicians in private practice did not have significantly better FKDs in any topic in comparison with hospital-employed or academic physicians. There was no significant difference in FKDs for medical records management or economic analytical tools based on practice type.
Comparisons based on PM involvement showed that physicians in practices with nonphysician management had only a slightly better FKD (5.6) at graduation than those in practices with physician involvement (5.7). None of the 9 topics was statistically significant different based on physician involvement in PM.
Discussion
Building a successful medical practice has become more difficult for graduating orthopedic surgery residents because of an increasingly complex health care system, shrinking reimbursement rates, and looming regulatory changes. These challenges have reinforced the importance of teaching residents the necessary PM knowledge and skills to function effectively in a medical practice. Multiple studies from different specialties surveying or testing graduating residents and young practicing physicians on their business management knowledge or specific business topics have shown severe deficiencies.5-11 Unfortunately, graduating orthopedic surgery residents also appear inadequately prepared in PM. In a study of resident coding/billing knowledge, Gill and Schutt6 surveyed 2006 graduating orthopedic residents and found that only 13% felt confident in their coding ability. Our study results add to our understanding of multiple PM topics and demonstrate graduating orthopedic residents’ deficiencies throughout these topics.
Increased efforts to develop business management training programs and curricula have helped improve both overall PM and business knowledge in other specialties.12-15 ACGME now requires 100 hours of PM training among family medicine residency programs.16 A curriculum instituted in a general surgery residency focused on improving coding found that accuracy improved from 36% to 88% over 12 months.13 A family practice residency instituted a “simulated practice” model for its residents to improve practical PM learning and found statistically significant improvement over their prior didactic lectures.15 However, there continues to be significant variability in the topics and methods covered in business management curricula as programs struggle to determine how to most effectively use their limited time to prepare graduating residents.
In this study, we introduced the concept of FKD. With limited time available for teaching business knowledge and PM skills in residency, it has become imperative that training be efficient and effective. The FKD model can improve training efficiency by directing training to the topics that will produce the highest yield in preparing physicians for practice. As our results demonstrate, topics with the lowest levels of knowledge among surgeons often are not the same as the topics that are most needed to function effectively in practice (Table 3). The FKD model identifies deficiencies in practical, applicable knowledge rather than focusing on a general knowledge level. We suspect that focusing on topics with a high FKD would provide a higher yield in preparing physicians for practice. As such, our results suggest that training in business operations and coding/billing would likely provide the highest practical value, despite the fact that these were not the areas of least general knowledge.
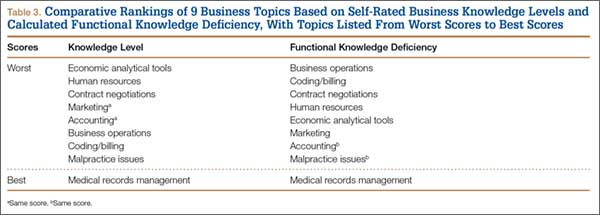
Another finding of this study was the FKD difference based on type of practice. Compared with private practice physicians, hospital-employed or academic physicians had substantially lower overall FKDs and significantly lower FKDs in several specific topics. However, these FKD differences exist despite minimal differences in overall levels of knowledge. This would suggest that less business knowledge was needed by physicians to enter these types of practices compared with traditional private practice. We speculate that this may be one factor influencing the recent trend by graduating orthopedic residents to take hospital-employed positions, as these positions may appear less demanding in terms of learning the management aspects of the new practice.
Our results also showed slightly higher reported average business knowledge and lower FKD reported by those who had recently completed training (within 2-5 years) versus those in practice much longer. This is particularly interesting, as our institution has maintained the same lecture-based program for many years without significant changes. Although these differences may not be statistically significant, they may reflect an increased interest in and attention to learning PM skills while in training. However, we acknowledge this is only one of many possible explanations for these findings.
This study had several limitations. First, all respondents were graduates of a single institution. We were trying to limit the variability in business training, but this also limits the scope of the results. Second, self-ratings on surveys provide subjective measures of business knowledge and functional knowledge. Scores may vary based on individuals’ understanding of given topics, or they may inaccurately represent their level of understanding. This is especially true of respondents who graduated from residency, for example, 20 years earlier—their survey responses may reflect erroneous recollection of business training at time of graduation compared with respondents who graduated more recently. Conversely, more recent graduates may not have a fully formed or accurate picture of how much business knowledge is required to function in practice. Nevertheless, we found no significant differences in measured parameters based on graduation date, so we chose not to exclude older respondents, which also may have weakened our data pool. Further, FKDs are relative values used to compare subjective deficiencies rather than absolute scores of specific general knowledge. As such, subjectivity, including recollection of business training, is inherent in the model used in this study.
Conclusion
Graduating orthopedic surgeons currently appear inadequately prepared to effectively manage business issues in their practices, as evidenced by their low overall knowledge levels and high FKDs. The novel FKD model described in this study helps define FKD levels and identify topics that may provide the highest yield in improving effectiveness in practice. Residency curricula focused on improving business and PM knowledge, particularly in the topics with the highest FKDs (eg, business operations, coding/billing), may improve training efficiency in these areas. Further studies with larger numbers of physicians across multiple institutions are needed to confirm these findings and to validate the FKD concept.
1. Rose EA, Neale AV, Rathur WA. Teaching practice management during residency. Fam Med. 1999;31(2):107-113.
2. Accreditation Council for Graduate Medical Education. ACGME common program requirements. http://www.acgme.org/acgmeweb/Portals/0/PFAssets/ProgramRequirements/CPRs2013.pdf. Updated June 9, 2013. Accessed August 25, 2015.
3. Itani K. A positive approach to core competencies and benchmarks for graduate medical education. Am J Surg. 2002;184(3):196-203.
4. Lusco VC, Martinez SA, Polk HC Jr. Program directors in surgery agree that residents should be formally trained in business and practice management. Am J Surg. 2005;189(1):11-13.
5. McDonnell PJ, Kirwan TJ, Brinton GS, et al. Perceptions of recent ophthalmology residency graduates regarding preparation for practice. Ophthalmology. 2007;114(2):387-391.
6. Gill JB, Schutt RC Jr. Practice management education in orthopaedic surgical residencies. J Bone Joint Surg Am. 2007;89(1):216-219.
7. Satiani B. Business knowledge in surgeons. Am J Surg. 2004;188(1):13-16.
8. Cantor JC, Baker LC, Hughes RG. Preparedness for practice. Young physicians’ views of their professional education. JAMA. 1993;270(9):1035-1040.
9. Fakhry SM, Robinson L, Hendershot K, Reines HD. Surgical residents’ knowledge of documentation and coding for professional services: an opportunity for a focused educational offering. Am J Surg. 2007;194(2):263-267.
10. Williford LE, Ling FW, Summitt RL Jr, Stovall TG. Practice management in obstetrics and gynecology residency curriculum. Obstet Gynecol. 1999;94(3):476-479.
11. Andreae MC, Dunham K, Freed GL. Inadequate training in billing and coding as perceived by recent pediatric graduates. Clin Pediatr. 2009;48(9):939-944.
12. Kolva DE, Barzee KA, Morley CP. Practice management residency curricula: a systematic literature review. Fam Med. 2009;41(6):411-419.
13. Jones K, Lebron RA, Mangram A, Dunn E. Practice management education during surgical residency. Am J Surg. 2008;196(6):878-881.
14. Kerfoot BP, Conlin PR, Travison T, McMahon GT. Web-based education in systems-based practice: a randomized trial. Arch Intern Med. 2007;167(4):361-366.
15. LoPresti L, Ginn P, Treat R. Using a simulated practice to improve practice management learning. Fam Med. 2009;41(9):640-645.
16. Accreditation Council for Graduate Medical Education. Family medicine program requirements. https://www.acgme.org/acgmeweb/tabid/132/ProgramandInstitutionalAccreditation/MedicalSpecialties/FamilyMedicine.aspx. Accessed September 23, 2015.
With the increasing complexity of health care policy, significant changes in reimbursement and payer sources, and constant push to improve the cost-efficiency of care delivery, there has been a growing focus on the importance of business knowledge and practice management (PM) skills among physicians. Family medicine was the first specialty to require PM training during residency; other specialities have begun implementing business training into their residency curriculum.1 In 1999, the Accreditation Council for Graduate Medical Education (ACGME) identified 6 core competencies that should be included in resident training. One of these core competencies involves training in health care systems and PM.2,3
Residency program directors have also recognized the need for business training among residents. One study that surveyed general surgery program directors found that more than 87% agreed that residents should be trained in business and PM.4 Although these directors recognized the need for training, they also acknowledged the current deficiency: more than 70% thought their current trainees were inadequately trained in business and PM. Similarly, residents and physicians in multiple specialties have reported significant deficiencies in their training and knowledge of PM and business principles.5-11 For example, in a recent survey of ophthalmologists who had been in practice less than 5 years, 70% reported being not very well or not at all trained in overall PM skills during residency.5 Yet, most respondents thought training in this area was the responsibility of the training program.
The call for more business and PM training during residency has been tempered by increasing demands on medical and surgical skills training and time limitations such as duty-hour restrictions. These limitations reinforce the need to find efficient and effective means of teaching necessary business knowledge and PM skills. Paramount to doing this is recognizing the difference between general knowledge and functional knowledge—essentially, what is specifically needed to function effectively in practice.
We conducted a study not only to determine the general level of knowledge that physicians have in different business and PM topics when they complete their residency, but also to evaluate the level of knowledge that graduating physicians need in different business and PM topics in order to function effectively in a medical practice. Toward this end, we developed a novel model that could help determine the level of the functional knowledge deficiency (FKD) of particular business topics. We thought this model would allow us to quantify how much knowledge physicians needed to acquire in a given topic in order to function effectively in practice. We hypothesized that graduating residents would report overall low levels of business knowledge and high FKDs.
Materials and Methods
To minimize variability in the specific type and amount of business training received, we focused this study on a single institution that had maintained a uniform business management curriculum over an extended period. The business training program provided to residents in the orthopedic surgery residency at this institution included 6 hours of didactic lectures on various business topics annually. This program has been in place for more than 15 years and has not undergone any significant changes during that time.
Using the program’s alumni directory, we emailed a cover letter and an 11-question survey to all 332 residents and fellows who had completed their residency or fellowship training at our institution between 1970 and 2008. Anyone who did not reply to the email was mailed a copy of the cover letter and the survey.
The first 4 survey questions involved the demographics of the surgeon and the surgeon’s practice. Subsequent questions focused on the surgeon’s understanding of 9 different general business and PM topics and their importance in the practice. The topics were marketing, business operations, human resources, contract negotiations, malpractice issues, coding/billing, medical records management, accounting, and economic analytical tools. The surgeon was asked to use a 10-point scale ranging from 1 (“knew nothing at all”) to 10 (“complete understanding”) to rate his or her understanding of each topic at the completion of residency. The surgeon was also asked to rate how important it was to understand that topic in the surgeon’s current practice. Again, a 10-point scale was used: 1 (“not important at all”) to 10 (“absolutely vital”) (Figure).
When the surveys were returned, their data were compiled and analyzed to determine the overall knowledge levels for each topic and the levels based on years in practice, type of practice, and level of involvement in PM. We also wanted to determine the amount of business knowledge that they needed in order to function effectively in practice (and that they lacked at time of graduation). We defined this as the FKD at graduation and calculated it as the difference between the surgeon’s reported importance of a topic in his or her current practice and his or her level of understanding of that topic at graduation. A larger FKD score represented greater deficiency, with a maximal possible FKD score of 9. A score of 0 would reflect an appropriate amount of knowledge to function effectively, and a negative score would reflect a knowledge surplus. Using the demographic information from the survey, we were then able to further analyze the levels of overall knowledge as well as the FKD for each topic with respect to length of time in practice, type of practice, and the surgeon’s involvement in PM.
We evaluated the reported levels of knowledge based on both type of practice (academic, hospital-employed, private practice) and who managed the practice (physician, nonphysician). Academic practices were defined as those associated with an academic medical center; hospital-employed practices were those in which the physician was an employee of a health system not associated with an academic medical center; and private practices were defined as physician-owned orthopedic practices not associated with an academic medical center. Regarding management, practices in which physicians were primarily responsible for the daily operations of the practice were considered physician-managed; conversely, practices in which operations were controlled by either employed or institutionally assigned administration were defined as nonphysician-managed.
Statistical analysis of the results for different practice types and levels of involvement in management was performed for both general knowledge and FKD. Means, medians, and standard deviations were calculated. One-way analysis of variance or t tests were then used to examine mean differences overall and within each business topic. When a difference was found, a post hoc Tukey multiple range test was performed to identify it. Differences at P < .05 were considered significant.
Results
One hundred eighty-two surgeons answered the survey, yielding a response rate of 55%. All had completed their training at our institution. Seven respondents were removed from the study because they had retired from practice (5) or had returned incomplete surveys (2).
The overall self-rated level of business knowledge of all responding surgeons at the conclusion of their training was 2.4 on the 10-point scale (Table 1). Specifically, physicians reported the lowest levels of business understanding in economic analytical tools (1.5), human resources (1.7), and contract negotiations (1.9), suggesting minimal knowledge of these topics generally. They reported the highest levels of knowledge in medical records management (3.8) and malpractice issues (3.3). Even these topics, however, still reflected overall low levels of knowledge.
There was no statistically significant difference between private practice and academic physicians. In addition, surgeons in physician-managed practices reported significantly (P = .045) higher levels of understanding of economic analytical tools than surgeons in nonphysician-managed practices (Table 1). There were no other statistically significant differences among groups.
The overall calculated FKD for all surgeons was 5.6. FKDs were calculated for all 9 business topics. The worst FKDs were in business operations (6.4) and coding/billing (6.3). The topic with the least deficiency (lowest FKD) was in medical records management (4.2) (Table 2).
Surgeons’ FKDs based on practice type (academic, hospital-employed, private practice) were compared to identify potentially significant differences. Hospital-employed physicians had the lowest overall FKD (4.0), followed by physicians in academic practices (5.1) and private practices (5.9). Hospital-employed physicians reported statistically significantly better (lower) FKDs in comparison with physicians in private practice in multiple topics, including human resources, contract negotiations, malpractice issues, coding/billing, and accounting (Table 2). Similarly, physicians in academic practices also had statistically significantly better FKDs than physicians in private practice in the topics of business operations, contract negotiations, and billing/coding. Compared with hospital-employed physicians, physicians in academic practices had significantly more knowledge about marketing, business operations, and accounting. Physicians in private practice did not have significantly better FKDs in any topic in comparison with hospital-employed or academic physicians. There was no significant difference in FKDs for medical records management or economic analytical tools based on practice type.
Comparisons based on PM involvement showed that physicians in practices with nonphysician management had only a slightly better FKD (5.6) at graduation than those in practices with physician involvement (5.7). None of the 9 topics was statistically significant different based on physician involvement in PM.
Discussion
Building a successful medical practice has become more difficult for graduating orthopedic surgery residents because of an increasingly complex health care system, shrinking reimbursement rates, and looming regulatory changes. These challenges have reinforced the importance of teaching residents the necessary PM knowledge and skills to function effectively in a medical practice. Multiple studies from different specialties surveying or testing graduating residents and young practicing physicians on their business management knowledge or specific business topics have shown severe deficiencies.5-11 Unfortunately, graduating orthopedic surgery residents also appear inadequately prepared in PM. In a study of resident coding/billing knowledge, Gill and Schutt6 surveyed 2006 graduating orthopedic residents and found that only 13% felt confident in their coding ability. Our study results add to our understanding of multiple PM topics and demonstrate graduating orthopedic residents’ deficiencies throughout these topics.
Increased efforts to develop business management training programs and curricula have helped improve both overall PM and business knowledge in other specialties.12-15 ACGME now requires 100 hours of PM training among family medicine residency programs.16 A curriculum instituted in a general surgery residency focused on improving coding found that accuracy improved from 36% to 88% over 12 months.13 A family practice residency instituted a “simulated practice” model for its residents to improve practical PM learning and found statistically significant improvement over their prior didactic lectures.15 However, there continues to be significant variability in the topics and methods covered in business management curricula as programs struggle to determine how to most effectively use their limited time to prepare graduating residents.
In this study, we introduced the concept of FKD. With limited time available for teaching business knowledge and PM skills in residency, it has become imperative that training be efficient and effective. The FKD model can improve training efficiency by directing training to the topics that will produce the highest yield in preparing physicians for practice. As our results demonstrate, topics with the lowest levels of knowledge among surgeons often are not the same as the topics that are most needed to function effectively in practice (Table 3). The FKD model identifies deficiencies in practical, applicable knowledge rather than focusing on a general knowledge level. We suspect that focusing on topics with a high FKD would provide a higher yield in preparing physicians for practice. As such, our results suggest that training in business operations and coding/billing would likely provide the highest practical value, despite the fact that these were not the areas of least general knowledge.
Another finding of this study was the FKD difference based on type of practice. Compared with private practice physicians, hospital-employed or academic physicians had substantially lower overall FKDs and significantly lower FKDs in several specific topics. However, these FKD differences exist despite minimal differences in overall levels of knowledge. This would suggest that less business knowledge was needed by physicians to enter these types of practices compared with traditional private practice. We speculate that this may be one factor influencing the recent trend by graduating orthopedic residents to take hospital-employed positions, as these positions may appear less demanding in terms of learning the management aspects of the new practice.
Our results also showed slightly higher reported average business knowledge and lower FKD reported by those who had recently completed training (within 2-5 years) versus those in practice much longer. This is particularly interesting, as our institution has maintained the same lecture-based program for many years without significant changes. Although these differences may not be statistically significant, they may reflect an increased interest in and attention to learning PM skills while in training. However, we acknowledge this is only one of many possible explanations for these findings.
This study had several limitations. First, all respondents were graduates of a single institution. We were trying to limit the variability in business training, but this also limits the scope of the results. Second, self-ratings on surveys provide subjective measures of business knowledge and functional knowledge. Scores may vary based on individuals’ understanding of given topics, or they may inaccurately represent their level of understanding. This is especially true of respondents who graduated from residency, for example, 20 years earlier—their survey responses may reflect erroneous recollection of business training at time of graduation compared with respondents who graduated more recently. Conversely, more recent graduates may not have a fully formed or accurate picture of how much business knowledge is required to function in practice. Nevertheless, we found no significant differences in measured parameters based on graduation date, so we chose not to exclude older respondents, which also may have weakened our data pool. Further, FKDs are relative values used to compare subjective deficiencies rather than absolute scores of specific general knowledge. As such, subjectivity, including recollection of business training, is inherent in the model used in this study.
Conclusion
Graduating orthopedic surgeons currently appear inadequately prepared to effectively manage business issues in their practices, as evidenced by their low overall knowledge levels and high FKDs. The novel FKD model described in this study helps define FKD levels and identify topics that may provide the highest yield in improving effectiveness in practice. Residency curricula focused on improving business and PM knowledge, particularly in the topics with the highest FKDs (eg, business operations, coding/billing), may improve training efficiency in these areas. Further studies with larger numbers of physicians across multiple institutions are needed to confirm these findings and to validate the FKD concept.
1. Rose EA, Neale AV, Rathur WA. Teaching practice management during residency. Fam Med. 1999;31(2):107-113.
2. Accreditation Council for Graduate Medical Education. ACGME common program requirements. http://www.acgme.org/acgmeweb/Portals/0/PFAssets/ProgramRequirements/CPRs2013.pdf. Updated June 9, 2013. Accessed August 25, 2015.
3. Itani K. A positive approach to core competencies and benchmarks for graduate medical education. Am J Surg. 2002;184(3):196-203.
4. Lusco VC, Martinez SA, Polk HC Jr. Program directors in surgery agree that residents should be formally trained in business and practice management. Am J Surg. 2005;189(1):11-13.
5. McDonnell PJ, Kirwan TJ, Brinton GS, et al. Perceptions of recent ophthalmology residency graduates regarding preparation for practice. Ophthalmology. 2007;114(2):387-391.
6. Gill JB, Schutt RC Jr. Practice management education in orthopaedic surgical residencies. J Bone Joint Surg Am. 2007;89(1):216-219.
7. Satiani B. Business knowledge in surgeons. Am J Surg. 2004;188(1):13-16.
8. Cantor JC, Baker LC, Hughes RG. Preparedness for practice. Young physicians’ views of their professional education. JAMA. 1993;270(9):1035-1040.
9. Fakhry SM, Robinson L, Hendershot K, Reines HD. Surgical residents’ knowledge of documentation and coding for professional services: an opportunity for a focused educational offering. Am J Surg. 2007;194(2):263-267.
10. Williford LE, Ling FW, Summitt RL Jr, Stovall TG. Practice management in obstetrics and gynecology residency curriculum. Obstet Gynecol. 1999;94(3):476-479.
11. Andreae MC, Dunham K, Freed GL. Inadequate training in billing and coding as perceived by recent pediatric graduates. Clin Pediatr. 2009;48(9):939-944.
12. Kolva DE, Barzee KA, Morley CP. Practice management residency curricula: a systematic literature review. Fam Med. 2009;41(6):411-419.
13. Jones K, Lebron RA, Mangram A, Dunn E. Practice management education during surgical residency. Am J Surg. 2008;196(6):878-881.
14. Kerfoot BP, Conlin PR, Travison T, McMahon GT. Web-based education in systems-based practice: a randomized trial. Arch Intern Med. 2007;167(4):361-366.
15. LoPresti L, Ginn P, Treat R. Using a simulated practice to improve practice management learning. Fam Med. 2009;41(9):640-645.
16. Accreditation Council for Graduate Medical Education. Family medicine program requirements. https://www.acgme.org/acgmeweb/tabid/132/ProgramandInstitutionalAccreditation/MedicalSpecialties/FamilyMedicine.aspx. Accessed September 23, 2015.
Current Evidence Does Not Support Medicare’s 3-Day Rule in Primary Total Joint Arthroplasty
Medicare beneficiaries’ demand for total hip arthroplasty (THA) and total knee arthroplasty (TKA) has increased significantly over the past several years, with recent studies reporting 209,945 primary THAs and 243,802 primary TKAs performed annually.1,2 With this demand has come an increase in the percentage of patients discharged to an extended-care facility (ECF) for skilled nursing care or acute rehabilitation—an estimated 49.3% for THA and 41.5% for TKA.1,2 To qualify for discharge to an ECF, Medicare beneficiaries are required to have an inpatient stay of at least 3 consecutive days.3 Although the basis of this rule is unclear, it is thought to prevent hasty discharge of unstable patients.
We conducted a study to explore the effect of this policy on length of stay (LOS) in a population of patients who underwent primary total joint arthroplasty (TJA). Based on a pilot study by our group, we hypothesized that such a statuary requirement would be associated with increased LOS and would not prevent discharge of potentially unstable patients. Specifically, we explored whether patients who could have been discharged earlier experienced any later inpatient complications or 30-day readmission to justify staying past their discharge readiness.
Materials and Methods
Institutional review board approval was obtained for this study. Between 2011 and 2012, the senior authors (Dr. Wellman, Dr. Attarian, Dr. Bolognesi) treated 985 patients with Current Procedural Terminology (CPT) codes 27130 (THA) and 27447 (TKA). Of the 985 patients, 287 (29.13%) were discharged to an ECF and were included in the study. Three of the 287 were excluded: 2 for requiring preadmission for medical optimization and 1 for having another procedure with plastic surgery. All patients were admitted from home on day of surgery and had a standardized clinical pathway with respect to pain control, mobilization, and anticoagulation. Physical therapy and occupational therapy (PT/OT) were initiated on day of surgery and were continued daily until discharge.
The primary outcome was discharge readiness, defined as meeting the criteria of stable blood pressure, pulse, and breathing; no fever over 101.5°F for 24 hours before discharge; wound healing with no concerns; pain controlled with oral medications; and ambulation or the potential for rehabilitation at the receiving facility. Secondary outcomes were changes in PT/OT progress, medical interventions, and 30-day readmission rate. PT/OT progress was categorized as either slow or steady by the therapist assigned to each patient at time of hospitalization. Steady progress indicated overall improvement on several measures, including transfers, ambulation distance, and ability to adhere to postoperative precautions; slow progress indicated no improvement on these measures.
Results for continuous variables were summarized with means, standard deviations, and ranges, and results for categorical variables were summarized with counts and percentages. Student t test was used to evaluate increase in LOS, and the McNemar test for paired data was used to analyze rehabilitation gains from readiness-for-discharge day to the next postoperative day (POD). SAS Version 9.2 software (SAS Institute) was used for all analyses.
Results
Of the 284 patients included in the study, 203 were female (71.5%), 81 male (28.5%). Mean (SD) age was 68 (11) years (range, 21-92 years). One hundred seventy-nine patients (63.0%) underwent TKA, and 105 (37.0%) underwent THA. Two hundred twenty-seven patients (80.0%) were discharged to skilled nursing care, and 57 (20.1%) to inpatient rehabilitation. Mean (SD) LOS was 3.44 (0.92) days (range, 3-9 days). One hundred eighty-three patients (64.4%) were ready for discharge on POD 2, 76 (26.8%) on POD 3, and 25 (8.8%) after POD 3. Delaying discharge until POD 3 increased LOS by 1.08 days (P < .001). Two hundred nine patients (73.6%) were discharged on POD 3, and 75 (26.4%) after POD 3. Reasons for being discharged after POD 3 were lack of ECF bed availability (48 patients, 64.0%) and postoperative complications (27 patients, 36.0%). Patients ready for discharge on POD 2 had fewer complications than patients ready after POD 2 (P < .001).
Analysis of the 183 patients who were ready for discharge on POD 2 demonstrated a statistically significant (P = .038) change in rehabilitation progress by staying an additional hospital day. However, this difference was not clinically significant: Only 17.5% of patients improved, while 82.5% remained unchanged or declined in progress. Most important, among patients who demonstrated rehabilitation gains, the improvement was not sufficient to change the decision regarding discharge destination. Three patients (1.6%) ready for discharge on POD 2 were readmitted within 30 days of discharge (2 for wound infection, 1 for syncope). Risk for 30-day readmission or development of an inpatient complication in patients ready for discharge on POD 2 was not significant (P = .073). Table 1 summarizes the statistical results.

As age 65 years or older is one of the major criteria for Medicare eligibility, a secondary analysis was performed to explore whether there were age-related differences in the study outcomes. We found no significant differences between patients 65 years or older and patients younger than 65 years with respect to discharge readiness, LOS, postoperative complications, or 30-day readmission. Table 2 summarizes the statistical results based on age.
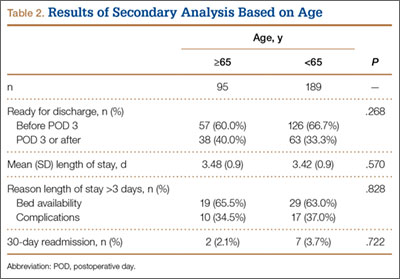
Discussion
Consistent with our pilot study,4 the majority of patients discharged to an ECF were ready for discharge on POD 2. Delaying discharge until POD 3 increased LOS by 1.08 days with no significant risk in 30-day readmission if patients were allowed to be discharged 1 day earlier. Different from our pilot study results, however, 17.5% of patients who stayed past their discharge readiness showed improvement in PT/OT progress, though this was not clinically sufficient to alter the decision regarding discharge destination. This difference can be attributed to the fact that the current study (vs the pilot study) was adequately powered for this outcome.
Our study was specifically designed to evaluate the effect of Medicare’s 3-day rule—the requirement of an inpatient hospital stay of at least 3 consecutive days to qualify for coverage for treatment at an ECF. This policy creates tremendous unnecessary hospitalization and resource utilization and denies patients earlier access to specialized postacute care. To put the economic implications of this policy in perspective, almost half of the 1 million TJAs performed annually are performed for Medicare beneficiaries, and almost half of those patients are discharged to an ECF.1,2,5 This equates to about 161,000 days of unnecessary hospitalization per year (64.4% of 250,000 patients), which translates into $310,730,000 in expenditures based on an average cost of $1930 per inpatient day for state/local government, nonprofit, and for-profit hospitals.6 Furthermore, with a growing trend toward outpatient TJA, the Medicare statute may leave substantial bills for patients who happen to require unplanned discharge to an ECF.
This study had its weaknesses. First, it was a retrospective review of charts at a single tertiary-care hospital. However, observer bias may have been eliminated, as the data were collected before a study was planned. An outcome such as discharge readiness, if prospectively assessed, could easily have been influenced by study personnel. Second, our patient sample was too small to definitively resolve this issue and be able to effect public policy change. However, there was sufficient power for the primary outcome. We also analyzed a consecutive group of patients who underwent a standardized postoperative clinical pathway with clear discharge-readiness criteria.
The effect of this study in the era of the Patient Protection and Affordable Care Act and its Bundled Payments for Care Improvement (BPCI) initiative deserves special attention. The BPCI initiative is divided into 4 models that reconcile payments associated with an episode of care (eg, TKA) against a predetermined payment amount.7 Relevant to our study, BPCI model 2 covers inpatient hospitalization up to 30, 60, or 90 days after discharge and includes a waiver of the 3-day rule for inpatient hospitalization. There are only 60 BPCI model 2–participating health care organizations. On the basis of our study results, we think the waiver is a step in the right direction, as no demonstrable benefits were realized from having patients stay hospitalized longer. However, the waiver should not be limited to select entities, and we hope that, with further research, the statutory requirement of 3-day inpatient hospitalization will be repealed.
Conclusion
Our study results call into question the validity of Medicare’s 3-day rule, and we hope they stimulate further research to definitively resolve this question. The majority of our study patients destined for discharge to an ECF could have been safely discharged on POD 2. The implications of reducing LOS cannot be overstated. From a hospital perspective, reducing LOS eliminates unnecessary hospitalization and resource utilization. From a patient perspective, it allows earlier access to specialized care and eliminates billing confusion. From a payer perspective, it may reduce costs significantly.
1. Cram P, Lu X, Kates SL, Singh JA, Li Y, Wolf BR. Total knee arthroplasty volume, utilization, and outcomes among Medicare beneficiaries, 1991–2010. JAMA. 2012;308(12):1227-1236.
2. Cram P, Lu X, Callaghan JJ, Vaughan-Sarrazin MS, Cai X, Li Y. Long-term trends in hip arthroplasty use and volume. J Arthroplasty. 2012;27(2):278-285.e2.
3. Centers for Medicare & Medicaid Services. Medicare Coverage of Skilled Nursing Facility Care. Baltimore, MD: US Dept of Health and Human Services, Centers for Medicare & Medicaid Services. CMS Product No. 10153. http://www.medicare.gov/pubs/pdf/10153.pdf. Revised January 2015. Accessed August 24, 2015.
4. Halawi MJ, Vovos TJ, Green CL, Wellman SS, Attarian DE, Bolognesi MP. Medicare’s 3-day rule: time for a rethink. J Arthroplasty. 2015;30(9):1483-1484.
5. Inpatient surgery. Centers for Disease Control and Prevention, National Center for Health Statistics website. http://www.cdc.gov/nchs/fastats/inpatient-surgery.htm. Updated April 29, 2015. Accessed August 24, 2015.
6 Hospital adjusted expenses per inpatient day by ownership. 2013. Kaiser Family Foundation website. http://kff.org/other/state-indicator/expenses-per-inpatient-day-by-ownership. Accessed August 24, 2015.
7. BPCI [Bundled Payments for Care Improvement] model 2: retrospective acute & post acute care episode. Centers for Medicare & Medicare Services website. http://innovation.cms.gov/initiatives/BPCI-Model-2. Updated August 20, 2015. Accessed August 24, 2015.
Medicare beneficiaries’ demand for total hip arthroplasty (THA) and total knee arthroplasty (TKA) has increased significantly over the past several years, with recent studies reporting 209,945 primary THAs and 243,802 primary TKAs performed annually.1,2 With this demand has come an increase in the percentage of patients discharged to an extended-care facility (ECF) for skilled nursing care or acute rehabilitation—an estimated 49.3% for THA and 41.5% for TKA.1,2 To qualify for discharge to an ECF, Medicare beneficiaries are required to have an inpatient stay of at least 3 consecutive days.3 Although the basis of this rule is unclear, it is thought to prevent hasty discharge of unstable patients.
We conducted a study to explore the effect of this policy on length of stay (LOS) in a population of patients who underwent primary total joint arthroplasty (TJA). Based on a pilot study by our group, we hypothesized that such a statuary requirement would be associated with increased LOS and would not prevent discharge of potentially unstable patients. Specifically, we explored whether patients who could have been discharged earlier experienced any later inpatient complications or 30-day readmission to justify staying past their discharge readiness.
Materials and Methods
Institutional review board approval was obtained for this study. Between 2011 and 2012, the senior authors (Dr. Wellman, Dr. Attarian, Dr. Bolognesi) treated 985 patients with Current Procedural Terminology (CPT) codes 27130 (THA) and 27447 (TKA). Of the 985 patients, 287 (29.13%) were discharged to an ECF and were included in the study. Three of the 287 were excluded: 2 for requiring preadmission for medical optimization and 1 for having another procedure with plastic surgery. All patients were admitted from home on day of surgery and had a standardized clinical pathway with respect to pain control, mobilization, and anticoagulation. Physical therapy and occupational therapy (PT/OT) were initiated on day of surgery and were continued daily until discharge.
The primary outcome was discharge readiness, defined as meeting the criteria of stable blood pressure, pulse, and breathing; no fever over 101.5°F for 24 hours before discharge; wound healing with no concerns; pain controlled with oral medications; and ambulation or the potential for rehabilitation at the receiving facility. Secondary outcomes were changes in PT/OT progress, medical interventions, and 30-day readmission rate. PT/OT progress was categorized as either slow or steady by the therapist assigned to each patient at time of hospitalization. Steady progress indicated overall improvement on several measures, including transfers, ambulation distance, and ability to adhere to postoperative precautions; slow progress indicated no improvement on these measures.
Results for continuous variables were summarized with means, standard deviations, and ranges, and results for categorical variables were summarized with counts and percentages. Student t test was used to evaluate increase in LOS, and the McNemar test for paired data was used to analyze rehabilitation gains from readiness-for-discharge day to the next postoperative day (POD). SAS Version 9.2 software (SAS Institute) was used for all analyses.
Results
Of the 284 patients included in the study, 203 were female (71.5%), 81 male (28.5%). Mean (SD) age was 68 (11) years (range, 21-92 years). One hundred seventy-nine patients (63.0%) underwent TKA, and 105 (37.0%) underwent THA. Two hundred twenty-seven patients (80.0%) were discharged to skilled nursing care, and 57 (20.1%) to inpatient rehabilitation. Mean (SD) LOS was 3.44 (0.92) days (range, 3-9 days). One hundred eighty-three patients (64.4%) were ready for discharge on POD 2, 76 (26.8%) on POD 3, and 25 (8.8%) after POD 3. Delaying discharge until POD 3 increased LOS by 1.08 days (P < .001). Two hundred nine patients (73.6%) were discharged on POD 3, and 75 (26.4%) after POD 3. Reasons for being discharged after POD 3 were lack of ECF bed availability (48 patients, 64.0%) and postoperative complications (27 patients, 36.0%). Patients ready for discharge on POD 2 had fewer complications than patients ready after POD 2 (P < .001).
Analysis of the 183 patients who were ready for discharge on POD 2 demonstrated a statistically significant (P = .038) change in rehabilitation progress by staying an additional hospital day. However, this difference was not clinically significant: Only 17.5% of patients improved, while 82.5% remained unchanged or declined in progress. Most important, among patients who demonstrated rehabilitation gains, the improvement was not sufficient to change the decision regarding discharge destination. Three patients (1.6%) ready for discharge on POD 2 were readmitted within 30 days of discharge (2 for wound infection, 1 for syncope). Risk for 30-day readmission or development of an inpatient complication in patients ready for discharge on POD 2 was not significant (P = .073). Table 1 summarizes the statistical results.
As age 65 years or older is one of the major criteria for Medicare eligibility, a secondary analysis was performed to explore whether there were age-related differences in the study outcomes. We found no significant differences between patients 65 years or older and patients younger than 65 years with respect to discharge readiness, LOS, postoperative complications, or 30-day readmission. Table 2 summarizes the statistical results based on age.
Discussion
Consistent with our pilot study,4 the majority of patients discharged to an ECF were ready for discharge on POD 2. Delaying discharge until POD 3 increased LOS by 1.08 days with no significant risk in 30-day readmission if patients were allowed to be discharged 1 day earlier. Different from our pilot study results, however, 17.5% of patients who stayed past their discharge readiness showed improvement in PT/OT progress, though this was not clinically sufficient to alter the decision regarding discharge destination. This difference can be attributed to the fact that the current study (vs the pilot study) was adequately powered for this outcome.
Our study was specifically designed to evaluate the effect of Medicare’s 3-day rule—the requirement of an inpatient hospital stay of at least 3 consecutive days to qualify for coverage for treatment at an ECF. This policy creates tremendous unnecessary hospitalization and resource utilization and denies patients earlier access to specialized postacute care. To put the economic implications of this policy in perspective, almost half of the 1 million TJAs performed annually are performed for Medicare beneficiaries, and almost half of those patients are discharged to an ECF.1,2,5 This equates to about 161,000 days of unnecessary hospitalization per year (64.4% of 250,000 patients), which translates into $310,730,000 in expenditures based on an average cost of $1930 per inpatient day for state/local government, nonprofit, and for-profit hospitals.6 Furthermore, with a growing trend toward outpatient TJA, the Medicare statute may leave substantial bills for patients who happen to require unplanned discharge to an ECF.
This study had its weaknesses. First, it was a retrospective review of charts at a single tertiary-care hospital. However, observer bias may have been eliminated, as the data were collected before a study was planned. An outcome such as discharge readiness, if prospectively assessed, could easily have been influenced by study personnel. Second, our patient sample was too small to definitively resolve this issue and be able to effect public policy change. However, there was sufficient power for the primary outcome. We also analyzed a consecutive group of patients who underwent a standardized postoperative clinical pathway with clear discharge-readiness criteria.
The effect of this study in the era of the Patient Protection and Affordable Care Act and its Bundled Payments for Care Improvement (BPCI) initiative deserves special attention. The BPCI initiative is divided into 4 models that reconcile payments associated with an episode of care (eg, TKA) against a predetermined payment amount.7 Relevant to our study, BPCI model 2 covers inpatient hospitalization up to 30, 60, or 90 days after discharge and includes a waiver of the 3-day rule for inpatient hospitalization. There are only 60 BPCI model 2–participating health care organizations. On the basis of our study results, we think the waiver is a step in the right direction, as no demonstrable benefits were realized from having patients stay hospitalized longer. However, the waiver should not be limited to select entities, and we hope that, with further research, the statutory requirement of 3-day inpatient hospitalization will be repealed.
Conclusion
Our study results call into question the validity of Medicare’s 3-day rule, and we hope they stimulate further research to definitively resolve this question. The majority of our study patients destined for discharge to an ECF could have been safely discharged on POD 2. The implications of reducing LOS cannot be overstated. From a hospital perspective, reducing LOS eliminates unnecessary hospitalization and resource utilization. From a patient perspective, it allows earlier access to specialized care and eliminates billing confusion. From a payer perspective, it may reduce costs significantly.
1. Cram P, Lu X, Kates SL, Singh JA, Li Y, Wolf BR. Total knee arthroplasty volume, utilization, and outcomes among Medicare beneficiaries, 1991–2010. JAMA. 2012;308(12):1227-1236.
2. Cram P, Lu X, Callaghan JJ, Vaughan-Sarrazin MS, Cai X, Li Y. Long-term trends in hip arthroplasty use and volume. J Arthroplasty. 2012;27(2):278-285.e2.
3. Centers for Medicare & Medicaid Services. Medicare Coverage of Skilled Nursing Facility Care. Baltimore, MD: US Dept of Health and Human Services, Centers for Medicare & Medicaid Services. CMS Product No. 10153. http://www.medicare.gov/pubs/pdf/10153.pdf. Revised January 2015. Accessed August 24, 2015.
4. Halawi MJ, Vovos TJ, Green CL, Wellman SS, Attarian DE, Bolognesi MP. Medicare’s 3-day rule: time for a rethink. J Arthroplasty. 2015;30(9):1483-1484.
5. Inpatient surgery. Centers for Disease Control and Prevention, National Center for Health Statistics website. http://www.cdc.gov/nchs/fastats/inpatient-surgery.htm. Updated April 29, 2015. Accessed August 24, 2015.
6 Hospital adjusted expenses per inpatient day by ownership. 2013. Kaiser Family Foundation website. http://kff.org/other/state-indicator/expenses-per-inpatient-day-by-ownership. Accessed August 24, 2015.
7. BPCI [Bundled Payments for Care Improvement] model 2: retrospective acute & post acute care episode. Centers for Medicare & Medicare Services website. http://innovation.cms.gov/initiatives/BPCI-Model-2. Updated August 20, 2015. Accessed August 24, 2015.
Using 3-Dimensional Fluoroscopy to Assess Acute Clavicle Fracture Displacement: A Radiographic Study
Clavicle fractures are common injuries, accounting for 2.6% to 5% of all adult fractures.1,2 Most clavicle fractures (69%-82%) occur in the middle third or midshaft.3,4 Midshaft clavicle fractures are often treated successfully with nonoperative means consisting of shoulder immobilization with either a sling or a figure-of-8 brace. Operative indications historically have been limited to open or impending open injuries and to patients with underlying neurovascular compromise. However, recent clinical studies have found that fractures with particular characteristics may benefit from surgical fixation. Important relative indications for open reduction and internal fixation of midshaft clavicle fractures are complete fracture fragment displacement with no cortical contact, and fractures with axial shortening of more than 20 mm.5,6
Accurately determining the extent of displacement and shortening can therefore be important in guiding treatment recommendations. The standard radiographic view for a clavicle fracture is upright or supine anteroposterior (AP). Typically, an AP radiograph with cephalic tilt of about 20° is obtained as well. On occasion, other supplemental radiographs, such as a 45° angulated view, as originally described by Quesada,7 are obtained. To our knowledge, the literature includes only 2 reports of studies that have compared different radiographic views and their accuracy in measuring fracture shortening8,9; no study has determined the best radiographic view for evaluating fracture displacement.
We conducted a study to determine which radiographic view best captures the most fracture fragment displacement. Acute midshaft clavicle fractures were assessed with simulated angled radiographs created from preoperative upright 3-dimensional (3-D) fluoroscopy scans. Our hypothesis was that a radiographic view with 20° of cephalic tilt would most often detect the most fracture displacement. In addition, we retrospectively reviewed our study patients’ initial AP injury radiographs to determine if obtaining a different view at maximum displacement would have helped identify a larger number of completely displaced midshaft clavicle fractures.
Patients and Methods
Institutional review board approval was obtained. Using our institution’s trauma registry database, we retrospectively identified 10 cases of patients who had undergone preoperative 3-D fluoroscopy for midshaft clavicle fractures. Study inclusion criteria were age 18 years or older, acute midshaft clavicle fracture, and preoperative 3-D fluoroscopy scan of clavicle available. Pediatric patients, nonacute injuries, and clavicle fractures of the lateral or medial third were excluded.
Three-dimensional fluoroscopy was used when the treating surgeon deemed it necessary for preoperative planning. All imaging was performed with a Philips MultiDiagnost Eleva 3-D fluoroscopy imager with patients in the upright standing position. (Informed patient consent was obtained.) Software bundled with the imager was used to create representative radiographs of differing angulation.
The common practice at most institutions is to obtain 2 radiographic views as part of a standard clavicle series. The additional AP angulated radiograph typically is obtained with 20° to 45° cephalic tilt from the horizontal axis. Therefore, simulated radiographs ranging from 15° to 50° of angulation in 5° increments were created, and the amount of superior displacement of the medial fragment was measured. As the simulated views were constructed from a 3-D composite image, there was none of the magnification error that occurs with AP or posteroanterior (PA) views. The stated degree of angulation mimics a radiograph’s AP cephalic tilt or PA caudal tilt (Figures 1A, 1B). For all radiographic images, displacement between fracture fragments was determined by measuring the distance between the superior cortices at the fracture site of the medial and lateral fragments. Each simulated radiograph was measured by 2 readers using standard computerized radiographic measurement tools. Final displacement was taken as the mean of the 2 measurements.
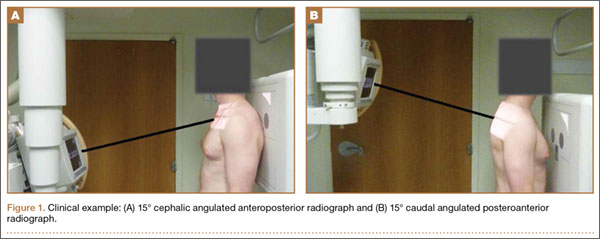
After determining which radiographic angulation demonstrated the largest number of maximally displaced fractures, we compared the simulated radiographs at that angulation with the injury AP images for all patients. Total number of patients with a completely displaced midshaft clavicle fracture and no cortical contact was recorded for the 2 radiographic views.
The Orthopaedic Trauma Association classification system8 was used to classify the clavicle fractures. Statistical analysis was performed with the Fisher exact test and a regression model, using SPSS Version 19.0 (IBM SPSS Statistics).
Results
Ten patients met the study inclusion criteria. Mean age was 32.9 years (range, 18-65 years). Seven of the 10 patients were male. Six patients had right-side clavicle fractures. Of the 10 patients, 5 had the comminuted wedge fracture pattern (15-B2.3), 2 had the simple spiral pattern (15-B1.1), 2 had the spiral wedge pattern (15-B2.1), and 1 had the oblique pattern (15-B1.2).
Table 1 summarizes the fracture displacement measurements obtained with the different radiographic views. Of the 10 cases, 5 showed the most displacement with the 15° tilted view (P = .004), and the other 5 showed maximum displacement with different radiographic angulations. In addition, 6 patients showed the least displacement with the 50° angulated view (P < .001). Results of the regression analysis are summarized in Tables 2 and 3.
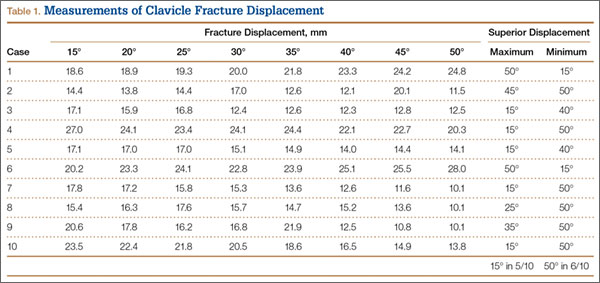
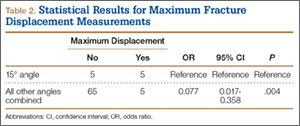
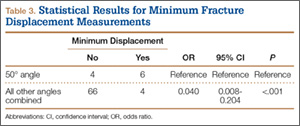
Initial horizontal AP imaging showed completely displaced midshaft clavicle fractures in 9 of the 10 patients, and 15° simulated radiographs showed completely displaced fractures in all 10 patients (P = .50).
Discussion
Our study results demonstrated that an upright 15° radiographic tilt (AP cephalad or PA caudal) identified the most fracture displacement in the most patients with acute midshaft clavicle fractures. To our knowledge, this is the first study to identify the radiographic angulation that best shows the most clavicle fracture fragment displacement.
Other investigators have studied the accuracy of different radiographic views in the assessment of midshaft clavicle fractures, but they concentrated on fracture shortening. Smekal and colleagues9 used computed tomography (CT) and 3 different radiographic views to evaluate malunited midshaft clavicle fractures. Comparing the horizontal clavicular length measurements obtained with radiographs and CT scans, they determined that PA thoracic radiographs were in highest agreement with the CT scans. The results, however, were not statistically significant. In their study, supine CT was successful because the fractures were healed, and the displacement and shortening amounts were not affected by patient position. Sharr and Mohammed10 studied the accuracy of different views in the assessment of clavicle length in an articulated cadaver specimen. They obtained multiple AP and PA radiographs of different horizontal (medial, lateral) and vertical (cephalad, caudal) angulations. Actual clavicle length was then directly measured and compared with the length measured on the different views. The authors concluded that a PA 15° caudal radiograph was most accurate in assessing clavicular length. Both Smekal and colleagues9 and Sharr and Mohammed10 recommended the PA radiograph because it decreases the degree of magnification on AP radiographs by minimizing the film-to-object distance.
Our findings are important because more accurate determination of fracture displacement in patients with midshaft clavicle fractures may change clinical management. Nowak and colleagues11 investigated various patient and clavicle fracture characteristics that were predictive of a higher rate of long-term sequelae. They found that complete fracture displacement was the strongest radiographic predictor of patients’ beliefs that they were fully recovered from injury at final follow-up. The authors concluded that fractures with no bony contact should receive more “active” management. Robinson and colleagues12 studied a cohort of patients with nonoperatively managed midshaft clavicle fractures and concluded that complete fracture displacement significantly increased risk for nonunion (this risk was 2.3 times higher in patients with displaced fractures than in patients with nondisplaced fractures). Last, McKee and colleagues13 found that shoulder strength and endurance were significantly decreased in nonoperatively treated displaced midshaft clavicle fractures than in the same patients’ uninjured shoulders.
Extending the results of these studies, recent prospective randomized control trials and a meta-analysis have compared the clinical outcomes of nonoperatively and operatively managed displaced midshaft clavicle fractures.14-18 With few exceptions, these studies found improved clinical results with operative fixation. In one such study, the Canadian Orthopaedic Trauma Society14 randomized patients with displaced midshaft clavicle fractures to either operative plate fixation or sling immobilization. The operative group was found to have improved Disability of the Arm, Shoulder, and Hand scores, improved Constant shoulder scores, increased patient satisfaction, faster mean time to bony fracture union, higher satisfaction with shoulder appearance, and lower rates of nonunion and malunion. Given the results of these studies, accurate identification of a displaced midshaft clavicle fracture with no cortical contact is fundamental in deciding whether to recommend operative fixation.
Retrospective review of our cohort’s initial radiographs revealed 1 case in which the patient’s completely displaced midshaft clavicle fracture would not have been diagnosed solely with an AP horizontal image. Cortical contact was seen on a standard AP clavicle radiograph (Figures 2A, 2B), and a 15° tilt radiograph created from 3-D fluoroscopy scan showed complete fracture fragment displacement (Figure 3). A change in fracture classification from partially displaced to fully displaced could alter the type of management used by a treating surgeon.
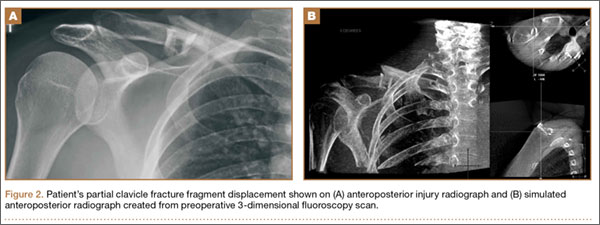
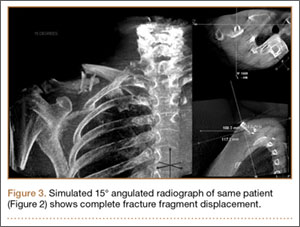
There were obvious weaknesses to this study. First, its sample size was small (10 patients). Nevertheless, we had sufficient numbers to find a statistically significant angulation. Second, a wider range of radiographic angles could have been studied. Our intent, however, was to investigate the accuracy of the 2 most common supplementary clavicle views (20° and 45° cephalic tilt). Therefore, we selected a range of simulated radiographs that began 5° outside these angulations. Third, we measured only the degree of fracture displacement; we were unable to accurately access fracture shortening, as the 3-D fluoroscopic images were limited to the injured clavicles. A potential solution to this problem is to widen the exposure field in order to include the entire chest and allow clavicular length comparison against the uninjured side. Doing this would have been possible, but at the expense of increasing the patient’s radiation exposure.
This innovative study used 3-D fluoroscopy to capture clavicle fracture images with patients in an upright position. Unlike standard CT, in which patients are supine, this 3-D imaging technology better emulates the patient positioning used for upright radiographs, thereby avoiding potential fracture fragment alignment changes caused by shifts in body position. In addition, 3-D fluoroscopy allows us to create multiple precise simulated radiographic angulations without the magnification error of AP radiographs and, to a lesser extent, PA radiographs. Having a standing PA 15° caudal tilt radiograph obviates the need for CT with 3-D reconstruction. More fine detail may be revealed by CT with 3-D reconstruction than by a standing PA 15° caudal tilt radiograph, but the patient faces less radiation risk and cost with the radiograph.
There is no consensus as to what constitutes the standard radiographic series for clavicle fractures. Radiographic technique can vary with respect to supplemental view angulation, supine or upright patient positioning, and AP or PA radiographic views. Although our study did not address the effect of supine versus upright patient positioning on acute midshaft clavicle fracture displacement, we think that, for all clinical and research purposes, upright 15° caudal PA radiographs should be obtained for patients with acute midshaft clavicle fractures.
Conclusion
Our retrospective study of 10 patients with acute midshaft clavicle fractures and preoperative upright 3-D fluoroscopy scans found that a 15° angulated radiograph most often demonstrated the most fracture fragment displacement. Given these findings, we recommend obtaining an additional PA 15° caudal radiograph in the upright position for patients with midshaft clavicle fractures to best assess the extent of fracture displacement. Accurately identifying the degree of fracture displacement is important, as operative management of completely displaced fractures has been shown to improve clinical outcomes.
1. Postacchini F, Gumina S, De Santis P, Albo F. Epidemiology of clavicle fractures. J Shoulder Elbow Surg. 2002;11(5):452-456.
2. Nordqvist A, Petersson C. The incidence of fractures of the clavicle. Clin Orthop Relat Res. 1994;(300):127-132.
3. Robinson CM. Fractures of the clavicle in the adult. Epidemiology and classification. J Bone Joint Surg Br. 1998;80(3):476-484.
4. Rowe CR. An atlas of anatomy and treatment of midclavicular fractures. Clin Orthop Relat Res. 1968;(58):29-42.
5. Jeray KJ. Acute midshaft clavicular fracture. J Am Acad Orthop Surg. 2007;15(4):239-248.
6. Khan LA, Bradnock TJ, Scott C, Robinson CM. Fractures of the clavicle. J Bone Joint Surg Am. 2009;91(2):447-460.
7. Quesada F. Technique for the roentgen diagnosis of fractures of the clavicle. Surg Gynecol Obstet. 1926;42:424-428.
8. Marsh JL, Slongo TF, Agel J, et al. Fracture and dislocation classification compendium—2007: Orthopaedic Trauma Association Classification, Database and Outcomes Committee. J Orthop Trauma. 2007;21(10 suppl):S1-S133.
9. Smekal V, Deml C, Irenberger A, et al. Length determination in midshaft clavicle fractures: validation of measurement. J Orthop Trauma. 2008;22(7):458-462.
10. Sharr JR, Mohammed KD. Optimizing the radiographic technique in clavicular fractures. J Shoulder Elbow Surg. 2003;12(2):170-172.
11. Nowak J, Holgersson M, Larsson S. Can we predict long-term sequelae after fractures of the clavicle based on initial findings? A prospective study with nine to ten years of follow-up. J Shoulder Elbow Surg. 2004;13(5):479-486.
12. Robinson CM, Court-Brown CM, McQueen MM, Wakefield AE. Estimating the risk of nonunion following nonoperative treatment of a clavicular fracture. J Bone Joint Surg Am. 2004;86(7):1359-1365.
13. McKee MD, Pedersen EM, Jones C, et al. Deficits following nonoperative treatment of displaced midshaft clavicular fractures. J Bone Joint Surg Am. 2006;88(1):35-40.
14. Canadian Orthopaedic Trauma Society. Nonoperative treatment compared with plate fixation of displaced midshaft clavicular fractures. A multicenter, randomized clinical trial. J Bone Joint Surg Am. 2007;89(1):1-10.
15. Judd DB, Pallis MP, Smith E, Bottoni CR. Acute operative stabilization versus nonoperative management of clavicle fractures. Am J Orthop. 2009;38(7):341-345.
16. Smekal V, Irenberger A, Struve P, Wambacher M, Krappinger D, Kralinger FS. Elastic stable intramedullary nailing versus nonoperative treatment of displaced midshaft clavicular fractures—a randomized, controlled, clinical trial. J Orthop Trauma. 2009;23(2):106-112.
17. Witzel K. Intramedullary osteosynthesis in fractures of the mid-third of the clavicle in sports traumatology [in German]. Z Orthop Unfall. 2007;145(5):639-642.
18. McKee RC, Whelan DB, Schemitsch EH, McKee MD. Operative versus nonoperative care of displaced midshaft clavicular fractures: a meta-analysis of randomized clinical trials. J Bone Joint Surg Am. 2012;94(8):675-684.
Clavicle fractures are common injuries, accounting for 2.6% to 5% of all adult fractures.1,2 Most clavicle fractures (69%-82%) occur in the middle third or midshaft.3,4 Midshaft clavicle fractures are often treated successfully with nonoperative means consisting of shoulder immobilization with either a sling or a figure-of-8 brace. Operative indications historically have been limited to open or impending open injuries and to patients with underlying neurovascular compromise. However, recent clinical studies have found that fractures with particular characteristics may benefit from surgical fixation. Important relative indications for open reduction and internal fixation of midshaft clavicle fractures are complete fracture fragment displacement with no cortical contact, and fractures with axial shortening of more than 20 mm.5,6
Accurately determining the extent of displacement and shortening can therefore be important in guiding treatment recommendations. The standard radiographic view for a clavicle fracture is upright or supine anteroposterior (AP). Typically, an AP radiograph with cephalic tilt of about 20° is obtained as well. On occasion, other supplemental radiographs, such as a 45° angulated view, as originally described by Quesada,7 are obtained. To our knowledge, the literature includes only 2 reports of studies that have compared different radiographic views and their accuracy in measuring fracture shortening8,9; no study has determined the best radiographic view for evaluating fracture displacement.
We conducted a study to determine which radiographic view best captures the most fracture fragment displacement. Acute midshaft clavicle fractures were assessed with simulated angled radiographs created from preoperative upright 3-dimensional (3-D) fluoroscopy scans. Our hypothesis was that a radiographic view with 20° of cephalic tilt would most often detect the most fracture displacement. In addition, we retrospectively reviewed our study patients’ initial AP injury radiographs to determine if obtaining a different view at maximum displacement would have helped identify a larger number of completely displaced midshaft clavicle fractures.
Patients and Methods
Institutional review board approval was obtained. Using our institution’s trauma registry database, we retrospectively identified 10 cases of patients who had undergone preoperative 3-D fluoroscopy for midshaft clavicle fractures. Study inclusion criteria were age 18 years or older, acute midshaft clavicle fracture, and preoperative 3-D fluoroscopy scan of clavicle available. Pediatric patients, nonacute injuries, and clavicle fractures of the lateral or medial third were excluded.
Three-dimensional fluoroscopy was used when the treating surgeon deemed it necessary for preoperative planning. All imaging was performed with a Philips MultiDiagnost Eleva 3-D fluoroscopy imager with patients in the upright standing position. (Informed patient consent was obtained.) Software bundled with the imager was used to create representative radiographs of differing angulation.
The common practice at most institutions is to obtain 2 radiographic views as part of a standard clavicle series. The additional AP angulated radiograph typically is obtained with 20° to 45° cephalic tilt from the horizontal axis. Therefore, simulated radiographs ranging from 15° to 50° of angulation in 5° increments were created, and the amount of superior displacement of the medial fragment was measured. As the simulated views were constructed from a 3-D composite image, there was none of the magnification error that occurs with AP or posteroanterior (PA) views. The stated degree of angulation mimics a radiograph’s AP cephalic tilt or PA caudal tilt (Figures 1A, 1B). For all radiographic images, displacement between fracture fragments was determined by measuring the distance between the superior cortices at the fracture site of the medial and lateral fragments. Each simulated radiograph was measured by 2 readers using standard computerized radiographic measurement tools. Final displacement was taken as the mean of the 2 measurements.
After determining which radiographic angulation demonstrated the largest number of maximally displaced fractures, we compared the simulated radiographs at that angulation with the injury AP images for all patients. Total number of patients with a completely displaced midshaft clavicle fracture and no cortical contact was recorded for the 2 radiographic views.
The Orthopaedic Trauma Association classification system8 was used to classify the clavicle fractures. Statistical analysis was performed with the Fisher exact test and a regression model, using SPSS Version 19.0 (IBM SPSS Statistics).
Results
Ten patients met the study inclusion criteria. Mean age was 32.9 years (range, 18-65 years). Seven of the 10 patients were male. Six patients had right-side clavicle fractures. Of the 10 patients, 5 had the comminuted wedge fracture pattern (15-B2.3), 2 had the simple spiral pattern (15-B1.1), 2 had the spiral wedge pattern (15-B2.1), and 1 had the oblique pattern (15-B1.2).
Table 1 summarizes the fracture displacement measurements obtained with the different radiographic views. Of the 10 cases, 5 showed the most displacement with the 15° tilted view (P = .004), and the other 5 showed maximum displacement with different radiographic angulations. In addition, 6 patients showed the least displacement with the 50° angulated view (P < .001). Results of the regression analysis are summarized in Tables 2 and 3.
Initial horizontal AP imaging showed completely displaced midshaft clavicle fractures in 9 of the 10 patients, and 15° simulated radiographs showed completely displaced fractures in all 10 patients (P = .50).
Discussion
Our study results demonstrated that an upright 15° radiographic tilt (AP cephalad or PA caudal) identified the most fracture displacement in the most patients with acute midshaft clavicle fractures. To our knowledge, this is the first study to identify the radiographic angulation that best shows the most clavicle fracture fragment displacement.
Other investigators have studied the accuracy of different radiographic views in the assessment of midshaft clavicle fractures, but they concentrated on fracture shortening. Smekal and colleagues9 used computed tomography (CT) and 3 different radiographic views to evaluate malunited midshaft clavicle fractures. Comparing the horizontal clavicular length measurements obtained with radiographs and CT scans, they determined that PA thoracic radiographs were in highest agreement with the CT scans. The results, however, were not statistically significant. In their study, supine CT was successful because the fractures were healed, and the displacement and shortening amounts were not affected by patient position. Sharr and Mohammed10 studied the accuracy of different views in the assessment of clavicle length in an articulated cadaver specimen. They obtained multiple AP and PA radiographs of different horizontal (medial, lateral) and vertical (cephalad, caudal) angulations. Actual clavicle length was then directly measured and compared with the length measured on the different views. The authors concluded that a PA 15° caudal radiograph was most accurate in assessing clavicular length. Both Smekal and colleagues9 and Sharr and Mohammed10 recommended the PA radiograph because it decreases the degree of magnification on AP radiographs by minimizing the film-to-object distance.
Our findings are important because more accurate determination of fracture displacement in patients with midshaft clavicle fractures may change clinical management. Nowak and colleagues11 investigated various patient and clavicle fracture characteristics that were predictive of a higher rate of long-term sequelae. They found that complete fracture displacement was the strongest radiographic predictor of patients’ beliefs that they were fully recovered from injury at final follow-up. The authors concluded that fractures with no bony contact should receive more “active” management. Robinson and colleagues12 studied a cohort of patients with nonoperatively managed midshaft clavicle fractures and concluded that complete fracture displacement significantly increased risk for nonunion (this risk was 2.3 times higher in patients with displaced fractures than in patients with nondisplaced fractures). Last, McKee and colleagues13 found that shoulder strength and endurance were significantly decreased in nonoperatively treated displaced midshaft clavicle fractures than in the same patients’ uninjured shoulders.
Extending the results of these studies, recent prospective randomized control trials and a meta-analysis have compared the clinical outcomes of nonoperatively and operatively managed displaced midshaft clavicle fractures.14-18 With few exceptions, these studies found improved clinical results with operative fixation. In one such study, the Canadian Orthopaedic Trauma Society14 randomized patients with displaced midshaft clavicle fractures to either operative plate fixation or sling immobilization. The operative group was found to have improved Disability of the Arm, Shoulder, and Hand scores, improved Constant shoulder scores, increased patient satisfaction, faster mean time to bony fracture union, higher satisfaction with shoulder appearance, and lower rates of nonunion and malunion. Given the results of these studies, accurate identification of a displaced midshaft clavicle fracture with no cortical contact is fundamental in deciding whether to recommend operative fixation.
Retrospective review of our cohort’s initial radiographs revealed 1 case in which the patient’s completely displaced midshaft clavicle fracture would not have been diagnosed solely with an AP horizontal image. Cortical contact was seen on a standard AP clavicle radiograph (Figures 2A, 2B), and a 15° tilt radiograph created from 3-D fluoroscopy scan showed complete fracture fragment displacement (Figure 3). A change in fracture classification from partially displaced to fully displaced could alter the type of management used by a treating surgeon.
There were obvious weaknesses to this study. First, its sample size was small (10 patients). Nevertheless, we had sufficient numbers to find a statistically significant angulation. Second, a wider range of radiographic angles could have been studied. Our intent, however, was to investigate the accuracy of the 2 most common supplementary clavicle views (20° and 45° cephalic tilt). Therefore, we selected a range of simulated radiographs that began 5° outside these angulations. Third, we measured only the degree of fracture displacement; we were unable to accurately access fracture shortening, as the 3-D fluoroscopic images were limited to the injured clavicles. A potential solution to this problem is to widen the exposure field in order to include the entire chest and allow clavicular length comparison against the uninjured side. Doing this would have been possible, but at the expense of increasing the patient’s radiation exposure.
This innovative study used 3-D fluoroscopy to capture clavicle fracture images with patients in an upright position. Unlike standard CT, in which patients are supine, this 3-D imaging technology better emulates the patient positioning used for upright radiographs, thereby avoiding potential fracture fragment alignment changes caused by shifts in body position. In addition, 3-D fluoroscopy allows us to create multiple precise simulated radiographic angulations without the magnification error of AP radiographs and, to a lesser extent, PA radiographs. Having a standing PA 15° caudal tilt radiograph obviates the need for CT with 3-D reconstruction. More fine detail may be revealed by CT with 3-D reconstruction than by a standing PA 15° caudal tilt radiograph, but the patient faces less radiation risk and cost with the radiograph.
There is no consensus as to what constitutes the standard radiographic series for clavicle fractures. Radiographic technique can vary with respect to supplemental view angulation, supine or upright patient positioning, and AP or PA radiographic views. Although our study did not address the effect of supine versus upright patient positioning on acute midshaft clavicle fracture displacement, we think that, for all clinical and research purposes, upright 15° caudal PA radiographs should be obtained for patients with acute midshaft clavicle fractures.
Conclusion
Our retrospective study of 10 patients with acute midshaft clavicle fractures and preoperative upright 3-D fluoroscopy scans found that a 15° angulated radiograph most often demonstrated the most fracture fragment displacement. Given these findings, we recommend obtaining an additional PA 15° caudal radiograph in the upright position for patients with midshaft clavicle fractures to best assess the extent of fracture displacement. Accurately identifying the degree of fracture displacement is important, as operative management of completely displaced fractures has been shown to improve clinical outcomes.
1. Postacchini F, Gumina S, De Santis P, Albo F. Epidemiology of clavicle fractures. J Shoulder Elbow Surg. 2002;11(5):452-456.
2. Nordqvist A, Petersson C. The incidence of fractures of the clavicle. Clin Orthop Relat Res. 1994;(300):127-132.
3. Robinson CM. Fractures of the clavicle in the adult. Epidemiology and classification. J Bone Joint Surg Br. 1998;80(3):476-484.
4. Rowe CR. An atlas of anatomy and treatment of midclavicular fractures. Clin Orthop Relat Res. 1968;(58):29-42.
5. Jeray KJ. Acute midshaft clavicular fracture. J Am Acad Orthop Surg. 2007;15(4):239-248.
6. Khan LA, Bradnock TJ, Scott C, Robinson CM. Fractures of the clavicle. J Bone Joint Surg Am. 2009;91(2):447-460.
7. Quesada F. Technique for the roentgen diagnosis of fractures of the clavicle. Surg Gynecol Obstet. 1926;42:424-428.
8. Marsh JL, Slongo TF, Agel J, et al. Fracture and dislocation classification compendium—2007: Orthopaedic Trauma Association Classification, Database and Outcomes Committee. J Orthop Trauma. 2007;21(10 suppl):S1-S133.
9. Smekal V, Deml C, Irenberger A, et al. Length determination in midshaft clavicle fractures: validation of measurement. J Orthop Trauma. 2008;22(7):458-462.
10. Sharr JR, Mohammed KD. Optimizing the radiographic technique in clavicular fractures. J Shoulder Elbow Surg. 2003;12(2):170-172.
11. Nowak J, Holgersson M, Larsson S. Can we predict long-term sequelae after fractures of the clavicle based on initial findings? A prospective study with nine to ten years of follow-up. J Shoulder Elbow Surg. 2004;13(5):479-486.
12. Robinson CM, Court-Brown CM, McQueen MM, Wakefield AE. Estimating the risk of nonunion following nonoperative treatment of a clavicular fracture. J Bone Joint Surg Am. 2004;86(7):1359-1365.
13. McKee MD, Pedersen EM, Jones C, et al. Deficits following nonoperative treatment of displaced midshaft clavicular fractures. J Bone Joint Surg Am. 2006;88(1):35-40.
14. Canadian Orthopaedic Trauma Society. Nonoperative treatment compared with plate fixation of displaced midshaft clavicular fractures. A multicenter, randomized clinical trial. J Bone Joint Surg Am. 2007;89(1):1-10.
15. Judd DB, Pallis MP, Smith E, Bottoni CR. Acute operative stabilization versus nonoperative management of clavicle fractures. Am J Orthop. 2009;38(7):341-345.
16. Smekal V, Irenberger A, Struve P, Wambacher M, Krappinger D, Kralinger FS. Elastic stable intramedullary nailing versus nonoperative treatment of displaced midshaft clavicular fractures—a randomized, controlled, clinical trial. J Orthop Trauma. 2009;23(2):106-112.
17. Witzel K. Intramedullary osteosynthesis in fractures of the mid-third of the clavicle in sports traumatology [in German]. Z Orthop Unfall. 2007;145(5):639-642.
18. McKee RC, Whelan DB, Schemitsch EH, McKee MD. Operative versus nonoperative care of displaced midshaft clavicular fractures: a meta-analysis of randomized clinical trials. J Bone Joint Surg Am. 2012;94(8):675-684.
The Supination-Pronation Test for Distal Biceps Tendon Rupture
Distal biceps tendon ruptures have been reported with increasing frequency, occurring 1.2 times per 100,000 patients per year, representing 3% of tendinous avulsions involving this muscle.1,2 This injury occurs most commonly in men between the ages of 40 and 60 years, and more often in the dominant extremity after an unexpected or violent eccentric contraction.2,3 Generally, the patient is performing a task that is more strenuous than usual and only performed occasionally; usually, it is a flexion task. The biceps muscle is the most superficial muscle in the anterior compartment of the arm with the distal tendon passing deep in the antecubital fossa to insert at the radial tuberosity (Figure 1). Pronation of the forearm rotates the radial tuberosity medially and posteriorly, drawing the biceps tendon distally with it (Figures 1-3). The biceps muscle is primarily responsible for supination of the forearm, although it is also important in elbow flexion.4,5 The bicipital aponeurosis (lacertus fibrosus) arises from the medial aspect of the muscle belly at the junction of the musculotendinous unit and the distal biceps tendon. This passes distally and medially across the antecubital fossa, blending with the fascia overlying the proximal flexor mass of the forearm, and inserts on the subcutaneous border of the ulna.3 A complete rupture of the distal biceps insertion can produce a 40% loss of supination strength, a 47% loss of supination endurance, and a 21% to 30% loss of flexion strength at the elbow when compared with the contralateral intact extremity.1,2,4
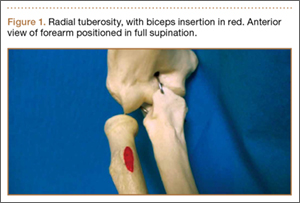
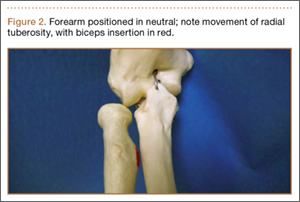
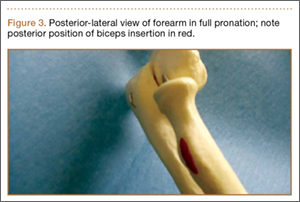
Background
Prompt diagnosis of a distal biceps tendon complete rupture increases the ability to perform a primary repair, and to restore motion and strength.3 Patients with acute ruptures of the distal biceps typically present with a history of experiencing a painful “pop” after a violent eccentric load force at the time of injury. Clinical examination of a patient with a distal biceps tendon rupture shows a loss of the normal upper arm contour, pain with flexion and supination of the forearm, ecchymosis, and an inability to palpate the distal biceps tendon in the antecubital fossa.5 It is important to note that a false-negative test can be elicited when examining the integrity of the muscle contour if the lacertus fibrosus remains intact when there is a complete rupture of the distal biceps tendon.6 This false negative also can occur with examination of the upper arm contour as the elbow flexes. Radiographic studies to evaluate the distal biceps tendon can aid in the diagnosis of ruptures but are not a substitute for a thorough history taking and physical examination.3 Plain radiographs may show hypertrophic bone formation at the radial tuberosity, although they are generally unrevealing.3,6 After a complete clinical examination of the distal biceps tendon, magnetic resonance imaging (MRI) can be an important tool for evaluation of the distal biceps tendon.3 This article introduces a special test used as a diagnostic tool during the physical examination to isolate the distal biceps tendon from the lacertus fibrosus and to evaluate the integrity of the distal biceps brachii tendon.
Test Description
To perform the supination-pronation test, the patient is positioned with both shoulders abducted to 90º and the elbows flexed to approximately 60º to 70º (Figures 4, 5). The examiner stands in front of the patient and observes the contour of the biceps muscle; the unaffected arm is used as a comparison. The examiner may either visually observe the contour of the muscle or may place a hand on the muscle belly throughout the test to feel for movement. The patient is asked to actively supinate and pronate the forearms by turning the hands. Through trial and error, we have found that the change in contour is most pronounced when placing the elbow in 60º to 70º of flexion. Additionally, through clinical experience, we have found testing the patient with both shoulders abducted to 90º provides the examiner with a reproducible examination that is easy to demonstrate to the patient; however, this shoulder position is not mandatory and can be modified if the patient struggles to get into testing position. Forearm position will maximize the size of the biceps, so the result is visually easier to appreciate. If the distal biceps tendon is intact, there is a substantial change in the shape of the biceps as the arm is supinated (the biceps moves proximally), then pronated (the biceps moves distally). Lack of migration of the biceps muscle during supination and pronation is considered a positive test, indicating rupture of the distal biceps tendon from its insertion on the radial tuberosity (Figure 6). We have found the anatomic correlations to a distal biceps injury may be clearly observed through the maneuver of the supination-pronation test and, therefore, provide a reliable clinical method to diagnose a complete distal biceps tendon rupture.
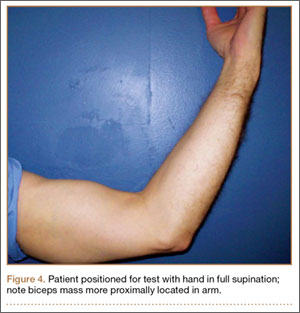
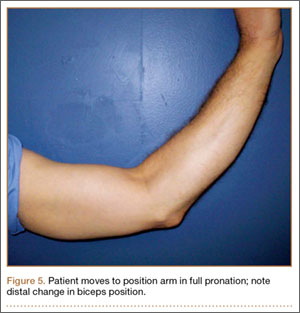
We have been using the supination-pronation test in our clinical practice for 2.5 years. In our experience, opportunities to use the supination-pronation test are very limited and specific. This type of tendon avulsion is rare, and the number of patients who warrant clinical examination using the supination-pronation test is small. We have had 5 positive supination-pronation tests in patients with suspected distal biceps tendon ruptures. To confirm if the supination-pronation test correctly demonstrated a full biceps tendon rupture in these 5 patients, we followed their clinical examination with MRI of the involved arm. Only 4 of the 5 patients were able to obtain MRI. Of these 4, all studies showed complete tearing of the distal biceps tendon from its attachment on the radial tuberosity. All 5 patients were taken into the operating room to confirm the clinical diagnosis and then repair it surgically. Through surgical exploration, we observed a full and complete tear of the distal biceps tendon in all patients, and the tears were repaired successfully. Postoperatively, all patients showed a full recovery with no complications, and all were able to regain full range of motion and strength in the involved arm. All 5 patients were discharged with no complaints.
Although we have not encountered false positive and false negatives using the supination-pronation test in clinical practice, we speculate that there would be a low rate of incidence for these outcomes. There is a possibility of a false-positive test in obese patients in whom the contours of the biceps are difficult to appreciate (although we have not observed this clinically). In these patients, the examiner may not see the migration of the biceps that is occurring. In practice, we have found that, if the contours of the bicep are difficult to appreciate, the test can be performed with the examiner placing his/her hand on the muscle belly during the test to actively feel for movement. This could decrease the risk of a false-positive supination-pronation test. A false negative may occur if the distal biceps tendon is almost completely torn. In this case, enough of the tendon fibers may remain intact to pull the biceps muscle belly distally as the hand is pronated. In our experience, this was not observed but should be noted as a potential risk for a false-negative test.
If the lacertus fibrosus is intact, and the distal biceps tendon is ruptured, the biceps will still change shape as the elbow is flexed and extended but will not change shape with supination and pronation. The biceps brachii muscle attaches distally to the radial tuberosity of the radius; contraction of the muscle pulls the tuberosity anteriorly, rotating the forearm into supination. When the forearm rotates into pronation, the tendon is pulled distally and the muscle lengthens, which causes the contour to be more elongated. Since the lacertus fibrosus attaches to the proximal ulna, it is not involved in forearm supination and pronation. It does, however, assist with elbow flexion.
It is very important to isolate the biceps brachii tendon from the lacertus fibrosus and the brachialis because the examiner may miss a distal tendon rupture by not isolating supination and pronation. The supination-pronation test is a novel clinical test that allows the examiner to isolate the biceps brachii tendon in supination and pronation to evaluate for distal biceps tendon rupture. It has been well established that early anatomic repair of distal biceps tendon rupture is advocated for optimal results in returning flexion and supination strength.3,4,6 Although some patients may choose nonoperative management of complete ruptures, prompt diagnosis of the injury is vital so that the option of surgical management at the time of presentation is not compromised by delay in diagnosis. Clinically, we have found that a delayed diagnosis results in more difficulty performing the surgery, and it may not be possible to obtain enough excursion for the biceps to be reattached with the passage of time. The literature suggests that patients with chronic ruptures (more than 4 weeks) often present with proximal retraction of the biceps muscles and scarring to the brachialis, which can make anatomic repair a difficult challenge.3,7
It is important to note the differences in treatment of proximal versus distal bicep tendon ruptures. Proximally, there are 2 tendon attachments. The tendon of the short head attaches to the coracoid process of the scapula. The tendon of the long head runs into the shoulder joint, attaching intra-articularly to the superior aspect of the glenoid. This tendon is often involved in degeneration concurrently with the adjacent rotator cuff and is vulnerable to rupture. Rupture of this tendon is usually treated nonoperatively. Because proximal rupture nearly always affects only the tendon to the long head, the muscle preserves 1 proximal attachment and continues to function, both as a supinator and as a flexor. Also, this type of rupture tends to occur in more elderly and less active patients who are less adversely affected by the modest loss of function associated with proximal ruptures.
Conclusion
The supination-pronation test properly isolates the distal biceps tendon and does not cause significant discomfort, which can be a problem with other physical examination tests for acute distal biceps ruptures. The squeeze test involves placing the patient in 60º to 80º of elbow flexion with the forearm pronated. The examiner places 1 hand at the distal myotendinous junction, and the other around the belly of the muscle and squeezes, looking for forearm supination.5 We have not found the squeeze test to be optimal because the amount of forearm supination obtained by performing this test can be subtle. Additionally, the patient commonly has significant ecchymosis and pain associated with this rupture, and it may be too painful to squeeze the muscle belly hard enough to have a reliable test. Another test is the hook test, which is performed by the examiner “hooking” an index finger under the intact biceps tendon from the lateral side.8 Clinically, we have found this test difficult to administer because it requires palpation of the tendon, which is often painful for the patient with an acute injury.
The supination-pronation test can easily be performed in the acute setting, and confirms attachment of the biceps tendon distally to the bicipital tuberosity of the radius. It will not show an incomplete tear, but in that case, the muscle retains its normal length, alleviating the urgency of surgical management. We have found the supination-pronation test to be a reliable and pain-free test that should be incorporated in the physical examination to evaluate patients for distal biceps injury.
1. Safran MR, Graham SM. Distal biceps tendon ruptures: incidence, demographics, and the effect of smoking. Clin Orthop Relat Res. 2002;(404):275-283.
2. McCarty III LP, Alpert JM, Bush-Joseph C. Reconstruction of a chronic distal biceps tendon rupture 4 years after initial injury. Am J Orthop. 2008;37(11):579-582.
3. Ramsey ML. Distal biceps tendon injuries: diagnosis and management. J Am Acad Orthop Surg. 1999;7(3):199-207.
4. Morrey BF, Askew L, An K, Dobyns J. Rupture of the distal tendon of the biceps brachii. A biomechanical study. J Bone Joint Surg Am. 1985;67(3):418-421.
5. Ruland RT, Dunbar RP, Bowen JD. The biceps squeeze test for diagnosis of distal biceps tendon ruptures. Clin Orthop Rel Res. 2005;(437):128-131.
6. Sutton KM, Dodds SD, Ahmad CS, Sethi PM. Surgical treatment of distal biceps rupture. J Am Acad Orthop Surg. 2010;18(3):139-148.
7. Leighton MM, Bush-Joseph CA, Bach BR Jr. Distal biceps brachii repair: results in dominant and nondominant extremities. Clin Orthop Relat Res. 1995;(317):114-121.
8. O’Driscoll SW, Goncalves LB, Dietz P. The hook test for distal biceps tendon avulsion. Am J Sports Med. 2007;35(11):1865-1869.
Distal biceps tendon ruptures have been reported with increasing frequency, occurring 1.2 times per 100,000 patients per year, representing 3% of tendinous avulsions involving this muscle.1,2 This injury occurs most commonly in men between the ages of 40 and 60 years, and more often in the dominant extremity after an unexpected or violent eccentric contraction.2,3 Generally, the patient is performing a task that is more strenuous than usual and only performed occasionally; usually, it is a flexion task. The biceps muscle is the most superficial muscle in the anterior compartment of the arm with the distal tendon passing deep in the antecubital fossa to insert at the radial tuberosity (Figure 1). Pronation of the forearm rotates the radial tuberosity medially and posteriorly, drawing the biceps tendon distally with it (Figures 1-3). The biceps muscle is primarily responsible for supination of the forearm, although it is also important in elbow flexion.4,5 The bicipital aponeurosis (lacertus fibrosus) arises from the medial aspect of the muscle belly at the junction of the musculotendinous unit and the distal biceps tendon. This passes distally and medially across the antecubital fossa, blending with the fascia overlying the proximal flexor mass of the forearm, and inserts on the subcutaneous border of the ulna.3 A complete rupture of the distal biceps insertion can produce a 40% loss of supination strength, a 47% loss of supination endurance, and a 21% to 30% loss of flexion strength at the elbow when compared with the contralateral intact extremity.1,2,4
Background
Prompt diagnosis of a distal biceps tendon complete rupture increases the ability to perform a primary repair, and to restore motion and strength.3 Patients with acute ruptures of the distal biceps typically present with a history of experiencing a painful “pop” after a violent eccentric load force at the time of injury. Clinical examination of a patient with a distal biceps tendon rupture shows a loss of the normal upper arm contour, pain with flexion and supination of the forearm, ecchymosis, and an inability to palpate the distal biceps tendon in the antecubital fossa.5 It is important to note that a false-negative test can be elicited when examining the integrity of the muscle contour if the lacertus fibrosus remains intact when there is a complete rupture of the distal biceps tendon.6 This false negative also can occur with examination of the upper arm contour as the elbow flexes. Radiographic studies to evaluate the distal biceps tendon can aid in the diagnosis of ruptures but are not a substitute for a thorough history taking and physical examination.3 Plain radiographs may show hypertrophic bone formation at the radial tuberosity, although they are generally unrevealing.3,6 After a complete clinical examination of the distal biceps tendon, magnetic resonance imaging (MRI) can be an important tool for evaluation of the distal biceps tendon.3 This article introduces a special test used as a diagnostic tool during the physical examination to isolate the distal biceps tendon from the lacertus fibrosus and to evaluate the integrity of the distal biceps brachii tendon.
Test Description
To perform the supination-pronation test, the patient is positioned with both shoulders abducted to 90º and the elbows flexed to approximately 60º to 70º (Figures 4, 5). The examiner stands in front of the patient and observes the contour of the biceps muscle; the unaffected arm is used as a comparison. The examiner may either visually observe the contour of the muscle or may place a hand on the muscle belly throughout the test to feel for movement. The patient is asked to actively supinate and pronate the forearms by turning the hands. Through trial and error, we have found that the change in contour is most pronounced when placing the elbow in 60º to 70º of flexion. Additionally, through clinical experience, we have found testing the patient with both shoulders abducted to 90º provides the examiner with a reproducible examination that is easy to demonstrate to the patient; however, this shoulder position is not mandatory and can be modified if the patient struggles to get into testing position. Forearm position will maximize the size of the biceps, so the result is visually easier to appreciate. If the distal biceps tendon is intact, there is a substantial change in the shape of the biceps as the arm is supinated (the biceps moves proximally), then pronated (the biceps moves distally). Lack of migration of the biceps muscle during supination and pronation is considered a positive test, indicating rupture of the distal biceps tendon from its insertion on the radial tuberosity (Figure 6). We have found the anatomic correlations to a distal biceps injury may be clearly observed through the maneuver of the supination-pronation test and, therefore, provide a reliable clinical method to diagnose a complete distal biceps tendon rupture.
We have been using the supination-pronation test in our clinical practice for 2.5 years. In our experience, opportunities to use the supination-pronation test are very limited and specific. This type of tendon avulsion is rare, and the number of patients who warrant clinical examination using the supination-pronation test is small. We have had 5 positive supination-pronation tests in patients with suspected distal biceps tendon ruptures. To confirm if the supination-pronation test correctly demonstrated a full biceps tendon rupture in these 5 patients, we followed their clinical examination with MRI of the involved arm. Only 4 of the 5 patients were able to obtain MRI. Of these 4, all studies showed complete tearing of the distal biceps tendon from its attachment on the radial tuberosity. All 5 patients were taken into the operating room to confirm the clinical diagnosis and then repair it surgically. Through surgical exploration, we observed a full and complete tear of the distal biceps tendon in all patients, and the tears were repaired successfully. Postoperatively, all patients showed a full recovery with no complications, and all were able to regain full range of motion and strength in the involved arm. All 5 patients were discharged with no complaints.
Although we have not encountered false positive and false negatives using the supination-pronation test in clinical practice, we speculate that there would be a low rate of incidence for these outcomes. There is a possibility of a false-positive test in obese patients in whom the contours of the biceps are difficult to appreciate (although we have not observed this clinically). In these patients, the examiner may not see the migration of the biceps that is occurring. In practice, we have found that, if the contours of the bicep are difficult to appreciate, the test can be performed with the examiner placing his/her hand on the muscle belly during the test to actively feel for movement. This could decrease the risk of a false-positive supination-pronation test. A false negative may occur if the distal biceps tendon is almost completely torn. In this case, enough of the tendon fibers may remain intact to pull the biceps muscle belly distally as the hand is pronated. In our experience, this was not observed but should be noted as a potential risk for a false-negative test.
If the lacertus fibrosus is intact, and the distal biceps tendon is ruptured, the biceps will still change shape as the elbow is flexed and extended but will not change shape with supination and pronation. The biceps brachii muscle attaches distally to the radial tuberosity of the radius; contraction of the muscle pulls the tuberosity anteriorly, rotating the forearm into supination. When the forearm rotates into pronation, the tendon is pulled distally and the muscle lengthens, which causes the contour to be more elongated. Since the lacertus fibrosus attaches to the proximal ulna, it is not involved in forearm supination and pronation. It does, however, assist with elbow flexion.
It is very important to isolate the biceps brachii tendon from the lacertus fibrosus and the brachialis because the examiner may miss a distal tendon rupture by not isolating supination and pronation. The supination-pronation test is a novel clinical test that allows the examiner to isolate the biceps brachii tendon in supination and pronation to evaluate for distal biceps tendon rupture. It has been well established that early anatomic repair of distal biceps tendon rupture is advocated for optimal results in returning flexion and supination strength.3,4,6 Although some patients may choose nonoperative management of complete ruptures, prompt diagnosis of the injury is vital so that the option of surgical management at the time of presentation is not compromised by delay in diagnosis. Clinically, we have found that a delayed diagnosis results in more difficulty performing the surgery, and it may not be possible to obtain enough excursion for the biceps to be reattached with the passage of time. The literature suggests that patients with chronic ruptures (more than 4 weeks) often present with proximal retraction of the biceps muscles and scarring to the brachialis, which can make anatomic repair a difficult challenge.3,7
It is important to note the differences in treatment of proximal versus distal bicep tendon ruptures. Proximally, there are 2 tendon attachments. The tendon of the short head attaches to the coracoid process of the scapula. The tendon of the long head runs into the shoulder joint, attaching intra-articularly to the superior aspect of the glenoid. This tendon is often involved in degeneration concurrently with the adjacent rotator cuff and is vulnerable to rupture. Rupture of this tendon is usually treated nonoperatively. Because proximal rupture nearly always affects only the tendon to the long head, the muscle preserves 1 proximal attachment and continues to function, both as a supinator and as a flexor. Also, this type of rupture tends to occur in more elderly and less active patients who are less adversely affected by the modest loss of function associated with proximal ruptures.
Conclusion
The supination-pronation test properly isolates the distal biceps tendon and does not cause significant discomfort, which can be a problem with other physical examination tests for acute distal biceps ruptures. The squeeze test involves placing the patient in 60º to 80º of elbow flexion with the forearm pronated. The examiner places 1 hand at the distal myotendinous junction, and the other around the belly of the muscle and squeezes, looking for forearm supination.5 We have not found the squeeze test to be optimal because the amount of forearm supination obtained by performing this test can be subtle. Additionally, the patient commonly has significant ecchymosis and pain associated with this rupture, and it may be too painful to squeeze the muscle belly hard enough to have a reliable test. Another test is the hook test, which is performed by the examiner “hooking” an index finger under the intact biceps tendon from the lateral side.8 Clinically, we have found this test difficult to administer because it requires palpation of the tendon, which is often painful for the patient with an acute injury.
The supination-pronation test can easily be performed in the acute setting, and confirms attachment of the biceps tendon distally to the bicipital tuberosity of the radius. It will not show an incomplete tear, but in that case, the muscle retains its normal length, alleviating the urgency of surgical management. We have found the supination-pronation test to be a reliable and pain-free test that should be incorporated in the physical examination to evaluate patients for distal biceps injury.
1. Safran MR, Graham SM. Distal biceps tendon ruptures: incidence, demographics, and the effect of smoking. Clin Orthop Relat Res. 2002;(404):275-283.
2. McCarty III LP, Alpert JM, Bush-Joseph C. Reconstruction of a chronic distal biceps tendon rupture 4 years after initial injury. Am J Orthop. 2008;37(11):579-582.
3. Ramsey ML. Distal biceps tendon injuries: diagnosis and management. J Am Acad Orthop Surg. 1999;7(3):199-207.
4. Morrey BF, Askew L, An K, Dobyns J. Rupture of the distal tendon of the biceps brachii. A biomechanical study. J Bone Joint Surg Am. 1985;67(3):418-421.
5. Ruland RT, Dunbar RP, Bowen JD. The biceps squeeze test for diagnosis of distal biceps tendon ruptures. Clin Orthop Rel Res. 2005;(437):128-131.
6. Sutton KM, Dodds SD, Ahmad CS, Sethi PM. Surgical treatment of distal biceps rupture. J Am Acad Orthop Surg. 2010;18(3):139-148.
7. Leighton MM, Bush-Joseph CA, Bach BR Jr. Distal biceps brachii repair: results in dominant and nondominant extremities. Clin Orthop Relat Res. 1995;(317):114-121.
8. O’Driscoll SW, Goncalves LB, Dietz P. The hook test for distal biceps tendon avulsion. Am J Sports Med. 2007;35(11):1865-1869.
HCAHPS Surveys and Patient Satisfaction
The Hospital Consumer Assessment of Healthcare Providers and Systems (HCAHPS) is the first national, standardized, publicly reported survey of patients' perception of hospital care. HCAHPS mandates a standard method of collecting and reporting perception of health care by patients to enable valid comparisons across all hospitals.[1, 2, 3] Voluntary collection of HCAHPS data for public reporting began in July 2006, mandatory collection of data for hospitals that participate in Inpatient Prospective Payment Program of Medicare began in July 2007, and public reporting of mandated HCAHPS scores began in 2008.[2]
Using data from the first 2‐year period, an earlier study had reported an increase in HCAHPS patient satisfaction scores in all domains except in the domain of satisfaction with physician communication.[4] Since then, data from additional years have become available, allowing assessment of satisfaction of hospitalized patients with physician communication over a longer period. Therefore, our objective was to examine changes in patient satisfaction with physician communication from 2007 to 2013, the last reported date, and to explore hospital and local population characteristics that may be associated with patient satisfaction.
METHODS
Publicly available data from 3 sources were used for this study. Patient satisfaction scores with physician communication and hospital characteristics were obtained from the HCAHPS data files available at the Hospital Compare database maintained by the Centers for Medicare and Medicaid Services (CMS).[5] HCAHPS files contain data for the preceding 12 months and are updated quarterly. We used files that reported data from the first to the fourth quarter of the year for 2007 to 2013. The HCAHPS survey contains 32 questions, of which 3 questions are about physician communication.[6] We used the percentage of survey participants who responded that physicians always communicated well as a measure of patient satisfaction with physician communication (the other 2 questions were not included). Hospitals that reported data on patient satisfaction during 2007 were divided into quartiles based on their satisfaction scores, and this quartile allocation was maintained during each subsequent year. Survey response rate, in percentage, was obtained from HCAHPS data files for each year. Hospital characteristics, such as ownership of the hospital, teaching hospital status, and designation of critical access hospital were obtained from the Hospital Compare website. Hospital ownership was defined as government (owned by federal, state, Veterans Affairs, or tribal authorities), for profit (owned by physicians or another proprietary), or nonprofit (owned by a nonprofit organization such as a church). A hospital was considered a teaching hospital if it obtained graduate medical education funding from CMS.
We obtained local population data from 2010 decennial census files and from the American Community Survey 5‐year data profile from 2009 to 2013; both datasets are maintained by the Unites States Census Bureau.[7] Census is mandated by Article I, Section 2 of the United States Constitution and takes place every 10 years. The American Community Survey is also a mandatory, ongoing statistical survey that samples a small percentage of the population every year giving communities the information they need to plan investments and services. We chose to use 5‐year estimates as these are more precise and are reliable in analyzing small populations. For each zip code, we extracted data on total population, percentage of African Americans in the population, median income, poverty level, and insurance status from the Census Bureau data files.
Local population characteristics at zip code level were mapped to hospitals using hospital service area (HSA) crosswalk files from the Dartmouth Atlas of Health Care.[7, 8] The Dartmouth Atlas defined 3436 HSAs by assigning zip codes to the hospital area where the greatest proportion of its Medicare residents were hospitalized. The number of acute care hospital beds and the number of physicians within the HSA were also obtained from the Dartmouth Atlas. Merging data from these 3 sources generated a dataset that contained information about patient satisfaction scores from a particular hospital, hospital characteristics, and population characteristics of the healthcare market.
Data were summarized as mean and standard deviation (SD). To model the dependence of observations from the same hospital and the correlation between hospitals within the same state due to similar regulations, and to assess the relative contribution of satisfaction scores over time within hospital, hospitals within states, and across states, 3‐level hierarchical regression models were examined.[9, 10] At the within‐hospital level, survey response rate was used as a time‐varying variable in addition to the year of observation. However, only year of observation was used to explore differences in patient satisfaction trajectories between hospitals. At the hospitals‐within‐states level, hospital characteristics and local population characteristics within the HSA were included. At the states level, only random effects were obtained, and no additional variables were included in the models.
Four models were built to assess the relationship between satisfaction scores and predictors. The basic model used only random effects without any predictors to determine the relative contribution of each level (within hospitals, hospitals within states, and across states) to variation in patient satisfaction scores and thus was consistent with the variance component analysis. The first model included the year of observation as a predictor at the within‐hospital level to examine trends in patient satisfaction scores during the observation period. For the second model, we added baseline satisfaction quartiles to the second model, whereas remaining predictors (HSA population, African American percentage in HSA, survey response rate, HSA median income, ownership of hospital, percentage with private any insurance in HSA, acute care hospital beds in HSA, teaching hospital status, and percentage of people living in poverty within HSA) were added in the third model. Quartiles for baseline satisfaction were generated using satisfaction scores from 2007. As a larger number of hospitals reported results for 2008 than for 2007 (2273 vs 3746), we conducted a sensitivity analysis using satisfaction quartiles in 2008 as baseline and examined subsequent trends over time for the 4 models noted above. All multilevel models were specified using the nlme package in R to account for clustering of observations within hospitals and hospitals within states, using hospital and state level random effects.[11]
RESULTS
Of the 4353 hospitals with data for the 7‐year period, the majority were in the Southern region (South = 1669, Midwest = 1239, Northeast = 607, West = 838). Texas had the largest number of hospital (N = 358) followed by California (N = 340). The largest number of hospitals were nonprofit (N = 2637, 60.6%). Mean (SD) patient satisfaction with physician communication was 78.9% (5.7%) in 2007 that increased to 81.7% (5.4%) in 2013. Throughout the observation period, the highest patient satisfaction was in the South (80.6% [6.6%] in 2007 and 83.2% [5.4%] in 2013). Of the 2273 hospitals that reported data in 2007, the mean satisfaction score of the lowest quartile was 72% (3.2%), and the highest quartile was 86.9% (3.2%) (Table 1). As a group, hospitals in the highest quartile in 2007 still had higher satisfaction scores in 2013 than the hospitals in the lowest quartile (85% [4.2%] vs 77% [3.6%], respectively). Only 4 of the 584 hospitals in the lowest quartile in 2007 climbed up to the highest quartile in 2013, whereas 22 hospitals that were in the upper quartile in 2007 dropped to the lowest quartile in 2013.
| Characteristic | Quartiles Based on 2007 Satisfaction Scores | |||
|---|---|---|---|---|
| Highest Quartile | 2nd Quartile | 3rd Quartile | Lowest Quartile | |
| ||||
| Total no. of hospitals, N (%) | 461 (20.3) | 545 (24.0) | 683 (30.0) | 584 (25.7) |
| Hospital ownership, N (%) | ||||
| For profit | 50 (14.4) | 60 (17.3) | 96 (27.7) | 140 (40.5) |
| Nonprofit | 269 (17.4) | 380 (24.6) | 515 (33.4) | 378 (24.5) |
| Government | 142 (36.9) | 105 (27.3) | 72 (18.7) | 66 (17.1) |
| HSA population, in 1,000, median (IQR) | 33.2 (70.5) | 88.5 (186) | 161.8 (374) | 222.2 (534) |
| Racial distribution of HSA population, median (IQR) | ||||
| White, % | 82.6 (26.2) | 82.5 (28.5) | 74.2 (32.9) | 66.8 (35.3) |
| Black, % | 4.3 (21.7) | 3.7 (16.3) | 5.9 (14.8) | 7.4 (12.1) |
| Other, % | 6.4 (7.1) | 8.8 (10.8) | 12.9 (19.8) | 20.0 (33.1) |
| HSA mean median income in $1,000, mean (SD) | 44.6 (11.7) | 52.4 (17.8) | 58.4 (17.1) | 57.5 (15.7) |
| Satisfaction scores (at baseline), mean (SD) | 86.9 (3.1) | 81.4 (1.1) | 77.5 (1.1) | 72.0 (3.2) |
| Satisfaction scores (in 2013), mean (SD) | 85.0 (4.3) | 82.0 (3.4) | 79.7 (3.0) | 77.0 (3.5) |
| Survey response rate (at baseline), mean (SD) | 43.2 (19.8) | 34.5 (9.4) | 32.6 (8.0) | 30.3 (7.8) |
| Survey response rate (20072013), mean (SD) | 32.8 (7.8) | 32.6 (7.5) | 30.8 (6.5) | 29.3 (6.5) |
| Percentage with any insurance in HSA, mean (SD) | 84.0 (5.4) | 84.8 (6.6) | 85.5 (6.3) | 83.9 (6.6) |
| Teaching hospital, N (%) | 42 (9.1) | 155 (28.4) | 277 (40.5) | 274 (46.9%) |
| Acute care hospital beds in HSA (per 1,000), mean (SD) | 3.2 (1.2) | 2.6 (0.8) | 2.5 (0.8) | 2.4 (0.7) |
| Number of physicians in HSA (per 100,000), mean (SD) | 190 (36) | 197 (43) | 204 (47) | 199 (45) |
| Percentage with poverty in HSA, mean (SD)[7] | 16.9 (6.6) | 15.5 (6.5) | 14.4 (5.7) | 15.5 (6.0) |
Using variance component analysis, we found that 23% of the variation in patient satisfaction scores with physician communication was due to differences between states, 52% was due to differences between hospitals within states, and 24% was due to changes over time within a hospital. When examining time trends of satisfaction during the 7‐year period without adjusting for other predictors, we found a statistically significant increasing trend in patient satisfaction with physician communication (0.33% per year; P < 0.001). We also found a significant negative correlation (0.62, P < 0.001) between the random effects for baseline satisfaction (intercept) and change over time (slope), suggesting that initial patient satisfaction with physicians at a hospital was negatively correlated with subsequent change in satisfaction scores during the observation period.
When examining the effect of satisfaction ranking in 2007, hospitals within the lowest quartile of patient satisfaction in 2007 had significantly larger increase in satisfaction scores during the subsequent period as compared to the hospitals in each of the other 3 quartiles (all P < 0.001, Table 2). The difference in the magnitude of the rate of increase in satisfaction scores was greatest between the lowest quartile and the highest quartile (1.10% per year; P < 0.001). In fact, the highest quartile had a statistically significant absolute decrease in patient satisfaction during the observation period (0.23% per year; P < 0.001, Figure 1).
| Variable | Model 1: ; P Value | Model 2: ; P Value | Model 3: ; P Value |
|---|---|---|---|
| |||
| Time (in years) | 0.33; <0.001 | 0.87; <0.001 | 0.89; <0.001 |
| Satisfaction quartiles at baseline | |||
| Highest quartile | 12.1; <0.001 | 10.4; <0.001 | |
| 2nd quartile | 7.9; <0.001 | 7.1; <0.001 | |
| 3rd quartile | 4.5; <0.001 | 4.1; <0.001 | |
| Lowest quartile (REF) | REF | REF | |
| Interaction with time | |||
| Highest quartile | 1.10; <0.001 | 0.94; <0.001 | |
| 2nd quartile | 0.73; <0.001 | 0.71; <0.001 | |
| 3rd quartile | 0.48; <0.001 | 0.47;<0.001 | |
| Survey response rate (%) | 0.12; <0.001 | ||
| Total population, in 10,000 | 0.002; 0.02 | ||
| African American (%) | 0.004; 0.13 | ||
| HSA median Income in $10,000 | 0.02; 0.58 | ||
| Ownership | |||
| Government (REF) | REF | ||
| Nonprofit | 0.01; 0.88 | ||
| For profit | 0.21; 0.11 | ||
| Percentage with insurance in HSA | 0.007; 0.27 | ||
| Acute care beds in HSA (per 1,000) | 0.60; <0.001 | ||
| Physicians in HSA (per 100,000) | 0.003; 0.007 | ||
| Teaching hospital | 0.34; 0.001 | ||
| Percentage in poverty in HSA | 0.01; 0.27 | ||
After adjusting for hospital characteristics and population characteristics of the HSA, the 2007 satisfaction quartiles remained significantly associated with subsequent change in satisfaction scores during the 7‐year observation period (Table 2). In addition, survey response rate, number of physicians, and the number of acute‐care hospital beds within the HSA were positively associated with patient satisfaction, whereas higher HSA population density and being a teaching hospital were negatively associated with patient satisfaction. Using 2008 satisfaction scores as baseline, the results did not change except that the number of physicians in the HSA and being a teaching hospital were no longer associated with satisfaction scores with physicians.
DISCUSSION
Using hierarchical modelling, we have shown that national patient satisfaction scores with physicians have consistently improved since 2007, the year when reporting of satisfaction scores began. We further show that the improvement in satisfaction scores has not been consistent through all hospitals. The largest increase in satisfaction scores was in hospitals that were in the lowest quartile of satisfaction scores in 2007. In contrast, satisfaction scores decreased in hospitals that were in the uppermost quartile of satisfaction scores. The difference between the lowest and uppermost quartile was so large in 2007 that despite the difference in the direction of change in satisfaction scores, hospitals in the uppermost quartile continued to have higher satisfaction scores in 2013 than hospitals in the lowest quartile.
Consistent with our findings for patient satisfaction, other studies have found that public reporting is associated with improvement in healthcare quality measures across nursing homes, physician groups, and hospitals.[12, 13, 14] However, it is unclear how public reporting can change patient satisfaction. The main purpose of public reporting of quality of healthcare measures, such as patient satisfaction with the healthcare they receive, is to generate value by increasing transparency and accountability, thereby increasing the quality of healthcare delivery. Healthcare consumers may also utilize the reported measures to choose providers that deliver high‐quality healthcare. Contrary to expectations, there is very little evidence that consumers choose healthcare facilities based on public reporting, and it is likely that other mechanisms may explain the observed association.[15, 16]
Physicians have historically had low adoption of strategies to improve patient satisfaction and often cite suboptimal data and lack of evidence for data‐driven strategies.[17, 18] Hospitals and healthcare organizations have deployed a broad range of strategies to engage physicians. These include emphasizing relationship between patient satisfaction and patient compliance, complaints and malpractice lawsuits, appealing to physicians' sense of competitiveness by publishing individual provider satisfaction scores, educating physicians on HCAHPS and providing them with regularly updated data, and development of specific techniques for improving patient‐physician interaction.[19, 20, 21, 22, 23, 24] Administrators may also enhance physician engagement by improving physician satisfaction, decreasing their turnover, support development of physicians in administrative leadership roles, and improving financial transparency.[25] Thus, involvement of hospital leadership has been instrumental in encouraging physicians to focus on quality measures including patient satisfaction. Some evidence suggests that public reporting exerts strong influence on hospital leaders for adequate resource allocation, local planning, and improvement efforts.[26, 27, 28]
Perhaps the most intriguing finding in our study is that hospitals in the uppermost quartile of satisfaction scores in 2007 had a statistically significant steady decline in scores during the following period as compared to hospitals in the lowest quartile that had a steady increase. A possible explanation for this finding can be that high‐performing hospitals become complacent and do not invest in developing the effort‐intensive resources required to maintain and improve performance in the physician‐related patient satisfaction domain. These resources may be diverted to competing needs that include addressing improvement efforts for a large number of other publicly reported healthcare quality measures. Thus, an unintended consequence of quality improvement may be that improvement in 1 domain may be at the expense of quality of care in another domain.[29, 30, 31] On the other hand, it is likely that hospitals in the lower quartile see a larger improvement in their scores for the same degree of investment as hospitals in the higher quartiles. It is also likely that hospitals, particularly those in the lowest quartile, develop their individual benchmarks and expend effort that is in line with their perceived need for improvement to achieve their strategic and marketing goals.
Our study has significant implications for the healthcare system, clinical practice, and future research. Whereas public reporting of quality measures is associated with an overall improvement in the reported quality measure, hospitals with high scores may move resources away from that metric or become complacent. Health policy makers need to design policies that encourage all hospitals and providers to perform better or continue to perform well. We further show that differences between hospitals and between local healthcare markets are the biggest factor determining the variation in patient satisfaction with physician communication, and an adjustment in reported score for these factors may be needed. Although local healthcare market factors may not be modifiable, an exchange of knowledge between hospitals with low and high patient satisfaction scores may improve overall satisfaction scores. Similarly, hospitals that are successful in increasing patient satisfaction scores should identify and share useful interventions.
The main strength of our study is that we used data on patient satisfaction with physician communication that were reported annually by most hospitals within the United States. These longitudinal data allowed us to examine not only the effect of public reporting on patient satisfaction with physician communication but also its trend over time. As we had 7 years of data, we were able to eliminate the possibility of regression to mean; an extreme result on first measurement is followed by a second measurement that tends to be closer to the average. Further, we adjusted satisfaction scores based on hospital and local healthcare market characteristics allowing us to compare satisfaction scores across hospitals. However, because units of observation were hospitals and not patients, we could not examine the effect of patient characteristics on satisfaction scores. In addition, HCAHPS surveys have low response rates and may have response and selection bias. Furthermore, we were unable to examine the strategies implemented by hospitals to improve satisfaction scores or the effect of such strategies on satisfaction scores. Data on hospital strategies to increase satisfaction scores are not available for most hospitals and could not have been included in the study.
In summary, we have found that public reporting was followed by an improvement in patient satisfaction scores with physician communication between 2007 and 2013. The rate of improvement was significantly greater in hospitals that had satisfaction scores in the lowest quartiles, whereas hospitals in the highest quartile had a small but statistically significant decline in patient satisfaction scores.
- Centers for Medicare Medicaid Services. Medicare program; hospital outpatient prospective payment system and CY 2007 payment rates; CY 2007 update to the ambulatory surgical center covered procedures list; Medicare administrative contractors; and reporting hospital quality data for FY 2008 inpatient prospective payment system annual payment update program‐‐HCAHPS survey, SCIP, and mortality. Final rule with comment period and final rule. Fed Regist. 2006;71(226):67959–68401.
- , , , , . Development, implementation, and public reporting of the HCAHPS survey. Med Care Res Rev. 2010;67(1):27–37.
- , , , . Comparison of Hospital Consumer Assessment of Healthcare Providers and Systems patient satisfaction scores for specialty hospitals and general medical hospitals: confounding effect of survey response rate. J Hosp Med. 2014;9(9):590–593.
- , , , et al. Hospital survey shows improvements in patient experience. Health Aff (Millwood). 2010;29(11):2061–2067.
- Centers for Medicare 2010:496829.
- , , , , , . The normal liver harbors the vitamin D nuclear receptor in nonparenchymal and biliary epithelial cells. Hepatology. 2003;37(5):1034–1042.
- , . Applied Longitudinal Data Analysis: Modeling Change and Event Occurrence. Oxford, United Kingdom: Oxford University Press; 2003.
- , . Data Analysis Using Regression and Multilevel/Hierarchical Models. Cambridge, United Kingdom: Cambridge University Press; 2007.
- nlme: Linear and Nonlinear Mixed Effects Models [computer program]. Version R package version 2015;3:1–121.
- , , , . Public reporting helped drive quality improvement in outpatient diabetes care among Wisconsin physician groups. Health Aff (Millwood). 2012;31(3):570–577.
- , , , , , . Governing healthcare through performance measurement in Massachusetts and the Netherlands. Health Policy. 2014;116(1):18–26.
- , , . Public reporting drove quality gains at nursing homes. Health Aff (Millwood). 2010;29(9):1706–1713.
- , , . Users of public reports of hospital quality: who, what, why, and how?: An aggregate analysis of 16 online public reporting Web sites and users' and experts' suggestions for improvement. Agency for Healthcare Research and Quality. Available at: http://archive.ahrq.gov/professionals/quality‐patient‐safety/quality‐resources/value/pubreportusers/index.html. Updated December 2011. Accessed April 2, 2015.
- Kaiser Family Foundation. 2008 update on consumers' views of patient safety and quality information. Available at: http://kff.org/health‐reform/poll‐finding/2008‐update‐on‐consumers‐views‐of‐patient‐2/. Published September 30, 2008. Accessed April 2, 2015.
- , . A report card on continuous quality improvement. Milbank Q. 1998;76(4):625–648, 511.
- , , . Assessing the impact of continuous quality improvement on clinical practice: what it will take to accelerate progress. Milbank Q. 1998;76(4):593–624, 510.
- , . Health care competition, strategic mission, and patient satisfaction: research model and propositions. J Health Organ Manag. 2008;22(6):627–641.
- , , . The effects of physician empathy on patient satisfaction and compliance. Eval Health Prof. 2004;27(3):237–251.
- , , , , . Association between vitamin D and hepatitis C virus infection: a meta‐analysis. World J Gastroenterol. 2013;19(35):5917–5924.
- , , , . The relation of patient satisfaction with complaints against physicians and malpractice lawsuits. Am J Med. 2005;118(10):1126–1133.
- , , , , , . Relation of patients' experiences with individual physicians to malpractice risk. Int J Qual Health Care. 2008;20(1):5–12.
- , , , . Association of patient satisfaction with complaints and risk management among emergency physicians. J Emerg Med. 2011;41(4):405–411.
- , , , , . Secrets of physician satisfaction. Study identifies pressure points and reveals life practices of highly satisfied doctors. Physician Exec. 2006;32(6):30–39.
- , , , et al. Attitudes of hospital leaders toward publicly reported measures of health care quality. JAMA Intern Med. 2014;174(12):1904–1911.
- , , , , , . Closing the quality gap: revisiting the state of the science (vol. 5: public reporting as a quality improvement strategy). Evid Rep Technol Assess (Full Rep). 2012(208.5):1–645.
- , , , , . Systematic review: the evidence that publishing patient care performance data improves quality of care. Ann Intern Med. 2008;148(2):111–123.
- , . The unintended consequences of quality improvement. Curr Opin Pediatr. 2009;21(6):777–782.
- , , , et al. Unintended consequences of implementing a national performance measurement system into local practice. J Gen Intern Med. 2012;27(4):405–412.
- , . Quality assessment by external bodies: intended and unintended impact on healthcare delivery. Curr Opin Anaesthesiol. 2009;22(2):237–241.
The Hospital Consumer Assessment of Healthcare Providers and Systems (HCAHPS) is the first national, standardized, publicly reported survey of patients' perception of hospital care. HCAHPS mandates a standard method of collecting and reporting perception of health care by patients to enable valid comparisons across all hospitals.[1, 2, 3] Voluntary collection of HCAHPS data for public reporting began in July 2006, mandatory collection of data for hospitals that participate in Inpatient Prospective Payment Program of Medicare began in July 2007, and public reporting of mandated HCAHPS scores began in 2008.[2]
Using data from the first 2‐year period, an earlier study had reported an increase in HCAHPS patient satisfaction scores in all domains except in the domain of satisfaction with physician communication.[4] Since then, data from additional years have become available, allowing assessment of satisfaction of hospitalized patients with physician communication over a longer period. Therefore, our objective was to examine changes in patient satisfaction with physician communication from 2007 to 2013, the last reported date, and to explore hospital and local population characteristics that may be associated with patient satisfaction.
METHODS
Publicly available data from 3 sources were used for this study. Patient satisfaction scores with physician communication and hospital characteristics were obtained from the HCAHPS data files available at the Hospital Compare database maintained by the Centers for Medicare and Medicaid Services (CMS).[5] HCAHPS files contain data for the preceding 12 months and are updated quarterly. We used files that reported data from the first to the fourth quarter of the year for 2007 to 2013. The HCAHPS survey contains 32 questions, of which 3 questions are about physician communication.[6] We used the percentage of survey participants who responded that physicians always communicated well as a measure of patient satisfaction with physician communication (the other 2 questions were not included). Hospitals that reported data on patient satisfaction during 2007 were divided into quartiles based on their satisfaction scores, and this quartile allocation was maintained during each subsequent year. Survey response rate, in percentage, was obtained from HCAHPS data files for each year. Hospital characteristics, such as ownership of the hospital, teaching hospital status, and designation of critical access hospital were obtained from the Hospital Compare website. Hospital ownership was defined as government (owned by federal, state, Veterans Affairs, or tribal authorities), for profit (owned by physicians or another proprietary), or nonprofit (owned by a nonprofit organization such as a church). A hospital was considered a teaching hospital if it obtained graduate medical education funding from CMS.
We obtained local population data from 2010 decennial census files and from the American Community Survey 5‐year data profile from 2009 to 2013; both datasets are maintained by the Unites States Census Bureau.[7] Census is mandated by Article I, Section 2 of the United States Constitution and takes place every 10 years. The American Community Survey is also a mandatory, ongoing statistical survey that samples a small percentage of the population every year giving communities the information they need to plan investments and services. We chose to use 5‐year estimates as these are more precise and are reliable in analyzing small populations. For each zip code, we extracted data on total population, percentage of African Americans in the population, median income, poverty level, and insurance status from the Census Bureau data files.
Local population characteristics at zip code level were mapped to hospitals using hospital service area (HSA) crosswalk files from the Dartmouth Atlas of Health Care.[7, 8] The Dartmouth Atlas defined 3436 HSAs by assigning zip codes to the hospital area where the greatest proportion of its Medicare residents were hospitalized. The number of acute care hospital beds and the number of physicians within the HSA were also obtained from the Dartmouth Atlas. Merging data from these 3 sources generated a dataset that contained information about patient satisfaction scores from a particular hospital, hospital characteristics, and population characteristics of the healthcare market.
Data were summarized as mean and standard deviation (SD). To model the dependence of observations from the same hospital and the correlation between hospitals within the same state due to similar regulations, and to assess the relative contribution of satisfaction scores over time within hospital, hospitals within states, and across states, 3‐level hierarchical regression models were examined.[9, 10] At the within‐hospital level, survey response rate was used as a time‐varying variable in addition to the year of observation. However, only year of observation was used to explore differences in patient satisfaction trajectories between hospitals. At the hospitals‐within‐states level, hospital characteristics and local population characteristics within the HSA were included. At the states level, only random effects were obtained, and no additional variables were included in the models.
Four models were built to assess the relationship between satisfaction scores and predictors. The basic model used only random effects without any predictors to determine the relative contribution of each level (within hospitals, hospitals within states, and across states) to variation in patient satisfaction scores and thus was consistent with the variance component analysis. The first model included the year of observation as a predictor at the within‐hospital level to examine trends in patient satisfaction scores during the observation period. For the second model, we added baseline satisfaction quartiles to the second model, whereas remaining predictors (HSA population, African American percentage in HSA, survey response rate, HSA median income, ownership of hospital, percentage with private any insurance in HSA, acute care hospital beds in HSA, teaching hospital status, and percentage of people living in poverty within HSA) were added in the third model. Quartiles for baseline satisfaction were generated using satisfaction scores from 2007. As a larger number of hospitals reported results for 2008 than for 2007 (2273 vs 3746), we conducted a sensitivity analysis using satisfaction quartiles in 2008 as baseline and examined subsequent trends over time for the 4 models noted above. All multilevel models were specified using the nlme package in R to account for clustering of observations within hospitals and hospitals within states, using hospital and state level random effects.[11]
RESULTS
Of the 4353 hospitals with data for the 7‐year period, the majority were in the Southern region (South = 1669, Midwest = 1239, Northeast = 607, West = 838). Texas had the largest number of hospital (N = 358) followed by California (N = 340). The largest number of hospitals were nonprofit (N = 2637, 60.6%). Mean (SD) patient satisfaction with physician communication was 78.9% (5.7%) in 2007 that increased to 81.7% (5.4%) in 2013. Throughout the observation period, the highest patient satisfaction was in the South (80.6% [6.6%] in 2007 and 83.2% [5.4%] in 2013). Of the 2273 hospitals that reported data in 2007, the mean satisfaction score of the lowest quartile was 72% (3.2%), and the highest quartile was 86.9% (3.2%) (Table 1). As a group, hospitals in the highest quartile in 2007 still had higher satisfaction scores in 2013 than the hospitals in the lowest quartile (85% [4.2%] vs 77% [3.6%], respectively). Only 4 of the 584 hospitals in the lowest quartile in 2007 climbed up to the highest quartile in 2013, whereas 22 hospitals that were in the upper quartile in 2007 dropped to the lowest quartile in 2013.
| Characteristic | Quartiles Based on 2007 Satisfaction Scores | |||
|---|---|---|---|---|
| Highest Quartile | 2nd Quartile | 3rd Quartile | Lowest Quartile | |
| ||||
| Total no. of hospitals, N (%) | 461 (20.3) | 545 (24.0) | 683 (30.0) | 584 (25.7) |
| Hospital ownership, N (%) | ||||
| For profit | 50 (14.4) | 60 (17.3) | 96 (27.7) | 140 (40.5) |
| Nonprofit | 269 (17.4) | 380 (24.6) | 515 (33.4) | 378 (24.5) |
| Government | 142 (36.9) | 105 (27.3) | 72 (18.7) | 66 (17.1) |
| HSA population, in 1,000, median (IQR) | 33.2 (70.5) | 88.5 (186) | 161.8 (374) | 222.2 (534) |
| Racial distribution of HSA population, median (IQR) | ||||
| White, % | 82.6 (26.2) | 82.5 (28.5) | 74.2 (32.9) | 66.8 (35.3) |
| Black, % | 4.3 (21.7) | 3.7 (16.3) | 5.9 (14.8) | 7.4 (12.1) |
| Other, % | 6.4 (7.1) | 8.8 (10.8) | 12.9 (19.8) | 20.0 (33.1) |
| HSA mean median income in $1,000, mean (SD) | 44.6 (11.7) | 52.4 (17.8) | 58.4 (17.1) | 57.5 (15.7) |
| Satisfaction scores (at baseline), mean (SD) | 86.9 (3.1) | 81.4 (1.1) | 77.5 (1.1) | 72.0 (3.2) |
| Satisfaction scores (in 2013), mean (SD) | 85.0 (4.3) | 82.0 (3.4) | 79.7 (3.0) | 77.0 (3.5) |
| Survey response rate (at baseline), mean (SD) | 43.2 (19.8) | 34.5 (9.4) | 32.6 (8.0) | 30.3 (7.8) |
| Survey response rate (20072013), mean (SD) | 32.8 (7.8) | 32.6 (7.5) | 30.8 (6.5) | 29.3 (6.5) |
| Percentage with any insurance in HSA, mean (SD) | 84.0 (5.4) | 84.8 (6.6) | 85.5 (6.3) | 83.9 (6.6) |
| Teaching hospital, N (%) | 42 (9.1) | 155 (28.4) | 277 (40.5) | 274 (46.9%) |
| Acute care hospital beds in HSA (per 1,000), mean (SD) | 3.2 (1.2) | 2.6 (0.8) | 2.5 (0.8) | 2.4 (0.7) |
| Number of physicians in HSA (per 100,000), mean (SD) | 190 (36) | 197 (43) | 204 (47) | 199 (45) |
| Percentage with poverty in HSA, mean (SD)[7] | 16.9 (6.6) | 15.5 (6.5) | 14.4 (5.7) | 15.5 (6.0) |
Using variance component analysis, we found that 23% of the variation in patient satisfaction scores with physician communication was due to differences between states, 52% was due to differences between hospitals within states, and 24% was due to changes over time within a hospital. When examining time trends of satisfaction during the 7‐year period without adjusting for other predictors, we found a statistically significant increasing trend in patient satisfaction with physician communication (0.33% per year; P < 0.001). We also found a significant negative correlation (0.62, P < 0.001) between the random effects for baseline satisfaction (intercept) and change over time (slope), suggesting that initial patient satisfaction with physicians at a hospital was negatively correlated with subsequent change in satisfaction scores during the observation period.
When examining the effect of satisfaction ranking in 2007, hospitals within the lowest quartile of patient satisfaction in 2007 had significantly larger increase in satisfaction scores during the subsequent period as compared to the hospitals in each of the other 3 quartiles (all P < 0.001, Table 2). The difference in the magnitude of the rate of increase in satisfaction scores was greatest between the lowest quartile and the highest quartile (1.10% per year; P < 0.001). In fact, the highest quartile had a statistically significant absolute decrease in patient satisfaction during the observation period (0.23% per year; P < 0.001, Figure 1).
| Variable | Model 1: ; P Value | Model 2: ; P Value | Model 3: ; P Value |
|---|---|---|---|
| |||
| Time (in years) | 0.33; <0.001 | 0.87; <0.001 | 0.89; <0.001 |
| Satisfaction quartiles at baseline | |||
| Highest quartile | 12.1; <0.001 | 10.4; <0.001 | |
| 2nd quartile | 7.9; <0.001 | 7.1; <0.001 | |
| 3rd quartile | 4.5; <0.001 | 4.1; <0.001 | |
| Lowest quartile (REF) | REF | REF | |
| Interaction with time | |||
| Highest quartile | 1.10; <0.001 | 0.94; <0.001 | |
| 2nd quartile | 0.73; <0.001 | 0.71; <0.001 | |
| 3rd quartile | 0.48; <0.001 | 0.47;<0.001 | |
| Survey response rate (%) | 0.12; <0.001 | ||
| Total population, in 10,000 | 0.002; 0.02 | ||
| African American (%) | 0.004; 0.13 | ||
| HSA median Income in $10,000 | 0.02; 0.58 | ||
| Ownership | |||
| Government (REF) | REF | ||
| Nonprofit | 0.01; 0.88 | ||
| For profit | 0.21; 0.11 | ||
| Percentage with insurance in HSA | 0.007; 0.27 | ||
| Acute care beds in HSA (per 1,000) | 0.60; <0.001 | ||
| Physicians in HSA (per 100,000) | 0.003; 0.007 | ||
| Teaching hospital | 0.34; 0.001 | ||
| Percentage in poverty in HSA | 0.01; 0.27 | ||
After adjusting for hospital characteristics and population characteristics of the HSA, the 2007 satisfaction quartiles remained significantly associated with subsequent change in satisfaction scores during the 7‐year observation period (Table 2). In addition, survey response rate, number of physicians, and the number of acute‐care hospital beds within the HSA were positively associated with patient satisfaction, whereas higher HSA population density and being a teaching hospital were negatively associated with patient satisfaction. Using 2008 satisfaction scores as baseline, the results did not change except that the number of physicians in the HSA and being a teaching hospital were no longer associated with satisfaction scores with physicians.
DISCUSSION
Using hierarchical modelling, we have shown that national patient satisfaction scores with physicians have consistently improved since 2007, the year when reporting of satisfaction scores began. We further show that the improvement in satisfaction scores has not been consistent through all hospitals. The largest increase in satisfaction scores was in hospitals that were in the lowest quartile of satisfaction scores in 2007. In contrast, satisfaction scores decreased in hospitals that were in the uppermost quartile of satisfaction scores. The difference between the lowest and uppermost quartile was so large in 2007 that despite the difference in the direction of change in satisfaction scores, hospitals in the uppermost quartile continued to have higher satisfaction scores in 2013 than hospitals in the lowest quartile.
Consistent with our findings for patient satisfaction, other studies have found that public reporting is associated with improvement in healthcare quality measures across nursing homes, physician groups, and hospitals.[12, 13, 14] However, it is unclear how public reporting can change patient satisfaction. The main purpose of public reporting of quality of healthcare measures, such as patient satisfaction with the healthcare they receive, is to generate value by increasing transparency and accountability, thereby increasing the quality of healthcare delivery. Healthcare consumers may also utilize the reported measures to choose providers that deliver high‐quality healthcare. Contrary to expectations, there is very little evidence that consumers choose healthcare facilities based on public reporting, and it is likely that other mechanisms may explain the observed association.[15, 16]
Physicians have historically had low adoption of strategies to improve patient satisfaction and often cite suboptimal data and lack of evidence for data‐driven strategies.[17, 18] Hospitals and healthcare organizations have deployed a broad range of strategies to engage physicians. These include emphasizing relationship between patient satisfaction and patient compliance, complaints and malpractice lawsuits, appealing to physicians' sense of competitiveness by publishing individual provider satisfaction scores, educating physicians on HCAHPS and providing them with regularly updated data, and development of specific techniques for improving patient‐physician interaction.[19, 20, 21, 22, 23, 24] Administrators may also enhance physician engagement by improving physician satisfaction, decreasing their turnover, support development of physicians in administrative leadership roles, and improving financial transparency.[25] Thus, involvement of hospital leadership has been instrumental in encouraging physicians to focus on quality measures including patient satisfaction. Some evidence suggests that public reporting exerts strong influence on hospital leaders for adequate resource allocation, local planning, and improvement efforts.[26, 27, 28]
Perhaps the most intriguing finding in our study is that hospitals in the uppermost quartile of satisfaction scores in 2007 had a statistically significant steady decline in scores during the following period as compared to hospitals in the lowest quartile that had a steady increase. A possible explanation for this finding can be that high‐performing hospitals become complacent and do not invest in developing the effort‐intensive resources required to maintain and improve performance in the physician‐related patient satisfaction domain. These resources may be diverted to competing needs that include addressing improvement efforts for a large number of other publicly reported healthcare quality measures. Thus, an unintended consequence of quality improvement may be that improvement in 1 domain may be at the expense of quality of care in another domain.[29, 30, 31] On the other hand, it is likely that hospitals in the lower quartile see a larger improvement in their scores for the same degree of investment as hospitals in the higher quartiles. It is also likely that hospitals, particularly those in the lowest quartile, develop their individual benchmarks and expend effort that is in line with their perceived need for improvement to achieve their strategic and marketing goals.
Our study has significant implications for the healthcare system, clinical practice, and future research. Whereas public reporting of quality measures is associated with an overall improvement in the reported quality measure, hospitals with high scores may move resources away from that metric or become complacent. Health policy makers need to design policies that encourage all hospitals and providers to perform better or continue to perform well. We further show that differences between hospitals and between local healthcare markets are the biggest factor determining the variation in patient satisfaction with physician communication, and an adjustment in reported score for these factors may be needed. Although local healthcare market factors may not be modifiable, an exchange of knowledge between hospitals with low and high patient satisfaction scores may improve overall satisfaction scores. Similarly, hospitals that are successful in increasing patient satisfaction scores should identify and share useful interventions.
The main strength of our study is that we used data on patient satisfaction with physician communication that were reported annually by most hospitals within the United States. These longitudinal data allowed us to examine not only the effect of public reporting on patient satisfaction with physician communication but also its trend over time. As we had 7 years of data, we were able to eliminate the possibility of regression to mean; an extreme result on first measurement is followed by a second measurement that tends to be closer to the average. Further, we adjusted satisfaction scores based on hospital and local healthcare market characteristics allowing us to compare satisfaction scores across hospitals. However, because units of observation were hospitals and not patients, we could not examine the effect of patient characteristics on satisfaction scores. In addition, HCAHPS surveys have low response rates and may have response and selection bias. Furthermore, we were unable to examine the strategies implemented by hospitals to improve satisfaction scores or the effect of such strategies on satisfaction scores. Data on hospital strategies to increase satisfaction scores are not available for most hospitals and could not have been included in the study.
In summary, we have found that public reporting was followed by an improvement in patient satisfaction scores with physician communication between 2007 and 2013. The rate of improvement was significantly greater in hospitals that had satisfaction scores in the lowest quartiles, whereas hospitals in the highest quartile had a small but statistically significant decline in patient satisfaction scores.
- Centers for Medicare Medicaid Services. Medicare program; hospital outpatient prospective payment system and CY 2007 payment rates; CY 2007 update to the ambulatory surgical center covered procedures list; Medicare administrative contractors; and reporting hospital quality data for FY 2008 inpatient prospective payment system annual payment update program‐‐HCAHPS survey, SCIP, and mortality. Final rule with comment period and final rule. Fed Regist. 2006;71(226):67959–68401.
- , , , , . Development, implementation, and public reporting of the HCAHPS survey. Med Care Res Rev. 2010;67(1):27–37.
- , , , . Comparison of Hospital Consumer Assessment of Healthcare Providers and Systems patient satisfaction scores for specialty hospitals and general medical hospitals: confounding effect of survey response rate. J Hosp Med. 2014;9(9):590–593.
- , , , et al. Hospital survey shows improvements in patient experience. Health Aff (Millwood). 2010;29(11):2061–2067.
- Centers for Medicare 2010:496829.
- , , , , , . The normal liver harbors the vitamin D nuclear receptor in nonparenchymal and biliary epithelial cells. Hepatology. 2003;37(5):1034–1042.
- , . Applied Longitudinal Data Analysis: Modeling Change and Event Occurrence. Oxford, United Kingdom: Oxford University Press; 2003.
- , . Data Analysis Using Regression and Multilevel/Hierarchical Models. Cambridge, United Kingdom: Cambridge University Press; 2007.
- nlme: Linear and Nonlinear Mixed Effects Models [computer program]. Version R package version 2015;3:1–121.
- , , , . Public reporting helped drive quality improvement in outpatient diabetes care among Wisconsin physician groups. Health Aff (Millwood). 2012;31(3):570–577.
- , , , , , . Governing healthcare through performance measurement in Massachusetts and the Netherlands. Health Policy. 2014;116(1):18–26.
- , , . Public reporting drove quality gains at nursing homes. Health Aff (Millwood). 2010;29(9):1706–1713.
- , , . Users of public reports of hospital quality: who, what, why, and how?: An aggregate analysis of 16 online public reporting Web sites and users' and experts' suggestions for improvement. Agency for Healthcare Research and Quality. Available at: http://archive.ahrq.gov/professionals/quality‐patient‐safety/quality‐resources/value/pubreportusers/index.html. Updated December 2011. Accessed April 2, 2015.
- Kaiser Family Foundation. 2008 update on consumers' views of patient safety and quality information. Available at: http://kff.org/health‐reform/poll‐finding/2008‐update‐on‐consumers‐views‐of‐patient‐2/. Published September 30, 2008. Accessed April 2, 2015.
- , . A report card on continuous quality improvement. Milbank Q. 1998;76(4):625–648, 511.
- , , . Assessing the impact of continuous quality improvement on clinical practice: what it will take to accelerate progress. Milbank Q. 1998;76(4):593–624, 510.
- , . Health care competition, strategic mission, and patient satisfaction: research model and propositions. J Health Organ Manag. 2008;22(6):627–641.
- , , . The effects of physician empathy on patient satisfaction and compliance. Eval Health Prof. 2004;27(3):237–251.
- , , , , . Association between vitamin D and hepatitis C virus infection: a meta‐analysis. World J Gastroenterol. 2013;19(35):5917–5924.
- , , , . The relation of patient satisfaction with complaints against physicians and malpractice lawsuits. Am J Med. 2005;118(10):1126–1133.
- , , , , , . Relation of patients' experiences with individual physicians to malpractice risk. Int J Qual Health Care. 2008;20(1):5–12.
- , , , . Association of patient satisfaction with complaints and risk management among emergency physicians. J Emerg Med. 2011;41(4):405–411.
- , , , , . Secrets of physician satisfaction. Study identifies pressure points and reveals life practices of highly satisfied doctors. Physician Exec. 2006;32(6):30–39.
- , , , et al. Attitudes of hospital leaders toward publicly reported measures of health care quality. JAMA Intern Med. 2014;174(12):1904–1911.
- , , , , , . Closing the quality gap: revisiting the state of the science (vol. 5: public reporting as a quality improvement strategy). Evid Rep Technol Assess (Full Rep). 2012(208.5):1–645.
- , , , , . Systematic review: the evidence that publishing patient care performance data improves quality of care. Ann Intern Med. 2008;148(2):111–123.
- , . The unintended consequences of quality improvement. Curr Opin Pediatr. 2009;21(6):777–782.
- , , , et al. Unintended consequences of implementing a national performance measurement system into local practice. J Gen Intern Med. 2012;27(4):405–412.
- , . Quality assessment by external bodies: intended and unintended impact on healthcare delivery. Curr Opin Anaesthesiol. 2009;22(2):237–241.
© 2015 Society of Hospital Medicine
