User login
Biceps Tenodesis and Superior Labrum Anterior to Posterior (SLAP) Tears
Injuries of the superior labrum–biceps complex (SLBC) have been recognized as a cause of shoulder pain since they were first described by Andrews and colleagues1 in 1985. Superior labrum anterior to posterior (SLAP) tears are relatively uncommon injuries of the shoulder, and their true incidence is difficult to establish. However, recently there has been a significant increase in the reported incidence and operative treatment of SLAP tears.2 SLAP tears can occur in isolation, but they are commonly seen in association with other shoulder lesions, including rotator cuff tear, Bankart lesion, glenohumeral arthritis, acromioclavicular joint pathology, and subacromial impingement.
Although SLAP tears are well described and classified,3-6 our understanding of symptomatic SLAP tears and of their contribution to glenohumeral instability is limited. Diagnosing a SLAP tear on the basis of history and physical examination is a clinical challenge. Pain is the most common presentation of SLAP tears, though localization and characterization of pain are variable and nonspecific.7 The mechanism of injury is helpful in acute presentation (traction injury; fall on outstretched, abducted arm), but an overhead athlete may present with no distinct mechanism other than chronic, repetitive use of the shoulder.8-11 Numerous provocative physical examination tests have been used to assist in the diagnosis of SLAP tear, yet there is no consensus regarding the ideal physical examination test, with high sensitivity, specificity, and accuracy.12-14 Magnetic resonance arthrography, the gold standard imaging modality, is highly sensitive and specific (>95%) for diagnosing SLAP tears.
SLAP tear management is based on lesion type and severity, age, functional demands, and presence of coexisting intra-articular lesions. Management options include nonoperative treatment, débridement or repair of SLBC, biceps tenotomy, and biceps tenodesis.15-19
In this 5-point review, we present an evidence-based analysis of the role of the SLBC in glenohumeral stability and the role of biceps tenodesis in the management of SLAP tears.
1. Role of SLBC in stability of glenohumeral joint
The anatomy of the SLBC has been well described,20,21 and there is consensus that SLBC pathology can be a source of shoulder pain. The superior labrum is relatively more mobile than the rest of the glenoid labrum, and it provides attachment to the long head of the biceps tendon (LHBT) and the superior glenohumeral and middle glenohumeral ligaments.
The functional role of the SLBC in glenohumeral stability and its contribution to the pathogenesis of shoulder instability are not clearly defined. Our understanding of SLBC function is largely derived from simulated cadaveric experiments of SLAP tears. Controlled laboratory studies with simulated type II SLAP tears in cadavers have shown significantly increased glenohumeral translation in the anterior-posterior and superior-inferior directions, suggesting a role of the superior labrum in maintaining glenohumeral stability.22-26 Interestingly, there is conflicting evidence regarding restoration of normal glenohumeral translation in cadaveric shoulders after repair of simulated SLAP lesions in the presence or absence of simulated anterior capsular laxity.22,25-27 However, it is important to understand the limitations of cadaveric experiments in order to appreciate and truly comprehend the results of these experiments. There are inconsistencies in the size of simulated type II SLAP lesions in different studies, which can affect the degree of glenohumeral translation and the results of repair.23-25,28 The amount of glenohumeral translation noticed after simulated SLAP tears in cadavers, though statistically significant, is small in amplitude, and its relevance may not translate to a clinically significant level. The impact of dynamic components of stability (eg, rotator cuff muscles), capsular stretch, and other in vivo variables that affect glenohumeral stability are unaccounted for during cadaveric experiments.
LHBT is a recognized cause of shoulder pain, but its contribution to shoulder stability is a point of continued debate. According to one school of thought, LHBT is a vestigial structure that can be sacrificed without any loss of stability. Another school of thought holds that LHBT is an important active stabilizer of the glenohumeral joint. Cadaveric studies have demonstrated that loading the LHBT decreases glenohumeral translation and rotational range of motion, especially in lower and mid ranges of abduction.23,29,30 Furthermore, LHBT contributes to anterior glenohumeral stability by resisting torsional forces in the abducted and externally rotated shoulder and reducing stress on the inferior glenohumeral ligaments.31-33 Strauss and colleagues22 recently found that simulated anterior and posterior type II SLAP lesions in cadaveric shoulders increased glenohumeral translation in all planes, and biceps tenodesis did not further worsen this abnormal glenohumeral translation. Furthermore, repair of posterior SLAP lesions along with biceps tenodesis restored abnormal glenohumeral translation with no significant difference from the baseline in any plane of motion. Again, the limitations of cadaveric studies should be considered when interpreting these results and applying them clinically.
2. Biceps tenodesis as primary treatment for SLAP tears
A growing body of evidence suggests that primary tenodesis of LHBT may be an effective alternative treatment to SLAP repairs in select patients.34-36 However, the evidence is weak, and high-quality studies comparing SLAP repair and primary biceps tenodesis are required in order to make a strong recommendation for one technique over another. Gupta and colleagues35 retrospectively analyzed 28 cases of concomitant SLAP tear and biceps tendonitis treated with primary open subpectoral biceps tenodesis. There was significant improvement in patients’ functional outcome scores postoperatively [SANE (Single Assessment Numeric Evaluation), ASES (American Shoulder and Elbow Surgeons shoulder index), SST (Simple Shoulder Test), VAS (visual analog scale), and SF-12 (Short Form-12)]. In addition, 80% of patients were satisfied with their outcome. Mean age was 43.7 years. Forty-two percent of patients had a worker’s compensation claim. Interestingly, 15 patients in this cohort had a type I SLAP tear. Boileau and colleagues34 prospectively followed 25 cases of type II SLAP tear treated with either SLAP repair (10 patients; mean age, 37 years) or primary arthroscopic biceps tenodesis (15 patients; mean age, 52 years). Compared with the SLAP repair group, the biceps tenodesis group had significantly higher rates of satisfaction and return to previous level of sports participation. However, group assignments were nonrandomized, and the decision to treat a patient with SLAP repair versus biceps tenodesis was made by the senior surgeon purely on the basis of age (SLAP repair for patients under 30 years). Ek and colleagues36 retrospectively compared the cases of 10 patients who underwent SLAP repair (mean age, 32 years) and 15 who underwent biceps tenodesis (mean age, 47 years) for type II SLAP tear. There was no significant difference between the groups with respect to outcome scores, return to play or preinjury activity level, or complications.
There continues to be significant debate as to which patient will benefit from primary SLAP repair versus biceps tenodesis. Multiple factors are involved: age, presence of associated shoulder pathology, occupation, preinjury activity level, and worker’s compensation status. Age has convincingly been shown to affect the outcomes of treatment of type II SLAP tears.34,35,37-40 There is consensus that patients over age 40 years will benefit from primary biceps tenodesis for SLAP tears. However, the evidence for this recommendation is weak.
3. Biceps tenodesis and failed SLAP repair
The definition of a failed SLAP repair is not well documented in the literature, but dissatisfaction after SLAP repair can result from continued shoulder pain, poor shoulder function, or inability to return to preinjury functional level.15,41 The etiologic determination and treatment of a failed SLAP repair are challenging, and outcomes of revision SLAP repair are not very promising.42,43 Biceps tenodesis has been proposed as an alternative treatment to revision SLAP repair for failed SLAP repair. McCormick and colleagues41 prospectively evaluated 42 patients (mean age, 39.2 years; minimum follow-up, 2 years) with failed type II SLAP repairs that were treated with open subpectoral biceps tenodesis. There was significant improvement in ASES, SANE, and Western Ontario Shoulder Instability Index (WOSI) outcome scores and in postoperative shoulder range of motion at a mean follow-up of 3.6 years. One patient had transient musculocutaneous neurapraxia after surgery. In a retrospective cohort study, Gupta and colleagues44 found significant improvement in ASES, SANE, SST, SF-12, and VAS outcome scores in 11 patients who underwent open subpectoral biceps tenodesis for failed arthroscopic SLAP repair (mean age at surgery, 40 years; mean follow-up, 26 months). Three of the 11 patients had worker’s compensation claims, and there were no complications and no revision surgeries required after biceps tenodesis. Werner and colleagues16 retrospectively evaluated 17 patients who underwent biceps tenodesis for failed SLAP repair (mean age, 39 years; minimum follow-up, 2 years). Twenty-nine percent of patients had worker’s compensation claims. Compared with the contralateral shoulder, the treated shoulder had better postoperative ASES, SANE, SST, and Veteran RAND 36-item health survey outcome scores; range of motion was near normal.
There are no high-quality studies comparing revision SLAP repair and biceps tenodesis in the management of failed SLAP repair.16,41-44 Case series studies have found improved outcomes and pain relief after biceps tenodesis for failed SLAP repair, but the quality of evidence has been poor (level IV evidence).16,41-44 The senior author recommends treating failed SLAP repairs with biceps tenodesis.
4. Biceps tenodesis as treatment option for SLAP tear in overhead throwing athletes
Biceps tenodesis is a potential alternative treatment to SLAP repair in overhead throwing athletes. Although outcome scores and satisfaction rates after SLAP repair are high in overhead athletes, the rates of return to sport are relatively low, especially in baseball players.38,45-47 In a level III cohort study, Boileau and colleagues34 found that 13 (87%) of 15 patients with type II SLAP tears, including 8 overhead athletes, had returned to their previous level of activity by a mean of 30 months after biceps tenodesis. In contrast, only 2 of 10 patients returned to their previous level of activity after SLAP repair. Interestingly, 3 patients who underwent biceps tenodesis for failed SLAP repair returned to overhead sports. Schöffl and colleagues48 reported on the outcomes of biceps tenodesis for SLAP lesions in 6 high-level rock climbers. By a mean follow-up of 6 months, all 6 patients had returned to their previous level of climbing. Their satisfaction rate was 96.8%. Gupta and colleagues35 reported on a cohort of 28 patients who underwent biceps tenodesis for SLAP tears and concomitant biceps tendonitis. Of the 8 athletes in the group, 5 were able to return to their previous level of play, and 1 was able to return to a lower level of sporting activity. There was significant improvement from preoperative to postoperative scores on ASES, SST, SANE, VAS, SF-12 overall, and SF-12 components.
Chalmers and colleagues49 recently described motion analyses with simultaneous surface electromyographic measurements in 18 baseball pitchers. Of these 18 players, 7 were uninjured (controls), 6 were pitching after SLAP repair, and 5 were pitching after subpectoral biceps tenodesis. There were no significant differences between controls and postoperative patients with respect to pitching kinematics. Interestingly, compared with the controls and the patients who underwent open biceps tenodesis, the patients who underwent SLAP repair had altered patterns of thoracic rotation during pitching. However, the clinical significance of this finding and the impact of this finding on pitching efficacy are not currently known.
Biceps tenodesis as a primary procedure for type II SLAP lesion in an overhead athlete is a concept in evolution. Increasing evidence suggests a role for primary biceps tenodesis in an overhead athlete with type II SLAP lesion and concomitant biceps pathology. However, this evidence is of poor quality, and the strength of the recommendation is weak. Still to be determined is whether return to preinjury performance level is better with primary biceps tenodesis or with SLAP repair in overhead athletes with type II SLAP lesion. As per the senior author’s treatment algorithm, we prefer SLAP repair for overhead athletes with type II SLAP tears and reserve biceps tenodesis for cases involving significant biceps pathology and/or clinical symptoms involving the bicipital groove consistent with extra-articular biceps pain.
5. Biceps tenodesis for type II SLAP tear in contact athletes and occupations demanding heavy labor (blue-collar jobs)
SLAP tears are less common in contact athletes, and there is general agreement that SLAP repair outcomes are better in contact athletes than in overhead athletes. In a retrospective review of 18 rugby players with SLAP tears, Funk and Snow50 reported excellent results and quicker return to sport after SLAP repair. Patients with isolated SLAP tears had the earliest return to play. Enad and colleagues51 reported SLAP repair outcomes in an active military population. SLAP tears are more common in the military versus the general population because of the unique physical demands placed on military personnel. The authors retrospectively reviewed 27 cases of type II SLAP tears treated with SLAP repair and suture anchors. Outcomes were measured at a mean of 30.5 months after surgery. Twenty-four (89%) of the 27 patients had good to excellent results, and 94% had returned to active duty by a mean of 4.4 months after SLAP repair.
Given the poor-quality evidence in the literature, we believe that biceps tenodesis should be reserved for revision surgery in contact athletes. There is insufficient evidence to recommend biceps tenodesis as primary treatment for type II SLAP tears in contact athletes. SLAP repair should be performed for primary SLAP lesions in contact athletes and for patients in physically demanding professions (eg, military, laborer, weightlifter).
Conclusion
SLAP tears can result in persistent shoulder pain and dysfunction. SLAP tear management depends on lesion type and severity, age, and functional demands. SLAP repair is the treatment of choice for type II SLAP lesions in young, active patients. Biceps tenodesis is a preferred alternative to SLAP repair in failed SLAP repair and in type II SLAP patients who are older than 40 years and who are less active and have a worker’s compensation claim. These recommendations are based on poor-quality evidence. There is an unmet need for randomized clinical studies comparing SLAP repair with biceps tenodesis for type II SLAP tears in different patient populations so as to optimize the current decision-making algorithm for SLAP tears.
1. Andrews JR, Carson WG Jr, McLeod WD. Glenoid labrum tears related to the long head of the biceps. Am J Sports Med. 1985;13(5):337-341.
2. Weber SC, Martin DF, Seiler JG 3rd, Harrast JJ. Superior labrum anterior and posterior lesions of the shoulder: incidence rates, complications, and outcomes as reported by American Board of Orthopaedic Surgery. Part II candidates. Am J Sports Med. 2012;40(7):1538-1543.
3. Snyder SJ, Karzel RP, Del Pizzo W, Ferkel RD, Friedman MJ. SLAP lesions of the shoulder. Arthroscopy. 1990;6(4):274-279.
4. Morgan CD, Burkhart SS, Palmeri M, Gillespie M. Type II SLAP lesions: three subtypes and their relationships to superior instability and rotator cuff tears. Arthroscopy. 1998;14(6):553-565.
5. Powell SE, Nord KD, Ryu RKN. The diagnosis, classification, and treatment of SLAP lesions. Oper Tech Sports Med. 2012;20(1):46-56.
6. Maffet MW, Gartsman GM, Moseley B. Superior labrum-biceps tendon complex lesions of the shoulder. Am J Sports Med. 1995;23(1):93-98.
7. Kim TK, Queale WS, Cosgarea AJ, McFarland EG. Clinical features of the different types of SLAP lesions: an analysis of one hundred and thirty-nine cases. J Bone Joint Surg Am. 2003;85(1):66-71.
8. Abrams GD, Safran MR. Diagnosis and management of superior labrum anterior posterior lesions in overhead athletes. Br J Sports Med. 2010;44(5):311-318.
9. Keener JD, Brophy RH. Superior labral tears of the shoulder: pathogenesis, evaluation, and treatment. J Am Acad Orthop Surg. 2009;17(10):627-637.
10. Abrams GD, Hussey KE, Harris JD, Cole BJ. Clinical results of combined meniscus and femoral osteochondral allograft transplantation: minimum 2-year follow-up. Arthroscopy. 2014;30(8):964-970.e1.
11. Burkhart SS, Morgan CD, Kibler WB. The disabled throwing shoulder: spectrum of pathology part I: pathoanatomy and biomechanics. Arthroscopy. 2003;19(4):404-420.
12. Virk MS, Arciero RA. Superior labrum anterior to posterior tears and glenohumeral instability. Instr Course Lect. 2013;62:501-514.
13. Calvert E, Chambers GK, Regan W, Hawkins RH, Leith JM. Special physical examination tests for superior labrum anterior posterior shoulder tears are clinically limited and invalid: a diagnostic systematic review. J Clin Epidemiol. 2009;62(5):558-563.
14. Jones GL, Galluch DB. Clinical assessment of superior glenoid labral lesions: a systematic review. Clin Orthop Relat Res. 2007;455:45-51.
15. Werner BC, Brockmeier SF, Miller MD. Etiology, diagnosis, and management of failed SLAP repair. J Am Acad Orthop Surg. 2014;22(9):554-565.
16. Werner BC, Pehlivan HC, Hart JM, et al. Biceps tenodesis is a viable option for salvage of failed SLAP repair. J Shoulder Elbow Surg. 2014;23(8):e179-e184.
17. Erickson J, Lavery K, Monica J, Gatt C, Dhawan A. Surgical treatment of symptomatic superior labrum anterior-posterior tears in patients older than 40 years: a systematic review. Am J Sports Med. 2015;43(5):1274-1282.
18. Huri G, Hyun YS, Garbis NG, McFarland EG. Treatment of superior labrum anterior posterior lesions: a literature review. Acta Orthop Traumatol Turc. 2014;48(3):290-297.
19. Li X, Lin TJ, Jager M, et al. Management of type II superior labrum anterior posterior lesions: a review of the literature. Orthop Rev. 2010;2(1):e6.
20. Cooper DE, Arnoczky SP, O’Brien SJ, Warren RF, DiCarlo E, Allen AA. Anatomy, histology, and vascularity of the glenoid labrum. An anatomical study. J Bone Joint Surg Am. 1992;74(1):46-52.
21. Vangsness CT, Jorgenson SS, Watson T, Johnson DL. The origin of the long head of the biceps from the scapula and glenoid labrum. An anatomical study of 100 shoulders. J Bone Joint Surg Br. 1994;76(6):951-954.
22. Strauss EJ, Salata MJ, Sershon RA, et al. Role of the superior labrum after biceps tenodesis in glenohumeral stability. J Shoulder Elbow Surg. 2014;23(4):485-491.
23. Pagnani MJ, Deng XH, Warren RF, Torzilli PA, Altchek DW. Effect of lesions of the superior portion of the glenoid labrum on glenohumeral translation. J Bone Joint Surg Am. 1995;77(7):1003-1010.
24. McMahon PJ, Burkart A, Musahl V, Debski RE. Glenohumeral translations are increased after a type II superior labrum anterior-posterior lesion: a cadaveric study of severity of passive stabilizer injury. J Shoulder Elbow Surg. 2004;13(1):39-44.
25. Burkart A, Debski R, Musahl V, McMahon P, Woo SL. Biomechanical tests for type II SLAP lesions of the shoulder joint before and after arthroscopic repair [in German]. Orthopade. 2003;32(7):600-607.
26. Panossian VR, Mihata T, Tibone JE, Fitzpatrick MJ, McGarry MH, Lee TQ. Biomechanical analysis of isolated type II SLAP lesions and repair. J Shoulder Elbow Surg. 2005;14(5):529-534.
27. Mihata T, McGarry MH, Tibone JE, Fitzpatrick MJ, Kinoshita M, Lee TQ. Biomechanical assessment of type II superior labral anterior-posterior (SLAP) lesions associated with anterior shoulder capsular laxity as seen in throwers: a cadaveric study. Am J Sports Med. 2008;36(8):1604-1610.
28. Youm T, Tibone JE, ElAttrache NS, McGarry MH, Lee TQ. Simulated type II superior labral anterior posterior lesions do not alter the path of glenohumeral articulation: a cadaveric biomechanical study. Am J Sports Med. 2008;36(4):767-774.
29. Youm T, ElAttrache NS, Tibone JE, McGarry MH, Lee TQ. The effect of the long head of the biceps on glenohumeral kinematics. J Shoulder Elbow Surg. 2009;18(1):122-129.
30. McGarry MH, Nguyen ML, Quigley RJ, Hanypsiak B, Gupta R, Lee TQ. The effect of long and short head biceps loading on glenohumeral joint rotational range of motion and humeral head position [published online ahead of print September 26, 2014]. Knee Surg Sports Traumatol Arthrosc.
31. Glousman R, Jobe F, Tibone J, Moynes D, Antonelli D, Perry J. Dynamic electromyographic analysis of the throwing shoulder with glenohumeral instability. J Bone Joint Surg Am. 1988;70(2):220-226.
32. Gowan ID, Jobe FW, Tibone JE, Perry J, Moynes DR. A comparative electromyographic analysis of the shoulder during pitching. Professional versus amateur pitchers. Am J Sports Med. 1987;15(6):586-590.
33. Rodosky MW, Harner CD, Fu FH. The role of the long head of the biceps muscle and superior glenoid labrum in anterior stability of the shoulder. Am J Sports Med. 1994;22(1):121-130.
34. Boileau P, Parratte S, Chuinard C, Roussanne Y, Shia D, Bicknell R. Arthroscopic treatment of isolated type II SLAP lesions: biceps tenodesis as an alternative to reinsertion. Am J Sports Med. 2009;37(5):929-936.
35. Gupta AK, Chalmers PN, Klosterman EL, et al. Subpectoral biceps tenodesis for bicipital tendonitis with SLAP tear. Orthopedics. 2015;38(1):e48-e53.
36. Ek ET, Shi LL, Tompson JD, Freehill MT, Warner JJ. Surgical treatment of isolated type II superior labrum anterior-posterior (SLAP) lesions: repair versus biceps tenodesis. J Shoulder Elbow Surg. 2014;23(7):1059-1065.
37. Alpert JM, Wuerz TH, O’Donnell TF, Carroll KM, Brucker NN, Gill TJ. The effect of age on the outcomes of arthroscopic repair of type II superior labral anterior and posterior lesions. Am J Sports Med. 2010;38(11):2299-2303.
38. Provencher MT, McCormick F, Dewing C, McIntire S, Solomon D. A prospective analysis of 179 type 2 superior labrum anterior and posterior repairs: outcomes and factors associated with success and failure. Am J Sports Med. 2013;41(4):880-886.
39. Denard PJ, Lädermann A, Burkhart SS. Long-term outcome after arthroscopic repair of type II SLAP lesions: results according to age and workers’ compensation status. Arthroscopy. 2012;28(4):451-457.
40. Burns JP, Bahk M, Snyder SJ. Superior labral tears: repair versus biceps tenodesis. J Shoulder Elbow Surg. 2011;20(2 suppl):S2-S8.
41. McCormick F, Nwachukwu BU, Solomon D, et al. The efficacy of biceps tenodesis in the treatment of failed superior labral anterior posterior repairs. Am J Sports Med. 2014;42(4):820-825.
42. Katz LM, Hsu S, Miller SL, et al. Poor outcomes after SLAP repair: descriptive analysis and prognosis. Arthroscopy. 2009;25(8):849-855.
43. Park S, Glousman RE. Outcomes of revision arthroscopic type II superior labral anterior posterior repairs. Am J Sports Med. 2011;39(6):1290-1294.
44. Gupta AK, Bruce B, Klosterman EL, McCormick F, Harris J, Romeo AA. Subpectoral biceps tenodesis for failed type II SLAP repair. Orthopedics. 2013;36(6):e723-e728.
45. Neuman BJ, Boisvert CB, Reiter B, Lawson K, Ciccotti MG, Cohen SB. Results of arthroscopic repair of type II superior labral anterior posterior lesions in overhead athletes: assessment of return to preinjury playing level and satisfaction. Am J Sports Med. 2011;39(9):1883-1888.
46. Fedoriw WW, Ramkumar P, McCulloch PC, Lintner DM. Return to play after treatment of superior labral tears in professional baseball players. Am J Sports Med. 2014;42(5):1155-1160.
47. Park JY, Chung SW, Jeon SH, Lee JG, Oh KS. Clinical and radiological outcomes of type 2 superior labral anterior posterior repairs in elite overhead athletes. Am J Sports Med. 2013;41(6):1372-1379.
48. Schöffl V, Popp D, Dickschass J, Küpper T. Superior labral anterior-posterior lesions in rock climbers—primary double tenodesis? Clin J Sport Med. 2011;21(3):261-263.
49. Chalmers PN, Trombley R, Cip J, et al. Postoperative restoration of upper extremity motion and neuromuscular control during the overhand pitch: evaluation of tenodesis and repair for superior labral anterior-posterior tears. Am J Sports Med. 2014;42(12):2825-2836.
50. Funk L, Snow M. SLAP tears of the glenoid labrum in contact athletes. Clin J Sport Med. 2007;17(1):1-4.
51. Enad JG, Gaines RJ, White SM, Kurtz CA. Arthroscopic superior labrum anterior-posterior repair in military patients. J Shoulder Elbow Surg. 2007;16(3):300-305.
Injuries of the superior labrum–biceps complex (SLBC) have been recognized as a cause of shoulder pain since they were first described by Andrews and colleagues1 in 1985. Superior labrum anterior to posterior (SLAP) tears are relatively uncommon injuries of the shoulder, and their true incidence is difficult to establish. However, recently there has been a significant increase in the reported incidence and operative treatment of SLAP tears.2 SLAP tears can occur in isolation, but they are commonly seen in association with other shoulder lesions, including rotator cuff tear, Bankart lesion, glenohumeral arthritis, acromioclavicular joint pathology, and subacromial impingement.
Although SLAP tears are well described and classified,3-6 our understanding of symptomatic SLAP tears and of their contribution to glenohumeral instability is limited. Diagnosing a SLAP tear on the basis of history and physical examination is a clinical challenge. Pain is the most common presentation of SLAP tears, though localization and characterization of pain are variable and nonspecific.7 The mechanism of injury is helpful in acute presentation (traction injury; fall on outstretched, abducted arm), but an overhead athlete may present with no distinct mechanism other than chronic, repetitive use of the shoulder.8-11 Numerous provocative physical examination tests have been used to assist in the diagnosis of SLAP tear, yet there is no consensus regarding the ideal physical examination test, with high sensitivity, specificity, and accuracy.12-14 Magnetic resonance arthrography, the gold standard imaging modality, is highly sensitive and specific (>95%) for diagnosing SLAP tears.
SLAP tear management is based on lesion type and severity, age, functional demands, and presence of coexisting intra-articular lesions. Management options include nonoperative treatment, débridement or repair of SLBC, biceps tenotomy, and biceps tenodesis.15-19
In this 5-point review, we present an evidence-based analysis of the role of the SLBC in glenohumeral stability and the role of biceps tenodesis in the management of SLAP tears.
1. Role of SLBC in stability of glenohumeral joint
The anatomy of the SLBC has been well described,20,21 and there is consensus that SLBC pathology can be a source of shoulder pain. The superior labrum is relatively more mobile than the rest of the glenoid labrum, and it provides attachment to the long head of the biceps tendon (LHBT) and the superior glenohumeral and middle glenohumeral ligaments.
The functional role of the SLBC in glenohumeral stability and its contribution to the pathogenesis of shoulder instability are not clearly defined. Our understanding of SLBC function is largely derived from simulated cadaveric experiments of SLAP tears. Controlled laboratory studies with simulated type II SLAP tears in cadavers have shown significantly increased glenohumeral translation in the anterior-posterior and superior-inferior directions, suggesting a role of the superior labrum in maintaining glenohumeral stability.22-26 Interestingly, there is conflicting evidence regarding restoration of normal glenohumeral translation in cadaveric shoulders after repair of simulated SLAP lesions in the presence or absence of simulated anterior capsular laxity.22,25-27 However, it is important to understand the limitations of cadaveric experiments in order to appreciate and truly comprehend the results of these experiments. There are inconsistencies in the size of simulated type II SLAP lesions in different studies, which can affect the degree of glenohumeral translation and the results of repair.23-25,28 The amount of glenohumeral translation noticed after simulated SLAP tears in cadavers, though statistically significant, is small in amplitude, and its relevance may not translate to a clinically significant level. The impact of dynamic components of stability (eg, rotator cuff muscles), capsular stretch, and other in vivo variables that affect glenohumeral stability are unaccounted for during cadaveric experiments.
LHBT is a recognized cause of shoulder pain, but its contribution to shoulder stability is a point of continued debate. According to one school of thought, LHBT is a vestigial structure that can be sacrificed without any loss of stability. Another school of thought holds that LHBT is an important active stabilizer of the glenohumeral joint. Cadaveric studies have demonstrated that loading the LHBT decreases glenohumeral translation and rotational range of motion, especially in lower and mid ranges of abduction.23,29,30 Furthermore, LHBT contributes to anterior glenohumeral stability by resisting torsional forces in the abducted and externally rotated shoulder and reducing stress on the inferior glenohumeral ligaments.31-33 Strauss and colleagues22 recently found that simulated anterior and posterior type II SLAP lesions in cadaveric shoulders increased glenohumeral translation in all planes, and biceps tenodesis did not further worsen this abnormal glenohumeral translation. Furthermore, repair of posterior SLAP lesions along with biceps tenodesis restored abnormal glenohumeral translation with no significant difference from the baseline in any plane of motion. Again, the limitations of cadaveric studies should be considered when interpreting these results and applying them clinically.
2. Biceps tenodesis as primary treatment for SLAP tears
A growing body of evidence suggests that primary tenodesis of LHBT may be an effective alternative treatment to SLAP repairs in select patients.34-36 However, the evidence is weak, and high-quality studies comparing SLAP repair and primary biceps tenodesis are required in order to make a strong recommendation for one technique over another. Gupta and colleagues35 retrospectively analyzed 28 cases of concomitant SLAP tear and biceps tendonitis treated with primary open subpectoral biceps tenodesis. There was significant improvement in patients’ functional outcome scores postoperatively [SANE (Single Assessment Numeric Evaluation), ASES (American Shoulder and Elbow Surgeons shoulder index), SST (Simple Shoulder Test), VAS (visual analog scale), and SF-12 (Short Form-12)]. In addition, 80% of patients were satisfied with their outcome. Mean age was 43.7 years. Forty-two percent of patients had a worker’s compensation claim. Interestingly, 15 patients in this cohort had a type I SLAP tear. Boileau and colleagues34 prospectively followed 25 cases of type II SLAP tear treated with either SLAP repair (10 patients; mean age, 37 years) or primary arthroscopic biceps tenodesis (15 patients; mean age, 52 years). Compared with the SLAP repair group, the biceps tenodesis group had significantly higher rates of satisfaction and return to previous level of sports participation. However, group assignments were nonrandomized, and the decision to treat a patient with SLAP repair versus biceps tenodesis was made by the senior surgeon purely on the basis of age (SLAP repair for patients under 30 years). Ek and colleagues36 retrospectively compared the cases of 10 patients who underwent SLAP repair (mean age, 32 years) and 15 who underwent biceps tenodesis (mean age, 47 years) for type II SLAP tear. There was no significant difference between the groups with respect to outcome scores, return to play or preinjury activity level, or complications.
There continues to be significant debate as to which patient will benefit from primary SLAP repair versus biceps tenodesis. Multiple factors are involved: age, presence of associated shoulder pathology, occupation, preinjury activity level, and worker’s compensation status. Age has convincingly been shown to affect the outcomes of treatment of type II SLAP tears.34,35,37-40 There is consensus that patients over age 40 years will benefit from primary biceps tenodesis for SLAP tears. However, the evidence for this recommendation is weak.
3. Biceps tenodesis and failed SLAP repair
The definition of a failed SLAP repair is not well documented in the literature, but dissatisfaction after SLAP repair can result from continued shoulder pain, poor shoulder function, or inability to return to preinjury functional level.15,41 The etiologic determination and treatment of a failed SLAP repair are challenging, and outcomes of revision SLAP repair are not very promising.42,43 Biceps tenodesis has been proposed as an alternative treatment to revision SLAP repair for failed SLAP repair. McCormick and colleagues41 prospectively evaluated 42 patients (mean age, 39.2 years; minimum follow-up, 2 years) with failed type II SLAP repairs that were treated with open subpectoral biceps tenodesis. There was significant improvement in ASES, SANE, and Western Ontario Shoulder Instability Index (WOSI) outcome scores and in postoperative shoulder range of motion at a mean follow-up of 3.6 years. One patient had transient musculocutaneous neurapraxia after surgery. In a retrospective cohort study, Gupta and colleagues44 found significant improvement in ASES, SANE, SST, SF-12, and VAS outcome scores in 11 patients who underwent open subpectoral biceps tenodesis for failed arthroscopic SLAP repair (mean age at surgery, 40 years; mean follow-up, 26 months). Three of the 11 patients had worker’s compensation claims, and there were no complications and no revision surgeries required after biceps tenodesis. Werner and colleagues16 retrospectively evaluated 17 patients who underwent biceps tenodesis for failed SLAP repair (mean age, 39 years; minimum follow-up, 2 years). Twenty-nine percent of patients had worker’s compensation claims. Compared with the contralateral shoulder, the treated shoulder had better postoperative ASES, SANE, SST, and Veteran RAND 36-item health survey outcome scores; range of motion was near normal.
There are no high-quality studies comparing revision SLAP repair and biceps tenodesis in the management of failed SLAP repair.16,41-44 Case series studies have found improved outcomes and pain relief after biceps tenodesis for failed SLAP repair, but the quality of evidence has been poor (level IV evidence).16,41-44 The senior author recommends treating failed SLAP repairs with biceps tenodesis.
4. Biceps tenodesis as treatment option for SLAP tear in overhead throwing athletes
Biceps tenodesis is a potential alternative treatment to SLAP repair in overhead throwing athletes. Although outcome scores and satisfaction rates after SLAP repair are high in overhead athletes, the rates of return to sport are relatively low, especially in baseball players.38,45-47 In a level III cohort study, Boileau and colleagues34 found that 13 (87%) of 15 patients with type II SLAP tears, including 8 overhead athletes, had returned to their previous level of activity by a mean of 30 months after biceps tenodesis. In contrast, only 2 of 10 patients returned to their previous level of activity after SLAP repair. Interestingly, 3 patients who underwent biceps tenodesis for failed SLAP repair returned to overhead sports. Schöffl and colleagues48 reported on the outcomes of biceps tenodesis for SLAP lesions in 6 high-level rock climbers. By a mean follow-up of 6 months, all 6 patients had returned to their previous level of climbing. Their satisfaction rate was 96.8%. Gupta and colleagues35 reported on a cohort of 28 patients who underwent biceps tenodesis for SLAP tears and concomitant biceps tendonitis. Of the 8 athletes in the group, 5 were able to return to their previous level of play, and 1 was able to return to a lower level of sporting activity. There was significant improvement from preoperative to postoperative scores on ASES, SST, SANE, VAS, SF-12 overall, and SF-12 components.
Chalmers and colleagues49 recently described motion analyses with simultaneous surface electromyographic measurements in 18 baseball pitchers. Of these 18 players, 7 were uninjured (controls), 6 were pitching after SLAP repair, and 5 were pitching after subpectoral biceps tenodesis. There were no significant differences between controls and postoperative patients with respect to pitching kinematics. Interestingly, compared with the controls and the patients who underwent open biceps tenodesis, the patients who underwent SLAP repair had altered patterns of thoracic rotation during pitching. However, the clinical significance of this finding and the impact of this finding on pitching efficacy are not currently known.
Biceps tenodesis as a primary procedure for type II SLAP lesion in an overhead athlete is a concept in evolution. Increasing evidence suggests a role for primary biceps tenodesis in an overhead athlete with type II SLAP lesion and concomitant biceps pathology. However, this evidence is of poor quality, and the strength of the recommendation is weak. Still to be determined is whether return to preinjury performance level is better with primary biceps tenodesis or with SLAP repair in overhead athletes with type II SLAP lesion. As per the senior author’s treatment algorithm, we prefer SLAP repair for overhead athletes with type II SLAP tears and reserve biceps tenodesis for cases involving significant biceps pathology and/or clinical symptoms involving the bicipital groove consistent with extra-articular biceps pain.
5. Biceps tenodesis for type II SLAP tear in contact athletes and occupations demanding heavy labor (blue-collar jobs)
SLAP tears are less common in contact athletes, and there is general agreement that SLAP repair outcomes are better in contact athletes than in overhead athletes. In a retrospective review of 18 rugby players with SLAP tears, Funk and Snow50 reported excellent results and quicker return to sport after SLAP repair. Patients with isolated SLAP tears had the earliest return to play. Enad and colleagues51 reported SLAP repair outcomes in an active military population. SLAP tears are more common in the military versus the general population because of the unique physical demands placed on military personnel. The authors retrospectively reviewed 27 cases of type II SLAP tears treated with SLAP repair and suture anchors. Outcomes were measured at a mean of 30.5 months after surgery. Twenty-four (89%) of the 27 patients had good to excellent results, and 94% had returned to active duty by a mean of 4.4 months after SLAP repair.
Given the poor-quality evidence in the literature, we believe that biceps tenodesis should be reserved for revision surgery in contact athletes. There is insufficient evidence to recommend biceps tenodesis as primary treatment for type II SLAP tears in contact athletes. SLAP repair should be performed for primary SLAP lesions in contact athletes and for patients in physically demanding professions (eg, military, laborer, weightlifter).
Conclusion
SLAP tears can result in persistent shoulder pain and dysfunction. SLAP tear management depends on lesion type and severity, age, and functional demands. SLAP repair is the treatment of choice for type II SLAP lesions in young, active patients. Biceps tenodesis is a preferred alternative to SLAP repair in failed SLAP repair and in type II SLAP patients who are older than 40 years and who are less active and have a worker’s compensation claim. These recommendations are based on poor-quality evidence. There is an unmet need for randomized clinical studies comparing SLAP repair with biceps tenodesis for type II SLAP tears in different patient populations so as to optimize the current decision-making algorithm for SLAP tears.
1. Andrews JR, Carson WG Jr, McLeod WD. Glenoid labrum tears related to the long head of the biceps. Am J Sports Med. 1985;13(5):337-341.
2. Weber SC, Martin DF, Seiler JG 3rd, Harrast JJ. Superior labrum anterior and posterior lesions of the shoulder: incidence rates, complications, and outcomes as reported by American Board of Orthopaedic Surgery. Part II candidates. Am J Sports Med. 2012;40(7):1538-1543.
3. Snyder SJ, Karzel RP, Del Pizzo W, Ferkel RD, Friedman MJ. SLAP lesions of the shoulder. Arthroscopy. 1990;6(4):274-279.
4. Morgan CD, Burkhart SS, Palmeri M, Gillespie M. Type II SLAP lesions: three subtypes and their relationships to superior instability and rotator cuff tears. Arthroscopy. 1998;14(6):553-565.
5. Powell SE, Nord KD, Ryu RKN. The diagnosis, classification, and treatment of SLAP lesions. Oper Tech Sports Med. 2012;20(1):46-56.
6. Maffet MW, Gartsman GM, Moseley B. Superior labrum-biceps tendon complex lesions of the shoulder. Am J Sports Med. 1995;23(1):93-98.
7. Kim TK, Queale WS, Cosgarea AJ, McFarland EG. Clinical features of the different types of SLAP lesions: an analysis of one hundred and thirty-nine cases. J Bone Joint Surg Am. 2003;85(1):66-71.
8. Abrams GD, Safran MR. Diagnosis and management of superior labrum anterior posterior lesions in overhead athletes. Br J Sports Med. 2010;44(5):311-318.
9. Keener JD, Brophy RH. Superior labral tears of the shoulder: pathogenesis, evaluation, and treatment. J Am Acad Orthop Surg. 2009;17(10):627-637.
10. Abrams GD, Hussey KE, Harris JD, Cole BJ. Clinical results of combined meniscus and femoral osteochondral allograft transplantation: minimum 2-year follow-up. Arthroscopy. 2014;30(8):964-970.e1.
11. Burkhart SS, Morgan CD, Kibler WB. The disabled throwing shoulder: spectrum of pathology part I: pathoanatomy and biomechanics. Arthroscopy. 2003;19(4):404-420.
12. Virk MS, Arciero RA. Superior labrum anterior to posterior tears and glenohumeral instability. Instr Course Lect. 2013;62:501-514.
13. Calvert E, Chambers GK, Regan W, Hawkins RH, Leith JM. Special physical examination tests for superior labrum anterior posterior shoulder tears are clinically limited and invalid: a diagnostic systematic review. J Clin Epidemiol. 2009;62(5):558-563.
14. Jones GL, Galluch DB. Clinical assessment of superior glenoid labral lesions: a systematic review. Clin Orthop Relat Res. 2007;455:45-51.
15. Werner BC, Brockmeier SF, Miller MD. Etiology, diagnosis, and management of failed SLAP repair. J Am Acad Orthop Surg. 2014;22(9):554-565.
16. Werner BC, Pehlivan HC, Hart JM, et al. Biceps tenodesis is a viable option for salvage of failed SLAP repair. J Shoulder Elbow Surg. 2014;23(8):e179-e184.
17. Erickson J, Lavery K, Monica J, Gatt C, Dhawan A. Surgical treatment of symptomatic superior labrum anterior-posterior tears in patients older than 40 years: a systematic review. Am J Sports Med. 2015;43(5):1274-1282.
18. Huri G, Hyun YS, Garbis NG, McFarland EG. Treatment of superior labrum anterior posterior lesions: a literature review. Acta Orthop Traumatol Turc. 2014;48(3):290-297.
19. Li X, Lin TJ, Jager M, et al. Management of type II superior labrum anterior posterior lesions: a review of the literature. Orthop Rev. 2010;2(1):e6.
20. Cooper DE, Arnoczky SP, O’Brien SJ, Warren RF, DiCarlo E, Allen AA. Anatomy, histology, and vascularity of the glenoid labrum. An anatomical study. J Bone Joint Surg Am. 1992;74(1):46-52.
21. Vangsness CT, Jorgenson SS, Watson T, Johnson DL. The origin of the long head of the biceps from the scapula and glenoid labrum. An anatomical study of 100 shoulders. J Bone Joint Surg Br. 1994;76(6):951-954.
22. Strauss EJ, Salata MJ, Sershon RA, et al. Role of the superior labrum after biceps tenodesis in glenohumeral stability. J Shoulder Elbow Surg. 2014;23(4):485-491.
23. Pagnani MJ, Deng XH, Warren RF, Torzilli PA, Altchek DW. Effect of lesions of the superior portion of the glenoid labrum on glenohumeral translation. J Bone Joint Surg Am. 1995;77(7):1003-1010.
24. McMahon PJ, Burkart A, Musahl V, Debski RE. Glenohumeral translations are increased after a type II superior labrum anterior-posterior lesion: a cadaveric study of severity of passive stabilizer injury. J Shoulder Elbow Surg. 2004;13(1):39-44.
25. Burkart A, Debski R, Musahl V, McMahon P, Woo SL. Biomechanical tests for type II SLAP lesions of the shoulder joint before and after arthroscopic repair [in German]. Orthopade. 2003;32(7):600-607.
26. Panossian VR, Mihata T, Tibone JE, Fitzpatrick MJ, McGarry MH, Lee TQ. Biomechanical analysis of isolated type II SLAP lesions and repair. J Shoulder Elbow Surg. 2005;14(5):529-534.
27. Mihata T, McGarry MH, Tibone JE, Fitzpatrick MJ, Kinoshita M, Lee TQ. Biomechanical assessment of type II superior labral anterior-posterior (SLAP) lesions associated with anterior shoulder capsular laxity as seen in throwers: a cadaveric study. Am J Sports Med. 2008;36(8):1604-1610.
28. Youm T, Tibone JE, ElAttrache NS, McGarry MH, Lee TQ. Simulated type II superior labral anterior posterior lesions do not alter the path of glenohumeral articulation: a cadaveric biomechanical study. Am J Sports Med. 2008;36(4):767-774.
29. Youm T, ElAttrache NS, Tibone JE, McGarry MH, Lee TQ. The effect of the long head of the biceps on glenohumeral kinematics. J Shoulder Elbow Surg. 2009;18(1):122-129.
30. McGarry MH, Nguyen ML, Quigley RJ, Hanypsiak B, Gupta R, Lee TQ. The effect of long and short head biceps loading on glenohumeral joint rotational range of motion and humeral head position [published online ahead of print September 26, 2014]. Knee Surg Sports Traumatol Arthrosc.
31. Glousman R, Jobe F, Tibone J, Moynes D, Antonelli D, Perry J. Dynamic electromyographic analysis of the throwing shoulder with glenohumeral instability. J Bone Joint Surg Am. 1988;70(2):220-226.
32. Gowan ID, Jobe FW, Tibone JE, Perry J, Moynes DR. A comparative electromyographic analysis of the shoulder during pitching. Professional versus amateur pitchers. Am J Sports Med. 1987;15(6):586-590.
33. Rodosky MW, Harner CD, Fu FH. The role of the long head of the biceps muscle and superior glenoid labrum in anterior stability of the shoulder. Am J Sports Med. 1994;22(1):121-130.
34. Boileau P, Parratte S, Chuinard C, Roussanne Y, Shia D, Bicknell R. Arthroscopic treatment of isolated type II SLAP lesions: biceps tenodesis as an alternative to reinsertion. Am J Sports Med. 2009;37(5):929-936.
35. Gupta AK, Chalmers PN, Klosterman EL, et al. Subpectoral biceps tenodesis for bicipital tendonitis with SLAP tear. Orthopedics. 2015;38(1):e48-e53.
36. Ek ET, Shi LL, Tompson JD, Freehill MT, Warner JJ. Surgical treatment of isolated type II superior labrum anterior-posterior (SLAP) lesions: repair versus biceps tenodesis. J Shoulder Elbow Surg. 2014;23(7):1059-1065.
37. Alpert JM, Wuerz TH, O’Donnell TF, Carroll KM, Brucker NN, Gill TJ. The effect of age on the outcomes of arthroscopic repair of type II superior labral anterior and posterior lesions. Am J Sports Med. 2010;38(11):2299-2303.
38. Provencher MT, McCormick F, Dewing C, McIntire S, Solomon D. A prospective analysis of 179 type 2 superior labrum anterior and posterior repairs: outcomes and factors associated with success and failure. Am J Sports Med. 2013;41(4):880-886.
39. Denard PJ, Lädermann A, Burkhart SS. Long-term outcome after arthroscopic repair of type II SLAP lesions: results according to age and workers’ compensation status. Arthroscopy. 2012;28(4):451-457.
40. Burns JP, Bahk M, Snyder SJ. Superior labral tears: repair versus biceps tenodesis. J Shoulder Elbow Surg. 2011;20(2 suppl):S2-S8.
41. McCormick F, Nwachukwu BU, Solomon D, et al. The efficacy of biceps tenodesis in the treatment of failed superior labral anterior posterior repairs. Am J Sports Med. 2014;42(4):820-825.
42. Katz LM, Hsu S, Miller SL, et al. Poor outcomes after SLAP repair: descriptive analysis and prognosis. Arthroscopy. 2009;25(8):849-855.
43. Park S, Glousman RE. Outcomes of revision arthroscopic type II superior labral anterior posterior repairs. Am J Sports Med. 2011;39(6):1290-1294.
44. Gupta AK, Bruce B, Klosterman EL, McCormick F, Harris J, Romeo AA. Subpectoral biceps tenodesis for failed type II SLAP repair. Orthopedics. 2013;36(6):e723-e728.
45. Neuman BJ, Boisvert CB, Reiter B, Lawson K, Ciccotti MG, Cohen SB. Results of arthroscopic repair of type II superior labral anterior posterior lesions in overhead athletes: assessment of return to preinjury playing level and satisfaction. Am J Sports Med. 2011;39(9):1883-1888.
46. Fedoriw WW, Ramkumar P, McCulloch PC, Lintner DM. Return to play after treatment of superior labral tears in professional baseball players. Am J Sports Med. 2014;42(5):1155-1160.
47. Park JY, Chung SW, Jeon SH, Lee JG, Oh KS. Clinical and radiological outcomes of type 2 superior labral anterior posterior repairs in elite overhead athletes. Am J Sports Med. 2013;41(6):1372-1379.
48. Schöffl V, Popp D, Dickschass J, Küpper T. Superior labral anterior-posterior lesions in rock climbers—primary double tenodesis? Clin J Sport Med. 2011;21(3):261-263.
49. Chalmers PN, Trombley R, Cip J, et al. Postoperative restoration of upper extremity motion and neuromuscular control during the overhand pitch: evaluation of tenodesis and repair for superior labral anterior-posterior tears. Am J Sports Med. 2014;42(12):2825-2836.
50. Funk L, Snow M. SLAP tears of the glenoid labrum in contact athletes. Clin J Sport Med. 2007;17(1):1-4.
51. Enad JG, Gaines RJ, White SM, Kurtz CA. Arthroscopic superior labrum anterior-posterior repair in military patients. J Shoulder Elbow Surg. 2007;16(3):300-305.
CPR Prior to Defibrillation for VF/VT CPA
Cardiopulmonary arrest (CPA) is a major contributor to overall mortality in both the in‐ and out‐of‐hospital setting.[1, 2, 3] Despite advances in the field of resuscitation science, mortality from CPA remains high.[1, 4] Unlike the out‐of‐hospital environment, inpatient CPA is unique, as trained healthcare providers are the primary responders with a range of expertise available throughout the duration of arrest.
There are inherent opportunities of in‐hospital cardiac arrest that exist, such as the opportunity for near immediate arrest detection, rapid initiation of high‐quality chest compressions, and early defibrillation if indicated. Given the association between improved rates of successful defibrillation and high‐quality chest compressions, the 2005 American Heart Association (AHA) updates changed the recommended guideline ventricular fibrillation/ventricular tachycardia (VF/VT) defibrillation sequence from 3 stacked shocks to a single shock followed by 2 minutes of chest compressions between defibrillation attempts.[5, 6] However, the recommendations were directed primarily at cases of out‐of‐hospital VF/VT CPA, and it currently remains unclear as to whether this strategy offers any advantage to patients who suffer an in‐hospital VF/VT arrest.[7]
Despite the aforementioned findings regarding the benefit of high‐quality chest compressions, there is a paucity of evidence in the medical literature to support whether delivering a period of chest compressions before defibrillation attempt, including initial shock and shock sequence, translate to improved outcomes. With the exception of the statement recommending early defibrillation in case of in‐hospital arrest, there are no formal AHA consensus recommendations.[5, 8, 9] Here we document our experience using the approach of expedited stacked defibrillation shocks in persons experiencing monitored in‐hospital VF/VT arrest.
METHODS
Design
This was a retrospective study of observational data from our in‐hospital resuscitation database. Waiver of informed consent was granted by our institutional investigational review board.
Setting
This study was performed in the University of California San Diego Healthcare System, which includes 2 urban academic hospitals, with a combined total of approximately 500 beds. A designated team is activated in response to code blue requests and includes: code registered nurse (RN), code doctor of medicine (MD), airway MD, respiratory therapist, pharmacist, house nursing supervisor, primary RN, and unit charge RN. Crash carts with defibrillators (ZOLL R and E series; ZOLL Medical Corp., Chelmsford, MA) are located on each inpatient unit. Defibrillator features include real‐time cardiopulmonary resuscitation (CPR) feedback, filtered electrocardiography (ECG), and continuous waveform capnography.
Resuscitation training is provided for all hospital providers as part of the novel Advanced Resuscitation Training (ART) program, which was initiated in 2007.[10] Critical care nurses and physicians receive annual training, whereas noncritical care personnel undergo biennial training. The curriculum is adaptable to institutional treatment algorithms, equipment, and code response. Content is adaptive based on provider type, unit, and opportunities for improvement as revealed by performance improvement data. Resuscitation treatment algorithms are reviewed annually by the Critical Care Committee and Code Blue Subcommittee as part of the ART program, with modifications incorporated into the institutional policies and procedures.
Subjects
All admitted patients with continuous cardiac monitoring who suffered VF/VT arrest between July 2005 and June 2013 were included in this analysis. Patients with active do not attempt resuscitation orders were excluded. Patients were identified from our institutional resuscitation database, into which all in‐hospital cardiopulmonary arrest data are entered. We did not have data on individual patient comorbidity or severity of illness. Overall patient acuity over the course of the study was monitored hospital wide through case‐mix index (CMI). The index is based upon the allocation of hospital resources used to treat a diagnosis‐related group of patients and has previously been used as a surrogate for patient acuity.[11, 12, 13] The code RN who performed the resuscitation is responsible for entering data into a protected performance improvement database. Telecommunications records and the unit log are cross‐referenced to assure complete capture.
Protocols
Specific protocol similarities and differences among the 3 study periods are presented in Table 1.
| Protocol Variable | Stack Shock Period (20052008) | Initial Chest Compression Period (20082011) | Modified Stack Shock Period (20112013) |
|---|---|---|---|
| |||
| Defibrillator type | Medtronic/Physio Control LifePak 12 | Zoll E Series | Zoll E Series |
| Joule increment with defibrillation | 200J‐300J‐360J, manual escalation | 120J‐150J‐200J, manual escalation | 120J‐150J‐200J, automatic escalation |
| Distinction between monitored and unmonitored in‐hospital cardiopulmonary arrest | No | Yes | Yes |
| Chest compressions prior to initial defibrillation | No | Yes | No* |
| Initial defibrillation strategy | 3 expedited stacked shocks with a brief pause between each single defibrillation attempt to confirm sustained VF/VT | 2 minutes of chest compressions prior to initial and in between attempts | 3 expedited stacked shocks with a brief pause between each single defibrillation attempt to confirm sustained VF/VT* |
| Chest compression to ventilation ratio | 15:1 | Continuous chest compressions with ventilation at ratio 10:1 | Continuous chest compressions with ventilation at ratio 10:1 |
| Vasopressors | Epinephrine 1 mg IV/IO every 35 minutes. | Epinephrine 1 mg IV/IO or vasopressin 40 units IV/IO every 35 minutes | Epinephrine 1 mg IV/IO or vasopressin 40 units IV/IO every 35 minutes. |
Stacked Shock Period (20052008)
Historically, our institutional cardiopulmonary arrest protocols advocated early defibrillation with administration of 3 stacked shocks with a brief pause between each single defibrillation attempt to confirm sustained VF/VT before initiating/resuming chest compressions.
Initial Chest Compression Period (20082011)
In 2008 the protocol was modified to reflect recommendations to perform a 2‐minute period of chest compressions prior to each defibrillation, including the initial attempt.
Modified Stacked Shack Period (20112013)
Finally, in 2011 the protocol was modified again, and defibrillators were configured to allow automatic advancement of defibrillation energy (120J‐150J‐200J). The defibrillation protocol included the following elements.
For an unmonitored arrest, chest compressions and ventilations should be initiated upon recognition of cardiopulmonary arrest. If VF/VT was identified upon placement of defibrillator pads, immediate counter shock was performed and chest compressions resumed immediately for a period of 2 minutes before considering a repeat defibrillation attempt. A dose of epinephrine (1 mg intravenous [IV]/emntraosseous [IO]) or vasopressin (40 units IV/IO) was administered as close to the reinitiation of chest compressions as possible. Defibrillation attempts proceeded with a single shock at a time, each preceded by 2 minutes of chest compressions.
For a monitored arrest, defibrillation attempts were expedited. Chest compressions without ventilations were initiated only until defibrillator pads were placed. Defibrillation attempts were initiated as soon as possible, with at least 3 or more successive shocks administered for persistent VF/VT (stacked shocks). Compressions were performed between shocks if they did not interfere with rhythm analysis. Compressions resumed following the initial series of stacked shocks with persistent CPA, regardless of rhythm, and pressors administered (epinephrine 1 mg IV or vasopressin 40 units IV). Persistent VF/VT received defibrillation attempts every 2 minutes following the initial series of stacked shocks, with compressions performed continuously between attempts. Persistent VF/VT should trigger emergent cardiology consultation for possible emergent percutaneous intervention.
Analysis
The primary outcome measure was defined as survival to hospital discharge at baseline and following each protocol change. 2 was used to compare the 3 time periods, with P < 0.05 defined as statistically significant. Specific group comparisons were made with Bonferroni correction, with P < 0.017 defined as statistically significant. Secondary outcome measures included return of spontaneous circulation (ROSC) and number of shocks required. Demographic and clinical data were also presented for each of the 3 study periods.
RESULTS
A total of 661 cardiopulmonary arrests of all rhythms were identified during the entire study period. Primary VF/VT arrests was identified in 106 patients (16%). Of these, 102 (96%) were being monitored with continuous ECG at the time of arrest. Demographic and clinical information for the entire study cohort are displayed in Table 2. There were no differences in age, gender, time of arrest, and location of arrest between study periods (all P > 0.05). The incidence of VF/VT arrest did not vary significantly between the study periods (P = 0.16). There were no differences in mean number of defibrillation attempts per arrest; however, there was a significant improvement in the rate of perfusing rhythm after initial set of defibrillation attempts and overall ROSC favoring stacked shocks (all P < 0.05, Table 2). Survival‐to‐hospital discharge for all VF/VT arrest victims decreased, then increased significantly from the stacked shock period to initial chest compression period to modified stacked shock period (58%, 18%, 71%, respectively, P < 0.01, Figure 1). After Bonferroni correction, specific group differences were significant between the stacked shock and initial chest compression groups (P < 0.01) and modified stacked shocks and initial chest compression groups (P < 0.01, Table 2). Finally, the incidence of bystander CPR appeared to be significantly greater in the modified stacked shock period following implementation of our resuscitation program (Table 2). Overall hospital CMI for fiscal years 2005/2006 through 2012/2013 were significantly different (1.47 vs 1.71, P < 0.0001).
| Parameter | Stacked Shocks (n = 31) | Initial Chest Compressions (n = 33) | Modified Stack Shocks (n = 42) |
|---|---|---|---|
| |||
| Age (y) | 54.3 | 64.3 | 59.8 |
| Male gender (%) | 16 (52) | 21 (64) | 21 (50) |
| VF/PVT arrest incidence (per 1,000 admissions) | 0.49 | 0.70 | |
| Arrest 7 am5 pm (%) | 15 (48) | 17 (52) | 21 (50) |
| Non‐ICU location (%) | 13 (42) | 15 (45) | 17 (40) |
| CPR prior to code team arrival (%) | 22 (71)* | 31 (94) | 42 (100) |
| Perfusing rhythm after initial set of defibrillation attempts (%) | 37 | 33 | 70 |
| Mean defibrillation attempts (no.) | 1.3 | 1.8 | 1.5 |
| ROSC (%) | 76 | 56 | 90 |
| Survival‐to‐hospital discharge (%) | 18 (58) | 6 (18) | 30 (71) |
| Case‐mix index (average coefficient by period) | 1.51 | 1.60 | 1.69∥ |
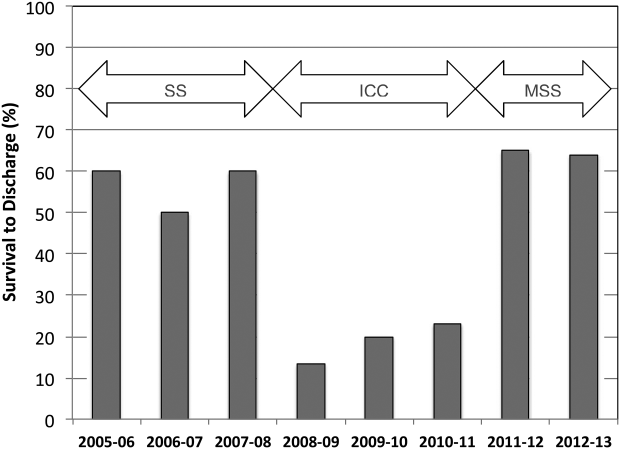
DISCUSSION
The specific focus of this observation was to report on defibrillation strategies that have previously only been reported in an out‐of‐hospital setting. There is no current consensus regarding chest compressions for a predetermined amount of time prior to defibrillation in an inpatient setting. Here we present data suggesting improved outcomes using an approach that expedited defibrillation and included a defibrillation strategy of stacked shocks (stacked shock and modified stack shock, respectively) in monitored inpatient VF/VT arrest.
Early out‐of‐hospital studies initially demonstrated a significant survival benefit for patients who received 1.5 to 3 minutes of chest compressions preceding defibrillation with reported arrest downtimes of 4 to 5 minutes prior to emergency medical services arrival.[14, 15] However, in more recent randomized controlled trials, outcome was not improved when chest compressions were performed prior to defibrillation attempt.[16, 17] Our findings suggest that there is no one size fits all approach to chest compression and defibrillation strategy. Instead, we suggest that factors including whether the arrest occurred while monitored or not aid with decision making and timing of defibrillation.
Our findings favoring expedited defibrillation and stacked shocks in witnessed arrest are consistent with the 3‐phase model of cardiac arrest proposed by Weisfeldt and Becker suggesting that defibrillation success is related to the energy status of the heart.[18] In this model, the first 4 minutes of VF arrest (electrical phase) are characterized by a high‐energy state with higher adenosine triphosphate (ATP)/adenosine monophosphate (AMP) ratios that are associated with increased likelihood for ROSC after defibrillation attempt.[19] Further, VF appears to deplete ATP/AMP ratios after about 4 minutes, at which point the likelihood of defibrillation success is substantially diminished.[18] Between 4 and 10 minutes (circulatory phase), energy stores in the myocardium are severely depleted. However, there is evidence to suggest that high‐quality chest compressions and high chest compression fractionparticularly in conjunction with epinephrinecan replenish ATP stores and increase the likelihood of defibrillation success.[6, 20] Beyond 10 minutes (metabolic phase), survival rates are abysmal, with no therapy yet identified producing clinical utility.
The secondary analyses reveal several interesting trends. We anticipated a higher number of defibrillation attempts during phase II due to a lower likelihood of conversion with a CPR‐first approach. Instead, the number of shocks was similar across all 3 periods. Our findings are consistent with previous reports of a low single or first shock probability of successful defibrillation. However, recent reports document that approximately 80% of patients who ultimately survive to discharge are successfully defibrillated within the first 3 shocks.[21, 22, 23]
It appears that the likelihood of conversion to a perfusing rhythm is higher with expedited, stacked shocks. This underscores the importance of identifying an optimal approach to the treatment of VF/VT, as the initial series of defibrillation attempts may determine outcomes. There also appeared to be an increase in the incidence of VF/VT during the modified stack shock period, although this was not statistically significant. The modified stack shock period correlated temporally with the expansion of our institution's cardiovascular service and the opening of a dedicated inpatient facility, which likely influenced our mixture of inpatients.
These data should be interpreted with consideration of study limitations. Primarily, we did not attempt to determine arrest times prior to initial defibrillation attempts, which is likely an important variable. However, we limited our population studied only to individuals experiencing VF/VT arrest that was witnessed by hospital care staff or occurred while on cardiac monitor. We are confident that these selective criteria resulted in expedited identification and response times well within the electrical phase. We did not evaluate differences or changes in individual patient‐level severity of illness that may have potentially confounded outcome analysis. The effect of individual level in severity of illness and comorbidity are not known. Instead, we used CMI coefficients to explore hospital wide changes in patient acuity during the study period. We noticed an increasing case‐mix coefficient value suggesting higher patient acuity, which would predict increased mortality rather than the decrease noted between the initial chest compression and modified stacked shock periods (Table 2). In addition, we did not integrate CPR process variables, such as depth, rate, recoil, chest compression fraction, and per‐shock pauses, into this analysis. Our previous studies indicated that high‐quality CPR may account for a significant amount of improvement in outcomes following our novel resuscitation program implementation in 2007.[10, 24] Since the program's inception, we have reported continuous improvement in overall in‐hospital mortality that was sustained throughout the duration of the study period despite the significant changes reported in the 3 periods with monitored VF/VT arrest.[10] The use of medications prior to initial defibrillation attempts was not recorded. We have recently reported that during the same period of data collection, there were no significant changes in the use of epinephrine; however, there was a significant increase in the use of vasopressin.[10] It is unclear whether the increased use of vasopressin contributed to the current outcomes. However, given our cohort of witnessed in‐hospital cardiac arrests with an initial shockable rhythm, we anticipate the use of vasopressors as unlikely prior to defibrillation attempt.
Additional important limitations and potential confounding factors in this study were the use of 2 different types of defibrillators, differing escalating energy strategies, and differing defibrillator waveforms. Recent evidence supports biphasic waveforms as more effective than monophasic waveforms.[25, 26, 27] Comparison of defibrillator brand and waveform superiority is out the scope of this study; however, it is interesting to note similar high rates of survival in the stacked shock and modified stack shock phases despite use of different defibrillator brands and waveforms during those respective phases. Regarding escalating energy of defibrillation countershocks, the most recent 2010 AHA guidelines have no position on the superiority of either manual or automatic escalation.[7] However, we noted similar high rates of survival in the stacked shock and modified stack shock periods despite use of differing escalating strategies. Finally, we used survival‐to‐hospital discharge as our main outcome measure rather than neurological status. However, prior studies from our institution suggest that most VF/VT survivors have good neurological outcomes, which are influenced heavily by preadmission functional status.[24]
CONCLUSIONS
Our data suggest that in cases of monitored VF/VT arrest, expeditious defibrillation with use of stacked shocks is associated with a higher rate of ROSC and survival to hospital discharge
Disclosure: Nothing to report.
- , , , et al. Strategies for improving survival after in‐hospital cardiac arrest in the United States: 2013 consensus recommendations: a consensus statement from the American Heart Association. Circulation. 2013;127:1538–1563.
- , , , et al. Survival from in‐hospital cardiac arrest during nights and weekends. JAMA. 2008;299:785–792.
- , , , et al. Heart disease and stroke statistics—2008 update: a report from the American Heart Association Statistics Committee and Stroke Statistics Subcommittee. Circulation. 2008;117:e25–e146.
- , , , . Predictors of survival from out‐of‐hospital cardiac arrest: a systematic review and meta‐analysis. Circ Cardiovasc Qual Outcomes. 2010;3:63–81.
- , , , et al. Quality of cardiopulmonary resuscitation during in‐hospital cardiac arrest. JAMA. 2005;293:305–310.
- , , , et al. Chest compression fraction determines survival in patients with out‐of‐hospital ventricular fibrillation. Circulation. 2009;120:1241–1247.
- , , , et al. Part 6: Defibrillation: 2010 International Consensus on Cardiopulmonary Resuscitation and Emergency Cardiovascular Care Science With Treatment Recommendations. Circulation. 2010;122:S325–S337.
- , , , et al. Part 1: executive summary: 2010 American Heart Association Guidelines for Cardiopulmonary Resuscitation and Emergency Cardiovascular Care. Circulation. 2010;122:S640—S656.
- , , , et al. Part 8: adult advanced cardiovascular life support: 2010 American Heart Association Guidelines for Cardiopulmonary Resuscitation and Emergency Cardiovascular Care. Circulation. 2010;122:S729–S767.
- , , , et al. A performance improvement‐based resuscitation programme reduces arrest incidence and increases survival from in‐hospital cardiac arrest. Resuscitation. 2015;92:63–69.
- . The evolution of case‐mix measurement using DRGs: past, present and future. Stud Health Technol Inform. 1994;14:75–83.
- , , , et al. Variability in case‐mix adjusted in‐hospital cardiac arrest rates. Med Care. 2012;50:124–130.
- , , , , . Impact of socioeconomic adjustment on physicians' relative cost of care. Med Care. 2013;51:454–460.
- , , , et al. Influence of cardiopulmonary resuscitation prior to defibrillation in patients with out‐of‐hospital ventricular fibrillation. JAMA. 1999;281:1182–1188.
- , , , et al. Delaying defibrillation to give basic cardiopulmonary resuscitation to patients with out‐of‐hospital ventricular fibrillation: a randomized trial. JAMA. 2003;289:1389–1395.
- , , , et al. Defibrillation or cardiopulmonary resuscitation first for patients with out‐of‐hospital cardiac arrests found by paramedics to be in ventricular fibrillation? A randomised control trial. Resuscitation. 2008;79:424–431.
- , , , . CPR before defibrillation in out‐of‐hospital cardiac arrest: a randomized trial. Emerg Med Australas. 2005;17:39–45.
- , . Resuscitation after cardiac arrest: a 3‐phase time‐sensitive model. JAMA. 2002;288:3035–3038.
- , , , , . Association of intramyocardial high energy phosphate concentrations with quantitative measures of the ventricular fibrillation electrocardiogram waveform. Resuscitation. 2009;80:946–950.
- , , , et al. Ventricular fibrillation median frequency may not be useful for monitoring during cardiac arrest treated with endothelin‐1 or epinephrine. Anesth Analg. 2004;99:1787–1793, table of contents.
- , , , , . “Probability of successful defibrillation” as a monitor during CPR in out‐of‐hospital cardiac arrested patients. Resuscitation. 2015;48:245–254.
- , , , . Shockable rhythms and defibrillation during in‐hospital pediatric cardiac arrest. Resuscitation. 2014;85:387–391.
- , , , . Beyond the pre‐shock pause: the effect of prehospital defibrillation mode on CPR interruptions and return of spontaneous circulation. Resuscitation. 2013;84:575–579.
- , , . Implementing a “resuscitation bundle” decreases incidence and improves outcomes in inpatient cardiopulmonary arrest. Circulation 2009;120(18 Suppl):S1441.
- , , , et al. Multicenter, randomized, controlled trial of 150‐J biphasic shocks compared with 200‐ to 360‐J monophasic shocks in the resuscitation of out‐of‐hospital cardiac arrest victims. Optimized Response to Cardiac Arrest (ORCA) Investigators. Circulation. 2000;102:1780–1787.
- , , , , . A prospective, randomised and blinded comparison of first shock success of monophasic and biphasic waveforms in out‐of‐hospital cardiac arrest. Resuscitation. 2003;58:17–24.
- , , , et al. Out‐of‐hospital cardiac arrest rectilinear biphasic to monophasic damped sine defibrillation waveforms with advanced life support intervention trial (ORBIT). Resuscitation. 2005;66:149–157.
Cardiopulmonary arrest (CPA) is a major contributor to overall mortality in both the in‐ and out‐of‐hospital setting.[1, 2, 3] Despite advances in the field of resuscitation science, mortality from CPA remains high.[1, 4] Unlike the out‐of‐hospital environment, inpatient CPA is unique, as trained healthcare providers are the primary responders with a range of expertise available throughout the duration of arrest.
There are inherent opportunities of in‐hospital cardiac arrest that exist, such as the opportunity for near immediate arrest detection, rapid initiation of high‐quality chest compressions, and early defibrillation if indicated. Given the association between improved rates of successful defibrillation and high‐quality chest compressions, the 2005 American Heart Association (AHA) updates changed the recommended guideline ventricular fibrillation/ventricular tachycardia (VF/VT) defibrillation sequence from 3 stacked shocks to a single shock followed by 2 minutes of chest compressions between defibrillation attempts.[5, 6] However, the recommendations were directed primarily at cases of out‐of‐hospital VF/VT CPA, and it currently remains unclear as to whether this strategy offers any advantage to patients who suffer an in‐hospital VF/VT arrest.[7]
Despite the aforementioned findings regarding the benefit of high‐quality chest compressions, there is a paucity of evidence in the medical literature to support whether delivering a period of chest compressions before defibrillation attempt, including initial shock and shock sequence, translate to improved outcomes. With the exception of the statement recommending early defibrillation in case of in‐hospital arrest, there are no formal AHA consensus recommendations.[5, 8, 9] Here we document our experience using the approach of expedited stacked defibrillation shocks in persons experiencing monitored in‐hospital VF/VT arrest.
METHODS
Design
This was a retrospective study of observational data from our in‐hospital resuscitation database. Waiver of informed consent was granted by our institutional investigational review board.
Setting
This study was performed in the University of California San Diego Healthcare System, which includes 2 urban academic hospitals, with a combined total of approximately 500 beds. A designated team is activated in response to code blue requests and includes: code registered nurse (RN), code doctor of medicine (MD), airway MD, respiratory therapist, pharmacist, house nursing supervisor, primary RN, and unit charge RN. Crash carts with defibrillators (ZOLL R and E series; ZOLL Medical Corp., Chelmsford, MA) are located on each inpatient unit. Defibrillator features include real‐time cardiopulmonary resuscitation (CPR) feedback, filtered electrocardiography (ECG), and continuous waveform capnography.
Resuscitation training is provided for all hospital providers as part of the novel Advanced Resuscitation Training (ART) program, which was initiated in 2007.[10] Critical care nurses and physicians receive annual training, whereas noncritical care personnel undergo biennial training. The curriculum is adaptable to institutional treatment algorithms, equipment, and code response. Content is adaptive based on provider type, unit, and opportunities for improvement as revealed by performance improvement data. Resuscitation treatment algorithms are reviewed annually by the Critical Care Committee and Code Blue Subcommittee as part of the ART program, with modifications incorporated into the institutional policies and procedures.
Subjects
All admitted patients with continuous cardiac monitoring who suffered VF/VT arrest between July 2005 and June 2013 were included in this analysis. Patients with active do not attempt resuscitation orders were excluded. Patients were identified from our institutional resuscitation database, into which all in‐hospital cardiopulmonary arrest data are entered. We did not have data on individual patient comorbidity or severity of illness. Overall patient acuity over the course of the study was monitored hospital wide through case‐mix index (CMI). The index is based upon the allocation of hospital resources used to treat a diagnosis‐related group of patients and has previously been used as a surrogate for patient acuity.[11, 12, 13] The code RN who performed the resuscitation is responsible for entering data into a protected performance improvement database. Telecommunications records and the unit log are cross‐referenced to assure complete capture.
Protocols
Specific protocol similarities and differences among the 3 study periods are presented in Table 1.
| Protocol Variable | Stack Shock Period (20052008) | Initial Chest Compression Period (20082011) | Modified Stack Shock Period (20112013) |
|---|---|---|---|
| |||
| Defibrillator type | Medtronic/Physio Control LifePak 12 | Zoll E Series | Zoll E Series |
| Joule increment with defibrillation | 200J‐300J‐360J, manual escalation | 120J‐150J‐200J, manual escalation | 120J‐150J‐200J, automatic escalation |
| Distinction between monitored and unmonitored in‐hospital cardiopulmonary arrest | No | Yes | Yes |
| Chest compressions prior to initial defibrillation | No | Yes | No* |
| Initial defibrillation strategy | 3 expedited stacked shocks with a brief pause between each single defibrillation attempt to confirm sustained VF/VT | 2 minutes of chest compressions prior to initial and in between attempts | 3 expedited stacked shocks with a brief pause between each single defibrillation attempt to confirm sustained VF/VT* |
| Chest compression to ventilation ratio | 15:1 | Continuous chest compressions with ventilation at ratio 10:1 | Continuous chest compressions with ventilation at ratio 10:1 |
| Vasopressors | Epinephrine 1 mg IV/IO every 35 minutes. | Epinephrine 1 mg IV/IO or vasopressin 40 units IV/IO every 35 minutes | Epinephrine 1 mg IV/IO or vasopressin 40 units IV/IO every 35 minutes. |
Stacked Shock Period (20052008)
Historically, our institutional cardiopulmonary arrest protocols advocated early defibrillation with administration of 3 stacked shocks with a brief pause between each single defibrillation attempt to confirm sustained VF/VT before initiating/resuming chest compressions.
Initial Chest Compression Period (20082011)
In 2008 the protocol was modified to reflect recommendations to perform a 2‐minute period of chest compressions prior to each defibrillation, including the initial attempt.
Modified Stacked Shack Period (20112013)
Finally, in 2011 the protocol was modified again, and defibrillators were configured to allow automatic advancement of defibrillation energy (120J‐150J‐200J). The defibrillation protocol included the following elements.
For an unmonitored arrest, chest compressions and ventilations should be initiated upon recognition of cardiopulmonary arrest. If VF/VT was identified upon placement of defibrillator pads, immediate counter shock was performed and chest compressions resumed immediately for a period of 2 minutes before considering a repeat defibrillation attempt. A dose of epinephrine (1 mg intravenous [IV]/emntraosseous [IO]) or vasopressin (40 units IV/IO) was administered as close to the reinitiation of chest compressions as possible. Defibrillation attempts proceeded with a single shock at a time, each preceded by 2 minutes of chest compressions.
For a monitored arrest, defibrillation attempts were expedited. Chest compressions without ventilations were initiated only until defibrillator pads were placed. Defibrillation attempts were initiated as soon as possible, with at least 3 or more successive shocks administered for persistent VF/VT (stacked shocks). Compressions were performed between shocks if they did not interfere with rhythm analysis. Compressions resumed following the initial series of stacked shocks with persistent CPA, regardless of rhythm, and pressors administered (epinephrine 1 mg IV or vasopressin 40 units IV). Persistent VF/VT received defibrillation attempts every 2 minutes following the initial series of stacked shocks, with compressions performed continuously between attempts. Persistent VF/VT should trigger emergent cardiology consultation for possible emergent percutaneous intervention.
Analysis
The primary outcome measure was defined as survival to hospital discharge at baseline and following each protocol change. 2 was used to compare the 3 time periods, with P < 0.05 defined as statistically significant. Specific group comparisons were made with Bonferroni correction, with P < 0.017 defined as statistically significant. Secondary outcome measures included return of spontaneous circulation (ROSC) and number of shocks required. Demographic and clinical data were also presented for each of the 3 study periods.
RESULTS
A total of 661 cardiopulmonary arrests of all rhythms were identified during the entire study period. Primary VF/VT arrests was identified in 106 patients (16%). Of these, 102 (96%) were being monitored with continuous ECG at the time of arrest. Demographic and clinical information for the entire study cohort are displayed in Table 2. There were no differences in age, gender, time of arrest, and location of arrest between study periods (all P > 0.05). The incidence of VF/VT arrest did not vary significantly between the study periods (P = 0.16). There were no differences in mean number of defibrillation attempts per arrest; however, there was a significant improvement in the rate of perfusing rhythm after initial set of defibrillation attempts and overall ROSC favoring stacked shocks (all P < 0.05, Table 2). Survival‐to‐hospital discharge for all VF/VT arrest victims decreased, then increased significantly from the stacked shock period to initial chest compression period to modified stacked shock period (58%, 18%, 71%, respectively, P < 0.01, Figure 1). After Bonferroni correction, specific group differences were significant between the stacked shock and initial chest compression groups (P < 0.01) and modified stacked shocks and initial chest compression groups (P < 0.01, Table 2). Finally, the incidence of bystander CPR appeared to be significantly greater in the modified stacked shock period following implementation of our resuscitation program (Table 2). Overall hospital CMI for fiscal years 2005/2006 through 2012/2013 were significantly different (1.47 vs 1.71, P < 0.0001).
| Parameter | Stacked Shocks (n = 31) | Initial Chest Compressions (n = 33) | Modified Stack Shocks (n = 42) |
|---|---|---|---|
| |||
| Age (y) | 54.3 | 64.3 | 59.8 |
| Male gender (%) | 16 (52) | 21 (64) | 21 (50) |
| VF/PVT arrest incidence (per 1,000 admissions) | 0.49 | 0.70 | |
| Arrest 7 am5 pm (%) | 15 (48) | 17 (52) | 21 (50) |
| Non‐ICU location (%) | 13 (42) | 15 (45) | 17 (40) |
| CPR prior to code team arrival (%) | 22 (71)* | 31 (94) | 42 (100) |
| Perfusing rhythm after initial set of defibrillation attempts (%) | 37 | 33 | 70 |
| Mean defibrillation attempts (no.) | 1.3 | 1.8 | 1.5 |
| ROSC (%) | 76 | 56 | 90 |
| Survival‐to‐hospital discharge (%) | 18 (58) | 6 (18) | 30 (71) |
| Case‐mix index (average coefficient by period) | 1.51 | 1.60 | 1.69∥ |
DISCUSSION
The specific focus of this observation was to report on defibrillation strategies that have previously only been reported in an out‐of‐hospital setting. There is no current consensus regarding chest compressions for a predetermined amount of time prior to defibrillation in an inpatient setting. Here we present data suggesting improved outcomes using an approach that expedited defibrillation and included a defibrillation strategy of stacked shocks (stacked shock and modified stack shock, respectively) in monitored inpatient VF/VT arrest.
Early out‐of‐hospital studies initially demonstrated a significant survival benefit for patients who received 1.5 to 3 minutes of chest compressions preceding defibrillation with reported arrest downtimes of 4 to 5 minutes prior to emergency medical services arrival.[14, 15] However, in more recent randomized controlled trials, outcome was not improved when chest compressions were performed prior to defibrillation attempt.[16, 17] Our findings suggest that there is no one size fits all approach to chest compression and defibrillation strategy. Instead, we suggest that factors including whether the arrest occurred while monitored or not aid with decision making and timing of defibrillation.
Our findings favoring expedited defibrillation and stacked shocks in witnessed arrest are consistent with the 3‐phase model of cardiac arrest proposed by Weisfeldt and Becker suggesting that defibrillation success is related to the energy status of the heart.[18] In this model, the first 4 minutes of VF arrest (electrical phase) are characterized by a high‐energy state with higher adenosine triphosphate (ATP)/adenosine monophosphate (AMP) ratios that are associated with increased likelihood for ROSC after defibrillation attempt.[19] Further, VF appears to deplete ATP/AMP ratios after about 4 minutes, at which point the likelihood of defibrillation success is substantially diminished.[18] Between 4 and 10 minutes (circulatory phase), energy stores in the myocardium are severely depleted. However, there is evidence to suggest that high‐quality chest compressions and high chest compression fractionparticularly in conjunction with epinephrinecan replenish ATP stores and increase the likelihood of defibrillation success.[6, 20] Beyond 10 minutes (metabolic phase), survival rates are abysmal, with no therapy yet identified producing clinical utility.
The secondary analyses reveal several interesting trends. We anticipated a higher number of defibrillation attempts during phase II due to a lower likelihood of conversion with a CPR‐first approach. Instead, the number of shocks was similar across all 3 periods. Our findings are consistent with previous reports of a low single or first shock probability of successful defibrillation. However, recent reports document that approximately 80% of patients who ultimately survive to discharge are successfully defibrillated within the first 3 shocks.[21, 22, 23]
It appears that the likelihood of conversion to a perfusing rhythm is higher with expedited, stacked shocks. This underscores the importance of identifying an optimal approach to the treatment of VF/VT, as the initial series of defibrillation attempts may determine outcomes. There also appeared to be an increase in the incidence of VF/VT during the modified stack shock period, although this was not statistically significant. The modified stack shock period correlated temporally with the expansion of our institution's cardiovascular service and the opening of a dedicated inpatient facility, which likely influenced our mixture of inpatients.
These data should be interpreted with consideration of study limitations. Primarily, we did not attempt to determine arrest times prior to initial defibrillation attempts, which is likely an important variable. However, we limited our population studied only to individuals experiencing VF/VT arrest that was witnessed by hospital care staff or occurred while on cardiac monitor. We are confident that these selective criteria resulted in expedited identification and response times well within the electrical phase. We did not evaluate differences or changes in individual patient‐level severity of illness that may have potentially confounded outcome analysis. The effect of individual level in severity of illness and comorbidity are not known. Instead, we used CMI coefficients to explore hospital wide changes in patient acuity during the study period. We noticed an increasing case‐mix coefficient value suggesting higher patient acuity, which would predict increased mortality rather than the decrease noted between the initial chest compression and modified stacked shock periods (Table 2). In addition, we did not integrate CPR process variables, such as depth, rate, recoil, chest compression fraction, and per‐shock pauses, into this analysis. Our previous studies indicated that high‐quality CPR may account for a significant amount of improvement in outcomes following our novel resuscitation program implementation in 2007.[10, 24] Since the program's inception, we have reported continuous improvement in overall in‐hospital mortality that was sustained throughout the duration of the study period despite the significant changes reported in the 3 periods with monitored VF/VT arrest.[10] The use of medications prior to initial defibrillation attempts was not recorded. We have recently reported that during the same period of data collection, there were no significant changes in the use of epinephrine; however, there was a significant increase in the use of vasopressin.[10] It is unclear whether the increased use of vasopressin contributed to the current outcomes. However, given our cohort of witnessed in‐hospital cardiac arrests with an initial shockable rhythm, we anticipate the use of vasopressors as unlikely prior to defibrillation attempt.
Additional important limitations and potential confounding factors in this study were the use of 2 different types of defibrillators, differing escalating energy strategies, and differing defibrillator waveforms. Recent evidence supports biphasic waveforms as more effective than monophasic waveforms.[25, 26, 27] Comparison of defibrillator brand and waveform superiority is out the scope of this study; however, it is interesting to note similar high rates of survival in the stacked shock and modified stack shock phases despite use of different defibrillator brands and waveforms during those respective phases. Regarding escalating energy of defibrillation countershocks, the most recent 2010 AHA guidelines have no position on the superiority of either manual or automatic escalation.[7] However, we noted similar high rates of survival in the stacked shock and modified stack shock periods despite use of differing escalating strategies. Finally, we used survival‐to‐hospital discharge as our main outcome measure rather than neurological status. However, prior studies from our institution suggest that most VF/VT survivors have good neurological outcomes, which are influenced heavily by preadmission functional status.[24]
CONCLUSIONS
Our data suggest that in cases of monitored VF/VT arrest, expeditious defibrillation with use of stacked shocks is associated with a higher rate of ROSC and survival to hospital discharge
Disclosure: Nothing to report.
- , , , et al. Strategies for improving survival after in‐hospital cardiac arrest in the United States: 2013 consensus recommendations: a consensus statement from the American Heart Association. Circulation. 2013;127:1538–1563.
- , , , et al. Survival from in‐hospital cardiac arrest during nights and weekends. JAMA. 2008;299:785–792.
- , , , et al. Heart disease and stroke statistics—2008 update: a report from the American Heart Association Statistics Committee and Stroke Statistics Subcommittee. Circulation. 2008;117:e25–e146.
- , , , . Predictors of survival from out‐of‐hospital cardiac arrest: a systematic review and meta‐analysis. Circ Cardiovasc Qual Outcomes. 2010;3:63–81.
- , , , et al. Quality of cardiopulmonary resuscitation during in‐hospital cardiac arrest. JAMA. 2005;293:305–310.
- , , , et al. Chest compression fraction determines survival in patients with out‐of‐hospital ventricular fibrillation. Circulation. 2009;120:1241–1247.
- , , , et al. Part 6: Defibrillation: 2010 International Consensus on Cardiopulmonary Resuscitation and Emergency Cardiovascular Care Science With Treatment Recommendations. Circulation. 2010;122:S325–S337.
- , , , et al. Part 1: executive summary: 2010 American Heart Association Guidelines for Cardiopulmonary Resuscitation and Emergency Cardiovascular Care. Circulation. 2010;122:S640—S656.
- , , , et al. Part 8: adult advanced cardiovascular life support: 2010 American Heart Association Guidelines for Cardiopulmonary Resuscitation and Emergency Cardiovascular Care. Circulation. 2010;122:S729–S767.
- , , , et al. A performance improvement‐based resuscitation programme reduces arrest incidence and increases survival from in‐hospital cardiac arrest. Resuscitation. 2015;92:63–69.
- . The evolution of case‐mix measurement using DRGs: past, present and future. Stud Health Technol Inform. 1994;14:75–83.
- , , , et al. Variability in case‐mix adjusted in‐hospital cardiac arrest rates. Med Care. 2012;50:124–130.
- , , , , . Impact of socioeconomic adjustment on physicians' relative cost of care. Med Care. 2013;51:454–460.
- , , , et al. Influence of cardiopulmonary resuscitation prior to defibrillation in patients with out‐of‐hospital ventricular fibrillation. JAMA. 1999;281:1182–1188.
- , , , et al. Delaying defibrillation to give basic cardiopulmonary resuscitation to patients with out‐of‐hospital ventricular fibrillation: a randomized trial. JAMA. 2003;289:1389–1395.
- , , , et al. Defibrillation or cardiopulmonary resuscitation first for patients with out‐of‐hospital cardiac arrests found by paramedics to be in ventricular fibrillation? A randomised control trial. Resuscitation. 2008;79:424–431.
- , , , . CPR before defibrillation in out‐of‐hospital cardiac arrest: a randomized trial. Emerg Med Australas. 2005;17:39–45.
- , . Resuscitation after cardiac arrest: a 3‐phase time‐sensitive model. JAMA. 2002;288:3035–3038.
- , , , , . Association of intramyocardial high energy phosphate concentrations with quantitative measures of the ventricular fibrillation electrocardiogram waveform. Resuscitation. 2009;80:946–950.
- , , , et al. Ventricular fibrillation median frequency may not be useful for monitoring during cardiac arrest treated with endothelin‐1 or epinephrine. Anesth Analg. 2004;99:1787–1793, table of contents.
- , , , , . “Probability of successful defibrillation” as a monitor during CPR in out‐of‐hospital cardiac arrested patients. Resuscitation. 2015;48:245–254.
- , , , . Shockable rhythms and defibrillation during in‐hospital pediatric cardiac arrest. Resuscitation. 2014;85:387–391.
- , , , . Beyond the pre‐shock pause: the effect of prehospital defibrillation mode on CPR interruptions and return of spontaneous circulation. Resuscitation. 2013;84:575–579.
- , , . Implementing a “resuscitation bundle” decreases incidence and improves outcomes in inpatient cardiopulmonary arrest. Circulation 2009;120(18 Suppl):S1441.
- , , , et al. Multicenter, randomized, controlled trial of 150‐J biphasic shocks compared with 200‐ to 360‐J monophasic shocks in the resuscitation of out‐of‐hospital cardiac arrest victims. Optimized Response to Cardiac Arrest (ORCA) Investigators. Circulation. 2000;102:1780–1787.
- , , , , . A prospective, randomised and blinded comparison of first shock success of monophasic and biphasic waveforms in out‐of‐hospital cardiac arrest. Resuscitation. 2003;58:17–24.
- , , , et al. Out‐of‐hospital cardiac arrest rectilinear biphasic to monophasic damped sine defibrillation waveforms with advanced life support intervention trial (ORBIT). Resuscitation. 2005;66:149–157.
© 2015 Society of Hospital Medicine

Hospital Evidence‐Based Practice Centers
Hospital evidence‐based practice centers (EPCs) are structures with the potential to facilitate the integration of evidence into institutional decision making to close knowing‐doing gaps[1, 2, 3, 4, 5, 6]; in the process, they can support the evolution of their parent institutions into learning healthcare systems.[7] The potential of hospital EPCs stems from their ability to identify and adapt national evidence‐based guidelines and systematic reviews for the local setting,[8] create local evidence‐based guidelines in the absence of national guidelines, use local data to help define problems and assess the impact of solutions,[9] and implement evidence into practice through computerized clinical decision support (CDS) interventions and other quality‐improvement (QI) initiatives.[9, 10] As such, hospital EPCs have the potential to strengthen relationships and understanding between clinicians and administrators[11]; foster a culture of evidence‐based practice; and improve the quality, safety, and value of care provided.[10]
Formal hospital EPCs remain uncommon in the United States,[10, 11, 12] though their numbers have expanded worldwide.[13, 14] This growth is due not to any reduced role for national EPCs, such as the National Institute for Health and Clinical Excellence[15] in the United Kingdom, or the 13 EPCs funded by the Agency for Healthcare Research and Quality (AHRQ)[16, 17] in the United States. Rather, this growth is fueled by the heightened awareness that the value of healthcare interventions often needs to be assessed locally, and that clinical guidelines that consider local context have a greater potential to improve quality and efficiency.[9, 18, 19]
Despite the increasing number of hospital EPCs globally, their impact on administrative and clinical decision making has rarely been examined,[13, 20] especially for hospital EPCs in the United States. The few studies that have assessed the impact of hospital EPCs on institutional decision making have done so in the context of technology acquisition, neglecting the role hospital EPCs may play in the integration of evidence into clinical practice. For example, the Technology Assessment Unit at McGill University Health Center found that of the 27 reviews commissioned in their first 5 years, 25 were implemented, with 6 (24%) recommending investments in new technologies and 19 (76%) recommending rejection, for a reported net hospital savings of $10 million.[21] Understanding the activities and impact of hospital EPCs is particularly critical for hospitalist leaders, who could leverage hospital EPCs to inform efforts to support the quality, safety, and value of care provided, or who may choose to establish or lead such infrastructure. The availability of such opportunities could also support hospitalist recruitment and retention.
In 2006, the University of Pennsylvania Health System (UPHS) created the Center for Evidence‐based Practice (CEP) to support the integration of evidence into practice to strengthen quality, safety, and value.[10] Cofounded by hospitalists with formal training in clinical epidemiology, the CEP performs rapid systematic reviews of the scientific literature to inform local practice and policy. In this article, we describe the first 8 years of the CEP's evidence synthesis activities and examine its impact on decision making across the health system.
METHODS
Setting
The UPHS includes 3 acute care hospitals, and inpatient facilities specializing in acute rehabilitation, skilled nursing, long‐term acute care, and hospice, with a capacity of more than 1800 beds and 75,000 annual admissions, as well as primary care and specialty clinics with more than 2 million annual outpatient visits. The CEP is funded by and organized within the Office of the UPHS Chief Medical Officer, serves all UPHS facilities, has an annual budget of approximately $1 million, and is currently staffed by a hospitalist director, 3 research analysts, 6 physician and nurse liaisons, a health economist, biostatistician, administrator, and librarians, totaling 5.5 full time equivalents.
The mission of the CEP is to support the quality, safety, and value of care at Penn through evidence‐based practice. To accomplish this mission, the CEP performs rapid systematic reviews, translates evidence into practice through the use of CDS interventions and clinical pathways, and offers education in evidence‐based decision making to trainees, staff, and faculty. This study is focused on the CEP's evidence synthesis activities.
Typically, clinical and administrative leaders submit a request to the CEP for an evidence review, the request is discussed and approved at the weekly staff meeting, and a research analyst and clinical liaison are assigned to the request and communicate with the requestor to clearly define the question of interest. Subsequently, the research analyst completes a protocol, a draft search, and a draft report, each reviewed and approved by the clinical liaison and requestor. The final report is posted to the website, disseminated to all key stakeholders across the UPHS as identified by the clinical liaisons, and integrated into decision making through various routes, including in‐person presentations to decision makers, and CDS and QI initiatives.
Study Design
The study included an analysis of an internal database of evidence reviews and a survey of report requestors, and was exempted from institutional review board review. Survey respondents were informed that their responses would be confidential and did not receive incentives.
Internal Database of Reports
Data from the CEP's internal management database were analyzed for its first 8 fiscal years (July 2006June 2014). Variables included requestor characteristics, report characteristics (eg, technology reviewed, clinical specialty examined, completion time, and performance of meta‐analyses and GRADE [Grading of Recommendations Assessment, Development and Evaluation] analyses[22]), report use (eg, integration of report into CDS interventions) and dissemination beyond the UPHS (eg, submission to Center for Reviews and Dissemination [CRD] Health Technology Assessment [HTA] database[23] and to peer‐reviewed journals). Report completion time was defined as the time between the date work began on the report and the date the final report was sent to the requestor. The technology categorization scheme was adapted from that provided by Goodman (2004)[24] and the UK National Institute for Health Research HTA Programme.[25] We systematically assigned the technology reviewed in each report to 1 of 8 mutually exclusive categories. The clinical specialty examined in each report was determined using an algorithm (see Supporting Information, Appendix 1, in the online version of this article).
We compared the report completion times and the proportions of requestor types, technologies reviewed, and clinical specialties examined in the CEP's first 4 fiscal years (July 2006June 2010) to those in the CEP's second 4 fiscal years (July 2010June 2014) using t tests and 2 tests for continuous and categorical variables, respectively.
Survey
We conducted a Web‐based survey (see Supporting Information, Appendix 2, in the online version of this article) of all requestors of the 139 rapid reviews completed in the last 4 fiscal years. Participants who requested multiple reports were surveyed only about the most recent report. Requestors were invited to participate in the survey via e‐mail, and follow‐up e‐mails were sent to nonrespondents at 7, 14, and 16 days. Nonrespondents and respondents were compared with respect to requestor type (physician vs nonphysician) and topic evaluated (traditional HTA topics such as drugs, biologics, and devices vs nontraditional HTA topics such as processes of care). The survey was administered using REDCap[26] electronic data capture tools. The 44‐item questionnaire collected data on the interaction between the requestor and the CEP, report characteristics, report impact, and requestor satisfaction.
Survey results were imported into Microsoft Excel (Microsoft Corp, Redmond, WA) and SPSS (IBM, Armonk, NY) for analysis. Descriptive statistics were generated, and statistical comparisons were conducted using 2 and Fisher exact tests.
RESULTS
Evidence Synthesis Activity
The CEP has produced several different report products since its inception. Evidence reviews (57%, n = 142) consist of a systematic review and analysis of the primary literature. Evidence advisories (32%, n = 79) are summaries of evidence from secondary sources such as guidelines or systematic reviews. Evidence inventories (3%, n = 7) are literature searches that describe the quantity and focus of available evidence, without analysis or synthesis.[27]
The categories of technologies examined, including their definitions and examples, are provided in Table 1. Drugs (24%, n = 60) and devices/equipment/supplies (19%, n = 48) were most commonly examined. The proportion of reports examining technology types traditionally evaluated by HTA organizations significantly decreased when comparing the first 4 years of CEP activity to the second 4 years (62% vs 38%, P < 0.01), whereas reports examining less traditionally reviewed categories increased (38% vs 62%, P < 0.01). The most common clinical specialties represented by the CEP reports were nursing (11%, n = 28), general surgery (11%, n = 28), critical care (10%, n = 24), and general medicine (9%, n = 22) (see Supporting Information, Appendix 3, in the online version of this article). Clinical departments were the most common requestors (29%, n = 72) (Table 2). The proportion of requests from clinical departments significantly increased when comparing the first 4 years to the second 4 years (20% vs 36%, P < 0.01), with requests from purchasing committees significantly decreasing (25% vs 6%, P < 0.01). The overall report completion time was 70 days, and significantly decreased when comparing the first 4 years to the second 4 years (89 days vs 50 days, P < 0.01).
| Category | Definition | Examples | Total | 20072010 | 20112014 | P Value |
|---|---|---|---|---|---|---|
| Total | 249 (100%) | 109 (100%) | 140 (100%) | |||
| Drug | A report primarily examining the efficacy/effectiveness, safety, appropriate use, or cost of a pharmacologic agent | Celecoxib for pain in joint arthroplasty; colchicine for prevention of pericarditis and atrial fibrillation | 60 (24%) | 35 (32%) | 25 (18%) | 0.009 |
| Device, equipment, and supplies | A report primarily examining the efficacy/effectiveness, safety, appropriate use, or cost of an instrument, apparatus, implement, machine, contrivance, implant, in vitro reagent, or other similar or related article, including a component part, or accessory that is intended for use in the prevention, diagnosis, or treatment of disease and does not achieve its primary intended purposes though chemical action or metabolism[50] | Thermometers for pediatric use; femoral closure devices for cardiac catheterization | 48 (19%) | 25 (23%) | 23 (16%) | 0.19 |
| Process of care | A report primarily examining a clinical pathway or a clinical practice guideline that significantly involves elements of prevention, diagnosis, and/or treatment or significantly incorporates 2 or more of the other technology categories | Preventing patient falls; prevention and management of delirium | 31 (12%) | 18 (17%) | 13 (9%) | 0.09 |
| Test, scale, or risk factor | A report primarily examining the efficacy/effectiveness, safety, appropriate use, or cost of a test intended to screen for, diagnose, classify, or monitor the progression of a disease | Computed tomography for acute chest pain; urine drug screening in chronic pain patients on opioid therapy | 31 (12%) | 8 (7%) | 23 (16%) | 0.03 |
| Medical/surgical procedure | A report primarily examining the efficacy/effectiveness, safety, appropriate use, or cost of a medical intervention that is not a drug, device, or test or of the application or removal of a device | Biliary drainage for chemotherapy patients; cognitive behavioral therapy for insomnia | 26 (10%) | 8 (7%) | 18 (13%) | 0.16 |
| Policy or organizational/managerial system | A report primarily examining laws or regulations; the organization, financing, or delivery of care, including settings of care; or healthcare providers | Medical care costs and productivity changes associated with smoking; physician training and credentialing for robotic surgery in obstetrics and gynecology | 26 (10%) | 4 (4%) | 22 (16%) | 0.002 |
| Support system | A report primarily examining the efficacy/effectiveness, safety, appropriate use, or cost of an intervention designed to provide a new or improved service to patients or healthcare providers that does not fall into 1 of the other categories | Reconciliation of data from differing electronic medical records; social media, text messaging, and postdischarge communication | 14 (6%) | 3 (3%) | 11 (8%) | 0.09 |
| Biologic | A report primarily examining the efficacy/effectiveness, safety, appropriate use, or cost of a product manufactured in a living system | Recombinant factor VIIa for cardiovascular surgery; osteobiologics for orthopedic fusions | 13 (5%) | 8 (7%) | 5 (4%) | 0.19 |
| Category | Total | 20072010 | 20112014 | P Value |
|---|---|---|---|---|
| ||||
| Total | 249 (100%) | 109 (100%) | 140 (100%) | |
| Clinical department | 72 (29%) | 22 (20%) | 50 (36%) | 0.007 |
| CMO | 47 (19%) | 21 (19%) | 26 (19%) | 0.92 |
| Purchasing committee | 35 (14%) | 27 (25%) | 8 (6%) | <0.001 |
| Formulary committee | 22 (9%) | 12 (11%) | 10 (7%) | 0.54 |
| Quality committee | 21 (8%) | 11 (10%) | 10 (7%) | 0.42 |
| Administrative department | 19 (8%) | 5 (5%) | 14 (10%) | 0.11 |
| Nursing | 14 (6%) | 4 (4%) | 10 (7%) | 0.23 |
| Other* | 19 (8%) | 7 (6%) | 12 (9%) | 0.55 |
Thirty‐seven (15%) reports included meta‐analyses conducted by CEP staff. Seventy‐five reports (30%) contained an evaluation of the quality of the evidence base using GRADE analyses.[22] Of these reports, the highest GRADE of evidence available for any comparison of interest was moderate (35%, n = 26) or high (33%, n = 25) in most cases, followed by very low (19%, n = 14) and low (13%, n = 10).
Reports were disseminated in a variety of ways beyond direct dissemination and presentation to requestors and posting on the center website. Thirty reports (12%) informed CDS interventions, 24 (10%) resulted in peer‐reviewed publications, and 204 (82%) were posted to the CRD HTA database.
Evidence Synthesis Impact
A total of 139 reports were completed between July 2010 and June 2014 for 65 individual requestors. Email invitations to participate in the survey were sent to the 64 requestors employed by the UPHS. The response rate was 72% (46/64). The proportions of physician requestors and traditional HTA topics evaluated were similar across respondents and nonrespondents (43% [20/46] vs 39% [7/18], P = 0.74; and 37% [17/46] vs 44% [8/18], P = 0.58, respectively). Aggregated survey responses are presented for items using a Likert scale in Figure 1, and for items using a yes/no or ordinal scale in Table 3.
| Items | % of Respondents Responding Affirmatively |
|---|---|
| Percentage of Respondents Ranking as First Choice* | |
| |
| Requestor activity | |
| What factors prompted you to request a report from CEP? (Please select all that apply.) | |
| My own time constraints | 28% (13/46) |
| CEP's ability to identify and synthesize evidence | 89% (41/46) |
| CEP's objectivity | 52% (24/46) |
| Recommendation from colleague | 30% (14/46) |
| Did you conduct any of your own literature searches before contacting CEP? | 67% (31/46) |
| Did you obtain and read any of the articles cited in CEP's report? | 63% (29/46) |
| Did you read the following sections of CEP's report? | |
| Evidence summary (at beginning of report) | 100% (45/45) |
| Introduction/background | 93% (42/45) |
| Methods | 84% (38/45) |
| Results | 98% (43/43) |
| Conclusion | 100% (43/43) |
| Report dissemination | |
| Did you share CEP's report with anyone NOT involved in requesting the report or in making the final decision? | 67% (30/45) |
| Did you share CEP's report with anyone outside of Penn? | 7% (3/45) |
| Requestor preferences | |
| Would it be helpful for CEP staff to call you after you receive any future CEP reports to answer any questions you might have? | 55% (24/44) |
| Following any future reports you request from CEP, would you be willing to complete a brief questionnaire? | 100% (44/44) |
| Please rank how you would prefer to receive reports from CEP in the future. | |
| E‐mail containing the report as a PDF attachment | 77% (34/44) |
| E‐mail containing a link to the report on CEP's website | 16% (7/44) |
| In‐person presentation by the CEP analyst writing the report | 18% (8/44) |
| In‐person presentation by the CEP director involved in the report | 16% (7/44) |

In general, respondents found reports easy to request, easy to use, timely, and relevant, resulting in high requestor satisfaction. In addition, 98% described the scope of content and level of detail as about right. Report impact was rated highly as well, with the evidence summary and conclusions rated as the most critical to decision making. A majority of respondents indicated that reports confirmed their tentative decision (77%, n = 34), whereas some changed their tentative decision (7%, n = 3), and others suggested the report had no effect on their tentative decision (16%, n = 7). Respondents indicated the amount of time that elapsed between receiving reports and making final decisions was 1 to 7 days (5%, n = 2), 8 to 30 days (40%, n = 17), 1 to 3 months (37%, n = 16), 4 to 6 months (9%, n = 4), or greater than 6 months (9%, n = 4). The most common reasons cited for requesting a report were the CEP's evidence synthesis skills and objectivity.
DISCUSSION
To our knowledge, this is the first comprehensive description and assessment of evidence synthesis activity by a hospital EPC in the United States. Our findings suggest that clinical and administrative leaders will request reports from a hospital EPC, and that hospital EPCs can promptly produce reports when requested. Moreover, these syntheses can address a wide range of clinical and policy topics, and can be disseminated through a variety of routes. Lastly, requestors are satisfied by these syntheses, and report that they inform decision making. These results suggest that EPCs may be an effective infrastructure paradigm for promoting evidence‐based decision making within healthcare provider organizations, and are consistent with previous analyses of hospital‐based EPCs.[21, 28, 29]
Over half of report requestors cited CEP's objectivity as a factor in their decision to request a report, underscoring the value of a neutral entity in an environment where clinical departments and hospital committees may have competing interests.[10] This asset was 1 of the primary drivers for establishing our hospital EPC. Concerns by clinical executives about the influence of industry and local politics on institutional decision making, and a desire to have clinical evidence more systematically and objectively integrated into decision making, fueled our center's funding.
The survey results also demonstrate that respondents were satisfied with the reports for many reasons, including readability, concision, timeliness, scope, and content, consistent with the evaluation of the French hospital‐based EPC CEDIT (French Committee for the Assessment and Dissemination of Technological Innovations).[29] Given the importance of readability, concision, and relevance that has been previously described,[16, 28, 30] nearly all CEP reports contain an evidence summary on the first page that highlights key findings in a concise, user‐friendly format.[31] The evidence summaries include bullet points that: (1) reference the most pertinent guideline recommendations along with their strength of recommendation and underlying quality of evidence; (2) organize and summarize study findings using the most critical clinical outcomes, including an assessment of the quality of the underlying evidence for each outcome; and (3) note important limitations of the findings.
Evidence syntheses must be timely to allow decision makers to act on the findings.[28, 32] The primary criticism of CEDIT was the lag between requests and report publication.[29] Rapid reviews, designed to inform urgent decisions, can overcome this challenge.[31, 33, 34] CEP reviews required approximately 2 months to complete on average, consistent with the most rapid timelines reported,[31, 33, 34] and much shorter than standard systematic review timelines, which can take up to 12 to 24 months.[33] Working with requestors to limit the scope of reviews to those issues most critical to a decision, using secondary resources when available, and hiring experienced research analysts help achieve these efficiencies.
The study by Bodeau‐Livinec also argues for the importance of report accessibility to ensure dissemination.[29] This is consistent with the CEP's approach, where all reports are posted on the UPHS internal website. Many also inform QI initiatives, as well as CDS interventions that address topics of general interest to acute care hospitals, such as venous thromboembolism (VTE) prophylaxis,[35] blood product transfusions,[36] sepsis care,[37, 38] and prevention of catheter‐associated urinary tract infections (CAUTI)[39] and hospital readmissions.[40] Most reports are also listed in an international database of rapid reviews,[23] and reports that address topics of general interest, have sufficient evidence to synthesize, and have no prior published systematic reviews are published in the peer‐reviewed literature.[41, 42]
The majority of reports completed by the CEP were evidence reviews, or systematic reviews of primary literature, suggesting that CEP reports often address questions previously unanswered by existing published systematic reviews; however, about a third of reports were evidence advisories, or summaries of evidence from preexisting secondary sources. The relative scarcity of high‐quality evidence bases in those reports where GRADE analyses were conducted might be expected, as requestors may be more likely to seek guidance when the evidence base on a topic is lacking. This was further supported by the small percentage (15%) of reports where adequate data of sufficient homogeneity existed to allow meta‐analyses. The small number of original meta‐analyses performed also reflects our reliance on secondary resources when available.
Only 7% of respondents reported that tentative decisions were changed based on their report. This is not surprising, as evidence reviews infrequently result in clear go or no go recommendations. More commonly, they address or inform complex clinical questions or pathways. In this context, the change/confirm/no effect framework may not completely reflect respondents' use of or benefit from reports. Thus, we included a diverse set of questions in our survey to best estimate the value of our reports. For example, when asked whether the report answered the question posed, informed their final decision, or was consistent with their final decision, 91%, 79%, and 71% agreed or strongly agreed, respectively. When asked whether they would request a report again if they had to do it all over, recommend CEP to their colleagues, and be likely to request reports in the future, at least 95% of survey respondents agreed or strongly agreed. In addition, no respondent indicated that their report was not timely enough to influence their decision. Moreover, only a minority of respondents expressed disappointment that the CEP's report did not provide actionable recommendations due to a lack of published evidence (9%, n = 4). Importantly, the large proportion of requestors indicating that reports confirmed their tentative decisions may be a reflection of hindsight bias.
The most apparent trend in the production of CEP reviews over time is the relative increase in requests by clinical departments, suggesting that the CEP is being increasingly consulted to help define best clinical practices. This is also supported by the relative increase in reports focused on policy or organizational/managerial systems. These findings suggest that hospital EPCs have value beyond the traditional realm of HTA.
This study has a number of limitations. First, not all of the eligible report requestors responded to our survey. Despite this, our response rate of 72% compares favorably with surveys published in medical journals.[43] In addition, nonresponse bias may be less important in physician surveys than surveys of the general population.[44] The similarity in requestor and report characteristics for respondents and nonrespondents supports this. Second, our survey of impact is self‐reported rather than an evaluation of actual decision making or patient outcomes. Thus, the survey relies on the accuracy of the responses. Third, recall bias must be considered, as some respondents were asked to evaluate reports that were greater than 1 year old. To reduce this bias, we asked respondents to consider the most recent report they requested, included that report as an attachment in the survey request, and only surveyed requestors from the most recent 4 of the CEP's 8 fiscal years. Fourth, social desirability bias could have also affected the survey responses, though it was likely minimized by the promise of confidentiality. Fifth, an examination of the impact of the CEP on costs was outside the scope of this evaluation; however, such information may be important to those assessing the sustainability or return on investment of such centers. Simple approaches we have previously used to approximate the value of our activities include: (1) estimating hospital cost savings resulting from decisions supported by our reports, such as the use of technologies like chlorhexidine for surgical site infections[45] or discontinuation of technologies like aprotinin for cardiac surgery[46]; and (2) estimating penalties avoided or rewards attained as a result of center‐led initiatives, such as those to increase VTE prophylaxis,[35] reduce CAUTI rates,[39] and reduce preventable mortality associated with sepsis.[37, 38] Similarly, given the focus of this study on the local evidence synthesis activities of our center, our examination did not include a detailed description of our CDS activities, or teaching activities, including our multidisciplinary workshops for physicians and nurses in evidence‐based QI[47] and our novel evidence‐based practice curriculum for medical students. Our study also did not include a description of our extramural activities, such as those supported by our contract with AHRQ as 1 of their 13 EPCs.[16, 17, 48, 49] A consideration of all of these activities enables a greater appreciation for the potential of such centers. Lastly, we examined a single EPC, which may not be representative of the diversity of hospitals and hospital staff across the United States. However, our EPC serves a diverse array of patient populations, clinical services, and service models throughout our multientity academic healthcare system, which may improve the generalizability of our experience to other settings.
As next steps, we recommend evaluation of other existing hospital EPCs nationally. Such studies could help hospitals and health systems ascertain which of their internal decisions might benefit from locally sourced rapid systematic reviews and determine whether an in‐house EPC could improve the value of care delivered.
In conclusion, our findings suggest that hospital EPCs within academic healthcare systems can efficiently synthesize and disseminate evidence for a variety of stakeholders. Moreover, these syntheses impact decision making in a variety of hospital contexts and clinical specialties. Hospitals and hospitalist leaders seeking to improve the implementation of evidence‐based practice at a systems level might consider establishing such infrastructure locally.
Acknowledgements
The authors thank Fran Barg, PhD (Department of Family Medicine and Community Health, University of Pennsylvania Perelman School of Medicine) and Joel Betesh, MD (University of Pennsylvania Health System) for their contributions to developing the survey. They did not receive any compensation for their contributions.
Disclosures: An earlier version of this work was presented as a poster at the 2014 AMA Research Symposium, November 7, 2014, Dallas, Texas. Mr. Jayakumar reports having received a University of Pennsylvania fellowship as a summer intern at the Center for Evidence‐based Practice. Dr. Umscheid cocreated and directs a hospital evidence‐based practice center, is the Senior Associate Director of an Agency for Healthcare Research and Quality Evidence‐Based Practice Center, and is a past member of the Medicare Evidence Development and Coverage Advisory Committee, which uses evidence reports developed by the Evidence‐based Practice Centers of the Agency for Healthcare Research and Quality. Dr. Umscheid's contribution was supported in part by the National Center for Research Resources, grant UL1RR024134, which is now at the National Center for Advancing Translational Sciences, grant UL1TR000003. The content of this article is solely the responsibility of the authors and does not necessarily represent the official views of the National Institutes of Health. None of the funders had a role in the design and conduct of the study; collection, management, analysis, and interpretation of the data; preparation, review, or approval of the manuscript; and decision to submit the manuscript for publication. Dr. Lavenberg, Dr. Mitchell, and Mr. Leas are employed as research analysts by a hospital evidence‐based practice center. Dr. Doshi is supported in part by a hospital evidence‐based practice center and is an Associate Director of an Agency for Healthcare Research and Quality Evidence‐based Practice Center. Dr. Goldmann is emeritus faculty at Penn, is supported in part by a hospital evidence‐based practice center, and is the Vice President and Chief Quality Assurance Officer in Clinical Solutions, a division of Elsevier, Inc., a global publishing company, and director of the division's Evidence‐based Medicine Center. Dr. Williams cocreated and codirects a hospital evidence‐based practice center. Dr. Brennan has oversight for and helped create a hospital evidence‐based practice center.
- , . “Bench to behavior”: translating comparative effectiveness research into improved clinical practice. Health Aff (Millwood). 2010;29(10):1891–1900.
- , , . Evaluating the status of “translating research into practice” at a major academic healthcare system. Int J Technol Assess Health Care. 2009;25(1):84–89.
- , , , . Five reasons that many comparative effectiveness studies fail to change patient care and clinical practice. Health Aff (Millwood). 2012;31(10):2168–2175.
- , , , , , . Fostering implementation of health services research findings into practice: a consolidated framework for advancing implementation science. Implement Sci. 2009;4(1):50.
- , . From best evidence to best practice: effective implementation of change in patients' care. Lancet. 2003;362(9391):1225–1230.
- , . Incentivizing “structures” over “outcomes” to bridge the knowing‐doing gap. JAMA Intern Med. 2015;175(3):354.
- Olsen L, Aisner D, McGinnis JM, eds. Institute of Medicine (US) Roundtable on Evidence‐Based Medicine. The Learning Healthcare System: Workshop Summary. Washington, DC: National Academies Press; 2007. Available at: http://www.ncbi.nlm.nih.gov/books/NBK53494/. Accessed October 29, 2014.
- , , , . Adapting clinical practice guidelines to local context and assessing barriers to their use. Can Med Assoc J. 2010;182(2):E78–E84.
- , , , . Integrating local data into hospital‐based healthcare technology assessment: two case studies. Int J Technol Assess Health Care. 2010;26(3):294–300.
- , , . Hospital‐based comparative effectiveness centers: translating research into practice to improve the quality, safety and value of patient care. J Gen Intern Med. 2010;25(12):1352–1355.
- , , , , . Health technology assessment at the University of California‐San Francisco. J Healthc Manag Am Coll Healthc Exec. 2011;56(1):15–29; discussion 29–30.
- , . Kaiser Permanente Southern California regional technology management process: evidence‐based medicine operationalized. Perm J. 2006;10(1):38–41.
- . Hospital‐based health technology assessment: developments to date. Pharmacoeconomics. 2014;32(9):819–824.
- , , , . Hospital based health technology assessment world‐wide survey. Available at: http://www.htai.org/fileadmin/HTAi_Files/ISG/HospitalBasedHTA/2008Files/HospitalBasedHTAISGSurveyReport.pdf. Accessed October 11, 2015.
- , . At the center of health care policy making: the use of health technology assessment at NICE. Med Decis Making. 2013;33(3):320–324.
- , , . Better information for better health care: the Evidence‐based Practice Center program and the Agency for Healthcare Research and Quality. Ann Intern Med. 2005;142(12 part 2):1035–1041.
- , . AHRQ's Effective Health Care Program: why comparative effectiveness matters. Am J Med Qual. 2009;24(1):67–70.
- , . Effect of clinical guidelines on medical practice: a systematic review of rigorous evaluations. Lancet. 1993;342(8883):1317–1322.
- , , , et al. Lost in knowledge translation: time for a map? J Contin Educ Health Prof. 2006;26(1):13–24.
- , , , . Effects and repercussions of local/hospital‐based health technology assessment (HTA): a systematic. Syst Rev. 2014;3:129.
- , , , et al. Impact of TAU Reports. McGill University Health Centre. Available at: https://francais.mcgill.ca/files/tau/FINAL_TAU_IMPACT_REPORT_FEB_2008.pdf. Published Feb 1, 2008. Accessed August 19, 2014.
- , , , et al. GRADE: an emerging consensus on rating quality of evidence and strength of recommendations. BMJ. 2008;336(7650):924–926.
- , , . Centre for Reviews and Dissemination databases: value, content, and developments. Int J Technol Assess Health Care. 2010;26(4):470–472.
- . HTA 101. Introduction to Health Technology Assessment. Available at: https://www.nlm.nih.gov/nichsr/hta101/ta10103.html. Accessed October 11, 2015.
- National Institute for Health Research. Remit. NIHR HTA Programme. Available at: http://www.nets.nihr.ac.uk/programmes/hta/remit. Accessed August 20, 2014.
- , , , , , . Research Electronic Data Capture (REDCap)—a metadata‐driven methodology and workflow process for providing translational research informatics support. J Biomed Inform. 2009;42(2):377–381.
- , , , . When the decision is what to decide: Using evidence inventory reports to focus health technology assessments. Int J Technol Assess Health Care. 2011;27(2):127–132.
- , . End‐user involvement in health technology assessment (HTA) development: a way to increase impact. Int J Technol Assess Health Care. 2005;21(02):263–267.
- , , , , . Impact of CEDIT recommendations: an example of health technology assessment in a hospital network. Int J Technol Assess Health Care. 2006;22(2):161–168.
- , , , . Increasing the relevance of research to health care managers: hospital CEO imperatives for improving quality and lowering costs. Health Care Manage Rev. 2007;32(2):150–159.
- , , , , . Evidence summaries: the evolution of a rapid review approach. Syst Rev. 2012;1(1):10.
- , , , . Health care decision makers' use of comparative effectiveness research: report from a series of focus groups. J Manag Care Pharm. 2013;19(9):745–754.
- , , , et al. Rapid reviews versus full systematic reviews: an inventory of current methods and practice in health technology assessment. Int J Technol Assess Health Care. 2008;24(2):133–139.
- , , , et al. EPC Methods: An Exploration of Methods and Context for the Production of Rapid Reviews. Rockville, MD: Agency for Healthcare Research and Quality; 2015. Available at: http://www.ncbi.nlm.nih.gov/books/NBK274092. Accessed March 5, 2015.
- , , , , . Effectiveness of a novel and scalable clinical decision support intervention to improve venous thromboembolism prophylaxis: a quasi‐experimental study. BMC Med Inform Decis Mak. 2012;12:92.
- . Order sets in electronic health records: principles of good practice. Chest. 2013;143(1):228–235.
- , , , et al. Development, implementation, and impact of an automated early warning and response system for sepsis. J Hosp Med. 2015;10(1):26–31.
- , , , et al. Clinician perception of the effectiveness of an automated early warning and response system for sepsis in an academic medical center. Ann Am Thorac Soc. 2015;12(10):1514–1519.
- , , , , , . Usability and impact of a computerized clinical decision support intervention designed to reduce urinary catheter utilization and catheter‐associated urinary tract infections. Infect Control Hosp Epidemiol. 2014;35(9):1147–1155.
- , , , et al. The readmission risk flag: using the electronic health record to automatically identify patients at risk for 30‐day readmission. J Hosp Med. 2013;8(12):689–695.
- , , , , , . A systematic review to inform institutional decisions about the use of extracorporeal membrane oxygenation during the H1N1 influenza pandemic. Crit Care Med. 2010;38(6):1398–1404.
- , , , . Heparin flushing and other interventions to maintain patency of central venous catheters: a systematic review. J Adv Nurs. 2009;65(10):2007–2021.
- , , . Response rates to mail surveys published in medical journals. J Clin Epidemiol. 1997;50(10):1129–1136.
- , . Physician response to surveys: a review of the literature. Am J Prev Med. 2001;20(1):61–67.
- , , , , . Systematic review and cost analysis comparing use of chlorhexidine with use of iodine for preoperative skin antisepsis to prevent surgical site infection. Infect Control Hosp Epidemiol. 2010;31(12):1219–1229.
- , , . Antifibrinolytic use in adult cardiac surgery. Curr Opin Hematol. 2007;14(5):455–467.
- , , , , . Teaching evidence assimilation for collaborative health care (TEACH) 2009–2014: building evidence‐based capacity within health care provider organizations. EGEMS (Wash DC). 2015;3(2):1165.
- , , , , , . Cleaning hospital room surfaces to prevent health care‐associated infections: a technical brief [published online August 11, 2015]. Ann Intern Med. doi:10.7326/M15‐1192.
- , , , Healthcare Infection Control Practices Advisory Committee. Updating the guideline development methodology of the Healthcare Infection Control Practices Advisory Committee (HICPAC). Am J Infect Control. 2010;38(4):264–273.
- U.S. Food and Drug Administration. FDA basics—What is a medical device? Available at: http://www.fda.gov/AboutFDA/Transparency/Basics/ucm211822.htm. Accessed November 12, 2014.
Hospital evidence‐based practice centers (EPCs) are structures with the potential to facilitate the integration of evidence into institutional decision making to close knowing‐doing gaps[1, 2, 3, 4, 5, 6]; in the process, they can support the evolution of their parent institutions into learning healthcare systems.[7] The potential of hospital EPCs stems from their ability to identify and adapt national evidence‐based guidelines and systematic reviews for the local setting,[8] create local evidence‐based guidelines in the absence of national guidelines, use local data to help define problems and assess the impact of solutions,[9] and implement evidence into practice through computerized clinical decision support (CDS) interventions and other quality‐improvement (QI) initiatives.[9, 10] As such, hospital EPCs have the potential to strengthen relationships and understanding between clinicians and administrators[11]; foster a culture of evidence‐based practice; and improve the quality, safety, and value of care provided.[10]
Formal hospital EPCs remain uncommon in the United States,[10, 11, 12] though their numbers have expanded worldwide.[13, 14] This growth is due not to any reduced role for national EPCs, such as the National Institute for Health and Clinical Excellence[15] in the United Kingdom, or the 13 EPCs funded by the Agency for Healthcare Research and Quality (AHRQ)[16, 17] in the United States. Rather, this growth is fueled by the heightened awareness that the value of healthcare interventions often needs to be assessed locally, and that clinical guidelines that consider local context have a greater potential to improve quality and efficiency.[9, 18, 19]
Despite the increasing number of hospital EPCs globally, their impact on administrative and clinical decision making has rarely been examined,[13, 20] especially for hospital EPCs in the United States. The few studies that have assessed the impact of hospital EPCs on institutional decision making have done so in the context of technology acquisition, neglecting the role hospital EPCs may play in the integration of evidence into clinical practice. For example, the Technology Assessment Unit at McGill University Health Center found that of the 27 reviews commissioned in their first 5 years, 25 were implemented, with 6 (24%) recommending investments in new technologies and 19 (76%) recommending rejection, for a reported net hospital savings of $10 million.[21] Understanding the activities and impact of hospital EPCs is particularly critical for hospitalist leaders, who could leverage hospital EPCs to inform efforts to support the quality, safety, and value of care provided, or who may choose to establish or lead such infrastructure. The availability of such opportunities could also support hospitalist recruitment and retention.
In 2006, the University of Pennsylvania Health System (UPHS) created the Center for Evidence‐based Practice (CEP) to support the integration of evidence into practice to strengthen quality, safety, and value.[10] Cofounded by hospitalists with formal training in clinical epidemiology, the CEP performs rapid systematic reviews of the scientific literature to inform local practice and policy. In this article, we describe the first 8 years of the CEP's evidence synthesis activities and examine its impact on decision making across the health system.
METHODS
Setting
The UPHS includes 3 acute care hospitals, and inpatient facilities specializing in acute rehabilitation, skilled nursing, long‐term acute care, and hospice, with a capacity of more than 1800 beds and 75,000 annual admissions, as well as primary care and specialty clinics with more than 2 million annual outpatient visits. The CEP is funded by and organized within the Office of the UPHS Chief Medical Officer, serves all UPHS facilities, has an annual budget of approximately $1 million, and is currently staffed by a hospitalist director, 3 research analysts, 6 physician and nurse liaisons, a health economist, biostatistician, administrator, and librarians, totaling 5.5 full time equivalents.
The mission of the CEP is to support the quality, safety, and value of care at Penn through evidence‐based practice. To accomplish this mission, the CEP performs rapid systematic reviews, translates evidence into practice through the use of CDS interventions and clinical pathways, and offers education in evidence‐based decision making to trainees, staff, and faculty. This study is focused on the CEP's evidence synthesis activities.
Typically, clinical and administrative leaders submit a request to the CEP for an evidence review, the request is discussed and approved at the weekly staff meeting, and a research analyst and clinical liaison are assigned to the request and communicate with the requestor to clearly define the question of interest. Subsequently, the research analyst completes a protocol, a draft search, and a draft report, each reviewed and approved by the clinical liaison and requestor. The final report is posted to the website, disseminated to all key stakeholders across the UPHS as identified by the clinical liaisons, and integrated into decision making through various routes, including in‐person presentations to decision makers, and CDS and QI initiatives.
Study Design
The study included an analysis of an internal database of evidence reviews and a survey of report requestors, and was exempted from institutional review board review. Survey respondents were informed that their responses would be confidential and did not receive incentives.
Internal Database of Reports
Data from the CEP's internal management database were analyzed for its first 8 fiscal years (July 2006June 2014). Variables included requestor characteristics, report characteristics (eg, technology reviewed, clinical specialty examined, completion time, and performance of meta‐analyses and GRADE [Grading of Recommendations Assessment, Development and Evaluation] analyses[22]), report use (eg, integration of report into CDS interventions) and dissemination beyond the UPHS (eg, submission to Center for Reviews and Dissemination [CRD] Health Technology Assessment [HTA] database[23] and to peer‐reviewed journals). Report completion time was defined as the time between the date work began on the report and the date the final report was sent to the requestor. The technology categorization scheme was adapted from that provided by Goodman (2004)[24] and the UK National Institute for Health Research HTA Programme.[25] We systematically assigned the technology reviewed in each report to 1 of 8 mutually exclusive categories. The clinical specialty examined in each report was determined using an algorithm (see Supporting Information, Appendix 1, in the online version of this article).
We compared the report completion times and the proportions of requestor types, technologies reviewed, and clinical specialties examined in the CEP's first 4 fiscal years (July 2006June 2010) to those in the CEP's second 4 fiscal years (July 2010June 2014) using t tests and 2 tests for continuous and categorical variables, respectively.
Survey
We conducted a Web‐based survey (see Supporting Information, Appendix 2, in the online version of this article) of all requestors of the 139 rapid reviews completed in the last 4 fiscal years. Participants who requested multiple reports were surveyed only about the most recent report. Requestors were invited to participate in the survey via e‐mail, and follow‐up e‐mails were sent to nonrespondents at 7, 14, and 16 days. Nonrespondents and respondents were compared with respect to requestor type (physician vs nonphysician) and topic evaluated (traditional HTA topics such as drugs, biologics, and devices vs nontraditional HTA topics such as processes of care). The survey was administered using REDCap[26] electronic data capture tools. The 44‐item questionnaire collected data on the interaction between the requestor and the CEP, report characteristics, report impact, and requestor satisfaction.
Survey results were imported into Microsoft Excel (Microsoft Corp, Redmond, WA) and SPSS (IBM, Armonk, NY) for analysis. Descriptive statistics were generated, and statistical comparisons were conducted using 2 and Fisher exact tests.
RESULTS
Evidence Synthesis Activity
The CEP has produced several different report products since its inception. Evidence reviews (57%, n = 142) consist of a systematic review and analysis of the primary literature. Evidence advisories (32%, n = 79) are summaries of evidence from secondary sources such as guidelines or systematic reviews. Evidence inventories (3%, n = 7) are literature searches that describe the quantity and focus of available evidence, without analysis or synthesis.[27]
The categories of technologies examined, including their definitions and examples, are provided in Table 1. Drugs (24%, n = 60) and devices/equipment/supplies (19%, n = 48) were most commonly examined. The proportion of reports examining technology types traditionally evaluated by HTA organizations significantly decreased when comparing the first 4 years of CEP activity to the second 4 years (62% vs 38%, P < 0.01), whereas reports examining less traditionally reviewed categories increased (38% vs 62%, P < 0.01). The most common clinical specialties represented by the CEP reports were nursing (11%, n = 28), general surgery (11%, n = 28), critical care (10%, n = 24), and general medicine (9%, n = 22) (see Supporting Information, Appendix 3, in the online version of this article). Clinical departments were the most common requestors (29%, n = 72) (Table 2). The proportion of requests from clinical departments significantly increased when comparing the first 4 years to the second 4 years (20% vs 36%, P < 0.01), with requests from purchasing committees significantly decreasing (25% vs 6%, P < 0.01). The overall report completion time was 70 days, and significantly decreased when comparing the first 4 years to the second 4 years (89 days vs 50 days, P < 0.01).
| Category | Definition | Examples | Total | 20072010 | 20112014 | P Value |
|---|---|---|---|---|---|---|
| Total | 249 (100%) | 109 (100%) | 140 (100%) | |||
| Drug | A report primarily examining the efficacy/effectiveness, safety, appropriate use, or cost of a pharmacologic agent | Celecoxib for pain in joint arthroplasty; colchicine for prevention of pericarditis and atrial fibrillation | 60 (24%) | 35 (32%) | 25 (18%) | 0.009 |
| Device, equipment, and supplies | A report primarily examining the efficacy/effectiveness, safety, appropriate use, or cost of an instrument, apparatus, implement, machine, contrivance, implant, in vitro reagent, or other similar or related article, including a component part, or accessory that is intended for use in the prevention, diagnosis, or treatment of disease and does not achieve its primary intended purposes though chemical action or metabolism[50] | Thermometers for pediatric use; femoral closure devices for cardiac catheterization | 48 (19%) | 25 (23%) | 23 (16%) | 0.19 |
| Process of care | A report primarily examining a clinical pathway or a clinical practice guideline that significantly involves elements of prevention, diagnosis, and/or treatment or significantly incorporates 2 or more of the other technology categories | Preventing patient falls; prevention and management of delirium | 31 (12%) | 18 (17%) | 13 (9%) | 0.09 |
| Test, scale, or risk factor | A report primarily examining the efficacy/effectiveness, safety, appropriate use, or cost of a test intended to screen for, diagnose, classify, or monitor the progression of a disease | Computed tomography for acute chest pain; urine drug screening in chronic pain patients on opioid therapy | 31 (12%) | 8 (7%) | 23 (16%) | 0.03 |
| Medical/surgical procedure | A report primarily examining the efficacy/effectiveness, safety, appropriate use, or cost of a medical intervention that is not a drug, device, or test or of the application or removal of a device | Biliary drainage for chemotherapy patients; cognitive behavioral therapy for insomnia | 26 (10%) | 8 (7%) | 18 (13%) | 0.16 |
| Policy or organizational/managerial system | A report primarily examining laws or regulations; the organization, financing, or delivery of care, including settings of care; or healthcare providers | Medical care costs and productivity changes associated with smoking; physician training and credentialing for robotic surgery in obstetrics and gynecology | 26 (10%) | 4 (4%) | 22 (16%) | 0.002 |
| Support system | A report primarily examining the efficacy/effectiveness, safety, appropriate use, or cost of an intervention designed to provide a new or improved service to patients or healthcare providers that does not fall into 1 of the other categories | Reconciliation of data from differing electronic medical records; social media, text messaging, and postdischarge communication | 14 (6%) | 3 (3%) | 11 (8%) | 0.09 |
| Biologic | A report primarily examining the efficacy/effectiveness, safety, appropriate use, or cost of a product manufactured in a living system | Recombinant factor VIIa for cardiovascular surgery; osteobiologics for orthopedic fusions | 13 (5%) | 8 (7%) | 5 (4%) | 0.19 |
| Category | Total | 20072010 | 20112014 | P Value |
|---|---|---|---|---|
| ||||
| Total | 249 (100%) | 109 (100%) | 140 (100%) | |
| Clinical department | 72 (29%) | 22 (20%) | 50 (36%) | 0.007 |
| CMO | 47 (19%) | 21 (19%) | 26 (19%) | 0.92 |
| Purchasing committee | 35 (14%) | 27 (25%) | 8 (6%) | <0.001 |
| Formulary committee | 22 (9%) | 12 (11%) | 10 (7%) | 0.54 |
| Quality committee | 21 (8%) | 11 (10%) | 10 (7%) | 0.42 |
| Administrative department | 19 (8%) | 5 (5%) | 14 (10%) | 0.11 |
| Nursing | 14 (6%) | 4 (4%) | 10 (7%) | 0.23 |
| Other* | 19 (8%) | 7 (6%) | 12 (9%) | 0.55 |
Thirty‐seven (15%) reports included meta‐analyses conducted by CEP staff. Seventy‐five reports (30%) contained an evaluation of the quality of the evidence base using GRADE analyses.[22] Of these reports, the highest GRADE of evidence available for any comparison of interest was moderate (35%, n = 26) or high (33%, n = 25) in most cases, followed by very low (19%, n = 14) and low (13%, n = 10).
Reports were disseminated in a variety of ways beyond direct dissemination and presentation to requestors and posting on the center website. Thirty reports (12%) informed CDS interventions, 24 (10%) resulted in peer‐reviewed publications, and 204 (82%) were posted to the CRD HTA database.
Evidence Synthesis Impact
A total of 139 reports were completed between July 2010 and June 2014 for 65 individual requestors. Email invitations to participate in the survey were sent to the 64 requestors employed by the UPHS. The response rate was 72% (46/64). The proportions of physician requestors and traditional HTA topics evaluated were similar across respondents and nonrespondents (43% [20/46] vs 39% [7/18], P = 0.74; and 37% [17/46] vs 44% [8/18], P = 0.58, respectively). Aggregated survey responses are presented for items using a Likert scale in Figure 1, and for items using a yes/no or ordinal scale in Table 3.
| Items | % of Respondents Responding Affirmatively |
|---|---|
| Percentage of Respondents Ranking as First Choice* | |
| |
| Requestor activity | |
| What factors prompted you to request a report from CEP? (Please select all that apply.) | |
| My own time constraints | 28% (13/46) |
| CEP's ability to identify and synthesize evidence | 89% (41/46) |
| CEP's objectivity | 52% (24/46) |
| Recommendation from colleague | 30% (14/46) |
| Did you conduct any of your own literature searches before contacting CEP? | 67% (31/46) |
| Did you obtain and read any of the articles cited in CEP's report? | 63% (29/46) |
| Did you read the following sections of CEP's report? | |
| Evidence summary (at beginning of report) | 100% (45/45) |
| Introduction/background | 93% (42/45) |
| Methods | 84% (38/45) |
| Results | 98% (43/43) |
| Conclusion | 100% (43/43) |
| Report dissemination | |
| Did you share CEP's report with anyone NOT involved in requesting the report or in making the final decision? | 67% (30/45) |
| Did you share CEP's report with anyone outside of Penn? | 7% (3/45) |
| Requestor preferences | |
| Would it be helpful for CEP staff to call you after you receive any future CEP reports to answer any questions you might have? | 55% (24/44) |
| Following any future reports you request from CEP, would you be willing to complete a brief questionnaire? | 100% (44/44) |
| Please rank how you would prefer to receive reports from CEP in the future. | |
| E‐mail containing the report as a PDF attachment | 77% (34/44) |
| E‐mail containing a link to the report on CEP's website | 16% (7/44) |
| In‐person presentation by the CEP analyst writing the report | 18% (8/44) |
| In‐person presentation by the CEP director involved in the report | 16% (7/44) |
In general, respondents found reports easy to request, easy to use, timely, and relevant, resulting in high requestor satisfaction. In addition, 98% described the scope of content and level of detail as about right. Report impact was rated highly as well, with the evidence summary and conclusions rated as the most critical to decision making. A majority of respondents indicated that reports confirmed their tentative decision (77%, n = 34), whereas some changed their tentative decision (7%, n = 3), and others suggested the report had no effect on their tentative decision (16%, n = 7). Respondents indicated the amount of time that elapsed between receiving reports and making final decisions was 1 to 7 days (5%, n = 2), 8 to 30 days (40%, n = 17), 1 to 3 months (37%, n = 16), 4 to 6 months (9%, n = 4), or greater than 6 months (9%, n = 4). The most common reasons cited for requesting a report were the CEP's evidence synthesis skills and objectivity.
DISCUSSION
To our knowledge, this is the first comprehensive description and assessment of evidence synthesis activity by a hospital EPC in the United States. Our findings suggest that clinical and administrative leaders will request reports from a hospital EPC, and that hospital EPCs can promptly produce reports when requested. Moreover, these syntheses can address a wide range of clinical and policy topics, and can be disseminated through a variety of routes. Lastly, requestors are satisfied by these syntheses, and report that they inform decision making. These results suggest that EPCs may be an effective infrastructure paradigm for promoting evidence‐based decision making within healthcare provider organizations, and are consistent with previous analyses of hospital‐based EPCs.[21, 28, 29]
Over half of report requestors cited CEP's objectivity as a factor in their decision to request a report, underscoring the value of a neutral entity in an environment where clinical departments and hospital committees may have competing interests.[10] This asset was 1 of the primary drivers for establishing our hospital EPC. Concerns by clinical executives about the influence of industry and local politics on institutional decision making, and a desire to have clinical evidence more systematically and objectively integrated into decision making, fueled our center's funding.
The survey results also demonstrate that respondents were satisfied with the reports for many reasons, including readability, concision, timeliness, scope, and content, consistent with the evaluation of the French hospital‐based EPC CEDIT (French Committee for the Assessment and Dissemination of Technological Innovations).[29] Given the importance of readability, concision, and relevance that has been previously described,[16, 28, 30] nearly all CEP reports contain an evidence summary on the first page that highlights key findings in a concise, user‐friendly format.[31] The evidence summaries include bullet points that: (1) reference the most pertinent guideline recommendations along with their strength of recommendation and underlying quality of evidence; (2) organize and summarize study findings using the most critical clinical outcomes, including an assessment of the quality of the underlying evidence for each outcome; and (3) note important limitations of the findings.
Evidence syntheses must be timely to allow decision makers to act on the findings.[28, 32] The primary criticism of CEDIT was the lag between requests and report publication.[29] Rapid reviews, designed to inform urgent decisions, can overcome this challenge.[31, 33, 34] CEP reviews required approximately 2 months to complete on average, consistent with the most rapid timelines reported,[31, 33, 34] and much shorter than standard systematic review timelines, which can take up to 12 to 24 months.[33] Working with requestors to limit the scope of reviews to those issues most critical to a decision, using secondary resources when available, and hiring experienced research analysts help achieve these efficiencies.
The study by Bodeau‐Livinec also argues for the importance of report accessibility to ensure dissemination.[29] This is consistent with the CEP's approach, where all reports are posted on the UPHS internal website. Many also inform QI initiatives, as well as CDS interventions that address topics of general interest to acute care hospitals, such as venous thromboembolism (VTE) prophylaxis,[35] blood product transfusions,[36] sepsis care,[37, 38] and prevention of catheter‐associated urinary tract infections (CAUTI)[39] and hospital readmissions.[40] Most reports are also listed in an international database of rapid reviews,[23] and reports that address topics of general interest, have sufficient evidence to synthesize, and have no prior published systematic reviews are published in the peer‐reviewed literature.[41, 42]
The majority of reports completed by the CEP were evidence reviews, or systematic reviews of primary literature, suggesting that CEP reports often address questions previously unanswered by existing published systematic reviews; however, about a third of reports were evidence advisories, or summaries of evidence from preexisting secondary sources. The relative scarcity of high‐quality evidence bases in those reports where GRADE analyses were conducted might be expected, as requestors may be more likely to seek guidance when the evidence base on a topic is lacking. This was further supported by the small percentage (15%) of reports where adequate data of sufficient homogeneity existed to allow meta‐analyses. The small number of original meta‐analyses performed also reflects our reliance on secondary resources when available.
Only 7% of respondents reported that tentative decisions were changed based on their report. This is not surprising, as evidence reviews infrequently result in clear go or no go recommendations. More commonly, they address or inform complex clinical questions or pathways. In this context, the change/confirm/no effect framework may not completely reflect respondents' use of or benefit from reports. Thus, we included a diverse set of questions in our survey to best estimate the value of our reports. For example, when asked whether the report answered the question posed, informed their final decision, or was consistent with their final decision, 91%, 79%, and 71% agreed or strongly agreed, respectively. When asked whether they would request a report again if they had to do it all over, recommend CEP to their colleagues, and be likely to request reports in the future, at least 95% of survey respondents agreed or strongly agreed. In addition, no respondent indicated that their report was not timely enough to influence their decision. Moreover, only a minority of respondents expressed disappointment that the CEP's report did not provide actionable recommendations due to a lack of published evidence (9%, n = 4). Importantly, the large proportion of requestors indicating that reports confirmed their tentative decisions may be a reflection of hindsight bias.
The most apparent trend in the production of CEP reviews over time is the relative increase in requests by clinical departments, suggesting that the CEP is being increasingly consulted to help define best clinical practices. This is also supported by the relative increase in reports focused on policy or organizational/managerial systems. These findings suggest that hospital EPCs have value beyond the traditional realm of HTA.
This study has a number of limitations. First, not all of the eligible report requestors responded to our survey. Despite this, our response rate of 72% compares favorably with surveys published in medical journals.[43] In addition, nonresponse bias may be less important in physician surveys than surveys of the general population.[44] The similarity in requestor and report characteristics for respondents and nonrespondents supports this. Second, our survey of impact is self‐reported rather than an evaluation of actual decision making or patient outcomes. Thus, the survey relies on the accuracy of the responses. Third, recall bias must be considered, as some respondents were asked to evaluate reports that were greater than 1 year old. To reduce this bias, we asked respondents to consider the most recent report they requested, included that report as an attachment in the survey request, and only surveyed requestors from the most recent 4 of the CEP's 8 fiscal years. Fourth, social desirability bias could have also affected the survey responses, though it was likely minimized by the promise of confidentiality. Fifth, an examination of the impact of the CEP on costs was outside the scope of this evaluation; however, such information may be important to those assessing the sustainability or return on investment of such centers. Simple approaches we have previously used to approximate the value of our activities include: (1) estimating hospital cost savings resulting from decisions supported by our reports, such as the use of technologies like chlorhexidine for surgical site infections[45] or discontinuation of technologies like aprotinin for cardiac surgery[46]; and (2) estimating penalties avoided or rewards attained as a result of center‐led initiatives, such as those to increase VTE prophylaxis,[35] reduce CAUTI rates,[39] and reduce preventable mortality associated with sepsis.[37, 38] Similarly, given the focus of this study on the local evidence synthesis activities of our center, our examination did not include a detailed description of our CDS activities, or teaching activities, including our multidisciplinary workshops for physicians and nurses in evidence‐based QI[47] and our novel evidence‐based practice curriculum for medical students. Our study also did not include a description of our extramural activities, such as those supported by our contract with AHRQ as 1 of their 13 EPCs.[16, 17, 48, 49] A consideration of all of these activities enables a greater appreciation for the potential of such centers. Lastly, we examined a single EPC, which may not be representative of the diversity of hospitals and hospital staff across the United States. However, our EPC serves a diverse array of patient populations, clinical services, and service models throughout our multientity academic healthcare system, which may improve the generalizability of our experience to other settings.
As next steps, we recommend evaluation of other existing hospital EPCs nationally. Such studies could help hospitals and health systems ascertain which of their internal decisions might benefit from locally sourced rapid systematic reviews and determine whether an in‐house EPC could improve the value of care delivered.
In conclusion, our findings suggest that hospital EPCs within academic healthcare systems can efficiently synthesize and disseminate evidence for a variety of stakeholders. Moreover, these syntheses impact decision making in a variety of hospital contexts and clinical specialties. Hospitals and hospitalist leaders seeking to improve the implementation of evidence‐based practice at a systems level might consider establishing such infrastructure locally.
Acknowledgements
The authors thank Fran Barg, PhD (Department of Family Medicine and Community Health, University of Pennsylvania Perelman School of Medicine) and Joel Betesh, MD (University of Pennsylvania Health System) for their contributions to developing the survey. They did not receive any compensation for their contributions.
Disclosures: An earlier version of this work was presented as a poster at the 2014 AMA Research Symposium, November 7, 2014, Dallas, Texas. Mr. Jayakumar reports having received a University of Pennsylvania fellowship as a summer intern at the Center for Evidence‐based Practice. Dr. Umscheid cocreated and directs a hospital evidence‐based practice center, is the Senior Associate Director of an Agency for Healthcare Research and Quality Evidence‐Based Practice Center, and is a past member of the Medicare Evidence Development and Coverage Advisory Committee, which uses evidence reports developed by the Evidence‐based Practice Centers of the Agency for Healthcare Research and Quality. Dr. Umscheid's contribution was supported in part by the National Center for Research Resources, grant UL1RR024134, which is now at the National Center for Advancing Translational Sciences, grant UL1TR000003. The content of this article is solely the responsibility of the authors and does not necessarily represent the official views of the National Institutes of Health. None of the funders had a role in the design and conduct of the study; collection, management, analysis, and interpretation of the data; preparation, review, or approval of the manuscript; and decision to submit the manuscript for publication. Dr. Lavenberg, Dr. Mitchell, and Mr. Leas are employed as research analysts by a hospital evidence‐based practice center. Dr. Doshi is supported in part by a hospital evidence‐based practice center and is an Associate Director of an Agency for Healthcare Research and Quality Evidence‐based Practice Center. Dr. Goldmann is emeritus faculty at Penn, is supported in part by a hospital evidence‐based practice center, and is the Vice President and Chief Quality Assurance Officer in Clinical Solutions, a division of Elsevier, Inc., a global publishing company, and director of the division's Evidence‐based Medicine Center. Dr. Williams cocreated and codirects a hospital evidence‐based practice center. Dr. Brennan has oversight for and helped create a hospital evidence‐based practice center.
- , . “Bench to behavior”: translating comparative effectiveness research into improved clinical practice. Health Aff (Millwood). 2010;29(10):1891–1900.
- , , . Evaluating the status of “translating research into practice” at a major academic healthcare system. Int J Technol Assess Health Care. 2009;25(1):84–89.
- , , , . Five reasons that many comparative effectiveness studies fail to change patient care and clinical practice. Health Aff (Millwood). 2012;31(10):2168–2175.
- , , , , , . Fostering implementation of health services research findings into practice: a consolidated framework for advancing implementation science. Implement Sci. 2009;4(1):50.
- , . From best evidence to best practice: effective implementation of change in patients' care. Lancet. 2003;362(9391):1225–1230.
- , . Incentivizing “structures” over “outcomes” to bridge the knowing‐doing gap. JAMA Intern Med. 2015;175(3):354.
- Olsen L, Aisner D, McGinnis JM, eds. Institute of Medicine (US) Roundtable on Evidence‐Based Medicine. The Learning Healthcare System: Workshop Summary. Washington, DC: National Academies Press; 2007. Available at: http://www.ncbi.nlm.nih.gov/books/NBK53494/. Accessed October 29, 2014.
- , , , . Adapting clinical practice guidelines to local context and assessing barriers to their use. Can Med Assoc J. 2010;182(2):E78–E84.
- , , , . Integrating local data into hospital‐based healthcare technology assessment: two case studies. Int J Technol Assess Health Care. 2010;26(3):294–300.
- , , . Hospital‐based comparative effectiveness centers: translating research into practice to improve the quality, safety and value of patient care. J Gen Intern Med. 2010;25(12):1352–1355.
- , , , , . Health technology assessment at the University of California‐San Francisco. J Healthc Manag Am Coll Healthc Exec. 2011;56(1):15–29; discussion 29–30.
- , . Kaiser Permanente Southern California regional technology management process: evidence‐based medicine operationalized. Perm J. 2006;10(1):38–41.
- . Hospital‐based health technology assessment: developments to date. Pharmacoeconomics. 2014;32(9):819–824.
- , , , . Hospital based health technology assessment world‐wide survey. Available at: http://www.htai.org/fileadmin/HTAi_Files/ISG/HospitalBasedHTA/2008Files/HospitalBasedHTAISGSurveyReport.pdf. Accessed October 11, 2015.
- , . At the center of health care policy making: the use of health technology assessment at NICE. Med Decis Making. 2013;33(3):320–324.
- , , . Better information for better health care: the Evidence‐based Practice Center program and the Agency for Healthcare Research and Quality. Ann Intern Med. 2005;142(12 part 2):1035–1041.
- , . AHRQ's Effective Health Care Program: why comparative effectiveness matters. Am J Med Qual. 2009;24(1):67–70.
- , . Effect of clinical guidelines on medical practice: a systematic review of rigorous evaluations. Lancet. 1993;342(8883):1317–1322.
- , , , et al. Lost in knowledge translation: time for a map? J Contin Educ Health Prof. 2006;26(1):13–24.
- , , , . Effects and repercussions of local/hospital‐based health technology assessment (HTA): a systematic. Syst Rev. 2014;3:129.
- , , , et al. Impact of TAU Reports. McGill University Health Centre. Available at: https://francais.mcgill.ca/files/tau/FINAL_TAU_IMPACT_REPORT_FEB_2008.pdf. Published Feb 1, 2008. Accessed August 19, 2014.
- , , , et al. GRADE: an emerging consensus on rating quality of evidence and strength of recommendations. BMJ. 2008;336(7650):924–926.
- , , . Centre for Reviews and Dissemination databases: value, content, and developments. Int J Technol Assess Health Care. 2010;26(4):470–472.
- . HTA 101. Introduction to Health Technology Assessment. Available at: https://www.nlm.nih.gov/nichsr/hta101/ta10103.html. Accessed October 11, 2015.
- National Institute for Health Research. Remit. NIHR HTA Programme. Available at: http://www.nets.nihr.ac.uk/programmes/hta/remit. Accessed August 20, 2014.
- , , , , , . Research Electronic Data Capture (REDCap)—a metadata‐driven methodology and workflow process for providing translational research informatics support. J Biomed Inform. 2009;42(2):377–381.
- , , , . When the decision is what to decide: Using evidence inventory reports to focus health technology assessments. Int J Technol Assess Health Care. 2011;27(2):127–132.
- , . End‐user involvement in health technology assessment (HTA) development: a way to increase impact. Int J Technol Assess Health Care. 2005;21(02):263–267.
- , , , , . Impact of CEDIT recommendations: an example of health technology assessment in a hospital network. Int J Technol Assess Health Care. 2006;22(2):161–168.
- , , , . Increasing the relevance of research to health care managers: hospital CEO imperatives for improving quality and lowering costs. Health Care Manage Rev. 2007;32(2):150–159.
- , , , , . Evidence summaries: the evolution of a rapid review approach. Syst Rev. 2012;1(1):10.
- , , , . Health care decision makers' use of comparative effectiveness research: report from a series of focus groups. J Manag Care Pharm. 2013;19(9):745–754.
- , , , et al. Rapid reviews versus full systematic reviews: an inventory of current methods and practice in health technology assessment. Int J Technol Assess Health Care. 2008;24(2):133–139.
- , , , et al. EPC Methods: An Exploration of Methods and Context for the Production of Rapid Reviews. Rockville, MD: Agency for Healthcare Research and Quality; 2015. Available at: http://www.ncbi.nlm.nih.gov/books/NBK274092. Accessed March 5, 2015.
- , , , , . Effectiveness of a novel and scalable clinical decision support intervention to improve venous thromboembolism prophylaxis: a quasi‐experimental study. BMC Med Inform Decis Mak. 2012;12:92.
- . Order sets in electronic health records: principles of good practice. Chest. 2013;143(1):228–235.
- , , , et al. Development, implementation, and impact of an automated early warning and response system for sepsis. J Hosp Med. 2015;10(1):26–31.
- , , , et al. Clinician perception of the effectiveness of an automated early warning and response system for sepsis in an academic medical center. Ann Am Thorac Soc. 2015;12(10):1514–1519.
- , , , , , . Usability and impact of a computerized clinical decision support intervention designed to reduce urinary catheter utilization and catheter‐associated urinary tract infections. Infect Control Hosp Epidemiol. 2014;35(9):1147–1155.
- , , , et al. The readmission risk flag: using the electronic health record to automatically identify patients at risk for 30‐day readmission. J Hosp Med. 2013;8(12):689–695.
- , , , , , . A systematic review to inform institutional decisions about the use of extracorporeal membrane oxygenation during the H1N1 influenza pandemic. Crit Care Med. 2010;38(6):1398–1404.
- , , , . Heparin flushing and other interventions to maintain patency of central venous catheters: a systematic review. J Adv Nurs. 2009;65(10):2007–2021.
- , , . Response rates to mail surveys published in medical journals. J Clin Epidemiol. 1997;50(10):1129–1136.
- , . Physician response to surveys: a review of the literature. Am J Prev Med. 2001;20(1):61–67.
- , , , , . Systematic review and cost analysis comparing use of chlorhexidine with use of iodine for preoperative skin antisepsis to prevent surgical site infection. Infect Control Hosp Epidemiol. 2010;31(12):1219–1229.
- , , . Antifibrinolytic use in adult cardiac surgery. Curr Opin Hematol. 2007;14(5):455–467.
- , , , , . Teaching evidence assimilation for collaborative health care (TEACH) 2009–2014: building evidence‐based capacity within health care provider organizations. EGEMS (Wash DC). 2015;3(2):1165.
- , , , , , . Cleaning hospital room surfaces to prevent health care‐associated infections: a technical brief [published online August 11, 2015]. Ann Intern Med. doi:10.7326/M15‐1192.
- , , , Healthcare Infection Control Practices Advisory Committee. Updating the guideline development methodology of the Healthcare Infection Control Practices Advisory Committee (HICPAC). Am J Infect Control. 2010;38(4):264–273.
- U.S. Food and Drug Administration. FDA basics—What is a medical device? Available at: http://www.fda.gov/AboutFDA/Transparency/Basics/ucm211822.htm. Accessed November 12, 2014.
© 2015 Society of Hospital Medicine
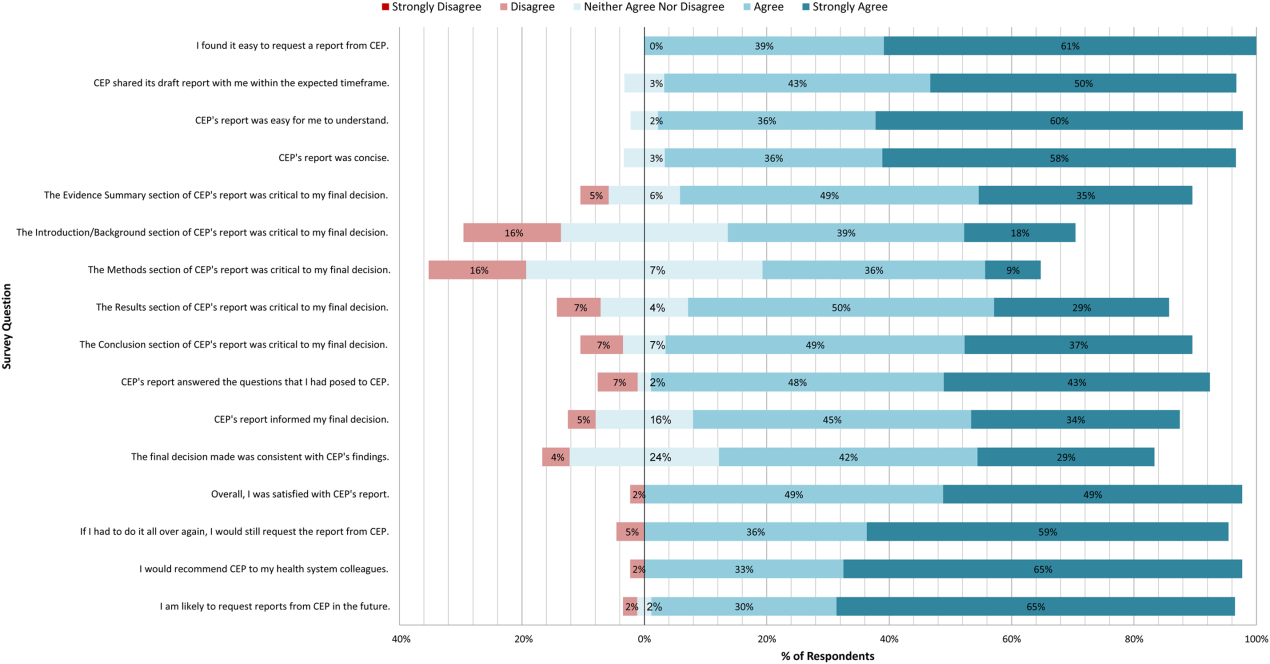
Opioid-Induced Androgen Deficiency in Veterans With Chronic Nonmalignant Pain
According to the CDC, the medical use of opioid painkillers has increased at least 10-fold during the past 20 years, “because of a movement toward more aggressive management of pain.”1 Although opioid therapy is generally considered effective for the treatment of pain, long-term use (both orally and intrathecally) is associated with adverse effects (AEs) such as constipation, fatigue, nausea, sleep disturbances, depression, sexual dysfunction, and hypogonadism.2,3Opioid-induced androgen deficiency (OPIAD), as defined by Smith and Elliot, is a clinical syndrome characterized by inappropriately low concentrations of gonadotropins (specifically, follicle-stimulating hormone [FSH] and luteinizing hormone [LH]), which leads to inadequate production of sex hormones, including estradiol and testosterone.4
Related: Testosterone Replacement Therapy: Playing Catch-up With Patients
The mechanism behind this phenomenon is initiated by either endogenous or exogenous opioids acting on opioid receptors in the hypothalamus, which causes a decrease in the release of gonadotropin- releasing hormone (GnRH). This decrease in GnRH causes a reduction in the release of LH and FSH from the pituitary gland as well as testosterone or estradiol from the gonads.4,5 Various guidelines report different cutoffs for the lower limit of normal total testosterone: The Endocrine Society recommends 300 ng/dL, the American Association of Clinical Endocrinologists suggests 200 ng/dL, and various other organizations suggest 230 ng/dL.6-8 Hypotestosteronism can result in patients presenting with a broad spectrum of clinical symptoms, including reduced libido, erectile dysfunction (ED), fatigue, hot flashes, depression, anemia, decreased muscle mass, weight gain, and osteopenia or osteoporosis.4 Women with low testosterone levels can experience irregular menstrual periods, oligomenorrhea, or amenorrhea.9 Opioid-induced androgen deficiency often goes unrecognized and untreated. The reported prevalence of opioid-induced hypogonadism ranges from 21% to 86%.4,9 Given the growing number of patients on chronic opioid therapy, OPIAD warrants further investigation to identify the prevalence in the veteran population to appropriately monitor and manage this deficiency.
The objective of this retrospective review was to identify the presence of secondary hypogonadism in chronic opioid users among a cohort of veterans receiving chronic opioids for nonmalignant pain. In addition to identifying the presence of secondary hypogonadism, the relationship between testosterone concentrations and total daily morphine equivalent doses (MEDs) was reviewed. These data along with the new information recently published on testosterone replacement therapy (TRT) and cardiovascular (CV) risk were then used to evaluate current practices at the West Palm Beach VAMC for OPIAD monitoring and management and to modify and update the local Criteria for Use (CFU) for TRT.
Methods
Patient data from the West Palm Beach VAMC in Florida from January 2013 to December 2013 were reviewed to identify patients who had a total testosterone (TT) level measured. All patient appointments for evaluation and treatment by the clinical pharmacy specialist in pain management were reviewed for data collection. This retrospective review was approved by the scientific advisory committee as part of the facility’s ongoing performance improvement efforts as defined by VHA Handbook 1058.05 and did not require written patient consent.10
Several distinct TT level data were collected. The descriptive data included patient age; gender; type of treated pain; testosterone level(s) drawn, including TT level before opioid therapy, TT level before/during/after TRT, and current total testosterone level; total daily MED of opioid therapy; duration of chronic opioid therapy; symptoms of exhibited hypogonadism; TRT formulation, dose, and duration; TRT prescriber; symptom change (if any); and laboratory tests ordered for TRT monitoring (lipid profile, liver profile, complete blood count, LH/FSH, and prostate specific antigen [PSA] panel).5,11,12
Related: Combination Treatment Relieves Opioid-Induced Constipation
Daily MED of opioid therapy was calculated using the VA/DoD opioid conversion table for patients on oxycodone, hydromorphone, or hydrocodone.13 For those on the fentanyl patch or methadone, conversion factors of 1:2 (fentanyl [µg/h]:morphine [mg/d]) and 1:3 (methadone:morphine) were used to convert to the MED.14 For patients on the buprenorphine patch, the package insert was used to convert to the corresponding MED.15 Combination therapies used the applicable conversions to calculate the total daily MED.
Once the data were collected, descriptive statistics were used to analyze the data. In addition, 4 graphs were generated to review potential relationships. The correlation coefficient was calculated using the Alcula Online Statistics Calculator (http://www.alcula.com; Correlation Coefficient Calculator).
Results
A total of 316 unique veteran patients were seen by the clinical pharmacy specialist in pain management from January 1, 2013, through December 31, 2013. Of these, 73 patients (23.1%) had at least 1 TT level drawn in 2013. Three patients with testosterone levels drawn (4.1%) were excluded from the data analysis for the following reasons: 1 patient did not have testosterone levels on file before receiving testosterone replacement from a non-VA source, 1 patient received opioids from a non-VA source (MED and duration of opioid therapy could not be calculated), and 1 patient inconsistently received opioids and MED used at the time of testosterone level draw. Per the local TRT CFU, a TT level > 350 ng/dL does not require treatment, whereas levels < 230 ng/dL (with symptoms) may require TRT, and < 200 ng/dL should be treated as hypogonadal (interpretation based on local laboratory’s reference range for TT).16 Of the 70 patients included in the analysis, 34 (48.6%) had a TT level < 230 ng/dL and would be considered eligible for TRT if they presented with symptoms of low testosterone. Of these 34 patients with a low testosterone level, 28 (40%) were being treated or had been treated with TRT (Figure 1).
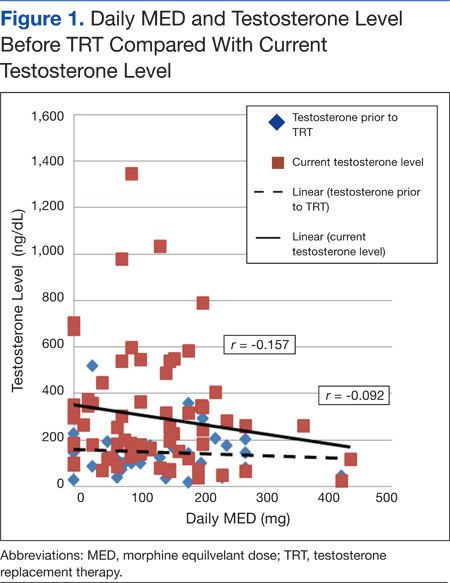
The average age of the male patients with a testosterone level drawn was 58.3 years, which was not significantly different from the calculated median age of 60 years. No female patients had a testosterone level drawn. On average, the TT level was normal before starting opioids (reference range per local laboratory: 175-781 ng/dL). Once opioids were initiated, patients were treated for an average duration of 52.5 months (calculated through December 2013) with an average daily dose of 126.8 MED (Table). Fifty of the 70 patients (71.4%) with testosterone levels drawn in 2013 received TRT. The most common symptoms reported by patients related to low testosterone included ED, decreased libido, depression, chronic fatigue, generalized weakness, and hot flashes or night sweats.
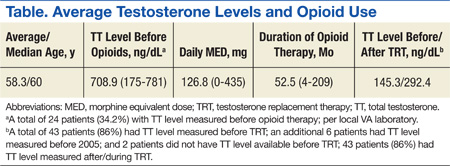
The average TT level prior to TRT was 145.3, and the average testosterone level after initiation of or during treatment with TRT was 292.4, which is within the normal TT level range. Most patients receiving TRT were treated with testosterone cypionate injections, and this was also the formulation used for the longest periods, likely due to the local CFU. In addition to testosterone cypionate injections, patients were also treated with testosterone enanthate injections, testosterone patches, and testosterone gel.
Figure 1 compares current testosterone level and testosterone level before TRT with total daily MEDs. Figure 2 compares current testosterone level and testosterone level before TRT with length of opioid therapy. The 2 figures use data from all patients included in the analysis and indicate a potential inverse relationship between the total daily MED and duration of therapy with the testosterone level, although none of the calculated correlation coefficients indicate that a strong relationship was present.
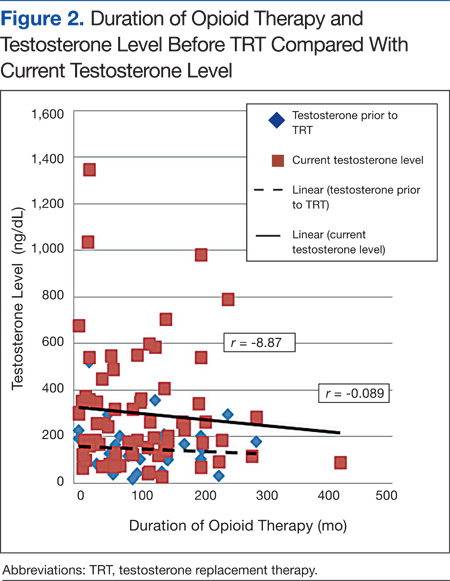
Figures 3 and 4 include data only for patients who had both a testosterone level collected before opioids (baseline testosterone level) and a current testosterone level. Figure 3 trends the data using total daily MED, and Figure 4 uses the duration of opioid therapy. The correlation for Figure 4 is slightly stronger; the strongest negative correlations were identified between total daily MED and testosterone level before opioid therapy (r = -0.273) and duration of opioid therapy and testosterone level prior to opioid therapy (r = -0.396). The trends indicate that most patients had a normal TT level before opioid treatment and that patients treated with higher MEDs and for longer durations of time were more likely to have lower total testosterone levels.
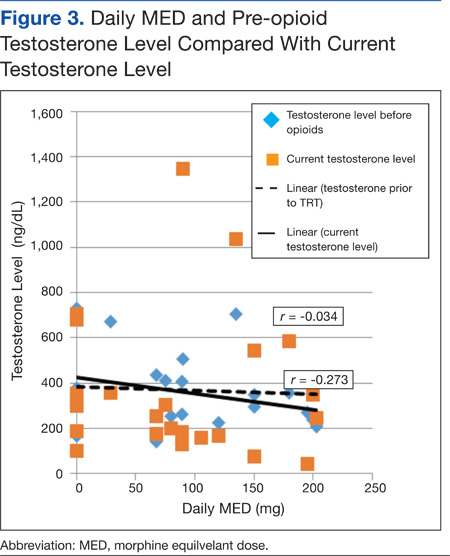
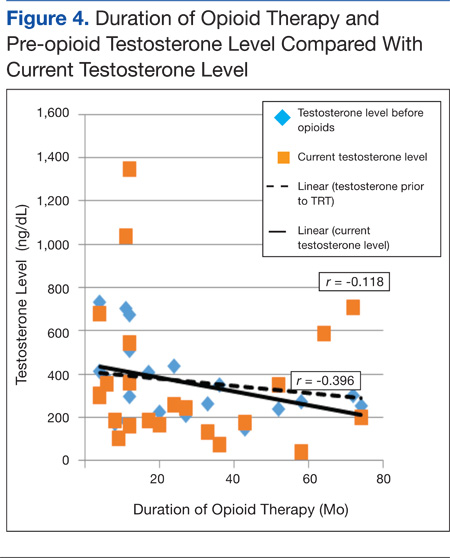
Discussion
Low testosterone levels can adversely affect patients’ quality of life (QOL) and add to patients’ medication burden with the initiation of TRT. Given new data analyzing the potential effects of TRT on CV event risk, the use of TRT should be carefully considered, as it may carry significant risks and may not be suitable for all patients.
In November 2013, a study was published regarding TRT and increased CV risk.17 This was a retrospective cohort study of men with low testosterone levels (< 300 ng/dL) who had undergone coronary angiography in the VA system between 2005 and 2011 (average age in testosterone group was 60.6 years). The results were significant for an absolute rate of events (all-cause mortality, myocardial infarction [MI], and ischemic stroke) of 19.9% in the no testosterone group and 25.7% in the TRT group, an absolute risk difference of 5.8% at 3 years after coronary angiography. Kaplan-Meier survival curves demonstrated that testosterone use was associated with increased risk of death, MI, and stroke. This result was unchanged when adjusted for the presence of coronary artery disease (CAD). In addition, no significant difference was found between the groups in terms of systolic blood pressure, low- density lipoprotein cholesterol level, or in the use of beta-blocker and statin medications. What is important to note is that in this cohort, 20% had a prior history of MI and heart failure, and more than 50% had confirmed obstructive CAD on angiography. In addition, as this was an observational study, confounding or bias may exist, and given the study population, generalizability may be limited to a veteran population.
Related: A Multidisciplinary Chronic Pain Management Clinic in an Indian Health Service Facility
Another retrospective cohort study assessed the risk of acute nonfatal MI following an initial TRT prescription in a large health care database (average age based on TRT prescription was 54.4 years).18 In men aged ≥ 65 years, a 2-fold increase in the risk of MI in the immediate 90 days after filling an initial TRT prescription declined to baseline after 91 to 180 days among those who did not refill their prescription. Younger men with a history of heart disease had a 2- to 3-fold increased risk of MI in the 90 days following initial TRT prescription. No excess risk was observed in the younger men without such a history. Again, this study has its limitations related to the retrospective design and use of a health care database as opposed to a randomized controlled trial.
In February 2014, a VA National Pharmacy Benefits Management (PBM) bulletin addressed 2 recent studies that had identified a possible risk of increased CV events in men receiving TRT. The bulletin noted that these studies had prompted the FDA to reassess the CV safety of TRT.19 The TRT CFU was updated by VISN 8 to ensure that the patients receive appropriate treatment and are monitored accordingly.
One of the major changes to the CFU was defining the reference ranges for TRT (interpretation based on a local laboratory’s reference range for total testosterone): serum TT < 200 ng/dL be “treated as hypogonadal, those with TT > 400 ng/dL be considered normal and those with TT 200-400 ng/dL be treated based on their clinical presentation if symptomatic; TT levels > 350 ng/dL do not require treatment, and levels below 230 ng/dL (with symptoms) may require testosterone replacement therapy.”16 Other important updates included revision of the exclusion criteria as well as highlighting special considerations related to TRT, including the use of free testosterone levels rather than TT levels in patients with suspected protein-binding issues, role in fertility treatments, limited use in patients on spironolactone therapy (due to spironolactone’s anti-androgen effects), and potential association with mood and behavior.16
As chronic opioid therapy is associated with OPIAD, the renewed interest in TRT and its potential AEs provides yet another reason to reconsider opioid therapy. This is especially valid when opioids are the potential cause of hypogonadism and the reaction is treating the AEs of opioids (as opposed to considering elimination of the causative agent) with a therapy that can potentially increase the risk for CV events so that opioids can be continued. Outside the potential CV risk with TRT, opioids carry the innate risk for substance abuse and addiction.
The Opioid Safety Initiative Requirements was released as a memorandum in April 2014 and is the VHA’s effort to “reduce harm from unsafe medications and/or excessive doses while adequately controlling pain in Veterans.”20 Although it does not discuss the risk of OPIAD, it does highlight the need to identify and mitigate high-risk patients as well as high-risk opioid regimens. All these factors, including the possibility of hypogonadism, should be considered before starting opioid therapy and at the time of opioid renewal, as it is known that opioid therapy is not without risks.
At the West Palm Beach VAMC, the primary care providers (PCPs) are responsible for the management of TRT, including the workup, renewal, and monitoring. The Chronic Nonmalignant Pain Management Clinic (CNMPMC) orders testosterone levels on patients who report symptoms of low testosterone, such as hot flashes, depression, and low energy level and refers them to their PCP as indicated. The authors believe that this is most appropriate for a number of reasons: (1) the CNMPMC is a consult service, and patients are not followed indefinitely; (2) patients should be fully evaluated for appropriateness of TRT (including assessment of CV risk) before starting therapy; and (3) the necessary monitoring parameters (laboratory testing, digital rectal exam, and osteoporosis screening) are not typically within the VA pain clinic provider’s scope of practice or expertise. A consideration for future practice would be to incorporate the use of a standardized questionnaire for OPIAD monitoring in patients receiving ≥ 100 mg of morphine daily (eg, the Aging Males’ Symptoms scale).21 It should, however, be at the forefront of the pain specialist’s and PCP’s minds that all patients on chronic opioid therapy or considering chronic opioid therapy should be counseled on the risk for OPIAD. If OPIAD is identified, the patient should be carefully considered for an opioid dose reduction as an initial management strategy.
Limitations
A limitation of this review is the lack of consistency or adequacy of serum testosterone sampling, noting that valid testosterone levels need to be drawn in the morning and not obtained during a time of acute illness. In addition, testosterone levels need to be drawn at an appropriate interval while on TRT (eg, at the midpoint between testosterone injections).16 Although the time of the sample collection is documented in the Computerized Patient Record System (CPRS), it is unknown whether the patient was acutely ill on the day of the sampling unless a progress note is entered, and it is difficult to determine whether the level timing was accurate based on the testosterone replacement formulation. Another limitation is that the average decline in serum testosterone levels with aging in men is 1% to 2% per year. A significant fraction of older men have levels below the lower limit of the normal range for healthy young men, so in older men it can be more difficult to determine whether low testosterone is related to chronic opioid use or to older age.5,16
As this was a retrospective review, additional limitations included the inability to measure subclinical OPIAD, and the data collection related to symptoms of hypogonadism was restricted by documentation in the CPRS progress notes. The lack of data for females does not contribute to the literature on OPIAD in women. Finally, as the total daily MED does not distinguish between short-acting and long-acting opioid therapy, no differences between the impacts of short-acting vs long- acting opioid therapy on risk for hypogonadism can be inferred. There is evidence to suggest that long-acting opioids are associated with a significantly higher risk for OPIAD compared with short-acting opioids, although the mechanism behind this is not well established.22,23
Conclusions
The average age of the patients on chronic opioid therapy with a testosterone level drawn in this cohort was 58.3 years, which is younger than originally anticipated. The median age of 60 years is not significantly different from the average age, indicating that outliers did not impact this calculation. On average, the TT level was normal before starting opioids. Once opioids were started, patients were treated for an average duration of 52.5 months with an average daily dose of 126.8 mg MED. In this veteran cohort, 48.6% of patients met the criteria for TRT based on TT level alone, which is within the reported prevalence range of opioid-induced hypogonadism already published.4,9 These results are in line with the original hypothesis that chronic opioid use can adversely impact testosterone levels and can have a poor effect on a patient’s QOL due to symptoms of low testosterone. In addition to TRT, possible and suggested (but not proven) treatment options for OPIAD include discontinuation of opioid therapy, opioid rotation, or conversion to buprenorphine.21 The approach used should account for multiple patient-specific factors and should be individualized.
Based on the data, there is a trend toward lower testosterone levels in veterans treated with higher MED and for longer periods with chronic opioids. Given recent data that infer that TRT carries increased CV risk as well as the VHA’s Opioid Safety Initiative, it is imperative that providers closely evaluate the appropriateness of starting TRT and/or continuing chronic opioid therapy. All patients generally should have failed non- opioid management prior to opioid therapy for chronic nonmalignant pain, and this should be documented accordingly. It is also crucial to have the “opioid talk” with patients from time to time and discuss the risks vs benefits, the potential for addiction, overdose, dependence, tolerance, constipation, and OPIAD so patients can continue to be an active and informed participants in their care.
Author disclosures
The authors report no actual or potential conflicts of interest with regard to this article.
Disclaimer
The opinions expressed herein are those of the authors and do not necessarily reflect those of Federal Practitioner, Frontline Medical Communications Inc., the U.S. Government, or any of its agencies. This article may discuss unlabeled or investigational use of certain drugs. Please review the complete prescribing information for specific drugs or drug combinations—including indications, contraindications, warnings, and adverse effects—before administering pharmacologic therapy to patients.
1. Centers for Disease Control and Prevention, National Center for Injury Prevention and Control. Unintentional drug poisoning in the United States, 2010. Atlanta, GA: Centers for Disease Control and Prevention Website. http://www.cdc.gov /HomeandRecreationalSafety/pdf/poison-issue-brief .pdf. Published July 2010. Accessed August 28, 2015.
2. American Academy of Family Physicians. Using opioids in the management of chronic pain patients: challenges and future options. University of Kentucky Medical Center Website. http://www .mc.uky.edu/equip-4-pcps/documents/CRx%20Literature/Opioids%20for%20chronic%20pain.pdf. Published 2010. Accessed August 28, 2015.
3. Duarte RV, Raphael JH, Labib M, Southall JL, Ashford RL. Prevalence and influence of diagnostic criteria in the assessment of hypogonadism in intrathecal opioid therapy patients. Pain Physician. 2013;16(1):9-14.
4. Smith HS, Elliott JA. Opioid-induced androgen deficiency (OPIAD). Pain Physician. 2012;15(suppl 3):ES145-ES156.
5. De Maddalena C, Bellini M, Berra M, Meriggiola MC, Aloisi AM. Opioid-induced hypogonadism: why and how to treat it. Pain Physician. 2012;15(suppl 3):ES111-ES118.
6. Bhasin S, Cunningham GR, Hayes FJ, et al; VM Endocrine Society Task Force. Testosterone therapy in men with androgen deficiency syndromes: an Endocrine Society clinical practice guideline. J Clin Endocrinol Metab. 2010;95(6):2536-2559.
7. Petak SM, Nankin HR, Spark RF, Swerdloff RS, Rodriguez-Rigau LJ; American Association of Clinical Endocrinologists. American Association of Clinical Endocrinologists Medical Guidelines for clinical practice for the evaluation and treatment of hypogonadism in adult male patients–2002 update. Endocr Pract. 2002;8(6):440-456.
8. Wang C, Nieschlag E, Swerdloff R, et al. Investigation, treatment, and monitoring of late-onset hypogonadism in males: ISA, ISSAM, EAU, EAA, and ASA recommendations. J Androl. 2009;30(1):1-9.
9. Reddy RG, Aung T, Karavitaki N, Wass JA. Opioid induced hypogonadism. BMJ. 2010;341:c4462.
10. U.S. Department of Veterans Affairs, Veterans Health Administration. VHA Handbook 1058.05: VHA operations activities that may constitute research. U.S. Department of Veterans Affairs Website. http://www.va.gov/vhapublications /ViewPublication.asp?pub_ID=2456. Published October 28, 2011. Accessed August 28, 2015.
11. AndroGel [package insert]. North Chicago, IL: AbbVie Inc; 2013.
12. Axiron [package insert]. Indianapolis, IL: Lilly USA, LLC; 2011.
13. U.S. Department of Veterans Affairs. Opioid therapy for chronic pain pocket guide. U.S. Department of Veterans Affairs. http://www.healthquality .va.gov/guidelines/pain/cot/opioidpocketguide23may2013v1.pdf. Published May 2013 Accessed August 28, 2015.
14. McPherson ML. Demystifying Opioid Conversion Calculations: A Guide for Effective Dosing. Bethesda, MD: American Society of Health-System Pharmacists; 2009.
15. Butrans [package insert]. Stamford, CT: Purdue Pharma LP; 2014.
16. Testosterone Replacement Therapy Criteria for Use. VISN 8: VISN Pharmacist Executives, Veterans Health Administration, Department of Veterans Affairs; 2014. [Internal document.]
17. Vigen R, O’Donnell CI, Barón AE, et al. Association of testosterone therapy with mortality, myocardial infarction, and stroke in men with low testosterone levels. JAMA. 2013;310(17):1829-1836.
18. Finkle WD, Greenland S, Ridgeway GK, et al. Increased risk of non-fatal myocardial infarction following testosterone therapy prescription in men. PLoS One. 2014;9(1):e85805.
19. U.S. Department of Veterans Affairs. Testosterone products and cardiovascular safety. U.S. Department of Veterans Affairs Website. http://www.pbm .va.gov/PBM/vacenterformedicationsafety /nationalpbmbulletin/Testosterone_Products_and _Cardiovascular_Safety_NATIONAL_PBM _BULLETIN_02.pdf. Published February 7, 2014. Accessed August 28, 2015.
20. U.S. Department of Veterans Affairs Veterans Health Administration (VHA) Pharmacy Benefits Management Services (PBM), Medical Advisory Panel (MAP) and Center for Medication Safety (VA MEDSAFE). Memorandum: Opioid Safety Initiative Requirements. U.S. Department of Veterans Affairs Website. http://www.veterans.senate.gov/imo /media/doc/VA%20Testimony%20-%20April%2030%20SVAC%20Overmedication%20hearing.pdf. Published April 30, 2014. Accessed August 28, 2015.
21. Brennan MJ. The effect of opioid therapy on endocrine function. Am J Med. 2013;126(3)(suppl 1):S12-S18.
22. Rubinstein AL, Carpenter DM, Minkoff JR. Hypogonadism in men with chronic pain linked to the use of long-acting rather than short-acting opioids. Clin J Pain. 2013;29(10):840-845.
23. Rubinstein A, Carpenter DM. Elucidating risk factors for androgen deficiency associated with daily opioid use. Am J Med. 2014;127(12):1195-1201.
According to the CDC, the medical use of opioid painkillers has increased at least 10-fold during the past 20 years, “because of a movement toward more aggressive management of pain.”1 Although opioid therapy is generally considered effective for the treatment of pain, long-term use (both orally and intrathecally) is associated with adverse effects (AEs) such as constipation, fatigue, nausea, sleep disturbances, depression, sexual dysfunction, and hypogonadism.2,3Opioid-induced androgen deficiency (OPIAD), as defined by Smith and Elliot, is a clinical syndrome characterized by inappropriately low concentrations of gonadotropins (specifically, follicle-stimulating hormone [FSH] and luteinizing hormone [LH]), which leads to inadequate production of sex hormones, including estradiol and testosterone.4
Related: Testosterone Replacement Therapy: Playing Catch-up With Patients
The mechanism behind this phenomenon is initiated by either endogenous or exogenous opioids acting on opioid receptors in the hypothalamus, which causes a decrease in the release of gonadotropin- releasing hormone (GnRH). This decrease in GnRH causes a reduction in the release of LH and FSH from the pituitary gland as well as testosterone or estradiol from the gonads.4,5 Various guidelines report different cutoffs for the lower limit of normal total testosterone: The Endocrine Society recommends 300 ng/dL, the American Association of Clinical Endocrinologists suggests 200 ng/dL, and various other organizations suggest 230 ng/dL.6-8 Hypotestosteronism can result in patients presenting with a broad spectrum of clinical symptoms, including reduced libido, erectile dysfunction (ED), fatigue, hot flashes, depression, anemia, decreased muscle mass, weight gain, and osteopenia or osteoporosis.4 Women with low testosterone levels can experience irregular menstrual periods, oligomenorrhea, or amenorrhea.9 Opioid-induced androgen deficiency often goes unrecognized and untreated. The reported prevalence of opioid-induced hypogonadism ranges from 21% to 86%.4,9 Given the growing number of patients on chronic opioid therapy, OPIAD warrants further investigation to identify the prevalence in the veteran population to appropriately monitor and manage this deficiency.
The objective of this retrospective review was to identify the presence of secondary hypogonadism in chronic opioid users among a cohort of veterans receiving chronic opioids for nonmalignant pain. In addition to identifying the presence of secondary hypogonadism, the relationship between testosterone concentrations and total daily morphine equivalent doses (MEDs) was reviewed. These data along with the new information recently published on testosterone replacement therapy (TRT) and cardiovascular (CV) risk were then used to evaluate current practices at the West Palm Beach VAMC for OPIAD monitoring and management and to modify and update the local Criteria for Use (CFU) for TRT.
Methods
Patient data from the West Palm Beach VAMC in Florida from January 2013 to December 2013 were reviewed to identify patients who had a total testosterone (TT) level measured. All patient appointments for evaluation and treatment by the clinical pharmacy specialist in pain management were reviewed for data collection. This retrospective review was approved by the scientific advisory committee as part of the facility’s ongoing performance improvement efforts as defined by VHA Handbook 1058.05 and did not require written patient consent.10
Several distinct TT level data were collected. The descriptive data included patient age; gender; type of treated pain; testosterone level(s) drawn, including TT level before opioid therapy, TT level before/during/after TRT, and current total testosterone level; total daily MED of opioid therapy; duration of chronic opioid therapy; symptoms of exhibited hypogonadism; TRT formulation, dose, and duration; TRT prescriber; symptom change (if any); and laboratory tests ordered for TRT monitoring (lipid profile, liver profile, complete blood count, LH/FSH, and prostate specific antigen [PSA] panel).5,11,12
Related: Combination Treatment Relieves Opioid-Induced Constipation
Daily MED of opioid therapy was calculated using the VA/DoD opioid conversion table for patients on oxycodone, hydromorphone, or hydrocodone.13 For those on the fentanyl patch or methadone, conversion factors of 1:2 (fentanyl [µg/h]:morphine [mg/d]) and 1:3 (methadone:morphine) were used to convert to the MED.14 For patients on the buprenorphine patch, the package insert was used to convert to the corresponding MED.15 Combination therapies used the applicable conversions to calculate the total daily MED.
Once the data were collected, descriptive statistics were used to analyze the data. In addition, 4 graphs were generated to review potential relationships. The correlation coefficient was calculated using the Alcula Online Statistics Calculator (http://www.alcula.com; Correlation Coefficient Calculator).
Results
A total of 316 unique veteran patients were seen by the clinical pharmacy specialist in pain management from January 1, 2013, through December 31, 2013. Of these, 73 patients (23.1%) had at least 1 TT level drawn in 2013. Three patients with testosterone levels drawn (4.1%) were excluded from the data analysis for the following reasons: 1 patient did not have testosterone levels on file before receiving testosterone replacement from a non-VA source, 1 patient received opioids from a non-VA source (MED and duration of opioid therapy could not be calculated), and 1 patient inconsistently received opioids and MED used at the time of testosterone level draw. Per the local TRT CFU, a TT level > 350 ng/dL does not require treatment, whereas levels < 230 ng/dL (with symptoms) may require TRT, and < 200 ng/dL should be treated as hypogonadal (interpretation based on local laboratory’s reference range for TT).16 Of the 70 patients included in the analysis, 34 (48.6%) had a TT level < 230 ng/dL and would be considered eligible for TRT if they presented with symptoms of low testosterone. Of these 34 patients with a low testosterone level, 28 (40%) were being treated or had been treated with TRT (Figure 1).
The average age of the male patients with a testosterone level drawn was 58.3 years, which was not significantly different from the calculated median age of 60 years. No female patients had a testosterone level drawn. On average, the TT level was normal before starting opioids (reference range per local laboratory: 175-781 ng/dL). Once opioids were initiated, patients were treated for an average duration of 52.5 months (calculated through December 2013) with an average daily dose of 126.8 MED (Table). Fifty of the 70 patients (71.4%) with testosterone levels drawn in 2013 received TRT. The most common symptoms reported by patients related to low testosterone included ED, decreased libido, depression, chronic fatigue, generalized weakness, and hot flashes or night sweats.
The average TT level prior to TRT was 145.3, and the average testosterone level after initiation of or during treatment with TRT was 292.4, which is within the normal TT level range. Most patients receiving TRT were treated with testosterone cypionate injections, and this was also the formulation used for the longest periods, likely due to the local CFU. In addition to testosterone cypionate injections, patients were also treated with testosterone enanthate injections, testosterone patches, and testosterone gel.
Figure 1 compares current testosterone level and testosterone level before TRT with total daily MEDs. Figure 2 compares current testosterone level and testosterone level before TRT with length of opioid therapy. The 2 figures use data from all patients included in the analysis and indicate a potential inverse relationship between the total daily MED and duration of therapy with the testosterone level, although none of the calculated correlation coefficients indicate that a strong relationship was present.
Figures 3 and 4 include data only for patients who had both a testosterone level collected before opioids (baseline testosterone level) and a current testosterone level. Figure 3 trends the data using total daily MED, and Figure 4 uses the duration of opioid therapy. The correlation for Figure 4 is slightly stronger; the strongest negative correlations were identified between total daily MED and testosterone level before opioid therapy (r = -0.273) and duration of opioid therapy and testosterone level prior to opioid therapy (r = -0.396). The trends indicate that most patients had a normal TT level before opioid treatment and that patients treated with higher MEDs and for longer durations of time were more likely to have lower total testosterone levels.
Discussion
Low testosterone levels can adversely affect patients’ quality of life (QOL) and add to patients’ medication burden with the initiation of TRT. Given new data analyzing the potential effects of TRT on CV event risk, the use of TRT should be carefully considered, as it may carry significant risks and may not be suitable for all patients.
In November 2013, a study was published regarding TRT and increased CV risk.17 This was a retrospective cohort study of men with low testosterone levels (< 300 ng/dL) who had undergone coronary angiography in the VA system between 2005 and 2011 (average age in testosterone group was 60.6 years). The results were significant for an absolute rate of events (all-cause mortality, myocardial infarction [MI], and ischemic stroke) of 19.9% in the no testosterone group and 25.7% in the TRT group, an absolute risk difference of 5.8% at 3 years after coronary angiography. Kaplan-Meier survival curves demonstrated that testosterone use was associated with increased risk of death, MI, and stroke. This result was unchanged when adjusted for the presence of coronary artery disease (CAD). In addition, no significant difference was found between the groups in terms of systolic blood pressure, low- density lipoprotein cholesterol level, or in the use of beta-blocker and statin medications. What is important to note is that in this cohort, 20% had a prior history of MI and heart failure, and more than 50% had confirmed obstructive CAD on angiography. In addition, as this was an observational study, confounding or bias may exist, and given the study population, generalizability may be limited to a veteran population.
Related: A Multidisciplinary Chronic Pain Management Clinic in an Indian Health Service Facility
Another retrospective cohort study assessed the risk of acute nonfatal MI following an initial TRT prescription in a large health care database (average age based on TRT prescription was 54.4 years).18 In men aged ≥ 65 years, a 2-fold increase in the risk of MI in the immediate 90 days after filling an initial TRT prescription declined to baseline after 91 to 180 days among those who did not refill their prescription. Younger men with a history of heart disease had a 2- to 3-fold increased risk of MI in the 90 days following initial TRT prescription. No excess risk was observed in the younger men without such a history. Again, this study has its limitations related to the retrospective design and use of a health care database as opposed to a randomized controlled trial.
In February 2014, a VA National Pharmacy Benefits Management (PBM) bulletin addressed 2 recent studies that had identified a possible risk of increased CV events in men receiving TRT. The bulletin noted that these studies had prompted the FDA to reassess the CV safety of TRT.19 The TRT CFU was updated by VISN 8 to ensure that the patients receive appropriate treatment and are monitored accordingly.
One of the major changes to the CFU was defining the reference ranges for TRT (interpretation based on a local laboratory’s reference range for total testosterone): serum TT < 200 ng/dL be “treated as hypogonadal, those with TT > 400 ng/dL be considered normal and those with TT 200-400 ng/dL be treated based on their clinical presentation if symptomatic; TT levels > 350 ng/dL do not require treatment, and levels below 230 ng/dL (with symptoms) may require testosterone replacement therapy.”16 Other important updates included revision of the exclusion criteria as well as highlighting special considerations related to TRT, including the use of free testosterone levels rather than TT levels in patients with suspected protein-binding issues, role in fertility treatments, limited use in patients on spironolactone therapy (due to spironolactone’s anti-androgen effects), and potential association with mood and behavior.16
As chronic opioid therapy is associated with OPIAD, the renewed interest in TRT and its potential AEs provides yet another reason to reconsider opioid therapy. This is especially valid when opioids are the potential cause of hypogonadism and the reaction is treating the AEs of opioids (as opposed to considering elimination of the causative agent) with a therapy that can potentially increase the risk for CV events so that opioids can be continued. Outside the potential CV risk with TRT, opioids carry the innate risk for substance abuse and addiction.
The Opioid Safety Initiative Requirements was released as a memorandum in April 2014 and is the VHA’s effort to “reduce harm from unsafe medications and/or excessive doses while adequately controlling pain in Veterans.”20 Although it does not discuss the risk of OPIAD, it does highlight the need to identify and mitigate high-risk patients as well as high-risk opioid regimens. All these factors, including the possibility of hypogonadism, should be considered before starting opioid therapy and at the time of opioid renewal, as it is known that opioid therapy is not without risks.
At the West Palm Beach VAMC, the primary care providers (PCPs) are responsible for the management of TRT, including the workup, renewal, and monitoring. The Chronic Nonmalignant Pain Management Clinic (CNMPMC) orders testosterone levels on patients who report symptoms of low testosterone, such as hot flashes, depression, and low energy level and refers them to their PCP as indicated. The authors believe that this is most appropriate for a number of reasons: (1) the CNMPMC is a consult service, and patients are not followed indefinitely; (2) patients should be fully evaluated for appropriateness of TRT (including assessment of CV risk) before starting therapy; and (3) the necessary monitoring parameters (laboratory testing, digital rectal exam, and osteoporosis screening) are not typically within the VA pain clinic provider’s scope of practice or expertise. A consideration for future practice would be to incorporate the use of a standardized questionnaire for OPIAD monitoring in patients receiving ≥ 100 mg of morphine daily (eg, the Aging Males’ Symptoms scale).21 It should, however, be at the forefront of the pain specialist’s and PCP’s minds that all patients on chronic opioid therapy or considering chronic opioid therapy should be counseled on the risk for OPIAD. If OPIAD is identified, the patient should be carefully considered for an opioid dose reduction as an initial management strategy.
Limitations
A limitation of this review is the lack of consistency or adequacy of serum testosterone sampling, noting that valid testosterone levels need to be drawn in the morning and not obtained during a time of acute illness. In addition, testosterone levels need to be drawn at an appropriate interval while on TRT (eg, at the midpoint between testosterone injections).16 Although the time of the sample collection is documented in the Computerized Patient Record System (CPRS), it is unknown whether the patient was acutely ill on the day of the sampling unless a progress note is entered, and it is difficult to determine whether the level timing was accurate based on the testosterone replacement formulation. Another limitation is that the average decline in serum testosterone levels with aging in men is 1% to 2% per year. A significant fraction of older men have levels below the lower limit of the normal range for healthy young men, so in older men it can be more difficult to determine whether low testosterone is related to chronic opioid use or to older age.5,16
As this was a retrospective review, additional limitations included the inability to measure subclinical OPIAD, and the data collection related to symptoms of hypogonadism was restricted by documentation in the CPRS progress notes. The lack of data for females does not contribute to the literature on OPIAD in women. Finally, as the total daily MED does not distinguish between short-acting and long-acting opioid therapy, no differences between the impacts of short-acting vs long- acting opioid therapy on risk for hypogonadism can be inferred. There is evidence to suggest that long-acting opioids are associated with a significantly higher risk for OPIAD compared with short-acting opioids, although the mechanism behind this is not well established.22,23
Conclusions
The average age of the patients on chronic opioid therapy with a testosterone level drawn in this cohort was 58.3 years, which is younger than originally anticipated. The median age of 60 years is not significantly different from the average age, indicating that outliers did not impact this calculation. On average, the TT level was normal before starting opioids. Once opioids were started, patients were treated for an average duration of 52.5 months with an average daily dose of 126.8 mg MED. In this veteran cohort, 48.6% of patients met the criteria for TRT based on TT level alone, which is within the reported prevalence range of opioid-induced hypogonadism already published.4,9 These results are in line with the original hypothesis that chronic opioid use can adversely impact testosterone levels and can have a poor effect on a patient’s QOL due to symptoms of low testosterone. In addition to TRT, possible and suggested (but not proven) treatment options for OPIAD include discontinuation of opioid therapy, opioid rotation, or conversion to buprenorphine.21 The approach used should account for multiple patient-specific factors and should be individualized.
Based on the data, there is a trend toward lower testosterone levels in veterans treated with higher MED and for longer periods with chronic opioids. Given recent data that infer that TRT carries increased CV risk as well as the VHA’s Opioid Safety Initiative, it is imperative that providers closely evaluate the appropriateness of starting TRT and/or continuing chronic opioid therapy. All patients generally should have failed non- opioid management prior to opioid therapy for chronic nonmalignant pain, and this should be documented accordingly. It is also crucial to have the “opioid talk” with patients from time to time and discuss the risks vs benefits, the potential for addiction, overdose, dependence, tolerance, constipation, and OPIAD so patients can continue to be an active and informed participants in their care.
Author disclosures
The authors report no actual or potential conflicts of interest with regard to this article.
Disclaimer
The opinions expressed herein are those of the authors and do not necessarily reflect those of Federal Practitioner, Frontline Medical Communications Inc., the U.S. Government, or any of its agencies. This article may discuss unlabeled or investigational use of certain drugs. Please review the complete prescribing information for specific drugs or drug combinations—including indications, contraindications, warnings, and adverse effects—before administering pharmacologic therapy to patients.
1. Centers for Disease Control and Prevention, National Center for Injury Prevention and Control. Unintentional drug poisoning in the United States, 2010. Atlanta, GA: Centers for Disease Control and Prevention Website. http://www.cdc.gov /HomeandRecreationalSafety/pdf/poison-issue-brief .pdf. Published July 2010. Accessed August 28, 2015.
2. American Academy of Family Physicians. Using opioids in the management of chronic pain patients: challenges and future options. University of Kentucky Medical Center Website. http://www .mc.uky.edu/equip-4-pcps/documents/CRx%20Literature/Opioids%20for%20chronic%20pain.pdf. Published 2010. Accessed August 28, 2015.
3. Duarte RV, Raphael JH, Labib M, Southall JL, Ashford RL. Prevalence and influence of diagnostic criteria in the assessment of hypogonadism in intrathecal opioid therapy patients. Pain Physician. 2013;16(1):9-14.
4. Smith HS, Elliott JA. Opioid-induced androgen deficiency (OPIAD). Pain Physician. 2012;15(suppl 3):ES145-ES156.
5. De Maddalena C, Bellini M, Berra M, Meriggiola MC, Aloisi AM. Opioid-induced hypogonadism: why and how to treat it. Pain Physician. 2012;15(suppl 3):ES111-ES118.
6. Bhasin S, Cunningham GR, Hayes FJ, et al; VM Endocrine Society Task Force. Testosterone therapy in men with androgen deficiency syndromes: an Endocrine Society clinical practice guideline. J Clin Endocrinol Metab. 2010;95(6):2536-2559.
7. Petak SM, Nankin HR, Spark RF, Swerdloff RS, Rodriguez-Rigau LJ; American Association of Clinical Endocrinologists. American Association of Clinical Endocrinologists Medical Guidelines for clinical practice for the evaluation and treatment of hypogonadism in adult male patients–2002 update. Endocr Pract. 2002;8(6):440-456.
8. Wang C, Nieschlag E, Swerdloff R, et al. Investigation, treatment, and monitoring of late-onset hypogonadism in males: ISA, ISSAM, EAU, EAA, and ASA recommendations. J Androl. 2009;30(1):1-9.
9. Reddy RG, Aung T, Karavitaki N, Wass JA. Opioid induced hypogonadism. BMJ. 2010;341:c4462.
10. U.S. Department of Veterans Affairs, Veterans Health Administration. VHA Handbook 1058.05: VHA operations activities that may constitute research. U.S. Department of Veterans Affairs Website. http://www.va.gov/vhapublications /ViewPublication.asp?pub_ID=2456. Published October 28, 2011. Accessed August 28, 2015.
11. AndroGel [package insert]. North Chicago, IL: AbbVie Inc; 2013.
12. Axiron [package insert]. Indianapolis, IL: Lilly USA, LLC; 2011.
13. U.S. Department of Veterans Affairs. Opioid therapy for chronic pain pocket guide. U.S. Department of Veterans Affairs. http://www.healthquality .va.gov/guidelines/pain/cot/opioidpocketguide23may2013v1.pdf. Published May 2013 Accessed August 28, 2015.
14. McPherson ML. Demystifying Opioid Conversion Calculations: A Guide for Effective Dosing. Bethesda, MD: American Society of Health-System Pharmacists; 2009.
15. Butrans [package insert]. Stamford, CT: Purdue Pharma LP; 2014.
16. Testosterone Replacement Therapy Criteria for Use. VISN 8: VISN Pharmacist Executives, Veterans Health Administration, Department of Veterans Affairs; 2014. [Internal document.]
17. Vigen R, O’Donnell CI, Barón AE, et al. Association of testosterone therapy with mortality, myocardial infarction, and stroke in men with low testosterone levels. JAMA. 2013;310(17):1829-1836.
18. Finkle WD, Greenland S, Ridgeway GK, et al. Increased risk of non-fatal myocardial infarction following testosterone therapy prescription in men. PLoS One. 2014;9(1):e85805.
19. U.S. Department of Veterans Affairs. Testosterone products and cardiovascular safety. U.S. Department of Veterans Affairs Website. http://www.pbm .va.gov/PBM/vacenterformedicationsafety /nationalpbmbulletin/Testosterone_Products_and _Cardiovascular_Safety_NATIONAL_PBM _BULLETIN_02.pdf. Published February 7, 2014. Accessed August 28, 2015.
20. U.S. Department of Veterans Affairs Veterans Health Administration (VHA) Pharmacy Benefits Management Services (PBM), Medical Advisory Panel (MAP) and Center for Medication Safety (VA MEDSAFE). Memorandum: Opioid Safety Initiative Requirements. U.S. Department of Veterans Affairs Website. http://www.veterans.senate.gov/imo /media/doc/VA%20Testimony%20-%20April%2030%20SVAC%20Overmedication%20hearing.pdf. Published April 30, 2014. Accessed August 28, 2015.
21. Brennan MJ. The effect of opioid therapy on endocrine function. Am J Med. 2013;126(3)(suppl 1):S12-S18.
22. Rubinstein AL, Carpenter DM, Minkoff JR. Hypogonadism in men with chronic pain linked to the use of long-acting rather than short-acting opioids. Clin J Pain. 2013;29(10):840-845.
23. Rubinstein A, Carpenter DM. Elucidating risk factors for androgen deficiency associated with daily opioid use. Am J Med. 2014;127(12):1195-1201.
Role of Radiosurgery in the Treatment of Brain Metastasis
Since the 1980s, patients with a single intracranial metastatic lesion traditionally have been treated with surgery followed by whole brain radiation therapy (WBRT). However, there is growing concern about the debilitating cognitive effects associated with WBRT in long-term survivors.
Limbrick and colleagues studied the outcomes of surgery followed by stereotactic radiosurgery (SRS) instead of WBRT and found that the less invasive surgical resection (SR) followed by SRS was an equally effective therapeutic option for the treatment of patients with limited metastatic disease to the brain.1 Median overall survival (OS) was 20 months and was 22 and 13 months for Classes 1 and 2 recursive partitioning analysis (RPA) patients, respectively. Recursive partitioning analysis refers to 3 prognostic classes based on a database of 3 trial studies and 1,200 patients (Table 1).2 According to RPA, the best survival was observed in Class 1 patients, and the worst survival was seen in Class 3 patients. Limbrick and colleagues found that survival outcome was equivalent to or greater than that reported by other studies using surgery plus WBRT or SRS plus WBRT.1 The WBRT was not used and was reserved as salvage therapy in cases of initial failure such as disease progression of brain metastasis.
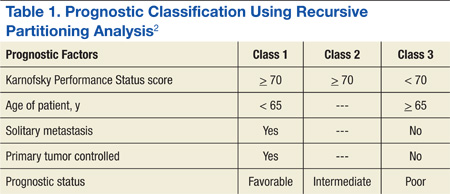
Radiation Therapies
Stereotactic radiosurgery is not a surgical procedure but a newly developed radiotherapy technique. It is a highly precise, intensive form of radiation therapy, focused on the tumor, with the goal of protecting the surrounding normal brain tissue as much as possible. Radiosurgery was initially introduced with the Gamma Knife by Lars Leksell several decades ago in order to deliver an intense radiation dose to a small, well-defined, single focal point using extreme precision. Stereotactic radiosurgery delivers efficient and focused radiation treatment to the tumor lesion.
There are 2 practical and commercially available radiation delivery systems for SRS: linear accelerator (LINAC)-based radiosurgery and Gamma Knife systems. Use of the Gamma Knife is limited largely to treatment of central nervous system (CNS) malignancies and certain head and neck cancers. Linear accelerator-based SRS is applicable to neoplasms in any organ system of the body (Table 2).
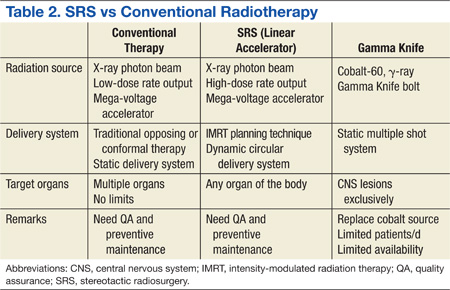
Proton therapy is yet another evolving and completely different mode of radiation therapy. There are currently 14 proton therapy centers in operation in the U.S., and 11 more centers are now under construction. Proton therapy uses charged heavy-particle therapy using proton beams, whereas conventional LINAC-based radiotherapy is X-ray radiotherapy, which uses high energy photon beams. Because of their relatively large mass, protons have little scatter of radiation to surrounding normal structures and can remain sharply focused on the tumor lesion. Accordingly, proton therapy delivers negligible radiation doses beyond tumor lesions, and much of the surrounding normal tissues can be saved from excessive and unnecessary radiation doses.
Related: Bone Metastasis: A Concise Overview
A single proton beam produces a narrow Bragg peak dose distribution at depth, and multiple consecutive stepwise series of different energies of proton beams are needed to administer complete coverage of the target tumor volume. The accumulation of these beam energies produces a uniform radiation dose distribution covering the entire tumor volume (Figure 1). In spite of the theoretical beneficial effects of proton beam therapy, more clinical experience is needed for it to be validated. Even then, the significantly higher costs of proton therapy represent another barrier to its wider implementation. Proton beam radiosurgery is still, in large part, an evolving technology, not widely and uniformly available.
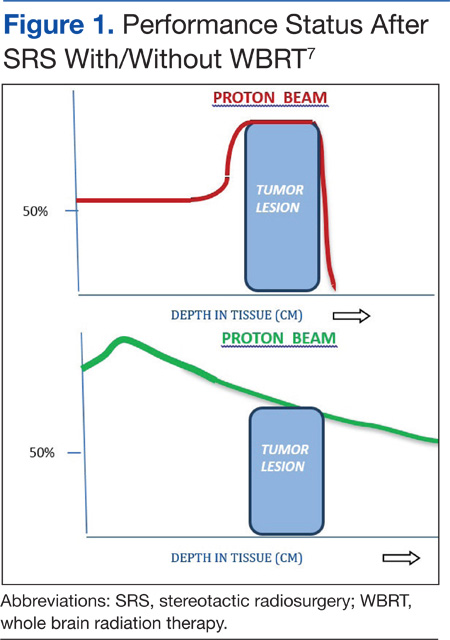
Role of Radiosurgery
Photon (X-ray)-based radiosurgery can be an alternative to craniotomy. Patients can return to their activities immediately after treatment. The ideal candidate for radiosurgery should have a small tumor (1-3 cm is best) with a well-defined margin. Retrospective studies reported no significant difference in therapy outcomes between the 2 therapies.3,4 Additional benefits of radiosurgery include low morbidity and mortality. Furthermore, radiosurgery can be applied to tumors near critical structures, such as the thalamus, basal ganglia, and brainstem, that are otherwise surgically inaccessible.
Most brain metastases are well defined and spherical, so they are ideally treated using SRS (Figure 1). Additionally, the brain is encased in the bony skull, which prevents significant intrafraction motion and provides a reproducible fidulial for accurate setup. Radiosurgery can tailor the radiation dose in order to precisely concentrate radiation distribution to the tumor lesion with a rapid dose falloff beyond the margin of the tumor bed, so surrounding normal brain tissues are spared from high-dose radiation. In sharp contrast, WBRT indiscriminately irradiates the entire brain without sparing the adjacent normal brain tissue (Figure 2). However, because of its limited dose distribution, radiosurgery offers no protection elsewhere in the brain from future metastasis, which is a benefit of whole brain radiation.
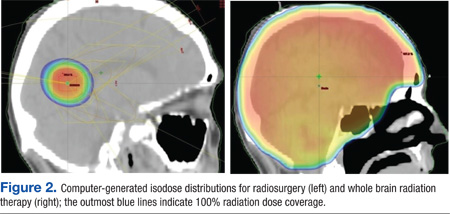
Future Use of SBRT
Based on successful experience with intracranial lesions, stereotactic techniques have been expanded to additional anatomical body sites other than the brain. Stereotactic body radiation therapy (SBRT), also called stereotactic body ablative radiotherapy, is progressively gaining acceptance and is being applied to various extracranial tumors, especially lung cancers and hepatic malignancies. Dosimetric studies and early phase clinical trials have clearly established the feasibility, safety, and efficacy of SBRT for certain tumor sites, such as lung, liver, kidney, spine, and paraspinal tumors. Additionally, SBRT may reduce treatment time and therapy costs and thus provide increased convenience to patients.
Effectiveness of SRS
Stafinski and colleagues conducted a meta-analysis of randomized trials to study the effectiveness of SRS in improving the survival as well as the quality of life (QOL) and functional status following SRS of patients with brain metastasis.5 This study found that SRS plus WBRT increased OS for patients with single brain metastasis compared with WBRT alone. Although no significant difference in OS was found in patients with multiple brain metastases, the addition of SRS to WBRT improved the local control and functional independence of this group of patients.
Related: Palliative Radiotherapy for the Management of Metastatic Cancer
Kondziolka and colleagues reported a local failure rate at 1 year of merely 8% following SRS boost therapy after WBRT compared with 100% without SRS.6 There was also a remarkable difference in median time to local failure—36 months vs 6 months, respectively. A randomized study designed to assess the possible benefit of SRS for the treatment of brain metastasis found a survival gain for patients with a single brain metastasis with a median survival time of 6.5 months (SRS) vs 4.9 months (no SRS).7
There are sparse data and reporting related to QOL measurements after SRS for brain metastasis. Andrews and colleagues reported improved functional and independent abilities at 6 months after completion of SRS therapy.7 The criteria used in that study for performance assessments included the Karnofsky Performance Status (KPS) scale, the need for steroid use, and mental status. They found that KPS improvement was statistically significant, and patients were able to decrease the dosage of steroid medication at 6 months after therapy with SRS (Table 3). Despite these reports suggesting superior outcomes with SRS, more rigorous investigations that adequately control for other factors influencing QOL in patients with cancer are needed.
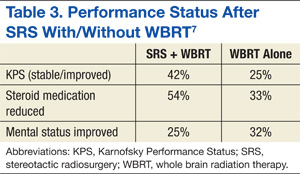
Two major limitations of SRS include large tumor size and multiple numbers of metastatic brain lesions. As the radiation dose to adjacent normal brain tissue quickly increases with larger tumor lesions (> 3-4 cm), the complication risks consequently rise proportionally, necessitating a decrease in the prescribed dose. Patients with poor performance status (< 70 KPS) and presence of active/progressive extracranial disease are also not ideal candidates for SRS.
Other unfavorable conditions for SRS include life expectancy of < 6 months, metastatic lesions in the posterior fossa, and severe acute CNS symptoms due to increased intracranial pressure, brain edema, or massive tumor effects. These factors do not necessarily contraindicate SRS but can increase the risks of such treatment. The authors recommend an experienced multispecialty approach to patients presenting with these findings.
Managing Brain Metastastis
To prevent symptoms related to brain edema (due to brain tumor itself and/or radiation-induced edema), steroid medication is generally administered to most patients, 1 to 3 days prior to initiation of radiation therapy. Corticosteroid use typically results in rapid improvement of existing CNS symptoms, such as headaches, and helps prevent the development of additional CNS symptoms due to radiation therapy-induced cerebral edema. A dexamethasone dose as low as 4 mg per day may be effective for prophylaxis if no symptoms or signs of increased intracranial pressure or altered consciousness exist. If the patient experiences symptomatic elevations in intracranial pressure, however, a 16-mg dose of dexamethasone per day orally, following a loading dose of 10-mg IV dexamethasone, should be considered. The latter scenario is not common.
Related: Pulmonary Vein Thrombosis Associated With Metastatic Carcinoma
The benefits of steroids, however, need to be carefully balanced against the possible adverse effects (AEs) associated with steroid use, including peripheral edema, gastrointestinal bleeding, risk of infections, hyperglycemia, insomnia, as well as mental status changes, such as anxiety, depression, and confusion. In long-term users, the additional AEs of oral candidiasis and osteoporosis should also be taken into account.
Craniotomy vs SRS
A retrospective study by Schöggl and colleagues compared single brain metastasis cases treated using either Gamma Knife or brain surgery followed by WBRT (30 Gy/10 fractions).3 Local control was significantly better after radiosurgery (95% vs 83%), and median survival was 12 months and 9 months after radiosurgery and brain surgery, respectively. There was no significant difference in OS.
Another comparative study of SR and SRS for solitary brain metastasis revealed no statistically significant difference in survival between the 2 therapeutic modalities (SR or SRS); the 1-year survival rate was 62% (SR) and 56% (SRS).4 A significant prognostic factor for survival was a good performance status of the patients. There was, however, a significant difference in local tumor control: None of the patients in the SRS group experienced local recurrence in contrast to 19 (58%) patients in the SR group.
Whereas selection criteria and treatment choice depend to a large extent on tumor location, tumor size, and availability of SRS, most studies demonstrated that both surgery and SRS result in comparable OS rates for patients with a single brain metastasis.
Multiple Brain Metastases
Jawahar and colleagues studied the role of SRS for multiple brain metastases.8 In their retrospective review of 50 patients with ≥ 3 brain metastases, they found an overall response rate (RR) of 82% and a median survival of 12 months after SRS. As a result of similar studies and their own data, Hasegawa and colleagues recommended radiosurgery alone as initial therapy for patients with a limited number of brain metastases.9
SRS vs SRS Plus WBRT
Studies on the role of SRS plus WBRT are somewhat conflicting. A Radiation Therapy Oncology Group study revealed statistically significant improvement in median survival when SRS boost therapy was added to WBRT in patients with a single brain metastasis compared with SRS alone.5 According to another study, the addition of SRS to WBRT provided better intracranial and local control of metastatic tumors.10
A randomized controlled study by Aoyama and colleagues reported no survival improvement using SRS and WBRT in patients with 1 to 4 brain metastases compared with SRS alone.11 In addition, a retrospective review found no difference in median survival outcomes between SRS alone and SRS plus WBRT (Table 4). In the absence of a clear survival benefit with the use of both modalities and in light of the added toxicity of WBRT, most clinicians have ceased offering both modalities upfront and instead reserve WBRT as a salvage option in cases of subsequent intracranial progression of disease.
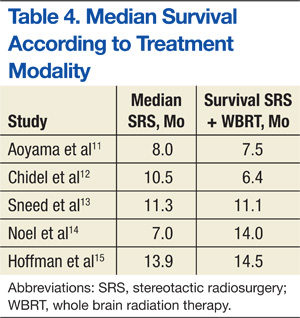
SRS vs WBRT
In general, both SR (crainotomy) and SRS for the treatment of brain metastases seem to be effective therapeutic modalities. Comparisons of both treatments did not reveal significant differences and showed similar outcomes after treatment of smaller lesions. For example, Rades and colleagues reported that SRS alone is as effective as surgery and WBRT for limited metastatic lesions (< 2) in the brain.16 Either SRS or surgery can be used, depending on performance status and metastatic burden (size, location, number of lesions, etc).
There are some inconsistencies in the final results of various studies, such as survival, local tumor control, mortality rate, and pattern of failures. For large, symptomatic brain metastasis, initial surgical debulking remains the preferred approach as a way of achieving immediate decompression and relief of swelling/symptoms. Additionally, for patients who have > 10 brain lesions and/or a histology that corroborates diffuse subclinical involvement of the brain parenchyma (eg, small-cell lung cancer), WBRT is also typically preferred to upfront SRS. Alternatively, radiosurgery is the preferred method for fewer and smaller lesions as a way of minimizing the toxicity from whole brain irradiation. The optimal treatment of multiple small brain metastases remains controversial with some investigators recommending SRS for > 4 metastases only in the setting of controlled extracranial disease based on the more favorable expected survival of such patients.
Multidisciplinary Approach for Lung and Breast Cancers
Prognostic outcomes of patients with brain metastases can vary by primary cancer type. Therefore, clinicians should consider cancer-specific management and tailor their recommendation for specific types of radiation depending on the individual cancer diagnosis. Various investigators have attempted to develop disease-specific prognostic tools to aid clinicians in their decision making. For example, Sperduto and colleagues analyzed significant indexes and diagnosis-specific prognostic factors and published the diagnostic-specific graded prognostic assessment factors.17 They were able to identify several significant prognostic factors, specific to different primary cancer types.
Bimodality Therapies
For certain cancers such as lung and breast primary cancers, bimodality therapy using chemotherapy and radiation treatment should be considered based on promising responses reported in the literature.
Recent studies on the efficacy of chemotherapy for brain metastases from small-cell lung cancer (43%-82%) have also been reported.18-20 Postmus and colleagues reported superior RR of 57% with combination chemotherapy and radiation vs a 22% RR for chemotherapy alone.21 They also found favorable long-term survival trends in patients treated with combined radiochemotherapy.
The efficacy of chemotherapy in non-small cell carcinoma of the lung has been reported in multiple phase 2 studies using various chemotherapeutic agents. The reported RR ranged from 35% to 50%.22-24 Comparative studies of combined chemoradiotherapy demonstrated a 33% RR in contrast to a 27% RR for combined therapy or chemotherapy alone, respectively. However, no difference was noted in median survival rates.25
Care must be taken when interpreting these studies due to heterogeneity of the patient population studied and a lack of data on potential synergistic toxicities between radiation to the CNS and systemic therapy. The authors generally avoid concurrent chemotherapy during CNS irradiation in patients who may have significant survival times > 1 year.
The prognosis of breast cancer patients with brain metastasis largely depends on the number and size of metastatic brain lesions, performance status, extracranial or systemic involvement, and systemic treatment following brain irradiation. The median survival of patients with brain metastasis and radiation therapy is generally about 18 months. The median survival for patients with breast cancer who develop brain metastasis was 3 years from diagnosis of the primary breast cancer.26
Recent advances in systemic agents/options for patients with breast cancer can significantly affect the decision-making process in regard to the treatment of brain lesions in these patients. For example, a few retrospective studies have clearly demonstrated the beneficial effect of trastuzumab in patients with breast cancer with brain metastasis. The median OS in HER2-positive patients with brain metastasis was significantly extended to 41 months when treated with HER2-targeted trastuzumab vs only 13 months for patients who received no treatment.27,28 As a result of the expected prolonged survival, SRS for small and isolated brain lesions has recently become a much more attractive option as a way of mitigating the deleterious long-term effect of whole brain irradiation (memory decline, somnolence, etc).
Summary
Stereotactic radiosurgery is a newly developed radiation therapy technique of highly conformal and focused radiation. For the treatment of patients with favorable prognostic factors and limited brain metastases, especially single brain metastasis, crainiotomy and SRS seems similarly effective and appropriate choices of therapy. Some studies question the possible benefits of additional WBRT to local therapy, such as crainiotomy or radiosurgery.
Some authors recommend deferral of WBRT after local brain therapy and reserving it for salvage therapy in cases of recurrence or progression of brain disease because of possible long-term AEs of whole brain irradiation as well as deterioration of QOL in long-term survivors. Thus, the role of additional WBRT to other local therapy has not been fully settled; further randomized studies may be necessary. Due to the controversies and complexities surrounding the treatment choices for patients with brain disease, all treatment decisions should be individualized and should involve close multidisciplinary collaboration between neurosurgeons, medical oncologists, and radiation oncologists.
Author disclosures
The authors report no actual or potential conflicts of interest with regard to this article.
Disclaimer
The opinions expressed herein are those of the authors and do not necessarily reflect those of Federal Practitioner, Frontline Medical Communications Inc., the U.S. Government, or any of its agencies. This article may discuss unlabeled or investigational use of certain drugs. Please review the complete prescribing information for specific drugs or drug combinations—including indications, contraindications, warnings, and adverse effects—before administering pharmacologic therapy to patients.
1. Limbrick DD Jr, Lusis EA, Chicoine MR, et al. Combined surgical resection and stereotactic radiosurgery for treatment of cerebral metastases. Surg Neurol. 2009;71(3):280-288.
2. Gaspar L, Scott C, Rotman M, et al. Recursive partitioning analysis (RPA) of prognostic factors in three Radiation Therapy Oncology Group (RTOG) brain metastases trials. Int J Radiat Oncol Biol Phys. 1997;37(4):745-751.
3. Schöggl A, Kitz K, Reddy M, et al. Defining the role of stereotactic radiosurgery versus microsurgery in the treatment of single brain metastases. Acta Neurochir (Wien). 2000;142(6):621-626.
4. O’Neill BP, Iturria NJ, Link MJ, Pollock BE, Ballman KV, O’Fallon JR. A comparison of surgical resection and stereotactic radiosurgery in the treatment of solitary brain metastases. Int J Radiat Oncol Biol Phys. 2003;55(5):1169-1176.
5. Stafinski T, Jhangri GS, Yan E, Manon D. Effectiveness of stereotactic radiosurgery alone or in combination with whole brain radiotherapy compared to conventional surgery and/or whole brain radiotherapy for the treatment of one or more brain metastases: a systematic review and meta-analysis. Cancer Treat Rev. 2006;32(3):203-213.
6. Kondziolka D, Patel A, Lunsford LD, Kassam A, Flickinger JC. Stereotactic radiosurgery plus whole brain radiotherapy versus radiotherapy alone for patients with multiple brain metastases. Int J Radiat Oncol Biol Phys. 1999;45(2):427-434.
7. Andrews DW, Scott CB, Sperduto PW, et al. Whole brain radiation therapy with or without stereotactic radiosurgery boost for patients with one to three brain metastases: phase III results of the RTOG 9508 randomised trial. Lancet. 2004;363(9422):1665-1672.
8. Jawahar A, Shaya M, Campbell P, et al. Role of stereotactic radiosurgery as a primary treatment option in the management of newly diagnosed multiple (3-6) intracranial metastases. Surg Neurol. 2005;64(3):207-212.
9. Hasegawa T, Kondziolka D, Flickinger JC, Germanwala A, Lunsford LD. Brain metastases treated with radiosurgery alone: an alternative to whole brain radiotherapy? Neurosurgery. 2003;52(6):1318-1326.
10. Rades D, Kueter JD, Hornung D, et al. Comparison of stereotactic radiosurgery (SRS) alone and whole brain radiotherapy (WBRT) plus a stereotactic boost (WBRT+SRS) for one to three brain metastases. Strahlenther Onkol. 2008;184(12):655-662.
11. Aoyama H, Shirato H, Tago M, et al. Stereotactic radiosurgery plus whole-brain radiation therapy vs stereotactic radiosurgery alone for treatment of brain metastases: a randomized controlled trial. JAMA. 2006;295(21):2483-2491.
12. Chidel MA, Suh JH, Reddy CA, Chao ST, Lundbeck MF, Barnett GH. Application of recursive partitioning analysis and evaluation of the use of whole brain radiation among patients treated with stereotactic radiosurgery for newly diagnosed brain metastases. Int J Radiat Oncol Biol Phys. 2000;47(4):993-999.
13. Sneed PK, Lamborn KR, Forstner JM, et al. Radiosurgery for brain metastases: is whole brain radiotherapy necessary? Int J Radiat Oncol Biol Phys. 1999;43(3):549-558.
14. Noel G, Medioni J, Valery CA, et al. Three irradiation treatment options including radiosurgery for brain metastases from primary lung cancer. Lung Cancer. 2003;41(3):333-343.
15. Hoffman R, Sneed PK, McDermott MW, et al. Radiosurgery for brain metastases from primary lung carcinoma. Cancer J. 2001;7(2):121-131.
16. Rades D, Bohlen G, Pluemer A, et al. Stereotactic radiosurgery alone versus resection plus whole brain radiotherapy for 1 or 2 brain metastases in recursive partitioning analysis class 1 and 2 patients. Cancer. 2007;109(12):2515-2521.
17. Sperduto PW, Chao ST, Sneed PK, et al. Diagnosis-specific prognostic factors, indexes, and treatment outcomes for patients with newly diagnosed brain metastases: a multi-institutional analysis of 4,259 patients. Int J Radiat Oncol Biol Phys. 2010;77(3):655-661.
18. Twelves CJ, Souhami RL, Harper PG, et al. The response of cerebral metastases in small cell lung cancer to systemic chemotherapy. Br J Cancer. 1990;61(1):147-150.
19. Tanaka H, Takifuj N, Masuda N, et al. [Systemic chemotherapy for brain metastases from small-cell lung cancer]. Nihon Kyobu Shikkan Gakkai Zasshi. 1993;31(4):492-497. Japanese.
20. Lee JS, Murphy WK, Glisson BS, Dhingra HM, Holoye PY, Hong WK. Primary chemotherapy of brain metastasis in small-cell lung cancer. J Clin Oncol. 1989;7(7):216-222.
21. Postmus PE, Haaxma-Reiche H, Smit EF, et al. Treatment of brain metastases of small-cell lung cancer: comparing teniposide and teniposide with whole-brain radiotherapy—a phase III study of the European Organisation for the Research and Treatment of Cancer Lung Cancer Cooperative Group. J Clin Oncol. 2000;18(19):3400-3408.
22. Cortes J, Rodriguez J, Aramendia JM, et al. Frontline paclitaxel/cisplatin-based chemotherapy in brain metastases from non-small-cell lung cancer. Oncology. 2003;64(1):28-35.
23. Minotti V, Crinò L, Meacci ML, et al. Chemotherapy with cisplatin and teniposide for cerebral metastases in non-small cell lung cancer. Lung Cancer. 1998;20(2):23-28.
24. Fujita A, Fukuoka S, Takabatake H, Tagaki S, Sekine K. Combination chemotherapy of cisplatin, ifosfamide, and irinotecan with rhG-CSF support in patient with brain metastases from non-small cell lung cancer. Oncology. 2000;59(4):291-295.
25. Robinet G, Thomas R, Breton JL, et al. Results of a phase III study of early versus delayed whole brain radiotherapy with concurrent cisplatin and vinorelbine combination in inoperable brain metastasis of non-small-cell lung cancer: Groupe Français de Pneumo-Cancérologie (GFPC) Protocol 95-1. Ann Oncol. 2001;12(1):29-67.
26. Kiricuta IC, Kölbl O, Willner J, Bohndorf W. Central nervous system metastases in breast cancer. J Cancer Res Clin Oncol. 1992;118(7):542-546.
27. Berghoff AS, Bago-Horvath Z, Dubsky P, et al. Impact of HER-2-targeted therapy on overall survival in patients with HER-2 positive metastatic breast cancer. Breast J. 2013;19(2):149-155.
28. Park IH, Ro J, Lee KS, Nam BH, Kwon Y, Shin KH. Truastzumab treatment beyond brain progression in HER2-positive metastatic breast cancer. Ann Oncol. 2009;20(1):56-62.
Since the 1980s, patients with a single intracranial metastatic lesion traditionally have been treated with surgery followed by whole brain radiation therapy (WBRT). However, there is growing concern about the debilitating cognitive effects associated with WBRT in long-term survivors.
Limbrick and colleagues studied the outcomes of surgery followed by stereotactic radiosurgery (SRS) instead of WBRT and found that the less invasive surgical resection (SR) followed by SRS was an equally effective therapeutic option for the treatment of patients with limited metastatic disease to the brain.1 Median overall survival (OS) was 20 months and was 22 and 13 months for Classes 1 and 2 recursive partitioning analysis (RPA) patients, respectively. Recursive partitioning analysis refers to 3 prognostic classes based on a database of 3 trial studies and 1,200 patients (Table 1).2 According to RPA, the best survival was observed in Class 1 patients, and the worst survival was seen in Class 3 patients. Limbrick and colleagues found that survival outcome was equivalent to or greater than that reported by other studies using surgery plus WBRT or SRS plus WBRT.1 The WBRT was not used and was reserved as salvage therapy in cases of initial failure such as disease progression of brain metastasis.
Radiation Therapies
Stereotactic radiosurgery is not a surgical procedure but a newly developed radiotherapy technique. It is a highly precise, intensive form of radiation therapy, focused on the tumor, with the goal of protecting the surrounding normal brain tissue as much as possible. Radiosurgery was initially introduced with the Gamma Knife by Lars Leksell several decades ago in order to deliver an intense radiation dose to a small, well-defined, single focal point using extreme precision. Stereotactic radiosurgery delivers efficient and focused radiation treatment to the tumor lesion.
There are 2 practical and commercially available radiation delivery systems for SRS: linear accelerator (LINAC)-based radiosurgery and Gamma Knife systems. Use of the Gamma Knife is limited largely to treatment of central nervous system (CNS) malignancies and certain head and neck cancers. Linear accelerator-based SRS is applicable to neoplasms in any organ system of the body (Table 2).
Proton therapy is yet another evolving and completely different mode of radiation therapy. There are currently 14 proton therapy centers in operation in the U.S., and 11 more centers are now under construction. Proton therapy uses charged heavy-particle therapy using proton beams, whereas conventional LINAC-based radiotherapy is X-ray radiotherapy, which uses high energy photon beams. Because of their relatively large mass, protons have little scatter of radiation to surrounding normal structures and can remain sharply focused on the tumor lesion. Accordingly, proton therapy delivers negligible radiation doses beyond tumor lesions, and much of the surrounding normal tissues can be saved from excessive and unnecessary radiation doses.
Related: Bone Metastasis: A Concise Overview
A single proton beam produces a narrow Bragg peak dose distribution at depth, and multiple consecutive stepwise series of different energies of proton beams are needed to administer complete coverage of the target tumor volume. The accumulation of these beam energies produces a uniform radiation dose distribution covering the entire tumor volume (Figure 1). In spite of the theoretical beneficial effects of proton beam therapy, more clinical experience is needed for it to be validated. Even then, the significantly higher costs of proton therapy represent another barrier to its wider implementation. Proton beam radiosurgery is still, in large part, an evolving technology, not widely and uniformly available.
Role of Radiosurgery
Photon (X-ray)-based radiosurgery can be an alternative to craniotomy. Patients can return to their activities immediately after treatment. The ideal candidate for radiosurgery should have a small tumor (1-3 cm is best) with a well-defined margin. Retrospective studies reported no significant difference in therapy outcomes between the 2 therapies.3,4 Additional benefits of radiosurgery include low morbidity and mortality. Furthermore, radiosurgery can be applied to tumors near critical structures, such as the thalamus, basal ganglia, and brainstem, that are otherwise surgically inaccessible.
Most brain metastases are well defined and spherical, so they are ideally treated using SRS (Figure 1). Additionally, the brain is encased in the bony skull, which prevents significant intrafraction motion and provides a reproducible fidulial for accurate setup. Radiosurgery can tailor the radiation dose in order to precisely concentrate radiation distribution to the tumor lesion with a rapid dose falloff beyond the margin of the tumor bed, so surrounding normal brain tissues are spared from high-dose radiation. In sharp contrast, WBRT indiscriminately irradiates the entire brain without sparing the adjacent normal brain tissue (Figure 2). However, because of its limited dose distribution, radiosurgery offers no protection elsewhere in the brain from future metastasis, which is a benefit of whole brain radiation.
Future Use of SBRT
Based on successful experience with intracranial lesions, stereotactic techniques have been expanded to additional anatomical body sites other than the brain. Stereotactic body radiation therapy (SBRT), also called stereotactic body ablative radiotherapy, is progressively gaining acceptance and is being applied to various extracranial tumors, especially lung cancers and hepatic malignancies. Dosimetric studies and early phase clinical trials have clearly established the feasibility, safety, and efficacy of SBRT for certain tumor sites, such as lung, liver, kidney, spine, and paraspinal tumors. Additionally, SBRT may reduce treatment time and therapy costs and thus provide increased convenience to patients.
Effectiveness of SRS
Stafinski and colleagues conducted a meta-analysis of randomized trials to study the effectiveness of SRS in improving the survival as well as the quality of life (QOL) and functional status following SRS of patients with brain metastasis.5 This study found that SRS plus WBRT increased OS for patients with single brain metastasis compared with WBRT alone. Although no significant difference in OS was found in patients with multiple brain metastases, the addition of SRS to WBRT improved the local control and functional independence of this group of patients.
Related: Palliative Radiotherapy for the Management of Metastatic Cancer
Kondziolka and colleagues reported a local failure rate at 1 year of merely 8% following SRS boost therapy after WBRT compared with 100% without SRS.6 There was also a remarkable difference in median time to local failure—36 months vs 6 months, respectively. A randomized study designed to assess the possible benefit of SRS for the treatment of brain metastasis found a survival gain for patients with a single brain metastasis with a median survival time of 6.5 months (SRS) vs 4.9 months (no SRS).7
There are sparse data and reporting related to QOL measurements after SRS for brain metastasis. Andrews and colleagues reported improved functional and independent abilities at 6 months after completion of SRS therapy.7 The criteria used in that study for performance assessments included the Karnofsky Performance Status (KPS) scale, the need for steroid use, and mental status. They found that KPS improvement was statistically significant, and patients were able to decrease the dosage of steroid medication at 6 months after therapy with SRS (Table 3). Despite these reports suggesting superior outcomes with SRS, more rigorous investigations that adequately control for other factors influencing QOL in patients with cancer are needed.
Two major limitations of SRS include large tumor size and multiple numbers of metastatic brain lesions. As the radiation dose to adjacent normal brain tissue quickly increases with larger tumor lesions (> 3-4 cm), the complication risks consequently rise proportionally, necessitating a decrease in the prescribed dose. Patients with poor performance status (< 70 KPS) and presence of active/progressive extracranial disease are also not ideal candidates for SRS.
Other unfavorable conditions for SRS include life expectancy of < 6 months, metastatic lesions in the posterior fossa, and severe acute CNS symptoms due to increased intracranial pressure, brain edema, or massive tumor effects. These factors do not necessarily contraindicate SRS but can increase the risks of such treatment. The authors recommend an experienced multispecialty approach to patients presenting with these findings.
Managing Brain Metastastis
To prevent symptoms related to brain edema (due to brain tumor itself and/or radiation-induced edema), steroid medication is generally administered to most patients, 1 to 3 days prior to initiation of radiation therapy. Corticosteroid use typically results in rapid improvement of existing CNS symptoms, such as headaches, and helps prevent the development of additional CNS symptoms due to radiation therapy-induced cerebral edema. A dexamethasone dose as low as 4 mg per day may be effective for prophylaxis if no symptoms or signs of increased intracranial pressure or altered consciousness exist. If the patient experiences symptomatic elevations in intracranial pressure, however, a 16-mg dose of dexamethasone per day orally, following a loading dose of 10-mg IV dexamethasone, should be considered. The latter scenario is not common.
Related: Pulmonary Vein Thrombosis Associated With Metastatic Carcinoma
The benefits of steroids, however, need to be carefully balanced against the possible adverse effects (AEs) associated with steroid use, including peripheral edema, gastrointestinal bleeding, risk of infections, hyperglycemia, insomnia, as well as mental status changes, such as anxiety, depression, and confusion. In long-term users, the additional AEs of oral candidiasis and osteoporosis should also be taken into account.
Craniotomy vs SRS
A retrospective study by Schöggl and colleagues compared single brain metastasis cases treated using either Gamma Knife or brain surgery followed by WBRT (30 Gy/10 fractions).3 Local control was significantly better after radiosurgery (95% vs 83%), and median survival was 12 months and 9 months after radiosurgery and brain surgery, respectively. There was no significant difference in OS.
Another comparative study of SR and SRS for solitary brain metastasis revealed no statistically significant difference in survival between the 2 therapeutic modalities (SR or SRS); the 1-year survival rate was 62% (SR) and 56% (SRS).4 A significant prognostic factor for survival was a good performance status of the patients. There was, however, a significant difference in local tumor control: None of the patients in the SRS group experienced local recurrence in contrast to 19 (58%) patients in the SR group.
Whereas selection criteria and treatment choice depend to a large extent on tumor location, tumor size, and availability of SRS, most studies demonstrated that both surgery and SRS result in comparable OS rates for patients with a single brain metastasis.
Multiple Brain Metastases
Jawahar and colleagues studied the role of SRS for multiple brain metastases.8 In their retrospective review of 50 patients with ≥ 3 brain metastases, they found an overall response rate (RR) of 82% and a median survival of 12 months after SRS. As a result of similar studies and their own data, Hasegawa and colleagues recommended radiosurgery alone as initial therapy for patients with a limited number of brain metastases.9
SRS vs SRS Plus WBRT
Studies on the role of SRS plus WBRT are somewhat conflicting. A Radiation Therapy Oncology Group study revealed statistically significant improvement in median survival when SRS boost therapy was added to WBRT in patients with a single brain metastasis compared with SRS alone.5 According to another study, the addition of SRS to WBRT provided better intracranial and local control of metastatic tumors.10
A randomized controlled study by Aoyama and colleagues reported no survival improvement using SRS and WBRT in patients with 1 to 4 brain metastases compared with SRS alone.11 In addition, a retrospective review found no difference in median survival outcomes between SRS alone and SRS plus WBRT (Table 4). In the absence of a clear survival benefit with the use of both modalities and in light of the added toxicity of WBRT, most clinicians have ceased offering both modalities upfront and instead reserve WBRT as a salvage option in cases of subsequent intracranial progression of disease.
SRS vs WBRT
In general, both SR (crainotomy) and SRS for the treatment of brain metastases seem to be effective therapeutic modalities. Comparisons of both treatments did not reveal significant differences and showed similar outcomes after treatment of smaller lesions. For example, Rades and colleagues reported that SRS alone is as effective as surgery and WBRT for limited metastatic lesions (< 2) in the brain.16 Either SRS or surgery can be used, depending on performance status and metastatic burden (size, location, number of lesions, etc).
There are some inconsistencies in the final results of various studies, such as survival, local tumor control, mortality rate, and pattern of failures. For large, symptomatic brain metastasis, initial surgical debulking remains the preferred approach as a way of achieving immediate decompression and relief of swelling/symptoms. Additionally, for patients who have > 10 brain lesions and/or a histology that corroborates diffuse subclinical involvement of the brain parenchyma (eg, small-cell lung cancer), WBRT is also typically preferred to upfront SRS. Alternatively, radiosurgery is the preferred method for fewer and smaller lesions as a way of minimizing the toxicity from whole brain irradiation. The optimal treatment of multiple small brain metastases remains controversial with some investigators recommending SRS for > 4 metastases only in the setting of controlled extracranial disease based on the more favorable expected survival of such patients.
Multidisciplinary Approach for Lung and Breast Cancers
Prognostic outcomes of patients with brain metastases can vary by primary cancer type. Therefore, clinicians should consider cancer-specific management and tailor their recommendation for specific types of radiation depending on the individual cancer diagnosis. Various investigators have attempted to develop disease-specific prognostic tools to aid clinicians in their decision making. For example, Sperduto and colleagues analyzed significant indexes and diagnosis-specific prognostic factors and published the diagnostic-specific graded prognostic assessment factors.17 They were able to identify several significant prognostic factors, specific to different primary cancer types.
Bimodality Therapies
For certain cancers such as lung and breast primary cancers, bimodality therapy using chemotherapy and radiation treatment should be considered based on promising responses reported in the literature.
Recent studies on the efficacy of chemotherapy for brain metastases from small-cell lung cancer (43%-82%) have also been reported.18-20 Postmus and colleagues reported superior RR of 57% with combination chemotherapy and radiation vs a 22% RR for chemotherapy alone.21 They also found favorable long-term survival trends in patients treated with combined radiochemotherapy.
The efficacy of chemotherapy in non-small cell carcinoma of the lung has been reported in multiple phase 2 studies using various chemotherapeutic agents. The reported RR ranged from 35% to 50%.22-24 Comparative studies of combined chemoradiotherapy demonstrated a 33% RR in contrast to a 27% RR for combined therapy or chemotherapy alone, respectively. However, no difference was noted in median survival rates.25
Care must be taken when interpreting these studies due to heterogeneity of the patient population studied and a lack of data on potential synergistic toxicities between radiation to the CNS and systemic therapy. The authors generally avoid concurrent chemotherapy during CNS irradiation in patients who may have significant survival times > 1 year.
The prognosis of breast cancer patients with brain metastasis largely depends on the number and size of metastatic brain lesions, performance status, extracranial or systemic involvement, and systemic treatment following brain irradiation. The median survival of patients with brain metastasis and radiation therapy is generally about 18 months. The median survival for patients with breast cancer who develop brain metastasis was 3 years from diagnosis of the primary breast cancer.26
Recent advances in systemic agents/options for patients with breast cancer can significantly affect the decision-making process in regard to the treatment of brain lesions in these patients. For example, a few retrospective studies have clearly demonstrated the beneficial effect of trastuzumab in patients with breast cancer with brain metastasis. The median OS in HER2-positive patients with brain metastasis was significantly extended to 41 months when treated with HER2-targeted trastuzumab vs only 13 months for patients who received no treatment.27,28 As a result of the expected prolonged survival, SRS for small and isolated brain lesions has recently become a much more attractive option as a way of mitigating the deleterious long-term effect of whole brain irradiation (memory decline, somnolence, etc).
Summary
Stereotactic radiosurgery is a newly developed radiation therapy technique of highly conformal and focused radiation. For the treatment of patients with favorable prognostic factors and limited brain metastases, especially single brain metastasis, crainiotomy and SRS seems similarly effective and appropriate choices of therapy. Some studies question the possible benefits of additional WBRT to local therapy, such as crainiotomy or radiosurgery.
Some authors recommend deferral of WBRT after local brain therapy and reserving it for salvage therapy in cases of recurrence or progression of brain disease because of possible long-term AEs of whole brain irradiation as well as deterioration of QOL in long-term survivors. Thus, the role of additional WBRT to other local therapy has not been fully settled; further randomized studies may be necessary. Due to the controversies and complexities surrounding the treatment choices for patients with brain disease, all treatment decisions should be individualized and should involve close multidisciplinary collaboration between neurosurgeons, medical oncologists, and radiation oncologists.
Author disclosures
The authors report no actual or potential conflicts of interest with regard to this article.
Disclaimer
The opinions expressed herein are those of the authors and do not necessarily reflect those of Federal Practitioner, Frontline Medical Communications Inc., the U.S. Government, or any of its agencies. This article may discuss unlabeled or investigational use of certain drugs. Please review the complete prescribing information for specific drugs or drug combinations—including indications, contraindications, warnings, and adverse effects—before administering pharmacologic therapy to patients.
1. Limbrick DD Jr, Lusis EA, Chicoine MR, et al. Combined surgical resection and stereotactic radiosurgery for treatment of cerebral metastases. Surg Neurol. 2009;71(3):280-288.
2. Gaspar L, Scott C, Rotman M, et al. Recursive partitioning analysis (RPA) of prognostic factors in three Radiation Therapy Oncology Group (RTOG) brain metastases trials. Int J Radiat Oncol Biol Phys. 1997;37(4):745-751.
3. Schöggl A, Kitz K, Reddy M, et al. Defining the role of stereotactic radiosurgery versus microsurgery in the treatment of single brain metastases. Acta Neurochir (Wien). 2000;142(6):621-626.
4. O’Neill BP, Iturria NJ, Link MJ, Pollock BE, Ballman KV, O’Fallon JR. A comparison of surgical resection and stereotactic radiosurgery in the treatment of solitary brain metastases. Int J Radiat Oncol Biol Phys. 2003;55(5):1169-1176.
5. Stafinski T, Jhangri GS, Yan E, Manon D. Effectiveness of stereotactic radiosurgery alone or in combination with whole brain radiotherapy compared to conventional surgery and/or whole brain radiotherapy for the treatment of one or more brain metastases: a systematic review and meta-analysis. Cancer Treat Rev. 2006;32(3):203-213.
6. Kondziolka D, Patel A, Lunsford LD, Kassam A, Flickinger JC. Stereotactic radiosurgery plus whole brain radiotherapy versus radiotherapy alone for patients with multiple brain metastases. Int J Radiat Oncol Biol Phys. 1999;45(2):427-434.
7. Andrews DW, Scott CB, Sperduto PW, et al. Whole brain radiation therapy with or without stereotactic radiosurgery boost for patients with one to three brain metastases: phase III results of the RTOG 9508 randomised trial. Lancet. 2004;363(9422):1665-1672.
8. Jawahar A, Shaya M, Campbell P, et al. Role of stereotactic radiosurgery as a primary treatment option in the management of newly diagnosed multiple (3-6) intracranial metastases. Surg Neurol. 2005;64(3):207-212.
9. Hasegawa T, Kondziolka D, Flickinger JC, Germanwala A, Lunsford LD. Brain metastases treated with radiosurgery alone: an alternative to whole brain radiotherapy? Neurosurgery. 2003;52(6):1318-1326.
10. Rades D, Kueter JD, Hornung D, et al. Comparison of stereotactic radiosurgery (SRS) alone and whole brain radiotherapy (WBRT) plus a stereotactic boost (WBRT+SRS) for one to three brain metastases. Strahlenther Onkol. 2008;184(12):655-662.
11. Aoyama H, Shirato H, Tago M, et al. Stereotactic radiosurgery plus whole-brain radiation therapy vs stereotactic radiosurgery alone for treatment of brain metastases: a randomized controlled trial. JAMA. 2006;295(21):2483-2491.
12. Chidel MA, Suh JH, Reddy CA, Chao ST, Lundbeck MF, Barnett GH. Application of recursive partitioning analysis and evaluation of the use of whole brain radiation among patients treated with stereotactic radiosurgery for newly diagnosed brain metastases. Int J Radiat Oncol Biol Phys. 2000;47(4):993-999.
13. Sneed PK, Lamborn KR, Forstner JM, et al. Radiosurgery for brain metastases: is whole brain radiotherapy necessary? Int J Radiat Oncol Biol Phys. 1999;43(3):549-558.
14. Noel G, Medioni J, Valery CA, et al. Three irradiation treatment options including radiosurgery for brain metastases from primary lung cancer. Lung Cancer. 2003;41(3):333-343.
15. Hoffman R, Sneed PK, McDermott MW, et al. Radiosurgery for brain metastases from primary lung carcinoma. Cancer J. 2001;7(2):121-131.
16. Rades D, Bohlen G, Pluemer A, et al. Stereotactic radiosurgery alone versus resection plus whole brain radiotherapy for 1 or 2 brain metastases in recursive partitioning analysis class 1 and 2 patients. Cancer. 2007;109(12):2515-2521.
17. Sperduto PW, Chao ST, Sneed PK, et al. Diagnosis-specific prognostic factors, indexes, and treatment outcomes for patients with newly diagnosed brain metastases: a multi-institutional analysis of 4,259 patients. Int J Radiat Oncol Biol Phys. 2010;77(3):655-661.
18. Twelves CJ, Souhami RL, Harper PG, et al. The response of cerebral metastases in small cell lung cancer to systemic chemotherapy. Br J Cancer. 1990;61(1):147-150.
19. Tanaka H, Takifuj N, Masuda N, et al. [Systemic chemotherapy for brain metastases from small-cell lung cancer]. Nihon Kyobu Shikkan Gakkai Zasshi. 1993;31(4):492-497. Japanese.
20. Lee JS, Murphy WK, Glisson BS, Dhingra HM, Holoye PY, Hong WK. Primary chemotherapy of brain metastasis in small-cell lung cancer. J Clin Oncol. 1989;7(7):216-222.
21. Postmus PE, Haaxma-Reiche H, Smit EF, et al. Treatment of brain metastases of small-cell lung cancer: comparing teniposide and teniposide with whole-brain radiotherapy—a phase III study of the European Organisation for the Research and Treatment of Cancer Lung Cancer Cooperative Group. J Clin Oncol. 2000;18(19):3400-3408.
22. Cortes J, Rodriguez J, Aramendia JM, et al. Frontline paclitaxel/cisplatin-based chemotherapy in brain metastases from non-small-cell lung cancer. Oncology. 2003;64(1):28-35.
23. Minotti V, Crinò L, Meacci ML, et al. Chemotherapy with cisplatin and teniposide for cerebral metastases in non-small cell lung cancer. Lung Cancer. 1998;20(2):23-28.
24. Fujita A, Fukuoka S, Takabatake H, Tagaki S, Sekine K. Combination chemotherapy of cisplatin, ifosfamide, and irinotecan with rhG-CSF support in patient with brain metastases from non-small cell lung cancer. Oncology. 2000;59(4):291-295.
25. Robinet G, Thomas R, Breton JL, et al. Results of a phase III study of early versus delayed whole brain radiotherapy with concurrent cisplatin and vinorelbine combination in inoperable brain metastasis of non-small-cell lung cancer: Groupe Français de Pneumo-Cancérologie (GFPC) Protocol 95-1. Ann Oncol. 2001;12(1):29-67.
26. Kiricuta IC, Kölbl O, Willner J, Bohndorf W. Central nervous system metastases in breast cancer. J Cancer Res Clin Oncol. 1992;118(7):542-546.
27. Berghoff AS, Bago-Horvath Z, Dubsky P, et al. Impact of HER-2-targeted therapy on overall survival in patients with HER-2 positive metastatic breast cancer. Breast J. 2013;19(2):149-155.
28. Park IH, Ro J, Lee KS, Nam BH, Kwon Y, Shin KH. Truastzumab treatment beyond brain progression in HER2-positive metastatic breast cancer. Ann Oncol. 2009;20(1):56-62.
Dissemination of a Care Collaboration Project
"I always pray that my patient won’t need supplies, like oxygen, because that means dealing with the VA. It’s impossible.”
Similar sentiments are shared by community health care providers (HCPs) when addressing the needs of their dual-care patients; those veterans who receive care from both the VHA and non-VHA providers and health care organizations.1,2 Many Medicare-eligible VHA primary care patients access primary and specialty care outside of VHA.3-6
Related: Treating Dual-Use Patients Across Two Health Care Systems
The consequences of dual care for veteran patients have been well described in the literature. Dual-care patients are at risk for several suboptimal health outcomes (higher A1c values, dying of colon cancer, rehospitalization for recurrent stroke or for any other cause),7-11 which may result from receiving fragmented or duplicative care.3,12
Much less attention has been paid to the interactions and care processes that occur between VHA providers and their community counterparts. Many community HCPs experience confusion and frustration when trying to coordinate patient care with VHA and are, not surprisingly, unfamiliar with VHA goals, policies, and procedures.
A study that explored perceptions of nonfederal physicians regarding barriers to effective dual care for veterans showed that coordinating care with VHA is often considered difficult.13 Most study respondents indicated that they were rarely or never informed about the visits that the patient makes to the VHA. There was the perception that information sharing is more common from non-VHA to VHA than vice versa. Most respondents indicated that they were unable to access the VHA formulary, making prescribing medications for their veteran patients problematic. More than half noted that the patient transfer to a VHA facility was problematic.
Related: Veterans' Health and Opioid Safety—Contexts, Risks, and Outreach Implications
Similar difficulties were experienced at the White River Junction VAMC (WRJVAMC) in Vermont. In hopes of alleviating the problems, a pilot project was conducted. The project provided information sharing and discussion meetings for community organizations often involved in dual care. As the project progressed, the VHA case managers observed that community nurses were more likely to have relevant data needed to transfer patients to a VA hospital. Meeting attendees expressed a desire to have greater communication and collaboration with VA. The WRJVAMC leadership recognized the positive impact of this pilot project on community engagement. An expanded trial was proposed and funded by the VHA Office of Rural Health (ORH).
The current project began in 2009 and is conducted throughout VISN 1, which encompasses all the New England states and includes 8 VAMCs and 47 additional access points, including community-based outpatient clinics (CBOCs) and outreach clinics. It is hoped that the project can create an organizational culture change in which VHA facilities move from a dual care to a comanaged care perspective. Presentations are made to community HCPs and staff who may provide care to veterans also served by VHA. The presentations explain the processes for delivery of VHA care; the history and mission of the VHA; eligibility for VHA health care; obtaining VHA prescriptions, medical supplies, and medical records; and transferring a patient to a VHA hospital. Presentations also include adequate time for conversation and questions.
The project lead is the director of primary care for VISN 1, and teams of local champions were assembled at each of the 8 medical centers. To facilitate recruitment of project staff, interested individuals attended a kick-off meeting held at a central location. Attendees heard a presentation about the consequences of dual care and spent time in a facilitated brainstorming session regarding the difficulties of comanaging care with community hospitals, providers, and health care organizations. The immediate overarching goal to “be good neighbors” to community partners was discussed. Finally, the expectations of project participation were considered, and questions were answered.
Following the in-person meeting, telephone calls were arranged with each site team to answer any remaining questions and secure participation. The majority of teams were composed of 1 primary care physician and 1 nurse/nurse case manager. The VISN 1 team was aided by staff from the ORH Veterans Rural Health Resource Center-Eastern Region (VRHRC-ER) to support project planning, implementation, and evaluation.
Related: Perceived Attitudes and Staff Roles of Disaster Management at CBOCs
The presentations were developed by the core project team members and the local VAMC project champions. The initial presentations targeted community physicians and primary care providers (PCPs). These short 30- to 60-minute presentations were designed to fit within lunch breaks and staff meetings. Along with the short presentations, longer (up to 3-4 hours), in-depth presentations targeted to medical staff (nurse case managers, social workers, financial/billing personnel) were scheduled through fiscal years (FYs) 2014-2015. These in-depth presentations will continue in FY16.
A 4-step protocol, outlined by Tomioka and colleagues, was chosen to guide dissemination activities and allow for evaluation of the degree of fidelity to the project model on replication.14 The steps begin with identifying the components of the program and advance through determining implementation and evaluating the degree of fidelity at the new site. Described here is the application of step 1 of the protocol. The second component is under way, and all remaining steps will be reported in a future article.
Methods
Through a series of focused discussions, the core project team delineated the specific project components. Each team member independently assigned an Adaptation Traffic Light designation to each component. Red light changes were those elements that cannot be altered without negatively impacting fidelity to the project model. Yellow light changes can be undertaken with caution, as they could potentially result in substantial deviations from the original project model. Finally, green light changes can be made without negative impact on the program.14 The team reconvened, discussed rationales for the assignments, reevaluated the values assigned, and reached an agreement about the light designation for each component. In cases where an agreement could not be reached through discussion, the team reexamined the component and made changes to the definition where warranted. For example, a concept that had been defined too broadly was broken down further until an agreement was reached regarding categorization of the resultant parts.
Results and Discussion
The project components, how they were implemented, and the Adaptation Traffic Light designations are presented in Table 1. This exercise brought clarity and focus to how the core project team viewed the implementation activities.

Red Lights
Several staff roles and project components were identified that were considered essential to success. First on this list was the role of the leader-champion. To have full impact, the leader-champion must be in a position of authority. For this project, the role of leader-champion was filled by the VISN 1 Primary Care Service Line director. The leader-champion actively facilitated weekly meetings, acted as a project ambassador to VA leadership, and expressed an even-tempered, supportive, problem-solving perspective with the various medical center project leads.
Because this project is implemented across a wide geographic area, local champions at each VAMC were deemed a red-light component. Having motivated people “on the ground” who are invested in the project’s goals is essential for success. For optimal outcomes, local champion involvement must be a choice and not an additional assigned responsibility. Maintaining a stable project team is ideal. In the instances where VAMC teams lost members, the core project team would actively assist in finding new members and orienting new members to the project.
An experienced project manager was also thought to be a red-light element for successful implementation. The project manager must maintain project focus, momentum, and trajectory while identifying opportunities for improvement and expansion.
This project could not be successfully implemented without dedicated administrative support and therefore could not be replicated without administrative assistance. Administrative support for this project was provided by 2 individuals. One individual maintained the weekly meeting schedule, arranged in-person team meetings, produced and circulated meeting minutes, and maintained a calendar of presentations. The second individual provided logistic support to ensure that project funds, equipment, and materials were accessible to each local medical center team as needed.
Community attendees were also a red-light component. On project initiation, the study team intended physicians and midlevel PCPs to be the target audience. However, many physicians were unable to attend due to time constraints. Instead, nurses and other office staff attended—only 13% of the attendees identified themselves as physicians or midlevel providers. As a result, the large project team decided to shift the initial focus from targeting providers to a the broader complement of HCPs. Work began to develop a more in-depth presentation, which would be of interest to nurses, case managers, social workers, administrators, and other medical office personnel.
Presentation content must be consistent across the sites and was, therefore, a red-light element. It is vitally important that the core message being delivered is unified. A small number of slides in the presentation were edited locally to include information specific to the individual medical center (clinic locations, addresses, telephone numbers, and local processes), but the majority of slides had identical content and formatting. The slide set is available on request.
Yellow Lights
Three project components were thought to have yellow-light flexibility and could, when changed with caution, allow for dissemination with fidelity to the project model. The printed materials distributed at presentations included booklets, trifold brochures, information sheets, and other resources seen as useful by each medical center team. Any printed materials could be distributed as long as they were VHA vetted and approved.
Although the evaluation is an essential component to tracking project impact and should be carried out in some form, it is recognized that not all facilities will need or want to conduct such a structured and time-intensive evaluation. In this case, evaluation included before-and-after presentation feedback forms and a telephone call 3 to 6 months after attendance.
Immediately following the presentation, participants were asked to rerate their VA-specific knowledge and identify the presentation elements they found most important. At the 3-month follow-up call, attendees were asked to give feedback about any situations in which they had comanaged care with VA, explain how any interactions had gone, and discuss whether they used any of the printed handouts. As of February 28, 2015, 101 presentations were made to more than 1,700 individuals. A total of 1,183 feedback forms (598 before and 585 after) were returned. The results showed a dramatic increase in self-rated knowledge of VA-specific topics and procedures (Table 2). Open-ended comments articulated appreciation for the VA teams’ willingness to openly share information, respectfully hear concerns from the community, and proactively work to improve care for veteran patients.

Presentation demeanor is very important but has some flexibility. The presenter does not have to be a seasoned public speaker. However, the presenter should adopt an unassuming, genuine, open stance and be willing to hear comments and criticisms in a gracious way. In those cases where a participant shares a bad experience in dealing with VA, the presenter must assure the speaker that the intention is to improve collaboration.
Green Lights
Event scheduling and identification of potential presentation sites was largely left up to the local VAMC and CBOC teams. Methods included contacting nearby health care facilities, leveraging existing professional and personal relationships, and targeting community facilities that were known to treat veterans. The status of presentations was reviewed at each team meeting. Finding the time to schedule and arrange presentations was difficult for many of the teams. The core project team enlisted the help of the Geospatial Outcomes Division at the Malcom Randall VAMC in Gainesville, Florida, to use geographic information system technology to create a list of facilities in the area of each VAMC. This allowed the teams to further target potential attendees.
Various other tasks were still noteworthy in their significance to the project’s success in VISN 1. The VISN 1 Care Collaboration project required portable projectors for each team. Funds for the projectors were sent to each participating facility to procure the projector locally. Salary support funding was sent to each participating VAMC to allow overtime as needed for presentations. Funding was also sent to each medical center to cover travel expenses related to project activities. Printing of presentation booklets was handled centrally, using the GPOExpress program, which allows printing at any FedEx office location and provides deep discounts for printed products. The ability to print on demand to a remote location with very short turnaround times was crucial in many instances.
Conculsions
This project began as a pilot implemented at a single medical center in 2009 and grew into a VISN-wide initiative. After expansion, all 8 VISN 1 sites, the core project team was able to have substantive discussions about the project’s components, their relative importance in the dissemination process, and suggestions for alternatives to identified barriers.14
In FY15, the VISN 1 core project team has helped expand the project in VISN 19. The new project team, located at the Salt Lake City VAMC in Utah, has long been interested in improving communication and collaboration with the non-VA health care community. However, interest and enthusiasm alone are not sufficient for successful uptake. Many sites likely will not have special funding to implement this program.
As a tool to support successful implementation, essential implementation components were identified, based on experience. Local facilities can use the information included in Table 1 to consider and assess their assets, identify enthusiastic staff in their facility, consider creative local partnerships that would support implementation, and reach out to local rural health resources for assistance. Efforts to build collegial relationships with community providers will enhance communication and improve the quality of care received by all veterans.
Author disclosures
The authors report no actual or potential conflicts of interest with regard to this article.
Disclaimer
The opinions expressed herein are those of the authors and do not necessarily reflect those of Federal Practitioner, Frontline Medical Communications Inc., the U.S. Government, or any of its agencies. This article may discuss unlabeled or investigational use of certain drugs. Please review complete prescribing information for specific drugs or drug combinations—including indications, contraindications, warnings, and adverse effects—before administering pharmacologic therapy to patients.
1. Borowsky SJ, Cowper DC. Dual use of VA and non-VA primary care. J Gen Intern Med. 1999;14(5): 274-280.
2. Nayar P, Nguyen AT, Ojha D, Schmid KK, Apenteng B, Woodbridge P. Transitions in dual care for veterans: non-federal physician perspectives. J Community Health. 2013;38(2):225-237.
3. Liu CF, Bryson CL, Burgess JF Jr, Sharp N, Perkins M, Maciejewski ML. Use of outpatient care in VA and Medicare among disability-eligible and age-eligible veteran patients. BMC Health Serv Res. 2012;12:51.
4. Liu CF, Chapko M, Bryson CL, et al. Use of outpatient care in Veterans Health Administration and Medicare among veterans receiving primary care in community-based and hospital outpatient clinics. Health Serv Res. 2010;45(5, pt 1):1268-1286.
5. Lee PW, Markle PS, West AN, Lee RE. Use and quality of care at a VA outreach clinic in northern Maine. J Prim Care Community Health. 2012;3(3):159-163.
6. Petersen LA, Byrne MM, Daw CN, Hasche J, Reis B, Pietz K. Relationship between clinical conditions and use of Veterans Affairs health care among Medicare-enrolled veterans. Health Serv Res. 2010;45(3):762-791.
7. Helmer D, Sambamoorthi U, Shen Y, et al. Opting out of an integrated healthcare system: dual-system use is associated with poorer glycemic control in veterans with diabetes. Prim Care Diabetes. 2008;2(2):73-80.
8. Tarlov E, Lee TA, Weichle TW, et al. Reduced overall and event-free survival among colon cancer patients using dual system care. Cancer Epidemiol Biomarkers Prev. 2012;21(12):2231-2241.
9. Wolinsky FD, An H, Liu L, Miller TR, Rosenthal GE. Exploring the association of dual use of the VHA and Medicare with mortality: separating the contributions of inpatient and outpatient services. BMC Health Serv Res. 2007;7:70.
10. Wolinsky FD, Miller TR, An H, Brezinski PR, Vaughn TE, Rosenthal GE. Dual use of Medicare and the Veterans Health Administration: are there adverse health outcomes? BMC Health Serv Res. 2006;6:131.
11. Jia H, Zheng Y, Reker DM, et al. Multiple system utilization and mortality for veterans with stroke. Stroke. 2007;38(2):355-360.
12. Maciejewski ML, Wang V, Burgess JF Jr, Bryson CL, Perkins M, Liu CF. The continuity and quality of primary care. Med Care Res Rev. 2013;70(5):497-513.
13. Miller EA, Intrator O. Veterans use of non-VHA services: implications for policy and planning. Soc Work Public Health. 2012;27(4):379-391.
14. Tomioka M, Braun KL. Implementing evidence-based programs: a four-step protocol for assuring replication with fidelity. Health Promot Pract. 2013;14(6):850-858.
"I always pray that my patient won’t need supplies, like oxygen, because that means dealing with the VA. It’s impossible.”
Similar sentiments are shared by community health care providers (HCPs) when addressing the needs of their dual-care patients; those veterans who receive care from both the VHA and non-VHA providers and health care organizations.1,2 Many Medicare-eligible VHA primary care patients access primary and specialty care outside of VHA.3-6
Related: Treating Dual-Use Patients Across Two Health Care Systems
The consequences of dual care for veteran patients have been well described in the literature. Dual-care patients are at risk for several suboptimal health outcomes (higher A1c values, dying of colon cancer, rehospitalization for recurrent stroke or for any other cause),7-11 which may result from receiving fragmented or duplicative care.3,12
Much less attention has been paid to the interactions and care processes that occur between VHA providers and their community counterparts. Many community HCPs experience confusion and frustration when trying to coordinate patient care with VHA and are, not surprisingly, unfamiliar with VHA goals, policies, and procedures.
A study that explored perceptions of nonfederal physicians regarding barriers to effective dual care for veterans showed that coordinating care with VHA is often considered difficult.13 Most study respondents indicated that they were rarely or never informed about the visits that the patient makes to the VHA. There was the perception that information sharing is more common from non-VHA to VHA than vice versa. Most respondents indicated that they were unable to access the VHA formulary, making prescribing medications for their veteran patients problematic. More than half noted that the patient transfer to a VHA facility was problematic.
Related: Veterans' Health and Opioid Safety—Contexts, Risks, and Outreach Implications
Similar difficulties were experienced at the White River Junction VAMC (WRJVAMC) in Vermont. In hopes of alleviating the problems, a pilot project was conducted. The project provided information sharing and discussion meetings for community organizations often involved in dual care. As the project progressed, the VHA case managers observed that community nurses were more likely to have relevant data needed to transfer patients to a VA hospital. Meeting attendees expressed a desire to have greater communication and collaboration with VA. The WRJVAMC leadership recognized the positive impact of this pilot project on community engagement. An expanded trial was proposed and funded by the VHA Office of Rural Health (ORH).
The current project began in 2009 and is conducted throughout VISN 1, which encompasses all the New England states and includes 8 VAMCs and 47 additional access points, including community-based outpatient clinics (CBOCs) and outreach clinics. It is hoped that the project can create an organizational culture change in which VHA facilities move from a dual care to a comanaged care perspective. Presentations are made to community HCPs and staff who may provide care to veterans also served by VHA. The presentations explain the processes for delivery of VHA care; the history and mission of the VHA; eligibility for VHA health care; obtaining VHA prescriptions, medical supplies, and medical records; and transferring a patient to a VHA hospital. Presentations also include adequate time for conversation and questions.
The project lead is the director of primary care for VISN 1, and teams of local champions were assembled at each of the 8 medical centers. To facilitate recruitment of project staff, interested individuals attended a kick-off meeting held at a central location. Attendees heard a presentation about the consequences of dual care and spent time in a facilitated brainstorming session regarding the difficulties of comanaging care with community hospitals, providers, and health care organizations. The immediate overarching goal to “be good neighbors” to community partners was discussed. Finally, the expectations of project participation were considered, and questions were answered.
Following the in-person meeting, telephone calls were arranged with each site team to answer any remaining questions and secure participation. The majority of teams were composed of 1 primary care physician and 1 nurse/nurse case manager. The VISN 1 team was aided by staff from the ORH Veterans Rural Health Resource Center-Eastern Region (VRHRC-ER) to support project planning, implementation, and evaluation.
Related: Perceived Attitudes and Staff Roles of Disaster Management at CBOCs
The presentations were developed by the core project team members and the local VAMC project champions. The initial presentations targeted community physicians and primary care providers (PCPs). These short 30- to 60-minute presentations were designed to fit within lunch breaks and staff meetings. Along with the short presentations, longer (up to 3-4 hours), in-depth presentations targeted to medical staff (nurse case managers, social workers, financial/billing personnel) were scheduled through fiscal years (FYs) 2014-2015. These in-depth presentations will continue in FY16.
A 4-step protocol, outlined by Tomioka and colleagues, was chosen to guide dissemination activities and allow for evaluation of the degree of fidelity to the project model on replication.14 The steps begin with identifying the components of the program and advance through determining implementation and evaluating the degree of fidelity at the new site. Described here is the application of step 1 of the protocol. The second component is under way, and all remaining steps will be reported in a future article.
Methods
Through a series of focused discussions, the core project team delineated the specific project components. Each team member independently assigned an Adaptation Traffic Light designation to each component. Red light changes were those elements that cannot be altered without negatively impacting fidelity to the project model. Yellow light changes can be undertaken with caution, as they could potentially result in substantial deviations from the original project model. Finally, green light changes can be made without negative impact on the program.14 The team reconvened, discussed rationales for the assignments, reevaluated the values assigned, and reached an agreement about the light designation for each component. In cases where an agreement could not be reached through discussion, the team reexamined the component and made changes to the definition where warranted. For example, a concept that had been defined too broadly was broken down further until an agreement was reached regarding categorization of the resultant parts.
Results and Discussion
The project components, how they were implemented, and the Adaptation Traffic Light designations are presented in Table 1. This exercise brought clarity and focus to how the core project team viewed the implementation activities.
Red Lights
Several staff roles and project components were identified that were considered essential to success. First on this list was the role of the leader-champion. To have full impact, the leader-champion must be in a position of authority. For this project, the role of leader-champion was filled by the VISN 1 Primary Care Service Line director. The leader-champion actively facilitated weekly meetings, acted as a project ambassador to VA leadership, and expressed an even-tempered, supportive, problem-solving perspective with the various medical center project leads.
Because this project is implemented across a wide geographic area, local champions at each VAMC were deemed a red-light component. Having motivated people “on the ground” who are invested in the project’s goals is essential for success. For optimal outcomes, local champion involvement must be a choice and not an additional assigned responsibility. Maintaining a stable project team is ideal. In the instances where VAMC teams lost members, the core project team would actively assist in finding new members and orienting new members to the project.
An experienced project manager was also thought to be a red-light element for successful implementation. The project manager must maintain project focus, momentum, and trajectory while identifying opportunities for improvement and expansion.
This project could not be successfully implemented without dedicated administrative support and therefore could not be replicated without administrative assistance. Administrative support for this project was provided by 2 individuals. One individual maintained the weekly meeting schedule, arranged in-person team meetings, produced and circulated meeting minutes, and maintained a calendar of presentations. The second individual provided logistic support to ensure that project funds, equipment, and materials were accessible to each local medical center team as needed.
Community attendees were also a red-light component. On project initiation, the study team intended physicians and midlevel PCPs to be the target audience. However, many physicians were unable to attend due to time constraints. Instead, nurses and other office staff attended—only 13% of the attendees identified themselves as physicians or midlevel providers. As a result, the large project team decided to shift the initial focus from targeting providers to a the broader complement of HCPs. Work began to develop a more in-depth presentation, which would be of interest to nurses, case managers, social workers, administrators, and other medical office personnel.
Presentation content must be consistent across the sites and was, therefore, a red-light element. It is vitally important that the core message being delivered is unified. A small number of slides in the presentation were edited locally to include information specific to the individual medical center (clinic locations, addresses, telephone numbers, and local processes), but the majority of slides had identical content and formatting. The slide set is available on request.
Yellow Lights
Three project components were thought to have yellow-light flexibility and could, when changed with caution, allow for dissemination with fidelity to the project model. The printed materials distributed at presentations included booklets, trifold brochures, information sheets, and other resources seen as useful by each medical center team. Any printed materials could be distributed as long as they were VHA vetted and approved.
Although the evaluation is an essential component to tracking project impact and should be carried out in some form, it is recognized that not all facilities will need or want to conduct such a structured and time-intensive evaluation. In this case, evaluation included before-and-after presentation feedback forms and a telephone call 3 to 6 months after attendance.
Immediately following the presentation, participants were asked to rerate their VA-specific knowledge and identify the presentation elements they found most important. At the 3-month follow-up call, attendees were asked to give feedback about any situations in which they had comanaged care with VA, explain how any interactions had gone, and discuss whether they used any of the printed handouts. As of February 28, 2015, 101 presentations were made to more than 1,700 individuals. A total of 1,183 feedback forms (598 before and 585 after) were returned. The results showed a dramatic increase in self-rated knowledge of VA-specific topics and procedures (Table 2). Open-ended comments articulated appreciation for the VA teams’ willingness to openly share information, respectfully hear concerns from the community, and proactively work to improve care for veteran patients.
Presentation demeanor is very important but has some flexibility. The presenter does not have to be a seasoned public speaker. However, the presenter should adopt an unassuming, genuine, open stance and be willing to hear comments and criticisms in a gracious way. In those cases where a participant shares a bad experience in dealing with VA, the presenter must assure the speaker that the intention is to improve collaboration.
Green Lights
Event scheduling and identification of potential presentation sites was largely left up to the local VAMC and CBOC teams. Methods included contacting nearby health care facilities, leveraging existing professional and personal relationships, and targeting community facilities that were known to treat veterans. The status of presentations was reviewed at each team meeting. Finding the time to schedule and arrange presentations was difficult for many of the teams. The core project team enlisted the help of the Geospatial Outcomes Division at the Malcom Randall VAMC in Gainesville, Florida, to use geographic information system technology to create a list of facilities in the area of each VAMC. This allowed the teams to further target potential attendees.
Various other tasks were still noteworthy in their significance to the project’s success in VISN 1. The VISN 1 Care Collaboration project required portable projectors for each team. Funds for the projectors were sent to each participating facility to procure the projector locally. Salary support funding was sent to each participating VAMC to allow overtime as needed for presentations. Funding was also sent to each medical center to cover travel expenses related to project activities. Printing of presentation booklets was handled centrally, using the GPOExpress program, which allows printing at any FedEx office location and provides deep discounts for printed products. The ability to print on demand to a remote location with very short turnaround times was crucial in many instances.
Conculsions
This project began as a pilot implemented at a single medical center in 2009 and grew into a VISN-wide initiative. After expansion, all 8 VISN 1 sites, the core project team was able to have substantive discussions about the project’s components, their relative importance in the dissemination process, and suggestions for alternatives to identified barriers.14
In FY15, the VISN 1 core project team has helped expand the project in VISN 19. The new project team, located at the Salt Lake City VAMC in Utah, has long been interested in improving communication and collaboration with the non-VA health care community. However, interest and enthusiasm alone are not sufficient for successful uptake. Many sites likely will not have special funding to implement this program.
As a tool to support successful implementation, essential implementation components were identified, based on experience. Local facilities can use the information included in Table 1 to consider and assess their assets, identify enthusiastic staff in their facility, consider creative local partnerships that would support implementation, and reach out to local rural health resources for assistance. Efforts to build collegial relationships with community providers will enhance communication and improve the quality of care received by all veterans.
Author disclosures
The authors report no actual or potential conflicts of interest with regard to this article.
Disclaimer
The opinions expressed herein are those of the authors and do not necessarily reflect those of Federal Practitioner, Frontline Medical Communications Inc., the U.S. Government, or any of its agencies. This article may discuss unlabeled or investigational use of certain drugs. Please review complete prescribing information for specific drugs or drug combinations—including indications, contraindications, warnings, and adverse effects—before administering pharmacologic therapy to patients.
1. Borowsky SJ, Cowper DC. Dual use of VA and non-VA primary care. J Gen Intern Med. 1999;14(5): 274-280.
2. Nayar P, Nguyen AT, Ojha D, Schmid KK, Apenteng B, Woodbridge P. Transitions in dual care for veterans: non-federal physician perspectives. J Community Health. 2013;38(2):225-237.
3. Liu CF, Bryson CL, Burgess JF Jr, Sharp N, Perkins M, Maciejewski ML. Use of outpatient care in VA and Medicare among disability-eligible and age-eligible veteran patients. BMC Health Serv Res. 2012;12:51.
4. Liu CF, Chapko M, Bryson CL, et al. Use of outpatient care in Veterans Health Administration and Medicare among veterans receiving primary care in community-based and hospital outpatient clinics. Health Serv Res. 2010;45(5, pt 1):1268-1286.
5. Lee PW, Markle PS, West AN, Lee RE. Use and quality of care at a VA outreach clinic in northern Maine. J Prim Care Community Health. 2012;3(3):159-163.
6. Petersen LA, Byrne MM, Daw CN, Hasche J, Reis B, Pietz K. Relationship between clinical conditions and use of Veterans Affairs health care among Medicare-enrolled veterans. Health Serv Res. 2010;45(3):762-791.
7. Helmer D, Sambamoorthi U, Shen Y, et al. Opting out of an integrated healthcare system: dual-system use is associated with poorer glycemic control in veterans with diabetes. Prim Care Diabetes. 2008;2(2):73-80.
8. Tarlov E, Lee TA, Weichle TW, et al. Reduced overall and event-free survival among colon cancer patients using dual system care. Cancer Epidemiol Biomarkers Prev. 2012;21(12):2231-2241.
9. Wolinsky FD, An H, Liu L, Miller TR, Rosenthal GE. Exploring the association of dual use of the VHA and Medicare with mortality: separating the contributions of inpatient and outpatient services. BMC Health Serv Res. 2007;7:70.
10. Wolinsky FD, Miller TR, An H, Brezinski PR, Vaughn TE, Rosenthal GE. Dual use of Medicare and the Veterans Health Administration: are there adverse health outcomes? BMC Health Serv Res. 2006;6:131.
11. Jia H, Zheng Y, Reker DM, et al. Multiple system utilization and mortality for veterans with stroke. Stroke. 2007;38(2):355-360.
12. Maciejewski ML, Wang V, Burgess JF Jr, Bryson CL, Perkins M, Liu CF. The continuity and quality of primary care. Med Care Res Rev. 2013;70(5):497-513.
13. Miller EA, Intrator O. Veterans use of non-VHA services: implications for policy and planning. Soc Work Public Health. 2012;27(4):379-391.
14. Tomioka M, Braun KL. Implementing evidence-based programs: a four-step protocol for assuring replication with fidelity. Health Promot Pract. 2013;14(6):850-858.
Code Status Discussions
Informed consent is one of the ethical, legal, and moral foundations of modern medicine.[1] Key elements of informed consent include: details of the procedure, benefits of the procedure, significant risks involved, likelihood of the outcome if predictable, and alternative therapeutic options.[2] Although rarely identified as such, conversations eliciting patient preferences about cardiopulmonary resuscitation (CPR) are among the most common examples of obtaining informed consent. Nevertheless, discussing CPR preference, often called code status discussions, differs from other examples of obtaining informed consent in 2 important ways. First, they occur well in advance of the potential need for CPR, so that the patient is well enough to participate meaningfully in the discussion. Second, because the default assumption is for patients to undergo the intervention (i.e. CPR), the focus of code status discussions is often on informed refusal, namely a decision about a do not resuscitate(DNR) order.
Since the institution of the Patient Self‐Determination Act in 1990, hospitals are obliged to educate patients about choices regarding end‐of‐life care at the time of hospital admission.[3] In many teaching hospitals, this responsibility falls to the admitting physician, often a trainee, who determines the patient's preferences regarding CPR and documents whether the patient is full code or DNR.
Prior studies have raised concerns about the quality of these conversations, highlighting their superficial nature and revealing trainee dissatisfaction with the results.[4, 5] Importantly, studies have shown that patients are capable of assimilating information about CPR when presented accurately and completely, and that such information can dramatically alter their choices.[6, 7, 8] These findings suggest that patients who are adequately educated will make more informed decisions regarding CPR, and that well‐informed choices about CPR may differ from poorly informed ones.
Although several studies have questioned the quality of code status discussions, none of these studies frames these interactions as examples of informed consent. Therefore, the purpose of the study was to examine the content of code status discussions as reported by internal medicine residents to determine whether they meet the basic tenets of informed consent, thereby facilitating informed decision making.
METHODS
In an iterative, collaborative process, authors A.F.B. and M.K.B. (an internal medicine resident at the time of the study and a board‐certified palliative care specialist/oncologist with experience in survey development, respectively) developed a survey adapted from previously published surveys.[9, 10, 11] The survey solicited respondent demographics, frequency of code status conversations, content of these discussions, and barriers to discussions. The survey instrument can be viewed in the Supporting Information, Appendix A, in the online version of this article. We used a 5‐point frequency scale (almost nevernearly always) for questions regarding: specific aspects of the informed consent related to code status discussions, resident confidence in conducting code status discussions, and barriers to code status discussions. We used a checklist for questions regarding content of code status discussions and patient characteristics influencing code status discussions. Residents provided a numeric percentage answer to 2 knowledge‐based questions of postarrest outcomes: (1) likelihood a patient would survive a witnessed pulseless ventricular tachycardia event and (2) likelihood of survival of a pulseless electrical activity event. The survey was revised by a hospitalist with experience in survey design (G.C.H.). We piloted the survey with 15 residents not part of the subject population and made revisions based on their input.
We sent a link to the online survey over secure email to all 159 internal medicine residents at our urban‐based academic medical center in January 2012. The email described the purpose of the study and stated that participation in the study (or lack thereof) was voluntary, anonymous, and would not have ramifications within the residency program. As part of the recruitment email, we explicitly included the elements of informed consent for the study participants. Not all the questions were mandatory to complete the survey. We sent a reminder e‐mail on a weekly basis for a total of 3 times and closed the survey after 1 month. Our goal was a 60% (N = 95) response rate.
We tabulated the results by question. For analytic purposes, we aligned the content questions with key elements of informed consent as follows: step‐by‐step description of the events (details), patient‐specific likelihood of discharge if resuscitated (benefits), complications of resuscitation (risks), population‐based likelihood of discharge if resuscitated (likelihood), and opportunity for changing code status (alternatives). For the knowledge‐based questions, we deemed the answer correct if it was within 10% (5%) of published statistics from the 2010 national registry of cardiopulmonary resuscitation.[12] We stratified the key elements of informed consent and level of confidence by postgraduate year (PGY), comparing PGY1 residents versus PGY2 and PGY3 residents using 2 tests (or Fisher exact test for observations 5). We performed a univariate logistic regression analysis examining the relationship between confidence and reported use of informed consent elements in code discussions. The dependent variable of confidence in sufficient information having been provided for fully informed decision making was dichotomized as most of the time or nearly always versus other responses, whereas the independent variable was dichotomized as residents who reported using all 5 informed consent elements versus those who did not. We analyzed data using Stata 12 (StataCorp, College Station, TX).
The institutional review board of the Beth Israel Deaconess reviewed the study protocol and determined that it was exempt from institutional review board review.
RESULTS
One hundred of 159 (62.3%) internal medicine residents responded to the survey. Of the respondents 93% (N = 93) completed the survey. The 7% (N = 7) who did not complete the survey omitted the knowledge‐based questions and demographics. Approximately half of participants (54%, N = 50) were male. The majority of residents (85%, N = 79) had either occasional or frequent exposure to palliative care, with 10% (N = 9) having completed a palliative care rotation (Table 1).
| Characteristic | N (%) |
|---|---|
| |
| Sex, male | 50 (54) |
| PGY level | |
| PGY1 | 35 (38) |
| PGY2 | 33 (35) |
| PGY3 | 25 (27) |
| Exposure to palliative care | |
| Very little | 5 (5) |
| Occasional | 55 (59) |
| Frequent | 24 (26) |
| Completed palliative care elective | 9 (10) |
| What type of teaching did you have with code status discussions (check all that apply)? | |
| No teaching | 6 (6) |
| Lectures | 35 (38) |
| Small group teaching sessions | 57 (61) |
| Direct observation and feedback | 50 (54) |
| Exposure to palliative care consultation while rotating on the wards | 54 (58) |
| Other | 4 (4) |
| How much has your previous teaching about resuscitative measures influenced your behavior? | |
| Not at all | 1 (1) |
| Not very much | 15 (16) |
| A little bit | 39 (42) |
| A lot | 38 (41) |
The vast majority of residents (96%, N = 95) discussed code status with more than 40% of patients they admitted to the hospital (Table 2). Two‐thirds (66%, N = 65) of all residents had the conversation with at least 4 out of 5 (81%99% and 100%) patients they admitted to the hospital. Only 1% (N = 1) of residents who responded to the survey reported conducting code status discussions with 20% or fewer of the patients they admitted to the hospital.
| N (%) | |
|---|---|
| Percentage of inpatients with which you discuss code status, n = 99 | |
| 100% | 12 (12) |
| 8199% | 53 (54) |
| 6180% | 19 (19) |
| 4160% | 11 (11) |
| 2140% | 3 (3) |
| 120% | 1 (1) |
| Aspects of resuscitative measures routinely discussed, n = 100 | |
| Intubation/ventilation | 100 (100) |
| Chest compressions | 99 (99) |
| Defibrillation | 86 (86) |
| Surrogate decision maker | 61 (61) |
| Likelihood of success | 35 (35) |
| Quality of life | 32 (32) |
| Vasopressors | 13 (13) |
| Likelihood of discharge | 10 (10) |
| Possible role of depression | 10 (10) |
| Physical states worse than death | 7 (7) |
| Religious beliefs as a factor | 6 (6) |
| Makes recommendations for code status, n = 93 | |
| Never | 19 (20) |
| Rarely | 33 (35) |
| Sometimes | 33 (35) |
| Often | 7 (8) |
| Nearly always | 1 (1) |
Most residents (66%, N = 66) identified the healthcare proxy or surrogate decision maker most of the time or nearly always. In addition, most residents (62%, N = 62) reminded patients that they could reverse their code status at any time. Almost half included a description of step‐by‐step events during resuscitation (45%, N = 45) or factored in patient's comorbidities (43%, N = 43) when discussing resuscitation at least most of the time. Few residents described complications (31%, N = 31) or outcomes (17%, N = 17) of cardiopulmonary arrests to patients most of the time or nearly always. Most residents did not explore factors such as quality of life, role of depression or physical states worse than death, factors that could potentially affect patient decision making (Table 2). Few (9%, N = 8) internal medicine residents (often or nearly always) offered their opinion regarding a patient's code status.
Many factors influenced residents' decisions to have a code status conversation. At least 85% (N = 86) of residents reported that older age, particular admitting diagnoses, and multiple comorbidities made them more likely to have a code status discussion (see Supporting Table 1 in the online version of this article). Patient race/ethnicity did not influence this decision, with only 1 respondent reporting this factor as relevant.
Residents identified lack of time (49%, N = 49 responding often or nearly always) as the most frequent barrier to having a code status discussion, followed by lack of rapport (29%, N = 29). Lack of experience (6%, N = 6), lack of information about the patient's clinical status (11%, N = 11), and lack of knowledge about outcomes (13%, N = 13) did not represent frequent barriers for residents.
Fifty‐five percent (N = 53) of residents often or nearly always felt confident that they provided enough information for patients to make fully informed decisions about code status, and this did not differ by PGY status (PGY1 vs PGY2/3, P = 0.80, 2 test). However, only 8% (N = 8) of residents most of the time or nearly always addressed all 5 key elements of informed consent in reporting the content of their code status discussions. When stratified by training year, PGY2/3 residents were significantly more likely than PGY1 residents to factor in a patient's comorbidities when discussing resuscitation and were also significantly more likely to relay the likelihood of hospital discharge. They were not significantly more likely to discuss other key elements of informed consent (Table 3).
| Elements of Code Status Discussion (Most of the Time or Nearly Always), n = 100 | Elements | Total, N (%) | PGY1, N (%) | PGY2/3, N (%) | P Value |
|---|---|---|---|---|---|
| |||||
| Identify the patient's HCP or surrogate | 66 (66) | N/A | N/A | N/A | |
| Describe the step‐by‐step events that occur during resuscitative measures | Details | 45 (45) | 14 (40) | 28 (33) | 0.437 |
| Describe the complications associated with resuscitative measures | Risks | 31 (31) | 8 (23) | 19 (33) | 0.308 |
| Describe the likelihood the patient will be discharged from the hospital if resuscitated | Likelihood | 17 (17) | 2 (6) | 14 (24) | 0.025 |
| Factor in the patient's comorbidities when discussing the likelihood of discharge from the hospital if resuscitated | Benefits | 43 (43) | 8 (23) | 33 (57) | 0.002 |
| Tell the patient that decisions regarding code status can be changed at any time | Alternatives | 62 (62) | 18 (51) | 38 (66) | 0.179 |
Our subanalysis showed that residents reporting all 5 key elements of informed consent were associated with higher levels of confidence that they had provided enough information to patients for them to make an informed decision (odds ratio of 1.7, 95% confidence interval 1.2‐2.3).
For the first knowledge‐based question about witnessed pulseless ventricular tachycardia, according to the 2010 registry,[12] 64% survived the event (range of responses 1%90%). Six out of 92 (7%) respondents were within 5% of the correct answer. For the second question about survival after unwitnessed pulseless electrical activity, 41.5% survived the event according to the registry (range of responses 1%50%). Three out of 92 (3%) respondents gave estimates within 5% of the correct answer. Figures 1 and 2 display the ranges of responses from residents.
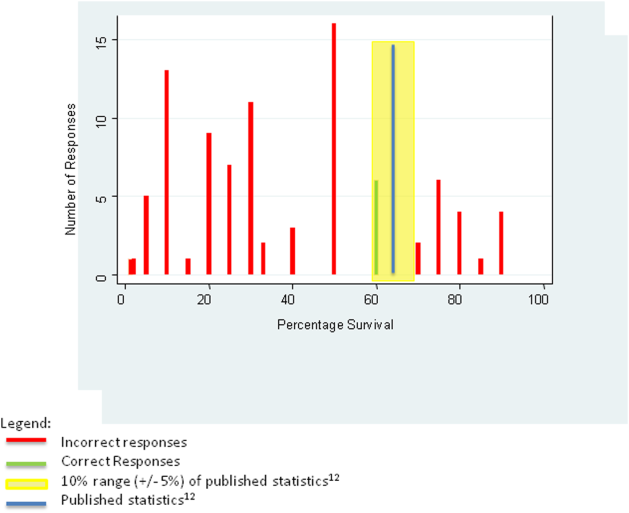
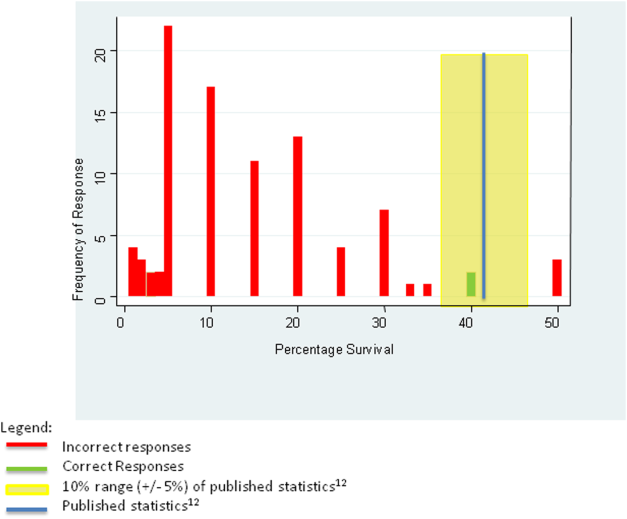
DISCUSSION
We found that although our internal medicine residents frequently have code status discussions with their patients, very few routinely report addressing all 5 key elements of informed consent. Furthermore, residents lack accurate knowledge about the outcomes of CPR, with most tending to underestimate the benefit expected of resuscitation. These deficiencies raise serious concerns about whether patients are receiving all the information essential to making fully informed decisions about their preferences for resuscitation.
The data demonstrate that the residents are routinely discussing code status and regularly discussing some aspects of the procedure itself, such as chest compressions, intubation, or defibrillation; the actual step‐by‐step events of CPR are being described less than half the time. It seems that residents mentally list the possible procedures that may occur in a code without a context for how one intervention would lead to another. Placing CPR into context is important, because studies have shown that more comprehensive discussions or the use of visual aids/videos that depict CPR in more detail improves patients' understanding of CPR and changes their decision about CPR, making them more likely to forego the procedure.[7, 8]
Residents report that they are more likely to have a code status discussion with patient's with multiple comorbidities, suggesting that they take into account information about the patient's clinical condition when deciding with which patients to address code status. They also recognize which patients are at increased risk for an in hospital cardiopulmonary arrest. Additionally, nearly half of residents factor in patient's comorbidities when discussing likelihood of discharge from the hospital, suggesting that they recognize that comorbidities can alter the outcome of CPR. Importantly, however, very few residents describe the likelihood the patient will be discharged from the hospital if resuscitated. Thus, residents in our sample have some insight into the impact of comorbidities on outcomes of CPR, but fail to provide their patients with any information about the outcome of CPR.
One reason residents may not discuss outcomes of CPR is because they do not know the data regarding outcomes. Although few residents reported that lack of knowledge of the risks and outcomes of CPR was a barrier, very few respondents answered the knowledge questions appropriately. Given how few residents gave an accurate estimate of CPR outcomes and simultaneously reported confidence in their code status discussions suggests that many residents fail to recognize their knowledge deficits. This finding corroborates other studies showing that residents don't know what they don't know[10] and may reflect their lack of education on CPR outcomes. Alternatively, some residents who underestimated the outcomes in the examples provided may have done so because, in their experience caring for patients with multiple comorbidites, the outcomes of CPR are in fact poorer than those in the cases described. Outcomes of CPR at our institution might differ from those quoted in the registry. However, given the prevalence of inaccuracy, both for under‐ and overestimation, it seems likely that a true knowledge deficit on the part of the residents still accounts for much of the error and should be a target for education. Understanding CPR outcomes is vital for informed decision making, and studies have shown that when patients have more information, it can substantially affect a patient's decision regarding resuscitation.[7, 13]
Residents are infrequently exploring key determinants that affect a patient's decision‐making process. Only one‐third of residents report discussing quality‐of‐life issues with patients during code status discussions. Understanding an individual patient's values and goals and how he or she describes a good quality of life can help guide the discussion and potential recommendations. For example, some patients may feel it is important to be alive regardless of the physical state, whereas others may feel that if there is not a chance to be independent in their activities of daily living, then they would not want to be resuscitated. By exploring patient's perceptions of what quality of life and physical states worse than death means, residents can better understand and assist in the decision‐making process of their patients.
Our data show that few residents offer a recommendation regarding code status. Thus, residents expect patients to make their own decision with the data provided. At the same time, many residents focus on the details of the procedural components of CPR with little mention of anticipated outcomes or inquiries into key determinants discussed above. Additionally, based on their response to the knowledge‐based questions, residents' estimates of survival, if offered, would be inaccurate. Thus, code status conversations by residents leave patients to make uninformed choices to consent to or refuse resuscitative measures.
When stratified by training year, PGY2/3 residents were significantly more likely than PGY1 residents to discuss likelihood of discharge from the hospital as well as factor in patients' comorbidities when discussing outcomes. Although there is a statistically significant improvement between PGY2/3 residents as compared to PGY1 residents, the numbers still show that most PGY2/3 residents and almost all PGY1 residents do not discuss the likelihood of discharge if resuscitated during code status discussions. In addition, there is no difference reported in other key areas of informed consent. Thus, though there is some improvement as housestaff advance in their training, PGY2 and PGY3 residents still do not discuss all 5 key elements of informed consent significantly more than PGY1 residents.
Our findings suggest an opportunity for additional education regarding how to address code status for internal medicine housestaff. Over half of the respondents reported small group teaching sessions, direct observation and feedback, and exposure to palliative care consultation during their clinical rotations; yet, very few of them included all the key elements of informed consent in their discussions. To address this, our institution is developing additional educational initiatives, including a faculty development program for teaching communication skills, using direct observation and feedback. The orientation didactic lecture series for housestaff now includes a lecture on CPR that highlights the data on outcomes and the importance of putting the step‐by‐step procedures of CPR into the context of potential benefits, such as survival to hospital discharge. The curriculum also includes a module on advance care planning for junior and senior residents during their ambulatory block, using simulation and feedback as part of the teaching methods.
There are limitations to this study. Studies based on surveys are subject to recall and selection bias, and we lack objective assessment of actual code status discussions. Furthermore, the nature of the study may lead to an overestimation of the quality of the code status discussions due to social acceptability bias; yet, our data clearly show that the key elements of informed consent are not included during these conversations. Another limitation is that our subjects were residents at a single institution, and our clinical practice may differ from other academic settings in the teaching environment and culture; yet, our findings mirror similar work done in other locations.[10, 14]
In conclusion, our results demonstrate that residents fail to meet standards of informed consent when discussing code status in that they do not provide sufficient information for patients to make an informed decision regarding resuscitation. Residents would benefit from education aimed at improving their knowledge of CPR outcomes as well as training on how to conduct these conversations effectively. Framing code status discussions as an example of an informed consent may help residents recognize the need for the key elements to be included in these conversations. In addition, training should focus on how to conduct these conversations in an efficient yet effective manner. This will require clear simple language, good communication skills, and training with observation and feedback by specialists trained in this field.
Disclosures
This work was presented at the Society of General Internal Medicine New England Regional Meeting, March 8, 2013, Yale Medical Center, New Haven, Connecticut. The authors report no conflicts of interest.
- , , , , Medical informed consent: general considerations for physicians. Mayo Clin Proc. 2008;83(3):313–319.
- Beth Israel Deaconess Medical Center. Policy #PR‐02 45 CFR 46.11679(4):240–243.
- , , , . Medical residents' perspectives on discussions of advanced directives: can prior experience affect how they approach patients? J Palliat Med. 2007;10(3):712–720.
- , , , , . Code status discussions between attending hospitalist physicians and medical patients at hospital admission. J Gen Intern Med. 2010;26(4):359–366.
- , , . The influence of the probability of survival on patient's preferences regarding cardiopulmonary resuscitation. N Engl J Med. 1994;330:545–549.
- , , , , . Using video images to improve the accuracy of surrogate decision‐making: a randomized controlled trial. J Am Med Dir Assoc. 2009;10(8):575–580.
- , , , et al. Use of video to facilitate end‐of‐life discussions with patients with cancer: a randomized controlled trial. J Clin Oncol. 2010;28(2):305–310.
- , , , , , . Resident Approaches to Advance Care Planning on the Day of Hospital Admission. Arch Intern Med. 2006;166:1597–1602.
- , , , . Assessing competence of residents to discuss end‐of‐life issues. J Palliat Med. 2005;8(2):363–371.
- , , , et al. Code status discussions and goals of care among hospitalised adults. J Med Ethics. 2009;35:338–342.
- , , , . Pre‐resuscitation factors associated with mortality in 49,130 cases of in‐hospital cardiac arrest: a report from the National Registry for Cardiopulmonary Resuscitation. Resuscitation. 2010;81:302–311.
- , , , . Resuscitation decision making in the elderly: the value of outcome data. J Gen Intern Med. 1993;8:295–300.
- , , . How do medical residents discuss resuscitation with patients? J Gen Intern Med. 1995;10:436–442.
Informed consent is one of the ethical, legal, and moral foundations of modern medicine.[1] Key elements of informed consent include: details of the procedure, benefits of the procedure, significant risks involved, likelihood of the outcome if predictable, and alternative therapeutic options.[2] Although rarely identified as such, conversations eliciting patient preferences about cardiopulmonary resuscitation (CPR) are among the most common examples of obtaining informed consent. Nevertheless, discussing CPR preference, often called code status discussions, differs from other examples of obtaining informed consent in 2 important ways. First, they occur well in advance of the potential need for CPR, so that the patient is well enough to participate meaningfully in the discussion. Second, because the default assumption is for patients to undergo the intervention (i.e. CPR), the focus of code status discussions is often on informed refusal, namely a decision about a do not resuscitate(DNR) order.
Since the institution of the Patient Self‐Determination Act in 1990, hospitals are obliged to educate patients about choices regarding end‐of‐life care at the time of hospital admission.[3] In many teaching hospitals, this responsibility falls to the admitting physician, often a trainee, who determines the patient's preferences regarding CPR and documents whether the patient is full code or DNR.
Prior studies have raised concerns about the quality of these conversations, highlighting their superficial nature and revealing trainee dissatisfaction with the results.[4, 5] Importantly, studies have shown that patients are capable of assimilating information about CPR when presented accurately and completely, and that such information can dramatically alter their choices.[6, 7, 8] These findings suggest that patients who are adequately educated will make more informed decisions regarding CPR, and that well‐informed choices about CPR may differ from poorly informed ones.
Although several studies have questioned the quality of code status discussions, none of these studies frames these interactions as examples of informed consent. Therefore, the purpose of the study was to examine the content of code status discussions as reported by internal medicine residents to determine whether they meet the basic tenets of informed consent, thereby facilitating informed decision making.
METHODS
In an iterative, collaborative process, authors A.F.B. and M.K.B. (an internal medicine resident at the time of the study and a board‐certified palliative care specialist/oncologist with experience in survey development, respectively) developed a survey adapted from previously published surveys.[9, 10, 11] The survey solicited respondent demographics, frequency of code status conversations, content of these discussions, and barriers to discussions. The survey instrument can be viewed in the Supporting Information, Appendix A, in the online version of this article. We used a 5‐point frequency scale (almost nevernearly always) for questions regarding: specific aspects of the informed consent related to code status discussions, resident confidence in conducting code status discussions, and barriers to code status discussions. We used a checklist for questions regarding content of code status discussions and patient characteristics influencing code status discussions. Residents provided a numeric percentage answer to 2 knowledge‐based questions of postarrest outcomes: (1) likelihood a patient would survive a witnessed pulseless ventricular tachycardia event and (2) likelihood of survival of a pulseless electrical activity event. The survey was revised by a hospitalist with experience in survey design (G.C.H.). We piloted the survey with 15 residents not part of the subject population and made revisions based on their input.
We sent a link to the online survey over secure email to all 159 internal medicine residents at our urban‐based academic medical center in January 2012. The email described the purpose of the study and stated that participation in the study (or lack thereof) was voluntary, anonymous, and would not have ramifications within the residency program. As part of the recruitment email, we explicitly included the elements of informed consent for the study participants. Not all the questions were mandatory to complete the survey. We sent a reminder e‐mail on a weekly basis for a total of 3 times and closed the survey after 1 month. Our goal was a 60% (N = 95) response rate.
We tabulated the results by question. For analytic purposes, we aligned the content questions with key elements of informed consent as follows: step‐by‐step description of the events (details), patient‐specific likelihood of discharge if resuscitated (benefits), complications of resuscitation (risks), population‐based likelihood of discharge if resuscitated (likelihood), and opportunity for changing code status (alternatives). For the knowledge‐based questions, we deemed the answer correct if it was within 10% (5%) of published statistics from the 2010 national registry of cardiopulmonary resuscitation.[12] We stratified the key elements of informed consent and level of confidence by postgraduate year (PGY), comparing PGY1 residents versus PGY2 and PGY3 residents using 2 tests (or Fisher exact test for observations 5). We performed a univariate logistic regression analysis examining the relationship between confidence and reported use of informed consent elements in code discussions. The dependent variable of confidence in sufficient information having been provided for fully informed decision making was dichotomized as most of the time or nearly always versus other responses, whereas the independent variable was dichotomized as residents who reported using all 5 informed consent elements versus those who did not. We analyzed data using Stata 12 (StataCorp, College Station, TX).
The institutional review board of the Beth Israel Deaconess reviewed the study protocol and determined that it was exempt from institutional review board review.
RESULTS
One hundred of 159 (62.3%) internal medicine residents responded to the survey. Of the respondents 93% (N = 93) completed the survey. The 7% (N = 7) who did not complete the survey omitted the knowledge‐based questions and demographics. Approximately half of participants (54%, N = 50) were male. The majority of residents (85%, N = 79) had either occasional or frequent exposure to palliative care, with 10% (N = 9) having completed a palliative care rotation (Table 1).
| Characteristic | N (%) |
|---|---|
| |
| Sex, male | 50 (54) |
| PGY level | |
| PGY1 | 35 (38) |
| PGY2 | 33 (35) |
| PGY3 | 25 (27) |
| Exposure to palliative care | |
| Very little | 5 (5) |
| Occasional | 55 (59) |
| Frequent | 24 (26) |
| Completed palliative care elective | 9 (10) |
| What type of teaching did you have with code status discussions (check all that apply)? | |
| No teaching | 6 (6) |
| Lectures | 35 (38) |
| Small group teaching sessions | 57 (61) |
| Direct observation and feedback | 50 (54) |
| Exposure to palliative care consultation while rotating on the wards | 54 (58) |
| Other | 4 (4) |
| How much has your previous teaching about resuscitative measures influenced your behavior? | |
| Not at all | 1 (1) |
| Not very much | 15 (16) |
| A little bit | 39 (42) |
| A lot | 38 (41) |
The vast majority of residents (96%, N = 95) discussed code status with more than 40% of patients they admitted to the hospital (Table 2). Two‐thirds (66%, N = 65) of all residents had the conversation with at least 4 out of 5 (81%99% and 100%) patients they admitted to the hospital. Only 1% (N = 1) of residents who responded to the survey reported conducting code status discussions with 20% or fewer of the patients they admitted to the hospital.
| N (%) | |
|---|---|
| Percentage of inpatients with which you discuss code status, n = 99 | |
| 100% | 12 (12) |
| 8199% | 53 (54) |
| 6180% | 19 (19) |
| 4160% | 11 (11) |
| 2140% | 3 (3) |
| 120% | 1 (1) |
| Aspects of resuscitative measures routinely discussed, n = 100 | |
| Intubation/ventilation | 100 (100) |
| Chest compressions | 99 (99) |
| Defibrillation | 86 (86) |
| Surrogate decision maker | 61 (61) |
| Likelihood of success | 35 (35) |
| Quality of life | 32 (32) |
| Vasopressors | 13 (13) |
| Likelihood of discharge | 10 (10) |
| Possible role of depression | 10 (10) |
| Physical states worse than death | 7 (7) |
| Religious beliefs as a factor | 6 (6) |
| Makes recommendations for code status, n = 93 | |
| Never | 19 (20) |
| Rarely | 33 (35) |
| Sometimes | 33 (35) |
| Often | 7 (8) |
| Nearly always | 1 (1) |
Most residents (66%, N = 66) identified the healthcare proxy or surrogate decision maker most of the time or nearly always. In addition, most residents (62%, N = 62) reminded patients that they could reverse their code status at any time. Almost half included a description of step‐by‐step events during resuscitation (45%, N = 45) or factored in patient's comorbidities (43%, N = 43) when discussing resuscitation at least most of the time. Few residents described complications (31%, N = 31) or outcomes (17%, N = 17) of cardiopulmonary arrests to patients most of the time or nearly always. Most residents did not explore factors such as quality of life, role of depression or physical states worse than death, factors that could potentially affect patient decision making (Table 2). Few (9%, N = 8) internal medicine residents (often or nearly always) offered their opinion regarding a patient's code status.
Many factors influenced residents' decisions to have a code status conversation. At least 85% (N = 86) of residents reported that older age, particular admitting diagnoses, and multiple comorbidities made them more likely to have a code status discussion (see Supporting Table 1 in the online version of this article). Patient race/ethnicity did not influence this decision, with only 1 respondent reporting this factor as relevant.
Residents identified lack of time (49%, N = 49 responding often or nearly always) as the most frequent barrier to having a code status discussion, followed by lack of rapport (29%, N = 29). Lack of experience (6%, N = 6), lack of information about the patient's clinical status (11%, N = 11), and lack of knowledge about outcomes (13%, N = 13) did not represent frequent barriers for residents.
Fifty‐five percent (N = 53) of residents often or nearly always felt confident that they provided enough information for patients to make fully informed decisions about code status, and this did not differ by PGY status (PGY1 vs PGY2/3, P = 0.80, 2 test). However, only 8% (N = 8) of residents most of the time or nearly always addressed all 5 key elements of informed consent in reporting the content of their code status discussions. When stratified by training year, PGY2/3 residents were significantly more likely than PGY1 residents to factor in a patient's comorbidities when discussing resuscitation and were also significantly more likely to relay the likelihood of hospital discharge. They were not significantly more likely to discuss other key elements of informed consent (Table 3).
| Elements of Code Status Discussion (Most of the Time or Nearly Always), n = 100 | Elements | Total, N (%) | PGY1, N (%) | PGY2/3, N (%) | P Value |
|---|---|---|---|---|---|
| |||||
| Identify the patient's HCP or surrogate | 66 (66) | N/A | N/A | N/A | |
| Describe the step‐by‐step events that occur during resuscitative measures | Details | 45 (45) | 14 (40) | 28 (33) | 0.437 |
| Describe the complications associated with resuscitative measures | Risks | 31 (31) | 8 (23) | 19 (33) | 0.308 |
| Describe the likelihood the patient will be discharged from the hospital if resuscitated | Likelihood | 17 (17) | 2 (6) | 14 (24) | 0.025 |
| Factor in the patient's comorbidities when discussing the likelihood of discharge from the hospital if resuscitated | Benefits | 43 (43) | 8 (23) | 33 (57) | 0.002 |
| Tell the patient that decisions regarding code status can be changed at any time | Alternatives | 62 (62) | 18 (51) | 38 (66) | 0.179 |
Our subanalysis showed that residents reporting all 5 key elements of informed consent were associated with higher levels of confidence that they had provided enough information to patients for them to make an informed decision (odds ratio of 1.7, 95% confidence interval 1.2‐2.3).
For the first knowledge‐based question about witnessed pulseless ventricular tachycardia, according to the 2010 registry,[12] 64% survived the event (range of responses 1%90%). Six out of 92 (7%) respondents were within 5% of the correct answer. For the second question about survival after unwitnessed pulseless electrical activity, 41.5% survived the event according to the registry (range of responses 1%50%). Three out of 92 (3%) respondents gave estimates within 5% of the correct answer. Figures 1 and 2 display the ranges of responses from residents.
DISCUSSION
We found that although our internal medicine residents frequently have code status discussions with their patients, very few routinely report addressing all 5 key elements of informed consent. Furthermore, residents lack accurate knowledge about the outcomes of CPR, with most tending to underestimate the benefit expected of resuscitation. These deficiencies raise serious concerns about whether patients are receiving all the information essential to making fully informed decisions about their preferences for resuscitation.
The data demonstrate that the residents are routinely discussing code status and regularly discussing some aspects of the procedure itself, such as chest compressions, intubation, or defibrillation; the actual step‐by‐step events of CPR are being described less than half the time. It seems that residents mentally list the possible procedures that may occur in a code without a context for how one intervention would lead to another. Placing CPR into context is important, because studies have shown that more comprehensive discussions or the use of visual aids/videos that depict CPR in more detail improves patients' understanding of CPR and changes their decision about CPR, making them more likely to forego the procedure.[7, 8]
Residents report that they are more likely to have a code status discussion with patient's with multiple comorbidities, suggesting that they take into account information about the patient's clinical condition when deciding with which patients to address code status. They also recognize which patients are at increased risk for an in hospital cardiopulmonary arrest. Additionally, nearly half of residents factor in patient's comorbidities when discussing likelihood of discharge from the hospital, suggesting that they recognize that comorbidities can alter the outcome of CPR. Importantly, however, very few residents describe the likelihood the patient will be discharged from the hospital if resuscitated. Thus, residents in our sample have some insight into the impact of comorbidities on outcomes of CPR, but fail to provide their patients with any information about the outcome of CPR.
One reason residents may not discuss outcomes of CPR is because they do not know the data regarding outcomes. Although few residents reported that lack of knowledge of the risks and outcomes of CPR was a barrier, very few respondents answered the knowledge questions appropriately. Given how few residents gave an accurate estimate of CPR outcomes and simultaneously reported confidence in their code status discussions suggests that many residents fail to recognize their knowledge deficits. This finding corroborates other studies showing that residents don't know what they don't know[10] and may reflect their lack of education on CPR outcomes. Alternatively, some residents who underestimated the outcomes in the examples provided may have done so because, in their experience caring for patients with multiple comorbidites, the outcomes of CPR are in fact poorer than those in the cases described. Outcomes of CPR at our institution might differ from those quoted in the registry. However, given the prevalence of inaccuracy, both for under‐ and overestimation, it seems likely that a true knowledge deficit on the part of the residents still accounts for much of the error and should be a target for education. Understanding CPR outcomes is vital for informed decision making, and studies have shown that when patients have more information, it can substantially affect a patient's decision regarding resuscitation.[7, 13]
Residents are infrequently exploring key determinants that affect a patient's decision‐making process. Only one‐third of residents report discussing quality‐of‐life issues with patients during code status discussions. Understanding an individual patient's values and goals and how he or she describes a good quality of life can help guide the discussion and potential recommendations. For example, some patients may feel it is important to be alive regardless of the physical state, whereas others may feel that if there is not a chance to be independent in their activities of daily living, then they would not want to be resuscitated. By exploring patient's perceptions of what quality of life and physical states worse than death means, residents can better understand and assist in the decision‐making process of their patients.
Our data show that few residents offer a recommendation regarding code status. Thus, residents expect patients to make their own decision with the data provided. At the same time, many residents focus on the details of the procedural components of CPR with little mention of anticipated outcomes or inquiries into key determinants discussed above. Additionally, based on their response to the knowledge‐based questions, residents' estimates of survival, if offered, would be inaccurate. Thus, code status conversations by residents leave patients to make uninformed choices to consent to or refuse resuscitative measures.
When stratified by training year, PGY2/3 residents were significantly more likely than PGY1 residents to discuss likelihood of discharge from the hospital as well as factor in patients' comorbidities when discussing outcomes. Although there is a statistically significant improvement between PGY2/3 residents as compared to PGY1 residents, the numbers still show that most PGY2/3 residents and almost all PGY1 residents do not discuss the likelihood of discharge if resuscitated during code status discussions. In addition, there is no difference reported in other key areas of informed consent. Thus, though there is some improvement as housestaff advance in their training, PGY2 and PGY3 residents still do not discuss all 5 key elements of informed consent significantly more than PGY1 residents.
Our findings suggest an opportunity for additional education regarding how to address code status for internal medicine housestaff. Over half of the respondents reported small group teaching sessions, direct observation and feedback, and exposure to palliative care consultation during their clinical rotations; yet, very few of them included all the key elements of informed consent in their discussions. To address this, our institution is developing additional educational initiatives, including a faculty development program for teaching communication skills, using direct observation and feedback. The orientation didactic lecture series for housestaff now includes a lecture on CPR that highlights the data on outcomes and the importance of putting the step‐by‐step procedures of CPR into the context of potential benefits, such as survival to hospital discharge. The curriculum also includes a module on advance care planning for junior and senior residents during their ambulatory block, using simulation and feedback as part of the teaching methods.
There are limitations to this study. Studies based on surveys are subject to recall and selection bias, and we lack objective assessment of actual code status discussions. Furthermore, the nature of the study may lead to an overestimation of the quality of the code status discussions due to social acceptability bias; yet, our data clearly show that the key elements of informed consent are not included during these conversations. Another limitation is that our subjects were residents at a single institution, and our clinical practice may differ from other academic settings in the teaching environment and culture; yet, our findings mirror similar work done in other locations.[10, 14]
In conclusion, our results demonstrate that residents fail to meet standards of informed consent when discussing code status in that they do not provide sufficient information for patients to make an informed decision regarding resuscitation. Residents would benefit from education aimed at improving their knowledge of CPR outcomes as well as training on how to conduct these conversations effectively. Framing code status discussions as an example of an informed consent may help residents recognize the need for the key elements to be included in these conversations. In addition, training should focus on how to conduct these conversations in an efficient yet effective manner. This will require clear simple language, good communication skills, and training with observation and feedback by specialists trained in this field.
Disclosures
This work was presented at the Society of General Internal Medicine New England Regional Meeting, March 8, 2013, Yale Medical Center, New Haven, Connecticut. The authors report no conflicts of interest.
- , , , , Medical informed consent: general considerations for physicians. Mayo Clin Proc. 2008;83(3):313–319.
- Beth Israel Deaconess Medical Center. Policy #PR‐02 45 CFR 46.11679(4):240–243.
- , , , . Medical residents' perspectives on discussions of advanced directives: can prior experience affect how they approach patients? J Palliat Med. 2007;10(3):712–720.
- , , , , . Code status discussions between attending hospitalist physicians and medical patients at hospital admission. J Gen Intern Med. 2010;26(4):359–366.
- , , . The influence of the probability of survival on patient's preferences regarding cardiopulmonary resuscitation. N Engl J Med. 1994;330:545–549.
- , , , , . Using video images to improve the accuracy of surrogate decision‐making: a randomized controlled trial. J Am Med Dir Assoc. 2009;10(8):575–580.
- , , , et al. Use of video to facilitate end‐of‐life discussions with patients with cancer: a randomized controlled trial. J Clin Oncol. 2010;28(2):305–310.
- , , , , , . Resident Approaches to Advance Care Planning on the Day of Hospital Admission. Arch Intern Med. 2006;166:1597–1602.
- , , , . Assessing competence of residents to discuss end‐of‐life issues. J Palliat Med. 2005;8(2):363–371.
- , , , et al. Code status discussions and goals of care among hospitalised adults. J Med Ethics. 2009;35:338–342.
- , , , . Pre‐resuscitation factors associated with mortality in 49,130 cases of in‐hospital cardiac arrest: a report from the National Registry for Cardiopulmonary Resuscitation. Resuscitation. 2010;81:302–311.
- , , , . Resuscitation decision making in the elderly: the value of outcome data. J Gen Intern Med. 1993;8:295–300.
- , , . How do medical residents discuss resuscitation with patients? J Gen Intern Med. 1995;10:436–442.
© 2015 Society of Hospital Medicine

Imiquimod Cream 2.5% and 3.75% Applied Once Daily to Treat External Genital Warts in Men
External genital warts (EGWs), which are caused by infection with select types of human papillomavirus (HPV), are one of the most prevalent and fastest growing sexually transmitted infections.1 External genital warts affect approximately 1% of sexually active adults in the United States and Europe, with another 15% having subclinical infections; more than 1 million new cases of EGWs are diagnosed annually.2-4 Although the condition is not life threatening, lesions can cause symptoms, such as burning, itching, bleeding, pain and dyspareunia, and potential urethral or rectal obstruction. External genital warts also have been associated with adverse psychological effects.5-8
The time between exposure to HPV and development of EGWs can vary from a few weeks to several months or years (median, 2.9 months).9 Many HPV infections are mild and transient, resolving spontaneously.10 As many as 30% of EGWs will regress over 4 months and approximately 90% clear within 2 years.11,12 However, even with treatment, the median time to resolution is 5.9 months.9
Imiquimod cream 5%, which has been successfully used to treat EGWs since it was approved by the US Food and Drug Administration in 1997, is applied to lesions 3 times weekly at bedtime until clearance is achieved or for a maximum of 16 weeks.13 In clinical studies, complete clearance has been reported in 35% to 75% of participants.14-21 However, it is important to note that not all anogenital regions with warts were required to be treated in these studies,14-21 and newly arising warts were not included in the analysis.17 Reported clearance rates were higher and median clearance time was shorter in women.17 Relatively low recurrence rates (6%–26%) have been reported after successful clearance of EGWs.16,17,20,21
Long treatment durations are always a concern for patient adherence. Although increasing the dosing frequency with imiquimod cream 5% might be considered an attractive option to reduce the length of the treatment course, it has resulted in greater incidence and severity of local adverse events (AEs) in some studies without improved efficacy.18,22,23 Thus lower concentrations of imiquimod (ie, 2.5% and 3.75% formulations) were developed to potentially decrease treatment duration and provide a daily dosing regimen.
We report the results of 2 identical, placebo-controlled, phase 3 studies evaluating the safety and efficacy of imiquimod cream 2.5% and 3.75% in treating EGWs in men. Pooled results from a female subgroup previously have been reported.24 Although the percentage of women who reported ever being diagnosed with EGWs was higher than in men (7.2% vs 4%) in one survey,25 other assessments have found a similar prevalence of EGWs among both genders.26-28 We provide important insights herein by reporting efficacy and tolerability data for imiquimod cream 2.5% and 3.75% in the treatment of EGWs in males.
Methods
Study Design
Male patients aged 12 years and older with 2 to 30 EGWs in the inguinal, perineal, and/or perianal areas as well as on the glans penis, penile shaft, scrotum, and/or foreskin were enrolled in 2 identical, multicenter, randomized, parallel-group, double-blind, placebo-controlled studies. Participants were randomized (2:2:1) to self-treatment with imiquimod cream 3.75% or 2.5% or placebo once daily until complete clearance was achieved or for a maximum of 8 weeks (end of treatment [EOT]). There was a follow-up period of up to 8 weeks (end of study [EOS]) in participants who did not achieve complete clearance by EOT. All participants who achieved complete clearance by EOS entered a 12-week observational follow-up period to assess recurrence.
Primary and Secondary Efficacy Criteria
The primary efficacy end point was complete clearance rate, which was defined as the proportion of participants by the EOS visit with zero EGWs (that either existed at baseline and any warts developing during the study) in all anogenital anatomic areas. It is important to note that this primary efficacy end point was very conservative in that it included any new warts occurring during the study that may not have received a full treatment course. Lesions were counted in all assessed anatomic areas without distinction between those that were identified at baseline or those that were newly identified during the study period. If new EGWs appeared during the study in new anatomic areas, such lesions were treated with the study medication as they appeared. Therefore, any newly arising EGWs received less than the full course of treatment, as therapy was not extended beyond the 8-week study period. Participants were evaluated for the presence of any EGWs in all anatomic areas without distinction between lesions that were present at baseline and newly arising EGWs. Therefore, development of new EGWs during the study period could potentially lower clearance rates.
Secondary end points were 75% or more and 50% or more reduction in EGW count, change in EGW count from baseline, and 12-week sustained clearance rate.
Safety
Safety assessments of AEs, both volunteered and elicited, were made throughout the study.
Study Oversight
The study was conducted in accordance with the ethical principles specified in the Declaration of Helsinki and in compliance with the requirements of local regulatory committees. All participants provided written informed consent.
Statistical Analysis
Statistical analysis for intention-to-treat (ITT) imputations was made for missing data points using last observation carried forward (LOCF). Complete clearance rates and partial clearance rates were analyzed using Cochran-Mantel-Haenszel statistics stratified by center and by gender for the overall population analyses. The percentage change in EGW count was analyzed using analysis of covariance. All statistical analyses were performed using SAS software (version 9.1.3).
Results
Study Population
Study characteristics by treatment group are summarized in the Table. Overall, 447 male participants (225 from study 1 and 222 from study 2) were included in the study. The majority of participants (84.1%) had EGWs on the penile shaft with only 1 affected region in just over half of participants (51.9%). Most participants (70.2%) were 35 years or younger, and approximately half had a baseline EGW count of 7 or less (50.6%). More than 20% of participants had an affected wart surface area greater than 150 mm2 at baseline, and in more than 60% of participants, the duration from first diagnosis of EGWs to enrollment in the study was more than 1 year.
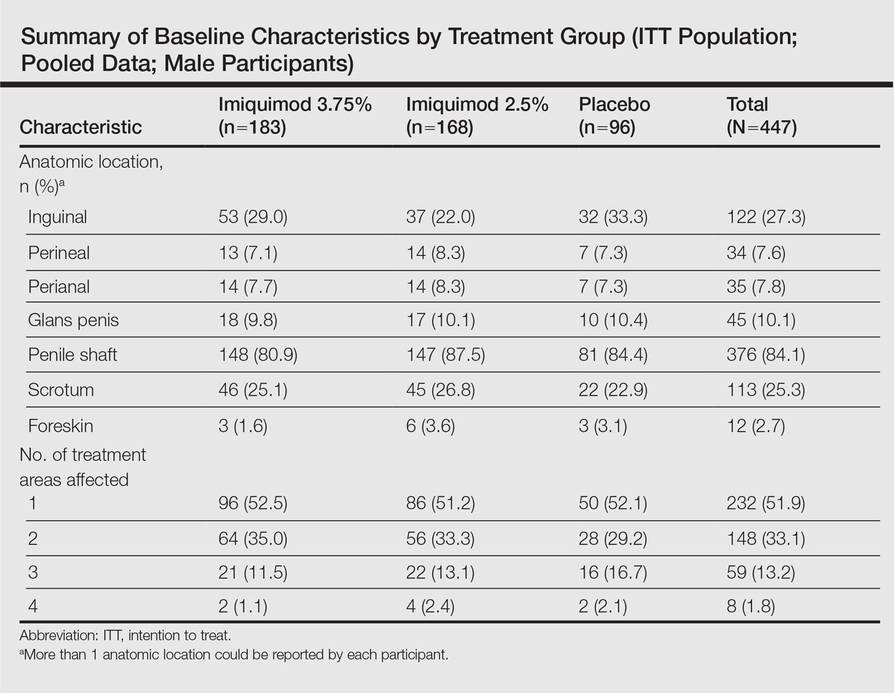
Primary Efficacy End Point
Imiquimod cream 3.75% was statistically superior to placebo in study 1 and study 2 (P=.015 and P=.019, respectively)(Figure) in providing complete clearance of all EGWs (baseline or new) at EOS. Imiquimod cream 2.5% was only statistically superior to placebo in study 2 (P=.034). Importantly, there were a number of participants who did not achieve complete clearance at EOT who continued to improve posttreatment. The percentage of participants treated with imiquimod cream 3.75% and 2.5% who were completely cleared at EOT was 12.0% (14.7% study 1 and 9.1% study 2) and 7.1% (7.2% study 1 and 7.1% study 2), respectively, compared to complete clearance rates of 18.6% (20.0% study 1 and 17.0% study 2) and 14.3% (13.3% study 1 and 15.3% study 2), respectively, at EOS (ITT population).
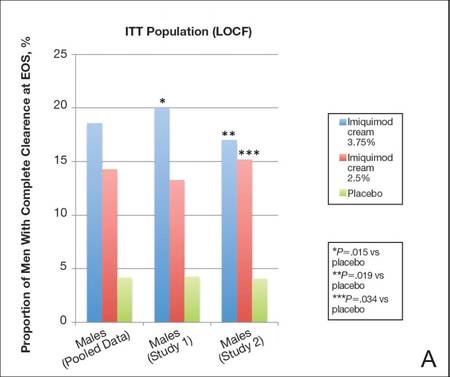 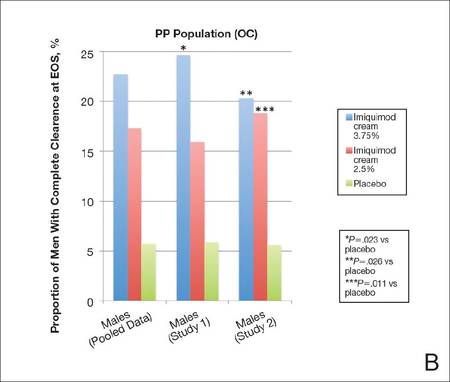 |
Complete clearance rates (defined as the proportion of participants by the end-of-study [EOS] visit with zero external genital warts in all anogenital anatomic areas) in the intention-to-treat (ITT) population (last observation carried forward [LOCF])(A) and per-protocol (PP) population (OC [observed case])(B), including both individual and pooled study data. |
In both studies complete clearance rates were significantly higher (P<.019 both studies) with imiquimod cream 3.75% compared with placebo at weeks 10 through 16 (EOS). In study 2, complete clearance rates were significantly higher (P<.049) with imiquimod cream 2.5% compared to placebo from week 14 to week 16 (EOS). Complete clearance rates were highest in participants treated with imiquimod cream 3.75% who had EGWs in the perianal region or on the glans penis (28.6% and 33.3%, respectively); however, the number of participants in both groups was relatively small.
Overall, 18.8% of participants took rest periods. Complete clearance rates were higher in men who took a rest period (26.5% and 27.3% for imiquimod cream 3.75% and 2.5%, respectively), perhaps reflecting a more brisk immunological response. The frequency, duration, and number of dosing days prior to the rest period were similar in the active treatment groups and lower in the placebo group.
There was a tendency for older participants (ie, >35 years) and those with lower baseline EGW counts (ie, ≤7) to respond better. Participants treated with imiquimod cream 3.75% also tended to respond best to treatment when only 1 anatomic area was affected.
Secondary Efficacy End Points
The proportion of male participants with at least a 75% reduction in EGW count from baseline at EOS was statistically superior with imiquimod 3.75% compared to placebo in study 1 and study 2 (P=.001 and P=.008, respectively). Statistical superiority also was apparent with imiquimod cream 2.5% versus placebo in study 2 (P=.013). Overall, 20.2% (18.1% study 1 and 22.4% study 2) and 27.3% (30.5% study 1 and 23.9% study 2) of participants achieved at least a 75% reduction in wart count at EOS with imiquimod cream 2.5% and 3.75%, respectively (pooled data).
Percentage change in EGW count from baseline at EOS was 35.8% and 24.1% with imiquimod cream 3.75% in study 1 and study 2, respectively, both significantly better than placebo (P=.002 and P=.011, respectively). Change in EGW count following treatment with imiquimod cream 2.5% was only significant in study 2 (P=.001).
The median time to complete clearance was shorter in the 2 active treatment groups compared with placebo. For those participants who attained complete clearance, the median time to complete clearance ranged from 57 to 59 days in the imiquimod cream 3.75% groups (studies 1 and 2, respectively), 60 to 74 days in the imiquimod 2.5% cream groups (studies 1 and 2, respectively), and 76 to 81 days with placebo (studies 2 and 1, respectively).
Safety
Less than one-third of male participants in each treatment group experienced AEs during the studies. The incidence of serious adverse events (SAEs) and AEs leading to study discontinuation was low. In total, 4 participants (0.9% [3 in the imiquimod cream 2.5% group and 1 in the imiquimod cream 3.75% group]) had AEs that led to study discontinuation. Application-site reactions were reported in a total of 46 participants (10.3%). The incidence and severity of local skin reactions was mostly mild or moderate, similar in both active treatment groups, and higher than in the placebo group. Local skin reactions were coincident with the treatment period and rapidly decreased when treatment was concluded. There were no clinically meaningful trends in vital sign measurements or laboratory measurements.
Comment
Imiquimod cream 5% has been shown to be a safe and effective treatment of EGWs. Our study was designed to evaluate lower concentrations of imiquimod cream (2.5% and 3.75%), which may permit daily dosing and a shortened treatment course in men with EGWs.
Efficacy of imiquimod cream 2.5% and 3.75% was established through both primary and secondary end points, though only the higher concentration was significantly more effective than placebo in both studies. In addition, a number of participants who were not completely cleared following 8 weeks of treatment went on to be completely cleared at EOS, demonstrating continued activity of imiquimod despite cessation of active treatment.
Imiquimod cream 3.75% was particularly effective when compared to placebo, with 18.6% of participants completely cleared at EOS, though the PP (observed case) results (22.7%) may be more encouraging and can be used to motivate patients.
Although there are limitations in making direct comparisons between studies, complete clearance rates in our studies were lower than those reported previously with imiquimod cream 5%.17 Lower efficacy rates might be expected given the differences in methodology. In the 2 studies reported here, participants had to have no EGWs (baseline or new, treated or untreated) in any of the anogenital areas specified to be reported as having achieved complete clearance. In earlier studies with imiquimod cream 5%, not all anogenital regions were required to be treated, and any new EGWs arising during treatment were not included in the analysis.17 Also, our analysis focused purely on a male patient population in which efficacy results tend to be lower regardless of treatment modality employed.
Recurrence is another important issue in the treatment of EGWs. Although not studied specifically in a male population, recurrence rates of 16.7% to 17.7% were seen in the 3 months following successful treatment with imiquimod cream 2.5% and 3.75% in the 2 pivotal studies. These results were consistent with the recurrence rates reported following successful treatment with imiquimod cream 5%.17
In general, complete clearance rates increased in a dose-dependent manner. Complete clearance rates were lower in the male subpopulation across all treatment groups compared to those previously reported in females,24 which was consistent with prior results reported for imiquimod cream 5% as well as other topical treatments.17 It has been suggested that this difference may be due in part to the distribution of female EGWs in areas of less keratinization. Complete clearance rates in the current analysis tended to be higher in male participants with baseline EGWs in anatomic sites with less keratinized skin such as the perianal, perineal, or glans penis areas.
Daily application of imiquimod cream 2.5% and 3.75% generally was well tolerated. Most reported AEs were mild or moderate, and few participants discontinued because of AEs. Few SAEs were reported and none were considered to be treatment related. There was no difference in the incidence rates of AEs between the 2 active treatments. The incidence of SAEs and study discontinuations was much lower than previously reported in the female cohort of these 2 studies.24
Conclusion
In conclusion, 2 well-controlled studies of males with EGWs who were treated for up to 8 weeks with imiquimod cream 2.5% and 3.75% applied daily demonstrated good tolerability and superior efficacy to placebo in complete clearance of all baseline and newly arising warts in addition to reducing EGW counts.
Acknowledgments—The authors thank Christina Cognata Smith, PharmD, and Mandeep Kaur, MD (both previously of Valeant Pharmaceuticals North America, LLC, Bridgewater, New Jersey), as well as Brian Bulley, MSc (Inergy Limited, Lindfield, West Sussex, United Kingdom), for assistance with the preparation of the manuscript. Valeant Pharmaceuticals North America, LLC, funded Inergy’s activities pertaining to this analysis.
1. Weinstock H, Berman S, Cates W. Sexually transmitted infections in American youth: incidence and prevalence estimates, 2000. Perspect Sex Reprod Health. 2004;36:6-10.
2. Dunne EF, Unger ER, Sternberg M, et al. Prevalence of HPV infection among females in the United States. JAMA. 2007;297:813-819.
3. Koutsky L. Epidemiology of genital human papillomavirus infection. Am J Med. 1997;102:3-8.
4. Kjaer SK, Tran TN, Sparen P, et al. The burden of genital warts: a study of nearly 70,000 women from the general female population in the 4 Nordic countries. J Infect Dis. 2007;196:1447-1454.
5. Woodhall S, Ramsey T, Cai C, et al. Estimation of the impact of genital warts on health-related quality of life. Sex Transm Infect. 2008;84:161-166.
6. Mortensen GL, Larsen HK. The quality of life of patients with genital warts: a qualitative study. BMC Public Health. 2010;10:113.
7. Wang KL, Jeng CJ, Yang YC, et al. The psychological impact of illness among women experiencing human papillomavirus-related illness or screening interventions. J Psychsom Obstet Gynaecol. 2010;31:16-23.
8. Lawrence S, Walzman M, Sheppard S, et al. The psychological impact caused by genital warts: has the Department of Health’s choice of vaccination missed the opportunity to prevent such morbidity? Int J STD AIDS. 2009;20:696-700.
9. Winer RL, Kiviat NB, Hughes JP, et al. Development and duration of human papillomavirus lesions, after initial infection. J Infect Dis. 2005;191:731-738.
10. Centers for Disease Control and Prevention. Human papillomavirus: HPV information for clinicians. Atlanta, GA: Centers for Disease Control and Prevention, US Department of Health and Human Services; April 2007.
11. Forcier M, Musacchio N. An overview of human papillomavirus infection for the dermatologist: disease, diagnosis, management, and prevention. Dermatol Ther. 2010;23:458-476.
12. Scheinfeld N, Lehman DS. An evidence-based review of medical and surgical treatments of genital warts. Dermatol Online J. 2006;12:5.
13. Aldara [package insert]. Bristol, TN: Graceway Pharmaceuticals, LLC; 2010.
14. Komericki P, Akkilic-Materna M, Strimitzer T, et al. Efficacy and safety of imiquimod versus podophyllotoxin in the treatment of genital warts. Sex Transm Dis. 2011;38:216-218.
15. Beutner KR, Tyring SK, Trofatter KF Jr, et al. Imiquimod, a patient-applied immune-response modifier for treatment of external genital warts. Antimicrob Agents Chemother. 1998;42:789-794.
16. Beutner KR, Spruance SL, Hougham AJ, et al. Treatment of genital warts with an immune-response modifier (imiquimod). J Am Acad Dermatol. 1998;38:230-239.
17. Edwards L, Ferenczy A, Eron L, et al. Self-administered topical 5% imiquimod cream for external anogenital warts. Arch Dermatol. 1998;134:25-30.
18. Fife KH, Ferenczy A, Douglas JM, et al. Treatment of external genital warts in men using 5% imiquimod cream applied three times a week, once daily, twice daily, or three times a day. Sex Transm Dis. 2001;28:226-231.
19. Garland SM, Waddell R, Mindel A, et al. An open-label phase II pilot study investigating the optimal duration of imiquimod 5% cream for the treatment of external genital warts in women. Int J STD AIDS. 2006;17:448-452.
20. Schofer H, Van Ophoven A, Henke U, et al. Randomized, comparative trial on the sustained efficacy of topical imiquimod 5% cream versus conventional ablative methods in external anogenital warts. Eur J Dermatol. 2006;16:642-648.
21. Arican O, Guneri F, Bilgic K, et al. Topical imiquimod 5% cream in external anogenital warts: a randomized, double-blind, placebo-controlled study. J Dermatol. 2004;31:627-631.
22. Gollnick H, Barasso R, Jappe U, et al. Safety and efficacy of imiquimod 5% cream in the treatment of penile genital warts in uncircumcised men when applied three times weekly or once per day. Int J STD AIDS. 2001;12:22-28.
23. Trofatter KF Jr, Ferenczy A, Fife KH. Increased frequency of dosing of imiquimod 5% cream in the treatment of external genital warts in women. Int J Gynecol Obstet. 2002;76:191-193.
24. Baker DA, Ferris DG, Martens MG, et al. Imiquimod 3.75% cream applied daily to treat anogenital warts: combined results from women in two randomized, placebo-controlled studies [published online ahead of print August 24, 2011]. Infect Dis Obstet Gynecol. 2011;2011:806105.
25. Dinh TH, Sternberg M, Dunne EF, et al. Genital warts among 18- to 59-year-olds in the US, National Health and Nutrition Examination Survey, 1999-2004. Sex Transm Dis. 2008;35:357-360.
26. Insinga RP, Dasbach EJ, Elbasha EH. Assessing the annual economic burden of preventing and treating anogenital human papillomavirus-related disease in the US: analytic framework and review of the literature. Pharmacoeconomics. 2005;23:1107-1122.
27. Koshiol JE, Laurent SA, Pimenta JM. Rate and predictors of new genital warts claims and genital warts-related healthcare utilization among privately insured patients in the United States. Sex Transm Dis. 2004;31:748-752.
28. Insinga RP, Glass AG, Rush BB. The health care costs of cervical human papillomavirus-related disease. Am J Obstet Gynecol. 2004;191:114-120.
External genital warts (EGWs), which are caused by infection with select types of human papillomavirus (HPV), are one of the most prevalent and fastest growing sexually transmitted infections.1 External genital warts affect approximately 1% of sexually active adults in the United States and Europe, with another 15% having subclinical infections; more than 1 million new cases of EGWs are diagnosed annually.2-4 Although the condition is not life threatening, lesions can cause symptoms, such as burning, itching, bleeding, pain and dyspareunia, and potential urethral or rectal obstruction. External genital warts also have been associated with adverse psychological effects.5-8
The time between exposure to HPV and development of EGWs can vary from a few weeks to several months or years (median, 2.9 months).9 Many HPV infections are mild and transient, resolving spontaneously.10 As many as 30% of EGWs will regress over 4 months and approximately 90% clear within 2 years.11,12 However, even with treatment, the median time to resolution is 5.9 months.9
Imiquimod cream 5%, which has been successfully used to treat EGWs since it was approved by the US Food and Drug Administration in 1997, is applied to lesions 3 times weekly at bedtime until clearance is achieved or for a maximum of 16 weeks.13 In clinical studies, complete clearance has been reported in 35% to 75% of participants.14-21 However, it is important to note that not all anogenital regions with warts were required to be treated in these studies,14-21 and newly arising warts were not included in the analysis.17 Reported clearance rates were higher and median clearance time was shorter in women.17 Relatively low recurrence rates (6%–26%) have been reported after successful clearance of EGWs.16,17,20,21
Long treatment durations are always a concern for patient adherence. Although increasing the dosing frequency with imiquimod cream 5% might be considered an attractive option to reduce the length of the treatment course, it has resulted in greater incidence and severity of local adverse events (AEs) in some studies without improved efficacy.18,22,23 Thus lower concentrations of imiquimod (ie, 2.5% and 3.75% formulations) were developed to potentially decrease treatment duration and provide a daily dosing regimen.
We report the results of 2 identical, placebo-controlled, phase 3 studies evaluating the safety and efficacy of imiquimod cream 2.5% and 3.75% in treating EGWs in men. Pooled results from a female subgroup previously have been reported.24 Although the percentage of women who reported ever being diagnosed with EGWs was higher than in men (7.2% vs 4%) in one survey,25 other assessments have found a similar prevalence of EGWs among both genders.26-28 We provide important insights herein by reporting efficacy and tolerability data for imiquimod cream 2.5% and 3.75% in the treatment of EGWs in males.
Methods
Study Design
Male patients aged 12 years and older with 2 to 30 EGWs in the inguinal, perineal, and/or perianal areas as well as on the glans penis, penile shaft, scrotum, and/or foreskin were enrolled in 2 identical, multicenter, randomized, parallel-group, double-blind, placebo-controlled studies. Participants were randomized (2:2:1) to self-treatment with imiquimod cream 3.75% or 2.5% or placebo once daily until complete clearance was achieved or for a maximum of 8 weeks (end of treatment [EOT]). There was a follow-up period of up to 8 weeks (end of study [EOS]) in participants who did not achieve complete clearance by EOT. All participants who achieved complete clearance by EOS entered a 12-week observational follow-up period to assess recurrence.
Primary and Secondary Efficacy Criteria
The primary efficacy end point was complete clearance rate, which was defined as the proportion of participants by the EOS visit with zero EGWs (that either existed at baseline and any warts developing during the study) in all anogenital anatomic areas. It is important to note that this primary efficacy end point was very conservative in that it included any new warts occurring during the study that may not have received a full treatment course. Lesions were counted in all assessed anatomic areas without distinction between those that were identified at baseline or those that were newly identified during the study period. If new EGWs appeared during the study in new anatomic areas, such lesions were treated with the study medication as they appeared. Therefore, any newly arising EGWs received less than the full course of treatment, as therapy was not extended beyond the 8-week study period. Participants were evaluated for the presence of any EGWs in all anatomic areas without distinction between lesions that were present at baseline and newly arising EGWs. Therefore, development of new EGWs during the study period could potentially lower clearance rates.
Secondary end points were 75% or more and 50% or more reduction in EGW count, change in EGW count from baseline, and 12-week sustained clearance rate.
Safety
Safety assessments of AEs, both volunteered and elicited, were made throughout the study.
Study Oversight
The study was conducted in accordance with the ethical principles specified in the Declaration of Helsinki and in compliance with the requirements of local regulatory committees. All participants provided written informed consent.
Statistical Analysis
Statistical analysis for intention-to-treat (ITT) imputations was made for missing data points using last observation carried forward (LOCF). Complete clearance rates and partial clearance rates were analyzed using Cochran-Mantel-Haenszel statistics stratified by center and by gender for the overall population analyses. The percentage change in EGW count was analyzed using analysis of covariance. All statistical analyses were performed using SAS software (version 9.1.3).
Results
Study Population
Study characteristics by treatment group are summarized in the Table. Overall, 447 male participants (225 from study 1 and 222 from study 2) were included in the study. The majority of participants (84.1%) had EGWs on the penile shaft with only 1 affected region in just over half of participants (51.9%). Most participants (70.2%) were 35 years or younger, and approximately half had a baseline EGW count of 7 or less (50.6%). More than 20% of participants had an affected wart surface area greater than 150 mm2 at baseline, and in more than 60% of participants, the duration from first diagnosis of EGWs to enrollment in the study was more than 1 year.
Primary Efficacy End Point
Imiquimod cream 3.75% was statistically superior to placebo in study 1 and study 2 (P=.015 and P=.019, respectively)(Figure) in providing complete clearance of all EGWs (baseline or new) at EOS. Imiquimod cream 2.5% was only statistically superior to placebo in study 2 (P=.034). Importantly, there were a number of participants who did not achieve complete clearance at EOT who continued to improve posttreatment. The percentage of participants treated with imiquimod cream 3.75% and 2.5% who were completely cleared at EOT was 12.0% (14.7% study 1 and 9.1% study 2) and 7.1% (7.2% study 1 and 7.1% study 2), respectively, compared to complete clearance rates of 18.6% (20.0% study 1 and 17.0% study 2) and 14.3% (13.3% study 1 and 15.3% study 2), respectively, at EOS (ITT population).
|
Complete clearance rates (defined as the proportion of participants by the end-of-study [EOS] visit with zero external genital warts in all anogenital anatomic areas) in the intention-to-treat (ITT) population (last observation carried forward [LOCF])(A) and per-protocol (PP) population (OC [observed case])(B), including both individual and pooled study data. |
In both studies complete clearance rates were significantly higher (P<.019 both studies) with imiquimod cream 3.75% compared with placebo at weeks 10 through 16 (EOS). In study 2, complete clearance rates were significantly higher (P<.049) with imiquimod cream 2.5% compared to placebo from week 14 to week 16 (EOS). Complete clearance rates were highest in participants treated with imiquimod cream 3.75% who had EGWs in the perianal region or on the glans penis (28.6% and 33.3%, respectively); however, the number of participants in both groups was relatively small.
Overall, 18.8% of participants took rest periods. Complete clearance rates were higher in men who took a rest period (26.5% and 27.3% for imiquimod cream 3.75% and 2.5%, respectively), perhaps reflecting a more brisk immunological response. The frequency, duration, and number of dosing days prior to the rest period were similar in the active treatment groups and lower in the placebo group.
There was a tendency for older participants (ie, >35 years) and those with lower baseline EGW counts (ie, ≤7) to respond better. Participants treated with imiquimod cream 3.75% also tended to respond best to treatment when only 1 anatomic area was affected.
Secondary Efficacy End Points
The proportion of male participants with at least a 75% reduction in EGW count from baseline at EOS was statistically superior with imiquimod 3.75% compared to placebo in study 1 and study 2 (P=.001 and P=.008, respectively). Statistical superiority also was apparent with imiquimod cream 2.5% versus placebo in study 2 (P=.013). Overall, 20.2% (18.1% study 1 and 22.4% study 2) and 27.3% (30.5% study 1 and 23.9% study 2) of participants achieved at least a 75% reduction in wart count at EOS with imiquimod cream 2.5% and 3.75%, respectively (pooled data).
Percentage change in EGW count from baseline at EOS was 35.8% and 24.1% with imiquimod cream 3.75% in study 1 and study 2, respectively, both significantly better than placebo (P=.002 and P=.011, respectively). Change in EGW count following treatment with imiquimod cream 2.5% was only significant in study 2 (P=.001).
The median time to complete clearance was shorter in the 2 active treatment groups compared with placebo. For those participants who attained complete clearance, the median time to complete clearance ranged from 57 to 59 days in the imiquimod cream 3.75% groups (studies 1 and 2, respectively), 60 to 74 days in the imiquimod 2.5% cream groups (studies 1 and 2, respectively), and 76 to 81 days with placebo (studies 2 and 1, respectively).
Safety
Less than one-third of male participants in each treatment group experienced AEs during the studies. The incidence of serious adverse events (SAEs) and AEs leading to study discontinuation was low. In total, 4 participants (0.9% [3 in the imiquimod cream 2.5% group and 1 in the imiquimod cream 3.75% group]) had AEs that led to study discontinuation. Application-site reactions were reported in a total of 46 participants (10.3%). The incidence and severity of local skin reactions was mostly mild or moderate, similar in both active treatment groups, and higher than in the placebo group. Local skin reactions were coincident with the treatment period and rapidly decreased when treatment was concluded. There were no clinically meaningful trends in vital sign measurements or laboratory measurements.
Comment
Imiquimod cream 5% has been shown to be a safe and effective treatment of EGWs. Our study was designed to evaluate lower concentrations of imiquimod cream (2.5% and 3.75%), which may permit daily dosing and a shortened treatment course in men with EGWs.
Efficacy of imiquimod cream 2.5% and 3.75% was established through both primary and secondary end points, though only the higher concentration was significantly more effective than placebo in both studies. In addition, a number of participants who were not completely cleared following 8 weeks of treatment went on to be completely cleared at EOS, demonstrating continued activity of imiquimod despite cessation of active treatment.
Imiquimod cream 3.75% was particularly effective when compared to placebo, with 18.6% of participants completely cleared at EOS, though the PP (observed case) results (22.7%) may be more encouraging and can be used to motivate patients.
Although there are limitations in making direct comparisons between studies, complete clearance rates in our studies were lower than those reported previously with imiquimod cream 5%.17 Lower efficacy rates might be expected given the differences in methodology. In the 2 studies reported here, participants had to have no EGWs (baseline or new, treated or untreated) in any of the anogenital areas specified to be reported as having achieved complete clearance. In earlier studies with imiquimod cream 5%, not all anogenital regions were required to be treated, and any new EGWs arising during treatment were not included in the analysis.17 Also, our analysis focused purely on a male patient population in which efficacy results tend to be lower regardless of treatment modality employed.
Recurrence is another important issue in the treatment of EGWs. Although not studied specifically in a male population, recurrence rates of 16.7% to 17.7% were seen in the 3 months following successful treatment with imiquimod cream 2.5% and 3.75% in the 2 pivotal studies. These results were consistent with the recurrence rates reported following successful treatment with imiquimod cream 5%.17
In general, complete clearance rates increased in a dose-dependent manner. Complete clearance rates were lower in the male subpopulation across all treatment groups compared to those previously reported in females,24 which was consistent with prior results reported for imiquimod cream 5% as well as other topical treatments.17 It has been suggested that this difference may be due in part to the distribution of female EGWs in areas of less keratinization. Complete clearance rates in the current analysis tended to be higher in male participants with baseline EGWs in anatomic sites with less keratinized skin such as the perianal, perineal, or glans penis areas.
Daily application of imiquimod cream 2.5% and 3.75% generally was well tolerated. Most reported AEs were mild or moderate, and few participants discontinued because of AEs. Few SAEs were reported and none were considered to be treatment related. There was no difference in the incidence rates of AEs between the 2 active treatments. The incidence of SAEs and study discontinuations was much lower than previously reported in the female cohort of these 2 studies.24
Conclusion
In conclusion, 2 well-controlled studies of males with EGWs who were treated for up to 8 weeks with imiquimod cream 2.5% and 3.75% applied daily demonstrated good tolerability and superior efficacy to placebo in complete clearance of all baseline and newly arising warts in addition to reducing EGW counts.
Acknowledgments—The authors thank Christina Cognata Smith, PharmD, and Mandeep Kaur, MD (both previously of Valeant Pharmaceuticals North America, LLC, Bridgewater, New Jersey), as well as Brian Bulley, MSc (Inergy Limited, Lindfield, West Sussex, United Kingdom), for assistance with the preparation of the manuscript. Valeant Pharmaceuticals North America, LLC, funded Inergy’s activities pertaining to this analysis.
1. Weinstock H, Berman S, Cates W. Sexually transmitted infections in American youth: incidence and prevalence estimates, 2000. Perspect Sex Reprod Health. 2004;36:6-10.
2. Dunne EF, Unger ER, Sternberg M, et al. Prevalence of HPV infection among females in the United States. JAMA. 2007;297:813-819.
3. Koutsky L. Epidemiology of genital human papillomavirus infection. Am J Med. 1997;102:3-8.
4. Kjaer SK, Tran TN, Sparen P, et al. The burden of genital warts: a study of nearly 70,000 women from the general female population in the 4 Nordic countries. J Infect Dis. 2007;196:1447-1454.
5. Woodhall S, Ramsey T, Cai C, et al. Estimation of the impact of genital warts on health-related quality of life. Sex Transm Infect. 2008;84:161-166.
6. Mortensen GL, Larsen HK. The quality of life of patients with genital warts: a qualitative study. BMC Public Health. 2010;10:113.
7. Wang KL, Jeng CJ, Yang YC, et al. The psychological impact of illness among women experiencing human papillomavirus-related illness or screening interventions. J Psychsom Obstet Gynaecol. 2010;31:16-23.
8. Lawrence S, Walzman M, Sheppard S, et al. The psychological impact caused by genital warts: has the Department of Health’s choice of vaccination missed the opportunity to prevent such morbidity? Int J STD AIDS. 2009;20:696-700.
9. Winer RL, Kiviat NB, Hughes JP, et al. Development and duration of human papillomavirus lesions, after initial infection. J Infect Dis. 2005;191:731-738.
10. Centers for Disease Control and Prevention. Human papillomavirus: HPV information for clinicians. Atlanta, GA: Centers for Disease Control and Prevention, US Department of Health and Human Services; April 2007.
11. Forcier M, Musacchio N. An overview of human papillomavirus infection for the dermatologist: disease, diagnosis, management, and prevention. Dermatol Ther. 2010;23:458-476.
12. Scheinfeld N, Lehman DS. An evidence-based review of medical and surgical treatments of genital warts. Dermatol Online J. 2006;12:5.
13. Aldara [package insert]. Bristol, TN: Graceway Pharmaceuticals, LLC; 2010.
14. Komericki P, Akkilic-Materna M, Strimitzer T, et al. Efficacy and safety of imiquimod versus podophyllotoxin in the treatment of genital warts. Sex Transm Dis. 2011;38:216-218.
15. Beutner KR, Tyring SK, Trofatter KF Jr, et al. Imiquimod, a patient-applied immune-response modifier for treatment of external genital warts. Antimicrob Agents Chemother. 1998;42:789-794.
16. Beutner KR, Spruance SL, Hougham AJ, et al. Treatment of genital warts with an immune-response modifier (imiquimod). J Am Acad Dermatol. 1998;38:230-239.
17. Edwards L, Ferenczy A, Eron L, et al. Self-administered topical 5% imiquimod cream for external anogenital warts. Arch Dermatol. 1998;134:25-30.
18. Fife KH, Ferenczy A, Douglas JM, et al. Treatment of external genital warts in men using 5% imiquimod cream applied three times a week, once daily, twice daily, or three times a day. Sex Transm Dis. 2001;28:226-231.
19. Garland SM, Waddell R, Mindel A, et al. An open-label phase II pilot study investigating the optimal duration of imiquimod 5% cream for the treatment of external genital warts in women. Int J STD AIDS. 2006;17:448-452.
20. Schofer H, Van Ophoven A, Henke U, et al. Randomized, comparative trial on the sustained efficacy of topical imiquimod 5% cream versus conventional ablative methods in external anogenital warts. Eur J Dermatol. 2006;16:642-648.
21. Arican O, Guneri F, Bilgic K, et al. Topical imiquimod 5% cream in external anogenital warts: a randomized, double-blind, placebo-controlled study. J Dermatol. 2004;31:627-631.
22. Gollnick H, Barasso R, Jappe U, et al. Safety and efficacy of imiquimod 5% cream in the treatment of penile genital warts in uncircumcised men when applied three times weekly or once per day. Int J STD AIDS. 2001;12:22-28.
23. Trofatter KF Jr, Ferenczy A, Fife KH. Increased frequency of dosing of imiquimod 5% cream in the treatment of external genital warts in women. Int J Gynecol Obstet. 2002;76:191-193.
24. Baker DA, Ferris DG, Martens MG, et al. Imiquimod 3.75% cream applied daily to treat anogenital warts: combined results from women in two randomized, placebo-controlled studies [published online ahead of print August 24, 2011]. Infect Dis Obstet Gynecol. 2011;2011:806105.
25. Dinh TH, Sternberg M, Dunne EF, et al. Genital warts among 18- to 59-year-olds in the US, National Health and Nutrition Examination Survey, 1999-2004. Sex Transm Dis. 2008;35:357-360.
26. Insinga RP, Dasbach EJ, Elbasha EH. Assessing the annual economic burden of preventing and treating anogenital human papillomavirus-related disease in the US: analytic framework and review of the literature. Pharmacoeconomics. 2005;23:1107-1122.
27. Koshiol JE, Laurent SA, Pimenta JM. Rate and predictors of new genital warts claims and genital warts-related healthcare utilization among privately insured patients in the United States. Sex Transm Dis. 2004;31:748-752.
28. Insinga RP, Glass AG, Rush BB. The health care costs of cervical human papillomavirus-related disease. Am J Obstet Gynecol. 2004;191:114-120.
Practice Points
- Imiquimod cream, both 2.5% and 3.75% concentrations, is more effective than placebo in treating external genital warts (EGWs) in men.
- Imiquimod cream, in both concentrations tested, is somewhat less effective in men than in women in the same protocol.
- Imiquimod cream treatment of EGWs is better tolerated in men than in women in the same protocol.

Tolerance of Fragranced and Fragrance-Free Facial Cleansers in Adults With Clinically Sensitive Skin
For thousands of years, humans have used fragrances to change or affect their mood and enhance an “aura of beauty.”1 Fragrance is a primary driver in consumer choice and purchasing decisions, especially when considering personal care products.2 In addition to fragrance, consumers choose cleanser products based on compatibility with skin, cleansing properties, and sensory attributes such as viscosity and foaming.3,4 However, fragrance sensitivity is among the most common causes of allergic contact dermatitis from cosmetics and personal care products,5 and estimates of the prevalence of fragrance sensitivity range from 1.8% to 4.2%.6
A panel of 26 fragrance ingredients that frequently induce contact dermatitis in sensitive individuals has been identified.7 Since 2003, regulatory authorities in the European Union require these compounds to be listed on the labels of consumer products to protect presensitized consumers.7,8 However, manufacturers of cosmetics are not required to specify allergenic fragrance ingredients outside the European Union, and therefore it is difficult for consumers in the United States to avoid fragrance allergens.
Creation of a fragranced product for fragrance-sensitive individuals begins with careful selection of ingredients and extensive formulation testing and evaluation. This process usually is followed by testing in normal individuals to confirm that the fragranced product is well accepted and then evaluation is done in clinically confirmed fragrance-sensitive patients and those with a compromised skin barrier from atopic dermatitis, rosacea, or eczema.
Sensitive skin may be due to increased immune responsiveness, altered neurosensory input, and/or decreased skin barrier function, and presents a complex challenge for dermatologists.9 Subjective perceptions of sensitive skin include stinging, burning, pruritus, and tightness following product application. Clinically sensitive skin is defined by the presence of erythema, stratum corneum desquamation, papules, pustules, wheals, vesicles, bullae, and/or erosions.9 Although some of these symptoms may be observed immediately, others may be delayed by minutes, hours, or days following the use of an irritating product. Patients who present with subjective symptoms of sensitive skin may or may not show objective symptoms.
Gentle skin cleansing is particularly important for patients with compromised skin barrier integrity, such as those with acne, atopic dermatitis, eczema, or rosacea. Standard alkaline surfactants in skin cleansers help to remove dirt and oily soil and produce lather but can impair the skin barrier function and facilitate development of irritation.10-13 The tolerability of a cleanser is influenced by its pH, the type and amount of surfactant ingredients, the presence of moisturizing agents, and the amount of residue left on the skin after washing.11,12 Mild cleansers have been developed for patients with sensitive skin conditions and are expected to provide cleansing benefits without negatively affecting the hydration and viscoelastic properties of skin.11 Mild cleansers interact minimally with skin proteins and lipids because they usually contain nonionic synthetic surfactant mixtures; they also have a pH value close to the slightly acidic pH of normal skin, contain moisturizing agents,11,14,15 and usually produce less foam.10,16 In patients with sensitive skin, mild and fragrance-free cleansers often are recommended.17,18 Because fragrances often affect consumers’ perception of product performance19 and enhance the cleaning experience of the user, consumer compliance with clinical recommendations to use fragrance-free cleansers often is poor.
Low–molecular-weight, water-soluble, hydrophobically modified polymers (HMPs) have been used to create gentle foaming cleansers with reduced impact on the skin barrier.12,16,20 In the presence of HMPs, surfactants assemble into larger, more stable polymer-surfactant structures that are less likely to penetrate the skin.16 Hydrophobically modified polymers can potentially reduce skin irritation by lowering the concentration of free micelles in solution. Additionally, both HMPs and HMP-surfactant complexes stabilize newly formed air-water interfaces, leading to thicker, denser, and longer-lasting foams.16 A gentle, fragrance-free, foaming liquid facial test cleanser with HMPs has been shown to be well tolerated in women with sensitive skin.20
This report describes 2 studies of a new mild, HMP-containing, foaming facial cleanser with a fragrance that was free of common allergens and irritating essential oils in patients with sensitive skin. Study 1 was designed to evaluate the tolerance and acceptability of 2 variations of the HMP-containing cleanser—one fragrance free and the other with fragrance—in a small sample of healthy adults with clinically diagnosed fragrance-sensitive skin. Study 2 was a large, 2-center study of the tolerability and effectiveness of the fragranced HMP-containing cleanser compared with a benchmark dermatologist-recommended, gentle, fragrance-free, nonfoaming cleanser in women with clinically diagnosed sensitive skin.
Methods
Study 1 Design
The primary objective of this prospective, randomized, single-center, crossover study was to evaluate the tolerability of fragranced versus fragrance-free formulations of a mild, HMP-containing liquid facial cleanser in healthy male and female adults with Fitzpatrick skin types I to IV who were clinically diagnosed as having fragrance sensitivity. Fragrance sensitivity was defined as a history of positive reactions to a fragrance mixture of 8 components (fragrance mixture I) and/or a fragrance mixture of 14 fragrances (fragrance mixture II) that included balsam of Peru (Myroxylonpereirae), geraniol, jasmine oil, and oakmoss.5 All participants provided written informed consent prior to enrolling in the study, and both the study protocol and informed consent agreement were approved by an institutional review board.
Participants were instructed to wash their face twice daily, noting the time of cleansing and providing commentary about their cleansing experience in a diary. The liquid facial test cleansers contained the HMP potassium acrylates copolymer, glycerin, and a surfactant system primarily containing cocamidopropyl betaine and lauryl glucoside prepared without added fragrance (as previously described20) or with a fragrance free of common allergens and irritating essential oils.
Half of the participants used the fragranced test cleanser and half used the fragrance-free test cleanser for a 3-week treatment period (weeks 1–3). Each treatment group subsequently switched to the other test cleanser for a second 3-week treatment period (weeks 4–6). Clinicians assessed global disease severity (an overall assessment of skin condition that was independent of other evaluation criteria), itching/burning, visible irritation, erythema, and desquamation at weekly time points throughout the study and graded each clinical tolerance attribute on a 5-point scale (0=none; 1=minimal; 2=mild; 3=moderate; 4=severe). Ordinal scores at baseline and at weeks 1 and 3 were used to calculate change from baseline.
A 7-item questionnaire also was administered to participants at each visit to assess skin condition, smoothness, softness, cleanliness, radiance, satisfaction with cleansing experience, and lathering. Each item was scored on a 5-point ordinal scale (0=none; 1=minimal; 2=good; 3=excellent; 4=superior). The scores for all parameters were statistically compared with baseline values using a paired t test with a significance level of P≤.05.
Study 2 Design
This prospective, 3-week, double-blind, randomized, comparative, 2-center study to evaluate the tolerability of the fragranced, HMP-containing test cleanser from study 1 versus a benchmark gentle, fragrance-free, nonfoaming cleanser in a large population of otherwise healthy females who had been clinically diagnosed with sensitive skin (not limited to fragrance sensitivity). The study sponsor provided blinded test materials, and neither the examiner nor the recorder knew which investigational product was administered to which participants. Additionally, personnel who dispensed the test cleansers to participants or supervised their use did not participate in the evaluation to minimize potential bias. All participants provided written informed consent prior to enrolling in the study, and the study protocol and informed consent agreement were approved by an institutional review board.
Participants included women aged 18 to 65 years with mild to moderate clinical symptoms of atopic dermatitis, eczema, acne, or rosacea within the 90 days prior to the study period. They were randomized into 2 balanced treatment groups: group 1 received the mild, fragranced, HMP-containing liquid facial cleanser from study 1 and group 2 received a leading, dermatologist-recommended, gentle, fragrance-free, nonfoaming cleanser. Each treatment group used the test cleansers at least once daily for 3 weeks.
Clinicians evaluated facial skin for softness and smoothness, global disease severity (rated visually by the investigator as an overall assessment of skin condition that was independent of other evaluation criteria [as previously described20]), itching, irritation, erythema, and desquamation at baseline and at weeks 1 and 3. The effectiveness of each product to remove facial dirt, cosmetics, and sebum also was assessed; clinical grading was performed as described for study 1 using the same grading scale as in study 1 and percentage change from baseline (improvement) was calculated.
The study also included a self-assessment of skin irritation in which participants responded yes or no to the following question: Have you experienced irritation using this product? Participants also completed a questionnaire in which they were asked to select the most appropriate answer—agree strongly, agree somewhat, neither, disagree somewhat, and disagree strongly— to the following statements: the cleanser leaves no residue; cleanses deep to remove dirt, oil, and makeup; the cleanser effectively removes makeup; the cleanser leaves my skin smooth; the cleanser leaves my skin soft; the cleanser rinses completely clean; cleanser does not over dry my skin; and my skin is completely clean.
The statistical analysis was performed using a nonparametric, 2-tailed, paired Mann-Whitney U test, and statistical significance was set at P≤.05.
Results
Study 1 Assessment
Eight female participants aged 22 to 60 years with clinically diagnosed fragrance sensitivity were enrolled in the study. After 3 weeks of use, clinician assessment showed that both the fragranced and fragrance-free test cleansers with HMPs improved several skin tolerance attributes, including global disease severity, irritation, and erythema (Figure 1). No notable differences in skin tolerance attributes were reported in the fragranced versus the fragrance-free formulations.
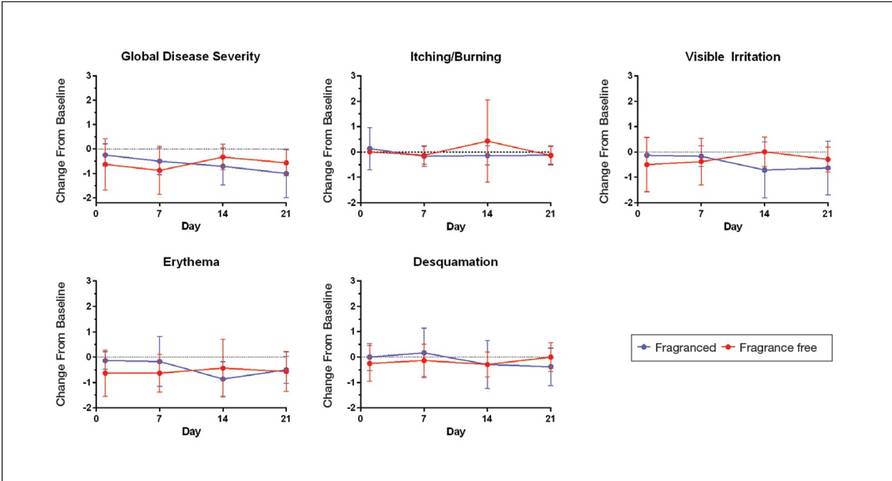
There were no reported differences in participant-reported cleanser effectiveness for the fragranced versus the fragrance-free cleanser either at baseline or weeks 1 or 3 (data not shown).
Study 2 Assessment
A total of 153 women aged 25 to 54 years with sensitive skin were enrolled in the study. Seventy-three participants were randomized to receive the fragranced test cleanser and 80 were randomized to receive the benchmark fragrance-free cleanser.
At week 3, there were no differences between the fragranced test cleanser and the benchmark cleanser in any of the clinician-assessed skin parameters (Figure 2). Of the parameters assessed, itching, irritation, and desquamation were the most improved from baseline in both treatment groups. Similar results were observed at week 1 (data not shown).
There were no apparent differences in subjective self-assessment of skin irritation between the test and benchmark cleansers at week 1 (15.7% vs 13.0%) or week 3 (24.3% vs 12.3%). When asked to respond to a series of 8 statements related to cleanser effectiveness, most participants either agreed strongly or agreed somewhat with the statements (Figure 3). There were no statistically significant differences between treatment groups, and responses to all statements indicated that participants were as satisfied with the test cleanser as they were with the benchmark cleanser.
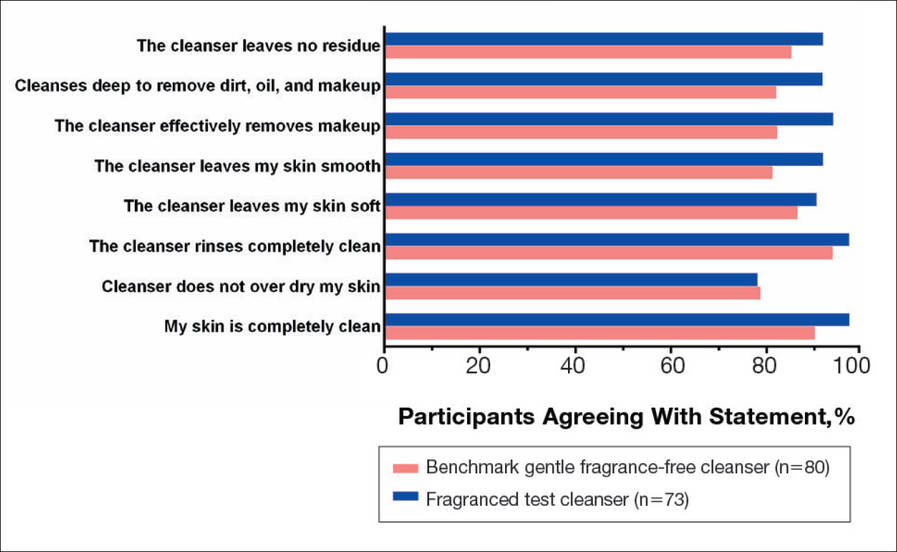
Comment
Consumers value cleansing, fragrance, viscosity, and foaming attributes in skin care products very highly.3,4,10 Fragrances are added to personal care products to positively affect consumers’ perception of product performance and to add emotional benefits by implying social or economic prestige to the use of a product.19 In one study, shampoo formulations that varied only in the added fragrance received different consumer evaluations for cleansing effectiveness and foaming.4
Although mild nonfoaming cleansers can be effective, adult consumers generally use cleansers that foam10,16 and often judge the performance of a cleansing product based on its foaming properties.3,10 Mild cleansers with HMPs maintain the ability to foam while also reducing the likelihood of skin irritation.16 One study showed that a mild, fragrance-free, foaming cleanser containing HMPs was as effective, well tolerated, and nonirritating in patients with sensitive skin as a benchmark nonfoaming gentle cleanser.20
Results from study 1 presented here show that fragranced and fragrance-free formulations of a mild, HMP-containing cleanser are equally efficacious and well tolerated in a small sample of participants with clinically diagnosed fragrance sensitivity. Skin tolerance attributes improved with both cleansers over a 3-week period, particularly global disease severity, irritation, and erythema. These results suggest that a fragrance free of common allergens and irritating essential oils could be introduced into a mild foaming cleanser containing HMPs without causing adverse reactions, even in patients who are fragrance sensitive.
Although the populations of studies 1 and 2 both included female participants with sensitive skin, they were not identical. While study 1 assessed a limited number of participants with clinically diagnosed fragrance sensitivity, study 2 was larger and included a broader range of participants with clinically diagnosed skin sensitivity, which could include fragrance sensitivity. The well-chosen fragrance of the test cleanser containing HMPs was well tolerated; however, this does not imply that any other fragrances added to this cleanser formulation would be as well tolerated.
Conclusion
The current studies indicate that a gentle fragranced foaming cleanser with HMPs was well tolerated in a small population of participants with clinically diagnosed fragrance sensitivity. In a larger population of female participants with sensitive skin, the gentle fragranced foaming cleanser with HMPs was as effective as a leading dermatologist-recommended, fragrance-free, gentle, nonfoaming cleanser. The gentle, HMP-containing, foaming cleanser with a fragrance that does not contain common allergens and irritating essential oils offers a new cleansing option for adults with sensitive skin who may prefer to use a fragranced and foaming product.
Acknowledgments—The authors are grateful to the patients and clinicians who participated in these studies. Editorial and medical writing support was provided by Tove Anderson, PhD, and Alex Loeb, PhD, both from Evidence Scientific Solutions, Inc, Philadelphia, Pennsylvania, and was funded by Johnson & Johnson Consumer Inc.
- Draelos ZD. To smell or not to smell? that is the question! J Cosmet Dermatol. 2013;12:1-2.
- Milotic D. The impact of fragrance on consumer choice. J Consumer Behaviour. 2003;3:179-191.
- Klein K. Evaluating shampoo foam. Cosmetics & Toiletries. 2004;119:32-36.
- Herman S. Skin care: the importance of feel. GCI Magazine. December 2007:70-74.
- Larsen WG. How to test for fragrance allergy. Cutis. 2000;65:39-41.
- Schnuch A, Uter W, Geier J, et al. Epidemiology of contact allergy: an estimation of morbidity employing the clinical epidemiology and drug-utilization research (CE-DUR) approach. Contact Dermatitis. 2002;47:32-39.
- Directive 2003/15/EC of the European Parliament and of the Council of 27 February 2003 amending Council Directive 76/768/EEC on the approximation of the laws of the Member States relating to cosmetic products. Official Journal of the European Communities. 2003;L66:26-35.
- Guidance note: labelling of ingredients in Cosmetics Directive 76/768/EEC. European Commission Web site. http: //ec.europa.eu/consumers/sectors/cosmetics/files/doc/guide _labelling200802_en.pdf. Updated February 2008. Accessed September 2, 2015.
- Draelos ZD. Sensitive skin: perceptions, evaluation, and treatment. Am J Contact Dermatitis. 1997;8:67-78.
- Abbas S, Goldberg JW, Massaro M. Personal cleanser technology and clinical performance. Dermatol Ther. 2004;17(suppl 1):35-42.
- Ananthapadmanabhan KP, Moore DJ, Subramanyan K, et al. Cleansing without compromise: the impact of cleansers on the skin barrier and the technology of mild cleansing. Dermatol Ther. 2004;17(suppl 1):16-25.
- Walters RM, Mao G, Gunn ET, et al. Cleansing formulations that respect skin barrier integrity. Dermatol Res Pract. 2012;2012:495917.
- Saad P, Flach CR, Walters RM, et al. Infrared spectroscopic studies of sodium dodecyl sulphate permeation and interaction with stratum corneum lipids in skin. Int J Cosmet Sci. 2012;34:36-43.
- Bikowski J. The use of cleansers as therapeutic concomitants in various dermatologic disorders. Cutis. 2001;68(suppl 5):12-19.
- Walters RM, Fevola MJ, LiBrizzi JJ, et al. Designing cleansers for the unique needs of baby skin. Cosmetics & Toiletries. 2008;123:53-60.
- Fevola MJ, Walters RM, LiBrizzi JJ. A new approach to formulating mild cleansers: hydrophobically-modified polymers for irritation mitigation. In: Morgan SE, Lochhead RY, eds. Polymeric Delivery of Therapeutics. Vol 1053. Washington, DC: American Chemical Society; 2011:221-242.
- Nelson SA, Yiannias JA. Relevance and avoidance of skin-care product allergens: pearls and pitfalls. Dermatol Clin. 2009;27:329-336.
- Arribas MP, Soro P, Silvestre JF. Allergic contact dermatitis to fragrances: part 2. Actas Dermosifiliogr. 2013;104:29-37.
- Schroeder W. Understanding fragrance in personal care. Cosmetics & Toiletries. 2009;124:36-44.
- Draelos Z, Hornby S, Walters RM, et al. Hydrophobically-modified polymers can minimize skin irritation potential caused by surfactant-based cleansers. J Cosmet Dermatol. 2013;12:314-321.
For thousands of years, humans have used fragrances to change or affect their mood and enhance an “aura of beauty.”1 Fragrance is a primary driver in consumer choice and purchasing decisions, especially when considering personal care products.2 In addition to fragrance, consumers choose cleanser products based on compatibility with skin, cleansing properties, and sensory attributes such as viscosity and foaming.3,4 However, fragrance sensitivity is among the most common causes of allergic contact dermatitis from cosmetics and personal care products,5 and estimates of the prevalence of fragrance sensitivity range from 1.8% to 4.2%.6
A panel of 26 fragrance ingredients that frequently induce contact dermatitis in sensitive individuals has been identified.7 Since 2003, regulatory authorities in the European Union require these compounds to be listed on the labels of consumer products to protect presensitized consumers.7,8 However, manufacturers of cosmetics are not required to specify allergenic fragrance ingredients outside the European Union, and therefore it is difficult for consumers in the United States to avoid fragrance allergens.
Creation of a fragranced product for fragrance-sensitive individuals begins with careful selection of ingredients and extensive formulation testing and evaluation. This process usually is followed by testing in normal individuals to confirm that the fragranced product is well accepted and then evaluation is done in clinically confirmed fragrance-sensitive patients and those with a compromised skin barrier from atopic dermatitis, rosacea, or eczema.
Sensitive skin may be due to increased immune responsiveness, altered neurosensory input, and/or decreased skin barrier function, and presents a complex challenge for dermatologists.9 Subjective perceptions of sensitive skin include stinging, burning, pruritus, and tightness following product application. Clinically sensitive skin is defined by the presence of erythema, stratum corneum desquamation, papules, pustules, wheals, vesicles, bullae, and/or erosions.9 Although some of these symptoms may be observed immediately, others may be delayed by minutes, hours, or days following the use of an irritating product. Patients who present with subjective symptoms of sensitive skin may or may not show objective symptoms.
Gentle skin cleansing is particularly important for patients with compromised skin barrier integrity, such as those with acne, atopic dermatitis, eczema, or rosacea. Standard alkaline surfactants in skin cleansers help to remove dirt and oily soil and produce lather but can impair the skin barrier function and facilitate development of irritation.10-13 The tolerability of a cleanser is influenced by its pH, the type and amount of surfactant ingredients, the presence of moisturizing agents, and the amount of residue left on the skin after washing.11,12 Mild cleansers have been developed for patients with sensitive skin conditions and are expected to provide cleansing benefits without negatively affecting the hydration and viscoelastic properties of skin.11 Mild cleansers interact minimally with skin proteins and lipids because they usually contain nonionic synthetic surfactant mixtures; they also have a pH value close to the slightly acidic pH of normal skin, contain moisturizing agents,11,14,15 and usually produce less foam.10,16 In patients with sensitive skin, mild and fragrance-free cleansers often are recommended.17,18 Because fragrances often affect consumers’ perception of product performance19 and enhance the cleaning experience of the user, consumer compliance with clinical recommendations to use fragrance-free cleansers often is poor.
Low–molecular-weight, water-soluble, hydrophobically modified polymers (HMPs) have been used to create gentle foaming cleansers with reduced impact on the skin barrier.12,16,20 In the presence of HMPs, surfactants assemble into larger, more stable polymer-surfactant structures that are less likely to penetrate the skin.16 Hydrophobically modified polymers can potentially reduce skin irritation by lowering the concentration of free micelles in solution. Additionally, both HMPs and HMP-surfactant complexes stabilize newly formed air-water interfaces, leading to thicker, denser, and longer-lasting foams.16 A gentle, fragrance-free, foaming liquid facial test cleanser with HMPs has been shown to be well tolerated in women with sensitive skin.20
This report describes 2 studies of a new mild, HMP-containing, foaming facial cleanser with a fragrance that was free of common allergens and irritating essential oils in patients with sensitive skin. Study 1 was designed to evaluate the tolerance and acceptability of 2 variations of the HMP-containing cleanser—one fragrance free and the other with fragrance—in a small sample of healthy adults with clinically diagnosed fragrance-sensitive skin. Study 2 was a large, 2-center study of the tolerability and effectiveness of the fragranced HMP-containing cleanser compared with a benchmark dermatologist-recommended, gentle, fragrance-free, nonfoaming cleanser in women with clinically diagnosed sensitive skin.
Methods
Study 1 Design
The primary objective of this prospective, randomized, single-center, crossover study was to evaluate the tolerability of fragranced versus fragrance-free formulations of a mild, HMP-containing liquid facial cleanser in healthy male and female adults with Fitzpatrick skin types I to IV who were clinically diagnosed as having fragrance sensitivity. Fragrance sensitivity was defined as a history of positive reactions to a fragrance mixture of 8 components (fragrance mixture I) and/or a fragrance mixture of 14 fragrances (fragrance mixture II) that included balsam of Peru (Myroxylonpereirae), geraniol, jasmine oil, and oakmoss.5 All participants provided written informed consent prior to enrolling in the study, and both the study protocol and informed consent agreement were approved by an institutional review board.
Participants were instructed to wash their face twice daily, noting the time of cleansing and providing commentary about their cleansing experience in a diary. The liquid facial test cleansers contained the HMP potassium acrylates copolymer, glycerin, and a surfactant system primarily containing cocamidopropyl betaine and lauryl glucoside prepared without added fragrance (as previously described20) or with a fragrance free of common allergens and irritating essential oils.
Half of the participants used the fragranced test cleanser and half used the fragrance-free test cleanser for a 3-week treatment period (weeks 1–3). Each treatment group subsequently switched to the other test cleanser for a second 3-week treatment period (weeks 4–6). Clinicians assessed global disease severity (an overall assessment of skin condition that was independent of other evaluation criteria), itching/burning, visible irritation, erythema, and desquamation at weekly time points throughout the study and graded each clinical tolerance attribute on a 5-point scale (0=none; 1=minimal; 2=mild; 3=moderate; 4=severe). Ordinal scores at baseline and at weeks 1 and 3 were used to calculate change from baseline.
A 7-item questionnaire also was administered to participants at each visit to assess skin condition, smoothness, softness, cleanliness, radiance, satisfaction with cleansing experience, and lathering. Each item was scored on a 5-point ordinal scale (0=none; 1=minimal; 2=good; 3=excellent; 4=superior). The scores for all parameters were statistically compared with baseline values using a paired t test with a significance level of P≤.05.
Study 2 Design
This prospective, 3-week, double-blind, randomized, comparative, 2-center study to evaluate the tolerability of the fragranced, HMP-containing test cleanser from study 1 versus a benchmark gentle, fragrance-free, nonfoaming cleanser in a large population of otherwise healthy females who had been clinically diagnosed with sensitive skin (not limited to fragrance sensitivity). The study sponsor provided blinded test materials, and neither the examiner nor the recorder knew which investigational product was administered to which participants. Additionally, personnel who dispensed the test cleansers to participants or supervised their use did not participate in the evaluation to minimize potential bias. All participants provided written informed consent prior to enrolling in the study, and the study protocol and informed consent agreement were approved by an institutional review board.
Participants included women aged 18 to 65 years with mild to moderate clinical symptoms of atopic dermatitis, eczema, acne, or rosacea within the 90 days prior to the study period. They were randomized into 2 balanced treatment groups: group 1 received the mild, fragranced, HMP-containing liquid facial cleanser from study 1 and group 2 received a leading, dermatologist-recommended, gentle, fragrance-free, nonfoaming cleanser. Each treatment group used the test cleansers at least once daily for 3 weeks.
Clinicians evaluated facial skin for softness and smoothness, global disease severity (rated visually by the investigator as an overall assessment of skin condition that was independent of other evaluation criteria [as previously described20]), itching, irritation, erythema, and desquamation at baseline and at weeks 1 and 3. The effectiveness of each product to remove facial dirt, cosmetics, and sebum also was assessed; clinical grading was performed as described for study 1 using the same grading scale as in study 1 and percentage change from baseline (improvement) was calculated.
The study also included a self-assessment of skin irritation in which participants responded yes or no to the following question: Have you experienced irritation using this product? Participants also completed a questionnaire in which they were asked to select the most appropriate answer—agree strongly, agree somewhat, neither, disagree somewhat, and disagree strongly— to the following statements: the cleanser leaves no residue; cleanses deep to remove dirt, oil, and makeup; the cleanser effectively removes makeup; the cleanser leaves my skin smooth; the cleanser leaves my skin soft; the cleanser rinses completely clean; cleanser does not over dry my skin; and my skin is completely clean.
The statistical analysis was performed using a nonparametric, 2-tailed, paired Mann-Whitney U test, and statistical significance was set at P≤.05.
Results
Study 1 Assessment
Eight female participants aged 22 to 60 years with clinically diagnosed fragrance sensitivity were enrolled in the study. After 3 weeks of use, clinician assessment showed that both the fragranced and fragrance-free test cleansers with HMPs improved several skin tolerance attributes, including global disease severity, irritation, and erythema (Figure 1). No notable differences in skin tolerance attributes were reported in the fragranced versus the fragrance-free formulations.
There were no reported differences in participant-reported cleanser effectiveness for the fragranced versus the fragrance-free cleanser either at baseline or weeks 1 or 3 (data not shown).
Study 2 Assessment
A total of 153 women aged 25 to 54 years with sensitive skin were enrolled in the study. Seventy-three participants were randomized to receive the fragranced test cleanser and 80 were randomized to receive the benchmark fragrance-free cleanser.
At week 3, there were no differences between the fragranced test cleanser and the benchmark cleanser in any of the clinician-assessed skin parameters (Figure 2). Of the parameters assessed, itching, irritation, and desquamation were the most improved from baseline in both treatment groups. Similar results were observed at week 1 (data not shown).
There were no apparent differences in subjective self-assessment of skin irritation between the test and benchmark cleansers at week 1 (15.7% vs 13.0%) or week 3 (24.3% vs 12.3%). When asked to respond to a series of 8 statements related to cleanser effectiveness, most participants either agreed strongly or agreed somewhat with the statements (Figure 3). There were no statistically significant differences between treatment groups, and responses to all statements indicated that participants were as satisfied with the test cleanser as they were with the benchmark cleanser.
Comment
Consumers value cleansing, fragrance, viscosity, and foaming attributes in skin care products very highly.3,4,10 Fragrances are added to personal care products to positively affect consumers’ perception of product performance and to add emotional benefits by implying social or economic prestige to the use of a product.19 In one study, shampoo formulations that varied only in the added fragrance received different consumer evaluations for cleansing effectiveness and foaming.4
Although mild nonfoaming cleansers can be effective, adult consumers generally use cleansers that foam10,16 and often judge the performance of a cleansing product based on its foaming properties.3,10 Mild cleansers with HMPs maintain the ability to foam while also reducing the likelihood of skin irritation.16 One study showed that a mild, fragrance-free, foaming cleanser containing HMPs was as effective, well tolerated, and nonirritating in patients with sensitive skin as a benchmark nonfoaming gentle cleanser.20
Results from study 1 presented here show that fragranced and fragrance-free formulations of a mild, HMP-containing cleanser are equally efficacious and well tolerated in a small sample of participants with clinically diagnosed fragrance sensitivity. Skin tolerance attributes improved with both cleansers over a 3-week period, particularly global disease severity, irritation, and erythema. These results suggest that a fragrance free of common allergens and irritating essential oils could be introduced into a mild foaming cleanser containing HMPs without causing adverse reactions, even in patients who are fragrance sensitive.
Although the populations of studies 1 and 2 both included female participants with sensitive skin, they were not identical. While study 1 assessed a limited number of participants with clinically diagnosed fragrance sensitivity, study 2 was larger and included a broader range of participants with clinically diagnosed skin sensitivity, which could include fragrance sensitivity. The well-chosen fragrance of the test cleanser containing HMPs was well tolerated; however, this does not imply that any other fragrances added to this cleanser formulation would be as well tolerated.
Conclusion
The current studies indicate that a gentle fragranced foaming cleanser with HMPs was well tolerated in a small population of participants with clinically diagnosed fragrance sensitivity. In a larger population of female participants with sensitive skin, the gentle fragranced foaming cleanser with HMPs was as effective as a leading dermatologist-recommended, fragrance-free, gentle, nonfoaming cleanser. The gentle, HMP-containing, foaming cleanser with a fragrance that does not contain common allergens and irritating essential oils offers a new cleansing option for adults with sensitive skin who may prefer to use a fragranced and foaming product.
Acknowledgments—The authors are grateful to the patients and clinicians who participated in these studies. Editorial and medical writing support was provided by Tove Anderson, PhD, and Alex Loeb, PhD, both from Evidence Scientific Solutions, Inc, Philadelphia, Pennsylvania, and was funded by Johnson & Johnson Consumer Inc.
- Draelos ZD. To smell or not to smell? that is the question! J Cosmet Dermatol. 2013;12:1-2.
- Milotic D. The impact of fragrance on consumer choice. J Consumer Behaviour. 2003;3:179-191.
- Klein K. Evaluating shampoo foam. Cosmetics & Toiletries. 2004;119:32-36.
- Herman S. Skin care: the importance of feel. GCI Magazine. December 2007:70-74.
- Larsen WG. How to test for fragrance allergy. Cutis. 2000;65:39-41.
- Schnuch A, Uter W, Geier J, et al. Epidemiology of contact allergy: an estimation of morbidity employing the clinical epidemiology and drug-utilization research (CE-DUR) approach. Contact Dermatitis. 2002;47:32-39.
- Directive 2003/15/EC of the European Parliament and of the Council of 27 February 2003 amending Council Directive 76/768/EEC on the approximation of the laws of the Member States relating to cosmetic products. Official Journal of the European Communities. 2003;L66:26-35.
- Guidance note: labelling of ingredients in Cosmetics Directive 76/768/EEC. European Commission Web site. http: //ec.europa.eu/consumers/sectors/cosmetics/files/doc/guide _labelling200802_en.pdf. Updated February 2008. Accessed September 2, 2015.
- Draelos ZD. Sensitive skin: perceptions, evaluation, and treatment. Am J Contact Dermatitis. 1997;8:67-78.
- Abbas S, Goldberg JW, Massaro M. Personal cleanser technology and clinical performance. Dermatol Ther. 2004;17(suppl 1):35-42.
- Ananthapadmanabhan KP, Moore DJ, Subramanyan K, et al. Cleansing without compromise: the impact of cleansers on the skin barrier and the technology of mild cleansing. Dermatol Ther. 2004;17(suppl 1):16-25.
- Walters RM, Mao G, Gunn ET, et al. Cleansing formulations that respect skin barrier integrity. Dermatol Res Pract. 2012;2012:495917.
- Saad P, Flach CR, Walters RM, et al. Infrared spectroscopic studies of sodium dodecyl sulphate permeation and interaction with stratum corneum lipids in skin. Int J Cosmet Sci. 2012;34:36-43.
- Bikowski J. The use of cleansers as therapeutic concomitants in various dermatologic disorders. Cutis. 2001;68(suppl 5):12-19.
- Walters RM, Fevola MJ, LiBrizzi JJ, et al. Designing cleansers for the unique needs of baby skin. Cosmetics & Toiletries. 2008;123:53-60.
- Fevola MJ, Walters RM, LiBrizzi JJ. A new approach to formulating mild cleansers: hydrophobically-modified polymers for irritation mitigation. In: Morgan SE, Lochhead RY, eds. Polymeric Delivery of Therapeutics. Vol 1053. Washington, DC: American Chemical Society; 2011:221-242.
- Nelson SA, Yiannias JA. Relevance and avoidance of skin-care product allergens: pearls and pitfalls. Dermatol Clin. 2009;27:329-336.
- Arribas MP, Soro P, Silvestre JF. Allergic contact dermatitis to fragrances: part 2. Actas Dermosifiliogr. 2013;104:29-37.
- Schroeder W. Understanding fragrance in personal care. Cosmetics & Toiletries. 2009;124:36-44.
- Draelos Z, Hornby S, Walters RM, et al. Hydrophobically-modified polymers can minimize skin irritation potential caused by surfactant-based cleansers. J Cosmet Dermatol. 2013;12:314-321.
Practice Points
- Fragranced and fragrance-free versions of a gentle foaming cleanser with hydrophobically modified polymers (HMPs) were similarly well tolerated in participants with clinically diagnosed fragrance sensitivity.
- In a large population of female participants with sensitive skin, the fragranced gentle foaming cleanser with HMPs was as effective as a leading dermatologist-recommended, fragrance-free, gentle, nonfoaming cleanser.
- The gentle, HMP-containing, foaming cleanser with a fragrance offers a new cleansing option for adults with sensitive skin who may prefer to use a fragranced and foaming product.

Guideline‐Concordant Antibiotic Use
Clinical guidelines are prevalent in the field of medicine, but physicians do not consistently provide guideline‐concordant care. Nonadherence to guidelines has been documented for a variety of clinical conditions, including chronic obstructive pulmonary disease,[1, 2] pain management,[3, 4] and major depressive disorder.[5, 6]
Although several professional societies, including the Infectious Diseases Society of America (IDSA), have developed and disseminated guidelines on antibiotic use, adherence to antibiotic‐prescribing guidelines is inconsistent. Several studies have documented inappropriate antibiotic prescribing for specific infections, including acute respiratory infections,[7, 8, 9] cellulitis,[10, 11] and asymptomatic bacteriuria.[12, 13]
Improving adherence to guidelines on antibiotic use could have several benefits. For certain infections, guideline adherence has been shown to improve patient outcomes and reduce resource utilization.[10, 14, 15] In general, guidelines promote more judicious use of antibiotics by clarifying when an antibiotic is indicated, which antibiotics to prescribe, and duration of antibiotic therapy. The more judicious use of antibiotics decreases a given patient's risk of developing an antibiotic‐resistant infection and Clostridium difficileassociated diarrhea.[16] Judicious antibiotic use will also have societal benefits by slowing the spread of antibiotic‐resistant bacteria.
As part of a local effort to improve antibiotic use, we decided to present physicians with hypothetical cases of common clinical scenarios to identify barriers to following antibiotic‐prescribing guidelines. Previous investigators have used case vignettes to assess the quality of care physicians provide, including decisions about antibiotics.[17, 18, 19, 20, 21] We used case vignettes to assess physicians' familiarity with and acceptance of IDSA guidelines for 3 common infectious conditions: skin and soft tissue infections (SSTI), suspected hospital‐acquired pneumonia (HAP), and asymptomatic bacteriuria (ASB). The findings from our project were intended to inform local interventions to improve antibiotic prescribing.
METHODS
All interviews were conducted at 2 acute care hospitals in Indianapolis, Indiana: Sidney and Lois Eskenazi Hospital and the Richard Roudebush Veterans Affairs Medical Center (VAMC). Eskenazi Hospital is a 316‐bed safety‐net hospital for Marion County, Indiana. The Roudebush VAMC is a 209‐bed tertiary care facility that provides comprehensive medical care for 85,000 veterans. Both hospitals are academically affiliated with Indiana University's School of Medicine.
Both hospitals have empiric antibiotic‐prescribing guidelines printed in their annual antibiograms. These guidelines, developed by each hospital's pharmacy department and the local infectious disease (ID) physicians, are distributed annually as a pocket booklet. During this study, an antibiotic stewardship program was active at hospital A but not hospital B. As part of this program at hospital A, an ID physician reviewed inpatients on antibiotics twice a week and, with the help of inpatient team pharmacists, provided feedback to the frontline prescribers.
For this study, inpatient physicians who prescribe antibiotics at either facility were invited to participate in a 30‐minute confidential interview about their antibiotic‐prescribing habits. All invitations were sent through electronic mail. The target enrollment was 30 physicians, which is consistent with prior literature on qualitative sampling.[22] Sampling was purposeful to recruit a heterogeneous group of participants from both hospital sites. Although such a sampling strategy precluded us from making conclusions about individual subgroups, our intention was to obtain the broadest range of information and perspectives, thereby challenging our own preconceived understandings and biases.
The protocol and conduct of this study were reviewed and approved by the Indiana University Institutional Review Board. Participants read and provided signed informed consent. No compensation was provided to physician participants.
A research assistant (A.R.C.) trained in qualitative interviewing conducted all interviews.[23] These interviews covered social norms, perceptions of risk, self‐efficacy, knowledge, and acceptance of guidelines. At the end of the interview, each participant was asked to respond to 3 case vignettes (Table 1), which had been developed by an ID physician (D.L.) based on both local and IDSA guidelines.[24, 25, 26] Participants decided whether to prescribe antibiotics and, if so, which antibiotic to use. After their response, the interviewer read aloud specific recommendations from IDSA guidelines and asked, Would you feel comfortable applying this recommendation to your practice? Are there situations when you would not apply this recommendation?
|
| 1. A 40‐year‐old man with poorly controlled type 2 diabetes develops pain and redness over the dorsum of his foot. He presents to the emergency room the day after these symptoms started. He denies any recent penetrating injuries to his foot, including no animal bites, and denies any water exposure. At the time of presentation, his temperature is 101.1F, pulse 89, his blood pressure is 124/76, and his respiratory rate is 16. Tender edema, warmth, and erythema extend up to the pretibial area of his right lower leg. Fissures are present between his toes, but he has no foot ulcers. There are no blisters or purulence. When you palpate, you don't feel any crepitus or fluctuance. He has a strong pulse at both dorsal pedis and posterior tibial arteries. Labs reveal a normal WBC count. What is your diagnosis? What antibiotics would you start? |
| 2. A 72‐year‐old man is admitted for a lobectomy. About 6 days after his operation, while still on mechanical ventilation, he develops findings suggestive of pneumonia, based on a new right lower lobe infiltrate on chest x‐ray, increased secretions, and fever (101.1F). A blood sample and an endotracheal aspirate are sent for culture. He is empirically started on vancomycin and piperacillin/tazobactam. After 3 days of empiric antibiotics, he has had no additional fevers and has been extubated to room air. His WBC count has normalized. Blood cultures show no growth. The respiratory sample shows >25 PMNs and <10 epithelial cells; no organisms are seen on Gram stain, and there is no growth on culture. Would you make any changes to his antibiotic regimen at this time? If so, how would you justify the change? |
| 3. A 72‐year‐old man presented with a severe Clostridium difficile infection, which resulted in both respiratory and acute renal failure. He gradually improved with supportive care, oral vancomycin, and IV metronidazole. After over a month of being hospitalized in the ICU, his Foley was removed. He was subsequently found to have urinary retention, so he was straight catheterized. The urine obtained from the straight catheterization was cloudy. A urinalysis showed 53 WBCs, positive nitrite, and many bacteria. Urine culture grew >100K ESBL‐producing Escherichia coli. He wasn't having fevers. He had no leukocytosis and no signs or symptoms attributable to a UTI. What is you diagnosis? What antibiotics would you start? |
All interviews were audio recorded, transcribed, and deidentified. All transcripts were reviewed by the study's research assistant (A.R.C.) for accuracy and completeness.
An ID physician (D.L.) reviewed each transcript to determine whether the participant's stated plan for each case vignette was in accordance with IDSA guidelines. Participants were evaluated on their decision to prescribe antibiotics and their choice of agents.
Transcripts were also analyzed using emergent thematic analysis.[27, 28, 29] First, 2 members of the research team (D.L., A.R.C.) reviewed all interview transcripts and discussed general impressions. Next, the analytic team reread one‐fifth of the transcripts, assigning codes to the data line by line. Codes were discussed among team members to determine the most prominent themes. During this phase, codes were added, eliminated, and combined while applying the codes to the remaining transcripts.[30] The analysts then performed focused coding: finalized codes from the first phase were applied to each transcript. The 2 analysts performed focused coding individually on each transcript in a consecutive fashion and met after every 10 transcripts to ensure consistency in their coding for the prior 10 transcripts. Analysts discussed any discrepancies to reach a consensus. Evidence was sought that may call observations and classifications into question.[31] Theoretical saturation was reached through the 30 interviews, so additional enrollment was deemed unnecessary. NVivo version 9 software (QSR International, Cambridge, MA) was used to facilitate all coding and analysis.
RESULTS
All participants were physicians who practiced inpatient medicine. Ten were women, and 20 were men. The median age of participants was 34 years (interquartile range [IQR] 3042). Twenty were attending or staff physicians and had spent a median of 10 years (IQR 315) in clinical practice. Of these attending physicians, 3 practiced pulmonary/critical care, 16 were hospitalists without subspecialty training, and 1 was a hospitalist with ID training. Seven attending physicians practiced exclusively at hospital A, 8 practiced exclusively at hospital B, and 5 practiced at both A and B. The remaining 10 participants were physicians in training or residents, who practiced at both hospitals and were either in their third or fourth year of an internal medicine or medicine/pediatrics residency program.
All participants expressed general awareness of and familiarity with clinical guidelines. Most participants also found guidelines useful in their clinical practice. According to a resident:
[Guidelines] give you a framework for what to do. If somebody questions what you are doing, it is easy to point to the guidelines (24, resident).
The guidelines tend to keep us up‐to‐date, because unless you're focused on 1 system, it can be impossible to keep up with everything that is changing across the board (28, attending).
Most of the guidelines are well‐researched and are approved by a lot of people, so I don't usually go against them (6, attending).
Despite general agreement with guidelines in principle, our interviews identified 3 major barriers to following guidelines in practice: (1) lack of awareness of specific guideline recommendations, (2) tension between adhering to guidelines and the desire to individualize patient care, and (3) skepticism of certain guideline recommendations.
Lack of Awareness of Specific Guideline Recommendations
Although participants stated that they agreed with guidelines in general, many had difficulty describing specific guideline recommendations. Two residents acknowledged that their attending physicians did not seem familiar with guidelines. In response to hearing a guideline recommendation on HAP, a resident stated: I'm learning from them [the guidelines] as we speak. In addition, an attending admitted that she was not familiar with the guidelines:
Now that you're asking about [prescribing] outside of the clinical guidelines, I am sitting here thinking, I can't think of any [guidelines]. In fact, I will say that I am probably not aware of all of the clinical guidelines or changes in them in recent years (28, attending).
| Category | Case Vignette | Illustrative Quotation |
|---|---|---|
| ||
| 1. Lack of awareness of specific guideline recommendations | SSTI | 1. [Treating for] methicillin susceptible [Staphylococcus aureus] without MRSA? Oh, oh, wow.[and] not doing any gram‐negative coverage? I guess I am most discomfortable with that, but if that's the guideline [recommendation], yes, I will probably start following it (8, attending). |
| ASB | 2. I still think that he has a UTI, even though he doesn't necessarily have symptoms, because he was catheterized for so long. I also know after you reach a certain age, we generally treat you even though you don't necessarily have symptoms just because of all the risks associated with having bacteria in your urine (29, resident). | |
| 2. Tension between adhering to guidelines and individualizing patient care | SSTI | 3. If he had a known history of MRSA, if he had something else likea temporary dialysis lineor prosthetic joint or something else that if he were to get bacteremic with MRSA, it would cause him more operations and significant morbidity. [In that case], I might add vancomycin to his regimen from the beginning (12, resident). |
| HAP | 4. He has only 1 lung because he had part of his lung taken out. So, anyway, part of a lung taken out, and he's got a new infiltrate on his x‐ray, and he's got all the risk factors for pneumonia, so I would say generally I would leave him on antibiotics, but cut down (5, attending). | |
| 5. I would be concerned, especially since the patient was febrile. He did have a new infiltrate, and he seemed to have gotten better on antibiotics. I would definitely take it [the guideline recommendation] into consideration, but I would probably go ahead and give a course of oral antibiotics (6, attending). | ||
| ASB | 6. I would say this is a UTI. I'm sure the guidelines are going to say no, but since he was having retention and it wasn't a urine [culture] obtained from him having a Foley, I have less comfort calling it colonization. I would say that it is probably an infection. You don't see a lot of fevers in just a bladder infection (25, attending). | |
| 3. Skepticism of guideline recommendations | SSTI | 7. My big concern is methicillin‐resistant S aureus [MRSA]. I think personally I have some concern about not covering for MRSA (17, attending). |
| HAP | 8. Those are the guidelines, so I mean it is agreeable if there are studies that back it up. It is not something I feel that great about, but I could trial them off antibiotics and see how they do (14, resident). | |
| 9. I guess I would have to look more at the studies that led to the recommendations. I don't know that I would stop antibiotics completely because of how sick he was (29, resident). | ||
| ASB | 10. They [the guidelines] are tough to swallow, but we follow them because that is what the evidence shows. A lot of people would be very, very tempted to treat this (19, attending). | |
| 11. A guy has a catheter in for a month and has a ton of white cells in his urine and is growing something that is clearly pathogenic: he needs treatment. I do not care what the guidelines say (7, attending). | ||
Tension Between Adhering to Guidelines and Individualizing Patient Care
Although participants agreed with guidelines in principle, they had difficulty applying specific guideline recommendations to an individual patient's care. Many participants acknowledged modifying these recommendations to better suit the needs of a specific patient:
So guidelines are guidelines, but at the end of the day, it still comes down to individualizing patient care, and so sometimes those guidelines do not cover all the bases, and you still need to do what you think is best for the patient (10, attending).
The guidelines are not examining the patient, and I am examining the patient. So I will do what the guidelines say unless I feel that that patient needs more care (11, resident).
Fine, the study says something, but your objective evidence about what happened [is different]. He had this fever, he had these radiologic changes that are suggestive of pneumonia, you start antibiotics, he gets better, so that clinical scenario suggests an infection that is getting better (15, resident).
[I would treat outside of guidelines] when we are treating severe sepsis in somebody with advanced liver disease. Most of the clinical research programsexclude patients with advanced liver disease if they have risks for certain types of infections that are unusual (16, attending).
If it's a patient who is intubated and sick, they can't complain [about urinary symptoms], so the asymptomatic part of that goes out the window. For critically ill patients on ventilators that have bacteriuria, particularly if it's an ESBL [extended‐spectrum ‐lactamase], which is a bad bacteria, not wanting the patient to get sicker and not knowing if they are having symptoms of pain or both, I might consider treating in that kind of situation, even though they are afebrile and no [elevated] white count (20, attending).
Skepticism of Guideline Recommendations
A third barrier to guideline adherence was physicians' skepticism of what the guidelines recommend in certain cases. This skepticism stemmed, in part, from guidelines promoting a standardized, one size fits all approach even in situations when participants were more comfortable using their own judgment:
To me, the guidelines are adding a little bit more of a stress, because the guidelines are good for the more obvious things; they're more black and white, this than that. But clinical medicine is never like that. There is always something that makes it really gray, and some of it has to do with things that you're seeing because you're there with the patient that doesn't quite fit (25, attending).
Overall, guidelines are easy to follow when they have what to do as opposed to what not to do. We are trained to do something and fix something, so to not do anything is probably the hardest guideline to follow (11, resident).
It is just scary that he is growing such a bad bug and with a bad microbe, I would be worried about it progressing (11, resident).
Another acknowledged she would have difficulty stopping all antibiotics after only 3 days of therapy:
It would make me a little nervous following them [the guidelines]. I think I would finish the course because he had a fever, and we started him on antibiotics and he got better. I still feel clinically that he could have had pneumonia (25, attending).
DISCUSSION
In this study, we used case vignettes to identify barriers to following IDSA guidelines. Case vignettes require few resources and provide a common starting point for assessing physician decision making. Prior studies have used case vignettes to measure the quality of physicians' practice, including antibiotic prescribing.[17, 18, 19, 20, 21] Case vignettes have been used to assess antibiotic prescribing in the neonatal ICU and medical students' knowledge of upper respiratory tract infections.[21, 32] In 1 study, physicians who scored poorly on a series of case vignettes more frequently prescribed antibiotics inappropriately in actual practice.[17]
Using case vignettes, we identified 3 barriers to following IDSA guidelines on SSTI, HAP, and ASB: (1) lack of awareness of specific guideline recommendations, (2) tension between adhering to guidelines and the desire to individualize patient care, and (3) skepticism of certain guideline recommendations. These barriers were distributed unevenly across participants, highlighting the heterogeneity that exists even within a subgroup of hospital medicine physicians.
We identified lack of familiarity with guideline recommendations as a barrier in our sample of physicians. Interestingly, participants initially expressed agreement with guidelines, but when presented with case vignettes and asked for their own treatment recommendations, it became clear that their familiarity with guidelines was superficial. The disconnect between self‐reported practice and actual adherence has also been described in a separate study on healthcare‐associated pneumonia.[33] In all likelihood, participants genuinely believed that they were practicing guideline‐concordant care, but without a formal process for audit and feedback, their lack of adherence had never been raised as an issue.
A second barrier to guideline‐concordant care was the tension between individualizing patient care and adhering to standardized recommendations. On one hand, this tension is unavoidable and is inherent in the practice of medicine. However, participants' responses to our case vignettes suggested that they find their patients too different to fit into any standardized guideline. This tension was also discussed by Charani et al., who interviewed 39 healthcare professionals at 4 hospitals in the United Kingdom. These investigators found that physicians routinely consider their patients to be outside the recommendations of local evidence‐based policies.[34] Instead of referring to guidelines, physicians rely on their knowledge and clinical experience to guide their antibiotic prescribing.
The final barrier to guideline adherence that we identified was providers' skepticism of what the guidelines were recommending. Although physician discomfort with certain guideline recommendations may be alleviated by reviewing the literature informing the recommendation, education alone is often insufficient to change antibiotic prescribing practices.[35] Furthermore, part of this skepticism may reflect the lack of data from randomized controlled trials to support every guideline recommendation. For example, most guideline recommendations are based on low‐quality evidence.[36] The guideline recommendations presented in this study were based on moderate‐ to high‐quality evidence.[24, 25, 26]
To our knowledge, this study is 1 of the few to describe barriers to guideline‐concordant antibiotic use among inpatient medicine physicians in the United States. The barriers discussed above have also been described by investigators in Europe who studied antibiotic use among inpatient physicians.[34, 37, 38] These commonalities highlight the shared challenges faced by local initiatives to improve antibiotic prescribing.
Our findings suggest that the 2 hospitals we studied need more active interventions to improve antibiotic prescribing. One attractive idea is involving hospitalist physicians in future improvement efforts. Hospitalists are well positioned for this role; they care for a large proportion of hospital patients, they frequently prescribe antibiotics, andas a professionthey are committed to the efficient use of healthcare resources. Hospitalists could assist in the dissemination of local guidelines, the implementation of reliable processes to prompt antibiotic de‐escalation, and the development of local standards for documenting the indication for antibiotics and the planned duration of therapy.[39]
One limitation of this study was that we did not validate whether a physician's self‐reported response to the case vignettes correlated with his or her actual practice. Interviews were conducted by a nonphysician and kept confidential, but participants may nonetheless have been inclined to give socially desirable responses. However, this is less likely because participants readily admitted to not knowing and often not following guidelines. In addition, our case vignettes presented simplistic, hypothetical situations and were therefore less able to account for all determinants of antibiotic‐prescribing decisions. Prior research has shown that antibiotic‐prescribing decisions are influenced by a multitude of factors, including social norms and the physician's underlying beliefs and emotions.[34, 40] Antibiotic‐prescribing decisions can also be influenced by audit and feedback processes.[35] Thus, we acknowledge that our findings may have been different if this study was conducted exclusively at hospitals without an antimicrobial stewardship program.
In conclusion, case vignettes may be a useful tool to assess physician knowledge and acceptance of antibiotic‐prescribing guidelines on a local level. This study used case vignettes to identify key barriers to guideline‐concordant antibiotic use. Developing local interventions to target each of these barriers will be the next step in improving antibiotic prescribing.
Disclosure: This project was supported by a Project Development Team within the ICTSI NIH/NCRR grant number UL1TR001108. The authors report no conflicts of interest.
- , , , , . Variation in adherence with Global Initiative for Chronic Obstructive Lung Disease (GOLD) drug therapy guidelines: a retrospective actuarial claims data analysis. Curr Med Res Opin. 2011;27:1425–1429.
- , , , , . Guideline adherence in management of stable chronic obstructive pulmonary disease. Respir Med. 2013;107:1046–1052.
- , , , et al. Guideline‐concordant management of opioid therapy among human immunodeficiency virus (HIV)‐infected and uninfected veterans. J Pain. 2014;15:1130–1140.
- , , , et al. Primary care clinician adherence to guidelines for the management of chronic musculoskeletal pain: results from the study of the effectiveness of a collaborative approach to pain. Pain Med. 2011;12:1490–1501.
- , , , , . Receiving guideline‐concordant pharmacotherapy for major depression: impact on ambulatory and inpatient health service use. Can J Psychiatry. 2007;52:191–200.
- , , , , , . Guideline‐concordant antidepressant use among patients with major depressive disorder. Gen Hosp Psychiatry. 2010;32:360–367.
- , . Antibiotic prescribing to adults with sore throat in the United States, 1997–2010. JAMA Intern Med. 2014;174:138–140.
- , , , . National trends in visit rates and antibiotic prescribing for adults with acute sinusitis. Arch Intern Med. 2012;172:1513–1514.
- , , . Geographic variation in outpatient antibiotic prescribing among older adults. Arch Intern Med. 2012;172:1465–1471.
- , , , et al. Decreased antibiotic utilization after implementation of a guideline for inpatient cellulitis and cutaneous abscess. Arch Intern Med. 2011;171:1072–1079.
- , , , , , . Skin and soft‐tissue infections requiring hospitalization at an academic medical center: opportunities for antimicrobial stewardship. Clin Infect Dis. 2010;51:895–903.
- , , , , , . Inappropriate treatment of catheter‐associated asymptomatic bacteriuria in a tertiary care hospital. Clin Infect Dis. 2009;48:1182–1188.
- . Asymptomatic bacteriuria: when the treatment is worse than the disease. Nat Rev Urol. 2012;9:85–93.
- , , , et al. Improving outcomes in elderly patients with community‐acquired pneumonia by adhering to national guidelines: Community‐Acquired Pneumonia Organization International cohort study results. Arch Intern Med. 2009;169:1515–1524.
- , , , et al. Effectiveness of an Antimicrobial Stewardship Approach for Urinary Catheter‐Associated Asymptomatic Bacteriuria. JAMA Intern Med. 2015;175:1120–1127.
- , , , , . Effect of antibiotic prescribing in primary care on antimicrobial resistance in individual patients: systematic review and meta‐analysis. BMJ. 2010;340:c2096.
- , , , et al. Do case vignettes accurately reflect antibiotic prescription? Infect Control Hosp Epidemiol. 2011;32:1003–1009.
- , , , et al. Antibiotic use: knowledge and perceptions in two university hospitals. J Antimicrob Chemother. 2011;66:936–940.
- , , , , . Comparison of vignettes, standardized patients, and chart abstraction: a prospective validation study of 3 methods for measuring quality. JAMA. 2000;283:1715–1722.
- , , , et al. Measuring the quality of physician practice by using clinical vignettes: a prospective validation study. Ann Intern Med. 2004;141:771–780.
- , , , et al. Clinical vignettes provide an understanding of antibiotic prescribing practices in neonatal intensive care units. Infect Control Hosp Epidemiol. 2011;32:597–602.
- . Sampling in qualitative inquiry. In: Crabtree BF, Miller WL, eds. Doing Qualitative Research. Thousand Oaks, CA: Sage; 1999:33–45.
- , , , , . Factors influencing antibiotic‐prescribing decisions among inpatient physicians: a qualitative investigation. Infect Control Hosp Epidemiol. 2015;36(9):1065–1072.
- , , , et al. Practice guidelines for the diagnosis and management of skin and soft tissue infections: 2014 update by the Infectious Diseases Society of America. Clin Infect Dis. 2014;59:e10–e52.
- American Thoracic Society and the Infectious Disease Society of North America. The new American Thoracic Society/Infectious Disease Society of North America guidelines for the management of hospital‐acquired, ventilator‐associated and healthcare‐associated pneumonia: a current view and new complementary information. Curr Opin Crit Care. 2006;12:444–445.
- , , , et al. Infectious Diseases Society of America guidelines for the diagnosis and treatment of asymptomatic bacteriuria in adults. Clin Infect Dis. 2005;40:643–654.
- , . The dance of interpretation. In: Crabtree BF, Miller WL, eds. Doing Qualitative Research. Thousand Oaks, CA: Sage; 1999:127–143.
- , . Qualitative Data Analysis. Thousand Oaks, CA: Sage; 1994.
- . Research Methods in Anthropology: Qualitative and Quantitative Approaches. Walnut Creek, CA: AltaMira; 2002.
- . Constructing Grounded Theory: A Practical Guide Through Qualitative Analysis. Thousand Oaks, CA: Sage; 2006.
- , . The Discovery of Grounded Theory: Strategies for Qualitative Research. Hawthorne, NY: Aldine de Gruyter; 1967.
- , , . Knowledge of the principles of judicious antibiotic use for upper respiratory infections: a survey of senior medical students. South Med J. 2005;98:889–895.
- , , , et al. The HCAP gap: differences between self‐reported practice patterns and published guidelines for health care‐associated pneumonia. Clin Infect Dis. 2009;49:1868–1874.
- , , , et al. Understanding the determinants of antimicrobial prescribing within hospitals: the role of “prescribing etiquette”. Clin Infect Dis. 2013;57:188–196.
- , , , et al. Infectious Diseases Society of America and the Society for Healthcare Epidemiology of America guidelines for developing an institutional program to enhance antimicrobial stewardship. Clin Infect Dis. 2007;44:159–177.
- , , , , . Quality and strength of evidence of the Infectious Diseases Society of America clinical practice guidelines. Clin Infect Dis. 2010;51:1147–1156.
- , , , , . Opposing expectations and suboptimal use of a local antibiotic hospital guideline: a qualitative study. J Antimicrob Chemother. 2008;62:189–195.
- , , , , , . Barriers to optimal antibiotic use for community‐acquired pneumonia at hospitals: a qualitative study. Qual Saf Health Care. 2007;16:143–149.
- , , . Role of the hospitalist in antimicrobial stewardship: a review of work completed and description of a multisite collaborative. Clin Ther. 2013;35:751–757.
- , , , et al. Behavior change strategies to influence antimicrobial prescribing in acute care: a systematic review. Clin Infect Dis. 2011;53:651–662.
Clinical guidelines are prevalent in the field of medicine, but physicians do not consistently provide guideline‐concordant care. Nonadherence to guidelines has been documented for a variety of clinical conditions, including chronic obstructive pulmonary disease,[1, 2] pain management,[3, 4] and major depressive disorder.[5, 6]
Although several professional societies, including the Infectious Diseases Society of America (IDSA), have developed and disseminated guidelines on antibiotic use, adherence to antibiotic‐prescribing guidelines is inconsistent. Several studies have documented inappropriate antibiotic prescribing for specific infections, including acute respiratory infections,[7, 8, 9] cellulitis,[10, 11] and asymptomatic bacteriuria.[12, 13]
Improving adherence to guidelines on antibiotic use could have several benefits. For certain infections, guideline adherence has been shown to improve patient outcomes and reduce resource utilization.[10, 14, 15] In general, guidelines promote more judicious use of antibiotics by clarifying when an antibiotic is indicated, which antibiotics to prescribe, and duration of antibiotic therapy. The more judicious use of antibiotics decreases a given patient's risk of developing an antibiotic‐resistant infection and Clostridium difficileassociated diarrhea.[16] Judicious antibiotic use will also have societal benefits by slowing the spread of antibiotic‐resistant bacteria.
As part of a local effort to improve antibiotic use, we decided to present physicians with hypothetical cases of common clinical scenarios to identify barriers to following antibiotic‐prescribing guidelines. Previous investigators have used case vignettes to assess the quality of care physicians provide, including decisions about antibiotics.[17, 18, 19, 20, 21] We used case vignettes to assess physicians' familiarity with and acceptance of IDSA guidelines for 3 common infectious conditions: skin and soft tissue infections (SSTI), suspected hospital‐acquired pneumonia (HAP), and asymptomatic bacteriuria (ASB). The findings from our project were intended to inform local interventions to improve antibiotic prescribing.
METHODS
All interviews were conducted at 2 acute care hospitals in Indianapolis, Indiana: Sidney and Lois Eskenazi Hospital and the Richard Roudebush Veterans Affairs Medical Center (VAMC). Eskenazi Hospital is a 316‐bed safety‐net hospital for Marion County, Indiana. The Roudebush VAMC is a 209‐bed tertiary care facility that provides comprehensive medical care for 85,000 veterans. Both hospitals are academically affiliated with Indiana University's School of Medicine.
Both hospitals have empiric antibiotic‐prescribing guidelines printed in their annual antibiograms. These guidelines, developed by each hospital's pharmacy department and the local infectious disease (ID) physicians, are distributed annually as a pocket booklet. During this study, an antibiotic stewardship program was active at hospital A but not hospital B. As part of this program at hospital A, an ID physician reviewed inpatients on antibiotics twice a week and, with the help of inpatient team pharmacists, provided feedback to the frontline prescribers.
For this study, inpatient physicians who prescribe antibiotics at either facility were invited to participate in a 30‐minute confidential interview about their antibiotic‐prescribing habits. All invitations were sent through electronic mail. The target enrollment was 30 physicians, which is consistent with prior literature on qualitative sampling.[22] Sampling was purposeful to recruit a heterogeneous group of participants from both hospital sites. Although such a sampling strategy precluded us from making conclusions about individual subgroups, our intention was to obtain the broadest range of information and perspectives, thereby challenging our own preconceived understandings and biases.
The protocol and conduct of this study were reviewed and approved by the Indiana University Institutional Review Board. Participants read and provided signed informed consent. No compensation was provided to physician participants.
A research assistant (A.R.C.) trained in qualitative interviewing conducted all interviews.[23] These interviews covered social norms, perceptions of risk, self‐efficacy, knowledge, and acceptance of guidelines. At the end of the interview, each participant was asked to respond to 3 case vignettes (Table 1), which had been developed by an ID physician (D.L.) based on both local and IDSA guidelines.[24, 25, 26] Participants decided whether to prescribe antibiotics and, if so, which antibiotic to use. After their response, the interviewer read aloud specific recommendations from IDSA guidelines and asked, Would you feel comfortable applying this recommendation to your practice? Are there situations when you would not apply this recommendation?
|
| 1. A 40‐year‐old man with poorly controlled type 2 diabetes develops pain and redness over the dorsum of his foot. He presents to the emergency room the day after these symptoms started. He denies any recent penetrating injuries to his foot, including no animal bites, and denies any water exposure. At the time of presentation, his temperature is 101.1F, pulse 89, his blood pressure is 124/76, and his respiratory rate is 16. Tender edema, warmth, and erythema extend up to the pretibial area of his right lower leg. Fissures are present between his toes, but he has no foot ulcers. There are no blisters or purulence. When you palpate, you don't feel any crepitus or fluctuance. He has a strong pulse at both dorsal pedis and posterior tibial arteries. Labs reveal a normal WBC count. What is your diagnosis? What antibiotics would you start? |
| 2. A 72‐year‐old man is admitted for a lobectomy. About 6 days after his operation, while still on mechanical ventilation, he develops findings suggestive of pneumonia, based on a new right lower lobe infiltrate on chest x‐ray, increased secretions, and fever (101.1F). A blood sample and an endotracheal aspirate are sent for culture. He is empirically started on vancomycin and piperacillin/tazobactam. After 3 days of empiric antibiotics, he has had no additional fevers and has been extubated to room air. His WBC count has normalized. Blood cultures show no growth. The respiratory sample shows >25 PMNs and <10 epithelial cells; no organisms are seen on Gram stain, and there is no growth on culture. Would you make any changes to his antibiotic regimen at this time? If so, how would you justify the change? |
| 3. A 72‐year‐old man presented with a severe Clostridium difficile infection, which resulted in both respiratory and acute renal failure. He gradually improved with supportive care, oral vancomycin, and IV metronidazole. After over a month of being hospitalized in the ICU, his Foley was removed. He was subsequently found to have urinary retention, so he was straight catheterized. The urine obtained from the straight catheterization was cloudy. A urinalysis showed 53 WBCs, positive nitrite, and many bacteria. Urine culture grew >100K ESBL‐producing Escherichia coli. He wasn't having fevers. He had no leukocytosis and no signs or symptoms attributable to a UTI. What is you diagnosis? What antibiotics would you start? |
All interviews were audio recorded, transcribed, and deidentified. All transcripts were reviewed by the study's research assistant (A.R.C.) for accuracy and completeness.
An ID physician (D.L.) reviewed each transcript to determine whether the participant's stated plan for each case vignette was in accordance with IDSA guidelines. Participants were evaluated on their decision to prescribe antibiotics and their choice of agents.
Transcripts were also analyzed using emergent thematic analysis.[27, 28, 29] First, 2 members of the research team (D.L., A.R.C.) reviewed all interview transcripts and discussed general impressions. Next, the analytic team reread one‐fifth of the transcripts, assigning codes to the data line by line. Codes were discussed among team members to determine the most prominent themes. During this phase, codes were added, eliminated, and combined while applying the codes to the remaining transcripts.[30] The analysts then performed focused coding: finalized codes from the first phase were applied to each transcript. The 2 analysts performed focused coding individually on each transcript in a consecutive fashion and met after every 10 transcripts to ensure consistency in their coding for the prior 10 transcripts. Analysts discussed any discrepancies to reach a consensus. Evidence was sought that may call observations and classifications into question.[31] Theoretical saturation was reached through the 30 interviews, so additional enrollment was deemed unnecessary. NVivo version 9 software (QSR International, Cambridge, MA) was used to facilitate all coding and analysis.
RESULTS
All participants were physicians who practiced inpatient medicine. Ten were women, and 20 were men. The median age of participants was 34 years (interquartile range [IQR] 3042). Twenty were attending or staff physicians and had spent a median of 10 years (IQR 315) in clinical practice. Of these attending physicians, 3 practiced pulmonary/critical care, 16 were hospitalists without subspecialty training, and 1 was a hospitalist with ID training. Seven attending physicians practiced exclusively at hospital A, 8 practiced exclusively at hospital B, and 5 practiced at both A and B. The remaining 10 participants were physicians in training or residents, who practiced at both hospitals and were either in their third or fourth year of an internal medicine or medicine/pediatrics residency program.
All participants expressed general awareness of and familiarity with clinical guidelines. Most participants also found guidelines useful in their clinical practice. According to a resident:
[Guidelines] give you a framework for what to do. If somebody questions what you are doing, it is easy to point to the guidelines (24, resident).
The guidelines tend to keep us up‐to‐date, because unless you're focused on 1 system, it can be impossible to keep up with everything that is changing across the board (28, attending).
Most of the guidelines are well‐researched and are approved by a lot of people, so I don't usually go against them (6, attending).
Despite general agreement with guidelines in principle, our interviews identified 3 major barriers to following guidelines in practice: (1) lack of awareness of specific guideline recommendations, (2) tension between adhering to guidelines and the desire to individualize patient care, and (3) skepticism of certain guideline recommendations.
Lack of Awareness of Specific Guideline Recommendations
Although participants stated that they agreed with guidelines in general, many had difficulty describing specific guideline recommendations. Two residents acknowledged that their attending physicians did not seem familiar with guidelines. In response to hearing a guideline recommendation on HAP, a resident stated: I'm learning from them [the guidelines] as we speak. In addition, an attending admitted that she was not familiar with the guidelines:
Now that you're asking about [prescribing] outside of the clinical guidelines, I am sitting here thinking, I can't think of any [guidelines]. In fact, I will say that I am probably not aware of all of the clinical guidelines or changes in them in recent years (28, attending).
| Category | Case Vignette | Illustrative Quotation |
|---|---|---|
| ||
| 1. Lack of awareness of specific guideline recommendations | SSTI | 1. [Treating for] methicillin susceptible [Staphylococcus aureus] without MRSA? Oh, oh, wow.[and] not doing any gram‐negative coverage? I guess I am most discomfortable with that, but if that's the guideline [recommendation], yes, I will probably start following it (8, attending). |
| ASB | 2. I still think that he has a UTI, even though he doesn't necessarily have symptoms, because he was catheterized for so long. I also know after you reach a certain age, we generally treat you even though you don't necessarily have symptoms just because of all the risks associated with having bacteria in your urine (29, resident). | |
| 2. Tension between adhering to guidelines and individualizing patient care | SSTI | 3. If he had a known history of MRSA, if he had something else likea temporary dialysis lineor prosthetic joint or something else that if he were to get bacteremic with MRSA, it would cause him more operations and significant morbidity. [In that case], I might add vancomycin to his regimen from the beginning (12, resident). |
| HAP | 4. He has only 1 lung because he had part of his lung taken out. So, anyway, part of a lung taken out, and he's got a new infiltrate on his x‐ray, and he's got all the risk factors for pneumonia, so I would say generally I would leave him on antibiotics, but cut down (5, attending). | |
| 5. I would be concerned, especially since the patient was febrile. He did have a new infiltrate, and he seemed to have gotten better on antibiotics. I would definitely take it [the guideline recommendation] into consideration, but I would probably go ahead and give a course of oral antibiotics (6, attending). | ||
| ASB | 6. I would say this is a UTI. I'm sure the guidelines are going to say no, but since he was having retention and it wasn't a urine [culture] obtained from him having a Foley, I have less comfort calling it colonization. I would say that it is probably an infection. You don't see a lot of fevers in just a bladder infection (25, attending). | |
| 3. Skepticism of guideline recommendations | SSTI | 7. My big concern is methicillin‐resistant S aureus [MRSA]. I think personally I have some concern about not covering for MRSA (17, attending). |
| HAP | 8. Those are the guidelines, so I mean it is agreeable if there are studies that back it up. It is not something I feel that great about, but I could trial them off antibiotics and see how they do (14, resident). | |
| 9. I guess I would have to look more at the studies that led to the recommendations. I don't know that I would stop antibiotics completely because of how sick he was (29, resident). | ||
| ASB | 10. They [the guidelines] are tough to swallow, but we follow them because that is what the evidence shows. A lot of people would be very, very tempted to treat this (19, attending). | |
| 11. A guy has a catheter in for a month and has a ton of white cells in his urine and is growing something that is clearly pathogenic: he needs treatment. I do not care what the guidelines say (7, attending). | ||
Tension Between Adhering to Guidelines and Individualizing Patient Care
Although participants agreed with guidelines in principle, they had difficulty applying specific guideline recommendations to an individual patient's care. Many participants acknowledged modifying these recommendations to better suit the needs of a specific patient:
So guidelines are guidelines, but at the end of the day, it still comes down to individualizing patient care, and so sometimes those guidelines do not cover all the bases, and you still need to do what you think is best for the patient (10, attending).
The guidelines are not examining the patient, and I am examining the patient. So I will do what the guidelines say unless I feel that that patient needs more care (11, resident).
Fine, the study says something, but your objective evidence about what happened [is different]. He had this fever, he had these radiologic changes that are suggestive of pneumonia, you start antibiotics, he gets better, so that clinical scenario suggests an infection that is getting better (15, resident).
[I would treat outside of guidelines] when we are treating severe sepsis in somebody with advanced liver disease. Most of the clinical research programsexclude patients with advanced liver disease if they have risks for certain types of infections that are unusual (16, attending).
If it's a patient who is intubated and sick, they can't complain [about urinary symptoms], so the asymptomatic part of that goes out the window. For critically ill patients on ventilators that have bacteriuria, particularly if it's an ESBL [extended‐spectrum ‐lactamase], which is a bad bacteria, not wanting the patient to get sicker and not knowing if they are having symptoms of pain or both, I might consider treating in that kind of situation, even though they are afebrile and no [elevated] white count (20, attending).
Skepticism of Guideline Recommendations
A third barrier to guideline adherence was physicians' skepticism of what the guidelines recommend in certain cases. This skepticism stemmed, in part, from guidelines promoting a standardized, one size fits all approach even in situations when participants were more comfortable using their own judgment:
To me, the guidelines are adding a little bit more of a stress, because the guidelines are good for the more obvious things; they're more black and white, this than that. But clinical medicine is never like that. There is always something that makes it really gray, and some of it has to do with things that you're seeing because you're there with the patient that doesn't quite fit (25, attending).
Overall, guidelines are easy to follow when they have what to do as opposed to what not to do. We are trained to do something and fix something, so to not do anything is probably the hardest guideline to follow (11, resident).
It is just scary that he is growing such a bad bug and with a bad microbe, I would be worried about it progressing (11, resident).
Another acknowledged she would have difficulty stopping all antibiotics after only 3 days of therapy:
It would make me a little nervous following them [the guidelines]. I think I would finish the course because he had a fever, and we started him on antibiotics and he got better. I still feel clinically that he could have had pneumonia (25, attending).
DISCUSSION
In this study, we used case vignettes to identify barriers to following IDSA guidelines. Case vignettes require few resources and provide a common starting point for assessing physician decision making. Prior studies have used case vignettes to measure the quality of physicians' practice, including antibiotic prescribing.[17, 18, 19, 20, 21] Case vignettes have been used to assess antibiotic prescribing in the neonatal ICU and medical students' knowledge of upper respiratory tract infections.[21, 32] In 1 study, physicians who scored poorly on a series of case vignettes more frequently prescribed antibiotics inappropriately in actual practice.[17]
Using case vignettes, we identified 3 barriers to following IDSA guidelines on SSTI, HAP, and ASB: (1) lack of awareness of specific guideline recommendations, (2) tension between adhering to guidelines and the desire to individualize patient care, and (3) skepticism of certain guideline recommendations. These barriers were distributed unevenly across participants, highlighting the heterogeneity that exists even within a subgroup of hospital medicine physicians.
We identified lack of familiarity with guideline recommendations as a barrier in our sample of physicians. Interestingly, participants initially expressed agreement with guidelines, but when presented with case vignettes and asked for their own treatment recommendations, it became clear that their familiarity with guidelines was superficial. The disconnect between self‐reported practice and actual adherence has also been described in a separate study on healthcare‐associated pneumonia.[33] In all likelihood, participants genuinely believed that they were practicing guideline‐concordant care, but without a formal process for audit and feedback, their lack of adherence had never been raised as an issue.
A second barrier to guideline‐concordant care was the tension between individualizing patient care and adhering to standardized recommendations. On one hand, this tension is unavoidable and is inherent in the practice of medicine. However, participants' responses to our case vignettes suggested that they find their patients too different to fit into any standardized guideline. This tension was also discussed by Charani et al., who interviewed 39 healthcare professionals at 4 hospitals in the United Kingdom. These investigators found that physicians routinely consider their patients to be outside the recommendations of local evidence‐based policies.[34] Instead of referring to guidelines, physicians rely on their knowledge and clinical experience to guide their antibiotic prescribing.
The final barrier to guideline adherence that we identified was providers' skepticism of what the guidelines were recommending. Although physician discomfort with certain guideline recommendations may be alleviated by reviewing the literature informing the recommendation, education alone is often insufficient to change antibiotic prescribing practices.[35] Furthermore, part of this skepticism may reflect the lack of data from randomized controlled trials to support every guideline recommendation. For example, most guideline recommendations are based on low‐quality evidence.[36] The guideline recommendations presented in this study were based on moderate‐ to high‐quality evidence.[24, 25, 26]
To our knowledge, this study is 1 of the few to describe barriers to guideline‐concordant antibiotic use among inpatient medicine physicians in the United States. The barriers discussed above have also been described by investigators in Europe who studied antibiotic use among inpatient physicians.[34, 37, 38] These commonalities highlight the shared challenges faced by local initiatives to improve antibiotic prescribing.
Our findings suggest that the 2 hospitals we studied need more active interventions to improve antibiotic prescribing. One attractive idea is involving hospitalist physicians in future improvement efforts. Hospitalists are well positioned for this role; they care for a large proportion of hospital patients, they frequently prescribe antibiotics, andas a professionthey are committed to the efficient use of healthcare resources. Hospitalists could assist in the dissemination of local guidelines, the implementation of reliable processes to prompt antibiotic de‐escalation, and the development of local standards for documenting the indication for antibiotics and the planned duration of therapy.[39]
One limitation of this study was that we did not validate whether a physician's self‐reported response to the case vignettes correlated with his or her actual practice. Interviews were conducted by a nonphysician and kept confidential, but participants may nonetheless have been inclined to give socially desirable responses. However, this is less likely because participants readily admitted to not knowing and often not following guidelines. In addition, our case vignettes presented simplistic, hypothetical situations and were therefore less able to account for all determinants of antibiotic‐prescribing decisions. Prior research has shown that antibiotic‐prescribing decisions are influenced by a multitude of factors, including social norms and the physician's underlying beliefs and emotions.[34, 40] Antibiotic‐prescribing decisions can also be influenced by audit and feedback processes.[35] Thus, we acknowledge that our findings may have been different if this study was conducted exclusively at hospitals without an antimicrobial stewardship program.
In conclusion, case vignettes may be a useful tool to assess physician knowledge and acceptance of antibiotic‐prescribing guidelines on a local level. This study used case vignettes to identify key barriers to guideline‐concordant antibiotic use. Developing local interventions to target each of these barriers will be the next step in improving antibiotic prescribing.
Disclosure: This project was supported by a Project Development Team within the ICTSI NIH/NCRR grant number UL1TR001108. The authors report no conflicts of interest.
- , , , , . Variation in adherence with Global Initiative for Chronic Obstructive Lung Disease (GOLD) drug therapy guidelines: a retrospective actuarial claims data analysis. Curr Med Res Opin. 2011;27:1425–1429.
- , , , , . Guideline adherence in management of stable chronic obstructive pulmonary disease. Respir Med. 2013;107:1046–1052.
- , , , et al. Guideline‐concordant management of opioid therapy among human immunodeficiency virus (HIV)‐infected and uninfected veterans. J Pain. 2014;15:1130–1140.
- , , , et al. Primary care clinician adherence to guidelines for the management of chronic musculoskeletal pain: results from the study of the effectiveness of a collaborative approach to pain. Pain Med. 2011;12:1490–1501.
- , , , , . Receiving guideline‐concordant pharmacotherapy for major depression: impact on ambulatory and inpatient health service use. Can J Psychiatry. 2007;52:191–200.
- , , , , , . Guideline‐concordant antidepressant use among patients with major depressive disorder. Gen Hosp Psychiatry. 2010;32:360–367.
- , . Antibiotic prescribing to adults with sore throat in the United States, 1997–2010. JAMA Intern Med. 2014;174:138–140.
- , , , . National trends in visit rates and antibiotic prescribing for adults with acute sinusitis. Arch Intern Med. 2012;172:1513–1514.
- , , . Geographic variation in outpatient antibiotic prescribing among older adults. Arch Intern Med. 2012;172:1465–1471.
- , , , et al. Decreased antibiotic utilization after implementation of a guideline for inpatient cellulitis and cutaneous abscess. Arch Intern Med. 2011;171:1072–1079.
- , , , , , . Skin and soft‐tissue infections requiring hospitalization at an academic medical center: opportunities for antimicrobial stewardship. Clin Infect Dis. 2010;51:895–903.
- , , , , , . Inappropriate treatment of catheter‐associated asymptomatic bacteriuria in a tertiary care hospital. Clin Infect Dis. 2009;48:1182–1188.
- . Asymptomatic bacteriuria: when the treatment is worse than the disease. Nat Rev Urol. 2012;9:85–93.
- , , , et al. Improving outcomes in elderly patients with community‐acquired pneumonia by adhering to national guidelines: Community‐Acquired Pneumonia Organization International cohort study results. Arch Intern Med. 2009;169:1515–1524.
- , , , et al. Effectiveness of an Antimicrobial Stewardship Approach for Urinary Catheter‐Associated Asymptomatic Bacteriuria. JAMA Intern Med. 2015;175:1120–1127.
- , , , , . Effect of antibiotic prescribing in primary care on antimicrobial resistance in individual patients: systematic review and meta‐analysis. BMJ. 2010;340:c2096.
- , , , et al. Do case vignettes accurately reflect antibiotic prescription? Infect Control Hosp Epidemiol. 2011;32:1003–1009.
- , , , et al. Antibiotic use: knowledge and perceptions in two university hospitals. J Antimicrob Chemother. 2011;66:936–940.
- , , , , . Comparison of vignettes, standardized patients, and chart abstraction: a prospective validation study of 3 methods for measuring quality. JAMA. 2000;283:1715–1722.
- , , , et al. Measuring the quality of physician practice by using clinical vignettes: a prospective validation study. Ann Intern Med. 2004;141:771–780.
- , , , et al. Clinical vignettes provide an understanding of antibiotic prescribing practices in neonatal intensive care units. Infect Control Hosp Epidemiol. 2011;32:597–602.
- . Sampling in qualitative inquiry. In: Crabtree BF, Miller WL, eds. Doing Qualitative Research. Thousand Oaks, CA: Sage; 1999:33–45.
- , , , , . Factors influencing antibiotic‐prescribing decisions among inpatient physicians: a qualitative investigation. Infect Control Hosp Epidemiol. 2015;36(9):1065–1072.
- , , , et al. Practice guidelines for the diagnosis and management of skin and soft tissue infections: 2014 update by the Infectious Diseases Society of America. Clin Infect Dis. 2014;59:e10–e52.
- American Thoracic Society and the Infectious Disease Society of North America. The new American Thoracic Society/Infectious Disease Society of North America guidelines for the management of hospital‐acquired, ventilator‐associated and healthcare‐associated pneumonia: a current view and new complementary information. Curr Opin Crit Care. 2006;12:444–445.
- , , , et al. Infectious Diseases Society of America guidelines for the diagnosis and treatment of asymptomatic bacteriuria in adults. Clin Infect Dis. 2005;40:643–654.
- , . The dance of interpretation. In: Crabtree BF, Miller WL, eds. Doing Qualitative Research. Thousand Oaks, CA: Sage; 1999:127–143.
- , . Qualitative Data Analysis. Thousand Oaks, CA: Sage; 1994.
- . Research Methods in Anthropology: Qualitative and Quantitative Approaches. Walnut Creek, CA: AltaMira; 2002.
- . Constructing Grounded Theory: A Practical Guide Through Qualitative Analysis. Thousand Oaks, CA: Sage; 2006.
- , . The Discovery of Grounded Theory: Strategies for Qualitative Research. Hawthorne, NY: Aldine de Gruyter; 1967.
- , , . Knowledge of the principles of judicious antibiotic use for upper respiratory infections: a survey of senior medical students. South Med J. 2005;98:889–895.
- , , , et al. The HCAP gap: differences between self‐reported practice patterns and published guidelines for health care‐associated pneumonia. Clin Infect Dis. 2009;49:1868–1874.
- , , , et al. Understanding the determinants of antimicrobial prescribing within hospitals: the role of “prescribing etiquette”. Clin Infect Dis. 2013;57:188–196.
- , , , et al. Infectious Diseases Society of America and the Society for Healthcare Epidemiology of America guidelines for developing an institutional program to enhance antimicrobial stewardship. Clin Infect Dis. 2007;44:159–177.
- , , , , . Quality and strength of evidence of the Infectious Diseases Society of America clinical practice guidelines. Clin Infect Dis. 2010;51:1147–1156.
- , , , , . Opposing expectations and suboptimal use of a local antibiotic hospital guideline: a qualitative study. J Antimicrob Chemother. 2008;62:189–195.
- , , , , , . Barriers to optimal antibiotic use for community‐acquired pneumonia at hospitals: a qualitative study. Qual Saf Health Care. 2007;16:143–149.
- , , . Role of the hospitalist in antimicrobial stewardship: a review of work completed and description of a multisite collaborative. Clin Ther. 2013;35:751–757.
- , , , et al. Behavior change strategies to influence antimicrobial prescribing in acute care: a systematic review. Clin Infect Dis. 2011;53:651–662.
© 2015 Society of Hospital Medicine