User login
Mental Status to Predict Mortality
Altered mental status (AMS), characterized by abnormal changes in a patient's arousal and/or cognition, is a significant predictor of hospital mortality.[1, 2, 3] Yet despite its prevalence[3, 4, 5] and importance, up to three‐quarters of AMS events go unrecognized by caregivers.[6, 7, 8] Acute changes in mental status, often caused by delirium in the hospitalized patient,[3] can present nonspecifically, making it difficult to detect and distinguish from other diagnoses such as depression or dementia.[7, 9] Further complicating the recognition of AMS, numerous and imprecise qualitative descriptors such as confused and alert and oriented are used in clinical practice to describe the mental status of patients.[10] Thus, more objective measures may result in improved detection of altered mental status and in earlier diagnostic and therapeutic interventions.
In critically ill patients, several scales have been widely adopted for quantifying mental status. The Richmond Agitation and Sedation Scale (RASS) was created to optimize sedation.[11] The Glasgow Coma Scale (GCS) was developed for head‐trauma patients[12] and is now a standardized assessment tool in intensive care units,[13] the emergency department,[14] and the prehospital setting.[15] In addition, a simplified scale, AVPU (Alert, responsive to Verbal stimuli, responsive to Painful stimuli, and Unresponsive) was initially used in the primary survey of trauma patients[16] but is now a common component of early‐warning scores and rapid response activation criteria, such as the Modified Early Warning Score (MEWS).[17, 18] In fact, in a systematic review of 72 distinct early‐warning scores, 89% of the scores used AVPU as the measure of mentation.[17] However, the utility of these 3 scales is not well established in the general‐ward setting. Our aim was therefore to compare the accuracies of AVPU, GCS, and RASS for predicting mortality in hospitalized general‐ward patients to provide insight into the accuracy of these different scores for clinical deterioration.
METHODS
Study Setting and Protocol
We conducted an observational cohort study of consecutive adult general‐ward admissions from July 2011 through January 2013 at a 500‐bed, urban US teaching hospital. During the study period, no early‐warning scoring systems were in place on the hospital wards. Rapid response teams responding to altered mental status would do so without specific thresholds for activation. During this period, nurses on the general floors were expected to record each patient's GCS and RASS score in the electronic health record (EPIC Systems Corp., Verona, WI) as part of the routine patient assessment at least once every 12‐hour shift. AVPU assessments were extracted from the eye component of the GCS. The letter A was assigned to a GCS Eye score of 4 (opens eyes spontaneously), V to a score of 3 (opens eyes in response to voice), P to a score of 2 (opens eyes in response to painful stimuli), and U to a score of 1 (does not open eyes). To avoid comparison of mental‐status scores at different time points, only concurrent GCS and RASS scores, documented within 10 minutes of one another, were included in the analysis.
Location and time‐stamped GCS and RASS scores, demographics, and in‐hospital mortality data were obtained from the hospital's Clinical Research Data Warehouse, which is maintained by the Center for Research Informatics at The University of Chicago. The study protocol and data‐collection mechanisms were approved by The University of Chicago Institutional Review Board (#16995A).
Statistical Analysis
Baseline admission characteristics were described using proportions (%) and measures of central tendency (mean, standard deviations [SD]; median, interquartile ranges [IQR]). Patient severity of illness at first ward observation was calculated using the MEWS.[19] All mental‐status observations during a patient's ward stay were included in the analysis. Odds ratios for 24‐hour mortality following an abnormal mental‐status score were calculated using generalized estimating equations, with an exchangeable correlation structure to account for the correlation of scores within the same patient, as more than 1 abnormal mental‐status score may have been documented within the 24 hours preceding death. Spearman's rank correlation coefficients () were used to estimate the correlation among AVPU, GCS, and RASS scores.
The predictive accuracies of AVPU, GCS, RASS, and the subscales of GCS were compared using the area under the receiver operating characteristic curve (AUC), with mortality within 24 hours of a mental‐status observation as the primary outcome and the mental‐status score as the predictor variable. Although AUCs are typically used as a measure of discriminative ability, this study used AUCs to summarize both sensitivity and specificity across a range of cutoffs, providing an overall measure of predictive accuracies across mental‐status scales. To estimate AUCs, the AVPU, GCS, and GCS subscales were entered into a logistic regression model as ordinal variables, whereas RASS was entered as a nominal variable due to its positive and negative components, and predicted probabilities were calculated. In addition, a combined model was fit where GCS and RASS were classified as categorical independent variables. AUCs were then calculated by utilizing the predicted probabilities from each logistic regression model using the trapezoidal rule.[20] A sensitivity analysis was performed to estimate the internal validity of the RASS model using 10‐fold cross‐validation.
Predefined subgroup analyses were performed that compared the accuracies of AVPU, GCS, and RASS for predicting 24‐hour mortality in patients above and below the median age of the study population, and between patients who underwent surgery during their admission or not (surgical vs medical). All tests of significance used a 2‐sided P value <0.05. All data analysis was performed using Stata version 13.0 (StataCorp, College Station, TX).
RESULTS
During the study period, 313,577 complete GCS and 305,177 RASS scores were recorded in the electronic health record by nursing staff. A total of 26,806 (17,603 GCS and 9203 RASS) observations were excluded due to nonsimultaneous measurement of the other score, resulting in 295,974 paired mental‐status observations. These observations were obtained from 26,873 admissions in 17,660 unique patients, with a median MEWS at ward admission of 1 (IQR 11). The mean patient age was 57 years (SD 17), and 23% were surgical patients (Table 1). Patients spent a median 63.9 hours (IQR 26.7118.6) on the wards per admission and contributed a median of 3 paired observations (IQR 24) per day, with 91% of patients having at least 2 observations per day. A total of 417 (1.6%) general‐ward admissions resulted in death during the hospitalization, with 354 mental‐status observations occurring within 24 hours of a death. In addition, 26,618 (99.9%) admissions had at least 1 paired mental‐status observation within the last 24 hours of their ward stay.
| |
| Total no. of admissions | 26,873 |
| Total no. of unique patients | 17,660 |
| Age, y, mean (SD) | 57 (17) |
| Female sex, n (%) | 14,293 (53) |
| Race, n (%) | |
| White | 10,516 (39) |
| Black | 12,580 (47) |
| Other/unknown | 3,777 (14) |
| Admission MEWS, median (IQR) | 1 (11) |
| Days on ward, median (IQR) | 5 (310) |
| Observations per person, per day, median (IQR) | 3 (24) |
| Underwent surgery during hospitalization, n (%) | 6,141 (23) |
| Deaths, n (%) | 417 (1.6) |
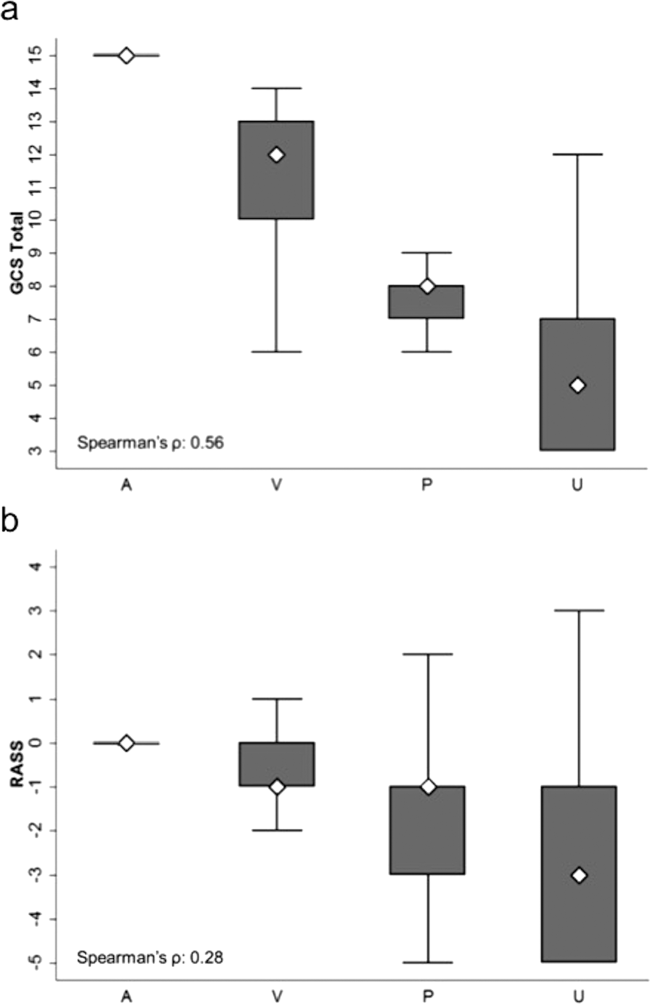
AVPU was moderately correlated with GCS (Spearman's =0.56) (Figure 1a) and weakly correlated with RASS (Spearman's =0.28) (Figure 1b). GCS scores were also weakly correlated to RASS (Spearman's =0.13, P<0.001). Notably, AVPU mapped to distinct levels of GCS, with Alert associated with a median GCS total score of 15, Voice a score of 12, Pain a score of 8, and Unresponsive a score of 5. Abnormal mental‐status scores on any scale were associated with significantly higher odds of death within 24 hours than normal mental‐status scores (Table 2). This association was consistent within the 3 subscales of GCS and for scores in both the sedation (<0) and agitation (>0) ranges of RASS.
| Mental‐status Score | Observations, n (%) | Odds Ratio for Mortality (95% CI) |
|---|---|---|
| ||
| GCS Eye (AVPU) | ||
| 4 (alert) | 289,857 (98) | Reference |
| <4 (not alert) | 6,117 (2) | 33.8 (23.947.9) |
| GCS Verbal | ||
| 5 | 277,862 (94) | Reference |
| 4 | 11,258 (4) | 4.7 (2.87.9) |
| <4 | 6,854 (2) | 52.7 (38.073.2) |
| GCS Motor | ||
| 6 | 287,441 (97) | Reference |
| <6 | 8,533 (3) | 41.8 (30.756.9) |
| GCS total | ||
| 15 | 276,042 (93) | Reference |
| 13, 14 | 12,437 (4) | 5.2 (3.38.3) |
| <13 | 7,495 (3) | 55.5 (40.077.1) |
| RASS | ||
| >0 | 6,867 (2) | 8.5 (5.613.0) |
| 0 | 275,708 (93) | Reference |
| <0 | 13,339 (5) | 25.8 (19.234.6) |
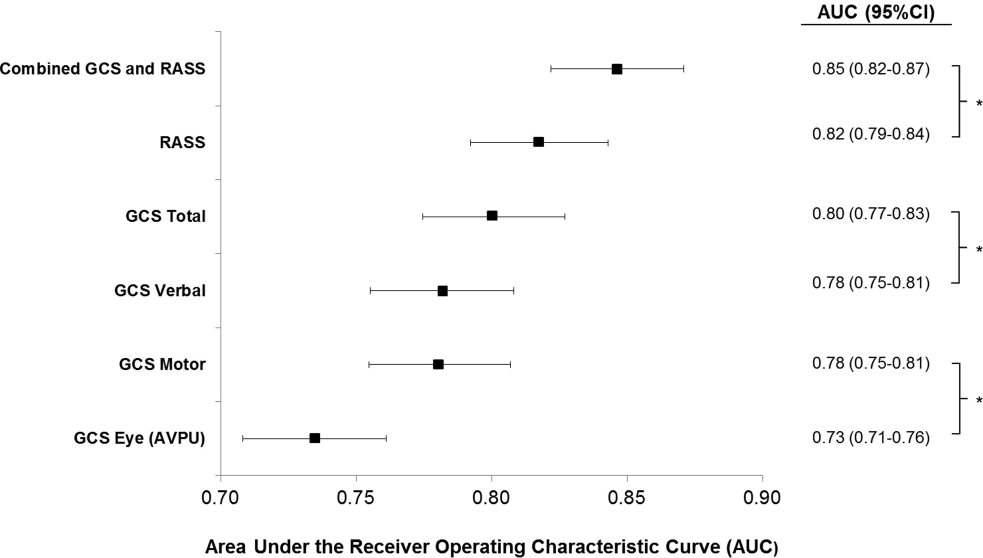
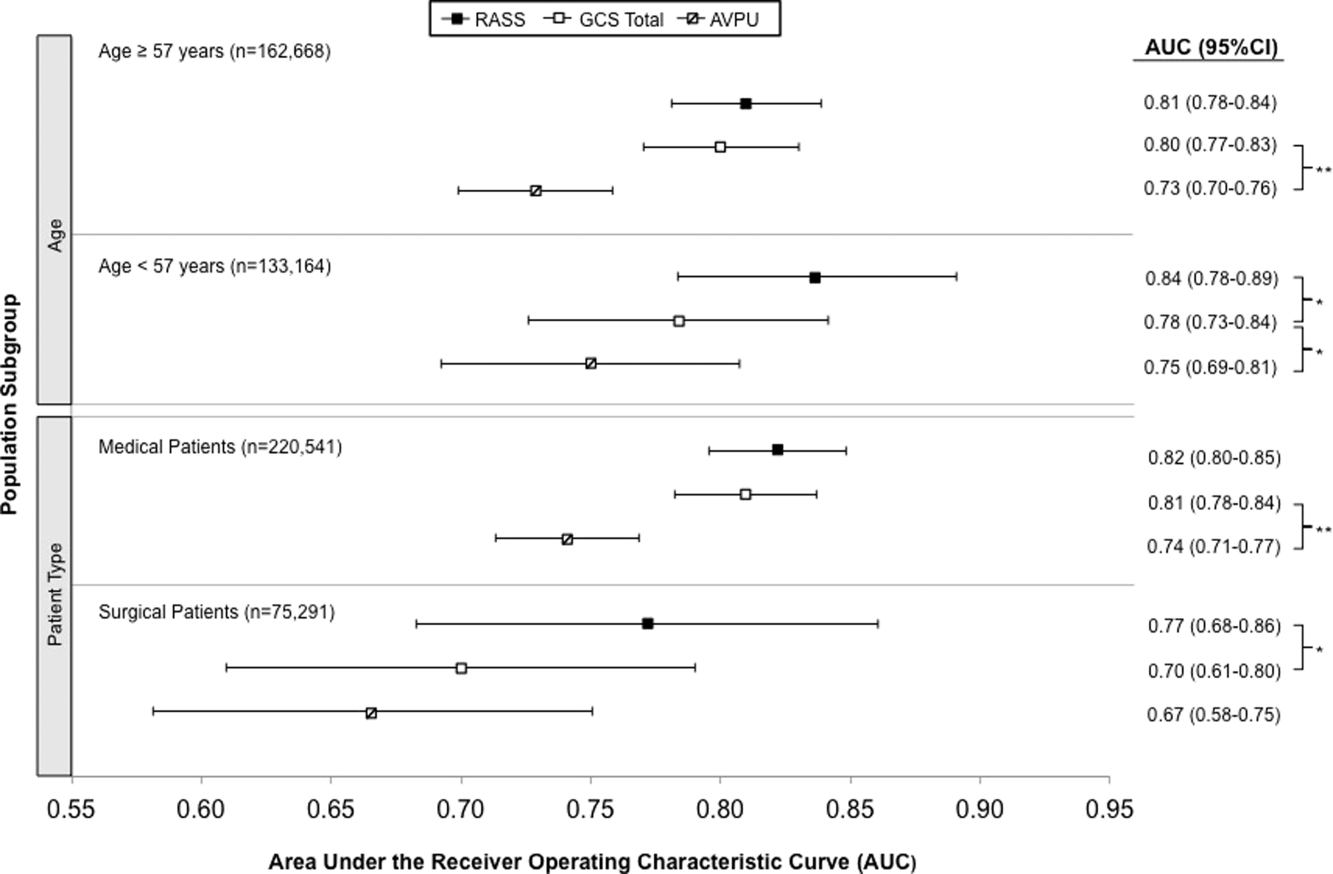
AVPU was the least accurate predictor of mortality (AUC 0.73 [95% confidence interval {CI}: 0.710.76]), whereas simultaneous use of GCS and RASS was the most accurate predictor (AUC 0.85 [95% CI: 0.820.87] (Figure 2). The accuracies of GCS and RASS were not significantly different from one another in the total study population (AUC 0.80 [95% CI: 0.770.83] and 0.82 [0.790.84], respectively, P=0.13). Ten‐fold cross‐validation to estimate the internal validity of the RASS model resulted in a lower AUC (0.78 [95% CI: 0.750.81]) for RASS as a predictor of 24‐hour mortality. Subgroup analysis indicated that RASS was more accurate than GCS in younger patients (<57 years old) and in surgical patients (Figure 3).
Removal of the 255 admissions missing a paired mental‐status observation within the last 24 hours of their ward stay resulted in no change in the AUC values. A sensitivity analysis for prediction of a combined secondary outcome of 24‐hour intensive care unit ICU transfer or cardiac arrest yielded lower AUCs for each mental‐status scale, with no change in the association among scales.
DISCUSSION
To our knowledge, this study is the first to compare the accuracies of AVPU, GCS, and RASS for predicting mortality in the general‐ward setting. Similar to McNarry and Goldhill, we demonstrated that AVPU scores mapped to distinct levels of GCS. Although our study reports the same median GCS scores of 15 and 8 for AVPU levels of Alert and Pain, respectively, we indicate slightly lower corresponding median GCS scores for AVPU scores of Voice (12 vs 13) and Unresponsive (5 vs 6) than their previous work.[21] We found that AVPU was the least accurate predictor of mortality within 24 hours of an observation, and the combination of GCS and RASS was the most accurate. RASS was at least as accurate a predictor for 24‐hour mortality in comparison to GCS total in the overall study population. However, the RASS score was the most accurate individual score in surgical and younger patients. These findings suggest that changing from the commonly used AVPU scale to the RASS and/or GCS would improve the prognostic ability of mental‐status assessments on the general wards.
Buist and colleagues have previously demonstrated altered mental status to be one of the strongest predictors of death on the wards. In that study, a GCS score of 3 and a decrease in GCS score by more than 2 points were independently associated with mortality (odds ratio 6.1 [95% CI: 3.111.8] and 5.5 [95% CI: 2.611.9], respectively).[22] We have also previously shown that after adjusting for vital signs, being unresponsive to pain was associated with a 4.5‐fold increase in the odds of death within 24 hours,[23]whereas Subbe and colleagues showed a relative risk ratio of 5.2 (95% CI: 1.518.1) for the combined endpoint of cardiac arrest, death at 60 days, or admission to the intensive care/high dependency unit.[19] In the current study, the magnitude of these associations was even stronger, with a GCS score <13 correlating with a 55‐fold increase in the odds of death, compared to a normal GCS, and not being alert being associated with a 33.8‐fold increase in the odds of death. This difference in magnitude is likely a product of the univariate nature of the current analysis, compared to both the Buist et al. and Churpek et al. studies, which adjusted for vital signs, thereby lessening the impact of any single predictor. Because this study was designed to compare mental‐status variables to one another for future model inclusion, and all the analyses were paired, confounding by additional predictors of death was not a concern.
One of the potential strengths of RASS over GCS and AVPU is its ability to measure agitation levels, in addition to depressed mentation, a feature that has been shown to be present in up to 60% of delirium episodes.[24] This may also explain why RASS was the most accurate predictor of mortality in our subset of younger patients and surgical patients, because hyperactive delirium is more common in younger and healthier patients, which surgical patients tend to be as compared to medical patients.[25, 26] In this study, we found negative RASS scores portending a worse prognosis than positive ones, which supports previous findings that hypoactive delirium had a higher association with mortality than hyperactive delirium at 6 months (hazard ratio 1.90 vs 1.37) and at 1 year (hazard ratio 1.60 vs 1.30) in elderly patients at postacute‐care facilities in 2 separate studies.[27, 28] However, a study of patients undergoing surgery for hip fracture found that patients with hyperactive delirium were more likely to die or be placed in a nursing home at 1 month follow‐up when compared to patients with purely hypoactive delirium (79% vs 32%, P=0.003).[29]
We found the assessment of RASS and GCS by ward nurses to be highly feasible. During the study period, nurses assessed mental status with the GCS and RASS scales at least once per 12‐hour shift in 91% of patients. GCS has been shown to be reliably and accurately recorded by experienced nurses (reliability coefficient=0.944 with 96.4% agreement with expert ratings).[30] RASS can take <30 seconds to administer, and in previous studies of the ICU setting has been shown to have over 94% nurse compliance for administration,[31] and good inter‐rater reliability (weighted kappa 0.66 and 0.89, respectively).[31, 32] Further, in a prior survey of 55 critical care nurses, 82% agreed that RASS was easy to score and clinically relevant.[31]
This study has several limitations. First, it was conducted in a single academic institution, which may limit generalizability to other hospitals. Second, baseline cognition and comorbidities were not available in the dataset, so we were unable to conduct additional subgroup analyses by these categories. However, we used age and hospital admission type as proxies. Third, the AVPU scores in this study were extracted from the Eye subset of the GCS scale, as AVPU was not directly assessed on our wards during the study period. Clinical assessment of mental status on the AVPU scale notes the presence of any active patient response (eg, eye opening, grunting, moaning, movement) to increasingly noxious stimuli. As such, our adaptation of AVPU using only eye‐opening criteria may underestimate the true number of patients correctly classified as alert, or responding to vocal/painful stimuli. However, a sensitivity analysis comparing directly assessed AVPU during a 3‐year period prior to the study implementation at our institution, and AVPU derived from the GCS Eye subscale for the study period, indicated no difference in predictive value for 24‐hour mortality. Fourth, we did not perform trend analyses for change from baseline mental status or evolution of AMS, which may more accurately predict 24‐hour mortality than discrete mental‐status observations. Finally, the 3 scales we compared differ in length, which may bias the AUC against AVPU, a 4‐point scale with a trapezoidal ROC curve compared to the smoother curve generated by the 15‐point GCS scale, for example. However, the lack of discrimination of the AVPU is the likely source of its lesser accuracy.
CONCLUSION
In the general‐ward setting, routine collection of GCS and RASS is feasible, and both are significantly more accurate for predicting mortality than the more commonly used AVPU scale. In addition, the combination of GCS and RASS has greater accuracy than any of the 3 individual scales. RASS may be particularly beneficial in the assessment of younger and/or surgical patients. Routine documentation and tracking of GCS and/or RASS by nurses may improve the detection of clinical deterioration in general‐ward patients. In addition, future early‐warning scores may benefit from the inclusion of GCS and/or RASS in lieu of AVPU.
Disclosures
Drs. Churpek and Edelson have a patent pending (ARCD. P0535US.P2) for risk stratification algorithms for hospitalized patients. Dr. Churpek is supported by a career development award from the National Heart, Lung, and Blood Institute (K08 HL121080). Dr. Edelson has received research support from the National Heart, Lung, and Blood Institute (K23 HL097157), Philips (Andover, MA), the American Heart Association (Dallas, TX), Laerdal Medical (Stavanger, Norway), and Early Sense (Tel Aviv, Israel). She has ownership interest in Quant HC (Chicago, IL), which is developing products for risk stratification of hospitalized patients. All other authors report no conflicts of interest.
- , , , et al. Delirium as a predictor of mortality in mechanically ventilated patients in the intensive care unit. JAMA. 2004;291(14):1753–1762.
- , , , , , Delirium in hospitalized older persons: outcomes and predictors. J Am Geriatr Soc. 1994;42(8):809–815.
- , , Occurrence and outcome of delirium in medical in‐patients: a systematic literature review. Age Ageing. 2006;35(4):350–364.
- , , , et al. Delirium. The occurrence and persistence of symptoms among elderly hospitalized patients. Arch Intern Med. 1992;152(2):334–340.
- , , Postoperative delirium. A review of 80 primary data‐collection studies. Arch Intern Med. 1995;155(5):461–465.
- , , , , Nurses' recognition of delirium and its symptoms: comparison of nurse and researcher ratings. Arch Intern Med. 2001;161(20):2467–2473.
- , , The misdiagnosis of delirium. Psychosomatics. 1997;38(5):433–439.
- , , , et al. Current opinions regarding the importance, diagnosis, and management of delirium in the intensive care unit: a survey of 912 healthcare professionals. Crit Care Med. 2004;32(1):106–112.
- , Misdiagnosing delirium as depression in medically ill elderly patients. Arch Intern Med. 1995;155(22):2459–2464.
- Doctors and nurses use of the word confused. Br J Psychiatry. 1984;145:441–443.
- , , , et al. The Richmond Agitation‐Sedation Scale: validity and reliability in adult intensive care unit patients. Am J Respir Crit Care Med. 2002;166(10):1338–1344.
- , Assessment and prognosis of coma after head injury. Acta Neurochir (Wien). 1976;34(1–4):45–55.
- , , , , Glasgow Coma Scale score in the evaluation of outcome in the intensive care unit: findings from the Acute Physiology and Chronic Health Evaluation III study. Crit Care Med. 1993;21(10):1459–1465.
- , , Variability in agreement between physicians and nurses when measuring the Glasgow Coma Scale in the emergency department limits its clinical usefulness. Emerg Med Australas. 2006;18(4):379–384.
- , , , Reliability of the Glasgow Coma Scale when used by emergency physicians and paramedics. J Trauma. 1993;34(1):46–48.
- , ; American College of Surgeons. Committee on Trauma. Advanced Trauma Life Support Program For Physicians: ATLS. 5th ed. Chicago, IL: American College of Surgeons; 1993.
- , , , Review and performance evaluation of aggregate weighted 'track and trigger' systems. Resuscitation. 2008;77(2):170–179.
- , , , , A review, and performance evaluation, of single‐parameter “track and trigger” systems. Resuscitation. 2008;79(1):11–21.
- , , , Validation of a modified Early Warning score in medical admissions. QJM. 2001;94(10):521–526.
- , , Comparing the areas under two or more correlated receiver operating characteristic curves: a nonparametric approach. Biometrics. 1988;44(3):837–845.
- , Simple bedside assessment of level of consciousness: comparison of two simple assessment scales with the Glascow Coma Scale. Anaesthesia. 2004;59(1):34–37.
- , , , , Association between clinically abnormal observations and subsequent in‐hospital mortality: a prospective study. Resuscitation. 2004;62(2):137–141.
- , , Predicting clinical deterioration in the hospital: the impact of outcome selection. Resuscitation. 2013;84(5):564–568.
- , , , et al. Delirium and its motoric subtypes: a study of 614 critically ill patients. J Am Geriatr Soc. 2006;54(3):479–484.
- , , , et al. Risk factors for delirium after major trauma. Am J Surg. 2008;196(6):864–869.
- , , , , Relationship between symptoms and motoric subtype of delirium. J Neuropsychiatry Clin Neurosci. 2000;12(1):51–56.
- , , , et al. Phenomenological subtypes of delirium in older persons: patterns, prevalence, and prognosis. Psychosomatics. 2009;50(3):248–254.
- , , , Association between psychomotor activity delirium subtypes and mortality among newly admitted post‐acute facility patients. J Gerontol A Biol Sci Med Sci. 2007;62(2):174–179.
- , , , Delirium severity and psychomotor types: their relationship with outcomes after hip fracture repair. J Am Geriatr Soc. 2002;50(5):850–857.
- , Reliability and accuracy of the Glasgow Coma Scale with experienced and inexperienced users. Lancet. 1991;337(8740):535–538.
- , , , et al. Large‐scale implementation of sedation and delirium monitoring in the intensive care unit: a report from two medical centers. Crit Care Med. 2005;33(6):1199–1205.
- , , , et al. Delirium and sedation recognition using validated instruments: reliability of bedside intensive care unit nursing assessments from 2007 to 2010. J Am Geriatr Soc. 2011;59(suppl 2):S249–S255.
Altered mental status (AMS), characterized by abnormal changes in a patient's arousal and/or cognition, is a significant predictor of hospital mortality.[1, 2, 3] Yet despite its prevalence[3, 4, 5] and importance, up to three‐quarters of AMS events go unrecognized by caregivers.[6, 7, 8] Acute changes in mental status, often caused by delirium in the hospitalized patient,[3] can present nonspecifically, making it difficult to detect and distinguish from other diagnoses such as depression or dementia.[7, 9] Further complicating the recognition of AMS, numerous and imprecise qualitative descriptors such as confused and alert and oriented are used in clinical practice to describe the mental status of patients.[10] Thus, more objective measures may result in improved detection of altered mental status and in earlier diagnostic and therapeutic interventions.
In critically ill patients, several scales have been widely adopted for quantifying mental status. The Richmond Agitation and Sedation Scale (RASS) was created to optimize sedation.[11] The Glasgow Coma Scale (GCS) was developed for head‐trauma patients[12] and is now a standardized assessment tool in intensive care units,[13] the emergency department,[14] and the prehospital setting.[15] In addition, a simplified scale, AVPU (Alert, responsive to Verbal stimuli, responsive to Painful stimuli, and Unresponsive) was initially used in the primary survey of trauma patients[16] but is now a common component of early‐warning scores and rapid response activation criteria, such as the Modified Early Warning Score (MEWS).[17, 18] In fact, in a systematic review of 72 distinct early‐warning scores, 89% of the scores used AVPU as the measure of mentation.[17] However, the utility of these 3 scales is not well established in the general‐ward setting. Our aim was therefore to compare the accuracies of AVPU, GCS, and RASS for predicting mortality in hospitalized general‐ward patients to provide insight into the accuracy of these different scores for clinical deterioration.
METHODS
Study Setting and Protocol
We conducted an observational cohort study of consecutive adult general‐ward admissions from July 2011 through January 2013 at a 500‐bed, urban US teaching hospital. During the study period, no early‐warning scoring systems were in place on the hospital wards. Rapid response teams responding to altered mental status would do so without specific thresholds for activation. During this period, nurses on the general floors were expected to record each patient's GCS and RASS score in the electronic health record (EPIC Systems Corp., Verona, WI) as part of the routine patient assessment at least once every 12‐hour shift. AVPU assessments were extracted from the eye component of the GCS. The letter A was assigned to a GCS Eye score of 4 (opens eyes spontaneously), V to a score of 3 (opens eyes in response to voice), P to a score of 2 (opens eyes in response to painful stimuli), and U to a score of 1 (does not open eyes). To avoid comparison of mental‐status scores at different time points, only concurrent GCS and RASS scores, documented within 10 minutes of one another, were included in the analysis.
Location and time‐stamped GCS and RASS scores, demographics, and in‐hospital mortality data were obtained from the hospital's Clinical Research Data Warehouse, which is maintained by the Center for Research Informatics at The University of Chicago. The study protocol and data‐collection mechanisms were approved by The University of Chicago Institutional Review Board (#16995A).
Statistical Analysis
Baseline admission characteristics were described using proportions (%) and measures of central tendency (mean, standard deviations [SD]; median, interquartile ranges [IQR]). Patient severity of illness at first ward observation was calculated using the MEWS.[19] All mental‐status observations during a patient's ward stay were included in the analysis. Odds ratios for 24‐hour mortality following an abnormal mental‐status score were calculated using generalized estimating equations, with an exchangeable correlation structure to account for the correlation of scores within the same patient, as more than 1 abnormal mental‐status score may have been documented within the 24 hours preceding death. Spearman's rank correlation coefficients () were used to estimate the correlation among AVPU, GCS, and RASS scores.
The predictive accuracies of AVPU, GCS, RASS, and the subscales of GCS were compared using the area under the receiver operating characteristic curve (AUC), with mortality within 24 hours of a mental‐status observation as the primary outcome and the mental‐status score as the predictor variable. Although AUCs are typically used as a measure of discriminative ability, this study used AUCs to summarize both sensitivity and specificity across a range of cutoffs, providing an overall measure of predictive accuracies across mental‐status scales. To estimate AUCs, the AVPU, GCS, and GCS subscales were entered into a logistic regression model as ordinal variables, whereas RASS was entered as a nominal variable due to its positive and negative components, and predicted probabilities were calculated. In addition, a combined model was fit where GCS and RASS were classified as categorical independent variables. AUCs were then calculated by utilizing the predicted probabilities from each logistic regression model using the trapezoidal rule.[20] A sensitivity analysis was performed to estimate the internal validity of the RASS model using 10‐fold cross‐validation.
Predefined subgroup analyses were performed that compared the accuracies of AVPU, GCS, and RASS for predicting 24‐hour mortality in patients above and below the median age of the study population, and between patients who underwent surgery during their admission or not (surgical vs medical). All tests of significance used a 2‐sided P value <0.05. All data analysis was performed using Stata version 13.0 (StataCorp, College Station, TX).
RESULTS
During the study period, 313,577 complete GCS and 305,177 RASS scores were recorded in the electronic health record by nursing staff. A total of 26,806 (17,603 GCS and 9203 RASS) observations were excluded due to nonsimultaneous measurement of the other score, resulting in 295,974 paired mental‐status observations. These observations were obtained from 26,873 admissions in 17,660 unique patients, with a median MEWS at ward admission of 1 (IQR 11). The mean patient age was 57 years (SD 17), and 23% were surgical patients (Table 1). Patients spent a median 63.9 hours (IQR 26.7118.6) on the wards per admission and contributed a median of 3 paired observations (IQR 24) per day, with 91% of patients having at least 2 observations per day. A total of 417 (1.6%) general‐ward admissions resulted in death during the hospitalization, with 354 mental‐status observations occurring within 24 hours of a death. In addition, 26,618 (99.9%) admissions had at least 1 paired mental‐status observation within the last 24 hours of their ward stay.
| |
| Total no. of admissions | 26,873 |
| Total no. of unique patients | 17,660 |
| Age, y, mean (SD) | 57 (17) |
| Female sex, n (%) | 14,293 (53) |
| Race, n (%) | |
| White | 10,516 (39) |
| Black | 12,580 (47) |
| Other/unknown | 3,777 (14) |
| Admission MEWS, median (IQR) | 1 (11) |
| Days on ward, median (IQR) | 5 (310) |
| Observations per person, per day, median (IQR) | 3 (24) |
| Underwent surgery during hospitalization, n (%) | 6,141 (23) |
| Deaths, n (%) | 417 (1.6) |
AVPU was moderately correlated with GCS (Spearman's =0.56) (Figure 1a) and weakly correlated with RASS (Spearman's =0.28) (Figure 1b). GCS scores were also weakly correlated to RASS (Spearman's =0.13, P<0.001). Notably, AVPU mapped to distinct levels of GCS, with Alert associated with a median GCS total score of 15, Voice a score of 12, Pain a score of 8, and Unresponsive a score of 5. Abnormal mental‐status scores on any scale were associated with significantly higher odds of death within 24 hours than normal mental‐status scores (Table 2). This association was consistent within the 3 subscales of GCS and for scores in both the sedation (<0) and agitation (>0) ranges of RASS.
| Mental‐status Score | Observations, n (%) | Odds Ratio for Mortality (95% CI) |
|---|---|---|
| ||
| GCS Eye (AVPU) | ||
| 4 (alert) | 289,857 (98) | Reference |
| <4 (not alert) | 6,117 (2) | 33.8 (23.947.9) |
| GCS Verbal | ||
| 5 | 277,862 (94) | Reference |
| 4 | 11,258 (4) | 4.7 (2.87.9) |
| <4 | 6,854 (2) | 52.7 (38.073.2) |
| GCS Motor | ||
| 6 | 287,441 (97) | Reference |
| <6 | 8,533 (3) | 41.8 (30.756.9) |
| GCS total | ||
| 15 | 276,042 (93) | Reference |
| 13, 14 | 12,437 (4) | 5.2 (3.38.3) |
| <13 | 7,495 (3) | 55.5 (40.077.1) |
| RASS | ||
| >0 | 6,867 (2) | 8.5 (5.613.0) |
| 0 | 275,708 (93) | Reference |
| <0 | 13,339 (5) | 25.8 (19.234.6) |
AVPU was the least accurate predictor of mortality (AUC 0.73 [95% confidence interval {CI}: 0.710.76]), whereas simultaneous use of GCS and RASS was the most accurate predictor (AUC 0.85 [95% CI: 0.820.87] (Figure 2). The accuracies of GCS and RASS were not significantly different from one another in the total study population (AUC 0.80 [95% CI: 0.770.83] and 0.82 [0.790.84], respectively, P=0.13). Ten‐fold cross‐validation to estimate the internal validity of the RASS model resulted in a lower AUC (0.78 [95% CI: 0.750.81]) for RASS as a predictor of 24‐hour mortality. Subgroup analysis indicated that RASS was more accurate than GCS in younger patients (<57 years old) and in surgical patients (Figure 3).
Removal of the 255 admissions missing a paired mental‐status observation within the last 24 hours of their ward stay resulted in no change in the AUC values. A sensitivity analysis for prediction of a combined secondary outcome of 24‐hour intensive care unit ICU transfer or cardiac arrest yielded lower AUCs for each mental‐status scale, with no change in the association among scales.
DISCUSSION
To our knowledge, this study is the first to compare the accuracies of AVPU, GCS, and RASS for predicting mortality in the general‐ward setting. Similar to McNarry and Goldhill, we demonstrated that AVPU scores mapped to distinct levels of GCS. Although our study reports the same median GCS scores of 15 and 8 for AVPU levels of Alert and Pain, respectively, we indicate slightly lower corresponding median GCS scores for AVPU scores of Voice (12 vs 13) and Unresponsive (5 vs 6) than their previous work.[21] We found that AVPU was the least accurate predictor of mortality within 24 hours of an observation, and the combination of GCS and RASS was the most accurate. RASS was at least as accurate a predictor for 24‐hour mortality in comparison to GCS total in the overall study population. However, the RASS score was the most accurate individual score in surgical and younger patients. These findings suggest that changing from the commonly used AVPU scale to the RASS and/or GCS would improve the prognostic ability of mental‐status assessments on the general wards.
Buist and colleagues have previously demonstrated altered mental status to be one of the strongest predictors of death on the wards. In that study, a GCS score of 3 and a decrease in GCS score by more than 2 points were independently associated with mortality (odds ratio 6.1 [95% CI: 3.111.8] and 5.5 [95% CI: 2.611.9], respectively).[22] We have also previously shown that after adjusting for vital signs, being unresponsive to pain was associated with a 4.5‐fold increase in the odds of death within 24 hours,[23]whereas Subbe and colleagues showed a relative risk ratio of 5.2 (95% CI: 1.518.1) for the combined endpoint of cardiac arrest, death at 60 days, or admission to the intensive care/high dependency unit.[19] In the current study, the magnitude of these associations was even stronger, with a GCS score <13 correlating with a 55‐fold increase in the odds of death, compared to a normal GCS, and not being alert being associated with a 33.8‐fold increase in the odds of death. This difference in magnitude is likely a product of the univariate nature of the current analysis, compared to both the Buist et al. and Churpek et al. studies, which adjusted for vital signs, thereby lessening the impact of any single predictor. Because this study was designed to compare mental‐status variables to one another for future model inclusion, and all the analyses were paired, confounding by additional predictors of death was not a concern.
One of the potential strengths of RASS over GCS and AVPU is its ability to measure agitation levels, in addition to depressed mentation, a feature that has been shown to be present in up to 60% of delirium episodes.[24] This may also explain why RASS was the most accurate predictor of mortality in our subset of younger patients and surgical patients, because hyperactive delirium is more common in younger and healthier patients, which surgical patients tend to be as compared to medical patients.[25, 26] In this study, we found negative RASS scores portending a worse prognosis than positive ones, which supports previous findings that hypoactive delirium had a higher association with mortality than hyperactive delirium at 6 months (hazard ratio 1.90 vs 1.37) and at 1 year (hazard ratio 1.60 vs 1.30) in elderly patients at postacute‐care facilities in 2 separate studies.[27, 28] However, a study of patients undergoing surgery for hip fracture found that patients with hyperactive delirium were more likely to die or be placed in a nursing home at 1 month follow‐up when compared to patients with purely hypoactive delirium (79% vs 32%, P=0.003).[29]
We found the assessment of RASS and GCS by ward nurses to be highly feasible. During the study period, nurses assessed mental status with the GCS and RASS scales at least once per 12‐hour shift in 91% of patients. GCS has been shown to be reliably and accurately recorded by experienced nurses (reliability coefficient=0.944 with 96.4% agreement with expert ratings).[30] RASS can take <30 seconds to administer, and in previous studies of the ICU setting has been shown to have over 94% nurse compliance for administration,[31] and good inter‐rater reliability (weighted kappa 0.66 and 0.89, respectively).[31, 32] Further, in a prior survey of 55 critical care nurses, 82% agreed that RASS was easy to score and clinically relevant.[31]
This study has several limitations. First, it was conducted in a single academic institution, which may limit generalizability to other hospitals. Second, baseline cognition and comorbidities were not available in the dataset, so we were unable to conduct additional subgroup analyses by these categories. However, we used age and hospital admission type as proxies. Third, the AVPU scores in this study were extracted from the Eye subset of the GCS scale, as AVPU was not directly assessed on our wards during the study period. Clinical assessment of mental status on the AVPU scale notes the presence of any active patient response (eg, eye opening, grunting, moaning, movement) to increasingly noxious stimuli. As such, our adaptation of AVPU using only eye‐opening criteria may underestimate the true number of patients correctly classified as alert, or responding to vocal/painful stimuli. However, a sensitivity analysis comparing directly assessed AVPU during a 3‐year period prior to the study implementation at our institution, and AVPU derived from the GCS Eye subscale for the study period, indicated no difference in predictive value for 24‐hour mortality. Fourth, we did not perform trend analyses for change from baseline mental status or evolution of AMS, which may more accurately predict 24‐hour mortality than discrete mental‐status observations. Finally, the 3 scales we compared differ in length, which may bias the AUC against AVPU, a 4‐point scale with a trapezoidal ROC curve compared to the smoother curve generated by the 15‐point GCS scale, for example. However, the lack of discrimination of the AVPU is the likely source of its lesser accuracy.
CONCLUSION
In the general‐ward setting, routine collection of GCS and RASS is feasible, and both are significantly more accurate for predicting mortality than the more commonly used AVPU scale. In addition, the combination of GCS and RASS has greater accuracy than any of the 3 individual scales. RASS may be particularly beneficial in the assessment of younger and/or surgical patients. Routine documentation and tracking of GCS and/or RASS by nurses may improve the detection of clinical deterioration in general‐ward patients. In addition, future early‐warning scores may benefit from the inclusion of GCS and/or RASS in lieu of AVPU.
Disclosures
Drs. Churpek and Edelson have a patent pending (ARCD. P0535US.P2) for risk stratification algorithms for hospitalized patients. Dr. Churpek is supported by a career development award from the National Heart, Lung, and Blood Institute (K08 HL121080). Dr. Edelson has received research support from the National Heart, Lung, and Blood Institute (K23 HL097157), Philips (Andover, MA), the American Heart Association (Dallas, TX), Laerdal Medical (Stavanger, Norway), and Early Sense (Tel Aviv, Israel). She has ownership interest in Quant HC (Chicago, IL), which is developing products for risk stratification of hospitalized patients. All other authors report no conflicts of interest.
- , , , et al. Delirium as a predictor of mortality in mechanically ventilated patients in the intensive care unit. JAMA. 2004;291(14):1753–1762.
- , , , , , Delirium in hospitalized older persons: outcomes and predictors. J Am Geriatr Soc. 1994;42(8):809–815.
- , , Occurrence and outcome of delirium in medical in‐patients: a systematic literature review. Age Ageing. 2006;35(4):350–364.
- , , , et al. Delirium. The occurrence and persistence of symptoms among elderly hospitalized patients. Arch Intern Med. 1992;152(2):334–340.
- , , Postoperative delirium. A review of 80 primary data‐collection studies. Arch Intern Med. 1995;155(5):461–465.
- , , , , Nurses' recognition of delirium and its symptoms: comparison of nurse and researcher ratings. Arch Intern Med. 2001;161(20):2467–2473.
- , , The misdiagnosis of delirium. Psychosomatics. 1997;38(5):433–439.
- , , , et al. Current opinions regarding the importance, diagnosis, and management of delirium in the intensive care unit: a survey of 912 healthcare professionals. Crit Care Med. 2004;32(1):106–112.
- , Misdiagnosing delirium as depression in medically ill elderly patients. Arch Intern Med. 1995;155(22):2459–2464.
- Doctors and nurses use of the word confused. Br J Psychiatry. 1984;145:441–443.
- , , , et al. The Richmond Agitation‐Sedation Scale: validity and reliability in adult intensive care unit patients. Am J Respir Crit Care Med. 2002;166(10):1338–1344.
- , Assessment and prognosis of coma after head injury. Acta Neurochir (Wien). 1976;34(1–4):45–55.
- , , , , Glasgow Coma Scale score in the evaluation of outcome in the intensive care unit: findings from the Acute Physiology and Chronic Health Evaluation III study. Crit Care Med. 1993;21(10):1459–1465.
- , , Variability in agreement between physicians and nurses when measuring the Glasgow Coma Scale in the emergency department limits its clinical usefulness. Emerg Med Australas. 2006;18(4):379–384.
- , , , Reliability of the Glasgow Coma Scale when used by emergency physicians and paramedics. J Trauma. 1993;34(1):46–48.
- , ; American College of Surgeons. Committee on Trauma. Advanced Trauma Life Support Program For Physicians: ATLS. 5th ed. Chicago, IL: American College of Surgeons; 1993.
- , , , Review and performance evaluation of aggregate weighted 'track and trigger' systems. Resuscitation. 2008;77(2):170–179.
- , , , , A review, and performance evaluation, of single‐parameter “track and trigger” systems. Resuscitation. 2008;79(1):11–21.
- , , , Validation of a modified Early Warning score in medical admissions. QJM. 2001;94(10):521–526.
- , , Comparing the areas under two or more correlated receiver operating characteristic curves: a nonparametric approach. Biometrics. 1988;44(3):837–845.
- , Simple bedside assessment of level of consciousness: comparison of two simple assessment scales with the Glascow Coma Scale. Anaesthesia. 2004;59(1):34–37.
- , , , , Association between clinically abnormal observations and subsequent in‐hospital mortality: a prospective study. Resuscitation. 2004;62(2):137–141.
- , , Predicting clinical deterioration in the hospital: the impact of outcome selection. Resuscitation. 2013;84(5):564–568.
- , , , et al. Delirium and its motoric subtypes: a study of 614 critically ill patients. J Am Geriatr Soc. 2006;54(3):479–484.
- , , , et al. Risk factors for delirium after major trauma. Am J Surg. 2008;196(6):864–869.
- , , , , Relationship between symptoms and motoric subtype of delirium. J Neuropsychiatry Clin Neurosci. 2000;12(1):51–56.
- , , , et al. Phenomenological subtypes of delirium in older persons: patterns, prevalence, and prognosis. Psychosomatics. 2009;50(3):248–254.
- , , , Association between psychomotor activity delirium subtypes and mortality among newly admitted post‐acute facility patients. J Gerontol A Biol Sci Med Sci. 2007;62(2):174–179.
- , , , Delirium severity and psychomotor types: their relationship with outcomes after hip fracture repair. J Am Geriatr Soc. 2002;50(5):850–857.
- , Reliability and accuracy of the Glasgow Coma Scale with experienced and inexperienced users. Lancet. 1991;337(8740):535–538.
- , , , et al. Large‐scale implementation of sedation and delirium monitoring in the intensive care unit: a report from two medical centers. Crit Care Med. 2005;33(6):1199–1205.
- , , , et al. Delirium and sedation recognition using validated instruments: reliability of bedside intensive care unit nursing assessments from 2007 to 2010. J Am Geriatr Soc. 2011;59(suppl 2):S249–S255.
© 2015 Society of Hospital Medicine

The Importance of an Antimicrobial Stewardship Program
An antimicrobial stewardship program (ASP) is designed to provide guidance for the safe andcost-effective use of antimicrobial agents. This evidence-based approach addresses the correct selection of antimicrobial agents, dosages, routes of administration, and duration of therapy. In other words, the ASP necessitates the right drug, the right time, the right amount, and the right duration.1 The ASP reduces the development of multidrug-resistant organisms (MDROs), adverse drug events (such as antibiotic-associated diarrhea and renal toxicity), hospital length of stay, collateral damage (development of Clostridium difficile colitis), and health care costs. Review of the literature has shown the ASP reduces hospital stays among patients with acute bacterial-skin and skin-structure infections along with other costly infections.2
The ASP is not a new concept, but it is a hot topic. A successful ASP cannot be achieved without the support of the hospital leadership to determine and provide the needed resources. Its success stems from being a joint collaborative effort between pharmacy, medicine, infection control (IC), microbiology, and information technology. The purpose of the ASP is to ensure proper use of antimicrobials within the health care system through the development of a formal, interdisciplinary team. The primary goal of the ASP is to optimize clinical outcomes while minimizing unintended consequences related to antimicrobial usage, such as toxicities or the emergence of resistance.
In today’s world, health care clinicians are dealing with a global challenge of MDROs such as Enterococcus faecium, Staphylococcus aureus (S aureus), Klebsiella pneumonia, Acinetobacter baumanii, Pseudomonas aeruginosa, and Enterobacter species (ESKAPE), better known as “bugs without borders.”3 According to the CDC, antibiotic-resistant infections affect at least 2 million people in the U.S. annually and result in > 23,000 deaths.2 According to Thomas Frieden, director of the CDC, the pipeline of new antibiotics is nearly empty for the short term, and new drugs could be a decade away from discovery and approval by the FDA.2
Literature Review
Pasquale and colleagues conducted a retrospective, observational chart review on 62 patients who were admitted for bacterial-skin and skin-structure infections (S aureus, MRSA, MSSA, and Pseudomonas aeruginosa).4 The data examined patient demographic characteristics, comorbidities, specific type of skin infection (the most common being cellulitis, major or deep abscesses, and surgical site infections), microbiology, surgical interventions, and recommendations obtained from the ASP committee.
The ASP recommendations were divided into 5 categories, including dosage changes, de-escalation, antibiotic regimen changes, infectious disease (ID) consults, and other (not described). The ASP offered 85 recommendations, and acceptance of the ASP recommendations by physicians was 95%. The intervention group had a significantly lower length of stay (4.4 days vs 6.2 days, P < .001); and the 30-day all-cause readmission rate was also significantly lower (6.5% vs 16.71%, P = .05). However, the skin and skin-related structures readmission rate did not differ significantly (3.33% vs 6.27%). It was impossible for the investigators to determine exact differences in the amount of antimicrobials used in the intervention group vs the historical controls, because the historical data were based on ICD-9 codes, which may explain the nonsignificant finding.4
D’Agata reviewed the antimicrobial usage and ASP programs in dialysis centers.5 Chronic hemodialysis patients with central lines were noted to have the greatest rate of infections and antibiotic usage (6.4 per 100 patient months). The next highest group was dialysis patients with grafts (2.4 per 100 patient months), followed by patients with fistulas (1.8 per 100 patient months). Vancomycin was most commonly chosen for all antibiotic starts (73%). Interestingly, vancomycin was followed by cefazolin and third- and/or fourth-generation cephalosporin, which are risk factors for the emergence of multidrug-resistant, Gram-negative bacteria that are highly linked to increased morbidity and mortality rates. The U.S. Renal Data System stated in its 2009 report that the use of antibiotic therapy has increased from 31% in 1994 to 41% in 2007.5
In reviewing inappropriate choices of antimicrobial prescribing, D’Agata compared prescriptions given to the Healthcare Infection Control Practices Advisory Committee to determine whether the correct antibiotic was chosen. In 164 vancomycin prescriptions, 20% were categorized as inappropriate.5 In another study done by Zvonar and colleagues, 163 prescriptions of vancomycin were reviewed, and 12% were considered inappropriate.6
Snyder and colleagues examined 278 patients on hemodialysis, and over a 1-year period, 32% of these patients received ≥ 1 antimicrobial with 29.8% of the doses classified as inappropriate.7 The most common category for inappropriate prescribing of antimicrobials was not meeting the criteria for diagnosing infections (52.9% of cases). The second leading cause of inappropriate prescription for infections was not meeting criteria for diagnosing specific skin and skin-structure infections (51.6% of cases). Another common category was failure to choose a narrower spectrum antimicrobial prescription (26.8%).7 Attention to the indications and duration of antimicrobial treatment accounted for 20.3% of all inappropriate doses. Correction of these problems with use of an ASP could reduce the patient’s exposure to unneeded or inappropriate antibiotics by 22% to 36% and decrease hospital costs between $200,000 to $900,000.5
Rosa and colleagues discussed adherence to an ASP and the effects on mortality in hospitalized cancer patients with febrile neutropenia (FN).8 A prospective cohort study was performed in a single facility over a 2-year period. Patients admitted with cancer and FN were followed for 28 days. The mortality rates of those treated with ASP protocol antibiotics were compared with those treated with other antibiotic regimens. One hundred sixty-nine patients with 307 episodes of FN were included. The rate of adherence to ASP recommendations was 53% with the mortality of this cohort 9.4% (29 patients).8
Older patients were more likely to be treated according to ASP recommendations, whereas patients with comorbidities were not treated with ASP guidelines, Rosa and colleagues noted.8 No explanation was given, but statistical testing did uphold these findings, ensuring that the results were correctly interpreted. The 28-day mortality during FN was related to several factors, including nonadherence with ASP recommendations (P = .001) relapsing diseases stages (P = .001), and time to antibiotic start therapy > 1 hour (P = .001). Adherence to the ASP was independently associated with a higher survival rate (P = .03), whereas mortality was attributable to infection in all 29 patients who died.
Nowak and colleagues reviewed the clinical and economic benefits of an ASP using a pre- and postanalysis of potential patients who might benefit from recommendations of the ASP.9 Subjects included adult inpatients with pneumonia or abdominal sepsis. Recommendations from ASP that were followed decreased expenditures by 9.75% during the first year and remained stable in the following years. The cumulative cost savings was about $1.7 million. Rates of nosocomial infections decreased, and pre- and postcomparison of survival and lengths of stay for patients with pneumonia (n = 2,186) or abdominal sepsis (n = 225) revealed no significant differences. Investigators argued that this finding may have been due to the hospital’s initiation of other concurrent IC programs.
Doron and colleagues conducted a survey identifying characteristics of ASP practices and factors associated with the presence of an ASP.10 Surveys were received from 48 states (North and South Dakota were not included) and Puerto Rico. Surveys were received from 406 providers, and 96.4% identified some form of ASP. Barriers to implementation included staffing constraints (69.4%) and insufficient funding (0.6%).10
About 38% of the responses stated ASP was being used for adults and pediatric patients, whereas 58.8% were used for adults only.10 The ASP teams were composed of a variety of providers, including infectious disease (ID) physicians (70.7%), IC professionals (51.1%), and clinical microbiologists (38.6%). Additional barriers to implementing an ASP were found as insufficient medical staff buy-in (32.8%), not high on the priority list (22.2%), and too many other things to consider or deal with at the time (42.8%). Interestingly, 41.1% of the subjects in facilities without an ASP responded that providers agree with limiting the use of antimicrobials compared with 66.9% of subjects in hospitals with an ASP. Factors linked to having an ASP included having an ID consultation service, an ID fellowship program, an ID pharmacist, larger hospitals, annual admissions > 10,000, having a published antibiogram, and being a teaching hospital.
Establishment of an ASP
The Infectious Diseases Society of America (IDSA) and the Society for Healthcare Epidemiology of America (SHEA) issued guidelines in 2007 for developing an institutional ASP to enhance antimicrobial stewardship and help prevent antimicrobial resistance in hospitals.11 The ASP may vary among facilities based on available resources.
When developing an ASP, 2 core strategies are necessary. The core measures are proactive and are usually conducted by an ID clinical pharmacist assigned to the ASP in collaboration with the ID physician. These strategies are not mutually exclusive and include a prospective audit with interventions provided to the clinicians, resulting in decreased inappropriate use of antimicrobials or a formulary restriction and preauthorization to help reduce antimicrobial usage and related cost.
Supplemental elements may be considered and prioritized as to the core antimicrobial stewardship strategies based on local practice pattern and resources.11 Factors to consider include education, which is considered to be an essential element of the ASP. Although education is important, it alone is only somewhat effective in changing clinicians’ prescribing practices. Guidelines and clinical pathways are elements set forth in institutional management protocols for common and potentially serious infections such as intravascular catheter-related infections, hospital- and community-acquired pneumonia, bloodstream infections, and complicated urinary tract infections among other types.
Another consideration is antimicrobial cycling. This process refers to the specific schedule of alternating specific antimicrobials or antimicrobial classes to prevent or reverse the development of antimicrobial resistance. Insufficient data on antimicrobial cycling currently exist to affect major changes in practice. This element, however, could be implemented in certain institutions if needed based on the reported bacterial resistance pattern.
Antimicrobial order forms can be used to help monitor the implementation of formulated institutional clinical practice pathways. However, the authors feel that documenting this indication in the clinician notes may be adequate and save time for everyone involved; additionally, reviewing combination therapy, which if avoided, may prevent the emergence of resistance. Although combination therapy is needed in certain clinical diagnostic situations, careful consideration of its use is essential.
Streamlining or de-escalation of therapy by using a narrower spectrum agent, based on culture and sensitivity results, prevents duplicative therapy with a patient when double coverage is not indicated or intended. Another goal is the discontinuation of therapy based on negative culture results and lack of supporting clinical signs and symptoms of infection. Dose optimization and adjustment should also be reviewed. Using the appropriate antimicrobial dose based on the specific pathogen, patient characteristic, source of infection, along with the pharmacokinetic and pharmacodynamics should be reviewed to prevent antimicrobial overuse and subsequent potentially avoidable adverse effects.
Parenteral to oral conversion from IV to oral administration (IV to oral) antimicrobials must be considered when the patient is clinically and hemodynamically stable, thus limiting the length of hospital stays and health care costs. However, it is important to keep in mind pharmacokinetic studies examining the bioavailability of antibiotics are usually conducted with healthy volunteers. Therefore, when treating patients who are elderly, on multiple medications, or severely ill, proper usage of these antibiotics is required. Also, having antibiotics with excellent bioavailability does not necessarily mean switching from IV to oral routes when treating serious infections such as bacteremia. Special consideration should be given when changing the route of administration. In addition, approval—or at least notification by the treating physician or ID specialist—should be included in the absence of an institutional policy, allowing for automatic IV to oral conversion.
The ASP Team
The participation of specific clinicians has been suggested as key to having a successful ASP team.12 Members should include an ID physician (director) who serves as the lead physician and supervises the overall function of the ASP, makes recommendations to the ASP team, and contributes to the educational activities. A clinical ID pharmacist (codirector) provides suggestions to clinicians on preferred first-line antimicrobials and reviews medication orders for antimicrobials and resistance patterns, microbiological data, patient data, and clinical information. The codirector also tracks any ASP-related data and submits monitoring reports on a regular basis.
If accessible, an IC professional should participate, implementing and monitoring prevention strategies that decrease health care-associated infections. These infections play a significant role in reducing MDROs and decreasing the use of antibiotics. Additionally, the IC professional can assist in the early identification of patients with MDROs, aid patient placement on transmission-based precautions, and flag a patient in the medical record for hightened awareness. Also, IC professionals promote hand hygiene, standard precautions, and contribute to infection prevention strategies, such as hospital bundle practices, to prevent catheter-associated bloodstream infections and ventilator-associated pneumonias, among others.
If possible, a microbiologist who can prepare culture and susceptibility data to optimize antimicrobial management and conduct timely documentation of microbial pathogens should be a member of the team. Microbiologists can report organism susceptibility, assist in the surveillance of specific organisms, and provide early identification of patients with MDROs that require transmission-based precautions. The microbiologist can perform a semiannual update of a local antibiogram while reporting antimicrobial susceptibility profiles. Based on the information gathered, microbiologists can provide new drug panels to the members of the ASP, who will decide which antibiotic panel will be used. Another possible member of the ASP team is a program analyst who provides data retrieval, performs data analysis, and delivers necessary reports to the team.
It is the responsibility of medical staff to review and implement suggestions made by the ASP when appropriate. However, these suggestions are not considered a substitute for clinical decisions, and discretion is required when treating individual patients. The VHA, in response to the IDSA/SHEA published guidelines, chartered an antimicrobial stewardship task force in May 2011 with the sole purpose “To optimize the care of Veterans by developing, deploying and monitoring a national-level strategic plan for improvements in antimicrobial therapy management.”1 In 2011, the Office of Inspector General in a combined assessment program summary report for management of MDROs in VHA facilities recommended that “the Under Secretary for Health, in conjunction with VISN and facility senior managers, ensures that facilities develop policies and programs that control and reduce antimicrobial agent use.”13
In 2012, the VHA conducted a survey to obtain baseline data regarding ASP activities, presence of dedicated personnel, current related practice policies, available resources, and outcomes. There were 140 voluntary participating VA facilities, of which 130 had inpatient services. The survey found that 26 facilities (20%) did not have an attending ID physician, 49 facilities (38%) reported having an ASP, 19 facilities (15%) had developed policy in place addressing de-escalation of antimicrobials, 87 facilities (67%) had not developed a business plan for an ASP, and 61 facilities (47%) had completed a medication usage evaluation.14 Feedback following the analysis of the survey data recommended integrating more ID personnel as needed, along with the development of ASP teams for all facilities with inpatient services, who would have the authority to change the antimicrobial therapy selection and have policies in place related to ASP principles.
Conclusions
Increased MDROs and decreased anti-infective development requires stricter management of antibiotics. An ASP is essential in any hospital or health care facility to decrease the incidence of resistance and improve patient care. The ASP is a collaborative effort that involves multiple specialties and departments. A successful ASP is one that changes based on local prescribing trends and resistance patterns while focusing on a patient as an individual.
Author disclosures
The authors report no actual or potential conflicts of interest with regard to this article.
Disclaimer
The opinions expressed herein are those of the authors and do not necessarily reflect those of Federal Practitioner, Frontline Medical Communications Inc., the U.S. Government, or any of its agencies. This article may discuss unlabeled or investigational use of certain drugs. Please review complete prescribing information for specific drugs or drug combinations—including indications, contraindications, warnings, and adverse effects—before administering pharmacologic therapy to patients.
1. U.S. Department of Veterans Affairs, Veterans Health Administration. Antimicrobial Stewardship Programs (ASP). VHA Directive 1031. U.S. Department of Veterans Affairs Website. http://www.va.gov/vhapublications/ViewPublication.asp?pub_ID=2964. Updated January 22, 2014. Accessed August 4, 2015.
2. Centers for Disease Control and Prevention. Antibiotic Resistance Threats in the United States, 2013. Centers for Disease Control and Prevention Website. http://www.cdc.gov/drugresistance/threat-report-2013/pdf/ar-threats-2013-508.pdf. Published April 23, 2013. Accessed August 4, 2015.
3. Pyrek K. Bugs without borders: the global challenge of MDROs. Infect Control Today. 2013;17(2):1-8.
4. Pasquale T, Trienski TL, Olexia DE, et al. Impact of an antimicrobial stewardship program on patients with acute bacterial skin and skin structure infections. Am J Health Syst Pharm. 2014;71(13):1136-1139.
5. D’Agata EM. Antimicrobial use and stewardship programs among dialysis centers. Semin Dial. 2013;26(4):457-464.
6. Zvonar R, Natarajan S, Edwards C, Roth V. Assessment of vancomycin use in chronic hemodialysis patients: room for improvement. Nephrol Dial Transplant. 2008;23(11):3690-3695.
7. Snyder, GM, Patel PR, Kallen AJ, Strom JA, Tucker JK, D’Agata EM. Antimicrobial use in outpatient hemodialysis units. Infect Control Hosp Epidemiol. 2013;34(4):349-357.
8. Rosa RG, Goldani LZ, dos Santos RP. Association between adherence to an antimicrobial stewardship program and mortality among hospitalised cancer patients with febril neutropaenia: a prospective cohort study. BMC Infect Dis. 2014;14:286.
9. Nowak MA, Nelson RE, Breidenbach JL, Thompson PA, Carson PJ. Clinical and economic outcomes of a prospective antimicrobial stewardship program. Am J Health Syst Pharm. 2012;69(17):1500-1508.
10. Doron S, Nadkarni L, Lyn Price L, et al. A nationwide survey of antimicrobial stewardship practices. Clin Ther. 2013;35(6):758-765.
11. Dellit TH, Owens RC, McGowan JE Jr, et al; Infectious Diseases Society of America; Society for Healthcare Epidemiology of America. Infectious Diseases Society of America and the Society for Healthcare Epidemiology of America guidelines for developing an institutional program to enhance antimicrobial stewardship. Clin Infect Dis. 2007;44(2):159-177.
12. Griffith M, Postelnick M, Scheetz M. Antimicrobial stewardship programs: methods of operation and suggested outcomes. Expert Rev Anti Infect Ther. 2012;10(1):63-73.
13. U.S. Department of Veterans Affairs Office of Inspector General. Combined Assessment Program Summary Report: Management of Multidrug-Resistant Organisms in Veterans Health Administration Facilities. Report No. 11-02870-04. U.S. Department of Veterans Affairs Website. http://www.va.gov/oig/pubs/VAOIG-11-02870-04.pdf. Updated October 14, 2011. Accessed August 4, 2015.
14. Roselle GA, Neuhauser M, Kelly A, Vandenberg P. 2012 Survey of antimicrobial stewardship in VA. Washington, DC: Department of Veterans Affairs; 2013.
An antimicrobial stewardship program (ASP) is designed to provide guidance for the safe andcost-effective use of antimicrobial agents. This evidence-based approach addresses the correct selection of antimicrobial agents, dosages, routes of administration, and duration of therapy. In other words, the ASP necessitates the right drug, the right time, the right amount, and the right duration.1 The ASP reduces the development of multidrug-resistant organisms (MDROs), adverse drug events (such as antibiotic-associated diarrhea and renal toxicity), hospital length of stay, collateral damage (development of Clostridium difficile colitis), and health care costs. Review of the literature has shown the ASP reduces hospital stays among patients with acute bacterial-skin and skin-structure infections along with other costly infections.2
The ASP is not a new concept, but it is a hot topic. A successful ASP cannot be achieved without the support of the hospital leadership to determine and provide the needed resources. Its success stems from being a joint collaborative effort between pharmacy, medicine, infection control (IC), microbiology, and information technology. The purpose of the ASP is to ensure proper use of antimicrobials within the health care system through the development of a formal, interdisciplinary team. The primary goal of the ASP is to optimize clinical outcomes while minimizing unintended consequences related to antimicrobial usage, such as toxicities or the emergence of resistance.
In today’s world, health care clinicians are dealing with a global challenge of MDROs such as Enterococcus faecium, Staphylococcus aureus (S aureus), Klebsiella pneumonia, Acinetobacter baumanii, Pseudomonas aeruginosa, and Enterobacter species (ESKAPE), better known as “bugs without borders.”3 According to the CDC, antibiotic-resistant infections affect at least 2 million people in the U.S. annually and result in > 23,000 deaths.2 According to Thomas Frieden, director of the CDC, the pipeline of new antibiotics is nearly empty for the short term, and new drugs could be a decade away from discovery and approval by the FDA.2
Literature Review
Pasquale and colleagues conducted a retrospective, observational chart review on 62 patients who were admitted for bacterial-skin and skin-structure infections (S aureus, MRSA, MSSA, and Pseudomonas aeruginosa).4 The data examined patient demographic characteristics, comorbidities, specific type of skin infection (the most common being cellulitis, major or deep abscesses, and surgical site infections), microbiology, surgical interventions, and recommendations obtained from the ASP committee.
The ASP recommendations were divided into 5 categories, including dosage changes, de-escalation, antibiotic regimen changes, infectious disease (ID) consults, and other (not described). The ASP offered 85 recommendations, and acceptance of the ASP recommendations by physicians was 95%. The intervention group had a significantly lower length of stay (4.4 days vs 6.2 days, P < .001); and the 30-day all-cause readmission rate was also significantly lower (6.5% vs 16.71%, P = .05). However, the skin and skin-related structures readmission rate did not differ significantly (3.33% vs 6.27%). It was impossible for the investigators to determine exact differences in the amount of antimicrobials used in the intervention group vs the historical controls, because the historical data were based on ICD-9 codes, which may explain the nonsignificant finding.4
D’Agata reviewed the antimicrobial usage and ASP programs in dialysis centers.5 Chronic hemodialysis patients with central lines were noted to have the greatest rate of infections and antibiotic usage (6.4 per 100 patient months). The next highest group was dialysis patients with grafts (2.4 per 100 patient months), followed by patients with fistulas (1.8 per 100 patient months). Vancomycin was most commonly chosen for all antibiotic starts (73%). Interestingly, vancomycin was followed by cefazolin and third- and/or fourth-generation cephalosporin, which are risk factors for the emergence of multidrug-resistant, Gram-negative bacteria that are highly linked to increased morbidity and mortality rates. The U.S. Renal Data System stated in its 2009 report that the use of antibiotic therapy has increased from 31% in 1994 to 41% in 2007.5
In reviewing inappropriate choices of antimicrobial prescribing, D’Agata compared prescriptions given to the Healthcare Infection Control Practices Advisory Committee to determine whether the correct antibiotic was chosen. In 164 vancomycin prescriptions, 20% were categorized as inappropriate.5 In another study done by Zvonar and colleagues, 163 prescriptions of vancomycin were reviewed, and 12% were considered inappropriate.6
Snyder and colleagues examined 278 patients on hemodialysis, and over a 1-year period, 32% of these patients received ≥ 1 antimicrobial with 29.8% of the doses classified as inappropriate.7 The most common category for inappropriate prescribing of antimicrobials was not meeting the criteria for diagnosing infections (52.9% of cases). The second leading cause of inappropriate prescription for infections was not meeting criteria for diagnosing specific skin and skin-structure infections (51.6% of cases). Another common category was failure to choose a narrower spectrum antimicrobial prescription (26.8%).7 Attention to the indications and duration of antimicrobial treatment accounted for 20.3% of all inappropriate doses. Correction of these problems with use of an ASP could reduce the patient’s exposure to unneeded or inappropriate antibiotics by 22% to 36% and decrease hospital costs between $200,000 to $900,000.5
Rosa and colleagues discussed adherence to an ASP and the effects on mortality in hospitalized cancer patients with febrile neutropenia (FN).8 A prospective cohort study was performed in a single facility over a 2-year period. Patients admitted with cancer and FN were followed for 28 days. The mortality rates of those treated with ASP protocol antibiotics were compared with those treated with other antibiotic regimens. One hundred sixty-nine patients with 307 episodes of FN were included. The rate of adherence to ASP recommendations was 53% with the mortality of this cohort 9.4% (29 patients).8
Older patients were more likely to be treated according to ASP recommendations, whereas patients with comorbidities were not treated with ASP guidelines, Rosa and colleagues noted.8 No explanation was given, but statistical testing did uphold these findings, ensuring that the results were correctly interpreted. The 28-day mortality during FN was related to several factors, including nonadherence with ASP recommendations (P = .001) relapsing diseases stages (P = .001), and time to antibiotic start therapy > 1 hour (P = .001). Adherence to the ASP was independently associated with a higher survival rate (P = .03), whereas mortality was attributable to infection in all 29 patients who died.
Nowak and colleagues reviewed the clinical and economic benefits of an ASP using a pre- and postanalysis of potential patients who might benefit from recommendations of the ASP.9 Subjects included adult inpatients with pneumonia or abdominal sepsis. Recommendations from ASP that were followed decreased expenditures by 9.75% during the first year and remained stable in the following years. The cumulative cost savings was about $1.7 million. Rates of nosocomial infections decreased, and pre- and postcomparison of survival and lengths of stay for patients with pneumonia (n = 2,186) or abdominal sepsis (n = 225) revealed no significant differences. Investigators argued that this finding may have been due to the hospital’s initiation of other concurrent IC programs.
Doron and colleagues conducted a survey identifying characteristics of ASP practices and factors associated with the presence of an ASP.10 Surveys were received from 48 states (North and South Dakota were not included) and Puerto Rico. Surveys were received from 406 providers, and 96.4% identified some form of ASP. Barriers to implementation included staffing constraints (69.4%) and insufficient funding (0.6%).10
About 38% of the responses stated ASP was being used for adults and pediatric patients, whereas 58.8% were used for adults only.10 The ASP teams were composed of a variety of providers, including infectious disease (ID) physicians (70.7%), IC professionals (51.1%), and clinical microbiologists (38.6%). Additional barriers to implementing an ASP were found as insufficient medical staff buy-in (32.8%), not high on the priority list (22.2%), and too many other things to consider or deal with at the time (42.8%). Interestingly, 41.1% of the subjects in facilities without an ASP responded that providers agree with limiting the use of antimicrobials compared with 66.9% of subjects in hospitals with an ASP. Factors linked to having an ASP included having an ID consultation service, an ID fellowship program, an ID pharmacist, larger hospitals, annual admissions > 10,000, having a published antibiogram, and being a teaching hospital.
Establishment of an ASP
The Infectious Diseases Society of America (IDSA) and the Society for Healthcare Epidemiology of America (SHEA) issued guidelines in 2007 for developing an institutional ASP to enhance antimicrobial stewardship and help prevent antimicrobial resistance in hospitals.11 The ASP may vary among facilities based on available resources.
When developing an ASP, 2 core strategies are necessary. The core measures are proactive and are usually conducted by an ID clinical pharmacist assigned to the ASP in collaboration with the ID physician. These strategies are not mutually exclusive and include a prospective audit with interventions provided to the clinicians, resulting in decreased inappropriate use of antimicrobials or a formulary restriction and preauthorization to help reduce antimicrobial usage and related cost.
Supplemental elements may be considered and prioritized as to the core antimicrobial stewardship strategies based on local practice pattern and resources.11 Factors to consider include education, which is considered to be an essential element of the ASP. Although education is important, it alone is only somewhat effective in changing clinicians’ prescribing practices. Guidelines and clinical pathways are elements set forth in institutional management protocols for common and potentially serious infections such as intravascular catheter-related infections, hospital- and community-acquired pneumonia, bloodstream infections, and complicated urinary tract infections among other types.
Another consideration is antimicrobial cycling. This process refers to the specific schedule of alternating specific antimicrobials or antimicrobial classes to prevent or reverse the development of antimicrobial resistance. Insufficient data on antimicrobial cycling currently exist to affect major changes in practice. This element, however, could be implemented in certain institutions if needed based on the reported bacterial resistance pattern.
Antimicrobial order forms can be used to help monitor the implementation of formulated institutional clinical practice pathways. However, the authors feel that documenting this indication in the clinician notes may be adequate and save time for everyone involved; additionally, reviewing combination therapy, which if avoided, may prevent the emergence of resistance. Although combination therapy is needed in certain clinical diagnostic situations, careful consideration of its use is essential.
Streamlining or de-escalation of therapy by using a narrower spectrum agent, based on culture and sensitivity results, prevents duplicative therapy with a patient when double coverage is not indicated or intended. Another goal is the discontinuation of therapy based on negative culture results and lack of supporting clinical signs and symptoms of infection. Dose optimization and adjustment should also be reviewed. Using the appropriate antimicrobial dose based on the specific pathogen, patient characteristic, source of infection, along with the pharmacokinetic and pharmacodynamics should be reviewed to prevent antimicrobial overuse and subsequent potentially avoidable adverse effects.
Parenteral to oral conversion from IV to oral administration (IV to oral) antimicrobials must be considered when the patient is clinically and hemodynamically stable, thus limiting the length of hospital stays and health care costs. However, it is important to keep in mind pharmacokinetic studies examining the bioavailability of antibiotics are usually conducted with healthy volunteers. Therefore, when treating patients who are elderly, on multiple medications, or severely ill, proper usage of these antibiotics is required. Also, having antibiotics with excellent bioavailability does not necessarily mean switching from IV to oral routes when treating serious infections such as bacteremia. Special consideration should be given when changing the route of administration. In addition, approval—or at least notification by the treating physician or ID specialist—should be included in the absence of an institutional policy, allowing for automatic IV to oral conversion.
The ASP Team
The participation of specific clinicians has been suggested as key to having a successful ASP team.12 Members should include an ID physician (director) who serves as the lead physician and supervises the overall function of the ASP, makes recommendations to the ASP team, and contributes to the educational activities. A clinical ID pharmacist (codirector) provides suggestions to clinicians on preferred first-line antimicrobials and reviews medication orders for antimicrobials and resistance patterns, microbiological data, patient data, and clinical information. The codirector also tracks any ASP-related data and submits monitoring reports on a regular basis.
If accessible, an IC professional should participate, implementing and monitoring prevention strategies that decrease health care-associated infections. These infections play a significant role in reducing MDROs and decreasing the use of antibiotics. Additionally, the IC professional can assist in the early identification of patients with MDROs, aid patient placement on transmission-based precautions, and flag a patient in the medical record for hightened awareness. Also, IC professionals promote hand hygiene, standard precautions, and contribute to infection prevention strategies, such as hospital bundle practices, to prevent catheter-associated bloodstream infections and ventilator-associated pneumonias, among others.
If possible, a microbiologist who can prepare culture and susceptibility data to optimize antimicrobial management and conduct timely documentation of microbial pathogens should be a member of the team. Microbiologists can report organism susceptibility, assist in the surveillance of specific organisms, and provide early identification of patients with MDROs that require transmission-based precautions. The microbiologist can perform a semiannual update of a local antibiogram while reporting antimicrobial susceptibility profiles. Based on the information gathered, microbiologists can provide new drug panels to the members of the ASP, who will decide which antibiotic panel will be used. Another possible member of the ASP team is a program analyst who provides data retrieval, performs data analysis, and delivers necessary reports to the team.
It is the responsibility of medical staff to review and implement suggestions made by the ASP when appropriate. However, these suggestions are not considered a substitute for clinical decisions, and discretion is required when treating individual patients. The VHA, in response to the IDSA/SHEA published guidelines, chartered an antimicrobial stewardship task force in May 2011 with the sole purpose “To optimize the care of Veterans by developing, deploying and monitoring a national-level strategic plan for improvements in antimicrobial therapy management.”1 In 2011, the Office of Inspector General in a combined assessment program summary report for management of MDROs in VHA facilities recommended that “the Under Secretary for Health, in conjunction with VISN and facility senior managers, ensures that facilities develop policies and programs that control and reduce antimicrobial agent use.”13
In 2012, the VHA conducted a survey to obtain baseline data regarding ASP activities, presence of dedicated personnel, current related practice policies, available resources, and outcomes. There were 140 voluntary participating VA facilities, of which 130 had inpatient services. The survey found that 26 facilities (20%) did not have an attending ID physician, 49 facilities (38%) reported having an ASP, 19 facilities (15%) had developed policy in place addressing de-escalation of antimicrobials, 87 facilities (67%) had not developed a business plan for an ASP, and 61 facilities (47%) had completed a medication usage evaluation.14 Feedback following the analysis of the survey data recommended integrating more ID personnel as needed, along with the development of ASP teams for all facilities with inpatient services, who would have the authority to change the antimicrobial therapy selection and have policies in place related to ASP principles.
Conclusions
Increased MDROs and decreased anti-infective development requires stricter management of antibiotics. An ASP is essential in any hospital or health care facility to decrease the incidence of resistance and improve patient care. The ASP is a collaborative effort that involves multiple specialties and departments. A successful ASP is one that changes based on local prescribing trends and resistance patterns while focusing on a patient as an individual.
Author disclosures
The authors report no actual or potential conflicts of interest with regard to this article.
Disclaimer
The opinions expressed herein are those of the authors and do not necessarily reflect those of Federal Practitioner, Frontline Medical Communications Inc., the U.S. Government, or any of its agencies. This article may discuss unlabeled or investigational use of certain drugs. Please review complete prescribing information for specific drugs or drug combinations—including indications, contraindications, warnings, and adverse effects—before administering pharmacologic therapy to patients.
1. U.S. Department of Veterans Affairs, Veterans Health Administration. Antimicrobial Stewardship Programs (ASP). VHA Directive 1031. U.S. Department of Veterans Affairs Website. http://www.va.gov/vhapublications/ViewPublication.asp?pub_ID=2964. Updated January 22, 2014. Accessed August 4, 2015.
2. Centers for Disease Control and Prevention. Antibiotic Resistance Threats in the United States, 2013. Centers for Disease Control and Prevention Website. http://www.cdc.gov/drugresistance/threat-report-2013/pdf/ar-threats-2013-508.pdf. Published April 23, 2013. Accessed August 4, 2015.
3. Pyrek K. Bugs without borders: the global challenge of MDROs. Infect Control Today. 2013;17(2):1-8.
4. Pasquale T, Trienski TL, Olexia DE, et al. Impact of an antimicrobial stewardship program on patients with acute bacterial skin and skin structure infections. Am J Health Syst Pharm. 2014;71(13):1136-1139.
5. D’Agata EM. Antimicrobial use and stewardship programs among dialysis centers. Semin Dial. 2013;26(4):457-464.
6. Zvonar R, Natarajan S, Edwards C, Roth V. Assessment of vancomycin use in chronic hemodialysis patients: room for improvement. Nephrol Dial Transplant. 2008;23(11):3690-3695.
7. Snyder, GM, Patel PR, Kallen AJ, Strom JA, Tucker JK, D’Agata EM. Antimicrobial use in outpatient hemodialysis units. Infect Control Hosp Epidemiol. 2013;34(4):349-357.
8. Rosa RG, Goldani LZ, dos Santos RP. Association between adherence to an antimicrobial stewardship program and mortality among hospitalised cancer patients with febril neutropaenia: a prospective cohort study. BMC Infect Dis. 2014;14:286.
9. Nowak MA, Nelson RE, Breidenbach JL, Thompson PA, Carson PJ. Clinical and economic outcomes of a prospective antimicrobial stewardship program. Am J Health Syst Pharm. 2012;69(17):1500-1508.
10. Doron S, Nadkarni L, Lyn Price L, et al. A nationwide survey of antimicrobial stewardship practices. Clin Ther. 2013;35(6):758-765.
11. Dellit TH, Owens RC, McGowan JE Jr, et al; Infectious Diseases Society of America; Society for Healthcare Epidemiology of America. Infectious Diseases Society of America and the Society for Healthcare Epidemiology of America guidelines for developing an institutional program to enhance antimicrobial stewardship. Clin Infect Dis. 2007;44(2):159-177.
12. Griffith M, Postelnick M, Scheetz M. Antimicrobial stewardship programs: methods of operation and suggested outcomes. Expert Rev Anti Infect Ther. 2012;10(1):63-73.
13. U.S. Department of Veterans Affairs Office of Inspector General. Combined Assessment Program Summary Report: Management of Multidrug-Resistant Organisms in Veterans Health Administration Facilities. Report No. 11-02870-04. U.S. Department of Veterans Affairs Website. http://www.va.gov/oig/pubs/VAOIG-11-02870-04.pdf. Updated October 14, 2011. Accessed August 4, 2015.
14. Roselle GA, Neuhauser M, Kelly A, Vandenberg P. 2012 Survey of antimicrobial stewardship in VA. Washington, DC: Department of Veterans Affairs; 2013.
Assessment of a Mental Health Residential Rehabilitation Treatment Program As Needed Medication List
The Mental Health Residential Rehabilitation Treatment Program (MHRRTP) is an essential part of the mental health services offered at the Clement J. Zablocki VAMC (ZVAMC) in Milwaukee, Wisconsin. Across the nation, there are about 250 MHRRTPs, which are designed to provide rehabilitation and treatment services to veterans ranging in age from 18 to 80 years, with medical conditions, mental illness, addiction, or psychosocial deficits.1 About 900 patients were admitted to the ZVAMC MHRRTP in 2013.
Background
Prior to 2010, pharmacy administrators recognized that many MHRRTP patients were inappropriately using emergency care services (ECS) to obtain treatments for simple ailments that often required only the use of over-the-counter medications. This was likely associated with the Safe Medication Management (SMM) Policy as defined in Professional Services Memorandum VII-29.2,3 This policy states that MHRRTP patients are not allowed to bring in any home medications—all medications are reconciled and readministered on admission in an effort to reduce diversion.
A lack of 24-hour-per-day provider availability forced patients to find treatment elsewhere. A 6-month review was completed in 2010, which identified all of the MHRRTP patients who used ECS, their chief medical condition, and the medication(s) that were administered to each patient. This review identified a total of 254 ECS visits made by MHRRTP patients during this period. Twenty percent of these visits resulted in prescriptions for over-the-counter medications. As a result, an as needed (PRN) medication list was created for patients to have medications readily available for simple ailments with nursing oversight (Box). The goal of the PRN medication list is to reduce the amount of unnecessary ECS visits, decrease unnecessary cost, and improve treatment efficiency and overall patient care.
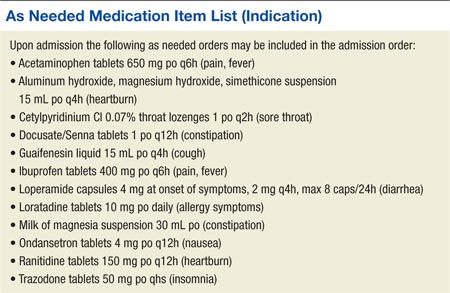
Treatment Programs
The ZVAMC MHRRTP has 189 beds divided among 7 different 6-week treatment programs, including General Men’s Program (GEN), Substance Abuse Rehabilitation (SAR), Posttraumatic Stress Disorder (PTSD), Women’s Program (WOM), Operation Enduring Freedom/Operation Iraqi Freedom/Operation New Dawn (OEF/OIF/OND), Domiciliary Care for Homeless Veterans (DCHV), and Individualized Addiction Consultation Team (I-ACT).4
The treatment programs within the MHRRTP at the ZVAMC address goals of rehabilitation, recovery, health maintenance, improved quality of life, and community integration in addition to specific treatment of medical conditions, mental illnesses, addictive disorders, and homelessness. Various levels of care are available through the program, based on the needs of each veteran. This care generally provides methods to enhance patients’ functional status and psychosocial rehabilitation.
A SMM program is used to ensure safe and effective medication use for all patients in the MHRRTP.2 As a result, the patients are admitted to the MHRRTP with inpatient status, and the medication delivery procedure varies based on the veteran’s ability to take medication independently. Veterans are assisted in developing self-care skills, which include comprehensive medication education. The goal of the SMM program is to give patients the assistance to eventually manage their medications independently.
MHRRTP Staffing
The MHRRTP must have adequate staffing in order to provide safe and effective patient care. Program staffing patterns are based on workload indicators and a bed-to-staff ratio.4 The MHRRTP is a multidisciplinary program; however, the only providers who can address medication issues are the 1.2 full-time employee equivalent MHRRTP psychiatrists. Unfortunately, the psychiatrists are not available for triage on nights, weekends, or holidays.
The role of the psychiatrist is to focus on the mental health needs of the MHRRTP patients, not the primary care medical concerns, which are the main reason for ECS visits. With the current model, providers are sometimes unavailable to meet the emergent needs of patients in the MHRRTP, and patients may be forced to choose between using ECS or leaving the concern unaddressed. Patients’ needs vary from mild to serious emergent needs but may not necessarily require full emergency assessments. For example, if a patient has a headache and a physician is not available to write an order for acetaminophen, the patient may need to visit the ECS to obtain a medication that otherwise would have been readily available at home. The restrictions are designed to promote medication safety, prevent medication diversion and misuse, and be in compliance with regulatory agencies (eg, The Joint Commission and the Commission on Accreditation of Rehabilitation Facilities).
ECS Use
During fiscal year 2010, pharmacy administrators discovered that many patients were using ECS to obtain medications for nonemergent conditions. Inappropriate and unnecessary use of ECS by MHRRTP patients delayed treatment, increased wait times for veterans in need of emergent care, and increased the cost of caring for simple ailments. To put this into perspective, the average cost of all conditions at the ZVAMC during the 2013 fiscal year was $657 per ECS visit, while the total cost of ECS was about $14 million.
In response to the inappropriate ECS use, the ZVAMC created a PRN medication list in 2010, which is offered to all MHRRTP patients, with the goal of reducing the number of patients inappropriately using ECS for minor ailments and providing more efficient and cost-effective patient care.2 The MHRRTP PRN medication list is initially evaluated by the admitting psychiatrist or nurse practitioner and mental health clinical pharmacy specialist completing the admission orders for appropriateness based on each patient’s comorbidities, medication regimen, and past medical history. For example, if a new patient with liver dysfunction is admitted to the MHRRTP, acetaminophen would not be made available due to an increased risk of hepatotoxicity. The other PRN medications would still be available for the patient if clinically appropriate.
Once the PRN medications are ordered, the MHRRTP nurse can assess a patient’s condition and administer the medication(s) to the patient as indicated. For instance, if a patient requests ibuprofen for pain, the nurse will document an initial pain score and administer the ibuprofendose. As a result, the patient obtains more efficient and convenient care and does not need to wait for a provider to become available or use ECS. Per ZVAMC policy, the nurse has 96 hours to reassess the PRN medication effectiveness; however, this is typically done within the same shift. Since the implementation of the PRN medication list, no formal assessment has been completed.
To the authors’ knowledge, the ZVAMC is the only MHRRTP in the VHA system that incorporates a PRN medication list in the admission orders to reduce unnecessary ECS visits. After completing a thorough literature review and contacting the national VA mental health pharmacist listserve, no studies discussing the use of PRN medication lists in this setting were identified, and no sites offered information as to a similar practice in place.
Methods
A randomized, retrospective case-controlled study involving a chart review was completed for patients admitted to the MHRRTP at the ZVAMC pre- and postimplementation of the MHRRTP PRN medication list between April 2010 and August 2010 and between April 2013 and August 2013, respectively. The ZVAMC is a teaching institution. This study was approved by the ZVAMC institutional review board.
Patients were eligible for the study if they were male, aged > 18 years, and admitted during the study period for treatment in the GEN or SAR programs at the ZVAMC for at least 4 weeks. Patients were excluded if they were female, admitted to the hospital after being seen by ECS, or if they were receiving treatment in the following programs: PTSD, WOM, OEF/OIF/OND, DCHV, and I-ACT. Patients studied in 2010 served as the control group, and patients studied in 2013 were the treatment group.
Objectives
The primary objective of this study was to evaluate the use of the current PRN medication list. Secondary objectives included the evaluation of the use of ECS by patients admitted to the MHRRTP pre- and postimplementation of the PRN medication list, the potential cost reduction due to avoided ECS use, and nurse and patient satisfaction with the PRN medication list.
Data
A list of all patients admitted to the MHRRTP at the ZVAMC between April and August of 2010 and 2013 was generated using the Veterans Health Information Systems and Technology Architecture (VISTA)system. The Computerized Patient Record System (CPRS) was used to evaluate the patient for inclusion and collect pertinent data. The PRN medication list was implemented on September 15, 2010. Data collection terminated as of September 14, 2010, regardless of discharge status. All data collected for this study were entered and stored in a database created by the authors. A table with set criteria to review was created for the 2010 and 2013 group to ensure standardization. The pharmacy resident reviewed all of the patient charts. The following data were collected for each patient in the 2010 group:
- Demographic data: Patient name, last 4 digits of their social security number, age
- Program information: Admitted to GEN or SAR program, admission and discharge date, duration of stay, reason for discharge
- ECS data: Date, type of visit, chief condition, medications administered during the visit, whether the visit resulted in a hospital admission, and whether the visit was avoidable
- Avoidable visit: visit in which the patient received or could have received medication(s) that are on the PRN medication list at the ECS visit to treat their illness
The same information was collected for each patient in the 2013 group in addition to the following: PRN medication data (medications administered from the PRN medication list and the number of times each medication was administered if applicable); and ECS data (along with the aforementioned data, it was noted if PRN medications were taken prior to the ECS visit).
In addition, nurse and patient satisfaction with the PRN medication list were assessed via a simple satisfaction survey. The survey was given to 120 patients admitted to the MHRRTP as well as to 32 nurses at the time of distribution. A cover letter on each survey explained the study and informed the patient that the survey was voluntary and anonymous. Satisfaction was based on 10-point scale, with 1 (lowest) and 10 (highest) in satisfaction. Additional questions were asked to identify areas of improvement (see eAppendixes A and B for patient and nurse surveys, respectively).
Statistical Analysis
Descriptive statistics were used to analyze collected data. The primary outcome was assessed for the group admitted postintervention by calculating the average number of times each medication on the PRN medication list was used per patient during their length of stay (LOS) as applicable. The administration totals for each medication on the PRN medication list during the postintervention study period were also recorded.
Secondary outcomes were assessed by comparing the recorded total number of ECS visits pre- and postimplementation. Additionally, the average number of ECS visits per admission and the number of avoidable ECS visits were recorded for each study group. The cost reduction from avoided ECS use was estimated by calculating the total cost of ECS used pre- and postimplementation. The difference between the number of avoidable ECS visits in the pre- and postintervention groups was assessed for statistical significance by using a chi-square test. The 2013 cost saving estimation was based on the average ECS visit cost in the 2013 fiscal year ($657). Of note, power for this study could not be calculated as this has not been studied prior; therefore, no precedence has been set.
Results
On completion of the data collection, 583 patients were assessed for inclusion into the study, 325 in the 2010 preimplementation group and 258 in the 2013 postimplementation group. A total of 200 patients were randomized in each group (n = 400); however, 69 (35%) and 63 (32%) were excluded from the 2010 group and 2013 group, respectively. Sample demographics are described in the Table.
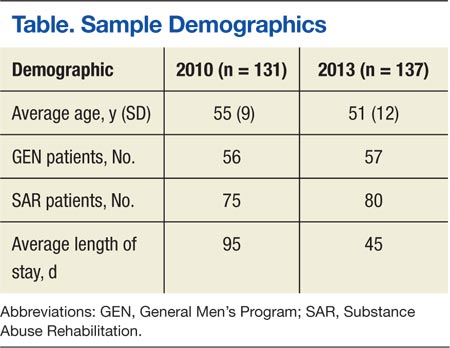
PRN Medication and ECS Use
Between April 1, 2013, and September 14, 2013, 3,959 doses of PRN medications were administered to MHRRTP patients who were included in the study (Figure). Prior to accessing ECS for their problem, 22 (36%) of the 61 patients who used ECS had trialed the PRN medication(s).
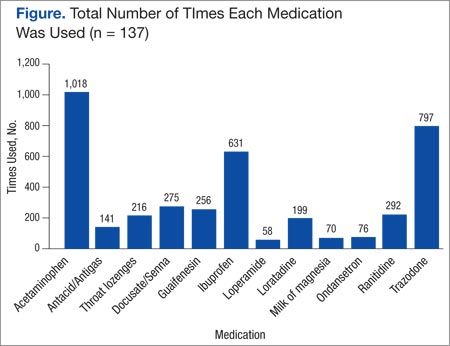
When comparing the total number of ECS visits, the 2010 group had 145 visits and the 2013 group had 96 visits. The preimplementation group averaged 1.1 ECS visits per MHRRTP admission, whereas the postimplementation group averaged 0.7 ECS visits per admission. The difference in the number of avoidable ECS visits was statistically significant, with the 2010 group totaling 15 avoidable visits, while the 2013 group totaled 1 ECS visit (P = .0045).
It was estimated that 9 (9.3%) ECS visits were avoided due to the PRN medication list in 2013. Using 137 patients, who were included in the postimplementation group, it can be calculated that $5,867 was saved due to the PRN medication list, or $42.83 per patient in 2013. Using the 2013 MHRRTP census of 898 patients, the financial impact of the PRN medication list can be extrapolated to produce an estimated annual cost savings of $38,461.
Patient and Nurse Satisfaction
Of the 120 patients given the patient satisfaction questionnaire, 28 (23%) patients responded. Of the respondents, 25 (89%) stated they were aware of the PRN medication list. The median rank of satisfaction reported was 8 on a 10-point scale. Twenty-two (79%) patients felt that the PRN medication list had or may have reduced the need to go to ECS or urgent care. Twenty-three (82%) patients recommended not removing any drugs listed on the PRN medication list.
Of the 32 registered nurses and licensed practical nurses working in the MHRRTP, 7 (22%) responded to the nurse satisfaction questionnaire. Of the respondents, 6 (86%) stated they discuss the PRN medication list during admission assessments every time or most of the time. The median rank of satisfaction was 9 on a 10-point scale. Four (57%) nurses felt patients had a clear understanding of the PRN medication list, and 100% of nurses stated they had enough guidance on situations to administer the medications. Seven (100%) stated that the PRN medication list had not caused adverse events; however, 5 (71%) stated that the list had been used inappropriately.
Discussion
This retrospective case-controlled study of 400 patients revealed high use of the PRN medication list and a cost avoidance of nearly $40,000. Although this represents a small reduction of the annual ECS budget, the PRN medication list also improved patient care by providing more efficient and convenient access to medications. The most commonly used medications were acetaminophen, trazodone, and ibuprofen. In addition, the nursing and patient surveys demonstrated an overall satisfaction with the current PRN medication list. It is important to note that the number of avoidable ECS visits decreased significantly after the implementation of the PRN medication list in 2010.
Roughly 35% of patients in each group were excluded from the study. The main exclusion criteria included a < 4-week LOS, being admitted to the hospital, being female, and being admitted prior to the study period. Women veterans were treated through different programs prior to the implementation of the PRN medication list; therefore, they were excluded to decrease variability. Only patients in the GEN and SAR programs were included, because they were well established prior to and after the intervention. The other programs, which included PTSD, WOM, OEF/OIF/OND, DCHV, and I-ACT, accounted for about one-third of MHRRTP admissions. However, they were not all available or structured similarly in 2010. Including the other programs would have increased variability.
Survey Results
Although the response rates were low, the patient and nurse satisfaction surveys revealed useful information that may assist in identifying the strengths and weaknesses of the current program. More rigorous surveying needs to be conducted to make the results more generalizable. Fifty percent of patients reported using a PRN medication on a daily basis or 3 times per week. However, 28.6% stated they never used the PRN medication list, which was thought to be an overestimation due to an incomplete understanding of what medications are on the PRN medication list. This finding does not correlate with the high use demonstrated with the actual number of PRN medications used.
Two patients marked “other,” one reported using the list when they “need the medication,” and another did not mark an answer. Similarly, 57.1% of the nursing staff reported offering a PRN medication on a daily basis and discussing the list on admission every time. However, 28.6% of nursing staff stated they do not complete admission assessments or work in the medication room, most likely because they are licensed practical nurses and do not have those responsibilities. Interestingly, when asked about medications that should be removed from the PRN medication list, 1 nurse suggested removing trazodone, which was the second most used drug. Some of the medications patients suggested adding to the PRN medication list included creams for dry skin or fungal infections, calcium carbonate, and pain medications such as tramadol, aspirin, and naproxen. Nurses suggested adding aspirin, diphenhydramine, and nicotine gum. These responses will aid in enhancing the current PRN medication list by potentially increasing the types of medications offered.
Limitations
This study has several limitations that may affect its interpretation. The study was retrospective in nature and had a short study period. The data were collected from a single specialty program, which decreases the study’s generalizability, as not all VAMCs have a MHRRTP. Also, the average LOS in 2010 was longer than in 2013. This was related to the restructuring of the MHRRTP in the spring of 2013 to allow for more condensed programming. As a result, it may be reasonable to infer that there were more ECS visits prior to implementation of the PRN medication list due to the longer LOS in 2010. This confounding variable was minimized by normalizing the calculation for the number and percent of ECS visits avoided.
The patient population was limited to male veterans and the satisfaction questionnaires had low response rates. The low patient response rate may have been due to a lack of incentive, decreased health literacy, or possibly lack of time. The low nurse response rate may have been due to limited time and also lack of incentive. A larger response rate may have increased the PRN medication list use and satisfaction reported. This study looked at the change in the number of ECS visits; but, it did not investigate any changes in the number of primary care visits. Patients were able to go to their primary care appointments during their stay in the MHRRTP and may have received medications listed on the PRN medication list at these appointments, which could have been avoided. Last, the accuracy of the documentation in CPRS may be unclear and may have subjected the study to bias. Unfortunately, ECS does not use bar code medication administration, so the administration of medications has to be manually written into the ECS visit note. This method may be vulnerable to human error.
Future Directions
Future directions from this study include discussing the results with the MHRRTP staff and identifying areas of improvement to enhance the medication list. Some discussion points include the reasoning to remove trazodone and examples of inappropriate use. Furthermore, the questions asked by patients and general
suggestions made by the nursing staff identified that increased patient education of the PRN medication list should be implemented during the admission assessment process. This would improve patient understanding and awareness of the PRN medication list, because some patients did not know about the list or what medications it included. Moving forward, the results of this project may provide incentive for future implementation of PRN medication lists at other VA MHRRTPs.
Conclusion
This study confirms that the MHRRTP PRN medication list has been highly used since its implementation in 2010. The study also suggests that the nursing staff and patients are satisfied with the current process. Furthermore, these findings illustrate the PRN medication list’s success at decreasing unnecessary use of ECS and its association with avoiding cost. Further studies are needed to support the results seen in this analysis. Although these discoveries are preliminary, they may provide incentive for future implementation of PRN medication lists at other VA MHRRTPs.
Acknowledgements
Michelle Bury had full access to all of the data in the study and takes responsibility for the integrity of the data and the accuracy of the data analysis.
Author disclosures
The authors report no actual or potential conflicts of interest with regard to this article.
Disclaimer
The opinions expressed herein are those of the authors and do not necessarily reflect those of Federal Practitioner, Frontline Medical Communications Inc., the U.S. Government, or any of its agencies. This article may discuss unlabeled or investigational use of certain drugs. Please review the complete prescribing information for specific drugs or drug combinations—including indications, contraindications, warnings, and adverse effects—before administering pharmacologic therapy to patients.
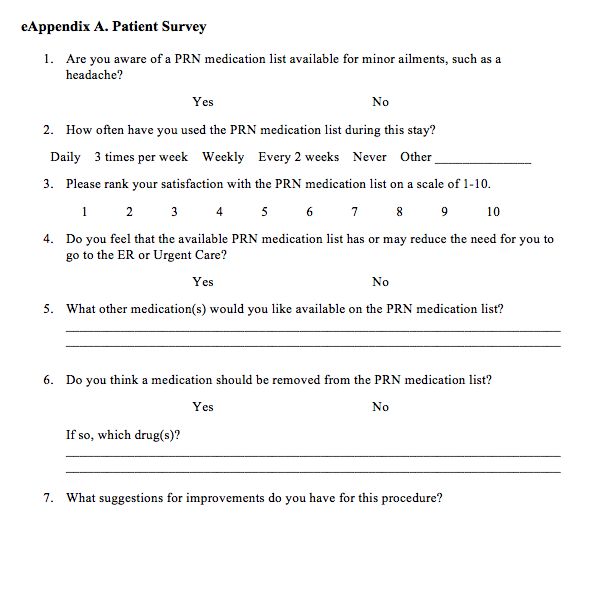
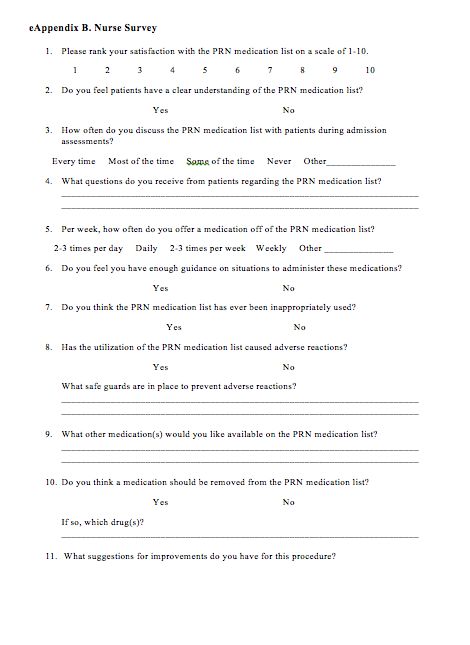
1. Department of Veterans Affairs. Mental Health Residential Rehabilitation Treatment Program. Washington, DC: Department of Veterans Affairs Website. https://vaww.portal.va.gov/sites/OMHS/mhrrtp/default.aspx. Accessed October 7, 2013.
2. Pharmacy Procedures for Safe Medication Management (SMM) in DOMs 123 and 43. Milwaukee, WI: Clement J. Zablocki VA Medical Center; September 2010.
3. Professional Services Memorandum VII-29. Milwaukee, WI: Clement J. Zablocki VA Medical Center; November 2010.
4. Petzel RA. Mental Health Residential Rehabilitation Treatment Program (MHRRTP): VHA Handbook 1162.02. Washington, DC: Veterans Health Administration; December 2010.
The Mental Health Residential Rehabilitation Treatment Program (MHRRTP) is an essential part of the mental health services offered at the Clement J. Zablocki VAMC (ZVAMC) in Milwaukee, Wisconsin. Across the nation, there are about 250 MHRRTPs, which are designed to provide rehabilitation and treatment services to veterans ranging in age from 18 to 80 years, with medical conditions, mental illness, addiction, or psychosocial deficits.1 About 900 patients were admitted to the ZVAMC MHRRTP in 2013.
Background
Prior to 2010, pharmacy administrators recognized that many MHRRTP patients were inappropriately using emergency care services (ECS) to obtain treatments for simple ailments that often required only the use of over-the-counter medications. This was likely associated with the Safe Medication Management (SMM) Policy as defined in Professional Services Memorandum VII-29.2,3 This policy states that MHRRTP patients are not allowed to bring in any home medications—all medications are reconciled and readministered on admission in an effort to reduce diversion.
A lack of 24-hour-per-day provider availability forced patients to find treatment elsewhere. A 6-month review was completed in 2010, which identified all of the MHRRTP patients who used ECS, their chief medical condition, and the medication(s) that were administered to each patient. This review identified a total of 254 ECS visits made by MHRRTP patients during this period. Twenty percent of these visits resulted in prescriptions for over-the-counter medications. As a result, an as needed (PRN) medication list was created for patients to have medications readily available for simple ailments with nursing oversight (Box). The goal of the PRN medication list is to reduce the amount of unnecessary ECS visits, decrease unnecessary cost, and improve treatment efficiency and overall patient care.
Treatment Programs
The ZVAMC MHRRTP has 189 beds divided among 7 different 6-week treatment programs, including General Men’s Program (GEN), Substance Abuse Rehabilitation (SAR), Posttraumatic Stress Disorder (PTSD), Women’s Program (WOM), Operation Enduring Freedom/Operation Iraqi Freedom/Operation New Dawn (OEF/OIF/OND), Domiciliary Care for Homeless Veterans (DCHV), and Individualized Addiction Consultation Team (I-ACT).4
The treatment programs within the MHRRTP at the ZVAMC address goals of rehabilitation, recovery, health maintenance, improved quality of life, and community integration in addition to specific treatment of medical conditions, mental illnesses, addictive disorders, and homelessness. Various levels of care are available through the program, based on the needs of each veteran. This care generally provides methods to enhance patients’ functional status and psychosocial rehabilitation.
A SMM program is used to ensure safe and effective medication use for all patients in the MHRRTP.2 As a result, the patients are admitted to the MHRRTP with inpatient status, and the medication delivery procedure varies based on the veteran’s ability to take medication independently. Veterans are assisted in developing self-care skills, which include comprehensive medication education. The goal of the SMM program is to give patients the assistance to eventually manage their medications independently.
MHRRTP Staffing
The MHRRTP must have adequate staffing in order to provide safe and effective patient care. Program staffing patterns are based on workload indicators and a bed-to-staff ratio.4 The MHRRTP is a multidisciplinary program; however, the only providers who can address medication issues are the 1.2 full-time employee equivalent MHRRTP psychiatrists. Unfortunately, the psychiatrists are not available for triage on nights, weekends, or holidays.
The role of the psychiatrist is to focus on the mental health needs of the MHRRTP patients, not the primary care medical concerns, which are the main reason for ECS visits. With the current model, providers are sometimes unavailable to meet the emergent needs of patients in the MHRRTP, and patients may be forced to choose between using ECS or leaving the concern unaddressed. Patients’ needs vary from mild to serious emergent needs but may not necessarily require full emergency assessments. For example, if a patient has a headache and a physician is not available to write an order for acetaminophen, the patient may need to visit the ECS to obtain a medication that otherwise would have been readily available at home. The restrictions are designed to promote medication safety, prevent medication diversion and misuse, and be in compliance with regulatory agencies (eg, The Joint Commission and the Commission on Accreditation of Rehabilitation Facilities).
ECS Use
During fiscal year 2010, pharmacy administrators discovered that many patients were using ECS to obtain medications for nonemergent conditions. Inappropriate and unnecessary use of ECS by MHRRTP patients delayed treatment, increased wait times for veterans in need of emergent care, and increased the cost of caring for simple ailments. To put this into perspective, the average cost of all conditions at the ZVAMC during the 2013 fiscal year was $657 per ECS visit, while the total cost of ECS was about $14 million.
In response to the inappropriate ECS use, the ZVAMC created a PRN medication list in 2010, which is offered to all MHRRTP patients, with the goal of reducing the number of patients inappropriately using ECS for minor ailments and providing more efficient and cost-effective patient care.2 The MHRRTP PRN medication list is initially evaluated by the admitting psychiatrist or nurse practitioner and mental health clinical pharmacy specialist completing the admission orders for appropriateness based on each patient’s comorbidities, medication regimen, and past medical history. For example, if a new patient with liver dysfunction is admitted to the MHRRTP, acetaminophen would not be made available due to an increased risk of hepatotoxicity. The other PRN medications would still be available for the patient if clinically appropriate.
Once the PRN medications are ordered, the MHRRTP nurse can assess a patient’s condition and administer the medication(s) to the patient as indicated. For instance, if a patient requests ibuprofen for pain, the nurse will document an initial pain score and administer the ibuprofendose. As a result, the patient obtains more efficient and convenient care and does not need to wait for a provider to become available or use ECS. Per ZVAMC policy, the nurse has 96 hours to reassess the PRN medication effectiveness; however, this is typically done within the same shift. Since the implementation of the PRN medication list, no formal assessment has been completed.
To the authors’ knowledge, the ZVAMC is the only MHRRTP in the VHA system that incorporates a PRN medication list in the admission orders to reduce unnecessary ECS visits. After completing a thorough literature review and contacting the national VA mental health pharmacist listserve, no studies discussing the use of PRN medication lists in this setting were identified, and no sites offered information as to a similar practice in place.
Methods
A randomized, retrospective case-controlled study involving a chart review was completed for patients admitted to the MHRRTP at the ZVAMC pre- and postimplementation of the MHRRTP PRN medication list between April 2010 and August 2010 and between April 2013 and August 2013, respectively. The ZVAMC is a teaching institution. This study was approved by the ZVAMC institutional review board.
Patients were eligible for the study if they were male, aged > 18 years, and admitted during the study period for treatment in the GEN or SAR programs at the ZVAMC for at least 4 weeks. Patients were excluded if they were female, admitted to the hospital after being seen by ECS, or if they were receiving treatment in the following programs: PTSD, WOM, OEF/OIF/OND, DCHV, and I-ACT. Patients studied in 2010 served as the control group, and patients studied in 2013 were the treatment group.
Objectives
The primary objective of this study was to evaluate the use of the current PRN medication list. Secondary objectives included the evaluation of the use of ECS by patients admitted to the MHRRTP pre- and postimplementation of the PRN medication list, the potential cost reduction due to avoided ECS use, and nurse and patient satisfaction with the PRN medication list.
Data
A list of all patients admitted to the MHRRTP at the ZVAMC between April and August of 2010 and 2013 was generated using the Veterans Health Information Systems and Technology Architecture (VISTA)system. The Computerized Patient Record System (CPRS) was used to evaluate the patient for inclusion and collect pertinent data. The PRN medication list was implemented on September 15, 2010. Data collection terminated as of September 14, 2010, regardless of discharge status. All data collected for this study were entered and stored in a database created by the authors. A table with set criteria to review was created for the 2010 and 2013 group to ensure standardization. The pharmacy resident reviewed all of the patient charts. The following data were collected for each patient in the 2010 group:
- Demographic data: Patient name, last 4 digits of their social security number, age
- Program information: Admitted to GEN or SAR program, admission and discharge date, duration of stay, reason for discharge
- ECS data: Date, type of visit, chief condition, medications administered during the visit, whether the visit resulted in a hospital admission, and whether the visit was avoidable
- Avoidable visit: visit in which the patient received or could have received medication(s) that are on the PRN medication list at the ECS visit to treat their illness
The same information was collected for each patient in the 2013 group in addition to the following: PRN medication data (medications administered from the PRN medication list and the number of times each medication was administered if applicable); and ECS data (along with the aforementioned data, it was noted if PRN medications were taken prior to the ECS visit).
In addition, nurse and patient satisfaction with the PRN medication list were assessed via a simple satisfaction survey. The survey was given to 120 patients admitted to the MHRRTP as well as to 32 nurses at the time of distribution. A cover letter on each survey explained the study and informed the patient that the survey was voluntary and anonymous. Satisfaction was based on 10-point scale, with 1 (lowest) and 10 (highest) in satisfaction. Additional questions were asked to identify areas of improvement (see eAppendixes A and B for patient and nurse surveys, respectively).
Statistical Analysis
Descriptive statistics were used to analyze collected data. The primary outcome was assessed for the group admitted postintervention by calculating the average number of times each medication on the PRN medication list was used per patient during their length of stay (LOS) as applicable. The administration totals for each medication on the PRN medication list during the postintervention study period were also recorded.
Secondary outcomes were assessed by comparing the recorded total number of ECS visits pre- and postimplementation. Additionally, the average number of ECS visits per admission and the number of avoidable ECS visits were recorded for each study group. The cost reduction from avoided ECS use was estimated by calculating the total cost of ECS used pre- and postimplementation. The difference between the number of avoidable ECS visits in the pre- and postintervention groups was assessed for statistical significance by using a chi-square test. The 2013 cost saving estimation was based on the average ECS visit cost in the 2013 fiscal year ($657). Of note, power for this study could not be calculated as this has not been studied prior; therefore, no precedence has been set.
Results
On completion of the data collection, 583 patients were assessed for inclusion into the study, 325 in the 2010 preimplementation group and 258 in the 2013 postimplementation group. A total of 200 patients were randomized in each group (n = 400); however, 69 (35%) and 63 (32%) were excluded from the 2010 group and 2013 group, respectively. Sample demographics are described in the Table.
PRN Medication and ECS Use
Between April 1, 2013, and September 14, 2013, 3,959 doses of PRN medications were administered to MHRRTP patients who were included in the study (Figure). Prior to accessing ECS for their problem, 22 (36%) of the 61 patients who used ECS had trialed the PRN medication(s).
When comparing the total number of ECS visits, the 2010 group had 145 visits and the 2013 group had 96 visits. The preimplementation group averaged 1.1 ECS visits per MHRRTP admission, whereas the postimplementation group averaged 0.7 ECS visits per admission. The difference in the number of avoidable ECS visits was statistically significant, with the 2010 group totaling 15 avoidable visits, while the 2013 group totaled 1 ECS visit (P = .0045).
It was estimated that 9 (9.3%) ECS visits were avoided due to the PRN medication list in 2013. Using 137 patients, who were included in the postimplementation group, it can be calculated that $5,867 was saved due to the PRN medication list, or $42.83 per patient in 2013. Using the 2013 MHRRTP census of 898 patients, the financial impact of the PRN medication list can be extrapolated to produce an estimated annual cost savings of $38,461.
Patient and Nurse Satisfaction
Of the 120 patients given the patient satisfaction questionnaire, 28 (23%) patients responded. Of the respondents, 25 (89%) stated they were aware of the PRN medication list. The median rank of satisfaction reported was 8 on a 10-point scale. Twenty-two (79%) patients felt that the PRN medication list had or may have reduced the need to go to ECS or urgent care. Twenty-three (82%) patients recommended not removing any drugs listed on the PRN medication list.
Of the 32 registered nurses and licensed practical nurses working in the MHRRTP, 7 (22%) responded to the nurse satisfaction questionnaire. Of the respondents, 6 (86%) stated they discuss the PRN medication list during admission assessments every time or most of the time. The median rank of satisfaction was 9 on a 10-point scale. Four (57%) nurses felt patients had a clear understanding of the PRN medication list, and 100% of nurses stated they had enough guidance on situations to administer the medications. Seven (100%) stated that the PRN medication list had not caused adverse events; however, 5 (71%) stated that the list had been used inappropriately.
Discussion
This retrospective case-controlled study of 400 patients revealed high use of the PRN medication list and a cost avoidance of nearly $40,000. Although this represents a small reduction of the annual ECS budget, the PRN medication list also improved patient care by providing more efficient and convenient access to medications. The most commonly used medications were acetaminophen, trazodone, and ibuprofen. In addition, the nursing and patient surveys demonstrated an overall satisfaction with the current PRN medication list. It is important to note that the number of avoidable ECS visits decreased significantly after the implementation of the PRN medication list in 2010.
Roughly 35% of patients in each group were excluded from the study. The main exclusion criteria included a < 4-week LOS, being admitted to the hospital, being female, and being admitted prior to the study period. Women veterans were treated through different programs prior to the implementation of the PRN medication list; therefore, they were excluded to decrease variability. Only patients in the GEN and SAR programs were included, because they were well established prior to and after the intervention. The other programs, which included PTSD, WOM, OEF/OIF/OND, DCHV, and I-ACT, accounted for about one-third of MHRRTP admissions. However, they were not all available or structured similarly in 2010. Including the other programs would have increased variability.
Survey Results
Although the response rates were low, the patient and nurse satisfaction surveys revealed useful information that may assist in identifying the strengths and weaknesses of the current program. More rigorous surveying needs to be conducted to make the results more generalizable. Fifty percent of patients reported using a PRN medication on a daily basis or 3 times per week. However, 28.6% stated they never used the PRN medication list, which was thought to be an overestimation due to an incomplete understanding of what medications are on the PRN medication list. This finding does not correlate with the high use demonstrated with the actual number of PRN medications used.
Two patients marked “other,” one reported using the list when they “need the medication,” and another did not mark an answer. Similarly, 57.1% of the nursing staff reported offering a PRN medication on a daily basis and discussing the list on admission every time. However, 28.6% of nursing staff stated they do not complete admission assessments or work in the medication room, most likely because they are licensed practical nurses and do not have those responsibilities. Interestingly, when asked about medications that should be removed from the PRN medication list, 1 nurse suggested removing trazodone, which was the second most used drug. Some of the medications patients suggested adding to the PRN medication list included creams for dry skin or fungal infections, calcium carbonate, and pain medications such as tramadol, aspirin, and naproxen. Nurses suggested adding aspirin, diphenhydramine, and nicotine gum. These responses will aid in enhancing the current PRN medication list by potentially increasing the types of medications offered.
Limitations
This study has several limitations that may affect its interpretation. The study was retrospective in nature and had a short study period. The data were collected from a single specialty program, which decreases the study’s generalizability, as not all VAMCs have a MHRRTP. Also, the average LOS in 2010 was longer than in 2013. This was related to the restructuring of the MHRRTP in the spring of 2013 to allow for more condensed programming. As a result, it may be reasonable to infer that there were more ECS visits prior to implementation of the PRN medication list due to the longer LOS in 2010. This confounding variable was minimized by normalizing the calculation for the number and percent of ECS visits avoided.
The patient population was limited to male veterans and the satisfaction questionnaires had low response rates. The low patient response rate may have been due to a lack of incentive, decreased health literacy, or possibly lack of time. The low nurse response rate may have been due to limited time and also lack of incentive. A larger response rate may have increased the PRN medication list use and satisfaction reported. This study looked at the change in the number of ECS visits; but, it did not investigate any changes in the number of primary care visits. Patients were able to go to their primary care appointments during their stay in the MHRRTP and may have received medications listed on the PRN medication list at these appointments, which could have been avoided. Last, the accuracy of the documentation in CPRS may be unclear and may have subjected the study to bias. Unfortunately, ECS does not use bar code medication administration, so the administration of medications has to be manually written into the ECS visit note. This method may be vulnerable to human error.
Future Directions
Future directions from this study include discussing the results with the MHRRTP staff and identifying areas of improvement to enhance the medication list. Some discussion points include the reasoning to remove trazodone and examples of inappropriate use. Furthermore, the questions asked by patients and general
suggestions made by the nursing staff identified that increased patient education of the PRN medication list should be implemented during the admission assessment process. This would improve patient understanding and awareness of the PRN medication list, because some patients did not know about the list or what medications it included. Moving forward, the results of this project may provide incentive for future implementation of PRN medication lists at other VA MHRRTPs.
Conclusion
This study confirms that the MHRRTP PRN medication list has been highly used since its implementation in 2010. The study also suggests that the nursing staff and patients are satisfied with the current process. Furthermore, these findings illustrate the PRN medication list’s success at decreasing unnecessary use of ECS and its association with avoiding cost. Further studies are needed to support the results seen in this analysis. Although these discoveries are preliminary, they may provide incentive for future implementation of PRN medication lists at other VA MHRRTPs.
Acknowledgements
Michelle Bury had full access to all of the data in the study and takes responsibility for the integrity of the data and the accuracy of the data analysis.
Author disclosures
The authors report no actual or potential conflicts of interest with regard to this article.
Disclaimer
The opinions expressed herein are those of the authors and do not necessarily reflect those of Federal Practitioner, Frontline Medical Communications Inc., the U.S. Government, or any of its agencies. This article may discuss unlabeled or investigational use of certain drugs. Please review the complete prescribing information for specific drugs or drug combinations—including indications, contraindications, warnings, and adverse effects—before administering pharmacologic therapy to patients.
1. Department of Veterans Affairs. Mental Health Residential Rehabilitation Treatment Program. Washington, DC: Department of Veterans Affairs Website. https://vaww.portal.va.gov/sites/OMHS/mhrrtp/default.aspx. Accessed October 7, 2013.
2. Pharmacy Procedures for Safe Medication Management (SMM) in DOMs 123 and 43. Milwaukee, WI: Clement J. Zablocki VA Medical Center; September 2010.
3. Professional Services Memorandum VII-29. Milwaukee, WI: Clement J. Zablocki VA Medical Center; November 2010.
4. Petzel RA. Mental Health Residential Rehabilitation Treatment Program (MHRRTP): VHA Handbook 1162.02. Washington, DC: Veterans Health Administration; December 2010.
Assessing the Quality of VA Animal Care and Use Programs
Institutions conducting research involving animals have established operational frameworks, referred to as animal care and use programs (ACUPs), to ensure research animal welfare and high-quality research data and to meet ethical and regulatory requirements.1-4 The Institutional Animal Care and Use Committee (IACUC) is a critical component of the ACUP and is responsible for the oversight and evaluation of all aspects of the ACUP.5 However, investigators, IACUCs, institutions, the research sponsor, and the federal government share responsibilities for ensuring research animal welfare.
Effective policies, procedures, practices, and systems in the ACUP are critical to an institution’s ability to ensure that animal research is conducted humanely and complies with applicable regulations, policies, and guidelines. To this end, considerable effort and resources have been devoted to improve the effectiveness of ACUPs, including external accreditation of ACUPs by the Association for Assessment and Accreditation of Laboratory Animal Care International (AAALAC International) and implementation of science-based performance standards, postapproval monitoring, and risk assessments and mitigation of identified vulnerability.6-9 However, the impact of these quality improvement measures remains unclear. There have been no valid, reliable, and quantifiable measures to assess the effectiveness and quality of ACUPs.
Compliance with federal regulations is not only required, but also essential in protecting laboratory animals. However, the goal is not to ensure compliance but to prevent unnecessary harm, injury, and suffering to those research animals. Overemphasis on compliance and documentation may negatively impact the system by diverting resources away from ensuring research animal welfare. The authors propose that although research animal welfare cannot be directly measured, it is possible to assess the quality of ACUPs. High-quality ACUPs are expected to minimize risk to research animals to the extent possible while maintaining the integrity of the research.
The authors previously developed a set of quality indicators (QIs) for human research protection programs (HRPPs) at the VA, emphasizing performance outcomes built on a foundation of compliance.10 Implementation of these QIs allowed the research team to collect data to assess the quality of VA HRPPs.11 It also allowed the team to answer important questions, such as whether there were significant differences in the quality of HRPPs among facilities using their own institutional review boards (IRBs) and those using affiliated university IRBs as their IRBs of record.12
Background
The VA health care system (VAHCS) is the largest integrated health care system in the U.S. Currently, there are 77 VA facilities conducting research involving laboratory animals. In addition to federal regulations governing research with animals, researchers in the VAHCS must comply with requirements established by VA.1-4 For example, in the VAHCS, the IACUC is a subcommittee of the Research and Development Committee (R&DC). Research involving animals may not be initiated until it has been approved by both the IACUC and the R&DC.13,14 All investigators, including animal research investigators, are required to have approved scopes of practice.14 Furthermore, all VA facilities that conduct animal research are required to have their ACUPs accredited by the AAALAC International.13
Based on the experience gained from the VA HRPP QIs, the authors developed a set of QIs that emphasize assessing the outcome of ACUPs rather than solely on IACUC review or compliance with animal research regulations and policies. This report describes the proposed QIs for assessing the quality of VA ACUPs and presents preliminary data using some of these QIs.
Methods
The VA ACUP QIs were developed through a process that included (1) identification of a set of potential indicators by the authors; (2) review and comments on the potential indicators by individuals within and outside VA who have expertise in protecting research animal welfare, including veterinarians with board certification in laboratory animal medicine, IACUC chairs, and individuals involved in the accreditation and oversight of ACUPs; and (3) review and revision by the authors of the proposed QIs in light of the suggestions and comments received. After 6 months of deliberation, a set of 13 QIs was finalized for consideration for implementation.
Data Collection
As part of the VA ACUP quality assurance program, each VA research facility is required to conduct regulatory audits of all animal research protocols once every 3 years by qualified research compliance officers (RCOs).15 Audit tools were developed for the triennial animal protocol regulatory audits (available at http://www.va.gov/oro/rcep.asp).11,12 Facility RCOs were then trained to use these tools to conduct audits throughout the year.
Results of the protocol regulatory audits, conducted between June 1, 2011, and May 31, 2012, were collected through a Web-based system from all 74 VA facilities conducting animal research during that period. Information collected included IACUC and R&DC initial approval of human research protocols; for-cause suspension or termination of animal research protocols; compliance with continuing review requirements; research personnel scopes of practice; and investigator animal research protection training requirements.
Because this study did not involve the use of laboratory animals, no ACUC review and approval was required.
Data Analysis
All data collected were entered into a database for analysis. When necessary, facilities were contacted to verify the accuracy and uniformity of data reported. Only descriptive statistics were obtained and presented.
Quality Indicators
As shown in the Box, a total of 13 QIs covering a broad range of areas that may have significant impact on research animal welfare were selected.
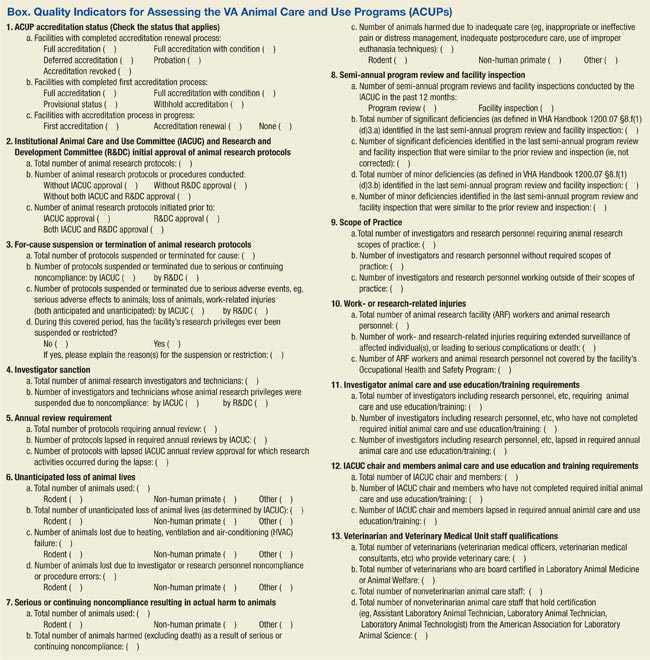
QI 1. ACUP accreditation status was chosen, because accreditation of an institutional ACUP by AAALAC International, the sole widely accepted ACUP accrediting organization, suggests that the institution establish acceptable operational frameworks to ensure research animal welfare. Because VA policy requires that all facilities conducting animal research be accredited, failure to achieve full accreditation may indicate that research animals are at an elevated risk due to a less than optimal system to protect research animals.13
QI 2. IACUC and R&DC initial approval of animal research protocols was chosen because of the importance of IACUC and R&DC review and approval in ensuring the scientific merit of the research and the adequacy of research animal protection. The number and the percentage of protocols conducted without or initiated prior to IACUC and/or R&DC approval, which may put animals at risk, is a good measure of the adequacy of the institution’s ACUP.
QI 3. For-cause suspension or termination of animal research protocols was chosen, because this is a serious event. Protocols can be suspended or prematurely terminated by IACUCs due to investigators’ serious or continuing noncompliance or due to serious adverse events/injuries to the animals or research personnel. The number and percentage of protocols suspended reflect the adequacy of the IACUC oversight of the institution’s animal research program.
QI 4. Investigator sanction was chosen, because investigators and research personnel play an important role in protecting research animals. The number and percentage of investigators or technicians whose research privileges were suspended due to noncompliance reflect the adequacy of the institution’s education and training program as well as oversight of the ACUP.
QI 5. Annual review requirement was chosen because of the importance of ongoing oversight of approved animal research by the IACUC. The number and percentage of protocols lapsed in annual reviews, particularly when research activities continued during the lapse reflects the adequacy of IACUC oversight.
QI 6. Unanticipated loss of animal lives was chosen, because loss of animal lives is the most serious harm to animals that the ACUP is intended to prevent. The number and percentage of animals whose lives are unnecessarily lost due to heating, ventilation, or air-conditioning failure reflect the adequacy of the institution’s animal care infrastructure and effectiveness of the emergency response plan.
QI 7. Serious or continuing noncompliance resulting in actual harm to animals was chosen, because actual harm to animals is an important outcome measure of the adequacy of ACUP. The number and percentage of animals harmed due to investigator noncompliance or inadequate care reflect the adequacy of the institution’s veterinarian and IACUC oversight.
QI 8. Semi-annual program review and facility inspection was chosen because of the importance of semi-annual program review and facility inspection in IACUC’s oversight of the institution’s ACUP. This QI emphasizes the timely correction and remediation of both major and minor deficiencies identified during semi-annual program reviews and facility inspections. Failure to promptly address identified deficiencies in a timely manner may place research animals at significant risk.
QI 9. Scope of practice was chosen because of the importance of the investigator’s qualification in ensuring not only high-quality research data, but also adequate protection of research animals. Certain animal procedures can be safely performed only by investigators with adequate training and experience. Allowing investigators who are unqualified to perform these procedures places animals at significant risk of being harmed.
QI 10. Work- or research-related injuries was chosen because of the importance of the safety of investigators and animal caretakers in the institution’s ACUP. The importance of the institution’s occupational health and safety program in protecting investigators and animal care workers cannot be overemphasized. The number and percentage of investigators and animal care workers covered by the occupational health and safety program and work- or research-related injuries reflect the adequacy of the ACUP.
QI 11. Investigator animal care and use education/training requirements was chosen because of the important role of investigators in protecting animal welfare. The number and percentage of investigators who fail to maintain required animal care and use education/training reflect the adequacy of the institution’s IACUC oversight.
QI 12. IACUC chair and members’ animal care and use education and training requirements was chosen because of the important role of the IACUC chair and members in the institution’s ACUP. To appropriately evaluate and approve/disapprove animal research protocols, the chair and members of IACUC must maintain sufficient knowledge of federal regulations and VA policies regarding animal protections.
QI 13. Veterinarian and veterinary medical unit staff qualification was chosen because of the important role of veterinarian and veterinary medical unit staff in the day-to-day care of research animals and the specialized knowledge and qualification they need to maintain the animal research facilities. The number of veterinarians and nonveterinary animal care staff with appropriate board certifications reflects the strength of an institution’s ACUP.
Results
Recognizing the importance of assessing the quality of VA ACUPs, the authors started to collect some QI data of VA ACUPs parallel to those of VA HRPPs before the aforementioned proposed QIs for VA ACUPs were fully developed. These preliminary data are included here to demonstrate the feasibility of implementing these proposed VA ACUP QIs.
IACUC and R&DC Approvals (QI 2)
VA policies require that all animal research protocols be reviewed and approved first by the IACUC and then by the R&DC.13,14 The IACUC is a subcommittee of the R&DC. No animal research activities in VA may be initiated before receiving both IACUC and R&DC approval.13,14
Between June 1, 2011, and May 31, 2012, regulatory audits were conducted on 1,286 animal research protocols. Among them, 1 (0.08%) protocol was conducted and completed without the required IACUC approval, 1 (0.08%) was conducted and completed without the required R&DC approval, 1 (0.08%) was initiated prior to IACUC approval, and 2 (0.16%) were initiated prior to R&DC approval.
For-Cause Suspension or Termination (QI 3)
Among the 1,286 animal research protocols audited, 14 (1.09%) protocols were suspended or terminated for cause; 10 (0.78%) protocols were suspended or terminated due to animal safety concerns; and 4 (0.31%) protocols were suspended or terminated due to investigator-related concerns.
Lapse in Continuing Reviews (QI 5)
Federal regulations and VA policies require that IACUC conduct continuing review of all animal research protocols annually.2,13 Of the 1,286 animal research protocols audited, 1,159 protocols required IACUC continuing reviews during the auditing period. Fifty-three protocols (4.57%) lapsed in IACUC annual reviews, and in 25 of these 53 protocols, investigators continued research activities during the lapse.
Scope of Practice (QI 9)
VA policies require all research personnel to have an approved research scope of practice or functional statement that defines the duties that the individual is qualified and allowed to perform for research purposes.14
A total of 4,604 research personnel records were reviewed from the 1,286 animal research protocols audited. Of these, 276 (5.99%) did not have an approved research scope of practice; 1 (0.02%) had an approved research scope of practice but was working outside the approved research scope of practice.
Training Requirements (QI 11)
VA policies require that all research personnel who participate in animal research complete initial and annual training to ensure that they can competently and humanely perform their duties related to animal research.14
Among the 4,604 animal research personnel records reviewed, 186 (4.04%) did not maintain their training requirements, including 26 (0.56%) without required initial training and 160 (3.48%) with lapses in required continuing training.
Discussion
Collectively, these proposed QIs should provide useful information about the overall quality of an ACUP. This allows semiquantitative assessment of the quality and performance of VA facilities’ ACUPs over time and comparison of the performance of ACUPs across research facilities in the VAHCS. The information obtained may also help administrators identify program vulnerabilities and make management decisions regarding where improvements are most needed. Specifically, QI data will be collected from all VA research facilities’ ACUPs annually. National averages for all QIs will be calculated. Each facility will then be provided with the results of its own ACUP QI data as well as the national averages, allowing the facility to compare its QI data with the national averages and determine how its ACUP performs compared with the overall VA ACUP performance.
These QIs were designed for use in assessing the quality of ACUPs at VA research facilities annually or at least once every other year. With the recent requirement that a full-time RCO at each VA research facility conduct regulatory audits of all animal research protocols once every 3 years, it is feasible that an assessment of the VA ACUPs using these QIs could be conducted annually as demonstrated by the preliminary data for QIs 2, 3, 5, 9, and 11 reported here.15,16 These preliminary data also showed high rates of lapses in IACUC continuing review (4.57%), lack of research personnel scopes of practice (5.99%), and noncompliance with training requirements (4.04%). These are areas that need improvements.
The size and complexity of animal research programs are different among different facilities, which can make it difficult to compare different facilities’ ACUPs using the same quality measures. In addition, VA facilities may use their own IACUCs or the affiliate university IACUCs as the IACUCs of record. However, based on the authors’ experience using HRPP QIs to assess the quality of VA HRPPs, the collected data using ACUP QIs will help determine whether such variables as the size and complexity of a program or the kind of IACUCs used (either VA, own IACUC, or affiliate IACUC) affect the quality of VA ACUPs.10-12
Limitations
There is no evidence proving that these QIs are the most optimal measures for evaluating the quality of a VA facility’s ACUP. It is also unknown whether these QIs correlate directly with the protection of research animals. Furthermore, a quantitative, numerical value cannot be put on each indicator to allow evaluators to rank facilities’ ACUPs.
Some QIs, such as QIs 3, 4, 7, and 8, may depend on how stringent an IACUC is. For example, it is possible that a conscientious IACUC may report more noncompliance or suspend more protocols, giving the appearance of a poor quality ACUP, whereas in fact it might be an excellent program. However, the authors want to emphasize that no single QI by itself is sufficient to assess the quality of a program. It is the combination of various QIs that provides information about the overall quality of a program. It is also through the data collected that the usefulness of any particular indicators may be determined.
Conclusion
These proposed QIs provide a useful first step toward developing a robust and valid assessment of VA ACUPs. As these QIs are used at VA facilities, they will likely be redefined and modified. The authors hope that other institutions will find these indicators useful as they develop instruments to assess their own ACUPs.
Acknowledgement
The authors thank Dr. Kathryn Bayne, Global Director, Association for Assessment and Accreditation of Laboratory Animal Care International, for her suggestions and comments during the development of these quality indicators and critical review of the manuscript, and Dr. J. Thomas Puglisi, Chief Officer, VA Office of Research Oversight, for his support and critical review of the manuscript.
Author disclosures
The authors report no actual or potential conflicts of interest with regard to this article.
Disclaimer
The opinions expressed herein are those of the authors and do not necessarily reflect those of Federal Practitioner, Frontline Medical Communications Inc., the U.S. Government, or any of its agencies. This article may discuss unlabeled or investigational use of certain drugs. Please review complete prescribing information for specific drugs or drug combinations—including indications, contraindications, warnings, and adverse effects—before administering pharmacologic therapy to patients.
1. Animal Welfare Act, 7 USC §2131-2156 (2008).
2. Animal Welfare Regulations, 9 CFR §1-4 (2008).
3. National Research Council of the National Academies. Guide for the Care and Use of Laboratory Animals. 8th ed. Washington, DC: National Academies Press; 2011.
4. Office of Laboratory Animal Welfare. Public Health Service Policy On Humane Care And Use Of Laboratory Animals. Bethesda, MD: National Institutes of Health, U.S. Department of Health and Human Services; 2015. NIH publication 15-8013. http://grants.nih.gov/grants/olaw//PHSPolicyLabAnimals.pdf. Revised 2015. Accessed August 3, 2015.
5. Sandgren EP. Defining the animal care and use program. Lab Anim (NY). 2005;34(10):41-44.
6. Association for Assessment and Accreditation of Laboratory Animal Care International. The AAALAC International accreditation program. The Association for Assessment and Accreditation of Laboratory Animal Care International Website. http://www.aaalac.org/accreditation/index.cfm. Updated 2015. Accessed August 3, 2015.
7. Klein HJ, Bayne KA. Establishing a culture of care, conscience, and responsibility: addressing the improvement of scientific discovery and animal welfare through science-based performance standards. ILAR J. 2007;48(1):3-11.
8. Banks RE, Norton JN. A sample postapproval monitoring program in academia. ILAR J. 2008;49(4):402-418.
9. Van Sluyters RC. A guide to risk assessment in animal care and use programs: the metaphor of the 3-legged stool. ILAR J. 2008;49(4):372-378.
10. Tsan MF, Smith K, Gao B. Assessing the quality of human research protection programs: the experience at the Department of Veterans Affairs. IRB. 2010;32(4):16-19.
11. Tsan MF, Nguyen Y, Brooks R. Using quality indicators to assess human research protection programs at the Department of Veterans Affairs. IRB. 2013;35(1):10-14.
12. Tsan MF, Nguyen Y, Brooks B. Assessing the quality of VA Human Research Protection Programs: VA vs. affiliated University Institutional Review Board. J Emp Res Hum Res Ethics. 2013;8(2):153-160.
13. VA Research and Development Service. Use of Animals in Research. VHA Handbook 1200.07. Washington, DC: Department of Veterans Affairs, Veterans Health Administration; 2011.
14. VA Research and Development Service. Research and Development (R&D) Committee. VHA Handbook 1200.01. Washington, DC: Veterans Health Administration; 2009.
15. Research Compliance Officers and the Auditing of VHA Human Subjects Research to Determine Compliance with Applicable Laws, Regulations, and Policies. VHA Directive 2008-064. Washington, DC: Veterans Health Administration; 2008.
16. VA Office of Research Oversight. Research Compliance Reporting Requirements. VHA Handbook 1058.01. Washington, DC: Veterans Health Administration; 2015.
Institutions conducting research involving animals have established operational frameworks, referred to as animal care and use programs (ACUPs), to ensure research animal welfare and high-quality research data and to meet ethical and regulatory requirements.1-4 The Institutional Animal Care and Use Committee (IACUC) is a critical component of the ACUP and is responsible for the oversight and evaluation of all aspects of the ACUP.5 However, investigators, IACUCs, institutions, the research sponsor, and the federal government share responsibilities for ensuring research animal welfare.
Effective policies, procedures, practices, and systems in the ACUP are critical to an institution’s ability to ensure that animal research is conducted humanely and complies with applicable regulations, policies, and guidelines. To this end, considerable effort and resources have been devoted to improve the effectiveness of ACUPs, including external accreditation of ACUPs by the Association for Assessment and Accreditation of Laboratory Animal Care International (AAALAC International) and implementation of science-based performance standards, postapproval monitoring, and risk assessments and mitigation of identified vulnerability.6-9 However, the impact of these quality improvement measures remains unclear. There have been no valid, reliable, and quantifiable measures to assess the effectiveness and quality of ACUPs.
Compliance with federal regulations is not only required, but also essential in protecting laboratory animals. However, the goal is not to ensure compliance but to prevent unnecessary harm, injury, and suffering to those research animals. Overemphasis on compliance and documentation may negatively impact the system by diverting resources away from ensuring research animal welfare. The authors propose that although research animal welfare cannot be directly measured, it is possible to assess the quality of ACUPs. High-quality ACUPs are expected to minimize risk to research animals to the extent possible while maintaining the integrity of the research.
The authors previously developed a set of quality indicators (QIs) for human research protection programs (HRPPs) at the VA, emphasizing performance outcomes built on a foundation of compliance.10 Implementation of these QIs allowed the research team to collect data to assess the quality of VA HRPPs.11 It also allowed the team to answer important questions, such as whether there were significant differences in the quality of HRPPs among facilities using their own institutional review boards (IRBs) and those using affiliated university IRBs as their IRBs of record.12
Background
The VA health care system (VAHCS) is the largest integrated health care system in the U.S. Currently, there are 77 VA facilities conducting research involving laboratory animals. In addition to federal regulations governing research with animals, researchers in the VAHCS must comply with requirements established by VA.1-4 For example, in the VAHCS, the IACUC is a subcommittee of the Research and Development Committee (R&DC). Research involving animals may not be initiated until it has been approved by both the IACUC and the R&DC.13,14 All investigators, including animal research investigators, are required to have approved scopes of practice.14 Furthermore, all VA facilities that conduct animal research are required to have their ACUPs accredited by the AAALAC International.13
Based on the experience gained from the VA HRPP QIs, the authors developed a set of QIs that emphasize assessing the outcome of ACUPs rather than solely on IACUC review or compliance with animal research regulations and policies. This report describes the proposed QIs for assessing the quality of VA ACUPs and presents preliminary data using some of these QIs.
Methods
The VA ACUP QIs were developed through a process that included (1) identification of a set of potential indicators by the authors; (2) review and comments on the potential indicators by individuals within and outside VA who have expertise in protecting research animal welfare, including veterinarians with board certification in laboratory animal medicine, IACUC chairs, and individuals involved in the accreditation and oversight of ACUPs; and (3) review and revision by the authors of the proposed QIs in light of the suggestions and comments received. After 6 months of deliberation, a set of 13 QIs was finalized for consideration for implementation.
Data Collection
As part of the VA ACUP quality assurance program, each VA research facility is required to conduct regulatory audits of all animal research protocols once every 3 years by qualified research compliance officers (RCOs).15 Audit tools were developed for the triennial animal protocol regulatory audits (available at http://www.va.gov/oro/rcep.asp).11,12 Facility RCOs were then trained to use these tools to conduct audits throughout the year.
Results of the protocol regulatory audits, conducted between June 1, 2011, and May 31, 2012, were collected through a Web-based system from all 74 VA facilities conducting animal research during that period. Information collected included IACUC and R&DC initial approval of human research protocols; for-cause suspension or termination of animal research protocols; compliance with continuing review requirements; research personnel scopes of practice; and investigator animal research protection training requirements.
Because this study did not involve the use of laboratory animals, no ACUC review and approval was required.
Data Analysis
All data collected were entered into a database for analysis. When necessary, facilities were contacted to verify the accuracy and uniformity of data reported. Only descriptive statistics were obtained and presented.
Quality Indicators
As shown in the Box, a total of 13 QIs covering a broad range of areas that may have significant impact on research animal welfare were selected.
QI 1. ACUP accreditation status was chosen, because accreditation of an institutional ACUP by AAALAC International, the sole widely accepted ACUP accrediting organization, suggests that the institution establish acceptable operational frameworks to ensure research animal welfare. Because VA policy requires that all facilities conducting animal research be accredited, failure to achieve full accreditation may indicate that research animals are at an elevated risk due to a less than optimal system to protect research animals.13
QI 2. IACUC and R&DC initial approval of animal research protocols was chosen because of the importance of IACUC and R&DC review and approval in ensuring the scientific merit of the research and the adequacy of research animal protection. The number and the percentage of protocols conducted without or initiated prior to IACUC and/or R&DC approval, which may put animals at risk, is a good measure of the adequacy of the institution’s ACUP.
QI 3. For-cause suspension or termination of animal research protocols was chosen, because this is a serious event. Protocols can be suspended or prematurely terminated by IACUCs due to investigators’ serious or continuing noncompliance or due to serious adverse events/injuries to the animals or research personnel. The number and percentage of protocols suspended reflect the adequacy of the IACUC oversight of the institution’s animal research program.
QI 4. Investigator sanction was chosen, because investigators and research personnel play an important role in protecting research animals. The number and percentage of investigators or technicians whose research privileges were suspended due to noncompliance reflect the adequacy of the institution’s education and training program as well as oversight of the ACUP.
QI 5. Annual review requirement was chosen because of the importance of ongoing oversight of approved animal research by the IACUC. The number and percentage of protocols lapsed in annual reviews, particularly when research activities continued during the lapse reflects the adequacy of IACUC oversight.
QI 6. Unanticipated loss of animal lives was chosen, because loss of animal lives is the most serious harm to animals that the ACUP is intended to prevent. The number and percentage of animals whose lives are unnecessarily lost due to heating, ventilation, or air-conditioning failure reflect the adequacy of the institution’s animal care infrastructure and effectiveness of the emergency response plan.
QI 7. Serious or continuing noncompliance resulting in actual harm to animals was chosen, because actual harm to animals is an important outcome measure of the adequacy of ACUP. The number and percentage of animals harmed due to investigator noncompliance or inadequate care reflect the adequacy of the institution’s veterinarian and IACUC oversight.
QI 8. Semi-annual program review and facility inspection was chosen because of the importance of semi-annual program review and facility inspection in IACUC’s oversight of the institution’s ACUP. This QI emphasizes the timely correction and remediation of both major and minor deficiencies identified during semi-annual program reviews and facility inspections. Failure to promptly address identified deficiencies in a timely manner may place research animals at significant risk.
QI 9. Scope of practice was chosen because of the importance of the investigator’s qualification in ensuring not only high-quality research data, but also adequate protection of research animals. Certain animal procedures can be safely performed only by investigators with adequate training and experience. Allowing investigators who are unqualified to perform these procedures places animals at significant risk of being harmed.
QI 10. Work- or research-related injuries was chosen because of the importance of the safety of investigators and animal caretakers in the institution’s ACUP. The importance of the institution’s occupational health and safety program in protecting investigators and animal care workers cannot be overemphasized. The number and percentage of investigators and animal care workers covered by the occupational health and safety program and work- or research-related injuries reflect the adequacy of the ACUP.
QI 11. Investigator animal care and use education/training requirements was chosen because of the important role of investigators in protecting animal welfare. The number and percentage of investigators who fail to maintain required animal care and use education/training reflect the adequacy of the institution’s IACUC oversight.
QI 12. IACUC chair and members’ animal care and use education and training requirements was chosen because of the important role of the IACUC chair and members in the institution’s ACUP. To appropriately evaluate and approve/disapprove animal research protocols, the chair and members of IACUC must maintain sufficient knowledge of federal regulations and VA policies regarding animal protections.
QI 13. Veterinarian and veterinary medical unit staff qualification was chosen because of the important role of veterinarian and veterinary medical unit staff in the day-to-day care of research animals and the specialized knowledge and qualification they need to maintain the animal research facilities. The number of veterinarians and nonveterinary animal care staff with appropriate board certifications reflects the strength of an institution’s ACUP.
Results
Recognizing the importance of assessing the quality of VA ACUPs, the authors started to collect some QI data of VA ACUPs parallel to those of VA HRPPs before the aforementioned proposed QIs for VA ACUPs were fully developed. These preliminary data are included here to demonstrate the feasibility of implementing these proposed VA ACUP QIs.
IACUC and R&DC Approvals (QI 2)
VA policies require that all animal research protocols be reviewed and approved first by the IACUC and then by the R&DC.13,14 The IACUC is a subcommittee of the R&DC. No animal research activities in VA may be initiated before receiving both IACUC and R&DC approval.13,14
Between June 1, 2011, and May 31, 2012, regulatory audits were conducted on 1,286 animal research protocols. Among them, 1 (0.08%) protocol was conducted and completed without the required IACUC approval, 1 (0.08%) was conducted and completed without the required R&DC approval, 1 (0.08%) was initiated prior to IACUC approval, and 2 (0.16%) were initiated prior to R&DC approval.
For-Cause Suspension or Termination (QI 3)
Among the 1,286 animal research protocols audited, 14 (1.09%) protocols were suspended or terminated for cause; 10 (0.78%) protocols were suspended or terminated due to animal safety concerns; and 4 (0.31%) protocols were suspended or terminated due to investigator-related concerns.
Lapse in Continuing Reviews (QI 5)
Federal regulations and VA policies require that IACUC conduct continuing review of all animal research protocols annually.2,13 Of the 1,286 animal research protocols audited, 1,159 protocols required IACUC continuing reviews during the auditing period. Fifty-three protocols (4.57%) lapsed in IACUC annual reviews, and in 25 of these 53 protocols, investigators continued research activities during the lapse.
Scope of Practice (QI 9)
VA policies require all research personnel to have an approved research scope of practice or functional statement that defines the duties that the individual is qualified and allowed to perform for research purposes.14
A total of 4,604 research personnel records were reviewed from the 1,286 animal research protocols audited. Of these, 276 (5.99%) did not have an approved research scope of practice; 1 (0.02%) had an approved research scope of practice but was working outside the approved research scope of practice.
Training Requirements (QI 11)
VA policies require that all research personnel who participate in animal research complete initial and annual training to ensure that they can competently and humanely perform their duties related to animal research.14
Among the 4,604 animal research personnel records reviewed, 186 (4.04%) did not maintain their training requirements, including 26 (0.56%) without required initial training and 160 (3.48%) with lapses in required continuing training.
Discussion
Collectively, these proposed QIs should provide useful information about the overall quality of an ACUP. This allows semiquantitative assessment of the quality and performance of VA facilities’ ACUPs over time and comparison of the performance of ACUPs across research facilities in the VAHCS. The information obtained may also help administrators identify program vulnerabilities and make management decisions regarding where improvements are most needed. Specifically, QI data will be collected from all VA research facilities’ ACUPs annually. National averages for all QIs will be calculated. Each facility will then be provided with the results of its own ACUP QI data as well as the national averages, allowing the facility to compare its QI data with the national averages and determine how its ACUP performs compared with the overall VA ACUP performance.
These QIs were designed for use in assessing the quality of ACUPs at VA research facilities annually or at least once every other year. With the recent requirement that a full-time RCO at each VA research facility conduct regulatory audits of all animal research protocols once every 3 years, it is feasible that an assessment of the VA ACUPs using these QIs could be conducted annually as demonstrated by the preliminary data for QIs 2, 3, 5, 9, and 11 reported here.15,16 These preliminary data also showed high rates of lapses in IACUC continuing review (4.57%), lack of research personnel scopes of practice (5.99%), and noncompliance with training requirements (4.04%). These are areas that need improvements.
The size and complexity of animal research programs are different among different facilities, which can make it difficult to compare different facilities’ ACUPs using the same quality measures. In addition, VA facilities may use their own IACUCs or the affiliate university IACUCs as the IACUCs of record. However, based on the authors’ experience using HRPP QIs to assess the quality of VA HRPPs, the collected data using ACUP QIs will help determine whether such variables as the size and complexity of a program or the kind of IACUCs used (either VA, own IACUC, or affiliate IACUC) affect the quality of VA ACUPs.10-12
Limitations
There is no evidence proving that these QIs are the most optimal measures for evaluating the quality of a VA facility’s ACUP. It is also unknown whether these QIs correlate directly with the protection of research animals. Furthermore, a quantitative, numerical value cannot be put on each indicator to allow evaluators to rank facilities’ ACUPs.
Some QIs, such as QIs 3, 4, 7, and 8, may depend on how stringent an IACUC is. For example, it is possible that a conscientious IACUC may report more noncompliance or suspend more protocols, giving the appearance of a poor quality ACUP, whereas in fact it might be an excellent program. However, the authors want to emphasize that no single QI by itself is sufficient to assess the quality of a program. It is the combination of various QIs that provides information about the overall quality of a program. It is also through the data collected that the usefulness of any particular indicators may be determined.
Conclusion
These proposed QIs provide a useful first step toward developing a robust and valid assessment of VA ACUPs. As these QIs are used at VA facilities, they will likely be redefined and modified. The authors hope that other institutions will find these indicators useful as they develop instruments to assess their own ACUPs.
Acknowledgement
The authors thank Dr. Kathryn Bayne, Global Director, Association for Assessment and Accreditation of Laboratory Animal Care International, for her suggestions and comments during the development of these quality indicators and critical review of the manuscript, and Dr. J. Thomas Puglisi, Chief Officer, VA Office of Research Oversight, for his support and critical review of the manuscript.
Author disclosures
The authors report no actual or potential conflicts of interest with regard to this article.
Disclaimer
The opinions expressed herein are those of the authors and do not necessarily reflect those of Federal Practitioner, Frontline Medical Communications Inc., the U.S. Government, or any of its agencies. This article may discuss unlabeled or investigational use of certain drugs. Please review complete prescribing information for specific drugs or drug combinations—including indications, contraindications, warnings, and adverse effects—before administering pharmacologic therapy to patients.
1. Animal Welfare Act, 7 USC §2131-2156 (2008).
2. Animal Welfare Regulations, 9 CFR §1-4 (2008).
3. National Research Council of the National Academies. Guide for the Care and Use of Laboratory Animals. 8th ed. Washington, DC: National Academies Press; 2011.
4. Office of Laboratory Animal Welfare. Public Health Service Policy On Humane Care And Use Of Laboratory Animals. Bethesda, MD: National Institutes of Health, U.S. Department of Health and Human Services; 2015. NIH publication 15-8013. http://grants.nih.gov/grants/olaw//PHSPolicyLabAnimals.pdf. Revised 2015. Accessed August 3, 2015.
5. Sandgren EP. Defining the animal care and use program. Lab Anim (NY). 2005;34(10):41-44.
6. Association for Assessment and Accreditation of Laboratory Animal Care International. The AAALAC International accreditation program. The Association for Assessment and Accreditation of Laboratory Animal Care International Website. http://www.aaalac.org/accreditation/index.cfm. Updated 2015. Accessed August 3, 2015.
7. Klein HJ, Bayne KA. Establishing a culture of care, conscience, and responsibility: addressing the improvement of scientific discovery and animal welfare through science-based performance standards. ILAR J. 2007;48(1):3-11.
8. Banks RE, Norton JN. A sample postapproval monitoring program in academia. ILAR J. 2008;49(4):402-418.
9. Van Sluyters RC. A guide to risk assessment in animal care and use programs: the metaphor of the 3-legged stool. ILAR J. 2008;49(4):372-378.
10. Tsan MF, Smith K, Gao B. Assessing the quality of human research protection programs: the experience at the Department of Veterans Affairs. IRB. 2010;32(4):16-19.
11. Tsan MF, Nguyen Y, Brooks R. Using quality indicators to assess human research protection programs at the Department of Veterans Affairs. IRB. 2013;35(1):10-14.
12. Tsan MF, Nguyen Y, Brooks B. Assessing the quality of VA Human Research Protection Programs: VA vs. affiliated University Institutional Review Board. J Emp Res Hum Res Ethics. 2013;8(2):153-160.
13. VA Research and Development Service. Use of Animals in Research. VHA Handbook 1200.07. Washington, DC: Department of Veterans Affairs, Veterans Health Administration; 2011.
14. VA Research and Development Service. Research and Development (R&D) Committee. VHA Handbook 1200.01. Washington, DC: Veterans Health Administration; 2009.
15. Research Compliance Officers and the Auditing of VHA Human Subjects Research to Determine Compliance with Applicable Laws, Regulations, and Policies. VHA Directive 2008-064. Washington, DC: Veterans Health Administration; 2008.
16. VA Office of Research Oversight. Research Compliance Reporting Requirements. VHA Handbook 1058.01. Washington, DC: Veterans Health Administration; 2015.
A Treatment Protocol for Patients With Diabetic Peripheral Neuropathy
The progressive symptoms of diabetic peripheral neuropathy (DPN) are some of the most frequent presentations of patients seeking care at the VHA. Patients with DPN often experience unmanageable pain in the lower extremities, loss of sensation in the feet, loss of balance, and an inability to perform daily functional activities.1 In addition, these patients are at significant risk for lower extremity ulceration and amputation.2 The symptoms and consequences of DPN are strongly linked to chronic use of pain medications as well as increased fall risk and injury.3 The high health care usage of veterans with these complex issues makes DPN a significant burden for the patient, the VHA, and society as a whole.
At the William Jennings Bryan Dorn VA Medical Center (WJBDVAMC) in Columbia, South Carolina, 10,763 veterans were identified to be at risk for limb loss in 2014 due to loss of protective sensation and 5,667 veterans diagnosed with DPN were treated in 2014.4 Although WJBDVAMC offers multiple clinics and programs to address the complex issues of diabetes and DPN, veterans oftentimes continue to experience uncontrolled pain, loss of protective sensation, and a decline in function even after diagnosis.
One area of improvement the authors identified in the WJBDVAMC Physical Medicine and Rehabilitation Services Department was the need for an effective, nonpharmacologic treatment for patients who experience DPN. As a result, the authors designed a pilot research study to determine whether or not a combined physical therapy intervention of monochromatic near-infrared energy (MIRE) treatments and a standardized balance exercise program would help improve the protective sensation, reduce fall risk, and decrease the adverse impact of pain on daily function. The study was approved by the institutional review board (IRB) and had no outside source of funding.
Background
Current treatments for DPN are primarily pharmacologic and are viewed as only moderately effective, limited by significant adverse effects (AEs) and drug interactions.5 Patients in the VHA at risk for amputation in low-, moderate-, and high-risk groups total 541,475 and 363,468 have a history of neuropathy. They are considered at risk due to multiple, documented factors, including weakness, callus, foot deformity, loss of protective sensation, and/or history of amputation.4 Neuropathy can affect tissues throughout the body, including organs, sensory neurons, cardiovascular status, the autonomic system, and the gastrointestinal tract as it progresses.
Individuals who develop DPN often experience severe, uncontrolled pain in the lower extremities, insensate feet, and decreased proprioceptive skills. The functional status of individuals with DPN often declines insidiously while mortality rate increases.6 Increased levels of neuropathic pain often lead to decreased activity levels, which, in turn, contribute to decreased endurance, poorly managed glycemic indexes, decreased strength, and decreased independence.
Additional DPN complications, such as decreased sensation and muscle atrophy in the lower extremities, often lead to foot deformity and increased areas of pressure during weight bearing postures. These areas of increased pressure may develop unknowingly into ulceration. If a patient’s wound becomes chronic and nonhealing, it can also lead to amputation. In such cases, early mortality may result.6,7 The cascading effects of neuropathic pain and decreased sensation place a patient with diabetes at risk for falls. Injuries from falls are widely known to be a leading cause of hospitalization and mortality in the elderly.8
Physical therapy may be prescribed for DPN and its resulting sequelae. Several studies present conflicting results regarding the benefits of therapeutic exercise in the treatment of DPN. Akbari and colleagues showed that balance exercises can increase stability in patients with DPN; whereas, a study by Kruse and colleagues noted a training program consisting of lower-extremity exercises, balance training, and walking resulted in minimal improvement of participants’ balance and leg strength over a 12-month period.9,10 Recent studies have shown that weight bearing does not increase ulceration in patients with diabetes and DPN. This is contrary to previous assumptions that patients with diabetes and DPN need to avoid weight-bearing activities.11,12
Transcutaneous electrical nerve stimulation (TENS), a modality often used in physical therapy, has been studied in the treatment of DPN with conflicting results. Gossrau and colleagues found that pain reduction with micro-TENS applied peripherally is not superior to a placebo.13 However, a case study by Somers and Somers indicated that TENS applied to the lumbar area seemed to reduce pain and insomnia associated with diabetic neuropathy.14
Several recent research studies suggest that MIRE, another available modality, may be effective in treating symptoms of DPN. Monochromatic infrared energy therapy is a noninvasive, drug-free, FDA-approved medical device that emits monochromatic near-infrared light to improve local circulation and decrease pain. A large study of 2,239 patients with DPN reported an increase in foot sensation and decreased neuropathic pain levels when treated with MIRE.15
Leonard and colleagues found that the MIRE treatments resulted in a significant increase in sensation in individuals with baseline sensation of 6.65 Semmes-Weinstein Monofilament (SWM) after 6 and 12 active treatments as well as a decrease in neuropathic symptoms as measured by the Michigan Neuropathy Screening Instrument.16 Prendergast and colleagues noted improved electrophysical changes in both large and small myelinated nerve fibers of patients with DPN following 10 MIRE treatments.17 When studying 49 patients with DPN, Kochman and colleagues found 100% of participants had improved sensation after 12 MIRE treatments when tested with monofilaments.18
An additional benefit of MIRE treatment is that it can be safely performed at home once the patient is educated on proper use and application. Home DPN treatment has the potential to decrease the burden this population places on health care systems by reducing provider visits, medication, hospitalization secondary to pain, ulceration, fall injuries, and amputations.
Methods
This was a prospective, case series pilot study designed to measure changes in patient pain levels using the visual analog scale (VAS) and Pain Outcomes Questionnaire-VA (POQ-VA), degree of protective sensation loss as measured by SWM, and fall risk as denoted by Tinetti scores from entry to 6 months. Informed consent was obtained prior to treatment, and 33 patients referred by primary care providers and specialty clinics met the criteria and enrolled in the study. Twenty-one patients completed the entire 6-month study. The nonparametric Friedman test with a Dunn’s multiple comparison (DMC) post hoc test was used to analyze the data from the initial, 4-week, 3-month, and 6-month follow-up visits.
Setting and Participants
The study was performed in the Outpatient Physical Therapy Department at WJBDVAMC. Veterans with DPN who met the inclusion/exclusion criteria were enrolled. Inclusion criteria specified that the participant must be referred by a qualified health care provider for the treatment of DPN, be able to read and write in English, have consistent transportation to and from the study location, and be able to apply MIRE therapy as directed at home.
Exclusion criteria were subjects for whom MIRE or exercise were contraindicated. Subjects were excluded if they had medical conditions that suggested a possible decline in health status in the next 6 months. Such conditions included a current regimen of chemotherapy, radiation therapy, or dialysis; recent lower extremity amputation without prosthesis; documented active alcohol and/or drug misuse; advanced chronic obstructive pulmonary disease as defined as dyspnea at rest at least once per day; unstable angina; hemiplegia or other lower extremity paralysis; and a history of central nervous system or peripheral nervous system demyelinating disorders. Additional exclusion criteria included hospitalization in the past 60 days, use of any apparatus for continuous or patient-controlled analgesia; history of chronic low back pain with documented radiculopathy; and any change in pertinent medications in the past 60 days, including pain medications, insulin, metformin, and anti-inflammatories.
Interventions
Subjects participated in a combined physical therapy approach using MIRE and a standardized balance program. Patients received treatment in the outpatient clinic 3 times each week for 4 weeks. The treatment then continued at the same frequency at home until the scheduled 6-month follow-up visit. Clinic and home treatments included application of MIRE to bilateral lower extremities and feet for 30 minutes each as well as performance of a therapeutic exercise program for balance.
In the clinic, 2 pads from the MIRE device (Anodyne Therapy, LLC, Tampa, FL) were placed along the medial and lateral aspect of each lower leg, and an additional 2 pads were placed in a T formation on the plantar surface of each foot, per the manufacturer’s recommendations. The T formation consisted of the first pad placed horizontally across the metatarsal heads and the second placed vertically down the length of the foot. Each pad was protected by plastic wrap to ensure proper hygiene and secured. The intensity of clinic treatments was set at 7 bars, which minimized the risk of burns. Home treatments were similar to those in the clinic, except that each leg had to be treated individually instead of simultaneously and home MIRE units are preset and only function at an intensity that is equivalent to around 7 bars on the clinical unit.
The standardized balance program consisted of a progression of the following exercises: ankle alphabet/ankle range of motion, standing lateral weight shifts, bilateral heel raises, bilateral toe raises, unilateral heel raises, unilateral toe raises, partial wall squats, and single leg stance. Each participant performed these exercises 3 times per week in the clinic and then 3 times per week at home following the 12th visit.
Outcomes and Follow-up
The POQ-VA, a subjective quality of life (QOL) measure for veterans, as well as VAS, SWM testing, and the Tinetti Gait and Balance Assessment scores were used to measure outcomes. Data were collected for each of these measures during the initial and 12th clinic visits and at the 3-month and 6-month follow-up visits. The POQ-VA and VAS scores were self-reported and filled out by each participant at the initial, 12th, 3-month, and 6-month visits. The POQ-VA score has proven to be reliable and valid for the assessment of noncancer, chronic pain in veterans.19 The VAS scores were measured using a scale of 0 to 10 cm.
The SWM was standardized, and 7 sites were tested on each foot during the initial, 12th, 3-month, and 6-month visits: plantar surface of the distal great toe, the distal 3rd toe, the distal 5th toe, the 1st metatarsal head, the 3rd metatarsal head, the 5th metatarsal head, and the mid-plantar arch. At each site, the SWM was applied with just enough force to initiate a bending force and held for 1.5 seconds. Each site was tested 3 times. Participants had to detect the monofilament at least twice for the monofilament value to be recorded. Monofilament testing began with 6.65 SWM and decreased to 5.07, 4.56, 4.32, and lower until the patient was no longer able to detect sensation.
The Tinetti Gait and Balance Assessments was performed on each participant at the initial, 12th, 3-month, and 6-month visits. Tinetti balance, gait, and total scores were recorded at each interval.
Results
Thirty-three patients, referred by primary care providers and specialty clinics, met the inclusion criteria and enrolled in the study. Twenty-one patients (20 men and 1 woman) completed the entire 6-month study. Causes for withdrawal included travel difficulties (5), did not show up for follow-up visits (4), lumbar radiculopathy (1), perceived minimal/no benefit (1), and unrelated death (1). No AEs were reported.
The Friedman test with DMC post hoc test was performed on the POQ-VA total score and subscale scores. The POQ-VA subscale scores were divided into the following domains: pain, activities of daily living (ADL), fear, negative affect, mobility, and vitality. The POQ-VA domains were analyzed to compare data from the initial, 12th, 3-month, and 6-month visits. The POQ-VA total score significantly decreased from the initial to the 12th visit (P < .01), from the initial to the 3-month (P < .01), and from the initial to the 6-month visit (P < .05). However, there was no significant change from the 12th visit to the 3-month follow-up, 12th visit to the 6-month follow-up, or the 3-month to 6-month follow-up.
The POQ-VA pain score decreased significantly from the initial to the 12th visit (P < .05) and from the initial to the 6-month visit (P < .05). However, there was no significant interval change from the initial to the 3-month, the 12th to 3-month, 12th to 6-month, or 3-month to 6-month visit (Figure 1). The POQ-VA vitality scores and POQ-VA fear scores did not yield significant changes. The POQ-VA negative affect scores showed significant improvement only between the initial and the 3-month visit (P < .05) (Figure 2). The POQ-VA ADL scores showed significant improvement in the initial vs 3-month score (P < .05). The POQ-VA mobility scores were significantly improved for the initial vs 12th visit (P < .01), initial vs 3-month visit (P < .01), and the initial vs 6-month visit (P < .001) (Figure 1).
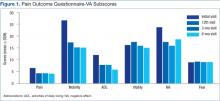
Analysis of VAS scores revealed a significant decrease at the 6-month time frame compared with the initial score for the left foot (P < .05). Further VAS analysis revealed no significant difference between the initial and 6-month right foot VAS score. When both feet were compared together, there was no significant difference in VAS ratings between any 2 points in time.
Analysis of Tinetti Total Score, Tinetti Balance Score, and Tinetti Gait Score revealed a significant difference between the initial vs 3-month visit for all 3 scores (P < .001, P < .001, and P < .05, respectively). In addition, Tinetti Total (P < .001) and Tinetti Balance (P < .01) scores were significantly improved from initial to the final 6-month visit. There were no significant findings between interim scores of the initial and 12th visits, the 12th and 3-month visits, or the 3-month and 6-month scores (Figure 2).
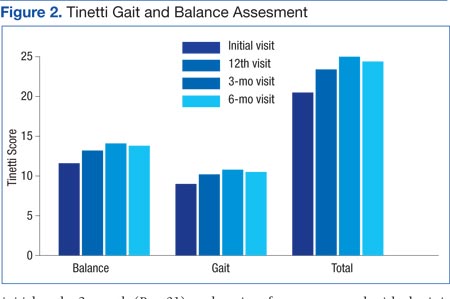
Analysis of SWM testing indicated a significant decrease in the total number of insensate sites (> 5.07) when both feet were grouped together between the initial and 3-month visits (P < .05) as well as the initial and 6-month (P < .01) visits. When the left and right feet were compared independently of each other, there was a significant decrease in the number of insensate sites between the initial and 6-month visits (P < .01 for both) (Figure 3).
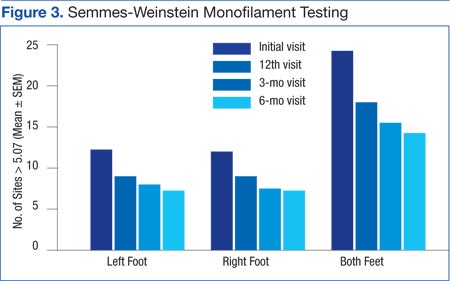
Discussion
This study investigated whether or not a multimodal physical therapy approach would reduce several of the debilitating symptoms of DPN experienced by many veterans at WJBDVAMC. The results support the idea that a combined treatment protocol of MIRE and a standardized exercise program can lead to decreased POQ-VA pain levels, improved balance, and improved protective sensation in veterans with DPN. Alleviation of these DPN complications may ultimately decrease an individual’s risk of injury and improve overall QOL.
Because the POQ-VA is a reliable, valid self-reported measure for veterans, it was chosen to quantify the impact of pain. Overall, veterans who participated in this study perceived decreased pain interference in multiple areas of their lives. The most significant findings were in overall QOL, household and community mobility, and pain ratings. This suggests that the combined treatment protocol will help veterans maintain an active lifestyle despite poorly controlled diabetes and neuropathic pain.
Along with decreased pain interference with QOL, participants demonstrated a decrease in fall risk as quantified by the Tinetti Gait and Balance Assessment. The SWM testing showed improved protective sensation as early as 3 months and continued through the 6-month visit. As protective sensation improves and fall risk decreases, the risk of injury is lessened, fear of falling is decreased, and individuals are less likely to self-impose limitations on daily activity levels, which improves QOL. In addition, decreased fall risk and improved protective sensation can reduce the financial burden on both the patient and the health care system. Many individuals are hospitalized secondary to fall injury, nonhealing wounds, resulting infections, and/or secondary complications from prolonged immobility. This treatment protocol demonstrates how a standardized physical therapy protocol, including MIRE and balance exercises, can be used preventively to reduce both the personal and financial impact of DPN.
It is interesting to note that some POQ-VA and Tinetti subscores were significantly improved at 3 months but not at 6 months. The significance achieved at 3 months may be due to the time required (ie, > 12 visits) to make significant physiological changes. The lack of significance at 6 months may be due to the natural tendency of participants to less consistently perform the home exercise program and MIRE protocol when unsupervised in the home. Differences in the VAS and POQ-VA pain score ratings were noted in the data. The POQ-VA pain rating scale indicated significant improvement in pain levels over the course of the study. However, when asked about pain using the 10-cm VAS, patients reported no significant improvements. This may be because veterans are more familiar with the numerical pain rating scale and are rarely asked to use the 10-cm VAS. It may also be because the POQ-VA pain rating asks for an average pain level over the previous week, whereas the 10-cm VAS asks for pain level at a discrete point in time.
Historically, physical therapy has had little to offer individuals with DPN. As a result of this study, however, a standardized treatment program for DPN has been implemented at the WJBDVAMC Physical Therapy Clinic. Referred patients are seen in the clinic on a trial basis. If positive results are documented during the clinic treatments, a home MIRE unit and exercise program are provided. The patients are expected to continue performing home treatments of MIRE and exercise 3 times a week after discharge.
Strengths and Limitations
Strengths of the study include a stringent IRB review, control of medication changes during the study through alerts to all VA providers, and a standardized MIRE and exercise protocol. An additional strength is the long duration of the study, which included supervised and unsupervised interventions that simulate real-life scenarios.
Limitations of the study include a small sample size, case-controlled design rather than a randomized, double-blinded study, which can contribute to selection bias, inability to differentiate between the benefits of physical therapy alone vs physical therapy and MIRE treatments, and retention of participants due to travel difficulties across a wide catchment area.
This pilot study should be expanded to a multicenter, randomized, double-blinded study to clarify the most beneficial treatments for individuals with diabetic neuropathy. Examining the number of documented falls pre- and postintervention may also be helpful to determine actual effects on an individual’s fall risk.
Conclusion
The use of a multimodal physical therapy approach seems to be effective in reducing the impact of neuropathic pain, the risk of amputation, and the risk of falls in individuals who have pursued all standard medical options but still experience the long-term effects of DPN. By adhering to a standardized treatment protocol of MIRE and therapeutic exercise, it seems that the benefits of this intervention can be maintained over time. This offers new, nonconventional treatment options in the field of physical therapy for veterans whose QOL is negatively impacted by the devastating effects of diabetic neuropathy.
Acknowledgements
Clinical support was provided by David Metzelfeld, DPT, and Cam Lendrim, PTA of William Jennings Bryan Dorn VA Medical Center. Paul Bartels, PhD, of Warren Wilson College provided data analysis support. Anodyne Therapy, LLC, provided the MIRE unit used in the clinic.
Author disclosures
The authors report no actual or potential conflicts of interest with regard to this article.
Disclaimer
The opinions expressed herein are those of the authors and do not necessarily reflect those of Federal Practitioner, Frontline Medical Communications Inc., the U.S. Government, or any of its agencies. This article may discuss unlabeled or investigational use of certain drugs. Please review complete prescribing information for specific drugs or drug combinations—including indications, contraindications, warnings, and adverse effects—before administering pharmacologic therapy to patients.
1. National Institute of Neurological Disorders and Stroke. Peripheral neuropathy fact sheet. National Institute of Neurological Disorders and Stroke Website. http://www.ninds.nih.gov/disorders/peripheralneuropath/detail_peripheralneuropathy.htm#183583208. Updated April 17, 2015. Accesssed August 8, 2015.
2. Armstrong DG, Lavery LA, and Wunderlich RP. Risk factors for diabetic foot ulceration: a logical approach to treatment. J Wound Ostomy Continence Nurs. 1998;25(3):123-128.
3. Pesa J, Meyer R, Quock T, Rattana SK, Mody SH. MBA Opioid utilization patterns among medicare patients with diabetic peripheral neuropathy. Am Health Drug Benefits. 2013;6(4):188-196.
4. VHA Support Service Center. The amputation risk by facility in the ProClarity amputation risk (PAVE) cube. Department of Veterans Affairs Nonpublic Intranet. http://vssc.med.va.gov.
5. Gore M, Brandenburg NA, Hoffman DL, Tai KS, Stacey B. Burden of illness in painful diabetic peripheral neuropathy: the patients’ perspectives. J Pain. 2006;7(12):892-900
6. Tentolouris N, Al-Sabbagh S, Walker MG, Boulton AJ, Jude EB. Mortality in diabetic and nondiabetic patients after amputations performed from 1990 to 1995: a 5-year follow-up study. Diabetes Care. 2004;27(7):1598-1604.
7. Boyko EJ, Ahroni JH, Stensel V, Forsberg RC, Davignon DR, Smith DG. A prospective study of risk factors for diabetic foot ulcer. The Seattle Diabetic Foot Study. Diabetes Care. 1999;22(7):1036-1042.
8. Centers for Disease Control and Prevention. Older adults falls: get the facts. Centers for Disease Control and Prevention Website. http://www.cdc.gov/HomeandRecreationalSafety/Falls/adultfalls.html. Updated July 1, 2015. Accessed August 8, 2015.
9. Akbari M, Jafari H, Moshashaee A, Forugh B. Do diabetic neuropathy patients benefit from balance training? J Rehabil Res Dev. 2012;49(2):333-338.
10. Kruse RL, Lemaster JW, Madsen RW. Fall and balance outcomes after an intervention to promote leg strength, balance, and walking in people with diabetic peripheral neuropathy: “feet first” randomized controlled trial. Phys Ther. 2010;90(11):1568-1579.
11. Lemaster JW, Mueller MJ, Reiber GE, Mehr DR, Madsen RW, Conn VS. Effect of weight-bearing activity on foot ulcer incidence in people with diabetic peripheral neuropathy: feet first randomized controlled trial. Phys Ther. 2008;88(11):1385-1398.
12. Tuttle LG, Hastings MK, and Mueller MJ. A moderate-intensity weight-bearing exercise program for a person with type 2 diabetes and peripheral neuropathy. Phys Ther. 2012;92(1):133-141.
13. Gossrau G, Wähner M, Kuschke M, et al. Microcurrent transcutaneous electric nerve stimulation in painful diabetic neuropathy: a randomized placebo-controlled study. Pain Med. 2011;12(6):953-960.
14. Somers DL, Somers MF. Treatment of neuropathic pain in a patient with diabetic neuropathy using transcutaneous electrical nerve stimulation applied to the skin of the lumbar region. Phys Ther. 1999;79(8):767-775.
15. Harkless LB, DeLellis S, Carnegie DH, Burke TJ. Improved foot sensitivity and pain reduction in patients with peripheral neuropathy after treatment with monochromatic infrared photo energy—MIRE. J Diabetes Complications. 2006;20(2):81-87.
16. Leonard DR, Farooqi MH, Myers S. Restoration of sensation, reduced pain, and improved balance in subjects with diabetic peripheral neuropathy: a double-blind, randomized, placebo-controlled study with monochromatic near-infrared treatment. Diabetes Care. 2004;27(1):168-172.
17. Prendergast JJ, Miranda G, Sanchez M. Improvement of sensory impairment in patients with peripheral neuropathy. Endocr Pract. 2004;10(1):24-30.
18. Kochman AB, Carnegie DH, Burke TJ. Symptomatic reversal of peripheral neuropathy in patients with diabetes. J Am Podiatr Med Assoc. 2002;92(3):125-130.
19. Clark ME, Gironda RJ, Young RW. Development and validation of the Pain Outcomes Questionnaire-VA. J Rehabil Res Dev. 2003;40(5):381-395.
The progressive symptoms of diabetic peripheral neuropathy (DPN) are some of the most frequent presentations of patients seeking care at the VHA. Patients with DPN often experience unmanageable pain in the lower extremities, loss of sensation in the feet, loss of balance, and an inability to perform daily functional activities.1 In addition, these patients are at significant risk for lower extremity ulceration and amputation.2 The symptoms and consequences of DPN are strongly linked to chronic use of pain medications as well as increased fall risk and injury.3 The high health care usage of veterans with these complex issues makes DPN a significant burden for the patient, the VHA, and society as a whole.
At the William Jennings Bryan Dorn VA Medical Center (WJBDVAMC) in Columbia, South Carolina, 10,763 veterans were identified to be at risk for limb loss in 2014 due to loss of protective sensation and 5,667 veterans diagnosed with DPN were treated in 2014.4 Although WJBDVAMC offers multiple clinics and programs to address the complex issues of diabetes and DPN, veterans oftentimes continue to experience uncontrolled pain, loss of protective sensation, and a decline in function even after diagnosis.
One area of improvement the authors identified in the WJBDVAMC Physical Medicine and Rehabilitation Services Department was the need for an effective, nonpharmacologic treatment for patients who experience DPN. As a result, the authors designed a pilot research study to determine whether or not a combined physical therapy intervention of monochromatic near-infrared energy (MIRE) treatments and a standardized balance exercise program would help improve the protective sensation, reduce fall risk, and decrease the adverse impact of pain on daily function. The study was approved by the institutional review board (IRB) and had no outside source of funding.
Background
Current treatments for DPN are primarily pharmacologic and are viewed as only moderately effective, limited by significant adverse effects (AEs) and drug interactions.5 Patients in the VHA at risk for amputation in low-, moderate-, and high-risk groups total 541,475 and 363,468 have a history of neuropathy. They are considered at risk due to multiple, documented factors, including weakness, callus, foot deformity, loss of protective sensation, and/or history of amputation.4 Neuropathy can affect tissues throughout the body, including organs, sensory neurons, cardiovascular status, the autonomic system, and the gastrointestinal tract as it progresses.
Individuals who develop DPN often experience severe, uncontrolled pain in the lower extremities, insensate feet, and decreased proprioceptive skills. The functional status of individuals with DPN often declines insidiously while mortality rate increases.6 Increased levels of neuropathic pain often lead to decreased activity levels, which, in turn, contribute to decreased endurance, poorly managed glycemic indexes, decreased strength, and decreased independence.
Additional DPN complications, such as decreased sensation and muscle atrophy in the lower extremities, often lead to foot deformity and increased areas of pressure during weight bearing postures. These areas of increased pressure may develop unknowingly into ulceration. If a patient’s wound becomes chronic and nonhealing, it can also lead to amputation. In such cases, early mortality may result.6,7 The cascading effects of neuropathic pain and decreased sensation place a patient with diabetes at risk for falls. Injuries from falls are widely known to be a leading cause of hospitalization and mortality in the elderly.8
Physical therapy may be prescribed for DPN and its resulting sequelae. Several studies present conflicting results regarding the benefits of therapeutic exercise in the treatment of DPN. Akbari and colleagues showed that balance exercises can increase stability in patients with DPN; whereas, a study by Kruse and colleagues noted a training program consisting of lower-extremity exercises, balance training, and walking resulted in minimal improvement of participants’ balance and leg strength over a 12-month period.9,10 Recent studies have shown that weight bearing does not increase ulceration in patients with diabetes and DPN. This is contrary to previous assumptions that patients with diabetes and DPN need to avoid weight-bearing activities.11,12
Transcutaneous electrical nerve stimulation (TENS), a modality often used in physical therapy, has been studied in the treatment of DPN with conflicting results. Gossrau and colleagues found that pain reduction with micro-TENS applied peripherally is not superior to a placebo.13 However, a case study by Somers and Somers indicated that TENS applied to the lumbar area seemed to reduce pain and insomnia associated with diabetic neuropathy.14
Several recent research studies suggest that MIRE, another available modality, may be effective in treating symptoms of DPN. Monochromatic infrared energy therapy is a noninvasive, drug-free, FDA-approved medical device that emits monochromatic near-infrared light to improve local circulation and decrease pain. A large study of 2,239 patients with DPN reported an increase in foot sensation and decreased neuropathic pain levels when treated with MIRE.15
Leonard and colleagues found that the MIRE treatments resulted in a significant increase in sensation in individuals with baseline sensation of 6.65 Semmes-Weinstein Monofilament (SWM) after 6 and 12 active treatments as well as a decrease in neuropathic symptoms as measured by the Michigan Neuropathy Screening Instrument.16 Prendergast and colleagues noted improved electrophysical changes in both large and small myelinated nerve fibers of patients with DPN following 10 MIRE treatments.17 When studying 49 patients with DPN, Kochman and colleagues found 100% of participants had improved sensation after 12 MIRE treatments when tested with monofilaments.18
An additional benefit of MIRE treatment is that it can be safely performed at home once the patient is educated on proper use and application. Home DPN treatment has the potential to decrease the burden this population places on health care systems by reducing provider visits, medication, hospitalization secondary to pain, ulceration, fall injuries, and amputations.
Methods
This was a prospective, case series pilot study designed to measure changes in patient pain levels using the visual analog scale (VAS) and Pain Outcomes Questionnaire-VA (POQ-VA), degree of protective sensation loss as measured by SWM, and fall risk as denoted by Tinetti scores from entry to 6 months. Informed consent was obtained prior to treatment, and 33 patients referred by primary care providers and specialty clinics met the criteria and enrolled in the study. Twenty-one patients completed the entire 6-month study. The nonparametric Friedman test with a Dunn’s multiple comparison (DMC) post hoc test was used to analyze the data from the initial, 4-week, 3-month, and 6-month follow-up visits.
Setting and Participants
The study was performed in the Outpatient Physical Therapy Department at WJBDVAMC. Veterans with DPN who met the inclusion/exclusion criteria were enrolled. Inclusion criteria specified that the participant must be referred by a qualified health care provider for the treatment of DPN, be able to read and write in English, have consistent transportation to and from the study location, and be able to apply MIRE therapy as directed at home.
Exclusion criteria were subjects for whom MIRE or exercise were contraindicated. Subjects were excluded if they had medical conditions that suggested a possible decline in health status in the next 6 months. Such conditions included a current regimen of chemotherapy, radiation therapy, or dialysis; recent lower extremity amputation without prosthesis; documented active alcohol and/or drug misuse; advanced chronic obstructive pulmonary disease as defined as dyspnea at rest at least once per day; unstable angina; hemiplegia or other lower extremity paralysis; and a history of central nervous system or peripheral nervous system demyelinating disorders. Additional exclusion criteria included hospitalization in the past 60 days, use of any apparatus for continuous or patient-controlled analgesia; history of chronic low back pain with documented radiculopathy; and any change in pertinent medications in the past 60 days, including pain medications, insulin, metformin, and anti-inflammatories.
Interventions
Subjects participated in a combined physical therapy approach using MIRE and a standardized balance program. Patients received treatment in the outpatient clinic 3 times each week for 4 weeks. The treatment then continued at the same frequency at home until the scheduled 6-month follow-up visit. Clinic and home treatments included application of MIRE to bilateral lower extremities and feet for 30 minutes each as well as performance of a therapeutic exercise program for balance.
In the clinic, 2 pads from the MIRE device (Anodyne Therapy, LLC, Tampa, FL) were placed along the medial and lateral aspect of each lower leg, and an additional 2 pads were placed in a T formation on the plantar surface of each foot, per the manufacturer’s recommendations. The T formation consisted of the first pad placed horizontally across the metatarsal heads and the second placed vertically down the length of the foot. Each pad was protected by plastic wrap to ensure proper hygiene and secured. The intensity of clinic treatments was set at 7 bars, which minimized the risk of burns. Home treatments were similar to those in the clinic, except that each leg had to be treated individually instead of simultaneously and home MIRE units are preset and only function at an intensity that is equivalent to around 7 bars on the clinical unit.
The standardized balance program consisted of a progression of the following exercises: ankle alphabet/ankle range of motion, standing lateral weight shifts, bilateral heel raises, bilateral toe raises, unilateral heel raises, unilateral toe raises, partial wall squats, and single leg stance. Each participant performed these exercises 3 times per week in the clinic and then 3 times per week at home following the 12th visit.
Outcomes and Follow-up
The POQ-VA, a subjective quality of life (QOL) measure for veterans, as well as VAS, SWM testing, and the Tinetti Gait and Balance Assessment scores were used to measure outcomes. Data were collected for each of these measures during the initial and 12th clinic visits and at the 3-month and 6-month follow-up visits. The POQ-VA and VAS scores were self-reported and filled out by each participant at the initial, 12th, 3-month, and 6-month visits. The POQ-VA score has proven to be reliable and valid for the assessment of noncancer, chronic pain in veterans.19 The VAS scores were measured using a scale of 0 to 10 cm.
The SWM was standardized, and 7 sites were tested on each foot during the initial, 12th, 3-month, and 6-month visits: plantar surface of the distal great toe, the distal 3rd toe, the distal 5th toe, the 1st metatarsal head, the 3rd metatarsal head, the 5th metatarsal head, and the mid-plantar arch. At each site, the SWM was applied with just enough force to initiate a bending force and held for 1.5 seconds. Each site was tested 3 times. Participants had to detect the monofilament at least twice for the monofilament value to be recorded. Monofilament testing began with 6.65 SWM and decreased to 5.07, 4.56, 4.32, and lower until the patient was no longer able to detect sensation.
The Tinetti Gait and Balance Assessments was performed on each participant at the initial, 12th, 3-month, and 6-month visits. Tinetti balance, gait, and total scores were recorded at each interval.
Results
Thirty-three patients, referred by primary care providers and specialty clinics, met the inclusion criteria and enrolled in the study. Twenty-one patients (20 men and 1 woman) completed the entire 6-month study. Causes for withdrawal included travel difficulties (5), did not show up for follow-up visits (4), lumbar radiculopathy (1), perceived minimal/no benefit (1), and unrelated death (1). No AEs were reported.
The Friedman test with DMC post hoc test was performed on the POQ-VA total score and subscale scores. The POQ-VA subscale scores were divided into the following domains: pain, activities of daily living (ADL), fear, negative affect, mobility, and vitality. The POQ-VA domains were analyzed to compare data from the initial, 12th, 3-month, and 6-month visits. The POQ-VA total score significantly decreased from the initial to the 12th visit (P < .01), from the initial to the 3-month (P < .01), and from the initial to the 6-month visit (P < .05). However, there was no significant change from the 12th visit to the 3-month follow-up, 12th visit to the 6-month follow-up, or the 3-month to 6-month follow-up.
The POQ-VA pain score decreased significantly from the initial to the 12th visit (P < .05) and from the initial to the 6-month visit (P < .05). However, there was no significant interval change from the initial to the 3-month, the 12th to 3-month, 12th to 6-month, or 3-month to 6-month visit (Figure 1). The POQ-VA vitality scores and POQ-VA fear scores did not yield significant changes. The POQ-VA negative affect scores showed significant improvement only between the initial and the 3-month visit (P < .05) (Figure 2). The POQ-VA ADL scores showed significant improvement in the initial vs 3-month score (P < .05). The POQ-VA mobility scores were significantly improved for the initial vs 12th visit (P < .01), initial vs 3-month visit (P < .01), and the initial vs 6-month visit (P < .001) (Figure 1).
Analysis of VAS scores revealed a significant decrease at the 6-month time frame compared with the initial score for the left foot (P < .05). Further VAS analysis revealed no significant difference between the initial and 6-month right foot VAS score. When both feet were compared together, there was no significant difference in VAS ratings between any 2 points in time.
Analysis of Tinetti Total Score, Tinetti Balance Score, and Tinetti Gait Score revealed a significant difference between the initial vs 3-month visit for all 3 scores (P < .001, P < .001, and P < .05, respectively). In addition, Tinetti Total (P < .001) and Tinetti Balance (P < .01) scores were significantly improved from initial to the final 6-month visit. There were no significant findings between interim scores of the initial and 12th visits, the 12th and 3-month visits, or the 3-month and 6-month scores (Figure 2).
Analysis of SWM testing indicated a significant decrease in the total number of insensate sites (> 5.07) when both feet were grouped together between the initial and 3-month visits (P < .05) as well as the initial and 6-month (P < .01) visits. When the left and right feet were compared independently of each other, there was a significant decrease in the number of insensate sites between the initial and 6-month visits (P < .01 for both) (Figure 3).
Discussion
This study investigated whether or not a multimodal physical therapy approach would reduce several of the debilitating symptoms of DPN experienced by many veterans at WJBDVAMC. The results support the idea that a combined treatment protocol of MIRE and a standardized exercise program can lead to decreased POQ-VA pain levels, improved balance, and improved protective sensation in veterans with DPN. Alleviation of these DPN complications may ultimately decrease an individual’s risk of injury and improve overall QOL.
Because the POQ-VA is a reliable, valid self-reported measure for veterans, it was chosen to quantify the impact of pain. Overall, veterans who participated in this study perceived decreased pain interference in multiple areas of their lives. The most significant findings were in overall QOL, household and community mobility, and pain ratings. This suggests that the combined treatment protocol will help veterans maintain an active lifestyle despite poorly controlled diabetes and neuropathic pain.
Along with decreased pain interference with QOL, participants demonstrated a decrease in fall risk as quantified by the Tinetti Gait and Balance Assessment. The SWM testing showed improved protective sensation as early as 3 months and continued through the 6-month visit. As protective sensation improves and fall risk decreases, the risk of injury is lessened, fear of falling is decreased, and individuals are less likely to self-impose limitations on daily activity levels, which improves QOL. In addition, decreased fall risk and improved protective sensation can reduce the financial burden on both the patient and the health care system. Many individuals are hospitalized secondary to fall injury, nonhealing wounds, resulting infections, and/or secondary complications from prolonged immobility. This treatment protocol demonstrates how a standardized physical therapy protocol, including MIRE and balance exercises, can be used preventively to reduce both the personal and financial impact of DPN.
It is interesting to note that some POQ-VA and Tinetti subscores were significantly improved at 3 months but not at 6 months. The significance achieved at 3 months may be due to the time required (ie, > 12 visits) to make significant physiological changes. The lack of significance at 6 months may be due to the natural tendency of participants to less consistently perform the home exercise program and MIRE protocol when unsupervised in the home. Differences in the VAS and POQ-VA pain score ratings were noted in the data. The POQ-VA pain rating scale indicated significant improvement in pain levels over the course of the study. However, when asked about pain using the 10-cm VAS, patients reported no significant improvements. This may be because veterans are more familiar with the numerical pain rating scale and are rarely asked to use the 10-cm VAS. It may also be because the POQ-VA pain rating asks for an average pain level over the previous week, whereas the 10-cm VAS asks for pain level at a discrete point in time.
Historically, physical therapy has had little to offer individuals with DPN. As a result of this study, however, a standardized treatment program for DPN has been implemented at the WJBDVAMC Physical Therapy Clinic. Referred patients are seen in the clinic on a trial basis. If positive results are documented during the clinic treatments, a home MIRE unit and exercise program are provided. The patients are expected to continue performing home treatments of MIRE and exercise 3 times a week after discharge.
Strengths and Limitations
Strengths of the study include a stringent IRB review, control of medication changes during the study through alerts to all VA providers, and a standardized MIRE and exercise protocol. An additional strength is the long duration of the study, which included supervised and unsupervised interventions that simulate real-life scenarios.
Limitations of the study include a small sample size, case-controlled design rather than a randomized, double-blinded study, which can contribute to selection bias, inability to differentiate between the benefits of physical therapy alone vs physical therapy and MIRE treatments, and retention of participants due to travel difficulties across a wide catchment area.
This pilot study should be expanded to a multicenter, randomized, double-blinded study to clarify the most beneficial treatments for individuals with diabetic neuropathy. Examining the number of documented falls pre- and postintervention may also be helpful to determine actual effects on an individual’s fall risk.
Conclusion
The use of a multimodal physical therapy approach seems to be effective in reducing the impact of neuropathic pain, the risk of amputation, and the risk of falls in individuals who have pursued all standard medical options but still experience the long-term effects of DPN. By adhering to a standardized treatment protocol of MIRE and therapeutic exercise, it seems that the benefits of this intervention can be maintained over time. This offers new, nonconventional treatment options in the field of physical therapy for veterans whose QOL is negatively impacted by the devastating effects of diabetic neuropathy.
Acknowledgements
Clinical support was provided by David Metzelfeld, DPT, and Cam Lendrim, PTA of William Jennings Bryan Dorn VA Medical Center. Paul Bartels, PhD, of Warren Wilson College provided data analysis support. Anodyne Therapy, LLC, provided the MIRE unit used in the clinic.
Author disclosures
The authors report no actual or potential conflicts of interest with regard to this article.
Disclaimer
The opinions expressed herein are those of the authors and do not necessarily reflect those of Federal Practitioner, Frontline Medical Communications Inc., the U.S. Government, or any of its agencies. This article may discuss unlabeled or investigational use of certain drugs. Please review complete prescribing information for specific drugs or drug combinations—including indications, contraindications, warnings, and adverse effects—before administering pharmacologic therapy to patients.
1. National Institute of Neurological Disorders and Stroke. Peripheral neuropathy fact sheet. National Institute of Neurological Disorders and Stroke Website. http://www.ninds.nih.gov/disorders/peripheralneuropath/detail_peripheralneuropathy.htm#183583208. Updated April 17, 2015. Accesssed August 8, 2015.
2. Armstrong DG, Lavery LA, and Wunderlich RP. Risk factors for diabetic foot ulceration: a logical approach to treatment. J Wound Ostomy Continence Nurs. 1998;25(3):123-128.
3. Pesa J, Meyer R, Quock T, Rattana SK, Mody SH. MBA Opioid utilization patterns among medicare patients with diabetic peripheral neuropathy. Am Health Drug Benefits. 2013;6(4):188-196.
4. VHA Support Service Center. The amputation risk by facility in the ProClarity amputation risk (PAVE) cube. Department of Veterans Affairs Nonpublic Intranet. http://vssc.med.va.gov.
5. Gore M, Brandenburg NA, Hoffman DL, Tai KS, Stacey B. Burden of illness in painful diabetic peripheral neuropathy: the patients’ perspectives. J Pain. 2006;7(12):892-900
6. Tentolouris N, Al-Sabbagh S, Walker MG, Boulton AJ, Jude EB. Mortality in diabetic and nondiabetic patients after amputations performed from 1990 to 1995: a 5-year follow-up study. Diabetes Care. 2004;27(7):1598-1604.
7. Boyko EJ, Ahroni JH, Stensel V, Forsberg RC, Davignon DR, Smith DG. A prospective study of risk factors for diabetic foot ulcer. The Seattle Diabetic Foot Study. Diabetes Care. 1999;22(7):1036-1042.
8. Centers for Disease Control and Prevention. Older adults falls: get the facts. Centers for Disease Control and Prevention Website. http://www.cdc.gov/HomeandRecreationalSafety/Falls/adultfalls.html. Updated July 1, 2015. Accessed August 8, 2015.
9. Akbari M, Jafari H, Moshashaee A, Forugh B. Do diabetic neuropathy patients benefit from balance training? J Rehabil Res Dev. 2012;49(2):333-338.
10. Kruse RL, Lemaster JW, Madsen RW. Fall and balance outcomes after an intervention to promote leg strength, balance, and walking in people with diabetic peripheral neuropathy: “feet first” randomized controlled trial. Phys Ther. 2010;90(11):1568-1579.
11. Lemaster JW, Mueller MJ, Reiber GE, Mehr DR, Madsen RW, Conn VS. Effect of weight-bearing activity on foot ulcer incidence in people with diabetic peripheral neuropathy: feet first randomized controlled trial. Phys Ther. 2008;88(11):1385-1398.
12. Tuttle LG, Hastings MK, and Mueller MJ. A moderate-intensity weight-bearing exercise program for a person with type 2 diabetes and peripheral neuropathy. Phys Ther. 2012;92(1):133-141.
13. Gossrau G, Wähner M, Kuschke M, et al. Microcurrent transcutaneous electric nerve stimulation in painful diabetic neuropathy: a randomized placebo-controlled study. Pain Med. 2011;12(6):953-960.
14. Somers DL, Somers MF. Treatment of neuropathic pain in a patient with diabetic neuropathy using transcutaneous electrical nerve stimulation applied to the skin of the lumbar region. Phys Ther. 1999;79(8):767-775.
15. Harkless LB, DeLellis S, Carnegie DH, Burke TJ. Improved foot sensitivity and pain reduction in patients with peripheral neuropathy after treatment with monochromatic infrared photo energy—MIRE. J Diabetes Complications. 2006;20(2):81-87.
16. Leonard DR, Farooqi MH, Myers S. Restoration of sensation, reduced pain, and improved balance in subjects with diabetic peripheral neuropathy: a double-blind, randomized, placebo-controlled study with monochromatic near-infrared treatment. Diabetes Care. 2004;27(1):168-172.
17. Prendergast JJ, Miranda G, Sanchez M. Improvement of sensory impairment in patients with peripheral neuropathy. Endocr Pract. 2004;10(1):24-30.
18. Kochman AB, Carnegie DH, Burke TJ. Symptomatic reversal of peripheral neuropathy in patients with diabetes. J Am Podiatr Med Assoc. 2002;92(3):125-130.
19. Clark ME, Gironda RJ, Young RW. Development and validation of the Pain Outcomes Questionnaire-VA. J Rehabil Res Dev. 2003;40(5):381-395.
Two‐Item Bedside Test for Delirium
Delirium (acute confusion) is common in older adults and leads to poor outcomes, such as death, clinician and caregiver burden, and prolonged cognitive and functional decline.[1, 2, 3, 4] Delirium is extremely costly, with estimates ranging from $143 to $152 billion annually (2005 US$).[5, 6] Early detection and management may improve the poor outcomes and reduce costs attributable to delirium,[3, 7] yet delirium identification in clinical practice has been challenging, particularly when translating research tools to the bedside.[8, 9, 10]As a result, only 12% to 35% of delirium cases are detected in routine care, with hypoactive delirium and delirium superimposed on dementia most likely to be missed.[11, 12, 13, 14, 15]
To address these issues, we recently developed and published the three‐dimensional Confusion Assessment Method (3D‐CAM), the 3‐minute diagnostic assessment for CAM‐defined delirium.[16] The 3D‐CAM is a structured assessment tool that includes mental status testing, patient symptom probes, and guided interviewer observations for signs of delirium. 3D‐CAM items were selected through a rigorous process to determine the most informative items for the 4 CAM diagnostic features.[17] The 3D‐CAM can be completed in 3 minutes, and has 95% sensitivity and 94% specificity relative to a reference standard.[16]
Despite the capabilities of the 3D‐CAM, there are situations when even 3 minutes is too long to devote to delirium identification. Moreover, a 2‐step approach in which a sensitive ultrabrief screen is administered, followed by the 3D‐CAM in positives, may be the most efficient approach for large‐scale delirium case identification. The aim of the current study was to use the 3D‐CAM database to identify the most sensitive single item and pair of items in the diagnosis of delirium, using the reference standard in the diagnostic accuracy analysis. We hypothesized that we could identify a single item with greater than 80% sensitivity and a pair of items with greater than 90% sensitivity for detection of delirium.
METHODS
Study Sample and Design
We analyzed data from the 3D‐CAM validation study,[16] which prospectively enrolled participants from a large urban teaching hospital in Boston, Massachusetts, using a consecutive enrollment sampling strategy. Inclusion criteria were: (1) 75 years old, (2) admitted to general or geriatric medicine services, (3) able to communicate in English, (4) without terminal conditions, (5) expected hospital stay of 2 days, (6) not a previous study participant. Experienced clinicians screened patients for eligibility. If the patient lacked capacity to provide consent, the designated surrogate decision maker was contacted. The study was approved by the institutional review board.
Reference Standard Delirium Diagnosis
The reference standard delirium diagnosis was based on an extensive (45 minutes) face‐to‐face patient interview by experienced clinician assessors (neuropsychologists or advanced practice nurses), medical record review, and input from the nurse and family members. This comprehensive assessment included: (1) reason for hospital admission, hospital course, and presence of cognitive concerns, (2) family, social, and functional history, (3) Montreal Cognitive Assessment,[18] (4) Geriatric Depression Scale,[19] (5) medical record review including scoring of comorbidities using the Charlson index,[20] determination of functional status using the basic and Instrumental Activities of Daily Living,[21, 22] psychoactive medications administered, and (6) a family member interview to assess the patient's baseline cognitive status that included the Eight‐Item Interview to Differentiate Aging and Dementia,[23] to assess the presence of dementia. Using all of these data, an expert panel, including the clinical assessor, the study principal investigator (E.R.M.), a geriatrician, and an experienced neuropsychologist, adjudicated the final delirium diagnoses using Diagnostic and Statistical Manual of Mental Disorders, 4th Edition (DSM‐IV) criteria. The panel also adjudicated for the presence or absence of dementia and mild cognitive impairment based on National Institute on Aging‐Alzheimer's Association (NIA‐AA) criteria.[24] This approach has been used in other delirium studies.[25]
3D‐CAM Assessments
After the reference standard assessment, the 3D‐CAM was administered by trained research assistants (RAs) who were blinded to the results of the reference standard. To reduce the likelihood of fluctuations or temporal changes, all assessments were completed between 11:00 am and 2:00 pm and for each participant, within a 2‐hour time period (for example, 11:23 am to 1:23 pm).
Statistical Analyses to Determine the Best Single‐ and Two‐Item Screeners
To determine the best single 3D‐CAM item to identify delirium, the responses of the 20 individual items in the 3D‐CAM (see Supporting Table 1 in the online version of this article) were compared to the reference standard to determine their sensitivity and specificity. Similarly, an algorithm was used to generate all unique 2‐item combinations of the 20 items (190 unique pairs), which were compared to the reference. An error, no response, or an answer of I do not know by the patient was considered a positive screen for delirium. The 2‐item screeners were considered positive if 1 or both of the items were positive. Sensitivity and specificity were calculated along with 95% confidence intervals (CIs).
Subset analyses were performed to determine sensitivity and specificity of individual items and pairs of items stratified by the patient's baseline cognitive status. Two strata were createdpatients with dementia (N=56), and patients with normal baseline cognitive status or mild cognitive impairment (MCI) (N=145). We chose to group MCI with normal for 2 reasons: (1) dementia is a well‐established and strong risk factor for delirium, whereas the evidence for MCI being a risk factor for delirium is less established and (2) to achieve adequate allocation of delirious cases in both strata. Last, we report the sensitivity of altered level of consciousness (LOC), which included lethargy, stupor, coma, and hypervigilance as a single screening item for delirium in the overall sample and by cognitive status. Analyses were conducted using commercially available software (SAS version 9.3; SAS Institute, Inc., Cary, NC).
RESULTS
Characteristics of the patients are shown in Table 1. Subjects had a mean age of 84 years, 62% were female, and 28% had a baseline dementia. Forty‐two (21%) had delirium based on the clinical reference standard. Twenty (10%) had less than a high school education and 100 (49%) had at least a college education.
| Characteristic | N (%) |
|---|---|
| |
| Age, y, mean (SD) | 84 (5.4) |
| Sex, n (%) female | 125 (62) |
| White, n (%) | 177 (88) |
| Education, n (%) | |
| Less than high school | 20 (10) |
| High school graduate | 75 (38) |
| College plus | 100 (49) |
| Vision interfered with interview, n (%) | 5 (2) |
| Hearing interfered with interview, n (%) | 18 (9) |
| English second language n (%) | 10 (5) |
| Charlson, mean (SD) | 3 (2.3) |
| ADL, n (% impaired) | 110 (55) |
| IADL, n (% impaired) | 163 (81) |
| MCI, n (%) | 50 (25) |
| Dementia, n (%) | 56 (28) |
| Delirium, n (%) | 42 (21) |
| MoCA, mean (SD) | 19 (6.6) |
| MoCA, median (range) | 20 (030) |
Single Item Screens
Table 2 reports the results of single‐item screens for delirium with sensitivity, the ability to correctly identify delirium when it is present by the reference standard, and specificity, the ability to correctly identify patients without delirium when it is not present by reference standard and 95% CIs. Items are listed in descending order of sensitivity; in the case of ties, the item with the higher specificity is listed first. The screening items with the highest sensitivity for delirium are Months of the year backwards, and Four digits backwards, both with a sensitivity of 83% (95% CI: 69%‐93%). Of these 2 items, Months of the year backwards had a much better specificity of 69% (95% CI: 61%‐76%), whereas Four digits backwards had a specificity of 52% (95% CI: 44%‐60%). The item What is the day of the week? had lower sensitivity at 71% (95% CI: 55%‐84%), but excellent specificity at 92% (95% CI: 87%‐96%).
| Screen Item | Screen Positive (%)c | Sensitivity (95% CI) | Specificity (95% CI) | LR | LR |
|---|---|---|---|---|---|
| |||||
| Months of the year backwards | 42 | 0.83 (0.69‐0.93) | 0.69 (0.61‐0.76) | 2.7 | 0.24 |
| Four digits backwards | 56 | 0.83 (0.69‐0.93) | 0.52 (0.44‐0.60) | 1.72 | 0.32 |
| What is the day of the week? | 21 | 0.71 (0.55‐0.84) | 0.92 (0.87‐0.96) | 9.46 | 0.31 |
| What is the year? | 16 | 0.55 (0.39‐0.70) | 0.94 (0.9‐0.97) | 9.67 | 0.48 |
| Have you felt confused during the past day? | 14 | 0.50 (0.34‐0.66) | 0.95 (0.9‐0.98) | 9.94 | 0.53 |
| Days of the week backwards | 15 | 0.50 (0.34‐0.66) | 0.94 (0.89‐0.97) | 7.95 | 0.53 |
| During the past day, did you see things that were not really there? | 11 | 0.45 (0.3‐0.61) | 0.97 (0.94‐0.99) | 17.98 | 0.56 |
| Three digits backwards | 15 | 0.45 (0.3‐0.61) | 0.92 (0.87‐0.96) | 5.99 | 0.59 |
| What type of place is this? | 9 | 0.38 (0.24‐0.54) | 0.99 (0.96‐1) | 30.29 | 0.63 |
| During the past day, did you think you were not in the hospital? | 10 | 0.38 (0.24‐0.54) | 0.97 (0.94‐0.99) | 15.14 | 0.64 |
We then examined performance of single‐item screeners in patients with and without dementia (Table 3). In persons with dementia, the best single item was also Months of the year backwards, with a sensitivity of 89% (95% CI: 72%‐98%) and a specificity of 61% (95% CI: 41%‐78%). In persons with normal baseline cognition or MCI, the best performing single item was Four digits backwards, with sensitivity of 79% (95% CI: 49%‐95%) and specificity of 51% (95% CI: 42%‐60%). Months of the year backwards also performed well, with sensitivity of 71% (95% CI: 42%‐92%) and specificity of 71% (95% CI: 62%‐79%).
| Test Item | Normal/MCI Patients (n=145) | Dementia Patients (n=56) | ||||||||
|---|---|---|---|---|---|---|---|---|---|---|
| Screen Positive (%)b | Sensitivity (95% CI) | Specificity (95% CI) | LR | LR | Screen Positive (%)b | Sensitivity (95% CI) | Specificity (95% CI) | LR | LR | |
| ||||||||||
| Months backwards | 33 | 0.71 (0.42‐0.92) | 0.71 (0.62‐0.79) | 2.46 | 0.4 | 64 | 0.89 (0.72‐0.98) | 0.61 (0.41‐0.78) | 2.27 | 0.18 |
| Four digits backwards | 52 | 0.79 (0.49‐0.95) | 0.51 (0.42‐0.60) | 1.61 | 0.42 | 66 | 0.86 (0.67‐0.96) | 0.54 (0.34‐0.72) | 1.85 | 0.27 |
| What is the day of the week? | 10 | 0.64 (0.35‐0.87) | 0.96 (0.91‐0.99) | 16.84 | 0.37 | 50 | 0.75 (0.55‐0.89) | 0.75 (0.55‐0.89) | 3 | 0.33 |
Two‐Item Screens
Table 4 reports the results of 2‐item screens for delirium with sensitivity, specificity, and 95% CIs. Item pairs are listed in descending order of sensitivity following the same convention as in Table 2. The 2‐item screen with the highest sensitivity for delirium is the combination of What is the day of the week? and Months of the year backwards, with a sensitivity of 93% (95% CI: 81%‐99%) and specificity of 64% (95% CI: 56%‐70%). This screen had a positive and negative likelihood ratio (LR) of 2.59 and 0.11, respectively. The combination of What is the day of the week? and Four digits backwards had the same sensitivity 93% (95% CI: 81%‐99%), but lower specificity of 48% (95% CI: 40%‐56%). The combination of What type of place is this? (hospital) and Four digits backwards had a sensitivity of 90% (95% CI: 77%‐97%) and specificity of 51% (95% CI: 43%‐50%).
| Screen Item 1 | Screen Item 2 | Screen Positive (%)c | Sensitivity (95% CI) | Specificity (95% CI) | LR | LR |
|---|---|---|---|---|---|---|
| ||||||
| What is the day of the week? | Months backwards | 48 | 0.93 (0.81‐0.99) | 0.64 (0.56‐0.70) | 2.59 | 0.11 |
| What is the day of the week? | Four digits backwards | 60 | 0.93 (0.81‐0.99) | 0.48 (0.4‐0.56) | 1.8 | 0.15 |
| Four digits backwards | Months backwards | 65 | 0.93 (0.81‐0.99) | 0.42 (0.34‐0.50) | 1.6 | 0.17 |
| What type of place is this? | Four digits backwards | 58 | 0.90 (0.77‐0.97) | 0.51 (0.43‐0.50) | 1.84 | 0.19 |
| What is the year? | Four digits backwards | 59 | 0.9 (0.77‐0.97) | 0.5 (0.42‐0.5) | 1.80 | 0.19 |
| What is the day of the week? | Three digits backwards | 30 | 0.88 (0.74‐0.96) | 0.86 (0.79‐0.90) | 6.09 | 0.14 |
| What is the year? | Months backwards | 44 | 0.88 (0.74‐0.96) | 0.68 (0.6‐0.75) | 2.75 | 0.18 |
| What type of place is this? | Months backwards | 43 | 0.86 (0.71‐0.95) | 0.69 (0.61‐0.70) | 2.73 | 0.21 |
| During the past day, did you think you were not in the hospital? | Months backwards | 43 | 0.86 (0.71‐0.95) | 0.69 (0.61‐0.70) | 2.73 | 0.21 |
| Days of the week backwards | Months backwards | 43 | 0.86 (0.71‐0.95) | 0.68 (0.6‐0.75) | 2.67 | 0.21 |
When subjects were stratified by baseline cognition, the best 2‐item screens for normal and MCI patients was What is the day of the week? and Four digits backwards, with 93% sensitivity (95% CI: 66%‐100%) and 50% specificity (95% CI: 42%‐59%). The best pair of items for patients with dementia (Table 5) was the same as the overall sample, What is the day of the week? and Months of the year backwards, but its performance differed with a higher sensitivity of 96% (95% CI: 82%‐100%) and lower specificity of 43% (95% CI: 24%‐63%). This same pair of items had 86% sensitivity (95% CI: 57%‐98%) and 69% (95% CI: 60%‐77%) specificity for persons with either normal cognition or MCI.
| Test Item 1 | Test Item 2 | Normal/MCI Patients (n=145) | Dementia Patients (n=56) | ||||||||
|---|---|---|---|---|---|---|---|---|---|---|---|
| Item Positive (%)b | Sensitivity (95% CI) | Specificity (95% CI) | LR | LR | Item Positive (%)b | Sensitivity (95% CI) | Specificity (95% CI) | LR | LR | ||
| |||||||||||
| What is the day of the week? | Months backwards | 36 | 0.86 (0.57‐0.98) | 0.69 (0.60‐0.77) | 2.74 | 0.21 | 77 | 0.96 (0.82‐1) | 0.43 (0.24‐0.63) | 1.69 | 0.08 |
| What is the day of the week? | Four digits backwards | 54 | 0.93 (0.66‐1) | 0.5 (0.42‐0.59) | 1.87 | 0.14 | 77 | 0.93 (0.76‐0.99) | 0.39 (0.22‐0.59) | 1.53 | 0.18 |
| Four digits backwards | Months backwards | 61 | 0.93 (0.66‐1) | 0.43 (0.34‐0.52) | 1.62 | 0.17 | 77 | 0.93 (0.76‐0.99) | 0.39 (0.22‐0.59) | 1.53 | 0.18 |
Altered Level of Consciousness as a Screener for Delirium
Altered level of consciousness (ALOC) was uncommon in our sample, with an overall prevalence of 10/201 (4.9%). When examined as a screening item for delirium, ALOC had very poor sensitivity of 19% (95% CI: 9%‐34%) but had excellent specificity 99% (95% CI: 96%‐100%). Altered LOC also demonstrated poor screening performance when stratified by cognitive status, with a sensitivity of 14% in the normal and MCI group (95% CI: 2%‐43%) and sensitivity of 21% (95% CI: 8%‐41%) in persons with dementia.
Positive and Negative Predictive Values
Although we focused on sensitivity and specificity in evaluating 1‐ and 2‐item screeners, we also examined positive and negative predictive values. These values will vary depending on the overall prevalence of delirium, which was 21% in this dataset. The best 1‐item screener, Months of the year backwards, had a positive predictive value of 31% and negative predictive value of 94%. The best 2‐item screener, Months of the year backwards with What is the day of the week?, had a positive predictive value of 41% and negative predictive value of 97% (see Supporting Tables 2 and 3 in the online version of this article) LRs for the items are in Tables 2 through 5.
DISCUSSION
Identifying simple, efficient, bedside case‐identification methods for delirium is an essential step toward improving recognition of this highly morbid syndrome in hospitalized older adults. In this study, we identified a single cognitive item, Months of the year backwards, that identified 83% of delirium cases when compared with a reference standard diagnosis. Furthermore, we identified 2 items, Months of the year backwards and What is the day of the week? which when used in combination identified 93% of delirium cases. The same 1 and 2 items also worked well in patients with dementia, in whom delirium is often missed. Although these items require further clinical validation, the development of an ultrabrief 2‐item test that identifies over 90% of delirium cases and can be completed in less than 1 minute (recently, we administered the best 2‐item screener to 20 consecutive general medicine patients over age 70 years, and it was completed in a median of 36.5 seconds), holds great potential for simplifying bedside delirium screening and improving the care of hospitalized older adults.
Our current findings both confirm and extend the emerging literature on best screening items for delirium. Sands and colleagues (2010)[26] tested a single test for delirium, Do you think (name of patient) has been more confused lately? in 21 subjects and achieved a sensitivity of 80%. Han and colleagues developed a screening tool in emergency‐department patients using the LOC question from the Richmond Agitation‐Sedation Scale and spelling the word lunch backwards, and achieved 98% sensitivity, but in a younger emergency department population with a low prevalence of dementia.[27] O'Regan et al. recently also found Months of the year backwards to be the best single‐screening item for delirium in a large sample, but only tested a 1‐item screen.[28] Our study extends these studies in several important ways by: (1) employing a rigorous clinical reference standard diagnosis of delirium, (2) having a large sample with a high prevalence of patients with dementia, (3) use of a general medical population, and (4) examining the best 2‐item screens in addition to the best single item.
Systematic intervention programs[29, 30, 31] that focus on improved delirium evaluation and management have the potential to improve patient outcomes and reduce costs. However, targeting these programs to patients with delirium has proven difficult, as only 12% to 35% of delirium cases are recognized in routine clinical practice.[11, 12, 13, 14, 15] The 1‐ and 2‐item screeners we identified could play an important role in future delirium identification. The 3D‐CAM combines high sensitivity (95%) with high specificity (94%)[16] and therefore would be an excellent choice as the second step after a positive screen. The feasibility, effectiveness, and cost of administering these screeners, followed by a brief diagnostic tool such as the 3D‐CAM, should be evaluated in future work.
Our study has noteworthy strengths, including the use of a large purposefully challenging clinical sample with advanced age that included a substantial proportion with dementia, a detailed assessment, and the testing of very brief and practical tools for bedside delirium screening.[25] This study also has several important limitations. Most importantly, we presented secondary analysis of individual items and pairs of items drawn from the 3D CAM assessment; therefore, the 2‐item bedside screen requires prospective clinical validation. The reference standard was based on the DSM‐IV, because this study was conducted prior to the release of DSM‐V. In addition, the ordering of the reference standard and 3D‐CAM assessments was not randomized due to feasibility constraints. In addition, this study was cross‐sectional, involved only a single hospital, and enrolled only older medical patients during the day shift. Our sample was older (aged 75 years and older), and a younger sample may have had a different prevalence of delirium, which could affect the positive predictive value of our ultrabrief screen. We plan to test this in a sample of patients aged 70 years and older in future studies. Finally, it should be noted that these best 1‐item and 2‐item screeners miss 17% and 7% of delirium cases, respectively. In cases where this is unacceptably high, alternative approaches might be necessary.
It is important to remember that these 1‐ and 2‐item screeners are not diagnostic tools and therefore should not be used in isolation. Optimally, they will be followed by a more specific evaluation, such as the 3D‐CAM, as part of a systematic delirium identification process. For instance, in our sample (with a delirium rate of 21%), the best 2‐item screener had a positive predictive value of 41%, meaning that positive screens are more likely to be false positives than true positives (see Supporting Tables 2 and 3 in the online version of this article).[32] Nevertheless, by reducing the total number of patients who require diagnostic instrument administration, use of these ultrabrief screeners can improve efficiency and result in a net benefit to delirium case‐identification efforts.[32]
Time has been demonstrated to be a barrier to delirium identification in previous studies, but there are likely others. These may include, for instance, staff nihilism about screening making a difference, ambiguous responsibility for delirium screening and management, unsupportive system leadership, and absent payment for these activities.[31] Moreover, it is possible that the 2‐step process we propose may create an incentive for staff to avoid positive screens as they see it creating more work for themselves. We plan to identify and address such barriers in our future work.
In conclusion, we identified a single screening item for delirium, Months of the year backwards, with 83% sensitivity, and a pair of items, Months of the year backwards and What is the day of the week?, with 93% sensitivity relative to a rigorous reference standard diagnosis. These ultrabrief screening items work well in patients with and without dementia, and should require very little training of staff. Future studies should further validate these tools, and determine their translatability and scalability into programs for systematic, widespread delirium detection. Developing efficient and accurate case identification strategies is a necessary prerequisite to appropriately target delirium management protocols, enabling healthcare systems to effectively address this costly and deadly condition.
Disclosures
Author contributionsD.M.F. conceived the study idea, participated in its design and coordination, and drafted the initial manuscript. S.K.I. contributed to the study design and conceptualization, supervision, funding, preliminary analysis, and interpretation of the data, and critical revision of the manuscript. J.G. conducted the analysis for the study and critically revised the manuscript. L.N. supervised the analysis for the study and critically revised the manuscript. R.J. contributed to the study design and critical revision of the manuscript. J.S.S. critically revised the manuscript. E.R.M. obtained funding for the study, supervised all data collection, assisted in drafting and critically revising the manuscript, and contributed to the conceptualization, design, and supervision of the study. All authors have seen and agree with the contents of the manuscript.
This work was supported by the National Institute of Aging grant number R01AG030618 and K24AG035075 to Dr. Marcantonio. Dr. Inouye's time was supported in part by grants P01AG031720, R01AG044518, and K07AG041835 from the National Institute on Aging. Dr. Inouye holds the Milton and Shirley F. Levy Family Chair (Hebrew Senior Life/Harvard Medical School). Dr. Fick is partially supported from National Institute of Nursing Research grant number R01 NR011042. Dr. Saczynski was supported in part by funding from the National Institute on Aging (K01AG33643) and from the National Heart Lung and Blood Institute (U01HL105268). The funding agencies had no role and the authors retained full autonomy in the preparation of this article. All authors and coauthors have no financial or nonfinancial conflicts of interest to disclose regarding this article.
This article was presented at the Presidential Poster Session at the American Geriatrics Society 2014 Annual Meeting in Orlando, Florida, May 14, 2014.
- , , , , , Delirium in elderly patients and the risk of postdischarge mortality, institutionalization, and dementia: a meta‐analysis. JAMA. 2010;304(4):443–451.
- , , , et al. Cognitive trajectories after postoperative delirium. N Engl J Med. 2012;367(1):30–39.
- , , Delirium in elderly people. Lancet. 2014;383:911–922.
- , , , Delirium superimposed on dementia is associated with prolonged length of stay and poor outcomes in hospitalized older adults. J Hosp Med. 2013;8(9):500–505.
- , , , , One‐year health care costs associated with delirium in the elderly population. Arch Intern Med. 2008;168(1):27–32.
- , The importance of delirium: Economic and societal costs. J Am Geriatr Soc. 2011;59(suppl 2):S241–S243.
- Delirium. Ann Intern Med. 2011;154(11):ITC6.
- , , , , , Fostering implementation of health services research findings into practice: a consolidated framework for advancing implementation science. Implement Sci. 2009;4:50.
- , , , Mixed‐methods approach to understanding nurses' clinical reasoning in recognizing delirium in hospitalized older adults. J Contin Educ Nurs. 2014;45:1–13.
- , , Educational interventions to improve recognition of delirium: a systematic review. J Am Geriatr Soc. 2013;61(11):1983–1993.
- , Delirium superimposed on dementia: accuracy of nurse documentation. J Gerontol Nurs. 2012;38(1):32–42.
- , , , et al. Detection of delirium by bedside nurses using the confusion assessment method. J Am Geriatr Soc. 2006;54:685–689.
- , , , et al. Documentation of delirium in elderly patients with hip fracture. J Gerontol Nurs. 2002;28(11):23–29.
- , , , Recorded delirium in a national sample of elderly inpatients: potential implications for recognition. J Geriatr Psychiatry Neurol. 2003;16(1):32–38.
- , , , et al. A tale of two methods: chart and interview methods for identifying delirium. J Am Geriatr Soc. 2014;62(3):518–524.
- , , , et al. 3D‐CAM: Derivation and validation of a 3‐minute diagnostic interview for CAM‐defined delirium: a cross‐sectional diagnostic test study. Ann Intern Med. 2014;161(8):554–561.
- , , , et al. Selecting optimal screening items for delirium: an application of item response theory. BMC Med Res Methodol. 2013;13:8.
- , , , et al. The Montreal Cognitive Assessment, MoCA: a brief screening tool for mild cognitive impairment. J Am Geriatr Soc. 2005;53(4):695–699.
- Geriatric Depression Scale. Psychopharmacol Bull. 1988;24(4):709–711.
- , , , A new method of classifying prognostic comorbidity in longitudinal studies: development and validation. J Chronic Dis. 1987;40(5):373–383.
- , , , , Studies of illness in the aged: the index of ADL: a standardized measure of biological and psychosocial function. JAMA. 1963;185:914–919.
- , Assessment of older people: self‐maintaining and instrumental activities of daily living. Gerontologist. 1969;9(3):179–186.
- , , , et al. The AD8: a brief informant interview to detect dementia. Neurology. 2005;65(4):559–564.
- , , , et al. The diagnosis of dementia due to Alzheimer's disease: recommendations from the National Institute on Aging‐Alzheimer's Association workgroups on diagnostic guidelines for Alzheimer's disease. Alzheimers Dement. 2011;7(3):263–269.
- , , , et al. Delirium diagnosis methodology used in research: a survey‐based study. Am J Geriatr Psychiatry. 2014;22(12):1513–1521.
- , , , , Single Question in Delirium (SQiD): testing its efficacy against psychiatrist interview, the Confusion Assessment Method and the Memorial Delirium Assessment Scale. Palliat Med. 2010;24(6):561–565.
- , , , et al. Diagnosing delirium in older emergency department patients: validity and reliability of the delirium triage screen and the brief confusion assessment method. Ann Emerg Med. 2013;62(5):457–465.
- , , , et al. Attention! A good bedside test for delirium? J Neurol Neurosurg Psychiatry. 2014;85(10):1122–1131.
- , , , , A model for management of delirious postacute care patients. J Am Geriatr Soc. 2005;53(10):1817–1825.
- , , , Computerized decision support for delirium superimposed on dementia in older adults: a pilot study. J Gerontol Nurs. 2011;37(4):39–47.
- , , , et al. Barriers and facilitators to implementing delirium rounds in a clinical trial across three diverse hospital settings. Clin Nurs Res. 2014;23(2):201–215.
- , Antecedent probability and the efficiency of psychometric signs, patterns, or cutting scores. Psychol Bull. 1955;52(3):194.
Delirium (acute confusion) is common in older adults and leads to poor outcomes, such as death, clinician and caregiver burden, and prolonged cognitive and functional decline.[1, 2, 3, 4] Delirium is extremely costly, with estimates ranging from $143 to $152 billion annually (2005 US$).[5, 6] Early detection and management may improve the poor outcomes and reduce costs attributable to delirium,[3, 7] yet delirium identification in clinical practice has been challenging, particularly when translating research tools to the bedside.[8, 9, 10]As a result, only 12% to 35% of delirium cases are detected in routine care, with hypoactive delirium and delirium superimposed on dementia most likely to be missed.[11, 12, 13, 14, 15]
To address these issues, we recently developed and published the three‐dimensional Confusion Assessment Method (3D‐CAM), the 3‐minute diagnostic assessment for CAM‐defined delirium.[16] The 3D‐CAM is a structured assessment tool that includes mental status testing, patient symptom probes, and guided interviewer observations for signs of delirium. 3D‐CAM items were selected through a rigorous process to determine the most informative items for the 4 CAM diagnostic features.[17] The 3D‐CAM can be completed in 3 minutes, and has 95% sensitivity and 94% specificity relative to a reference standard.[16]
Despite the capabilities of the 3D‐CAM, there are situations when even 3 minutes is too long to devote to delirium identification. Moreover, a 2‐step approach in which a sensitive ultrabrief screen is administered, followed by the 3D‐CAM in positives, may be the most efficient approach for large‐scale delirium case identification. The aim of the current study was to use the 3D‐CAM database to identify the most sensitive single item and pair of items in the diagnosis of delirium, using the reference standard in the diagnostic accuracy analysis. We hypothesized that we could identify a single item with greater than 80% sensitivity and a pair of items with greater than 90% sensitivity for detection of delirium.
METHODS
Study Sample and Design
We analyzed data from the 3D‐CAM validation study,[16] which prospectively enrolled participants from a large urban teaching hospital in Boston, Massachusetts, using a consecutive enrollment sampling strategy. Inclusion criteria were: (1) 75 years old, (2) admitted to general or geriatric medicine services, (3) able to communicate in English, (4) without terminal conditions, (5) expected hospital stay of 2 days, (6) not a previous study participant. Experienced clinicians screened patients for eligibility. If the patient lacked capacity to provide consent, the designated surrogate decision maker was contacted. The study was approved by the institutional review board.
Reference Standard Delirium Diagnosis
The reference standard delirium diagnosis was based on an extensive (45 minutes) face‐to‐face patient interview by experienced clinician assessors (neuropsychologists or advanced practice nurses), medical record review, and input from the nurse and family members. This comprehensive assessment included: (1) reason for hospital admission, hospital course, and presence of cognitive concerns, (2) family, social, and functional history, (3) Montreal Cognitive Assessment,[18] (4) Geriatric Depression Scale,[19] (5) medical record review including scoring of comorbidities using the Charlson index,[20] determination of functional status using the basic and Instrumental Activities of Daily Living,[21, 22] psychoactive medications administered, and (6) a family member interview to assess the patient's baseline cognitive status that included the Eight‐Item Interview to Differentiate Aging and Dementia,[23] to assess the presence of dementia. Using all of these data, an expert panel, including the clinical assessor, the study principal investigator (E.R.M.), a geriatrician, and an experienced neuropsychologist, adjudicated the final delirium diagnoses using Diagnostic and Statistical Manual of Mental Disorders, 4th Edition (DSM‐IV) criteria. The panel also adjudicated for the presence or absence of dementia and mild cognitive impairment based on National Institute on Aging‐Alzheimer's Association (NIA‐AA) criteria.[24] This approach has been used in other delirium studies.[25]
3D‐CAM Assessments
After the reference standard assessment, the 3D‐CAM was administered by trained research assistants (RAs) who were blinded to the results of the reference standard. To reduce the likelihood of fluctuations or temporal changes, all assessments were completed between 11:00 am and 2:00 pm and for each participant, within a 2‐hour time period (for example, 11:23 am to 1:23 pm).
Statistical Analyses to Determine the Best Single‐ and Two‐Item Screeners
To determine the best single 3D‐CAM item to identify delirium, the responses of the 20 individual items in the 3D‐CAM (see Supporting Table 1 in the online version of this article) were compared to the reference standard to determine their sensitivity and specificity. Similarly, an algorithm was used to generate all unique 2‐item combinations of the 20 items (190 unique pairs), which were compared to the reference. An error, no response, or an answer of I do not know by the patient was considered a positive screen for delirium. The 2‐item screeners were considered positive if 1 or both of the items were positive. Sensitivity and specificity were calculated along with 95% confidence intervals (CIs).
Subset analyses were performed to determine sensitivity and specificity of individual items and pairs of items stratified by the patient's baseline cognitive status. Two strata were createdpatients with dementia (N=56), and patients with normal baseline cognitive status or mild cognitive impairment (MCI) (N=145). We chose to group MCI with normal for 2 reasons: (1) dementia is a well‐established and strong risk factor for delirium, whereas the evidence for MCI being a risk factor for delirium is less established and (2) to achieve adequate allocation of delirious cases in both strata. Last, we report the sensitivity of altered level of consciousness (LOC), which included lethargy, stupor, coma, and hypervigilance as a single screening item for delirium in the overall sample and by cognitive status. Analyses were conducted using commercially available software (SAS version 9.3; SAS Institute, Inc., Cary, NC).
RESULTS
Characteristics of the patients are shown in Table 1. Subjects had a mean age of 84 years, 62% were female, and 28% had a baseline dementia. Forty‐two (21%) had delirium based on the clinical reference standard. Twenty (10%) had less than a high school education and 100 (49%) had at least a college education.
| Characteristic | N (%) |
|---|---|
| |
| Age, y, mean (SD) | 84 (5.4) |
| Sex, n (%) female | 125 (62) |
| White, n (%) | 177 (88) |
| Education, n (%) | |
| Less than high school | 20 (10) |
| High school graduate | 75 (38) |
| College plus | 100 (49) |
| Vision interfered with interview, n (%) | 5 (2) |
| Hearing interfered with interview, n (%) | 18 (9) |
| English second language n (%) | 10 (5) |
| Charlson, mean (SD) | 3 (2.3) |
| ADL, n (% impaired) | 110 (55) |
| IADL, n (% impaired) | 163 (81) |
| MCI, n (%) | 50 (25) |
| Dementia, n (%) | 56 (28) |
| Delirium, n (%) | 42 (21) |
| MoCA, mean (SD) | 19 (6.6) |
| MoCA, median (range) | 20 (030) |
Single Item Screens
Table 2 reports the results of single‐item screens for delirium with sensitivity, the ability to correctly identify delirium when it is present by the reference standard, and specificity, the ability to correctly identify patients without delirium when it is not present by reference standard and 95% CIs. Items are listed in descending order of sensitivity; in the case of ties, the item with the higher specificity is listed first. The screening items with the highest sensitivity for delirium are Months of the year backwards, and Four digits backwards, both with a sensitivity of 83% (95% CI: 69%‐93%). Of these 2 items, Months of the year backwards had a much better specificity of 69% (95% CI: 61%‐76%), whereas Four digits backwards had a specificity of 52% (95% CI: 44%‐60%). The item What is the day of the week? had lower sensitivity at 71% (95% CI: 55%‐84%), but excellent specificity at 92% (95% CI: 87%‐96%).
| Screen Item | Screen Positive (%)c | Sensitivity (95% CI) | Specificity (95% CI) | LR | LR |
|---|---|---|---|---|---|
| |||||
| Months of the year backwards | 42 | 0.83 (0.69‐0.93) | 0.69 (0.61‐0.76) | 2.7 | 0.24 |
| Four digits backwards | 56 | 0.83 (0.69‐0.93) | 0.52 (0.44‐0.60) | 1.72 | 0.32 |
| What is the day of the week? | 21 | 0.71 (0.55‐0.84) | 0.92 (0.87‐0.96) | 9.46 | 0.31 |
| What is the year? | 16 | 0.55 (0.39‐0.70) | 0.94 (0.9‐0.97) | 9.67 | 0.48 |
| Have you felt confused during the past day? | 14 | 0.50 (0.34‐0.66) | 0.95 (0.9‐0.98) | 9.94 | 0.53 |
| Days of the week backwards | 15 | 0.50 (0.34‐0.66) | 0.94 (0.89‐0.97) | 7.95 | 0.53 |
| During the past day, did you see things that were not really there? | 11 | 0.45 (0.3‐0.61) | 0.97 (0.94‐0.99) | 17.98 | 0.56 |
| Three digits backwards | 15 | 0.45 (0.3‐0.61) | 0.92 (0.87‐0.96) | 5.99 | 0.59 |
| What type of place is this? | 9 | 0.38 (0.24‐0.54) | 0.99 (0.96‐1) | 30.29 | 0.63 |
| During the past day, did you think you were not in the hospital? | 10 | 0.38 (0.24‐0.54) | 0.97 (0.94‐0.99) | 15.14 | 0.64 |
We then examined performance of single‐item screeners in patients with and without dementia (Table 3). In persons with dementia, the best single item was also Months of the year backwards, with a sensitivity of 89% (95% CI: 72%‐98%) and a specificity of 61% (95% CI: 41%‐78%). In persons with normal baseline cognition or MCI, the best performing single item was Four digits backwards, with sensitivity of 79% (95% CI: 49%‐95%) and specificity of 51% (95% CI: 42%‐60%). Months of the year backwards also performed well, with sensitivity of 71% (95% CI: 42%‐92%) and specificity of 71% (95% CI: 62%‐79%).
| Test Item | Normal/MCI Patients (n=145) | Dementia Patients (n=56) | ||||||||
|---|---|---|---|---|---|---|---|---|---|---|
| Screen Positive (%)b | Sensitivity (95% CI) | Specificity (95% CI) | LR | LR | Screen Positive (%)b | Sensitivity (95% CI) | Specificity (95% CI) | LR | LR | |
| ||||||||||
| Months backwards | 33 | 0.71 (0.42‐0.92) | 0.71 (0.62‐0.79) | 2.46 | 0.4 | 64 | 0.89 (0.72‐0.98) | 0.61 (0.41‐0.78) | 2.27 | 0.18 |
| Four digits backwards | 52 | 0.79 (0.49‐0.95) | 0.51 (0.42‐0.60) | 1.61 | 0.42 | 66 | 0.86 (0.67‐0.96) | 0.54 (0.34‐0.72) | 1.85 | 0.27 |
| What is the day of the week? | 10 | 0.64 (0.35‐0.87) | 0.96 (0.91‐0.99) | 16.84 | 0.37 | 50 | 0.75 (0.55‐0.89) | 0.75 (0.55‐0.89) | 3 | 0.33 |
Two‐Item Screens
Table 4 reports the results of 2‐item screens for delirium with sensitivity, specificity, and 95% CIs. Item pairs are listed in descending order of sensitivity following the same convention as in Table 2. The 2‐item screen with the highest sensitivity for delirium is the combination of What is the day of the week? and Months of the year backwards, with a sensitivity of 93% (95% CI: 81%‐99%) and specificity of 64% (95% CI: 56%‐70%). This screen had a positive and negative likelihood ratio (LR) of 2.59 and 0.11, respectively. The combination of What is the day of the week? and Four digits backwards had the same sensitivity 93% (95% CI: 81%‐99%), but lower specificity of 48% (95% CI: 40%‐56%). The combination of What type of place is this? (hospital) and Four digits backwards had a sensitivity of 90% (95% CI: 77%‐97%) and specificity of 51% (95% CI: 43%‐50%).
| Screen Item 1 | Screen Item 2 | Screen Positive (%)c | Sensitivity (95% CI) | Specificity (95% CI) | LR | LR |
|---|---|---|---|---|---|---|
| ||||||
| What is the day of the week? | Months backwards | 48 | 0.93 (0.81‐0.99) | 0.64 (0.56‐0.70) | 2.59 | 0.11 |
| What is the day of the week? | Four digits backwards | 60 | 0.93 (0.81‐0.99) | 0.48 (0.4‐0.56) | 1.8 | 0.15 |
| Four digits backwards | Months backwards | 65 | 0.93 (0.81‐0.99) | 0.42 (0.34‐0.50) | 1.6 | 0.17 |
| What type of place is this? | Four digits backwards | 58 | 0.90 (0.77‐0.97) | 0.51 (0.43‐0.50) | 1.84 | 0.19 |
| What is the year? | Four digits backwards | 59 | 0.9 (0.77‐0.97) | 0.5 (0.42‐0.5) | 1.80 | 0.19 |
| What is the day of the week? | Three digits backwards | 30 | 0.88 (0.74‐0.96) | 0.86 (0.79‐0.90) | 6.09 | 0.14 |
| What is the year? | Months backwards | 44 | 0.88 (0.74‐0.96) | 0.68 (0.6‐0.75) | 2.75 | 0.18 |
| What type of place is this? | Months backwards | 43 | 0.86 (0.71‐0.95) | 0.69 (0.61‐0.70) | 2.73 | 0.21 |
| During the past day, did you think you were not in the hospital? | Months backwards | 43 | 0.86 (0.71‐0.95) | 0.69 (0.61‐0.70) | 2.73 | 0.21 |
| Days of the week backwards | Months backwards | 43 | 0.86 (0.71‐0.95) | 0.68 (0.6‐0.75) | 2.67 | 0.21 |
When subjects were stratified by baseline cognition, the best 2‐item screens for normal and MCI patients was What is the day of the week? and Four digits backwards, with 93% sensitivity (95% CI: 66%‐100%) and 50% specificity (95% CI: 42%‐59%). The best pair of items for patients with dementia (Table 5) was the same as the overall sample, What is the day of the week? and Months of the year backwards, but its performance differed with a higher sensitivity of 96% (95% CI: 82%‐100%) and lower specificity of 43% (95% CI: 24%‐63%). This same pair of items had 86% sensitivity (95% CI: 57%‐98%) and 69% (95% CI: 60%‐77%) specificity for persons with either normal cognition or MCI.
| Test Item 1 | Test Item 2 | Normal/MCI Patients (n=145) | Dementia Patients (n=56) | ||||||||
|---|---|---|---|---|---|---|---|---|---|---|---|
| Item Positive (%)b | Sensitivity (95% CI) | Specificity (95% CI) | LR | LR | Item Positive (%)b | Sensitivity (95% CI) | Specificity (95% CI) | LR | LR | ||
| |||||||||||
| What is the day of the week? | Months backwards | 36 | 0.86 (0.57‐0.98) | 0.69 (0.60‐0.77) | 2.74 | 0.21 | 77 | 0.96 (0.82‐1) | 0.43 (0.24‐0.63) | 1.69 | 0.08 |
| What is the day of the week? | Four digits backwards | 54 | 0.93 (0.66‐1) | 0.5 (0.42‐0.59) | 1.87 | 0.14 | 77 | 0.93 (0.76‐0.99) | 0.39 (0.22‐0.59) | 1.53 | 0.18 |
| Four digits backwards | Months backwards | 61 | 0.93 (0.66‐1) | 0.43 (0.34‐0.52) | 1.62 | 0.17 | 77 | 0.93 (0.76‐0.99) | 0.39 (0.22‐0.59) | 1.53 | 0.18 |
Altered Level of Consciousness as a Screener for Delirium
Altered level of consciousness (ALOC) was uncommon in our sample, with an overall prevalence of 10/201 (4.9%). When examined as a screening item for delirium, ALOC had very poor sensitivity of 19% (95% CI: 9%‐34%) but had excellent specificity 99% (95% CI: 96%‐100%). Altered LOC also demonstrated poor screening performance when stratified by cognitive status, with a sensitivity of 14% in the normal and MCI group (95% CI: 2%‐43%) and sensitivity of 21% (95% CI: 8%‐41%) in persons with dementia.
Positive and Negative Predictive Values
Although we focused on sensitivity and specificity in evaluating 1‐ and 2‐item screeners, we also examined positive and negative predictive values. These values will vary depending on the overall prevalence of delirium, which was 21% in this dataset. The best 1‐item screener, Months of the year backwards, had a positive predictive value of 31% and negative predictive value of 94%. The best 2‐item screener, Months of the year backwards with What is the day of the week?, had a positive predictive value of 41% and negative predictive value of 97% (see Supporting Tables 2 and 3 in the online version of this article) LRs for the items are in Tables 2 through 5.
DISCUSSION
Identifying simple, efficient, bedside case‐identification methods for delirium is an essential step toward improving recognition of this highly morbid syndrome in hospitalized older adults. In this study, we identified a single cognitive item, Months of the year backwards, that identified 83% of delirium cases when compared with a reference standard diagnosis. Furthermore, we identified 2 items, Months of the year backwards and What is the day of the week? which when used in combination identified 93% of delirium cases. The same 1 and 2 items also worked well in patients with dementia, in whom delirium is often missed. Although these items require further clinical validation, the development of an ultrabrief 2‐item test that identifies over 90% of delirium cases and can be completed in less than 1 minute (recently, we administered the best 2‐item screener to 20 consecutive general medicine patients over age 70 years, and it was completed in a median of 36.5 seconds), holds great potential for simplifying bedside delirium screening and improving the care of hospitalized older adults.
Our current findings both confirm and extend the emerging literature on best screening items for delirium. Sands and colleagues (2010)[26] tested a single test for delirium, Do you think (name of patient) has been more confused lately? in 21 subjects and achieved a sensitivity of 80%. Han and colleagues developed a screening tool in emergency‐department patients using the LOC question from the Richmond Agitation‐Sedation Scale and spelling the word lunch backwards, and achieved 98% sensitivity, but in a younger emergency department population with a low prevalence of dementia.[27] O'Regan et al. recently also found Months of the year backwards to be the best single‐screening item for delirium in a large sample, but only tested a 1‐item screen.[28] Our study extends these studies in several important ways by: (1) employing a rigorous clinical reference standard diagnosis of delirium, (2) having a large sample with a high prevalence of patients with dementia, (3) use of a general medical population, and (4) examining the best 2‐item screens in addition to the best single item.
Systematic intervention programs[29, 30, 31] that focus on improved delirium evaluation and management have the potential to improve patient outcomes and reduce costs. However, targeting these programs to patients with delirium has proven difficult, as only 12% to 35% of delirium cases are recognized in routine clinical practice.[11, 12, 13, 14, 15] The 1‐ and 2‐item screeners we identified could play an important role in future delirium identification. The 3D‐CAM combines high sensitivity (95%) with high specificity (94%)[16] and therefore would be an excellent choice as the second step after a positive screen. The feasibility, effectiveness, and cost of administering these screeners, followed by a brief diagnostic tool such as the 3D‐CAM, should be evaluated in future work.
Our study has noteworthy strengths, including the use of a large purposefully challenging clinical sample with advanced age that included a substantial proportion with dementia, a detailed assessment, and the testing of very brief and practical tools for bedside delirium screening.[25] This study also has several important limitations. Most importantly, we presented secondary analysis of individual items and pairs of items drawn from the 3D CAM assessment; therefore, the 2‐item bedside screen requires prospective clinical validation. The reference standard was based on the DSM‐IV, because this study was conducted prior to the release of DSM‐V. In addition, the ordering of the reference standard and 3D‐CAM assessments was not randomized due to feasibility constraints. In addition, this study was cross‐sectional, involved only a single hospital, and enrolled only older medical patients during the day shift. Our sample was older (aged 75 years and older), and a younger sample may have had a different prevalence of delirium, which could affect the positive predictive value of our ultrabrief screen. We plan to test this in a sample of patients aged 70 years and older in future studies. Finally, it should be noted that these best 1‐item and 2‐item screeners miss 17% and 7% of delirium cases, respectively. In cases where this is unacceptably high, alternative approaches might be necessary.
It is important to remember that these 1‐ and 2‐item screeners are not diagnostic tools and therefore should not be used in isolation. Optimally, they will be followed by a more specific evaluation, such as the 3D‐CAM, as part of a systematic delirium identification process. For instance, in our sample (with a delirium rate of 21%), the best 2‐item screener had a positive predictive value of 41%, meaning that positive screens are more likely to be false positives than true positives (see Supporting Tables 2 and 3 in the online version of this article).[32] Nevertheless, by reducing the total number of patients who require diagnostic instrument administration, use of these ultrabrief screeners can improve efficiency and result in a net benefit to delirium case‐identification efforts.[32]
Time has been demonstrated to be a barrier to delirium identification in previous studies, but there are likely others. These may include, for instance, staff nihilism about screening making a difference, ambiguous responsibility for delirium screening and management, unsupportive system leadership, and absent payment for these activities.[31] Moreover, it is possible that the 2‐step process we propose may create an incentive for staff to avoid positive screens as they see it creating more work for themselves. We plan to identify and address such barriers in our future work.
In conclusion, we identified a single screening item for delirium, Months of the year backwards, with 83% sensitivity, and a pair of items, Months of the year backwards and What is the day of the week?, with 93% sensitivity relative to a rigorous reference standard diagnosis. These ultrabrief screening items work well in patients with and without dementia, and should require very little training of staff. Future studies should further validate these tools, and determine their translatability and scalability into programs for systematic, widespread delirium detection. Developing efficient and accurate case identification strategies is a necessary prerequisite to appropriately target delirium management protocols, enabling healthcare systems to effectively address this costly and deadly condition.
Disclosures
Author contributionsD.M.F. conceived the study idea, participated in its design and coordination, and drafted the initial manuscript. S.K.I. contributed to the study design and conceptualization, supervision, funding, preliminary analysis, and interpretation of the data, and critical revision of the manuscript. J.G. conducted the analysis for the study and critically revised the manuscript. L.N. supervised the analysis for the study and critically revised the manuscript. R.J. contributed to the study design and critical revision of the manuscript. J.S.S. critically revised the manuscript. E.R.M. obtained funding for the study, supervised all data collection, assisted in drafting and critically revising the manuscript, and contributed to the conceptualization, design, and supervision of the study. All authors have seen and agree with the contents of the manuscript.
This work was supported by the National Institute of Aging grant number R01AG030618 and K24AG035075 to Dr. Marcantonio. Dr. Inouye's time was supported in part by grants P01AG031720, R01AG044518, and K07AG041835 from the National Institute on Aging. Dr. Inouye holds the Milton and Shirley F. Levy Family Chair (Hebrew Senior Life/Harvard Medical School). Dr. Fick is partially supported from National Institute of Nursing Research grant number R01 NR011042. Dr. Saczynski was supported in part by funding from the National Institute on Aging (K01AG33643) and from the National Heart Lung and Blood Institute (U01HL105268). The funding agencies had no role and the authors retained full autonomy in the preparation of this article. All authors and coauthors have no financial or nonfinancial conflicts of interest to disclose regarding this article.
This article was presented at the Presidential Poster Session at the American Geriatrics Society 2014 Annual Meeting in Orlando, Florida, May 14, 2014.
- , , , , , Delirium in elderly patients and the risk of postdischarge mortality, institutionalization, and dementia: a meta‐analysis. JAMA. 2010;304(4):443–451.
- , , , et al. Cognitive trajectories after postoperative delirium. N Engl J Med. 2012;367(1):30–39.
- , , Delirium in elderly people. Lancet. 2014;383:911–922.
- , , , Delirium superimposed on dementia is associated with prolonged length of stay and poor outcomes in hospitalized older adults. J Hosp Med. 2013;8(9):500–505.
- , , , , One‐year health care costs associated with delirium in the elderly population. Arch Intern Med. 2008;168(1):27–32.
- , The importance of delirium: Economic and societal costs. J Am Geriatr Soc. 2011;59(suppl 2):S241–S243.
- Delirium. Ann Intern Med. 2011;154(11):ITC6.
- , , , , , Fostering implementation of health services research findings into practice: a consolidated framework for advancing implementation science. Implement Sci. 2009;4:50.
- , , , Mixed‐methods approach to understanding nurses' clinical reasoning in recognizing delirium in hospitalized older adults. J Contin Educ Nurs. 2014;45:1–13.
- , , Educational interventions to improve recognition of delirium: a systematic review. J Am Geriatr Soc. 2013;61(11):1983–1993.
- , Delirium superimposed on dementia: accuracy of nurse documentation. J Gerontol Nurs. 2012;38(1):32–42.
- , , , et al. Detection of delirium by bedside nurses using the confusion assessment method. J Am Geriatr Soc. 2006;54:685–689.
- , , , et al. Documentation of delirium in elderly patients with hip fracture. J Gerontol Nurs. 2002;28(11):23–29.
- , , , Recorded delirium in a national sample of elderly inpatients: potential implications for recognition. J Geriatr Psychiatry Neurol. 2003;16(1):32–38.
- , , , et al. A tale of two methods: chart and interview methods for identifying delirium. J Am Geriatr Soc. 2014;62(3):518–524.
- , , , et al. 3D‐CAM: Derivation and validation of a 3‐minute diagnostic interview for CAM‐defined delirium: a cross‐sectional diagnostic test study. Ann Intern Med. 2014;161(8):554–561.
- , , , et al. Selecting optimal screening items for delirium: an application of item response theory. BMC Med Res Methodol. 2013;13:8.
- , , , et al. The Montreal Cognitive Assessment, MoCA: a brief screening tool for mild cognitive impairment. J Am Geriatr Soc. 2005;53(4):695–699.
- Geriatric Depression Scale. Psychopharmacol Bull. 1988;24(4):709–711.
- , , , A new method of classifying prognostic comorbidity in longitudinal studies: development and validation. J Chronic Dis. 1987;40(5):373–383.
- , , , , Studies of illness in the aged: the index of ADL: a standardized measure of biological and psychosocial function. JAMA. 1963;185:914–919.
- , Assessment of older people: self‐maintaining and instrumental activities of daily living. Gerontologist. 1969;9(3):179–186.
- , , , et al. The AD8: a brief informant interview to detect dementia. Neurology. 2005;65(4):559–564.
- , , , et al. The diagnosis of dementia due to Alzheimer's disease: recommendations from the National Institute on Aging‐Alzheimer's Association workgroups on diagnostic guidelines for Alzheimer's disease. Alzheimers Dement. 2011;7(3):263–269.
- , , , et al. Delirium diagnosis methodology used in research: a survey‐based study. Am J Geriatr Psychiatry. 2014;22(12):1513–1521.
- , , , , Single Question in Delirium (SQiD): testing its efficacy against psychiatrist interview, the Confusion Assessment Method and the Memorial Delirium Assessment Scale. Palliat Med. 2010;24(6):561–565.
- , , , et al. Diagnosing delirium in older emergency department patients: validity and reliability of the delirium triage screen and the brief confusion assessment method. Ann Emerg Med. 2013;62(5):457–465.
- , , , et al. Attention! A good bedside test for delirium? J Neurol Neurosurg Psychiatry. 2014;85(10):1122–1131.
- , , , , A model for management of delirious postacute care patients. J Am Geriatr Soc. 2005;53(10):1817–1825.
- , , , Computerized decision support for delirium superimposed on dementia in older adults: a pilot study. J Gerontol Nurs. 2011;37(4):39–47.
- , , , et al. Barriers and facilitators to implementing delirium rounds in a clinical trial across three diverse hospital settings. Clin Nurs Res. 2014;23(2):201–215.
- , Antecedent probability and the efficiency of psychometric signs, patterns, or cutting scores. Psychol Bull. 1955;52(3):194.
© 2015 Society of Hospital Medicine
Physician Skin Examinations for Melanoma Screening
In the United States an estimated 73,870 new cases of melanoma will be diagnosed in 2015.1 Although melanoma accounts for less than 2% of all US skin cancer cases, it is responsible for the vast majority of skin cancer deaths. From 2007 to 2011, melanoma mortality rates decreased by 2.6% per year in individuals younger than 50 years but increased by 0.6% per year among those 50 years and older.1 Reports of the direct annual treatment costs for melanoma in the United States have ranged from $44.9 million for Medicare recipients with existing cases of melanoma to $932.5 million for newly diagnosed melanomas across all age groups.2
Melanoma survival rates are inversely related to tumor thickness at the time of diagnosis.3 Melanoma can be cured if caught early and properly treated. Secondary preventative measures include physician skin examinations (PSEs), which may increase the likelihood of detecting melanomas in earlier stages, thereby potentially increasing survival rates and quality of life as well as decreasing treatment costs. Physician skin examinations are performed in the physician’s office and are safe, noninvasive, and painless. Patients with suspicious lesions should subsequently undergo a skin biopsy, which is a low-risk procedure. False-positives from biopsies do not lead to extreme patient morbidity, and false-negatives will hopefully be detected at a subsequent visit.
There is a lack of consensus regarding recommendations for PSEs for skin cancer screening. Due to a lack of randomized controlled trials on the effects of skin cancer screening on patient morbidity and mortality, the US Preventive Services Task Force (USPSTF) has concluded that there is insufficient evidence to recommend for or against such screening4; however, other organizations including the American Cancer Society and the American Academy of Dermatology recommend periodic skin cancer screening examinations.1,5 In a rapidly changing health care climate and with the rollout of the Patient Protection and Affordable Care Act, a USPSTF recommendation for skin screening with PSEs for skin cancer would have a large impact on clinical practice in the United States.
This article provides a systematic review of the current domestic and international data regarding the impact of PSEs on melanoma tumor thickness at the time of diagnosis as well as mortality from melanoma.
Methods
Search Strategy
A systematic search of PubMed articles indexed for MEDLINE and Embase for studies related to melanoma and PSEs was performed for the period from each database’s inception to November 8, 2014. One of the authors (S.L.M.) designed a broad search strategy with assistance from a medical librarian who had expertise in searching research bibliographies. Articles were excluded if they had a cross-sectional study design or were editorials or review articles. Search terms included skin neoplasm, skin cancer, or melanoma in combination with any of the following: skin examination, mass screening, screening, and secondary prevention.
Study Selection
All published studies reporting outcomes and correlations with PSEs and cutaneous melanoma in adult patients were screened. If multiple studies were published describing the same study, follow-up studies were included for data extraction, but the original study was the primary resource. Observational studies were a focus in this review, as these types of studies are much more common in this subject area.
One of the authors (S.L.M.) screened the titles and abstracts of identified studies for eligibility. If the reviewer considered a study potentially eligible based on the abstract review, a full-text review was carried out. The reference lists of eligible studies were manually searched to identify additional studies.
Data Extraction, Quality Assessment, and Data Synthesis
Data items to be extracted were agreed on before search implementation and were extracted by one investigator (S.L.M.) following criteria developed by review of the Cochrane Handbook for Systematic Reviews of Interventions.6 Study population, design, sample size, and outcomes were extracted. Risk of bias of individual articles was evaluated using a tool developed from the RTI item bank (RTI International) for determining the risk of bias and precision of eligible observational studies.7 Studies ultimately were classified into 3 categories based on the risk of bias: (1) low risk of bias, (2) medium risk of bias, and (3) high risk of bias. The strength of evidence of included studies was evaluated by the following items: risk of bias, consistency, directness, precision, and overall conclusion. Data from the included studies was synthesized qualitatively in a narrative format. This review adhered to guidelines in the Cochrane Handbook for Systematic Reviews of Interventions6 and the PRISMA (preferred reporting items for systematic reviews and meta-analyses) guidelines.8
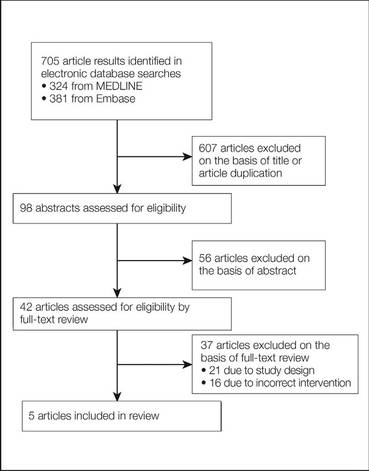
Results
A total of 705 titles were screened, 98 abstracts were assessed for eligibility, 42 full-text reviews were carried out, and 5 eligible studies were identified (Figure 1). Five observational studies were included in the final review. A summary of the results is presented in Table 1.
Included studies were assessed for several types of biases, including selection bias, attrition bias, detection bias, performance bias, and response bias. The judgments were given for each domain (Table 2). There was heterogeneity in study design, reporting of total-body skin examination methods, and reporting of outcomes among all 5 studies. All 5 studies were assessed as having a medium risk of bias.
Physician Skin Examination Impact
One article by Berwick et al9 reanalyzed data from a 1996 study10 and provided no significant evidence regarding the benefits of PSEs in the reduction of melanoma mortality. Data for 650 patients with newly diagnosed melanomas were obtained from the Connecticut Tumor Registry, a site for the National Cancer Institute’s Surveillance, Epidemiology, and End Results (SEER) program, along with 549 age- and sex-frequency matched controls from the general population.10 Participants were followed biannually for a mean of 5.4 years. Of the original 650 case patients, 122 were excluded from the study with reasons provided. Physician skin examination was defined as a positive response to the following questionnaire item: “[Before your recent biopsy] did the doctor examine your skin during any of your visits?”9 Data analysis showed no significant association between PSE and death from melanoma. Upon univariate analysis, the hazard ratio for physician screening was 0.7 (95% confidence interval [CI], 0.4-1.3).9
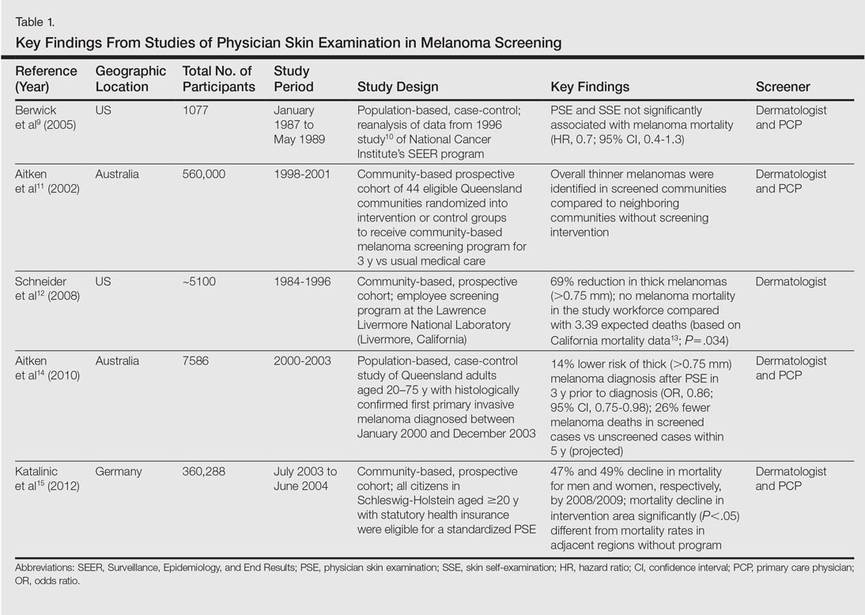
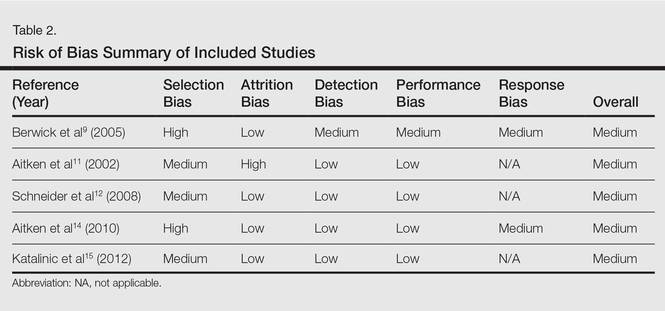
The SCREEN (Skin Cancer Research to Provide Evidence for Effectiveness of Screening in Northern Germany) project, which was undertaken in Schleswig-Holstein, Germany, is the world’s largest systematic population-based skin cancer screening program.15 The participation rate was
19% (N=360,288) of the eligible population (citizens aged ≥20 years with statutory health insurance). Screening was a 2-step process performed by trained physicians: initial general practitioner whole-body skin examination followed by referral to a dermatologist for evaluation of suspicious skin findings. Five years after the SCREEN program was conducted, melanoma mortality declined by 47% per 100,000 men and by 49% per 100,000 women. The annual percentage change in the most recent 10-year period (2000-2009) was 7.5% (95% CI, –14.0 to –0.5; P<.05) for men and 7.1% for women (95% CI,
–10.5 to –2.9; P<.05). Simultaneously, the melanoma mortality rates in the 4 unscreened adjacent regions and the rest of Germany were stable, significantly (P<.05) different from the decline in mortality observed in Schleswig-Holstein.15
A community-based, prospective cohort study investigated the impact of an employee melanoma screening program at the Lawrence Livermore National Laboratory (Livermore, California) (1984-1996) demonstrated an impact on melanoma thickness and mortality rates.12 The cohort (approximately 5100 participants) was followed over 3 phases of surveillance: (1) preawareness (1969-1975), (2) early awareness of increased melanoma risk (1976-1984), and (3) screening program (1984-1996). The screening program encouraged employees to self-examine their skin for “suggestive lesions”; if a suggestive lesion was found, a full-body skin examination was performed by a physician. After being evaluated, participants with melanoma, dysplastic nevi, 50 or more moles, or a family history of melanoma were offered a periodic full-body examination every 3 to 24 months, often with
full-body photography and dermoscopy. Physician skin screening resulted in a reduction in crude incidence of thicker melanomas (defined as
>0.75 mm) during the 3 study phases. Compared with the early-awareness period (phase 2), a 69% reduction in the diagnosis of thick melanomas was reported in the screening program period (phase 3)(P=.0001). During the screening period, no eligible melanoma deaths occurred in the study population, whereas the expected number of deaths was 3.39 (P=.034) based on observed melanoma mortality in 5 San Francisco/Oakland Bay–area counties in California as reported to the SEER program from 1984 to 1996.12
The strongest evidence for reduced thickness of melanomas detected via PSEs was reported in a population-based, case-control study by Aitken et al14 of all residents in Queensland, Australia, aged 20 to 75 years with a histologically confirmed first primary invasive cutaneous melanoma diagnosed between January 2000 and December 2003. Whole-body PSE in the 3 years before diagnosis was inversely associated with tumor thickness at diagnosis (χ2=44.37; P<.001), including a 14% lower risk of diagnosis of a thick melanoma (>0.75 mm)(odds ratio [OR], 0.86; 95% CI, 0.75-0.98) and a 40% lower risk of diagnosis of a melanoma that was 3 mm or larger (OR, 0.60; 95% CI, 0.43-0.83). The investigators applied melanoma thickness-specific survival estimates to the thickness distribution of the screened and unscreened cases in their sample to estimate melanoma deaths within 5 and 10 years of diagnosis. Compared to the unscreened cases, they estimated that the screened cases would have 26% fewer melanoma deaths within 5 years of diagnosis and 23% fewer deaths within 10 years.14
Another prospective cohort study in Queensland was designed to detect a 20% reduction in mortality from melanoma during a 15-year intervention period in communities that received a screening program.11 A total of 44 communities (aggregate population, 560,000 adults aged ≥30 years) were randomized into intervention or control groups to receive a community-based melanoma screening program for 3 years versus usual medical care.Overall, thinner melanomas were identified in communities with the screening program versus neighboring communities without it.11 Of the 33 melanomas found through the screening program, 39% (13/33) were in situ lesions, 55% (18/33) were thin (<1 mm) invasive lesions, and 6% (2/33) were 1-mm thick or greater.16 Within the population of Queensland during the period from 1999 through 2002, 36% were in situ lesions, 48% were invasive thin melanomas, and 16% were invasive melanomas 1-mm thick or more, indicating that melanomas found through screening were thinner or less advanced.17
Comment
Our review identified 5 studies describing the impact of PSEs for melanoma screening on tumor thickness at diagnosis and melanoma mortality. Key findings are highlighted in Figure 2. Our findings suggest that PSEs are associated with a decline in melanoma tumor thickness and melanoma-specific mortality. Our findings are qualitatively similar to prior reviews that supported the use of PSEs to detect thinner melanomas and improve mortality outcomes.18-20
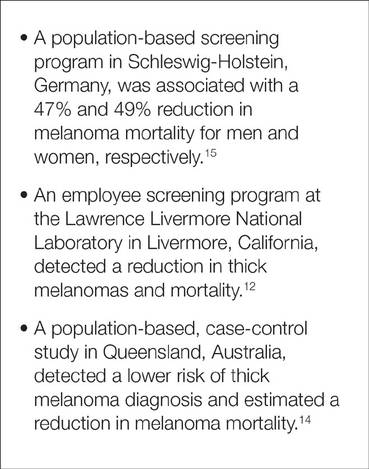
The greatest evidence for population-based screening programs was provided by the SCREEN study. This landmark study documented that screening programs utilizing primary care physicians (PCPs) and dermatologists can lead to a reduction in melanoma mortality.15 Findings from the study led to the countrywide expansion of the screening program in 2008, leading to 45 million Germans eligible for skin cancer screenings every 2 years.21 Nearly two-thirds of dermatologists (N=1348) were satisfied with routine PSE and 83% perceived a better quality of health care for skin with the 2008 expansion.22
Data suggest that physician-detected melanomas through PSEs or routine physical examinations are thinner at the time of diagnosis than those found by patients or their partners.14,23-26 Terushkin and Halpern20 analyzed 9 worldwide studies encompassing more than 7500 patients and found that physician-detected melanomas were 0.55 mm thinner than those detected by patients or their significant others. The workplace screening and education program reviewed herein also reported a reduction in thicker melanomas and melanoma mortality during the study period.12
Not all Americans have a regular dermatologist. As such, educating PCPs in skin cancer detection has been a recent area of study. The premise is that the skin examination can be integrated into routine physical examinations conducted by PCPs. The previously discussed studies, particularly Aitken et al,14 Schneider et al,12 and Katalinic et al,15 as well as the SCREEN program studies,15 suggest that integration of the skin examination into the routine physical examination may be a feasible method to reduce melanoma thickness and mortality. Furthermore, the SCREEN study15 identified participants with risk factors for melanoma, finding that approximately half of men and women (N=360,288) had at least one melanoma risk factor, which suggests that it may be more practical to design screening practices around high-risk participants.
Several studies were excluded from our analysis on the basis of study design, including cross-sectional observational studies; however, it is worth briefly commenting on the findings of the excluded studies here, as they add to the body of literature. A community-based, multi-institutional study of 566 adults with invasive melanoma assessed the role of PSEs in the year prior to diagnosis by interviewing participants in clinic within 3 months of melanoma diagnosis.24 Patients who underwent full-body PSE in the year prior to diagnosis were more than 2 times more likely to have thinner (≤1 mm) melanomas (OR, 2.51; 95% CI, 1.62-3.87]). Notably, men older than 60 years appeared to benefit the most from this practice; men in this age group contributed greatly to the observed effect, likely because they had 4 times the odds of a thinner melanoma (OR, 4.09; 95% CI, 1.88-8.89]). Thinner melanomas also were associated with an age of 60 years or younger, female sex, and higher education level.24
Pollitt et al27 analyzed the association between prediagnosis Medicaid enrollment status and melanoma tumor thickness. The study found that men and women who intermittently enrolled in Medicaid or were not enrolled until the month of diagnosis had an increased chance of late-stage melanoma when compared to other patients. Patients who continuously enrolled during the year prior to diagnosis had lower odds for thicker melanomas, suggesting that these patients had greater access to screening examinations.27
Roetzheim et al28 analyzed data from the SEER-Medicare linked dataset to investigate patterns of dermatologist and PCP visits in the 2 years before melanoma diagnosis. Medicare beneficiaries seeing both a dermatologist and a PCP prior to melanoma diagnosis had greater odds of a thinner melanoma and lower melanoma mortality compared to patients without such visits.28
Durbec et al29 conducted a retrospective, population-based study of 650 patients in France who were seen by a dermatologist for melanoma. The thinnest melanomas were reported in patients seeing a dermatologist for prospective follow-up of nevi or consulting a dermatologist for other diseases. Patients referred to a dermatologist by PCPs tended to be older and had the highest frequency of thick (>3 mm), nodular, and/or ulcerated melanomas,29 which could be interpreted as a need for greater PCP education in melanoma screening.
Rates of skin examinations have been increasing since the year 2000, both overall and among high-risk groups as reported by a recent study on skin cancer screening trends. Prevalence of having at least one total-body skin examination increased from 14.5% in 2000 to 16.5% in 2005 to 19.8% in 2010 (P<.0001).30 One study revealed a practice gap in which more than 3 in 10 PCPs and 1 in 10 dermatologists reported not screening more than half their high-risk patients for skin cancer.31 The major obstacle to narrowing the identified practice gap involves establishing a national strategy to screen high-risk individuals for skin cancer and requires partnerships among patients, PCPs, specialists, policy makers, and government sponsors.
Lack of evidence that screening for skin cancer with PSEs reduces overall mortality does not mean there is a lack of lifesaving potential of screenings. The resources required to execute a randomized controlled trial with adequate power are vast, as the USPSTF estimated 800,000 participants would be needed.4 Barriers to conducting a randomized clinical trial for skin cancer screening include the large sample size required, prolonged follow-up, and various ethical issues such as withholding screening for a cancer that is potentially curable in early stages. Lessons from screenings for breast and prostate cancers have taught us that such randomized controlled trials assessing cancer screening are costly and do not always produce definitive answers.32
Conclusion
Although proof of improved health outcomes from randomized controlled trials is still required, there is evidence to support targeted screening programs for the detection of thinner melanomas and, by proxy, reduced melanoma mortality. Amidst the health care climate change and payment reform, recommendations from national organizations on melanoma screenings are paramount. Clinicians should continue to offer regular skin examinations as the body of evidence continues to grow in support of PSEs for melanoma screening.
Acknowledgments—We are grateful to Mary Butler, PhD, and Robert Kane, MD, both from Minneapolis, Minnesota, for their guidance and consultation.
1. American Cancer Society. Cancer Facts & Figures 2015. Atlanta, GA: American Cancer Society; 2015. http: //www.cancer.org/Research/CancerFactsStatistics/cancer factsfigures2015/cancer-facts-and-figures-2015. Accessed July 6, 2015.
2. Guy G Jr, Ekwueme D, Tangka F, et al. Melanoma treatment costs: a systematic review of the literature, 1990-2011. Am J Prev. 2012;43:537-545.
3. Margolis D, Halpern A, Rebbeck T, et al. Validation of a melanoma prognostic model. Arch Dermatol. 1998;134:1597-1601.
4. Wolff T, Tai E, Miller T. Screening for skin cancer: an update of the evidence for the U.S. Preventative Services Task Force. Ann Intern Med. 2009;150:194-198.
5. American Academy of Dermatology. Melanoma
Monday. http://www.aad.org/spot-skin-cancer
/community-programs-events/melanoma-monday. Accessed August 19, 2015.
6. Higgins JPT, Green S, eds. Cochrane Handbook for
Systematic Reviews of Interventions Version 5.1.0 [updated March 2011]. The Cochrane Collaboration, 2011. http:
//www.cochrane-handbook.org. Updated March 2011. Accessed November 10, 2014.
7. Viswanathan M, Berkman N. Development of the RTI item bank on risk of bias and precision of observational studies. J Clin Epidemiol. 2012;65:163-178.
8. Moher D, Liberati A, Tetzlaff J, et al; PRISMA group. Preferred reporting items for systematic reviews and meta-analyses: the PRISMA statement [published online ahead of print July 23, 2009]. J Clin Epidemiol. 2009;62:1006-1012.
9. Berwick M, Armstrong B, Ben-Porat L. Sun exposure and mortality from melanoma. J Natl Cancer Inst. 2005;97:195-199.
10. Berwick M, Begg C, Fine J, et al. Screening for cutaneous melanoma by skin self-examination. J Natl Cancer Inst. 1996;88:17-23.
11. Aitken J, Elwood J, Lowe J, et al. A randomised trial of population screening for melanoma. J Med Screen. 2002;9:33-37.
12. Schneider J, Moore D, Mendelsohn M. Screening program reduced melanoma mortality at the Lawrence Livermore National Laboratory, 1984 to 1996. J Am Acad Dermatol. 2008;58:741-749.
13. Expert Health Data Programming Inc. Health data software and health statistics. Available from: http: //www.ehdp.com. Accessed April 1, 2001. Cited by: Schneider J, Moore D, Mendelsohn M. Screening program reduced melanoma mortality at the Lawrence Livermore National Laboratory, 1984 to 1996. J Am Acad Dermatol. 2008;58:741-749.
14. Aitken J, Elwood M, Baade P, et al. Clinical whole-body skin examination reduces the incidence of thick melanomas. Int J Cancer. 2010;126:450-458.
15. Katalinic A, Waldmann A, Weinstock M, et al. Does skin cancer screening save lives? an observational study comparing trends in melanoma mortality in regions with and without screening. Cancer. 2012;118:5395-5402.
16. Aitken J, Janda M, Elwood M, et al. Clinical outcomes from skin screening clinics within a community-based melanoma screening program. J Am Acad Dermatol. 2006;54:105-114.
17. Coory M, Baade P, Aitken JF, et al. Trends for in-situ and invasive melanoma in Queensland, Australia, 1982 to 2002. Cancer Causes Control. 2006;17:21-27.
18. Mayer JE, Swetter SM, Fu T, et al. Screening, early detection, education, and trends for melanoma: current status (2007-2013) and future directions: part II. screening, education, and future directions. J Am Acad Dermatol. 2014;71:611.e1-611.e10; quiz, 621-622.
19. Curiel-Lewandrowski C, Chen S, Swetter S, et al. Screening and prevention measures for melanoma: is there a survival advantage? Curr Oncol Rep. 2012;14:458-467.
20. Terushkin V, Halpern A. Melanoma early detection. Hematol Oncol Clin North Am. 2009;23:481-500.
21. Geller A, Greinert R, Sinclair C, et al. A nationwide population-based skin cancer screening in Germany: proceedings of the first meeting of the International Task Force on Skin Cancer Screening and Prevention (September 24 and 25, 2009) [published online ahead of print April 8, 2010]. Cancer Epidemiol. 2010;34:355-358.
22. Kornek T, Schafer I, Reusch M, et al. Routine skin cancer screening in Germany: four years of experience from the dermatologists’ perspective. Dermatology. 2012;225:289-293.
23. De Giorgi V, Grazzini M, Rossari S, et al. Is skin self-examination for cutaneous melanoma detection still adequate? a retrospective study. Dermatology. 2012;225:31-36.
24. Swetter S, Johnson T, Miller D, et al. Melanoma in middle-aged and older men: a multi-institutional survey study of factors related to tumor thickness. Arch Dermatol. 2009;145:397-404.
25. Kantor J, Kantor D. Routine dermatologist-performed full-body skin examination and early melanoma detection. Arch Dermatol. 2009;145:873-876.
26. Kovalyshyn I, Dusza S, Siamas K, et al. The impact of physician screening on melanoma detection. Arch Dermatol. 2011;147:1269-1275.
27. Pollitt R, Clarke C, Shema S, et al. California Medicaid enrollment and melanoma stage at diagnosis: a population-based study. Am J Prev Med. 2008;35:7-13.
28. Roetzheim R, Lee J, Ferrante J, et al. The influence of dermatologist and primary care physician visits on melanoma outcomes among Medicare beneficiaries. J Am Board Fam Med. 2013;26:637-647.
29. Durbec F, Vitry F, Granel-Brocard F, et al. The role of circumstances of diagnosis and access to dermatological care in early diagnosis of cutaneous melanoma: a population-based study in France. Arch Dermatol. 2010;146:240-246.
30. Lakhani N, Saraiya M, Thompson T, et al. Total body skin examination for skin cancer screening among U.S. adults from 2000 to 2010. Prev Med. 2014;61:75-80.
31. Oliveria SA, Heneghan MK, Cushman LF, et al. Skin cancer screening by dermatologists, family practitioners, and internists: barriers and facilitating factors. Arch Dermatol. 2011;147:39-44.
32. Bigby M. Why the evidence for skin cancer screening is insufficient: lessons from prostate cancer screening. Arch Dermatol. 2010;146:322-324.
In the United States an estimated 73,870 new cases of melanoma will be diagnosed in 2015.1 Although melanoma accounts for less than 2% of all US skin cancer cases, it is responsible for the vast majority of skin cancer deaths. From 2007 to 2011, melanoma mortality rates decreased by 2.6% per year in individuals younger than 50 years but increased by 0.6% per year among those 50 years and older.1 Reports of the direct annual treatment costs for melanoma in the United States have ranged from $44.9 million for Medicare recipients with existing cases of melanoma to $932.5 million for newly diagnosed melanomas across all age groups.2
Melanoma survival rates are inversely related to tumor thickness at the time of diagnosis.3 Melanoma can be cured if caught early and properly treated. Secondary preventative measures include physician skin examinations (PSEs), which may increase the likelihood of detecting melanomas in earlier stages, thereby potentially increasing survival rates and quality of life as well as decreasing treatment costs. Physician skin examinations are performed in the physician’s office and are safe, noninvasive, and painless. Patients with suspicious lesions should subsequently undergo a skin biopsy, which is a low-risk procedure. False-positives from biopsies do not lead to extreme patient morbidity, and false-negatives will hopefully be detected at a subsequent visit.
There is a lack of consensus regarding recommendations for PSEs for skin cancer screening. Due to a lack of randomized controlled trials on the effects of skin cancer screening on patient morbidity and mortality, the US Preventive Services Task Force (USPSTF) has concluded that there is insufficient evidence to recommend for or against such screening4; however, other organizations including the American Cancer Society and the American Academy of Dermatology recommend periodic skin cancer screening examinations.1,5 In a rapidly changing health care climate and with the rollout of the Patient Protection and Affordable Care Act, a USPSTF recommendation for skin screening with PSEs for skin cancer would have a large impact on clinical practice in the United States.
This article provides a systematic review of the current domestic and international data regarding the impact of PSEs on melanoma tumor thickness at the time of diagnosis as well as mortality from melanoma.
Methods
Search Strategy
A systematic search of PubMed articles indexed for MEDLINE and Embase for studies related to melanoma and PSEs was performed for the period from each database’s inception to November 8, 2014. One of the authors (S.L.M.) designed a broad search strategy with assistance from a medical librarian who had expertise in searching research bibliographies. Articles were excluded if they had a cross-sectional study design or were editorials or review articles. Search terms included skin neoplasm, skin cancer, or melanoma in combination with any of the following: skin examination, mass screening, screening, and secondary prevention.
Study Selection
All published studies reporting outcomes and correlations with PSEs and cutaneous melanoma in adult patients were screened. If multiple studies were published describing the same study, follow-up studies were included for data extraction, but the original study was the primary resource. Observational studies were a focus in this review, as these types of studies are much more common in this subject area.
One of the authors (S.L.M.) screened the titles and abstracts of identified studies for eligibility. If the reviewer considered a study potentially eligible based on the abstract review, a full-text review was carried out. The reference lists of eligible studies were manually searched to identify additional studies.
Data Extraction, Quality Assessment, and Data Synthesis
Data items to be extracted were agreed on before search implementation and were extracted by one investigator (S.L.M.) following criteria developed by review of the Cochrane Handbook for Systematic Reviews of Interventions.6 Study population, design, sample size, and outcomes were extracted. Risk of bias of individual articles was evaluated using a tool developed from the RTI item bank (RTI International) for determining the risk of bias and precision of eligible observational studies.7 Studies ultimately were classified into 3 categories based on the risk of bias: (1) low risk of bias, (2) medium risk of bias, and (3) high risk of bias. The strength of evidence of included studies was evaluated by the following items: risk of bias, consistency, directness, precision, and overall conclusion. Data from the included studies was synthesized qualitatively in a narrative format. This review adhered to guidelines in the Cochrane Handbook for Systematic Reviews of Interventions6 and the PRISMA (preferred reporting items for systematic reviews and meta-analyses) guidelines.8
Results
A total of 705 titles were screened, 98 abstracts were assessed for eligibility, 42 full-text reviews were carried out, and 5 eligible studies were identified (Figure 1). Five observational studies were included in the final review. A summary of the results is presented in Table 1.
Included studies were assessed for several types of biases, including selection bias, attrition bias, detection bias, performance bias, and response bias. The judgments were given for each domain (Table 2). There was heterogeneity in study design, reporting of total-body skin examination methods, and reporting of outcomes among all 5 studies. All 5 studies were assessed as having a medium risk of bias.
Physician Skin Examination Impact
One article by Berwick et al9 reanalyzed data from a 1996 study10 and provided no significant evidence regarding the benefits of PSEs in the reduction of melanoma mortality. Data for 650 patients with newly diagnosed melanomas were obtained from the Connecticut Tumor Registry, a site for the National Cancer Institute’s Surveillance, Epidemiology, and End Results (SEER) program, along with 549 age- and sex-frequency matched controls from the general population.10 Participants were followed biannually for a mean of 5.4 years. Of the original 650 case patients, 122 were excluded from the study with reasons provided. Physician skin examination was defined as a positive response to the following questionnaire item: “[Before your recent biopsy] did the doctor examine your skin during any of your visits?”9 Data analysis showed no significant association between PSE and death from melanoma. Upon univariate analysis, the hazard ratio for physician screening was 0.7 (95% confidence interval [CI], 0.4-1.3).9
The SCREEN (Skin Cancer Research to Provide Evidence for Effectiveness of Screening in Northern Germany) project, which was undertaken in Schleswig-Holstein, Germany, is the world’s largest systematic population-based skin cancer screening program.15 The participation rate was
19% (N=360,288) of the eligible population (citizens aged ≥20 years with statutory health insurance). Screening was a 2-step process performed by trained physicians: initial general practitioner whole-body skin examination followed by referral to a dermatologist for evaluation of suspicious skin findings. Five years after the SCREEN program was conducted, melanoma mortality declined by 47% per 100,000 men and by 49% per 100,000 women. The annual percentage change in the most recent 10-year period (2000-2009) was 7.5% (95% CI, –14.0 to –0.5; P<.05) for men and 7.1% for women (95% CI,
–10.5 to –2.9; P<.05). Simultaneously, the melanoma mortality rates in the 4 unscreened adjacent regions and the rest of Germany were stable, significantly (P<.05) different from the decline in mortality observed in Schleswig-Holstein.15
A community-based, prospective cohort study investigated the impact of an employee melanoma screening program at the Lawrence Livermore National Laboratory (Livermore, California) (1984-1996) demonstrated an impact on melanoma thickness and mortality rates.12 The cohort (approximately 5100 participants) was followed over 3 phases of surveillance: (1) preawareness (1969-1975), (2) early awareness of increased melanoma risk (1976-1984), and (3) screening program (1984-1996). The screening program encouraged employees to self-examine their skin for “suggestive lesions”; if a suggestive lesion was found, a full-body skin examination was performed by a physician. After being evaluated, participants with melanoma, dysplastic nevi, 50 or more moles, or a family history of melanoma were offered a periodic full-body examination every 3 to 24 months, often with
full-body photography and dermoscopy. Physician skin screening resulted in a reduction in crude incidence of thicker melanomas (defined as
>0.75 mm) during the 3 study phases. Compared with the early-awareness period (phase 2), a 69% reduction in the diagnosis of thick melanomas was reported in the screening program period (phase 3)(P=.0001). During the screening period, no eligible melanoma deaths occurred in the study population, whereas the expected number of deaths was 3.39 (P=.034) based on observed melanoma mortality in 5 San Francisco/Oakland Bay–area counties in California as reported to the SEER program from 1984 to 1996.12
The strongest evidence for reduced thickness of melanomas detected via PSEs was reported in a population-based, case-control study by Aitken et al14 of all residents in Queensland, Australia, aged 20 to 75 years with a histologically confirmed first primary invasive cutaneous melanoma diagnosed between January 2000 and December 2003. Whole-body PSE in the 3 years before diagnosis was inversely associated with tumor thickness at diagnosis (χ2=44.37; P<.001), including a 14% lower risk of diagnosis of a thick melanoma (>0.75 mm)(odds ratio [OR], 0.86; 95% CI, 0.75-0.98) and a 40% lower risk of diagnosis of a melanoma that was 3 mm or larger (OR, 0.60; 95% CI, 0.43-0.83). The investigators applied melanoma thickness-specific survival estimates to the thickness distribution of the screened and unscreened cases in their sample to estimate melanoma deaths within 5 and 10 years of diagnosis. Compared to the unscreened cases, they estimated that the screened cases would have 26% fewer melanoma deaths within 5 years of diagnosis and 23% fewer deaths within 10 years.14
Another prospective cohort study in Queensland was designed to detect a 20% reduction in mortality from melanoma during a 15-year intervention period in communities that received a screening program.11 A total of 44 communities (aggregate population, 560,000 adults aged ≥30 years) were randomized into intervention or control groups to receive a community-based melanoma screening program for 3 years versus usual medical care.Overall, thinner melanomas were identified in communities with the screening program versus neighboring communities without it.11 Of the 33 melanomas found through the screening program, 39% (13/33) were in situ lesions, 55% (18/33) were thin (<1 mm) invasive lesions, and 6% (2/33) were 1-mm thick or greater.16 Within the population of Queensland during the period from 1999 through 2002, 36% were in situ lesions, 48% were invasive thin melanomas, and 16% were invasive melanomas 1-mm thick or more, indicating that melanomas found through screening were thinner or less advanced.17
Comment
Our review identified 5 studies describing the impact of PSEs for melanoma screening on tumor thickness at diagnosis and melanoma mortality. Key findings are highlighted in Figure 2. Our findings suggest that PSEs are associated with a decline in melanoma tumor thickness and melanoma-specific mortality. Our findings are qualitatively similar to prior reviews that supported the use of PSEs to detect thinner melanomas and improve mortality outcomes.18-20
The greatest evidence for population-based screening programs was provided by the SCREEN study. This landmark study documented that screening programs utilizing primary care physicians (PCPs) and dermatologists can lead to a reduction in melanoma mortality.15 Findings from the study led to the countrywide expansion of the screening program in 2008, leading to 45 million Germans eligible for skin cancer screenings every 2 years.21 Nearly two-thirds of dermatologists (N=1348) were satisfied with routine PSE and 83% perceived a better quality of health care for skin with the 2008 expansion.22
Data suggest that physician-detected melanomas through PSEs or routine physical examinations are thinner at the time of diagnosis than those found by patients or their partners.14,23-26 Terushkin and Halpern20 analyzed 9 worldwide studies encompassing more than 7500 patients and found that physician-detected melanomas were 0.55 mm thinner than those detected by patients or their significant others. The workplace screening and education program reviewed herein also reported a reduction in thicker melanomas and melanoma mortality during the study period.12
Not all Americans have a regular dermatologist. As such, educating PCPs in skin cancer detection has been a recent area of study. The premise is that the skin examination can be integrated into routine physical examinations conducted by PCPs. The previously discussed studies, particularly Aitken et al,14 Schneider et al,12 and Katalinic et al,15 as well as the SCREEN program studies,15 suggest that integration of the skin examination into the routine physical examination may be a feasible method to reduce melanoma thickness and mortality. Furthermore, the SCREEN study15 identified participants with risk factors for melanoma, finding that approximately half of men and women (N=360,288) had at least one melanoma risk factor, which suggests that it may be more practical to design screening practices around high-risk participants.
Several studies were excluded from our analysis on the basis of study design, including cross-sectional observational studies; however, it is worth briefly commenting on the findings of the excluded studies here, as they add to the body of literature. A community-based, multi-institutional study of 566 adults with invasive melanoma assessed the role of PSEs in the year prior to diagnosis by interviewing participants in clinic within 3 months of melanoma diagnosis.24 Patients who underwent full-body PSE in the year prior to diagnosis were more than 2 times more likely to have thinner (≤1 mm) melanomas (OR, 2.51; 95% CI, 1.62-3.87]). Notably, men older than 60 years appeared to benefit the most from this practice; men in this age group contributed greatly to the observed effect, likely because they had 4 times the odds of a thinner melanoma (OR, 4.09; 95% CI, 1.88-8.89]). Thinner melanomas also were associated with an age of 60 years or younger, female sex, and higher education level.24
Pollitt et al27 analyzed the association between prediagnosis Medicaid enrollment status and melanoma tumor thickness. The study found that men and women who intermittently enrolled in Medicaid or were not enrolled until the month of diagnosis had an increased chance of late-stage melanoma when compared to other patients. Patients who continuously enrolled during the year prior to diagnosis had lower odds for thicker melanomas, suggesting that these patients had greater access to screening examinations.27
Roetzheim et al28 analyzed data from the SEER-Medicare linked dataset to investigate patterns of dermatologist and PCP visits in the 2 years before melanoma diagnosis. Medicare beneficiaries seeing both a dermatologist and a PCP prior to melanoma diagnosis had greater odds of a thinner melanoma and lower melanoma mortality compared to patients without such visits.28
Durbec et al29 conducted a retrospective, population-based study of 650 patients in France who were seen by a dermatologist for melanoma. The thinnest melanomas were reported in patients seeing a dermatologist for prospective follow-up of nevi or consulting a dermatologist for other diseases. Patients referred to a dermatologist by PCPs tended to be older and had the highest frequency of thick (>3 mm), nodular, and/or ulcerated melanomas,29 which could be interpreted as a need for greater PCP education in melanoma screening.
Rates of skin examinations have been increasing since the year 2000, both overall and among high-risk groups as reported by a recent study on skin cancer screening trends. Prevalence of having at least one total-body skin examination increased from 14.5% in 2000 to 16.5% in 2005 to 19.8% in 2010 (P<.0001).30 One study revealed a practice gap in which more than 3 in 10 PCPs and 1 in 10 dermatologists reported not screening more than half their high-risk patients for skin cancer.31 The major obstacle to narrowing the identified practice gap involves establishing a national strategy to screen high-risk individuals for skin cancer and requires partnerships among patients, PCPs, specialists, policy makers, and government sponsors.
Lack of evidence that screening for skin cancer with PSEs reduces overall mortality does not mean there is a lack of lifesaving potential of screenings. The resources required to execute a randomized controlled trial with adequate power are vast, as the USPSTF estimated 800,000 participants would be needed.4 Barriers to conducting a randomized clinical trial for skin cancer screening include the large sample size required, prolonged follow-up, and various ethical issues such as withholding screening for a cancer that is potentially curable in early stages. Lessons from screenings for breast and prostate cancers have taught us that such randomized controlled trials assessing cancer screening are costly and do not always produce definitive answers.32
Conclusion
Although proof of improved health outcomes from randomized controlled trials is still required, there is evidence to support targeted screening programs for the detection of thinner melanomas and, by proxy, reduced melanoma mortality. Amidst the health care climate change and payment reform, recommendations from national organizations on melanoma screenings are paramount. Clinicians should continue to offer regular skin examinations as the body of evidence continues to grow in support of PSEs for melanoma screening.
Acknowledgments—We are grateful to Mary Butler, PhD, and Robert Kane, MD, both from Minneapolis, Minnesota, for their guidance and consultation.
1. American Cancer Society. Cancer Facts & Figures 2015. Atlanta, GA: American Cancer Society; 2015. http: //www.cancer.org/Research/CancerFactsStatistics/cancer factsfigures2015/cancer-facts-and-figures-2015. Accessed July 6, 2015.
2. Guy G Jr, Ekwueme D, Tangka F, et al. Melanoma treatment costs: a systematic review of the literature, 1990-2011. Am J Prev. 2012;43:537-545.
3. Margolis D, Halpern A, Rebbeck T, et al. Validation of a melanoma prognostic model. Arch Dermatol. 1998;134:1597-1601.
4. Wolff T, Tai E, Miller T. Screening for skin cancer: an update of the evidence for the U.S. Preventative Services Task Force. Ann Intern Med. 2009;150:194-198.
5. American Academy of Dermatology. Melanoma
Monday. http://www.aad.org/spot-skin-cancer
/community-programs-events/melanoma-monday. Accessed August 19, 2015.
6. Higgins JPT, Green S, eds. Cochrane Handbook for
Systematic Reviews of Interventions Version 5.1.0 [updated March 2011]. The Cochrane Collaboration, 2011. http:
//www.cochrane-handbook.org. Updated March 2011. Accessed November 10, 2014.
7. Viswanathan M, Berkman N. Development of the RTI item bank on risk of bias and precision of observational studies. J Clin Epidemiol. 2012;65:163-178.
8. Moher D, Liberati A, Tetzlaff J, et al; PRISMA group. Preferred reporting items for systematic reviews and meta-analyses: the PRISMA statement [published online ahead of print July 23, 2009]. J Clin Epidemiol. 2009;62:1006-1012.
9. Berwick M, Armstrong B, Ben-Porat L. Sun exposure and mortality from melanoma. J Natl Cancer Inst. 2005;97:195-199.
10. Berwick M, Begg C, Fine J, et al. Screening for cutaneous melanoma by skin self-examination. J Natl Cancer Inst. 1996;88:17-23.
11. Aitken J, Elwood J, Lowe J, et al. A randomised trial of population screening for melanoma. J Med Screen. 2002;9:33-37.
12. Schneider J, Moore D, Mendelsohn M. Screening program reduced melanoma mortality at the Lawrence Livermore National Laboratory, 1984 to 1996. J Am Acad Dermatol. 2008;58:741-749.
13. Expert Health Data Programming Inc. Health data software and health statistics. Available from: http: //www.ehdp.com. Accessed April 1, 2001. Cited by: Schneider J, Moore D, Mendelsohn M. Screening program reduced melanoma mortality at the Lawrence Livermore National Laboratory, 1984 to 1996. J Am Acad Dermatol. 2008;58:741-749.
14. Aitken J, Elwood M, Baade P, et al. Clinical whole-body skin examination reduces the incidence of thick melanomas. Int J Cancer. 2010;126:450-458.
15. Katalinic A, Waldmann A, Weinstock M, et al. Does skin cancer screening save lives? an observational study comparing trends in melanoma mortality in regions with and without screening. Cancer. 2012;118:5395-5402.
16. Aitken J, Janda M, Elwood M, et al. Clinical outcomes from skin screening clinics within a community-based melanoma screening program. J Am Acad Dermatol. 2006;54:105-114.
17. Coory M, Baade P, Aitken JF, et al. Trends for in-situ and invasive melanoma in Queensland, Australia, 1982 to 2002. Cancer Causes Control. 2006;17:21-27.
18. Mayer JE, Swetter SM, Fu T, et al. Screening, early detection, education, and trends for melanoma: current status (2007-2013) and future directions: part II. screening, education, and future directions. J Am Acad Dermatol. 2014;71:611.e1-611.e10; quiz, 621-622.
19. Curiel-Lewandrowski C, Chen S, Swetter S, et al. Screening and prevention measures for melanoma: is there a survival advantage? Curr Oncol Rep. 2012;14:458-467.
20. Terushkin V, Halpern A. Melanoma early detection. Hematol Oncol Clin North Am. 2009;23:481-500.
21. Geller A, Greinert R, Sinclair C, et al. A nationwide population-based skin cancer screening in Germany: proceedings of the first meeting of the International Task Force on Skin Cancer Screening and Prevention (September 24 and 25, 2009) [published online ahead of print April 8, 2010]. Cancer Epidemiol. 2010;34:355-358.
22. Kornek T, Schafer I, Reusch M, et al. Routine skin cancer screening in Germany: four years of experience from the dermatologists’ perspective. Dermatology. 2012;225:289-293.
23. De Giorgi V, Grazzini M, Rossari S, et al. Is skin self-examination for cutaneous melanoma detection still adequate? a retrospective study. Dermatology. 2012;225:31-36.
24. Swetter S, Johnson T, Miller D, et al. Melanoma in middle-aged and older men: a multi-institutional survey study of factors related to tumor thickness. Arch Dermatol. 2009;145:397-404.
25. Kantor J, Kantor D. Routine dermatologist-performed full-body skin examination and early melanoma detection. Arch Dermatol. 2009;145:873-876.
26. Kovalyshyn I, Dusza S, Siamas K, et al. The impact of physician screening on melanoma detection. Arch Dermatol. 2011;147:1269-1275.
27. Pollitt R, Clarke C, Shema S, et al. California Medicaid enrollment and melanoma stage at diagnosis: a population-based study. Am J Prev Med. 2008;35:7-13.
28. Roetzheim R, Lee J, Ferrante J, et al. The influence of dermatologist and primary care physician visits on melanoma outcomes among Medicare beneficiaries. J Am Board Fam Med. 2013;26:637-647.
29. Durbec F, Vitry F, Granel-Brocard F, et al. The role of circumstances of diagnosis and access to dermatological care in early diagnosis of cutaneous melanoma: a population-based study in France. Arch Dermatol. 2010;146:240-246.
30. Lakhani N, Saraiya M, Thompson T, et al. Total body skin examination for skin cancer screening among U.S. adults from 2000 to 2010. Prev Med. 2014;61:75-80.
31. Oliveria SA, Heneghan MK, Cushman LF, et al. Skin cancer screening by dermatologists, family practitioners, and internists: barriers and facilitating factors. Arch Dermatol. 2011;147:39-44.
32. Bigby M. Why the evidence for skin cancer screening is insufficient: lessons from prostate cancer screening. Arch Dermatol. 2010;146:322-324.
Practice Points
- Current guidelines regarding melanoma screening are inconsistent.
- There is a growing pool of evidence supporting screening to improve melanoma outcomes.
Secular Trends in AB Resistance
Among hospitalized patients with serious infections, the choice of empiric therapy plays a key role in outcomes.[1, 2, 3, 4, 5, 6, 7, 8, 9] Rising rates and variable patterns of antimicrobial resistance, however, complicate selecting appropriate empiric therapy. Amidst this shifting landscape of resistance to antimicrobials, gram‐negative bacteria and specifically Acinetobacter baumannii (AB), remain a considerable challenge.[10] On the one hand, AB is a less‐frequent cause of serious infections than organisms like Pseudomonas aeruginosa or Enterobacteriaceae in severely ill hospitalized patients.[11, 12] On the other, AB has evolved a variety of resistance mechanisms and exhibits unpredictable susceptibility patterns.[13] These factors combine to increase the likelihood of administering inappropriate empiric therapy when faced with an infection caused by AB and, thereby, raising the risk of death.[14] The fact that clinicians may not routinely consider AB as the potential culprit pathogen in the patient they are treating along with this organism's highly in vitro resistant nature, may result in routine gram‐negative coverage being frequently inadequate for AB infections.
To address the poor outcomes related to inappropriate empiric therapy in the setting of AB, one requires an appreciation of the longitudinal changes and geographic differences in the susceptibility of this pathogen. Thus, we aimed to examine secular trends in the resistance of AB to antimicrobial agents whose effectiveness against this microorganism was well supported in the literature during the study timeframe.[15]
METHODS
To determine the prevalence of predefined resistance patterns among AB in respiratory and blood stream infection (BSI) specimens, we examined The Surveillance Network (TSN) database from Eurofins. We explored data collected between years 2003 and 2012. The database has been used extensively for surveillance purposes since 1994, and has previously been described in detail.[16, 17, 18, 19, 20] Briefly, TSN is a warehouse of routine clinical microbiology data collected from a nationally representative sample of microbiology laboratories in 217 hospitals in the United States. To minimize selection bias, laboratories are included based on their geography and the demographics of the populations they serve.[18] Only clinically significant samples are reported. No personal identifying information for source patients is available in this database. Only source laboratories that perform antimicrobial susceptibility testing according standard Food and Drug Administrationapproved testing methods and that interpret susceptibility in accordance with the Clinical Laboratory Standards Institute breakpoints are included.[21] (See Supporting Table 4 in the online version of this article for minimum inhibitory concentration (MIC) changes over the course of the studycurrent colistin and polymyxin breakpoints applied retrospectively). All enrolled laboratories undergo a pre‐enrollment site visit. Logical filters are used for routine quality control to detect unusual susceptibility profiles and to ensure appropriate testing methods. Repeat testing and reporting are done as necessary.[18]
Laboratory samples are reported as susceptible, intermediate, or resistant. We grouped isolates with intermediate MICs together with the resistant ones for the purposes of the current analysis. Duplicate isolates were excluded. Only samples representing 1 of the 2 infections of interest, respiratory or BSI, were included.
We examined 3 time periods2003 to 2005, 2006 to 2008, and 2009 to 2012for the prevalence of AB's resistance to the following antibiotics: carbapenems (imipenem, meropenem, doripenem), aminoglycosides (tobramycin, amikacin), tetracyclines (minocycline, doxycycline), polymyxins (colistin, polymyxin B), ampicillin‐sulbactam, and trimethoprim‐sulfamethoxazole. Antimicrobial resistance was defined by the designation of intermediate or resistant in the susceptibility category. Resistance to a class of antibiotics was defined as resistance to all drugs within the class for which testing was available. The organism was multidrug resistant (MDR) if it was resistant to at least 1 antimicrobial in at least 3 drug classes examined.[22] Resistance to a combination of 2 drugs was present if the specimen was resistant to both of the drugs in the combination for which testing was available. We examined the data by infection type, time period, the 9 US Census divisions, and location of origin of the sample.
All categorical variables are reported as percentages. Continuous variables are reported as meansstandard deviations and/or medians with the interquartile range (IQR). We did not pursue hypothesis testing due to a high risk of type I error in this large dataset. Therefore, only clinically important trends are highlighted.
RESULTS
Among the 39,320 AB specimens, 81.1% were derived from a respiratory source and 18.9% represented BSI. Demographics of source patients are listed in Table 1. Notably, the median age of those with respiratory infection (58 years; IQR 38, 73) was higher than among patients with BSI (54.5 years; IQR 36, 71), and there were proportionally fewer females among respiratory patients (39.9%) than those with BSI (46.0%). Though only 24.3% of all BSI samples originated from the intensive are unit (ICU), 40.5% of respiratory specimens came from that location. The plurality of all specimens was collected in the 2003 to 2005 time interval (41.3%), followed by 2006 to 2008 (34.7%), with a minority coming from years 2009 to 2012 (24.0%). The proportions of collected specimens from respiratory and BSI sources were similar in all time periods examined (Table 1). Geographically, the South Atlantic division contributed the most samples (24.1%) and East South Central the fewest (2.6%) (Figure 1). The vast majority of all samples came from hospital wards (78.6%), where roughly one‐half originated in the ICU (37.5%). Fewer still came from outpatient sources (18.3%), and a small minority (2.5%) from nursing homes.

| Pneumonia | BSI | All | |
|---|---|---|---|
| |||
| Total, N (%) | 31,868 (81.1) | 7,452 (18.9) | 39,320 |
| Age, y | |||
| Mean (SD) | 57.7 (37.4) | 57.6 (40.6) | 57.7 (38.0) |
| Median (IQR 25, 75) | 58 (38, 73) | 54.5 (36, 71) | 57 (37, 73) |
| Gender, female (%) | 12,725 (39.9) | 3,425 (46.0) | 16,150 (41.1) |
| ICU (%) | 12,9191 (40.5) | 1,809 (24.3) | 14,7284 (37.5) |
| Time period, % total | |||
| 20032005 | 12,910 (40.5) | 3,340 (44.8) | 16,250 (41.3) |
| 20062008 | 11,205 (35.2) | 2,435 (32.7) | 13,640 (34.7) |
| 20092012 | 7,753 (24.3) | 1,677 (22.5) | 9,430 (24.0) |
Figure 2 depicts overall resistance patterns by individual drugs, drug classes, and frequently used combinations of agents. Although doripenem had the highest rate of resistance numerically (90.3%), its susceptibility was tested only in a small minority of specimens (n=31, 0.08%). Resistance to trimethoprim‐sulfamethoxazole was high (55.3%) based on a large number of samples tested (n=33,031). Conversely, colistin as an agent and polymyxins as a class exhibited the highest susceptibility rates of over 90%, though the numbers of samples tested for susceptibility to these drugs were also small (colistin n=2,086, 5.3%; polymyxins n=3,120, 7.9%) (Figure 2). Among commonly used drug combinations, carbapenem+aminoglycoside (18.0%) had the lowest resistance rates, and nearly 30% of all AB specimens tested met the criteria for MDR.
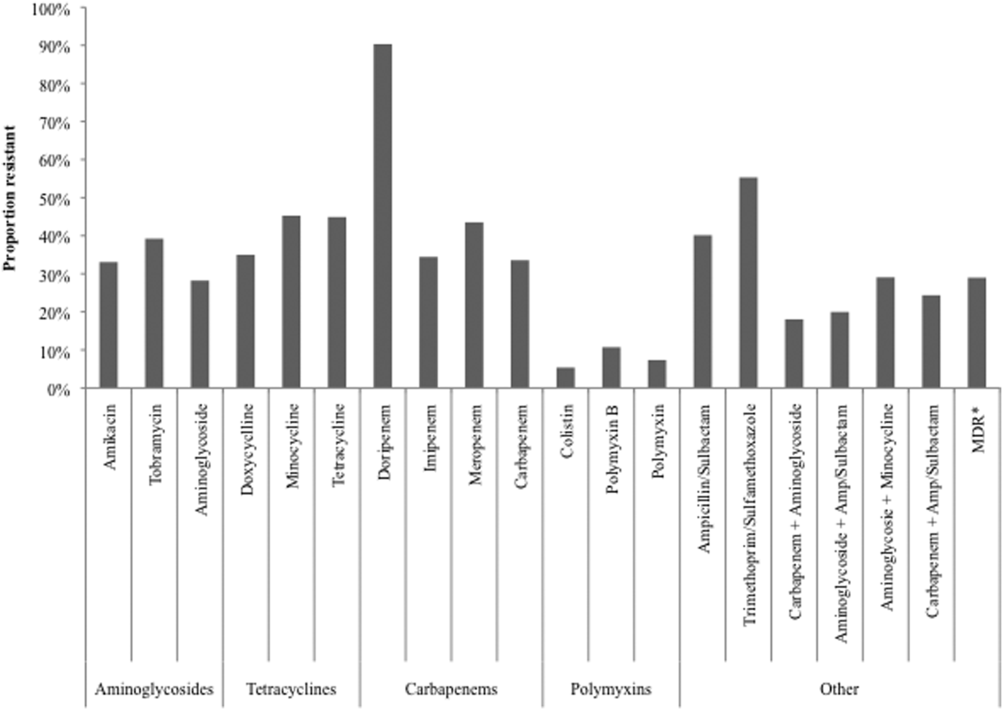
Over time, resistance to carbapenems more‐than doubled, from 21.0% in 2003 to 2005 to 47.9% in 2009 to 2012 (Table 2). Although relatively few samples were tested for colistin susceptibility (n=2,086, 5.3%), resistance to this drug also more than doubled from 2.8% (95% confidence interval: 1.9‐4.2) in 2006 to 2008 to 6.9% (95% confidence interval: 5.7‐8.2) in 2009 to 2012. As a class, however, polymyxins exhibited stable resistance rates over the time frame of the study (Table 2). Prevalence of MDR AB rose from 21.4% in 2003 to 2005 to 33.7% in 2006 to 2008, and remained stable at 35.2% in 2009 to 2012. Resistance to even such broad combinations as carbapenem+ampicillin/sulbactam nearly tripled from 13.2% in 2003 to 2005 to 35.5% in 2009 to 2012. Notably, between 2003 and 2012, although resistance rates either rose or remained stable to all other agents, those to minocycline diminished from 56.5% in 2003 to 2005 to 36.6% in 2006 to 2008 to 30.5% in 2009 to 2012. (See Supporting Table 1 in the online version of this article for time trends based on whether they represented respiratory or BSI specimens, with directionally similar trends in both.)
| Drug/Combination | Time Period | ||||||||
|---|---|---|---|---|---|---|---|---|---|
| 20032005 | 20062008 | 20092012 | |||||||
| Na | %b | 95% CI | N | % | 95% CI | N | % | 95% CI | |
| |||||||||
| Amikacin | 12,949 | 25.2 | 24.5‐26.0 | 10.929 | 35.2 | 34.3‐36.1 | 6,292 | 45.7 | 44.4‐46.9 |
| Tobramycin | 14,549 | 37.1 | 36.3‐37.9 | 11,877 | 41.9 | 41.0‐42.8 | 7,901 | 39.2 | 38.1‐40.3 |
| Aminoglycoside | 14,505 | 22.5 | 21.8‐23.2 | 11,967 | 30.6 | 29.8‐31.4 | 7,736 | 34.8 | 33.8‐35.8 |
| Doxycycline | 173 | 36.4 | 29.6‐43.8 | 38 | 29.0 | 17.0‐44.8 | 32 | 34.4 | 20.4‐51.7 |
| Minocycline | 1,388 | 56.5 | 53.9‐50.1 | 902 | 36.6 | 33.5‐39.8 | 522 | 30.5 | 26.7‐34.5 |
| Tetracycline | 1,511 | 55.4 | 52.9‐57.9 | 940 | 36.3 | 33.3‐39.4 | 546 | 30.8 | 27.0‐34.8 |
| Doripenem | NR | NR | NR | 9 | 77.8 | 45.3‐93.7 | 22 | 95.5 | 78.2‐99.2 |
| Imipenem | 14,728 | 21.8 | 21.2‐22.5 | 12,094 | 40.3 | 39.4‐41.2 | 6,681 | 51.7 | 50.5‐52.9 |
| Meropenem | 7,226 | 37.0 | 35.9‐38.1 | 5,628 | 48.7 | 47.3‐50.0 | 4,919 | 47.3 | 45.9‐48.7 |
| Carbapenem | 15,490 | 21.0 | 20.4‐21.7 | 12,975 | 38.8 | 38.0‐39.7 | 8,778 | 47.9 | 46.9‐49.0 |
| Ampicillin/sulbactam | 10,525 | 35.2 | 34.3‐36.2 | 9,413 | 44.9 | 43.9‐45.9 | 6,460 | 41.2 | 40.0‐42.4 |
| Colistin | NR | NR | NR | 783 | 2.8 | 1.9‐4.2 | 1,303 | 6.9 | 5.7‐8.2 |
| Polymyxin B | 105 | 7.6 | 3.9‐14.3 | 796 | 12.8 | 10.7‐15.3 | 321 | 6.5 | 4.3‐9.6 |
| Polymyxin | 105 | 7.6 | 3.9‐14.3 | 1,563 | 7.9 | 6.6‐9.3 | 1,452 | 6.8 | 5.6‐8.2 |
| Trimethoprim/sulfamethoxazole | 13,640 | 52.5 | 51.7‐53.3 | 11,535 | 57.1 | 56.2‐58.0 | 7,856 | 57.6 | 56.5‐58.7 |
| MDRc | 16,249 | 21.4 | 20.7‐22.0 | 13,640 | 33.7 | 33.0‐34.5 | 9,431 | 35.2 | 34.2‐36.2 |
| Carbapenem+aminoglycoside | 14,601 | 8.9 | 8.5‐9.4 | 12,333 | 21.3 | 20.6‐22.0 | 8,256 | 29.3 | 28.3‐30.3 |
| Aminoglycoside+ampicillin/sulbactam | 10,107 | 12.9 | 12.3‐13.6 | 9,077 | 24.9 | 24.0‐25.8 | 6,200 | 24.3 | 23.2‐25.3 |
| Aminoglycosie+minocycline | 1,359 | 35.6 | 33.1‐38.2 | 856 | 21.4 | 18.8‐24.2 | 503 | 24.5 | 20.9‐28.4 |
| Carbapenem+ampicillin/sulbactam | 10,228 | 13.2 | 12.5‐13.9 | 9,145 | 29.4 | 28.4‐30.3 | 6,143 | 35.5 | 34.3‐36.7 |
Regionally, examining resistance by classes and combinations of antibiotics, trimethoprim‐sulfamethoxazole exhibited consistently the highest rates of resistance, ranging from the lowest in the New England (28.8%) to the highest in the East North Central (69.9%) Census divisions (See Supporting Table 2 in the online version of this article). The rates of resistance to tetracyclines ranged from 0.0% in New England to 52.6% in the Mountain division, and to polymyxins from 0.0% in the East South Central division to 23.4% in New England. Generally, New England enjoyed the lowest rates of resistance (0.0% to tetracyclines to 28.8% to trimethoprim‐sulfamethoxazole), and the Mountain division the highest (0.9% to polymyxins to 52.6% to tetracyclines). The rates of MDR AB ranged from 8.0% in New England to 50.4% in the Mountain division (see Supporting Table 2 in the online version of this article).
Examining resistances to drug classes and combinations by the location of the source specimen revealed that trimethoprim‐sulfamethoxazole once again exhibited the highest rate of resistance across all locations (see Supporting Table 3 in the online version of this article). Despite their modest contribution to the overall sample pool (n=967, 2.5%), organisms from nursing home subjects had the highest prevalence of resistance to aminoglycosides (36.3%), tetracyclines (57.1%), and carbapenems (47.1%). This pattern held true for combination regimens examined. Nursing homes also vastly surpassed other locations in the rates of MDR AB (46.5%). Interestingly, the rates of MDR did not differ substantially among regular inpatient wards (29.2%), the ICU (28.7%), and outpatient locations (26.2%) (see Supporting Table 3 in the online version of this article).
DISCUSSION
In this large multicenter survey we have documented the rising rates of AB resistance to clinically important antimicrobials in the United States. On the whole, all antimicrobials, except for minocycline, exhibited either large or small increases in resistance. Alarmingly, even colistin, a true last resort AB treatment, lost a considerable amount of activity against AB, with the resistance rate rising from 2.8% in 2006 to 2008 to 6.9% in 2009 to 2012. The single encouraging trend that we observed was that resistance to minocycline appeared to diminish substantially, going from over one‐half of all AB tested in 2003 to 2005 to just under one‐third in 2009 to 2012.
Although we did note a rise in the MDR AB, our data suggest a lower percentage of all AB that meets the MDR phenotype criteria compared to reports by other groups. For example, the Center for Disease Dynamics and Economic Policy (CDDEP), analyzing the same data as our study, reports a rise in MDR AB from 32.1% in 1999 to 51.0% in 2010.[23] This discrepancy is easily explained by the fact that we included polymyxins, tetracyclines, and trimethoprim‐sulfamethoxazole in our evaluation, whereas the CDDEP did not examine these agents. Furthermore, we omitted fluoroquinolones, a drug class with high rates of resistance, from our study, because we were interested in focusing only on antimicrobials with clinical data in AB infections.[22] In addition, we limited our evaluation to specimens derived from respiratory or BSI sources, whereas the CDDEP data reflect any AB isolate present in TSN.
We additionally confirm that there is substantial geographic variation in resistance patterns. Thus, despite different definitions, our data agree with those from the CDDEP that the MDR prevalence is highest in the Mountain and East North Central divisions, and lowest in New England overall.[23] The wide variations underscore the fact that it is not valid to speak of national rates of resistance, but rather it is important to concentrate on the local patterns. This information, though important from the macroepidemiologic standpoint, is likely still not granular enough to help clinicians make empiric treatment decisions. In fact, what is needed for that is real‐time antibiogram data specific to each center and even each unit within each center.
The latter point is further illustrated by our analysis of locations of origin of the specimens. In this analysis, we discovered that, contrary to the common presumption that the ICU has the highest rate of resistant organisms, specimens derived from nursing homes represent perhaps the most intensely resistant organisms. In other words, the nursing home is the setting most likely to harbor patients with respiratory infections and BSIs caused by resistant AB. These data are in agreement with several other recent investigations. In a period‐prevalence survey conducted in the state of Maryland in 2009 by Thom and colleagues, long‐term care facilities were found to have the highest prevalence of any AB, and also those resistant to imipenem, MDR, and extensively drug‐resistant organisms.[24] Mortensen and coworkers confirmed the high prevalence of AB and AB resistance in long‐term care facilities, and extended this finding to suggest that there is evidence for intra‐ and interhospital spread of these pathogens.[25] Our data confirm this concerning finding at the national level, and point to a potential area of intervention for infection prevention.
An additional finding of some concern is that the highest proportion of colistin resistance among those specimens, whose location of origin was reported in the database, was the outpatient setting (6.6% compared to 5.4% in the ICU specimens, for example). Although these infections would likely meet the definition for healthcare‐associated infection, AB as a community‐acquired respiratory pathogen is not unprecedented either in the United States or abroad.[26, 27, 28, 29, 30] It is, however, reassuring that most other antimicrobials examined in our study exhibit higher rates of susceptibility in the specimens derived from the outpatient settings than either from the hospital or the nursing home.
Our study has a number of strengths. As a large multicenter survey, it is representative of AB susceptibility patterns across the United States, which makes it highly generalizable. We focused on antibiotics for which clinical evidence is available, thus adding a practical dimension to the results. Another pragmatic consideration is examining the data by geographic distributions, allowing an additional layer of granularity for clinical decisions. At the same time it suffers from some limitations. The TSN database consists of microbiology samples from hospital laboratories. Although we attempted to reduce the risk of duplication, because of how samples are numbered in the database, repeat sampling remains a possibility. Despite having stratified the data by geography and the location of origin of the specimen, it is likely not granular enough for local risk stratification decisions clinicians make daily about the choices of empiric therapy. Some of the MIC breakpoints have changed over the period of the study (see Supporting Table 4 in the online version of this article). Because these changes occurred in the last year of data collection (2012), they should have had only a minimal, if any, impact on the observed rates of resistance in the time frame examined. Additionally, because resistance rates evolve rapidly, more current data are required for effective clinical decision making.
In summary, we have demonstrated that the last decade has seen an alarming increase in the rate of resistance of AB to multiple clinically important antimicrobial agents and classes. We have further emphasized the importance of granularity in susceptibility data to help clinicians make sensible decisions about empiric therapy in hospitalized patients with serious infections. Finally, and potentially most disturbingly, the nursing home as a location appears to be a robust reservoir for spread for resistant AB. All of these observations highlight the urgent need to develop novel antibiotics and nontraditional agents, such as antibodies and vaccines, to combat AB infections, in addition to having important infection prevention implications if we are to contain the looming threat of the end of antibiotics.[31]
Disclosure
This study was funded by a grant from Tetraphase Pharmaceuticals, Watertown, MA.
- National Nosocomial Infections Surveillance (NNIS) System Report. Am J Infect Control. 2004;32:470–485.
- , , , National surveillance of antimicrobial resistance in Pseudomonas aeruginosa isolates obtained from intensive care unit patients from 1993 to 2002. Antimicrob Agents Chemother. 2004;48:4606–4610.
- , , , et al. Health care‐associated pneumonia and community‐acquired pneumonia: a single‐center experience. Antimicrob Agents Chemother. 2007;51:3568–3573.
- , , , et al. Clinical importance of delays in the initiation of appropriate antibiotic treatment for ventilator‐associated pneumonia. Chest. 2002;122:262–268.
- ; ICU‐Acquired Pneumonia Study Group. Modification of empiric antibiotic treatment in patients with pneumonia acquired in the intensive care unit. Intensive Care Med. 1996;22:387–394.
- , , , , Antimicrobial therapy escalation and hospital mortality among patients with HCAP: a single center experience. Chest. 2008:134:963–968.
- , , , et al. Surviving Sepsis Campaign: international guidelines for management of severe sepsis and septic shock: 2008. Crit Care Med. 2008;36:296–327.
- , , , , , Inappropriate antibiotic therapy in Gram‐negative sepsis increases hospital length of stay. Crit Care Med. 2011;39:46–51.
- , , , Inadequate antimicrobial treatment of infections: a risk factor for hospital mortality among critically ill patients. Chest. 1999;115:462–474.
- Centers for Disease Control and Prevention. Antibiotic resistance threats in the United States, 2013. Available at: http://www.cdc.gov/drugresistance/threat-report-2013/pdf/ar-threats-2013-508.pdf#page=59. Accessed December 29, 2014.
- , , , et al.; National Healthcare Safety Network (NHSN) Team and Participating NHSN Facilities. Antimicrobial‐resistant pathogens associated with healthcare‐associated infections: summary of data reported to the National Healthcare Safety Network at the Centers for Disease Control and Prevention, 2009–2010. Infect Control Hosp Epidemiol. 2013;34:1–14.
- , , , , Multi‐drug resistance, inappropriate initial antibiotic therapy and mortality in Gram‐negative severe sepsis and septic shock: a retrospective cohort study. Crit Care. 2014;18(6):596.
- , , , , , Global challenge of multidrug‐resistant Acinetobacter baumannii. Antimicrob Agents Chemother. 2007;51:3471–3484.
- , , , Predictors of hospital mortality among septic ICU patients with Acinetobacter spp. bacteremia: a cohort study. BMC Infect Dis. 2014;14:572.
- , Treatment of Acinetobacter infections. Clin Infect Dis. 2010;51:79–84.
- , , Increasing resistance of Acinetobacter species to imipenem in United States hospitals, 1999–2006. Infect Control Hosp Epidemiol. 2010;31:196–197.
- , , , , Trends in resistance to carbapenems and third‐generation cephalosporins among clinical isolates of Klebsiella pneumoniae in the United States, 1999–2010. Infect Control Hosp Epidemiol. 2013;34:259–268.
- , , Antimicrobial resistance in key bloodstream bacterial isolates: electronic surveillance with the Surveillance Network Database—USA. Clin Infect Dis. 1999;29:259–263.
- , , Community‐associated methicillin‐resistant Staphylococcus aureus in outpatients, United States, 1999–2006. Emerg Infect Dis. 2009;15:1925–1930.
- , , , , Prevalence of antimicrobial resistance in bacteria isolated from central nervous system specimens as reported by U.S. hospital laboratories from 2000 to 2002. Ann Clin Microbiol Antimicrob. 2004;3:3.
- Performance standards for antimicrobial susceptibility testing: twenty‐second informational supplement. CLSI document M100‐S22. Wayne, PA: Clinical and Laboratory Standards Institute; 2012.
- , , , et al. Multidrug‐resistant, extensively drug‐resistant and pandrug‐resistant bacteria: an international expert proposal for interim standard definitions for acquired resistance. Clin Microbiol Infect. 2012;18:268–281.
- CDDEP: The Center for Disease Dynamics, Economics and Policy. Resistance map: Acinetobacter baumannii overview. Available at: http://www.cddep.org/projects/resistance_map/acinetobacter_baumannii_overview. Accessed January 16, 2015.
- , , , et al.; Maryland MDRO Prevention Collaborative. Assessing the burden of Acinetobacter baumannii in Maryland: a statewide cross‐sectional period prevalence survey. Infect Control Hosp Epidemiol. 2012;33:883–888.
- , , , et al. Multidrug‐resistant Acinetobacter baumannii infection, colonization, and transmission related to a long‐term care facility providing subacute care. Infect Control Hosp Epidemiol. 2014;35:406–411.
- , , , , , Severe community‐acquired pneumonia due to Acinetobacter baumannii. Chest. 2001;120:1072–1077.
- , , , , , Fulminant community‐acquired Acinetobacter baumannii pneumonia as distinct clinical syndrome. Chest. 2006;129:102–109.
- , , , Community‐acquired Acinetobacter baumannii pneumonia. Rev Clin Esp. 2003;203:284–286.
- , , , et al. Antimicrobial drug‐resistant microbes associated with hospitalized community‐acquired and healthcare‐associated pneumonia: a multi‐center study in Taiwan. J Formos Med Assoc. 2013;112:31–40.
- , , , , Antimicrobial resistance in Hispanic patients hospitalized in San Antonio, TX with community‐acquired pneumonia. Hosp Pract (1995). 2010;38:108–113.
- Centers for Disease Control and Prevention. CDC director blog. The end of antibiotics. Can we come back from the brink? Available at: http://blogs.cdc.gov/cdcdirector/2014/05/05/the-end-of-antibiotics-can-we-come-back-from-the-brink/. Published May 5, 2014. Accessed January 16, 2015.
Among hospitalized patients with serious infections, the choice of empiric therapy plays a key role in outcomes.[1, 2, 3, 4, 5, 6, 7, 8, 9] Rising rates and variable patterns of antimicrobial resistance, however, complicate selecting appropriate empiric therapy. Amidst this shifting landscape of resistance to antimicrobials, gram‐negative bacteria and specifically Acinetobacter baumannii (AB), remain a considerable challenge.[10] On the one hand, AB is a less‐frequent cause of serious infections than organisms like Pseudomonas aeruginosa or Enterobacteriaceae in severely ill hospitalized patients.[11, 12] On the other, AB has evolved a variety of resistance mechanisms and exhibits unpredictable susceptibility patterns.[13] These factors combine to increase the likelihood of administering inappropriate empiric therapy when faced with an infection caused by AB and, thereby, raising the risk of death.[14] The fact that clinicians may not routinely consider AB as the potential culprit pathogen in the patient they are treating along with this organism's highly in vitro resistant nature, may result in routine gram‐negative coverage being frequently inadequate for AB infections.
To address the poor outcomes related to inappropriate empiric therapy in the setting of AB, one requires an appreciation of the longitudinal changes and geographic differences in the susceptibility of this pathogen. Thus, we aimed to examine secular trends in the resistance of AB to antimicrobial agents whose effectiveness against this microorganism was well supported in the literature during the study timeframe.[15]
METHODS
To determine the prevalence of predefined resistance patterns among AB in respiratory and blood stream infection (BSI) specimens, we examined The Surveillance Network (TSN) database from Eurofins. We explored data collected between years 2003 and 2012. The database has been used extensively for surveillance purposes since 1994, and has previously been described in detail.[16, 17, 18, 19, 20] Briefly, TSN is a warehouse of routine clinical microbiology data collected from a nationally representative sample of microbiology laboratories in 217 hospitals in the United States. To minimize selection bias, laboratories are included based on their geography and the demographics of the populations they serve.[18] Only clinically significant samples are reported. No personal identifying information for source patients is available in this database. Only source laboratories that perform antimicrobial susceptibility testing according standard Food and Drug Administrationapproved testing methods and that interpret susceptibility in accordance with the Clinical Laboratory Standards Institute breakpoints are included.[21] (See Supporting Table 4 in the online version of this article for minimum inhibitory concentration (MIC) changes over the course of the studycurrent colistin and polymyxin breakpoints applied retrospectively). All enrolled laboratories undergo a pre‐enrollment site visit. Logical filters are used for routine quality control to detect unusual susceptibility profiles and to ensure appropriate testing methods. Repeat testing and reporting are done as necessary.[18]
Laboratory samples are reported as susceptible, intermediate, or resistant. We grouped isolates with intermediate MICs together with the resistant ones for the purposes of the current analysis. Duplicate isolates were excluded. Only samples representing 1 of the 2 infections of interest, respiratory or BSI, were included.
We examined 3 time periods2003 to 2005, 2006 to 2008, and 2009 to 2012for the prevalence of AB's resistance to the following antibiotics: carbapenems (imipenem, meropenem, doripenem), aminoglycosides (tobramycin, amikacin), tetracyclines (minocycline, doxycycline), polymyxins (colistin, polymyxin B), ampicillin‐sulbactam, and trimethoprim‐sulfamethoxazole. Antimicrobial resistance was defined by the designation of intermediate or resistant in the susceptibility category. Resistance to a class of antibiotics was defined as resistance to all drugs within the class for which testing was available. The organism was multidrug resistant (MDR) if it was resistant to at least 1 antimicrobial in at least 3 drug classes examined.[22] Resistance to a combination of 2 drugs was present if the specimen was resistant to both of the drugs in the combination for which testing was available. We examined the data by infection type, time period, the 9 US Census divisions, and location of origin of the sample.
All categorical variables are reported as percentages. Continuous variables are reported as meansstandard deviations and/or medians with the interquartile range (IQR). We did not pursue hypothesis testing due to a high risk of type I error in this large dataset. Therefore, only clinically important trends are highlighted.
RESULTS
Among the 39,320 AB specimens, 81.1% were derived from a respiratory source and 18.9% represented BSI. Demographics of source patients are listed in Table 1. Notably, the median age of those with respiratory infection (58 years; IQR 38, 73) was higher than among patients with BSI (54.5 years; IQR 36, 71), and there were proportionally fewer females among respiratory patients (39.9%) than those with BSI (46.0%). Though only 24.3% of all BSI samples originated from the intensive are unit (ICU), 40.5% of respiratory specimens came from that location. The plurality of all specimens was collected in the 2003 to 2005 time interval (41.3%), followed by 2006 to 2008 (34.7%), with a minority coming from years 2009 to 2012 (24.0%). The proportions of collected specimens from respiratory and BSI sources were similar in all time periods examined (Table 1). Geographically, the South Atlantic division contributed the most samples (24.1%) and East South Central the fewest (2.6%) (Figure 1). The vast majority of all samples came from hospital wards (78.6%), where roughly one‐half originated in the ICU (37.5%). Fewer still came from outpatient sources (18.3%), and a small minority (2.5%) from nursing homes.
| Pneumonia | BSI | All | |
|---|---|---|---|
| |||
| Total, N (%) | 31,868 (81.1) | 7,452 (18.9) | 39,320 |
| Age, y | |||
| Mean (SD) | 57.7 (37.4) | 57.6 (40.6) | 57.7 (38.0) |
| Median (IQR 25, 75) | 58 (38, 73) | 54.5 (36, 71) | 57 (37, 73) |
| Gender, female (%) | 12,725 (39.9) | 3,425 (46.0) | 16,150 (41.1) |
| ICU (%) | 12,9191 (40.5) | 1,809 (24.3) | 14,7284 (37.5) |
| Time period, % total | |||
| 20032005 | 12,910 (40.5) | 3,340 (44.8) | 16,250 (41.3) |
| 20062008 | 11,205 (35.2) | 2,435 (32.7) | 13,640 (34.7) |
| 20092012 | 7,753 (24.3) | 1,677 (22.5) | 9,430 (24.0) |
Figure 2 depicts overall resistance patterns by individual drugs, drug classes, and frequently used combinations of agents. Although doripenem had the highest rate of resistance numerically (90.3%), its susceptibility was tested only in a small minority of specimens (n=31, 0.08%). Resistance to trimethoprim‐sulfamethoxazole was high (55.3%) based on a large number of samples tested (n=33,031). Conversely, colistin as an agent and polymyxins as a class exhibited the highest susceptibility rates of over 90%, though the numbers of samples tested for susceptibility to these drugs were also small (colistin n=2,086, 5.3%; polymyxins n=3,120, 7.9%) (Figure 2). Among commonly used drug combinations, carbapenem+aminoglycoside (18.0%) had the lowest resistance rates, and nearly 30% of all AB specimens tested met the criteria for MDR.
Over time, resistance to carbapenems more‐than doubled, from 21.0% in 2003 to 2005 to 47.9% in 2009 to 2012 (Table 2). Although relatively few samples were tested for colistin susceptibility (n=2,086, 5.3%), resistance to this drug also more than doubled from 2.8% (95% confidence interval: 1.9‐4.2) in 2006 to 2008 to 6.9% (95% confidence interval: 5.7‐8.2) in 2009 to 2012. As a class, however, polymyxins exhibited stable resistance rates over the time frame of the study (Table 2). Prevalence of MDR AB rose from 21.4% in 2003 to 2005 to 33.7% in 2006 to 2008, and remained stable at 35.2% in 2009 to 2012. Resistance to even such broad combinations as carbapenem+ampicillin/sulbactam nearly tripled from 13.2% in 2003 to 2005 to 35.5% in 2009 to 2012. Notably, between 2003 and 2012, although resistance rates either rose or remained stable to all other agents, those to minocycline diminished from 56.5% in 2003 to 2005 to 36.6% in 2006 to 2008 to 30.5% in 2009 to 2012. (See Supporting Table 1 in the online version of this article for time trends based on whether they represented respiratory or BSI specimens, with directionally similar trends in both.)
| Drug/Combination | Time Period | ||||||||
|---|---|---|---|---|---|---|---|---|---|
| 20032005 | 20062008 | 20092012 | |||||||
| Na | %b | 95% CI | N | % | 95% CI | N | % | 95% CI | |
| |||||||||
| Amikacin | 12,949 | 25.2 | 24.5‐26.0 | 10.929 | 35.2 | 34.3‐36.1 | 6,292 | 45.7 | 44.4‐46.9 |
| Tobramycin | 14,549 | 37.1 | 36.3‐37.9 | 11,877 | 41.9 | 41.0‐42.8 | 7,901 | 39.2 | 38.1‐40.3 |
| Aminoglycoside | 14,505 | 22.5 | 21.8‐23.2 | 11,967 | 30.6 | 29.8‐31.4 | 7,736 | 34.8 | 33.8‐35.8 |
| Doxycycline | 173 | 36.4 | 29.6‐43.8 | 38 | 29.0 | 17.0‐44.8 | 32 | 34.4 | 20.4‐51.7 |
| Minocycline | 1,388 | 56.5 | 53.9‐50.1 | 902 | 36.6 | 33.5‐39.8 | 522 | 30.5 | 26.7‐34.5 |
| Tetracycline | 1,511 | 55.4 | 52.9‐57.9 | 940 | 36.3 | 33.3‐39.4 | 546 | 30.8 | 27.0‐34.8 |
| Doripenem | NR | NR | NR | 9 | 77.8 | 45.3‐93.7 | 22 | 95.5 | 78.2‐99.2 |
| Imipenem | 14,728 | 21.8 | 21.2‐22.5 | 12,094 | 40.3 | 39.4‐41.2 | 6,681 | 51.7 | 50.5‐52.9 |
| Meropenem | 7,226 | 37.0 | 35.9‐38.1 | 5,628 | 48.7 | 47.3‐50.0 | 4,919 | 47.3 | 45.9‐48.7 |
| Carbapenem | 15,490 | 21.0 | 20.4‐21.7 | 12,975 | 38.8 | 38.0‐39.7 | 8,778 | 47.9 | 46.9‐49.0 |
| Ampicillin/sulbactam | 10,525 | 35.2 | 34.3‐36.2 | 9,413 | 44.9 | 43.9‐45.9 | 6,460 | 41.2 | 40.0‐42.4 |
| Colistin | NR | NR | NR | 783 | 2.8 | 1.9‐4.2 | 1,303 | 6.9 | 5.7‐8.2 |
| Polymyxin B | 105 | 7.6 | 3.9‐14.3 | 796 | 12.8 | 10.7‐15.3 | 321 | 6.5 | 4.3‐9.6 |
| Polymyxin | 105 | 7.6 | 3.9‐14.3 | 1,563 | 7.9 | 6.6‐9.3 | 1,452 | 6.8 | 5.6‐8.2 |
| Trimethoprim/sulfamethoxazole | 13,640 | 52.5 | 51.7‐53.3 | 11,535 | 57.1 | 56.2‐58.0 | 7,856 | 57.6 | 56.5‐58.7 |
| MDRc | 16,249 | 21.4 | 20.7‐22.0 | 13,640 | 33.7 | 33.0‐34.5 | 9,431 | 35.2 | 34.2‐36.2 |
| Carbapenem+aminoglycoside | 14,601 | 8.9 | 8.5‐9.4 | 12,333 | 21.3 | 20.6‐22.0 | 8,256 | 29.3 | 28.3‐30.3 |
| Aminoglycoside+ampicillin/sulbactam | 10,107 | 12.9 | 12.3‐13.6 | 9,077 | 24.9 | 24.0‐25.8 | 6,200 | 24.3 | 23.2‐25.3 |
| Aminoglycosie+minocycline | 1,359 | 35.6 | 33.1‐38.2 | 856 | 21.4 | 18.8‐24.2 | 503 | 24.5 | 20.9‐28.4 |
| Carbapenem+ampicillin/sulbactam | 10,228 | 13.2 | 12.5‐13.9 | 9,145 | 29.4 | 28.4‐30.3 | 6,143 | 35.5 | 34.3‐36.7 |
Regionally, examining resistance by classes and combinations of antibiotics, trimethoprim‐sulfamethoxazole exhibited consistently the highest rates of resistance, ranging from the lowest in the New England (28.8%) to the highest in the East North Central (69.9%) Census divisions (See Supporting Table 2 in the online version of this article). The rates of resistance to tetracyclines ranged from 0.0% in New England to 52.6% in the Mountain division, and to polymyxins from 0.0% in the East South Central division to 23.4% in New England. Generally, New England enjoyed the lowest rates of resistance (0.0% to tetracyclines to 28.8% to trimethoprim‐sulfamethoxazole), and the Mountain division the highest (0.9% to polymyxins to 52.6% to tetracyclines). The rates of MDR AB ranged from 8.0% in New England to 50.4% in the Mountain division (see Supporting Table 2 in the online version of this article).
Examining resistances to drug classes and combinations by the location of the source specimen revealed that trimethoprim‐sulfamethoxazole once again exhibited the highest rate of resistance across all locations (see Supporting Table 3 in the online version of this article). Despite their modest contribution to the overall sample pool (n=967, 2.5%), organisms from nursing home subjects had the highest prevalence of resistance to aminoglycosides (36.3%), tetracyclines (57.1%), and carbapenems (47.1%). This pattern held true for combination regimens examined. Nursing homes also vastly surpassed other locations in the rates of MDR AB (46.5%). Interestingly, the rates of MDR did not differ substantially among regular inpatient wards (29.2%), the ICU (28.7%), and outpatient locations (26.2%) (see Supporting Table 3 in the online version of this article).
DISCUSSION
In this large multicenter survey we have documented the rising rates of AB resistance to clinically important antimicrobials in the United States. On the whole, all antimicrobials, except for minocycline, exhibited either large or small increases in resistance. Alarmingly, even colistin, a true last resort AB treatment, lost a considerable amount of activity against AB, with the resistance rate rising from 2.8% in 2006 to 2008 to 6.9% in 2009 to 2012. The single encouraging trend that we observed was that resistance to minocycline appeared to diminish substantially, going from over one‐half of all AB tested in 2003 to 2005 to just under one‐third in 2009 to 2012.
Although we did note a rise in the MDR AB, our data suggest a lower percentage of all AB that meets the MDR phenotype criteria compared to reports by other groups. For example, the Center for Disease Dynamics and Economic Policy (CDDEP), analyzing the same data as our study, reports a rise in MDR AB from 32.1% in 1999 to 51.0% in 2010.[23] This discrepancy is easily explained by the fact that we included polymyxins, tetracyclines, and trimethoprim‐sulfamethoxazole in our evaluation, whereas the CDDEP did not examine these agents. Furthermore, we omitted fluoroquinolones, a drug class with high rates of resistance, from our study, because we were interested in focusing only on antimicrobials with clinical data in AB infections.[22] In addition, we limited our evaluation to specimens derived from respiratory or BSI sources, whereas the CDDEP data reflect any AB isolate present in TSN.
We additionally confirm that there is substantial geographic variation in resistance patterns. Thus, despite different definitions, our data agree with those from the CDDEP that the MDR prevalence is highest in the Mountain and East North Central divisions, and lowest in New England overall.[23] The wide variations underscore the fact that it is not valid to speak of national rates of resistance, but rather it is important to concentrate on the local patterns. This information, though important from the macroepidemiologic standpoint, is likely still not granular enough to help clinicians make empiric treatment decisions. In fact, what is needed for that is real‐time antibiogram data specific to each center and even each unit within each center.
The latter point is further illustrated by our analysis of locations of origin of the specimens. In this analysis, we discovered that, contrary to the common presumption that the ICU has the highest rate of resistant organisms, specimens derived from nursing homes represent perhaps the most intensely resistant organisms. In other words, the nursing home is the setting most likely to harbor patients with respiratory infections and BSIs caused by resistant AB. These data are in agreement with several other recent investigations. In a period‐prevalence survey conducted in the state of Maryland in 2009 by Thom and colleagues, long‐term care facilities were found to have the highest prevalence of any AB, and also those resistant to imipenem, MDR, and extensively drug‐resistant organisms.[24] Mortensen and coworkers confirmed the high prevalence of AB and AB resistance in long‐term care facilities, and extended this finding to suggest that there is evidence for intra‐ and interhospital spread of these pathogens.[25] Our data confirm this concerning finding at the national level, and point to a potential area of intervention for infection prevention.
An additional finding of some concern is that the highest proportion of colistin resistance among those specimens, whose location of origin was reported in the database, was the outpatient setting (6.6% compared to 5.4% in the ICU specimens, for example). Although these infections would likely meet the definition for healthcare‐associated infection, AB as a community‐acquired respiratory pathogen is not unprecedented either in the United States or abroad.[26, 27, 28, 29, 30] It is, however, reassuring that most other antimicrobials examined in our study exhibit higher rates of susceptibility in the specimens derived from the outpatient settings than either from the hospital or the nursing home.
Our study has a number of strengths. As a large multicenter survey, it is representative of AB susceptibility patterns across the United States, which makes it highly generalizable. We focused on antibiotics for which clinical evidence is available, thus adding a practical dimension to the results. Another pragmatic consideration is examining the data by geographic distributions, allowing an additional layer of granularity for clinical decisions. At the same time it suffers from some limitations. The TSN database consists of microbiology samples from hospital laboratories. Although we attempted to reduce the risk of duplication, because of how samples are numbered in the database, repeat sampling remains a possibility. Despite having stratified the data by geography and the location of origin of the specimen, it is likely not granular enough for local risk stratification decisions clinicians make daily about the choices of empiric therapy. Some of the MIC breakpoints have changed over the period of the study (see Supporting Table 4 in the online version of this article). Because these changes occurred in the last year of data collection (2012), they should have had only a minimal, if any, impact on the observed rates of resistance in the time frame examined. Additionally, because resistance rates evolve rapidly, more current data are required for effective clinical decision making.
In summary, we have demonstrated that the last decade has seen an alarming increase in the rate of resistance of AB to multiple clinically important antimicrobial agents and classes. We have further emphasized the importance of granularity in susceptibility data to help clinicians make sensible decisions about empiric therapy in hospitalized patients with serious infections. Finally, and potentially most disturbingly, the nursing home as a location appears to be a robust reservoir for spread for resistant AB. All of these observations highlight the urgent need to develop novel antibiotics and nontraditional agents, such as antibodies and vaccines, to combat AB infections, in addition to having important infection prevention implications if we are to contain the looming threat of the end of antibiotics.[31]
Disclosure
This study was funded by a grant from Tetraphase Pharmaceuticals, Watertown, MA.
- National Nosocomial Infections Surveillance (NNIS) System Report. Am J Infect Control. 2004;32:470–485.
- , , , National surveillance of antimicrobial resistance in Pseudomonas aeruginosa isolates obtained from intensive care unit patients from 1993 to 2002. Antimicrob Agents Chemother. 2004;48:4606–4610.
- , , , et al. Health care‐associated pneumonia and community‐acquired pneumonia: a single‐center experience. Antimicrob Agents Chemother. 2007;51:3568–3573.
- , , , et al. Clinical importance of delays in the initiation of appropriate antibiotic treatment for ventilator‐associated pneumonia. Chest. 2002;122:262–268.
- ; ICU‐Acquired Pneumonia Study Group. Modification of empiric antibiotic treatment in patients with pneumonia acquired in the intensive care unit. Intensive Care Med. 1996;22:387–394.
- , , , , Antimicrobial therapy escalation and hospital mortality among patients with HCAP: a single center experience. Chest. 2008:134:963–968.
- , , , et al. Surviving Sepsis Campaign: international guidelines for management of severe sepsis and septic shock: 2008. Crit Care Med. 2008;36:296–327.
- , , , , , Inappropriate antibiotic therapy in Gram‐negative sepsis increases hospital length of stay. Crit Care Med. 2011;39:46–51.
- , , , Inadequate antimicrobial treatment of infections: a risk factor for hospital mortality among critically ill patients. Chest. 1999;115:462–474.
- Centers for Disease Control and Prevention. Antibiotic resistance threats in the United States, 2013. Available at: http://www.cdc.gov/drugresistance/threat-report-2013/pdf/ar-threats-2013-508.pdf#page=59. Accessed December 29, 2014.
- , , , et al.; National Healthcare Safety Network (NHSN) Team and Participating NHSN Facilities. Antimicrobial‐resistant pathogens associated with healthcare‐associated infections: summary of data reported to the National Healthcare Safety Network at the Centers for Disease Control and Prevention, 2009–2010. Infect Control Hosp Epidemiol. 2013;34:1–14.
- , , , , Multi‐drug resistance, inappropriate initial antibiotic therapy and mortality in Gram‐negative severe sepsis and septic shock: a retrospective cohort study. Crit Care. 2014;18(6):596.
- , , , , , Global challenge of multidrug‐resistant Acinetobacter baumannii. Antimicrob Agents Chemother. 2007;51:3471–3484.
- , , , Predictors of hospital mortality among septic ICU patients with Acinetobacter spp. bacteremia: a cohort study. BMC Infect Dis. 2014;14:572.
- , Treatment of Acinetobacter infections. Clin Infect Dis. 2010;51:79–84.
- , , Increasing resistance of Acinetobacter species to imipenem in United States hospitals, 1999–2006. Infect Control Hosp Epidemiol. 2010;31:196–197.
- , , , , Trends in resistance to carbapenems and third‐generation cephalosporins among clinical isolates of Klebsiella pneumoniae in the United States, 1999–2010. Infect Control Hosp Epidemiol. 2013;34:259–268.
- , , Antimicrobial resistance in key bloodstream bacterial isolates: electronic surveillance with the Surveillance Network Database—USA. Clin Infect Dis. 1999;29:259–263.
- , , Community‐associated methicillin‐resistant Staphylococcus aureus in outpatients, United States, 1999–2006. Emerg Infect Dis. 2009;15:1925–1930.
- , , , , Prevalence of antimicrobial resistance in bacteria isolated from central nervous system specimens as reported by U.S. hospital laboratories from 2000 to 2002. Ann Clin Microbiol Antimicrob. 2004;3:3.
- Performance standards for antimicrobial susceptibility testing: twenty‐second informational supplement. CLSI document M100‐S22. Wayne, PA: Clinical and Laboratory Standards Institute; 2012.
- , , , et al. Multidrug‐resistant, extensively drug‐resistant and pandrug‐resistant bacteria: an international expert proposal for interim standard definitions for acquired resistance. Clin Microbiol Infect. 2012;18:268–281.
- CDDEP: The Center for Disease Dynamics, Economics and Policy. Resistance map: Acinetobacter baumannii overview. Available at: http://www.cddep.org/projects/resistance_map/acinetobacter_baumannii_overview. Accessed January 16, 2015.
- , , , et al.; Maryland MDRO Prevention Collaborative. Assessing the burden of Acinetobacter baumannii in Maryland: a statewide cross‐sectional period prevalence survey. Infect Control Hosp Epidemiol. 2012;33:883–888.
- , , , et al. Multidrug‐resistant Acinetobacter baumannii infection, colonization, and transmission related to a long‐term care facility providing subacute care. Infect Control Hosp Epidemiol. 2014;35:406–411.
- , , , , , Severe community‐acquired pneumonia due to Acinetobacter baumannii. Chest. 2001;120:1072–1077.
- , , , , , Fulminant community‐acquired Acinetobacter baumannii pneumonia as distinct clinical syndrome. Chest. 2006;129:102–109.
- , , , Community‐acquired Acinetobacter baumannii pneumonia. Rev Clin Esp. 2003;203:284–286.
- , , , et al. Antimicrobial drug‐resistant microbes associated with hospitalized community‐acquired and healthcare‐associated pneumonia: a multi‐center study in Taiwan. J Formos Med Assoc. 2013;112:31–40.
- , , , , Antimicrobial resistance in Hispanic patients hospitalized in San Antonio, TX with community‐acquired pneumonia. Hosp Pract (1995). 2010;38:108–113.
- Centers for Disease Control and Prevention. CDC director blog. The end of antibiotics. Can we come back from the brink? Available at: http://blogs.cdc.gov/cdcdirector/2014/05/05/the-end-of-antibiotics-can-we-come-back-from-the-brink/. Published May 5, 2014. Accessed January 16, 2015.
© 2015 Society of Hospital Medicine
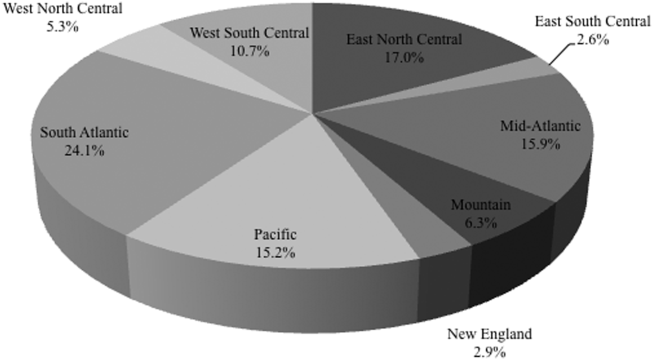

Evaluation of Gender as a Clinically Relevant Outcome Variable in the Treatment of Onychomycosis With Efinaconazole Topical Solution 10%
Onychomycosis is the most common nail disease in adults, representing up to 50% of all nail disorders, and is nearly always associated with tinea pedis.1,2 Moreover, toenail onychomycosis frequently involves several nails3 and can be more challenging to treat because of the slow growth rate of nails and the difficult delivery of antifungal agents to the nail bed.3,4
The most prevalent predisposing risk factor for developing onychomycosis is advanced age, with a reported prevalence of 18.2% in patients aged 60 to 79 years compared to 0.7% in patients younger than 19 years.2 Men are up to 3 times more likely to develop onychomycosis than women, though the reasons for this gender difference are less clear.2,5 It has been hypothesized that occupational factors may play a role,2 with increased use of occlusive footwear and more frequent nail injuries contributing to a higher incidence of onychomycosis in males.6
Differences in hormone levels associated with gender also may result in different capacities to inhibit the growth of dermatophytes.2 The risk for developing onychomycosis increases with age at a similar rate in both genders.7
Although onychomycosis is more common in men, the disease has been shown to have a greater impact on quality of life (QOL) in women. Studies have shown that onychomycosis was more likely to cause embarrassment in women than in men (83% vs 71%; N=258), and women with onychomycosis felt severely embarrassed more often than men (44% vs 26%; N=258).8,9 Additionally, one study (N=43,593) showed statistically significant differences associated with gender among onychomycosis patients who reported experiencing pain (33.7% of women vs 26.7% of men; P<.001), discomfort in walking (43.1% vs 36.4%; P<.001), and embarrassment (28.8% vs 25.1%; P<.001).10 Severe cases of onychomycosis even appear to have a negative impact on patients’ intimate relationships, and lower self-esteem has been reported in female patients due to unsightly and contagious-looking nail plates.11,12 Socks and stockings frequently may be damaged due to the constant friction from diseased nails that are sharp and dystrophic.13,14 In one study, treatment satisfaction was related to improvement in nail condition; however, males tended to be more satisfied with the improvement than females. Females were significantly less satisfied than males based on QOL scores for discomfort in wearing shoes (61.5 vs 86.3; P=.001), restrictions in shoe options (59.0 vs 82.8; P=.001), and the need to conceal toenails (73.3 vs 89.3; P<.01).15
Numerous studies have assessed the effectiveness of antifungal drugs in treating onychomycosis; however, there are limited data available on the impact of gender on outcome variables. Results from 2 identical 52-week, prospective, multicenter, randomized, double-blind studies of a total of 1655 participants (age range, 18–70 years) assessing the safety and efficacy of efinaconazole topical solution 10% in the treatment of onychomycosis were reported in 2013.16 Here, a gender subgroup analysis for male and female participants with mild to moderate onychomycosis is presented.
Methods
Two 52-week, prospective, multicenter, randomized, double-blind, vehicle-controlled studies were designed to evaluate the efficacy, safety, and tolerability of efinaconazole topical solution 10% versus vehicle in 1655 participants aged 18 to 70 years with mild to moderate toenail onychomycosis. Participants who presented with 20% to 50% clinical involvement of the target toenail were randomized (3:1 ratio) to once-daily application of a blinded study drug on the toenails for 48 weeks, followed by a 4-week follow-up period.16
Efficacy Evaluation
The primary efficacy end point was complete cure, defined as 0% clinical involvement of target toenail and mycologic cure based on negative potassium hydroxide examination and negative fungal culture at week 52.16 Secondary and supportive efficacy end points included mycologic cure, treatment success (<10% clinical involvement of the target toenail), complete or almost complete cure (≤5% clinical involvement and mycologic cure), and change in QOL based on a self-administered QOL questionnaire. All secondary end points were assessed at week 52.16 All items in the QOL questionnaire were transferred to a 0 to 100 scale, with higher scores indicating better functioning.17
In both studies, treatment compliance was assessed through participant diaries that detailed all drug applications as well as the weight of returned product bottles. Participants were considered noncompliant if they missed more than 14 cumulative applications of the study drug in the 28 days leading up to the visit at week 48, if they missed more than 20% of the total number of expected study drug applications during the treatment period, and/or if they missed 28 or more consecutive applications of the study drug during the total treatment period.
Safety Evaluation
Safety assessments included monitoring and recording adverse events (AEs) until week 52.16
Results
The 2 studies included a total of 1275 (77.2%) male and 376 (22.8%) female participants with mild to moderate onychomycosis (intention-to-treat population). Pooled results are provided in this analysis.
At baseline, the mean area of target toenail involvement among male and female participants in the efinaconazole treatment group was 36.7% and 35.6%, respectively, compared to 36.4% and 37.9%, respectively, in the vehicle group. The mean number of affected nontarget toenails was 2.8 and 2.7 among male and female participants, respectively, in the efinaconazole group compared to 2.9 and 2.4, respectively, in the vehicle group (Table 1).
Female participants tended to be somewhat more compliant with treatment than male participants at study end. At week 52, 93.0% and 93.4% of female participants in the efinaconazole and vehicle groups, respectively, were considered compliant with treatment compared to 91.1% and 88.6% of male participants, respectively (Table 1).
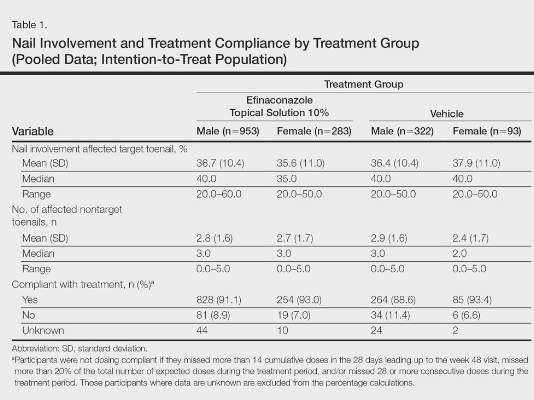
Primary Efficacy End Point (Observed Case)
At week 52, 15.8% of male and 27.1% of female participants in the efinaconazole treatment group had a complete cure compared to 4.2% and 6.3%, respectively, of those in the vehicle group (both P<.001). Efinaconazole topical solution 10% was significantly more effective than vehicle from week 48 (P<.001 male and P=.004 female).
The differences in complete cure rates reported for male (15.8%) and female (27.1%) participants treated with efinaconazole topical solution 10% were significant at week 52 (P=.001)(Figure 1).
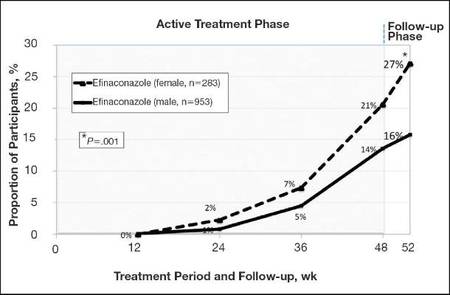 |
| Figure 1. Proportion of male and female participants treated with once-daily application of efinaconazole topical solution 10% who achieved complete cure from weeks 12 to 52 (observed case; intention-to-treat population; pooled data). |
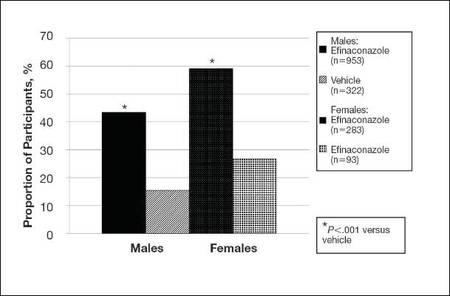 |
| Figure 2. Treatment success (defined as ≤10% clinical involvement of the target toenail) at week 52. Comparison of results with efinaconazole topical solution 10% and vehicle (observed case; intention-to-treat population; pooled data). |
Secondary and Supportive Efficacy End Points (Observed Case)
At week 52, 53.7% of male participants and 64.8% of female participants in the efinaconazole group achieved mycologic cure compared to 14.8% and 22.5%, respectively, of those in the vehicle group (both P<.001). Mycologic cure in the efinaconazole group versus the vehicle group became statistically significant at week 12 in male participants (P=.002) and at week 24 in female participants (P<.001).
At week 52, more male and female participants in the efinaconazole group (24.9% and 36.8%, respectively) achieved complete or almost complete cure compared to those in the vehicle group (6.8% and 11.3%, respectively), and 43.5% and 59.1% of male and female participants, respectively, were considered treatment successes (≤10% clinical involvement of the target toenail) compared to 15.5% and 26.8%, respectively, in the vehicle group (all P<.001)(Figure 2).
Treatment satisfaction scores were higher among female participants. At week 52, the mean QOL assessment score among female participants in the efinaconazole group was 77.2 compared to 70.3 among male participants in the same group (43.0 and 41.2, respectively, in the vehicle group). All QOL assessment scores were lower (ie, worse) in female onychomycosis participants at baseline. Improvements in all QOL scores were much greater in female participants at week 52 (Table 2).
The total number of efinaconazole applications was similar among male and female participants (315.1 vs 316.7). The mean amount of efina- conazole applied was greater in male participants (50.4 g vs 45.6 g), and overall compliance rates, though similar, were slightly higher in females compared to males (efinaconazole only)(93.0% vs 91.1%).
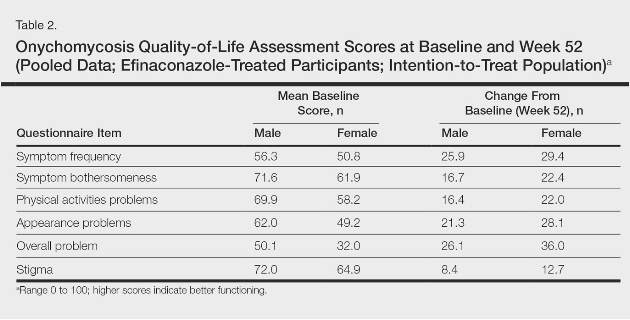
Safety
Overall, AE rates for efinaconazole were similar to those reported for vehicle (65.3% vs 59.8%).16 Slightly more female participants reported 1 or more AE than males (71.3% vs 63.5%). Adverse events were generally mild (50.0% in females; 53.7% in males) or moderate (46.7% in females; 41.8% in males) in severity, were not related to the study drug (89.9% in females; 93.1% in males), and resolved without sequelae. The rate of discontinuation from AEs was low (2.8% in females; 2.5% in males).
Comment
Efinaconazole topical solution 10% was significantly more effective than vehicle in both male and female participants with mild to moderate onychomycosis. It appears to be especially effective in female participants, with more than 27% of female participants achieving complete cure at week 52, and nearly 37% of female participants achieving complete or almost complete cure at week 52.
Mycologic cure is the only consistently defined efficacy parameter reported in toenail onychomycosis studies.18 It often is considered the main treatment goal, with complete cure occurring somewhat later as the nails grow out.19 Indeed, in this subgroup analysis the differences seen between the active and vehicle groups correlated well with the cure rates seen at week 52. Interestingly, significantly better mycologic cure rates (P=.002, active vs vehicle) were seen as early as week 12 in the male subgroup.
The current analysis suggests that male onychomycosis patients may be more difficult to treat, a finding noted by other investigators, though the reason is not clear.20 It is known that the prevalence of onychomycosis is higher in males,2,5 but data comparing cure rates by gender is lacking. It has been suggested that men more frequently undergo nail trauma and tend to seek help for more advanced disease.20 Treatment compliance also may be an issue. In our study, mean nail involvement was similar among male and female participants treated with efinaconazole (36.7% and 35.6%, respectively). Treatment compliance was higher among females compared to males (93.0% vs 91.1%), with the lowest compliance rates seen in males in the vehicle group (where complete cure rates also were the lowest). The amount of study drug used was greater in males, possibly due to larger toenails, though toenail surface area was not measured. Although there is no evidence to suggest that male toenails grow quicker, as many factors can impact nail growth, they tend to be thicker. Patients with thick toenails may be less likely to achieve complete cure.20 It also is possible that male toenails take longer to grow out fully, and they may require a longer treatment course. The 52-week duration of these studies may not have allowed for full regrowth of the nails, despite mycologic cure. Indeed, continued improvement in cure rates in onychomycosis patients with longer treatment courses have been noted by other investigators.21
The current analysis revealed much lower baseline QOL scores in female onychomycosis patients compared to male patients. Given that target nail involvement at baseline was similar across both groups, this finding may be indicative of greater concern about their condition among females, supporting other views that onychomycosis has a greater impact on QOL in female patients. Similar scores reported across genders at week 52 likely reflects the greater efficacy seen in females.
Conclusion
Based on this subgroup analysis, once-daily application of efinaconazole topical solution 10% may provide a useful option in the treatment of mild to moderate onychomycosis, particularly in female patients. The greater improvement in nail condition concomitantly among females translates to higher overall treatment satisfaction.
Acknowledgment—The author thanks Brian Bulley, MSc, of Inergy Limited, Lindfield, West Sussex, United Kingdom, for medical writing support. Valeant Pharmaceuticals North America, LLC, funded Inergy’s activities pertaining to the manuscript.
1. Scher RK, Coppa LM. Advances in the diagnosis and treatment of onychomycosis. Hosp Med. 1998;34:11-20.
2. Gupta AK, Jain HC, Lynde CW, et al. Prevalence and epidemiology of onychomycosis in patients visiting physicians’ offices: a multicenter Canadian survey of 15,000 patients. J Am Acad Dermatol. 2000;43:244-248.
3. Finch JJ, Warshaw EM. Toenail onychomycosis: current and future treatment options. Dermatol Ther. 2007;20:31-46.
4. Kumar S, Kimball AB. New antifungal therapies for the treatment of onychomycosis. Expert Opin Investig Drugs. 2009;18:727-734.
5. Elewski BE, Charif MA. Prevalence of onychomycosis in patients attending a dermatology clinic in northeastern Ohio for other conditions. Arch Dermatol. 1997;133:1172-1173.
6. Araujo AJG, Bastos OMP, Souza MAJ, et al. Occurrence of onychomycosis among patients attended in dermatology offices in the city of Rio de Janeiro, Brazil. An Bras Dermatol. 2003;78:299-308.
7. Pierard G. Onychomycosis and other superficial fungal infections of the foot in the elderly: a Pan-European Survey. Dermatology. 2001;202:220-224.
8. Drake LA, Scher RK, Smith EB, et al. Effect of onychomycosis on quality of life. J Am Acad Dermatol. 1998;38(5, pt 1):702-704.
9. Kowalczuk-Zieleniec E, Nowicki E, Majkowicz M. Onychomycosis changes quality of life. J Eur Acad Dermatol Venereol. 2002;16(suppl 1):248.
10. Katsambas A, Abeck D, Haneke E, et al. The effects of foot disease on quality of life: results of the Achilles Project. J Eur Acad Dermatol Venereol. 2005;19:191-195.
11. Salgo PL, Daniel CR, Gupta AK, et al. Onychomycosis disease management. Medical Crossfire: Debates, Peer Exchange and Insights in Medicine. 2003;4:1-17.
12. Elewski BE. The effect of toenail onychomycosis on patient quality of life. Int J Dermatol. 1997;36:754-756.
13. Hay RJ. The future of onychomycosis therapy may involve a combination of approaches. Br J Dermatol. 2001;145:3-8.
14. Whittam LR, Hay RJ. The impact of onychomycosis on quality of life. Clin Exp Dermatol. 1997;22:87-89.
15. Stier DM, Gause D, Joseph WS, et al. Patient satisfaction with oral versus nonoral therapeutic approaches in onychomycosis. J Am Podiatr Med Assoc. 2001;91:521-527.
16. Elewski BE, Rich P, Pollak R, et al. Efinaconazole 10% solution in the treatment of toenail onychomycosis: two phase 3 multicenter, randomized, double-blind studies. J Am Acad Dermatol. 2013;68:600-608.
17. Tosti A, Elewski BE. Treatment of onychomycosis with efinaconazole 10% topical solution and quality of life. J Clin Aesthet Dermatol. 2014;7:25-30.
18. Werschler WP, Bondar G, Armstrong D. Assessing treatment outcomes in toenail onychomycosis clinical trials. Am J Clin Dermatol. 2004;5:145-152.
19. Gupta AK. Treatment of dermatophyte toenail onychomycosis in the United States: a pharmacoeconomic analysis. J Am Podiatr Med Assoc. 2002;92:272-286.
20. Sigurgeirsson B. Prognostic factors for cure following treatment of onychomycosis. J Eur Acad Dermatol Venereol. 2010;24:679-684.
21. Epstein E. How often does oral treatment of toenail onychomycosis produce a disease-free nail? an analysis of published data. Arch Dermatol. 1998;134:1551-1554.
Onychomycosis is the most common nail disease in adults, representing up to 50% of all nail disorders, and is nearly always associated with tinea pedis.1,2 Moreover, toenail onychomycosis frequently involves several nails3 and can be more challenging to treat because of the slow growth rate of nails and the difficult delivery of antifungal agents to the nail bed.3,4
The most prevalent predisposing risk factor for developing onychomycosis is advanced age, with a reported prevalence of 18.2% in patients aged 60 to 79 years compared to 0.7% in patients younger than 19 years.2 Men are up to 3 times more likely to develop onychomycosis than women, though the reasons for this gender difference are less clear.2,5 It has been hypothesized that occupational factors may play a role,2 with increased use of occlusive footwear and more frequent nail injuries contributing to a higher incidence of onychomycosis in males.6
Differences in hormone levels associated with gender also may result in different capacities to inhibit the growth of dermatophytes.2 The risk for developing onychomycosis increases with age at a similar rate in both genders.7
Although onychomycosis is more common in men, the disease has been shown to have a greater impact on quality of life (QOL) in women. Studies have shown that onychomycosis was more likely to cause embarrassment in women than in men (83% vs 71%; N=258), and women with onychomycosis felt severely embarrassed more often than men (44% vs 26%; N=258).8,9 Additionally, one study (N=43,593) showed statistically significant differences associated with gender among onychomycosis patients who reported experiencing pain (33.7% of women vs 26.7% of men; P<.001), discomfort in walking (43.1% vs 36.4%; P<.001), and embarrassment (28.8% vs 25.1%; P<.001).10 Severe cases of onychomycosis even appear to have a negative impact on patients’ intimate relationships, and lower self-esteem has been reported in female patients due to unsightly and contagious-looking nail plates.11,12 Socks and stockings frequently may be damaged due to the constant friction from diseased nails that are sharp and dystrophic.13,14 In one study, treatment satisfaction was related to improvement in nail condition; however, males tended to be more satisfied with the improvement than females. Females were significantly less satisfied than males based on QOL scores for discomfort in wearing shoes (61.5 vs 86.3; P=.001), restrictions in shoe options (59.0 vs 82.8; P=.001), and the need to conceal toenails (73.3 vs 89.3; P<.01).15
Numerous studies have assessed the effectiveness of antifungal drugs in treating onychomycosis; however, there are limited data available on the impact of gender on outcome variables. Results from 2 identical 52-week, prospective, multicenter, randomized, double-blind studies of a total of 1655 participants (age range, 18–70 years) assessing the safety and efficacy of efinaconazole topical solution 10% in the treatment of onychomycosis were reported in 2013.16 Here, a gender subgroup analysis for male and female participants with mild to moderate onychomycosis is presented.
Methods
Two 52-week, prospective, multicenter, randomized, double-blind, vehicle-controlled studies were designed to evaluate the efficacy, safety, and tolerability of efinaconazole topical solution 10% versus vehicle in 1655 participants aged 18 to 70 years with mild to moderate toenail onychomycosis. Participants who presented with 20% to 50% clinical involvement of the target toenail were randomized (3:1 ratio) to once-daily application of a blinded study drug on the toenails for 48 weeks, followed by a 4-week follow-up period.16
Efficacy Evaluation
The primary efficacy end point was complete cure, defined as 0% clinical involvement of target toenail and mycologic cure based on negative potassium hydroxide examination and negative fungal culture at week 52.16 Secondary and supportive efficacy end points included mycologic cure, treatment success (<10% clinical involvement of the target toenail), complete or almost complete cure (≤5% clinical involvement and mycologic cure), and change in QOL based on a self-administered QOL questionnaire. All secondary end points were assessed at week 52.16 All items in the QOL questionnaire were transferred to a 0 to 100 scale, with higher scores indicating better functioning.17
In both studies, treatment compliance was assessed through participant diaries that detailed all drug applications as well as the weight of returned product bottles. Participants were considered noncompliant if they missed more than 14 cumulative applications of the study drug in the 28 days leading up to the visit at week 48, if they missed more than 20% of the total number of expected study drug applications during the treatment period, and/or if they missed 28 or more consecutive applications of the study drug during the total treatment period.
Safety Evaluation
Safety assessments included monitoring and recording adverse events (AEs) until week 52.16
Results
The 2 studies included a total of 1275 (77.2%) male and 376 (22.8%) female participants with mild to moderate onychomycosis (intention-to-treat population). Pooled results are provided in this analysis.
At baseline, the mean area of target toenail involvement among male and female participants in the efinaconazole treatment group was 36.7% and 35.6%, respectively, compared to 36.4% and 37.9%, respectively, in the vehicle group. The mean number of affected nontarget toenails was 2.8 and 2.7 among male and female participants, respectively, in the efinaconazole group compared to 2.9 and 2.4, respectively, in the vehicle group (Table 1).
Female participants tended to be somewhat more compliant with treatment than male participants at study end. At week 52, 93.0% and 93.4% of female participants in the efinaconazole and vehicle groups, respectively, were considered compliant with treatment compared to 91.1% and 88.6% of male participants, respectively (Table 1).
Primary Efficacy End Point (Observed Case)
At week 52, 15.8% of male and 27.1% of female participants in the efinaconazole treatment group had a complete cure compared to 4.2% and 6.3%, respectively, of those in the vehicle group (both P<.001). Efinaconazole topical solution 10% was significantly more effective than vehicle from week 48 (P<.001 male and P=.004 female).
The differences in complete cure rates reported for male (15.8%) and female (27.1%) participants treated with efinaconazole topical solution 10% were significant at week 52 (P=.001)(Figure 1).
|
| Figure 1. Proportion of male and female participants treated with once-daily application of efinaconazole topical solution 10% who achieved complete cure from weeks 12 to 52 (observed case; intention-to-treat population; pooled data). |
|
| Figure 2. Treatment success (defined as ≤10% clinical involvement of the target toenail) at week 52. Comparison of results with efinaconazole topical solution 10% and vehicle (observed case; intention-to-treat population; pooled data). |
Secondary and Supportive Efficacy End Points (Observed Case)
At week 52, 53.7% of male participants and 64.8% of female participants in the efinaconazole group achieved mycologic cure compared to 14.8% and 22.5%, respectively, of those in the vehicle group (both P<.001). Mycologic cure in the efinaconazole group versus the vehicle group became statistically significant at week 12 in male participants (P=.002) and at week 24 in female participants (P<.001).
At week 52, more male and female participants in the efinaconazole group (24.9% and 36.8%, respectively) achieved complete or almost complete cure compared to those in the vehicle group (6.8% and 11.3%, respectively), and 43.5% and 59.1% of male and female participants, respectively, were considered treatment successes (≤10% clinical involvement of the target toenail) compared to 15.5% and 26.8%, respectively, in the vehicle group (all P<.001)(Figure 2).
Treatment satisfaction scores were higher among female participants. At week 52, the mean QOL assessment score among female participants in the efinaconazole group was 77.2 compared to 70.3 among male participants in the same group (43.0 and 41.2, respectively, in the vehicle group). All QOL assessment scores were lower (ie, worse) in female onychomycosis participants at baseline. Improvements in all QOL scores were much greater in female participants at week 52 (Table 2).
The total number of efinaconazole applications was similar among male and female participants (315.1 vs 316.7). The mean amount of efina- conazole applied was greater in male participants (50.4 g vs 45.6 g), and overall compliance rates, though similar, were slightly higher in females compared to males (efinaconazole only)(93.0% vs 91.1%).
Safety
Overall, AE rates for efinaconazole were similar to those reported for vehicle (65.3% vs 59.8%).16 Slightly more female participants reported 1 or more AE than males (71.3% vs 63.5%). Adverse events were generally mild (50.0% in females; 53.7% in males) or moderate (46.7% in females; 41.8% in males) in severity, were not related to the study drug (89.9% in females; 93.1% in males), and resolved without sequelae. The rate of discontinuation from AEs was low (2.8% in females; 2.5% in males).
Comment
Efinaconazole topical solution 10% was significantly more effective than vehicle in both male and female participants with mild to moderate onychomycosis. It appears to be especially effective in female participants, with more than 27% of female participants achieving complete cure at week 52, and nearly 37% of female participants achieving complete or almost complete cure at week 52.
Mycologic cure is the only consistently defined efficacy parameter reported in toenail onychomycosis studies.18 It often is considered the main treatment goal, with complete cure occurring somewhat later as the nails grow out.19 Indeed, in this subgroup analysis the differences seen between the active and vehicle groups correlated well with the cure rates seen at week 52. Interestingly, significantly better mycologic cure rates (P=.002, active vs vehicle) were seen as early as week 12 in the male subgroup.
The current analysis suggests that male onychomycosis patients may be more difficult to treat, a finding noted by other investigators, though the reason is not clear.20 It is known that the prevalence of onychomycosis is higher in males,2,5 but data comparing cure rates by gender is lacking. It has been suggested that men more frequently undergo nail trauma and tend to seek help for more advanced disease.20 Treatment compliance also may be an issue. In our study, mean nail involvement was similar among male and female participants treated with efinaconazole (36.7% and 35.6%, respectively). Treatment compliance was higher among females compared to males (93.0% vs 91.1%), with the lowest compliance rates seen in males in the vehicle group (where complete cure rates also were the lowest). The amount of study drug used was greater in males, possibly due to larger toenails, though toenail surface area was not measured. Although there is no evidence to suggest that male toenails grow quicker, as many factors can impact nail growth, they tend to be thicker. Patients with thick toenails may be less likely to achieve complete cure.20 It also is possible that male toenails take longer to grow out fully, and they may require a longer treatment course. The 52-week duration of these studies may not have allowed for full regrowth of the nails, despite mycologic cure. Indeed, continued improvement in cure rates in onychomycosis patients with longer treatment courses have been noted by other investigators.21
The current analysis revealed much lower baseline QOL scores in female onychomycosis patients compared to male patients. Given that target nail involvement at baseline was similar across both groups, this finding may be indicative of greater concern about their condition among females, supporting other views that onychomycosis has a greater impact on QOL in female patients. Similar scores reported across genders at week 52 likely reflects the greater efficacy seen in females.
Conclusion
Based on this subgroup analysis, once-daily application of efinaconazole topical solution 10% may provide a useful option in the treatment of mild to moderate onychomycosis, particularly in female patients. The greater improvement in nail condition concomitantly among females translates to higher overall treatment satisfaction.
Acknowledgment—The author thanks Brian Bulley, MSc, of Inergy Limited, Lindfield, West Sussex, United Kingdom, for medical writing support. Valeant Pharmaceuticals North America, LLC, funded Inergy’s activities pertaining to the manuscript.
1. Scher RK, Coppa LM. Advances in the diagnosis and treatment of onychomycosis. Hosp Med. 1998;34:11-20.
2. Gupta AK, Jain HC, Lynde CW, et al. Prevalence and epidemiology of onychomycosis in patients visiting physicians’ offices: a multicenter Canadian survey of 15,000 patients. J Am Acad Dermatol. 2000;43:244-248.
3. Finch JJ, Warshaw EM. Toenail onychomycosis: current and future treatment options. Dermatol Ther. 2007;20:31-46.
4. Kumar S, Kimball AB. New antifungal therapies for the treatment of onychomycosis. Expert Opin Investig Drugs. 2009;18:727-734.
5. Elewski BE, Charif MA. Prevalence of onychomycosis in patients attending a dermatology clinic in northeastern Ohio for other conditions. Arch Dermatol. 1997;133:1172-1173.
6. Araujo AJG, Bastos OMP, Souza MAJ, et al. Occurrence of onychomycosis among patients attended in dermatology offices in the city of Rio de Janeiro, Brazil. An Bras Dermatol. 2003;78:299-308.
7. Pierard G. Onychomycosis and other superficial fungal infections of the foot in the elderly: a Pan-European Survey. Dermatology. 2001;202:220-224.
8. Drake LA, Scher RK, Smith EB, et al. Effect of onychomycosis on quality of life. J Am Acad Dermatol. 1998;38(5, pt 1):702-704.
9. Kowalczuk-Zieleniec E, Nowicki E, Majkowicz M. Onychomycosis changes quality of life. J Eur Acad Dermatol Venereol. 2002;16(suppl 1):248.
10. Katsambas A, Abeck D, Haneke E, et al. The effects of foot disease on quality of life: results of the Achilles Project. J Eur Acad Dermatol Venereol. 2005;19:191-195.
11. Salgo PL, Daniel CR, Gupta AK, et al. Onychomycosis disease management. Medical Crossfire: Debates, Peer Exchange and Insights in Medicine. 2003;4:1-17.
12. Elewski BE. The effect of toenail onychomycosis on patient quality of life. Int J Dermatol. 1997;36:754-756.
13. Hay RJ. The future of onychomycosis therapy may involve a combination of approaches. Br J Dermatol. 2001;145:3-8.
14. Whittam LR, Hay RJ. The impact of onychomycosis on quality of life. Clin Exp Dermatol. 1997;22:87-89.
15. Stier DM, Gause D, Joseph WS, et al. Patient satisfaction with oral versus nonoral therapeutic approaches in onychomycosis. J Am Podiatr Med Assoc. 2001;91:521-527.
16. Elewski BE, Rich P, Pollak R, et al. Efinaconazole 10% solution in the treatment of toenail onychomycosis: two phase 3 multicenter, randomized, double-blind studies. J Am Acad Dermatol. 2013;68:600-608.
17. Tosti A, Elewski BE. Treatment of onychomycosis with efinaconazole 10% topical solution and quality of life. J Clin Aesthet Dermatol. 2014;7:25-30.
18. Werschler WP, Bondar G, Armstrong D. Assessing treatment outcomes in toenail onychomycosis clinical trials. Am J Clin Dermatol. 2004;5:145-152.
19. Gupta AK. Treatment of dermatophyte toenail onychomycosis in the United States: a pharmacoeconomic analysis. J Am Podiatr Med Assoc. 2002;92:272-286.
20. Sigurgeirsson B. Prognostic factors for cure following treatment of onychomycosis. J Eur Acad Dermatol Venereol. 2010;24:679-684.
21. Epstein E. How often does oral treatment of toenail onychomycosis produce a disease-free nail? an analysis of published data. Arch Dermatol. 1998;134:1551-1554.
Practice Points
- Men, particularly as they age, are more likely to develop onychomycosis.
- Treatment adherence may be a bigger issue among male patients.
- Onychomycosis in males may be more difficult to treat for a variety of reasons.

A Multipronged Approach to Decrease the Risk of Clostridium difficile Infection at a Community Hospital and Long-Term Care Facility
From Sharp HealthCare, San Diego, CA.
Abstract
- Objective: To examine the relationship between the rate of Clostridium difficile infections (CDI) and implementation of 3 interventions aimed at preserving the fecal microbiome: (1) reduction of antimicrobial pressure; (2) reduction in intensity of gastrointestinal prophylaxis with proton-pump inhibitors (PPIs); and (3) expansion of probiotic therapy.
- Methods: We conducted a retrospective analysis of all inpatients with CDI between January 2009 and December 2013 receiving care at our community hospital and associated long-term care (LTC) facility. We used interrupted time series analysis to assess CDI rates during the implementation phase (2008–2010) and the postimplementation phase (2011–2013).
- Results: A reduction in the rate of health care facility–associated CDIs was seen. The mean number of cases per 10,000 patient days fell from 11.9 to 3.6 in acute care and 6.1 to 1.1 in LTC. Recurrence rates decreased from 64% in 2009 to 16% by 2014. The likelihood of CDI recurring was 3 times higher in those exposed to PPI and 0.35 times less likely in those who received probiotics with their initial CDI therapy.
- Conclusion: The risk of CDI incidence and recurrence was significantly reduced in our inpatients, with recurrent CDI associated with PPI use, multiple antibiotic courses, and lack of probiotics. We attribute our success to the combined effect of intensified antibiotic stewardship, reduced PPI use, and expanded probiotic use.
Clostridium difficile is classified as an urgent public health threat by the Centers for Disease Control and Prevention [1]. A recent study by the CDC found that it caused more than 400,000 infections in the United States in 2011, leading to over 29,000 deaths [2]. The costs of treating CDI are substantial and recurrences are common. While rates for many health care–associated infections are declining, C. difficile infection (CDI) rates remain at historically high levels [1] with the elderly at greatest risk for infection and mortality from the illness [3].
CDIs can be prevented. A principal recommendation for preventing CDIs is improving antibiotic use. Antibiotic use increases the risk for developing CDI by disrupting the colonic microbiome. Hospitalized and long-term care (LTC) patients are frequently prescribed antibiotics, but studies indicate that much of this use is inappropriate [4]. Antimicrobial stewardship has been shown to be effective in reducing CDI rates. Other infection prevention measures commonly employed to decrease the risk of hospital-onset CDI include monitoring of hand hygiene compliance using soap and water, terminal cleaning with bleach products of rooms occupied by patients with CDI, and daily cleaning of highly touched areas. At our institution, patients identified with CDI are placed on contact precautions until they have been adequately treated and have had resolution of diarrhea for 48 hours.
In addition to preventing CDI transmission through antimicrobial stewardship, attention is being paid to the possibility that restricting PPI use may help in preventing CDI. The increasing utilization of proton-pump inhibitors (PPIs) in recent years has coincided with the trend of increasing CDI rates. Although C. difficile spores are acid-resistant, vegetative forms are easily affected by acidity. Several studies have shown the association of acid suppression and greater susceptibility of acquiring CDI or recurrences [5–7]. Elevated gastric pH by PPIs facilitates the growth of potentially pathogenic upper and lower gastrointestinal (GI) tract flora, including the conversion of C. difficile from spore to vegetative form in the upper GI tract [5,8].
A growing body of evidence indicates that probiotics are both safe and effective for preventing CDIs [9]. Probiotics may counteract disturbances in intestinal flora, thereby reducing the risk for colonization by pathogenic bacteria. Probiotics can inhibit pathogen adhesion, colonization, and invasion of the gastrointestinal mucosa [10].
We hypothesized that preservation and/or restoration of the diversity of the fecal microbiome would prevent CDI and disease recurrence in our facility. Prior to 2009, we had strict infection prevention measures in place to prevent disease transmission, similar to many other institutions. In 2009, we implemented 3 additional interventions to reduce the rising incidence of CDI: (1) an antibiotic stewardship program, (2) lowering the intensity of acid suppression, and (3) expanding the use of probiotic therapy. The 3 interventions were initiated over the 19-month period January 2009 through July 2010. This study addresses the effects of these interventions.
Methods
Patients and Data Collection
The study was conducted at a community hospital (59 beds) that has an associated LTC facility (122 beds). We conducted a retrospective analysis of hospital and LTC data from all documented cases of CDI between January 2009 and December 2013. Study subjects included all patients with stools positive for C. difficile antigen and toxin with associated symptoms of infection (n = 123). Institutional review board approval was obtained prior to data collection.
The following information was collected: admission diagnosis, number of days from admission until confirmed CDI, residence prior to admission, duration and type of antibiotics received prior to or during symptoms of CDI, type of GI prophylaxis received within 14 days prior to and during CDI treatment, probiotic received and duration, and the type and duration of antibiotic treatment given for the CDI. The data collected was used to determine the likely origin of each C. difficile case, dates of recurrences, and the possible effects of the interventions. Antibiotic use was categorized as: (1) recent antibiotic course (antibiotics received within the preceding 4 weeks), (2) antibiotic courses greater than 10 days, and (3) multiple antibiotic courses (more than 1 antibiotic course received sequentially or concurrently).
Positive C. difficile infections were detected using a 2-step algorithm, starting in 2009. The samples were first screened with a rapid membrane enzyme immunoassay for glutamate dehydrogenase (GDH) antigen and toxin A and B in stool (C. Diff Quik Chek Complete, Techlab, Blacksburg, VA). Discrepant samples (GDH positive and toxin A and B negative) were reflexed to DNA-based PCR testing. The PCR assay was changed to the Verigene C. difficile test (Nanosphere, Northbrook, IL) in 2012. Up to 30 days after discharge from our facility, positive results were considered as acquired from our facility and positive results within 2 days of admission with symptoms of CDI were considered positive on admission and were not attributed to our facility. A primary episode of CDI was defined to be the first identified episode or event in each patient. Recurrent CDI was defined as a repeated case of CDI within 180 days of the original CDI event.
Interventions to Reduce CDI
Reduction of Antibiotic Pressure
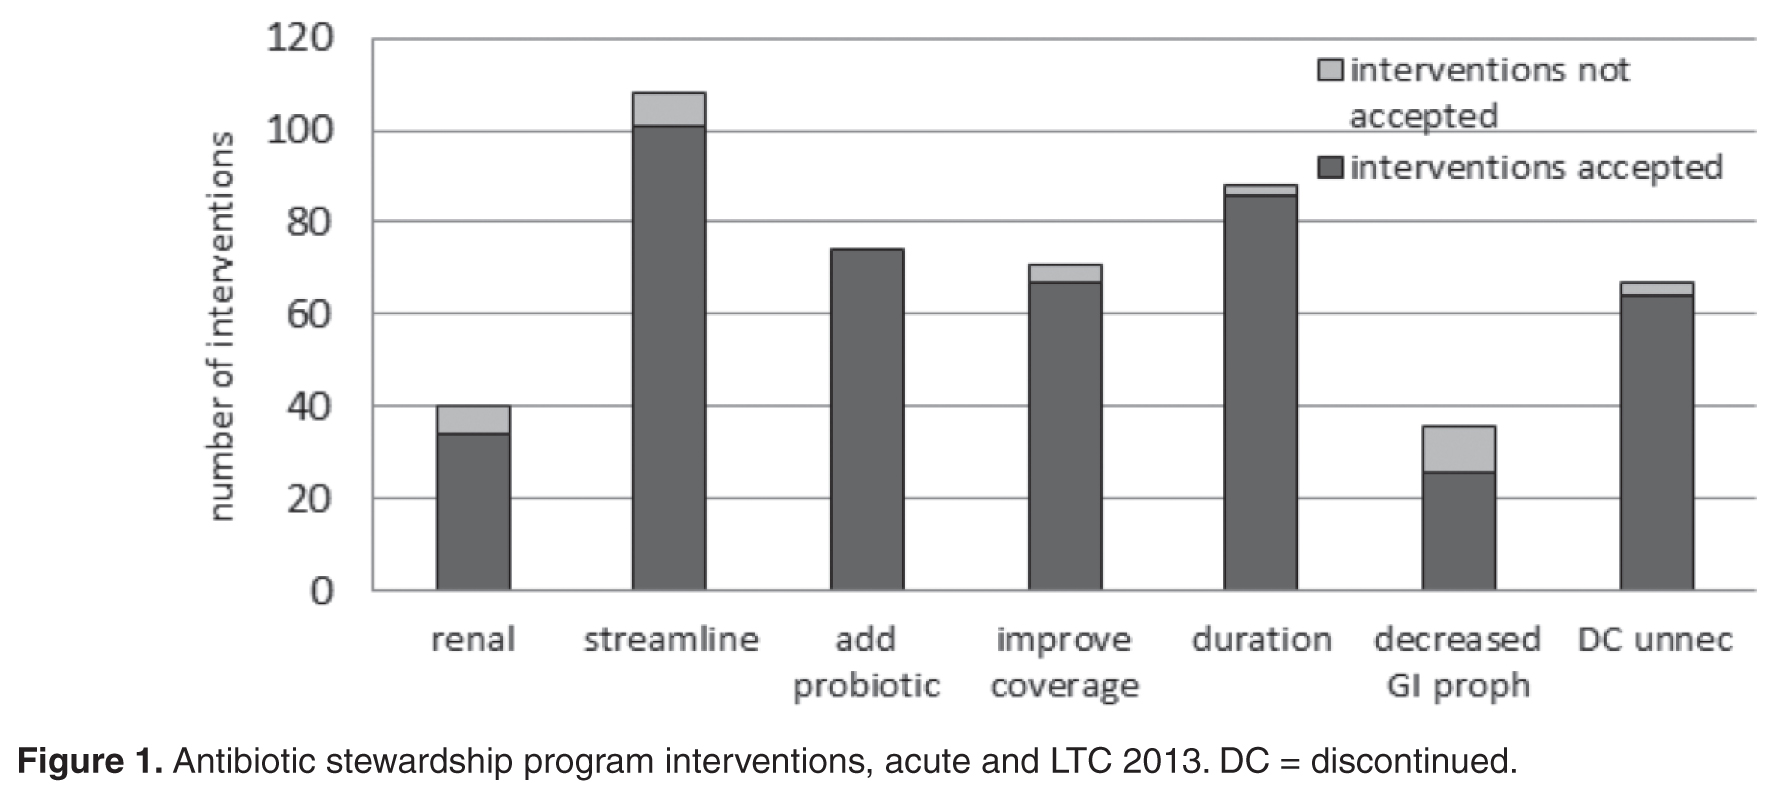
Other actions taken to improve antimicrobial prescribing as part of the stewardship program included medication usage evaluations (MUEs) for levofloxacin and carbapenems, implementing an automatic dosing/duration protocol for levofloxacin, and carbapenem restriction to prevent inappropriate use. Nursing and pharmacy staffs were educated on vancomycin appropriateness, benefits of MRSA screening for de-escalation, procalcitonin, and treatment of sepsis. Emergency department staff was educated on (1) empiric antimicrobial treatment recommendations for urinary and skin and soft tissue infections based on outpatient antibiogram data, (2) renal adjustment of antimicrobials, (3) fluoroquinolones: resistance formation, higher CDI risk and higher dosing recommendations, (4) GI prophylaxis recommendations, and (5) probiotics.
Reduction in the Intensity of Acid Suppression for GI Prophylaxis
PPIs were substituted with histamine-2 receptor antagonists (H2RA) whenever acid suppression for GI prophylaxis was warranted. If GI symptoms persisted, sucralfate was added. In May 2010, all eligible LTC patients were converted from PPIs to H2RA.
Expanding the Use of Probiotics
We expanded the use of probiotics as an adjunctive treatment for CDI with metronidazole ± vancomycin oral therapies. Probiotics were included concurrently with any broad-spectrum antibiotic administration, longer antibiotic courses (≥ 7 days), and/or multiple courses of antibiotics. The combination of Saccromyces boulardii plus Lactobacillus acidophilus and L. bulgaricus was given with twice daily dosing until the end of 2011. In January 2012, our facility switched over to daily administration of a probiotic with the active ingredients of Lactobacillus acidophilus and Lactobacillus casei, 50 billion colony-forming units. Probiotics were given during the antibiotic course plus for 1 additional week after course completion. Probiotics were not administered to selected groups of patients: (1) immunocompromised patients, (2) patients who were NPO, or (3) patients excluded by their physicians.
There was no change or enhanced targeting of infection prevention or environmental hygiene strategies during the study period.
Data Analysis and Statistical Methods
All data were collected on data collection sheets and transcribed into Microsoft Office Excel 2007 Service Pack 3. No data were excluded from analysis. Continuous variables, eg, number of cases of CDI, are reported as mean ± standard deviation. Categorical variables, eg, number of recurrent CDI cases, are reported as the count and percentage. Comparison of populations was done with the Wilcoxon rank sum test. Segments of the interrupted time series were assessed using linear regression. Associations were tested using χ2. Statistical tests were deemed significant when the α probability was < 0.05. No adjustments were made for multiplicity. Data descriptive statistics (including frequency histograms for visual examination of distributions) and statistical analyses were performed using Stata 11.1 (StataCorp, College Station, TX).
Results
CDIs
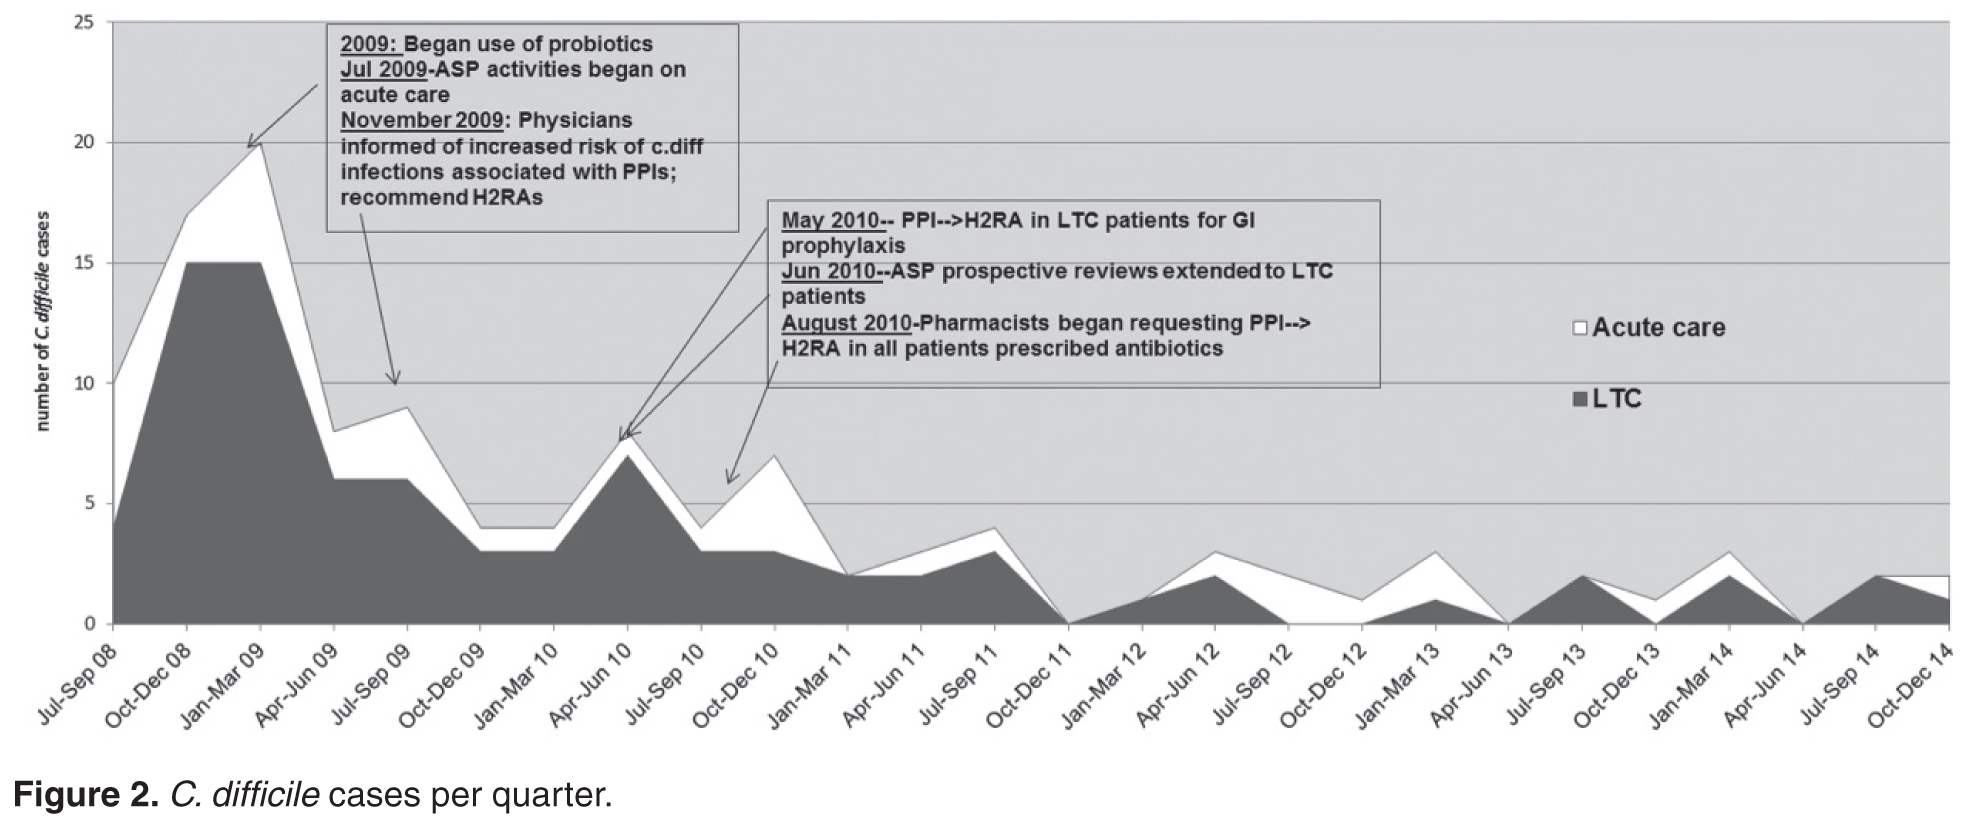

Within the population of patients having a CDI or recurrence, we found that those patients in the later time period (2011–2013) were significantly less likely to have a recurrence than those in the earlier time period (pre- Jan 2011) (chi square = 5.975, df = 1, P = 0.015). The odds ratio (OR) was 0.35 (95% CI 0.15 to 0.83).
Patients in the earlier (2009–2010) vs. the later post-intervention group (2011–2013) had more likely received multiple antibiotic courses (chi square = 5.32, df = 1, P = 0.021, OR 2.56), a PPI (chi square = 8.86, df = 1, P = 0.003, OR 3.38), and had a health care facility–associated infection originating from our institution as opposed to outside facility transfers or community-acquired cases (chi square = 7.09, df = 1, P = 0.008, OR 2.94).
Antibiotic Pressure

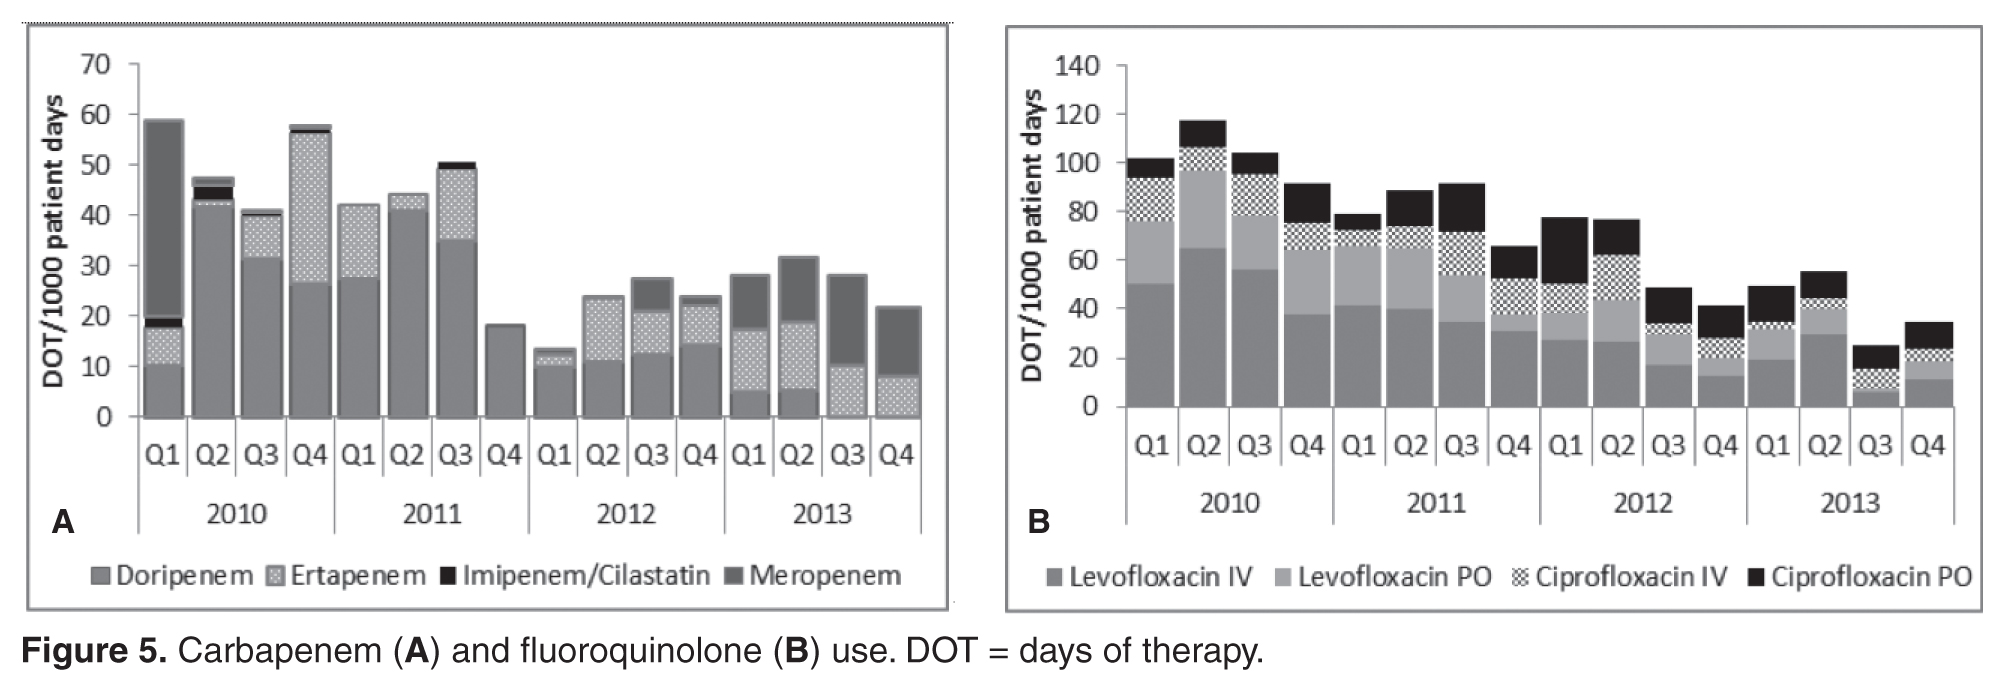
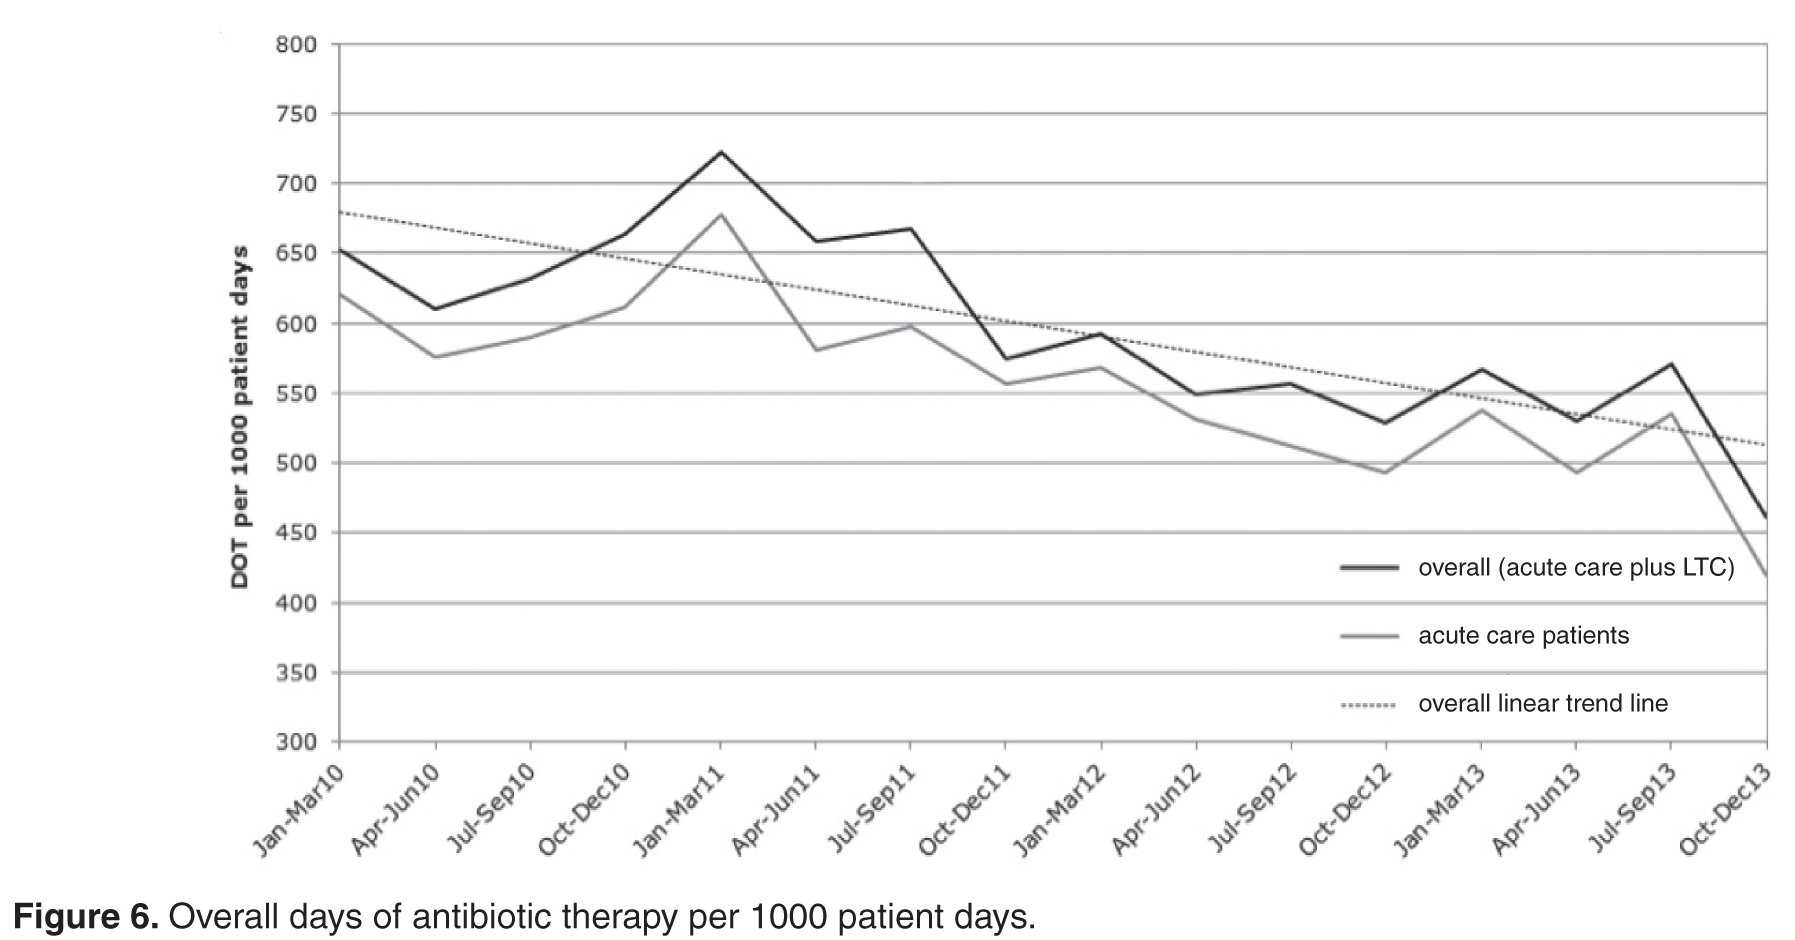
Acid Suppression
In evaluating the effects of limiting the use of PPIs, patients who received an H2RA or no antacid prophylaxis were significantly less likely to have a recurrence of CDI than those who received a PPI (chi square = 6.35, df = 1, P = 0.012). The OR for recurrence with PPIs was 3.05 (95% CI 1.25 to 7.44). Of patients exposed to PPIs, those exposed in the later time period (2011 through 2013) were significantly less likely to have a recurrence than those exposed in the early time period (third quarter 2008 through 2010; chi square = 15.14, df = 1, P < 0.001). The OR was 0.23 (95% CI, 0.11 to 0.49).
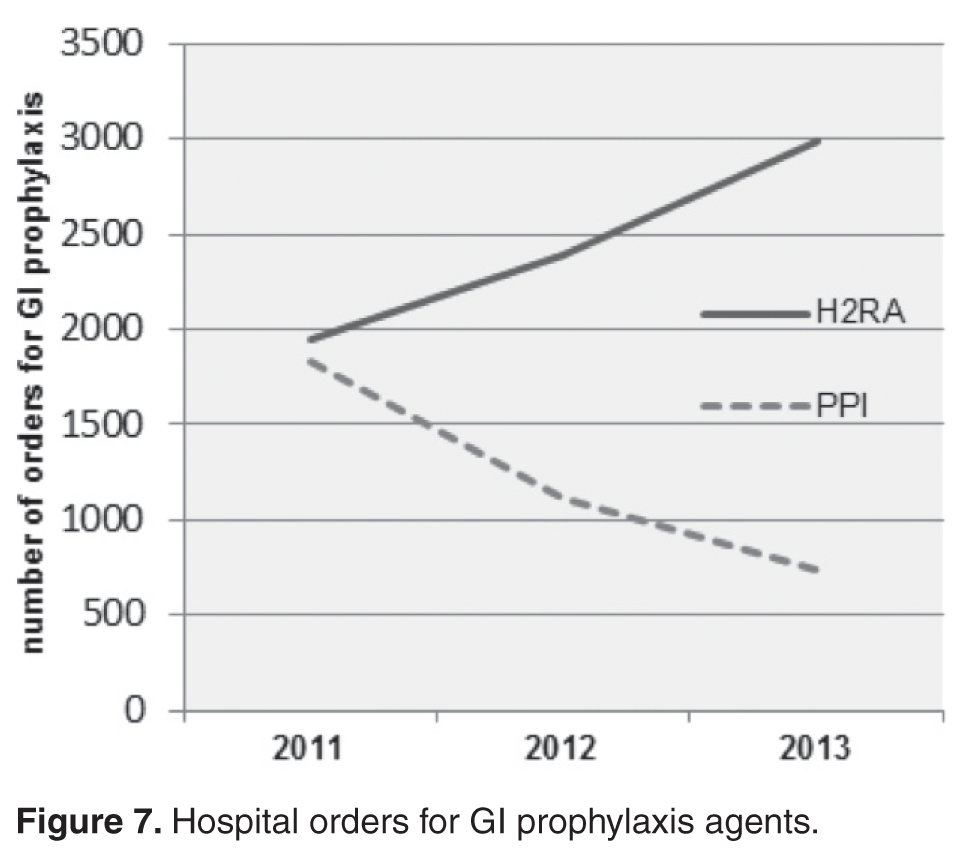
Probiotics
During 2009–2011, only 15% of the CDI patients had received probiotics with an antibiotic course. Probiotic therapy as part of CDI treatment increased from 60% in 2009 to 91% in 2011. Among patients that contracted CDI in 2012–2013, only 2 patients received probiotics with their antibiotic courses.
Recurrences

With regard to the effect of probiotics within this population, those who received 
One patient with significant initial antibiotic pressure was continued on her PPI during CDI treatment and continued to have recurrences, despite probiotic use. After her fourth recurrence, her PPI was changed to an H2RA, and she had no further recurrences. She continues off PPI therapy and is CDI-free 2 years later. Another patient who remained on his PPI had 3 recurrences, until finally a probiotic was added and the recurrences abated.
Discussion
CDI is common in hospitalized patients, and its incidence has increased due to multiple factors, which include the widespread use of broad-spectrum antimicrobials and increased use of PPIs. Our observational study showed a statistically significant reduction in the number of health care–associated CDI cases during our implementation period (mid–2008 through 2010). From 2011 on, all initiatives were maintained. As the lower rates of CDI continued, physician confidence in antimicrobial stewardship recommendations increased. During this latter portion of the study period, hospitalists uniformly switched patients to H2RA for GI prophylaxis, added prophylactic probiotics to antibiotic courses as well as CDI therapy, and were more receptive to streamlining and limiting durations of antibiotic therapy. Although the study was completed in 2013, follow-up data have shown that the low CDI incidence has continued through 2014.
The average age of the patients in our study was 69 years. In 2009, there were 41 C. difficile cases originating from our institution; however, by the end of 2011, only 9 cases had been reported, a 75% reduction. The majority of our cases of C. difficile in 2009–2010 originated from our facility’s LTC units (Figure 2). Risk factors in the LTC population included older age (72% are > 65 years) with multiple comorbidities, exposure to frequent multiple courses of broad-spectrum antibiotics, and use of PPIs as the standard for GI prophylaxis therapy. Multiple antibiotic courses had a strong association with PPI administration in the patients who contracted CDI, while recent antibiotics and antibiotics greater than 10 days did not. Implications may include an increased risk of CDI in patients requiring multiple antibiotic courses concurrent with PPI exposure.
Infection prevention strategies were promulgated among the health care team during the study period but were not specifically targeted for quality improvement efforts. Therefore, in contrast to other studies where infection prevention measures and environmental hygiene were prominent components of a CDI prevention “bundle,” our focus was on antimicrobial stewardship and PPI and probiotic use, not enhancement of standard infection prevention and environmental hygiene measures.
The antibiotics used prior to the development of CDI in our study were similar to findings from other studies that have associated broad-spectrum antibiotics with increased susceptibility to CDI [11]. Antimicrobials disrupt the normal GI flora, which is essential for eradicating many C. difficile spores [12]. The utilization of high-risk antibiotics and prolonged antimicrobial therapy were reduced with implementation of our antimicrobial stewardship program. In 2012, the antimicrobial stewardship program developed a LTC fever protocol, providing education to LTC nurses, physicians, and pharmacists using the modified McGeer criteria [13] for infection in LTC units and empiric antibiotic recommendations from our epidemiologist. A formal recommendation for a LTC 7-day stop date for urinary, respiratory, and skin and soft tissue infections was initiated, which included are-assessment at day 6–7 for resolution of symptoms.
With regard to PPI therapy, our study revealed that patients who had received a PPI at some point were 3.05 times more likely to have a recurrence of CDI than those who had not. These findings are consistent with the literature. Linsky et al [5] found a 42% increased risk of CDI recurrence in patients receiving PPIs concurrent with CDI treatment while considering covariates that may influence the risk of recurrent CDI or exposure to PPIs. A meta-analysis of 16 observational studies involving more than 1.2 million hospitalized patients by Janarthanan et al [14] explored the association between CDI and PPIs and showed a 65% increase in the incidence of CDI among PPI users. Those receiving PPI for GI prophylaxis in the earlier time period (before 2011) were 77% more likely to have a recurrence than those who received PPI in the later period. This finding might be associated with the more appropriate antimicrobial use and the more consistent use of consistent prophylactic probiotics in the later study period.
Our results showed that those who received probiotics with the initial CDI treatment were significantly less likely to have a recurrence than those who did not. Patients receiving probiotics in the later period (2011–2013) were 74% less likely to have a recurrence than patients in the earlier group (2009–2010). Despite the standard use of probiotics for primary CDI prevention at our institution, we could not show direct significance to the lack of probiotic use found in the identified CDI patients with this observational study design. The higher benefit in more recent years could possibly be attributed to the fact that these patients were much less likely to have received a PPI, that most had likely received probiotics concurrently plus 1 week after their antibiotic courses, and their antibiotic therapy was likely more focused and streamlined to prevent C. difficile infection. A meta-analysis of probiotic efficacy in primary CDI prevention suggested that probiotics can lead to a 64% reduction in the incidence of CDI, in addition to reducing GI-associated symptoms related to infection or antibiotic use [9]. A dose-response study of the efficacy of a probiotic formula showed a lower incidence of CDI, 1.2% for higher dose vs. 9.4% for lower dose vs. 23.8% for placebo [15]. Maziade et al [16] added prophylactic probiotics to a bundle of standard preventative measures for C. difficile infections, and were able to show an enhanced and sustained decrease in CDI rates (73%) and recurrences (39%). However, many of the probiotic studies which have studied the relationship to CDI have been criticized for reporting abnormally high rates of infection [9,16] missing data, a lack of controls or excessive patient exclusion criteria [17,18] The more recent PLACIDE study by Allen et al [19] was a large multicenter randomized controlled trial that did not show any benefit to CDI prevention with probiotics; however, with 83% of screened patients excluded, the patients were low risk, with the resulting CDI incidence (0.99%) too low to show a benefit. Acid suppression was also not revealed in the specific CDI cases, and others have found this to be a significant risk factor [5–7].
Limitations of this study include the study design (an observational, retrospective analysis), the small size of our facility, and the difficulty in obtaining probiotic history prior to admission in some cases. Due to a change in computer systems, hospital orders for GI prophylaxis agents could not be obtained for 2009–2010. Due to the fact that we instituted our interventions somewhat concurrently, it is difficult to analyze their individual impact. Randomized controlled trials evaluating the combined role of probiotics, GI prophylaxis, and antibiotic pressure in CDI are needed to further define the importance of this approach.
Corresponding author: Bridget Olson, RPh, Sharp Coronado Hospital & Villa Coronado Long-Term Care Facility, 250
Prospect Pl., Coronado CA 92118, bridget.olson@sharp.com.
Financial disclosures: None.
Author contributions: conception and design, BO, TH, KW, RO; analysis and interpretation of data, RAF; drafting of article, BO, RAF; critical revision of the article, RAF, JH, TH; provision of study materials or patients, BO; statistical expertise, RAF; administrative or technical support, KW, RO; collection and assembly of data, BO.
1. Centers for Disease Control and Prevention. Antibiotic resistance threats in the United States, 2013. http://www.cdc.gov/drugresistance/threat-report-2013/index.html.
2. Lessa FC, Mu Y, Bamberg WM, Beldavs ZG, et al. Burden of Clostridium difficile infection in the United States. N Engl J Med 2015;372:825–34.
3. Pepin J, Valiquette L, Cossette B. Mortality attributable to nosocomial Clostridium difficile-associated disease during an epidemic caused by a hypervirulent strain in Quebec. CMAJ 2005;173:1037–42.
4. Warren JW, Palumbo FB, Fitterman L, Speedie SM. Incidence and characteristics of antibiotic use in aged nursing home patients. J Am Geriatr Soc 1991;39:963–72.
5. Linsky A, Gupta K, Lawler E, et al. Proton pump inhibitors and risk for recurrent Clostridium difficile infection. Arch Intern Med 2010;170:772–8.
6. Dial S, Delaney JA, Barkun AN, Sulssa S. Use of gastric acid-suppressive agents and the risk of community-acquired Clostridium difficile-associated disease. JAMA 2005;294:2989–95.
7. Howell M, Novack V, Grgurich P, et.al. Iatrogenic gastric acid suppression and the risk if nosocomial Clostridium difficile infection. Arch Intern Med 2010;170:784–90.
8. Radulovic Z, Petrovic T, Bulajic S. Antibiotic susceptibility of probiotic bacteria. In Pana M, editor. Antibiotic resistant bacteria: a continuous challenge in the new millennium. Rijeka, Croatia: InTech; 2012.
9. Goldenberg JZ, Ma SS, Saxton JD, et al. Probiotics for the prevention of Clostridium difficile-associated diarrhea in adults and children. Cochrane Database Syst Rev 2013;5:CD006095.
10. Johnston BC, Ma SY, Goldenberg JZ, et al. Probiotics for the prevention of Clostridium difficile-associated diarrhea. Ann Intern Med 2012;157:878–88.
11. Blondeau JM. What have we learned about antimicrobial use and the risks for Clostridium difficile-associated diarrhoea? J Antimicrob Chemother 2009;63:203–37.
12. Elliott B, Chang BJ, Golledge CL et al. Clostridium difficile-associated diarrhoea. Intern Med J 2007;37:561–8.
13. Stone, ND, Ashraf, MS et al. Surveillance definitions of infections in long-term care facilities: revisiting the McGeer criteria. Infect Control Hosp Epidemiol 2012;33:965–77.
14. Janarthanan S, Ditah I, Adler DG, Ehrinpreis MN. Clostridium difficile-associated diarrhea and proton pump inhibitor therapy: a meta-analysis. Am J Gastroenterol 2012;107:1001–10.
15. Gao XW, Mubasher M, Fang CY, et al. Dose-response efficacy of a proprietary probiotic formula of Lactobacillus acidophilus CL1285 and Lactobacillus casei LBC80R for antibiotic-associated diarrhea and Clostridium difficile-associated diarrhea prophylaxis in adult patients. Am J Gastroenterol 2010;105:1636-41.
16. Maziade PJ, Andriessen JA, Pereira P, et.al. Impact of adding prophylactic probiotics to a bundle of standard preventative measures for Clostridium difficile infections: enhanced and sustained decrease in the incidence and severity of infection at a community hospital. Curr Med Res Opin 2013;29:1341–7.
17. Islam, J, Cohen J, Rajkumar C, Llewelyn M. Probiotics for the prevention and treatment of Clostridium difficile in older patients. Age Ageing 2012;41:706–11.
18. Hickson M, D’Souza AL, Muthu N, et al. Use of probiotic Lactobacillus preparation to prevent diarrhoea associated with antibiotics: randomised double blind placebo controlled trial. BMJ 2007;335:80.
19. Allen S J, Wareham K, Wang, D, et.al. Lactobacilli and bifidobacteria in the prevention of antibiotic-associated diarrhoea and Clostridium difficile diarrhoea in older inpatients (PLACIDE): a randomized, double-blind, placebo-controlled, multi-centre trial. Lancet 2013;382:1249–57.
From Sharp HealthCare, San Diego, CA.
Abstract
- Objective: To examine the relationship between the rate of Clostridium difficile infections (CDI) and implementation of 3 interventions aimed at preserving the fecal microbiome: (1) reduction of antimicrobial pressure; (2) reduction in intensity of gastrointestinal prophylaxis with proton-pump inhibitors (PPIs); and (3) expansion of probiotic therapy.
- Methods: We conducted a retrospective analysis of all inpatients with CDI between January 2009 and December 2013 receiving care at our community hospital and associated long-term care (LTC) facility. We used interrupted time series analysis to assess CDI rates during the implementation phase (2008–2010) and the postimplementation phase (2011–2013).
- Results: A reduction in the rate of health care facility–associated CDIs was seen. The mean number of cases per 10,000 patient days fell from 11.9 to 3.6 in acute care and 6.1 to 1.1 in LTC. Recurrence rates decreased from 64% in 2009 to 16% by 2014. The likelihood of CDI recurring was 3 times higher in those exposed to PPI and 0.35 times less likely in those who received probiotics with their initial CDI therapy.
- Conclusion: The risk of CDI incidence and recurrence was significantly reduced in our inpatients, with recurrent CDI associated with PPI use, multiple antibiotic courses, and lack of probiotics. We attribute our success to the combined effect of intensified antibiotic stewardship, reduced PPI use, and expanded probiotic use.
Clostridium difficile is classified as an urgent public health threat by the Centers for Disease Control and Prevention [1]. A recent study by the CDC found that it caused more than 400,000 infections in the United States in 2011, leading to over 29,000 deaths [2]. The costs of treating CDI are substantial and recurrences are common. While rates for many health care–associated infections are declining, C. difficile infection (CDI) rates remain at historically high levels [1] with the elderly at greatest risk for infection and mortality from the illness [3].
CDIs can be prevented. A principal recommendation for preventing CDIs is improving antibiotic use. Antibiotic use increases the risk for developing CDI by disrupting the colonic microbiome. Hospitalized and long-term care (LTC) patients are frequently prescribed antibiotics, but studies indicate that much of this use is inappropriate [4]. Antimicrobial stewardship has been shown to be effective in reducing CDI rates. Other infection prevention measures commonly employed to decrease the risk of hospital-onset CDI include monitoring of hand hygiene compliance using soap and water, terminal cleaning with bleach products of rooms occupied by patients with CDI, and daily cleaning of highly touched areas. At our institution, patients identified with CDI are placed on contact precautions until they have been adequately treated and have had resolution of diarrhea for 48 hours.
In addition to preventing CDI transmission through antimicrobial stewardship, attention is being paid to the possibility that restricting PPI use may help in preventing CDI. The increasing utilization of proton-pump inhibitors (PPIs) in recent years has coincided with the trend of increasing CDI rates. Although C. difficile spores are acid-resistant, vegetative forms are easily affected by acidity. Several studies have shown the association of acid suppression and greater susceptibility of acquiring CDI or recurrences [5–7]. Elevated gastric pH by PPIs facilitates the growth of potentially pathogenic upper and lower gastrointestinal (GI) tract flora, including the conversion of C. difficile from spore to vegetative form in the upper GI tract [5,8].
A growing body of evidence indicates that probiotics are both safe and effective for preventing CDIs [9]. Probiotics may counteract disturbances in intestinal flora, thereby reducing the risk for colonization by pathogenic bacteria. Probiotics can inhibit pathogen adhesion, colonization, and invasion of the gastrointestinal mucosa [10].
We hypothesized that preservation and/or restoration of the diversity of the fecal microbiome would prevent CDI and disease recurrence in our facility. Prior to 2009, we had strict infection prevention measures in place to prevent disease transmission, similar to many other institutions. In 2009, we implemented 3 additional interventions to reduce the rising incidence of CDI: (1) an antibiotic stewardship program, (2) lowering the intensity of acid suppression, and (3) expanding the use of probiotic therapy. The 3 interventions were initiated over the 19-month period January 2009 through July 2010. This study addresses the effects of these interventions.
Methods
Patients and Data Collection
The study was conducted at a community hospital (59 beds) that has an associated LTC facility (122 beds). We conducted a retrospective analysis of hospital and LTC data from all documented cases of CDI between January 2009 and December 2013. Study subjects included all patients with stools positive for C. difficile antigen and toxin with associated symptoms of infection (n = 123). Institutional review board approval was obtained prior to data collection.
The following information was collected: admission diagnosis, number of days from admission until confirmed CDI, residence prior to admission, duration and type of antibiotics received prior to or during symptoms of CDI, type of GI prophylaxis received within 14 days prior to and during CDI treatment, probiotic received and duration, and the type and duration of antibiotic treatment given for the CDI. The data collected was used to determine the likely origin of each C. difficile case, dates of recurrences, and the possible effects of the interventions. Antibiotic use was categorized as: (1) recent antibiotic course (antibiotics received within the preceding 4 weeks), (2) antibiotic courses greater than 10 days, and (3) multiple antibiotic courses (more than 1 antibiotic course received sequentially or concurrently).
Positive C. difficile infections were detected using a 2-step algorithm, starting in 2009. The samples were first screened with a rapid membrane enzyme immunoassay for glutamate dehydrogenase (GDH) antigen and toxin A and B in stool (C. Diff Quik Chek Complete, Techlab, Blacksburg, VA). Discrepant samples (GDH positive and toxin A and B negative) were reflexed to DNA-based PCR testing. The PCR assay was changed to the Verigene C. difficile test (Nanosphere, Northbrook, IL) in 2012. Up to 30 days after discharge from our facility, positive results were considered as acquired from our facility and positive results within 2 days of admission with symptoms of CDI were considered positive on admission and were not attributed to our facility. A primary episode of CDI was defined to be the first identified episode or event in each patient. Recurrent CDI was defined as a repeated case of CDI within 180 days of the original CDI event.
Interventions to Reduce CDI
Reduction of Antibiotic Pressure
Other actions taken to improve antimicrobial prescribing as part of the stewardship program included medication usage evaluations (MUEs) for levofloxacin and carbapenems, implementing an automatic dosing/duration protocol for levofloxacin, and carbapenem restriction to prevent inappropriate use. Nursing and pharmacy staffs were educated on vancomycin appropriateness, benefits of MRSA screening for de-escalation, procalcitonin, and treatment of sepsis. Emergency department staff was educated on (1) empiric antimicrobial treatment recommendations for urinary and skin and soft tissue infections based on outpatient antibiogram data, (2) renal adjustment of antimicrobials, (3) fluoroquinolones: resistance formation, higher CDI risk and higher dosing recommendations, (4) GI prophylaxis recommendations, and (5) probiotics.
Reduction in the Intensity of Acid Suppression for GI Prophylaxis
PPIs were substituted with histamine-2 receptor antagonists (H2RA) whenever acid suppression for GI prophylaxis was warranted. If GI symptoms persisted, sucralfate was added. In May 2010, all eligible LTC patients were converted from PPIs to H2RA.
Expanding the Use of Probiotics
We expanded the use of probiotics as an adjunctive treatment for CDI with metronidazole ± vancomycin oral therapies. Probiotics were included concurrently with any broad-spectrum antibiotic administration, longer antibiotic courses (≥ 7 days), and/or multiple courses of antibiotics. The combination of Saccromyces boulardii plus Lactobacillus acidophilus and L. bulgaricus was given with twice daily dosing until the end of 2011. In January 2012, our facility switched over to daily administration of a probiotic with the active ingredients of Lactobacillus acidophilus and Lactobacillus casei, 50 billion colony-forming units. Probiotics were given during the antibiotic course plus for 1 additional week after course completion. Probiotics were not administered to selected groups of patients: (1) immunocompromised patients, (2) patients who were NPO, or (3) patients excluded by their physicians.
There was no change or enhanced targeting of infection prevention or environmental hygiene strategies during the study period.
Data Analysis and Statistical Methods
All data were collected on data collection sheets and transcribed into Microsoft Office Excel 2007 Service Pack 3. No data were excluded from analysis. Continuous variables, eg, number of cases of CDI, are reported as mean ± standard deviation. Categorical variables, eg, number of recurrent CDI cases, are reported as the count and percentage. Comparison of populations was done with the Wilcoxon rank sum test. Segments of the interrupted time series were assessed using linear regression. Associations were tested using χ2. Statistical tests were deemed significant when the α probability was < 0.05. No adjustments were made for multiplicity. Data descriptive statistics (including frequency histograms for visual examination of distributions) and statistical analyses were performed using Stata 11.1 (StataCorp, College Station, TX).
Results
CDIs
Within the population of patients having a CDI or recurrence, we found that those patients in the later time period (2011–2013) were significantly less likely to have a recurrence than those in the earlier time period (pre- Jan 2011) (chi square = 5.975, df = 1, P = 0.015). The odds ratio (OR) was 0.35 (95% CI 0.15 to 0.83).
Patients in the earlier (2009–2010) vs. the later post-intervention group (2011–2013) had more likely received multiple antibiotic courses (chi square = 5.32, df = 1, P = 0.021, OR 2.56), a PPI (chi square = 8.86, df = 1, P = 0.003, OR 3.38), and had a health care facility–associated infection originating from our institution as opposed to outside facility transfers or community-acquired cases (chi square = 7.09, df = 1, P = 0.008, OR 2.94).
Antibiotic Pressure
Acid Suppression
In evaluating the effects of limiting the use of PPIs, patients who received an H2RA or no antacid prophylaxis were significantly less likely to have a recurrence of CDI than those who received a PPI (chi square = 6.35, df = 1, P = 0.012). The OR for recurrence with PPIs was 3.05 (95% CI 1.25 to 7.44). Of patients exposed to PPIs, those exposed in the later time period (2011 through 2013) were significantly less likely to have a recurrence than those exposed in the early time period (third quarter 2008 through 2010; chi square = 15.14, df = 1, P < 0.001). The OR was 0.23 (95% CI, 0.11 to 0.49).
Probiotics
During 2009–2011, only 15% of the CDI patients had received probiotics with an antibiotic course. Probiotic therapy as part of CDI treatment increased from 60% in 2009 to 91% in 2011. Among patients that contracted CDI in 2012–2013, only 2 patients received probiotics with their antibiotic courses.
Recurrences
With regard to the effect of probiotics within this population, those who received
One patient with significant initial antibiotic pressure was continued on her PPI during CDI treatment and continued to have recurrences, despite probiotic use. After her fourth recurrence, her PPI was changed to an H2RA, and she had no further recurrences. She continues off PPI therapy and is CDI-free 2 years later. Another patient who remained on his PPI had 3 recurrences, until finally a probiotic was added and the recurrences abated.
Discussion
CDI is common in hospitalized patients, and its incidence has increased due to multiple factors, which include the widespread use of broad-spectrum antimicrobials and increased use of PPIs. Our observational study showed a statistically significant reduction in the number of health care–associated CDI cases during our implementation period (mid–2008 through 2010). From 2011 on, all initiatives were maintained. As the lower rates of CDI continued, physician confidence in antimicrobial stewardship recommendations increased. During this latter portion of the study period, hospitalists uniformly switched patients to H2RA for GI prophylaxis, added prophylactic probiotics to antibiotic courses as well as CDI therapy, and were more receptive to streamlining and limiting durations of antibiotic therapy. Although the study was completed in 2013, follow-up data have shown that the low CDI incidence has continued through 2014.
The average age of the patients in our study was 69 years. In 2009, there were 41 C. difficile cases originating from our institution; however, by the end of 2011, only 9 cases had been reported, a 75% reduction. The majority of our cases of C. difficile in 2009–2010 originated from our facility’s LTC units (Figure 2). Risk factors in the LTC population included older age (72% are > 65 years) with multiple comorbidities, exposure to frequent multiple courses of broad-spectrum antibiotics, and use of PPIs as the standard for GI prophylaxis therapy. Multiple antibiotic courses had a strong association with PPI administration in the patients who contracted CDI, while recent antibiotics and antibiotics greater than 10 days did not. Implications may include an increased risk of CDI in patients requiring multiple antibiotic courses concurrent with PPI exposure.
Infection prevention strategies were promulgated among the health care team during the study period but were not specifically targeted for quality improvement efforts. Therefore, in contrast to other studies where infection prevention measures and environmental hygiene were prominent components of a CDI prevention “bundle,” our focus was on antimicrobial stewardship and PPI and probiotic use, not enhancement of standard infection prevention and environmental hygiene measures.
The antibiotics used prior to the development of CDI in our study were similar to findings from other studies that have associated broad-spectrum antibiotics with increased susceptibility to CDI [11]. Antimicrobials disrupt the normal GI flora, which is essential for eradicating many C. difficile spores [12]. The utilization of high-risk antibiotics and prolonged antimicrobial therapy were reduced with implementation of our antimicrobial stewardship program. In 2012, the antimicrobial stewardship program developed a LTC fever protocol, providing education to LTC nurses, physicians, and pharmacists using the modified McGeer criteria [13] for infection in LTC units and empiric antibiotic recommendations from our epidemiologist. A formal recommendation for a LTC 7-day stop date for urinary, respiratory, and skin and soft tissue infections was initiated, which included are-assessment at day 6–7 for resolution of symptoms.
With regard to PPI therapy, our study revealed that patients who had received a PPI at some point were 3.05 times more likely to have a recurrence of CDI than those who had not. These findings are consistent with the literature. Linsky et al [5] found a 42% increased risk of CDI recurrence in patients receiving PPIs concurrent with CDI treatment while considering covariates that may influence the risk of recurrent CDI or exposure to PPIs. A meta-analysis of 16 observational studies involving more than 1.2 million hospitalized patients by Janarthanan et al [14] explored the association between CDI and PPIs and showed a 65% increase in the incidence of CDI among PPI users. Those receiving PPI for GI prophylaxis in the earlier time period (before 2011) were 77% more likely to have a recurrence than those who received PPI in the later period. This finding might be associated with the more appropriate antimicrobial use and the more consistent use of consistent prophylactic probiotics in the later study period.
Our results showed that those who received probiotics with the initial CDI treatment were significantly less likely to have a recurrence than those who did not. Patients receiving probiotics in the later period (2011–2013) were 74% less likely to have a recurrence than patients in the earlier group (2009–2010). Despite the standard use of probiotics for primary CDI prevention at our institution, we could not show direct significance to the lack of probiotic use found in the identified CDI patients with this observational study design. The higher benefit in more recent years could possibly be attributed to the fact that these patients were much less likely to have received a PPI, that most had likely received probiotics concurrently plus 1 week after their antibiotic courses, and their antibiotic therapy was likely more focused and streamlined to prevent C. difficile infection. A meta-analysis of probiotic efficacy in primary CDI prevention suggested that probiotics can lead to a 64% reduction in the incidence of CDI, in addition to reducing GI-associated symptoms related to infection or antibiotic use [9]. A dose-response study of the efficacy of a probiotic formula showed a lower incidence of CDI, 1.2% for higher dose vs. 9.4% for lower dose vs. 23.8% for placebo [15]. Maziade et al [16] added prophylactic probiotics to a bundle of standard preventative measures for C. difficile infections, and were able to show an enhanced and sustained decrease in CDI rates (73%) and recurrences (39%). However, many of the probiotic studies which have studied the relationship to CDI have been criticized for reporting abnormally high rates of infection [9,16] missing data, a lack of controls or excessive patient exclusion criteria [17,18] The more recent PLACIDE study by Allen et al [19] was a large multicenter randomized controlled trial that did not show any benefit to CDI prevention with probiotics; however, with 83% of screened patients excluded, the patients were low risk, with the resulting CDI incidence (0.99%) too low to show a benefit. Acid suppression was also not revealed in the specific CDI cases, and others have found this to be a significant risk factor [5–7].
Limitations of this study include the study design (an observational, retrospective analysis), the small size of our facility, and the difficulty in obtaining probiotic history prior to admission in some cases. Due to a change in computer systems, hospital orders for GI prophylaxis agents could not be obtained for 2009–2010. Due to the fact that we instituted our interventions somewhat concurrently, it is difficult to analyze their individual impact. Randomized controlled trials evaluating the combined role of probiotics, GI prophylaxis, and antibiotic pressure in CDI are needed to further define the importance of this approach.
Corresponding author: Bridget Olson, RPh, Sharp Coronado Hospital & Villa Coronado Long-Term Care Facility, 250
Prospect Pl., Coronado CA 92118, bridget.olson@sharp.com.
Financial disclosures: None.
Author contributions: conception and design, BO, TH, KW, RO; analysis and interpretation of data, RAF; drafting of article, BO, RAF; critical revision of the article, RAF, JH, TH; provision of study materials or patients, BO; statistical expertise, RAF; administrative or technical support, KW, RO; collection and assembly of data, BO.
1. Centers for Disease Control and Prevention. Antibiotic resistance threats in the United States, 2013. http://www.cdc.gov/drugresistance/threat-report-2013/index.html.
2. Lessa FC, Mu Y, Bamberg WM, Beldavs ZG, et al. Burden of Clostridium difficile infection in the United States. N Engl J Med 2015;372:825–34.
3. Pepin J, Valiquette L, Cossette B. Mortality attributable to nosocomial Clostridium difficile-associated disease during an epidemic caused by a hypervirulent strain in Quebec. CMAJ 2005;173:1037–42.
4. Warren JW, Palumbo FB, Fitterman L, Speedie SM. Incidence and characteristics of antibiotic use in aged nursing home patients. J Am Geriatr Soc 1991;39:963–72.
5. Linsky A, Gupta K, Lawler E, et al. Proton pump inhibitors and risk for recurrent Clostridium difficile infection. Arch Intern Med 2010;170:772–8.
6. Dial S, Delaney JA, Barkun AN, Sulssa S. Use of gastric acid-suppressive agents and the risk of community-acquired Clostridium difficile-associated disease. JAMA 2005;294:2989–95.
7. Howell M, Novack V, Grgurich P, et.al. Iatrogenic gastric acid suppression and the risk if nosocomial Clostridium difficile infection. Arch Intern Med 2010;170:784–90.
8. Radulovic Z, Petrovic T, Bulajic S. Antibiotic susceptibility of probiotic bacteria. In Pana M, editor. Antibiotic resistant bacteria: a continuous challenge in the new millennium. Rijeka, Croatia: InTech; 2012.
9. Goldenberg JZ, Ma SS, Saxton JD, et al. Probiotics for the prevention of Clostridium difficile-associated diarrhea in adults and children. Cochrane Database Syst Rev 2013;5:CD006095.
10. Johnston BC, Ma SY, Goldenberg JZ, et al. Probiotics for the prevention of Clostridium difficile-associated diarrhea. Ann Intern Med 2012;157:878–88.
11. Blondeau JM. What have we learned about antimicrobial use and the risks for Clostridium difficile-associated diarrhoea? J Antimicrob Chemother 2009;63:203–37.
12. Elliott B, Chang BJ, Golledge CL et al. Clostridium difficile-associated diarrhoea. Intern Med J 2007;37:561–8.
13. Stone, ND, Ashraf, MS et al. Surveillance definitions of infections in long-term care facilities: revisiting the McGeer criteria. Infect Control Hosp Epidemiol 2012;33:965–77.
14. Janarthanan S, Ditah I, Adler DG, Ehrinpreis MN. Clostridium difficile-associated diarrhea and proton pump inhibitor therapy: a meta-analysis. Am J Gastroenterol 2012;107:1001–10.
15. Gao XW, Mubasher M, Fang CY, et al. Dose-response efficacy of a proprietary probiotic formula of Lactobacillus acidophilus CL1285 and Lactobacillus casei LBC80R for antibiotic-associated diarrhea and Clostridium difficile-associated diarrhea prophylaxis in adult patients. Am J Gastroenterol 2010;105:1636-41.
16. Maziade PJ, Andriessen JA, Pereira P, et.al. Impact of adding prophylactic probiotics to a bundle of standard preventative measures for Clostridium difficile infections: enhanced and sustained decrease in the incidence and severity of infection at a community hospital. Curr Med Res Opin 2013;29:1341–7.
17. Islam, J, Cohen J, Rajkumar C, Llewelyn M. Probiotics for the prevention and treatment of Clostridium difficile in older patients. Age Ageing 2012;41:706–11.
18. Hickson M, D’Souza AL, Muthu N, et al. Use of probiotic Lactobacillus preparation to prevent diarrhoea associated with antibiotics: randomised double blind placebo controlled trial. BMJ 2007;335:80.
19. Allen S J, Wareham K, Wang, D, et.al. Lactobacilli and bifidobacteria in the prevention of antibiotic-associated diarrhoea and Clostridium difficile diarrhoea in older inpatients (PLACIDE): a randomized, double-blind, placebo-controlled, multi-centre trial. Lancet 2013;382:1249–57.